INDUSTRIAL and ENGINEERING CHEMISTRY
88
INDUSTRIAL and ENGINEERING CHEMISTRY ANALYTICAL EDITION WALTER J. MURPHY, EDITOR ISSUED JUNE 21, 1944 VOL. 16, NO. 6 CONSECUTIVE NO. 12 Editorial Assistant: G. G ladys G ordon R. P. C hapman J. R. C hurchill B. L. C larke Lawrence T. Hallett, Associate Editor Manuscript Assistant: S tella A nderson Advisory Board T ; R . C unningham G.'E. F. L undell M. G. M ellon Make-up Assistant: C harlotte C. S ayre R. II. M üller B. L. O ser H. H. W illard Molecular Weight o£ Cellulose .... O. A. Battista 351 Colorimetric Determination of Nickel in Bronze . . Henry Seaman 354 Increase in Concentration of Insecticide in Freon-12 Accompanying Transfer or Discharge of Aerosol- Producing Solution . C. M. Smith and L. D. Goodhue 355 Modified Bailey B uret ........................................................ Loren Hammack and Chester L. Naegelin 357 Determination of Vitamin A Content of Margarine R. H. Neal and F. H. Luckmann 358 Qualitative Differentiation of Methylcarbinols and Methyl K etones ....................................... lonas Kamlet 362 Picment Determination in Carbon Black and Iron Blue P a i n t s ..................................... Francis B. Robinson 364 Device for Renewing the Filter-Cake Surface in Small-Scale Vacuum Filtrations .............................. R. S. Burnett and A. L. Merrilield 365 Determination of Nitrogen Dioxide by Cerate Oxi- dimetry ............................................... F. M. Stubblefield 366 Determining Hygroscopicity of Fertilizers . J. Y. Yee 367 Stable Starch Solution for Dissolved Oxygen Deter- minations ........................................... Wesley S. Platner 369 Rapid Estimation of Chlorate Ion Employing Catal- ysis . A. J. Boyle, V. V. Hughey, and Clyde C. Casto 370 Iodine Number Method for Tall O il .............................. Richard G. Rowe, C. C. Furnas, and Harding Bliss 371 Improved Vacuum Distilling Head . . W. F. Barthel 374 Colorimetric Determination of Nickel in Steel . . . G. R. Makepeace and C. H. Craft 375 Identification of Nornicotine in T obacco ................. C. V. Bowen and W. F. Barthel 377 Colorimetric Determination of Phosphorus as Molybdivanadophosphoric A cid ................................... R. E. Kitson with M. G. Mellon 379 Determination of Potassium in Fertilizer Mixtures A. B. Joy 383 Relationship between Unsaturation and Ultraviolet Absorption Spectra of Various Fats and Fatty Acids ...................................................................................... R. H. Barnes, I. I. Rusoff, E. S. Miller, and G. O. Burr 385 8-Hydroxyquinaldine as Analytical Reagent .... Lynne L. Merritt, Jr., and Jack K. Walker 387 Determining Phytin Phosphorus . . . E. B. Earley 389 Determination of Small Amounts of Sulfate in Cellulose Nitrate and Other Cellulose Esters . . . Carroll L. Holfpauir and John D. Guthrie 391 Photoelectric Automatic Liquid Level Control . . . Norman H. Ceaglske and Sol A. Kesslinger 393 New Design of Humidity Cabinet for Corrosion Test- ing ........................................................................ Floyd Todd 394 Apparatus for Surface Area M easurement ................. K. A. Krieger 398 Improved Distilling F la s k ............................. Erich Baer 399 MICROCHEMISTRY Ultramicrodetermination of Arsenic by Gutzeit Spot-Filtration under V acuum .............................. Henry S. Satterlee and Gertrude Blodgett 400 Microchemical Identification of Demerol .... Joseph Levine 408 Semimicrosaponification of E s te rs .......................... John Mitchell, Jr., D. M. Smith, and Florence S. Money 410 Modifications of Apparatus for Deuterium Oxide Determination by the Falling D rop ...................... E. S. Fetcher, Jr. 412 Improved Apparatus for Solubility Determination or for Small-Scale Recrystallization ...................... Lyman C. Craig and Otto W. Post 413 Semimicrodetermination of Arsenic in Insecti- cides . . Mark D. Snyder and Wallace M. McNabb 414 NOTES ON ANALYTICAL PROCEDURES Vacuum Stopcock Lubricant Unaffected by Hy- drocarbons .......................................... W. H. Pearlson 415 Stopcock Lubricants for Use with Organic Vapors I. E. Puddington 415 Determination of Phthalate ....................................... Sterling B. Smith and John F. Strempfer 416 Stability of Wijs Solution for Iodine Number Determinations ............................................................ Frank A. Norris and Robert J. Buswell 417 Aid in Ashing Certain Materials .......................... Selma L. Bandemer and P. J. Schaible 417 Constant-Rate Dropping F u n n e l .............................. Gilbert Ashburn and Robert L. Frank 418 NEW EQUIPMENT Sulfur T rain ............................................................................... 418 The American Chemical Society assumes no responsibility for the statements and opinions advanced by contributors to its publications. 29,700 copies of this issue printed. Copyright 1044 by American Chemical Society. , . \ ubhshed by the American Chemical Society at Easton, Pa. Edi- R ur e: f foo 10th Street, N. W., Washington 6, D. C.; telephone, Republic 5301; cable, Jiechem (Washington). Business Office: American Lhcrmcal Society, 1155 10th Street, N. W „ Washington 6. D. C. Advertia- 9-4430lCe" 332 West ',2n4 Street, New York 18, N. Y.; Telephone, Bryant , Entered as second-class matter at the Post Office at Easton, Pa., under the Act of March 3, 1879, as 24 times a year—Industrial Edition monthly on the 1st, Analytical Edition monthly on the loth. Acceptance JvL1? IP* at -Penial rate of postage provided for in Section 1103, Act of October 3,1917, authorized July 13, 1918. Remittances and orders for subscriptions and for single copies, notices of °f address and new professional connections, and claims for missing utnbers should be sent to the American Chemical Society. 1155 16th Street, imiot it ’'i a-iiington 6, D. C. Changes of address for the Industrial Edition ust be received on or before the I8th of the preceding month and for the Analytical Edition not later than the 30th of the preceding month. Claims for missing numbers will not be allowed (1) if received more than 60 days from date of issue (owing to the hazards of wartime delivery, no claims can be honored from subscribers outside of North America). (2) if loss was due to failure of notice of change of address to be received before the dates specified in the preceding sentence, or (3) if ttie reason for claim is ‘‘missing from files". Annual subscription—Industrial Edition and Analytical Edition sold only as a unit, members S3.00, nonmembers S4.00. Postage to countries not in the Pan-American Union S2.25; Canadian postage 80.75. Single copies—■ current issues, Industrial Edition 80.75, Analytical Edition 80.50; back numbers, Industrial Edition 80.80, Analytical Edition prices on request; special rates members. The American Chemical Society also publishes Chemical and Engineering News, Chemical Abstráete, and Journal of the American Chemical Society. Rates on request.
-
Upload
khangminh22 -
Category
Documents
-
view
3 -
download
0
Transcript of INDUSTRIAL and ENGINEERING CHEMISTRY
INDUSTRIAL and ENGINEERING CHEMISTRYANALYTICAL EDITION
W A LTER J . M U R P H Y , E D IT O R ISSU ED JU N E 21, 1944 V O L . 16, NO. 6 C O N S E C U T IV E NO. 12
Editorial Assistant: G . G l a d y s G o r d o n
R. P. C h a p m a n J. R . C h u r c h i l l B. L. C l a r k e
Lawrence T. Hallett, Associate Editor
M anuscript Assistant: S t e l l a A n d e r s o n
Advisory BoardT ; R . C u n n in g h a m G .'E . F. L u n d e l l M . G. M e l l o n
Make-up Assistant: C h a r l o t t e C . S a y r e
R. II. M ü l l e r B. L. O s e r H. H . W il l a r d
M olecular W eig h t o£ C ellu lose . . . . O. A. Battista 351C olorim etric D e te rm in a t io n of N ickel in B ro n ze . .
Henry Seaman 354Increase in C o n c e n tra tio n of In se c tic id e in F re o n -12
A ccom pany ing T ra n s fe r o r D isch arg e of A erosol- P roduc ing S o lu tio n . C. M. Smith and L. D. G oodhue 355
Modified B ailey B u r e t ........................................................Loren Hammack and Chester L. Naegelin 357
D ete rm in a tio n of V ita m in A C o n te n t of M a rg a rin eR. H. Neal and F. H. Luckmann 358
Q ualitative D iffe re n tia tio n of M e th y lc a rb in o ls a n d M ethyl K e t o n e s ....................................... lonas Kamlet 362
P icm en t D e te rm in a t io n in C a rb o n B lack a n d Iro n Blue P a i n t s ..................................... Francis B. Robinson 364
Device fo r R en ew in g th e F il te r -C a k e S u rface in S m all-Scale V a c u u m F i l t r a t i o n s ..............................
R. S. Burnett and A. L. Merrilield 365D ete rm in a tio n of N itro g e n D ioxide by C e ra te O xi
d im e try ............................................... F. M. Stubblefield 366D eterm in ing H y g ro sco p ic ity of F e r til iz e rs . J. Y. Yee 367Stable S ta r c h S o lu tio n fo r D issolved O xygen D e te r
m in a tio n s ........................................... Wesley S. Platner 369Rapid E s tim a tio n of C h lo ra te Io n E m p lo y in g C a ta l
ysis . A. J. Boyle, V. V. Hughey, and Clyde C. Casto 370Iodine N u m b e r M e th o d fo r T a ll O i l ..............................
Richard G. Rowe, C. C. Furnas, and Harding Bliss 371Im proved V a c u u m D is tillin g H ead . . W. F. Barthel 374C olorim etric D e te rm in a t io n of N ickel in S tee l . . .
G. R. M akepeace and C. H. Craft 375Id en tifica tio n of N o rn ic o tin e in T o b a c c o .................
C. V. Bowen and W. F. Barthel 377C olorim etric D e te rm in a t io n of P h o sp h o ru s as
M o ly b d ivanadophospho ric A c i d ...................................R. E. Kitson with M. G. Mellon 379
D e te rm in a tio n of P o ta s s iu m in F e r t il iz e r M ix tu re sA. B. Joy 383
R ela tionsh ip b e tw e e n U n s a tu r a t io n a n d U ltra v io le t A bsorp tion S p e c tra of V ario u s F a ts a n d F a t ty A c i d s ......................................................................................
R. H. Barnes, I. I. Rusoff, E. S. Miller, and G. O. Burr 3858-H ydroxyqu ina ld ine a s A n a ly tic a l R e a g e n t . . . .
Lynne L. Merritt, Jr., and Jack K. W alker 387D eterm in ing P h y tin P h o sp h o ru s . . . E. B. Earley 389
D e te rm in a t io n of S m a ll A m o u n ts of S u lfa te in C ellu lose N itr a te a n d O th e r C ellu lose E s te rs . . .
Carroll L. Holfpauir and John D. G uthrie 391P h o to e le c tr ic A u to m a tic L iq u id Level C o n tro l . . .
Norman H. Ceaglske and Sol A. Kesslinger 393N ew D esign of H u m id ity C a b in e t fo r C o rro s io n T e s t
in g ........................................................................Floyd Todd 394A p p a ra tu s fo r S u rface A rea M e a s u r e m e n t .................
K. A. Krieger 398Im p ro v ed D is tillin g F l a s k .............................Erich Baer 399
M IC R O C H E M IST R Y U ltr a m ic ro d e te rm in a tio n of A rsen ic by G u tz e it
S p o t-F i l t r a t io n u n d e r V a c u u m ..............................Henry S. Satterlee and G ertrude Blodgett 400
M ic ro ch em ica l Id e n tif ic a tio n of D em ero l . . . .Joseph Levine 408
S e m im ic ro sa p o n if ic a tio n of E s t e r s ..........................John Mitchell, Jr., D. M. Smith, and Florence S. Money 410
M o d ifica tio n s of A p p a ra tu s fo r D e u te r iu m O xide D e te rm in a t io n by th e F a ll in g D r o p ......................
E. S. Fetcher, Jr. 412Im p ro v ed A p p a ra tu s fo r S o lu b ili ty D e te rm in a t io n
o r fo r S m a ll-S ca le R e c ry s ta l l iz a t io n ......................Lyman C. Craig and Otto W. Post 413
S e m im ic ro d e te rm in a tio n of A rsen ic in In s e c tic id es . . Mark D. Snyder and W allace M. McNabb 414
N O TES ON ANALYTICAL PR O C ED U R ESV a c u u m S to p co ck L u b r ic a n t U naffec ted by H y
d ro c a rb o n s ..........................................W. H. Pearlson 415S to p co ck L u b r ic a n ts fo r Use w ith O rg an ic V apors
I. E. Puddington 415D e te rm in a t io n of P h t h a l a t e .......................................
Sterling B. Smith and John F. Strempfer 416S ta b i l i ty of W ijs S o lu tio n fo r Io d in e N u m b e r
D e t e r m i n a t i o n s ............................................................Frank A. Norris and Robert J. Buswell 417
A id in A sh in g C e r ta in M a te r ia ls ..........................Selma L. Bandemer and P. J. Schaible 417
C o n s ta n t-R a te D ro p p in g F u n n e l ..............................G ilbert Ashburn and Robert L. Frank 418
NEW E Q U IPM E N T S u lfu r T r a i n ...............................................................................418
T he A m erican Chem ical Society assum es no responsib ility for th e s ta tem en ts an d opinions advanced by con tribu to rs to its publications. 29,700 copies of th is issue p rin ted . C opyrigh t 1044 by Am erican Chem ical Society.
, . \ ubhshed by the A m erican Chem ical Society a t E aston , Pa . E d i- R u r e: f foo 10th S treet, N . W ., W ashington 6 , D . C .; telephone,Republic 5301; cable, Jiechem (W ash ing ton). Business Office: Am ericanLhcrmcal Society, 1155 10th S treet, N . W „ W ashington 6 . D. C. A dvertia- 9-4430lCe" 332 W est ',2 n 4 S tree t, New Y ork 18, N . Y .; Telephone, B ry an t
, Entered as second-class m a tte r a t the P ost Office a t E aston , Pa., under the A ct of M arch 3, 1879, as 24 tim es a year— Industria l E dition monthly on the 1st, A naly tical E d ition m onthly on the lo th . A cceptance JvL1? IP* a t -Penial ra te of postage provided for in Section 1103, A ct of October 3 ,1917, au thorized Ju ly 13, 1918.
Rem ittances and orders for subscrip tions and for single copies, notices of °f address and new professional connections, and claims for missing
utnbers should be sen t to th e A m erican Chem ical Society. 1155 16th S treet, imiot it ’'i a-iiington 6 , D . C. Changes of address for the Industria l E dition
ust be received on or before the I 8th of the preceding m onth and for the
A naly tical E d ition n o t la te r th an the 30th of the preceding m onth . Claims for m issing num bers will n o t be allowed (1) if received m ore than 60 days from d a te of issue (owing to the hazards of w artim e delivery, no claims can be honored from subscribers outside of N o rth Am erica). (2) if loss was due to failure of notice of change of address to be received before th e da tes specified in the preceding sentence, or (3) if ttie reason for claim is ‘‘missing from files".
A nnual subscrip tion— Industria l E d ition and A nalytical E d ition sold only as a un it, m em bers S3.00, nonm em bers S4.00. Postage to countries not in the Pan-A m erican Union S2.25; C anad ian postage 80.75. Single copies—■ cu rren t issues, In d u stria l E dition 80.75, A naly tical E d ition 80.50; back num bers, Industria l E d ition 80.80, A naly tical E d ition prices on request; special ra te s mem bers.
The A m erican Chem ical Society also publishes Chemical and Engineering News, Chemical Abstráete, and Journa l o f the Am erican Chemical Society. R ates on request.
I N D U S T R I A L A N D E N G I N E E R I N G C H E M I S T R Y Vol. 16, No. 6
—— means— — Research in Glass
L A B O R A T O R Y W A R E PYREX41 P Y R E X ” and “ V Y C O R ” are registered tra d e-m a rks and indicate manufacture b y
C O R N I N G G L A S S W O R K S . C O R N I N G , N E W Y O R K
TIM E has em phasized the econom y o f Pyrex Laboratory Glass
w are in the industrial laboratory. Over the years departm ent heads,
research directors and purchasing agents have proved that on the sim ple test tube
or the m ost elaborate apparatus the nam e PY R EX m eans econom y, and greater
usefulness.
In this w artim e year w hen to o ls o f every k ind m ust last lon ger and serve better,
be sure you specify Pyrex Laboratory W are. It is the on e g lassw are that is balanced
for m echanical strength, chem ical stability and heat resistance. It is the all-around
w are for all-around laboratory use.
Consult your laboratory supply dealer; work with him— he is a good man to know.
June, 1944 A N A L Y T I C A L E D I T I O N 5
In th e w ar zo n es armor-piercing shells are a potent force for pulverizing enemy concentrations. To insure their effectiveness, these deadly weapons
must be manufactured with rigid uniformity.
In production-front laboratories another kind of uniformity—uniformity of reagent chemicals— is of equal importance. That is why many chemists always specify B&A reagents, whether for use in
special analyses or for routine testing purposes.They know the B&A label is their assurance of product uniformity . . . assurance of quality, unvarying purity and consistent accuracy . . . for into the making of B&A reagents go years of experience in reagent and fine chemical manufacture.Successful results in your laboratory work require uniform reagents. Next time you requisition —be sure to specify B&A reagents!

Vol. 16, No. 6
D eterm ination of com parative melting points in the M erck Research Laboratories.
MERCK has
THE RIGHT COMBINATION
for Laboratory Chemicals
Fine chemicals for the professions and industry since 1818.
One of the unique “ M erck Cross Tables” in the M erck A nalytical Laboratories.
Stockcoast.
r— M E R C K & CO., In c.i 7■I ' ■*,: ' . ■ . ■; V
Please send me the following charts:1 ' v - % - .« s.* •
□ Sensitiv ity of Q ualitative R eactions
□ Periodic C hart of th e E lem entsB□ Sensitivity. C hart
iI h m m m m i m M R i f H N M M n M i i i a i i i i M M i i Q i i a a a a a i i i i B a i B B a i i
*y§t<inu actiMin</, C(o/i4}milfA RAH W AY, N. J.Ind. E ng. C hem .— f 15-44
N a m e ........................................ . . . , , ...................................................................... ....
C om pany .................................... ...................................P o sitio n ................................
S tr e e t ..................................................................................................................
C ity ................................................................................ S ta te ......................................

15100 Square cross section, w ith G. C. A. standard screw thread neck. 200 m l. capacity. $2.25 per doz., $12.15 per case (6 doz.). Caps not supplied.
15094 Round hottle, w ith G. C. A. standard screw thread neck. Caps not supplied.
CAPACITY DOZ. IN CASE PER DOZ. PER CASE5 m l . 120 $0.38 $41.04
15 m l . 60 $0.53 $28.62100 m l . 18 $1.25 $20.25500 m l . 6 $3.34 $18.04
CAPILLARY PIPETTE TUBINGKIMBLE RESISTANT GLASS (N-51A)
46455 In length of approximately 34". Wall thickness, 0.2 m m . Outside diam eter, 0.7 to 1.0 m m . and 1.2 to 1.5 m m . Useful in m aking m elting; point capillaries, and micro pipettes and for, typing o f streptococci. $6.00 per pound.
D istribu ted by leading laboratory supply houses throughout the U nited Statesi an d Canada.
The Vi si bl e Guarantee o f I n v i s i b l e Quality
KIMBLE GLASS COMPANY • • • - V i n e l a n d , n . j .N E W Y O R K • C H I C A G O • P H I L A D E L P H I A • D E T R O I T • B O S T O N • I N D I A N A P O L I S - S A N F R A N C I S C O
June, 1944 A N A L Y T I C A L E D I T I O N
S C R E W C A P C U L T U R E T U B E SKIMBLE RESISTANT GLASS (N -5 IA )
45066 Round b ottom ,w ith G. C. A. standard screw thread neck. Assembled Avith satisfactory plastic cap, but suitable for alum inum cap when available again. Tubes o f th is type' are effective in reducing evaporation, m old form ation and contam ination.
BOTTLESUseful for Sampling and Storage
KIMBLE RESISTANT GLASS (N-51A)
L E E D S A. N O R T H R U P C O M PA N Y , 4930 S T E N T O N AVE., PH 1 LA., PA-
LEEDS & NORTHRUPM EASU RIN G IN STRU M EN TS - T E L E M E T E R S • A U TO M A TIC CO N TR O LS • H E A T -T R E A T IN G rURNACES
Vol. 16, No. 6
A Slogan For Every Am erican
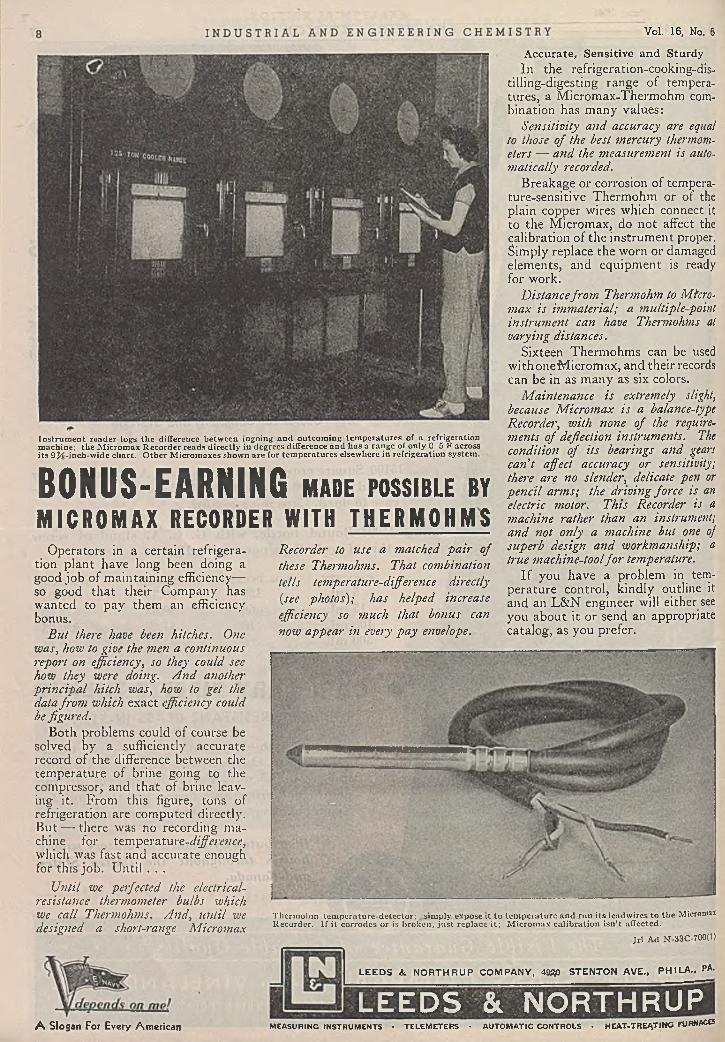
In s tru m e n t reader logs the difference betw een ingoing and outcom ing tem pera tu res of a refrigeration m achine; the M icrom ax R ecorder reads d irectly in degrees difference an d has a range of only 0 -5 F across its 9 % -inch-wide c h a rt. O ther M icrom axes shown are for tem pera tu res elsewhere in refrigeration system .
BONUS-EARNING MADE POSSIBLE BYMICROMAX RECORDER WITH THERMOHMS
Operators in a certain refrigeration plant have long been doing a good job of maintaining efficiency— so good that their Company has wanted to pay them an efficiency bonus.
But there have been hitches. One was, how to give the men a continuous report on efficiency, so they could see how they were doing. And another principal hitch was, how to get the data from which exact efficiency could be figured.
Both problems could of course be solved by a sufficiently accurate record of the difference between the temperature of brine going to the compressor, and that of brine leaving it. From this figure, tons of refrigeration are computed directly. But — there was no recording machine for temperature-rf'ijfei'i’wri, which was fast and accurate enough for this job. Until . . .
Recorder to use a matched pa ir of these Thermohms. That combination tells temperature-diffierence directly (.see photos); has helped increase efficiency so much that bonus can now appear in every pay envelope.
Until we perfected the electrical- resistance thermometer bulbs which we call Thermohms. And, until we designed a short-range Micromax
A ccu ra te , S en sitiv e a n d S tu rd yIn the refrigeration-cooking-dis-
tilling-digesting range of temperatures, a Micromax-Thermohm combination has many values:
Sensitivity and accuracy are equal to those of the best mercury thermometers — and the measurement is auto- matically recorded.
Breakage or corrosion of temperature-sensitive Thermohm or of the plain copper wires which connect it to the Micromax, do not affect the calibration of the instrument proper. Simply replace the worn or damaged elements, and equipment is ready for work.
Distance from Thermohm to Mtcro- max is immaterial; a multiple-poinl instrument can have Thermohms at varying distances.
Sixteen Thermohms can be used withoneMicromax, and their records can be in as many as six colors.
Maintenance is extremely slight, because Micromax is a balance-type Recorder, with none of the requirements of deflection instruments. The condition of its bearings and gears can't affect accuracy or sensitivity; there are no slender, delicate pen or pencil arms; the driving force is an electric motor. This Recorder is a machine rather than an instrument; and not only a machine but one of superb design and workmanship; a true machine-tool fo r temperature.
If you have a problem in temperature control, kindly outline it and an L&N engineer will either see you about it or send an appropriate catalog, as you prefer.
Therm ohm tem pera tu re-de tecto r; sim ply expose i t to tem p era tu re an d ru n its leadw ires to th e Microniax Recorder. If it corrodes or is b roken , ju s t rep lace i t ; M icrom ax calib ra tion isn ’t affected.
Jrl Ad N-33C-7000)
June, 1944 A N A L Y T I C A L E D I T I O N 9
fu rn a ce .
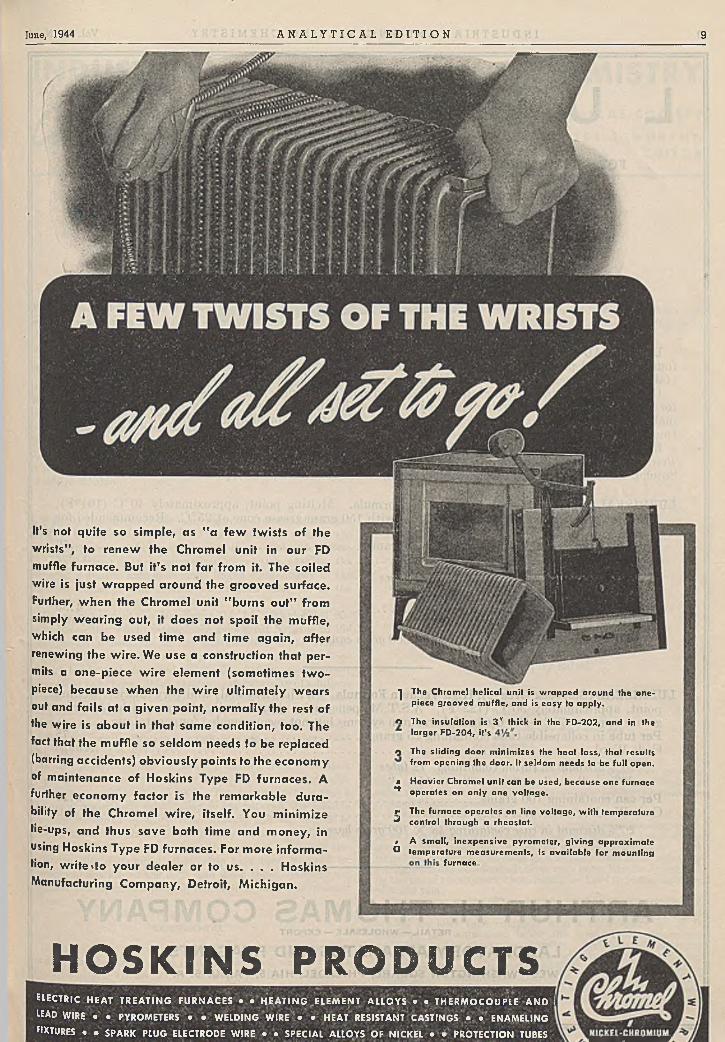
It’s not quite so sim ple, as " a few tw ists of the wrists” , to renew the Chrom el unit in our FD muffle furnace. But it’s not far from it. The coiled wire is ¡ust w rapped around the grooved surface. Further, w hen the Chrom el unit "burns out” from simply w earing out, it does not spoil the muffle, which can be used time and time a ga in , after renewing the w ire. We use a construction that permits a one-piece w ire element (som etim es tw o- piece) because w hen the w ire ultim ately w ears out and fa ils at a given point, norm ally the rest of the wire is about in that sam e condition, too. The fact that the muffle so seldom needs to be replaced (barring accidents) o b v io u sly points to the econom y of maintenance of H oskins Type FD furnaces. A further econom y factor is the rem arkable durability of the Chrom el w ire, itself. You m inim ize tie-ups, and thus save both time and m oney, in using Hoskins Type FD furnaces. For more inform ation, write <to your dealer or to us. . . . Hoskins Manufacturing Co m p an y, Detroit, M ichigan.
| T h e C h ro m e l h e lic a l u n it is w r a p p e d a ro u n d the o n e - p ie c e g ro o v e d m u ffle , a n d is e a s y to a p p ly .
O T h e in s u la t io n is 3 V th ic k in the F D -2 0 2 , a n d in the la rg e r F D -2 0 4 , it’s
O T h e s l id in g d o o r m in im iz e s the h e a t lo s s , th at re su lts fro m o p e n in g the d o o r. It s e ld o m n e e d s to be fu ll o p e n .
m H e a v ie r C h r o m e l u n it c a n be u s e d , b e c a u s e o ne fu rn a c e^ o p e ra te s o n o n ly o n e v o lta g e .
rj T h e fu rn a c e o p e ra te s o n lin e v o lta g e , w ith te m p e ra tu re* c o n tro l th ro u g h a rh e o sta t.
# A s m a ll , in e x p e n s iv e p y ro m e te r , g iv in g a p p ro x im a teO te m p e ra tu re m e a s u re m e n ts , is a v a i la b le fo r m o u n tin g
H O S K IN S PRO DU CTSE lE C T R IC H E A T T R E A T I N G F U R N A C E S • • H E A T I N G E L E M E N T A L L O Y S • . T H E R M O C O U P L E A N D I
IEAD WIRE • • PYROMETERS • • W ELD IN G WIRE • • HEAT RESISTANT C ASTIN GS • • EN A M ELIN G
fIXTURES • . SPAR K PLUG ELECTRODE W IRE • . SPEC IA L AL LO Y S O F N IC K EL • • PRO TECTIO N TUBES
10 I N D U S T R I A L A N D E N G I N E E R I N G C H E M I S T R Y Vol. 16, No. 6
L U B R I S E A L(R E G IS T E R E D U. S . PA T E N T O F F IC E )
FOR LUBRICATING GROUND GLASS JOINTS, STOPCOCKS, VALVES, ETC., AND FOR SEALING DESICCATORS, ANAEROBIC JARS, ETC.
INCLUDING A NEW HIGH VACUUM FORMULA
1 F L U B R I S E A L««a, u. a. p a t. o m c x
I M P R O V E D F O R M U L AA p ro p rie tary ’ lu b rica tin g , »eallng
I a n d ru s t-p ro o fin g m ed iu m ; fo u n d laV- 1 ac tu a l p ra c tic e ro be n e a r ly a c id a n d
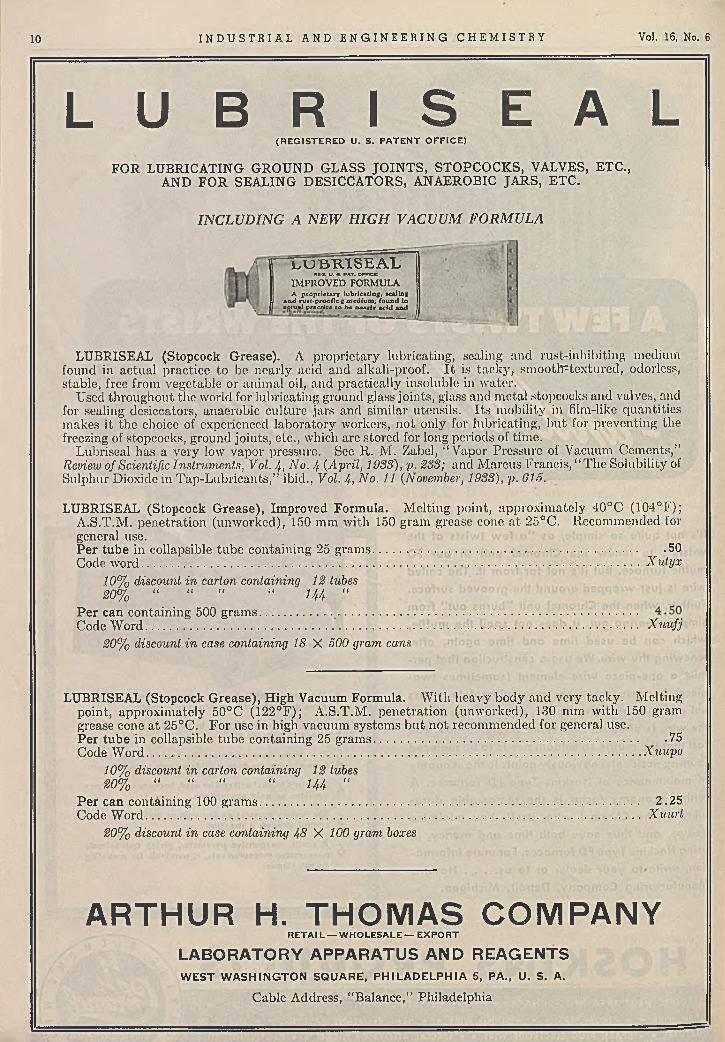
LUBRISEAL (Stopcock Grease). A proprietary lubricating, sealing and rust-inhibiting medium found in actual practice to be nearly acid and alkali-proof. It is tacky, smootlFtcxtured, odorless, stable, free from vegetable or animal oil, and practically insoluble in water.
Used throughout the world for lubricating ground glass joints, glass and metal stopcocks and valves, and for sealing desiccators, anaerobic culture jars and similar utensils. Its mobility in film-like quantities makes it the choice of experienced laboratory workers, not only for lubricating, but for preventing the freezing of stopcocks, ground joints, etc., which are stored for long periods of time.
Lubriseal has a very low vapor pressure. See R. M. Zabel, “ Vapor Pressure of Vacuum Cements,” Review of Scientific Instruments, Vol. 4, No. 4 (April, 1933), p. 233; and Marcus Francis, “ The Solubility of Sulphur Dioxide in Tap-Lubricants,” ibid., Vol. 4, No. 11 (November, 1933), p. 615.
LUBRISEAL (Stopcock Grease), Improved Formula. Melting point, approximately 40°C (104°F);A.S.T.M. penetration (unworked), 150 mm with 150 gram grease cone at 25°C. Recommended forgeneral use.Per tube in collapsible tube containing 25 grams............... ......................... .5 0Code word............................................................................................................................................... ...............N utyx
10% discount in carton containing 12 tubes20% “ “ “ “ 144 “
Per can containing 500 grams........................................................................................................................Code Word................................................................................................ Xuufj
20% discount in case containing 18 X 500 gram cans
LUBRISEAL (Stopcock Grease), High Vacuum Formula. With heavy body and very tacky. Melting point, approximately 50°C (122°F); A.S.T.M . penetration (unworked), 130 mm with 150 gram grease cone at 25°C. For use in high vacuum systems but not recommended for general use.Per tube in collapsible tube containing 25 grams................................................................................................75Code Word...............................................................................................................................................................Xuupo
10% discount in carton containing 12 tubes20% “ “ “ “ 144 “
Per can containing 100 grams......................................................................................................................... 2 .25CodeW ord........................................................................................ Xuurt
20% discount in case containing 48 X 100 gram boxes
ARTHUR H. THOMAS COMPANYR ET A IL — W H O LESA LE — E X P O R T
LABORATORY APPARATUS AND REAGENTSW E S T W A S H IN G T O N S Q U A R E , P H IL A D E L P H IA 5, PA., U. S. A.
Cable Address, “Balance,” Philadelphia
INDUSTRIAL a n d ENGINEERING CHEMISTRYP U B L I S H E D BY
* T H E A M E R I C A N C H E M I C A L S O C I E T Y
W A L T E R J . M U R P H Y , E D I T O R
Molecular W eight of Cell uloseMeasuremenl of A verage Degree of Polymerization
O . A . B A T T IS T A , Am erican V isco se Corporation, Marcus H o o k , Pa.
Viscosity-concentration data are given for five samples of purified cellulose representing the degree of polym erization range from 300 to 3000. O n plotting the data on semilogarithmic paper, linear relationships were found to exist, in each case, between (1)
the viscosity function and concentration, and (2) the relative
viscosity function measured at 0 .5 % concentration and the degrees of polymerization corresponding to values calculated from viscosity- concentration data extrapolated to infinite dilution. The data have been used to derive a mathematical expression by means of which the value of the viscosity function at the standard concentration of 0.5% may be converted to degree of polymerization data equivalent to values obtained by extrapolation of viscosity-concentration data to infinite dilution.
WIT H the advent of the more rigorous concepts of cellulose as a Iong-chain molecule of high molecular weight, the
deteriorating action of chemicals and heat on cellulose has come to bo considered as a depolym crization reaction whereby the monomeric glucose anhydride units linked continuously in the cellulose chains become severed a t irregular intervals in the chains, giving rise to shorter molecules.
The publication of th e Staudinger (11, 12, 13) empirical viscosity-molecular weight relationship gave great im petus to the investigation of m ethods for the determ ination of the w eight- average molecular weights of high polymeric compounds. Cop- pick (2) has recently reviewed and discussed the more significant papers th a t have been published relating the viscosity of solutions of high polymers w ith the degree of polymerization. The procedure most widely used is to relate viscosity da ta obtained a t relatively high concentrations w ith the value of th e viscosity function a t infinite dilution through the use of m athem atical equations (2, Jt, 5, 6, 8, 14).
In this paper, viscosity d a ta arc presented for five samples of purified cellulose representing the practical degree of polymerization range from 300 to 3000. These da ta illustrate th a t a linear semilogarithmic relationship exists between th e relative viscosity measured a t 0.5% concentration and the degree of polymerization calculated from viscosity da ta extrapolated to infinite dilution. The constants of the equation expressing this experimentally determ ined relationship have been obtained by a graphical analysis of th e data , and using these constants the equation has been satisfactorily checked against extrapolated values.
E X P E R IM E N T A L
M e t h o d o f F l u id i t y M e a s u r e m e n t . T he general procedure used for the m easurem ent of fluidity was based on the papers by Clibbens and Geake (!) and Mease (9). The viscom eter’s design, complete dimensional specifications, m ethod of calibra
tion, and a discussion of the precision of viscosity measurem ent obtainable w ith this type of capillary viscometer, arc given in the foregoing papers.
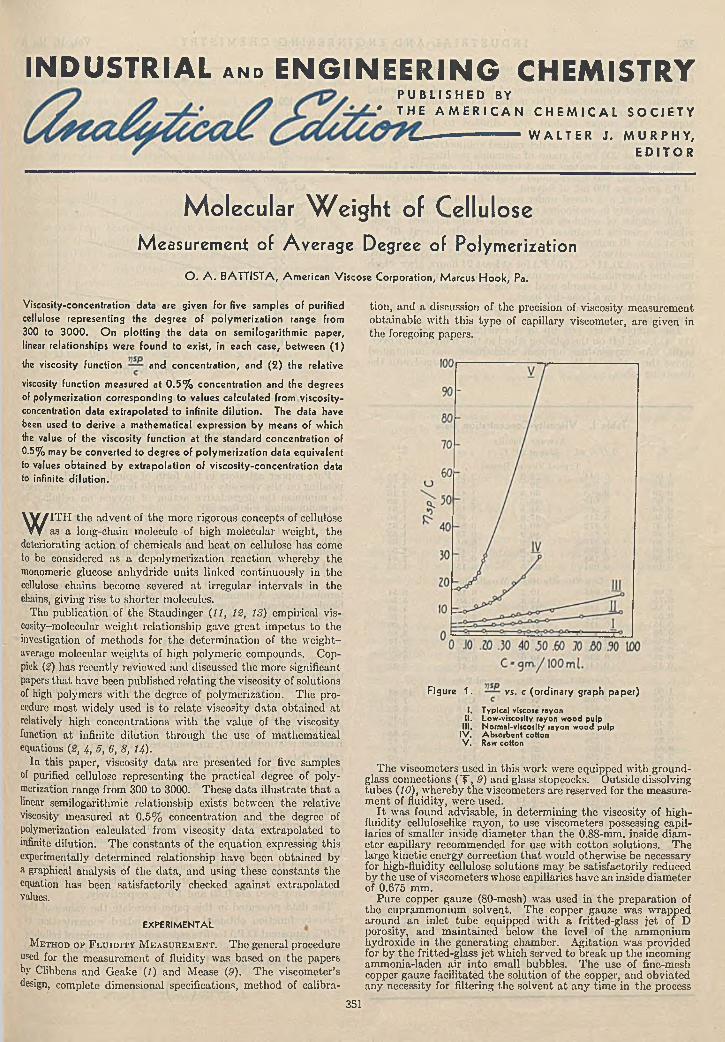
Figure 1. vs. c (ordinary graph paper)
I. Typ ica l viscose rayonII. Low -viscoslty rayon wood pulp
III. Normal-viscoslty rayon wood pulpIV . A bsorbent cottonV . Raw cotton
The viscometers used in this work were equipped w ith ground- glass connections (" f , 9) and glass stopcocks. Outside dissolving tubes (10), whereby th e viscometers are reserved for th e m easurem ent of fluidity, were used.
I t was found advisable, in determ ining the viscosity of high- fluidity celluloselike rayon, to use viscometers possessing capillaries of smaller inside diam eter than the 0 .88-mm. inside diam eter capillary recommended for use w ith cotton solutions. The large kinetic energy correction th a t would otherwise be necessary for high-fluidity cellulose solutions m ay be satisfactorily reduced by the use of viscometers whose capillaries have an inside diam eter of 0.675 mm.
Pure copper gauze (80-mesh) was used in th e preparation of the cupram monium solvent. The copper gauze was wrapped around an inlet tube equipped w ith a fritted-glass je t of D porosity, and m aintained below the level of th e ammonium hydroxide in the generating chamber. A gitation was provided for by th e fritted-glass je t which served to break up the incoming amm onia-laden air into small bubbles. T he use of fine-mesh copper gauze facilitated the solution of the copper, and obviated any necessity for filtering the solvent a t any tim e in th e process
351
352 I N D U S T R I A L A N D E N G I N E E R I N G C H E M I S T R Y Vol. 16, No. 6
of its preparation. A siphon was used to transfer the solvent from the generating cham ber to th e stock bottle.
T he copper content was determined by m eans of a calibrated photoelectric colorimeter. This m ethod is rapid and was shown to be as accurate as th e volum etric m ethod for determining copper. T he copper content was ad justed to 15.0 (± 0 .10 ) grams of copper per liter.
The amm onia content was determ ined volum ctrically and was maintained a t 200 (± 5 ) gram s of amm onia per liter.
The nitrous acid content was determ ined by m eans of a Lunge nitrom eter and w as never found to exceed th e maximum limit of 0.5 gram per 100 ml. of solvent.
T he solvent was stored under oxygen-free nitrogen a t 5° C., and its viscosity in centipoises ranged from 1.32 to 1.36 a t 20° C.
All samples of cellulose used in th is study received a mild alkaline scouring trea tm en t (1% sodium hydroxide a t 40° C. for a t least 40 m inutes), and a thorough extraction w ith w ater and organic solvents. Samples were conditioned a t 58% relative hum idity and 21.11° C. (70° F .) for a t least 24 hours, a fter which moisture determ inations were made in duplicate on each sample. T he weight of th e sample used for the m easurem ent of fluidity was calculated on a bone-dry basis.
Black glazed analytical weighing paper was used for weighing the samples.
The samples were p u t up in a constant-tcm peraturc room (18° C.), and left on the ro tating wheel a t th is tem perature overnight. An oxygen-free nitrogen atm osphere was m aintained above the surface of the solvent as i t was discharged into the dissolving tubes.
Table I. V iscosity-Concentration Data
c'%
c A verage F lu id ity G ./100 m l. Rkes at S0° C. v sp
VJPc
1.00T ypical Viscose R ayon
0 .9 4 4 2 3 .3 2 .14 2 .2 60 .7 5 0.708 29 .1 1.51 2 .1 30 .70 0.660 3 0 .8 1.42 2 .1 50 .6 5 0.613 3 3 .5 1 .18 1.900.60 0.566 3 4 .8 1.10 1.940 .5 5 0.519 3 7 .0 0 .9 7 1.860 .5 0 0.472 4 0 .0 0 .8 6 1 .820 .4 5 0 .4 2 5 4 0 .9 0 .7 8 1 .830 .4 0 0.377 4 4 .9 0 .6 4 1.690 .3 0 0.283 4 9 .6 0 .4 7 1 .660 .2 0 0 .188 55 .7 0 .3 1 1.640 .1 0 0 .094 6 3 .5 0 .1 5 1 .59
1.00Low-Viscosity R ay o n W ood P u lp
0 .9 4 4 1 0 .2 6 .1 8 6 .540 .7 5 0 .708 15 .3 3 .8 0 5 .3 60 .5 5 0.519 2 1 .7 2 .3 8 4 .5 80 .5 0 0.472 2 4 .0 2 .0 0 4 .360 .4 5 0 .425 2 7 .2 1.70 4 .0 00 .4 0 0 .377 2 9 .8 1 .47 3 .8 90 .3 5 0.330 32 .9 1 .23 3 .720 .3 0 0.283 3 6 .3 1.03 3 .630 .2 5 0.236 4 0 .0 0 .8 4 3 .5 50 .1 5 0.141 4 9 .9 0 .4 7 3 .3 3
1 .00N orm al-V iscosity R ayon W ood P u lp 0 .944 5 .5 0 12 .2 12.81
0 .6 0 0 .566 14 .0 4 .2 4 7 .4 90 .5 0 0.472 17 .5 3 .1 8 6 .730 .4 5 0 .425 19 .6 2 .76 6 .4 00 .4 2 0.395 21 .3 2 .4 5 6 .1 80 .4 0 0.377 2 2 .8 2 .2 2 5 .8 80 .3 8 0.358 22 .9 2 .21 6 .1 70 .3 5 0.330 2 6 .5 1 .78 5 .3 90 .3 0 0.283 30 .4 1 .42 5 .0 20 .20 0 .1 8 8 3 9 .9 0 .8 7 4 .6 20 .10 0.094 52 .9 0 .3 9 4 .14
0 .50 0.472A bsorbent C o tto n
5 .19 13 .3 28 .170 .4 0 0.377 8 .2 8 7 .8 8 20.900 .3 5 0 .330 10.3 6 .14 18.600 .3 0 0 .282 13.6 4 .4 3 15.750 .2 5 0 .236 17 .4 3 .2 4 13.720 .23 0.217 19.1 2 .91 13.400 .2 2 0 . 20S 21 .0 2 .55 12.250 .2 0 0 .1 8 8 2 2 .5 2 .3 3 12.300 .1 5 0.141 2 8 .5 1 .62 11.500 .1 0 0.094 3 8 .8 0 .925 9 .7 8
0 .5 0 0.472R aw C o tton
1 .45 4 8 .0 101.60 .2 5 0 .236 7 .3 8 8 .9 8 38 .050 .2 0 0 .188 11.4 5 .4 2 28.610 .1 8 0.169 13.9 4 .2 8 25 .320 .1 5 0.141 18.3 3 .03 21 .490 .1 2 0.113 2 2 .6 2 .23 19.720 .1 1 0.104 24 .9 1 .95 18.750 .1 0 0 .094 27.1 1 .75 18.610 .0 9 0 .085 2 9 .8 1 .50 17.650 .0 8 0.075 3 1 .5 1 .37 18.350 .0 5 0.047 4 3 .2 0 .73 15.55
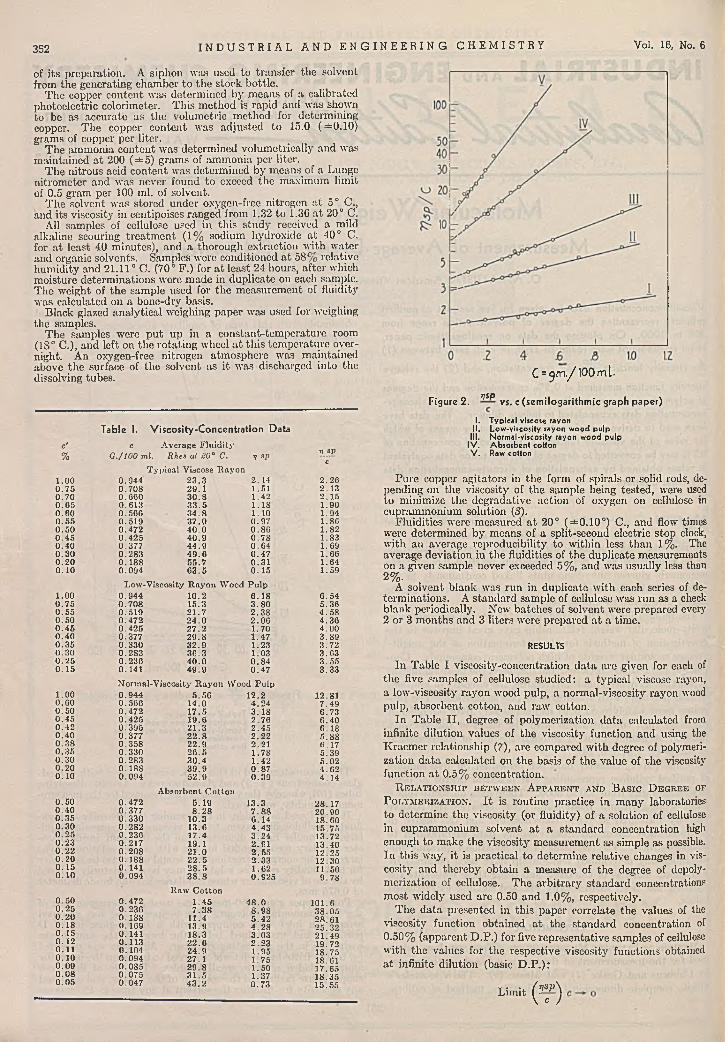
Fisure 2. ysp
C =301. / 100 ml-
vs. c (semilogarithmic graph paper)
I. Typ ica l viscose rayonII. Low -viscosity rayon wood pulp
III. Normal-viscosity rayon wood pulpIV . Absorbent cottonV . Raw cotton
P ure copper agitators in the form of spirals or solid rods, depending on th e viscosity of the sam ple being tested, were used to minimize the degradative action of oxygen on cellulose in cupram monium solution (3).
F luidities were measured a t 20° (± 0 .1 0 °) C., and flow times were determ ined by m eans of a split-second electric stop clock, w ith an average reproducibility to w ithin loss than 1%. The average deviation in the fluidities of the duplicate measurements on a given sample never exceeded 5% , and was usually less than 2%.
A solvent blank was run in duplicate w ith each series of determ inations. A standard sample of cellulose was run as a check blank periodically. New batches of solvent were prepared every 2 or 3 m onths and 3 liters were prepared a t a time.
R E S U L T S
In Table I viscosity-concentration da ta are given for each of th e five samples of cellulose studied: a typical viscose rayon, a low-viscosity rayon wood pulp, a norm al-viscosity rayon wood pulp, absorbent cotton, and raw cotton.
In T able II , degree of polymerization d a ta calculated from infinite dilution values of th e viscosity function and using the K raem er relationship (7), are compared w ith degree of polymerization da ta calculated on th e basis of th e value of the viscosity function a t 0.5% concentration.
R e l a t io n s h i p b e t w e e n A p p a r e n t a n d B a s ic D e g r e e of P o l y m e r iz a t io n . I t is routine practice in m any laboratories to determine the viscosity (or fluidity) of a solution of cellulose in cuprammonium solvent a t a standard concentration high enough to m ake the viscosity m easurem ent as simple as possible. In th is way, it is practical to determ ine relative changes in viscosity and thereby obtain a measure of th e degree of depoly- merization of cellulose. T he arb itra ry standard concentrations m ost widely used are 0.50 and 1.0%, respectively.
T he da ta presented in th is paper correlate th e values of the viscosity function obtained a t the standard concentration of 0.50% (apparent D .P .) for five representative samples of cellulose w ith th e values for th e respective viscosity functions obtained a t infinite dilution (basic D .P .):
Lim iti t ( f )
June, 1944 A N A L Y T I C A L E D I T I O N 353
7 ]SpOn plott ing the vs. c da ta for each sample on ordinary graph
cpaper, the curves in Figure 1 are obtained, in which the ra te of increase of the slope is dependent upon the degree of polym erization of the sample being studied. Furtherm ore, as the degree of polymerization increases, the variation in the slope of th e curves even a t very low concentrations precludes reliable extrapolation
of th e — t's . c d a t a , c
However, when th e same d a ta are plotted
on semilogarithmic paper, linear curves are obtained for each sample (Figure 2) and more reliable extrapolation is possible.
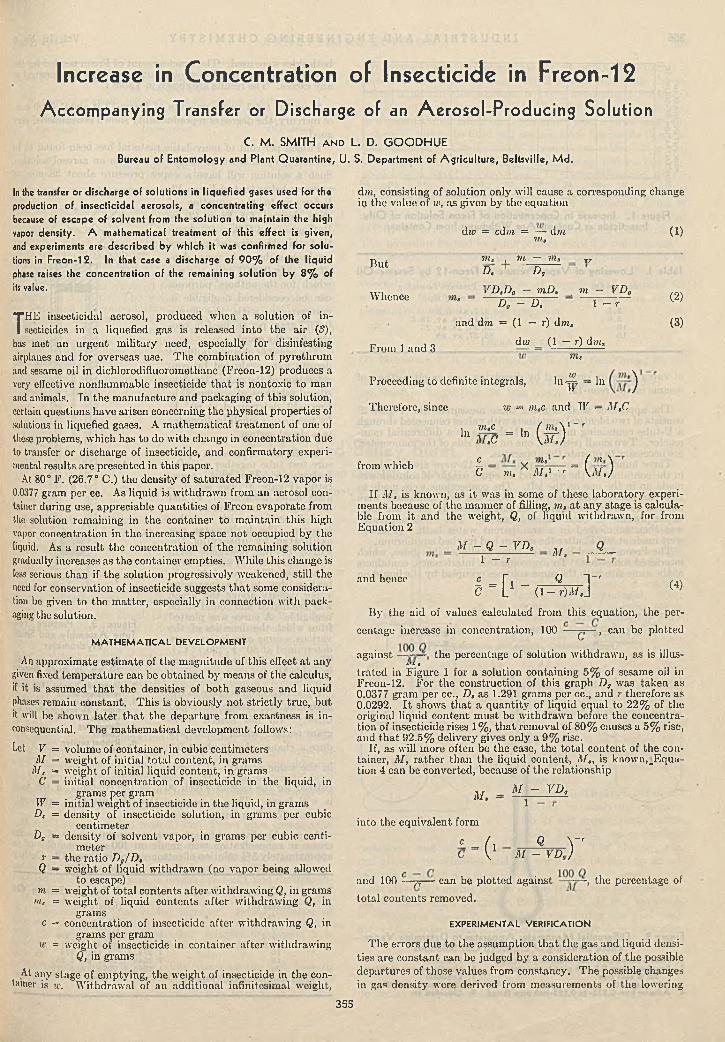
The data have been used to draw a conversion graph (Figure 3) in which the calculated “apparen t D .P .” obtained for each sample a t 0.5% concentration are plotted against the corresponding “basic D .P .” calculated from the values of the respective viscosity functions a t infinite dilution, using th e K raem er relationship (7).
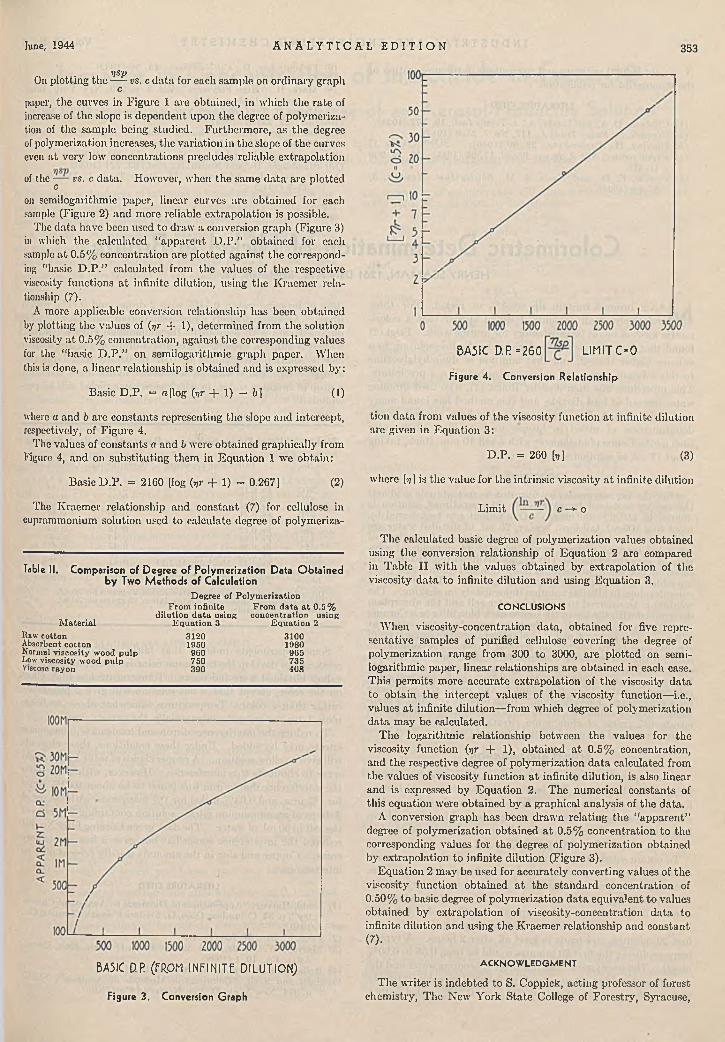
A more applicable conversion relationship has been obtained by plotting the values of (yr + 1), determ ined from th e solution viscosity a t 0.5% concentration, against the corresponding values for the “basic D .P .” on semilogarithmic graph paper. W hen this is done, a linear relationship is obtained and is expressed by:
Basic D .P . = «[log [yr + 1) — 6 ] ( 1)
where a and b are constants representing the slope and intercept, respectively, of Figure 4.
The values of constants a and b were obtained graphically from Figure 4, and on substitu ting them in E quation 1 we obtain:
Basic D .P. = 2160 [log {yr + 1) - 0.267] (2)
The Kraem er relationship and constant (7) for cellulose in cuprammonium solution used to calculate degree of polymeriza-
Table II. Comparison of Degree of Polymerization Data O btained by Two M ethods of Calculation
D egree of P o lym erization From infinite From d a ta a t 0 .5%
d ilu tion d a ta using concen tration usingE q u a tio n 3 E q u a tio n 2Material
Raw cotton 3120Absorbent co tto n 1950Normal viscosity wood pu lp 960Low viscosity wood pu lp 750Viscose rayon 390
31001980965735408
BA5IC D.R (FRPM INFINITE DILUTION)
Figure 3. Conversion Graph
BASIC D.P =260 LIMIT C - 0
Figure 4. Conversion Relationship
tion da ta from values of the viscosity function a t infinite dilution are given in Equation 3:
D .P . = 260 fo] (3)
where [y] is the value for the intrinsic viscosity a t infinite dilution
L im it c —► o
T he calculated basic degree of polymerization values obtained using th e conversion relationship of E quation 2 are compared in Table I I w ith th e values obtained by extrapolation of the viscosity da ta to infinite dilution and using E quation 3.
C O N C L U S IO N S
When viscosity-concentration data , obtained for five representative samples of purified cellulose covering th e degree of polymerization range from 300 to 3000, are p lo tted on semilogarithmic paper, linear relationships are obtained in each case. T his perm its more accurate extrapolation of the viscosity da ta to obtain the intercept values of the viscosity function—i.e., values a t infinite dilution—from which degree of polymerization da ta m ay be calculated.
T he logarithmic relationship between th e values for the viscosity function (yr + 1), obtained a t 0.5% concentration, and the respective degree of polymerization da ta calculated from the values of viscosity function a t infinite dilution, is also linear and is expressed by Equation 2. The numerical constants of this equation were obtained by a graphical analysis of the data .
A conversion graph has been draw n relating the “apparen t” degree of polym erization obtained a t 0.5% concentration to the corresponding values for the degree of polym erization obtained by extrapolation to infinite dilution (Figure 3).
E quation 2 m ay be used for accurately converting values of the viscosity function obtained a t th e standard concentration of 0.50% to basic degree of polymerization da ta equivalent to values obtained by extrapolation of viscosity-concentration da ta to infinite dilution and using the K raem er relationship and constant(7).
A C K N O W L E D G M E N T
The w riter is indebted to S. Coppick, acting professor of forest chem istry, T he New Y ork S tate College of Forestry, Syracuse,

354 I N D U S T R I A L A N D E N G I N E E R I N G C H E M I S T R Y Vol. 16, No. 6
N. Y., for helpful criticism and suggestions in the preparation of the m anuscript for publication.
L IT E R A T U R E C ITED
(1) Clibbens, D. A., and Geake, A., J . Textile Inst., 19, T77 (1928).(2) Coppick, S., Paper Trade J ., 117, No. 7, 25-9 (1943).(3) Doering, H ., Papicr-Fabr., 38, SO (1910).(4) Experim enter, S ilk J . Papon World, 17, 23 (1941); 18, 25, 209
(1941).(5) Farrow, F. D., and Neale, S. M., Shirley Inst. Memoirs, 3,
67-82 (1924).
(6) Fiekcntscher, IT., Cclluloscchem., 13, 58 (1932).(7) Kraem er, E . 0 . , I n d . E nq . C u e .« ., 30, 1200 (1938).(8) M ark, H ., “ High Polym ers” , Vol. 2, p. 279, New York, Inter-
seicnce Publishers, 1942.(9) Mease, IT. T ., ./. Research Nall. Bur. Standards, 22, 271 (1939).
(10) Ibid., 27, 551-3 (1941).(11) Staudinger, II., "D ie hochmolekularen organischen Verbin
dungen” , Berlin, Julius Springer, 1932.(12) Staudinger, II., and Ileuer, W „ Ber., 63, 222 (1930).(13) Staudinger, H., and Nodzu, R .. Ibid., 63, 721 (1930).(14) Strauss, F . L., and Levy, R. M., Paper Trade ./., 114, No. 18,
33-7 (1942).
Colorimetric Determination of Nickel in BronzeH E N R Y S E A M A N , 1261 D aly A v e „ Bethlehem, Pa.
MANY bronzes contain up to 1% of nickel. For these relatively small am ounts it would appear th a t a colori
m etric method might be satisfactory for routine work. Feigl (2) found th a t lead dioxide oxidized nickel in alkaline solution to a valence higher th an 2, and th a t addition of dimethylglyoxime to this solution gave a red coloration rather than a precipitate. This procedure was improved by Rollet (/J), who used bromine w ater instead of lead dioxide, and this method has found many applications (1, 3, 5). T his reaction has been applied to the determ ination of nickel in bronze using a filter photom eter such as the Cenco photclom eter w ith a cell 10 mm. thick, taking about 17 ml. of solution.
P R O C E D U R E
A fter the tin is removed by filtration as m etastannic acid and the copper and lead by electrolysis, the remaining solution is diluted to 150 ml. and mixed. One milliliter is transferred by pipet to a 100-ml. tall-form beaker, 25 ml. of distilled w ater arc added, and the m ixture is shaken after addition of one drop of sa tu rated bromine water. Seven drops of an amm oniacal solution of dimethylglyoxime (10 grams of dimethylglyoxime d is solved in 650 ml. of ammonium hydroxide ami diluted to 1 liter) are added and the m ixture is again shaken well. T he orange-red color develops in alkaline solution immediately on shaking. The solution is transferred to a photclom eter cell and the absorption determined w ith the use of the Cenco dark blue filter or a Corning blue filter such as No. 556. The maximum absorption occurs a t 475 m p. The per cent nickel is obtained from the usual type of straight-line curve plotted on semilog paper. The calibration da ta for th is curve can be obtained through the use of a solution of a c.p. nickel sa lt standardized gravimetricaliy, or preferably by removing an aliquot from the regular sample, obtaining the colorimetric value from this aliquot, and using the rem ainder for a gravim etric determ ination. W ith bronzes containing m anganese, iron, or alum inum , 3 to 5 drops of a solution of ammonium citrate (25 grams of ammonium citrate dissolved in 30 ml. of water) are added before addition of bromine water.
R E S U L T S A N D D IS C U S S IO N
Some typical single results obtained by th is m ethod are shown in Table I. In general, it is believed the results are satisfactory for the usual type of bronze. T he use of ammonium citra te does no t eliminate the interference of manganese and iron b u t reduces i t considerably. T he precision and accuracy of this m ethod in the range indicated are 0.02 to 0.04% nickel.
To obtain satisfactory results w ith this m ethod i t is necessary to standardize on a procedure and use it for all determinations. Among the factors which can affect the intensity of the color are tim e of standing, am ount of bromine used, am ount of ammonium citrate used, shaking, and tem perature. T he color intensity increases on standing, the increase being greatest during the first 20 minutes, and tends to level off a fter 2 hours. A typical increase during the first 20 m inutes would be from 0.58 to 0.60% nickel. The use of more than one drop of brom ine w ater and the use of ammonium citra te tend to lower the color intensity slightly—for example, standard 52a gave 0.75% nickel w ith I
drop of bromine water, 0.74% with 2 drops, and 0.71% with 5 drops. An approxim ately equal reduction in values for nickel is obtained w ith 3 to 5 drops of the ammonium citra te solution, so th a t 5 drops of bromine w ater and 5 drops of the ammonium citra te solution give values of 0 .QJ to 0 .68% nickel for this sample. Low results will also be obtained by the use of too small a drop of bromine w ater, in which case some nickel will be precipitated.
Table I. N ick e l Determinations on Bureau of Standards SamplesSam ple
No. In te rfering E lem entaNickel
G ravim etric Colorí me% % %
37C Fe, 0.17 0 .5 8 0 .5937C Fe, 0.17 0 .5 8 0 .5 7 “37B Fe, 0.21 0 .4 5 0 .4 6 “37B Fe, 0.21 0 .4 5 0 .4 6 “52 Fe, 0.12 0 .13 0 .1352 Fe, 0.12 0 .1 3 0 .1 3 “124 Fe, 0.38 0 .4 5 0 .47124 Fe, 0.38 0 .4 5 0 .4 6 “52a Fe, 0.05; M n, 0.02 0.73 0 .7562 Fe, 1.13; M n, 1.59; Al, 1.13 0 .64 0 .7 0 “
M anganese b ro n zee Fe, 2.2; . M n, 3.1 ; Al, 3.8 0 .00 0 . 10b
° U sing 3 drops of am m onium c itra te solution, 25 gram s per 30 ml. l> Using 5 drops of am m onium c itra te solu tion , 25 gram s per 30 ml. c A com m ercial sam ple.
Some experim ents indicate th a t fairly vigorous shaking is necessary to develop the maximum color intensity, although the values obtained were indecisive. Tem perature has little effect on the color, except th a t a ho t solution will give a precipitate ra ther than a color. Tem peratures somewhat above or below room tem perature gave substantially the same values.
To reduce the interference of iron and manganese, ammonium citra te m ay be added. U nder these conditions, these elements will give a yellow solution. A proper choice of wave length might serve to eliminate this interference. However, w ith a blue filter the interference due to iron was found to be about 0.02% nickel for 1% iron, and 0.03% nickel for 1% manganese w ith the use of 3 drops of an ammonium citra te solution containing 25 grams of the sa lt in 30 ml. of water. T he dark green Corning filter No. 401 reduced the interference som ewhat b u t gave a less satisfactory curve. Copper and zinc in the am ounts usually present offer no interference.
L IT E R A T U R E C ITED
(1) Diehl, Harvey, "A pplications of Dioximcs to Analytical Chemistry ” , p. 35, Columbus, Ohio, G. Frederick Sm ith Chemical Co., 1940.
(2) Feigl, F., Ber., 57, 758 (1924).(3) M urray, W . M., Jr., and Ashley, S. E. Q., I n d . E n g . Chem .,
A n a d . E d „ 10, 1 (1938).(4) Rollet, A. P ., Compt. rend., 183, 212 (1926).(5) Snell and Snell, “ Colorimetric M ethods of Analysis” , Vol. I.
p. 314, New York, D . Van N ostrand Co., 1936.
Increase in Concentration of Insecticide in Freon-12A ccom p an ying Transfer or Discharge of an A ero so l-Pro d u cing Solution
C. M . S M IT H a n d L . D . G O O D H U E
Bureau of Entom ology and Plant Quarantine, U. S. Department of A griculture, Beltsville, M d.
In the transfer or discharge of solutions in liquefied gases used for the production of insecticidal aerosols, a concentrating effect occurs because of escape of solvent from the solution to maintain the high vapor density. A mathematical treatment of this effect is given, and experiments are described by which it was confirmed for solutions in Freon-12. In that case a discharge of 9 0 % of the liquid phase raises the concentration of the remaining solution by 8 % of its value.
THE insecticidal aerosol, produced when a solution of insecticides in a liquefied gas is released into the air (3),
has met an urgent m ilitary need, especially for disinfesting airplanes and for overseas use. T he combination of pyrethrum and sesame oil in dichlorodifluoromethane (Freon-12) produces a very effective nonflammable insecticide th a t is nontoxic to m an and animals. In th e m anufacture and packaging of this solution, certain questions have arisen concerning the physical properties of solutions in liquefied gases. A m athem atical trea tm en t of one of these problems, which has to do w ith change in concentration due to transfer or discharge of insecticide, and confirmatory experimental results are presented in th is paper.
At 80° F . (26.7° C.) the density of sa tu ra ted Freon-12 vapor is 0.0377 gram per cc. As liquid is w ithdraw n from an aerosol container during use, appreciable quantities of Freon evaporate from the solution rem aining in the container to m aintain this high vapor concentration in th e increasing space no t occupied by the liquid. As a result the concentration of th e rem aining solution gradually increases as th e container empties. While this change is less serious than if th e solution progressively weakened, still the need for conservation of insecticide suggests th a t some consideration be given to the m atter, especially in connection w ith packaging the solution.
M A T H E M A T I C A L D E V E L O P M E N T
An approximate estim ate of the m agnitude of th is effect a t any given fixed tem perature can be obtained by means of the calculus, If it is assumed th a t th e densities of both gaseous and liquid phases remain constant. This is obviously not strictly true, bu t it will be shown la te r th a t th e departure from exactness is inconsequential. The m athem atical developm ent follows:
Let V = volume of container, in cubic centim eters M = weight of initial to ta l content, in grams
M , = weight of initial liquid content, in grams C = initial concentration of insecticide in the liquid, in
gram s per gram W = initial w eight of insecticide in the liquid, in grams D, = density of insecticide solution, in grams per cubic
centim eterD„ = density of solvent vapor, in grams per cubic centi
m eter r — the ratio Df /D ,
Q — weight of liquid w ithdraw n (no vapor being allowed to escape)
m = weight of to ta l contents after withdrawing Q; in grams m, = w eight of liquid contents after w ithdrawing Q, in
gram sc = concentration of insecticide after w ithdrawing Q, in
gram s per gram «■ = weight of insecticide in container after w ithdrawing
Q, in grams
At any stage of emptying, the weight of insecticide in the container is v>. W ithdraw al of an additional infinitesimal weight,
dm, consisting of solution only will cause a corresponding change in the value of w, as given by the equation
B ut
Whence
From 1 and 3
du) = cdm = — dm m,
vi, , vi — in, \T D, D„VD,D„ — mJD, _ m — VD,j
n" Z>„ - D, 1 - r
an d dm = (1 — r) dm ,
dm (1 — r) dm ,
( 1)
(2)
(3)
m ,
wW =Proceeding to definite integrals, ln-|p. — In ^
Therefore, since w — m,o and W — i\f,C
. m .c , ( m ,V ” rln M jc = ln W . )
from which 4 = — X ■'!*, _ r = ( v'r')C vi, M ,x r \ M ,J
I f M , is known, as it was in some of these laboratory experim ents because of the m anner of filling, m , a t any stage is calculable from it and the weight, Q, of liquid w ithdrawn, for from E quation 2
M - Q - V D , 1 — r M . Q
and hence £ = f i i L _ r rc L1 (1— r)M,\ (4)
By the aid of values calculated from th is equation, the per
centage increase in concentration, 100 g — , can be plotted
against the percentage of solution w ithdraw n, as is illus-J r i g
tra ted in Figure 1 for a solution containing 5% of sesame oil in Freou-12. For the construction of this graph Da was taken as 0.0377 gram per cc., D, as 1.291 grams per cc., and r therefore as0.0292. I t shows th a t a quan tity of liquid equal to 22% of the original liquid content m ust be w ithdraw n before the concentration of insecticide rises 1% , th a t removal of 80% causes a 5% rise, and th a t 92.5% delivery gives only a 9% rise.
If, as will more often be the case, the to ta l content of the container, ¿1/, ra ther than th e liquid content, M „ is known,„Equation 4 can be converted, because of the relationship
M , =
into the equivalent form
- 0
M - VD„1
cC
Qi l l - VD,r
and 100 — ¡ r ~ ean be plotted against the percentage of
to ta l contents removed.
E X P E R IM E N T A L V E R IF IC A T IO N
T he errors due to the assum ption th a t the gas and liquid densities are constant can be judged by a consideration of the possible departures of those values from constancy. The possible changes in gas density were derived from m easurem ents of the lowering
355

P E R C E N T O F O R I C I N A L S O L U T IO N W IT H D R A W N F R O M C O N T A IN E R
re 1. Increase in Concentration of Freon Solution of O i ly Insecticide as Contents A re Withdrawn from Container
Low ering of V ap o r Pressure of Freon-12 by Sesame O ilSesam e Oil Vapor P ressure Lowering
% M m . o f Ho2 .5 8 , 7, av . 6 .55 .0 18, 19, 18, av . 18 .3
10 23, 24, 28, av . 2515 35, 37, av . 36
of vapor pressure produced by dissolving various proportions of sesame oil in Freon-12.
T he apparatus used to m ake these measurem ents (Figure 2) consists of two identical containers w ith valves connected through a U -tube containing mercury, which acts as a differential m anometer. Two small petcocks, one on each side of the manometer, are necessary to operate the apparatus.
Three hundred gram s of liquid Freon-12 were always placed in the container on the righ t and an equal weight of solution was m ade up in the one on the left. T he connections were made to the m anom eter, and th e vapors from the two containers were allowed to enter th e m anom eter simultaneously until the to tal vapor pressure on each side was exerted. The whole apparatus was then submerged in a transparen t w ater bath . Readings were m ade a t 80° F . after th e system had reached equilibrium.
The Freon-12 used contained some nonliquefiable gases, which interfered somewhat. To overcome th is interference, containers of the same size w ith the same volumes occupied by th e liquid on
Density of Freon-12 Due to SesameD ensity
G./cc.1 .3 0 3 “
1 .298 , 1 .2985, av . 1 .298 1 .290 , 1 .292, av . 1.291 1 .274 , 1 .274 , av . 1.274 1 .2548, 1 .2552, av . 1.255 1 .2285, 1 .2295, av . 1.229
Table II. Change inSesam e Oil
Figure 2. Differential Manometer Apparatus to Determine V apor Pressure Lowering of Liquefied G as Solutions
1. Heavy-w alled glass lube containing mercury 5. Petcock2. Grass frame from 0.5-tneh pipe having slo b 6, N eedle valve on container
cut In each tide 7. Container3. Rubber gasket 8, LiqueBed gas solution4. A dapte r from 0 .3 7 5 - to 0,125-Inch pipe thread 9. LiqueB ed gas
“ F ro m B icbow sky an d G ilkey (1),
356 I N D U S T R I A L A N D E N G I N E E R I N G C H E M I S T R Y Vol. 16, No. 6
June, 1944 A N A L Y T I C A L E D I T I O N 357
Table III. Concentrating Effect Caused by Rem oval of L iq u id from an A eroso l Bomb
{Containing orig inally 400 gram s of a 5 % so lu tion of co ttonseed oil in Freon-12)
Solution W ithdraw n R elative C oncen tra tion of Oil% by w eight D eterm ined C alculated
% %0 ( 100 . 0) 100.0
50 100.9, 101.5 , av . 101 .2 102.180 105.3 , 100.5 , av . 105.9 105.290 108.9, 109.1 , av . 109 .0 108.0
seed oil was chosen instead of sesame oil because it did not oxidize when heated for the analyses. T he initial concentration was determined by w ithdrawing two 5-gram samples into pressure test tubes, which were weighed before and after to determine the exact weight of the samples.
The apparatus was used w ithout the hydrom eter. T he volatile solvent was then allowed to evaporate, and the tes t tube containing the residue was removed from the frame and heated for 30 minutes a t 110° C. The weight of the residue was then determined and the concentration by weight of nonvolatile m atter calculated. D uplicate samples were also taken after 50, 80, and 90% of the solution had been allowed to escape. Mechanical difficulties m ade the results unreliable after 95% had been removed. All operations were carried ou t a t 80° F . T he results are shown in Table I I I .
The degree of concordance shown is good, considering the experimental difficulties involved. T he over-all effect is compara-
tively small until the container is alm ost em pty and, since it is in th e direction leading to greater assurance of getting the required minim um concentration, no t very im portant in the actual application of th e insecticide. I t m ight be im portant, however, to a m anufacturer filling small containers from a large one. The last containers to be filled will contain more insecticide than the first unless some compensatory measures are taken. I t is also im portant, when samples oi solution are being used for test purposes afe a standard of comparison. In precise laboratory tests it would be good practice to use no t more th an 50% of th e original solution. The simplest procedure in the commercial filling of aerosol containers is to add sufficient pure Freon to the reservoir a t intervals to m aintain approxim ately the original concentration. This procedure is used by some present aerosol m anufacturers.
Although the foregoing discussion has been based wholly on da ta pertaining to dichlorodifluoromethane, the formula developed will obviously apply to all liquefied-gas solutions for which the densities of the liquid and gaseous phases remain reasonably constant during evaporation.
L IT E R A T U R E C ITED
(1) Bichowsky, F . R ., and Gilkey, W . K ., I n d . E n g . C h e m ., 23, 366(1931).
(2) Buffington, R . M ., and Gilkey, W. K ., Ibid., 23, 254 (1931).(3) Goodhue, L. D., Ibid., 34, 1456 (1942).
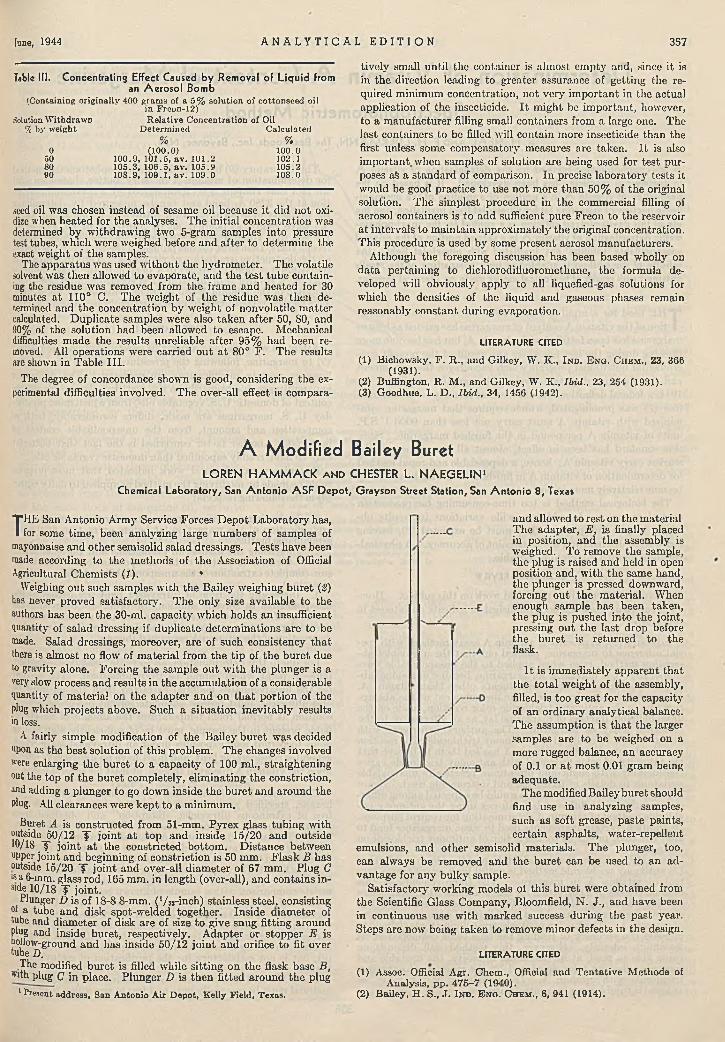
A M odified Bailey BuretL O R E N H A M M A C K a n d C H E S T E R L . N A E G E L I N 1
Chem ical Laboratory, San A n to n io A S F D epot, Grayson Street Station, San A n to n io 8 , Texas
THE San Antonio Army Service Forces D epot L aboratory has, for some tim e, been analyzing large num bers of samples of
mayonnaise and o ther semisolid salad dressings. T ests have been made according to the m ethods of th e Association of Official Agricultural Chem ists ((). 1 *
Weighing ou t such samples w ith the Bailey weighing buret (2) has never proved satisfactory. T he only size available to the authors has been the 30-ml. capacity which holds an insufficient quantity of salad dressing if duplicate determ inations are to be made. Salad dressings, moreover, are of such consistency th a t there is alm ost no flow of m aterial from the tip of the b u re t due to gravity alone. Forcing the sample ou t w ith the plunger is a very slow process and results in the accum ulation of a considerable quantity of m aterial on th e adap te r and on th a t portion of the plug which projects above. Such a situa tion inevitably results •n loss.
A fairly simple modification of th e Bailey buret was decided upon as the best solution of this problem. T he changes involved were enlarging the bu re t to a capacity of 100 ml., straightening out the top of the buret completely, elim inating the constriction, and adding a plunger to go down inside the bu re t and around the plug. All clearances were k ep t to a minim um.
Buret A is constructed from 51-mm. Pyrex glass tubing with outside 50/12 f jo in t a t top and inside 15/20 and outside 10/18 _y jo in t a t th e constricted bottom . D istance between upper joint and beginning of constriction is 50 mm. F lask B has outside 15/20 y jo in t and over-all d iam eter of 67 mm. Plug C is a 6-mm. glass rod, 165 mm. in length (over-all), and contains inside10/18 y joint.
Plunger D is of 18-8 8-mm. ('/si-inch) stainless steel, consisting of a tube and disk spot-welded together. Inside aiam eter of tube and diam eter of disk are of size to give snug fitting around Plug and inside buret, respectively. A dapter or stopper E is pollow-ground and has inside 50/12 jo in t and orifice to fit over tube D.
The modified bu re t is filled while sitting on th e flask base B, with plug C in place. P lunger D is then fitted around th e plug
1 Present address, S an A nton io A ir D epo t, K elly F ie ld , Texas.
and allowed to rest on the material T he adapter, E , is finally placed in position, and the assembly is weighed. To remove th e sample, th e plug is raised and held in open position and, w ith the same hand, the plunger is pressed downward, forcing out the m aterial. When enough sample has been taken , th e plug is pushed in to the joint, pressing ou t th e last drop before the buret is re turned to the flask.
I t is im m ediately apparen t th a t the to ta l w eight of the assembly, filled, is too great for the capacity of an ordinary analytical balance. T he assum ption is th a t the larger samples are to be weighed on a more rugged balance, an accuracy of 0.1 or a t m ost 0.01 gram being adequate.
T he modified Bailey bu re t should find use in analyzing samples, such as soft grease, paste paints, certain asphalts, water-repellent
emulsions, and o ther semisolid m aterials. T he plunger, too, can always be rem oved and the bu re t can be used to an advantage for any bulky sample.
Satisfactory working models oi this buret were obtained from the Scientific Glass Com pany, Bloomfield, N . J ., and have been in continuous use w ith m arked success during the past year. Steps are now being taken to remove minor defects in the design.
L IT E R A T U R E C ITED
(1) Assoc. Official Agr. Chem., Official and T en tative M ethods ofAnalysis, pp. 475-7 (1940).
(2) Bailey, H . S., J . I n d . E n o . C h e m ., 6, 941 (1914).
Determination of Vitamin A Content of MargarineSpectropkotom etric M ethod
R. H . N E A L A N D F. H . L U C K M A N N , The Best Foods, Inc., Bayonne, N . J.
A spectrophotometric method for the determination of vitamin A in commercial margarine has been developed. It is based on the destruction of vitamin A i n a portion of a solution of the unsaponi- fiable fraction of margarine fat by ultraviolet light irradiation, and the use of this devitaminized solution as a control for the spectrophoto- melric determination of vitamin A in a second portion of the original unsaponifiable solution not irradiated with ultraviolet light. The validity of the method is established by a comparison of the results obtained with results of biological assays made on identical samples.
TH E need for a rapid and accurate m ethod for the determ ination of the v itam in A content of m argarine lias existed as long as
m argarine has been fortified w ith vitam in A, b u t has become more pressing during the last few years as a result of the present governm ental nutritional program which encourages the enrichment and fortification of certain foods w ith essential nutrients. In 1941, a federal definition and standard of identity for oleomargarine (7) was prom ulgated, which requires th a t m argarine v ita minized w ith v itam in A m ust carry no t less than 9000 U.S.P. units of vitam in A per pound in th e finished margarine. Since this standard has been in effect, alm ost all margarines on the m arket carry vitam in A; hence, a dependable and rapid method for determ ination of vitam in A in finished m argarine has recently become relatively more im portant.
The biological m ethod is too time-consuming for production control purposes. In addition, wide variations in results obtained by the biological method m ust be expected (3), leaving much to be desired from the standpoint of accuracy. A physical- chemical method is therefore desirable.
L IT E R A T U R E R E V IE W
There is relatively little published work on this subject. However, sufficient work has been published to indicate an in terest in th is m atter.
_ Edisbury (6), in describing vitam in A assay m ethods w ith special reference to margarine, pointed ou t th a t the u ltraviolet absorption method, even when applied to the unsaponifiable fraction of the oil, is unreliable for margarine, because of residual absorption of unsaponifiable constituents other than vitam in A. H e suggested a spectrophotom etric m easurem ent of the absorption due to the antim ony trichloride color reaction, m ade on the unsaponifiable fraction of m argarine fat, as an alternative to the biological assay of m argarine. The au thors’ experience w ith measuring the intensity of the antim ony trichloride color reaction as a means of estim ating vitam in A has led them to believe th a t the intensity of color produced w ith antim ony trichloride varies considerably w ith slight-and oftentim es practically unavoidable variations in details of technique and instrum ents used. Hence considerable variations in results would be expected among different operators and different laboratories using the antim ony t r i chloride m ethod of vitam in A determ ination for control purposes. In addition, certain ingredients used in some m argarines tend to a lter the color produced by the action of antim ony trichloride on vitam in A,
Oser {10) indicates th a t an adapta tion of the D ann and Evelyn (3) antim ony trichloride m ethod is useful for a quantita tive control of vitam in A in margarine. The im provem ents in th is method consist of a correction for side reactions which sometimes develop interfering color or tu rb id ity , and the inclusion of a density m easurem ent produced by th e addition of a know'n increment of vitam in A. The Evelyn photoelectric colorimeter is claimed to increase the accuracy of reading the blue color developed a t its maximum intensity. However, this m ethod still depends on being able to read, a t its maximum intensity, th e unstable and somewhat fleeting color developed by the reactioh of antim ony trichloride w ith vitam in A. The instability of the color developed is troublesome for control purposes.
This laboratory (9) has published a spectrophotom etric method for determ ination of vitam in A in dairy butter, based on: (a) the fact th a t vitam in A is characterized by a maximum absorption a t the 3280 Â. band and can be measured by determining the intensity of absorption in the u ltraviolet region a t this (3280 À.) wave length, as pointed ou t by M orton et al. (ô, 8) and (b) the fact th a t vitam in A is destroyed by ultraviolet light; within recent years, D em nrcst (4) has published the results of his studies on the destructive irradiation of vitam in A. T hus by destroying the vitam in A (and carotene) in a portion of the unsaponifiable fraction, a control is obtained for the spectrophotom etric determ ination of the vitam in A and carotene contained in the sample. T his m ethod is considered to yield satisfactory results.
E X P E R IM E N T A L
A ttem pts were m ade to apply th is spectrophotom etric method (3) to m argarine, following the procedure used for dairy butter; however, certain modifications are necessary. The difficulties apparently are due prim arily to the fact th a t the unsaponifiable content of domestic U. S. vegetable oils, from which most present- day U. S. m argarines are made, differs considerably, both in composition and am ount, from th e unsaponifiable content of bu tterfa t. A nother factor concerned is the fact th a t butterfat m ay be more readily saponified th an domestic vegetable oils.
Prelim inary experimental work indicated th a t m ost progress could be made by modifying the m ethod as applied to dairy butter (3) in the following respects:
1. Increasing saponification tim e in order to ensure complete saponification of the m argarine fa t before extraction of the un- ; saponifiable m atter.
2. Increasing the num ber of extractions and the quantity of solvent used for extraction of the unsaponifiable, in order to ensure complete extraction of the unsaponifiable m aterial containing vitam in A.
3. Increasing the tim e of ultraviolet light irradiation of the unsaponifiable in solvent solution, in order to overcome the masking effect of the relatively large am ount of unsaponifiable m aterial present in m argarine fa t and thus to obtain complete destruction of the vitam in A contained therein.
For use in this determ ination, all solvents m ust be exceedingly pure— a point which cannot be overemphasized. The solvent for the unsaponifiable m aterial extracted from the oil must be optically clear, m ust possess adequate solvent power to hold in solution a t normal room tem peratures the am ount of unsaponifiable present in th e sample, m ust be of sufficiently high boiling point to perm it long exposures under an u ltraviolet lamp which generates considerable heat, and m ust have no destructive effects upon the vitam in A dissolved therein, a t least for several hours.
The authors have found either cyclohexane or m ethyl cyclo- hexane, specified as "purified for spectrophotom etric use and free of extraneous ultraviolet absorption” and obtained from Eastm an K odak Company, Rochester, N . Y., to be satisfactory in m ost instances (3). V itam in A is stable in either of these solvents for several days, provided th a t the solutions are stored in the dark, and the solvents themselves are sufficiently pure.
I t has been the au thors’ practice to verify the suitability of each lot of either cyclohexane or m ethyl cyclohexane byr spectrophoto- [ m etric comparison w ith a sample of known purity . A sample is considered usable only.if it shows no extraneous absorption in the region between 5000 and 2200 A.; extraneous absorption within this range is considered evidence of im purities and the material is rejected. A m ethod satisfactory for the purification of cyclohexane containing a small am ount of im purities has been given(3), bu t is no t satisfactory for the purification of m ethyl cyclohexane.
The ether and alcohol used for extracting th e unsaponifiable m aterial m ust be especially pure and free of peroxides, in order to
358

June, 1944 A N A L Y T I C A L E D I T I O N 359
avoid oxidation of the extracted vitam in A.These solvents m ust be carefully purified before use, even though the best grades are pu rchased. A m ethod for the purification of anhydrous c . p . ethyl ether w a s given in a previous publication (9). Specially denatured No. 30 alcohol can be satisfactorily purified by an A.O.A.C. method (/) .
Repeated a ttem pts have dem onstrated th a t the vitamin A content of whole m argarine fat (vitaminized) cannot successfully be destroyed by ultraviolet light irradiation, using available ultraviolet light equipm ent. However, the vitamin A content of the unsaponifiable fraction of margarine fa t can be destroyed by intense and ultraviolet irradiation. A considerably more transparen t solution of the extracted unsaponifiable, in the range below about 3200 A., results from the intense u ltraviolet irradiation required to destroy completely the vitam in A in the unsaponifiable fraction of margarine fa t; a t 3280 A., the increased transparency due to the action of ultraviolet light on unsaponifiable m aterials other than vitam in A is so small as to be neglected for all practical purposes. This point Figure 1.is demonstrated by the results shown in Table I.
The points covered in Table I are further illustrated in Figure 1, in which are shown ultraviolet absorption curves obtained on samples not included in the table. These curves, all obtained from the unsaponifiable fractions of the same stock of m argarine oil, serve to emphasize:
The absorption due to constituents other than vitam in A in m argarine oil unsaponifiable.
Ultraviolet irradiation of the unsaponifiable fraction of a vitam inized oil produces a m aterial which shows no v itam in A characteristics spectrophotom etrically. T his irradiated m aterial shows an absorption, a t the po in t of maximum vitam in A absorption, in reasonably close agreem ent w ith th a t of the nonvitaminized, nonirradiated, unsaponifiable fraction of the same oil.
Irradiation increases the transparency of the unsaponifiable fraction in regions below about 3200 A.
Irradiation of the unsaponifiable fraction of a vitam inized m argarine oil produces a control for spectrophotom etric v itam in A determinations, which gives results in reasonably close agreem ent with those obtained by use of the unsaponifiable fraction of the same oil before vitaminizing.
The curve (curve 5) obtained by the m ethod described herein
Table I. Effect of Irradiation
(Comparison of controls used in th e unsaponifiable m ethod for de te rm ina- tion of v itam in A in m argarine oil. D up lica te de te rm ina tions)
Ir rad ia ted U nsaponifiable of
V itam inized M argarine Oil
E J* x looo 1 OB.
k ( ihm)Ultraviolet A bsorption
Curves
(1 ) Irradiated unsaponifiable fraction of vitaminized margarine o il vs. solvent control(2 ) Nonirradiated unsaponifiable fraction of same margarine oil before vitaminizing vs. solvent control(3 ) Nonirradiated unsaponifiable fraction of same vitaminized margarine oil vs. nonirradiated unsaponifiable fraction of same oil before vitaminizing (both in solvent)(4 ) Nonirradiated unsaponifiable fraction of same vitaminized margarine oil vs. solvent control(5 ) Nonirradiated unsaponifiable fraction of same vitaminized margarine o il vs. same material after irradiation (both in solvent)
exhibits a vitam in A peak a t the region of maximum vitam in A absorption.
T he following method is based on the destruction of vitam in A in a portion of a cyclohexane (or m ethyl cyclohexane) solution of the unsaponifiable fraction of m argarine fa t by ultraviolet light and the use of this de- vitaminized solution as a control for the spectrophotom etric determ ination of vitam in A in a second portion of the original unsaponifiable solution no t irradiated w ith ultraviolet light.
E Q U IP M E N T U SED
S p e c t r o p h o t o m e t e r . Adam Ililger, L td ., in term ediate quartz spectrograph w ith Spek- ker photom eter, equipped w ith tungsten steel electrodes as a source of light. Q uartz ab sorption cells, Hilger Type C, 1-cm. quartz Kjoldahl-shaped flasks, 25 cc.
Beckman quartz spectrophotom eter, M odel D, m anufactured by N ational Technical Laboratories, South Pasadena, Calif. Equipped w ith tungsten lam p light source, cesium oxide and blue sensitive phototubes, and Corex absorption cells (1-cm. square type).
B oth instrum ents have been used with equally satisfactory results for this determ ination.
U l t r a v i o l e t L a m p . U v ia rc p o u ltry treater, Type R T , Spec. 100, C ooper-Ilew itt Electric Co., Hoboken, N. J . A more complete description of this lamp, together w ith a reference for obtaining its spectral radiation, has been given (9).
M E T H O D
SampleNo.
D a teAnalyzed
6-11-42
6-17-42
Irrad ia tedU nsaponifiable
C ontro l
N on irrad ia ted U nsaponifiable
of Oil before V itam inizing
as C ontro l
U .S .P . u n its o f v itam in A per pound o f margarine
13,é0013,60015,00016,100
14.00014.000 14,200 15,100
.largarm e u il v8. N on irrad i
a ted U nsaponifiable of Sam e
Oil before V itam inizing
600600600600
•wi P.rePai e<i under a u th o rs ’ supervision , w ith process sam ples avail-“ole lor use in th is experim ental work.
E x t r a c t io n o f U n s a p o n i f ia b l e M a t e r i a l . M elt the m argarine in a w ater bath a t about 60° C., and separate the fat by filtration through a W hatm an No. 12 folded filter paper (or o ther equivalent paper).
Saponify 20 grams of the separated and filtered fa t w ith 30 ce, of alcoholic potassium
hydroxide (200 grams per liter of specially denatured No. 30 alcohol) by boiling, w ith suitable reflux arrangem ent, for 15 minutes.
D ilute the alcoholic solution w ith w ater to approxim ately 4 volumes and cool in an ice-water bath . E x trac t the unsaponifiable m aterial w ith cold ethyl ether. A t least six extractions, w ith the following successive am ounts of ether, are required for complete rem oval of the unsaponifiable m aterial: 200, 150, 100, 50, 50, 50 cc. (Both the ether and alcohol m ust be vcr3- carefully purified im mediately before use. This is essential for dependable results.) Vigorous shaking is also necessary for complete removal of the unsaponifiable m aterial. The sample should be adequately protected from sunlight during extraction.
Composite the ether ex tracts and wash w ith 150-cc. portions of distilled w ater un til substantially free of soap. (There should be no appreciable tu rb id ity developed a fter acidifying the wash w ater w ith 10% hydrochloric acid.) A dequate precautions should be taken to avoid troublesome emulsions; the first two w ater W’ashes should be made by merely pouring the w ater through the e ther w ithout shaking.
F ilte r the ether solution through filter paper and concentrate to 25 to 50 cc. by distillation on a steam bath . Remove the rem ainder of th e ether by evaporating, on a steam bath, under a stream of carbon dioxide to prevent oxidation. W hen substantia lly all th e ether has been evaporated, cool im m ediately to abou t 20° C. (70° F .) and dissolve the unsaponifiable m aterial in optically clear cyclohexane or m ethyl cyclohexane. M ake a solution up to 50 cc. (40% solution weight to volume, on original fa t basis). F ilte r and store in the dark a t about 4° to 10° G. (40° to 50° F .) un til the sample is examined spectrophotom etrically, b u t no t longer th an 48 hours.
SPECTROPHOTOMETRIC DETERM INATION OF VlTAM IN A . D ivide the cyclohexane (or m ethyl cyclohexane) solution of unsaponifiable m aterial into two parts, and irradia te one portion under the U viarc as follow’s: T ransfer the solution to be irradiated into a 25-cc. K jeldahl-shaped quartz flask, and stopper the flask w ith a cork w rapped in alum inum foil. Allowr a t least 10

360 I N D U S T R I A L A N D E N G I N E E R I N G C H E M I S T R Y Vol. 16, No. 6
m inutes for the lamp to come to full operating tem perature before starting irradiations.
Support the flask in sucli a position th a t the cork rests against the rim of the Lampshade (the lamp in use is equipped w ith a shade 21 cm., 14 inches, in diam eter) and the bulb of the flask is held about 10 cm. (4 inches) away from the m ercury tube of the lamp. Place a sheet of alum inum foil about 7.5 cm. (3 inches) below the flask being irradiated, in order to reflect the light back tow ard the sample. A gitate the sample every 15 m inutes by gently tapping the flask, for example, w ith a pencil. Allow the sample to heat up as m uch as the lam p will heat it, provided th a t the tem perature does no t reach the boiling point of the solvent being used.
Irrad iate un til the vitam in A has been destroyed. Under the authors’ conditions, approxim ately 2.5 hours have been required for complete destruction of the vitam in A contained in this concentration of margarine fa t unsaponifiable. D estruction of v ita min A can be estim ated by the Carr-Price test, and the tim e of irradiation required for the u ltraviolet lamp in use can be established spectrophotom etrically by irradiating un til there is no further decrease in absorption of the irradited sample a t 3280 A.
After cooling to about 21° C. (70° P .), filter the irradiated solution, which m ust be clear and colorless, and determine v itamin A in the nonirradiated solution by means of the spectrophotom eter (1-cm. cells), using the u ltraviolet irradiated solution as a control. W ith the H ilger spectrophotom eter, expose the plates a t density settings ranging from 0 to 1.50 in increments of 0.05, w ith the exposure tim e graduated up to about 2 seconds on E astm an No. 33 plates. These plates are satisfactorily developed w ith E astm an D72, diluted 1 to 2. Considerable time can be saved, w ithout any sacrifice in accuracy, by using a Beckman spectrophotom eter. For this instrum ent, 1-cm. square type Corex absorption cells are satisfactory. A tungsten lamp instead of a hydrogen discharge tube can be satisfactorily used as a source of ultraviolet light.
Read the m atch point (or density) a t 3280 A., and calculate thea ] cm va ue th e sample under test. The difference in absorption a t 3280 A., between the nonirradiated and irradiated sample', is a measure of the vitam in A content of the sample.
This method has been successfully used for determ ining the vitam in A content of a variety of domestic vegetable oil margarines, b u t no attem pts have been m ade to apply the method to animal fa t margarines or to coconut oil type margarines.
C a l c u l a t i o n s
M atch point (or density) a t 3280 A. w w trA———— X wl4U X 4o4 —
U .S.P.units of vitam in A per pound of m argarine fat
% fa t in sample X U.S.P. units of vitam in A per poundof bu tte rfa t _
100U.S.P-. units of vitam in A per pound of margarine
These calculations are based on 2140 as the conversion factor for vitam in A.
D e r i v a t i o n o f C o n v e r s io n F a c t o r o f 2140. The conversion factor to be used for converting from E J % value a t 3280 A.,to U.S.P. units of vitam in A per gram of oil, was determ ined for the instrum ents employed by use of the U .S.P. standard of reference cod liver oil. The method, consisting of value determ inations, m ade by the instrum ent being calibrated, on the unsaponifiable fraction of U.S.P. standard of reference cod liver oil containing 3000 U.S.P. units per gram of oil, has been described (9). The saponification and extraction procedure used for rem oval of the unsaponifiable m aterial from the reference cod liver oil, for spectrophotom etric study, is a modification of the procedure published by Wilkie (12).
Table I I shows the results of conversion factor determ inations m ade with the Hilger spectrophotom eter, using the current U.S.P. standard of reference cod liver oil containing 1700 U .S.P. vitam in A units per gram of oil. These determ inations include results obtained by the use of both cyclohexane and m ethyl cyclohexane as solvents. In order to minimize the effect of any possible instability of the U .S.P. reference oil, fresh or practically fresh
Table II.
D ate of D eterm in
Establishment of Conversion Factor (H ilg e r Spectrophotometer)
P e r C en tSolution M atch /?!% Couver- (Original P o in t . 1 cm. sion
a tion Oil Basis) Solvent a t 3280 A. Value Factor2-28-41 1.000 Cyclohexane 0.795 0.795 21382-28-41 1.000 M ethyl
cyclohexane0.795 0.795 2138
6-12-42 1.000 M ethy lcyclohexane
0.790 0.790 2152
8-4-42 1.000 M ethylcyclohexane
0.790 0.790 2152
8-4-42 1.000 M ethylcyclohexane
0.800 0.800 2125
8-18-42 1.000 M ethylcyclohexane
0.795 0.795
Av.
2138
2137
C onversion fac to r of 2140 used. Sim ilar resu lts were ob tained by use of B eckm an spec trophotom eter.
D eterm ina tions d a ted 2-28-41, 6-12-42, and 8-4-42 were m ade on fresh sam ples of reference oil, n o t previously opened. D eterm ina tion dated 8-18-42 was m ade on sam e sam ple used on 8-4-42 a fte r sto rage for 2-week in te rim a t 7° C. (45° F .) in th e dark and under an a tm osphere of carbon dioxide.
samples of th e reference oil were used for each determination as indicated.
E x p e c t e d A c c u r a c y o f M e t h o d . In order to determine the lim it of vitam in A recovery and the degree of reproducibility which m ight be expected from the use of th is method, several lots of m argarine were made under controlled conditions. Samples of th e oil going into th e m argarines were taken before the vitam in A -bearing oils were added. T he finished margarines were analyzed by the above m ethod and the oils before processing into m argarine were analyzed spectrophotom etrically as whole oil, using the nonvitam inized bu t otherwise identical oil sample as a control. Typical results (Table I I I ) show th a t very close to theoretical recovery can be obtained by th is method, and th a t the results are reproducible to a satisfactory degree.
C o r r e l a t io n w i t h B io l o g ic a l A s s a y s . In order to determine the agreem ent between the spectrophotom etric method and the biological U .S.P. m ethod, several samples of m argarine were analyzed by the spectrophotom etric method a t about the time th a t portions of the identical p rin ts were being assayed for vitamin A by commercial biological laboratories.
Table III. Reproducibility and Recovery of Vitam in AS pectrophotom etric A nalysis of W hole
V itam in A Found by
Ir rad ia ted Oil, U sing N on- Irrad iatedSam ple D eterm ina U nsaponifiable vitam inized Unsaponifi
No. tio n No. M ethod C ontro l Oil able M ethod
U .S .P . units U .S .P . units %I 1 15,500 16,100 96
2 15,100 15,900 95II 1 16,900 16,900 10Q
1022 16,700 16,300II I 1 15,100 15,500 97
2 15,700 15,500 101IV 1 15,300 15,300 100
2 15,100 15,700 96Av. 98.4
All samples used for this comparison were commercial margarines, received in their original containers; included were several different brands of margarine, m ade by different manufacturers, and also several p rin ts of one single b rand of margarine. The da ta covering the comparison of results obtained by the above m ethod w ith those obtained by the U .S.P. biological method were bu ilt up over a period of approxim ately one year.
In order to obtain sufficient da ta to estim ate the biological vitam in A potency of these samples w ith a reasonable degree of accuracy, the commercial biological laboratories employed for tb s work were instructed, in m ost instances, to feed the standard of reference cod liver oil and the sample of m argarine under test at two different levels. By means of log-dose interpolation curves, p lotting weight response vs. sample weight fed, the biological

June, 1944 A N A L Y T I C A L E D I T I O N 361
Table IV . Comparison of Results of Spectrophotometric vs. Biological M ethods(S tan d ard of reference oil con tain ing 1700 U .S .P . v itam in A un its per gram used)
TT O D Ti’ 1-- : ,,1 _opecw opnotom etncM ethod No. of Levels Fed D aily D ose A verage G ain W eight
D e ter U .S .P . un its U .S .P . U .S .P . OnSample m ina per pound of reference reference reference On
No. B rand tion No. m argarine“ oil Sam ple oil Sam ple oil sam pleM g. Mg. Grants Grams
1 A 1 9,700 0 .8 8 56.7 28.1 23.12 9,500 2 23 9,300 1 .47 9 4 .5 36.1 35^0
Av. 9,5002 B 1 16,100 0 .8 8 3 4 .0 30 .3 14.0
2 16,100 2 23 15,900 1.47 56.7 39*6 2<Ü9
Av. 16,0003 C 1 15,300 0 .882 53.4 19 .9 28 .9
2 15,100 2 23 14,600 . 1.176 6 9 .8 21Ü 0 4Ó!o
Av. 15,0004 D 1 9,700 0 .882 82.5 19.9 3 8 .9
2 8,900 2 23 9,100 1.176 113'. 5 29 .0 5 1 .8
Av. 9,2005 E 1 16,300 1.176 100.9 3 7 .0 51.9
2 16,100 1 1Av. 16,200
6 E 1 11,500 0 .8 8 45 .4 29 .9 27 .92 11,300 2 2 1 .47 75 .6 44 .2 40 .3
Av. 11,4007 E 1 14,000 0 .8 8 45.4 2 8 .5 3 4 .3
2 12,800 2 2 1.47 75 .7 51.1 38.4Av. 13,400
8 E - 1 16,100 0.882 19.92 15,900 2 1 1.176 100 .9 2 9 .0 57 !o
Av. 16,0009 E I 15,200 0 .8 8 45 .4 30 .3 28 .3
2 2 1.47 7 5 .6 4 8 .2 3 5 .010 E 1 12,500 0 .8 8 45.4 40.3 37 .4
2 2 1.47 7 5 .6 5 7 .3 4 3 .311 E 1 13,400 0 .8 8 45 .4 31 .4 3 1 .8
2 14,000 2 23 14,000 1 .4 7 . 75 .6 38!6 4 Ü 9
Av. 13,80012 E 1 14,200 I 1 1.176 100.9 3 5 .5 47 .313 E 1 13,400 2 2 0 .8 8 45 .4 3 0 .2 3 7 .8
1.47 75 .6 4 3 .8 4 7 .814 E 1 16,500 0 .8 8 45 .4 2 8 .9 3 2 .8
2 2 1.47 75 .6 44 .3 55.1
U .S .P . un its v itam in A per pound of m argarine, average
b y log-dose in te rpo la tion curves“
10,100
6,900
17.500
15.300
O ver 9,000
13.500
14.200
21,400
12.300
11,800
17.200
O ver 9,000 18,700
Av. (excluding N os. 5 and 12, on which only single level b io-tests are available) 13,491
a Results rounded off to n eares t 100 un its .
18,300
14,766
vitamin A potency was estim ated as th e average of the response from the levels fed. All biological tes ts were m ade by the U.S.P. method. Two commercial biological laboratories, Food Research Laboratories, Long Island City, N . Y., and the L aboratory of Vitamin Technology, Chicago, 111., carried ou t the biological tests. However, each sample was bio-tested by only one of th e biological laboratories.
The com parative results, shown in T able IV , dem onstrated that consistent and reproducible results are obtained by the spectrophotometric m ethod; these results are in as reasonable agreement w ith th e U .S.P. biological m ethod as could be expected when the known variation in results obtained by th e biological method is considered {11). I t is significant th a t while in this comparison th e biological m ethod gave som ewhat higher results than the spectrophotom etric m ethod on some samples, th e reverse was true on o ther samples, and th e average of all the samples analyzed by th e spectrophotom etric m ethod is in very close agreement w ith th e average of th e same samples tested by the biological m ethod.
A similar condition has been found to exist when comparing biological results obtained by different biological laboratories on identical samples of v itam in A -bearing oils. A separate publication {U) covers several years’ experience w ith vitam in A -bearing oils used for enriching m argarine and reports biological results obtained by two different laboratories on each of eleven large lots.
T he average of th e results on all samples obtained by the two laboratories agree to w ithin 3% a lthough results on individual samples show variations ranging from 2 to 95%.
T hus some individual variations in results obtained by spectrophotom etric and biological methods, as shown in T able IV, m ust be expected because of the relatively poor reproducibility of the biological method. T he results on m ost individual samples compared by th e two m ethods show reasonably good agreem ent in vitam in A potency. These results are considered to confirm the validity of th e spectrophotom etric m ethod described above.
S U M M A R Y
A spectrophotom etric m ethod for th e determ ination of vitam in A in m argarine is based on the destruction of vitam in A in a portion of a solution of the unsaponifiable fraction of m argarine fa t by u ltrav io let irradiation, and the use of th is devitam inized solution as a control for th e spectrophotom etric determ ination of vitam in A in a second portion of th e original unsaponifiable solution no t irradiated w ith ultraviolet light. T his method gives consistent and reproducible results, and practically complete recovery of th e v itam in A contained in margarine. Two satisfactory solvents and tw o satisfactory instrum ents for th is determ ination are described. T he valid ity of th e m ethod has been demonstrated by comparison w ith the U .S.P. biological m ethod on identical samples, by feeding both th e sample under te s t and the

362 I N D U S T R I A L A N D E N G I N E E R I N G C H E M I S T R Y Vol. 16, No. 6
U .S.P. standard of reference oil a t multiple levels and estim ating the biological vitam in A potency from log-dose interpolation curves.
A C K N O W L E D G M E N T
The writers wish to express their appreciation to T he Best Foods, Inc., for permission to publish th is work; also to E . D. Seiter and G. Rowland of th is laboratory and Miss C. N o tt, formerly of this laboratory, for valuable technical assistance.
L IT E R A T U R E C ITED
(1) Assoc. Official Agr. Cliem., Official and T en tative M ethods of Analysis, 4 th ed., p. 412, Section 22, 1935.
Qualitative Differentiation and Methyl
J O N A S K A M L E T , Chem ical Research Division,
(2) B arthen, C. L., and Leonard, C. S., ■/. Am. Pharm. Assoc., 26,5 1 5 -2 4 (1 9 3 9 ).
(3) D ann, W . J-, and Evelyn, IC. A., Biochem. J ., 32, 100S (1938).(4) Deinarest, Beaum ont, Z. Vitamin]orach., 9, 20-1 (1939).(5) D rum m ond, J . C., and M orton, It. A., Biochem. J„ 23, 785
(1 9 2 9 ).(6) E disbury, J . R ., Analyst, 65, 484-93 (1940).(7) Federal Register, 6 , 2761 (1 941).(8) M orton, R . A., and Heilbron, I. M ., Biochem. J ., 22, 9S7 (1928).(9) Neal, R . H „ H aurand, C. IT., and Luckm ann, F. H., I n d . E n o .
C h e m ., A n a l . E d ., 13, 150 (1 9 4 1 ).(10) Oser, B. L., Federation Proc., 1, 343 (1942).(11) Vahlteich, H . W., and Neal, R . H ., Food Industries, 16, 90
(M arch, 1944).(12) Wilkie, J . B„ J . Assoc. Official Agr. Chem., 20, 208-12 (1937).
of the Methylcarbinols Ketonesides Laboratories, Inc., N ew York, N . V.
Compounds yielding positive Lieben iodoform reactions may be either methyl ketones or methylcarbinols. O n reaction with a reagent containing o-nitrobenzaldehyde in alkaline solution, o nly the methyl ketones will form indigo and may thus be distinguished readily from the methylcarbinols.
IN T H E course of a recent investigation, a simple and rapid m ethod was needed for the qualitative differentiation of
m ethyl ketones and m ethylcarbinols. T he valuable Lieben iodoform reaction (7) has long been used to detect th e grouping CH3CO— when joined to a hydrogen atom , or to a carbon atom which does no t carry highly activated hydrogen atom s, or groups capable of exerting excessively high stone hindrance. However, the corresponding m ethylcarbinols (CH3CHOH—) will also give the Lieben reaction, owing undoubtedly to their prior oxidation by the alkaline hypoiodite reagent to the m ethyl ketones. Thus, while m ethyl ketones and m ethylcarbinols are readily identifiable by the Lieben reaction, there is no simple m eans of differentiating the two groups.
T he von Baeycr-D rew sen synthesis of indigo (/ , 6), a t one tim e practiced on a commercial scale, is based on a reaction which lends itself readily to such a differential identification technique. o-Nitrobenzaldehyde was found by these workers to condense w ith acetone, aeetaldehyde, or pyruvic acid in the presence of alkali, to form indigotin. Feig!, Zappert, and Vasquez (3) ap plied th is reaction to six additional m ethyl ketones (m ethyl e thy l ketone, m ethyl hcptenone, aeetophenone, acetylacetone, diacetyl, and ethyl acetoacetate) and suggested its applicability in detecting other m ethyl ketones.
Tananescu and his co-workers (8, 9) have suggested th a t the reaction probably proceeds as follows:
The m ethyl ketone first condenses with the o-nitrobcnzalde- hyde to form the corresponding |8-2-nitrophenyl-|3-hydroxy- e thy l ketone ( I ) :
Compound I I then cyclizes in the presence of the alkali:
C rCHO+ CH3COR
''j—NOs
J—C H O H . CH S. C O . R (I)
Compound I undergoes an intram olecular oxidation-reduction to form the corresponding /3-2-nitrosophenyl-|3-ketoethyl ketone ( I I ) :
/ \ - N 0 8
^ / L cHOH.CHí .GO.RNO
C O . C H 2.C O . R
0 -■NO
C O .C IL .C O .RO H - V l —COR
C O / (III)
to form Compound I I I , two moles of which split off R . COOII by hydrolysis and form one mole of indigotin:
1 '^ C — COR + 2NaOHc o /
Q - n h > C = C < :+ 2 R.COONa
(II)
As the result of the au tho r’s investigation, it was found that a simple qualitative differentiation of m ethylcarbinols and m ethyl ketones could be based on the Lieben iodoform reaction in conjunction w ith the von Baeyer-Drewsen. indigo reaction, both being specifically modified for use as an analytical technique. A negative iodoform reaction rules ou t bo th methylcarbinols and m ethyl ketones; a positive iodoform reaction and a negative indigo reaction indicate a m ethylcarbinol; a positive iodoform reaction and a positive indigo reaction indicate a m ethyl ketone. This differentiation is specific. W hen a technical sample of a methylcarbinol was found to give a fain t positive indigo reaction, this could invariably be traced to the presence of methyl ketone as an im purity. Scrupulous purification of the methylcarbinol (e.g., via a characteristic crystalline derivative) resulted in a product which reacted entirely in the expected
I O D O F O R M R E A C T IO N
T he procedure used for the iodoform reaction was th a t described by Fuson and Tullock (5).
R e a g e n t s R e q u i r e d . Dioxane, 10% sodium hydroxide solution, and iodine reagent: 200 grams of potassium iodide and 100 gram s of iodine dissolved in 800 ce. of distilled water.
P r o c e d u r e . A bout 100 mg. of the compound being tested are placed in a 150 X 16 mm. te s t tube, 5 cc. of dioxane are added, and the sample is dissolved w ith shaking. F irst 1 cc. of 10% sodium hydroxide solution and then th e iodine reagent
are added dropwise w ith shaking until a slight excess of iodine causes a definite dark color w hich does no t disappear on s tand ing. The tes t tube is now placed in a w ater b a th m aintained a t 60° C., and th e dropwise addition of the iodine reagent is continued until th e definite dark color persists as before; bu t the «■arming a t 60° C. should no t last over 2 m inutes. The excess of iodine is now rem oved w ith a few drops of 10% sodium hydroxide solution, and the te s t tube is filled w ith cold water, allowed to stand for 15 m inutes, and filtered. The characteristic odor of iodoform is readily distinguishable. As a confirmation, the crystals which are collected on the filter paper are dried at 100° C. for one hour and identified by their m elting point. Iodoform m elts a t 119-121° C.
IN D IG O R E A C T IO N
Since o-nitrobenzaldehyde is no t a t present obtainable from any domestic source, it m ay be prepared by n itra ting benz- aldehyde by the m ethod described by Friedlander and Hcn- riques (4) and separating th e o-nitrobenzaldehyde from the mixture of isomers thus obtained by the m ethod described by Erlmrt (2).
P r e p a r a t io n o f R e a g e n t . One hundred grams of finely powdered sodium n itra te are added in small portions to 1 liter of 66° B6. sulfuric acid, the tem perature of the m ixture being kept below 20° C. by external cooling, c.p. benzaldehyde (106 grams) is now added to this n itra ting m ixture in small portions, the tem perature being kept below 30-35° C. A fter all the benzaldehyde has been added, the reaction m ixture is cautiously poured into a m ixture of 1.5 liters of w ater and 1.5 kg. of ice. The oily layer of mixed o- and »i-nitrobenzaldehyde is separated by decantation and mixed w ithout heating w ith 500 cc. of 44% sodium bisulfite solution (sp. gr. 1.37). Six hundred cubic centimeters of w ater heated to 45° C. are now added to dissolve the m agm a of crystals and the resu ltan t solution is chilled in a refrigerator a t 0° to 5° C. for 48 hours. The copious precipitate of »2-nitrobenzaldehyde sodium bisulfite which forms is filtered off. To the filtrate is added a sa tu ra ted sodium car- bopate solution to strong alkaline reaction, and the m ixture is cooled and extracted w ith three successive 500-ec. portions of ether. The ether extracts are dried overnight over anhydrous calcium chloride, filtered, and the solvent evaporated off. The residual oil (20 to 25 grams) solidifies on cooling and consists ofo-nitrobenzaldehyde mixed w ith sm aller am ounts of wi-nitro- benzaldehyde. T his product is sufficiently pure for use in the technique described below.
The o-nitrobenzaldehyde reagent is prepared by dissolving 5.0 grams of the crystals or the oily product in 100 cc. of 95% ethanol. This reagent solution should be prepared fresh from the undissolved compound a t least once a m onth, and stored in an amber-colored glass-stoppered bottle.
P r o c e d u r e . A bout 100 mg. of the compound being tested Rre dissolved or suspended w ith vigorous agitation in 5.0 cc. of the o-nitrobenzaldehyde reagent, and 1.0 cc. of 10% sodium hydroxide solution is added dropwise. An im m ediate darkening of the solution will occur (partly due to the form ation of dismutation products of o-nitrobenzaldehyde). A fter 60 seconds, a few drops of th e solution are placed on a piece of filter paper and allowed to be absorbed. The filter paper is then washed under a stream of tap w ater and examined. If the brown stain has washed away, the te s t is negative—i.e., the sample was a methylcarbinol. A positive te s t—i.e., a m ethyl ketone—is evidenced by a distinct and unm istakable deposition of indigo- blue dyestuff w ithin the fibers of the filter paper. The “ spo t” of indigo blue is usually rimm ed by a characteristic blue-green ring, which cannot be removed, even by prolonged washing. By comparing the washable brown stains obtained w ith known methylcarbinols and the perm anent blue dye obtained with known m ethyl ketones, the chem ist can soon become highly proficient in distinguishing the two.
This method will detec t as little as 1 mg. of m ethyl ketone ® a 100-mg. sample of m ethylcarbinol. I t has been tried w ith a number of methylcarbinols and m ethyl ketones. The results obtained m ay be sum marized by classifying the compounds as follows:
C lass I. Compounds which give a positive indigo reaction bu t fail to give a positive iodoform reaction: No compounds were found which fall in this class categorically. Sterically hindered compounds like pinacolone (1) give th e indigo reaction more readily than they form iodoform, b u t these belong properly in Class III,
June, 1944
C l a s s II. Compounds which give a negative indigo reaction and a positive iodoform reaction: ethanol (2), isopropanol (3), m ethylethylcarbinoi (4), methyl-w-propylcarbinol (5), m ethyl- isopropylcarbinol (6), m ethyl-R-butylcarbinol (7), m ethyliso- butylcarbinol (8), m ethyl-n-amy)carbinol (9), methylisoam yl- carbinol (10), methyl-n-hexylcarbinol (11), methylisohexyl- carbinol (12), butandiol - 2,3 (13), bcnzylm ethylcarbinol (14), 1 - phenylpropandiol-2,3 (15), lactic acid (16), methyl lac ta te(17), and ethyl lactate (18).
T his class, therefore, comprises only the methylcarbinols—i.e., the series of compounds characterized by the grouping C H j. - C H O H — joined to a hydrogen atom or to a carbon atom which does no t carry groups th a t exert an excessively great steric hindrance.
C l a s s I I I . Compounds which give a positive indigo reaction and a positive iodoform reaction: acetaldehyde (19), acetone(20), m ethyl ethyl ketone (21), m ethyl n-propyl ketone (22), m ethyl isopropyl ketone (23), m ethyl n -butyl ketone (24), m ethyl isobutyl ketone (25), m ethyl rc-amyl ketone (26), m ethyl isoamyl ketone (27), m ethyl n-hexyl ketone (28), m ethyl iso- hexyl ketone (29) aeetoin (30), diacetyl (31), phenylacetone (32),1-phenylpropanol-l, one-2 (33), pyruvic acid (34), m ethyl pyruvate (35), ethyl pyruvate (36), m ethyl cyclohoxylketone (37), benzyl acetone (38), acetophenone (39), m ethyl p-tolyl ketone (40), p-chloroaeetophenone (41), p-bromoacetophenone (42), m ethyl p-anisyl ketone (43), 2,4-dimethoxyacetophenone (44),o-hydroxyacetophenone (45), w-hydroxy acetophenone (46), p-hydroxyacetophenone (47), 3-methoxy-4-hydroxyacetophenone (48), o-nitroacetophenone (49), o-aminoacetophenone (50),2-aceto-l-naphthoxyacetic acid (51),m esityl oxide (52), benzalace- tone (53), salieylalacetone (54), vanillalacetone (55), p-hydroxy- benzalacetone (56), furfuralacetone (57), aeetylacetone (58), acetonylacetone (59), benzoyiacetone (60), levulinic acid (61), m ethyi levulinate (62), ethyl levulinate (63), ethyl acetoaeetate (64), a-acety l-7-butyrolactone (65), pentanol-l-one-4 (66), 5- diethylam inopentanone-2 (67), m ethylheptenone (68), 0-ionone (69), ot-ionone (70), m ethyl vinyl ketone (71).
T his class, therefore, comprises only the m ethyl ketones—i.e., the series of compounds characterized by the grouping CI13.0 0 — joined to a hydrogen atom or to a carbon atom which does no t carry groups th a t exert an excessively great hindrance.
363
Interfering compounds in th e iodoform reaction are usually(a) prim ary amines which are oxidized to m ethyl ketones by the alkaline hypoiodite reagent (such as a-am inoisobutyric acid, a-phenylethy lamine, 2-am inoheptane, 2-aminohexane, isopropyl amine, etc.), (5) esters of ethanol and secondary alcohols which are hydrolyzed by th e alkaline reagent to compounds of Class I I (such as ethyl acetate, ethy l propionate, d iethylphthalate, diethyladipate, sec-butyl acetate, sec-amyl acetate, isopropyl- aeetate, etc.), and (c) oximes which are hydrolyzed to m ethyl ketones (such as acetoxime, acetophenone oxime, acetone oxime, m ethyl ethyl ketoxime).
The only compounds which have been found to interfere in the indigo reaction are those which ate readily hydrolyzed by th e alkaline reagent to compounds of Class I I I . These are (a) halogen derivatives (such as ethylidene chloride, 2 ,2- dibromopropane, 2,2-dibrom obutane, etc.), (6) acetals (such as acetaldehyde alcohólate, acetal), (c) oximes (such as acetoxime, acetophenone oxime, acetone oxime, m ethyl ethyl ketoxime,, ete.), and (d) bisulfite addition products (such as acetaldehyde.- sodium bisulfite, acetone sodium bisulfite, etc.).
L IT E R A T U R E C IT E D
(1) Baeyer, A. von, and Drewsen, V. B., (to Badische Anilin u. Soda-fabrik), German Patent 19,768 (Feb. 24, 1882); U. S. Patents 257,812-3-4-5 (May 9,1882).
(2) E rhart, Carl, German Patent 116,124 (Sept. 10, 1899).(3) Feigl, F., Zappert, R., and Vasquez, S., Mikrochemie, 17, 169
(1935).(4) Friedlander, P., and Henriques, R., Ber., 14, 2801-5 (1881).(5) Fuson, R. C., and Tullock, C. W., J . Am. Chem. Soc., 56, 1638-40
(1934).(6) Heller, G., Lauth, H., and Buchwaldt, A., Ber., 55, 483-9 (1922).(7) Lieben, Adolph, Ann., Suppl. 7, 218 (1870).(8) Tananescu, I., and Baciu, A., Bull. eoc. chim., V Series, 4, 1673-83
(1937).(9) Tananescu, I., and Georgesou, A., Ibid., IV Series, 51, 234-40
(1932).
A N A L Y T I C A L E D I T I O N
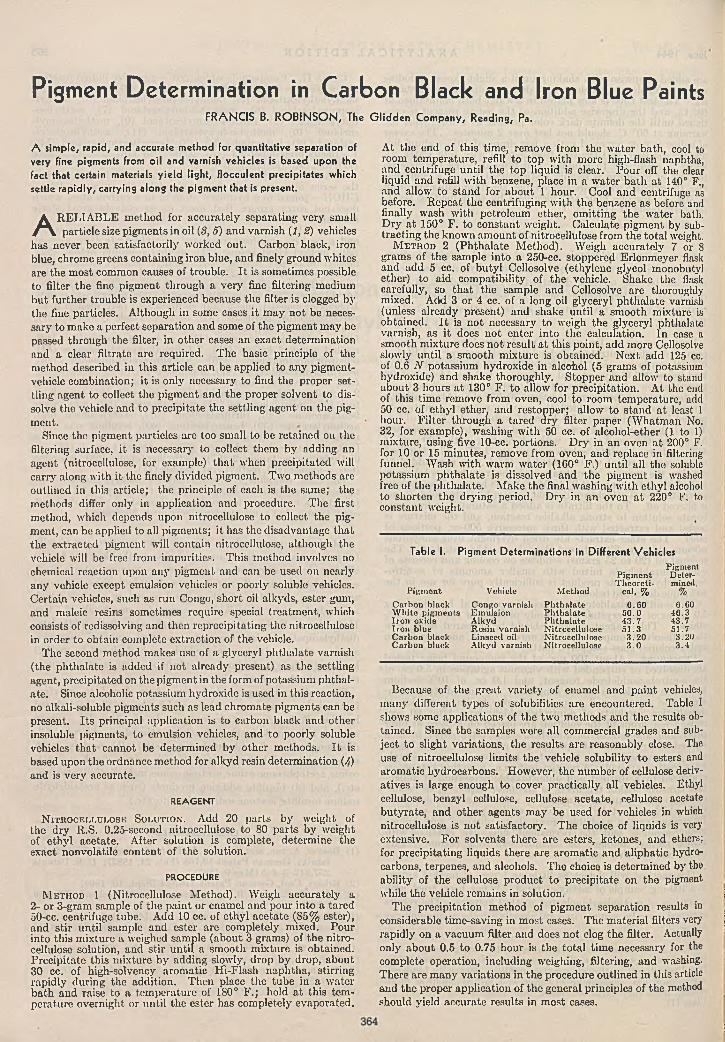
Pigment Determination in Carbon Black and Iron Blue PaintsF R A N C IS B. R O B IN S O N , The G lid d e n Com pany, Reading, Pa.
A simple, rapid, and accurate method for quantitative separation of very fine pigments from oil and varnish vehicles is based upon the fact that certain materials y ie ld light, flocculent precipitates which settle rapidly, carrying along the pigment that is present.
A R EL IA B LE m ethod for accurately separating very small particle size pigm ents in oil (3 , 5) and varnish (1, S) vehicles
has never been satisfactorily worked out. Carbon black, iron blue, chrome greens containing iron blue, and finely ground whites are the m ost common causes of trouble. I t is sometimes possible to filter the fine pigm ent through a very fine filtering medium bu t further trouble is experienced because the filter is clogged by the fine particles. Although in some cases i t m ay no t be necessary to m ake a perfect separation and some of the pigm ent m ay be passed through the filter, in other cases an exact determ ination and a clear filtrate are required. The basic principle of the method described in this article can be applied to any pigment- vehiclc com bination; it is only necessary to find the proper settling agent to collect the pigm ent and th e proper solvent to dissolve the vehicle and to precipitate the settling agent on the pigment.
Since the pigm ent particles arc too small to be retained on the filtering surface, it is necessary to collect them by adding an agent (nitrocellulose, for example) th a t when precipitated will carry along w ith i t the finely divided pigm ent. Two m ethods are outlined in this article; the principle of each is the sam e; the methods differ only in application and procedure. T he first method, which depends upon nitrocellulose to collect the pigm ent, can be applied to all pigm ents; it has the disadvantage th a t the extracted pigm ent will contain nitrocellulose, although the vehicle will be free from im purities. This m ethod involves no chemical reaction upon any pigm ent and can be used on nearly any vehicle except emulsion vehicles or poorly soluble vehicles. Certaiju vehicles, such as run Congo, short oil alkyds, ester gum, and maleic resins sometimes require special treatm ent, which consists of redissolving and then reprecipitating the nitrocellulose in order to obtain complete extraction of the vehicle.
The second method makes use of a glyceryl ph thalate varnish (the phthalate is added if not already present) as the settling agent, precipitated on the pigm ent in the form of potassium phthalate. Since alcoholic potassium hydroxide is used in this reaction, no alkali-soluble pigments such as lead chrom ate pigments can be present. I ts principal application is to carbon black and other insoluble pigments, to emulsion vehicles, and to poorly soluble vehicles th a t cannot be determ ined by other methods. I t is based upon the ordnance method for alkyd resin determ ination (4) and is very accurate.
R E A G E N T
N it r o c e l l u l o s e S o l u t i o n . Add 20 parts by weight of the dry R.S. 0.25-second nitrocellulose to 80 parts by weight of ethy l acetate. A fter solution is complete, determ ine the exact nonvolatile content of th e solution.
P R O C E D U R E
M e t h o d 1 (Nitrocellulose M ethod). Weigh accurately a2- or 3-gram sample of the pain t or enamel and pour into a tared 50-cc. centrifuge tube. Add 10 cc. of ethyl acetate (85% ester), and s tir until sample and ester are completely mixed. Pour into th is m ixture a weighed sample (about 3 grams) of the nitrocellulose solution, and s tir until a sm ooth m ixture is obtained. Precip itate th is m ixture by adding slowly, drop by drop, about 30 cc. of high-solvency arom atic S i-F lash naphtha, stirring rapidly during the addition. Then place the tube in a w ater ba th and raise to a tem perature of 180° F .; hold a t this tem perature overnight or until the ester has completely evaporated.
At the end of th is time, remove from the w ater bath, cool to room tem perature, refill to top w ith more high-flash naphtha, and^ centrifuge until the top liquid is clear. P our off the clear liquid and refill w ith benzene, place in a w ater ba th a t 140° F., and allow to stand for about 1 hour. Cool and centrifuge as before. R epeat the centrifuging w ith the benzene as before and finally wash w ith petroleum ether, om itting the w ater bath. D ry a t 150° F . to constant weight. Calculate pigm ent by subtracting the known am ount of nitrocellulose from the to ta l weight.
M e t h o d 2 (P h thala te M ethod). Weigh accurately 7 or 8 grams of the sample into a 250-cc. stoppered Erlenm eyer flask and add 5 cc. of butyl Cellosolve (ethylene glycol monobutyl ether) to aid com patibility of the vehicle. Shake the flask carefully, so th a t the sam ple and Cellosolve are thoroughly mixed. Add 3 or 4 cc. of a long oil glyceryl ph thala te varnish (unless already present) and shake until a sm ooth mixture is obtained. I t is no t necessary to weigh the glyceryl phthalate varnish, as i t does no t enter into the calculation. In case a sm ooth m ixture does no t result a t this point; add m ore Cellosolve slowly until a sm ooth m ixture is obtained. N ext add 125 cc. of 0.6 N potassium hydroxide in alcohol (5 gram s of potassium hydroxide) and shako thoroughly. S topper and allow to stand about 3 hours a t 130° F . to allow for precipitation. A t the end of this tim e remove from oven, cool to room tem perature, add 50 cc. of ethyl ether, and restopper; allow to stand a t least 1 hour. F ilte r through a tared dry filter paper (W hatm an No. 32, for example), washing w ith 50 cc. of alcohol-ether (1 to 1) mixture, using five 10-cc. portions. D ry in an oven a t 200° F. for 10 or 15 m inutes, remove from oven, and replace in filtering funnel. W ash w ith warm w ater (160° F.) until all the soluble potassium ph thalate is dissolved and th e pigm ent is washed free of the phthalate. M ake the final washing w ith ethyl alcohol to shorten the drying period. D ry in an oven a t 220° F. to constant weight.
Table I. Pigment Determinations in Different V eh icles
Pigm ent Vehicle M ethod
Pigm ent T heo re ti
cal, %
PigmentD etermined,
%C arbon black Congo varnish P h th a la te 6 .60 6 . GOW hite pigm ents Em ulsion P h th a la te 50 .0 46.3Iron oxide Alkyd P h th a la te 43 .7 43.7Iron blue R osin varnish N itrocellulose 51 .3 51.7C arbon black Linseed oil N itrocellulose 3 .2 0 3.20C arbon black Alkyd varnish Nitrocellulose 3 .0 3.4
Because of the great variety of enamel and pain t vehicles, m any different types of solubilities are encountered. Table I shows some applications of the two m ethods and the results obtained. Since the samples were all commercial grades and subject to slight variations, the results are reasonably close. The use of nitrocellulose lim its the veliicle solubility to esters and arom atic hydrocarbons. However, the num ber of cellulose derivatives is large enough to cover practically all vehicles. Ethyl cellulose, benzyl cellulose, cellulose acetate, cellulose acetate bu tyrate , and other agents m ay be used for vehicles in which nitrocellulose is no t satisfactory. T he choice of liquids is very extensive. For solvents there are esters, ketones, and ethers; for precipitating liquids there are arom atic and aliphatic hydrocarbons, terpenes, and alcohols. The choice is determ ined by the ability of the cellulose product to precipitate on the pigment . while the vehicle rem ains in solution.
The precipitation m ethod of pigm ent separation results in considerable time-saving in m ost cases. The m aterial filters very rapidly on a vacuum filter and does not clog the filter. Actually only about 0.5 to 0.75 hour is the to ta l tim e necessary for the complete operation, including weighing, filtering, and washing. There are m any variations in the procedure outlined in this article and the proper application of the general principles of the method should yield accurate results in most cases.
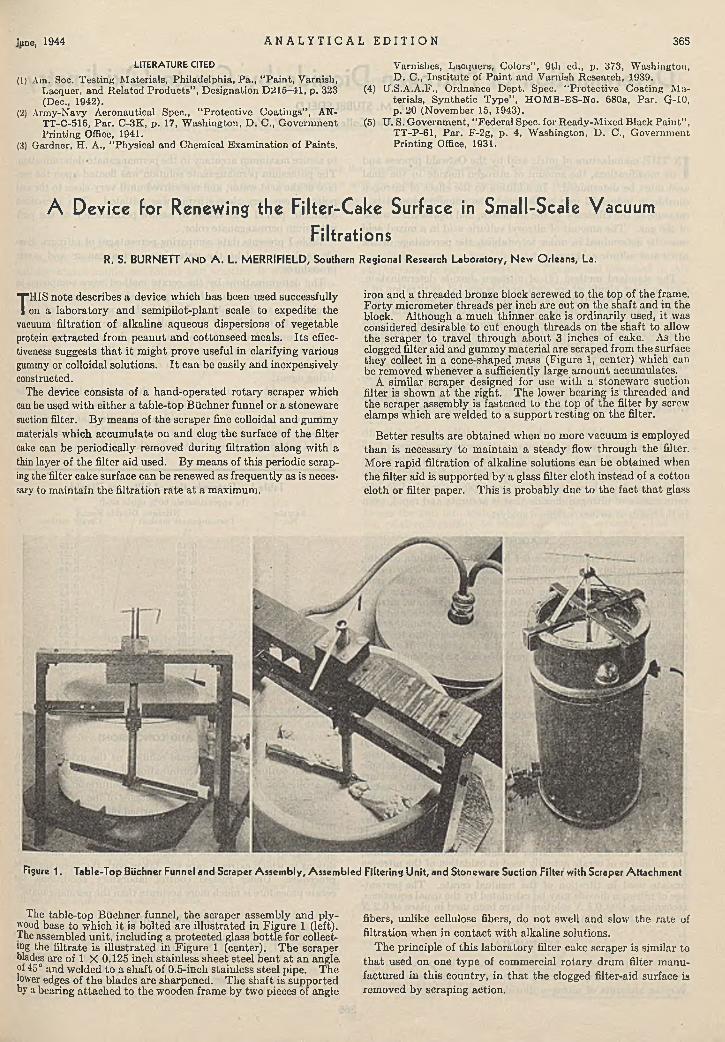
June, 1944 A N A L Y T I C A L E D I T I O N 365
L IT E R A T U R E C ITED
(1) Am. Soc. T esting M aterials, Philadelphia, Pa., "P ain t, Varnish,Lacquer, and R elated Products” , D esignation D215-41, p. 323 (Dec., 1942).
(2) Army-Navy A eronautical Spec., "P ro tective C oatings” , ATT-TT-C-516, P a r. C-3IC, p. 17, W ashington, D. C., G overnm ent Printing Office, 1941.
(3) Gardner, H. A., “ Physical and Chemical Exam ination of Paints,
Varnishes, Lacquers, Colors” , 9 th ed., p. 373, W ashington,D . C., In s titu te of P a in t and Varnish Research, 1939.
(4) U.S.A.A.F., Ordnance D ept. Spec. “ Protective Coating M aterials, Synthetic T ype” , HOM B-ES-No. 680a, Par. Q-10, p. 20 (Novem ber 15, 1943).
(5) U. S. G overnm ent, “ Federal Spec, for Ready-M ixed Black P a in t” ,TT-P-61, P a r. F-2g, p . 4, W ashington, D . C., Governm ent P rin ting Office, 1931.
A D evice for Renewing the Filter-Cake Surface in Sm all-Scale Vacuum Filtrations
R. S. B U R N E T T A N D A . L . M E R R IF IE L D , Southern Regional Research Laboratory, New Orleans, La.
THIS note describes a device which has been used successfully on a laboratory and sem ipilot-plant scale to expedite the
vacuum filtration of alkaline aqueous dispersions of vegetable protein extracted from peanu t and cottonseed meals. I t s effectiveness suggests th a t i t m ight prove useful in clarifying various gummy or colloidal solutions. I t can be easily and inexpensively constructed.
The device consists of a hand-operated ro tary scraper which can be used w ith either a table-top Büchner funnel or a stoneware suction filter. By means of the scraper fine colloidal and gummy materials which accum ulate on and clog the surface of th e filter cake can be periodically rem oved during filtration along w ith a thin layer of the filter aid used. B y means of th is periodic scraping the filter cake surface can be renewed as frequently as is necessary to m aintain th e filtration ra te a t a maximum.
iron and a threaded bronze block screwed to the top of the frame. F o rty m icrom eter threads per inch are cu t on the shaft and in the block. Although a m uch th inner cake is ordinarily used, it was considered desirable to cut enough threads on the shaft to allow the scraper to travel through about 3 inches of cake. As the clogged filter aid and gumm y m aterial are scraped from the surface they collect in a cone-shaped m ass (Figure 1, center) which can be removed whenever a sufficiently large am ount accumulates.
A sim ilar scraper designed for use w ith a stoneware suction filter is shown a t the right. T he lower bearing is threaded and the scraper assembly is fastened to the top of the filter by screw clamps which are welded to a support resting on th e filter.
B etter results are obtained when no more vacuum is employed than is necessary to m aintain a steady flow through the filter. More rapid filtration of alkaline solutions can be obtained when the filter aid is supported by a glass filter cloth instead of a cotton cloth or filter paper. T his is probably due to the fact th a t glass
The table-top Buchner funnel, the scraper assembly and plywood base to which i t is bolted are illustrated in Figure 1 (left). The assembled unit, including a protected glass bo ttle for collecting the filtrate is illustrated in F igure 1 (center). T he scraper blades are of 1 X 0.125 inch stainless sheet steel ben t a t an angle, of 45° and welded to a shaft of 0.5-inch stainless steel pipe. The lower edges of th e blades are sharpened. T he shaft is supported by a bearing attached to the wooden fram e by two pieces of angle
fibers, unlike cellulose fibers, do no t swell and slow the ra te of filtration when in con tac t w ith alkaline solutions.
T he principle of th is laboratory filter cake scraper is similar to th a t used on one ty p e of commercial ro tary drum filter m anufactured in th is country, in th a t the clogged filter-aid surface is rem oved by scraping action.
Figure 1. Table-Top Büchner Funnel and Scraper A ssem b ly, Assem bled Filtering Unit, and Stoneware Suction Filter with Scraper Attachment

1
Determination of Nitrogen Dioxide by Cerate Oxidim etryF. M . S T U B B L E F IE L D
Davis and Elkins C o llege , Elkins, W . V a .
IN T H E m anufacture of nitric acid by the Ostwald process and its modifications, the am ount of nitrogen dioxide in the final
acid m ust be determined. In addition to the effect of nitrogen dioxide in industrial uses of the acid, the am ount present is a m easure of the efficiency of the air bleach, and represents a waste of the gas. The am ount of nitrosyl sulfuric acid in a mixed acid m ust be determ ined in order to establish the percentage of the nitric and sulfuric acids present.
T he standard m ethod (8) of nitrogen dioxide determ ination, used in m ost p lants where such work is needed, is titra tion of a 10-ml, sample w ith 0.2 N potassium perm anganate un til a pink color persists for 3 minutes. The m ethod is accurate only w ith careful m anipulation of the sample. In actual control practice loss of nitrogen dioxide from the solution under even the best of conditions, speed of addition of potassium perm anganate, .am ount of stirring of the solution while titra ting , and ind ividual definition of w hat constitutes a perm anent pink color, :ns well as the error caused when a rushed analyst shortens th e 3- m inu te period to 2 m inutes or even I-—all contribute to inaccuracy . N itrosyl sulfuric acid is also determ ined by perm anganate titra tion , using either a 10-ml. sample or an aliquot thereof.
T he m any published works, and especially those of Smith (I, 3), amply prove the advantages of cerim etry in regard to stab ility and oxidizing power of the solution, reversibility of the reaction, and lack of side reactions and interferences. These advantages have been retained in developing a m ethod for determ ination of nitrogen dioxide th a t is accurate and rapid, even in the hands of an inexperienced analyst.
R E A G E N T S
T he solutions required are a 0.1 N solution of sodium oxalate, an approxim ately 0.1 N solution of am m onium n itra to cerate containing 170 ml. of 72% perchloric acid per liter and th e indicator, nitro-o-phenanthroline ferrous sulfate. T he cerate solution is prepared by adding 55 to 56 gram s of am m onium nitra to- rerate to the perchloric acid, stirring for half a minute, and adding 100 ml. of water. The solution is stirred for another half minute, a second 100-ml, portion of w ater is added, and the process is repeated until a volume of 1 lite r is reached. I f th e salt is no t dissolved in this way, an insoluble salt m ay precip ititate in a few days’ standing.
The cerate solution is checked periodically in term s of exactly 0.1 AT sodium oxalate.
P R O C E D U R E
To 100 ml. of w ater in a 250-ml. beaker, 5 ml. of 72% perchloric acid are added. To this acidified solution in m ost cases 25 to 50 ml. of 0.1 N cerate are added, the am ount varying 'with the quanti ty of nitrogen dioxide expected to be present. A 10-ml. sample of "the acid is p ipetted accurately into the beaker. A t the s ta r t of delivery, the p ipet tip should be near th e bottom of the beaker; near the end of delivery, the tip is raised un til i t barely touches th e surface of the solution. I t is let stand 1 o r 2 minutes, then stirred slowly. Two to 3 drops of nitroferroin-are added, and the excess cerate is ti tra ted w ith sodium oxalate. T he end point is sharp. Since the exact cerate equivalence in term s of a 0.1 N solution is known by the earlier oxalate titra tio n of the cerate, the milliliters of cerate actually used in oxidation of the nitrogen dioxide wall be the equivalence figure m inus the milliliters of 0.1 N oxalate used in titra tion of th e residual cerate. The percentage of nitrogen dioxide m ay be calculated by the usual equations, recognizing th a t 0.1 A solutions have been used in place of 0.2 N potassium perm anganate.
E X P E R IM E N T A L
T he m ethod was carefully checked against the potassium perm anganate procedure, using a series of acid samples containing varying am ounts of nitrogen dioxide. Extrem e care was taken
to assure maximum accuracy in the perm anganate determination. T he potassium perm anganate solution was floated upon the surface of the acid water, and not stirred until very close to the end point, w'hen very slow stirring was initiated. T he prescribed3-m inute period was taken to assure perm anency of the pink potassium perm anganate color. .
Table I presents da ta comparing percentages of nitrogen dioxide as determined by the potassium perm anganate and cerate procedures.
The determ inations by the cerate method were completed in much less tim e than those by the perm anganate procedure. The results compare favorably. In the higher percentages of nitrogen dioxide i t is believed th a t results by the cerate procedure are more accurate than by the perm anganate, because of sharper end point and absence of opportun ity for possible loss of nitrogen dioxide, since the gas is always in contact w ith an excess of oxidizing agent.
No a ttem p t was m ade to extend the m ethod directly to the nitrosyl sulfuric acid determ ination. Since the potassium perm anganate titra tion for this is identical w ith th a t for nitrogen dioxide, the w riter can see no reason why the cerate titration should no t be entirely satisfactory for this estim ation.
Table I. Determination of Nitrogen D io x id e(In approxim ately 60% n itric acid)
Sam ple N itrogen Dioxide Perm anganate m ethod
FoundNo. C erate m ethod
% %1 0 .15 0 .1 52 0 .2 8 0 .2 83 0 .36 0 .374 0.48 0 .485 0 .59 0 .606 0 .8 0 0.807 0 .8 8 0 .888 1.02 1.029 1.24 1.24
10 1 .46 1.4711 1.58 1.5912 1.69 1.7013 1.84 1.8514 2.09 2.1015 2 .26 2 .2710 2.63 2 .6417 2 .97 2 .9 818 3 .49 3.5119 4 .16 4 .1720 5.34 5.36
S U M M A R Y A N D C O N C L U S IO N S
A procedure utilizing a cerate solution as the oxidizing agent has been outlined for the determ ination of nitrogen dioxide, and its application to the estim ation of nitrosyl sulfuric acid suggested.The method has none of the disadvantages of the potassium perm anganate procedure and m ay be carried ou t rapidly. Experim ental work has proved i t to be fully as accurate as the perm anganate m ethod in lower concentrations of nitrogen dioxide and slightly more accurate a t higher concentration, under conditions in which extreme care was taken w ith the permanganate procedure. Under rushed control laboratory conditions, the f cerate procedure is m uch more accurate than the permanganate.
L IT E R A T U R E C IT E D
(1) Kolthoff, I . M ., and Furm an, N . H ., “Volum etric Analysis"’Vol. I I , pp. 491-5, New York, John W iley & Sons, 1929.
. (2) Scott, W . W., “ S tandard M ethods of Chemical Analysis” , 5th ed., p . 653, New York, D . Van N ostrand Co., 1939.
(3) Sm ith, G. F ., “ C erate Oxidim etry” , Columbus, Ohio, G. Frederick Sm ith Chemical Co., 1942.

Determining Hygroscopicity of FertilizersJ . y. Y E E
Bureau of Plant Industry, Soils and A gricu ltu ra l Engineering, U. S. Department of A griculture, Beltsville, M d.
A rapid method is described for determining the hygroscopicity of fertilizers by measuring
the relative humidity of the air in equilibrium with the mixtures. From curves showing these
values against the moisture contents, the storage quality of fertilizers can be determined.
THE hygroscopicity of a fertilizer, or its tendency to absorb moisture, determ ines to a large ex ten t w hether it will remain
drillable under humid conditions and w hether it will cake on storage. A rapid and accurato m ethod for measuring the hygroscopicity of a fertilizer would, therefore, be a means of predicting the behavior of th e fertilizer under practical conditions.
Figure 1. Relative Hum idity-Resistance Curve
A fertilizer m aterial will absorb m oisture from the surrounding atmosphere if the relative hum idity of th a t atm osphere is greater than th a t corresponding to the vapor pressure of a saturated solution of the fertilizer m aterial a t the same tem perature, and will lose m oisture a t relative hum idities below th a t value. The aqueous vapor pressure of a sa tu rated solution is thus a measure of the hygroscopicity of the solid in question. Adams and Merz CO have determ ined the hygroscopicity of a large num ber of pure fertilizer compounds and their m ixtures by measuring the relative humidity over their sa turated solutions by means of an isoteni- scope. This method, however, requires the evaporation of a large quantity of w ater from the liquid phase and is, therefore, not applicable to mixed fertilizers which generally contain only a small am ount of moisture. The w ithdrawal of much w ater would disturb the equilibria in such systems.
Ordinarily, when i t is desired to determ ine a t w hat relative humidity a fertilizer m ixture begins to take up m oisture, a num ber of tared samples are exposed to various known relative humidities in controlled-hum idity chambers. T he relative hu midity a t which the sample ju s t begins to gain weight is noted. This is the threshold value above which the fertilizer m ixture will absorb m oisture and below which it will not. This method,
however, will no t always give the exact values because it is impractical to prepare hum idity chambers to cover the entire hum idity range in narrow intervals. T he m ethod described in this paper, however, perm its accurate determ inations of the hygroscopicity of fertilizers in about 30 m inutes w ith no weighings and w ithout the hum idity chambers required for the usual method.
Over each fertilizer mixture, there m ust exist a partial aqueous vapor pressure corresponding to the vapor pressure of the complex solution contained in th a t particular fertilizer mixture. If, therefore, a fertilizer m ixture is kep t in a closed container until equilibrium is established a t a desired tem perature, and a method is found to determ ine the relative hum idity over the sample, a measure of the hygroscopicity of the sample will have been obtained.
For measuring the relative hum idity in a small enclosed space, the electric hygrom eter as developed by D unm ore (3) of the N ational B ureau of S tandards, was found to be m ost satisfactory. The electric hygrom eter un it consists of a moisture-sensitive film containing lithium chloride on a bifilar coil of palladium wire wound on a thin-walled polystyrene tube. T he resistance between the two term inals of the electric hygrom eter varies w ith the relative hum idity to which the u n it is exposed. The hu- midity-resistance calibration curve for one such un it is shown in Figure 1. I t requires five units w ith m oisture-sensitive films containing various am ounts of lithium chloride to cover the whole hum idity range.
A P P A R A T U S
T he arrangem ent of the apparatus used for this determ ination is very simple, as shown in Figure 2.A is a 16-ounce bo ttle about ‘/ j full of a fertilizer mixture, B.C is a n e l e c t r i c hygrom eter unit. D and D ' are terminals of the un it coming through the two holes in the rubber stopper.These term inals are soldered to copper tips F and F ' on top of the glass rods, G a n d (? ', c o m in g through the same openings in the rub- A' 1-*1 ber stopper to hold the un it in place.
F i g u r e 2 . E le c t r ic H y g r o m e t e r U n i t
A ssem bly
.’.••• -i11 k.c , .V : •• •• \v .\v•••!•, • ;/ ,
.*•:, " V
367
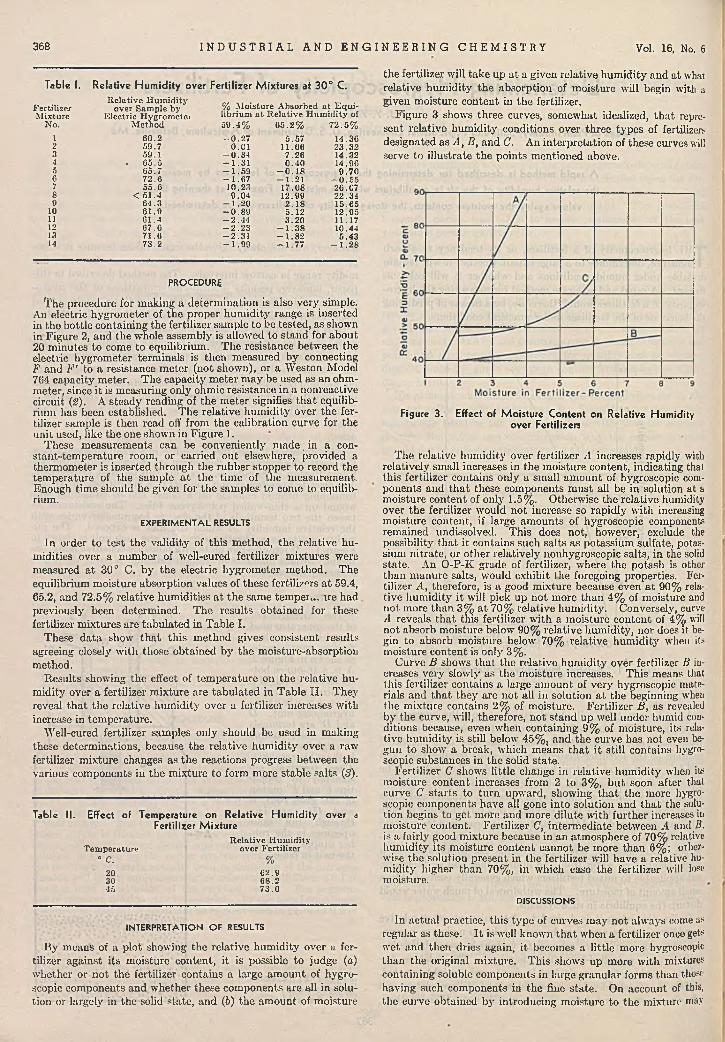
368 I N D U S T R I A L A N D E N G I N E E R I N G C H E M I S T R Y Vol. 16. No. 6
Table I. Relative H um idity over Fertilizer M ixtures at 3 0 ° C .
FertilizerR elative H u m id ity
over Sam ple by % M oistu re A bsorbed a t E q u iM ixture E lec tric H ygrom eter librium a t R elative H u m id ity of
No. M ethod 5 9 .4 % 6 5 .2 % 7 2 .5 %1 60 .2 - 0 . 2 7 5.57 14.362 59.7 0 .01 11.66 23 .323 59.1 - 0 . 3 4 7 .2 6 14.324 . 6 5 .5 - 1 . 3 1 0 .4 0 14.965 65 .7 - 1 . 5 9 - 0 . 1S 9 .7 06 7 2 .6 - 1 . 6 7 - 1.21 - 0 . 5 57 5 5 .6 10.23 17.08 26 .078 < 51.4 9 .0 4 12.99 22 .349 64 .3 - 1 .20 2 .1 8 15.65
10 61 .9 - 0 . 8 9 5 .12 12.9511 61.4 - 2 . 4 4 3 .2 0 11.1712 6 7 .6 - 2 . 2 3 - 1 . 3 8 10.4413 71 .6 - 2 . 3 1 - 1 . 8 2 5 .4314 73 .2 - 1 . 9 9 - 1 . 7 7 - 1 . 2 8
P R O C E D U R E
The procedure for making a determ ination is also very simple. An electric hygrom eter of the proper hum idity range is inserted in the bottle containing the fertilizer sample to be tested, as shown in Figure 2, and the whole assembly is allowed to stand for about 20 m inutes to come to equilibrium. The resistance between the electric hygrom eter term inals is then m easured by connecting F and F ' to a resistance m eter (not shown), or a W eston Model 764 capacity meter. T he capacity m eter m ay be used as an ohm- m eter, since it is measuring only ohmic resistance in a nonreactive circuit (3). A steady reading of the m eter signifies th a t equilibrium has been established. The relative hum idity over the fertilizer sample is then read off from the calibration curve for the unit used, like the one shown in Figure 1.
These m easurem ents can be conveniently m a d e . in a con- stant-tem perature room, or carried ou t elsewhere, provided a therm om eter is inserted through the rubber stopper to record the tem perature of the sample a t the tim e of the m easurem ent. Enough tim e should be given for the samples to come to equilibrium.
E X P E R IM E N T A L R E S U L T S
In order to tes t the valid ity of this method, the relative humidities over a num ber of well-cured fertilizer m ixtures were measured a t 30° C. by the electric hygrom eter m ethod. The equilibrium m oisture absorption values of these fertilizers a t 59.4, 65.2, and 72.5% relative hum idities a t the same tem per,., ire had previously been determined. T he results obtained for these fertilizer m ixtures are tabu lated in Table I.
These da ta show th a t th is m ethod gives consistent results agreeing closely w ith those obtained by the m oisture-absorption method.
R esults showing the effect of tem perature on the relative hum idity over a fertilizer m ixture are tabu lated in T able II . They reveal th a t the relative hum idity over a fertilizer increases with increase in tem perature.
Well-cured fertilizer samples only should be used in making these determ inations, because the relative hum idity over a raw fertilizer m ixture changes as the reactions progress between the various components in th e m ixture to form more stable salts (3).
Tabic II. Effect of Temperature on Relative H um idity over aFertiliser M ixture
R elative H um id ityT em pera tu re over F ertilizer
0 C. %20 6 2 .930 6 8 .245 7 3 .0
IN T E R P R E T A T IO N O F R E S U L T S
By means of a plot showing th e relative hum idity over a fertilizer against its m oisture content, it is possible to judge (a) whether or no t the fertilizer contains a large am ount of hygroscopic components and w hether these components are all in solution or largely in the solid sta te , and (6) th e am ount of moisture
the fertilizer will take up a t a given relative hum idity and a t what relative hum idity th e absorption of m oisture will begin with a given m oisture content in the fertilizer.
Figure 3 shows three curves, som ewhat idealized, th a t represent relative hum idity conditions over th ree types of fertilizers designated as A , B , and C. An in terpretation of these curves will serve to illustrate the points mentioned above.
Figure 3. Effect of Moisture Content on Relative Hum idity over Fertilizers
The relative hum idity over fertilizer A increases rapidly with relatively small increases in the m oisture content, indicating that this fertilizer contains only a small am ount of hygroscopic components and th a t these components m ust all be in solution at a m oisture content of only 1.5%. Otherwise the relative humidity over the fertilizer would no t increase so rapidly w ith increasing m oisture content, if large am ounts of hygroscopic components remained undissolved. This does not, however, exclude the possibility th a t it contains such salts as potassium sulfate, potassium nitrate, or other relatively nonhygroscopic salts, in the solid state. An O-P-K grade of fertilizer, where the potash is other than m anure salts, would exhibit the foregoing properties. Fertilizer A, therefore, is a good m ixture because even a t 90% relative hum idity i t will pick up no t more th an 4% of m oisture and not more than 3% a t 70% relative hum idity. Conversely, curve A reveals th a t this fertilizer w ith a m oisture content of 4% will not. absorb moisture below 90% relative hum idity, nor does it begin to absorb m oisture below 70% relative hum idity when it-- moisture content is only 3%.
Curve B shows that, the relative hum idity over fertilizer B increases very slowly as the m oisture increases. This means that this fertilizer contains a large amount, of very hygroscopic materials and th a t they arc not all in solution a t the beginning when the m ixture contains 2% of moisture. Fertilizer B, as revealed by the curve, will, therefore, no t stand up well under humid conditions because, even when containing 9% of m oisture, its relative hum idity is still below 45% , and the curve has not even begun to show a break, which means th a t i t still contains hygroscopic substances in the solid state.
Fertilizer C shows little change in relative hum idity when its moisture content increases from 2 to 3% , b u t soon after that curve C s ta rts to tu rn upward, showing th a t the more hygroscopic components have all gone into solution and th a t the solution begins to get more and more dilute w ith further increases iu m oisture content. Fertilizer C, interm ediate between A and B, is a fairly good m ixture because in an atm osphere of 70% relative hum idity its m oisture content cannot be more than 6% ; otherwise the solution present in the fertilizer will have a relative hum idity higher than 70% , in which case the fertilizer will lose moisture.
D IS C U S S IO N S
In actual practice, th is type of curves m ay no t always come as regular as these. I t is well known th a t when a fertilizer once gets wet and then dries again, it becomes a little more hygroscopic than th e original m ixture. This shows up more w ith mixtures containing soluble components in large granular forms than those having such components in the fine sta te . On account of this, the curve obtained by introducing m oisture to the mixture may
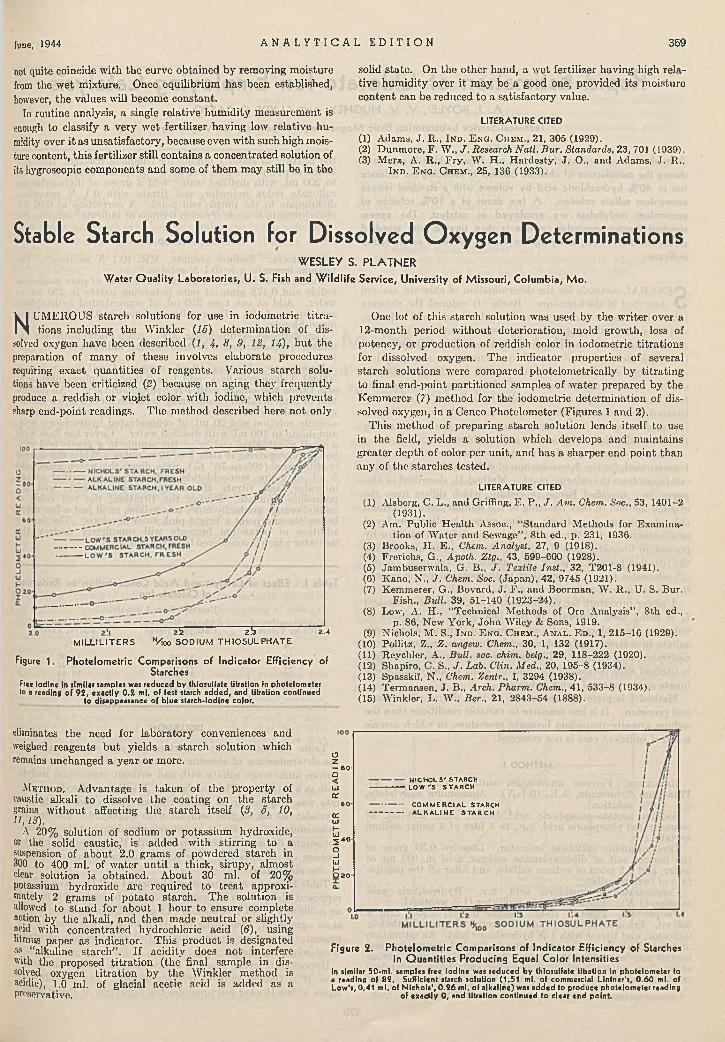
June, 1944 A N A L Y T I C A L E D I T I O N 369
not quite coincide w ith the curve obtained by removing moisture from the wet mixture. Once equilibrium has been established, however, the values will become constant.
Iu routine analysis, a single relative hum idity m easurem ent is enough to classify a very w et fertilizer having low relative humidity over i t as unsatisfactory, because even w ith such high moisture content, th is fertilizer still contains a concentrated solution of its hygroscopic components and some of them m ay still be in the
solid sta te . On the other hand, a wet fertilizer having high relative hum idity over it m ay be a good one, provided its m oisture content can be reduced to a satisfactory value.
L IT E R A T U R E C ITED
(1) A d a m s , J . R ., I n d . E n o . C h e m ., 21, 305 (1929).(2) Dunm ore, F . W., / . Research N atl. B ur. Standards, 23, 701 (1939).(3) M e rz , A. R ., Fry , W . H ., H ardesty , J . O ., and Adams, J . R .,
I n d . E n g . C h e m ., 25 , 130 (1 933).
Stable Starch Solution for Dissolved O xygen DeterminationsW E S L E Y S. P L A I N E R
Water Q u ality Laboratories, U. S. Fish and W ild life Service, University of M issouri, Colum bia, M o.
One lot of this starch solution was used by the w riter over a 12-m onth period w ithout deterioration, mold growth, loss of potency, or production of reddish color in iodom etric titra tions for dissolved oxygen. The indicator properties of several starch solutions were compared photelometrically by titra ting to final end-point partitioned samples of w ater prepared by the K em m erer (7) m ethod for the iodometric determ ination of dissolved oxygen, in a Cenco Photelom eter (Figures 1 and 2).
T his method of preparing starch solution lends itself to use in the field, yields a solution which develops and m aintains greater depth of color per unit, and has a sharper end point than any of the starches tested.
L IT E R A T U R E C ITED
(1) Alsberg, C. L., and Griffing, E . P., J . A m . Chem. Soc., 53, 1401-2(1931).
(2) Am. Public H ealth Assoc., “S tandard M ethods for Exam ination of W ater and Sewage” , 8 th ed., p. 231, 1936.
(3) Brooks, I I . E., Chem. Analyst, 27, 9 (1918).(4) Frerichs, G., Apoth. Ztg., 43, 599-600 (1928).(5) Jam busenvala, G. B., ./. Textile Inst., 32, T201-8 (1941).(6) K ano, N ., J . Chem. Soc. (Japan), 42, 9745 (1921).(7) Kem merer, G., Bovard, J . F ., and Boorm an, W . R ., U. S. Bur.
Fish., Bull. 39, 51-140 (1923-24).(8) Low, A. H ., "Technical M ethods of Ore Analysis” , 8th ed.,
p. 86, New York, John Wiley & Sons, 1919.(9) Nichols, M . S., I nd . E no. C h e m ., A n a l . E d ., 1, 215-16 (1929).
(10) Pollitz, Z„ Z . angew. Chem., 30, 1, 132 (1917).(11) Reychlcr, A., Bull. soc. chim. belg., 29, 118-222 (1920).(12) Shapiro, C. S., J . Lab. Clin. Med., 20, 195-8 (1934).(13) Spasskii, N ., Chem. Zentr., I, 3294 (1938).(14) Term ansen, J . B., Arch. Pharm. Chem., 41, 533-8 (1934).(15) W inkler, L. W., Ber., 21, 2843-54 (1888).
15 15 i aM IL L IL IT E R S N/loo SODIUM T H IO S U LP H A T E
Figure 1. Photelometric Comparisons of Indicator Efficiency of Starches
free iodine In similar samples was reduced by thiosulfate titration in photelometer to a reading of 9 2 , exactly 0 .2 ml. of test starch added, and titration continued
to disappearance of blue starch-iodine color.
NUMEROUS starch solutions for use in iodom etric titra tions including th e W inkler (IS) determ ination of dis
solved oxygen have been described (1, 4, 8, 9, 12, 14), b u t the preparation of m any of these involves elaborate procedures requiring exact quantities of reagents. Various starch solutions have been criticized (2) because on aging they frequently produce a reddish or vio.lct color w ith iodine, which prevents sharp end-point readings. The method described here no t only
eliminates the need for laboratory conveniences and weighed reagents b u t yields a starch solution which remains unchanged a year or more.
Me t h o d . Advantage is taken of the property of caustic alkali to dissolve the coating on the starch grains w ithout affecting the starch itself (3, 5, 10, II, 13).
A 20% solution of sodium or potassium hydroxide, or the solid caustic, is added w ith stirring to a suspension of about 2.0 grams of powdered starch in 300 to 400 ml. of w ater until a thick, sirupy, almost clear solution is obtained. A bout 30 ml. of 20% potassium hydroxide are required to trea t approximately 2 grams of potato starch. T he solution is allowed to stand for about 1 hour to ensure complete action by the alkali, and then made neutral or slightly acid with concentrated hydrochloric acid (6), using litmus paper as indicator. T his product is designated as “alkaline starch” . If acidity does n o t interfere with the proposed titra tion (the final sample in dissolved oxygen titra tion by the W inkler m ethod is acidic), 1.0 ml. of glacial acetic acid is added as a preservative.
02- SO-Cl<UJa.
60a.wf-u2 40o-JuH020
■ N IC H O L S " S T A R C H ■ L O W 'S S T A R C H
C O M M E R C IA L S T A R C H A L K A L I N E S T A R C H
Figure 2. Photelometric Comparisons of Indicator Efficiency of Starches in Quantities Producing Equal Color Intensities
In similar 50-ml. samples free iodine was reduced by thiosulfate titration in photelometer to a reading of 82. Sufficient starch solution (1.51 ml. of commercial Lintner's, 0 .6 0 ml. of Low 's, 0.41 ml. of N icho ls', 0 .2 6 ml. of alkaline) was added to produce photelometer reading
of exactly 0 , and titration continued to clear end p o in t

Rapid Estimation oí Chlorate Ion Employing CatalysisA . J. B O Y L E 1, V . V . H U G H E Y , a n d C L Y D E C . C A S T O
Technical Service Laboratories, Basic M agnesium, Incorporated, Las V egas, N ev.
A method for estimating chlorate in cell liquor which is produced during the manufacture of chlorine consists of reducing the chlorate ion in 4 0 % hydrochloric acid by volume with a standard ferrous ammonium sulfate solution. A few drops of a 1 0 % solution of ammonium molybdate are em ployed as catalyst. The excess standard ferrous ammonium sulfate is then titrated with standard potassium dichromate, using diphenylam ine sulfonate as the redox indicator.
SEVERA L methods for the determ ination of chlorate ion are described in the literature. Bacho (1) reduced the chlorate
ion w ith excess sodium arsenite in hydrochloric acid solution, and then used the potassium brom ate m ethod of Györy (4) in determ ining the excess arsenite. Peters and D eutschländer(6) employed an arsenite-bromide m ixture in a strong hydrochloric acid solution. Osmium tetroxide was suggested as a cata lyst by Gleu (S). Böige and Troberg (2) reduced the chlorate ion w ith excess cuprous chloride a t 80° C. and finally titra ted the excess w ith standard potassium dichromate. H arvey (5) used a ferrous sulfate-potassium iodide system, titra ting the liberated iodine with standard sodium thiosulfate.
Essentially two methods are employed a t Basic Magnesium, Incorporated, for the determ ination of sodium chlorate in Hooker cell liquor from the chlorine plant. M ethod II , described in this paper, is a modified Bacho procedure, which differs from the original method in th a t rcfluxing of the sodium arsenite-sodium chlorate m ixture is om itted; iodine monochloride is employed as a cata lyst in the titra tion of the excess sodium arsenite by potassium brom ate, thus sharpening the end point and making the titra tion possible a t lower th an boiling tem peratures. Sm ith(7) advocates use of th is catalyst in the potentiom etric estim ation of arsenite by potassium brom ate.
A newer procedure for the estim ation of chlorate ion, Method ■ I, is being used currently in this laboratory. I t consists of reducing the chlorate w ith an excess of ferrous ammonium sulfate in a strong hydrochloric acid solution, using ammonium m olybdate as a catalyst. T he excess ferrous amm onium sulfate is titra ted w ith potassium dichromate, using diphenylamine sulfonate as the internal redox indicator.
M ethod I is preferred because of its high degree of accuracy and precision. I t is less sensitive to variable conditions than the sodium arsenite-potassium brom ate procedure, in which arsenic is lost if sufficient care is not exercised.
M E T H O D I
R e a g e n t s . Ferrous amm onium sulfate, c.p. (0.25 N ). Potassium dichromate, A.R. (0.1 N ). Ammonium m olybdate, c .p . (10% solution).
Sodium acetate-phosphoric acid buffer. Add 250 ml. of concentrated phosphoric acid, c.p., to 1 liter of 4 molar sodium acetate, c .p .
Diphenylam ine sulfonate indicator. Dissolve 0.30 gram of the barium sa lt of diphenylamine sulfonic acid in 100 ml. of water, add 0.5 gram of sodium sulfate, and filter off the precipita te of barium sulfate.
C oncentrated hydrochloric acid, c.p. Hydrochloric acid solution (1 A0- Phenolphthalein indicator (1% solution).
P r o p e d u r e . P ipet a 10-ml. sample of cell liquor into a 500-ml. Erlenm eyer flask, add 2 drops of phenolphthalein indicator, and titra te w ith 1 N hydrochloric acid. An estim ation of to ta l alkalinity sufficiently accurate for cell liquor chemical control m ay be made a t this point. Add 10 ml. of 0.25 N ferrous ammonium sulfate solution, 3 drops of amm onium m olybdate catalyst, and 40 ml. of concentrated hydrochloric acid. Allow
1 P resen t address, W ayne U niversity , College of M edicine, D etro it, M ich.
the m ixture to stand 1 m inute for complete reaction, then add 20 ml. of phosphoric acid-sodium acetate buffer reagent. Dilute to 200 ml. w ith distilled water, add 3 drops of diphenylamine sulfonate redox indicator, and titra te w ith 0.1 N potassium dichrom ate to the purple end point. A correction of 0.05 ml. of dichrom ate is made for each 6 drops of indicator solution (8).
M E T H O D II
Po-R e a g e n t s . Sodium arsenite, A.R. (0.1 N solution), tassium brom ate, c.p. (0.1 N solution).
Iodine monochloride. Dissolve 0.279 gram of pure potassium iodide and 0.178 gram of pure potassium iodate in 250 ml. of w ater. Add a t one tim e 250 ml. of concentrated hydrochloric acid (sp. gr. 1-.19). The resulting solution is 0.005 M in iodine monochloride.
Concentrated hydrochloric acid, c.p. Phenolphthalein indicator (1% solution). M ethyl orange indicator (0.1% solution). —
P r o c e d u r e . P ipet a 10-ml. sample of cell liquor into a 500-ml. Erlenm eyer flask, add 1 or 2 drops of phenolphthalein, and titra te the sample w ith 1 N hydrochloric acid. An estimation of to ta l alkalinity sufficiently accurate for cell liquor chemical control m ay be made a t this point. Add 30 ml. of standard arsenite solution and 20 ml. of concentrated hydrochloric acid, and dilute to 100 ml. w ith distilled w ater. Cover the flask with a small w atch glass and bring the sample to a gentle boil on a ho t plate, removing i t a fter 8 to 10 m inutes. While the sample is still warm (40° to 70° C.), rinse down the w atch glass, add 5 ml. of iodine monochloride and 5 drops of m ethyl orange indicator, and titra te the excess sodium arsenite with 0.1 potassium brom ate. D uring the titra tion , the red color of m ethyl orange gradually fades to a yellow, until ju s t a few drops before the end point a bright pink color develops. The further addition of potassium brom ate will completely destroy the indicator w'hich is considered to be the end point.
Table I. Effect of Catalyst and A c id Concentration on Reduction of Chlorate Ion
C oncen tra tion of HC1 b y Volum e
%18313640SO
(R eaction tim e, 1 m inute)C h lo ra te R educed, C hiorato Reduced,C a ta ly e t P resen t
34 .9991 .229 8 .4 099 .7099 .70
C ata ly s t A bsent
%32 .90 82 .4 5 94 .6198 .8098 .80
D IS C U S S IO N
T able I illustrates the im portance of acid concentration in the determ ination of chlorate ion, using an excess of standard ferrous ammonium sulfate w ith and w ithout ammonium molybdate as a catalyst. The standard 0.1 IV solution of sodium chlora te was prepared from Merck reagent quality sodium chlorate crystals; 10 ml. of this solution were employed. The ferrous amm onium sulfate solution was standardized against the standard potassium dichrom ate solution in both the presence and the absence of the catalyst. T he results indicated no interference by the m olybdate.
Table I I gives a comparison of M ethods I and II . The values, represent the sodium chlorate content of the samples expressed as milliliters of 0.1 N solution. In general, the methods are in close agreem ent, accounting for about 99% of the chlorate ion present. In routine analyses for control purposes this accuracy is entirely adequate.
H ypochlorite in cell liquor is no t considered in this discussion since i t is present only in m icroquantities. The hot alkaline liquor of the Hooker cell prom otes the form ation of chlorate ion.
370
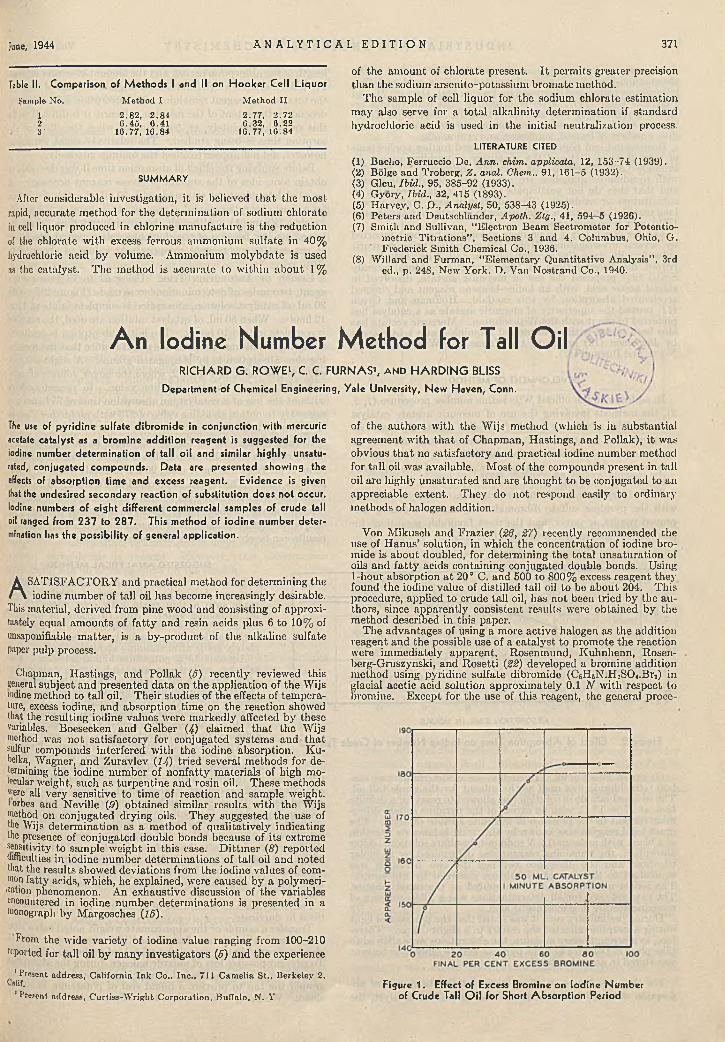
June, 1944 A N A L Y T I C A L E D I T I O N 371
Table II. Comparison of M ethods I and II on H oo ker Ce ll L iquor
Sample No. M ethod I M ethod II
1.23 '
2 .8 2 , 2 .84 0 .4 5 , 0 .41
16.77, 16 .84
2 .77 , 2 .7 2 6 .32 , 6 .22
16.77, 16.84
S U M M A R Y
After considerable investigation, i t is believed th a t the most rapid, accurate’ m ethod for the determ ination of sodium chlorate in cell liquor produced in chlorine m anufacture is the reduction of the chlorate w ith excess ferrous ammonium sulfate in 40% hydrochloric acid by volume. Ammonium m olybdate is used as the catalyst. The method is accurate to w ithin about 1 %
of the am ount of chlorate present. I t perm its greater precision than the sodium arsenite-potassium brom ate method.
T he sample of cell liquor for the sodium chlorate estim ation m ay also serve for a to ta l alkalinity determ ination if standard hydrochloric acid is used in the initial neutralization process.
L IT E R A T U R E C ITED
(1) Bacho, Ferruccio De, A nn . chim. applicata, 12, 153-74 (1939).(2) Bolge and Troberg, Z . anal. Chem., 91 , 161-5 (1932).(3) Gleu, Ibid., 95, 385-92 (1933).(4) Gyory, Ibid.. 32, 415 (1893).(5) H arvey, C. P ., Analysl, 50, 538-43 (1925).(6) Peters and Deutschlander, Apolh. Ztg., 41, 594-5 (1926).(7) Sm ith and Sullivan, “Electron Beam Sectrom etor for Potentio-
m etric T itra tio n s” , Sections 3 and 4, Columbus, Ohio, G. Frederick Sm ith Chemical Co., 1936.
(8) W illard and Furm an, “ E lem entary Q uantitative Analysis", 3rded„ p. 248, New York, D. Van N ostrand Co., 1940.
A n Iodine Number Method for Tall O ilR IC H A R D G . R O W E 1, C. C. F U R N A S 2, a n d H A R D I N G B LISS
Department of Chemical Engineering, Yale University, New Haven, Conn.
The use of pyridine sulfate dibromide in conjunction with mercuric acetate catalyst as a bromine addition reagent is suggested for the Iodine number determination of tall oil and similar highly unsatu- rated, conjugated compounds. Data are presented showing the effects of absorption time and excess reagent. Evidence is given that the undesired secondary reaction of substitution does not occur. Iodine numbers of eight different commercial samples of crude tall oil ranged from 237 to 287. This method of iodine number determination has the possibility of general application.
A SATISFACTORY and practical method for determining the iodine num ber of tall oil has become increasingly desirable.
This material, derived from pine wood and consisting of approximately equal am ounts of fa tty and resin acids plus 6 to 10% of tmsaponifiable m atter, is a by-product of the alkaline sulfate paper pulp process.
Chapman, H astings, and Poliak (5) recently reviewed this general subject and presented data on the application of the Wijs iodine method to tall oil. T heir studies of the effects of tem perature, excess iodine, and absorption time on the reaction showed that the resulting iodine values were m arkedly affected by these variables. Boesecken and Gelber (4) claimed th a t the Wijs method was no t satisfactory for conjugated system s and th a t sulfur compounds interfered w ith the iodine absorption. Ku- helka, Wagtier, and Zuravlev (14 ) tried several m ethods for determining the iodine num ber of nonfa tty m aterials of high molecular weight, such as turpentine and rosin oil. These methods were all very sensitive to tim e of reaction and sample weight, lorbes and Neville (9) obtained sim ilar results w ith the Wijs method on conjugated drying oils. They suggested the use of the Wijs determ ination as a method of qualitatively indicating the presence of conjugated double bonds because of its extreme sensitivity to sample weight in this case. D ittm er (8) reported difficulties in iodine num ber determ inations of tall oil and noted that the results showed deviations from the iodine values of common fatty acids, which, he explained, were caused by a polymerisation phenomenon. An exhaustive discussion of the variables encountered in iodine num ber determ inations is presented in a monograph by Margosches (15).
From the wide variety of iodine value ranging from 100-210 reported for tall oil by m any investigators (5) and th e experience
'P resen t address, C alifornia In k Co., Inc ., 711 C am elia S t., B erkeley 2, Calif.
' Present address, C urtiss-W righ t C orpora tion , Buffalo, N . V
of the authors w ith the Wijs method (which is in substantial agreem ent w ith th a t of Chapm an, H astings, and Poliak), i t was obvious th a t no satisfactory and practical iodine num ber method for ta ll oil was available. M ost of th e compounds present in tall oil are highly unsaturated and are thought to be conjugated to an appreciable extent. They do not respond easily to ordinary m ethods of halogen addition.
Von M ikusch and Frazier (26, 27) recently recommended the use of H anus’ solution, in which the concentration of iodine bromide is about doubled, for determ ining the to ta l unsaturation of oils and fa tty acids containing conjugated double bonds. Using1-hour absorption a t 20° C. and 500 to 800% excess reagent they found the iodine value of distilled tall oil to be about 204. This procedure, applied to crude tall oil, has not been tried by the au thors, since apparently consistent results were obtained by the method described in this paper.
T he advantages of using a more active halogen as the addition reagent and the possible use of a cata lyst to prom ote the reaction were im mediately apparent. Rosenmund, K uhnhenn, Rosen- berg-Gruszynski, and R osetti (22) developed a bromine addition method using pyridine sulfate dibromide (CDH5N .I i2SO4.Br2) in glacial acetic acid solution approxim ately 0.1 i f w ith respect to bromine. E xcept for the use of this reagent., the general proce-
Figure 1. Effect of Excess Bromine on Iodine Number of Crude Tall O i l for Short A bsorption Period
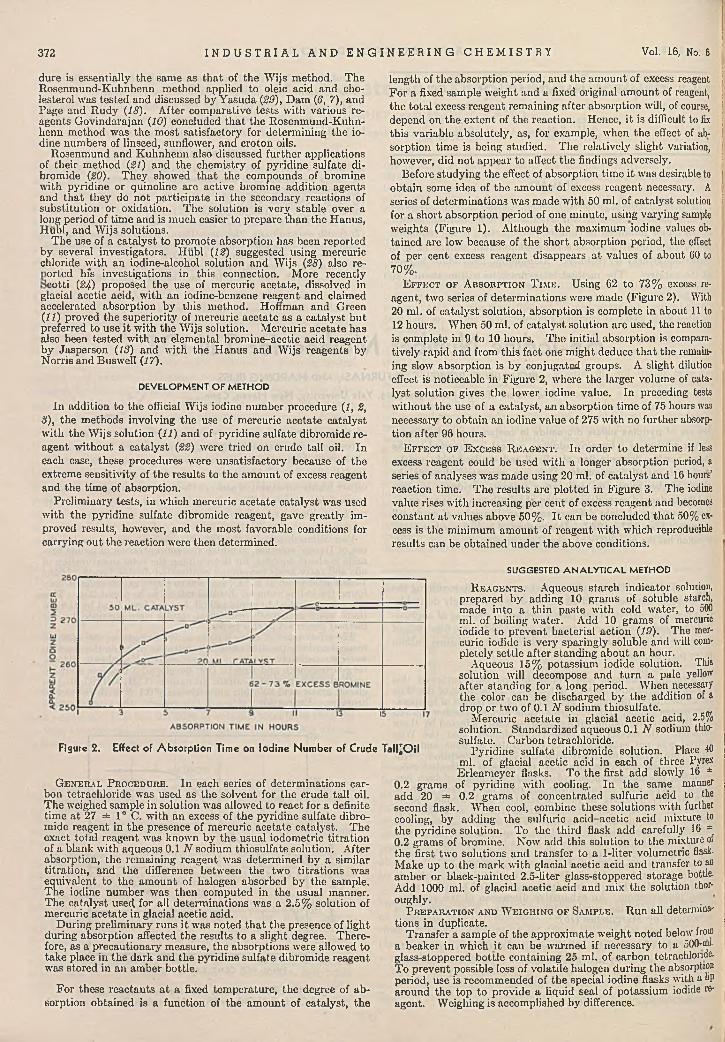
dure is essentially th e same as th a t of the W ijs m ethod. T he Rosenm und-Kuhnhenn m ethod applied to oleic acid and cholesterol was tested and discussed by Y asuda {29), D am (6, 7), and Page and R udy {IS). After com parative tests w ith various reagents G ovindarajan {10) concluded th a t the R osenm und-K uhnhenn method was the m ost satisfactory for determ ining the iodine num bers of linseed, sunflower, and croton oils.
Rosenmund and K uhnhenn also discussed further applications of their m ethod {21) and the chem istry of pyridine sulfate dibromide {20). T hey showed th a t the compounds of bromine w ith pyridine or quinoline are active bromine addition agents and th a t they do no t participate in the secondary reactions of substitu tion or oxidation. The solution is very stable over a long period of tim e and is m uch easier to prepare th an the Hanus, H ubl, and Wijs solutions.
T he use of a cata lyst to prom ote absorption has been reported by several investigators. H ubl {12) suggested using mercuric chloride w ith an iodine-alcohol solution and W ijs {28) also re-
orted hfs investigations in this connection. M ore recently cotti {24) proposed the use of mercuric acetate, dissolved in
glacial acetic acid, w ith an iodine-benzene reagent and claimed accelerated absorption by this method. Hoffman and Green {11) proved the superiority of mercuric acetate as a catalyst b u t preferred to use it w ith th e W ijs solution. M ercuric ace tate has also been tested w ith an elem ental brom ine-acetic acid reagent by Jasperson {IS) and w ith the H anus and Wijs reagents by Norris and Buswell (27).
D E V E L O P M E N T O F M E T H O D
In addition to th e official W ijs iodine num ber procedure (2, 2, S), the methods involving th e use of mercuric acetate catalyst w ith the W ijs solution (22) and of pyridine sulfate dibromide reagent w ithout a cata lyst {22) were tried on crude ta ll oil. In each case, these procedures were unsatisfactory because of the extreme sensitivity of th e results to the am ount of excess reagent and the time of absorption.
Prelim inary tests, in which mercuric acetate catalyst was used w ith th e pyridine sulfate dibromide reagent, gave greatly improved results, however, and the m ost favorable conditions for carrying ou t the reaction were then determined.
372
G e n e r a l P r o c e d u r e . In each series of determ inations carbon tetrachloride was used as the solvent for the crude tall oil. T he weighed sample in solution was allowed to react for a definite tim e a t 27 =*= 1° C. w ith an excess of the pyridine sulfate dibromide reagent in th e presence of mercuric acetate catalyst. T he exact to ta l reagent was known by the usual iodometric titra tion of a blank w ith aqueous 0.1 N sodium thiosulfate solution. A fter absorption, the rem aining reagent was determ ined by a similar titra tion , and the difference between the two titra tions was equivalent to the am ount of halogen absorbed by the sample. T he iodine num ber was then com puted in the usual manner. The catalyst used for all determ inations was a 2.5% solution of mercuric acetate in glacial acetic acid.
D uring prelim inary runs i t was noted th a t the presence of light during absorption affected the results to a slight degree. Therefore, as a precautionary measure, the absorptions were allowed to take place in th e dark and the pyridine sulfate dibromide reagent was stored in an am ber bottle.
For these reactan ts a t a fixed tem perature, the degree of absorption obtained is a function of the am ount of catalyst, the
length of the absorption period, and the am ount of excess reagent F or a fixed sample weight and a fixed original am ount of reagent, th e to ta l excess reagent rem aining after absorption will, of course, depend on the extent of the reaction. Hence, it is difficult to fix this variable absolutely, as, for example, when the effect of absorption tim e is being studied. The relatively slight variation, however, did no t appear to affect the findings adversely.
Before studying the effect of absorption tim e it was desirable to j obtain some idea of the am ount of excess reagent necessary. A series of determ inations was m ade w ith 50 ml. of cata lyst solution for a short absorption period of one m inute, using varying sample weights (Figure 1). A lthough the m aximum iodine values obtained are low because of the short absorption period, the effect of per cent excess reagent disappears a t values of about 60 to 70%.
E f f e c t o f A b so rp tio n T im e. Using 62 to 73% excess reagent, two series of determ inations were made (Figure 2). With 20 ml. of cata lyst solution, absorption is complete in about 11 to i
12 hours. W hen 50 ml. of cata lyst solution are used, the reaction is complete in 9 to 10 hours. T he initial absorption is comparatively rapid and from th is fact one might deduce th a t the remaining slow absorption is by conjugated groups. A slight dilution j effect is noticeable in Figure 2, where the larger volume of catalyst solution gives the lower iodine value. In preceding tests w ithout the use of a catalyst, an absorption tim e of 75 hours was necessary to obtain an iodine value of 275 w ith no further absorption after 96 hours.
E f f e c t o f E x c e s s R e a g e n t . In order to determine if less excess reagent could be used w ith a longer absorption period, a series of analyses was made using 20 ml. of cata lyst and 16 hours' reaction time. T he results are plotted in Figure 3. The iodine value rises w ith increasing per cent of excess reagent and becomes constant a t values above 50%. I t can be concluded th a t 50% excess is the m inim um am ount of reagent w ith which reproducible results can be obtained under the above conditions.
S U G G E S T E D A N A L Y T I C A L M E T H O D
R e a g e n t s . Aqueous starch indicator solution, prepared by adding 10 gram s of soluble starch, made into a th in paste w ith cold w’ater, to 500 ml. of boiling w ater. Add 10 gram s of mercuric iodide to prevent bacterial action {19). The mercuric iodide is very sparingly soluble and will completely settle after standing about an hour.
Aqueous 15% potassium iodide solution. This solution will decompose and tu rn a pale yellow after standing for a long period. W h e n necessary the color can be discharged by the addition of a drop or two of 0.1 N sodium thiosulfate.
M ercuric acetate in glacial acetic acid, 2.5% solution. Standardized aqueous 0.1 N sodium tliio- sulfate. Carbon tetrachloride.
Pyridine sulfate dibromide solution. Place 40 ml. of glacial acetic acid in each of three Pyrex Erlenm eyer flasks. To the first add slowly 16 *
0.2 gram s of pyridine w ith cooling. In the same manner ; add 20 =*= 0.2 gram s of concentrated sulfuric acid to the second flask. W hen cool, combine these solutions w ith further cooling, by adding the sulfuric acid-acetic acid mixture to the pyridine solution. To the th ird flask add carefully 16 * 0.2 gram s of bromine. Now' add this solution to the mixture of th e first two solutions and transfer to a 1-liter volumetric flask. M ake up to the m ark w ith glacial acetic acid and transfer to aD am ber or black-painted 2.5-liter glass-stoppered storage bottle , Add 1000 ml. of glacial acetic acid and mix the solution thoroughly.
P r e p a r a t io n a n d W e i g h i n g o f S a m p l e . R un all determinations in duplicate.
T ransfer a sample of the approxim ate w eight noted below’ from a beaker in which it can be warmed if necessary to a 500-™. glass-stoppered bottle containing 25 ml. of carbon tetrachloride To prevent possible loss of volatile halogen during the a bso rp tion period, use is recommended of the special iodine flasks with a hp around the top to provide a liquid seal of potassium iodide reagent. Weighing is accomplished by difference.
Vol. 16, No. 6I N D U S T R I A L A N D E N G I N E E R I N G C H E M I S T R Y
Figure 2. Effect of A bsorption Time on Iodine Num ber of Crude Tall^O il
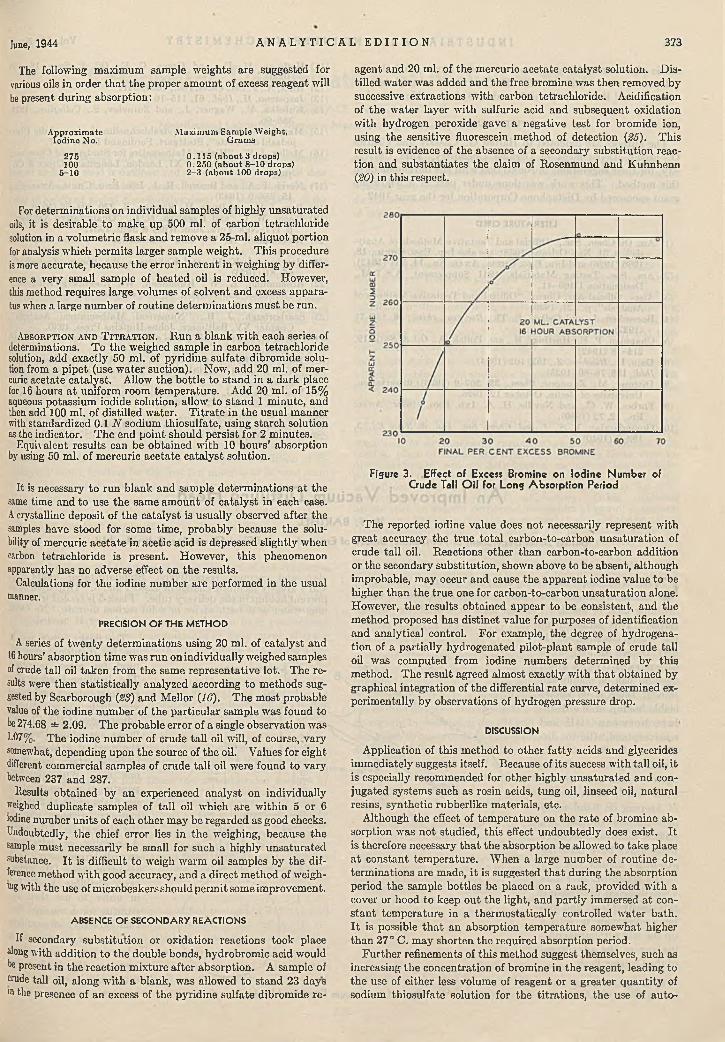
June, 1944 A N A L Y T I C A L E D I T I O N 373
The following maximum sample weights are suggested for various oils in order th a t the proper am ount of excess reagent will be present during absorption:
A pproxim ate M axim um Sam ple W eight,Iodine No. G ram a
275 0 .1 1 5 (a b o u t 3 drops)100 0 .2 5 0 (ab o u t 8 -10 drops)
5-10 2 -3 (ab o u t 100 drops)
For determ inations on individual samples of highly unsaturated oils, it is desirable to make up 500 ml. of carbon tetrachloride solution in a volum etric flask and remove a 25-ml. aliquot portion for analysis which perm its larger sample weight. T his procedure is more accurate, because th e error inherent in weighing by difference a very small sample of heated oil is reduced. However, this method requires large volumes of solvent and excess apparatus when a large num ber of routine determ inations m ust be run.
Ab s o r p t io n a n d T it r a t i o n . R un a blank w ith each series of determinations. T o the weighed sample in carbon tetrachloride solution, add exactly 50 ml. of pyridine sulfate dibromide solution from a p ipet (use w ater suction). Now, add 20 ml. of mercuric acetate catalyst. Allow th e bo ttle to stand in a dark place for 16 hours a t uniform room tem perature. Add 20 ml. of 15% aqueous potassium iodide solution, allow to s tand 1 m inute, and then add 100 ml. of distilled w ater. T itra te in the usual m anner with standardized 0.1 N sodium thiosulfate, using starch solution as the indicator. T he end point should persist for 2 m inutes.
Equivalent results can be obtained w ith 10 hours' absorption by using 50 ml. of mercuric acetate cata lyst solution.
It is necessary to run b lank and sample determ inations a t the same time and to use th e same am ount of catalyst in each case. A crystalline deposit of th e cata lyst is usually observed after the samples have stood for some time, probably because the solubility of mercuric acetate in acetic acid is depressed slightly when carbon tetrachloride is present. However, th is phenomenon apparently has no adverse effect on th e results.
Calculations for the iodine number are performed in the usual manner.
P R E C IS IO N O F T H E M E T H O D
A series of tw enty determ inations using 20 ml. of cata lyst and 16 hours’ absorption tim e was run on individually weighed samples of crude tall oil taken from th e same representative lot. The results were then statistically analyzed according to m ethods suggested by Scarborough (23) and Mellor (16). The m ost probable value of the iodine num ber of the particular sam ple was found to be 274.68 =*= 2.09. The probable error of a single observation was 1.07%. The iodine num ber of crude ta ll oil will, of course, vary somewhat, depending upon th e source of th e oil. Values for eight different commercial samples of crude ta ll oil were found to vary between 237 and 287.
Results obtained by an experienced analyst on individually weighed duplicate samples of tall oil which are within 5 or 6 iodine number units of each other may be regarded as good cheeks. Undoubtedly, the chief error lies in the weighing, because the sample must necessarily be small for such a highly unsaturated substance. I t is difficult to weigh warm oil samples by the difference method with good accuracy, and a direct method of weigh- ®g with the use of microbeakers should permit some improvement.
A B S E N C E O F S E C O N D A R Y R E A C T IO N S
If secondary substitution or oxidation reactions took place along with addition to the double bonds, hydrobromic acid would be present in the reaction mixture after absorption. A sample of crude tall oil, along with a blank, was allowed to stand 23 days w the presence of an excess of the pyridine sulfate dibromide re
agent and 20 ml. of the mercuric acetate cata lyst solution. D istilled w ater was added and th e free bromine was th en rem oved by successive extractions w ith carbon tetrachloride. Acidification of th e w ater layer w ith sulfuric acid and subsequent oxidation with hydrogen peroxide gave a negative te s t for bromide ion, using the sensitive fluorescein method of detection (26). This result is evidence of the absence of a secondary substitu tion reaction and substantiates the claim of Rosenm und and K uhnhenn (20) in this respect.
Figure 3. Effect of Excess Bromine on Iodine Num ber of Crude Tall O i l for Lo n g Absorption Period
The reported iodine value does no t necessarily represent w ith great accuracy the true to ta l carbon-to-carbon unsaturation of crude ta ll oil. Reactions other th an carbon-to-carbon addition or the secondary substitution, shown above to be absent, although improbable, m ay occur and cause the apparen t iodine value to be higher than the true one for carbon-to-carbon unsaturation alone. However, the results obtained appear to be consistent, and the m ethod proposed has d istinct value for purposes of identification and analytical control. F o r example, th e degree of hydrogenation of a partially hydrogenated pilot-plant sample of crude tall oil was com puted from iodine num bers determ ined by this m ethod. T he result agreed alm ost exactly w ith th a t obtained by graphical integration of th e differential ra te curve, determ ined experim entally by observations of hydrogen pressure drop.
D IS C U S S IO N
Application of this m ethod to other fa tty acids and glycerides im mediately suggests itself. Because of its success w ith ta ll oil, it is especially recommended for other highly unsaturated and conjugated system s such as rosin acids, tung oil, linseed oil, natural resins, synthetic rubberlikc m aterials, etc.
Although the effect of tem perature on the ra te of brom ine ab sorption was no t studied, th is effect undoubtedly does exist. I t is therefore necessary th a t th e absorption be allowed to take place a t constant tem perature. W hen a large num ber of routine determ inations are made, i t is suggested th a t during the absorption period the sample bottles be placed on a rack, provided w ith a cover or hood to keep ou t th e light, and partly immersed a t cons tan t tem perature in a therm ostatically controlled w ater bath . I t is possible th a t an absorption tem perature somewhat higher th an 27° C. m ay shorten th e required absorption period.
F u rther refinements of th is m ethod suggest themselves, such as increasing th e concentration of brom ine in th e reagent, leading to th e use of either less volum e of reagent or a greater quan tity of sodium thiosulfate solution for the titrations, the use of au to
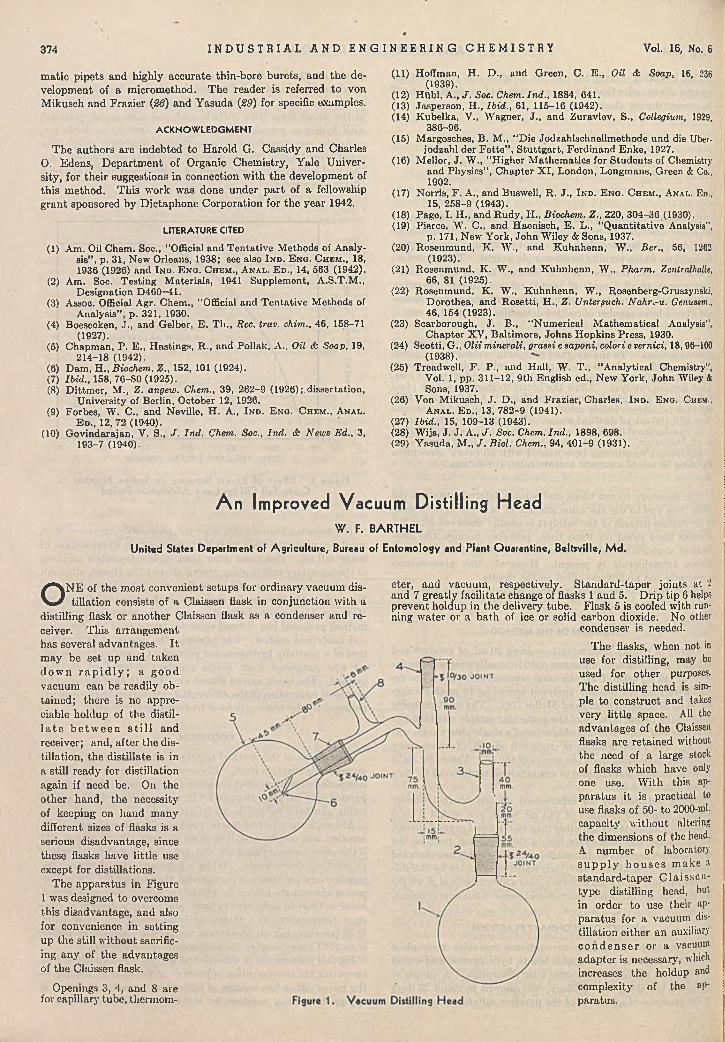
374 I N D U S T R I A L A N D E N G I N E E R I N G C H E M I S T R Y Vol. 16, No. 6
m atic p ip e ts a n d h igh ly accu ra te th in -b o re b u re ts , and th e dev e lopm en t of a m icrom ethod . T h e read er is refe rred to von M ikusch a n d F raz ie r (26) an d Y asu d a (29) for specific exam ples.
A C K N O W L E D G M E N T
T h e a u th o rs a re in d eb ted to H aro ld G. C assidy an d C harles O. E dens, D e p a rtm e n t of O rganic C hem istry , Y ale U n ivers ity , for th e ir suggestions in connection w ith th e developm en t of th is m eth o d . T h is w ork w as done u n d e r p a r t of a fellowship g ra n t sponsored by D ic tap h o n e C orp o ra tio n for th e y ear 1942.
L IT E R A T U R E C IT E D
(1) Am. Oil Chem. Soc., "Official and T entative M ethods of A nalys is ” , p . 31 , N e w O rle a n s , 1938 ; see a lso I n d . E n g . Chem., 18,1936 (1926) and I n d . E n g . Chem., A n a l . E d . , 14, 563 (1942).
(2) Am. Soo. Testing M aterials, 1941 Supplem ent, A .S.T.M .,D esignation D460-41.
(3) Assoc. Official Agr. Chem., "Official and T entative M ethods ofAnalysis” , p. 321, 1930.
(4 ) Boesecken, J., and Gelber, E . T h., Rec. trav. chim., 46, 158-71(1927).
(5) Chapm an, P . E ., H astings, R ., and Poliak, A., Oil & Soap, 19,214-18 (1942).
(6) Dam , H ..Biochem. Z., 152, 101 (1924).(7) Ibid., 158, 76-80 (1925).(8) D ittm er, M., Z . angew. Chem., 39, 262-9 (1926)¡.dissertation,
U niversity of Berlin, October 12, 1926.(9) Forbes, W. C., and Neville, H . A., I n d . E n g . C hem ., A n a l .
E d ., 12, 72(1940).(10) G ovindarajan, V. S., J . Ind . Chem. Soc., Ind . & News Ed., 3,
193-7 (1940).
(11) Hoffman, H . D ., and Green, C. E ., Oil & Soap, 16, 236(1939).
(12) HiibI, A., J . Soc. Chem. Ind ., 1884, 641.(13) Jasperson, H„ Ibid., 61, 115-16 (1942).(14) Kubelka, V., W agner, J ., and Zuravlev, S., Collegium, 1929,
386-96.(15) Margosches, B. M., "D ie Jodzahlschnellm ethode und die Ubcr-
jodzahl der F e tte ” , S tu ttg a rt, Ferdinand Enke, 1927.(16) Mellor, J . W., "H igher M athem atics for S tudents of Chemistry
and Physics” , C hapter X I, London, Longmans, Green <t Co., 1902.
(17) Norris, F . A., and Buswell, R . J ., I n d . E n g . C h e m ., A n a l . Ed.,15, 258-9 (1943).
(18) Pago, I. H ., and R udy, H ., Biochem. Z., 220, 304-36 (1930).(19) Pierce, W . C., and Haenisch, E . L ., "Q uan tita tive Analysis",
p. 171, New York, John W iley & Sons, 1937.(20) Rosenm und, K . W ., and K uhnhenn, W ., Ber., 56, 1262
(1923).(21) Rosenm und, K . W., and K uhnhenn, W ., Pharm. Zentralhalle,
66, 81 (1925).(22) Rosenm und, K . W ., K uhnhenn, W., Rosenberg-Gruszynski,
D orothea, and R osetti, H ., Z. Untersuch. Nahr.-u. Genvsm., 46, 154 (1923).
(23) Scarborough, J . B., “ Num erical M athem atical Analysis",C hap ter XV, Baltim ore, Johns Hopkins Press, 1930.
(24) Sco tti.G ., Olii minerali, grassi esaponi, colori evernici, 18,96-100(1938).
(25) Treadwell, F . P., and Hall, W. T ., "A nalytical Chemistry",Vol. 1, pp. 311-12, 9th English ed., New York, John Wiley & Sons, 1937.
(26) Von M ikusch, J . D., and Frazier, Charles, I n d . E n g . Chem.,A n a l . E d . , 13, 782-9 (1941).
(27) Ibid., 15, 109-13 (1943).(28) W ijs, J . J . A., J . Soc. Chem. Ind ., 1898, 698.(29) Yasuda, M., J . Biol. Chem., 94, 401-9 (1931).
A n Improved Vacuum D istilling H eadW . F. B A R T H E L
United States Department of A griculture, Bureau of Entom ology and Plant Quarantine, Beltsville, M d.
ON E of the m ost convenient setups for ordinary vacuum distillation consists of a Claissen flask in conjunction w ith a
distilling flask or another Claissen flask as a condenser and receiver. T his arrangem ent has several advantages. I t m ay be set up and taken d o w n r a p i d l y ; a g o o d vacuum can be readily obtained; there is no appreciable holdup of the distil- l a t e b e tw e e n s t i l l and receiver; and, after th e distillation, the distillate is in a still ready for distillation again if need be. On the o ther hand, the necessity of keeping on hand m any different sizes of flasks is a serious disadvantage, since these flasks have little use except for distillations.
T he apparatus in Figure 1 was designed to overcome this disadvantage, and also for convenience in setting up the still w ithout sacrificing any of the advantages of the Claissen flask.
Openings 3, 4, and 8 are for capillary tube, thermom
eter, and vacuum, respectively. S tandard-taper joints at i and 7 greatly facilitate change of flasks 1 and 5. D rip tip 6 helps prevent holdup in the delivery tube. Flask 5 is cooled with running w ater or a bath of ice or solid carbon dioxide. No other
condenser is needed.
T he flasks, when not in use for distilling, may be used for o ther purposes. T he distilling head is simple to construct and takes very little space. All the advantages of the Claissen flasks are retained without the need of a large stock of flasks which have only one use. W ith this apparatus it is practical to use flasks of 50- to 2000-ml. capacity w ithout altering the dimensions of the head. A num ber of laboratory s u p p l y h o u s e s m ake a s tandard-taper C la issen - type distilling head, but in order to use their apparatus for a vacuum distillation either an auxiliary c o n d e n s e r or a vacuum adap te r is necessary, which increases the holdup and complexity of the apparatus.
Colorimetric Determination of Nickel in SteelG . R. M A K E P E A C E a n d C. H . C R A F T
Metallurgical Laboratory, M enasco Manufacturing Com pany, Burbank, Calif.
The method of Murray and A sh le y for the colorimetric determination of nickel in steel is outlined and criticized. Experimental data are presented on the stability under various conditions of the red color of oxid ized nickel dim ethylglyoxim e. A modification of the method is described which gives a highly stable and readily repro-
MURRAY and Ashley (/) have presented a method for developing quantita tively the red color of oxidized nickel
dimethylglyoxime.
The sample is dissolved in dilute n itric acid (in th e case of difficultly soluble chromium-nickel steels, a m ixture of nitric and hydrochloric acids is used). To an aliquot of suitable size the following additions are m ade: citric acid to p revent iron precipitation a t the final p H brom ine w ater to oxidize nickel, ammonium hydroxide in sufficient quan tity to bring the pH to 8-9, and dimethylglyoxime in the form of 1% solution in alcohol to develop the red nickel color. The solution is diluted to known volume and the color is compared. A wave length th a t has been recommended for spcctrophotom etric reading is 530 mp.
Although the m ethod of M urray and Ashley has been used with some success in this laboratory and elsewhere, i t has certain undesirable characteristics. The color developed in the nickel solution shows continuous change from th e in s tan t of addition of di- mcthylglyoxime, tending for the first few m inutes to become more intense, then to fade. M urray and Ashley note the phenomenon of the color intensity change a t 530 mp w ith time, and present a set of curves illustrating its characteristics. A t no tim e is there a period of constant transm ittance in the transm ittance vs. time curve of sufficient duration to give a time margin for tru ly reproducible reading.
Both the slope and the tim e of the minimum of th e transm ittance vs. time curve appear to be changed by changes in the nickel concentration of the solution used for making the curve. Small differences in pH a t the tim e of adding dimethylglyoxime to otherwise similar solutions were found to have pronounced effects on the shape of the transm ittance vs. tim e curve, altering both the slope and the position of the minimum to a m arked degree.
. If 80% of the recommended am ount of amm onium hydroxide is used, no color a t all develops (pH 6.8). (All pH measurem ents «ere made w ith a Leeds & N orthrup potentiom etric pH m eter using a standard glass electrode and a calom el-saturated potassium chloride reference electrode.) W ith 90% of the am ount required (pH 8.1), th e ra te of color developm ent is slow and rate ?f fading is high. If the concentration of ammonium hydroxide ■s high, the rate of color developm ent is high and the ra te of fading slow, solutions retaining substantially all their color for several hours. If as much as four times th e recom mended am ount of ammonium hydroxide is used, the color is completely developed |n about 30 seconds. A second effect enters, however—a rapidly increasing interference of the iron in the solution. U ltim ately iron hydroxide is precipitated under these conditions. Critical examination of the pH range w ithin which th e M urray-Ashley method is workable shows i t to be less th an 1 pH unit, pH 8.2 to
I t was found th a t th e am ounts of ta rta ric acid, bromine water, and dimethylglyoxime solution wrere no t critical above a minimum value if sufficient extra am m onium hydroxide was added to neutralize increases in the acid content.
It was concluded th a t the unmodified m ethod of M urray and Ashley, while suitable for m any purposes, is no t sufficiently reproducible (a t least w ithout elaborate precautions) to m eet the needs of this laboratory. I t does, however, have the v irtue of being rapid. I t was in an effort to retain its speed while improv- ■ng its accuracy th a t th is research was undertaken. The original method recommends dissolving th e sample in 1 to 1 nitric acid,
ducible red color, and is particularly suitable for routine work because of its rapidity and manipulative sim plicity. Copper and cobalt interfere only slightly; the other elements ordinarily found in steel do not interfere. The accuracy of the method is comparable to that of routine gravimetric procedures.
except difficultly soluble chromium-nickel steels for which a mixtu re of equal parts of nitric and hydrochloric acids is suggested. Since m any of the steels analyzed in th is laboratory contain about 1% chromium and do no t dissolve completely in nitric acid or rapidly in hydrochloric acid, a m ethod was tried of decomposing first in an “acid m ixture” (133 ml. of 1.82 sp. gr. sulfuric acid and 167 ml. of 85% phosphoric acid per liter of solution) and then completing dissolution by adding 1 to 1 nitric acid. F or 1% chromium steels the m ethod was more rapid than decomposing w ith hydrocliloric acid and more nearly complete th an dissolving in nitric acid. N o effect on the developm ent of the nickel color was observed.
In th e effort to produce a nickel color th a t would be quickly formed, stable, and reproducible w ithout elaborate control of the conditions of developm ent, various o ther basic substances were tried in place of ammonium hydroxide. Among them were sodium carbonate, sodium tetraborate , sodium orthophosphate, potassium pyrophosphate, and sodium hydroxide, all in th e concentrations required to produce the proper pH range for color developm ent. None proved satisfactory. O ther oxidizing: agents such as sodium perborate, potassium chlorate, potassium iodate, and hydrogen peroxide were tried in place of tne brom ine. Only ammonium peroxydisulfate in th e presence of silver ion showed promise, b u t th e desired degree of color stab ility was n o t achieved w ith it. T he effects of solution tem perature on color developm ent were studied, b u t no worthwhile modification u tilizing tem perature control was found. Color developm ent a t high amm onium hydroxide concentration followed by reduction of the solution pH to 8.5 to prevent iron precipitation proved unworkable.
I t was realized a t this poin t th a t ta rta ric acid will hold iron in solution a t a considerably higher pH th an will citric acid. Accordingly, the citric acid was replaced by tartaric . Upon experim ent it was discovered th a t , while iron will develop an interfering color in ta r tra te solutions m ade basic w ith ammonium hydroxide nearly as quickly as in c itra te solutions under the same conditions, the interference and any precipitate th a t m ay form can be cleared up rapidly by increasing the pH still fu rther w ith sodium hydroxide. T his is no t true of citra te solutions. While the nickel color develops slowly and incompletely in very dilute sodium hydroxide solutions of pH 8 to 9 and no t a t all in more concentrated solutions, th e color, once developed, rem ains stable over long periods of tim e even in ra ther strongly basic sodium hydroxide solutions. In view of these facts, the following approach was tried :
The sample W’as trea ted w ith ta r ta ric acid and bromine and made strongly ammoniacal. Then the dimethylglyoxime solution was added. Under these conditions th e color developed rapidly. After 1 m inute, sodium hydroxide was added. A fter 2 to 3 m inutes the increase in iron interference which had taken place in ammoniacal solution cleared up completely and the color became stable. No further change in color and consequently in transm ittance a t 530 m ^ w-as observed. T he reading a t 24 hours was identical w ith the reading 5 m inutes after adding dim ethylglyoxime.
P R O C E D U R E
Since these results seemed very encouraging, a procedure wras devised to m ake use of them and was used in all the studies hereafter reported. H igh-purity reagents m ust be used. P articu lar
375

376 I N D U S T R I A L A N D E N G I N E E R I N G C H E M I S T R Y Vol. 16, No. 6
a tten tion .should be paid to the suitability of the ta rta ric acid and of the dimethylglyoxime.
Decompose a 0.25-gram sample in 20 ml. of an acid m ixture (133 ml. of 1.S2 sp. gr. sulfuric acid and 167 ml. of 85% ortho- phosphoric acid per liter of solution). Steels containing little chromium m ay be dissolved directly in 8 N n itric acid. Stainless- type steels m ay require the use of hydrochloric acid. Cautiously add 10 ml. of S N nitric acid and boil to expel oxides of nitrogen. T ransfer the solution to a volum etric flask of suitable size and dilute to th e m ark. T ransfer by p ipet to a 100-ml,, volum etric flask an aliquot of th e diluted solution containing between 0.05 and 0.3 mg. of nickel. Add to it, mixing a fter each addition, 5 ml. of a 20% tartaric acid solution, 5 ml. of saturated bromine w ater, 10 ml. of 0.90 sp. gr. am m onium hydroxide, and 5 ml. of a 1% solution of dimethylglyoxime in m ethyl alcohol. (Occasional difficulties in developm ent of color and in fading upon addition of sodium hydroxide have been traced to im pure or partially decomposed ta r ta ric acid and dimethylglyoxime. c.p. reagents are no t uniformly satisfactory in this respect. Im pure tartaric acid interferes w ith developm ent of color upon addition of dimethylglyoxime, in extreme cases preventing any color formation a t all. Im pure dimethylglyoxime results in a fading of the color upon addition of sodium hydroxide. The fading m ay take place very rapidly or slowly, depending on the degree of im purity. B oth difficulties can be overcome by special trea tment. Addition of a second 5-ml. portion of bromine w ater after introduction of th e dimethylglyoxime ensures complete color development. Difficulties w ith the dimethylglyoxime reagent can be overcome by acidifying the alcohol solution with dilute sulfuric acid and adding enough bromine w ater to color i t yellow. This should be done 15 to 30 m inutes before i t is used. Occasional small further additions of bromine w ater are necessary to keep the solution yellow. The trea ted reagent is usable for only a few hours.)
After 1 m inute add 10 ml. of 6 N sodium hydroxide solution and dilute to the m ark. After 5 m inutes, transfer the solution to the optical cell and compare the transm ittance a t 530 m^ with th a t of pure water.
Two transm ittance vs. wave-length curves were prepared, one from N ational Bureau of S tandards Bessemer steel lOd containing substantially no nickel, and one from a nickel solution made from c .p . nickel n itra te . They are shown in Figure 1 as read on a Coleman Universal spectrophotom eter. A Beckman spectrophotom eter, w ith a m uch narrower wave band th an the Coleman, gave a similar curve for the nickel solution; the positions of the maxima and minim a were identical. Appreciable interference of the blank (Bessemer steel), however, did no t occur on the Beckm an instrum ent until wave lengths as short as 470 mu were reached.
F rom a study of these curves it was decided th a t the m ost satisfactory wave length for reading th e transm ittance of th e nickel color in steel on a Coleman U niversal spectrophotom eter, which has a wave band w idth of 35 mp, is 530 m/i, the wave length originally suggested for the method of M urray and Ashley. This selection was made on a basis of minim um interference of the blank and m aximum interference of the nickel color. F or instrum ents w ith a wave band m uch narrower than 35 rim, such as the Beckm an photoelectric spectrophotom eter, a lower setting such as 480 or 490 my. seems to be preferable, since the lower value is closer to a minimum of the nickel curve and since iron interference is small in th is range w ith such an instrum ent. Presum ably, it would be possible to use for bo th spectrophotom eters a wavelength setting a t the 470 inp minimum of the nickel curve, if a blank prepared from a steel free of nickel were used as the reference solution, thus canceling th e effect of iron interference.
F or colorimeters using filters one probably would do best to select a filter w ith a ra ther sharp cutoff a t about 450 mp, passing no light of shorter wave length. T his selection is indicated to eliminate interference due to the color of th e iron present. Increased sensitivity can be obtained by further restriction of the wave length of light used for comparison to the range of m aximum interference of the nickel color.
Samples were taken from a scries of N ational Bureau of S tandards nickel-containing steels and m ixtures of these steels to cover in sm all steps a series of nickel percentages from 0.002 to, 5.12.
3 5 0 4 0 0 4 5 0 5 0 0 5 5 0 5 0 0 £ 5 0
h S o tse /eo g i/} in
Figure 1. Per Cent Transmittance vs. W ave Length Curves for Bessemer steel blank and C .P. nickel nitrate solution as read on
Cbleman Universal spectrophotometer (35 mM band width)
They were prepared according to th e m ethod previously outlined, and th e points so obtained were p lo tted on semilog paper w ith the per cent transm ittance of th e sample compared with w ater a t 530 mju as th e o rdinate and th e per cent of nickel in the steel as th e abscissa. In th is fashion three transm ittance vs. concentration curves were obtained, for 0 to 1%, 1 to 2.5%, and2.5 to 5.5% nickel steels. A to ta l of 27 concentrations was used in obtaining th e th ree curves.
T he color was found to follow th e Beer-Lam bert law very exactly when read a t 530 m ^; therefore th e transm ittance vs. concentration curves, when plo tted as described, were straight lines over the entire range utilized.
N o one of the 27 points determ ined from th e N ational Bureau of S tandards samples deviated from th e transm ittance vs. concentration curves plo tted from them by more than 2 % of the total nickel present in th e steel in the case of steels containing more th an 1% nickel. No one of th e points deviated from the transm ittance vs. concentration curve by more th an 0.02% nickel (2 “ points” ) based on the to ta l analysis of th e steel in the case of steels containing less th an 1 % nickel. These points were established by single determ inations, no t by averages of groups of determ inations. The differences betw een th e high and the low values on th e N ational Bureau of S tandards reports sent with each steel are as g rea t as 1.7% of th e to ta l nickel present in the steel in the case of steels containing more th an 1% nickel. Differences of as m uch as 0 .021% of nickel (2 “points” ) based on the to ta l analysis of the steel are listed in th e case of steels containing less th an 1% nickel.
Reproducibility was checked by m aking five complete determ inations by th e au thors’ m ethod on N ational B ureau of Standards nickel steel 33b containing 3.48% nickel. Using the transm ittance vs. concentration curve established for steels containing2.5 to 5.5% nickel, the average value of th e five determinations was 3.48% nickel. T he maximum deviation from the average value was —0.05% nickel. H igh and low values on the National B ureau of S tandards report are 3.51 and 3.46% nickel, respectively. T he m ethod appears to be capable of the high order of reproducibility necessary for precise steel analysis.
June, 1944 A N A L Y T I C A L E D I T I O N 377
S E N S IT IV IT Y
Tests were made to determ ine th e sensitivity of the m ethod to small variations in procedure. I t was found th a t th e ta rta ric acid, bromine w ater, and dimethylglyoxime added could be decreased 25% or increased 100% w ithout affecting th e results. The ammonium hydroxide m ay be decreased 20% or increased 50% w ithout effect. Approxim ately th e same range of values holds for the sodium hydroxide. I t was determ ined th a t the time elapsed between adding the dimethylglyoxime and the sodium hydroxide is no t critical so long as it exceeds 1 m inute— i.e., color developm ent is complete in less th a n 1 m inute.
Three identical samples equivalent to a standard steel containing 0.60% nickel were prepared, using for each sample 0.125 gram of National Bureau of S tandards Bessemer steel lOd and 0.125 gram of nickel-chromium steeL32e. To sam ple 1 th e sodium hydroxide, which arrests color developm ent as well as preventing iron precipitation, was added 30 seconds after adding dimethylglyoxime ; to sam ple 2 ,5 m inutes after adding the dim ethylglyoxime; and to sam ple 3, 10 m inutes a fter adding the cli- metkylglyoxime. In each case th e solution was diluted to the volumetric m ark and mixed im m ediately after adding th e sodium hydroxide. T ransm ittance readings in each case were taken 10 minutes_after adding th e sodium hydroxide. The results, expressed in term s of the analysis of the steel as read from th e 0 to 1% nickel curve, averaged 0.599% nickel w ith a m axim um deviation from the average value of 0.005% nickel.
IN T E R F E R E N C E S
The method was-tested for interference by copper, cobalt, tungsten, molybdenum, chromium, and vanadium . The small amounts of copper (less th an 0.2 %) present in the usual steels did not interfere. Copper, when present to the extent of 0.50% in the steel, caused a positive nickel error of 0.02%. Cobalt, when added to the sample equivalent to 2.5% in th e steel, caused a positive error of 0.03% nickel. B oth elem ents were tested for in terference on a sample of steel containing 0.60% nickel. T he inter-
Table I. A n a lysis of SteelsSam ple 50a
B ureau of A uthors ' S tan d ard s m ethod
% %
Sam ple 132 B ureau of A u th o rs ' S tan d ard s m ethod
% %T ungstenC hrom iumV anadiumN ickelM olybdenum
IS .25 3 .52 0 .970 0 .045 0 .07
6 .2 94 .091 .640 .0957 .0 8
0 .13
ferenee of the o ther elem ents m entioned was determ ined by using the m ethod w ithout modification of any sort to analyze for nickel in two Bureau of S tandards tool steel samples, 50a and 132.
In view of the extreme conditions in these two analyses and th e small error in nickel in each case, it was concluded th a t these elem ents do no t interfere w ith th e determ ination to any appreciable extent. In the analysis of ordinary chromium-nickel stainless steels, no interference by chromium was observed.
A D V A N T A G E S O F M E T H O D
T he m ost im portan t advantages of the m ethod are its rapidity and its freedom from m anipulations requiring exceptional p recautions or a high degree of analytical skill. I t is well suited for routine use. W hen a group of five samples was analyzed by a worker only recently fam iliar w ith the m ethod, th e to ta l elapsed time, exclusive of weighing, was 1 hour and 10 m inutes (results reported above in paragraph on reproducibility). If a large num ber of samples is run a t one tim e, one thoroughly fam iliar w ith the m ethod can reduce the tim e required per sample to about 8 minutes.
L IT E R A T U R E C IT ED
(1) M u r r a y a n d A sh ley , I n d . E n g . C h e m ., A n a l . E d ., 10, 1 (1 9 3 8 ).
Identification of Nornicotine in TobaccoC . V . B O W E N A N D w. F. B A R T H E L
U. S. Department of A gricu ltu re , Bureau of Entom ology and Plant Quarantine, Beltsville, M d.
THE rather common occurrence of nornicotine in tobacco (3, 4, S, 7) indicates the need of a reliable qualitative means
of identifying this alkaloid when present w ith nicotine.Shmuk (8) identified nornicotine in such a m ixture after
extracting the ether-soluble m aterial from alkalized p lan t m aterial, by forming th e alkaloid pierates, recrystallizing from hot water, and m ethylating 'the m ixture of pierates. Ho attribu ted the resulting elevation in m elting po in t of the picrate to the conversion of nornicotine to nicotine.
This procedure has several serious drawbacks. T he ether extract of the alkalized p lan t m aterial will contain pyridine and other amines, no t all of which are rem oved by “blowing” . These compounds as well as the alkaloids form pierates. The re- crystallizations th a t occur before and during m ethylation will tend to remove these am ine pierates b u t a t the same tim e to eliminate the p icrate of the m inor alkaloid. If the minor alkaloid is present in small am ount, i t m ay be lost in the recrystallization of the original picrate. Since the mixed pierates before Methylation have a m elting point lower than th a t of nicotine picrate, and, being solid, require the addition of liquid for the Methylation, i t is possible for a fractional crystallization to occur with the form ation of new p icrate crystals richer in nicotine content and consequently having a higher m elting point. Such a rise in m elting po in t could easily bo m isinterpreted as being due to m ethylation of nornicotine, while in fact the alkaloid
picrate originally present m ay have been simply rendered richer in nicotine by recrystallization. Such a recrystallization proves neither the presence nor the absence of nornicotine.
The proposed method differs from th a t of Shm uk in the isolation of the alkaloids and in the position of the m ethylation step. T he steam -volatile tobacco alkaloids are separated from all. o ther amines and m ethylated before the p icrate is formed. T he m elting points of the pierates formed are compared before and after m ethylation. Since they are no t recrystallized no fractional crystallization can occur.
M arkwood (5 ) introduced m ethylation as a step in the determ ination of nornicotine, bu t since his m ethod did no t depend on m elting points, he failed to report the melting point of m ethylated nornicotine picrate as an indication of the form ation of nicotine.
The m ethod presented here is based on the quan tita tive m ethylation of the nornicotine and also on th e elevation of th e melting point' of th e alkaloid picrate. Consequently, the m ethylation of nornicotine to nicotine was investigated. T he nornicotine used in preparing the standard solution was identical w ith th a t used by M arkwood (7), had been isolated from Robinson’s Medium Broadleaf, a stra in of M aryland tobacco, and formed a picrate melting a t 190-191° C. T he absence of nicotine was established by finding no alkaloid in th e distillate after treating a sample w ith nitrous acid, making the aqueous solution ju s t basic to phenolphthalein, and steam-distilling.
378 I N D U S T R I A L A N D E N G I N E E R I N G C H E M I S T R Y Vol. 16, No. 6
Tabic Effect of M éthylation of Nornicotine on Picrate M elting Point
P ic ra te M elting Point®
Sam pleN ornicotine in
Alkaloid M ixture OriginalM ethy l
ated M ixed% ° C. ° C. ° C.
N icotine 221—223N ornicotine ÍÓÓ 187-190 221-223 220-223M ixtures
1 9 4 .8 168-180 220-223 221-2232 89 .4 180-184 223-224 221-2233 84 .3 175-183 222-223 221-2234 79 .2 178-183 222-223 220-2215 22 .9 205-214 222-224 221-224G 19.2 210-218 222-224 222-2247 13.7 213-220 222-221 222-2248 4 .6 215-223 222-224 222-224
a N o t recrystallized, num bers.
M elting points corrected and rounded off to whole
a N o t recrystallized. b A m erican grown.
M E T H Y L A T IO N O F N O R N IC O T IN E
Ten milliliters of the nornicotine solution containing 23.2 mg. of the alkaloid were treated w ith formic acid and formaldehyde according to M arkwood's method (.5), m ade alkaline to phenol- phthalein, and steam-distilled. No alkaloid was detected in th e distillation residue.
T he alkaloid in the distillate was precipita ted as a picrate, the melting point of which, when no t recrystallized, was 221- 223° C. A mixed m elting point with nicotine picrate prepared from a sample of pure nicotine showed no depression. The pure nicotine had been treated w ith nitrous acid for the removal of nornicotine. The absence of alkaloid in the distillation residue and the melting point of the picrate of the alkaloid in the final distillate prove the quan tita tive m éthylation of nornicotine to nicotine by means of formaldehyde and formic acid.A sharp melting point is no t to be expectedafter m éthylation when no recrystallizationhas been made. In obtaining th e melting points, considerationm ust be given to the spread, although the upper lim it is themost easily observed tem perature. T he entire spread m ust be•considered as the melting point. Values obtained w ith knownm ixtures of nicotine and nornicotine are shown in Tabic I.
P R O C E D U R E
A 1-gram sample of tobacco, 10 ml. of sodium hydroxide (30% by weight), and 10 grams of sodium chloride are steam-distilled in to 3 ml. of dilute hydrochloric acid (1 + 4) until a fresh portion of distillate gives no opalescence wheu a few milliliters are tested w ith silicotungstic acid solution. T he volume of distillate is ab o u t 100 ml. T he steam -volatile alkaloids are separated from o ther picrate-forming m aterials by precipitation by silicotungstic acid solution (12%) according to A.O.A.C. procedure (I), filtered on a small, hardened filter paper in a Iiirscli funnel, and washed w ith w ater containing 1 ml. of concentrated hydrochloric acid per liter. T he alkaloid in this residue is steam-distilled from sodium hydroxide and sodium chloride into hydrochloric acid, as above. T he distillate is concentrated to about 10 ml. and divided into two approxim ately equal portions. One portion is m ethylated according to M arkwood's method by adding 2 drops of formic acid and 5 ml. of formaldehyde (37%) and refluxing for 15 minutes. I t is then cooled and neutralized, and 25 ml. of sa tu ra ted aqueous picric acid solution are added. This solution is next concentrated by boiling to about 30 ml. and allowed to cool slowly. Twenty-five milliliters of th e picric acid solution are added to the neutralized unm etliylated portion, warmed to dissolve th e precipitate, cooled slowly. T he alkaloid picrates are filtered off and washed, once w ith dilute picric acid solution and once w ith water. The melting points of the picrates of th e unm ethylated distillate, th e m ethylated portion, and the m ethy lated portion mixed w ith nicotine picrate are compared for an elevation of tem perature due to m ethylation. The nicotine pierate should be prepared from pure nicotine and washed in the same m anner as the unm ethylated portion.
If the m elting point of the m ethylated portion is higher than th a t of the un treated portion and is comparable w ith th a t of the nicotine picrate, and no depression occurs in th e mixed melting point, nornicotine is confirmed. Since nornicotine is the only alkaloid th a t can be m ethylated to form nicotine and any derivative of other alkaloids would affect the mixed melting point, i t is evident th a t nornicotine is the only steam -volatile alkaloid aside from nicotine which is present in the tobacco tested. Table II shows the effect of m ethylation.
Nornicotine in tobacco, tobacco mixtures, and nicotine preparations m ay be identified in the same m anner, although smaller samples should be used when the alkaloid content is high.
Although th is method appears to be lengthy, a t present it offers the best chemical means for the identification of nornicotine, can be conducted in any laboratory, and does not require expensive and specialized equipm ent, such as a polarimeter, which is now either no t available or difficult to obtain. I t has the following advantages over the m ethod proposed by Shmuk: (1) W hen the picrates are formed, only the steam-volatile alkaloids ra th e r th an all the ether-extractable materials are present; (2) since the mixed picrate is recrystallized only in the m other liquor instead of "Being recrystallized from hot water
Table II. Effect of M ethylation of Tobacco A lk a lo ld s on Picrate M elting Point
Sam pleAnalysis
N icotine N ornicotine
N ornicotine in T o tal
S team -V olatile Alkaloid
Picrhte M elting Point*1 M ethyl-
O riginal ated Mixed% ■ % % ° C. ° C. 0 C.
C ash (flue-cured type) 0 .7 0 2.40 77 .4 182-185 221-223 220-222M ary land M edium Broad-
leaf (Robinson) 0 .9 8 2 .1 8 6 8 .8 180-194 222-223 219-223Burley, Iialley 1.23 1.41 53.4 196-206 220-223 221-224M ary land , M d.-Conn.
B roadleaf 2 .22 0 .49 18.1 203-219 222-223 222-223X an th i (T urkish) b 6 .5 9 1 .28 16.3 214-223 221-224 221-224
M elting po in ts corrected and rounded off to whole num bers.
and again in the m ethylation process, the possibility of loss of the minor alkaloid is elim inated; and (3) th e steam-distillation requires less tim e th an an ether extraction. An im proved steam- distillation apparatus (2) was used, bu t any steam-distillation apparatus m ay be conveniently used although the tim e may be longer and the volume of the distillate larger. W hen nicotine and nornicotine are determ ined (S), a liquants of the first distillate m ay be used to confirm the presence of nornicotine.
S U M M A R Y
Nornicotine m ay be identified in tobacco, insecticidal tobacco preparations, and nicotine preparations by comparing the melting point of the mixed picrates of the steam -volatile alkaloids with the picrate melting point of a m ethylated sample thereof. M ethylation of the nornicotine gives nicotine; consequently, the picrate of the m ethylated alkaloids will m elt a t the same point as nicotine picrate and no depression of melting point will occur in a m ixed-m elting point determ ination w ith nicotine picra te in those cases where steam -volatile alkaloids other than nicotine and nornicotine are substantially absent.
Nornicotine was confirmed in tobacco sam ples by this method.
L IT E R A T U R E C IT ED
(1) Assoc. Official Agr. Chem., Official and T en tative Methods ofAnalysis, 5 th ed., p. 64 (1940).
(2) Bowen, C. V'., and B arthel, W. F., Ind ." E ng . C h e m ., A n a l . Ei>->15, 590 (1943).
(3) Ibid., 15, 740-1 (1943).(4) M arkwood, L. N ., J . Assoc. Officiai Aor. Chem., 23, S04-10 (1940).(5) Ibid., 26, 2S3-9 (1943).(6) M arkwood, L. N „ Science, 92, 204-5 (1940).(7) Markwood, L. N., and Barthel, W. F., J . Assoc. Official Agr.
Chem., 26, 2S0-3 (1943).(8) Shm uk. A. A„ J . Applied Chern. (U. S. S. K.), 14, 864-6 (1941)-
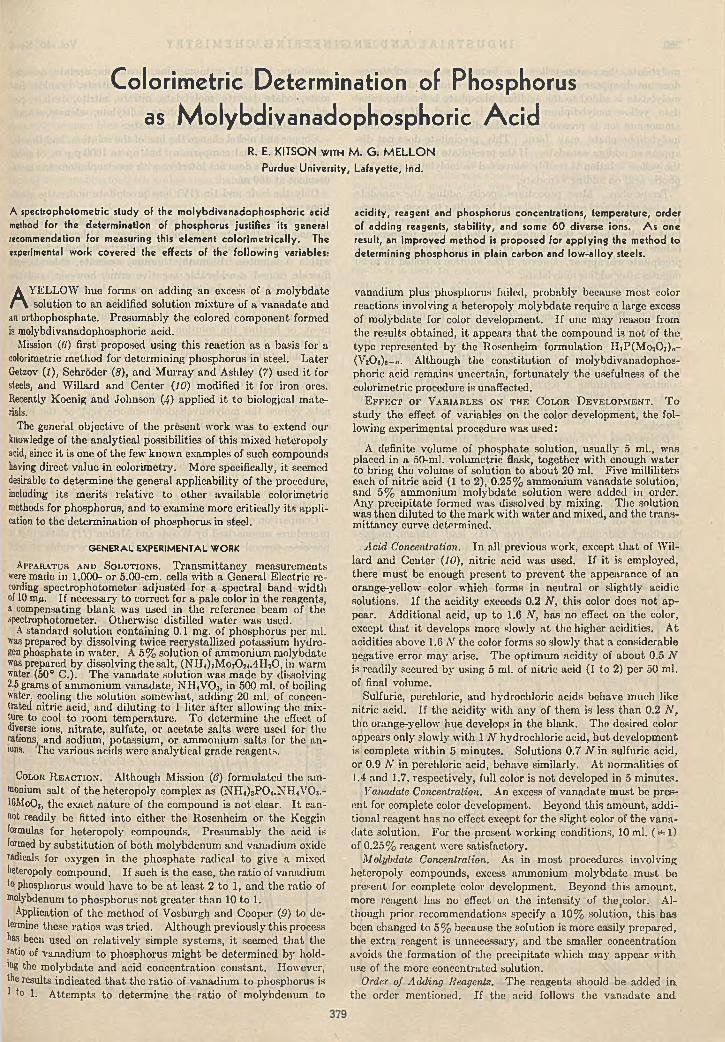
Colorimetric Determination of Phosphorus as M olybdivanadophosphoric A c id
R. E. K IT S O N w i t h M . G . M E L L O N
Purdue University, Lafayette, Ind.
A spectrophotometric study of the molybdivanadophosphoric acid method for the determination of phosphorus justifies its general recommendation for measuring this element colorim etrically. The experimental work covered the effects of the following variables:
A YELLOW hue forms on adding an excess of a m olybdate solution to an acidified solution m ixture of a vanadate and
an orthophosphate. Presum ably the colored com ponent formed is molybdivanadophosphoric acid.
Mission (6) first proposed using th is reaction as a basis for a colorimetric method for determining phosphorus in steel. Later Getzov (1), Schroder (8), and M urray and Ashley (7) used it for steels, and W illard and C enter (10) modified it for iron ores. Recently Koenig and Johnson (4) applied it to biological m aterials.
The general objective of the present work was to extend our knowledge of the analytical possibilities of this mixed heteropoly acid, since it is one of the few known examples of such compounds having direct value in colorimetry. M ore specifically, it seemed desirable to determ ine the general applicability of the procedure, including its m erits relative to other available colorimetric methods for phosphorus, and to examine m ore critically its application to the determ ination of phosphorus in steel.
G E N E R A L E X P E R IM E N T A L W O R K
A p p a r a t u s a n d S o l u t i o n s . T ransm ittancy m easurem ents were made in 1.000- or 5.00-cm. cells w ith a General Electric recording spectrophotom eter adjusted for a spectral band width of 10 m/i. If necessary to correct for a pale color in the reagents, a compensating blank was used in the reference beam of the spectrophotometer. Otherwise distilled w ater was used.
A standard solution containing 0.1 mg. of phosphorus per ml. was prepared by dissolving twice recrystallized potassium hydrogen phosphate in water. A 5% solution of ammonium m olybdate was prepared by dissolving the salt, (N ID 7M 07O24.4II2O, in warm water (50° C.). The vanadate solution was m ade by dissolving2.5 grams of amm onium vanadate, NILVOa, in 500 ml. of boiling water, cooling the solution somewhat, adding 20 ml. of concentrated nitric acid, and diluting to 1 liter a fter allowing the mixture to cool to room tem perature. To determ ine the effect of diverse ions, n itrate , sulfate, or acetate salts were used for the rations, and sodium, potassium , or amm onium salts for the anions. The various acids were analytical grade reagents.
Co l o r R e a c t io n . Although Mission (8) form ulated the am monium salt of the heteropoly complex as (NTDsPOi.NILVOj.- 16MoOj, the exact nature of the compound is no t clear. I t cannot readily be fitted into either the Rosenheim or the Keggin formulas for heteropoly compounds. Presum ably th e acid is formed by substitu tion of both molybdenum and vanadium oxide radicals for oxygen in the phosphate radical to give a mixed keteropoly compound. I f such is the case, the ratio of vanadium to phosphorus would have to be a t least 2 to 1, and the ratio of molybdenum to phosphorus no t greater than 10 to 1.
Application of the m ethod of Vosburgh and Cooper (.9) to determine these ratios was tried. Although previously this process has been used on relatively simple systems, it seemed th a t the ratio of vanadium to phosphorus m ight be determ ined by hold- mg the m olybdate and acid concentration constant. However, the results indicated th a t the ra tio of vanadium to phosphorus is * to 1. A ttem pts to determ ine the ratio of molybdenum to
acidity, reagent and phosphorus concentrations, temperature, order of adding reagents, stability, and some 60 diverse ions. A s one result, an improved method is proposed for applying the method to determining phosphorus in plain carbon and low -alloy steels.
vanadium plus phosphorus failed, probably because most color reactions involving a heteropoly m olybdate require a large excess of m olybdate for color developm ent. If one may reason from the results obtained, it appears th a t the compound is no t of th e type represented by the Rosenheim formulation ILPfM oJJj),,- (V20 ,)e-„ . Although the constitution of m olybdivanadophosphoric acid remains uncertain, fortunately the usefulness of the colorimetric procedure is unaffected.
E f f e c t o f V a r i a b l e s o n t h e C o l o r D e v e l o p m e n t . T o study the effect of variables on the color developm ent, the following experim ental procedure was used :
A definite volume of phosphate solution, usually 5 ml., was placed in a 50-ml. volum etric flask, together w ith enough w ater to bring the volume of solution to about 20 ml. Five milliliters each of nitric acid (1 to 2), 0.25% amm onium vanadate solution, and 5% ammonium m olybdate solution were added in order. Any precipitate formed was dissolved by mixing. The solution was then diluted to the m ark with w ater and mixed, and the trans- m ittaney curve determined.
Acid Concentration. In all previous work, except th a t of W illard and Center (10), nitric acid was used. If it is employed, there m ust be enough present to p revent the appearance of an orange-yellow color which forms in neutral or slightly acidic solutions. If th e acidity exceeds 0.2 N , th is color does not ap pear. A dditional acid, up to 1.6 N , has no effect on the color, except th a t it develops more slowly a t the higher acidities. A t acidities above 1.6 Ar the color forms so slowly th a t a considerable negative error m ay arise. T he optimum acidity of about 0.5 N is readily secured by using 5 ml. of nitric acid (1 to 2) per 50 ml. of final volume.
Sulfuric, perchloric, and hydrochloric acids behave much like nitric acid. If the acidity with any of them is less than 0.2 N , the orange-yellow hue develops in the blank. The desired color appears only slowly with 1 N hydrochloric acid, b u t developm ent is complete w ithin 5 m inutes. Solutions 0.7 N in sulfuric acid, or 0.9 N in perchloric acid, behave similarly. A t norm alities o f i.4 and 1.7, respectively, full color is no t developed in 5 m inutes.
Vanadate Concentration. An excess of vanadate m ust be present for complete color development. Beyond this am ount, additional reagent has no effect except for the slight color of the vanadate solution. For the present working conditions, 10 ml. (=*=1) of 0.25% reagent were satisfactory.
Molybdate Concentration. As in m ost procedures involving heteropoly compounds, excess ammonium m olybdate m ust be present, for complete color developm ent. Beyond this am ount, more reagent has no effect on the intensity of th e (color. Although prior recom mendations specify a 10% solution, this has been changed to 5% because the solution is more easily prepared, the extra reagent is unnecessary, and the sm aller concentration avoids the formation of the precipitate which m ay appear with use of the more concentrated solution.
Order of Adding Reagents. The reagents should be added in the order mentioned. I f the acid follows the vanadate and
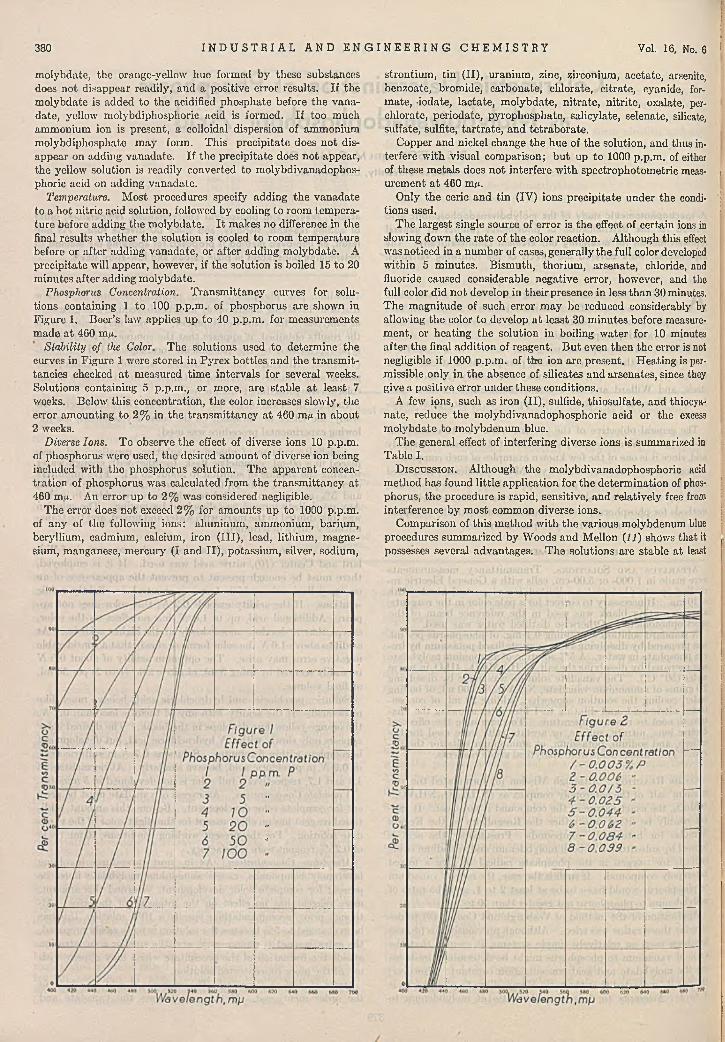
380 I N D U S T R I A L A N D E N G I N E E R I N G C H E M I S T R Y Vol. 16, No. 6
m olybdate, the orange-yellow hue formed by these substances does no t disappear readily, and a positive error results. I f the m olybdate is added to the acidified phosphate before the vanadate, yellow molybdiphosphorie acid is formed. I f too much amm onium ion is present, a colloidal dispersion of ammonium molybdiphospliate m ay form. T his precipitate does no t disappear on adding vanadate. I f the precipitate does no t appear, the yellow solution is readily converted to molybdivanadophos- phoric acid on adding vanadate.
Temperature. M ost procedures specify adding th e vanadate to a ho t nitric acid solution, followed by cooling to room tem perature before adding the m olybdate. I t makes no difference in the final results w hether th e solution is cooled to room tem perature before or after adding vanadate, or after adding m olybdate. A precipitate will appear, however, if the solution is boiled 15 to 20 m inutes after adding m olybdate.
Phosphorus Concentration. T ransm ittancy curves for solutions containing 1 to 100 p.p.m . of phosphorus are shown in Figure 1. Boer’s law applies up to 40 p.p.m . for m easurem ents made a t 460 m^.
Stability of the Color. The solutions used to determ ine the curves in Figure 1 were stored in Pyrex bottles and the transm it- tancies checked a t m easured tim e intervals for several weeks. Solutions containing 5 p.p.m ., or more, are stable a t least 7 weeks. Below th is concentration, th e color increases slowly, the error am ounting to 2% in the transm ittancy a t 460 m/i in about 2 weeks.
Diverse Ions. To observe the effect of diverse ions 10 p.p.m. of phosphorus were used, the desired am ount of diverse ion being included w ith the phosphorus solution. The apparen t concentra tio n of phosphorus was calculated from the transm ittancy a t 460 m/i. An error up to 2% was considered negligible.
The error does no t exceed 2% for am ounts up to 1000 p.p.m. of any of the following ions: aluminum, ammonium, barium , beryllium, cadmium, calcium, iron (III), lead, lithium , magnesium, manganese, m ercury (I and II ) , potassium , silver, sodium,
strontium , tin (II), uranium , zinc, zirconium, acetate, arsenite, benzoate, bromide, carbonate, chlorate, citrate, cyanide, form ate, -iodate, lactate, m olybdate, n itra te , n itrite , oxalate, perchlorate, periodate, pyrophosphate, salicylate, selenate, silicate, sulfate, sulfite, ta r tra te , and te traborate .
Copper and nickel change the hue of th e solution, and thus interfere w ith visual comparison; b u t up to 1000 p.p.m , of either of these m etals does no t interfere w ith speetrophotom etric meas- , urem ent a t 460 m/t.
Only the eerie and tin (IV) ions precipitate under the conditions used.
The largest single source of error is th e effect of certain ions in slowing down the ra te of the color reaction. A lthough th is effect wasnoticed in a num ber of cases, generally the full color developed w ithin 5 m inutes. B ism uth, thorium , arsenate, chloride, and fluoride caused considerable negative error, however, and the full color did n o t develop in their presence in less th an 30 minutes. T he m agnitude of such error m ay be reduced considerably by allowing th e color to develop a t least 30 m inutes before measurem ent, or heating the solution in boiling w ater for 10 minutes after the final addition of reagent. B u t even then the error is not negligible if 1000 p.p.m . of the ion are present. H eating is permissible only in the absence of silicates and arsenates, since they give a positive error under these conditions.
A few ions, such as iron (II), sulfide, thiosulfate, and thiocya- nate, reduce the m olybdivanadophosphoric acid or the excess m olybdate to molybdenum blue.
T he general effect of interfering diverse ions is summarized in Table I.
D i s c u s s i o n . Although the m olybdivanadophosphoric acid m ethod has found little application for the determ ination of phosphorus, the procedure is rapid, sensitive, and relatively free from interference by m ost common diverse ions.
Comparison of th is m ethod w ith the various molybdenum blue procedures sum marized by Woods and Mellon (11) shows that it possesses several advantages. T he solutions are stable a t least
June, 1944 A N A L Y T I C A L E D I T I O N 381
2 weeks, as compared w ith a m aximum of 10 hour's for any of the molybdenum blues studied. I t is also relatively free from interference, as compared w ith them . Especially im portan t is this characteristic for iron (III) and silicate, both of which interfere in most molybdenum blue methods. A lthough a m olybdenum blue is more satisfactory for visual comparison th an th e yellow molyb- divanodophosphoric acid, th is technique can be used. However, photoelectric means are preferable. In general, th e ranges for molybdenum blue methods are less th an th a t for th is procedure, which extends from 1 to 50 p.p.m . for 1-em. thickness. The system conforms to B eer’s law through m ost of th is range.
Since photoelectric m easurem ent seems preferable, a series of permanent standards was no t established. Such a series could be prepared from the acid itself, b u t w ith low concentrations of phosphorus the solutions are no t stable more th an 2 weeks'. Comparison of th e transm ittancy curves in Figure 1 (for 10 p.p.m.) with those for dichrom ate solutions (8) shows an approxim ate match with th e aqueous dichrom ate solutions a t pH 6.1.
Table 1. Effect of Diverse IonsA m oun t
Ion A dded as A m ount E rro r Perm issibleP .p .m . % P .p .m ,
Bi+ + * B i(N O ,), 1000 5 400Crt + <- Cra(SO«)s 10 1 10Co++ C o(NO,)z 100 2 100Fe++ Fe(NH«)s(SO«)j 100 0 100Th+-*-■*- + T h(N O i), 400 38 20AsO«----- NazlTAsO* 1000 15 125c i- N aC l 1000 24 75PtCli— H iPtC le 20 0 20CtiOi “ ~ K jC nO r 4 2 4F- N aF 1000 51 50I" K I 100 a 0MnOt - K M nO i 10 10 0SCN- K SC N 500 0 500SiOi NajSjOe 250 0 250wo«— N ajW O i 250 2 250
4 Oxidizes to iodine.
R E C O M M E N D E D G E N E R A L P R O C E D U R E
Sample. Procure a representative portion of the m aterial and subject it to the necessary preparative treatm ent. W eigh or measure by volume a sample containing no t less than 0.005 mg. of phosphorus.
If necessary, dissolve the sample by appropriate means, taking care in the dissolution and subsequent trea tm en t to convert the phosphorus to orthophosphate. Obviously, phosphoric acid may not be used for dissolution, nor pyrophosphate for a fusion. Interfering ions should either be rem oved or inhibited to bring their concentrations w ithin the lim its set in Table I . M ake the resulting solution ju s t acidic to litm us and dilute to a definite volume in a volum etric flask.
D e s ir e d C o n s t i t u e n t . T ransfer a suitable aliquot of the solution to a 100-ml. flask. I f Nesslcr tubes are used for visual comparison, a t least 0.005 mg. of phosphorus should be in the aliquot. For photom etric m easurem ent in 1-cm. cells, 0.1 to 5 mg. of phosphorus should be present. Add in order, w ith adequate mixing, 10 ml. of n itric acid (1 to 2), 10 ml. of 0.25% am monium vanadate solution, and 10 ml. of 5% amm onium molyb- uatc solution. D ilute to th e m ark and mix well. T he color may be measured a t once by any of the usual means. F ilte r photometric m easurem ent should be m ade w ith a blue filter having its maximum transm ission near 470 m ¡i, and spectrophotom etric measurement is m ade best between 460 and 480 mix.
D E T E R M IN A T IO N O F P H O S P H O R U S IN S T E E L
Several colorimetric m ethods have been described for determining phosphorus in steel in a fraction of th e tim e required for ihe conventional gravim etric or titrim etric procedure. A 0.5- gram sample m ay be handled colorimetrically w ith an accuracy equal to th a t of the usual titrim etric procedure, and w ith a saving of time of a t least tw o th irds. For th is purpose Mission (6) first used the m olybdivanadophosphoric aeid m ethod. I t was investigated subsequently by others (1, 7, 8). Since th e procedure
has no t been generally applied in the routine analysis of steel, th e work reported here was done to check th e earlier recommendations w ith modern photoelectric equipm ent.
E X P E R IM E N T A L W O R K
A plain carbon steel was used as the source of phosphorus in most of the work. The m anufacturer’s analysis gave the following percentages: C, 0.64; M n, 0.65; Si, 0.18; S, 0.022; and P, 0.02. T he last value was checked. The solutions of ammonium vanadate and m olybdate were the same as used before. The potassium perm anganate and the ammonium peroxydisulfate solutions were 1 and 7.5% , respectively. The 3% hydrogen peroxide was the common U.S.P. solution.
P r e l i m in a r y E x p e r i m e n t s . In m ost m ethods for the colorim etric determ ination of minor constituents in iron and steel, some reaction is used to convert th e colored ferric ion to a colorless complex. Several common reactions are inapplicable w ith the m olybdivanadophosphoric acid m ethod. Phosphoric acid obviously cannot be used to form the ferric phosphate complex. Fluoride ion interferes w ith th e color development, thus elim inating th e fluoride complex. R eduction of ferric to ferrous ion is objectionable because ferrous iron partially reduces the colored complex. A lthough dissolution of the sample in perchloric acid gives a m easurable system (10), th e procedure recommended here proved to be more rapid and more easily controlled.
This situation necessitates developing the m olybdivanadophosphoric acid color in th e presence of the ferric iron color. The la tter, or background color, m ust be reproducible to ensure reliable results in the final evaluation of the to ta l color. Prelim inary experiments w ith the procedure of M urray and Ashley (7) revealed difficulties which were traced to this background color. T he deviation was small and probably would be unnoticed in various visual m ethods. Since it was definitely more th an the 2% error considered negligible for work w ith the recording spectrophotom eter, m eans were sought to reduce th e uncertainty.
Subsequent work showed th a t a reproducible background color could be obtained w ith the procedure of M urray and Ashley only by careful control of the experim ental conditions. T he use of amm onium peroxydisulfate as oxidant eased the necessity for careful control. Solutions prepared w ith th is reagent were more reproducible th an those using the perm anganate previously recommended, and they did no t require such close duplication of experim ental conditions. Excess oxidant is readily removed by heating, thus elim inating an operation from the procedure and saving time.
E f f e c t o f V a r i a b l e s o n C o l o r . The following experimenta l procedure was used in studying the effect of variables on the peroxydisulfate m ethod:
A 0.5-gram sam ple of steel in a 150-ml. conical flask was treated w ith 20 ml. of n itric acid (1 to 2). A fter violent action ceased, the solution was heated to boiling on a ho t p late and allowed to boil from 2 to 5 m inutes. Five milliliters of the peroxydisulfate solution were added, and the solution was boiled from 3 to 5 m inutes to destroy excess oxidant. Ten milliliters of vanadate solution were then added, and the solution was cooled to room tem perature. Following addition of 20 ml. of m olybdate solution, th e system was mixed and transferred to a 100-ml. volum etric flask. A fter dilution to volume w ith w ater and mixing, the transm ittancy curve was determ ined in 5.00-cm. cells.
A cid Concentration. T he concentration of acid in th e final solution is indefinite because of th e am ount used up in th e dissolution process, and th a t boiled out during subsequent heating. T he intense color produced w ith th e use of small am ounts of acid is probably attribu tab le to a vanadom olybdate complex which forms a t low acidity. T he color w ith high acid concentra tion is due alm ost entirely to the iron color. T he optimum am ount of acid is 20 ml. of nitric acid (1 to 2). This volume provides reproducible background color, b u t more reduces the intensity of the final color. M easurem ent of the acid to =<= 1 ml. from a 250-ml. bu ret is recommended.
382 I N D U S T R I A L A N D E N G I N E E R I N G C H E M I S T R Y Vol. 16, No. 6
Peroxydisulfate Concentration. Enough ammonimn peroxydisulfate m ust be added to oxidize organic m aterial, bu t a large excess should be avoided. Although 5 ml. of a 7.5% solution ■were chosen as the optim um am ount, twice as m uch is permissible. As the solution decomposes on standing, it should be prepared daily.
Vanadate and Molybdate Concentration. V ariations in the vanadate and m olybdate concentrations have some effect on the final color. T w enty milliliters of 5% ammonium m olybdate and 10 ml. of 0.25% ammonium vanadate gave best results. These volum es should be controlled w ithin 1 ml.
Time of Heating. T he steel solution should be boiled a t least 2 m inutes after dissolution of th e sample, bu t boiling as long as 5 m inutes has no deleterious effect on th e color. T he length of tim e of boiling after adding peroxydisulfate is apparently not critical, since variation from 3 to 10 m inutes made no difference.
Order of Adding Reagents. Three successions of adding reagents were tried : both the vanadate and the m olybdate to the h o t steel solution; th e vanadate to the hot solution, followed by cooling before adding the m olybdate; and both the m olybdate and vanadate to th e cooled steel solution. The same final color was obtained. However, th e second order was finally adopted, chiefly because of previous recommendation.
Stability of Color. The full color intensity develops immedi- a'.ely on adding the molybdate, and the color is stable for a t least an hour. Since th e m ethod is being recommended for rapid photom etric measurem ent, this factor was not studied further.
R E C O M M E N D E D P R O C E D U R E F O R S T E E L S
Based on th is experim ental evidence, the following procedure is recommended for the determ ination of phosphorus in plain carbon and certain low' alloy steels:
S a m p l e . Weigh a 0.5-gram representative sample i n t o a 150-ml. conical flask, add 20 ml. of nitric acid (1 to 2), and, after violent action ceases, boil 2 m inutes to remove nitrous oxide fumes. Add 5 ml. of a freshly prepared 7.5% solution of am monium peroxydisulfate, and boil 3 to 5 m inutes to destroy the excess.
D e s i r e d C o n s t i t u e n t . Add 10 ml. of 0.25% ammonium vanadate solution to the ho t solution and then cool to room tem perature. A fter adding 20 ml. of 5% amm onium m olybdate solution, mix thoroughly and transfer the solution to a iOO-ml. volum etric flask. D ilu te to the m ark, mix, and measure the color in tensity by any suitable means. A blue filter w ith maxim um transmission near 470 m y is suitable for a filter photom eter. W ith a spectrophotom eter the best wave length is the range 460 to 480 my.
Table II. Data Used for Calibration CurveSteel Log T*mNo. Phosphorus T*60 Observed C alcd .0
% %55 0.003 6 8 .8 1 .838 1.843l i d 0 .006 6 8 .0 1.833 1.83012d 0.013 6 2 .9 1.799 1.79816b 0.025 5 5 .5 1.744 1.74420c 0.044 4 5 .9 1.662 1.65821c 0.062 3 6 .8 1.566 1.57622b 0.084 3 1 .2 1.494 1.476
8d 0.099 2 5 .0 1 .398 1.4091 C alcu la ted from th e equation
% P - 1.857A
- log Tno
A N A L Y S I S O F S T A N D A R D S A M P L E S
'T h e final tes t of the procedure was the analysis of some 20 plain rand ilow-alloy steels from th e N ational Bureau of Standards. ¡Eight plain carbon steels of different phosphorus contents were used to establish a calibration curve. T he rem ainder were analyzed on the basis of th is curve. Three samples of each steel were
prepared according to the recommended procedure. The average of the transm ittancy readings a t 460 m y was used as the most probable value.
The d a ta secured for the eight steels used for the calibration curve are summarized in T able II . T he transm ittancy curves for the solutions are shown in Figure 2. I f log ÎVa is plotted against percentage of phosphorus, a stra igh t line is obtained, indicating conformity to Beer’s law. T he equation of the best straigh t line was calculated by th e m ethod of least squares, the da ta obtained being included in Table II .
A fter the calibration curve had been established, 14 plain carbon and low-alloy steels were analyzed (Table I I I ) . In each case th e average value found is the result of a t least 3 determinations. T he average deviation from th e m ean was usually less than 2 to 3% of the phosphorus present.
Table III. A n a lys is of Standard SteelsSam ple T ype
and No.Phosphorus
FoundD eviation
from S tan d ardAllowable
D eviation (6)% % %
Bessem er 9c 0.091 ^ - 0 .0 0 5 ±0.004Bessem er lOd 0.087 0.001 0.004Bessem er 23a 0.102 0 .000 0.004B .O .H . 13c 0.011 - 0 .002 0.002B .O .H. 15a 0 .006 - 0.001 0.002A.O.H. 21a 0.062 - 0.001 0.003A .O.H. 34 0 .095 0.000 0.004A.O.H. 35 0.035 + 0.002 0.003E lectric 51 0 .016 + 0 .0 0 5 • 0.002Acid electric 65a 0.036 0 .000 0.003M n rail 100 0.022 - 0.001 0.002Ni 33b 0.036 - 0.001 0.003N i-C r 32b 0.024 4 0 .008 0.002C r-M o 72 0.033 + 0 .017 0.002
Exam ination of the results shows th a t in four cases the experim ental results are outside the limits set for gravim etric or titri- m etric methods. The reason for th e deviation in steel 9e is un- knowm, three excellent checks being obtained. W ith steel 51, hou'ever (because of high carbon ?), 6 sam ples diverged widely. O ther samples in wdiieh deviation occurred contained moderate am ounts of chromium, which would be expected to interfere.
T he accuracy of the calibration curve was confirmed by calculating the best straigh t line for all the steels except Nos. 32b, 33b, 51, and 72. T he formulas for the best stra igh t lines are
m „ 1.857 - log 7«o /n , ,% 1 = jg g g (8 samples)
1.857 - log Ttta , ,= ------- £ 500 ’ (18 samples)
D i s c u s s io n . The use of ammonium peroxydisulfate has several advantages over potassium perm anganate in this method. T he background color is more nearly reproducible. Since exact control of experimental conditions is no t necessary, the over-all procedure is simplified. There is a saving of approximately 10 m inutes in time.
The calibration curve m ay be prepared by using a series of steels of known phosphorus content, or by adding known amounts of phosphorus to solutions of a single analyzed steel. The former alternative was used in this w-ork, and th e la tte r by Murray and Ashley (7). Their m ethod seems preferable if one type of steel is to be analyzed, since the background color is then essentially constant. As Beer’s law applies to the system , one may extrapolate to concentrations of phosphorus below th a t of the standard. If several types of steel, having compositions no t too different but giving different background colors, are to be analyzed, an average calibration curve should be prepared from a series of known steels of the types to be analyzed. In any questionable case, the second alternative should be used. Instead of taking the results from such a calibration curve, they m ay be calculated from the straight-line equation already mentioned.

June, 1944 A N A L Y T I C A L E D I T I O N 383
Murray and Ashley reported serious interference w ith high (4%) silicon, b u t in the usual range of this elem ent no interference was found in th is work. M ore th an 0.4% chromium gives a positive error. In general, th e accuracy equals th a t of the common titrimetric m ethod, which is less rapid and requires more skill. The molybdenum blue m ethod of Hague and B right (3) is also less rapid.
L IT E R A T U R E C IT E D
(1) Getzov, Zavodskaya Lab., 4 , 349 (1935).(2) Hague and Bright, J . Research Natl. B ur. Standards, 26, 405
(1941).(3) Kitson and Mellon, I n d . E n o . C h e m ., A n a l . E d ., 16, 42 (1944).
(4) Koenig and Johnson, Ibid., 14, 155 (1942).(5) Lundell, Hoffman, and Bright, "Chem ical Analysis of Iron and
Steel” , p. 131, New York, John W iley & Sons, 1931.(6) Mission, Chem. Ztg., 32, 633 (1908); A nn. chim. anal. chim.
appl., 4, 267 (1922).(7) M urray and Ashley, I n d . E n g . C h e m ., A n a l . E d ., 10, 1 (1938).(8) Schroder, Stahl u. Eisen, 38, 316 (1918).(9) Vosburgh and Cooper, J . A m . Chem. Soc., 63, 437 (1941).
(10) W illard and Center, I n d . E n g . C h e m ., A n a l . E d ., 13, 81 (1941);C enter and Willard, Ibid., 14, 287 (1942).
(11) Woods and Mellon, Ibid., 13, 760 (1941).
A bsthacted from a portion of the thesla presen ted by R . E , K itson to the G rad u a te School of P u rd u e U n iversity in p a rtia l fulfillm ent of the requ ire m ents for the degree of d o c to r of philosophy.
Determination of Potassium in Fertilizer MixturesRemoval of Am m onia and O rgan ic Matter without Ignition
A . B. J O Y
The Pacific Chem ical and Fertilizer Co ., H on olu lu, T. H .
THE ignition step in the A.O.A.C. (1) m ethod for the determination of potassium in mixed fertilizers requires
careful a tten tion and m ay sometimes result in potassium losses or insoluble residues. This paper presents a procedure which has been found to reduce errors and shorten the tim e of analysis of many fertilizers by elim inating high-tem perature ignition with sulfuric acid.
Kraybill and T hornton (4) have called atten tion to losses during ignition which m ay be caused by spattering or volatilization. St. John and M idgley (6) found th a t controlled tem peratures tend to avoid volatilization of potassium due to localized overheating. T hey also noted insoluble residues from ashing plant materials w ith sulfuric acid, bu t usually none when using their acid digestion method.
In his 1940 R eport on Potash, Ford (3) showed th a t errors from “water-insoluble residues th a t are often encountered” should be corrected either by filtering the potassium solution before adding platinic chloride, or by .dissolving the weighed potassium platinic chloride w ith hot w ater and reweighing the dried crucible. In either case additional work is involved which increases the tim e of analysis.
In 1934 this laboratory experienced difficulty in obtaining accurate potash results by the official m ethod of th a t tim e when analyzing fertilizers containing little or no superphosphate and large am ounts of monoammonium phosphate. Since the ignition step was found to be th e m ain source of error in the analysis of mixtures of this type (2), a procedure was adopted which eliminated ignition by using a low -tem perature m ethod to remove interfering ammonium salts and organic m atter. T hus it was impossible to form insoluble m etasilicates or phosphates.
Changes in the A.O.A.C. m ethod were m ade in 1935, so th a t with proper m anipulation and corrections for insoluble residue it was possible to determine potassium in all types of fertilizer with a greater degree of accuracy. Although these changes included better ignition technique, the low-tem perature procedure as used in th is laboratory appeared to have certain advantages. Several im provem ents in th e m ethod have been m ade recently and analytical results compared w ith those obtained by ignition with sulfuric acid, using the same solution for both determ inations.
M E T H O D
R e a g e n t s (other th an used in A.O.A.C. m ethod). Concentrated sodium hydroxide solution, 30 grams of A.C.S. reagent sodium hydroxide per 100 ml. of solution. Sodium chlorate solution, 10 gram s of A.C.S. reagent sodium chlorate per 100 ml. of solution. 30% sulfuric acid, 20 ml. of sulfuric acid (A.C.S. reagent, 1.84 sp. gr.) in 80 ml. of water.
- M e t h o d 1 (for inorganic fertilizers). Place 5 grams of sample in a 250-ml. volum etric flask and add about 100 ml. of w ater and 50 ml. of sa tu ra ted ammonium oxalate solution. Boil 30 m inutes, cool, dilute to 250 ml., mix well, and filter or allow coarser particles to settle. P ipet a 100-ml. aliquot into a 500-ml. K jeldahl flask containing a few glass beads. (If m oisture content of the fertilizer perm its grinding fine enough to prevent separation of particles, weigh a 2-gram sam ple directly into the K jeldahl flask. Add about 75 ml. of w ater and 20 ml. of sa tu ra ted am monium oxalate solution. Boil 10 minutes.)
Add 3 or 4 drops of 1% phenolphthalein solution and 5 ml. of concentrated sodium hydroxide solution. Boil vigorously until dam p red litm us paper placed over m outh of flask shows_ no trace of blue color when le f | there several m inutes. The time required to expel amm onia is usually less than 15 minutes. If red color of phenolphthalein fades during boiling, add sufficient sodium hydroxide to restore.
Cool and transfer w ith thorough washing to a 200-ml. volumetric flask. D ilute to mark, mix well, and pass through a close-textured dry filter. D eterm ine K20 on a 25- or 50-rnl. aliquot by the platinic chloride method. T rea t precipitate in evaporating dish w ith about 15 ml. of 85% alcohol and 1 ml. of concentrated hydrochloric acid. Use rubber policeman to break up residue thoroughly before transferring to Gooch crucible. W ash as usual w ith alcohol and ammonium chloride solution, b u t use ten 10-ml. portions of ammonium chloride solution if a 50-ml. aliquot was taken. A djust suction during the ammonium chloride washing so th a t the je t from wash bottle or 10-ml. p ipet (enlarged tip opening) will about half fill the crucible and ag itate the precipitate w ith each washing.
M e t h o d 2 (for fertilizers containing urea, cyanamide, or other interfering organic m aterials). Prepare a 5-gram to 250-ml. fertilizer solution as in M ethod 1, b u t after boiling 30 m inutes add 2 ml. of concentrated amm onium hydroxide or sufficient to make alkaline. Cool, dilute to volume, mix well, and pass through a close-textured dry filter. Add 5 ml. of concentrated nitric acid to a 100-ml. aliquot in a 500-ml. K jeldahl flask and boil vigorously to a volume of about 10 ml. Add 5 ml. of sodium chlorate solution and 5 ml. of 30% sulfuric acid. (If sample is high in organic m atte r or urea, use 10 ml. of 30% sulfuric acid.)
Boil to dense sulfur trioxide fumes using low heat, then use high heat for 10 to 15 m inutes to destroy organic m atter. Cool 3 or 4 m inutes and wash down neck of flask w ith about 100 ml. of w ater. H ea t to obtain complete solution of residue. Add phenolphthalein and neutralize w ith concentrated sodium hydroxide solution. Add 2 ml. excess and boil to negative test for ammonia. Proceed as in M ethod 1.
D IS C U S S IO N
The use of a 5-gram sample in th is method ra ther than the official 2.5 gram s is based upon the study of K raybill and T hornton (o), who found th a t errors m ay result due to difficulty in weighing uniform 2.5-gram samples. The larger sample is taken in order to minimize such errors, usually caused by separation

384 I N D U S T R I A L A N D E N G I N E E R I N G C H E M I S T R Y Vol. 16, No. 6
Table I. Comparative K 2O A nalyses and Com position of Laboratory M ixtures
M ix tu re“
Calcula tedK , 0
H t S O iIgu itiou
K i O
NewM ethod
K s OC om position of
M ix ture% % % %
L -l 22 .2
Av.
22.1422.32
22.23
22 .1922 .23
22.21
20 KC1&20 K : S O i c 10 Superphosphate 25 ( N E L ) j S O .20 A m m o-Phos A
5 Bone meal1-2 22 .2
Av.
2 1 .93 d 22 .24
22.09
2 2 .17 22 .10
22 .14
20 KC1*20 K jSO ,“10 Superphosphate 10 A m m o-Phos A 10 C aC N j 10 U ram on 10 Fish meal 10 Bone meal
L-3 30 .4
Av.
30 .2830 .44
30 .36
3 0 .3530.30
30 .33
50 KC1»10 Superphosphate 20 (N lD iS O .10 A m m o-Phos A 10 T ankage
L-4 3 0 .4
Av.
30.3730.43
30 .40
30 .4230 .36
30 .39
50 KC1»10 Superphosphate- 20 (NHOiSOr 10 A m m o-Phos A 10 U ram on
L-5 30 .4
Av.
30 .183 0 .4 0
30 .29
30.413 0 .2 9
30 .35
50 KC1«20 Superphosphate 20 fNHi)sSOi 10 A m m o-Phos A
L-6 10.8 10.75 10.76 20 K j S O . c . r . / 40 NaNOa 40 ( N H . ) j SC L
° M aterials weighed on analy tica l balance. D uplicate analyses m ade on a second series of weighings.
t> T rona m uriate . A nalysis by th is labo ra to ry , 61.29% KaO. M anufactu re r’s analysis, 61.26% K 2O.
e Foreign potassium sulfate. Analysis by th is labo ra to ry , 49.70% KiO. M anufac tu re r's guaran tee , 49 .5% KsO.
Low resu lt probab ly caused by sp a tte r in g a t s ta r t of ign ition due to large am o u n t of organic m a tte r.
« T ro n a m uriate . Analysis b y th is lab o ra to ry , 60.80% KaO. M anufactu ré e s analysis, 60.81% KiO.
/ A naly tical reagen t, dried before using. Theoretical K jO , 54.05% .
------- T f r" --- ------------- --------------------
of coarse 1-mm. particles from the fines. M any fertilizers of low m oisture content, however, can be finely ground and have only traces of organic m a tte r from phosphates and by-product ammonium sulfate. Two gram s of such m aterial m ay be treated directly for amm onia rem oval by th e shortened procedure. The to ta l tim e from weighing a 2-gram sample to taking an aliquot for evaporation w ith platinic chloride is about 40 minutes.
The tim e of boiling a 5-gram sample w ith amm onium oxalate has been made to agree w ith th e A.O.A.C. period of 30 minutes, b u t it has been th e experience of this laboratory th a t 10 to 15 m inutes is sufficient for m ost types of fertilizer, especially when the composition of the sample is known or a finely ground 2-gram sample is used.
Although M ethod 1 does no t require addition of ammonium hydroxide a fter boiling w ith ammonium oxalate, th is m ay be done if the solution is to be used for a check analysis by sulfuric acid ignition. This does no t appreciably lengthen th e tim e of expelling ammonia from a 100-ml. aliquot.
Phenolphthalein indicator is no t destroyed or volatilized during the boiling period. Fading of color indicates a drop in pH and will occur only in exceptional cases where 5 ml. (1.5 grams) of sodium hydroxide are no t sufficient to react w ith all am monium salts present. I f it is desired to check the litm us tes t for complete removal of ammonia, phenolphthalein m ay be om itted and a portion of the final filtered solution trea ted w ith Nessler reagent.
The final solution of a fertilizer analyzed by M ethod 1 will contain a small am ount of sodium oxalate. In case the sample contains no soluble calcium the am ount of sodium oxalate in a 50-ml. aliquot taken for evaporation w ith platinic chloride will be approxim ately 0.24 gram . T his m ay be decomposed before precipitation of potassium platinic chloride by th e hypochlorite reaction, or preferably allowed to remain w ith the precipitate,
since th is am ount of sodium oxalate is easily removed by acid alcohol and amm onium chloride washing. Decomposition by sodium hypochlorite is accomplished by the addition of 3 to 4 ml. of pure 5% available chlorine solution to a 50-ml. aliquot in a porcelain dish. The solution is then m ade distinctly acid w ith concentrated hydrochloric (2 ml.) and evaporated for 10 minutes, a fter which the necessary am ount of platinic chloride is added.
The final solutions of organic fertilizers will no t contain oxalate since i t is destroyed by th e sulfuric acid trea tm en t of Method 2. In th is procedure sodium chlorate is used in addition to sulfuric acid in order to destroy o ther forms of organic m atte r , especially when present in large am ounts. N o a ttem p t was made to use perchloric acid because of the possible hazard of explosion.
Table I gives the com parative analyses and composition of six fertilizer m ixtures m ade in the laboratory, each containing known am ounts of K .O. Interfering m aterials such as calcium cyanam ide, urea, tankage, and fish m eal were used in amounts greater th an those ordinarily found in commercial fertilizers. One inorganic m ixture (L-6) which contained no calcium was included, so th a t the maximum am ount of sodium oxalate would be present.
In these particular mixes, w ith the exception of L -l, ignition w ith sulfuric acid according to th e A.O.A.C. technique produced only traces of insoluble residue. T he asbestos-padded Gooch crucibles were therefore no t washed ou t w ith ho t w ater and reweighed. T able I I gives com parative analyses on various types of local commercial fertilizers.
Table II. Comparative K jO A n a lyse s of Commercial FertilizersH jSO i Ig n itio n
k 2oN ew M ethod V ariation
Form ula KjO K jO% % %
7-20.5-17 18.07 18.02 - 0 . 0 57-20.5-17“ 16.48 16.49 + 0.017-20.5-171 17 .86 17.80 - 0 . 0 6
6-20-12 13 .32 13.31 - 0.018-12 . 6-6 5 .7 2 5 .77 + 0 .0 57-3.5-23 23 .01 23 .15 + 0 .1 46-15-10 9 .9 8 9 .91 - 0 .0 77-10-10 10.17 10.23 + 0 .0 67-11-10 10.48 10.50 + 0.028-9-11 10.68 10.59 - 0 . 0 97-12-7 7 .8 3 7 .7 9 - 0 .0 411-20-22 26.63 26 .61 - 0.02
a C ontain ing 252 pounds of bone m eal per ton. & C ontain ing 50 pounds of U ram on per ton.
S U M M A R Y
A method presented for the determination of potassium in mixed fertilizers involves the usual ammonium oxalate solution and chloroplatinic acid precipitation, but employs a rapid volatilization procedure for removal of ammonia, and an oxidizing method for destroying interfering organic compounds. This means of preparing a solution from which potassium may be precipitated makes it unnecessary to ignite a t a high temperature with sulfuric acid, which may result in the formation of insoluble residue or the loss of potassium by spattering or volatilization.
A large number of analyses by this method have been made on inorganic and organic fertilizers containing salts of known potassium content, and the results are in close agreement with the calculated values of these mixtures.
L IT E R A T U R E C ITED
(1) Assoc. Official Agr. Chem., Official and T entative M ethods olAnalysis, 5th ed. (1 9 4 0 ).
(2) Bible, C . M ., I n d . E n o . C h e m ., A n a l . E d ., 4 , 2 34 (1932).(3) Ford , O. W ., J . Assoc. Official Agr. Chem., 23 , 2 64 (1940).(4) K raybill, H . I t., and T hornton, S . F „ Ibid., 18, 263 (1935).(5) Ibid., 18, 2 7 4 (1935).(6 ) S t. John, J . L., and Midgley, M . C „ I n d . E n o . C h e m ,, A n a l . Ed.,
14, 3 0 1 -2 (1 942).
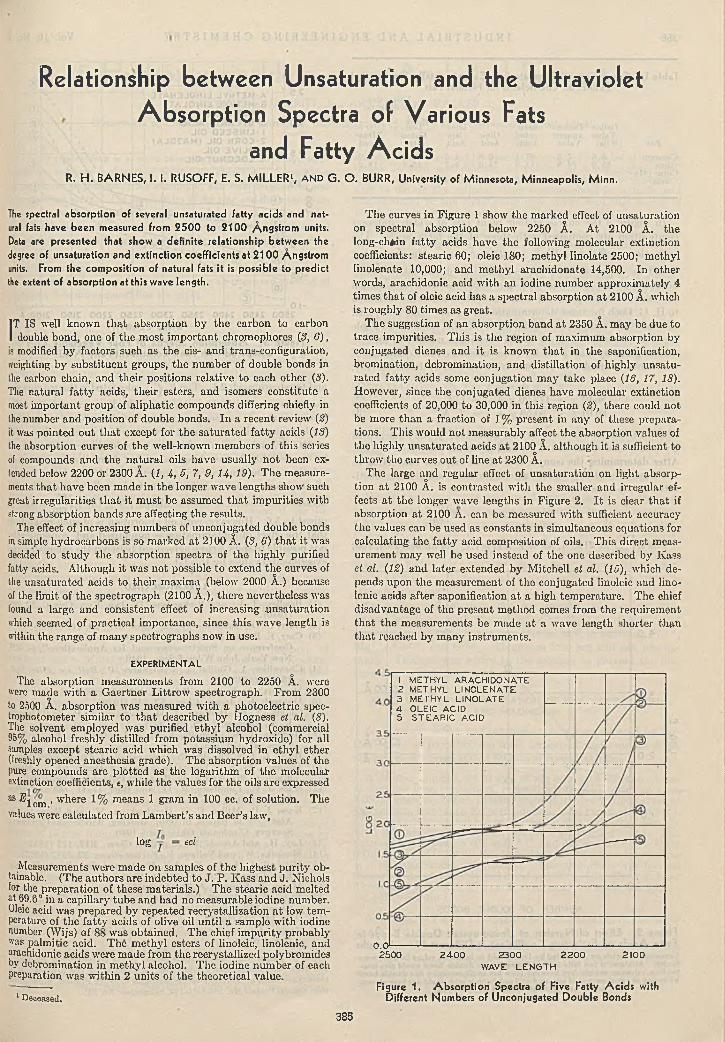
Relationship between Unsaturation and the Ultraviolet Absorption Spectra of Various Fats
and Fatty A c id sR. H . B A R N E S , I. I. R U S O F F , E. S. M IL L E R 1, A N D G . O . B U R R , University of Minnesota, M inneapolis, M inn.
The spectral absorption of several unsaturated fatty acids and natural fats have been measured from 2 5 0 0 to 2 1 0 0 Angstrom units. Data are presented that show a definite relationship between the degree of unsaturation and extinction coefficients at 2 1 0 0 Angstrom units. From the composition of natural fats it is possible to predict the extent of absorption at this wave length.
IT IS well known th a t absorption by the carbon to carbon double bond, one of the m ost im portan t chromophores (3, 6),
is modified by factors such as th e cis- and trans-configuration, weighting by substituen t groups, th e num ber of double bonds in the carbon chain, and the ir positions relative to each other (3). Tiie natural fa tty acids, their esters, and isomers constitute a most im portant group of aliphatic compounds differing chiefly in the number and position of double bonds. In a recent review' (2) it was pointed ou t th a t except for th e sa tu rated fa tty acids (13) the absorption curves of th e well-known mem bers of this series of compounds and the natu ra l oils have usually no t been extended below 2200 or 2300 Â. (1, 4, 5, 7, 9, 14, 19). T he m easurements th a t have been m ade in th e longer wave lengths show such great irregularities th a t it m ust bo assumed th a t im purities w ith strong absorption bands are affecting the results.
The effect of increasing num bers of unconjugated double bonds in simple hydrocarbons is so m arked a t 2100 Â. (3, 6) th a t it was decided to study the absorption spectra of th e highly purified fatty acids. A lthough it was no t possible to extend th e curves of the unsaturated acids to their m axima (below 2000 À.) because of the lim it of the spectrograph (2100 A .), there nevertheless was found a large and consistent effect of increasing unsaturation which seemed of practical im portance, since th is wave length is within the range of m any spectrographs now in use.
The curves in Figure 1 show the m arked effect of unsaturation on spectral absorption below 2250 A. A t 2100 A. the long-ch<wn fa tty acids have the following molecular extinction coefficients: stearic 60; oleic 180; m ethyl linolate 2500; m ethyl linolenate 10,000; and m ethyl arachidonate 14,500. In other words, arachidonic acid w ith an iodine num ber approxim ately 4 times th a t of oleic acid has a spectral absorption a t 2100 A. which is roughly 80 tim es as great.
T he suggestion of an absorption band a t 2350 A. may be due to trace im purities. T his is the region of maximum absorption by conjugated dienes and it is known th a t in th e saponification, brom ination, debrom ination, and distillation of highly unsaturated fa tty acids some conjugation m ay take place (16, 17, 18). However, since th e conjugated dienes have molecular extinction coefficients of 20,000 to 30,000 in th is region (2), there could not be more than a fraction of 1% present in any of these preparations. T his would no t m easurably affect the absorption values of the highly unsaturated acids a t 2100 A. although it is sufficient to throw the curves ou t of line a t 2300 A.
T he large and regular effect of unsaturation on light absorption a t 2100 A. is contrasted w ith the sm aller and irregular effects a t th e longer wave lengths in Figure 2. I t is clear th a t if absorption a t 2100 A. can be m easured w ith sufficient accuracy the values can be used as constants in sim ultaneous equations for calculating the fa tty acid composition of oils. This direct m easurem ent m ay well be used instead of the one described by Kaas et al. (12) and la te r extended by M itchell et al. (15), which depends upon th e m easurem ent of th e conjugated linoleic and lino- lenic acids after saponification a t a high tem perature. T he chief d isadvantage of th e present m ethod comes from th e requirem ent th a t the m easurem ents be m ade a t a wave length shorter than th a t reached by m any instrum ents.
E X P E R IM E N T A L
The absorption m easurem ents from 2100 to 2250 A. were were made w ith a G aertner L ittrow spectrograph. From 2300 to 2500 A. absorption was m easured w ith a photoelectric spectrophotometer sim ilar to th a t described by Hogness et al. (8). The solvent employed was purified ethy l alcohol (commercial 05% alcohol freshly distilled from potassium hydroxide) for all samples except stearic acid which was dissolved in ethy l ether (freshly opened anesthesia grade). The absorption values of the pure compounds are p lo tted as th e logarithm of th e molecular extinction coefficients, «, while the values for the oils are expressed
88 ^1 cm ’ w^ ere % means 1 gram in 100 cc. of solution. The values were calculated from L am bert’s and Beer’s law,
log eel
Measurements were m ade on samples of the highest pu rity obtainable. (The au thors are indebted to J . P . K ass and J . Nichols for the preparation of these m aterials.) T he stearic acid melted at 69.6° in a capillary tube and had no measurable iodine number. Oleic acid was prepared by repeated recrystallization a t low tem perature of the fa tty acids of olive oil un til a sample w ith iodine number (Wijs) of 88 was obtained. The chief im purity probably was palmitic acid. The m ethyl esters of linoleic, linolenic, and arachidonic acids were made from the recrystallized polybromides by debromination in m ethyl alcohol. The iodine num ber of each preparation was w ithin 2 units of the theoretical value.
1 Deceased.
1 M ETH YL A R A C H ID O N A TE2 M ETH YL L IN O L E N A T E3 M E T H Y L L IN O L A T E4 O L E IC A C ID5 S T E A R IC A C ID
O.O1 2500 2 4 0 0 2 300 2 2 0 0
WAVE L E N G T H2100
Figure 1. A b so rp tion Spectra of Five Fatty A c id s with Different Numbers of Unconjugated D ouble Bonds
385
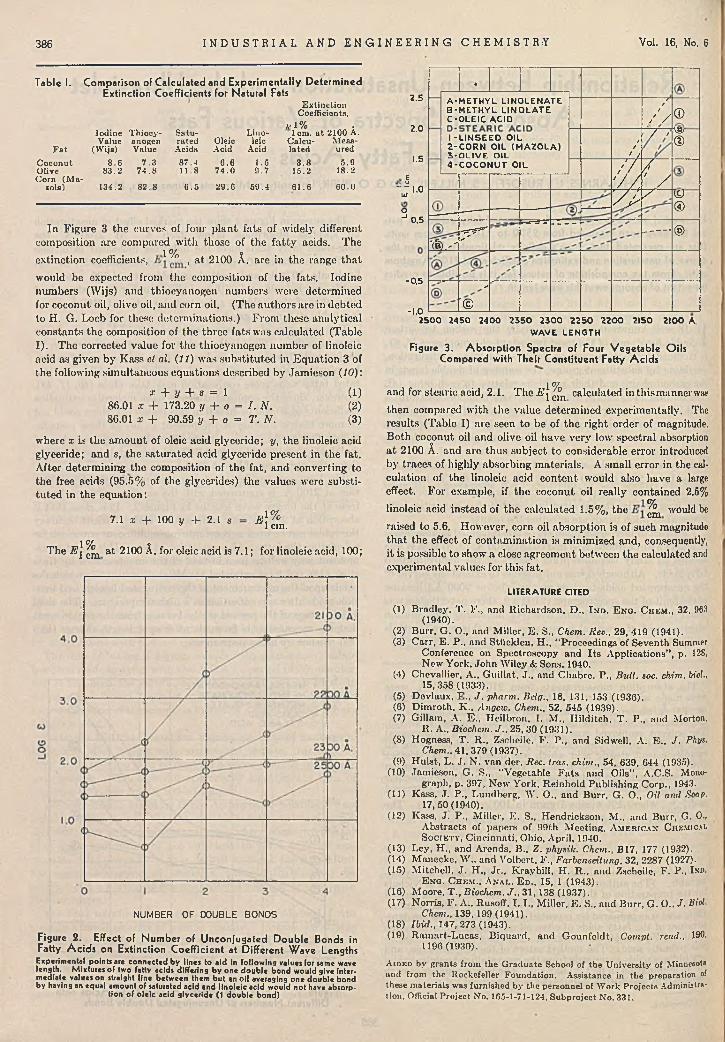
386 I N D U S T R I A L A N D E N G I N E E R I N G C H E M I S T R Y Vol. 16, No. 6
Table I. Comparison of Calculated and Experim entally Determined Extinction Coefficients for Natural Fats
E xtinctionCoefficients,
2 . 5
Iodine Thiocy- S a tu LinoA-1% .
1 cm. a t 2100 A. 2.0Value anogen ra ted Oleic leic C alcu M eas
F a t (W ij.) Value Acids Acid Acid la ted ured1.5C oconut 8 .6 7 .3 87.4 6 .6 1.5 3 .8 5 .9
Olive 83 .2 7 4 .8 11 .8 7 4 .0 9 .7 15.2 18.2Corn (M a 5
zd a ) 134.2 8 2 .8 6 .5 29 .6 5 9 .4 61 .6 60 .0 - 71.0Id
In Figure 3 the curves of four p lan t fats of widely different
0J 0.5
composition are compared w ith those of the fa tty acids. The 1% ?extinction coefficients, , a t 2100 A. are in the range th a t
would be expected from th e composition of the fats. Iodine numbers (Wijs) and tliiocyanogen num bers were determined for coconut oil, olive oil, and corn oil. (The authors are in debted to H. G. Loeb for these determ inations.) From these analytical constants the composition of the three fats was calculated (Table I). The corrected value for the tliiocyanogen num ber of linoleic acid as given by K ass cl al. (11) was substitu ted in E quation 3 of t he following sim ultaneous equations described by Jamieson (10):
x + y + s = 186.01 * + 173.20 y + o = I . N .86.01 x + 90.59 y + o = T. N .
(1)(2)(3 )
where x is the am ount of oleic acid glyceride; y, th e linoleic acid glyceride; and s, the sa turated acid glyceride present in the fat. After determ ining the composition of the fat, and converting to the free acids (95.5% of the glycerides) th e values were substitu ted in the equation:
7.1 x + 100 y -f- 2.1 s F} %1 cm.
The E I ^ a t 2100 Â. for oleic acid is 7.1 ; for linoleic acid, 100;
NUMBER OF 00U BLE BONDS
Figure 2. Effect of Num ber of Unconjugated Double Bonds in Fatty A c id s on Extinction Coefficient at Different W ave Lengths
Experimental points are connected b y lines to aid in Following values For same wave length. Mixtures of two fatty acids differing by one double bond would give Intermediate values on straight line between them but an oil averaging one double bond by having an equal amount of saturated acid and lino le ic acid would not have absorp
tion of o leic acid glyceride (1 double bond)
- 0 . 5
-1.0
•
A - M E T H V L l i n o l e n a t e B - M E T H Y L L I N O L A T E C - O L E I C A C I D
//
// /
/ /©
1 » 2 - V
L I N S E E D O I L C O R N O I L ( M A Z O L A ) O L I V E O I L
//
' /
/ 'W
©
4 - C O C O N U T O I L/ / /
' / / ‘ /
--------- V J sy ©
©
■ ( f ) . - '7 ^
r ^ i d T k
................ ®
s '
■ ©
2 5 0 0 245 0 240 0 2 3 5 0 2 3 0 0 2 2 5 0 2 2 0 0 2150 2100 A
W A V E L E N G T H
Figure 3. A bsorption Spectra of Four V egetable O ils Compared with Their Constituent Fatty A c id s
1%and for stearic acid, 2. 1. The i i j calculated in th is manner wars
then compared with the value determ ined experimentally. The results (Table I) are seen to be of the right order of magnitude. Both coconut oil and olive oil have very low spectral absorption a t 2100 A. and are thus subject to considerable error introduced by traces of highly absorbing m aterials. A small error in the calculation of the linoleic acid content would also have a large effect. For example, if the coconut oil really contained 2.5%
linoleic acid instead of the calculated 1.5%, the ^ would be
raised to 5.6, However, corn oil absorption is of such magnitude th a t the effect of contam ination is minimized and, consequently, it is possible to show a close agreem ent between the calculated and experimental values for this fat.
LITERATURE CITED
(1) Bradley, T . F., and R ichardson, D., I n d . E n o . C h e m ., 32, 903(1940).
(2) Burr, G. 0 ., and Miller, E . S., Chem. Rev., 29, 419 (1941).(3) Carr, E . P., and Sttlcklen, H., “Proceedings of Seventh Summer
Conference on Spectroscopy and I ts Applications", p. 128, New York, John Wiley & Sons, 1940.
(4) Chcvallier, A.. Guillat, J ., and Chabre, P., Bull. soc. chim. biol.,15, 358 (1933) .
(5) Devlaux, E ., J . pharm. Bclg., 18, 131, 153 (1936).(6) D im roth, K ., Angcw. Chem.. 52, 545 (1939).(7) Gillam, A. E ., Ileilbron, I. M., H ilditch, T . P., and Morton,
R. A., Biochcm. J ., 25, 30 (1931).(8) Hogness, T . R., Zscheile, F . P ., and Sidwell, A. E ., J . Phys.
Chem., 4 1 ,3 7 9 (1 9 3 7 ) .(9) H ulst, L. J . N. van der, Rex. trae. chim., 54, 639, 644 (1935).
(10) Jamieson, G. S., “Vegetable F a ts and Oils", A.C.S. Monograph, p. 397, New York, Reinhold Publishing Corp., 1943.
(11) Kass, J. P., Lundberg, W. O., and Burr, G. O., Oil anil Soap,17,50(1940).
(12) Kass, J. P., Miller, E. S., Hendrickson, M., and Burr, G. 0.,A bstracts of papers of 99th Meeting, A m e r i c a n C h e m i c a l S o c i e t y , C incinnati, Ohio, April, 1940.
(13) Ley, H., and Arends, B„ Z. physik. Chem., B 17, 177 (1932).(14) Manecke, W „ and Volbert, F ., Farbenseituno, 32 , 2287 (1927)'(15) Mitchell, J . H., Jr., K raybill, H. R ., and Zscheile, F . P., Iso.
E n o . C h e m ., A n a l . E d ., 15, 1 (1943).(16) Moore, T ., Biochcm. J ., 31, 138 (1937).(17) Norris, F . A., Rusoff, 1.1., Miller, E. S., and Burr, G. 0 ., J . Bid.
Chem., 139, 199(1941).(18) Ibid., 147,273(1943).(19) Rnmart-Lucns, Biquard, and Gounfoldt, Compt. rend., 190'
1196(1930).
A ided by g ran ts from th e G rad u a te School of th e U n iversity of Minnesot* and from the Rockefeller F o unda tion . A ssistance in the preparation of these m ateria ls was furn ished by the personnel of W ork P ro jec ts Administr»- tion. Official P ro jec t No. 165-1-71-124, Subpro ject No. 331.
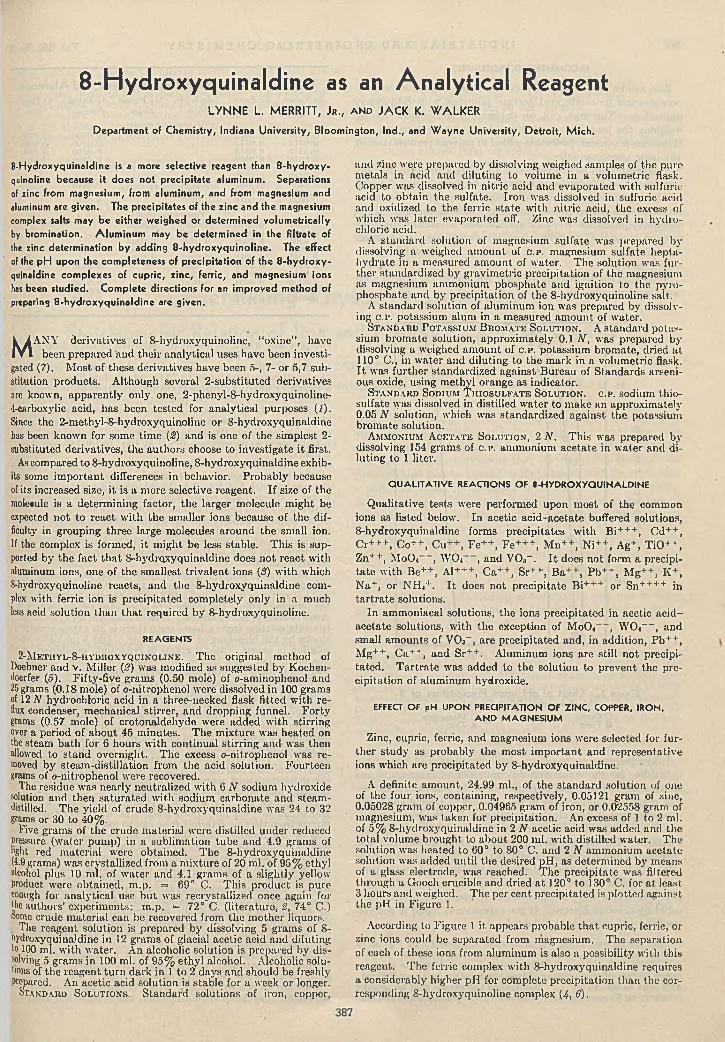
8-Hydroxyquinaldine as an Analytical ReagentL Y N N E L . M E R R IT T , J r ., a n d J A C K K. W A L K E R
Department of Chemistry, Indiana University, Bloomington, Ind., and W ayne University, Detroit, M ich.
8-Hydroxyquinaldine is a more selective reagent than 8-hydroxy- quinoline because it does not precipitate aluminum. Separations of zinc from magnesium, from aluminum, and from magnesium and aluminum are given. The precipitates of the zinc and the magnesium complex salts may be either weighed or determined volumetrically by bromination. Alum inum may be determined in the filtrate of the zinc determination by adding 8-hydroxyquinoline. The effect of the p H upon the completeness of precipitation of the 8-hydroxy- quinaldine complexes of cupric, zinc, ferric, and magnesium ions has been studied. Complete directions for an improved method of preparing 8-hydroxyquinaldine are given.
M ANY derivatives of S-hydroxyquinoline, “ oxine” , have been p repared ‘and their analytical uses have been investi
gated (7). M ost of these derivatives have been 5-, 7- or 5,7 substitution products. Although several 2-substituted derivatives are known, apparently only one, 2-phenyl-S-hydroxyquinoline-4-carboxylic acid, has been tested for analytical purposes (1). Since the 2-m ethyl-8-hydroxyquinoline or 8-hydroxyquinaldine has been known for some tim e (2) and is one of the simplest 2- substituted derivatives, the authors choose to investigate it first.
As compared to 8-hydroxyquinoline, 8-hydroxyquinaldine exhibits some im portan t differences in behavior. Probably because of its increased size, it is a more selective reagent. I f size of the moleeule is a determ ining factor, the larger molecule m ight be expected no t to react w ith the smaller ions because of the difficulty in grouping three; large molecules around the small ion. If the complex is formed, it m ight be less stable. T his is supported by the fact th a t 8-hydrQxyquinaldine does no t react with aluminum ions, one of the sm allest trivalent ions (3) w ith which 8-hydroxyquinoline reacts, and the 8-hydroxyquinaldine complex with ferric ion is precipitated completely only in a much less acid solution than th a t required by 8-hydroxyquinoline.
REAGENTS
2-M e t h y l -8 - i iy d r o x y q u i n o l in e . T he original method of Doebner and v. M iller (2) was modified as suggested by Kochen- (loerfer (o). Fifty-five grams (0.50 mole) of o-aminophenol and 25 grains (0.18 mole) of o-nitrophenol were dissolved in 100 grams of 12 JV hydrochloric acid in a three-necked flask fitted w ith reflux condenser, mechanical stirrer, and dropping funnel. Forty grams (0.57 mole) of crotonaldehyde were added w ith stirring over a period of about 45 m inutes. T he m ixture was heated on the steam bath for 6 hours w ith continual stirring and was then allowed to stand overnight. T he excess o-nitrophenol was removed by steam -distillation from the acid solution. Fourteen grams of o-nitrophenol were recovered.
The residue was nearly neutralized w ith 6 N sodium hydroxide solution and then sa turated with sodium carbonate and steam- distilled. T he yield of crude 8-hydroxyquinaldine was 24 to 32 grams or 30 to 40%.
Five gram s of the crude m aterial were distilled under reduced pressure (w ater pum p) in a sublim ation tube and 4.9 gram s of light red m aterial were obtained. T he 8-hydroxyquinaldine (4.9 grams) was crystallized from a m ixture of 20 ml. of 95% ethyl alcohol plus 10 ml. of w ater and 4.1 gram s of a slightly yellow product were obtained, m .p. = 69° C. T his product is pure enough for analytical use b u t was recrystallized once again for •he authors’ experim ents: m .p. = 72° C. (literature, 2, 74° C.) Some crude m aterial can be recovered from the m other liquors.
The reagent solution is prepared by dissolving 5 grams of 8- nydroxyquinaldine in 12 gram s of glacial acetic acid and diluting In 100 ml. w ith w ater. An alcoholic solution is prepared by dissolving 5 gram s in 100 ml. of 95% ethy l alcohol. Alcoholic solutions of the reagent tu rn dark in 1 to 2 days and should be freshly Prepared. An acetic acid solution is stable for a week or longer.
St a n d a r d S o l u t i o n s . S t a n d a r d s o lu t io n s o f i r o n , c o p p e r ,
and zinc were prepared by dissolving weighed samples of the pure metals in acid and diluting to volume in a volum etric flask. Copper was dissolved in nitric acid and evaporated w ith sulfuric acid to obtain the sulfate. Iron was dissolved in sulfuric acid and oxidized to the ferric sta te w ith nitric acid, the excess of which was la ter evaporated off. Zinc was dissolved in hydrochloric acid.
A standard solution of magnesium sulfate was prepared by dissolving a weighed am ount of c . p . magnesium sulfate hepta- hydrate in a measured am ount of water. The solution was further standardized by gravim etric precipitation of the magnesium as magnesium amm onium phosphate and ignition to the pyrophosphate and by precipitation of the 8-hydroxyquinoline salt.
A standard solution of alum inum ion was prepared by dissolving c.p. potassium alum in a m easured am ount of water.
S t a n d a r d P o t a s s iu m B r o m a t e S o l u t i o n . A standard potassium brom ate solution, approxim ately 0.1 A , was prepared by dissolving a weighed am ount of c . p . potassium brom ate, dried a t 110° C., in w ater and diluting to the m ark in a volum etric flask. I t was further standardized against B ureau of S tandards arseni- ous oxide, using m ethyl orange as indicator.
S t a n d a r d S o d iu m T h i o s u l k a t e S o l u t i o n , c . p . s o d iu m th io - s u l f a t e w a s d is s o lv e d in d i s t i l l e d w a t e r to m a k e a n a p p r o x im a te ly 0.05 N s o lu t io n , w h ic h w a s s t a n d a r d i z e d a g a i n s t t h e p o ta s s iu m b r o m a t e s o lu t io n .
A m m o n iu m A c e t a t e S o l u t i o n , 2 N . T his w a s p r e p a r e d b y d is s o lv in g 154 g r a m s o f c .p . a m m o n iu m a c e t a t e in w a t e r a n d d i l u t i n g t o 1 l i t e r .
Q UALITATIVE REACTIONS OF 8-HyDROXyQUINALDINE
Q ualitative tests were performed upon m ost of the common ions as listed below. In acetic ac id -acetate buffered solutions, 8-hydroxyquinaldine forms precipitates w ith B i+++, C d++, C r+++, Co++, C u++, Fe++, F e+++, M n++, N i++, Ag+, T iO ++, Zn++, MoO( , WO( , and VOa" . I t does not form a precipita te w ith Be++, A1+++, C a++, Sr++, B a++, P b ++, M g++, K \ N a+, or N H (+. I t does not precip itate B i+++ or Sn++++ in ta r tra te solutions.
In am m oniacal solutions, the ious precipitated in acetic ac id - acetate solutions, w ith the exception of MoO< , WO<— , and small am ounts of V 03- , are precipitated and, in addition, P b ++, M g++, C a++, and S r+ + . Aluminum ions are still no t precipita ted . T a rtra te was added to the solution to prevent the precipitation of aluminum hydroxide.
EFFECT OF pH UPON PRECIPITATION OF ZINC, COPPER, IRON, AN D MAGNESIUM
Zinc, cupric, ferric, and magnesium ions were selected for further study as probably the m ost im portan t and representative ions which are precipitated by 8-hydroxyquinaldine.
A definite am ount, 24.99 ml., of the standard solution of one of the four ions, containing, respectively, 0.05121 gram of zinc, 0.05028 gram of copper, 0.04965 gram of iron, or 0.02558 gram of magnesium, was taken for precipitation. An excess of 1 to 2 ml. of 5% 8-hydroxyquinaldine in 2 N acetic acid was added and the to tal volume brought to about 200 ml. w ith distilled w ater. T he solution was heated to 60° to 80° C. and 2 N ammonium acetate solution was added until the desired pH, as determ ined by means of a glass electrode, was reached. T he precipitate was filtered through a Gooch crucible and dried a t 120° to 130° C. for a t least 3 hours and weighed. The per cent precipitated is plotted against the pH in Figure 1.
According to Figure 1 it appears probable th a t cupric, ferric, or zinc ions could be separated from magnesium. The separation of each of these ioas from alum inum is also a possibility w ith th is reagent. T he ferric complex w ith 8-hydroxyquinaldine requires a considerably higher pH for complete precipitation than the corresponding 8-hydroxyquinoline complex (4, 6).

R E C O M M E N D E D P R O C E D U R E S
Zinc can be separated from alum inum and magnesium ions by precipitation in acetic ac id -aceta te solutions w ith S-hydroxy- quinaldine. The zinc can be determ ined gravim etrically by weighing the precip itate or volum etrically by brom ination. If aluminum is present, ta r tra te is added to p revent precipitation of any basic alum inum salts.
Magnesium can be determ ined in the filtrate from the zinc determ ination, if no alum inum is present, by raising the pH to 9.3 or higher. W hen ta r tra te s and a high concentration of ammonium salts are present (when alum inum is present) the magnesium- 8-hydroxyquinaldine complex precip itates so slowly th a t the m ethod is useless. Calcium ions interfere in the magnesium determ ination in am ounts over 2 or 3 mg. and should be previously removed.
Aluminum can be determ ined after removal of the zinc by adding 8-hydroxyquinoline.
388 I N D U S T R I A L A N D E N
3 4 - 5 6 7 8 9
pH.
figu re 1. Effect of p H upon Precipitation of 8- H ydroxyquinaldine Com plexes
O Cupric A M «gn«lum• Fcn lc A Z in c
I t is advantageous to use an alcoholic solution of 8-hydroxyquinaldine for th e volum etric determ ination of magnesium and an alcoholic solution m ay be employed in the zinc determ ination. T he reagent is more soluble in the presence of alcohol and is not coprecipitated in th e alkaline solutions. N o trouble is experienced in th e gravim etric determ inations and when using acid solutions. T he coprccipitated reagent is volatile a t 130° C. The magnesium and zinc salts are soluble in ho t 95% alcohol and the solubility in w ater is undoubtedly slightly increased by the presence of alcohol; therefore only the required am ount of reagent should be employed. T he presence of an excess of reagent is indicated by a yellow filtrate. I f the supernatan t liquid is no t yellow, more reagent should be added.
P r o c e d u r e f o r Z i n c . I f alum inum is present add 1 gram of amm onium ta r tra te to th e clear, slightly acid solution. Add 2 ml. of 5% 8-hydroxyquinaldine solution in 2 N acetic acid for every 10 mg. of zinc present, dilute the solution to about 200 ml., and heat to 60° to 80° C. N eutralize the excess acid by adding d ilu te (1 to 5) ammonium hydroxide drop by drop until th e zinc
I N E E R I N G C H E M I S T R Y Vol. 16, No. 6
Tabic 1. Determination of Z in c , Magnesium, and AluminumZn T aken Zn Found M r T aken M g Found A1 T aken Al Found
Gram Gram Gram Gram Gram GramG ravim etric results
0 .0512 0.0515 0.0500 0.05000.0512 0.0512 0.0500 0.05000.0510 0.0513 0.0100 0.01000 .0510 0.0509 0.0100 0.01030.0510 0.0513 0.0287 0.02850 .0510 0.0513 0.0115 0 .01120 .0205 0.0202 0.0115 0.Ó24S0.0109 0.0103 0.0115 0.02480.0020 0.0018 0.0287 0.0250
V olum etric results0 .0512 0 .0510 0.0256 0.02560.0512 0.0516 0.0287 0.02860.0205 0 .0208 0.0256 0.02540.0040 0 .0044 0.0287 0.02860.0040 0.0042 0.0287 0.02860.0510 0 .0518 0.0287 0ÍÓ2500.0510 0.0507 0.0287 0.02500.0206 0.0204 0.0287 0 .02500.0010 0.0013 0.0287 0.01000.0010 0.0013 0.0287 0.0100
complex salt which forms on the addition of each drop just redissolves on stirring. Add 45 ml. of 2 N ammonium acetate slowly and w ith stirring. T h q jjH should be a t least 5.5. Allow the solution to stand for 10 to 20 m inutes before filtering through a Gooch or filtering crucible if the precipitate is to be weighed or through a filter paper if the precipitate is to be determ ined volumetrically. If the am ount of zinc is low and the amount of alum inum and magnesium is high, allow the solution to stand several hours before filtering. W ash well w ith ho t w ater. If the precipitate is to be weighed, dry i t a t 130° to 140° C. for a t least 2 hours.
To determ ine the zinc volum etrically, dissolve the washed precipitate w ith 30 ml. of ho t 1 to 2 hydrochloric acid and wash thoroughly w ith ho t 1 to 3 hydrochloric acid and then with hot water. M oisten The paper w ith a few drops of concentrated hydrochloric acid before the final two washings w ith w ater in order to ensure the complete solution and rem oval of all zinc complex salt. If the am ount of zinc is small and the am ount of aluminum and magnesium is large, reprecipitate th e zinc as described above. Use only 1 to 2 ml. of the 8-hydroxyquinaldine reagent for the reprecipitation.
Dissolve the second precipitate in 30 ml. of ho t 1 to 3 hydrochloric acid, wash the paper thoroughly w ith hydrochloric acid and ho t w ater as before, and add 3 gram s of potassium bromide to the filtrate. D ilute the solution to about 150 ml. and add a few drops of m ethyl red indicator. R un in standard 0.1 N potassium brom ate solution from a b u re t until there is an excess present as shown by the bleaching of the indicator. Add 5 ml. of bromate solution in excess. Add 3 gram s of potassium iodide, stir until dissolved, and back-titra te w ith standard sodium thiosulfate solution using a 2 % starch solution as indicator.
If no alum inum is present and no ta r tra te has been added, the proper pH for the precipitation of zinc can be atta ined by adding dilute amm onium hydroxide until a white precip itate of zinc hydroxide appears. Redissolve the zinc hydroxide w ith a drop of acetic acid. Add 2 ml. of the acetic acid solution of 8-hydroxyquinaldine for each 10 mg. of zinc present and then 2 to 3 drops of concentrated amm onium hydroxide. T he pH should be at least 5.5. This procedure eliminates the high concentration of amm onium salts and m akes it easier to reach the required pH for the precipitation of magnesium. I f am m onium acetate is used, the least am ount possible should be added.
P r o c e d u r e f o r M a g n e s iu m . If alum inum was no t present and ta rtra te s were no t added when zinc was precipitated, the filtrate from the zinc determ ination can be used for the determination of magnesium. Add 3 ml. of acetic acid solution of 8- hydroxyquinaldine for every 10 mg. of magnesium present (if the determ ination is to be carried ou t volum etrically, use an alcoholic solution of the reagent) and add concentrated ammonium hydroxide until the pH is a t least 9.3 or until no further precipitate forms. D igest the solution a t 60° to 80° C. for 20 minutes and filter through a Gooch or filtering crucible if the magnesium is to be determ ined gravim etrically or through a paper filter if the determ ination is to be completed volum etrically. Wash with hot w ater, d ry the precipitate a t 130° to 140° C., and weigh for a gravim etric determ ination.
T he precipitate m ay be dissolved in hydrochloric acid and titra ted w ith potassium brom ate according to the procedure outlined above for th e volum etric determ ination of zinc.
P r o c e d u r e f o r A l u m i n u m . A fter the zinc has been rem o v ed , alum inum m ay be precip itated from the filtrate by adding 8-
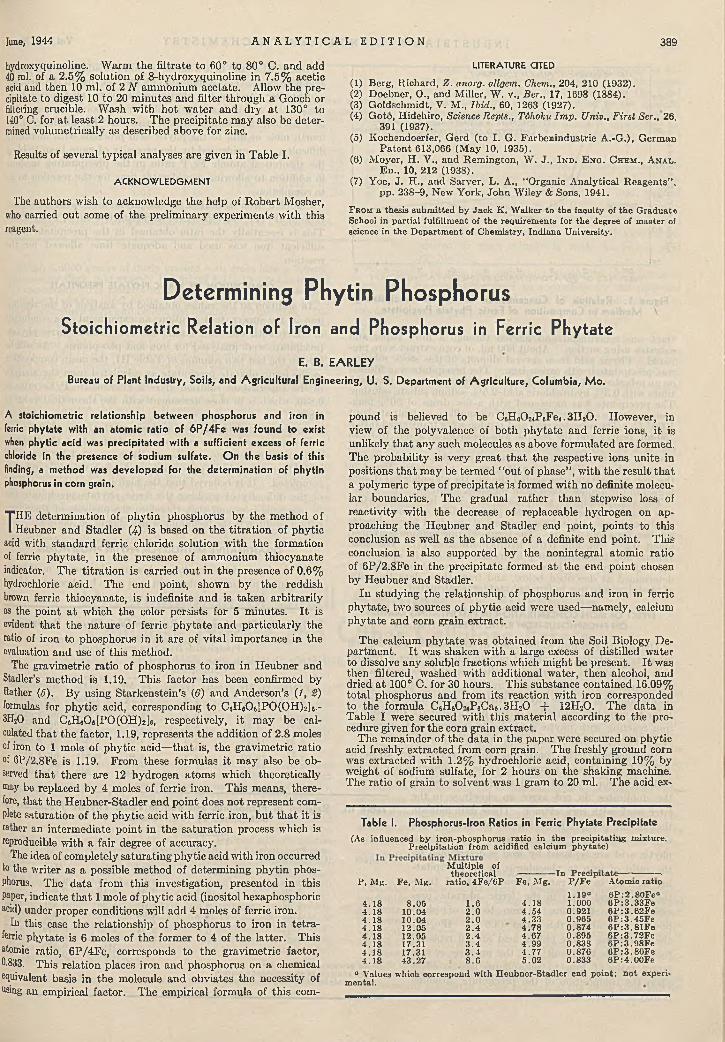
lune, 1944 A N A L Y T I C A L E D I T I O N 389
hydroxyquinoiine. W arm the filtra te to 60° to 80° C. and add 40 ml. of a 2.5% solution of 8-hydroxyquinoline in 7.5% acetic acid and then 10 ml. of 2 N amm onium acetate. Allow th e precipitate to digest 10 to 20 m inutes and filter through a Gooch or filtering crucible. W ash w ith ho t w ater and dry a t 130° to 140° C. for a t least 2 hours. T he precip itate m ay also be determined volum etrically as described above for zinc.
Results of several typical analyses are given in T able I.
A C K N O W L E D G M E N T
The authors wish to acknowledge the help of R obert Mosher, who carried ou t some of the prelim inary experiments w ith this reagent.
L IT E R A T U R E C IT ED
(1) Berg, itichard, Z. anorg. allgem. Chem., 204, 210 (1932).(2) Doebner, O., and Miller, W. v., Ber., 17, 1698 (1884).(3) Goldschmidt, V. M., Ibid., 60, 1263 (1927).(4) Goto, Hidehiro, Science Repts., Tdhoku Im p. Univ., First Ser., 26,
391 (1937).(5) Kochendoerfer, Gerd (to I. G. Farbenindustrie A.-G.), German
Patent 613,066 (May 10, 1935).(6) Moyer, H. V., and Remington, W. J., I n d . E n g . C h e m ., A n a l .
E d ., 10, 212 (1938).(7) Yoe, J. H., and Sarver, L. A., "Organic Analytical Reagents” ,
pp. 238-9, New York, John \Yiley & Sons, 1941.
F rom a thesis su b m itted b y Jac k K . W alker to the facu lty of th e G rad u a te School in p a rtia l fulfillm ent of th e requ irem ents for th e degree of m aster of science in th e D ep artm en t of C hem istry , In d ian a U niversity .
Determining Phytin PhosphorusStoichiom etric Relation of Iron and Phosphorus in Ferric Phytate
E. B. E A R L E Y
Bureau of Plant Industry, Soils, and A gricultural Engineering, U. S. Department of A griculture, Colum bia, M o.
A stoichiometric relationship between phosphorus and iron in ferric phytate with an atomic ratio of 6 P /4 F e was found to exist when phytic acid was precipitated with a sufficient excess of ferric chloride in the presence of sodium sulfate. O n the basis of this finding, a method was developed for the determination of phytin phosphorus in corn grain.
T HE determ ination of phytin phosphorus by th e m ethod of Heubner and Stadler (4) is based on th e titra tio n of phytic
acid with standard ferric chloride solution w ith the formation of ferric phytate , in the presence of am m onium thiocyanate indicator. The titra tion is carried ou t in th e presence of 0.6% hydrochloric acid. T he end point, shown by the reddish brown ferric thiocyanate, is indefinite and is taken arbitrarily as the point a t which the color persists for 5 minutes. I t is evident th a t the nature of ferric phy ta te and particularly the ratio of iron to phosphorus in i t are of v ital im portance in the evaluation and use of this method.
The gravimetric ratio of phosphorus to iron in H eubner and Stadler’s m ethod is 1.19. This factor has been confirmed by Rather (5). By using Starkenstein 's (6') and Anderson’s (1, S) formulas for phytic acid, corresponding to CjHjOsIPO (OH)2]6.- 3H20 and CsHjOj [PO (OH)2 ]n, respectively, i t m ay be calculated th a t the factor, 1.19, represents the addition of 2.8 moles of iron to 1 mole of phytic acid— th a t is, the gravim etric ratio of 6P/2.8Fe is 1.19. From these formulas i t m ay also be observed th a t there are 12 hydrogen atom s which theoretically ewiy bo replaced by 4 moles of ferric iron. This means, therefore, tha t the H eubner-Stadler end point does no t represent complete saturation of the phytic acid w ith ferric iron, b u t th a t i t is rather an interm ediate point in th e saturation process which is reproducible w ith a fair degree of accuracy.
The idea of completely saturating phytic acid w ith iron occurred to the writer as a possible m ethod of determ ining phy tin phosphorus. The d a ta from th is investigation, presented in this Paper, indicate th a t 1 mole of phytic acid (inositol hexaphosphoric acid) under proper conditions will add 4 moles of ferric iron.
In this case th e relationship of phosphorus to iron in te tra- ferrie phytate is 6 moles of the former to 4 of the la tte r. This atomic ratio, 6P /4Fe, corresponds to the gravim etric factor, 0-833. This relation places iron and phosphorus on a chemical equivalent basis in the molecule and obviates the necessity of ^ing an empirical factor. The empirical formula of th is com
pound is believed to be CoHeCkiPcFe« ■ 3 II20 . However, in view of the polyvalence of both p hy ta te and ferric ions, i t is unlikely th a t any such molecules as above form ulated are formed. T he probability is very great th a t the respective ions unite in positions th a t m ay be term ed “ ou t of phase” , w ith the result th a t a polymeric type of precipitate is formed w ith no definite molecular boundaries. T he gradual ra ther th an stepwise loss of reactiv ity w ith th e decrease of replaceable hydrogen on approaching the H eubner and Stadler end point, points to this conclusion as well as th e absence of a definite end point. This conclusion is also supported by the nonintegral atom ic ratio of 6P / 2.8Fe in th e precipitate formed a t the end point chosen by H eubner and Stadler.
In studying the relationship of phosphorus and iron in ferric phytate , two sources of phytic acid were used—namely, calcium phy ta te and corn grain extract.
The calcium phy ta te was obtained from the Soil Biology D epartm ent. I t was shaken w ith a large excess of distilled w ater to dissolve any soluble fractions which m ight be present. I t was then filtered, washed w ith additional w ater, then alcohol, and dried a t 100° C. for 30 hours. This substance contained 16.09% to ta l phosphorus and from its reaction w ith iron corresponded to the formula CeHcO-iPeCaB. 3H 20 + 12H20 . T he da ta in Table I were secured w ith this m aterial according to the procedure given for the corn grain extract.
The rem ainder of the da ta in the paper were secured on phytic acid freshly extracted from corn grain. T he freshly ground corn was extracted w ith 1.2 % hydrochloric acid, containing 10% by weight of sodium sulfate, for 2 hours on the shaking machine. The ratio of grain to solvent was 1 gram to 20 ml. T he acid ex-
Table I. Phosphorus-Iron Ratios in Ferric Phytate Precipitate(As influenced b y iron-phosphorus ra tio in th e p rec ip ita tin g m ixture.
P rec ip ita tio n from acidified calcium p h y ta te )
M ultip le oftheore tical - In P rec ip ita te ---------------.
P , M g. F e , M g. ra tio , 4 F e /6 P Fe, M g. P /F e Atom io ra tio1 .19° 6 P :2 .S 0 F e °
4 .1 8 8 .0 5 1 .6 4 .1 8 1.000 6 P :3 .3 3 F e4 .1 8 10.04 2 .0 4 .54 0.921 6 P :3 .6 2 F e4 .1 8 10.04 2 .0 4 .3 3 0.965 C P :3 .4 5 F e4 .1 8 12.05 2 .4 4 .7 8 0.874 6 P :3 .8 1 F e4 .1 8 12.05 2 .4 4 .67 0.895 6 P :3 .7 2 F e4 .1 8 17.31 3 .4 4 .9 9 0 .838 6 P :3 .9 8 F e4 .1 8 17.31 3 .4 4 .7 7 0 .870 6 P :3 .8 0 F e4 .1 8 43 .27 8 .6 5 .02 0.833 6 P :4 .0 0 F e
“ V alues w hich correspond w ith H eu b n er-S tad le r end p o in t; n o t ex p ertm ental. ,
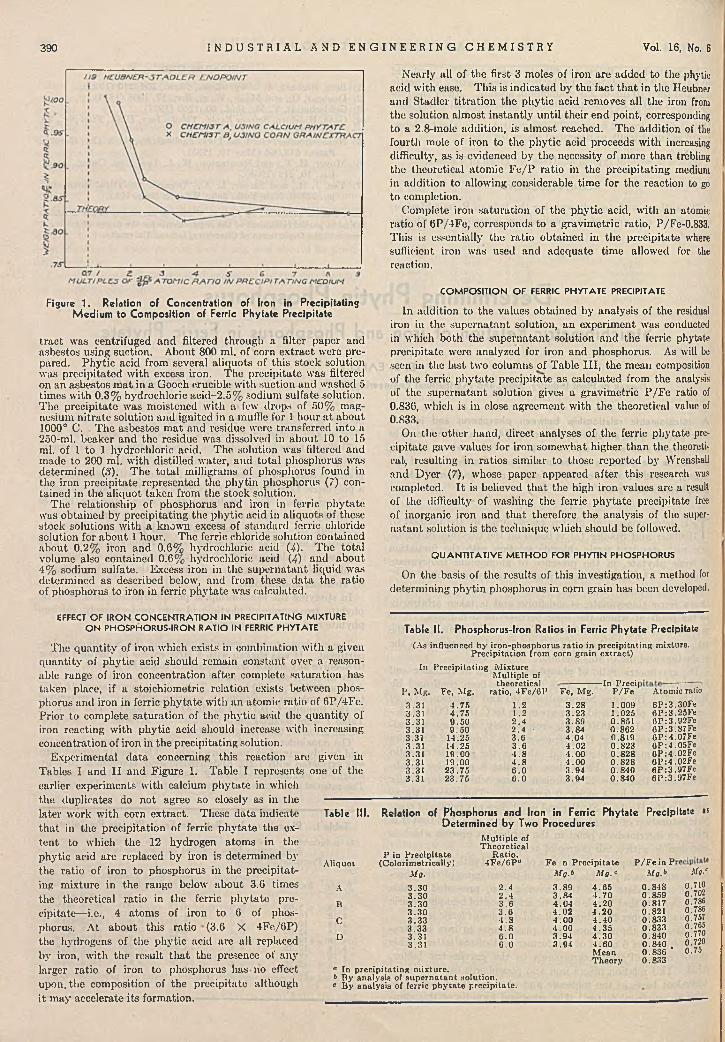
390 I N D U S T R I A L A N D E N G I N E E R I N G C H E M I S T R Y Vol. 16, No. 6
Figure 1. Relation of Concentration of Iron in Precipitating M edium to Composition of Ferric Phytate Precipitate
tra c t was centrifuged and filtered through a filter paper and asbestos using suction. A bout 800 ml. of corn ex tract were prepared. Phytic acid from several aliquots of this stock solution was precipitated w ith excess iron. The precipitate was filtered on an asbestos m at in a Gooch crucible with suction and washed 5 times w ith 0.3% hydrochloric acid-2 .5% sodium sulfate solution. The precipitate was moistened w ith a few drops of 50% magnesium n itra te solution and ignited in a muffle for 1 hour a t about 1000° C. T he asbestos m at and residue were transferred into a 250-ml. beaker and the residue was dissolved in about 10 to 15 ml. of 1 to 1 hydrochloric acid. The solution was filtered and m ade to 200 ml. w ith distilled w ater, and to ta l phosphorus was determ ined (S). T he to ta l milligrams of phosphorus found in the iron precipitate represented the phytin phosphorus (7) contained in the aliquot taken from the stock solution.
The relationship of phosphorus and iron in ferric phytate was obtained by precipitating the phytic acid in aliquots of these stock solutions w ith a known excess of standard ferric chloride solution for about 1 hour. The ferric chloride solution contained about 0.2% iron and 0.6% hydrochloric acid (4). The total volume also contained 0 .6% hydrochloric acid (4) and about 4% sodium sulfate. Excess iron in the supernatan t liquid was determ ined as described below, and from these data the ratio of phosphorus to iron in ferric phy ta te was calculated.
Nearly all of the first 3 moles of iron are added to the phytic acid with ease. T his is indicated by the fact th a t in the Ileubner and Stadler titra tion the phytic acid removes all the iron from the solution alm ost instantly un til their end point, corresponding to a 2.8-mole addition, is alm ost reached. The addition of the fourth mole of iron to the phytic acid proceeds w ith increasing difficulty, as is evidenced by the necessity of more than trebling the theoretical atom ic F e /P ratio in the precipitating medium in addition to allowing considerable tim e for the reaction to go to completion.
Gomplete iron saturation of the phytic acid, w ith an atomic ratio of 6P /4Fe, corresponds to a gravim etric ratio, P/Fe-0.833, This is essentially the ratio obtained in the precipitate where sufficient iron was used and adequate tim e allowed for the reaction.
COMPOSITION OF FERRIC PHYTATE PRECIPITATE
In addition to the values obtained by analysis of the residual iron in the supernatan t solution, an experim ent was conducted in which both the supernatan t solution and the ferric phytate precipitate were analyzed for iron and phosphorus. As will be seen in the last two columns of Table I I I , the mean composition of the ferric p hy ta te precipitate as calculated from the analysis of the supernatan t solution gives a gravim etric P /F e ratio of 0.836, which is in close agreem ent with the theoretical value of 0.833.
On the other hand, direct analyses of the ferric phytate precipitate gave values for iron som ewhat higher than the theoretical, resulting in ratios similar to those reported by Wrenshall and D yer (7), whose paper appeared after this research was completed. I t is believed th a t the high iron values are a result of the difficulty of washing the ferric p hy ta te precipitate free of inorganic iron and th a t therefore the analysis of the supern a tan t solution is the technique which should be followed.
QUANTITATIVE METHOD FOR PHYTIN PHOSPHORUS
On the basis of the results of this investigation, a method for determ ining phytin phosphorus in com grain has been developed.
EFFECT OF IRON CONCENTRATION IN PRECIPITATING MIXTURE ON PHOSPHORUS-IRON RATIO IN FERRIC PHYTATE
The quantity of iron which exists in combination w ith a given quantity of phytic acid should remain constant over a reasonable range of iron concentration after complete saturation has taken place, if a stoichiometric relation exists between phosphorus and iron in ferric phy ta te w ith an atom ic ratio of 6P/4Fe. Prior to complete saturation of the phytic acid the q u an tity of iron reacting w ith phytic acid should increase w ith increasing concentration of iron in the precipitating solution.
Experim ental data concerning this reaction are given in Tables I and II and Figure 1. Table I represents one of the earlier experiments with calcium phytate in which the duplicates do no t agree so closely as in the later work w ith corn extract. These data indicate th a t in the precipitation of ferric phy ta te the exten t to which the 12 hydrogen atom s in the phytic acid are replaced by iron is determined by the ratio of iron to phosphorus in the precip itating m ixture in the range below about 3.6 times the theoretical ratio in the ferric phytate precipitate— i.e., 4 atom s of iron to 6 of phosphorus. A t about th is ratio (3.6 X 4Fe/6P) the hydrogens of the phytic acid are all replaced by iron, w ith the result th a t the presence of any larger ratio of iron to phosphorus has no effect upon, the composition of the precipitate although i t m ay accelerate its formation.
Tabic II. Phosphorus-Iron Ratios in Ferric Phytate Precipitate(As influenced by iron-phosphorus ra tio in p rec ip ita ting mixture.
P rec ip ita tion from corn grain ex trac t)In
P. Mg.
P rec ip ita ting M ixtureM ultip le of theoretical
Fe, M g. ra tio , 4 F e /6 P Fe, Mg.- I n Precii
P /F e3.31 4 .7 5 1.2 3 .2 8 1.0093.31 4 .7 5 1 .2 3 .2 3 1.0253.31 9 .5 0 2 .4 3 .89 0.8513.31 9 .50 2 .4 • 3 .84 0.8623.31 14.25 3 .6 4.04 0.8193 .31 14.25 3 .6 4 .02 0.8233 .31 19.00 4 .8 4 .0 0 0 .8283.31 19.00 4 .8 4 .0 0 0 .8283.31 23 .75 6 .0 3 .94 0.8403.31 23 .75 6 .0 3 .94 0 .840
Atomic ratio6P :3 .30F e0P :3 .25F e6P :3 .92F e6P :3 .87F e0P:4.O7FeCP:-1.05Fe0P:4.O2Fe0P:4.O 2Fe6P :3 .97F e0P :3 .97F e
Table 111. Relation of Phosphorus and Iron in Ferric Phytate Precipitate >! Determined by Two Procedures
AIt- '0 . 7 1 00 . 7 0 20 . 7 8 60 . 7 8 60 . 7 5 70 . 7 6 50 . 7 7 00 . 7 2 00 . 7 5
P in P rec ip ita te
M ultip le of Theoretical
R atio ,P /F e in PA liquot (C olorim etrically) 4 F e /6 P a Fe n P rec ip ita te
Mg. Mg.t> M g. c Mg.f>
A 3 .3 0 2 .4 3 .8 9 4 .6 5 0 .8483 .3 0 2 .4 3 .8 4 4 .7 0 0.859
B 3 .3 0 3 .6 4 .0 4 4 .2 0 0.8173 .3 0 3 .6 4 .0 2 4 .2 0 0.821
C 3 .3 3 4 .8 4 .0 0 4 .4 0 0.8333 .3 3 4 .8 4 .0 0 4 .3 5 0.833
D 3.31 6 .0 3 .9 4 4 .3 0 0.8403 .31 6 .0
a In p rec ip ita tin g m ixture.t> By analysis of s u p e rn a ta n t solution.c B y analysis of ferric p h y ta te p rec ip ita te .
3 .94 4 .6 0M eanT heory
0 .840 .0 .8360.833
June, 1944 A N A L Y T I C A L E D I T I O N 391
Table IV . Comparison of Phytln Phosphorus V aluesAs determ ined by proposed iron m ethod and b y analyses of ferric p h y ta te p rec ip ita te )
Corn W eight of—In P rec ip ita te -
P h y tin P P h y tin/--------InT o tal
C orn G) P h y tin
rain--------- *P h y tin P
Sample Sam ple F e° (F e X 0 .833) p& P P of to ta l PGrama M g. e Mg. M g* % % %
46 1.2249 4 .0 5 3 .3 7 3 .3 4 0.312 0 .275 88.147 1.1948 3 .5 0 2.91 2 .8 8 0.281 0 .243 8 6 .583 1.1956 3 .5 5 2 .9 6 2 .9 6 0 .285 0.247 86 .786 1.2228 3 .99 3 .32 3 .3 0 0 .312 0 .272 8 7 .287 1.1901 3 .8 2 3 .1 8 3.24 0 .299 0.267 89 .390 1.1791 3 .6 5 3 .4 4 3 .1 0 0.296 0 .258 8 7 .2
* D eterm ined by analysis of s u p e rn a ta n t solution.* D eterm ined by analysis of ferric p h y ta te p rec ip ita te .c Average of d u p lica te de te rm ina tions from acid e x tra c t of a single sam ple.
Weigh 4.6000 gram s of finely ground corn grain into a 200-ml. Erlenmeyer flask, add exactly 100 ml. of 1.2% hydrochloric acid(6) containing 10% sodium sulfate by weight, and shake on a mechanical shaker for 2 hours. D ecant the supernatan t liquid into a centrifuge tube and centrifuge for about 10 m inutes. Decant the liquid through a dry filter paper into a d ry beaker. Im mediately p ipet 50 ml. of the ex trac t into a clean, d ry 200-ml. Erlenmeyer flask, add 50 ml. of distilled water, and mix thoroughly. Add 15 ml. of standardized ferric chloride solution prepared in 0 .6% hydrochloric acid and containing approximately 0.2% iron. R o ta te the flask gently while adding the iron solution. Stopper the flask and continue to ro ta te un til the ferric phytate forms. T hen le t stand about 1 hour w ith occasional shaking. D ecant the solution through a d ry filter paper into a clean, dry beaker or centrifuge the solution. Im m ediately pipet 50 ml. of this solution into a 100-ml. beaker, bring hydrochloric acid concentration up to 1 N , and p u t through a Walden silver reductor in two portions. Rinse the beaker w ith six 25- ml. portions of 1 N hydrochloric acid, allowing each portion to drain alm ost to the top of the silver column before adding the next. C atch the solution and washings in a 500-ml. Erlenm eyer flask, add about 0.25 gram of sodium fluoride and 3 drops of sodium diphenylam ine sulfonate indicator, and titra te the ferrous iron im m ediately w ith 0.00895 N potassium dichrom ate (1 ml. = 0.5 mg. of iron). The end point is very sharp, changing from slightly yellow to purple.
From the titra tion value the milligrams of in organic iron in the 50-ml. aliquot m ay be ascertained, and the value, subtracted from the to tal milligrams of iron originally added to the aliquot, gives the milligrams of iron chemically bound as ferric phytate . This la tte r quan tity m ultiplied by0.833 gives milligrams of phytin phosphorus in 1.0 gram of grain.
This m ethod was further checked on samples of corn grain by comparing the phytin phosphorus obtained by the proposed iron method w ith th a t obtained from the ferric phy ta te precipita te . The iron in the precipitating m ixture ranged from 3.1 to 3.6 times the theoretical am ount required to react completely w ith the phytic acid (Table IV ).
T he results of th is te s t indicate th a t phytin phosphorus in corn grain m ay be determ ined as accurately by the proposed iron m ethod as by the determ ination of phytin phosphorus in th e ferric phy ta te precipitate.
ACKNOW LEDGMENT
T he au thor wishes to thank E . E . D eTurk, professor of soil fertility , for his assistance in preparing this paper, and K . M. Peng, assistan t in soil fertility , for his help w ith the chemical analyses.
LITERATURE CITED
(1)(2) (3)
(4)(5)(6)(7)C o n t r i b u t i o n from th e D e p a r tm e n t of A gronom y, A gricu ltu ral E xperim en t S ta tio n , U niversity of Illinois. Published w ith th e app roval of the D irecto r.
Anderson, R . J., N. Y. Agr. E xp t. Sta., Tech. Bull. 19 (1912). Ibid., Tech. Bull. 79 (1920).Dickman, S. R ., and B ray, R. H., I n d . E n g . C h e m ., A n a l . E d .
12, 665 (1940).H eubner, W ., and Stadler, H ., Biochem. Z., 64, 422 (1914). R ather, j . B., J . A m . Chem. Soc., 39, 2506 (1917).Starkenstein, Emil, Biochem. Z ., 30, 56 (1910).W renshall, C. L., and D yer, W . J., Soil Sei., 51, 235 (1941).
Determination of Small Am ounts of Sulfate in Cellul ose Nitrate and O ther Cellulose Esters
C A R R O L L L . H O F F P A U IR AN D J O H N D. G U T H R IE , Southern Regional Research Laboratory, N ew Orleans, La.
T HE relationship between sulfate content and stability of cellulose n itra te has long been recognized (4). In the process
of stabilization of cellulose n itra te the sulfate content approaches zero and (he determ ination of sulfate becomes increasingly difficult.
A number of m ethods for estim ating sulfate in cellulose esters have been described. Cross, Bevan, and Briggs (£) used aqua regia to decompose the sam ple and determ ined sulfate gravi- metrically on the digest. Berl and Bem m ann (1) and H ake and. Lewis (4) decomposed the organic m aterial w ith alkali. Kullgren(4) decomposed the sample w ith hydrochloric acid, evaporated the solution to dryness, burned the residue in a combustion tube >n a current of oxygen, and absorbed the evolved sulfuric acid in sodium hydroxide solution. Dunnicliff (S) oxidized the cellulose nitrate w ith nitric acid and sodium chlorate and determ ined the sulfate gravim etrically. M alm and T anghe (5) decomposed cellulose acetate by refluxing w ith nitric acid, completed the oxidation w ith potassium n itra te , and determ ined sulfate gravimetrically after removing n itra te by evaporation w ith hydro- cldoric acid. W hen the sulfate content of cellulose n itra te or other esters is very low these methods require the use of large samples to provide sufficient am ounts of the barium sulfate precipitate for convenient m anipulation and the decomposition becomes lengthy and tedious.
A method of analysis which has proved convenient and which gives Reproducible results involves decomposition of the cellulose
n itrate w ith nitric acid to which a small am ount of perchloric acid is added after the initial stage of digestion. T he sulfate in the digest is determ ined by a modification of the Morgulis and H em phill (7) m ethod. Barium chrom ate dissolved in dilute hydrochloric acid reacts w ith sulfate ions to give a precipitate of barium sulfate and an equivalent am ount of chromic acid which can be determ ined iodom etrically after the excess barium chrom ate is precipitated by making the solution alkaline w ith amm onia. This procedure determines to ta l sulfur, b u t i t is assumed th a t p rac tically all the sulfur in cellulose n itra te is in th e form of sulfate. This assum ption is im plicit in alm ost all m ethods for determining sulfate in cellulose n itra te and seems reasonable in view of the processes and m aterials used in its m anufacture.
REAGENTSB a r iu m C h r o m a t e R e a g e n t . Prepare pure barium chrom ate
by double decomposition, using solutions containing theoretical am ounts of barium chloride and potassium dichrom ate. Wash the barium chrom ate thoroughly w ith 1% acetic acid and then w ith w ater and dry. Dissolve 2.53 gram s of barium chrom ate in 100 ml. of 2 N hydrochloric acid and dilute to 1 liter.
P o t a s s i u m I o d a t e , 0.01 N . Dissolve 0.3567 gram of pure potassium iodate in water and dilute to exactly 1 Titer.
S o d iu m T h i o s u l f a t e S o l u t i o n , 9 .OO2 N . S tandardize against the standard potassium iodate solution a t the same tim e the determ inations are titra ted .
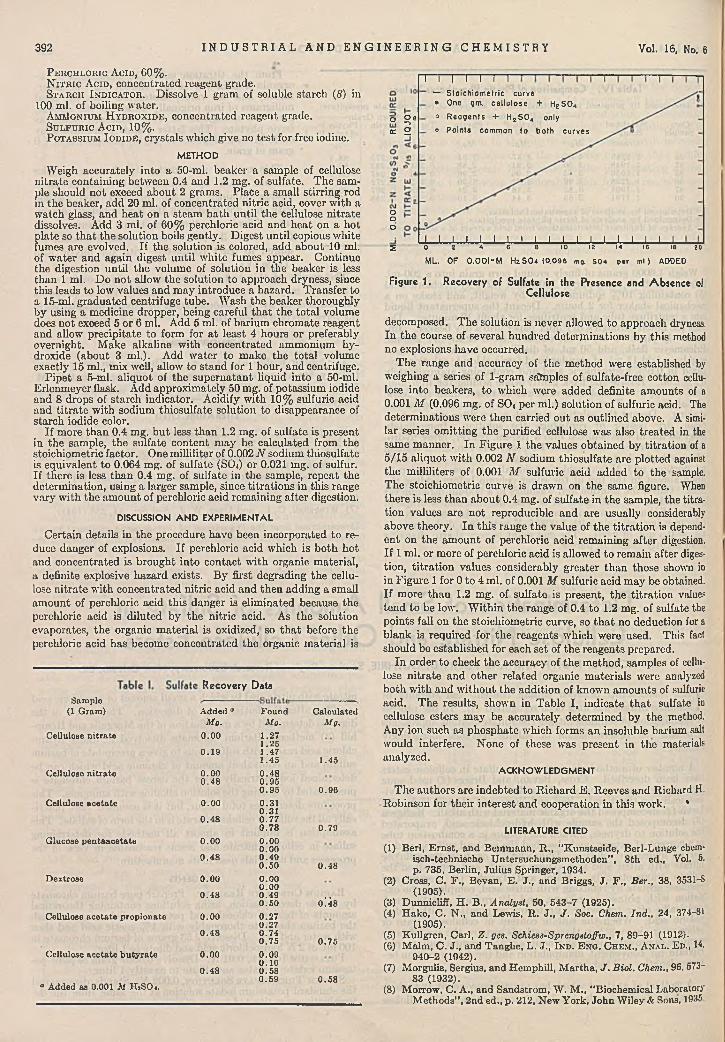
392 I N D U S T R I A L A N D E N G I N E E R I N G C H E M I S T R Y Vol. 16, No. 6
P erch loric A cid , 60%.N itr ic A cid , con cen tra ted reagen t grade.St a r c h I n d ic a t o r . Dissolve 1 gram of soluble starch (S) in
100 ml. of boiling water.A mMo n iu m H y d r o x id e , concentrated reagent grade.S u l f u r ic A c id , 10%.P ota ssiu m I o d id e , cry sta ls w h ich g iv e no te s t for free iod ine.
M E T H O D
Weigh accurately into a 50-ml. beaker a sample of cellulose n itra te containing between 0.4 and 1.2 mg. of sulfate. T he sample should no t exceed about 2 grams. Place a small stirring rod in the beaker, add 20 ml. of concentrated nitric acid, cover w ith a watch glass, and heat on a steam b a th until the cellulose n itrate dissolves. Add 3 ml. of 60% perchloric acid and heat on a hot plate so th a t the solution boils gently. D igest until copious white fumes are evolved. If the solution is colored, add about 10 ml. of w ater and again digest until w hite fumes appear. Continue the digestion until th e volume of solution in the beaker is less than 1 ml. D o no t allow the solution to approach dryness, since this leads to low values and m ay introduce a hazard. T ransfer to a 15-ml. graduated centrifuge tube. Wash the beaker thoroughly by using a medicine dropper, being careful th a t the to ta l volume does no t exceed 5 or 6 ml. Add 5 ml. of barium chrom ate reagent and allow precipitate to form for a t least 4 hours o r preferably overnight. M ake alkaline w ith concentrated amm onium hydroxide (about 3 m l.). Add w ater to m ake the to ta l volume exactly 15 ml., mix well, allow to stand for 1 hour, and centrifuge.
P ipet a 5-ml. aliquot of the supernatan t liquid in to a 50-ml. Erlenm eyer flask. Add approxim ately 50 mg. of potassium iodide and 8 drops of starch indicator. Acidify w ith 10% sulfuric acid and titra te w ith sodium thiosulfate solution to disappearance of starch iodide color.
If more than 0.4 mg. b u t less th an 1.2 mg. of sulfate is present in the sample, the sulfate content m ay be calculated from the stoichiometric factor. One m illiliter of 0.002 N sodium thiosulfate is equivalent to 0.064 mg. of sulfate (SOj) or 0.021 mg. of sulfur. If there is less than 0.4 mg. of sulfate in the sample, repeat the determ ination, using a larger sample, since titra tions in this range vary w ith the am ount of perchloric acid rem aining after digestion.
D IS C U S S IO N A N D E X P E R IM E N T A L
C ertain details in th e procedure have been incorporated to reduce danger of explosions. If perchloric acid which is bo th hot and concentrated is brought into contact w ith organic m aterial, a definite explosive hazard exists. By first degrading the cellulose n itra te w ith concentrated nitric acid and then adding a small am ount of perchloric acid th is danger is elim inated because the perchloric acid is diluted by th e nitric acid. As th e solution evaporates, the organic m aterial is oxidized, so th a t before the perchloric acid has become concentrated th e organic m aterial is
O §8œ 2
Sam ple (1 G ram )
Cellulose n itra te
Cellulose n itra te
Cellulose ace ta te
Glucose p en taace ta te
D extrose
Cellulose a ce ta te p rop ionate
Cellulose ace ta te b u ty ra te
0 A d d e d as 0.001 M H rSO i.
Recovery Data
A dded 0 Found C alculatedM g. M o. Mo.
0 .0 0 1.27
0 .1 91.251.471 .45 1.45
0 .0 0 0 .4 80 .4 8 0 .9 5
0 .9 5 0 .9 60 .0 0 0 .31
0 .4 80 .310 .7 70 .7 8 0 .79
0 .0 0 0 .0 0
0 .4 80 .0 00 .4 90 .5 0 0 .4 8
0 .0 0 0 .0 0
0 .4 80 .0 00 .4 90 .5 0 0 Ü 8
0 .0 0 0 .2 7
0 .4 80 .2 70 .7 40 .7 5 0 .7 5
0 .0 0 0 .0 9
0 .4 80 .1 00 .5 80 .5 9 0 .5 8
ooo
I I I I I I I— Sto ichiom etric curve • One gm. ce llu lo se + H2 S 0 4
O R ea ge n ts + H 2S 0 4 only
e Points common to both cu rves
I I I I I I I I I I I I I t I I I I I5 0 2 4 6 6 10 12 14 16 16 SO
ML. OF O.OOI-M H2 SO 4 (0.096 mg. S04 par ml) ADDED
Figure 1. Recovery of Sulfate in the Presence and A bsence ol Cellulose
decomposed. T he solution is never allowed to approach dryness. In th e course of several hundred determ inations by th is method no explosions have occurred.
The range and accuracy of th e m ethod were established by weighing a series of 1-gram sain pics of sulfate-free cotton cellulose into beakers, to which were added definite am ounts of a0.001 M (0.096 mg. of S 0 4 per ml.) solution of sulfuric acid. The determ inations were then carried ou t as outlined above. A similar series om itting th e purified cellulose was also treated in the same m anner. In Figure 1 the values obtained by titra tion of a 5/15 aliquot w ith 0.002 N sodium thiosulfate are p lo tted against the milliliters of 0.001 M sulfuric acid added to the sample. The stoichiometric curve is drawn on th e same figure. When there is less th an about 0.4 mg. of sulfate in the sample, the titration yalues are no t reproducible and are usually considerably above theory. In th is range th e value of th e titra tio n is dependen t on the am ount of perchloric acid rem aining after digestion. If 1 ml. or more of perchloric acid is allowed to rem ain after digestion, titra tion values considerably greater th an those shown in in Figure 1 for 0 to 4 ml. of 0.001 M sulfuric acid m ay be obtained. If m ore than 1.2 mg. of sulfate is present, th e titra tio n values tend to be low. W ithin th e range of 0.4 to 1.2 mg. of sulfate the points fall on the stoichiometric curve, so th a t no deduction for a blank is required for the reagents which were used. This fact should be established for each se t of th e reagents prepared.
In order to check th e accuracy of th e method, samples of cellulose n itra te and o ther related organic m aterials were analyzed both w ith and w ithout th e addition of known am ounts of sulfuric acid. T he results, shown in T able I, indicate th a t sulfate in cellulose esters m ay be accurately determ ined by th e method. Any ion such as phosphate which forms an insoluble barium salt would interfere. N one of these was present in the materials analyzed.
ACKNOW LEDGMENT
T he authors are indebted to R ichard E . Reeves and Richard H. Robinson for their in terest and cooperation in th is work. *
LITERATURE CITED
(1) Berl, Ernst, and Bemmann, R., “Kunstseide, Berl-Lunge chem-isch-technische Untersuchungsmethoden” , 8th ed., Vol. 5. p. 735, Berlin, Julius Springer, 1934.
(2) Cross, C. F., Bevan, E. J., and Briggs, J. F., Ber., 38, 3531-8(1905).
(3) Dunnicliff, H. B., Analyst, 50, 543-7 (1925).(4) Hake, C. N„ and Lewis, R. J., J . Soc. Chem. Ind., 24, 374-81
(1905).(5) Kullgren, Carl, Z. gee. Schiess-Sprengstoffw., 7, 89-91 (1912).(6) Malm, C . J., and Tanghe, L. J., I n d . E n g . C h e m ., A n a l . E d ., 14.
940-2 (1942).(7) Morgulis, Sergius, and Hemphill, M artha, J . Biol. Chem., 96, 573-
83 (1932).(8) Morrow, C. A., and Sandstrom, W. M., “Biochemical Laboratory
Methods” , 2nd ed., p. 212, New York, John Wiley & Sons, 1935
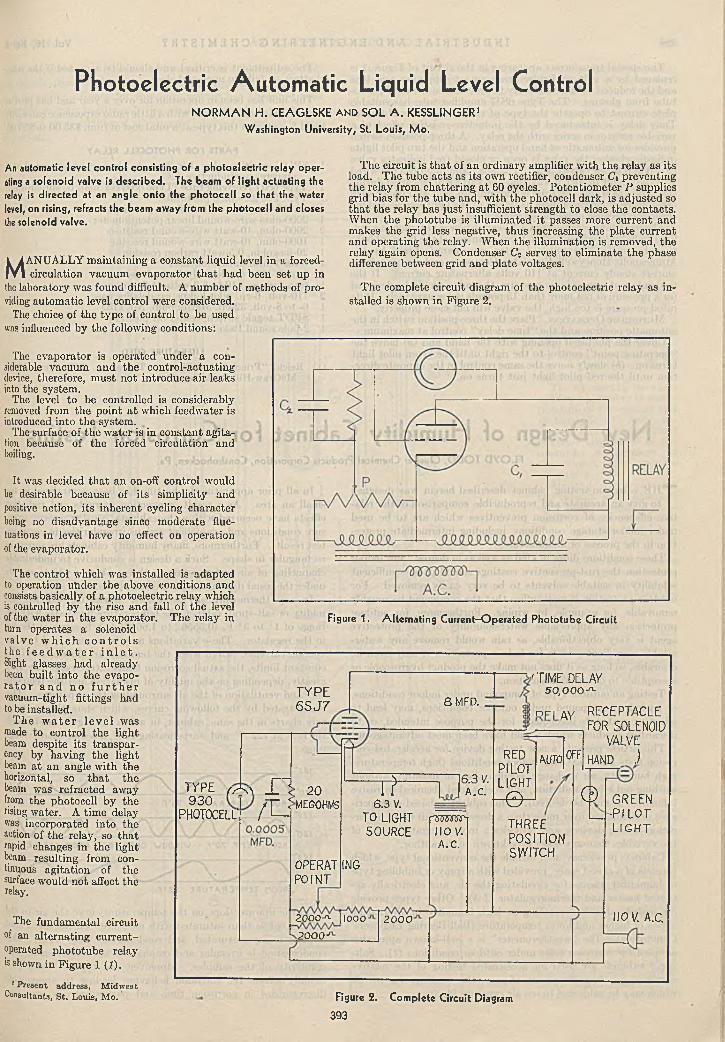
Photoelectric Autom atic Liquid Level ControlN O R M A N H . C E A G L S K E a n d S O L A . K E S S L IN G E R 1
Washington University, St. Lo u is, M o.
An automatic level control consisting of a photoelectric relay oper- jting a solenoid valve is described. The beam of light actuating the relay is directed at an angle onto the photocell so that the water level, on rising, refracts the beam away from the photocell and closes the solenoid valve.
M ANUALLY m aintaining a constant liquid level in a forced- circulation vacuum evaporator th a t had been set up in
the laboratory was found difficult. A num ber of m ethods of providing autom atic level control were considered.
The choice of the type of control to be used was influenced by the following conditions:
The evaporator is operated under a considerable vacuum and th e control-actuating device, therefore, m ust no t introduce air leaks into the system.
The level to be controlled is considerably removed from th e point a t which feedw ater is introduced into th e system.
The surface of th e w ater is in constant agitation because of th e forced circulation and boiling.
It was decided th a t an on-off control would be desirable because of its simplicity and positive action, its inherent cycling character being no disadvantage since m oderate fluctuations in level have no effect on operation of the evaporator.
The control which was installed is »adapted to operation under the above conditions and consists basically of a photoelectric relay which is controlled by th e rise and fall of the level of the w ater in the evaporator. T he relay in turn operates a solenoid va lve w h ic h c o n t r o l s the f e e d w a t e r i n l e t .Sight glasses had already been built into the evapor a to r a n d n o f u r t h e r vacuum-tight fittings had to be installed.
T he w a t e r le v e l was made to control th e light beam despite its transparency by having th e light beam a t an angle w ith the horizontal, so th a t th e beam was refracted away from the photocell by the rising water. A tim e delay was incorporated in to the action of the relay, so th a t rapid changes in th e light beam resulting from continuous agitation of the surface would no t affect the relay.
The fundam ental circuit of an alternating cu rren t- operated phototube relay is shown in Figure 1 (I).
1 Present address, M idw est Consultants, S t. Louis, M o.
T he circuit is th a t of an ordinary amplifier w ith the relay as its load. T he tube acts as its own rectifier, condenser Ci preventing the relay from chattering a t 60 cycles. Potentiom eter P supplies grid bias for th e tube and, w ith the photocell dark, is ad justed so th a t th e relay has ju s t insufficient strength to close th e contacts. W hen the phototube is illum inated it passes m ore current and m akes th e grid loss negative, th u s increasing the p late current and operating the relay. W hen th e illum ination is removed, the relay again opens. Condenser C\ serves to elim inate th e phase difference between grid and plate voltages.
T he complete circuit diagram of the photoelectric relay as installed is shown in Figure 2.
Figure 1. Alternating Current-O perated Phototube Circuit
T Y P E
6 S J 7
TYPE ^ 930
PHOTOCELL"
£ lf U
: 2 0 MEGOHMS
OPERATPOINT
T f
ING
8 MFD.
'T I M E DELAY5 0 ,0 0 0 * -
6.3 V. TO LIGHT SOURCE
rOTOTPino v.A .C .
6.3 V A.C.
2 0 0 0 ^ . 11000 J
2 0 0 0 J2 0 0 0
AUTOR E D
P I L O T L IG H T_ 0 _
THREEPOSITIONS W IT C H
n r I AY R E C E P T A C L E
FO R SO L EN O ID VALVE
H A N D JOFF
0 G R E E N-PILOTLIGHT
110 V. A.C.
Figure 2. Com plete Circuit Diagram
393
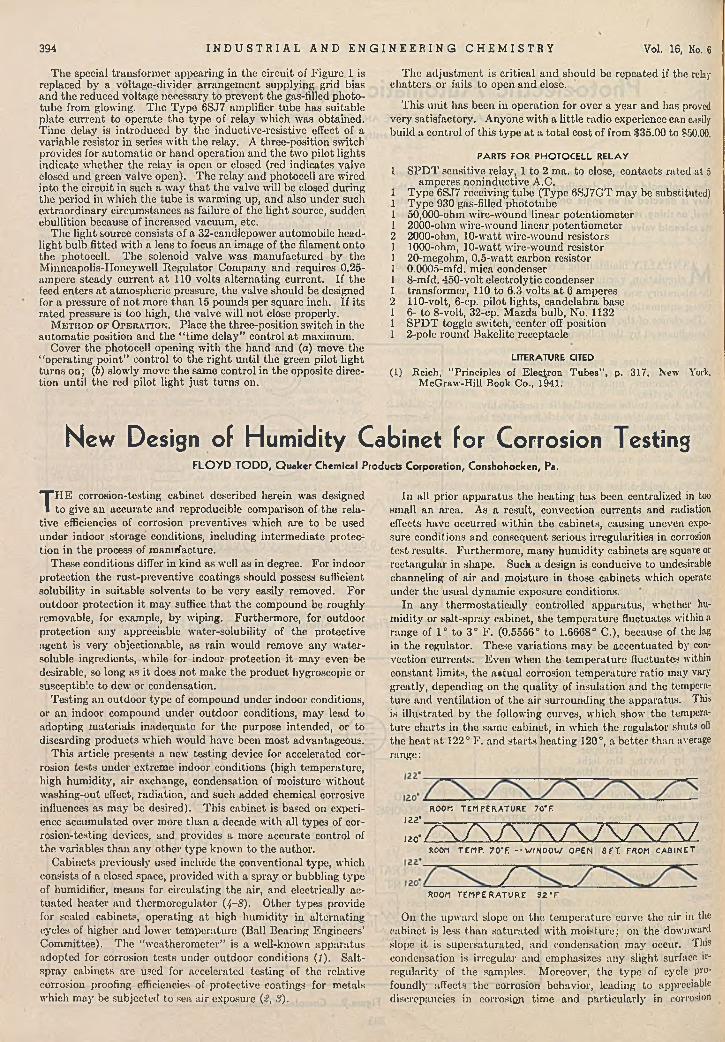
394 I N D U S T R I A L A N D E N G I N E E R I N G C H E M I S T R Y Vol. 16, No. 6
The special transform er appearing in the circuit of Figure 1 is replaced by a voltage-divider arrangem ent supplying grid bias and the reduced voltage necessary to p revent the gas-filled phototube from glowing. T he T ype 6SJ7 amplifier tube has suitable p late current to operate th e type of relay which was obtained. Tim e delay is introduced by the inductive-resistive effect of a variable resistor in series w ith th e relay. A three-position switch provides for autom atic or hand operation and th e two pilot lights indicate w hether the relay is open or closed (red indicates valve closed and green valve open). The relay and photocell are wired into th e circuit in such a w ay th a t th e valve will be closed during the period in which the tube is w arming up, and also under such extraordinary circumstances as failure of the light source, sudden ebullition because of increased vacuum, etc.
The light source consists of a 32-candlepower autom obile headlight bulb fitted w ith a lens to focus an image of th e filam ent onto the photocell. The solenoid valve was m anufactured by the Minneapolis-IIoncywell R egulator Com pany and requires 0.25- ampere steady current a t 110 volts a lternating current. I f the feed enters a t atm ospheric pressure, th e valve should be designed for a pressure of no t more than 15 pounds per square inch. If its rated pressure is too high, th e valve will no t close properly.
M eth o d o f O p e r a t io n . Place the three-position switch in the autom atic position and th e “ time delay” control a t maximum.
Cover the photocell opening w ith the hand and (a) move the “ operating po in t” control to th e righ t until the green pilot light turns on; (5) slowly move the same control in the opposite direction until the red pilot light ju s t turns on.
T he ad justm ent is critical and should be repeated if the relay chatters or fails to open and close.
T his un it has been in operation for over a year and has proved very satisfactory. Anyone w ith a little radio experience can easily build a control of this type a t a to ta l cost of from $35.00 to $50.00.
PARTS FOR PHO TO CELL RELA Y1 SPD T sensitive relay, 1 to 2 ma. to close, contacts rated at 5
amperes noninductive A.C.1 Type 6SJ7 receiving tube (Type 6SJ7G T m ay be substituted) 1 Type 930 gas-filled phototube 1 50,000-ohm wire-wound linear potentiom eter1 2000-ohm wire-wound linear potentiom eter2 2000-olun, 10-w att wire-wound resistors 1 1000-ohm, 10-watt wire-wound resistor1 20-megohm, 0.5-w att carbon resistor 1 0.0005-mfd. mica condenser 1 8-mfd. 450-volt electrolytic condenser1 transform er, 110 to 6.3 volts a t 6 amperes2 110-volt, 6-cp. pilot lights, candelabra base 1 6- to 8-volt, 32-cp. M azda bulb, No. 11321 SPD T toggle switch, center off position 1 2-pole round Bakelite receptacle
LITERATURE CITED(1) Reich, “ Principles of E lectron T ubes", p. 317, New York,
M cGraw-Hill Book Co., 1941.
New Design of Humidity Cabinet for Corrosion TestingF L O Y D T O D D , Q uaker Chemical Products Corporation, Conshohocken, Pa.
T H E corrosion-testing cabinet described herein was designed to give an accurate and reproducible comparison of the rela
tive efficiencies of corrosion preventives which are to be used under indoor storage conditions, including interm ediate protection in the process of m anufacture.
These conditions differ in kind as well as in degree. For indoor protection the rust-preventive coatings should possess sufficient solubility in suitable solvents to be very easily removed. For outdoor protection it m ay suffice th a t the compound be roughly removable, for example, by wiping. Furtherm ore, for outdoor protection any appreciable w ater-solubility of the protective agent is very objectionable, as rain would remove any w ater- soluble ingredients, while for indoor protection it m ay even be desirable, so long as it does no t make the product hygroscopic or susceptible to dew or condensation.
Testing an outdoor type of compound under indoor conditions, or an indoor compound under outdoor conditions, m ay lead to adopting m aterials inadequate for the purpose intended, or to discarding products which would have been m ost advantageous.
T his article presents a new testing device for accelerated corrosion tests under extreme indoor conditions (high tem perature, high hum idity, air exchange, condensation of m oisture w ithout washing-out effect, radiation, and such added chemical corrosive influences as m ay be desired). This cabinet is based on experience accum ulated over more th an a decade w ith all types of corrosion-testing devices, and provides a more accurate control of the variables than any other type known to the author.
Cabinets previously used include the conventional type, whicii consists of a closed space, provided w ith a spray or bubbling type of humidifier, means for circulating the air, and electrically actuated heater and therm oregulator U--8). O ther types provide for sealed cabinets, operating a t high hum idity in alternating cycles of higher and lower tem perature (Ball Bearing Engineers’ Comm ittee). The ‘'weatherom eter” is a well-known apparatus adopted for corrosion tests under outdoor conditions ( /) . Salt- sprav cabinets are used for accelerated testing of the relative corrosion proofing efficiencies of protective coatings for m etals which m ay be subjected to sea air exposure (£, 3).
In all prior apparatus the heating lias been centralized in too small an area. As a result, convection currents and radiation effects have occurred within the cabinets, causing uneven exposure conditions and consequent serious irregularities in corrosion test results. Furtherm ore, many hum idity cabinets are square or rectangular in shape. Such a design is conducive to undesirable channeling of air and m oisture in those cabinets which operate under the usual dynamic exposure conditions.
In any therm ostatically controlled apparatus, whether hum idity or salt-spray cabinet, the tem perature fluctuates within a range of 1° to 3° F . (0.5556° to 1.6668° C.), because of the lag in the regulator. These variations m ay be accentuated by convection currents. Even when the tem perature fluctuates within constant limits, the a«tual corrosion tem perature ratio may vary greatly, depending on the quality of insulation and the temperature and ventilation of the air surrounding the apparatus. This is illustrated by the following curves, which show the temperature charts in the same cabinet, in which the regulator shuts oil the heat a t 122° F. and s ta rts heating 120°, a be tter than average range:
ROOM TEM PERATURE 70‘ F122’
120* / A / \ A A A 7 V X A 7TF -
ZROOM TEMP. 70 ‘ F --W INDOW OPEN 8 FT. FROM CABINET
ROOM TEM PE R A TU R E 8Z ' F
On the upw ard slope on the tem perature curve the air in the cabinet is less th an saturated w ith m oisture; on the downward slope i t is supersaturated, and condensation m ay occur. This condensation is irregular and emphasizes any slight surface irregularity of the samples. Moreover, the type of cycle profoundly affects the corrosion behavior, leading to appreciable discrepancies in corrosion tim e and particularly in corrosion

The walls and bottom are heated over a p reponderant area. T his heating is effected by m eans of the vapors of a constant- boiling liquid and is therefore absolutely uniform and laglcss. Convection currents are thus completely elim inated.
Still more im portant, the tem perature ‘ 'curve” is here a stra igh t line, the cycles.of recurrent sub- and supersaturations are eliminated completely, because the tem perature is th a t of th e boiling
point of a constant-boiling liquid, and no mechanical regulation is necessary.
T he uniform ity of the tem perature and hum idity conditions w ithin the cabinet give accurate comparisons of the relative efficiencies of corrosion preventives, platings, varnishes, or other protective coatings. These results can be accurately reproduced.
By using cyclopentane as the heating liquid a tem perature of 120 F . (49° C.) is ’ m aintained, which is a commonly specified condition. By selecting th e heating liquid, practically any tem perature desired can be m aintained exactly.
T he air used in th e cabinet is preheated to the tem perature of the cabinet and prehumidified to 100% before it enters the cabinet chamber, regardless of the operating tem perature of the cabinet or of outside conditions.
Air and w ater entering the cabinet are au tom atically and accurately controlled and are not affected even by relatively wide variations in the laboratory or p lan t lines.
T he design avoids corners or sharp angles, which tend to cause irregularities in a ir c u r r e n ts w ith in th e cabinet.
The only variable, th a t of the effect on boiling point of variations of atm ospheric pressure, has proved practically insignificant.
types, dependent on external factors no t controlled in any cabinet specifications w ith which the au tho r is familiar.
A humidity cabinet for corrosion testing has therefore been designed in order to elim inate the disadvantages of prior cabinets. Its design gives additional advantages inheren t in only this type of cabinet.
Figure 1. V ertical Section of Humidity Cabinet
CONSTRUCTION OF CABINET
The cabinet, shown in vertical section in Figure 1 and in horizontal section in Figure 2, consists of a vapor- tigh t jacketed cylindrical container, V, w ith a conical bottom and top. The cham ber is m ade of No. 22 B. & S. gage Monel metal. The annular spaces and lid, IF, are insulated w ith loosely packed rock wool or glass wool. Fourteen feet (420 cm.) of 0.25-inch (0.6- cm.) copper tubing are bent into a spiral and tacked uniformly around the bo ttom of the cabinet chamber. T he top of th e spiral tu b ing is ben t abruptly downward in the central p a r t of the cabinet w ith its orifice a t N . An overflow tube, O, is used to keep a constant
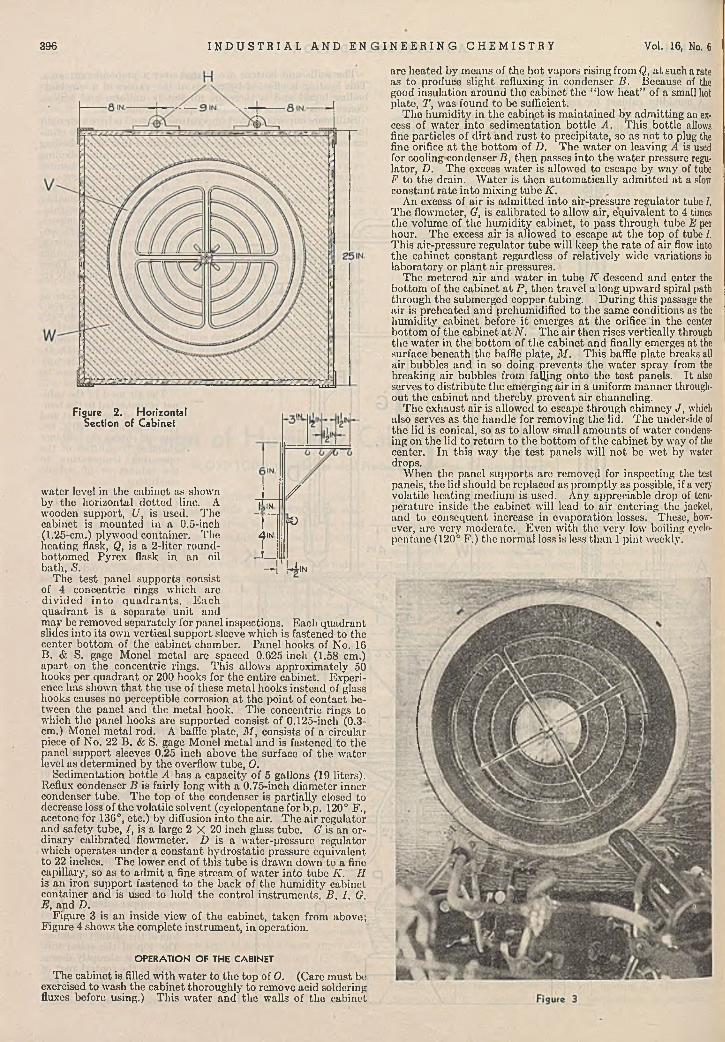
OPERATION OF THE CABINET
The cabinet is filled w ith w ater to th e top of 0 . (Care m ust be exercised to wash the cabinet thoroughly to remove acid soldering fluxes before using.) This w ater and th e walls of th e cabinet
396 I N D U S T R I A L A N D E N
Figure 2. Horizontal Section of Cabinet
w ater level in the cabinet as shown j ^by the horizontal do tted line. A u ,Nwooden support, U, is used. The cabinet is m ounted in a 0.5-inch f J®(1.25-em.) plywood container. The 4 inheating flask, Q, is a 2-litcr round- Ibottom ed Pyrex flask in an oil —I—bath , S . — (—1in.
The tes t panel supports consist of 4 concentric rings which arc d iv id ed in to q u a d ra n ts . E ach quadran t is a separate un it andm ay be rem oved separately for panel inspections. E ach quadran t slides into its own vertical support sleeve which is fastened to the center bottom of the cabinet chamber. Panel hooks of No. 16 B. & S. gage M onel m etal are spaced 0.625 inch (1.58 cm.) ap a rt on th e concentric rings. T his allows approxim ately 50 hooks per quadran t or 200 hooks for th e entire cabinet. Experience has shown th a t the use of these m etal hooks instead of glass hooks causes no perceptible corrosion a t th e point of contact between th e panel and the m etal hook. The concentric rings to which the panel hooks are supported consist of 0.125-inch (0.3- cm.) Monel m etal rod. A baffle plate, M , consists of a circular piece of No. 22 B. & S. gage Monel m etal and is fastened to the panel support sleeves 0.25 inch above th e surface of the w ater level as determ ined by the overflow tube, 0 .
Sedim entation bottle A has a capacity of 5 gallons (19 liters). Reflux condenser B is fairly long w ith a 0.75-inch diam eter inner condenser tube. T he top of the condenser is partially closed to decrease loss of th e volatile solvent (cyclopentane for b.p. 120° F ., acetone for 136°, etc.) by diffusion in to th e air. T he air regulator and safety tube, 7, is a large 2 X 20 inch glass tube. G is an ordinary calibrated flowmeter. D is a w ater-pressure regulator which operates under a constant hydrostatic pressure equivalent to 22 inches. T he lower end of this tube is drawn down to a fine capillary, so as to adm it a fine stream of w ater into tube K . H is an iron support fastened to the back of the hum idity cabinet container and is used to hold th e control instrum ents, B, 7, G, E, and D.
Figure 3 is an inside view of the cabinet, taken from above; Figure 4 shows the complete instrum ent, in operation.
are heated by means of tire ho t vapors rising from Q, a t such a rate as to produce slight refluxing in condenser B. Because of the good insulation around th e cabinet th e “ low hea t” of a small hot plate, T, was found to be sufficient.
Tho hum idity in th e cabinet is m aintained by adm itting an excess of w ater into sedim entation bo ttle A . This bottle allows fine particles of d irt and ru s t to precipitate, so as no t to plug the fine orifice a t th e bottom of D. T he w ater on leaving A is used for coo ling condenser B , then passes into the w ater pressure regulator, D. The excess w ater is allowed to escape by way of tube F to the drain. W ater is then autom atically adm itted a t a slow constant ra te into mixing tube K .
An excess of air is adm itted into air-pressure regulator tube I. T he flowmeter, G, is calibrated to allow air, equivalent to 4 times the volume of the hum idity cabinet, to pass through tube E per hour. The excess a ir is allowed to escape a t th e top of tube 1. This air-pressure regulator tube will keep the ra te of air flow into the cabinet constant regardless of relatively wide variations in laboratory' or p lan t a ir pressures.
T he m etered air and w ater in tube K descend and enter the bottom of the cabinet a t P , then travel a long upw ard spiral path through th e submerged copper tubing. D uring th is passage the air is preheated and prehumidified to the same conditions as the hum idity cabinet before it emerges a t the orifice in the cent« bottom of the cabinet a t N . T he air then rises vertically through the w ater in the bottom of the cabinet and finally emerges at the surface beneath the baffle plate, M . T his baffle plate breaks all air bubbles and in so doing prevents th e w ater spray from the breaking a ir bubbles from falling onto the te s t panels. I t also serves to d istribute the emerging air in a uniform m anner throughout the cabinet and thereby prevent a ir channeling.
The exhaust a ir is allowed to escape through chimney' J , which also serves as th e handle for removing the lid. T he underside ol the lid is conical, so as to allow sinall am ounts of w ater condensing on the lid to re tu rn to the bottom of th e cabinet by way of the center. In th is w ay the te s t panels will no t be w et by' water drops.
When the panel supports are rem oved for inspecting the test panels, the lid should be replaced as prom ptly as possible, if a very volatile heating medium is used. Any appreciable drop of temperature inside the cabinet will lead to a ir entering the jacket, and to consequent increase in evaporation losses. These, however, are very moderate. Even w ith the very low boiling cyclopentane (120° F .) the norm al loss is less than 1 p in t weekly.
I N E E R I N G C H E M I S T R Y Vol. 16, No. 6
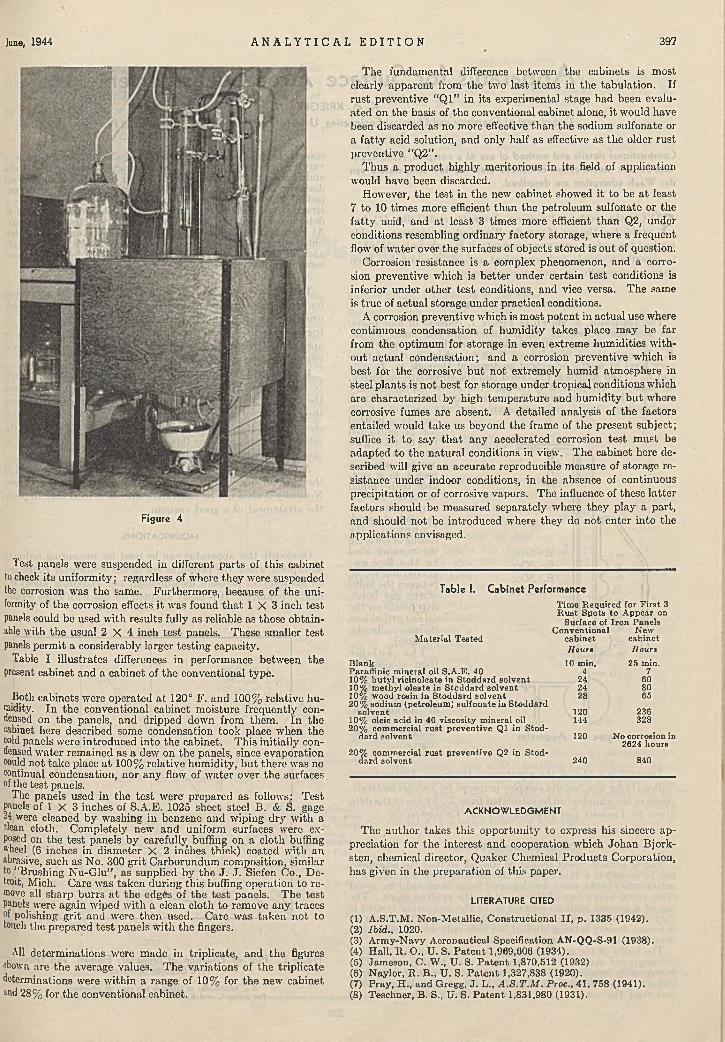
lune, 1944 A N A L Y T I C A L E D I T I O N 397
T he fundam ental difference between the cabinets is most clearly apparen t from the two last item s in the tabulation. If ru s t preventive " Q l” in its experimental stage had been evalua ted on the basis of the conventional cabinet alone, i t would have been discarded as no more effective th an th e sodium sulfonate or a fa tty acid solution, and only half as effective as the older rust preventive “Q2” .
T hus a product highly m eritorious in its field of application would have been discarded.
However, th e tes t in th e new cabinet showed it to be a t least 7 to 10 tim es more efficient th an th e petroleum sulfonate or the fa tty acid, and a t least 3 tim es more efficient th an Q2, under conditions resembling ordinary factory storage, where a frequent flow of w ater over th e surfaces of objects stored is ou t of question.
Corrosion resistance is a complex phenomenon, and a corrosion preventive which is b e tte r under certain te s t conditions is inferior under other te s t conditions, and vice versa. T he same is true of actual storage under practical conditions.
A corrosion preventive which is m ost po ten t in actual use where continuous condensation of hum idity takes place m ay be far from th e optim um for storage in even extreme hum idities w ithout actual condensation; and a corrosion preventive which is best for the corrosive b u t no t extremely humid atm osphere in steel plants is no t best for storage under tropical conditions which are characterized by high tem perature and hum idity b u t where corrosive fumes are absent. A detailed analysis of th e factors entailed would take us beyond th e fram e of the present subject; suffice it to say th a t any accelerated corrosion te s t m ust be adapted to the natu ral conditions in view. T he cabinet here described will give an accurate reproducible m easure of storage resistance under indoor conditions, in the absence of continuous precipitation or of corrosive vapors. T he influence of these la tte r factors should be m easured separately where they play a part, and should no t be introduced where they do no t enter into the applications envisaged.
Table I. Cabinet PerformanceT im e R equ ired for F irs t 3 R u s t Spots to A ppear on
Surface of Iron PanelsC onven tional New
M ate ria l T ested cab inet cab inetH ours Hours
B lank 10 m in. 25 min.Paraffinic m ineral oil S .A .E . 40 4 710% b u ty l ricinolcafce in S to d d ard so lven t 24 6010% m ethy l oleate in S toddard so lven t 24 8010% wood rosin in S toddard so lven t20% sod ium (petroleum ) su lfona te in S toddard
28 65
so lven t 120 23610% oleic acid in 40 viscosity m ineral oil 20% com m ercial ru s t p reven tive Q l in S tod
144 328
dard so lv en t
20% com m ercial ru s t p reven tive Q2 in S tod
120 No corrosion in 2624 hourB
d a rd so lven t 240 840
A C K N O W L E D G M E N T
The au thor takes th is opportunity to express his sincere appreciation for th e in terest and cooperation which Johan Bjork- sten, chemical director, Q uaker Chemical Products Corporation, has given in the preparation of this paper.
LITERATURE CITED
(1) A .S.T.M . Non-M etallic, Constructional I I , p . 1335 (1942).(2) Ibid., 1020.(3) A rm y-N avy Aeronautical Specification AN-QQ-S-91 (1938).(4) H all, It. O., U. S. P a ten t 1,969,606 (1934).(5) Jam eson, C. W ., U. S. P a ten t 1,870,512 (1932)(6) Naylor, E.. B., U. S. P a ten t 1,327,838 (1920).(7) Pray, H „ and Gregg, J . L „ A .S .T .M . Proc., 41, 758 (1941).(8) Teschner, B. S., U. S. P a ten t 1,831,980 (1931).
Figure 4
Test panels were suspended in different parts of th is cabinet to check its uniform ity; regardless of where they were suspended the corrosion was the same. Furtherm ore, because of the uniformity of th e corrosion effects it was found th a t 1 X 3 inch test panels could be used w ith results fully as reliable as those obtainable with th e usual 2 X 4 inch te s t panels. These smaller test panels perm it a considerably larger testing capacity.
Table I illustrates differences in performance between the present cabinet and a cabinet of the conventional type.
Both cabinets were operated a t 120° F . and 100% relative hu- midity. In th e conventional cabinet m oisture frequently condensed on the panels, and dripped down from them . In the cabinet here described some condensation took place w hen the cold panels were introduced into th e cabinet. T his initially condensed w ater rem ained as a dew on the panels, since evaporation could not take place a t 100% relative hum idity, b u t there was no continual condensation, nor any flow of w ater over the surfaces of the test panels.
The panels used in the te s t were' prepared as follows: T est panels of 1 X 3 inches of S.A.E. 1025 sheet steel B. & S. gage 24 were cleaned by washing in benzene and wiping dry w ith a clean cloth. Completely new and uniform surfaces were exposed on the tes t panels by carefully buffing on a cloth buffing wheel (6 inches in diam eter X 2 inches thick) coated w ith an abrasive, such as No. 300 grit C arborundum composition, similar to ‘‘Brushing N u-Glu” , as supplied by th e J . J . Siefen Co., D etroit, Mich. Care was taken during th is buffing operation to remove all sharp burrs a t the edges of th e te s t panels. The test panels were again wiped w ith a clean cloth to remove any traces of polishing g rit and were then used. C are was taken no t to touch the prepared te s t panels w ith th e fingers.
All determ inations were m ade in triplicate, and th e figures shown are th e average values. T he variations of the triplicate determinations were within a range of 10% for th e new cabinet Mid 28% for the conventional cabinet.
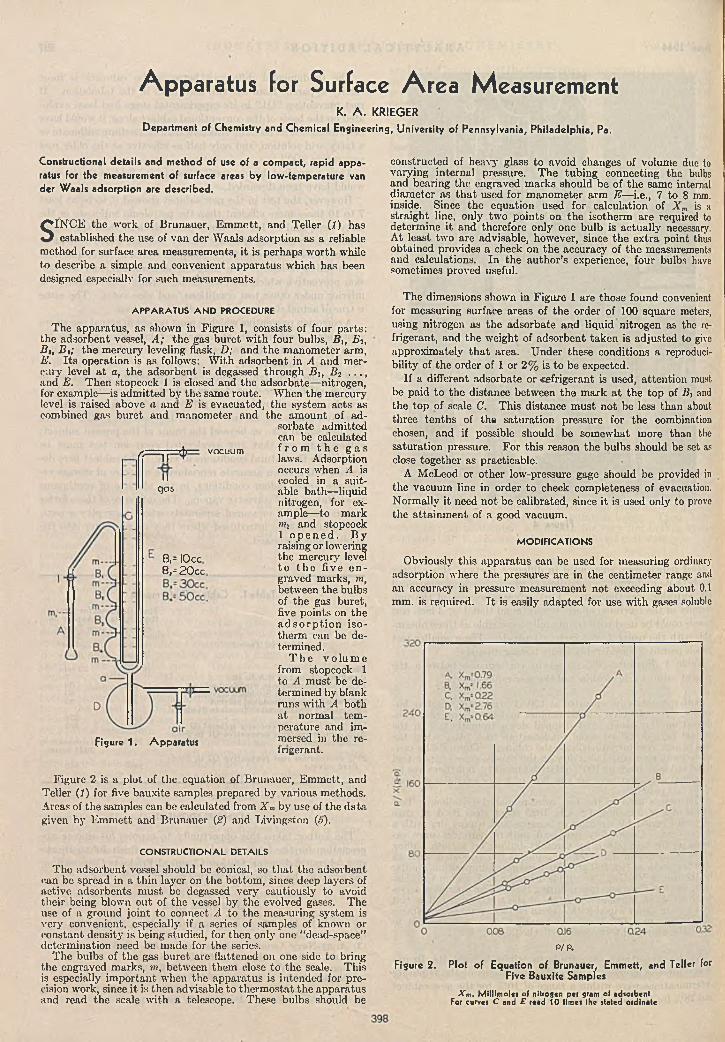
Apparatus for Surface A re a MeasurementK. A . K R IE G E R
Department of Chemistry and Chem ical Engineering, University of Pennsylvania, Philadelphia, Pa.
Figure 2 is a plot of the equation of Brunauer, Em m ett, and Teller (1) for five bauxite samples prepared by various methods. Areas of the samples can be calculated from X m by use of the da ta given by E m m ett and B runauer (S) and Livingston (/>).
C O N S T R U C T IO N A L D E T A IL S
T he adsorbent vessel should be conical, so th a t the adsorbent can be spread in a th in layer on the bottom , since deep layers of active adsorbents m ust be degassed very cautiously to avoid their being blown out of th e vessel by the evolved gases. The use of a ground jo in t to connect A to th e measuring system is very convenient, especially if a series of samples of known or constant density is being studied, for then only one “dead-space” determ ination need be made for th e series.
T he bulbs of the gas buret are flattened on one side to bring the engraved marks, m, between them close to th e scale. This is especially im portan t when th e apparatus is intended for precision work, since i t is then advisable to therm osta t th e apparatus and read th e scale w ith a telescope. These bulbs should be
p/p.
Figure 2. Plot of Equation of Brunauer, Emmett, and Teller for Five Bauxite Samples
Xm . M illim oles of nitrogen per gram of adsorbent For curves C and E read 10 times the stated ordinate
constructed of heavy glass to avoid changes of volume due to varying internal pressure. T he tubing connecting the bulbs and bearing the engraved m arks should be of th e same internal d iam eter as th a t used for m anom eter arm E —i.e., 7 to 8 mm. inside. Since the equation used for calculation of X m is a stra igh t line, only two points on th e isotherm are required to determ ine it and therefore only one bulb is actually necessary. A t least two are advisable, however, since th e ex tra point thus obtained provides a check on the accuracy of th e measurements and calculations. In the au tho r’s experience, four bulbs have sometimes proved useful.
The dimensions shown in Figure 1 are those found convenient for measuring surface areas of the order of 100 square meters, using nitrogen as the adsórbate and liquid nitrogen as the refrigerant, and the weight of adsorbent taken is adjusted to give approximately th a t area. U nder these conditions a reproducibility of the order of 1 or 2% is to be expected.
If a different adsórbate or refrigeran t is used, attention must be paid to the distance between th e m ark a t the top of B, and the top of scale C. This distance m ust not be less than about three ten ths of tha saturation pressure for the combination chosen, and if possible should be som ewhat more than the saturation pressure. For th is reason the bulbs should be set as close together as practicable.
A McLeod or other low-pressure gage should be provided in the vacuum line in order to cheek completeness of evacuation. Normally it need no t be calibrated, since it is used only to prove the a tta inm en t of a good vacuum.
M O D IF IC A T IO N S
Obviously this apparatus can be used for measuring ordinary adsorption where the pressures are in the centim eter range and an accuracy in pressure m easurem ent no t exceeding about 0.1 mm. is required. I t is easily adapted for use w ith gases soluble
Constructional details and method of use of a compact, rapid apparatus for the measurement of surface areas by low-temperature van der W aals adsorption arc described.
S IN C E th e work of Brunauer, E m m ett, and Teller (I) has established the use of van der W aals adsorption as a reliable
method for surface area measurem ents, it is perhaps w orth while to describe a simple and convenient appara tus which has been designed especially for such measurements.
A P P A R A T U S A N D P R O C E D U R E
T he apparatus, as shown in Figure 1, consists of four parts: the adsorbent vessel, A ; th e gas bu re t w ith four bulbs, B ,, B,, B t, B¡; th e m ercury leveling flask, D; and th e m anom eter arm, E. I ts operation is as follows: W ith adsorbent in A and mercury level a t a, th e adsorbent is degassed through B t , B 2 . . . , and E. Then stopcock 1 is closed and the adsórbate—nitrogen, for example—is adm itted by the same route. W hen the mercury level is raised above a ana E is evacuated, the system acts as combined gas buret and m anom eter and the am ount of ad
sórbate adm itted can be calculated
/ ■ ih— vocuum f r o m t h e g a s11 T laws. Adsorption
occurs when A is 11 cooled in a suit-
<5os able ba th—liquidnitrogen, for example—to m ark »ii and stopcock 1 o p e n e d . B y raising or lowering
B, = |0 cc the mercury levelB,= 2 0 cc to t h ,e fiv ,e e n -
graved marks, m,between th e bulbs of th e gas buret, five points on the a d s o r p t io n iso therm can be determined.
T h e v o lu m e from stopcock 1 to A m ust be determined by blank runs w ith A both a t normal tem perature and im-
Figure 1. Apparatus mersed in the refrigerant.
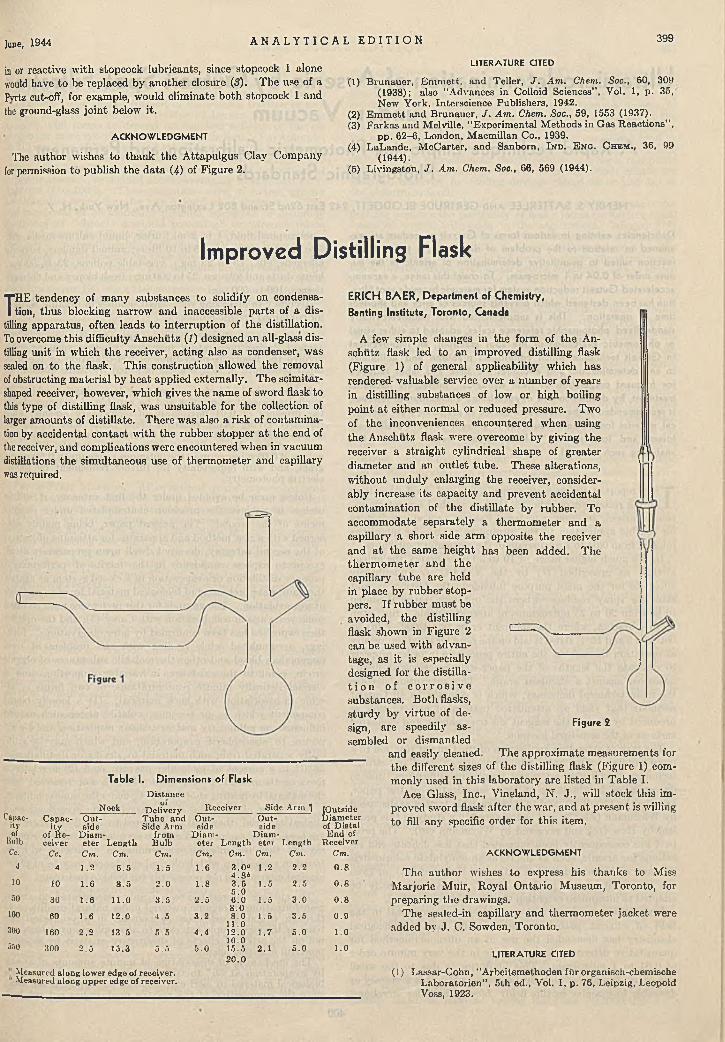
June, 1944 A N A L Y T I C A L E D I T I O N 399
in or reactive w ith stopcock lubricants, since stopcock 1 alone would have to be replaced by another closure (3). The use of a Pyrtz cut-off, for example, would elim inate both stopcock 1 and the ground-glass jo in t below it.
ACKNOW LEDGMENT
The author wishes to th an k th e A ttapulgus Clay Company for permission to publish the da ta (4) of Figure 2.
LITERATURE CITED
(1) B runauer, E m m ett, and Teller, J . A m . Chem. Soc., 60, 309(1938); also "A dvances in Colloid Sciences” , Vol. 1, p. 35, New York, Interscience Publishers, 1942.
(2) E m m ett and B runauer, J . A m . Chem. Soc., 59, 1553 (1937).(3) Farkas and Melville, "Experim ental M ethods in Gas R eactions” ,
pp. 62-6, London, M acmillan Co., 1939.(4) LaLande, M cC arter, and Sanborn, I n d . E n o . C h e m ., 36, 99
(1944).(5) Livingston, J . Am . Chem. Soc., 66, 569 (1944).
Improved Distilling Flask
T HE tendency of m any substances to solidify on condensation, thus blocking narrow and inaccessible parts of a dis
tilling apparatus, often leads to in terruption of the distillation. To overcome th is difficulty Anschutz (I) designed an all-glass distilling unit in which th e receiver, acting also as condenser, was sealed on to the flask. T his construction allowed th e removal of obstructing m aterial by heat applied externally. T he scim itar- shaped receiver, however, which gives the nam e of sword flask to this type of distilling flask, was unsuitable for the collection of larger amounts of distillate. There was also a risk of contam ination by accidental contact w ith the rubber stopper a t th e end of the receiver, and complications were encountered when in vacuum distillations the sim ultaneous use of therm om eter and capillary was required.
Table I. Dimensions of FlaskD istance
E R IC H B A E R , Department of Chemistry,
Banting Institute, Toronto, Canada
A few simple changes in the form of the Anschutz flask led to an im proved distilling flask (Figure 1) of general applicability which has rendered- valuable service over a num ber of years in distilling substances of low or high boiling point a t either normal or reduced pressure. Two of th e inconveniences encountered when using the Anschutz flask were overcome by giving the receiver a stra igh t cylindrical shape of greater diam eter and an ou tlet tube. These alterations, w ithout unduly enlarging th e receiver, considerably increase its capacity and prevent accidental contam ination of the d istillate by rubber. To accom modate separately a therm om eter and a capillary a short side arm opposite the receiver and a t th e same height has been added. The th e rm o m e te r an d th e capillary tube are held in place by rubber stoppers. If rubber m ust be avoided, th e distilling flask shown in Figure 2 can be used w ith advantage, as it is especially designed for the distilla- t i o n o f c o r r o s i v e substances. B oth flasks, sturdy by v irtue of design, are speedily assembled or dism antled
and easily cleaned
Figure 2
Capacityof
Bulb
Neck OID elivery R eceiver Side A rm T (Outside
D iam eter of D istal E n d of
R eceiver
C apac-
o f % -ceiver
O utside
D iam eter Length
T u b e and Side Arm
from Bulb
O utside
D iam ete r L ength
O u tside
D iam e te r Length
Cc. ■ Cc. Cm. Cm. Cm. Cm. Cm. Cm. Cm. Cm.4 4 1.2 6 .5 1.5 1 .6 3 .0 ° 1 .2 2 .2 0 .8
10 10 1 .6 8 .5 2 .0 1 .84.8*>3 .5 1 .5 2 .5 0 .8
50 30 1 .6 11.0 3 .5 2 .55 .06 .0 1 .5 3 .0 0 .8
100 60 1 .6 12 .0 4 .5 3 .28 .08 .0 1 .5 3 .5 0 .9
300 160 2 .2 13.5 5 .5 4 .411 .012.0 1 .7 5 .0 1 .0
550 300 2 .5 15.3 5 .5 5 .016.015.5 2 .1 5 .0 1 .020.0
1 M easured along lower edge of receiver.1 M easured along upper edge of receiver.
The approxim ate m easurem ents for the different sizes of the distilling flask (Figure 1) commonly used in this laboratory are listed in Table I.
Ace Glass, Inc., Vineland, N . J., will stock th is im proved sword flask after the war, and a t present is willing to fill any specific order for th is item.
ACKNOWLEDGMENT
T he au thor wishes to express his thanks to Miss M arjorie M uir, Royal O ntario M useum, Toronto, for preparing the drawings.
T he sealed-in capillary and therm om eter jacket were added by J. C. Sowden, Toronto.
LITERATURE CITED
(1) Lassar-Cohn, "A rbeitsm ethoden fa r organisch-chemische Laboratorien” , 5th ed., Vol. 1, p. 76, Leipzig, Leopold Voss, 1923.
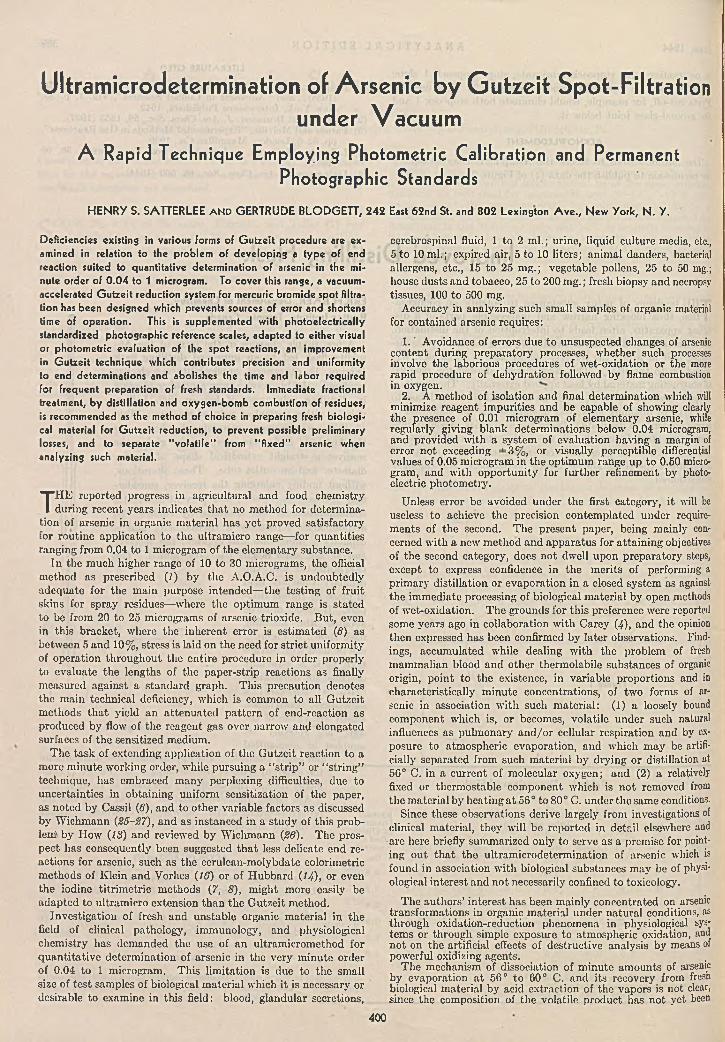
Ultramicrodetermination of A rsen ic by Gutzeit Spot-Filtration under Vacuum
A Rapid Technique Em ploying Photometric Calibration and Permanent Photographic Standards
H E N R y S. S A T T E R L E E a n d G E R T R U D E B L O D G E T T , 242 East 62nd St. and 802 Lexington A v e ., N ew Yo rk, N . Y .
Deficiencies existing in various forms of G utzeit procedure are examined in relation to the problem of developing a type of end reaction suited to quantitative determination of arsenic in the minute order of 0 .0 4 to 1 microgram. To cover this range, a vacuum- accelerated G utzeit reduction system for mercuric bromide spot filtration has been designed which prevents sources of error and shortens time of operation. This is supplemented with photoelectrically standardized photographic reference scales, adapted to either visual or photometric evaluation of the spot reactions, an improvement in G utzeit technique which contributes precision and uniformity to end determinations and abolishes the time and labor required for frequent preparation of fresh standards. Immediate fractional treatment, by distillation and oxygen-bom b combustion of residues, is recommended as the method of choice in preparing fresh bio log ical material for G utzeit reduction, to prevent possible preliminary losses, and to separate “ volatile” from "fixed” arsenic when analyzing such material.
T H E reported progress in agricultural and food chemistry during recen t years indicates th a t no m ethod for determ ina
tion of arsenic in organic m aterial has y e t proved satisfactory for routine application to th e ultram icro range—for quantities ranging from 0.04 to 1 microgram of the elem entary substance.
In the m uch higher range of 10 to 30 micrograms, the official method as prescribed ( /) by th e A.O.A.C. is undoubtedly adequate for the m ain purpose intended—the testing of fru it skins for spray residues—where the optim um range is sta ted to be from 20 to 25 micrograms of arsenic trioxide. B ut, even in this bracket, where the inherent error is estim ated (6) as between 5 and 10%, stress is laid on the need for s tr ic t uniform ity of operation throughout th e entire procedure in order properly to evaluate th e lengths of the paper-strip reactions as finally measured against a standard graph. T his precaution denotes the m ain technical deficiency, which is common to all G utzeit methods th a t yield an a ttenuated pa tte rn of end-reaction as produced by flow of the reagent gas over narrow and elongated surfaces of the sensitized medium.
T he ta sk of extending application of the G utzeit reaction to a more m inute working order, while pursuing a “ s trip ” or “ string” technique, has embraced m any perplexing difficulties, due to uncertainties in obtaining uniform sensitization of the paper, as noted by Cassil (<?), and to o ther variable factors as discussed by W ichm ann {25-27), and as instanced in a study of this problem by How {13) and reviewed by W ichm ann {26). The prospect has consequently been suggested th a t less delicate end reactions for arsenic, such as the ccrulean-m olybdatc colorimetric m ethods of Klein and Vorhes {16) or of H ubbard {14), or even the iodine titrim etric m ethods {7, 8), m ight more easily be adapted to ultram icro extension th an th e G utzeit method.
Investigation of fresh and unstable organic m aterial in th e field of clinical pathology, immunology, and physiological chem istry has dem anded the use of an ultram icrom ethod for quan tita tive determ ination of arsenic in the very m inute order of 0.04 to 1 microgram. T his lim itation is due to the small size of te s t sam ples of biological m aterial which it is necessary or desirable to examine in th is field: blood, glandular secretions,
cerebrospinal fluid, 1 to 2 m l.; urine, liquid culture media, etc.,5 to 10 m l.; expired air, 5 to 10 liters; anim al danders, bacterial allergens, etc., 15 to 25 m g.; vegetable pollens, 25 to 50 mg.; house dusts and tobacco, 25 to 200 m g.; fresh biopsy and necropsy tissues, 100 to 500 mg.
A ccuracy in analyzing such small samples of organic material for contained arsenic requires:
1 . ' Avoidance of errors due to unsuspected changes of arsenic content during preparatory processes, w hether such processes involve th e laborious procedures of wet-oxidation or the more rapid procedure of dehydration followed by flame combustion in oxygen.
2. A method of isolation and final determ ination which will minimize reagent im purities and be capable of showing clearly th e presence of 0.01 microgram of elem entary arsenic, while regularly giving blank determ inations below 0.04 microgram, and provided w ith a system of evaluation having a margin of error no t exceeding ± 3 % , or visually perceptible differential values of 0.05 microgram in the optim um range up to 0.50 microgram , and w ith opportunity for fu rther refinem ent by photoelectric photom etry.
Unless error be avoided under the first category, i t will be useless to achieve th e precision contem plated under requirem ents of the second. T he present paper, being m ainly concerned w ith a new m ethod and appara tus for a tta in ing objectives i of the second category, does n o t dwell upon preparatory steps, except to express confidence in the m erits of performing a prim ary distillation or evaporation in a closed system as against the im m ediate processing of biological m aterial by open methods of wet-oxidation. The grounds for th is preference wrere reported some years ago in collaboration w ith Carey (4), and the opinion then expressed has been confirmed by la ter observations. Findings, accum ulated while dealing w ith the problem of fresh m am m alian blood and o ther therm olabile substances of organic origin, po in t to the existence, in variable proportions and in characteristically m inute concentrations, of twro forms of arsenic in association w ith such m aterial: (I) a loosely boundcom ponent which is, or becomes, volatile under such natural influences as pulm onary an d /o r cellular respiration and by exposure to atm ospheric evaporation, and which m ay be artificially separated from such m aterial by drying or distillation at 56° C. in a current of molecular oxygen; and (2) a relatively fixed or therm ostable com ponent which is no t removed from the m aterial by heating a t 56° to 80° C. under the same conditions.
Since these observations derive largely from investigations of clinical m aterial, they will be reported in detail elsewhere and
■are here briefly sum m arized only to servo as a promise for pointing o u t th a t the ultram icrodeterm ination of arsenic which is found in association w ith biological substances m ay be of physiological in terest and no t necessarily confined to toxicology.
The authors’ in terest has been m ainly concentrated on arsenic transform ations in organic m aterial under na tu ra l conditions, as through oxidation-reduction phenom ena in physiological system s or through simple exposure to atm ospheric oxidation, and no t on the artificial effects of destructive analysis by means of powerful oxidizing agents.
The mechanism of dissociation of m inute am ounts of arsenic by evaporation a t 56° to 60° C. and its recovery from fresh biological m aterial by acid extraction of the vapors is not clear, since the composition of the volatile product has no t yet been
400
determined. I t is presumed to be derived by the splitting off of a labile arsenic group from an arsenoprotein, bu t w hether th is is an arsonium group, an alkyl arsinc, or simply arsenic trihydride is not known. T he arsenic content of the volatile fraction in proportion to th a t of the dried residue of hum an blood, is very variable, and seems to depend on age and activ ity of the organism, or more specifically on body metabolism. For example; in 212 analyses of hum an blood taken from 51 adult individuals, the average “ to ta l arsenic” found was 59.14 micrograms per 100 cc., ranging from 10 to 190 micrograms, w ith the proportion of “volatile arsenic” , as defined above, averaging 40.57% and vary ing from 0 to 100%. These variations were, of course, greater for the entire series th an for any individual of th e group, which was composed of 33 am bulant patients, suspected or definitely diagnosed as “ chronic arsenical poisoning” or “arsenic retention”, 13 cases “ for diagnosis” , 2 cases of “hyperallcrgic sta te” , and only 3 "norm al” healthy individuals. Of these la tte r, 2 had an average “to ta l arsenic” in their blood of 25.5 micrograms per 100 cc. with 85% "volatile” , and the th ird norm al individual (in the 28th week of pregnancy) showed a to ta l blood-arsenic of 180 micrograms per 100 cc., which corresponded to th e physiological increase during gestation, as shown by G uthm ann and Grass (12). In this last case th e interesting features were th a t the "volatile arsenic” fraction was 100%, and the expircd-air test, performed a t the same tim e, showed 50 micrograms of arsenic per 100 liters as collected directly through the vacuum extraction train, and was the highest te s t on exhaled air which has been recorded in the au thors’ series.
There can be no doubt th a t the sensitiveness of th e G utzeit arsine-mercuric brom ide end reaction is, per se, sufficient to m eet the exacting requirem ents indicated above. There are, however, certain faults in th e accepted G utzeit techniques as affecting ultramicrodeterminntions which dem and correction in order to extend its usefulness to th a t range.
Paper-St r ip M e th o d . A fter several years’ experience with Gutzeit reactions produced by th e paper-strip method it became evident to the authors th a t the inaccuracies'and disadvantages of this system of end reaction, as compared w ith the paper-disk method, are a ttribu tab le to : (1) difficulties in appraisem ent of stains representing less than 2 micrograms, because of unequal distribution on opposite sides of th e strip and inconspicuous intensification along the free edge of the paper and (2) instability of reactions on th e “ standard” tes t strips used as criteria for quantitative evaluation. R apid fading, which m ay escape a tten tion in the higher ranges, is very noticeable in the low values and renders such strips unreliable as scales of reference w ithin a few hours. H ere follows a disadvantage common to both strip and disk systems—th e labor and tim e involved in frequent production of fresh standards for comparison.
D isk M e t h o d s . F aults which are particularly a ttribu tab le to the various G utzeit disk or diaphragm m ethods proceed mainly from the heating process a t the hydrogen generator, a necessary feature w ith all positive-pressure system s of disk filtration in order to obtain a prom pt and clear-cut reaction upon the sensitized medium. T his applies no t only to the smaller (5-mm. diameter) areas and to th e standard 6.5-mm. disk which is prescribed by the B ritish Pharm acopoeia (3) b u t to methods (17) employing filtration areas as large as 20 mm. in diam eter. Boiling or lesser heating of the zinc-acid m ixture is undesirable since it not only causes irregular action w ith fluctuating pressures w ithin the confines of a small generating vessel having a resistant outlet, bu t produces an uneven flow of gas and a tendency to excessive heat a t the absorption level. T his has in some instances(2) been lessened by use, of a m anom eter side arm attached to the generator which provides some cushioning effect on pressure osculations. In other forms of apparatus (17) irregularities are lessened while the to ta l pressure w ithin the system is raised, by forcing hydrogen or nitrogen gas in to the generator from outside the system.
Some analysts (11) place a heating lim itation of from 40° to o0 C. in the reducing vessel and aim to prom ote a rapid evolu- t;on of hydrogen gas by means of catalytic “ im purities” in the zinc reagent; e ither accidental ingredients, or purposely alloyed with the zinc, as for example, 0.3% of copper (24). O ther analysts (10, 20) insist on a relatively slow ra te of gas evolution and rely mainly on a stannous chloride activation of the zinc tor augmenting ac tiv ity of the hydrogen gas so produced.
Gutzeit disk system s under varying degrees of positive pressure, as commonly practiced, thus appear to present a dilemma, in th a t
icy require heat to accelerate gas form ation and to m aintain sufficient pressure to force a current of gas through the filter medium against the internal resistance of the system plus a t
June, 1944
mospheric pressure beyond the filter disk; while, on the other hand, this same internal pressure factor works against the evolution of gas a t the source and raises th e boiling point in the generator. Irregular gas production thus becomes inevitable and results in an in term itten t or irregular delivery of gas a t the reaction level of the filter disk, while excessive heat in th e generato r carries w ater vapor to all levels. These conditions tend to wash away some of th e water-soluble arsenic-m ercury halide stain after its deposition on the filtcr-disk, causing a m argínate diffusion of th e reaction or uneven staining. Such effects are lessened, however, by cooling devices placed a t or ju s t below the absorption level.
Finally, there exists in all G utzeit system s which operate under positive pressure th e possibility of leaky joints perm itting small losses of arsenic trihydride to th e atm osphere. Alleged (15) partia l losses of arsenic hydride a t the absorption level by passage through the sensitized filter disk, w ith failure to react on the mercuric halide, probably do no t occur in ranges of concentration below 10 micrograms, even under boiling conditions, as was s Iio w d long ago by B ird (2) and later by Cribb (10).
While m ost of these objectionable features have been stressed by early workers (23), recognized by la te r critics (19, 20) of G utzeit technique, and to some ex ten t corrected as affecting the semimicro range of determ ination, th e authors have found them seriously detrim ental in the micro range and a complete obstacle to successful practice in th e ultram icro range.
A fter experim enting for more th an a year w ith various forms of electrolytic cells in seeking to produce atom ic hydrogen under instrum ental control, the complicating factors so introduced, especially the unpredictable influence of overvoltage upon the more sensitive (m ercury) types of electrodes, led the authors to abandon hope of finding a completely reliable electrolytic method and to concentrate upon a vacuum system as the best m eans for correcting the faults of the zinc-acid generator. T hey then discovered th a t a system of spot-filtration securely closed against leakage could be ensured under a low vacuum , and th a t, when operated a t from 0.25 to 0.5 atm ospheric pressure, th is system would yield more uniform and prom pt end reactions w ith better control of hea t and m oisture a t th e absorption level than could otherwise be produced upon a Gutzeit-sensitizcd medium. By this means, under instrum ental control, they furtherm ore found th a t the developm ent of active hydrogen in the usual zinc-acid m ixture is m arkedly increased and th a t the whole reduction process proceeds evenly to a conclusion w ithin 15 m inutes. Gas- current im pedance in the scrubber, and a t th e filter disk, is overcome by th is device and the end reaction is rendered in sharp dem arcation upon a precisely m easured circular area of the sensitized paper. F or ultram icrodeterm inations, th e reactive area m ay be reduced as lowr as 3.17 mm. (0.125 inch) in diam eter, or i t m ay be suited to any preferred range of operation by ad justing the caliber of th e filtration je t to 6.35 mm. (0.25 inch) or' larger, w ith corresponding ad justm ent of the vacuum.
R ealization of these characteristics finally provided an opportu n ity for applying photographic and photom etric m ethods to quan tita tive evaluation of the G utzeit end reaction, a project found im practicable w ith either strip or thread reactions. The use of photographic step scales for perm anent standards of reference, as here reported, has now been practiced in th is laboratory for more th an two years; i t is so far beyond th e experim ental stage th a t the authors do no t hesitate to recom mend it as an im portan t tim e- and labor-saving device which also implem ents precision in the procedure here described. These artificial standards of reference consist of an accurately graded series of silver deposits photographically prin ted on brom ide paper from a m aster negative. The fineness of gradation m ay be varied to su it special requirem ents (or lim ited ranges), as is shown in Figure 4.
REAGENTS
S u l f u r i c A c id , c . p ., special arsenic-free (supplied by the J. T . B aker Chemical Co.), obtained in 500 ml. Pyrex bottles, usually rated on label as having less than “0.000000% As” .
401A N A L Y T I C A L E D I T I O N
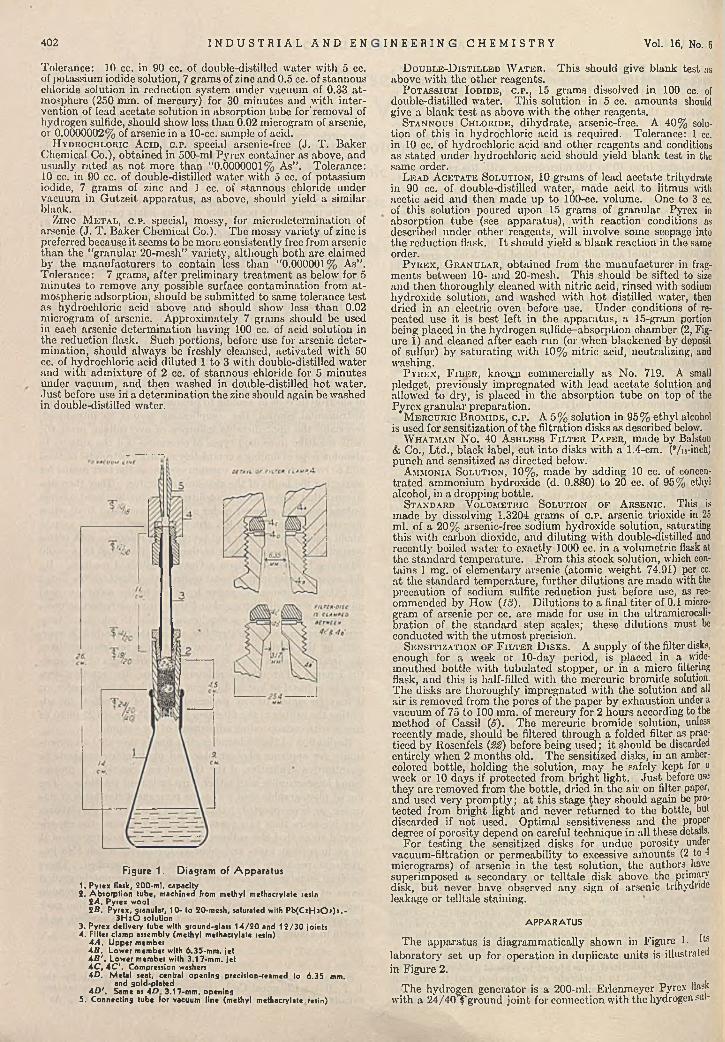
Tolerance: 10 cc. in 90 cc. of double-distilled w ater w ith 5 cc. of potassium iodide solution, 7 gram s of zinc and 0.5 cc. of stannous chloride solution in reduction system under vacuum of 0.33 a tmosphere (250 mm. of mercury) for 30 m inutes and w ith in tervention of lead acetate solution in absorption tube for'rem oval of hydrogen sulfide, should show less than 0.02 microgram of arsenic, or 0.0000002% of arsenic in a 10-cc. sample of acid.
H ydrochlo ric A c id , c.p . special arsenic-free (J. T . Baker Chemical Co.), obtained in 500-ml Pyrex container as above, and usually rated as no t more th an “0.0000001% As” . Tolerance: 10 cc. in 90 cc. of double-distilled w ater w ith 5 cc. of potassium iodide, 7 gram s of zinc and 1 cc. of stannous chloride under vacuum in G utzeit apparatus, as above, should yield a similar blank.
Zin c M e t a l , c . p . special, mossy, for m icrodetermination of arsenic (J. T . Baker Chemical Co.). T he mossy variety of zinc is preferred because it seems to be more consistently free from arsenic th an the "granular 20-mesh” variety, although both are claimed by the m anufacturers to contain less than “0.000001% As” . Tolerance: 7 grams, after preliminary treatm ent as below for 5m inutes to remove any possible surface contam ination from a tmospheric adsorption, should be subm itted to same tolerance test as hydrochloric acid above and should show less th an 0.02 microgram of arsenic. Approximately 7 gram s should be used in each arsenic determ ination having 100 cc. of acid solution in the reduction flask. Such portions, before use for arsenic determ ination, should always be freshly cleansed, activated w ith 50 cc. of hydrochloric acid diluted 1 to 3 w ith double-distilled water and w ith adm ixture of 2 ce. of stannous chloride for 5 m inutes under vacuum, and then washed in double-distilled ho t w ater. Ju s t before use in a determ ination the zinc should again be washed in double-distilled water.
402 I N D U S T R I A L A N D EN
Figure 1. Diagram of Apparatus1. Pyrex flask, 200-m i. capacity2. Absorption tube, machined from methyl methacrylate resin
2 4 , Pyrex wool2B . Pyrex, granular, 10- to 20-mesh, saturated with P b C Q H s O i)* . -
3 H iO solution3. Pyrex delivery tube with ground-glass 1 4 /2 0 and 1 2 /3 0 joints4. Filter clamp assembly (methyl methacrylate resin)
4 4 . Upper memberA B . Low er member with 6,35-mm. jet A B f, Low er member with 3.17-mm. jetA C . A C ’ , Compression washersAD. Metal seat, central opening precision-reamed to 6,35 mm.
and gold-plated A D \ Same as A D 3.17-mm. opening
5. Connecting tube for vacuum line (methyl methacrylate resin)
D o u b l e - D i s t i l l e d W a t e r . T his should give blank test as above w ith the other reagents.
P o t a s s i u m I o d i d e , c.p ., 15 grains dissolved in 100 cc. of double-distilled water. This solution in 5 cc. am ounts should give a blank tes t as above w ith the other reagents.
S t a n n o u s C h l o r i d e , dihydrate, arsenic-free. A 4 0 % solution of this in hydrochloric acid is required. Tolerance: 1 cc. in 10 cc. of hydrochloric acid and other reagents and conditions as sta ted under hydrochloric acid should yield blank test in the same order.
L e a d A c e t a t e S o l u t i o n , 10 gram s of lead acetate trihydrate in 90 cc. of double-distilled w ater, made acid to litmus with acetic acid and then m ade up to 100-ec. volume. One to 3 cc. of th is solution poured upon 15 gram s of granular Pyrex in absorption tube (see apparatus), w ith reaction conditions as described under other reagents, will involve some seepage into the reduction flask. I t should yield a b lank reaction in the same order.
P y r e x , G r a n u l a r , obtained from the m anufacturer in fragm ents between 10- and 20-mesh. T his should be sifted to size and th en thoroughly cleaned w ith nitric acid, rinsed with sodium hydroxide solution, and washed w ith ho t distilled water, then dried in an electric oven before use. U nder conditions of re-Eeated use it is best left in the apparatus, a 15-gram portion
eing placed in the hydrogen sulfide-absorption chamber (2, Figure 1) and cleaned after each run (or when blackened by deposit of sulfur) by saturating w ith 10% nitric acid, neutralizing, and washing.
P y r e x , F i b e r , known commercially as No. 719. A small pledget, previously im pregnated w ith lead acetate ¡Solution and allowed to dry, is placed in the absorption tube on top of the Pyrex granular preparation.
M e r c u r ic B r o m id e , c .p . A 5% solution in 95% ethyl alcohol is used for sensitization of the filtration disks as described below.
W h a t m a n N o. 4 0 A s h l e s s F i l t e r P a p e r , made by Balstou & Co., L td ., black label, cu t into disks w ith a 1.4-cm. (9/i«-inch) punch and sensitized as directed below.
A m m o n ia S o l u t i o n , 10%, made by adding 10 cc. of concentra ted ammonium hydroxide (d. 0.880) to 20 cc. of 95% ethyl alcohol, in a dropping bottle.
S t a n d a r d V o l u m e t r ic S o l u t io n o f A r s e n i c . This is made by dissolving 1.3204 grams of c . p . arsenic trioxide in_25 ml. of a 20% arsenic-free sodium hydroxide solution, saturating th is w ith carbon dioxide, and diluting w ith double-distilled and recently boiled w ater to exactly 1000 cc. in a volumetric flask at the standard tem perature. From th is stock solution, which contains 1 mg. of elem entary arsenic (atomic weight 74.91) per cc. a t the standard tem perature, further dilutions are made with the precaution of sodium sulfite reduction ju s t before use, as recommended by How (15). D ilutions to a final tite r of 0.1 microgram of arsenic per cc. are made for use in the ultramicrocalibration of the standard step scales; these dilutions must be conducted w ith the utm ost precision.
S e n s i t iz a t i o n o f F i l t e r D i s k s . A supply of the filter disks, enough for a week or 10-day period, is placed in a widem outhed bottle w ith tubulated stopper, or in a micro filtering flask, and this is half-filled w ith the mercuric bromide solution. The disks are thoroughly im pregnated w ith the solution and all air is removed from the pores of the paper by exhaustion under a vacuum of 75 to 100 mm. of m ercury for 2 hours according to the method of Cassil (5). The mercuric bromide solution, unless recently made, should be filtered through a folded filter as practiced by Rosenfels (55) before being used; it should be discarded entirely when 2 m onths old. The sensitized disks, in an ambcr- colorca bottle, holding the solution, m ay be safely kept for a week or 10 days if protected from bright light. Ju s t before use they are removed from the bottle, dried in the air on filter paper, and used very prom ptly; a t th is stage they should again be protected from bright light and never returned to the bottle, but discarded if no t used. Optim al sensitiveness and the proper degree of porosity depend on careful technique in all these details.
F or testing the sensitized disks for undue porosity under vacuum -filtration or perm eability to excessive amounts (2 to 1 micrograms) of arsenic in the tes t solution, the authors have superimposed a secondary or telltale disk above the primary disk, b u t never have observed any sign of arsenic tnhydride leakage or telltale staining.
A P P A R A T U S
The apparatus is diagram m atically shown in Figure 1. b-s laboratory set up for operation in duplicate units is illustrated in Figure 2.
T he hydrogen generator is a 200-ml. Erlenm eyer Pyrex flask w ith a 24 /40 'Tground jo in t for connection with the hydrogen sul-
I N E E R I N G C H E M I S T R Y Vol. 16, No. 6
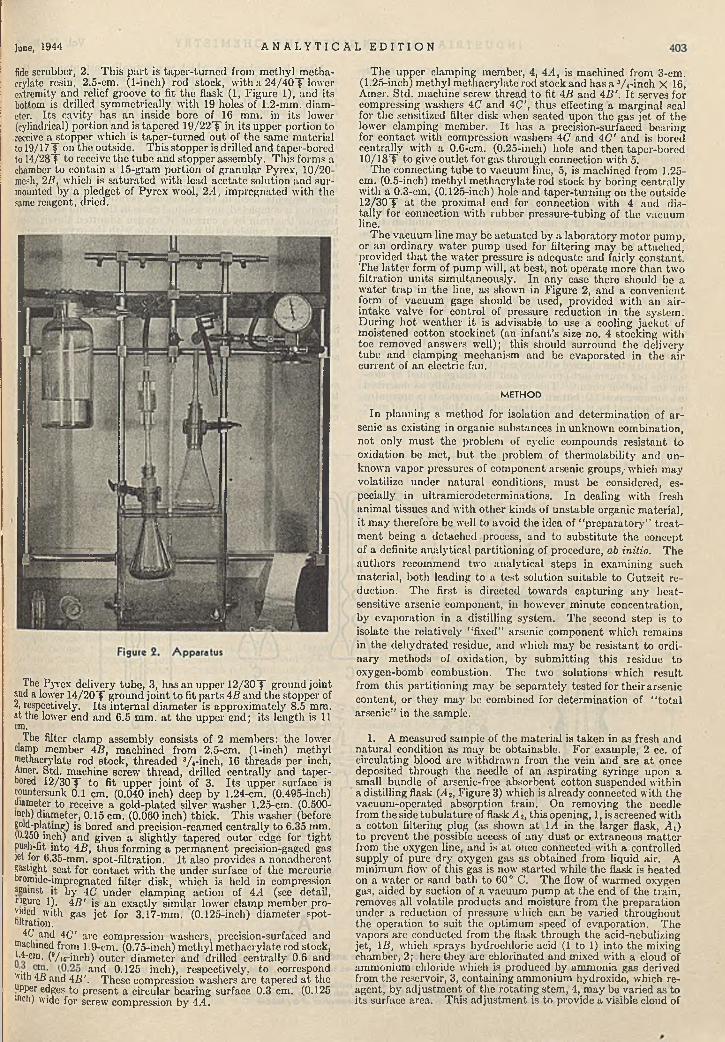
June, 1944 A N A L Y T I C A L E D I T I O N
fide scrubber, 2. This p a rt is taper-turned from m ethyl m ethacrylate resin, 2.5-em. (1-inch) rod stock, with a 2 4 /4 0 f lower extremity and relief groove to fit the flask (1, Figure 1), and its bottom is drilled sym metrically w ith 19 holes of 1.2-mrn. diameter. Its cavity has an inside bore of 16 mm. in its lower (cylindrical) portion and is tapered 19/22"$" in its upper portion to receive a stopper which is taper-turned ou t of the same material to 19/17T on the outside. This stopper is drilled and taper-bored to 14/28"$" to receive the tube and stopper assembly. This forms a chamber to contain a 15-gram portion of granular Pyrex, 10/20- mcsh, 2/1, which is sa tu rated w ith lead acetate solution and surmounted by a pledget of Pyrex wool, 2/1, im pregnated with the same reagent, dried.
The upper clamping member, 4, 4A, is machined from 3-em. (1.25-inch) m ethyl m ethacrylate rod stock and has a V i-inch x 16, Amer. S td. machine screw thread to fit 4B and 4/1'. I t serves for compressing washers 4C and 4C ', thus effecting a m arginal seal for the sensitized filter disk when seated upon the gas je t of th e lower clamping member. I t has a precision-surfaced bearing for contact w ith compression washers 4(7 and 4C' and is bored centrally w ith a 0.6-cm. (0.25-inch) hole and then taper-bored 10/181" to give outlet for gas through connection w ith 5.
T he connecting tube to vacuum line, 5, is machined from 1.25- cm. (0.5-inch) m ethyl m ethacrylate rod stock by boring centrally with a 0.3-cm. (0.125-inch) hole and taper-turning on the outside 12/30 f a t the proximal end for connection with 4 and dis- tally for connection with rubber pressure-tubing of the vacuum line.
The vacuum line m ay be actuated by a laboratory m otor pum p, or an ordinary w ater pum p used for filtering m ay be attached, provided th a t the w ater pressure is adequate and fairly constant. T he la tte r form of pum p will, a t best, no t operate more than two filtration units simultaneously. In any case there should be a w ater trap in the line, as shown in Figure 2, and a convenient form of vacuum gage should be used, provided w ith an air- intake valve for control of pressure reduction in the system. D uring ho t w eather i t is advisable to use a cooling jacket of moistened cotton stockinet (an in fan t’s size no. 4 stocking with toe removed answers well); this should surround the delivery tube and clamping mechanism and be evaporated in the air current of an electric fan.
METHOD
In planning a m ethod for isolation and determ ination of a rsenic as existing in organic substances in unknown combination, no t only m ust the problem of cyclic compounds resistant to oxidation be met, bu t the problem of therm olability and unknown vapor pressures of component arsenic groups,- which may volatilize under na tu ra l conditions, m ust be considered, especially in ultram icrodctcrm inations. In dealing w ith fresh anim al tissues and w ith o ther kinds of unstable organic m aterial, it m ay therefore be well to avoid the idea of “ p reparatory” tre a tm ent being a detached process, and to substitu te th e concept of a definite analytical partitioning of procedure, ab initio. T he authors recommend two analytical steps in examining such m aterial, both leading to a tes t solution suitable to G utzeit reduction. The first is directed tow ards capturing any heat- sensitive arsenic component, in however m inute concentration, by evaporation in a distilling system. The second step is to isolate th e relatively "fixed” arsenic com ponent which rem ains in the dehydrated residue, and which m ay be resistant to ordinary m ethods of oxidation, by subm itting this residue to oxygen-bomb combustion. The two solutions which resu lt from th is partitioning m ay be separately tested for their arsenic content, or they m ay be combined for determ ination of “ to ta l arsenic” in the sample.
1. A measured sample of the m aterial is taken in as fresh and natu ral condition as m ay be obtainable. For example, 2 cc. of circulating blood are w ithdrawn from the vein and are a t once deposited through the needle of an aspirating syringe upon a small bundle of arsenic-free absorbent cotton suspended within a distilling flask (/12, Figure 3) which is already connected with the vacuum -operated absorption train . On removing the needle from the side tubulature of flask A t, this opening, 1, is screened w ith a cotton filtering plug (as shown a t 1A in the larger flask, A i) to p revent the possible access of any dust or extraneous m a tte r from the oxygen line, and is a t once connected w ith a controlled supply of pure dry oxygen gas as obtained from liquid air. A minimum flow of th is gas is now started while the flask is heated on a w ater or sand bath to 60° C. T he flow of warmed oxygen gas, aided by suction of a vacuum pum p a t the end of the tra in , removes all volatile products and moisture from the preparation under a reduction of pressure which can be varied throughout the operation to suit the optimum speed of evaporation. T he vapors are conducted from the flask through the acid-nebulizing jet, IB , which sprays hydrochloric acid (1 to 1) into the mixing chamber, 2; here they are chlorinated and mixed w ith a cloud of ammonium chloride which is produced by amm onia gas derived from the reservoir, 3, containing ammonium hydroxide, which reagent, by adjustm ent of the rotating stem , 4, m ay be varied as to its surface area. T his adjustm ent is to provide a visible cloud of
The Pyrex delivery tube, 3, has an upper 12/30"$" ground joint and a lower 1 4 /2 0 f ground jo in t to fit p arts 4B and the stopper of 2, respectively. I ts in ternal diam eter is approxim ately 8.5 mm. at the lower end and 6.5 mm. a t the upper end; its length is 11 cm.
The filter clamp assembly consists of 2 members: the lower damp member 4B, machined from 2.5-cm. (1-inch) methyl methacrylate rod stock, threaded 3/<-meh, 16 threads per inch, Amer. Std. machine screw thread , drilled centrally and taper- bored 12/301" to fit upper jo in t of 3. I ts upper surface is countersunk 0.1 cm. (0.040 inch) deep by 1.24-cm. (0.495-inch) diameter to receive a gold-plated silver washer 1.25-cm. (0.500- inch) diameter, 0.15 cm. (0.060 inch) thick. This washer (before pd-platm z) is bored and precision-reamed centrally to 6.35 mm. 1*1.250 inch) and given a slightly tapered outer edge for tight push-fit into 4/7, thus forming a perm anent precision-gaged gas jet for 0.35-mm. spot-filtration. I t also provides a nonadherent gastight seat for contact w ith the under surface of the mercuric bromide-impregnated filter disk, which is held in compression against it by 4(7 under clamping action of 4.4 (see detail, figure 1). 4/7' is an exactly similar lower clamp member provided with gas je t for 3.17-mm. (0.125-inch) diam eter spot- hltration.
4(7 and 4C' are compression washers, precision-surfaced and machined from 1.9-cm. (0.75-inch) m ethyl m ethacrylate rod stock, L4-cm. (!/ic-inrh) outer diam eter and drilled centrally 0.6 and v'n i' d' anc* 0.125 inch), respectively, to correspond'ith 4/7 and 4/7'. These compression washers are tapered a t the upper edges to present a circular bearing surface 0.3 cm. (0.125 mch) wide for screw compression by 4.4.

A fter the combustion, which is practically instantaneous, the gases and smoke are completely exhausted from the bomb through its outlet, 4, which is connected to the same absorption train , B, C, C', D, as described in the first instance. In this case the am m onium ions which are given off from the amm onium hydroxide in the com m unicating reservoir, 3, of the nebulizing chamber, B, 2, combining w ith the spray of hydrochloric acid, serve prim arily to effect an amm onium chloride cloud precipitation of all smoke particles w ithin the globular portion of th is chamber. Thence the combustion gases are conducted under action of the vacuum pum p into the remaining units of the extraction tra in which have been provided with the same reagents used in the previous operation. W hen the exhaustion is completed, any residual gases in th e bomb are washed through the tra in by a current of oxygen adm itted through the bomb inlet, 3, which is still in connection w ith the oxygen supply. The resulting extracts, combined w ith bomb residues and all washings from bomb and train , are similarly made up to 100 cc. in volume to form another te s t solution which represents the second analytical fraction, or relatively "fixed” arsenic, of the original sample. B oth te s t solutions m ay be reduced separately, or combined and determ ined as “ to ta l arsenic” .
I s o l a t i o n a n d D e t e r m i n a t i o n o f A r s e n i c f r o m T est S o l u t i o n s . W hatever the previous analytical procedure may have been, th e te s t m aterial is assumed a t th is stage to be in acid aqueous solution.
The degree of acidity, if no t known, should be determined and ad justed to approxim ately 12% hydrochloric acid, when brought to 100 cc. in volume. T his test solution, containing the arsenic which is to be isolated as 'ursine and then quantitatively determined, is placed in the hydrogen generator flask (1, Figure 1)
ammonium chloride in the combined vapors to serve as an indicator of the ra te of absorption throughout units C, C', and D of t he tra in , all of which contain sulfuric acid (1 to 3).
The tem perature in th e distilling flask is m aintained a t 60° to 80° C. until there rem ains only- a desiccated residue. In the case of 2-ec. samples of blood, th is procedure requires about 30 m inutes and somewhat longer for similar am ounts of other animal and vegetable tissues. For larger (5- to 15-cc.) samples of liquids, such as urine and liquid culture media, a larger flask, A u w ith reflux condenser is used, and evaporation is proportionately prolonged. T he heat-labile components and m ost of the moisture having been evaporated and extracted in the absorption train , the vacuum line and oxygen supply are disconnected. All extracts, w ith washings from the train , are then made suitable to G utzeit reduction (12% acid concentration) by dilution to a volume of about 100 cc. This constitutes a tes t solution representing the first or “volatile” fraction of the sample under analysis.
2. In the second analytical step, the dehydrated re s id u e - consisting, in th e case chosen, of dried blood on cotton—is prom ptly removed from flask Aj, Figure 3, and placed in the cradle fixture, 13, of the oxygen bomb, Aa, where its contained fuse wire, 4, is connected to the terminals, 10A and 11, of the ignition system in the bomb head, 1. The cylinder or combustion chamber, 2, supported by its clamping collar (not shown) is then raised to the closed position as indicated in A3, and there securely' sealed by a massive clamping mechanism (not shown). The bomb is then charged w ith oxygen a t 17.6 kg. per sq. cm. (250 pounds per square inch) pressure and the charge ignited by closing the ignition circuit. This process is essentially' as described in a former report (4), b u t w ith certain im provem ents in apparatus (manufactured by th e P arr Instrum en t Co., Moline, 111.) of more recent development.
Figure 3. Apparatus for Separate Determination of V olatile and Fixed A rse n ic in Small Quantities of B iological Material At, A t. Flasks for distilling and dehydrating material for analysis. A i Is for 5- to S5-cc. samples of urine, liquid culture media, etc. A , is for smaller samples, 2 to 2.9 cc.,
or grams, of b lood, fresh tissues, etc..As, A s, Right sectional views of oxygen bomb used for flame combustion of dried residues. B , C , C ' , D , E . Vacuum extraction train used in connection with A i , A j , and A j for obtaining test solutions for ultramlcrodetermination of arsenic by extraction of volatile
products of evaporation or by extraction of smoke and gases from oxygen-bom b combustion of dry residue

June, 1944 A N A L Y T I C A L E D I T I O N 405
Figure 4. Photographic Standards for V acuum -G u tze it Spot Reactions
Critical reproduction of original is limited b y photomechanical processes involved, me original step scales present 3 series of sepia tints; each series has a less steep
gradient of Intensity than is represented in the illustration.
and 5 cc. of potassium iodide w ith I cc. of stannous chloride are added. The flask is then placed in a w ater b a th a t 15° C. and ' grams of activated zinc are added; i t is then very prom ptly (10 to 15 seconds) connected to th e o ther parts of the apparatus which have previously been assembled and supplied w ith reagents, including a sensitized filter disk securely clamped in position for gas filtration under vacuum.
The vacuum pump attached to the system is then started and reduction of pressure is first ad justed to approxim ately 0.5 atmosphere (380 mm. of mercury), a t which i t is m aintained for 2 minutes. If the gas form ation in the generating flask is then not. sufficiently active, th e pressure is fu rther reduced to the Point of optim um action, which, in the authors’ experience is not below 0.25 atm osphere (190 mm. of m ercury), and is held at this point for about 10 m inutes, according to th e ac tiv ity of die gas formation. Pressure is then raised to the first level of 380 mm. of m ercury and is kep t a t th is point un til 20 m inutes in all have elapsed. D uring the run th e tem perature of the «ater bath should be from 15° to 20° C. Atmospheric pressure is restored to the system a t the end of the run by gradually admitting air through th e air-intake valve on th e vacuum gage, it is convenient to have tw o or more un its operating simultaneously on the same vacuum line (sec arrangem ent shown in figure 2).
Upon completion of the run , the filter disk bearing the spot reaction is removed from the clamping assembly and is immediately treated w ith 1 or 2 drops of the amm onia solution, which tem porarily darkens the spot te s t to some shade of warm way. The disk is now surface-dried by contact w ith clean filter Paper and a t once evaluated for arsenic conten t by comparison with a standard photographic step scale which has been calibrated to micrograms of arsenic as illustrated in Figure 4.
The degree of arsenic reaction m ay be read directly by placing the spot upon a w hite background and comparing its intensity' "'ith the shades of the photographic scale through windows which sre punched in its banded portion. A nything which appears to he less than 0.04 micrograin of arsenic in a 6.35-mm. (0.25-inch) spot test is considered a “ b lank” . This corresponds to 0.01
microgram of arsenic in the 3.17-mm. (0.125-inch) spo t tes t and is the lim it of sensitivity which th e authors have set for the method in routine practice. Incidentally , i t is a severe tes t on laboratory technique and purity of reagents and in earlier experience there have been considerable periods of tim e when, owing to a lapse of pu rity in one of the reagents, i t has been impossible, to get satisfactory b lank tests w ith the 3.17-mm. (0.125-inch) filtration area, or even w ith the 6.35-mm. (0.25-inch) area. Such Lapses were, of course, definite departures from the tolerances given above under Reagents. The fault was usually found in the sulfuric acid and was accounted for by the fact th a t th is reagent, a lthough of the highest pu rity obtainable a t the time, had been stored and m arketed by th e m anufacturers in ordinary flint- glass bottles (which are no t arsenic-free), and was probably also due to incidental air-contam ination th ro u g h 'u se of too large containers. W ith the cooperation of the m anufacturers this difficulty has been corrected and i t is now possible regularly to get satisfactory blanks (less th an 0.02 microgram) when operating w ith the 6.35-mm. (0.25-inch) filtration orifice. (The J . T . B aker Chemical Co. will now supply on request “ acid sulfuric c .p . special arsenic-free” and “ acid hydrochloric c . p . special arsenic- free” in 500 ml. glass-stoppered Pyrex bottles.)
In dealing w ith very sm all quantities of m ateria l the authors have encountered interferences from only two elem ents which m ay obscure the am m onia-treated G utzeit end reaction. In rare instances of clinical blood exam ination following a recent intravenous injection of thiosulfate (adm inistered to alleviate poisoning from overdose of a therapeutic arsenical), the hydrogen sulfide evolved in the generator has no t been completely removed by the lead acetate scrubber. This occurred no t in the volatile fraction, b u t in the residual fraction. Here, w arning is given by a rap id and intense blackening of the scrubber, and th e obvious remedy is to use a smaller sample or aliquot, which will still be adequate for determ ining arsenic concentration, which in these cases, is high. Occasionally, when samples of phos- phatic urine have been evaporated, an excessive am ount of volatile phosphorus lias distilled over a t 60° to 80° C. in to th e extraction train . In such cases, although the am m onia reagent does no t darken the yellow stain caused by phosphorus, th e am m onia-darkened reaction for arsenic will be degraded by th e interference so as to cause false readings on the scale. Smaller aliquots, or rem oval of the phosphorus by distillation w ith hydro- bromic acid as m entioned below, will preven t the difficulty.
H aving never had interferences from antim ony or selenium, the au thors believe th a t, w ith the sm all samples of m aterial needed for ultram icrodeterm inations, th is problem would arise only in exceptional circumstances, as in examining anim al blood or excretions following ingestion of seleniferous or anti- moniferous food.
In experiments w ith the addition of small am ounts of sodium selenate to tes t samples of arsenical urine, they found th a t any concentration of selenium likely to occur— i.e., under 50 micro- grams per 100 cc.— would be removed as selenium hydride along w ith hydrogen sulfide, by action of the lend acetate scrubber. In the event of combined interferences, in cases of selenium or antim ony poisoning complicated w ith arsenic poisoning of organic m aterial, they have been prepared to w'ork w ith relatively large samples and to remove phosphorus and antim ony by distilling w ith 45% hydrobromic acid and an excess of bromine into the vacuum -extraction system, thus isolating arsenic w ith selenium in the distillate; then to separate selenium from arsenic by precipitating the selenium from th e distillate w ith sulfur dioxide and hydroxylamine hydrochloride, according to the m ethod of Robinson, Dudley, Williams, and livers {21), leaving-arsenic in the filtrate to be brought into a proper tes t solution for end determ ination by the present method, choosing an aliquot suitable to the ultram icro range.
P H O T O G R A P H IC S T A N D A R D S F O R E V A L U A T I O N O F G U T Z E IT S P O TTESTS
The first essential for producing a photographic step-seale print for the evaluation of G utzeit spot tes ts is a prim ary film trans
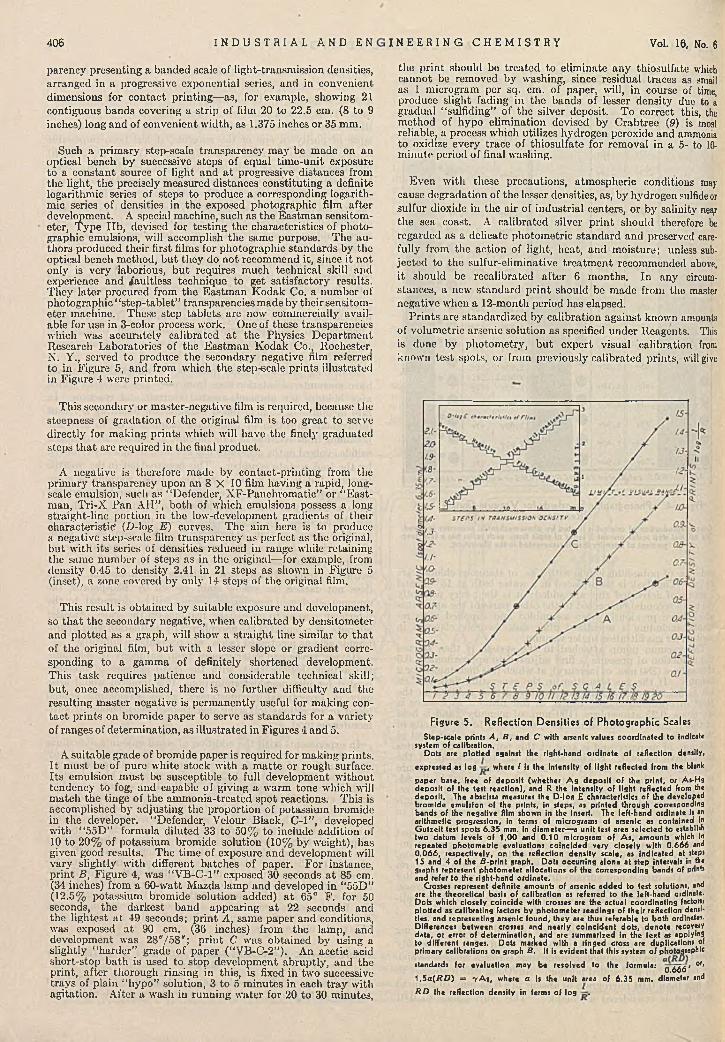
parency presenting a banded scale of iight-transm ission densities, arranged in a progressive exponential series, and in convenient dimensions for contac t printing—as, for example, showing 21 contiguous bands covering a strip of film 20 to 22.5 cm. (8 to 9 inches) long and of convenient w idth, as 1.375 inches or 35 mm.
Such a prim ary step-scale transparency m ay be made on an optical bench by successive steps of equal tim e-unit exposure to a constant source of light and a t progressive distances from the light, the precisely measured distances constituting a definite logarithmic series of steps to produce a corresponding logarithmic series of densities in the exposed photographic film after development. A special machine, such as the E astm an sensitom- eter, Type l ib , devised for testing the characteristics of photographic emulsions, will accomplish the same purpose. The authors produced their first films for photographic standards by the optical bench method, bu t they do no t recom mend it, since it not only is very laborious, b u t requires much technical skill and experience and /au ltlcss technique to get satisfactory results. They later procured from the E astm an K odak Co. a num ber of photographic “ step-tablet” transparencies made by the ir sensitom- eter machine. These step tab lets are now commercially available for use in 3-color process work. One of these transparencies which was accurately calibrated a t the Physics D epartm ent Research Laboratories of the E astm an K odak Co., Rochester, N. Y., served to produce the secondary negative nlm referred to in Figure 5, and from which the step-ecale prin ts illustrated in Figure 4 were printed.
This secondary or m aster-negative film is required, because the steepness of gradation of the original film is too great to serve directly for m aking p rin ts which will have the finely graduated steps th a t are required in the final product.
A negative is therefore made by contact-printing from the prim ary transparency upon an 8 X 10 film having a rapid, long- scale emulsion, such as “ Defender, X F-Panchrom atic” or “ Eust- m an, T ri-X P an A H ” , both of which emulsions possess a long straight-line portion in the low-devclapment gradients of their characteristic’ (D-log E) curves. The aim here is to produce a negative step-scale film transparency as perfect as the original, bu t w ith its series of densities reduced in range while retaining the same num ber of steps as in the original— for example, from density 0.45 to density 2.41 in 21 steps as shown in Figure 5 (inset), a zone covered by only 14 steps of the original film.
This result is obtained by suitable exposure and development, so th a t the secondary negative, when calibrated by densitom eter and p lo tted as a graph, will show a stra igh t line similar to th a t of the original film, b u t w ith a lesser slope or gradient corresponding to a gamma of definitely shortened development. T his task requires patience and considerable technical skill; but, once accomplished, there is no further difficulty and the resulting m aster negative is perm anently useful for making conta c t p rin ts on bromide paper to serve as standards for a variety of ranges of determ ination, as illustrated in Figures 4 and 5.
A suitable grade of bromide paper is required for making prints. I t m ust be of pure white stock w ith a m atte or rough surface. Its emulsion m ust be susceptible to full developm ent w ithout tendency to fog, and capable of giving a warm tone which will m atch the tinge of the am m onia-treated spot reactions. T his is accomplished by adjusting the proportion of potassium bromide in the developer. “ Defender, Velour Black, C - l” , developed with “ 55D” formula diluted 33 to 50% to include addition of 10 to 20% of potassium bromide solution (10% by weight), has given good results. The tim e of exposure and developm ent will vary slightly w ith different batches of paper. For instance, p rin t B, Figure 4, was “ VB-C-1” exposed 30 seconds a t 85 cm. (34 inches) from a 60-w att M azda lamp and developed in “ 55D” (12.5% potassium bromide solution added) a t 65° F . for 50 seconds, the darkest band appearing a t 22 seconds and th e lightest a t 49 seconds; p rin t A. same paper and conditions, was exposed a t 90 cm. (36 inches) from the lamp, and developm ent was 28"/58"; p rin t C was obtained by using a slightly “ harder” grade of paper (“ VB-C-2” ). An acetic acid short-stop bath is used to stop developm ent abruptly , and the print, a fter thorough rinsing in this, is fixed in two successive trays of plain “ hypo” solution, 3 to 5 m inutes in each tra y with agitation. After a wash in running w ater for 20 to 30 minutes,
406 I N D U S T R I A L A N D EN
the prin t should be treated to elim inate any thiosulfatc which cannot be removed by washing, since residual traces as small as 1 microgram per sq. cm. of paper, will, in course of time, produce slight fading in the bands of lesser density due to a gradual “ sulfiding” of the silver deposit. To correct this, the method of hypo elim ination devised by C rabtree (9) is most reliable, a process which utilizes hydrogen peroxide and ammonia to oxidize every trace of thiosulfatc for removal in a 5- to 10- m inute period of final washing.
Even w ith these precautions, atm ospheric conditions may cause degradation of th e lesser densities, as, by hydrogen sulfide or sulfur dioxide in the air of industrial centers, or by salinity nefg the sea coast. A calibrated silver p rin t should therefore be regarded as a delicate photom etric standard and preserved carefully from the action of light, heat, and m oisture; unless subjected to the sulfur-elim inative trea tm en t recommended above, it should be recalibrated a fter 6 m onths. In any circumstances, a new standard prin t should be made from the master negative when a 12-month period has elapsed.
P rin ts are standardized by calibration against known amounts of volum etric arsenic solution as specified under Reagents. This is done by photometry', b u t expert visual calibration from known test spots, or from previously calibrated prints, will give
I N E E R I N G C H E M I S T R Y Vol. 16, No. 6
Figure 5. Reflection Densities of Photographic ScalesStep-scale prints A , B , and C with arsenic values coordinated to indicate
system of calibration.Dots are plotted against the right-hand ordinate of reflection density,
expressed as log , where I Is the Intensity of light reflected from the blank
paper base, free of deposit (whether A g deposit of the print, or A s-H s deposit of the test reaction), and R the intensity of light reflected from the deposit. The abscissa measures the D -Io g E characteristics of the developed bromide emulsion of the prints, in steps, as printed through corresponding bands of the negative film shown in the insert. The left-hand ordinate is an arithmetic progression, in terms of micrograms of arsenic as contained in Gutzeit test spots 6.35 mm. in diameter— a unit test area selected to establish two datum levels of 1 .0 0 and 0 .1 0 micrograra of A s , amounts which in repeated photometric evaluations coincided very closely with 0 .666 and 0 ,0 6 6 , respectively, on the reflection density scale, as indicated at steps 15 and 4 of the fi-prlnt graph. Dots occurring alone at step intervals In the graphs represent photometer allocations of the corresponding bands of prints and refer to the right-hand ordinate.
Gosses represent definite amounts of arsenic added to test solutions, and are the theoretical basis of calibration as referred to the left-hand ordinate. Dots which closely coincide with crosses are the actual coordinating factors; plotted as calibrating factors b y photometer readings of their reflection densities. and representing arsenic found, they are thus referable to both ordinates. Differences between crosses and nearly coincident d o b , denote recovery data, or error of determination, and are summarized in the text as applying to different ranges. D o b marked with a ringed cross are duplications of primary calibrations on graph B . it Is evident that this system of photographicstandards for evaluation may be resolved to the formula: r r r r » ot>0.6001,5a(J?i!>) = y A s , where a is the unit area of 6 .35 mm. diameter and
R D the reflection density in terms of log .
June, 1944 A N A L Y T I C A L E D I T I O N 407
results which are surprisingly close to calibrations by galvanom eter readings w ith a photoelectric cell. F or photom etric calibration the authors have employed the following apparatus:
A selenium photocell w ith a 20-mm. effective diam eter, giving a photocurrent of 150 microamperes and o u tp u t of 25 m icrow atts at 1 lumen. T his is placed in an insulated adapter, or in a microphotometric slit ocular, a t the eyepiece position of a microscope and connected w ith a m irror galvanom eter of approximately 750-ohm resistance and a sensitivity of 2.5 X 10~8 ampere per mm., w ith the interposition of a compensating resistance circuit, so designed as to provide selective sensitivity with adjustable zero point on the galvanom eter scale under a wide variation of light intensities or field areas.
A microscope fitted w ith 24-mm. and 40-mm. single-lens objectives, and w ith tube length adjustable from 155 to 200 mm. for controlling exact size of field, a mechanical stage for m ultiple (reduced field) readings, and a quick-shifting device for alternately positioning tes t spots and step-scale bands w ithin the illuminated field of the instrum ent. (Precision of operation is favored by averaging or integrating fractional readings by means of a microphotomctric slit ocular as described by Lange, 18.)
An efficient type of electric microscope lamp and condenser, adjustable to an approxim ately 45° angle of incidence to prevent specular reflection, and capable of illum inating a field of 7 mm. or less in diameter. This lam p m ust be operated by a storage b a ttery to ensure a nonfluctuating current and m ust produce a light of iiigh intensity which is so steady as to cause no oscillation of the galvanometer light beam.
With such a system , the difference in photocurrent of reflectances from u n it areas of ad jacen t bands of a step scale, such as scale B in Figures 4 and 5, will give deflections of the light beam on the galvanom eter scale of 3 to 15 mm., as controlled by sensitivity adjustm ent in the balanced circuit. Reactions from known am ounts of arsenic or from unknown te s t solutions can thus be nearly m atched w ith scale-band deflection readings and values interpolated according to the step deflection.
The precision of th e combined vacuum -G utzeit procedure and photometric reading method, when sum marized from the recovery data of Figure 5, shows: (a) in the lower part, or “ toe” portion, of curves B and C (from 0.04 to 0.40 microgram of arsenic), comprising 7 recoveries, an accuracy of 95.85%, w ith a mean deviation of =*=0.04 microgram; (6) in the range covered by the straight-line portion of the graphs (from 0.50 to 2.0 mierograms of arsenic), comprising 15 readings on 12 recoveries, an accuracy of 99.93%, w ith a m ean deviation of ±0.0053 microgram; (c) an over-all accuracy, for the entire range, of 98.63%, w ith a m ean error of ± 1 .37% . T his applies to an exemplary set of findings and is som ewhat b e tte r th an the general average of ± 1 .5% , which is claimed for the photom etric application of the m ethod. F o r routine visual evaluations in the optimum range of 0.04 to 0.90 microgram of arsenic, precision is estim ated as w ith in ± 0 .03 microgram, and the visual error increases from ± 0 .06 to ± 0 .07 microgram in the higher range from 0.90 to the visual lim it of 1.6 micrograms of arsenic, which implies a ± 3 % error in the optim um range.
Only the bands of reflection density on the calibrated scales are the essential criteria for arsenic determ ination, and these represent ascending gradients of arsenic value stric tly according to the area of the te s t spot. W hen such a step-scale p rin t has once been calibrated for the u n it area of 6.35-mm. (0.250-inch) diameter, as shown in Figures 4 and 5, it follows m athem atically that any step of the scale when referred to 3.17-mm. (0.125-inch) test spots, will represent ju s t one fourth of the value attribu tab le to the un it area. Thus, if an area be selected th a t is 2.5 times that of the u n it area, or 10 tim es th a t of the 3.17-mm. area, its calculated area would be 79.167 sq. mm., its diam eter 10.04 mtn., and there would be established a triple ratio of 0 .25 :1 :2 .5 or 1:4:10, in scale value, according to spot area, w ith corresponding arsenic values holding throughout all shades of the scale.
S U M M A R Y
A relatively rapid procedure and new apparatus are described for isolation under vacuum of sm all am ounts of arsenic as a rsenic trihydride. The m ethod is especially applicable to very small samples of fresh biological m aterial and o ther organic substances which dem and an ultram icro range of determ ination. I t employs the well-known zinc-acid reduction process, which is shortened in tim e of operation to 15 m inutes and intensified in action w ithout applying heat. T his is accomplished by operation in a vacuum system a t 0.25 to 0.5 atm osphere to produce an arsine-m ercuric bromide reaction by spot filtration. The reaction is concentrated by je t-filtration through a precisely gaged area of the sensitized medium. The diam eters of the jets producing the spot reactions are designated as 3.17 mm. (0.125 inch) and 6.35 mm. (0.250 inch), giving two orders of reaction areas in the ratio 1 to 4, and providing ranges of 0.01 to 0.40 and 0.04 to 1.50 micrograms of arsenic, respectively.
These G utzeit spot reactions, after intensification w ith am monia, are immediately" evaluated by' reference to a standardized photographic step-scale p rin t having 20 bands of m athem atically graded reflection densities, which have been photom etrically calibrated against fresh spot tes ts from known am ounts of arsenic. The method of calibrating these photographic standards by coordination w ith recovery data , and the photographic procedure for producing the p rin ts and the perm anent film negatives from which they are derived, are described. A pparatus comprising the vacuum -filtration system consists m ainly of parts which are precisely" m achined from m ethyl m ethacrylate polymer.
Sensitivity claimed for the method in its present form is 0.01 microgram of elem entary arsenic, which is visually distinguishable from a “ blank” . Accuracy claimed for the vacuum- G utzeit m ethod combined w ith evaluation by photographic standards is ± 3 % by visual inspection .in the range 0.02 to0.90 microgram of arsenic and ± 1 .5 % by photometry" in the extended range to 2.0 micrograms of arsenic. Larger or smafier filtration areas m ay be used for o ther ranges than those described.
L lt E R A T U R E C ITED
(1) Assoc. Official Agr. Chem., Official and T en tative M ethods ofAnalysis, 5th ed., pp. 390-3 (1940).
(2) Bird, F. C. J., Analyst, 26, 181 (1901).(3) B ritish Pharm acopoeia, 1932 ed., Appendix V II, pp. 559-64.(4) Carey, F . P ., B lodgett, G., and Satterlee, H . S., I n d . E n o .
C h e m ., A n a l . E d ., 6, 32 7 (1934).(5) Cassil, C. C., J . Assoc. Official Agr. Chem., 20, 177 (1937).(6) Ibid., 21, 199-200 (1938).(7) Ibid., 24, 196 (1941).(8) Cassil, C. C., and W ichm ann, H . J., Ibid., 22, 436 (1939).(9) C rabtree, J . I ., E aton , G. T ., and Mueliler, L. E ., J . Phot. Soc.
A m ., 6, No. 4, 6-13 (Oct. 25, 1940); Communication 780,R esearch Laboratories, E astm an K odak Co., Rochester, N . Y.
(10) Cribb, C. H ., Analyst, 52, 701 (1927).(11) Davis, IV. A., and M altby, J . G., Ibid., 61, 96 (1936).(12) G uthm ann, H ., and Grass, H ., Arch. Gyndkol., 152, 127 (1933).(13) How, A. E., I n d . E ng . Chem., A n a l . E d ., 10, 226 (1938).(14) H ubbard , D. M ., Ibid., 13, 915 (1941).(15) Jacobs, B- J-, and Naglor, J ., Ibid., 14, 442 (1942).(16) Klein, A. K ., and Vorhes, F. A., Jr ., J . Assoc. Official Agr.
Chem., 22, 121 (1939).(17) Lachele, C. E ., I n d . E ng . Chem., A n a l . E d ., 6, 256 (1934).(18) Lange, B., “Photoelem ents and T heir A pplication” , tr . by
A. St. John, p. 227, New York, Reinhold Publishing Corp.,1938.
(19) M ayraud, L. P ., J . A m . Pharm. Assoc., 20, 637 (1931).(20) Neller, J . R ., J . Assoc. Official Agr. Chem., 12, 332 (1929).(21) Robinson, W. O., Dudley, H . C., Williams, K . T ., and Byers,
H . G., I n d . E n o . C h e m ., A n a l . E d ., 6, 27 4 (1 9 3 4 ).(22) Rosenfels, R. S., J . Assoc. Official Agr. Chem., 21, 493 (1938).(23) Sanger, C. F., and Black, O. F., J . Soc. Chem. Ind ., 26, 1121
(1907).(24) Taylor, G ., and Ham ence, J . H ., Analyst, 67, 12 (1942).(25) W ichm ann, H . J ., J . Assoc. Official Agr. Chem., 20, 165 (1937).(26) Ibid., 22, 310-11 (1939).(27) Ibid., 22, 319 (1 9 3 9 ).
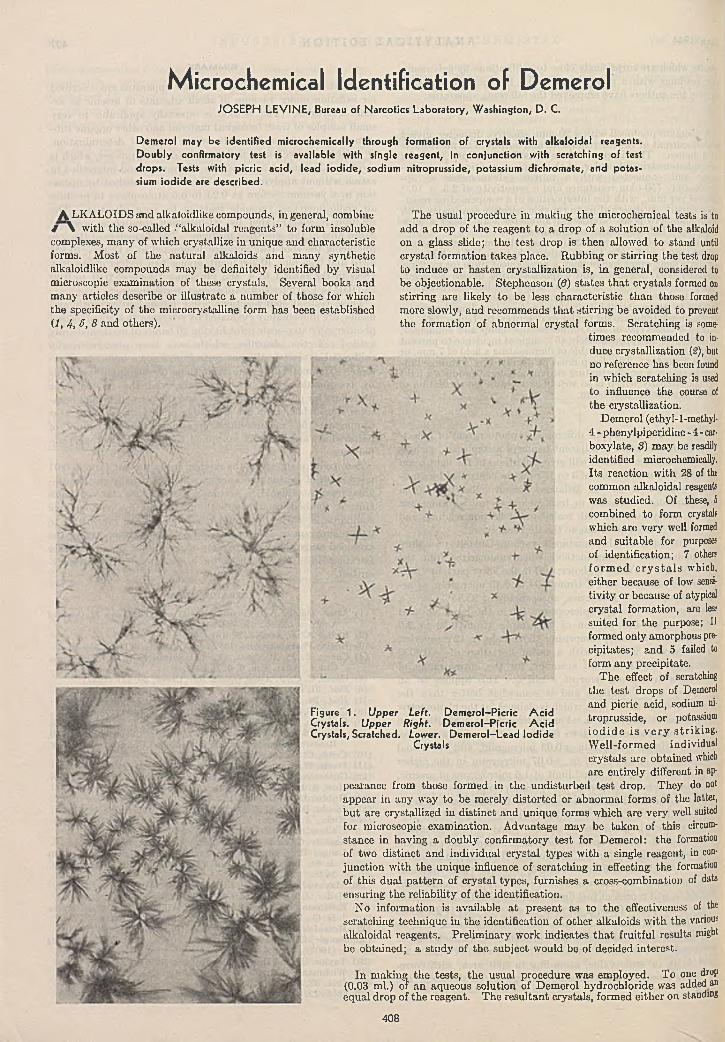
Microchemical Identification of Demerol
A LKA LOID S irnd alkaloidlike compounds, in general, combine f \ w ith the so-called .“alkaloidal reagents” to form insoluble complexes, m any of which crystallize in unique and characteristic forms. M ost of the natural alkaloids and m any synthetic alkaloidlike compounds may be definitely identified by visual microscopic examination of these crystals. Several books and many articles describe or illustrate a num ber of those for which the specificity of the microcrystalline form has been established (f, 4, G, 8 and others).
The usual procedure in making th e microchemical tests is to add a drop of the reagent to a drop of a solution of the alkaloid on a glass slide; the tes t drop is then allowed to stand until crystal form ation takes place. Rubbing or stirring the test drop to induce or hasten crystallization is, in general, considered to bo objectionable. Stephenson (6) s ta tes th a t crystals formed on stirring are likely to be less characteristic th an those formed more slowly, and recommends th a t stirring be avoided to prevent the formation of abnorm al crystal forms. Scratching is some
times recommended to induce crystallization (2), but no reference has been found in which scratching is used to influence the course of the crystallization.
Demerol (ethyl-l-methyl- 4 - phenylpiperidine - 4 - car- boxylate, 8) m ay be readily identified microchemically. Its reaction w ith 28 of the common alkaloidal reagent' was studied. Of these, 5 combined to form crystals which are very well formed and suitable for purposes of identification; 7 others fo rm e d c r y s ta l s which, either because of low sensitiv ity or because of atypical crystal formation, are less suited for the purpose; 1) formed only amorphous precipitates; and 5 failed to form any precipitate.
The effect of scratching the test drops of Demerol and picric acid, sodium ni- troprusside, or potassium io d id e is v e ry strik ing. W ell-form ed individual crystals arc obtained which are entirely different in ap
pearance from those formed in the undisturbed test drop. They do not appear in any way to be merely distorted or abnorm al forms of the latter, bu t are crystallized in d istinct and unique forms which are very well suited for microscopic examination. Advantage m ay be taken of this circumstance in having a doubly confirmatory tes t for Dem erol: the formation of two distinct and individual crystal types w ith a single reagent, in conjunction w ith the unique influence of scratching in effecting the formation of tliis dual p a tte rn of crystal types, furnishes a cross-combination of data ensuring the reliability of th e identification.
No information is available a t present as to the effectiveness of the scratching technique in the identification of other alkaloids w ith the various alkaloidal reagents. Prelim inary work indicates th a t fruitful results might be obtained; a study of th e subject would be of decided interest.
Figure 1. Upper Left. D em erol-P icric A c id Crystals. U pper Right. D em ero l-P icric A c id Crystals, Scratched. Lower. D em ero l-Lead Iodide
Crystals
J O S E P H L E V IN E , Bureau of Narcotics Laboratory, Washington, D . C.
Demerol may be identified microchemically through formation of crystals with alkaloidal reagents. D ou bly confirmatory test is available with single reagent, in conjunction with scratching of test drops. Tests with picric acid, lead iod ide, sodium nitroprusside, potassium dichromate, and potassium iodide are described.
In making th e tests, the usual procedure was employed. To one drop (0.03 ml.) of an aqueous solution of Demerol hydrochloride was added an equal drop of the reagent. T he resu ltan t crystals, formed either on standing
408
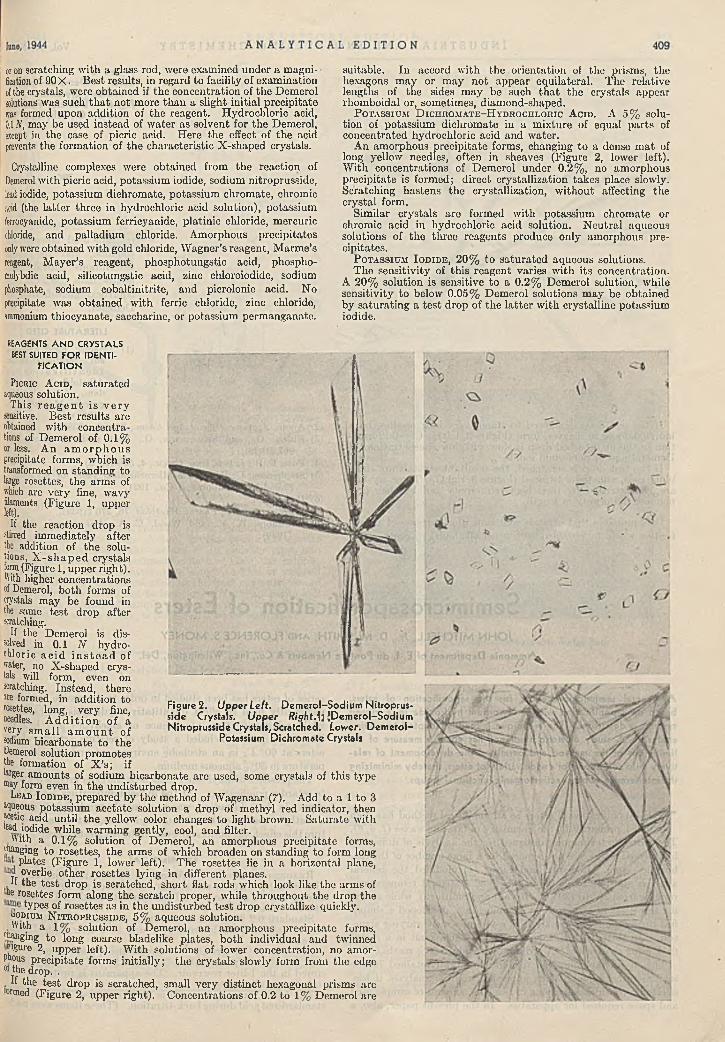
Figure 2. U pper Left. Dem erol-Sodium Nitroprus- side Crystals. U pper Right.\l JDem erol-Sodium Nitroprusside Crystals, Scratched. Lower. D em erol-
Potassium Dichromate Crystals
or on scratching w ith a glass rod, were examined under a m agnification of 90 X . B est results, in regard to facility of examination of the crystals, were obtained if the concentration of the Demerol solutions was such th a t no t more than a slight initial precipitate m formed upon addition of the reagent. Hydrochloric acid, 0,1 iV, may be used instead of w ater as solvent for the Demerol, except in the case of picric acid. H ere the effect of th e acid prevents the form ation of the characteristic X -shaped crystals.
Crystalline complexes were obtained from the reaction of Demerol with picric acid, potassium iodide, sodium nitroprusside, ted iodide, potassium dichromate, potassium chrom ate, chromic acid (the la tte r three in hydrochloric acid solution), potassium ferrocyanide, potassium ferrieyanide, platinic chloride, mercuric chloride, and palladium chloride. Amorphous precipitates only were obtained with gold chloride, W agner’s reagent, M arm e’s reagent, M ayer’s reagent, phosphotungstic acid, phospho- molybdic acid, silieotungstie acid, zinc chloroiodide, sodium phosphate, sodium cobaltinitrite, and picrolonic acid. No precipitate was obtained w ith ferric chloride, zinc chloride, ammonium thiocyanate, saccharine, or potassium perm anganate.
suitable. In accord with the orientation of the prisms, the hexagons m ay or m ay no t appear equilateral. The relative lengths of th e sides m ay be sucb th a t th e crystals appear rliomboidal or, sometimes, diamond-shaped.
P o t a s s iu m D i c h r o .m a t e - H y d r o c h l o r ic A c i d . A 5% solution of potassium dichrom ate in a m ixture of equal parts of concentrated hydrochloric acid and w ater.
An amorphous precipitate forms, changing to a dense m a t of long yellow needles, often in sheaves (Figure 2, lower left). W ith concentrations of Demerol under 0.2% , no am orphous precipitate is formed; direct crystallization takes place slowly. Scratching hastens th e crystallization, w ithout affecting the crystal form.
Sim ilar crystals are formed w ith potassium chrom ate or chromic acid in hydrochloric acid solution. N eu tral aqueous solutions of the th ree reagents produce only amorphous precipitates.
P o t a s s iu m I o d i d e , 20% to sa tu ra ted aqueous solutions.T he sensitivity of th is reagent varies w ith its concentration.
A 20% solution is sensitive to a 0.2% Demerol solution, while sensitivity to below 0.05% Demerol solutions m ay be obtained by sa tu ra ting a te s t drop of th e la tte r w ith crystalline potassium iodide.
«EAGENTS A N D C R Y S T A L SBEST SUITED FOR IDENTI
FICATION
Picric A cid , saturated aqueous so lu tion .
This r e a g e n t is v e ry sensitive. B est results are obtained w ith concentrations of Demerol of 0.1% or less. A n a m o r p h o u s precipitate forms, which is transformed on standing to largo rosettes, th e arm s of which are very fine, wavy filaments (Figure 1, upper left).
If the reaction drop is stirred immediately after the addition of the solutions, X - s h a p e d crystals lorm (Figure 1, upper right).1'ith higher concentrations of Demerol, both forms of crystals may be found in the same tes t drop after scratching.
If the Demerol is dissolved _ in 0.1 N hydrochloric a c id i n s t e a d of water, no X -shaped crystals will form, even on scratching. Instead, there are formed, in addition to rosettes, long, very fine, needles. A d d i t i o n of a very s m a ll a m o u n t of sodium bicarbonate to the Demerol solution prom otes the formation of X ’s; ifhrger amounts of sodium bicarbonate are used, some crystals of th is type may form even in th e undisturbed drop.
Lead I o d ide ,_ prepared by th e method of W agenaar (7), Add to a 1 to 3 aqueous potassium acetate solution a drop of m ethyl red indicator, then acetic acid until th e yellow color changes to light brown. S atu ra te w ith lead iodide while warming gently, cool, and filter.
Hith a 0.1% solution of Demerol, an amorphous precipitate forms, flanging to rosettes, th e arm s of which broaden on standing to form long
plates (Figure 1, lower left). T he rosettes lie in a horizontal plane,Tf T rlie o t^ er rosettes lying in different planes.u the test drop is scratched, short flat rods which look like the arm s of
he rosettes form along th e scratch proper, while throughout the drop the types of rosettes as in the undisturbed te s t drop crystallize quickly.
« tdium N i t r o p r u s s id e , 5 % a q u e o u s s o lu t io n .With a 1% solution of Demerol, an amorphous precipitate forms,
changing to long coarse bladelike plates, bo th individual and twinned ■figure 2, upper left). W ith solutions of lower concentration, no am orphous precipitate forms initially; th e crystals slowly form from the edge ol the drop. .
If the tes t drop is scratched, small very d istinct hexagonal prisms are onned (Figure 2, upper right). C oncentrations of 0.2 to 1% Demerol are
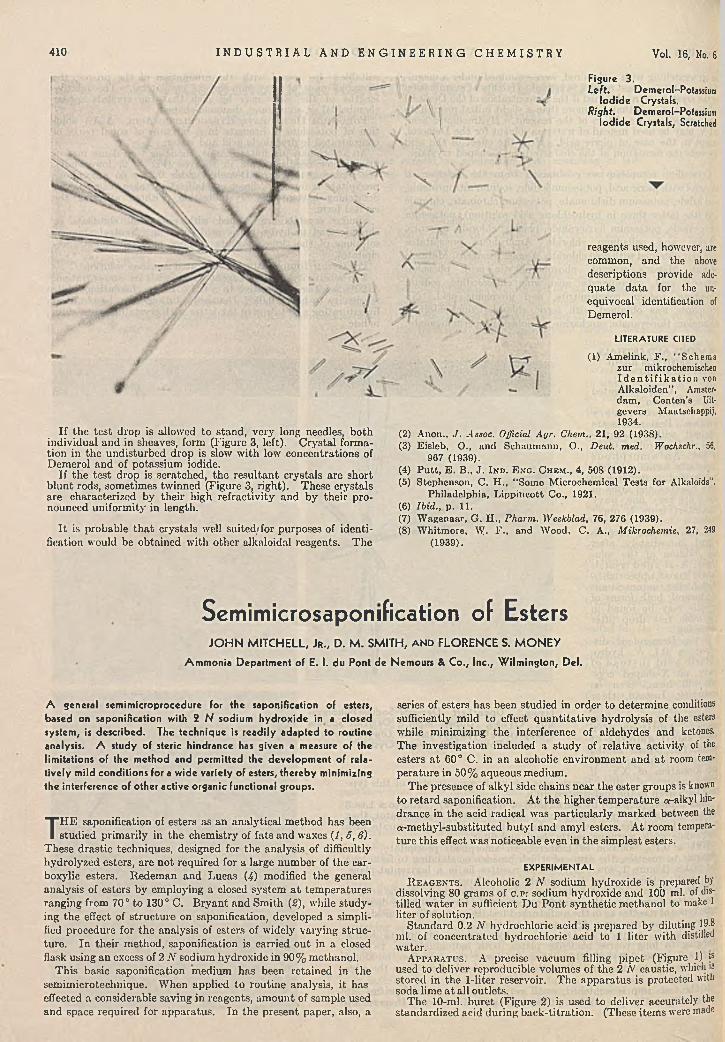
410 I N D U S T R I A L A N D E N G I N E E R I N G C H E M I S T R Y Vol. 16, No. 6
Figure 3.Left. Demerol-Potassium
Iodide Crystals.Right. Demerol-Potassium
Iodide Crystals, Scratched
reagents used, however, are common, and the above descriptions provide adequate da ta for the unequivocal identification of Demerol.
LITERATURE CITED
If th e te s t drop is allowed to stand, very long needles, both individual and in sheaves, form (Figure 3, left). C rystal formation in the undisturbed drop is slow w ith lotv concentrations of Demerol and of potassium iodide.
If th e te s t drop is scratched, th e resu ltan t crystals are short b lun t rods, sometimes tw inned (Figure 3, right). These crystals are characterized by their high refractiv ity and by their pronounced uniform ity in length.
I t is probable th a t crystals well suited/for purposes of identification would be obtained w ith other alkaloidal reagents. T he
(1) Amelink, F ., “ Schema zur mikrochemischen I d e n t i f i k a t i o n von Alkaloiden” , Amsterdam , Centen’s Uit- gevers Maatschappij, 1934.
(2) Anon., J . Assoc. Oßicial Agr. C h e m ., 21, 92 (1938).(3) Eisleb, O., and Schaum ann, 0 ., Deut. med. Wochschr., 56,
967 (1939).(4) P u tt, E . B„ J. I n d . E n g . C h e m ., 4, 508 (1912).(5) Stephenson, C. H ., ‘‘Some Microchemical Tests for Alkaloids",
Philadelphia, L ippincott Co., 1921.(6) Ibid., p. 11.(7) W agenaar, G. H ., Pharm. Weekblad, 76, 276 (1939).(8) W hitmore, W. F ., and Wood, C. A., Mikrochemie, 27, 249
(1939).
Semimicrosapomfication of EstersJ O H N M IT C H E L L , J r . , D . M . S M IT H , a n d F L O R E N C E S. M O N E Y
Am m onia Department of E. I. du Pont de Nemours & C o ., Inc., W ilm ington, Del.
A general semimicroprocedure for the saponification of esters, based on saponification with 2 N sodium hydroxide in a closed system, is described. The technique is readily adapted to routine analysis. A study of steric hindrance has given a measure of the limitations of the method and permitted the developm ent of relatively mild conditions for a wide variety of esters, thereby minimizing the interference of other active organic functional groups.
T H E saponification of esters as an analytical method has been studied prim arily in the chemistry of fats and waxes (7, 5, 6).
These drastic techniques, designed for the analysis of difficultly hydrolyzed esters, are no t required for a large num ber of the car- boxylic esters. Redem an and Lucas (4) modified the general analysis of esters by employing a closed system a t tem peratures ranging from 70° to 130° C. B ryan t and Sm ith (2), while studying the effect of s truc tu re on saponification, developed a simplified procedure for th e analysis of esters of widely varying structure. In their method, saponification is carried ou t in a closed flask using an excess of 2 N sodium hydroxide in 90% m ethanol.
T his basic saponification medium has been retained in the sem im icrotechnique. W hen applied to routine analysis, it has effected a considerable saving in reagents, am ount of sample used and space required for apparatus. In the present paper, also, a
series of esters has been studied in order to determ ine conditions sufficiently mild to effect quan tita tive hydrolysis of the esters while minimizing the interference of aldehydes and ketones. T he investigation included a study of relative activity of the esters a t 60° C. in an alcoholic environm ent and a t room temperature in 50% aqueous medium.
T he presence of alkyl side chains near the ester groups is known to retard saponification. A t the higher tem perature a-alkyl hindrance in the acid radical was particularly m arked between the a-m ethyl-substituted bu ty l and amyl esters. A t room temperature th is effect was noticeable even in the sim plest esters.
E X P E R IM E N T A L
R e a g e n t s . Alcoholic 2 N sodium hydroxide is prepared by dissolving 80 gram s of c . p : sodium hydroxide and 100 ml. of distilled w ater in sufficient D u P ont synthetic m ethanol to make 1 liter of solution.
S tandard 0.2 N hydrochloric acid is prepared by diluting 19-8 ml. of concentrated hydrochloric acid to 1 liter with distilled water.
A p p a r a t u s . A precise vacuum filling p ipet (Figure 1) p used to deliver reproducible volumes of the 2 N caustic, which is stored in the 1-liter reservoir. The apparatus is protected with soda lime a t all outlets.
T he 10-ml. buret (Figure 2) is used to deliver accurately the standardized acid during back-titration . (These item s were made
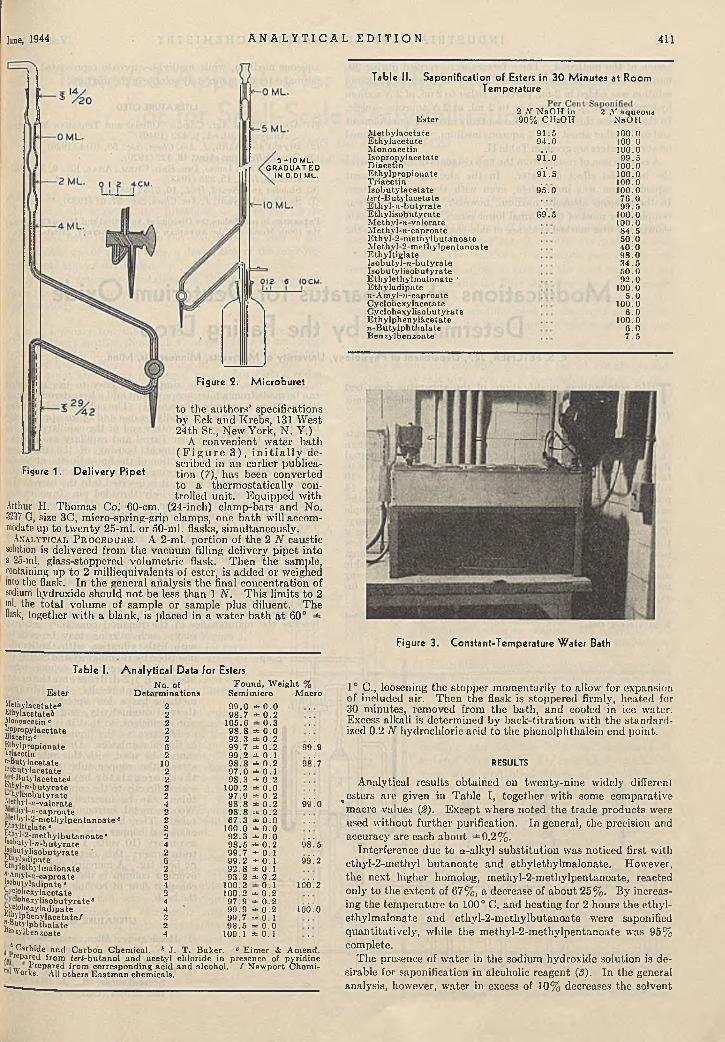
lune, 1944 A N A L Y T I C A L E D I T I O N 411
Table II. Saponification of Esters in 30 Minutes at Room Temperature
E aterM eth y lace ta teE th y lac e ta teM onoace tinIsopropy laeetateD iacctinE thy lp ro p io n a teT riace tinIso b u ty lace ta te/e ri-B u ty lace ta teE th y l-n -bu ty ra teE th y liso b u ty ra teM ethy l-n -va lera teM ethy l-n -cap roa teE th y l-2-m etn y lb u tan o a teM ethy l-2 -m ethy lpen tanoateE th y ltig la teIao b u ty l-n -b u ty ra teIso bu ty liaobu ty ra teE th y le th y lm alo n ate *E th y lad ip a ten-A m yl-n-eaproateC yclohcxylacetateC yclohexylisobu tyrateE thylphenyl& cetatert-B u ty lph thala teB enzylbenzoate
2 Ar NaOIT in 2 AT aqueous90% CHaOH N aO H
9 1 .5 100.09 4 .0 100.0
100.09 Ï .0 9 9 .5
100.09 Ï . 5 100.0
100.09*5.0 100.0
7 6 .09 9 .5
6*9.5 100.0100.08 4 .55 0 .04 0 .09 8 .03 4 .550 .09 2 .0
100.05 .0
100.06 .0
100.06 .07 .5
Figure 2. M icroburet
to the authors' specifications by Eck and K rebs, 131 W est 24th St., New York, N . Y.)
A convenient w ater bath ( F i g u r e 3 ) , i n i t i a l l y de- scribed in an earlier publica-
rigure 1. D elivery Pipet tion (7), has been convertedto a therm ostatically controlled unit. Equipped w ith
Arthur TI. Thom as Co.’ 60-cm. (24-inch) clamp-bars and No. 3237 G, size 3C, micro-spring-grip clamps, one b a th will accom-
, modate up to tw enty 25-ml. or 50-ml. flasks, simultaneously.An a l y t ic a l P r o c e d u r e . A 2-ml. portion of the 2 N caustic
solution is delivered from the vacuum filling delivery p ipet into a 25-ml. glass-stoppered volum etric flask. Then the sample,
I containing up to 2 m illiequivalents of ester, is added or weighed | wto the flask. In the general analysis the final concentration of | sodium hydroxide should no t be less than 1 N . T his lim its to 2 I ml. the to tal volume of sample or sample plus diluent. The
flask, together w ith a blank, is placed in a w ater bath a t 60° =*=
Table I. A n a ly tica l Data for EstersNo. of F ound , W eight %
E ste r D oteMethylacetate** hthylacetate&Monoacetin c Isopropylaeetate biacetin«JMylpropionateinacetin n*Butylacetate isobutylacetate p bbutylacetate^Lthybn-bufcyrate c-inylisobutyrate Jlethyl-u-valerate V e p.v -»-caproate p.?{'\yl-2-m ethylpentanoate e gnyjtiglate eFoybS-m ethylbutanoate *Lobutyl-n-butyrate fe^ntyhsobutyrate gnyladipate ^hylethylm alonate «•Amyl-n-caproate Uobutvladipate Ä Lycjohexylacetate
oheiy liaobutyratee «M ohexyladipate¡ ^ ’¡Pbenylacetate/J'öutylphthalate öei>iylbeiuoate
* Carbide and C arbon Chem ical. ... „ ___________/,]rePa^ d from ferf-butanol and ace ty l chloride in presence of pyridine r»iw .S p a r e d from corresponding acid an d alcohol. / N ew port Chem i-
’ orks. All o thers E as tm an chem icals.
m inations Sem im icro M acro2 9 9 .0 * 0 .02 9 8 .7 * 0 .22 105 .6 0 .32 9 8 .8 * 0 .02 9 2 .3 * 0 .26 9 9 .7 =*= 0 .2 99! 92 9 9 .2 ± 0 .1
10 9 8 .8 * 0 .2 98! 72 9 7 .0 * 0 .12 98 .3 * 0 .22 100.2 * 0 .02 97 .9 * 0 .24 9 8 .8 ± 0 .2 9 9 ’.02 9 8 .8 rib 0 .22 6 7 .3 ± 0 .02 100.0 * 0 .02 9 2 .3 * 0 .04 9 8 .5 * 0 .2 98! 52 9 9 .7 rib 0 .16 9 9 .2 ± 0 .1 99! 22 9 2 .8 =*= 0 .12 9 3 .2 ± 0 .24 100.2 0 .1 106! 22 100.2 * 0 .24 9 7 .9 * 0 .24 ° 9 9 .9 =b 0 .2 ÎÔÔ'.O2 9 9 .7 rib 0 .12 9 8 .5 ± 0 .04 100.1 rit 0 .1
b J . T . B aker. c E im er & A m end.
Figure 3. Constant-Temperature Water Bath
1° C., loosening the stopper m om entarily to allow for expansion of included air. Then the flask is stoppered firmly, heated for 30 minutes, removed from the bath , and cooled in ice water. Excess alkali is determined by back-titration w ith the standard ized 0.2 N hydrochloric acid to the phenolphthalein end point.
RESULTS
A nalytical results obtained on tw enty-nine widely different # esters are given in Table I, together w ith some com parative
macro values (2). Except where noted the trade products were used w ithout fu rther purification. In general, th e precision and accuracy are each about ± 0 .2% .
Interference due to a-alkyl substitu tion was noticed first with ethyl-2-m ethyl butanoate and ethylethylm alonate. However, the next higher homolog, m ethyl-2-m ethylpentanoate, reacted only to the extent of 67%, a decrease of about 25% . By increasing the tem perature to 100° C. and heating for 2 hours the ethy lethylm alonate and ethyl-2-m ethylbutanoate were saponified quantitatively , while the m ethyi-2-m ethylpentanoate was 95% complete.
T he presence of w ater in the sodium hydroxide solution is desirable for saponification in alcoholic reagent (5). In the general analysis, however, w ater in excess of 10% decreases the solvent
5 - 1 0 M L. G R A D U A T E D
IN 0 .0 1 M L.

412 I N D U S T R I A L A N D E N G I N E E R I N G C H E M I S T R Y Vol. 16, No. 6
action of the m ethanol. These factors were verified during 30- m inute room tem perature studies, where th e ester in m ethanol solution was added in 2-ml. portions either to 2 ml. of 2 W sodium hydroxide in 90% m ethanol or to 2 ml. of 2 N aqueous caustic. In the one case th is represented essentially alcoholic environm ent and in the other about a 50% aqueous medium. R esults obtained on several esters are given in Table II.
A comparison of results from the two reagents definitely proves the beneficial effect of water. In the alcoholic environm ent saponification was incomplete, even w ith the simplest esters. In the aqueous alcoholic medium, however, saponification was complete for m ost of the norm al lower esters. ieri-Butyl acetate showed th e first m arked evidence of side-chain interference in the
aqueous medium, while m ethyl-a-caproate represented the first normal ester no t completely soluble in the mixture.
LITERATURE CITED
(1) Assoc. Official Agr. Chem., "Official and Tentative Methods o!Analysis” , 5th ed., p. 432 (1940).
(2) Bryant and Smith, J . Am. Chem. Soc., 58, 1014 (1936).(.3) Caudri, Rec. trav. chim., 48, 422 (1929).(4) Redeman and Lucas, I n d . E n o . C h e m ., A n a l . E d ., 9, 521 (1937).(5) Ricman, lin'd., 15, 325 (1943).(6) Shaefer and Picard, Ibid., 10, 515 (1938).(7) Smith and Bryant, J . Am. Chan. Soc., 57, 61 (1935).
P r e s e n t e d in p a r t before th e D ivision of A naly tical an d M icro Chemistry it th e 100th M eeting of th e A m e r i c a n C h e m i c a l S o c i e t y , Pittsburgh. P i.
Modifications of Apparatus for Deuterium O xid e Determination by the Fallins.Drop
E. S. F E T C H E R , J r .1, Department of Physio logy, University of M innesota, M inneapolis, M inn.
An accurate, relatively simple, and easy to use micropipet can be made from a microscope m ount and a hypodermic syringe; its operation is entirely mechanical. The ou tle t of a 1-cc. tuberculin syringe is a ttached rigidly to one end of an appropriately bent 0.5-mm. capillary; th e o ther end of the capillary is dram to a small tip . The syringe barrel and capillary are mounted firmly on the coarse-adjustm ent housing of the microscope m ount in such a w ay th a t m otion of the fine-adjustm ent housing is no t interfered with. A spring is slipped over the lubricated plunger of the syringe before i t is inserted into the barrel. The plunger is ac tua ted by a precisely threaded pin (from an inexpensive microm eter caliper, for example). The threaded sleeve in which th is pin tu rns is attached to the fine-adjustm ent housing Two stops allow the pin to be turned through only part of a revolution. The capillary and syringe are filled, under vacuum, with mercury. The coarse ad justm ent of the microscope mount raises and lowers the entire pipet; the fine ad justm ent is used for filling and flushing the capillary; ro tation of the threaded pin through its prescribed lim its delivers the droplet. The capillary may k provided w ith a rem ovable tip for easy cleaning, and with a mercury reservoir.
Extrem ely vigorous stirring of th e constant-tem perature bath renders the m aintenance of th e required constancy relatively
easy; such stirring m ay be achieved w ith little vibration w ith the impeller
pum p described by Hemingway and Shelley (I).As a therm oregulator, copper tubing filled w ith 1 ,2 -d ib ro m o m e th a n e has given excellent results; 1,2 -dibroroo- m ethane has a low specific heat, high therm al conductivity, and high expansion coefficient, so th a t it is about twice as effective as the liquids usually used in therm oregulators. Ordinary cement cannot be used w ith this substance to a ttach the copper tube to the glas t h e r m o r e g u l a t o r head; i t should be sealed directly to the copper, or the glass tubing can be inserted into a cup of Wood’s m etal surrounding the copper tube. T he heater elem ent used is enameled copper wire connected to the secondary (10 volts, 12 amperes) of a transform er; this elem ent has almost no hea t lag. A mercury, constant-head overflow column is used to maintain a constant flow of cooling w ater through the bath.
LITERATURE CITED
(1) Hemingway, Allen, and Shelley, W., Rev. Sci. Instruments, 11, 204-5<1940)' .(2) Keston, A. S., R ittenberg, D.,- *■“ Schoenheimer, R., J ■ Biol. Chem-. 122. 227-37 (1942).
T H IS note outlines modifications of the apparatus described by K eston, R ittenberg , and Schoenheimer (8) which perm it
greater speed of deuterium oxide analysis.
Two distillation tra ins are used (see diagram), the components of which are more readily cleaned and more interchangeable th an those of K eston et al. The distillation trains are supported rigidly only a t positions i. W here m any determ inations are to be made, the following glassware will be found sufficient: 10 tubes a; 3 each of tubes 6 and c; 2 each of tubes d and g; 14 plugs e; and 6 weighing b o ttle s /. Tubes g w ith weighing bottles can be attached to tube o2 in place of the plug when th e sample contains no organic m aterial and combustion is unnecessary. T he ou tle t of the combustion furnace is adapted to fit the a tubes. The sample, w ith barium carbonate, is boiled for a few mom ents before the pressure is reduced, to elim inate bumping. Calcium oxide is used in tube b in place of potassium hydroxide and chromic oxide to elim inate replaceable H +. As condensing medium an ice-saturated calcium chloride b a th is convenient, inexpensive, and entirely satisfactory.
1 P resen t address, E q u ip m en t L abora to ry , Engineering: D ivision, W righ t Field, D ay to n , Ohio.
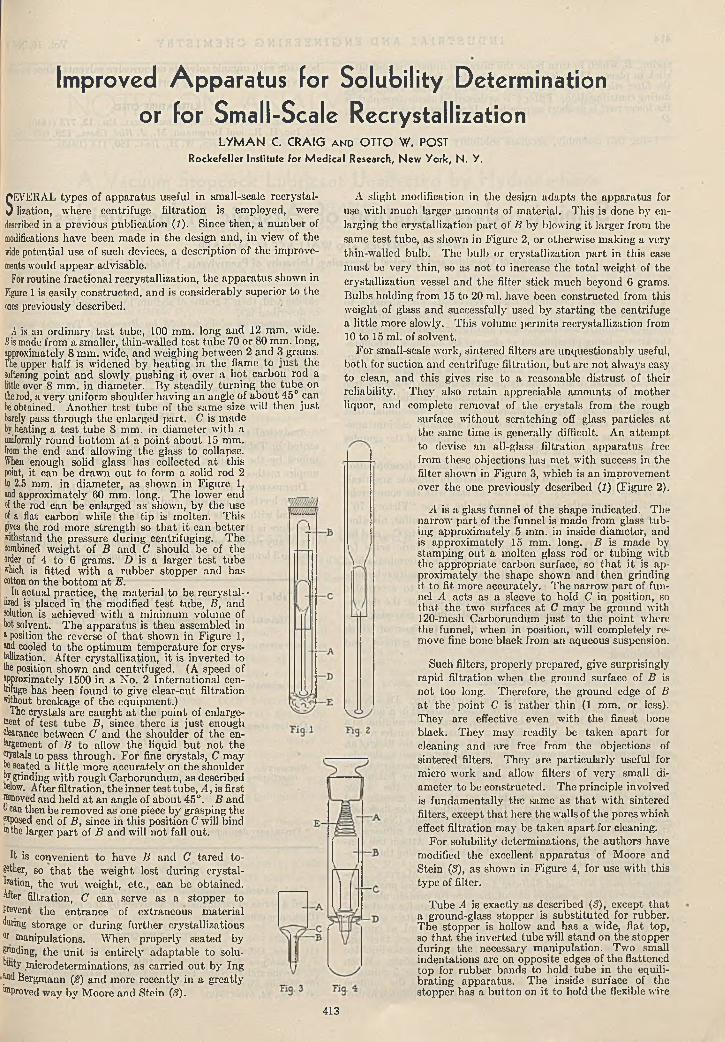
Improved Apparatus for Solubility Determination or for Small-Scale Recrystallization
L Y M A N C. C R A IG a n d O T T O W . P O S T
Rockefeller Institute for M edical Research, N ew Yo rk, N . Y.
SEVERAL types of apparatus useful in small-scale recrystallization, where centrifuge filtration is employed, were
described in a previous publication (i) . Since then, a num ber of modifications have been made in the design and, in view of the rride potential use of such devices, a description of the improvements would appear advisable.
For routine fractional recrystallization, the apparatus shown in Figure 1 is easily constructed, and is considerably superior to the ones previously described.
.1 is an ordinary test tube, 100 mm. long and 12 mm. wide. Bis made from a smaller, thin-walled test tube 70 or 80 mm. long, approximately 8 mm. wide, and weighing between 2 and 3 grams. The upper half is widened by heating m the flame to ju s t the softening point and slowly pushing it over a ho t carbon rod a little over 8 mm. in diam eter. By steadily turning the tube on the rod, a very uniform shoulder having an angle of about 45° can be obtained. A nother test tube of the same size will then just barely pass through the enlarged part. C is made by heating a test tube 8 mm. in diam eter w ith a uniformly round bottom at a point about 15 mm. from the end and allowing the glass to collapse.When enough solid glass has collected a t this point, it can be draw n ou t to form a solid rod 2 to 2.5 mm. in diam eter, as shown in Figure 1, and approximately 60 mm. long. The lower end of the rod can be enlarged as shown, by tlie use of a flat carbon while the tip is m olten. This pres the rod more strength so th a t it can better withstand the pressure during centrifuging. The combined weignt of B and C should be of the order of 4 to 6 grams. D is a larger tes t tube which is fitted w ith a rubber stopper and has cotton on the bottom a t E.. In actual practice, th e m aterial to be recrystal- > wed_ is placed in the modified te s t tube, B, and solution is achieved w ith a minimum volume of hot solvent. T he apparatus is then assembled in »position the reverse of th a t shown in Figure 1,»nd cooled to the optim um tem perature for crystallization. A fter crystallization, it is inverted to the position shown and centrifuged. (A speed of approximately 1500 in a No. 2 In ternational centrifuge has been found to give clear-cut filtration without breakage of the equipm ent.)
The crystals are caught a t the point of enlargement of test tube B, since there is ju s t enough clearance between C and the shoulder of the enlargement of B to allow the liquid b u t no t the crystals to pass through. For fine crystals, C m ay be seated a little more accurately on the shoulder by grinding w ith rough Carborundum , as described below. After filtration, the inner te s t tube, A , is first removed and held a t an angle of about 45°. B and 1 can then be removed as one piece by grasping the ®posed end of B , since in this position C will bind 111 the larger p a rt of B and will not fall out.
It is convenient to have B and C tared to other, so th a t the w eight lost during crystallization, the w et weight, etc., can be obtained. After filtration, C can serve as a stopper to Prevent the entrance of extraneous m aterial Coring storage or during further crystallizations ot manipulations. W hen properly seated by Srmding, the u n it is entirely adaptable to solu- buity .mierodeterminations, as carried ou t by Ing »nd Bergmann (2) and more recently in a greatly ^Proved way by Moore and Stein (3).
A slight modification in the design adap ts the apparatus for use w ith m uch larger am ounts of m aterial. This is done by enlarging the crystallization p a r t of B by blowing it larger from the same te s t tube, as shown in Figure 2, or otherwise making a very thin-walled bulb. T he bulb or crystallization p a rt in this case m ust be very th in , so as no t to increase the to ta l weight of the crystallization vessel and the filter stick much beyond 6 grams. Bulbs holding from 15 to 20 ml. have been constructed from this weight of glass and successfully used by starting the centrifuge a little more slowly. This volume perm its recrystallization from 10 to 15 ml. of solvent.
For small-scale work, sintered filters are unquestionably useful, both for suction and centrifuge filtration, b u t are no t always easy to clean, and this gives rise to a reasonable d istrust of their reliability. They also retain appreciable am ounts of m other liquor, and complete removal of the crystals from the rough
surface w ithout scratching off glass particles a t the same tim e is generally difficult. An a ttem p t to devise an all-glass filtration apparatus free from these objections has m et w ith success in the filter shown in Figure 3, which is an im provem ent over the one previously described (I) (Figure 2).
A is a glass funnel of the shape indicated. The narrow p a rt of the funnel is m ade from glass tu b ing approxim ately 5 mm. in inside diam eter, and is approxim ately 15 mm. long. B is m ade by stam ping out a m olten glass rod or tubing with the appropriate carbon surface, so th a t i t is approxim ately th e shape shown and then grinding it to fit more accurately. T he narrow p a rt of funnel A acts as a sleeve to hold C in position, so th a t th e two surfaces a t C m ay be ground with 120-mesh C arborundum ju s t to the point where the funnel, when in position, will completely remove fine bone black from an aqueous suspension.
Such filters, properly prepared, give surprisingly rapid filtration when the ground surface of B is no t too long. Therefore, the ground edge of B a t the point C is ra ther th in (1 mm. or less). They are effective even w ith the finest bone black. They m ay readily be taken ap a rt for cleaning and are free from the objections of sintered filters. They are particularly useful for micro work and allow filters of very small diam eter to be constructed. T he principle involved is fundam entally the same as th a t w ith sintered filters, except th a t here the walls of the pores which effect filtration m ay be taken ap a rt for cleaning.
For solubility determ inations, the au thors have modified the excellent apparatus of Moore and Stein (3), as shown in Figure 4, for use w ith this type of filter.
T ube A is exactly as described (3), except th a t a ground-glass stopper is substitu ted for rubber. The stopper is hollow and has a wide, flat top, so th a t th e inverted tube will stand on the stopper during the necessary m anipulation. Two small indentations are on opposite edges of the flattened top for rubber bands to hold tube in the equilibrating apparatus. T he inside surface of the stopper has a button on it to hold the flexible wire
413

414 I N D U S T R I A L A N D E N G I N E E R I N G C H E M I S T R Y Vol. 16, No. 6
spring, E, which in tu rn holds the filtration apparatus and filter stick in place. F lask B is of very th in glass, for its rests against the filter stick to hold it in place and a heavy flask would break during centrifugation. F ilte r C is as described above, except th a t the lower p art is as short as possible. I t rests on a soft tin collar, D.
be made w ith organic solvents or corrosive solvents, since no rubber is present to absorb any portion of th e solvent.
LITERATURE CITED
Using this assembly, accurate solubility determ inations may
(1) C ra ig , L . C ., I n d . E n g . C h e m ., A n a l . E d ., 12, 773 (1940).(2) In g , H . I t . , a n d B e rg m a n n , M ., J ■ Biol. Chem.., 129, 603 (1939).(3) M o o re , S ., a n d S te in , TV. H ., Ibid., 150, 113 (1943).
Semimicrodeterrmnation of A rsen ic in InsecticidesM A R K D. S N Y D E R a n d W A L L A C E M .M c N A B B
Department of Chemistry and Chemical Engineering, University of Pennsylvania, Philadelphia, Pa.
T H E procedure presented below represents an extension to insecticidal arsenicals of the m ethod recently described (4)
for the sem im icrodeterm ination of arsenic in organic compounds, the arsenic being precipitated as elem ent by action of hypophos- phorous acid and determ ined iodometrically w ith the aid of Kop- peschaar’s brom ide-brom ate solution. T his m ethod is believed to be applicable to any properly prepared solution of arsenic free from interfering substances, such as organic m aterial or metals precipitatable by hypophosphorous acid. It. was found th a t acid-soluble arsenicals (Paris green, lead arsenate, calcium arsenate) could be analyzed thus, following dissolution of the samples in aqueous hydrochloric acid.
In presence of organic m aterial, a prelim inary decomposition similar to th a t described for the analysis of organic arsenicals (2, 4) m ay be necessary. T his was the case w ith the commercial insecticide currently m arketed under the nam e “ Victory 76” , sta ted to contain calcium arsenate together w ith sulfur, nicotine, organic compounds w ith carbon contents from Cio to Cm, and ine rt m aterial. Decomposition by n itric and sulfuric acids (4) was shown to be a suitable preparation for the determ ination of arsenic in this insecticide. An alternative decomposition by bromine was found to be more rapid and to lead to acceptable results, b u t is judged to be less satisfactory because the decomposition liquid contained suspended dark-colored m aterial, presum ably organic brom ination products, the presence of which interfered visually a t the tim e the arsenic was reduced and precipitated.
PROCEDURES
S u b s t a n c e s S o l u b l e i n H y d r o c h l o r i c A c id . Dissolve a weighed sample (0.5 to 2 grams) of dried m aterial in a minimal volume of 6 N to 12 N hydrochloric acid, transfer th e solution to a 500 ml. volum etric flask, and dilute to the m ark. T ransfer an aliquot portion containing about 15 mg. of arsenic to the flask of an all-glass decomposition apparatus w ith reflux tube, such as th a t described for use in the determ ination of arsenic or m ercury in organic compounds (5 , 4). If a sufficiently sensitive balance is available—e.g., a semimicrobalance—weigh ou t the whole sample, of such size as to contain about 15 mg. of arsenic, and dissolve in hydrochloric acid. To th e solution in the flask add and dissolve rapidly 3 gram s of sodium hypophosphite (N aH 2P 0 2.- HjO), and then add concentrated hydrochloric acid sufficient to increase the acid concentration to about 6 N . A ttach the condenser and heat th e flask w ith a small flame, completing the analysis as described (4).
A r s e n ic a l M i x t u r e s C o n t a in in g O r g a n ic M a t t e r . Decomposition by N itric and Sulfuric Acids (recommended 'procedure). Weigh accurately a sam ple of suitable size (to contain about 15 mg. of arsenic; 0.5 gram of Victory 76) and transfer to th e decomposition flask. Add 25 ml. of concentrated nitric acid and warm the m ixture for several m inutes. Add 20 ml. of concentra ted sulfuric acid, evaporate the m ixture to fumes, then add more nitric acid and again evaporate to fumes. Allow the liquid to cool partially and introduce 1 gram of ammonium sulfate. W hen evolution of gas ceases, heat the liquid gently for 5 m inutes. Cool, add about 50 ml. of w ater, and heat un til th e solution clears or is slightly opalescent. Add 35 ml. of concentrated hydro
chloric acid, then 3 grams of sodium hypophospite, and continue as described (4).
Decomposition of Victory 76 by Bromine. Transfer weighed sample to the decomposition flask, add 2 ml. of liquid bromine, and swirl th e m ixture for about 5 m inutes. Add 50 ml. of 6.V hydrochloric acid and heat m oderately until nearly all the excess bromine is expelled (hood). To the cooled solution add 10 ml. of concentrated hydrochloric acid and 3 gram s of sodium hypophosphite, and complete the analysis as indicated above.
RESULTS
A nalytical results for the four m aterials mentioned are presented in T able I, which includes also com parative results obtained by the fam iliar distillation procedure ( /) selected as an umpire method.
D i s c u s s io n . Results by the reduction m ethod show satisfactory levels of precision and accuracy, and are substantially identical with results by the distillation method. The reduction procedure is the more rapid, requiring about 40 minutes (exclusive of any needed prelim inary decomposition), as compared with the 2 to 3 hours required for the distillation procedure.
Table I. Determination of A rse n ic in Some Insecticides
M aterial
P aris green
Arsenio Found R eduction m ethod D istillation method
%42.81 42 .77
Av. 42 .79
%42.75 42.72 42.57
Av. 42.68
Lead arsenate 20 .25 20 .18 20 .15
Av. 20 .19C alcium arsenate 26 .65
26 .7226.73
Av. 26 .70
20.23 20.27 20.30
Av. 20.2726.84 26.77
Av. 26.81
Victory 76 insecticide
11 N O , 1 IsSOj B rom inedecom position decom position
3.57 3 .5 0 3 .6 0
Av. 3 .5 6
3 .643 .5 53 .6 03 .5 9
3.62° 3.57°
Av. 3.60
a P relim inary decom position by IIN O i-H iSO j.
ACKNOW LEDGMENT
G rateful acknowledgm ent is m ade to J. J. McGlynn, who executed a series of confirm atory analyses by the reduction and distillation methods.
(1)LITERATURE CITED
Assoc. Official A g r. Chem., Official and T en tative M ethods of Analysis, 5 th ed., pp. 44-5, 1940.
(2) Levine and M cN abb, I n d . E n o . C h e m ., A n a l . E d . , 15, 76 (1943)-(3) Sloviter, M cN abb, and W agner, Ibid., 13, 890 (1941),(4) Ibid., 14, 516 (1942).
NOTES ON ANALYTICAL PROCEDURES
A Vacuum Sto pco ck Lubricant Unaffected by H ydrocarbonsW . H . P E A R L S O N
School of Chemistry and Physics, The Pennsylvania State Co llege, State Co llege , Pa.
D ESPITE the frequent need in vacuum work for a stopcock lubricant th a t is unaffected by hydrocarbons, an inexpen
sive, readily prepared lubricant does not seem to be described in the literature. The glycol c itra te polym er of Sager (I) is satisfactory tow ards hydrocarbons, bu t its viscosity characteristics make it unsuitable for vacuum work. A fter a few hours the lubricant flows ou t of the ground surfaces, and rapid leakage results. From analogy w ith the common rubber-paraffin lubricant, it appeared th a t a high-molecular-weight filler m ight add sufficient body to overcome this difficulty. T he addition of cellulose ace- late to the glycol ester produced a lubricant th a t is quite unaffected by hydrocarbons and th a t perm itted the m aintenance of a vacuum of 10“ 4 mm. of m ercury after more than 6 m onths’ use.
A solution of cellulose acetate was prepared by heating 7.5 grams of Celanese, cu t into sm all pieces, in 45 gram s of te tra-
ethylene glycol. After 4 hours a t 140° C., w ith frequent stirring, the solution appeared homogeneous. Citric acid (30 grams) was heated on an oil ba th to 190° and the cellulose acetate solution added. H eating w as continued a t 180-190° C. for 90 minutes.
In order to remove dissolved water, the solution was immediately poured into a previously heated glass ja r in a desiccator and the desiccator evacuated as rapidly as foaming perm itted. The dehydration has little effect on the final consistency.
Stopcocks lubricated w ith this m aterial showed no signs of failure after 6 m onths in contact w ith liquid toluene, repeated evacuation, and frequent turning. N o changes in the properties of the lubricant were observed after storage in a closed ja r for a year.
LITERATURE CITED
(1) S a g e r , T . P . , I n d . E n g . C h e m ., A n a l . E d . , 4, 388 (1932).
Sto p co ck Lubricants for Use with O rgan ic V ap o rsI. E. P U D D IN G T O N
Division of Chemistry, National Research Laboratories, Ottawa, Canada
R ECIPES for lubricants which are insoluble in m ost organic solvents have been suggested (1-4). Generally, glycerol
has been used as a base while bentonite, dextrin, or dextrin and mannitol serve as thickening agents. While these un doubtedly behave well under ordinary conditions, sometimes the use of such a lubricant is required in1 a low-pressure system, "here conditions are more exacting. B oth bentonite and dextrin are difficult to dehydrate and dextrin is very ap t to decompose when heated to the tem perature necessary to disperse it thoroughly in glycerol. T his is undesirable, since w ater is one of the decomposition products, and while the vapor pressure of anhydrous glycerol is about 4 X 10“ 4 mm. of m ercury a t 25' C., it rises to 0.4 mm. when i t contains 2% water. This means th a t in order to obtain low pressures, long pumping times are necessary.
In an a ttem p t to obviate this difficulty several other thickening agents were tried. The m ost successful were combinations of mannitol or crystalline carbohydrates such as sucrose with polyvinyl alcohol of medium viscosity. T he polyvinyl alcohol 'tself made a good thickening agent, b u t the extra m aterial was required to give the necessary film streng th for lubrication.
Before making up, all m aterials were dried in vacuo at. 70° to 80° C. .This trea tm en t concentrated glycerol from 94% to better than 99% in about 4 hours and a McLeod gage on the system showed a pressure of 10 “ 4 mm.
Perhaps the m ost successful lubricant contained 1 to 3% of medium viscosity polyvinyl alcohol and 15 to 20% of m annitol, in glycerol. A fter th e ingredients had been pasted in th e cold the mixture was carefully heated to about 130° C. and held
there with continuous stirring until th e dispersion was uniform and complete. Stirring, when crystals first appeared after the mix cooled, was beneficial in keeping the m annitol finely divided. Although th e product was ra ther d ry in appearance, it behaved well after repeated turning of the stopcock.
T he m annitol m ay be replaced w ith about 40% of sucrose. T his preparation behaves well w ithout th e polyvinyl alcohol. Sucrose crystals will usually appear in the supersaturated solution after about two days’ standing, and stirring for a short tim e will keep them in a fine s ta te of division.
W ith either of these lubricants no difficulty was experienced in obtaining and holding a M cLeod gage pressure of 10“ 6 mm. T hey have been used successfully in system s containing ethyl ether vapors. Stopcocks did no t have to be regreased more frequently th an when norm al hydrocarbon greases are used w ith inert vapors.
Another possible base for this type of lubricant, which could be used in the presence of paraffin hydrocarbons, is triethanol- amine. This m aterial lias a lower vapor pressure th an glycerol (7 X 10“ 5 mm. a t 25° C.) and th e absorption of paraffin hydrocarbon vapors is about the same. In general, the same thickening agents can be used, b u t more care m ust be exercised to get the crystals in a sufficiently fine sta te of division.
Table I shows the com parative absorption of some organic vapors by anhydrous glycerol and triethanolam ine, when a 2- gram sam ple w ith a surface area of 4.8 sq. cm. was exposed 26 hours a t room tem perature in a sealed ja r containing the liquid organic solvent. The finished lubricants m ight be expected to absorb considerably less, since they are already sa turated with
415
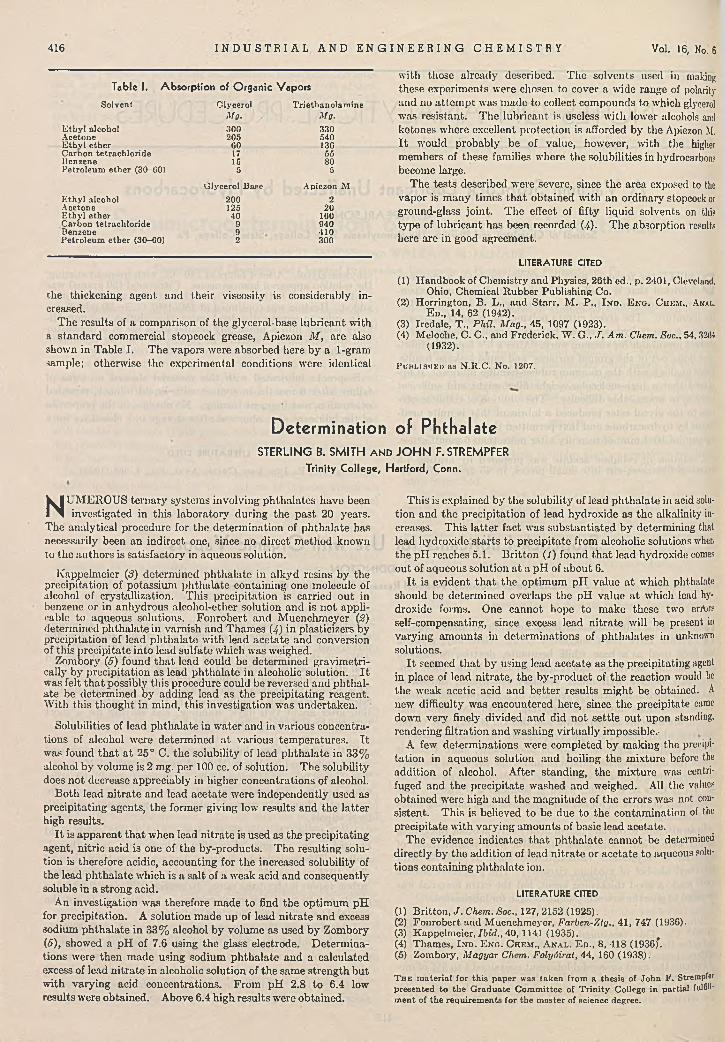
416 I N D U S T R I A L A N D E N G I N E E R I N G C H E M I S T R Y Vol. 16, No. 6
Table I. Absorption of O rgan ic Vapors
Solvent
E th y l alcohol A cetone E th v l e th e r C arbon te trach lo ride
GlycerolM g.300205
60
T riethano lam ineM g.330540136
17 55Benzene 15 80Petro leum e th e r (30-60) 5 5
Glycerol Base Apiezon ME th y l alcohol 200 2Acetone 125 20E th y l e th e r 40 160C arbon te trach lo ride 9 940Benzene 9 410P etro leum e th e r (30-60) 2 300
the thickening agent, and their viscosity is considerably increased.
T he results of a comparison of the glycerol-base lubricant with a standard commercial stopcock grease, Apiezon M , are also shown in Table I. The vapors were absorbed here by a 1-gram sample; otherwise the experimental conditions were identical
with those already described. The solvents used in making these experiments were chosen to cover a wide range of polarity and no a ttem p t was m ade to collect compounds to which glycerol was resistant. The lubricant is useless w ith lower alcohols and ketones where excellent protection is afforded by the Apiezon M. I t would probably be of value, however, w ith the higher members of these families where the solubilities in hydrocarbons become large.
T he tests described were severe, since th e area exposed to the vapor is m any times th a t obtained w ith an ordinary stopcock or ground-glass joint. T he effect of fifty liquid solvents on this type of lubricant has been recorded (4). T he absorption results here are in good agreement.
LITERATURE CITED
(X) Handbook of Chem istry and Physics, 26th ed., p. 2401, Cleveland. Ohio, Chemical R ubber Publishing Co.
(2) H errington, B. L., and S tarr, M . P., I n d . E n g . C h em ., Anal.E d ., 14, 62 (1942).
(3) Iredale, T „ P hil. Mag., 45, 1097 (1923).(4) Meloche, C. C., and Frederick, W. G., J . Am . Chem. Soc., 54,3284
(1932).
PunLTSUEi» as N .R .C . No. 1207.
Determination of PhthalateS T E R L IN G B. S M IT H a n d J O H N F .S T R E M P F E R
Trinity Co llege , Hartford, Conn.
N UM EROUS ternary systems involving ph thalates have been investigated in this laboratory during the past 20 years.
The analytical procedure for the determ ination of ph thala te has necessarily been an indirect one, since no d irect method known to th e au thors is satisfactory in aqueous solution.
Kappehneicr (3) determ ined phthalate in a lkyd resins by the precipitation of potassium phthalate containing one molecule of alcohol of crystallization. This precipitation is carried out in benzene or in anhydrous alcohol-ether solution and is no t applicable to aqueous solutions. Fonrobert and M uenchm eyer (2) determined phthalate in varnish and Tham es (4) in plasticizers by precipitation of lead ph thala te w ith lead acetate and conversion of this precipitate into lead sulfate which was weighed.
Zombory (5) found th a t lead could be determ ined gravim etri- cally by precipitation as lead ph thala te in alcoholic solution. I t was felt th a t possibly this procedure could be reversed and ph thalate be determ ined by adding lead as the precipitating reagent. W ith th is thought in mind, this investigation was undertaken.
Solubilities of lead ph thalate in w ater and in various concentrations of alcohol were determ ined a t various tem peratures. I t was found th a t a t 25° C. th e solubility of lead ph thalate in 33% alcohol by volume is 2 mg. per 100 cc. of solution. T he solubility does no t decrease appreciably in higher concentrations of alcohol.
B oth lead n itra te and lead acetate were independently used as precipitating agents, the former giving low results and the la tte r high results.
I t is apparen t th a t when lead n itra te is used as the precipitating agent, n itric acid is one of the by-products. T he resulting solution is therefore acidic, accounting for th e increased solubility of the lead phthalate which is a sa lt of a weak acid and consequently soluble in a strong acid.
An investigation was therefore made to find the optim um pH for precipitation. A solution m ade up of lead n itra te and excess sodium ph thalate in 33% alcohol by volume as used by Zombory(5), showed a pH of 7.6 using th e glass electrode. D eterm inations were then m ade using sodium ph thala te and a calculated excess of lead n itra te in alcoholic solution of th e same strength bu t w ith varying acid concentrations. From pH 2.8 to 6.4 low results were obtained. Above 6.4 high results were obtained.
This is explained by the solubility of lead ph thala te in acid solution and th e precipitation of lead hydroxide as th e alkalinity increases. This la tte r fact was substan tia ted by determining that lead hydroxide s ta rts to precipitate from alcoholic solutions when the pH reaches 5.1. B ritton (1) found th a t lead hydroxide comes out of aqueous solution a t a pH of about 6.
I t is evident th a t the optim um pH value a t which phthalate should be determ ined overlaps the pH value a t which lead hydroxide forms. One cannot hope to make these two eribr? self-compensating, since excess lead n itra te will be present in varying am ounts in determ inations of phthalates in unknown solutions.
I t seemed th a t by using lead acetate as th e precipitating agent in place of lead n itra te , the by-product of the reaction would be the weak acetic acid and b e tte r results m ight be obtained. A new' difficulty was encountered here, since the precipitate came dowm very finely divided and did no t settle ou t upon standing, rendering filtration and washing virtually impossible.-
A few determ inations w'ere completed by making the precipita tion in aqueous solution and boiling the m ixture before the addition of alcohol. A fter standing, the m ixture was centrifuged and the precipitate washed and weighed. All the values obtained w'ere high and the m agnitude of the errors was not consistent. T his is believed to be due to the contam ination of the precipitate w ith varying am ounts of basic lead acetate.
T he evidence indicates th a t ph thalate cannot be determined directly by th e addition of lead n itra te or acetate to aqueous solutions containing ph thalate ion.
LITERATURE CITED
(1) Britton, J . Chem. Soc., 127, 2152 (1925).(2) Fonrobert and M uenchmeyer, Farben-Zlg., 41, 747 (1936).(3) Kappelmeier, Ibid., 40,1141 (1935).(4) Tham es, I n d . E n o . C h e m ., A n a l . E d . , 8, 418 (1936)*.(5) Zombory, Magyar Chem. FolyAirat, 44, 160 (1938).
T h e m ate ria l for th is p ap er was tak en from a thesis of John F. StrempRr presen ted to th e G rad u a te C om m ittee of T rin ity College in partia l fulfillm en t of th e requ irem ents for th e m aster of science degree.

Stability of W ijs Solution for Iodine Number DeterminationsF R A N K A . N O R R IS a n d R O B E R T J . B U S W E L L , G eneral M ills, Inc., M inneapolis, M inn.
T HE Wijs solution is probably the m ost satisfactory for general use in determ ining iodine numbers. I t s more
widespread utilization is hindered m ainly by its supposed difficulty of preparation and short life. T he first objection is hardly valid if chlorine is available and if the analyst is reasonably careful. The short life would appear to be a m uch more serious objection, since three standard references on fa t analytical methods specifically caution against using th is solution when it is more than 30 days old ( / , 2, 4). However, H ilditch (3) does not accept this view, and Wijs himself (3) claims indefinite stability for, the reagent. Previous experience by one of the present authors is in agreem ent w ith the two last-nam ed investigators.
Since a decision on the stab ility of W ijs solution was considered necessary in connection w ith some analytical work, the authors m easured the stab ility of the reagent when stored a t room tem perature in 250-ml. dark bottles. T he solution was prepared in the standard m anner and contained 1.5% excess equivalents of iodine over chlorine. Linseed oil, stored in the ice box, was used as the te s t substrate.
Over a to tal period of 505 days, the Wijs solution did no t change sufficiently to cause a m easurable difference in the iodine number of the substrate. N o measurable differences were found when the reagent was taken from bottles th a t had been previously opened. These facts indicate the validity of storing the solution a year or more, if storage is in small bottles which are opened as needed.
Table I. Stability of W ijs Solution
B ottle No.Age of Solution,
D aysD ays Since B ottle
F irs t Opened Iodine No.
1 G 0 177.32 45 0 178 .02 97 52 177.13 97 03 132 35 176! 53 174 77 170.83 231 134 176.34 277 0 177.04 314 37 177.44 374 97 177.05 404 0 177.85 455 51 170.85 505 101 177.2
LITERATURE CITED
(1) Am. Oil Chein. Soc., M ethods, 1941.(2) Assoc. Official Agr. Chem., Official and T entative M ethods, 5th
ed., p. 430, 1940.(3) H ilditch, T . P., “ Industrial Chem istry of F a ts and W axes” , p. 48,
London, Baillifere, Tindall & Cox, 1941.(4) Jam ieson, G. S., “ Vegetable F a ts and Oils” , p. 343, New York,
Reinhold Publishing Corp., 1932.(5) W ijs, J . J . A., Analyst, 54, 11-14 (1929).
P a p e r 52, Jo u rn a l Series, Chem ical Research D ep artm en t, G eneral Mills, Inc.
A n A id in A sh in gS E L M A L . B A N D E M E R a n d P. J . S C H A IB L E
Chemistry Section, M ichigan Agricultural Experiment Station,East Lansing, M ich.
T HE ashing of m any products is often difficult and time- consuming, as is evidenced by th e num ber of procedures
published for special m aterials (1). This is especially true for substances th a t are finely ground, contain oil or fat, or have a high phosphorus-to-base ratio . F or such m aterials, a simple procedure which was recently devised to ash large volumes of liquid egg w hite (3) is suggested.
This procedure consists of lining th e crucible w ith filter paper, charring th e m aterial over a M eker burner in th is lined crucible, moistening th e char w ith a solution of magnesium chloride, ana completing th e ashing in a muffle furnace.. Filter paper of th e correct size (W hatm an No. 40 or equivalent) is folded as for filtering, the tip of th e cone folded back, and th is truncated cone fitted into the crucible. T his liner prevents local overheating because of th e air space between i t and the crucible and perm its th e easy escape of th e volatile m aterials,
Certain M aterialssince th e charring proceeds slowly from th e outside tow ard the center. T he charred mass tends to retain its cone shape and is free of th e crucible. Thus, th e crucible walls are protected from the action of the m aterials ashed. F a tty m aterials burn more evenly and slowly, w ithout spattering. The char is moistened w ith a solution of magnesium chloride added dropwise over the entire m ass and ashed in a muffle overnight a t 600° C. The ash obtained is light, fluffy, and voluminous and dissolves readily in dilute hydrochloric acid on heating.
I f unaided by th is procedure, m aterials which have a high phosphorus-to-base ratio fuse on ignition to a glassy mass which frequently entraps carbon th a t can then be burned off only with great difficulty. This fusion is caused by th e conversion of the dihydrogen and monohydrogen phosphates upon ignition to the m etaphosphate (3), which does no t dissolve readily in ho t dilute hydrochloric acid. In th e suggested procedure, magnesium chloride supplies base to produce th e te rtia ry phosphate which is unaffected on heating to 600° C.
In th e au thors’ experience, samples ash poorly if they do not contain am ple base for the phosphorus or in the ease of plant m aterial if th e stalks, stems, hulls, coatings, or b ran have been removed. In these m aterials, th e use of th e lined crucible and magnesium chloride is beneficial. In com parative trials, the proposed m ethod aided the ashing of fresh tissues such as muscle, liver, intestines, and fa t of chicken, pork, and beef as well as fresh egg w hite and yolk, casein, lecithin, corn gluten meal, flour, and starch.
LITERATURE CITED
(1) Assoc. Official Agr. Chem., Official and T en tative M ethods ofAnalysis, 5 th ed., 1940.
(2) Bandem er, S. L., and Schaible, P . J ., Poultry Sci. (in press).(3) Mellor, J . W ., “ Comprehensive T reatise on Inorganic and
Theoretical C hem istry” , Vol. V III , p. 967, New Y ork, Longm ans, Green & Co., 1935.
J o u r n a l A rticle No. 697 (n.s.) M ichigan A gricultural E xperim en t S ta tion .
417

Htri A Constant-Rate D ropping Funnel
C H E M IST S are often annoyed to find, a fter carefully adjusting
a dropping funnel to deliver a liquid dropwise into a reaction mixture, th a t w ithin a short time the flow of drops has either stopped entirely or greatly diminished. A combination of two factors m ay be held largely responsible for this: the diminishing hydrostatic pressure as the liquid level falls, and the gradual tendency for' the stopcock to close during the flow of the liquid. This conclusion can be readily verified by experiment.
A simple modification eliminates both these factors from an ordinary dropping funnel.
T he modification, as shown in the accompanying diagram, chiefly consists in placing tightly in th e top of th e funnel a one-hole stopper, A , in which is inserted a glass tube, B, reaching nearly to the bottom of the
G IL B E R T A S H B U R N a n d R O B E R T L . F R A N K ,
N oye s Chemical Laboratory, University of Illinois, Urbana, III.
funnel. W hen liquid is allowed to flow out, air enters tube B and escapes a t D. The pressure in the air space, C, then changes in such a way th a t as the liquid level drops, the sum of C and the hydrostatic pressure represented by the distance D E remains essentially constant. This is in accordance w ith the principles of the M ario tte flask (I).
The gradual tendency of the-stopcock to close m ay be obviated by restricting the entrance of a ir into B and then opening stopcock G completely. The air flow can be controlled either by means of a capillary tube attached to B or, as illustrated, II. by a screw clamp on a short piece of rubber tubing into whien.has been inserted a small wire, I . If the opening a t V is of large diam eter, it is sometimes necessary to draw out the tube in order to prevent a ir from entering a t this point.
Dropping funnels equipped in this way have been found useful in this laboratory for the dropwise delivery of liquids into reaction mixtures. Although a slight decrease in ra te can be noticed during the tim e of delivery, th e flow is constant enough for m ost purposes.
LITERATURE CITED
(1) M u e lle r , I n d . E n o . C h e m ., A n a i ,. E d ., 12, 171 (1940).
NEW EQUIPMENTSulfur Train
Num bered among im proved appara tus accelerated by the war program is a sulfur train , originated by the Universal Oil Products Co. and built by the Precision Scientific Co., 1736 N orth Springfield Ave., Chicago. The m ethod, identified as U .O.P. M ethod H-201-43-A, determ ines 0.0002 to 0.05% of sulfur in combustible liquids and gases. The samples are burned in a stream of purified air and the products of combustion absorbed in a solution of sodium hypobrom ite. The sulfur is then determined as sulfate by turbidim etric m easurem ent of colloidal barium sulfate.
The apparatus consists of an air-pressure regulator and filter pressure gage, air-purification furnace, cooling tank, gas scrubbers, water regulator, m oisture trap , and bank of eight A .S.T.M . sulfur lamps.
Compressed air controlled by a pressure-reducing valve is reduced
to 2 p.s.i., then passes through an activated charcoal tower and into the air-purification furnace containing a heated stainless steel U-tube 1 inch in diam eter and approxim ately 4 feet long, filled with quarti chips.
Air leaving the furnace is cooled to approxim ately room temperature by passing through a w ater-jacketed copper-coil condenser a t the furnace outlet. I t then passes successively through water, sodium hypobrom ite, and sodium hydroxide scrubbers, then through a eonstant-pressure regulator, into a m oisture trap fitted into a vacuum bottle, and finally into a d istribution manifold serving the sulfur lamps.
For the determ ination of sulfur in gases, the apparatus includes eight Duralum in weighing bombs of 35-ml. capacity, for connecting to the sulfur lamps.
418

Vlbrationless Drive with full power of motor delivered at all speedsThroughout the entire speed range of 75 to 1300 f.p.m., the Sargent Cone Drive delivers full motor power, is vibrationless and silent, and assures constancy of any selected speed. It is, therefore, as efficient for such applications as the rotation of electrodes end calorimeter paddles at speeds of about 200 r.p.m. w less, as it is for general stirring operations at higher speeds. Fine adjustment of speed is made by means of an adjusting nut which changes the effective diameter of the cone in contact with the friction ring. Because the motor is a brushless, induction type not containing centrifugal switches, it is relatively safe against explosion. The simple right angle clamp permits rapid adjustment of the motor to any desired Position in horizontal and vertical planes.
S-76445 S arg en t C one D riv e S tirr in g M otor. (P a te n t No. 1,973,576.) C om ple te w ith cross su p p o rt rod , r ig h t ang le clam p, connecting cord an d plug, b u t w ith o u t su p p o rt s tand . F o ro p e ra tio n fro m 115 v o lt A.C. 60 cycle c ircu its ......................$33.50S-76455 D itto . B u t fo r 115 v o lt D .C . c ircu its ...................... 38.50S-76465 D itto . B u t fo r 230 v o lt A.C. 60 cycle c ircu its .... 34.505-76475 D itto . B u t for 230 v o lt D .C . c ircu its.................... 40.50S-76480 A node C huck and C athode C o lle t........................... 1.50S-79225 S u p p o rt on ly fo r S a rg en t C one D riv e S tirr in g M o to r ( i llu s tra te d a b o v e). D esigned w ith considerab le m ass to m in im ize su p p o rt v ib ra tio n . T h e h eav y U sh aped base accom m odates vessels u p to six inches in d iam e te r a n d la rg e r vessels can b e p laced on to p o f th e base w hich has a fla t surface. S u p p lied w ith a % " rod , 30 inches long and ad justing , screw s to in su re a solid fo u r p o in t su p p o rt on any surface. E ach $10.00
SARGENT CONE DRIVE IRRING MOTOR
E. H. SARGENT & COMPANY, 155-165 East Superior Street, Chicago 11, IllinoisM ichigan D iv is ion: 7959 E a s t Jefferso n , D e tro it 7, Michigan
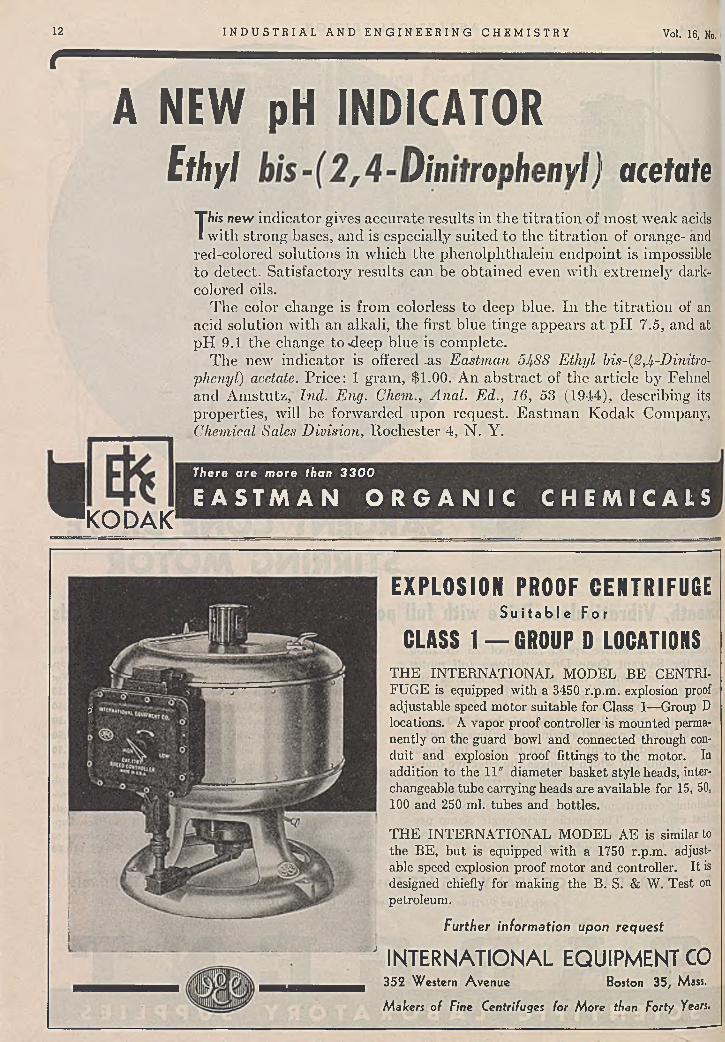
12 I N D U S T R I A L A N D E N G I N E E R I N G C H E M I S T R Y Vol. 16, No.
e
A N EW pH INDICATORE t h y l b i s - ( 2 , 4 - D in i t r o p h e n y a ce ta te
^ K O D A K 1
T his new indicator gives accurate results in the titration of most weak acids with strong bases, and is especially suited to the titra tion of orange- and
red-colored solutions in which the phenolplithalein endpoint is impossible to detect. Satisfactory results can be obtained even with extremely dark- colored oils.
The color change is from colorless to deep blue. In the titration of an acid solution with an alkali, the first blue tinge appears a t pH 7.5, and at pH 9.1 the change to «deep blue is complete.
The new indicator is offered .as Eastman 5J/.S8 Ethyl his-{2,^-Dinitro- phenyl) acetate. Price: 1 gram, $1.00. An abstract of the article by Fehnel and Amstutz, Ind. Eng. Chem., Anal. Ed., 16, 53 (1944), describing its properties, will be forwarded upon request. Eastm an Kodak Company, Chemical Sales Division, Rochester 4, N. Y.
There are more than 3300
E A S T M A N O R G A N I C C H E M I C A L S
f
EXPLOSION PROOF CENTRIFUGES u i t a b l e For
CLASS 1 — GROUP D LOCATIONSTHE INTERNATIONAL MODEL BE CENTRIFUGE is equipped with a 3450 r.p.m. explosion proof adjustable speed motor suitable for Class 1— Group D locations. A vapor proof controller is mounted permanently on the guard bowl and connected through conduit and explosion proof fittings to the motor. In addition to the 11" diameter basket style heads, interchangeable tube carrying heads are available for 15, 50, 100 and 250 ml. tubes and bottles.
THE INTERNATIONAL MODEL AE is similar to the BE, but is equipped with a 1750 r.p.m. adjustable speed explosion proof motor and controller. It is designed chiefly for making the B. S. & W. Test on petroleum.
Further information upon request
J IN T E R N A T IO N A L E Q U IP M E N T C O352 Western Avenue Boston 35, Mass.
Makers of Fine Centrifuges for More than Forty Years.
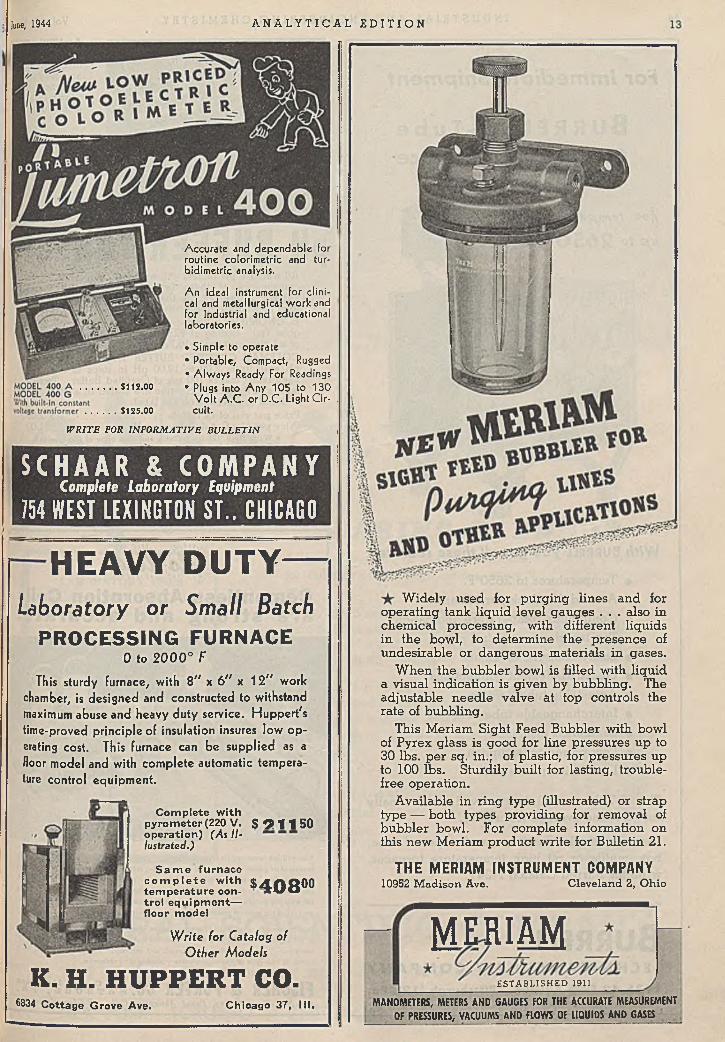
SCHAAR & COMPANYC o m p l e te L a b o r a t o r y E q u ip m e n t
754 WEST LEXINGTON ST.. CHICAGO
Accurate and dependable for routine colorimetric and tur- bidimetric analysis.
An ideal instrument for clinical and metallurgical work and for industrial and educational laboratories.
• Simple to operate• Portable, Compact, Rugged• Always Ready For Readings
511 2 .0 0 • plugs into Any 105 to 130Volt A.C. or D.C. Light C ir -
5 1 25 .00 c u i t .
W R IT E FOR IN F O R M A T IV E B U L L E T IN
June, 1944 A N A L Y T I C A L E D I T I O N
Widely used for purging lines and for operating tank liquid level gauges . . . also in chemical processing, with different liquids in the bowl, to determine the presence of undesirable or dangerous materials in gases.
When the bubbler bowl is filled with liquid a visual indication is given by bubbling. The adjustable needle valve at top controls the rate of bubbling.
This Meriam Sight Feed Bubbler with bowl of Pyrex glass is good for line pressures up to 30 lbs. per sq. in.; of plastic, for pressures up to 100 lbs. Sturdily built for lasting, trouble- free operation.
Available in ring type (illustrated) or strap type — both types providing for removal of bubbler bowl. For complete information on this new Meriam product write for Bulletin 21.
THE MERIAM INSTRUMENT COMPANY10952 M a d iso n A ve. C lev e la n d 2, O h io
MERIAME S T A B L IS H E D 1911
MANOMETERS, METERS AND GAUGES FOR THE ACCURATE MEASUREMENT OF PRESSURES, VACUUMS AND FLOWS OF LIQUIDS AND GASES
HEAVY DUTY—Laboratory or Sm all Batch
PROCESSING FURNACE0 to 2 0 0 0 ° F
This sturdy furnace, with 3" x 6 " x 127/ work chamber, is designed and constructed to withstand maximum abuse and heavy duty service. Huppert's time-proved principle of insulation insures low operating cost. This furnace can be supplied as a floor model and with complete automatic temperature control equipment.
W rite for Catalog of Other Models
K. H. HUPPERT CO.6834 Cottage Grove Ave. Chicago 37, I I I .
Com plete w ith pyrom eter (220 V . $ 9 1 1 5 0 operation) ( A s II - lu stra ted .)
S a m e fu rnace c o m p l e t e w ith S iH I Q O O tem perature con- * W C»tro l equipm ent— floor model
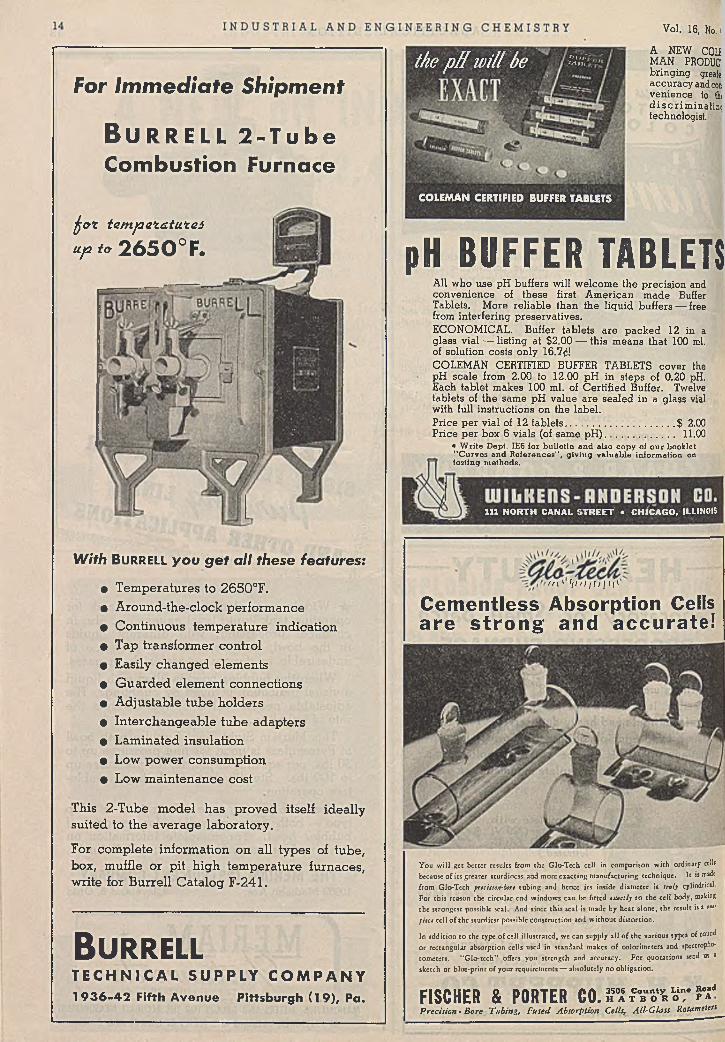
the pH will be **utTy^Ht.
COLEMAN CERTIFIED BUFFER TABLETS
111 NORTH CANAL STREET • CHICAGO, ILLINOIS
pH B U F F E R TABLETSAll who use pH buffers will welcome the precision and convenience of these first American made Buffer Tablets. More reliable than the liquid buffers — free from interfering preservatives.ECONOMICAL. Buffer tablets are packed 12 in a glass vial — listing at $2.00 — this means that 100 ml. of solution costs only 16.7(i!COLEMAN CERTIFIED BUFFER TABLETS cover the pH scale from 2.00 to 12.00 pH in steps of 0.20 pH. Each tablet makes 100 ml. of Certified Buffer. Twelve tablets of the same pH value are sealed in a glass vial with full instructions on the label.Price per vial of 12 tablets.........................................$ 2.00Price per box 6 vials (of same pH ).......................... 11.00
• W rite D ept. IE6 fo r b u lle tin a n d also co p y of o u r bookle t “ C u rv es a n d R e fe re n c e s" , g iv in g v a lu ab le in fo rm ation on te s tin g m e thods.
B u r r e llT E C H N I C A L S U P P L Y C O M P A N Y1 9 3 6 - 4 2 F if th A v e n u e P i t t s b u r g h ( 1 9 ) , P a .
W i t h B u r r e l l y o u g e t a l l t h e s e f e a t u r e s :
0 Temperatures to 2650°F.• Around-the-clock performance• Continuous temperature indication• Tap transformer control• Easily changed elements• Guarded element connections• Adjustable tube holders• Interchangeable tube adapters• Laminated insulation• Low power consumption• Low maintenance cost
This 2-Tube model has proved itself ideally suited to the average laboratory.
For complete information on all types of tube, box, mutile or pit high temperature furnaces, write for Burrell Catalog F-241.
n i ' ' ; / ' / / / ; / 11'
Cem entless Absorption Cells a re s t ro n g and accu rate!
For Im m ed ia te Sh ip m en t
B u r r e l l 2 - T u b eCom bustion Furnace
A NEW C0L£ MAN PRODUC bringing greate accuracy and cot venience to thid iscrim inatimtechnologist.
Vol. 16, No. I
h & t t a m j a a t G . t u . t a i
up to 2 6 5 0 °F .
Y ou w ill g e t b e tte r re su lts from th e G Io-T cch cell in com parison w ith ordinary cells because o f its g re a te r sturd iness and m ore ex a c tin g m an u factu rin g tech n iq u e . I t is made fro m G lo-T cch prtcision-bort tu b in g and hence i ts inside d iam ete r is truly cylindrical.
F o r th is reason th e c irc u lar end w in d o w s can be fitted t x a c tl j to th e cell body, making th e s tro n g est possib le sea l. A nd since th is sea l is m ade by h e a t a lo n e , th e resu lt is a t*1'
pitc t cell o f th e s tu rd ies t possib le co n s tru c tio n and w ith o u t d is to r t io n .
In a d d itio n to th e ty p e o f cell i llu s tra te d , w e can supp ly a ll o f th e various types o f round o r rec tan g u lar ab so rp tio n ce lls used in s tan d ard m akes o f co lo rim ete rs and spectrophotom eters. '■G lo-tcch’' offers y o u s tre n g th and accuracy . F o r q u o ta tio n s send us a sketch o r b lu e-p rin t o f yo u r requ irem en ts-— ab so lu te ly n o o b lig a tio n .
FISCHER & PORTER M .?!iTS,5,8rK'Precision - Bore Tubing, Fused Absorption Cells, All-Glass Rotameters
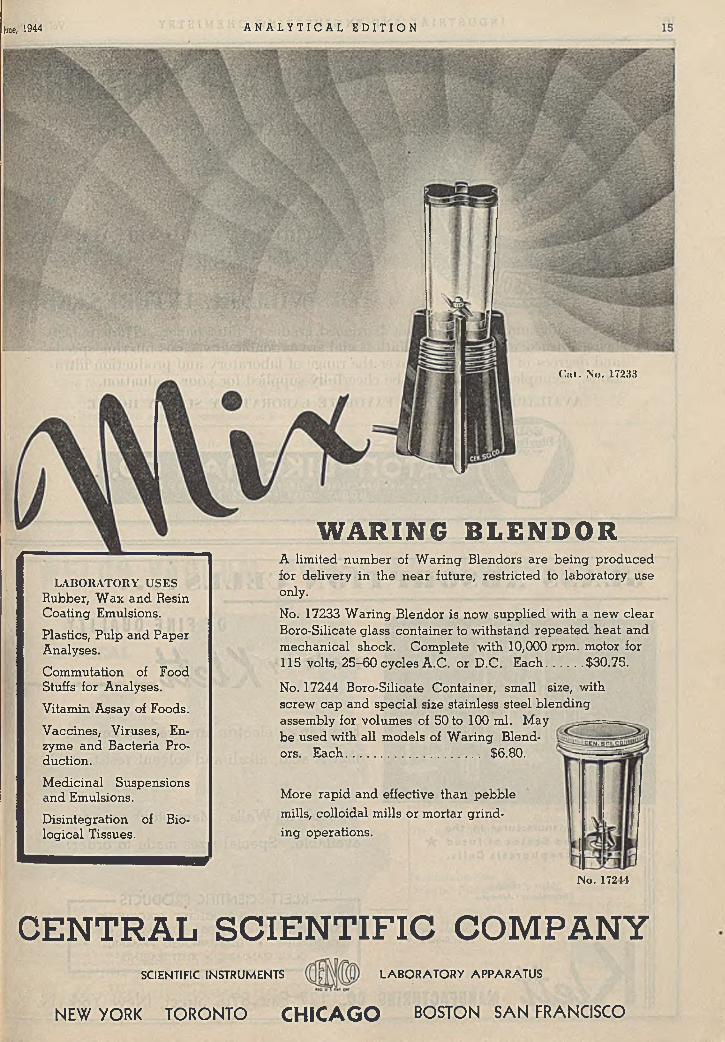
Jane, 1944 A N A L Y T I C A L E D I T I O N
C a l. N o. 17233
CEN TR A L S C IE N T IF IC COM PANYS C IE N T IF IC IN S T R U M E N T S L A B O R A T O R Y A P P A R A T U S
NEW YORK TORONTO C H I C A G O BOSTON SA N FRANCISCO
No. 17 2 11
LABORATORY U SES Rubber, Wax and Resin Coating Emulsions.Plastics, Pulp and Paper Analyses.Commutation of Food Stuffs for Analyses.Vitamin Assay of Foods.Vaccines, Viruses, Enzyme and Bacteria Production.
Medicinal Suspensions and Emulsions.Disintegration of Biological Tissues.
WARING BLENDOR
More rapid and effective than pebble mills, colloidal mills or mortar grinding operations.
A limited number of Waring Blendors are being produced for delivery in the near future, restricted to laboratory use only.
No. 17233 Waring Blendor is now supplied with a new clear Boro-Silicate glass container to withstand repeated heat and mechanical shock. Complete with 10,000 rpm. motor for 115 volts, 25-60 cycles A.C. or D.C. Each $30.75.
No. 17244 Boro-Silicate Container, small size, with screw cap and special size stainless steel blending assembly for volumes of 50 to 100 ml. May be used with all models of Waring Blendors. Each.......................................... $6.80.
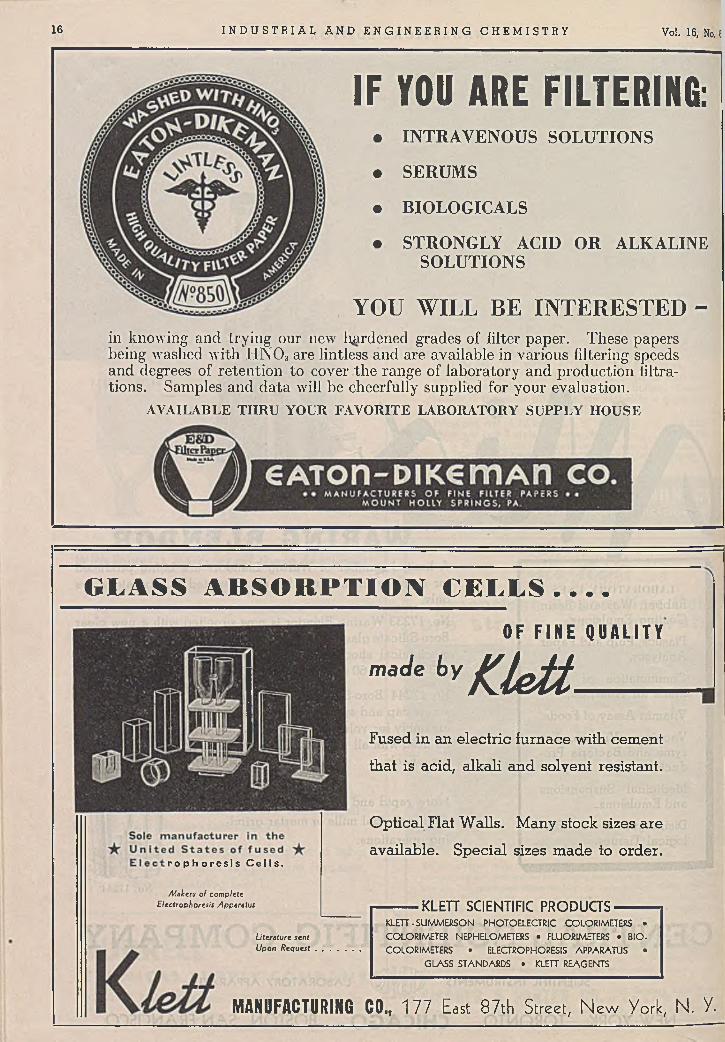
16 I N D U S T R I A L A N D E N G I N E E R I N G C H E M I S T R Y Vol. 16, No. £
IF YOU ARE FILTERING:• IN TR A V E N O U S SO LUTIO NS
• SERUM S
• BIOLOGICALS
• STRONGLY ACID OR ALKALINE SO LUTIO NS
YOU WILL BE INTERESTED -in knowing and trying our new hardened grades of filter paper. These papers being washed with JHN03 are lintless and are available in various filtering speeds and degrees of retention to cover the range of laboratory and production liltra- tions. Samples and data will be cheerfully supplied for your evaluation.
AVAILABLE THRU YOUR FAVORITE LABORATORY SUPPLY HOUSE
G L A S S A B S O R P T I O N C E L L S ____
O F F I N E Q U A L I T Y
”“ J' i v K l e t i _____
M ANUFACTURING C O ., 1 77 East 87th Street, N ew York, N . y .
Fused in an electric furnace with cement
that is acid, alkali and solvent resistant.
Optical Flat Walls. Many stock sizes are
available. Special sizes made to order.r o p h o r e s l s C e l l s .
K LET T SC IEN TIFIC P R O D U C T S ---------KLETT • SUMMERSON PHOTOELECTRIC COLORIMETERS • COLORIMETER NEPHELOMETERS • FLUORIMETERS • BIOCOLORIMETERS • ELECTROPHORESIS APPARATUS •
GLASS STANDARDS • KLETT REAGENTS
Makers o f complete Electrophoresis Apparatus
Literature sent Upon Request
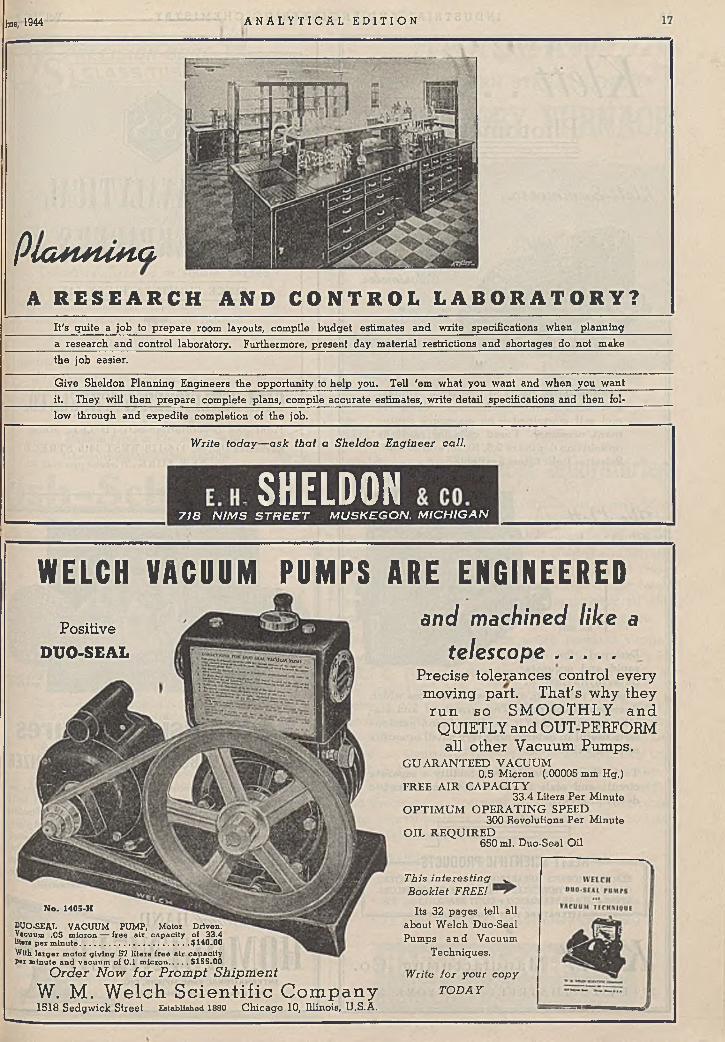
VAt'ouM W m f .
W rite today— a sk tha t a Sheldon E ngineer call.
SHELDON7 1 8 N I M S S T R E E T M U S K E G O N . M I C H I G A N
It's quite a job to prepare room layouts, compile budget estimates and write specifications wben planning a researcb and control laboratory. Furthermore, present day material restrictions and shortages do not makethe job easier.
Give Sheldon Planning Engineers the opportunity to help you. Tell 'em w hat you want and when you want it. They will then prepare complete plans, compile accurate estimates, write detail specifications and then fol- low through and expedite completion of the job.
June, 1944 A N A L Y T I C A L E D I T I O N
P iG S U U H G
A R E S E A R C H A N D C O N T R O L L A B O R A T O R Y ?
WELCH VACUUM PUMPS ARE ENGINEEREDPositive
DUO-SEAL
N o. 1405-H
DUO-SEAL V ACU U M PUM P, M otor D riven . Vacuum .05 m icro n — fre e a ir c a p a c ity of 33.4litar* p e r m in u te .......................................................$140.00With la rg e r m o to r g iv ing 57 lite rs free a ir c a p ac ity P«r m inute a n d v acu u m of 0.1 m ic ro n $155.00
O rder N ow for Prom pt Sh ipm en tW. M. W e lc h S c i e n t i f i c C o m p a n y1518 Sedgwick Street E stab lished 1880 Chicago 10, Illinois, U.S.A.
and machined like a telescope .....
Precise tolerances control every moving part. That's why they run so SMOOTHLY and
QUIETLY and OUT-PERFORM all other Vacuum Pumps.
G U A R A N T E E D V ACUUM0.5 Micron (.00005 mm Hg.)
FREE A IR C A PA C ITY33.4 Liters Per Minute
O P T IM U M O P E R A T IN G SPEED300 Revolutions Per Minute
O IL R EQ U IR ED650 ml. Duo-Seal Oil
This in teresting ^
Booklet FREE!
Its 32 pages tell all about W elch Duo-Seal Pumps a n d Vacuum
Techniques.
Write fo r your copy T O D A Y
18 I N D U S T R I A L A N D E N G I N E E R I N G C H E M I S T R Y Vol. 16, No.
W ith H and Homogenizer
t u ttf-luorimeter
No. 2071
D e sig n e d fo r th e ra p id a n d a c c u r a te d e t e r m i n a t i o n o f „t h ia m in , r ib o fla v in , a n d o th e r su b s ta n c e s w h ic h f lu o resce in s o lu t io n . T h e s e n s it iv ity a n d s t a b il ity are s u c h t h a t i t h a s b e e n fo u n d p a r t ic u la r ly u s e fu l in d e te r m in in g very s m a ll a m o u n ts o f th e s e su b s ta n c e s .
K l e t t . . . .P h o t o m e t e r s
No Emulsion Failuresw ith the LA B O R A T O R Y HOM OGENIZER• Test samples, experimental batches perfectly homogenized quickly, conveniently. Perma- ilent suspension w ith no failures — if ingred ien t-ra tio is sound. T he m icrophotos above show higher degree o f dispersion.
H undreds in daily laboratory use. Easy and simple to operate
and keep clean. Save time and m a te ria ls . C apacity , 1 to 10ounces; sturdily made of molded alum inum; stainless steel piston. Height, 10 inches. Still avail’ able from pre-war stock. Only $6.50 complete, direct or from your laboratory supply house. Satisfaction Guaranteed/
HAND
HOMOGENIZEDIN T E R N A T IO N A L E M U L S I F I E R S , IN C .
2 4 0 1 S u r r e y C o u r t , C h ic a g o , III.
K le t t - £ u + tu n e / iix u r
Photoelectric QlcvU G elt
Calorim eter
No. 900-3
F o r t h e var ied n e e d s o f in d u s tr ia l, c lin ic a l a n d a g r ic u ltu r a l la b o r a to r ie s . C o m p le te a n d s e lf c o n ta in e d — n o a c ce sso r y e q u ip m e n t n e c essa ry . F u se d c e lls fo r rea d in g s o n s o lu t io n d e p th s o f 2 .5 , 10, 20, a n d 40 m m . S e le c t iv e l ig h t f ilte r s a v a ila b le .
ELECTROPHORESIS APPARATUS • BIO -COLORIM ETERS G L A SS A BSORPTION CELLS • COLORIMETER NEPHELOM- ETERS • G L A SS STANDARDS « KLETT REAGENTS
L I T E R A T U R E S E N T U PO N R E Q U E S T
K le t t M a n u fa c tu r in g C o .179 E A S T 8 7 T H S T R E E T N E W Y O R K , N . Y.
S IN C E E IG H T E E N F IF T Y -S IX
n r
CARL SCHLEICHER & SCIIUELL CO.P lan t and Laboratories: SO U T H L E E , MASS.
E xecu tive Offices: 116-118 W EST 14th ST R E E T NEW Y O R K , N . Y.
KLETT SCIENTIFIC PRODUCTS
T o fu r th e r in c r e a se i t s a d a p ta b il ity a se p a r a te c ir c u it a n d s c a le is p ro v id ed fo r c o lo r im e tr ic d e te r m in a t io n s .
Withitorur a n d Pe*tU

¡sue, 1944 A N A L Y T I C A L E D I T I O N 19
HARSHAW SCIENTIFIC1 9 4 5 E . 9 7 th S T R E E T • C L E V E L A N D 6 , O H IO C IN C IN N A T I • D E T R O IT • P H IL A D E L P H IA
DAIGGERA c i d a n d A l k a l i R e s i s t a n t
L A B O R A T O R Y E N A M E LDaigger NUKEM Laboratory Enamel can be termed a "liquid plastic" and may be easily applied to any surface.
This product was originally developed for use in industrial plants w here steel and wood parts are exposed to acid and alkali fumes.
Daigger Laboratory Enamels are applied with little effort either by brush or spray methods.They will set out-of-dust in about fifteen minutes and will dry hard in one hour. O n properly prepared surfaces, these enamels will cover in one coat without showing brush marks; they will produce rich, full gloss finishes which are resistant to heat, alcohol, acids, alkalies, fumes of all kinds and constant washing or scrubbing.
priced at Per gallon*2.00 p er q u a r t
W rite for color card and descriptive literature
A. DAIGGER & CO.Laboratory A pparatus and Reagents
159 West Kinzie Street • Chicago
HARSHAWNEW MODERN STREAMLINED
A sk fo r Bulletin PB-293 Made of Pyrex or Kimble NC. glass
FISH -SCHU RM AN CORPORATIO N 230 East 45th Street New York 17, N. Y .
F i s h - S c h u r m a
LABORATORY FURNACE
for chemical and metallurgical laboratoriesThis modern Harshaw M LR furnace has incorporated in its design all the b est features of the large production furnace such as: full metal outer casing, rugged long life heating elements (folded and formed ribbon type heater), refractory lined door and front of furnace, totally enclosed terminals, ceramic brick insulation, even distribution of heat, plus all the special features included in all Harshaw furnaces.
The M LR furnace can be safely operated continuously at 1850° F. and for short periods as high as 2000° F. The large working chamber is 7 hi" wide x SVi" high x 14" deep . . . The ceramic plates in which resistors are mounted can be reversed (at factory) for full muffle operation . . . Current characteristics: 3.5 KW., on 115 Volts or with transformer on 230 Volts . . . Control of furnace can be automatic by use of an indicating and controlling pyrometer or manually operated by the use of an indicating pyrometer and rheostat . . . For most applications, a fabricated alloy hearth plate is supplied to protect the bottom heating elements.
W rite D ep a rtm en t 298 for q u o ta tio n
S E N D F O R• 32 page book listing Industrial Chem icals
• 72 page price list of Laboratory Chem icals
Cylindrical, Tapered or Square ShapedF.S. Precision-Bore Glass Tubes are made to exact inside dimensions for applications where in terchangeability and precise bore are required.Inside diam eter: 0.13mm (0.005") to 100mm (4") kept accurate w ithin .01 to .001mm (± .0004" to .00004").For: M anom eters, Barom eters, Viscosimeters, Flowmeters, Gauges, Pum ps and m any other scientific, technical and industrial purposes.
IABORATORY APPARATUS & REAGENTS • t N D U S T R I A l C H E M l t ^
TWO IMPORTANT LABORATOR1 S A F E T Y IT E M S !
CARBON mmm dioxide FIRE EXTINGUISHE!
Modern, portable, operated with oni hand, safe— which includes one-hail thumb-trigger operation. The Randolpl kills flames with instant, effective actioa Quickly smothers oil, gasoline, painl m achine and electric fires. Will no conduct electricity; cannot damage 01 stain food, clothing, woodwork, ma chinery. Leaves no mess to clean up, Underwriters' approved. 18%' high. Capacity 4 lbs. C O 2.No. 14090—filled, with hanging brade! ready for u se ...................... $20.16 each
ALL-PLASTIC FACE & EYE SHIELDN O T E F O R E H E A D
A N D H A IR P R O T E C T IO N
H E a DBANOa d ju s t s
TO ANY Size FOR
) MENOR l WOMEN
L I F T E DP O S IT IO NIn ten thousand and one
ways, the chemist is bringing æPthe day of Victory closer and closer. Through multiplied production of m ilitary explo- sives . . . through discoveries of new processes, new syn- -œthetics, new compounds, new alloys . . . chemistry is speeding the complete mobilization of our war machine and the nation’s needs to keep it running.
Spencer’s contribution in this achievement lies in the field of optical science and in supplying instruments of many types indispensable to the world of chemistry.
F E L T E D F O R E H E A D B A N D
P l a s t i c s h i e l d
Pull-up strap li.ts and adjusts to any angle without touching or soiling face of shield.Designed for utmost c o m f o r t . No b o l t s , nuts, ratches to lose.P e r f e c t a l l ' r o u n d vision, ventilation. No fogging. Non-interference with eye glass« or respirators. Light w eight— no binding or tightness. Non-flan- mable, unbreakable, maximum transparency, no side glare- C leaned with damp cloth.No. 36720......................................................................................$1.50 Each
fPULL-UPStrap
& C O M P A N YA R T H U R SL J V aJLJLV^VJL L E N S COM PANY
B U FFA L O , N EW Y O R KS C IE N T IF IC IN S T R U M E N T D IV IS IO N O FA M ERICA N O PTIC A L COM PAN Y
125 W. Hubbaid St.

Science opens the door to industrial progress in controlling product uniformity and im provem ent. . . in keeping ahead of competition and public dem and. Your laboratory appropriation invested in Steelab equipment and furniture, assures profitable returns in maximum efficiency and serv iceability . Add the nam e of your organization to over 10,000 of the nation's outstanding laboratories Steelab has a lread y planned and equipped.
C oors P o r c e l a in C o m p a n y ^iferJ . GOLDEN, COLORADO
‘teasic equipmentOF A L L M O D E R N , T E S T I N Gl a b o r a t o r i e s
74*B I C H X E H F I ! X X E L
( TABLE TYPE )& Gol&iad* ßnaduct
^W<yädruüde attic
LUMETRONPHOTOELECTRIC COLORIMETER MOD. 402-E
A highly sensitive instrument covering an unusually widefield of application.• Designed for use with filters isolating narrow spectral
bands. 16 monochromatic filters available.• Great variety of sample holders including test tubes, micro
cells, absorption cells up to 150 mm light path.• Line-operated, high stability and reproducibility due to
use of balanced photocell circuit.• A p p lica b le with accessories to fluorescence, ultraviolet
absorption, scattering effect, haze, reflection of opaque liquids, powders, pastes, solids.
Write for 15-page bulletin
PHOTOVOLT CORPORATION95 M adison A ve. NEW YORK 16, N . Y.
Colorimeters, Fluorescence Meters, Reflection Meters,Glossmeters, Densitometers, Smokemeters, Photometers
KEY TO THE PERFECT LABORATORY AND THE FUTURE PROGRESS OF YOUR ORGANIZATION
S E E over flOO illustrations (con ta in ed in 224 p a g e s) o f sc ientifica lly g s ; d esig n ed , precision b u ilt la b o ra to ry eau ipm ent to meet yo u r specificd e sig n e d , prec is ion b u ilt la b o ra to ry equ ipm ent to meet yo u r specific
p la n n in g needs.
'»ŚW ILABORATORY FURNITURE COMPANY, INC
[irne, 1944 A N A L Y T I C A L E D I T I O N
CHEMICAL AND SCIENTIFIC PORCELAIN WARE

22 I N D U S T R I A L A N D E N G I N E E R I N G C H E M I S T R Y Vol. 16, No.
T he l a r g e ARL-DIETERT Grating Spectrograph with the Multisource Unit and Compara- tor-Densitometer form a mated set of practical analytical equipment, capable of the utmost in performance, accuracy, speed, and versatility of operation.
The Large ARL-DIETERT Grating Spectrograph is ideal for either the analysis of material possessing simple spectra or of material with a more complicated spectra such as alloy steels. For the latter type of material, the spectrograph is operated in the second order with a uniform dispersion of 3.5 angstroms per mm. Lines that are 0.05 angstroms apart are easily resolved with clear cut definition.
■fa W rite to d a y f o r in fo rm a tio n
• • for the u ltim ate in accurate perform ance
The Multisource Unit heralds a new era in spectro- chemical analysis. This versatile instrument will obtain the maximum in accuracy and increase the scope of operation of any spectrograph. The Multisource is mote powerful than any other excitation unit, and the reproducibility of the excitation is the best obtainable.
The Comparator-Densitometer makes a speedy identification of the spectral fines of 72 elements. Time is saved and human error is reduced to a minimum with the accurate and easy to read galvanometer.
The practical staff of ARL-DIETERT spectrogra- pliers is qualified to help you solve your analytical control problems.
o n sp ec tro g ra p h ic e q u ip m e n t a n d c o n su lta n t serv ice .
DIETERTA P P L I E D R E S E A R C H L A B O R A T O R I E S 4336 SAN FERNANDO RD., GLENDALE 4, CALIF.
H A R R Y W . D I E T E R T C O . 9330 ROSELAWN AVE., DETROIT 4, MICH.