Introduction to Oil Cleanliness - Bard Engineering Group
50
Introduction to Oil Cleanliness Filtration & Monitoring Solutions for hydraulic oil and lubricants PURE POWER
-
Upload
khangminh22 -
Category
Documents
-
view
1 -
download
0
Transcript of Introduction to Oil Cleanliness - Bard Engineering Group

Introduction to Oil Cleanliness
Filtration & Monitoring Solutions for hydraulic oil and lubricants
PURE POWER

2
Fluid is one of the most critical components in a hydraulic system

3
Introduction
In hydraulics, fluid is one of the most critical components. Its main function is to serve as a
medium to transmit power, but it can also be used to dissipate heat, lubricate, seal clearances
between moving parts or transport contaminants. Once a hydraulic system is operational,
contaminants will find their way into the hydraulic fluid and affect the physical and chemical
composition. This contamination causes numerous problems, including:
� Component breakdown
� Reduced hydraulic fluid and equipment life
� Decrease in system efficiency
� Machine downtime
� High maintenance costs
The financial losses that come along with this process can become a heavy burden, especially
when breakdown occurs in critical systems and interrupts the continuation of business processes.
There are various ways of monitoring and maintaining fluid condition, but to solve the problem,
it’s important to first understand it.
This guide is intended to help the user in decision making about hydraulic fluid filtration. The
selection and correct use of a filtration system is important to increase operational reliability
while reducing manufacturing and maintenance costs.
ContentIntroduction 3
Sources of Contamination 6
Measurement 8
Contamination Types 9
Damage Caused by Contamination 17
Oil Sampling 20
Quantifying Solid Particle Contamination 23
ISO Cleanliness Levels 27
Cleanliness Selection Guide 29
Types of Hydraulic Fluid 30
Filtration Types 32
Types of Filtration Media 33
Reactive Maintenance 38
Preventive Maintenance 38
Condition Based Maintenance 39
Solutions 42
Solutions for Solid Contamination 43
Solutions for Contaminated Air 44
Solutions for Water Contamination 44
Solutions for Acids 45
Condition Monitoring Solutions 46
Conversion Tools 48

4
NOTES

Contamination

Sources of Contamination
Contamination in a hydraulic system is impossible to completely avoid. To determine the best long term solution to remove and prevent contamination, it is important to first identify the source.
Ingress contaminationParticles from the surrounding air enter
the hydraulic fluid through (temporary)
openings in the hydraulic system. This can
be reservoir breathers, leaking cylinder
rod seals or when the hydraulic system is
opened for maintenance.
Contaminated componentsAlthough maintenance is important,
it is also a source of contamination.
In addition to the increased chance
of ingress contamination, every new
component installed, is a potential risk of
contamination.
Internally generated contaminationContamination can also develop within the
hydraulic system. For example changes in
temperature cause condensation leading
to water contamination and friction of
components can cause solid contamination
in the hydraulic fluid.
The four sources
Contaminated new fluidWhen commissioning or topping up a
hydraulic system, it is often assumed that
the new hydraulic fluid is clean. However,
the fluid is transported and stored in
containers, tanks and transport systems
before entering the hydraulic system, which
implies risks of contamination.
Most contamination enters through conventional breathers and cylinder rod glands
New fluid is not clean fluid and must be filtered before use
FACT

7
Contaminated and unfiltered new fluid
Airborne contaminationand humidity
Opening in a hydraulic system
Opening in a hydraulic system
Water Contaminationdue to Cooler leakage
Maintenance
Wear contamination
Condensation
Air contaminationdue to damaged seals
By-pass filtration
Desiccant Breathers
Desiccant Breathers
Off-Line Filtration
Off-Line Filtration
Contamination sources in a hydraulic system Additional filtration solution

8
Measurement
Particle sizeContaminants come in various sizes, mostly as particles of microscopic size, invisible to the
human eye. The particles are measured on micrometre scale.
Micrometre scaleOne micrometre (“μm” or ‘‘micron’’) is one-millionth of a meter, 39 millionths of an inch. The
human eye can detect particles larger than approximately 40 microns. Particles that damage
hydraulic or lubrication systems are mostly smaller than 40 microns.
Most available filtration units are able to remove particles over 3 micron, but fall short when it
comes to smaller particles. Unfortunately these smaller particles, also known as silt, can cause
serious damage to hydraulic systems.
FACTAdditives in hydraulic fluid are generally
well below 1 micron in size and are
unaffected by standard filtration methods
100 μmGrain of salt
40 μmHuman eye visibility
25 μmPollen grains
10 μmAverage cell in human body
0,1 - 3 μmBacteria

9
Contamination Types
Every form of contamination damages a system in its own way and requires a different treatment. To ensure the best filtration solution, it is important to determine the type of contamination.
Acid2
Solid contamination1
Soft contamination3
Water contamination 4
Air contamination5

10
Solid Contamination
Solid contamination is most of the time an insoluble contamination type that won’t dissolve in oil or other liquids. Solid contaminants like metal, sand and rubber but also salt and ice crystals can be
recognised by:
� The presence of contamination in the tank
� Damaged seals
� Clogged valves
� Accelerated oil oxidation and deterioration
Solid contamination can cause the following problems: abrasion, adhesion, fatigue, erosion and silting.
AdhesionAdhesion occurs when the oil film thickness
decreases to a point that metal-to-metal
contact starts occurring, resulting in surface
weld and shear.
Components typical subject to adhesion
� Hydraulic cylinders
� Ball and journal bearings
Adhesive wear effects
� Valve leakage
� Lower system efficiency
� Component breakdown
Abrasion Abrasion occurs when a large solid
contamination particle gets stuck
between two moving components
and digs itself into one of them,
scratching and damaging the surface
of both moving components.
Components typically subject to abrasion
� Hydraulic components like pump, motor,
spool valves and cylinders
� Journal bearings
Abrasive wear effects
� Dimensional changes to system
� Valve leakage
� Lower system efficiency

11
ErosionErosion occurs when particles impact and
damage the component surfaces by removing
material.
SiltingSilting occurs when solid particles build-up in
the hydraulic system.
Silting effects
� Clogged valves
� Slow response, instability
� Spool jamming/stiction
� Solenoid burnout
� Impacts heat transfer characteristics
FatigueFatigue occurs when solid particles get stuck
and repeatedly dent the component’s surface,
resulting in surface cracking and damage. Due
to fatigue the particle will get released to start
damaging another part of the system.
Fatigue wear effects
� Leakage
� Deterioration of component
surface
� Cracking of component
surface
Components typical subject to
fatigue wear
� Journal, hydrostatic and rolling
element bearings
� Geared system
Erosive wear effects
� Dimensional changes to system
� Valve leakage
� Disfunctional valves or nozzle spray pattern
Components typical subject to erosion
� Pump
� Valves (servo, proportional, directional)
� Nozzle
Components typical subject to silting
� Valves (servo, proportional, directional)
� Heat exchangers
� Cylinders

12
AcidsOne of the main reasons of degradation of hydraulic fluid
is oxidation, a chemical reaction between oxygen and
hydrocarbon molecules in the fluid. Hydraulic oxidative
degradation is rated by the Acid Number (AN) / Total
Acid Number (TAN). It displays the amount of potassium
hydroxide (KOH) in milligrams that is needed to neutralize
the acids in one gram of oil.
Effects acids
� Fluid gets darker
� Increased viscosity
� Development of varnish and sludge

13
Soft Contamination � Less effective heat exchangers
� Increased wear of valves, load gears, and bearing surfaces
� Reduced hydraulic fluid life
� Premature filter change-outs and oil flow restrictions
� Increased oil leakage
Soft contaminants will also cause sludge, a soft dark substance
which moves around in the hydraulic system until coming to
rest at the bottom.
Effects of sludge
� Monday morning disease
� Clogged of valves
� Increased operating temperature
� Corrosion
Soft contaminants are another insoluble contamination type causing problems for a wide range of hydraulic
applications, especially turbines. Soft contaminants can lead to the formation of varnish. Contaminated fluid
containing metal and moisture particles will oxidise, which results in fluid degradation and a rising Total Acid
Number (TAN), and eventually in the formation of varnish. This process will be accelerated by temperature
fluctuations (heat) which cause hot spots.
Varnish creates a sticky film on the components of the hydraulic system, catching all sorts of particles. This
continues to build up, forming an abrasive and destructive surface film that results in sticky deposits adhering
to the metal surfaces of the oil loop, e.g. piping, valves, heat exchangers, filters and other sensitive equipment.
Varnish is one of the most underestimated contaminants that will lead to a reduced service life of your fluids,
filters and system and will cause unscheduled downtime and maintenance.
Effects of varnish

14
Water Contamination
Water state
Solid contamination is often considered as the biggest cause of hydraulic and lubrication failure. However water contamination can cause many problems like corrosion and oil degradation by oxidation. The water concentration in a hydraulic fluid is marked as RH percentage (relative humidity), ppm (parts per million) or % (percentage weight or volume).
Water can be present in a hydraulic or
lubrication fluid as dissolved or free water.
Dissolved water develops when individual
water molecules bind with oil molecules.
As these water molecules are too small to
see with the naked eye, it will not change
the colour of the fluid, it will remain clear.
Each type of oil has its own
‘’saturation point’’ at which
oil can’t hold any more water
molecules. Most common
saturation points will be
between 200 and 600 ppm (0,02
– 0,06 percent) depending on the temperature
of the oil. At a higher temperature the oil will
be able to hold more water. Also aged fluids
can dissolve more water. After the saturation
point is reached and more water enters the
system, emulsion will be created. The state of
the hydraulic fluid will change from clear to a
cloudy, milky substance. Adding more water
to this emulsion leads to free water, which is
mostly found on the bottom of oil reservoirs
due to the higher specific density.
To minimise the damaging
effects of free water, the
concentration of water
in oil should be as low as
possible and well below
the oil saturation point. We
recommend a maximum saturation level of 40-
50% at operating temperature for H, HL, HLP
and HVLP fluids*. Dielectric fluids should be
maintained at an even lower saturation level.
0 20 40 600
100
200
300
400
Saturation curve
Fluid Temperature (°C)
Wat
er C
onc
entr
atio
n (P
PM
)
System design point
Dissolved WaterFree Water
Water Concentration10,000 PPM 1 %1,000 PPM 0,1 %100 PPM 0,01 %
*PPM- Parts per million
*See page 28-29 for explanation.
FACTHydraulic fluid holds more water at high temperature

15
Typical oil saturation levels*
Different hydraulic fluids have their own
saturation point.
� Hydraulic: 200-400 PPM (0.02-0.04 %
� Lubrication: 200-750 PPM (0.02-0.075%
� Dielectric: 30-50 PPM (0.003-0.005 %
� Industrial Phosphate Ester: 1000-3000 PPM
(0.1-0.3 %)
*Actual levels will depend on oil type temperature
and additives.
Water contamination can be recognised by:
� Condensation in tank
� Rust in tank and oil circuit
� Pump cavitation & erosion
Water contamination effects
� Oil oxidation & deterioration
� Reduced lubricating film thickness
� Corrosion
� Accelerated metal surface fatigue
� Loss of dielectric strength in insulating oils
Effects of water contamination
The first sign of water contamination is a
change in viscosity. This will result in reduced
lubrication thickness causing metal-to-metal
contact. The combination of free water with
small copper or iron particles created by wear
will have a catalytic effect on the oxidation.
Free water also penetrates microscopic pores
in the metal surfaces, causing corrosion of
the system’s components. Corrosion particles
will spread through the system, causing the
formation of new corrosion in the tank and the
cycle continues.
Water contamination will also cause depletion
of additives which results in loss of dielectric
strength, oxidation, accelerated metal surface
fatigue and oil breakdown.0
10
20
30
40
50
60
70
Oil
deg
rad
atio
n (%
)
Oil+
Wat
er+
Cup
per
Oil+
Wat
er+
Iro
n
Oil+
Co
pp
er
Oil+
Iro
n
Oil+
Wat
er
Min
eral
Oil
1 5,3 3,8 5,2 47,8 65,9
Oil degradation due to catalytic effect.
Effects of water contamination on life cycle of bearings.
0,0 0,1 0,2 0,3 0,4 0,50
50
100
150
200
250
Water in oil (%)
Rem
aini
ng b
eari
ng li
fe (%
) 0,0025% = 25 ppm
0,01% = 100 ppm
0,05% = 500 ppm
0,10% = 1000 ppm
0,15% = 1500 ppm
0,25% = 2500 ppm
0,50% = 5000 ppmFACTAt freezing temperatures
the formation of ice crystals can have severe
damaging effects

16
Air Contamination
DAMAGE
� Loss of transmitted power
� Reduced pump output
� Loss of lubrication
� Increased operating
temperature
� Reservoir fluid foaming
� Chemical reactions
Inside a hydraulic system, air can exist in a dissolved or free
state. Dissolved air will not pose a problem, free air on the
other hand will become a problem when it passes through
system components. It can cause pressure changes that
compress the air and produce a large amount of heat in
small air bubbles. This heat can destroy both additives and
the hydraulic liquid itself.
If the amount of free air reaches a certain level, it will
have a negative effect on the productivity of the system.
Hydraulic systems rely on the fluid being relatively
incompressible, while air reduces the volume of the liquid.
This is due to the fact that air is far more compressible
than the liquid in which it is dissolved. When air is present,
a pump has to put more energy into compressing the air,
therefore there is less energy left for operating the system.
A system in this state is said to be ‘spongy‘.
Air in both dissolved and free state is a potential source of
oxidation, accelerating the corrosion of metal parts. Both
produce oxides which promote the formation of particles
or form sludge. Wear and interference increase if oxidation
debris is not prevented or removed.
SOURCES
� System leaks
� Pump aeration
� Reservoir fluid turbulence
� Low oil level in reservoir
(splashing)
PREVENTION
� System air bleeds
� Flooded suction pump
� Proper reservoir design
� Return line diffusers
� Desiccant Breathers
FACTFoam is a good indication of air contamination

17
Damage Caused by Contamination
Typical Dynamic Clearances
COMPONENT DETAILS CLEARANCE
ValvesServo 1 - 4 μmProportional 1 - 6 μmDirectional 2 - 8 μm
Variable Volume
Piston Pumps
Piston to Bore 5 - 40 μm
Valve Plate to Cylinder
block0.5 - 5 μm
Vane PumpsTip to Case 0.5 - 1 μm
Sides to Case 5 - 13 μm
Gear PumpsTooth Tip to Case 0.5 - 5 μmTooth to Side Plate 0.5 - 5 μm
Ball Bearings Film Thickness 0.1 - 0.7 μmRoller Bearings FIlm Thickness 0.1 - 1 μmJournal Bearings Film Thickness 0.5 - 100 μmSeal Seal and Shaft 0.05 0.5 μm
Gears Mating Faces 0.1 - 1 μm
*Ref. ASME (American Society of Mechanical Engineers) Wear Handbook
Lubrication thickness
In hydraulic systems moving surfaces are separated by the lubrication fluid. The lubrication
thickness is determined by the viscosity of the fluid, the load on and speed of the moving
surfaces.
High mechanical loads can cause the lubrication thickness to decrease to less than 1μm. This in
combination with surface wear and roughness (particles) increases the risk of the lubrication film
becoming corrupted, causing metal-to-metal friction with harmful results.
The following failures can occur:
� Orifice blockages
� Orifice blockages in pilots of poppet/proportional/servo valves
� Jammed pistons in pumps or vanes in rotor slots
� Component wear
� Abrasive wear
� Erosive wear
� Adhesive wear
� Fatigue wear
� Corrosive wear
� Corrosion
� Degradation of the surface
� Depletion of additives and their protective ability
� Biological growth
� Microbes and fungi can be found in hydraulic systems in water and air,
producing acids that attack metal surfaces, causing
� Acid smell of oil and oil can look slimy
� Increase in fluid viscosity
� Reduced hydraulic fluid life
� Clogged filter elements
� Increased presence of sediment

18
NOTES
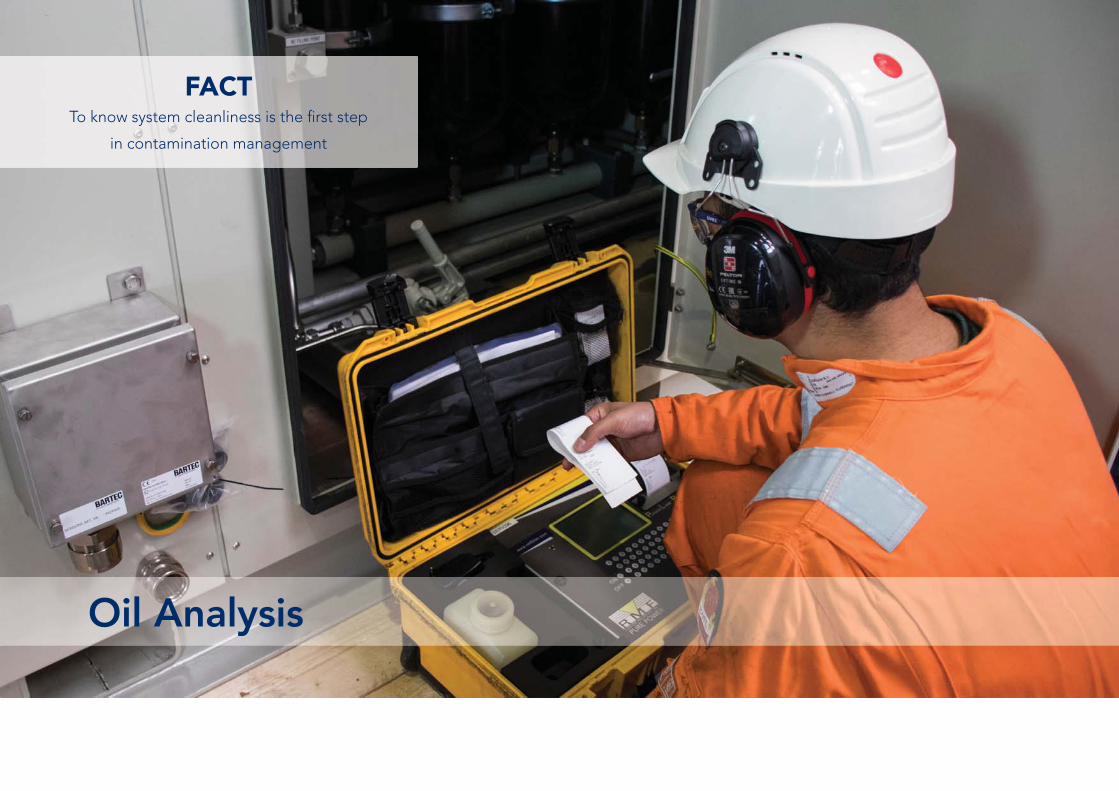
Oil Analysis
FACTTo know system cleanliness is the first step
in contamination management
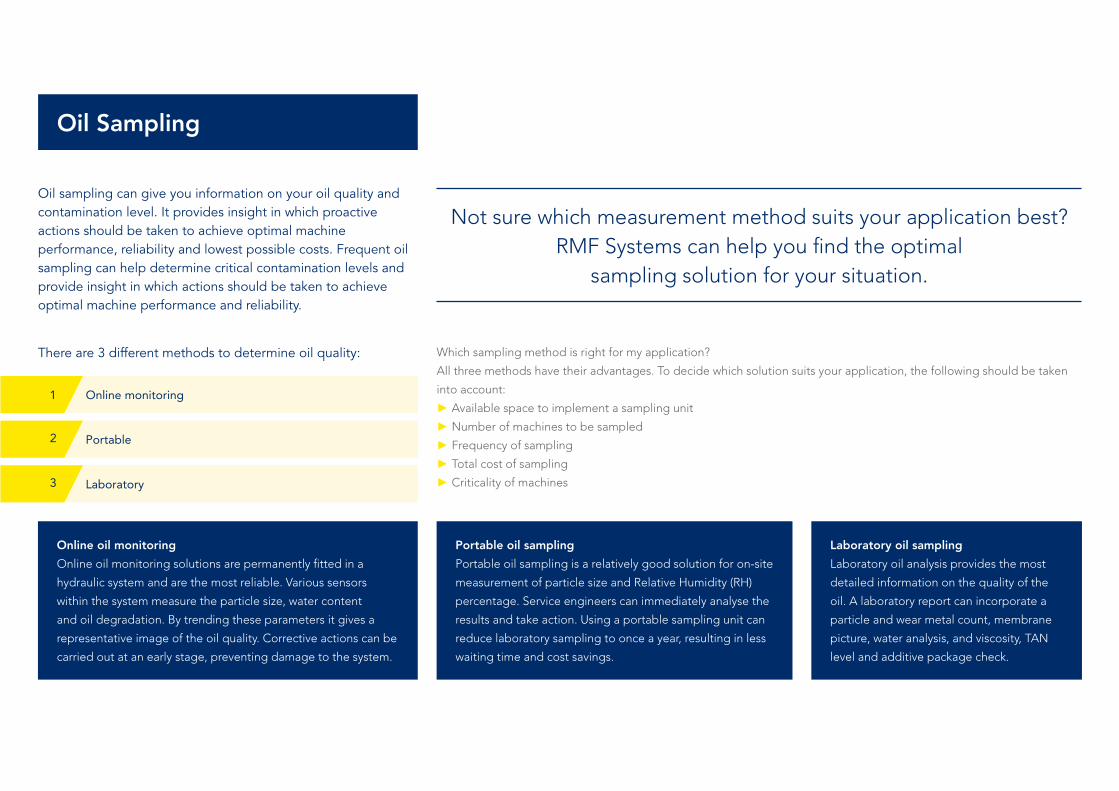
Oil Sampling
Not sure which measurement method suits your application best? RMF Systems can help you find the optimal
sampling solution for your situation.
Which sampling method is right for my application?
All three methods have their advantages. To decide which solution suits your application, the following should be taken
into account:
� Available space to implement a sampling unit
� Number of machines to be sampled
� Frequency of sampling
� Total cost of sampling
� Criticality of machines
Laboratory oil sampling
Laboratory oil analysis provides the most
detailed information on the quality of the
oil. A laboratory report can incorporate a
particle and wear metal count, membrane
picture, water analysis, and viscosity, TAN
level and additive package check.
Online oil monitoring
Online oil monitoring solutions are permanently fitted in a
hydraulic system and are the most reliable. Various sensors
within the system measure the particle size, water content
and oil degradation. By trending these parameters it gives a
representative image of the oil quality. Corrective actions can be
carried out at an early stage, preventing damage to the system.
Portable oil sampling
Portable oil sampling is a relatively good solution for on-site
measurement of particle size and Relative Humidity (RH)
percentage. Service engineers can immediately analyse the
results and take action. Using a portable sampling unit can
reduce laboratory sampling to once a year, resulting in less
waiting time and cost savings.
Oil sampling can give you information on your oil quality and contamination level. It provides insight in which proactive actions should be taken to achieve optimal machine performance, reliability and lowest possible costs. Frequent oil sampling can help determine critical contamination levels and provide insight in which actions should be taken to achieve optimal machine performance and reliability.
Portable2
Online monitoring1
Laboratory3
There are 3 different methods to determine oil quality:

21
How to take a representative sample
There are a few common mistakes when taking an oil sample:
� Incorrect sampling point
� Inconsistent sampling point
� Reusing an old sample bottle
� Taking a sample without flushing the sampling point first
EXISTING SYSTEM
SEND SAMPLE FOR LABORATORY TEST
NEW INSTALLATIONNEW OIL
ZERO POINT MEASUREMENT
FIRST CHECK AFTER 3 MONTHS
FIRST CHECK AFTER 6 MONTHS
CHECK AGAIN AFTER 6 MONTHS
GOOD
CHECK AGAIN AFTER 3 MONTHS
INCREASE INTERVAL FOR BETTER TRENDING
WARNING
CHECK AGAIN AFTER 1 MONTH
IMPROVE OIL QUALITY!TIPS: INSTALL OFFLINE FILTER, CHANGE OIL AND REPAIR OR
REPLACE BROKEN COMPONENTS
BAD
Oil Sampling frequency
To ensure consistent and representative results, the sampling conditions must always be the
same. Therefore ensure to document the sample location, flush volume, frequency, timing within
a cycle and indicate what tools and accessories were used.
LocationThere are a few locations in a hydraulic system which provide you with a representative sample.
Good sampling points are:
� Before pressure filter
� Return line before filter
� Oil reservoir (last resort)
Off-line filter units often have a sample point at the base of the housing. When this is not the
case, find a sampling point between the pump and filter.
FrequencyThe frequency of sampling is determined by the criticality of a hydraulic system. Critical systems
need a higher sampling frequency to ensure operational reliability. For systems that are less
critical sampling every six months should be sufficient. The Oil sampling frequency chart can
help you determine the sampling frequency. The indications “Good”, “Warning” and “Bad”
might differ per system. Most component builders have specified typical oil cleanliness levels
and lifetime of the component.
Please contact RMF Systems for more information or advise on choosing the most suitable
method for your application.

22
Procedure for taking an oil sampleBefore taking a sample always make sure the hydraulic system is in stable operation and follow the procedure below to
get the most out of a laboratory oil analysis.
Requirements:
� A certified particle free glass or hard plastic sampling bottle (approximately 100-200 ml)
� An open oil container or bucket (approximately 2 litres)
� A sampling hose
Place the sampling bottle carefully under the sampling hose without disconnecting the hose from the valve2
Close the valve and unplug the sampling hose5
Connect the sampling hose to the sampling point and flush between 1 and 2 litres into the oil container1
Immediately place the cap on the bottle after taking the sample4
Fill the bottle for approximately 80%3
Fill out the label on the sample bottle6
Pack the sampling bottle properly and send it for laboratory testing7
Steps
FACTThere are different classes
in certification of cleanliness
of sampling bottles

23
Quantifying Solid Particle Contamination
ISO 4406:1999Developed by the International Organization for Standardization, the ISO Range Code is the
commonly used cleanliness code. The ISO 4406 code records the cleanliness level of a hydraulic
liquid by three numbers. These numbers correspond with the amount of particles respectively
larger than 4, 6 and 14 micron per 100ml. As there are always more small particles than large
particles, the ISO code numbers always go from high to low (example: 17/15/13).
250,000,0004μ 6μ 14μ
28130,000,000
2764,000,000
2632,000,000
2516,000,000
248,000,000
234,000,000
222,000,000
211,000,000
20500,000
19250,000
18130,000
17 1764,000
1632,000
15 1516,000
148,000
13 134,000
122,000
111,000
10500
9250
8130
764
632
516
48
34
22
11
00.5
Larger than 4 μm = 125,000
Larger than 6 μm = 29,490
Larger than 14 μm = 4,250
Example:
ISO 16/14/11 – NAS 6
Microscopic view of a cleanliness level that
is commonly required by OEM. This sample
contains 40 thousand particles per 100 ml.
ISO 23/21/18 – NAS 12
Microscopic view of highly contaminated
hydraulic fluid. This sample contains more
than 4 million particles per 100 ml.

24
NAS 1638NAS 1638 (National Aerospace Standard) is and American standard originated in the
aerospace industry to determine contamination levels of fluid in hydraulic components.
NAS 1638 divides particles in five size classes:
� 5 to 15 μm / 100 ml
� 15 to 25 μm / 100 ml
� 25 to 50 μm / 100 ml
� 50 to 100 μm / 100 ml
� 100 or higher μm / 100 ml
These five size classes combined with the particle distribution result in 14 different
classes with “00” being the cleanest and “12” the dirtiest. The class with the highest
amount of particles counted, is referring to the fluid’s NAS class.
Maximum particles / 100ml in specified size range (μm)
00 0 1 2 3 4 5 6 7 8 9 10 11 12
5-15 125 250 500 1000 2000 4000 8000 16000 32000 64000 128000 256000 512000 1024000
15-25 22 44 89 178 356 712 1425 2850 5700 11400 22800 45600 91200 182400
25-50 4 8 16 32 63 126 253 506 1012 2025 4050 8100 16200 32400
50-100 1 2 3 6 11 22 45 90 1801 360 720 1410 2880 5760
≥100 0 0 1 1 2 4 8 16 32 64 128 256 512 1024

25
SAE AS 4059
Since 2001 the SAE Aerospace Standard (AS) replaces the NAS 1638 standard for all new
designs.
Table 1: Cleanliness classes for differential particle counts
SAE AS 4059 is identical to ISO 11218. SAE AS 4059 table 1 displays the maximum contamination
limits (particles/100ml). Particles are categorised in five size groups in accordance with ISO
11171. The particle count is displayed by class, from 00 to 14.
Table 2: Cleanliness classes for cumulative particle counts
SAE AS 4059 table 2 displays particle size in category A to F and particle count per category in
class 000 to 12.
6 to 14 μm 14 to 21 μm 21 to 38 μm 38 to 70 μm >70 μm
00 125 22 4 1 0
0 250 44 8 2 0
1 500 89 16 3 1
2 1.000 178 32 6 1
3 2.000 356 63 11 2
4 4.000 712 126 22 4
5 8.000 1.425 253 45 8
6 16.000 2.850 506 90 16
7 32.000 5.700 1.012 180 32
8 64.000 11.400 2.025 360 64
9 128.000 22.800 4.050 720 128
10 256.000 45.600 8.100 1.440 256
11 512.000 91.200 16.200 2.880 512
12 1.024.000 182.400 32.400 5.760 1.024
Table 1 Cleanliness classes for differential particle counts (particles/100ml)
SIZE >4 μm(c) >6 μm(c) >14 μm(c) >21 μm(c) >38 μm(c) >70 μm(c)
SIZE CODE A B C D E F
000 195 76 14 3 1 0
00 390 152 27 5 1 0
0 780 304 54 10 2 0
1 1.560 609 109 20 4 1
2 3.120 1.217 217 39 7 1
3 6.250 2.432 432 76 13 2
4 12.500 4.864 864 152 26 4
5 25.000 9.731 1.731 306 53 8
6 50.000 19.462 3.462 612 106 16
7 100.000 38.924 6.924 1.224 212 32
8 200.000 77.849 13.849 2.449 424 64
9 400.000 155.698 27.698 4.898 848 128
10 800.000 311.396 55.396 9.796 1.696 256
11 1.600.000 622.792 110.792 19.592 3.392 512
12 3.200.000 1.245.584 221.584 39.184 6.784 1.024
Table 2 Cleanliness classes for cumulative particle counts (particles/100ml)
** The information reproduced in these tables is a brief extract from SAE AS4059 Rev. E revised in May 2005. For further details and explanations please see the full Standard.

26
GOST 17216-200
The GOST standard was introduced by Russian
government and adopted by the Inter-governmental
committee of standardization metrology. GOST divides
particles in five groups by size. The group with the highest
amount of particles will represent the contamination level.
SIZE RANGE 5 - 10 μm 10 - 25 μm 25 - 50 μm 50 - 100 μm >100 μm
00 8 4 1 0 0
0 16 8 2 0 0
1 32 16 3 0 0
2 63 32 4 1 0
3 125 63 8 2 0
4 250 125 12 3 0
5 500 250 25 4 1
6 1.000 500 50 6 2
7 2.000 1.000 100 12 4
8 4.000 2.000 200 25 6
9 8.000 4.000 400 50 12
10 16.000 8.000 800 100 25
11 31.500 16.000 1.600 200 50
12 63.000 31.500 3.150 400 100
13 - 63.000 6.300 800 200
14 - 125.000 12.500 1.600 400
15 - - 25.000 3.150 800
16 - - 50.000 6.300 1.600
17 - - - 125.000 3.150

27
LOW/MEDIUM PRESSURE140 BAR AND LOWER
HIGH PRESSURE 140-210 BAR
VERY HIGH PRESSURE 210 BAR AND HIGHER
MODERATE CONDITIONS SEVERE CONDITIONSHIGH PRESSURES AND SEVERE CONDITIONS
PUMPS
Fixed gear/Fixed vane 20/18/15 19/17/14 18/16/13
Fixed piston 19/17/14 18/16/13 17/15/12
Variable vane 18/16/13 17/15/12 Not applicable
Variable piston 18/16/13 17/15/12 16/14/11
VALVES
Check valves 20/18/15 20/18/15 19/17/14
Directional valves 20/18/15 19/17/14 18/16/13
Standard flow valves 20/18/15 19/17/14 18/16/13
Cartridge valves 19/17/14 18/16/13 17/15/12
Propor tional valves 17/15/12 17/15/12 16/14/11
Servo valves 16/14/11 16/14/11 15/13/10
ACTUATORS
Cylinders, Vane motors, Gear motors 20/18/15 19/17/14 18/16/13
Piston motors, Swash plate, Gear motors 19/17/14 18/16/13 17/15/12
Hydrostatic drives 16/15/12 16/14/11 15/13/10
Test stands 15/13/10 15/13/10 15/13/10
BEARINGS
Journal bearings 17/15/12 Not applicable Not applicable
Industrial gear boxes 17/15/12 Not applicable Not applicable
Ball bearings 15/13/10 Not applicable Not applicable
Roller bearings 16/14/10 Not applicable Not applicable
ISO Cleanliness Levels
Achieving the correct cleanliness level
Knowing the cleanliness level of a fluid forms the basis for
contamination control measures. Different components require
different cleanliness levels. RMF Systems created an overview to help
you determine the optimal cleanliness level for your system.
By selecting the most sensitive component used in the system in the
left hand column and the amount of pressure in the top row you can
determine the recommended ISO class level.
FACT Every hydraulic component has a manufacturers
specified ISO cleanliness level

28
FACTDisposal of contaminated fluid can cost
over 5 times the cost of new oil.

29
Cleanliness Selection Guide
Fluid viscosity
The viscosity is the fluid’s resistance to shear or flow and shows the adhesive / cohesive or
frictional fluid property. The resistance is caused by intermolecular friction exerted when layers
of fluids attempt to slide by one another. The viscosity rating is needed for correct design
of required temperatures for storage, pumping or injection of fluids. There are two related
measures of fluid viscosity known as dynamic (or absolute) and kinematic viscosity.
*Comparisons are made at 100°F (38°C). For other viscosity conversion
approximations, use the formula: Centistokes (cSt) = Saybolt Universal
Seconds (SUS) / 4.635 at 100° F
KINEMATIC VISCOSITY MM2/S AT 40°C (104°F)
ISO VISCOSITY GRADE
MIDPOINT MINIMUM MAXIMUM
ISO VG 2 2.2 1.98 2.42
ISO VG 3 3.2 2.88 3.52
ISO VG 5 4.6 4.14 5.06
ISO VG 7 6.8 6.12 7.46
ISO VG 10 10 9.00 11.0
ISO VG 15 15 13.5 16.5
ISO VG 22 22 19.8 24.2
ISO VG 32 32 29.8 35.2
ISO VG 46 46 41.4 50.6
ISO VG 68 68 61.2 74.8
ISO VG 100 100 90.0 110
ISO VG 150 150 135 165
ISO VG 220 220 198 242
ISO VG 320 320 288 352
ISO VG 460 460 414 506
ISO VG 680 680 612 748
ISO VG 1000 1000 900 1100
ISO VG 1500 1500 1350 1650
ISO VG 2200 2200 1980 2420
ISO VG 3200 3200 2880 3520
Viscosity Classification
Viscosity Conversion Chart
cSt (Centistokes)* SUS (Saybolt Universal Seconds)
10 46
20 93
25 116
30 139
32.4 150
40 185
50 232
70 324
90 417

30
Types of Hydraulic FluidHydraulic fluids are formulated depending on the application and the required properties
Biodegradable fluidsBiodegradable hydraulic fluids are produced using plant oils and used in
biologically critical environments.
Suitable sealing
material
HE Hydraulic Environmental NBR
HETG Triglyceride baseplant oils NBR
HEES Synthetic ester base FPM
HEPG Polyglycol base, FPM
HEPR Other base liquids, primarily Poly-alpha-olefins FPM
Flame resistant fluids
Suitable sealing material
HFAE Oil in water emulsions NBR
HFAS Synthetic concentrates
dissolved in water NBR
HFB Water in oil emulsions FPM
HFC Water glycols NBR
HFD Synthetic liquids FPM
Mineral fluids The most frequently used hydraulic base fluid also known as hydraulic oil.
Suitable sealing
material
H and HH No additives (is no longer used in practice)
NBR
HL Extra additives to increase the corrosion protection and resistance to
aging
HM Extra additives to increase the corrosion protection and resistance to
aging and to reduce wear due to scoring in the mixed friction area
HLP Extra additives in addition to HL oil to reduce wear and protect
against corrosion and oxidation
HV and HVLP Like HLP, but with increased resistance to aging, as well as an
improved temperature-viscosity relationship
HLPD Like HLP, but with additives to improve particle transport (detergent
effect) and dispersion capacity (water carrying capacity)

Filtration is used to separate contamination from a fluid by forcing the fluid through a filtration medium. The fluid is forced through the filtration medium, leaving contamination particles behind in the filter.
Filtration

Filtration Types
Suction filtration
Suction filtration prevents the ingress of large particles
(150 - 200 μm) from the fluid reservoir into the system’s
circuit and is a basic form of filtration that doesn’t
contribute to the cleanliness level. Suction filters are
usually placed between the pump and the inlet pipe with
flanges.
Pressure filtration
Pressure filtration has a typical filter fineness between 3
and 20μm and can be used to protect the whole system,
part of the system or just a component immediately
downstream of the pump.
Bypass filtration
Bypass filters act as a kidney loop, draining oil from the main system.
After oil is been filtered it returns to the system oil reservoir. The
amount of oil extracted to be filtered is insignificant ensuring the
filtration won’t affect the operation of the main system. By using
elements with different filter fineness higher fluid cleanliness can be
achieved.
Return filtration
Return filtration is the most common form of fluid filtration.
Return filtration takes place on the return line, in or on
the hydraulic reservoir just before the fluid returns to the
reservoir.
Offline filters
With offline filtration oil is extracted from the main system by an
external pump, which makes it possible to filter the oil even when the
main system in not in operation. Changing filter elements is made easy
and can also be done witout interrupting the main system.
Air filters
Air filters clean the air before it enters the oil reservoir.
This air can be highly contaminated due to the (dusty)
environment. Only a limited number of air filters are
capable of removing both water and solid particles from
the air, which significantly reduces the oxidation process.
Filtration protects hydraulic systems from contamination and therefore from malfunctions, breakdowns and expensive oil changes. Filtration can take place in several different ways or combinations.
System filtration Additional filtration
33
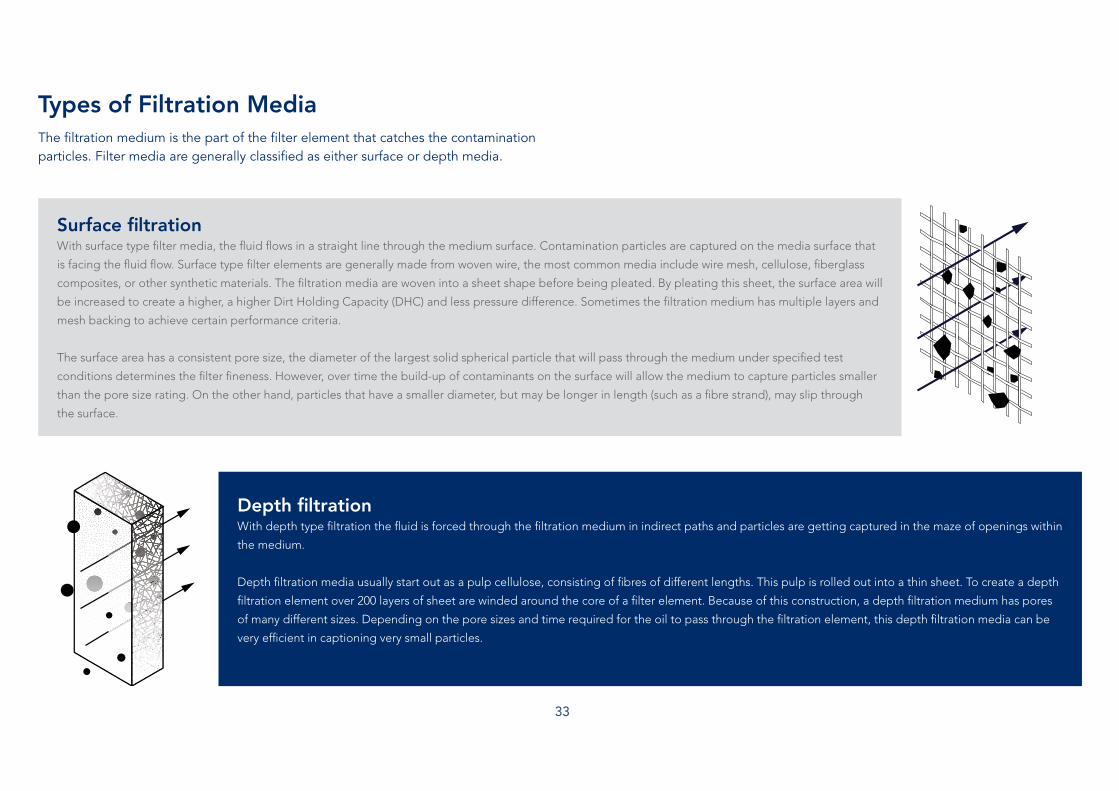
Types of Filtration Media
Depth filtrationWith depth type filtration the fluid is forced through the filtration medium in indirect paths and particles are getting captured in the maze of openings within
the medium.
Depth filtration media usually start out as a pulp cellulose, consisting of fibres of different lengths. This pulp is rolled out into a thin sheet. To create a depth
filtration element over 200 layers of sheet are winded around the core of a filter element. Because of this construction, a depth filtration medium has pores
of many different sizes. Depending on the pore sizes and time required for the oil to pass through the filtration element, this depth filtration media can be
very efficient in captioning very small particles.
Surface filtrationWith surface type filter media, the fluid flows in a straight line through the medium surface. Contamination particles are captured on the media surface that
is facing the fluid flow. Surface type filter elements are generally made from woven wire, the most common media include wire mesh, cellulose, fiberglass
composites, or other synthetic materials. The filtration media are woven into a sheet shape before being pleated. By pleating this sheet, the surface area will
be increased to create a higher, a higher Dirt Holding Capacity (DHC) and less pressure difference. Sometimes the filtration medium has multiple layers and
mesh backing to achieve certain performance criteria.
The surface area has a consistent pore size, the diameter of the largest solid spherical particle that will pass through the medium under specified test
conditions determines the filter fineness. However, over time the build-up of contaminants on the surface will allow the medium to capture particles smaller
than the pore size rating. On the other hand, particles that have a smaller diameter, but may be longer in length (such as a fibre strand), may slip through
the surface.
The filtration medium is the part of the filter element that catches the contamination particles. Filter media are generally classified as either surface or depth media.

34
Filtration Flow Direction
Besides the filtration type and filtration media, the filtration flow direction is also important when determining the right
filtration type for your application. In contrast to surface filtration which always has a radial flow direction, depth filtration
can go in two different directions, either the axial or radial flow direction.
Radial filtrationIn contrast to axial filtration the fluid flow in radial
filtration is from the outside in, through all filtration
medium layers. This eliminates channel forming due to
the various flow paths.
Axial filtrationAn axial fluid flow is created between the filtration
medium layers, the fluid flows through the filter
element from top to bottom. Contaminants are
captured in the filter media, which can lead to a
common problem: channel forming.
FACTRMF Systems depth filtration
can increase fluid life time
3-10 times.

35
The Multipass Test
When filtering fluid flows through a filtration element. At some point in time the filter element will be completely saturated and the pressure difference will rise. Saturated filter elements need to be changed in order to ensure efficient filtration of the oil.
One method to evaluate the filter element
performance is by the ISO 16889 “Multipass
Test Procedure”, recognised by ANSI* and
NFPA**. During this test, fluid circulates
through the circuit under controlled and
monitored conditions. The differential
pressure is recorded while a constant amount
of contaminant is injected upstream (before)
of the element. On-line laser particle sensors
determine the contaminant levels upstream
and downstream (after) of the element. With
this information, the performance attribute
(Beta ratio) can be determined for several
particle sizes.
Three element performance characteristics
can be measured with the Multipass Test:
1. Dirt holding capacity
2. Pressure differential of the filter element
3. Filtration efficiency, expressed as a “Beta
Ratio”
Example
We start by comparing the upstream and downstream particle count. Let’s assume 50,000
particles of 10μm and larger were counted upstream of the filter element and 10,000 particles
at the same size range were counted downstream.
We divide the particles upstream by the particles
downstream to calculate the Beta ratio, which in this
example equals 5 (Beta = 50.000/10.000 = 5).
With the Beta ratio we can calculate the filter’s dirt holding
capacity. This can be found by the following equation:
Efficiency = (1-1/Beta)*100 = 80%.
This means the filter tested was 80% efficient at removing
particles of 10μm and larger.
The Beta ratio / efficiencies table shows some common Beta ratio numbers and their
corresponding efficiencies.
BETA RATIOS/EFFICIENCIES
Beta Ratio(at a given particle size)
Capture Efficiency (at same particle size)
1.01 1.0%
1.1 9.0%
1.5 33.3%
2.0 50.0%
5.0 80.0%
10.0 90.0%20.0 95.0%75.0 98.7%
100 99.0%
200 99.5%
1000 99.9%
''x'' is at a specific particle size
B
# of particles downstream# of particles upstream
10,00050,000
B
10
x
= =
=
(c)
(c)
5
Efficiency 1 Beta1 100
Efficiency 1 51 100 80%
x
10
= -
= - =
a
a
k
k
Test filter
Δp
Beta ratio
Injection reservoir
Test reservoir
Flow measurement
Downstream particle counter
Downstreampressure sensor
Upstream particle counterUpstreampressure sensor
ANSI* - American National Standards Instute is a private non-profit organisation that controls the development of standards for products, services processes nad personnel in the United States.NFPA** - National Fire Protection Association is a United States organisation that creates and maintains private, copyrighted standards and codes.
36
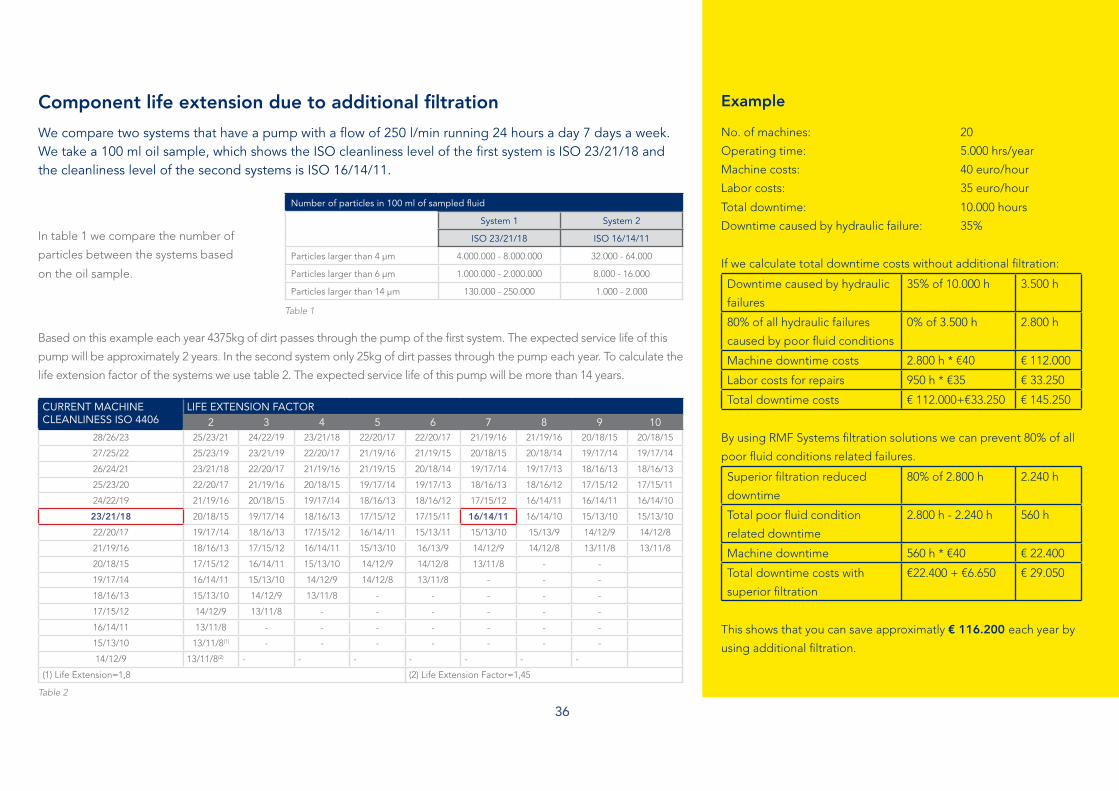
Component life extension due to additional filtration
We compare two systems that have a pump with a flow of 250 l/min running 24 hours a day 7 days a week. We take a 100 ml oil sample, which shows the ISO cleanliness level of the first system is ISO 23/21/18 and the cleanliness level of the second systems is ISO 16/14/11.
In table 1 we compare the number of
particles between the systems based
on the oil sample.
Number of particles in 100 ml of sampled fluid
System 1 System 2
ISO 23/21/18 ISO 16/14/11
Particles larger than 4 μm 4.000.000 - 8.000.000 32.000 - 64.000
Particles larger than 6 μm 1.000.000 - 2.000.000 8.000 - 16.000
Particles larger than 14 μm 130.000 - 250.000 1.000 - 2.000
Table 1
Based on this example each year 4375kg of dirt passes through the pump of the first system. The expected service life of this
pump will be approximately 2 years. In the second system only 25kg of dirt passes through the pump each year. To calculate the
life extension factor of the systems we use table 2. The expected service life of this pump will be more than 14 years.
CURRENT MACHINE CLEANLINESS ISO 4406
LIFE EXTENSION FACTOR2 3 4 5 6 7 8 9 10
28/26/23 25/23/21 24/22/19 23/21/18 22/20/17 22/20/17 21/19/16 21/19/16 20/18/15 20/18/15
27/25/22 25/23/19 23/21/19 22/20/17 21/19/16 21/19/15 20/18/15 20/18/14 19/17/14 19/17/14
26/24/21 23/21/18 22/20/17 21/19/16 21/19/15 20/18/14 19/17/14 19/17/13 18/16/13 18/16/13
25/23/20 22/20/17 21/19/16 20/18/15 19/17/14 19/17/13 18/16/13 18/16/12 17/15/12 17/15/11
24/22/19 21/19/16 20/18/15 19/17/14 18/16/13 18/16/12 17/15/12 16/14/11 16/14/11 16/14/10
23/21/18 20/18/15 19/17/14 18/16/13 17/15/12 17/15/11 16/14/11 16/14/10 15/13/10 15/13/10
22/20/17 19/17/14 18/16/13 17/15/12 16/14/11 15/13/11 15/13/10 15/13/9 14/12/9 14/12/8
21/19/16 18/16/13 17/15/12 16/14/11 15/13/10 16/13/9 14/12/9 14/12/8 13/11/8 13/11/8
20/18/15 17/15/12 16/14/11 15/13/10 14/12/9 14/12/8 13/11/8 - -
19/17/14 16/14/11 15/13/10 14/12/9 14/12/8 13/11/8 - - -
18/16/13 15/13/10 14/12/9 13/11/8 - - - - -
17/15/12 14/12/9 13/11/8 - - - - - -
16/14/11 13/11/8 - - - - - - -
15/13/10 13/11/8(1) - - - - - - -
14/12/9 13/11/8(2) - - - - - - -
(1) Life Extension=1,8 (2) Life Extension Factor=1,45
Table 2
Example
No. of machines: 20
Operating time: 5.000 hrs/year
Machine costs: 40 euro/hour
Labor costs: 35 euro/hour
Total downtime: 10.000 hours
Downtime caused by hydraulic failure: 35%
If we calculate total downtime costs without additional filtration:
Downtime caused by hydraulic
failures
35% of 10.000 h 3.500 h
80% of all hydraulic failures
caused by poor fluid conditions
0% of 3.500 h 2.800 h
Machine downtime costs 2.800 h * €40 € 112.000
Labor costs for repairs 950 h * €35 € 33.250
Total downtime costs € 112.000+€33.250 € 145.250
By using RMF Systems filtration solutions we can prevent 80% of all
poor fluid conditions related failures.
Superior filtration reduced
downtime
80% of 2.800 h 2.240 h
Total poor fluid condition
related downtime
2.800 h - 2.240 h 560 h
Machine downtime 560 h * €40 € 22.400
Total downtime costs with
superior filtration
€22.400 + €6.650 € 29.050
This shows that you can save approximatly € 116.200 each year by
using additional filtration.

Maintenance

Preventive MaintenancePreventive maintenance is a scheduled form of maintenance and
therefore minimises downtime due to failures and interference with
the system. The maintenance schedule is based on set specifications
and standards for oil and component replacement. Unfortunately the
service life of oil and components can’t be predicted with complete
certainty. Therefore preventive maintenance can lead to unnecessary
high replacement costs or downtime.
Reactive MaintenanceAs the term suggests, reactive maintenance is an unplanned form
of maintenance. Failures are solved when they occur, often causing
unnecessary long downtime and high costs.
Equipment must be maintained to extend their service life and reduce the amount of downtime and failures. Currently ‘condition based maintenance’ is an often heard term within the industry. RMF Systems prefers this approach to maintenance over reactive or preventive maintenance.
Maintenance

39
Condition Based Maintenance
Within condition based maintenance, we differentiate four types of analysis:
Condition based maintenance, also known as predictive maintenance, is based on constantly monitoring your equipment and
analysing the data. The purpose of condition based maintenance is to find symptoms of potential failures before they occur. Real time
data is collected by sensors within the system, enabling immediate action when required. Also this will lead to less frequent laboratory
analysis, which saves costs.
REDUCE LIFE CYCLE COSTSBY CONDITION BASED
MAINTENANCE
REMOTE MONITORINGAND ANALYSIS
DATA OUTPUT:BEARING, GEAR &OIL CONDITION
MONITORED BY CONDITION MONITORING
EQUIPMENT
CLIENT ASSETS
Oil quality analysis
Providing data on oil viscosity, acid levels,
solid contamination, water content and
oxidation level.
Vibration analysis
Determine issues like: bearing degradation,
unbalanced components, structural support
issues, rotational problems, alignment
concerns, resonance and electrical problems.
Infrared analysis
Determine detrimental conditions such as:
loose electrical connections, corrosion and dirt
build up that induces high resistance joints,
unbalanced electrical loads, and mechanical
and process problems due to heat.
Stroboscopic analysis
Inspect wear on rotating equipment such
as couplings and V-belts utilising a portable
strobe light.

40

OFF-LINE FILTRATION CONDITION MONITORINGAIR BREATHING BY-PASS FILTRATION DEHYDRATION
Solutions

Solutions
Save (maintenance) costs 2
Reducing malfunctions and downtime1
Extend service life of equipment and oil3
Minimise oil and filter changes4
RMF Systems can advise you on the optimal solution to solve your contamination problems. With our range of products we can
find a fitting solution for your application.
RMF Systems offers complete filtration and monitoring solutions for all types of equipment in practically every industry. The extensive RMF Systems range covers all kinds of contamination, whether it be solid, water, air borne or acids.
All solutions are focussed on:

43
Offline filtration Offline filtration units can be applied to every imaginable industrial
application where a hydraulic system is present. An Integrated
pump-motor combination pumps oil out of the reservoir, filters it
and pumps clean oil back into the system. Offline filtration units can
continue working even when the main system is not in use.
Bypass filtrationBypass filtration units are especially suitable for mobile applications in
hydraulic systems.
RMF Systems has designed a bypass filtration system that is equipped
with an integrated pressure compensated flow control valve. This valve
bleeds oil from the main system, passes this through the filter element
before it returns to the reservoir. The amount of oil extracted from the
main system at any time is insignificant ensuring that it will not affect
the operation of the system.
FACTRMF Systems Depth filtration can remove contamination that is
not removed by line filters.
Solutions for Solid Contamination Most forms of solid contamination can be solved by utilising either an offline or bypass filtration system.

44
Solutions for Contaminated AirAir contamination can be prevented in multiple ways, one of them is the usage of desiccant breathers.
Desiccant breathersRMF Systems’ desiccant breathers deal effectively with both particle and water contamination
in a single process. The air is dried by passage through a column packed with ZR gel granules.
The dried air is subsequently filtered with the use of a pleated synthetic fibre filter element
(replaceable spin-on type) that removes solid particles (down to 3μ). This process prevents
contamination and oxidation of the oil and components.
Vacuum dehydrationThe RMF Vacuum Dehydration Units are designated oil purification
units which can be applied directly to various types of machine
reservoirs. The units dehydrate and clean most types of oil such as
lubricating, hydraulic, transformer and switch oils by removing particles,
gasses, and water.
Water absorbing elementsThe RMF cellulose elements have the ability to absorb water and
filter particles down to 0,5 micron out of hydraulic fluids. Also special
polymer spin-on filters and elements remove both water and solid
particles.
Solutions for Water Contamination

45
Solutions for AcidsThere are several ways to remove acids from oil. The obvious one is to use the alkalinity of oil to neutralise the acids. This is currently used method for removing acids in gas and diesel engine applications.
Acids formed by hydrolysis in ester based fluids are harmful to turbine control systems. The most common way to remove these acids is by using fuller earth or aluminium oxides or an ion exchange resin.
Electrostatic filterThis filter unit acts as a kidney loop filter. It pumps small
amounts of hydraulic fluid through an electric field
caused by 14000 volts in the cleaning cell. This electric
field attracts and bundles particle to the surface of the
cleaning element. The Electrostatic filter can remove solid
particle down to 5 micron, sludge, varnish, resin and other
oxidation products. The electrostatic oil cleaning has now
influence to the liquid additives of the oil.
Acid-X This filtration skid uses 3 Ion-exchange elements. The elements
are specially designed for removal of oxidation products which are
dissolved in the hydraulic fluid. These elements adsorb polar acids
without adding nothing to the fluid such as conventional Ion exchange
elements do by adding water to the system.
ange

46
Condition Monitoring SolutionsCondition Monitoring Center (CMC)
The CMC provides you with reliable feedback on solid particle contamination,
water levels (%RH), oil temperature and degradation. Making use of only high
quality components and proven optical technology and algorithms, this CMC is the
most accurate, consistent and advanced diagnostic monitoring centre. Its modular
design and versatility make it the best condition monitoring centre for hydraulic and
lubrication fluids, meeting the requirements of even the most demanding industries.
Portable Laser Particle Counter (PLPC)The PLPC is the most complete way
to measure the contamination level
of your system. With the PLPC
you have the ability to measure,
analyze and document your
results immediately. The Portable
Laser Particle Counter makes
it possible to determine the ISO
cleanliness levels of the hydraulic fluid.
It can also report in any other
international cleanliness level standards.
Oil Quality Sensor (OQS)
The Oil Quality Sensor provides real time oil
deterioration data by continuously monitoring
your hydraulic fluids. This OQS is a cost
effective monitoring solution that enables you
to base your fluid changes and maintenance on
the actual condition of your fluids. Unnecessary
and expensive oil changes belong to the past,
which will result in significant cost savings.
Contamination Monitoring Sensor (CMS)The CMS in-line particle counter
automatically monitors and displays
particulate contamination, moisture (%RH)
and temperature levels in various hydraulic
fluids. It is designed specifically to be
mounted directly to systems, where ongoing
measurement or analysis is required, and
where space and costs are limited.
FACT Visual examination of a fluid is not an
accurate methode of analysis.
Moisture Content Sensor (MCS)
The MCS is a perfect solution for online monitoring of moisture in
transformer, lubricating and hydraulic fluid, as well as diesel fuel.
The MCS is perfectly suitable for long term usage in moisture levels,
higher than 90% RH. Making it the perfect solution for gearboxes,
thrusters and other applications where free water is a threat.
By combining the MCS with other RMF products like
a Condition Monitoring Center and vacuum
dehydration unit, we offer you the
optimal solution for your water
contamination problems.

Conversion Tools

Comparison of Hydraulic Fluid Cleanliness StandardsISO CODE NAS CLASS
23/21/18 12
22/20/18 --
22/20/17 11
22/20/16 --
21/19/16 10
20/18/15 9
19/17/14 8
18/16/13 7
17/15/12 6
16/14/12 --
16/14/11 5
15/13/10 4
14/12/9 3
13/11/8 2
12/10/8 --
12/10/7 1
12/10/6 --
PressureFROM TO MULTIPLY BYAtmosphere Bar 1.01325
Bar Atmosphere 0.9869233
Atmosphere PSI 14.69595
PSI Atmosphere 0.06804596
Bar PSI 0.069
PSI Bar 14.50
Bar Pascal (Pa) 100000
Pascal (Pa) Bar 0.00001
PSI Pascal (Pa) 6894.747
Pascal (Pa) PSI 0.000145
ViscositycSt (at 100° F) ISO-VG SUS (SSU)
10 9 46
20 21 93
30 31 139
32 32 148
40 43 185
43 46 200
46 49 213
50 52 232
60 63 278
68 71 315
70 324
80 371
90 417
100 93 464
110 510
120 556
130 602
140 649
150 139 695cSt: CentistokesISO: International Standards OrganisationSUS: Saybolt Universal Seconds (same as SSU)SSU: (Saybolt Seconds Universal (same as SUS)
Conversion Tools

DistanceFROM TO MULTIPLY BYCentimetres Feet 30.48
Feet Centimetres 0.0328083
Centimetres Inches 2.54
Inches Centimetres 0.394
Metres Feet 3.28083
Feet Metres 0.3048
Metres Inches 39.36996
Inches Metres 0.0254
Metres Yards 1.09361
Yards Metres 0.9144
Microns Inches 0.000039
Inches Microns 25.400
Microns Metre 0.000001
Metre Microns 1000000
Microns Millimetre 0.0001
Millimetre Microns 1000
Millimetres Feet 0.00328083
Feet Millimetres 394.800
Millimetres Inches 0.03937
Inches Millimetres 25.40
VolumeFROM TO MULTIPLY BYCubic Centimetres Cubic Feet 0.00003521
Cubic Feet Cubic Centimetres 28316.85
Cubic Centimetres Cubic Inches 0.06102
Cubic Inches Cubic Centimetres 16.38706
Cubic Centimetres Litres 0.000001
Litres Cubic Centimetres 1000
Cubic Centimetres US Gallons 0.0002642
US Gallons Cubic Centimetres 3785.412
Cubic Metres Cubic Feet 35.310
Cubic Feet Cubic Metres 0.02831685
Cubic Metres Cubic Inches 61023
Cubic Inches Cubic Metres 1.638706e-05
Cubic Metres Litres 1000
Litres Cubic Metres 0.001
Cubic Metres US Gallons 264.20
Us Gallons Cubic Metres 0.00378541
Litres Cubic Centimeter 1000
Cubic Centimetres Litres 0.001
Litres Cubic Feet 0.035315
Cubic Feet Litres 28.31685
Litres Cubic Inches 61.0234
Cubic Inches Litres 0.01638706
Litres Gallons 0.220083
Gallons Litres 4.544
Litres US Gallons 0.264170
US Gallons Litres 3.785
Litres/min Cubic Centimetres/min 1000
Cubic Centimetres/min Litres/min 0.001
Litres/min Cubic feet/min 0.035
Cubic Feet/min Litres/min 28.31685
Litres/min Gallons/Min 0.264
Gallons/min Litres/min 4.546092
MassFROM TO MULTIPLY BYGrams Pounds (lb) 0.0022046
Pounds (lb) Grams 453.5924
Kilograms Grams 1000
Grams Kilograms 0.001
Kilograms Pounds (lb) 2.20462
Pounds (lb) Kilograms 0.4535924
Tonnes (t) Tons (tn) 1.102311
Tons (tn) Tonnes (t) 0.9071847

We’re Here To Help You Coenecoop 99 | 2741 PH
Waddinxveen | The Netherlands
E: [email protected]: www.rmfsystems.com
RMF Systems is committed to designing, manufacturing and supplying world leading, innovative solutions in the field of oil cleanliness and monitoring. Our goal is to maximise equipment availability and reliability in a wide range of markets by significantly improving oil cleanliness resulting in increased service life of oil and equipment.
The commitment to continuous research and development from our dedicated team of engineers has led to solutions that significantly reduce the total cost of ownership of equipment whilst benefiting the environment for future generations.
RMF Systems gladly helps you to determine the source of your contamination problem and informs you on the optimal solution to filter and monitor your oil.
Please contact one of our sales engineers for an appointment.
RM
F Sy
stem
s 20
1801
11_E
N
Copyright ©2018 RMF SystemsSubject to change without prior notice
Email Enquiry: [email protected] Phone Enquiry: 07 3126 6322 Brisbane Mackay Hunter Valley Perth
+31 (0)182 24 48 88