Measuring the Glycemic Index of Foods: Interlaboratory Study
Upload
independentCategory
view
1download
0
Interlaboratory comparison of Taq Nuclease Assays for thequantification of the toxic cyanobacteria Microcystis sp
Eva Schober1, Michael Werndl1, Kati Laakso2, Irina Korschineck3, Kaarina Sivonen2, andRainer Kurmayer1,*
1Institute for Limnology, Austrian Academy of Sciences, 5310 Mondsee, Austria 2University ofHelsinki, Department of Applied Chemistry and Microbiology, 00014 Helsinki, Finland 3IngenetixGmbH, Simmeringer Haupstrasse 24, 1110 Vienna, Austria
SummaryThe application of quantitative real time PCR has been proposed for the quantification of toxicgenotypes of cyanobacteria. We have compared the Taq Nuclease Assay (TNA) in quantifying thetoxic cyanobacteria Microcystis sp. via the intergenic spacer region of the phycocyanin operon(PC) and mcyB indicative of the production of the toxic heptapeptide microcystin between threeresearch groups employing three instruments (ABI7300, GeneAmp5700, ABI7500). The estimatesof mcyB genotypes were compared using (i) DNA of a mcyB containing strain and a non-mcyBcontaining strain supplied in different mixtures across a low range of variation (0-10% of mcyB)and across a high range of variation (20-100%), and (ii) DNA from field samples containingMicrocystis sp. For all three instruments highly significant linear regression curves between theproportion of the mcyB containing strain and the percentage of mcyB genotypes both within thelow range and within the high range of mcyB variation were obtained. The regression curvesderived from the three instruments differed in slope and within the high range of mcyB variationmcyB proportions were either underestimated (0-50%) or overestimated (0-72%). For fieldsamples cell numbers estimated via both TNAs as well as mcyB proportions showed significantlinear relationships between the instruments. For all instruments a linear relationship between thecell numbers estimated as PC genotypes and the cell numbers estimated as mcyB genotypes wasobserved. The proportions of mcyB varied from 2-28% and did not differ between the instruments.It is concluded that the TNA is able to provide quantitative estimates on mcyB genotype numbersthat are reproducible between research groups and is useful to follow variation in mcyB genotypeproportion occurring within weeks to months.
Keywordsgenotype composition; seasonality; quantitative real-time PCR; microcystin net production; watermonitoring
IntroductionThe cyanobacterium Microcystis sp. is frequently found in freshwater all over the world.Microcystis sp. produces hepatotoxic microcystins that are known to inhibit eukaryoticprotein phosphatases. Typically toxic strains and non-toxic strains co-occur but cannot bedistinguished by morphological criteria in the microscope. The wax and wane of
*Correspondence to: Rainer Kurmayer, Institute for Limnology, Austrian Academy of Sciences, 5310 Mondsee, Mondseestraße 9,Austria ([email protected], phone: +43 6232 3125 32, fax: +43 6232 3578).
Europe PMC Funders GroupAuthor ManuscriptJ Microbiol Methods. Author manuscript; available in PMC 2011 February 04.
Published in final edited form as:J Microbiol Methods. 2007 April ; 69(1): 122–128. doi:10.1016/j.mimet.2006.12.007.
Europe PM
C Funders A
uthor Manuscripts
Europe PM
C Funders A
uthor Manuscripts

microcystin-producing vs. non-microcystin-producing strains has been suggested as a mostimportant factor regulating microcystin net production in water (Sivonen and Jones, 1999).However, the quantitative assessment of strain composition in water samples has long timebeen impeded, mainly because of a lack of appropriate methods. Through the identificationof the genes involved in microcystin synthesis (Dittmann et al., 1997), a new avenue inenvironmental research was opened and quantitative real-time PCR has been increasinglyapplied in order to quantify these genes directly in the environment (Foulds et al., 2002;Kurmayer and Kutzenberger, 2003; Vaitomaa et al., 2003; Rinta-Kanto et al., 2005; Yoshidaet al., 2006).
The Taq nuclease assay (TNA) was introduced to quantify mcy genotypes in water samples(Kurmayer and Kutzenberger, 2003). This approach was based on the quantification of thetotal population of Microcystis sp. by TNA amplifying the intergenic spacer region withinthe phycocyanin operon (PC) and a subpopulation by another TNA amplifying mcyBinvolved in microcystin synthesis. The proportion of mcyB genotypes is determined bydividing the number of cells of mcyB genotypes through the corresponding number of PCgenotypes.
During the EU-project PEPCY (Toxic and other bioactive peptides in cyanobacteria,QLRT-2001-02634, www.pepcy.de) a number of lakes in European countries were selectedfor quantifying microcystin genotypes. The analysis of the lake samples should beperformed in several laboratories. Comparing and standardizing quantitative PCR resultsbetween laboratories prior to sample analysis was considered necessary because noexperience on the reproducibility of the estimated proportion of specific genotypes viaquantitative PCR is available. This issue is of particular relevance as quantitative PCRmethodology uses linear-log calibration curves rendering the calculation of DNAconcentrations sensitive to variations in the slope induced by minor variations of the Ctvalues. Consequently, the noise within Ct values induced by the semi logarithmic calibrationalgorithm alone can mask differences in genotype proportion in populations.
TNA results obtained in three laboratories (Helsinki, Mondsee, Vienna) were comparedusing DNA extracts of Microcystis strain HUB524 (with mcyB) and strain HUB53 (withoutmcyB) supplied in different mixtures from 0, 2, 4, 6, 8, 10% of strain HUB524 (low range ofmcyB variation) and 20, 40, 60, 80, 100% of HUB524 (high range) at a constant celldensity. Further, TNA results obtained from field samples were compared between the threeresearch groups using DNA extracts obtained from water samples from a hypertrophic lakecontaining Microcystis sp. (Kurmayer and Kutzenberger, 2003).
Materials and methodsSampling, cell harvesting and cell quantification
The unicellular strains HUB524 (with mcyB) and HUB53 (without mcyB) were isolatedfrom the eutrophic lake Pehlitzsee (Brandenburg) in 1978 and kindly provided by M.Henning (Humboldt University Berlin, Germany). Both strains were grown in batch culturein Z medium (Zehnder and Gorham, 1960) and harvested during the late logarithmic growthphase. The DNA extracts of the field samples collected from Wannsee during 1999-2000were those used previously by Kurmayer and Kutzenberger (2003) and were stored at −20°C. In total 15 samples in monthly intervals were analysed.
Cells were harvested by filtering onto glass fiber filters (GF/C, Whatman, Kent, GreatBritain) under vacuum pressure and stored frozen (−20°C) until DNA extraction. ForMicrocystis strains aliquots were analyzed for cell numbers using two independent methods:(i) electronic particle counting (Casy ® 1, Schärfe system, Reutlingen, Germany) from
Schober et al. Page 2
J Microbiol Methods. Author manuscript; available in PMC 2011 February 04.
Europe PM
C Funders A
uthor Manuscripts
Europe PM
C Funders A
uthor Manuscripts

formaldehyde fixed samples (2%, v/v), (ii) counting of cells from Lugol fixed samples bythe inverted microscope technique as described previously (Kurmayer et al., 2003,Kurmayer and Kutzenberger, 2003). For strains HUB524 and HUB53 cell numbersdetermined by the particle counter correlated highly significantly with cell numbersdetermined in the microscope (Kurmayer and Kutzenberger, 2003).
Prior to the counting of field samples the colonies of Microcystis were identified fromphytoplankton net samples according to the species key based on morphological criteria byKomarék and Anagnostidis (1999) as described (Kurmayer et al., 2002). Fivemorphospecies were identified: M. aeruginosa, M. ichthyoblabe, M. flos-aquae, M.novacekii and M. wesenbergii. Live counting of 400 randomly selected colonies in July2000 showed a dominance of M. aeruginosa/M. flos-aquae (51 %) and M. ichthyoblabe (41%).
For the counting of Microcystis cells in field samples the Lugol fixed samples weredisintegrated by ultrasonication (40 impulses per second during 4 min in 10 ml sample) asdescribed previously (Kurmayer et al., 2003). The samples were then diluted up to 100 fold(depending on the population density) and at least 400 single cells of Microcystis werecounted at 400x magnification and the results were averaged from at least two transects persedimentation chamber. Because it was impossible to discriminate between morphospeciesduring the counting of single cells, all morphospecies of Microcystis sp. were consideredmorphological variations of individuals of one population. This approach is in accordancewith the unification of all species of Microcystis Kützing ex Lemmerman 1907 (includingM. aeruginosa, M. ichthyoblabe, M. novackekii, M. viridis, M. wesenbergii) under the Rulesof the Bacteriological Code (Otsuka et al., 2001).
Preparation of DNA extractsAll research groups have used identical DNA extracts. DNA was extracted from cellscollected on glass fibre filters using a standard phenol-chloroform DNA extractionprocedure that has been described previously (Kurmayer et al., 2003). In a previous studythe TNA results for PC and mcyB obtained from DNA extracted using the standard phenol-chloroform procedure have been compared with the TNA results using DNA extracted by acommercially available DNA purification kit (DNeasy ®, Qiagen, Vienna). Although theDNeasy kit revealed quantitative data, the standard phenol-chloroform procedure has beenfound to be superior because yielding more accurate results (Schober and Kurmayer, 2006).
DNA extracts equivalent to 200 cells μl−1 either originating from strain HUB524 (withmcyB) or from strain HUB53 (without mcyB) were mixed at ratios with 0%, 2%, 4%, 6%,8%, 10% (low range of mcyB variation) and 20%, 40%, 60%, 80%, 100% (high range ofmcyB variation) of HUB524. This concentration resulted in a total template of 1000 cellsper reaction (5 μl of the template) and was shown to give most reliable results because it liesin the optimal range of the standard curves (10–104 cells, see Fig. 1A in Kurmayer andKutzenberger, 2003). For the strain mixture the ratios were adjusted and analysed by TNAsby each research group in triplicate. DNA extracts from field samples were also diluteddown to a cell concentration of 200 cells μl−1 of DNA extract and analysed by each researchgroup once. In order to reduce possible inhibitory influences from field samples down to aminimum, all extracts from field samples were diluted at least one hundred fold.
Taq Nuclease AssayFor each gene standard curves based on predetermined cell concentrations were establishedby relating the known DNA concentrations (in cell equivalents) to the threshold cycle of thediluted Microcystis sp. extract. The threshold cycle (Ct) is the PCR cycle number at which
Schober et al. Page 3
J Microbiol Methods. Author manuscript; available in PMC 2011 February 04.
Europe PM
C Funders A
uthor Manuscripts
Europe PM
C Funders A
uthor Manuscripts

the fluorescence passes a set threshold level. The threshold value for the fluorescence of allsamples was set manually at 0.1 according to the manufacturers instructions. The researchgroups employed the following instruments: (i) ABI7300 Real Time PCR System(Helsinki), (ii) ABI GeneAmp5700 Sequence Detection System (Mondsee); (iii) ABIPRISM 7500 Sequence Detection System (Ingenetix, Vienna).
For all experiments TaqMan® Universal PCR Master Mix (ABI, #4304437) was usedcontaining a twofold concentration of premixed PCR buffer, AmpliTaq Gold DNAPolymerase, dNTPs with dUTP (instead of dTTP), AmpErase® UNG to prevent carry-overcontamination and ROX (5-carboxy-X-rhodamine) as a passive reference dye. However,using ABI7500 an unexpected instability of the ROX signal was observed in field samplesand a second independent reference signal (TAMRA, 6-carboxytetramethylrodamine) wasused to correct for random fluctuations in the fluorescent signal. Primers and TaqManprobes were those used by Kurmayer and Kutzenberger (2003) and were synthesized by ABI(Vienna) and Sigma-Genosys (Helsinki). For the concentrations of the primers and probessee Kurmayer and Kutzenberger (2003). PCR was initiated with 2 min at 50°C (AmpErase®UNG protection against carry-over contamination) followed by 10 min at 95°C.Subsequently PCR was performed for 45 cycles consisting of a 95°C denaturation step for15 s and by a 60°C annealing/extension step for 1 min.
In order to estimate the number of PC copies per cell the PCR product amplified during theTNA of PC-IGS (5′-GCTACTTCGACCGCGCCGCCGCTGCTGTCGCCTAGTCCCTGGGGCTAGTCTCAATTAAACCGTAGGA-3′, 67 bp) was also amplified from strain HUB524 by conventionalPCR and purified using the QiaQuick purification kit (Qiagen, Vienna). The concentrationof the purified oligonucleotide was determined using the Nanodrop ND-1000 spectralphotometer (Peqlab Biotechnologie GmbH, Erlangen, Germany): 16.23-19.22 ng μl−1. Thisconcentration was diluted down to a working concentration of 1 fmol μl−1 (6.022×10⁸
copies μl−1) and dilutions ranged from 30.1-3.1×10⁷ copies template−1.
Statistical analysesThe linear calibration curves were fitted using the least square approximation and theassociated statistical tests of Sigma Plot 2000 (V 6.10). To achieve normal distribution andhomogeneity of variances cell numbers of genotypes and proportions of mcyB were log (x+1) transformed.
The linear regressions between the proportion of strain HUB524 and the percentage ofmcyB genotypes estimated in the strain mixture were compared in slope using a generalfactorial model of Analysis of Variance (ANOVA). The data were modelled as y=μ+βx+ε,where y is the measured proportion of mcyB, μ is the overall mean level, β is the effect ofthe instrument (ABI7300, GeneAmp5700, ABI7500), x is the effect of the cells of strainHUB524 in the strain mixture as a covariate, and ε is the random deviation, N(0, σ2) (Sokaland Rohlf, 1995). A SPSS statistical package (V 6.0 for Windows) was used for thecovariance analysis.
The influence of the instruments and the low vs. the high range of mcyB variation on theestimation of mcyB proportions was statistically compared using a Two-Way ANOVAdesign. The data were modelled as y=μ+α+β+αβ+ε where y is the dependent variableestimated by TNA, μ is the overall mean level, α is the effect of the instrument (ABI7300,GeneAmp5700, ABI7500), β is the effect of the low range (0-10%) or high range (20-100%)of mcyB proportion of strain HUB524, αβ is the interaction between both factors and ε isthe unexplained part of the variance (Sokal and Rohlf, 1995). A statistical package fromStatistica (V7.1) was used for the Two-Way ANOVA.
Schober et al. Page 4
J Microbiol Methods. Author manuscript; available in PMC 2011 February 04.
Europe PM
C Funders A
uthor Manuscripts
Europe PM
C Funders A
uthor Manuscripts

ResultsStandardization of TNA
Calibration curves obtained between Ct values (the PCR cycle number at which thefluorescence passes a set threshold level) and DNA (in cell number equivalents calculatedfrom pre-determined cell concentrations) for PC and mcyB using DNA extracts obtainedfrom strain HUB524 showed a good correspondence between the three instruments. TheABI7300 and ABI7500 instruments showed a higher sensitivity when compared with theGeneAmp5700 (Table 1). All calibration curves were similar in slope and showed the sameamplification efficiency.
The regression curve obtained with the purified oligonucleotide for PC showed a higheramplification efficiency compared with the regression curves obtained from the DNAextracted from the cells (Table 1). The number of PC copies per cell was calculated bydividing the number of copies for a given Ct value through the number of cells resulting inthe same Ct value taken from the linear calibration curve for PC (GeneAmp5700): 26.5±3.8(SE), min=13, max=33, (n=7).
Quantification of mcyB in mixed populations of Microcystis strainsDNA extracts equivalent to 1000 cells per template either originating from strain HUB524(with mcyB) or from strain HUB53 (without mcyB) were mixed at ratios of 0-100% andanalyzed by TNA as described above. For the total range of 0-100% of HUB524 the Ctvalues obtained for PC varied from 0.65-0.9 (ABI7300), 0.61-1.56 (GeneAmp5700),0.46-0.75(ABI7500) implying that the amount of DNA (in cell number equivalents) pertemplate was relatively constant irrespective of the proportion of strain HUB524: 650-1100cells (ABI7300), 800-1500 cells (GeneAmp5700), 780-1140 cells (ABI7500), (Fig. 1).
In contrast the cell numbers of mcyB genotypes decreased linearly with a decreasingproportion of HUB524 and mcyB genotypes were not detected by any of the threeinstruments at 0% HUB524. The proportion of mcyB genotypes was determined by dividingthe number of cells of mcyB genotypes (as determined using the TNA for mcyB) throughthe corresponding number of PC genotypes. For all three instruments highly significantlinear regression curves between the proportion of strain HUB524 and the percentage ofmcyB genotypes were obtained (Table 2). However, the regression curves derived from thethree instruments differed in slope, as the influence of the instrument was found highlysignificant (ANOVA, df=95, p<0.001). The slope of the regression line derived fromABI7300 was close to one resulting in relatively low underestimation or overestimation ofmcyB proportions (9% underestimation-22% overestimation). In contrast the regression linederived from GeneAmp5700 underestimated mcyB proportions by 0-49% while theregression line derived from ABI7500 overestimated mcyB proportions by 0-73%.
In order to find out whether the instruments differ in quantifying mcyB genotypes betweenthe low range (0-10%) and the high range (20-100%) of mcyB variation, a Two-WayANOVA testing the effects of both the instrument and the low vs. high range of mcyBproportion was performed. Overall the influence of the instrument on the average, minimaand maxima of mcyB proportions was found marginally significant (Two-way ANOVA,df=93, p=0.053, Table 3). However, the interaction effect between both factors was neverfound significant implying that all three instruments produced accurate results both withinthe low range and the high range of mcyB variation (p>0.5). Post-hoc comparisons revealeda homogeneous subset of average, minima and maxima of mcyB proportions for the lowrange (p>0.05) but not for the high range of mcyB variation (p<0.05, Table 3, Fig. 1).
Schober et al. Page 5
J Microbiol Methods. Author manuscript; available in PMC 2011 February 04.
Europe PM
C Funders A
uthor Manuscripts
Europe PM
C Funders A
uthor Manuscripts
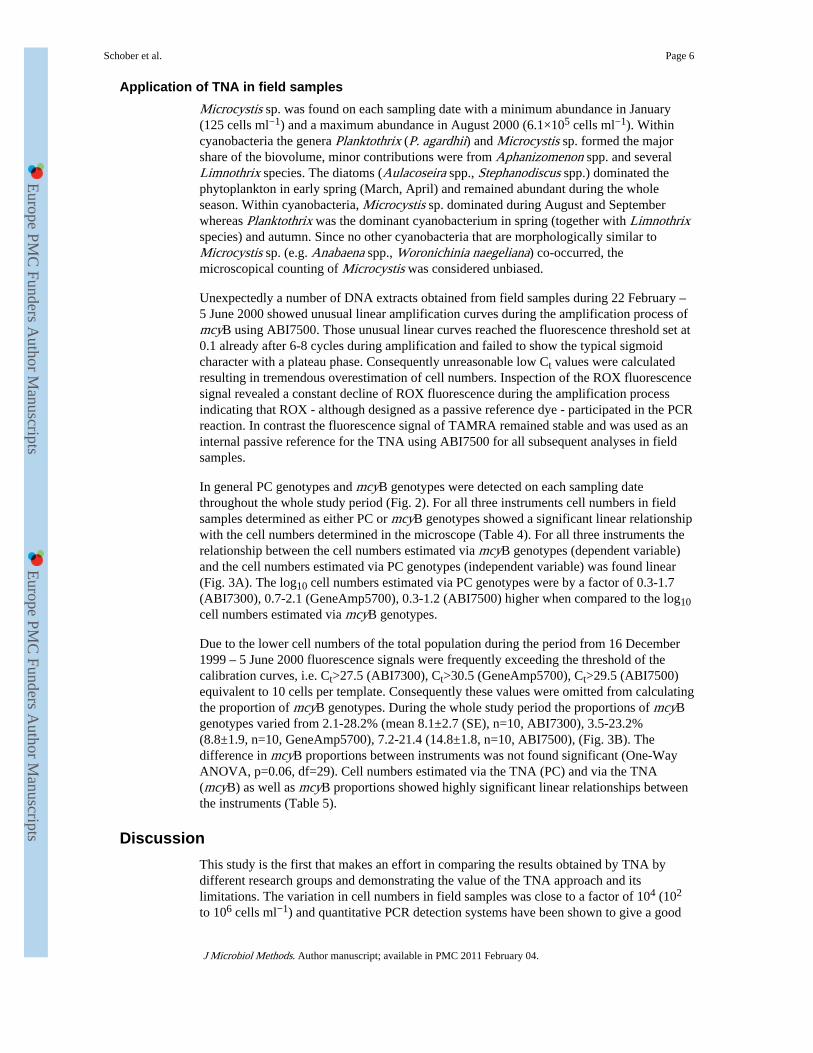
Application of TNA in field samplesMicrocystis sp. was found on each sampling date with a minimum abundance in January(125 cells ml−1) and a maximum abundance in August 2000 (6.1×10⁵ cells ml−1). Withincyanobacteria the genera Planktothrix (P. agardhii) and Microcystis sp. formed the majorshare of the biovolume, minor contributions were from Aphanizomenon spp. and severalLimnothrix species. The diatoms (Aulacoseira spp., Stephanodiscus spp.) dominated thephytoplankton in early spring (March, April) and remained abundant during the wholeseason. Within cyanobacteria, Microcystis sp. dominated during August and Septemberwhereas Planktothrix was the dominant cyanobacterium in spring (together with Limnothrixspecies) and autumn. Since no other cyanobacteria that are morphologically similar toMicrocystis sp. (e.g. Anabaena spp., Woronichinia naegeliana) co-occurred, themicroscopical counting of Microcystis was considered unbiased.
Unexpectedly a number of DNA extracts obtained from field samples during 22 February –5 June 2000 showed unusual linear amplification curves during the amplification process ofmcyB using ABI7500. Those unusual linear curves reached the fluorescence threshold set at0.1 already after 6-8 cycles during amplification and failed to show the typical sigmoidcharacter with a plateau phase. Consequently unreasonable low Ct values were calculatedresulting in tremendous overestimation of cell numbers. Inspection of the ROX fluorescencesignal revealed a constant decline of ROX fluorescence during the amplification processindicating that ROX - although designed as a passive reference dye - participated in the PCRreaction. In contrast the fluorescence signal of TAMRA remained stable and was used as aninternal passive reference for the TNA using ABI7500 for all subsequent analyses in fieldsamples.
In general PC genotypes and mcyB genotypes were detected on each sampling datethroughout the whole study period (Fig. 2). For all three instruments cell numbers in fieldsamples determined as either PC or mcyB genotypes showed a significant linear relationshipwith the cell numbers determined in the microscope (Table 4). For all three instruments therelationship between the cell numbers estimated via mcyB genotypes (dependent variable)and the cell numbers estimated via PC genotypes (independent variable) was found linear(Fig. 3A). The log10 cell numbers estimated via PC genotypes were by a factor of 0.3-1.7(ABI7300), 0.7-2.1 (GeneAmp5700), 0.3-1.2 (ABI7500) higher when compared to the log10cell numbers estimated via mcyB genotypes.
Due to the lower cell numbers of the total population during the period from 16 December1999 – 5 June 2000 fluorescence signals were frequently exceeding the threshold of thecalibration curves, i.e. Ct>27.5 (ABI7300), Ct>30.5 (GeneAmp5700), Ct>29.5 (ABI7500)equivalent to 10 cells per template. Consequently these values were omitted from calculatingthe proportion of mcyB genotypes. During the whole study period the proportions of mcyBgenotypes varied from 2.1-28.2% (mean 8.1±2.7 (SE), n=10, ABI7300), 3.5-23.2%(8.8±1.9, n=10, GeneAmp5700), 7.2-21.4 (14.8±1.8, n=10, ABI7500), (Fig. 3B). Thedifference in mcyB proportions between instruments was not found significant (One-WayANOVA, p=0.06, df=29). Cell numbers estimated via the TNA (PC) and via the TNA(mcyB) as well as mcyB proportions showed highly significant linear relationships betweenthe instruments (Table 5).
DiscussionThis study is the first that makes an effort in comparing the results obtained by TNA bydifferent research groups and demonstrating the value of the TNA approach and itslimitations. The variation in cell numbers in field samples was close to a factor of 104 (102
to 106 cells ml−1) and quantitative PCR detection systems have been shown to give a good
Schober et al. Page 6
J Microbiol Methods. Author manuscript; available in PMC 2011 February 04.
Europe PM
C Funders A
uthor Manuscripts
Europe PM
C Funders A
uthor Manuscripts

reproducibility when compared along a wide range of starting DNA concentration in thetemplate (e.g. 10-105 cells per template, Becker et al., 2000, Zhang and Fang, 2006). Incontrast the quantification of the proportion of subpopulations of toxic genotypes is moresophisticated, as the potential range of variation is only 0-100% implying that inaccuraciesin cell number estimates are more visible. The only possibility to quantify the proportion ofspecific toxic genotypes is by relating cell numbers of the subpopulation to the cell numbersof the total population by two independent TNAs (Kurmayer and Kutzenberger, 2003). Thisapproach minimizes the influence of physiologically induced variation in the DNA contentwhich can be more than tenfold (Kurmayer and Kutzenberger, 2003).
Notably, all three instruments showed the ability to discriminate between mcyB genotypeproportions both in the low range of mcyB variation (0-10%) as well as in the high range(20-100%) of variation and highly significant linear regression curves between theproportion of the mcyB containing strain and the percentage of mcyB genotypes wereobtained. On the other hand comparing the mcyB proportion between instrumentsdocumented that mcyB genotype proportions could either be overestimated (ABI7500) orunderestimated (GenAmp5700) within the higher range of mcyB variation (20-100%). Themaxima of the overestimates and underestimates recorded were 50% and 100%, each.Accordingly the ABI7500 instrument revealed also higher mcyB proportions in fieldsamples when compared to the other instruments. Nevertheless, in this study the TNAresults obtained by all three instruments led to the conclusion that the proportion of mcyB inthe population of Microcystis in the study lake was low (1/5– 1/10 of the population). It isconcluded that the TNA is able to provide quantitative estimates on mcyB genotypenumbers that are reproducible between research groups within the lower range of variationof mcyB (0-10%) while proportions of mcyB genotypes vary up to a factor of two within thehigher range of mcyB variation (20-100%). Despite these limitations in the quantitativeestimates all instruments were able to follow the variation in mcyB genotype proportionboth within the strain mixture as well as in the field occurring within weeks to months.
Over the whole study period the cell numbers of mcyB genotypes increased or decreasedlinearly with the cell numbers of PC genotypes implying that the average proportion ofmcyB genotypes was constantly coupled to the increase or decrease in Microcystis cellnumbers. On the other hand all three instruments revealed short-term variation in mcyBgenotype proportions within weeks to months. Recently Yoshida et al. (2006) reported0.5-35% of seasonal variation of the mcyA genotype proportion in Lake Mikata, Japan.Biological agents influencing the mcy genotype proportion might explain this short-termvariability in both lakes. The same authors reported cyanophages selectively infecting onetoxic strain of Microcystis aeruginosa but other strains that were resistant (Yoshida et al.,2006). In the field viruses may result in the replacement of sensitive strains only whileclosely related resistant strains may gain a selective advantage (Fuhrman and Schwalbach,2003). This mechanism will counteract a possible competitive exclusion occurring betweenclosely related strains (Thingstad and Lignell, 1997) and would result in a constant co-adaptation process between the host population and the viruses.
It is concluded that the average proportion of mcyB genotypes in a specific lake estimatedmonthly during one year was found reproducible between research groups and the cellnumber of PC genotypes could be used to predict the number of mcyB genotypes in fieldsamples. More studies on the seasonal proportion of mcyB genotypes in phytoplankton areneeded to assist water monitoring purposes and early warning tasks. For example if mcyBgenotypes are detected early during pre-bloom periods mitigation of microcystin netproduction could be attempted already in spring, e.g. by intensified mixing of the watercolumn and reducing the growth of Microcystis sp. in favour of green algae and diatoms(Visser et al., 1996).
Schober et al. Page 7
J Microbiol Methods. Author manuscript; available in PMC 2011 February 04.
Europe PM
C Funders A
uthor Manuscripts
Europe PM
C Funders A
uthor Manuscripts
AcknowledgmentsThis study was financed through the EU project PEPCY (Toxic and Other Bioactive Peptides in Cyanobacteria,QLK4-CT-2002-02634, www.pepcy.de) and the Austrian Science Funds FWF P18185. We are grateful to ThomasHalama for his technical advice. We are grateful to anonymous reviewers for their comments on an earlier versionof the manuscript.
ReferencesBecker S, Böger P, Oehlmann R, Ernst A. PCR bias in ecological analysis: a case study for
quantitative Taq nuclease assays in analyses of microbial communities. Appl. Environ. Microbiol.2000; 66:4945–4953. [PubMed: 11055948]
Dittmann E, Neilan BA, Erhard M, von Döhren H, Börner T. Insertional mutagenesis of a peptidesynthetase gene that is responsible for hepatotoxin production in the cyanobacterium Microcystisaeruginosa PCC 7806. Mol. Microbiol. 1997; 26:779–787. [PubMed: 9427407]
Foulds IV, Granacki A, Xiao C, Krull UJ, Castle A, Horgen PA. Quantification of microcystin-producing cyanobacteria and E.coli in water by 5′-nuclease PCR. J. Appl. Microbiol. 2002; 93:825–834. [PubMed: 12392529]
Fuhrman J, Schwalbach M. Viral influence on aquatic bacterial communities. Biol. Bull. 2003;204:192–195. [PubMed: 12700152]
Komarék J, Anagnostidis K. Cyanoprokaryota, 1. Teil Chroococcales. Gustav Fischer Verlag Jena.1999:225–236.
Kurmayer R, Christiansen G, Chorus I. The abundance of microcystin-producing genotypes correlatespositively with colony size in Microcystis and determines its microcystin net production in LakeWannsee. Appl. Environ. Microbiol. 2003; 69:787–795. [PubMed: 12570996]
Kurmayer R, Dittmann E, Fastner J, Chorus I. Diversity of microcystin genes within a population ofthe toxic cyanobacterium Microcystis spp. in Lake Wannsee (Berlin, Germany). Microb. Ecol.2002; 43:107–118. [PubMed: 11984633]
Kurmayer R, Kutzenberger T. Application of real-time PCR for quantification of microcystingenotypes in a population of the toxic cyanobacterium Microcystis sp. Appl. Environ. Microbiol.2003; 69:6723–6730. [PubMed: 14602633]
Otsuka S, Suda S, Shibata S, Oyaizu H, Matsumoto S, Watanabe MM. A proposal for the unificationof five species of the cyanobacterial genus Microcystis Kützing ex Lemmermann 1907 under therules of the bacteriological code. Int. J. Syst. Evol. Microbiol. 2001; 51:873–879. [PubMed:11411709]
Rinta-Kanto J, Ouelette A, Boyer G, Twiss M, Bridgeman T, Wilhelm S. Quantification of toxicMicrocystis spp. during the 2003 and 2004 blooms in Western Lake Erie using quantitative real-time PCR. Environ. Sci. Technol. 2005; 39:4198–4205. [PubMed: 15984800]
Schober E, Kurmayer R. Evaluation of different DNA sampling techniques for the application of thereal-time PCR method for the quantification of cyanobacteria in water. Lett. Appl. Microbiol.2006; 42:412–417. [PubMed: 16599997]
Sivonen, K.; Jones, G. Cyanobacterial toxins. In: Chorus, I.; Bartram, J., editors. Toxic cyanobacteriain water. A guide to their public health consequences, monitoring and management. WHO, E &FN Spon; London: 1999. p. 41-112.
Sokal, R.; Rohlf, F. The principles and practice of statistics in biological research. 3rd edition. W.H.Freeman and Company; New York: 1995. Biometry; p. 886
Thingstad T, Lignell R. Theoretical models for the control of bacterial growth rate, abundance,diversity and carbon demand. Aquat. Microb. Ecol. 1997; 13:19–27.
Vaitomaa J, Rantala A, Halinen K, Rouhiainen L, Tallberg P, Mokelke L, Sivonen K. Quantitativereal-time PCR for determination of microcystin synthetase E copy numbers for Microcystis andAnabaena in lakes. Appl. Environ. Microbiol. 2003; 69:7289–7297. [PubMed: 14660378]
Visser PM, Ibelings B, Van der Veer B, Koedood J, Mur L. Artificial mixing prevents nuisanceblooms of the cyanobacterium Microcystis in Lake Nieuwe Meer, the Netherlands. FreshwaterBiol. 1996; 36:435–450.
Schober et al. Page 8
J Microbiol Methods. Author manuscript; available in PMC 2011 February 04.
Europe PM
C Funders A
uthor Manuscripts
Europe PM
C Funders A
uthor Manuscripts

Yoshida M, Yoshida T, Takashima Y, Hosoda N, Hiroishi S. Dynamics of microcystin-producing andnon-microcystin-producing Microcystis populations is correlated with nitrate concentration in aJapanese lake. FEMS Microbiology Letters. 2006 in press.
Yoshida T, Takashima Y, Tomaru Y, Shirai Y, Takao Y, Hiroishi S, Nagasaki K. Isolation andcharacterization of a cyanophage infecting the toxic cyanobacterium Microcystis aeruginosa. Appl.Environ. Microbiol. 2006; 72:1239–1247. [PubMed: 16461672]
Zehnder A, Gorham PR. Factors influencing the growth of Microcystis aeruginosa Kütz. Emend.Elenkin. Can. J. Microbiol. 1960; 6:645–660.
Zhang T, Fang HHP. Applications of real-time polymerase chain reaction for quantification ofmicroorganisms in environmental samples. Appl. Microbiol. Biotechnol. 2006; 70:281–289.[PubMed: 16470363]
Schober et al. Page 9
J Microbiol Methods. Author manuscript; available in PMC 2011 February 04.
Europe PM
C Funders A
uthor Manuscripts
Europe PM
C Funders A
uthor Manuscripts

Fig. 1.The accuracy in determining genotype proportions using the TNA was tested by mixing twoculture strains, one strain containing mcyB (HUB524) and one strain without mcyB(HUB53) in different ratios (0-100%) but a constant amount of DNA. (A) Mean±1SE cellnumbers of PC genotypes (black symbols) and mcyB genotypes (white symbols) pertemplate determined by three different instruments: ABI7300 (circles), GeneAmp5700(squares), ABI7500 (triangles). (B) Mean±1SE proportions of mcyB genotypes.
Schober et al. Page 10
J Microbiol Methods. Author manuscript; available in PMC 2011 February 04.
Europe PM
C Funders A
uthor Manuscripts
Europe PM
C Funders A
uthor Manuscripts

Fig. 2.Microcystis sp. cell numbers in hypertrophic Lake Wannsee (Berlin. Germany)from July1999 to October 2000 determined in the microscope and via (A) TNA (PC) and (B) TNA(mcyB) using three instruments (ABI7300, GeneAmp5700, ABI7500), mean (± 1SE).
Schober et al. Page 11
J Microbiol Methods. Author manuscript; available in PMC 2011 February 04.
Europe PM
C Funders A
uthor Manuscripts
Europe PM
C Funders A
uthor Manuscripts

Fig. 3.(A) Relationship between the mean (± 1SE) cell numbers determined via TNA (PC) and viaTNA (mcyB) using three instruments (ABI7300, GenAmp5700, ABI7500). (B) Proportionof mcyB genotypes during the same period, mean (± 1SE).
Schober et al. Page 12
J Microbiol Methods. Author manuscript; available in PMC 2011 February 04.
Europe PM
C Funders A
uthor Manuscripts
Europe PM
C Funders A
uthor Manuscripts

Europe PM
C Funders A
uthor Manuscripts
Europe PM
C Funders A
uthor Manuscripts
Schober et al. Page 13
Tabl
e 1
Lin
ear
calib
ratio
n cu
rves
obt
aine
d w
ith th
ree
inst
rum
ents
(A
BI7
300,
Gen
eAm
p570
0, A
BI7
500)
ope
rate
d by
thre
e re
sear
ch g
roup
s (H
elsi
nki,
Mon
dsee
,V
ienn
a). y
, the
PC
R c
ycle
num
ber
(Ct)
at th
e se
t flu
ores
cenc
e th
resh
old
leve
l (0.
1); x
, the
am
ount
of
star
ting
DN
A (
give
n as
log 1
0 ce
ll nu
mbe
req
uiva
lent
s) o
r th
e am
ount
of
phyc
ocya
nin
(PC
) co
pies
per
tem
plat
e (g
iven
as
log 1
0 co
py n
umbe
r eq
uiva
lent
s) f
or th
e ol
igon
ucle
otid
e.
Inst
rum
ent
Cal
ibra
tion
cur
veE
(%
)1R
2N
p
PC AB
I730
0y=
36.2
1–3.
50x
930.
995
<0.
001
Gen
eAm
p570
0y=
38.6
1–3.
49x
940.
996
<0.
001
AB
I750
0y=
37.1
8–3.
48x
940.
996
<0.
001
mcy
B
AB
I730
0y=
40.1
1–3.
89x
810.
995
<0.
001
Gen
eAm
p570
0y=
46.1
4–4.
07x
760.
995
<0.
001
AB
I750
0y=
40.8
1–3.
93x
800.
996
<0.
001
PC o
ligon
ucle
otid
e
Gen
eAm
p570
0y
=42
.84-
3.34
x99
0.99
7<
0.00
1
1 The
am
plif
icat
ion
effi
cien
cy (
E)
was
cal
cula
ted
as f
ollo
ws:
E=
(10−
1/sl
ope −
1)×
100.
J Microbiol Methods. Author manuscript; available in PMC 2011 February 04.

Europe PM
C Funders A
uthor Manuscripts
Europe PM
C Funders A
uthor Manuscripts
Schober et al. Page 14
Table 2
Regression curves between the proportion of Microcystis strain HUB524 (containing mcyB) and thepercentage of mcyB genotypes in the strain mixture as determined via TNA. y, the log10 number of mcyBgenotypes; x, the proportion of log10 cells of strain HUB524 (see also Fig. 1).
Instrument Regression curve R2 N p
ABI7300 y=0.134+0.964x 0.99 33 <0.001
GeneAmp5700 y=0.174+0.869x 0.92 33 <0.001
ABI7500 y=0.152+1.064x 0.98 33 <0.001
J Microbiol Methods. Author manuscript; available in PMC 2011 February 04.

Europe PM
C Funders A
uthor Manuscripts
Europe PM
C Funders A
uthor Manuscripts
Schober et al. Page 15
Table 3
Mean±SE, minima and maxima of mcyB proportions estimated from mixed populations containing twoMicrocystis strains at fixed cell numbers (200 cells μl−1 of DNA extract), HUB524 (with mcyB) and HUB53(without mcyB) in different proportions (0, 2, 4, 6, 8, 10% of strain HUB524 = low range of mcyB variation,20, 40, 60, 80, 100% = high range).
mcyB % Min % mcyB Max % mcyB
ABI7300
Low range (0-10%) 7.6±12I 0-13.5I 0-18.6I
High range (20-100%) 65.4±6.9II,III 21-96II,III 23.4-121.4II,III
Total 33.9±6a,b 0-96a,b 0-121.4a,b
GeneAmp5700
Low range (0-10%) 7.4±1.4I 0-18I 0-25I
High range (20-100%) 49.1±5.5II 16-86II 20-100II
total 26.4±4.5a 0-86a 0-100a
ABI7500
Low range (0-10%) 10.5±1.9I 0-22I 0-33I
High range (20-100%) 102.4±11.1III 31-161III 40-208III
Total 52.3±9.5b 0-161b 0-209b
Two-Way ANOVA
Instrument P=0.0532 0.0459 0.044
Low vs. high range P<0.0001 <0.0001 <0.0001
Interaction P=0.538 0.6 0.529
a… homogeneous subsets not significantly different at p <0.05 (Fisher LSD Post-hoc comparison)
b… homogeneous subsets not significantly different at p <0.05 (Fisher LSD Post-hoc comparison)
I… homogeneous subsets not significantly different at p <0.05 (Fisher LSD Post-hoc comparison)
II… homogeneous subsets not significantly different at p <0.05 (Fisher LSD Post-hoc comparison)
III… homogeneous subsets not significantly different at p <0.05 (Fisher LSD Post-hoc comparison)
J Microbiol Methods. Author manuscript; available in PMC 2011 February 04.

Europe PM
C Funders A
uthor Manuscripts
Europe PM
C Funders A
uthor Manuscripts
Schober et al. Page 16
Table 4
Regression curves between cell numbers determined in the microscope and cell numbers of PC and mcyBgenotypes determined by three instruments: ABI7300 (Helsinki), GeneAmp5700 (Mondsee), ABI7500(Vienna). x, log10 cells ml−1 (microscope), y, log10 cells ml−1 (TNA). For the regression curves calculated
between PC genotypes and mcyB genotypes y is the log cell number ml−1 calculated using mcyB (TNA) and xis the log cell number ml−1 calculated using PC (TNA).
Instrument Regression curve R2 N p
PC
ABI7300 y=−0.682+1.201x 0.82 15 <0.001
GeneAmp5700 y=−1.349+1.292x 0.81 15 <0.001
ABI7500 y=−1.589+1.253x 0.86 15 <0.001
mcyB
ABI7300 y=−1.23+1.052x 0.74 15 <0.001
GeneAmp5700 y=−2.473+1.264x 0.71 15 <0.001
ABI7500 y=−1.862+1.129x 0.79 15 <0.001
PC vs mcyB
ABI7300 y=−0.69+0.89x 0.93 15 <0.001
GeneAmp5700 y=−1.33+1.023x 0.96 15 <0.001
ABI7500 y=−0.536+0.93x 0.97 15 <0.001
J Microbiol Methods. Author manuscript; available in PMC 2011 February 04.

Europe PM
C Funders A
uthor Manuscripts
Europe PM
C Funders A
uthor Manuscripts
Schober et al. Page 17
Table 5
Statistics on linear relationships on log10 cell numbers and mcyB proportions estimated via TNA (PC) andTNA (mcyB) between three instruments ABI7300 (Helsinki), GeneAmp5700 (Mondsee), ABI7500 (Vienna).The regression functions are given below the diagonal and the coefficients of determination are given abovethe diagonal., x, y= log10 cell number of cells of PC/mcyB genotypes or percent of mcyB genotypes of thedependent/independent variable; n, sample size; p, probability of erroneously rejecting the hypothesis of nolinear relationship between the data sets compared between two instruments.
GeneAmp5700 (x) ABI7300 (x) ABI7500
PC
GeneAmp5700 – – – – R2=0.91, p<0.001, n=15 R2=0.99, p<0.001, n=15
ABI7300 (y) y=0.771+0.879x – – – – R2=0.94, p<0.001, n=15
ABI7500 (y) y=−0.135+0.933x y =−0.644+0.988x – – – –
mcyB
GeneAmp5700 – – – – R2=0.84, p<0.001, n=15 R2=0.96, p<0.001, n=15
ABI7300 (y) y=1.06+0.747x – – – – R2=0.82, p<0.001, n=15
ABI7500 (y) y=0.512+0.831x y=−0.137+0.94x – – – –
mcyBproportion
GeneAmp5700 – – – – R2=0.58, p=0.017, n=9 R2=0.76, p=0.002, n=9
ABI7300 (y) y=−2.59+1.17x – – – – R2=0.54, p=0.025, n=9
ABI7500 (y) y=3.16+1.52x y=9.22+0.83x – – – –
J Microbiol Methods. Author manuscript; available in PMC 2011 February 04.
Copyright © 2022 FDOKUMEN