Smith, Matt and Šikoparija, B. (2020) Interlaboratory ...
31
Original citation: Smith, Matt and Šikoparija, B. (2020) Interlaboratory proficiency test in aerobiology using virtual slides – feasibility study. Grana. ISSN 0017-3134 Online: 1651-2049 (In Press) Permanent WRaP URL: https://eprints.worc.ac.uk/id/eprint/9688 Copyright and reuse: The Worcester Research and Publications (WRaP) makes this work available open access under the following conditions. Copyright © and all moral rights to the version of the paper presented here belong to the individual author(s) and/or other copyright owners. To the extent reasonable and practicable the material made available in WRaP has been checked for eligibility before being made available. Copies of full items can be used for personal research or study, educational, or not-for-profit purposes without prior permission or charge, provided that the authors, title and full bibliographic details are credited, a hyperlink and/or URL is given for the original metadata page and the content is not changed in any way. Publisher’s statement: This is an Accepted Manuscript of an article published by Taylor & Francis in Grana on 1 September 2020, available online: https://www.tandfonline.com/doi/full/10.1080/00173134.2020.1784266 A note on versions: The version presented here may differ from the published version or, version of record, if you wish to cite this item you are advised to consult the publisher’s version. Please see the ‘permanent WRaP URL’ above for details on accessing the published version and note that access may require a subscription. For more information, please contact [email protected]
-
Upload
khangminh22 -
Category
Documents
-
view
0 -
download
0
Transcript of Smith, Matt and Šikoparija, B. (2020) Interlaboratory ...
Original citation: Smith, Matt and Šikoparija, B. (2020) Interlaboratory proficiency test in aerobiology using virtual slides – feasibility study. Grana. ISSN 0017-3134 Online: 1651-2049 (In Press)
Permanent WRaP URL: https://eprints.worc.ac.uk/id/eprint/9688
Copyright and reuse:
The Worcester Research and Publications (WRaP) makes this work available open access under the following
conditions. Copyright © and all moral rights to the version of the paper presented here belong to the individual
author(s) and/or other copyright owners. To the extent reasonable and practicable the material made available
in WRaP has been checked for eligibility before being made available.
Copies of full items can be used for personal research or study, educational, or not-for-profit purposes without
prior permission or charge, provided that the authors, title and full bibliographic details are credited, a
hyperlink and/or URL is given for the original metadata page and the content is not changed in any way.
Publisher’s statement:
This is an Accepted Manuscript of an article published by Taylor & Francis in Grana on 1 September 2020, available online: https://www.tandfonline.com/doi/full/10.1080/00173134.2020.1784266
A note on versions:
The version presented here may differ from the published version or, version of record, if you wish to cite this
item you are advised to consult the publisher’s version. Please see the ‘permanent WRaP URL’ above for details
on accessing the published version and note that access may require a subscription.
For more information, please contact [email protected]
1
Interlaboratory proficiency test in aerobiology using virtual slides – feasibility study 1
2
MATT SMITH1*, BRANKO ŠIKOPARIJA2 3
4
*1School of Science and the Environment, University of Worcester, UK 5
2BioSensе Institute - Research Institute for Information Technologies in Biosystems, University 6
of Novi Sad, Dr. Zorana Đinđića 1, Novi Sad, Serbia 7
8
9
*School of Science and the Environment, University of Worcester, Henwick Grove, Worcester, 10
WR26AJ, e-mail: [email protected] 11
12
2
Abstract 13
14
This study examines the use of Virtual Slide Images with the aim of assessing their efficacy and 15
usability in comparison to traditional microscopy with glass slides for the Quality Control of 16
aerobiological samples. Three glass microscopy slides containing samples of airborne pollen were 17
digitised. Six counters from two laboratories examined the glass slides and their data were used to 18
calculate assigned values and acceptable coefficients of variation (CV%) for 7 pollen types. A total 19
of 24 analysts from 12 countries examined the virtual slides using specialist OlyVIA software. Data 20
from traditional glass and virtual slides were entered into tests for repeatability and 21
intralaboratory reproducibility following the norm EN 16868:2019. Participants also completed a 22
questionnaire reflecting on the efficacy and usability of Virtual Slide Images for interlaboratory 23
Quality Control. Data from traditional glass and virtual slides were comparable but coefficients of 24
variation were generally larger for virtual slides than glass slides. Participants who examined <10% 25
of the slide were more likely to produce results outside the limits of the study. The use of virtual 26
slide technology is not for everyone and, in the current study, we found that opinion was polarised 27
but it was interesting to note that there were no differences in response based on years of 28
experience. There are advantages and disadvantages of the two methods, and we recommend 29
virtual slides are used as an adjunct to glass slides for use in aerobiology Quality Control and other 30
aspects of palynological training and assessment. 31
32
Keywords: Aerobiology; Quality Assurance; Quality Control; Questionnaire; Virtual Slide Images 33
34
3
1. Introduction 35
36
This study was organized by the European Aerobiology Society (EAS) Working Group on Quality 37
Control which is responsible for ensuring representativeness and reproducibility of the methods 38
used in routine aerobiological monitoring. In addition to repeatability and intralaboratory 39
reproducibility the norm (EN 16868:2019 (CEN 2019)) requires regular assessment of 40
interlaboratory reproducibility and accuracy. 41
The methodology for interlaboratory Quality Control (QC) has been proposed and 42
implemented in previous large scale exercises organised under the auspices of the EAS (Galán et al. 43
2014; Šikoparija et al. 2017). However, a common feature of the former interlaboratory QC tests 44
was the time required for completion. The same sample is analysed by several pollen monitoring 45
laboratories, and so the slide needs to travel around Europe until all participants have received 46
and analysed it. This takes a great deal of time and effort (Smith et al. 2019). For example, the QC 47
exercise for Ambrosia pollen took a total of 531 days from when the exercise commenced until all 48
69 analysts reported their results (Šikoparija et al. 2017). 49
One method that could significantly reduce the time taken to conduct interlaboratory QC 50
tests, is virtual microscopy (Rocha et al. 2009). Virtual Slide Images (.vsi) are microscope slides that 51
have been scanned (digitalized) by taking high-resolution multi focus micrographs, which are 52
stitched together using image-processing software (Weinstein et al. 2009; Pantanowitz et al. 2011). 53
The virtual slides can be viewed on a computer screen using specialist software to examine 54
selected areas at high magnification (Koch et al. 2009; Rocha et al. 2009; Weinstein et al. 2009). 55
The technique is becoming increasingly common in research, consultation, teaching, and quality 56
control in pathology (Rocha et al. 2009; Vyas et al. 2016) and could be translated to aerobiology. 57
4
With this in mind, we piloted the use of Virtual Slide Images with the aim of assessing their 58
efficacy and usability in comparison to traditional microscope slides. 59
60
2. Materials and Methods 61
62
This project was approved by BioSensе Institute Internal Review for its use of human subjects, and 63
all data have been anonymised. 64
65
2.1. Materials for analysis 66
In this study, segments of three 24-hour samples collected in Serbia were digitized (i.e. 11 March 67
2018, 10 August 2014, and 24 April 2018). Detailed digitalization of a 14x48mm sample is very 68
time consuming (about 30 h) and produces very large files (about 200 GB) we therefore decided to 69
only do this for the central part of the sample, i.e. a 5x48 mm section situated at about 5mm from 70
the edges of the tape. The z-axis was limited to 28 microns and 21 cross sections at 1.4 micron 71
spacing, which reduced the file size to about 25 GB (scanning time around 6h). For this purpose, 72
Olympus BX51 microscope with UPLSAPO 40x / 0.90 objective lens (180 micron working distance) 73
and Olympus Soft Imaging Solutions with XC10 digital camera were used. 74
This exercise did not aim to test the knowledge of participants and their ability to identify 75
different pollen types, rather it was to determine whether a range of different pollen types with 76
different morphological characteristics could be counted with a degree of reproducibility on 77
Virtual Slide Images. 78
79
80
5
2.2. Assigned values 81
In order to determine the correct values in the slides, six counters from two laboratories were 82
asked to analyse the microscope slides using the normal methods used in their laboratories. 83
Assigned values for selected pollen types were determined (Galán et al. 2014; Šikoparija et al. 84
2017) as the robust average after outliers were removed using Hampel’s test (Šikoparija et al. 85
2017). Only pollen types with an assigned value more than 10 pollen/m3 were deemed suitable for 86
further analysis (CEN 2019). 87
88
2.3. Virtual slides between analysts comparison 89
A call for participation in this QC exercise was sent by the European Aerobiology Society’s QC 90
Working Group to active aerobiological monitoring stations in Europe. Virtual slides were analysed 91
using the Olympus OlyVIA ver.2.9.1 build 13771 software (freely available from 92
https://www.olympus-lifescience.com/en/support/downloads/). Participants were requested to 93
analyse a minimum of 10% of the slide surface using a magnification they felt comfortable with 94
(Galán et al. 2014). The analysed surface depends on the size of the display and so participants 95
were asked to submit a screenshot of the display, after choosing the magnification they wanted to 96
use, so that the area of slide examined in pixels could be verified. A list of pollen types likely to be 97
found on each slide (not exhaustive) was supplied to counters to aid identification (Appendix 1). 98
99
2.4. Questionnaires 100
Participants were asked to fill in a questionnaire reflecting on the efficacy and usability of Virtual 101
Slide Images for interlaboratory Quality Control. The questionnaire included 7 questions on a 102
Likert Scale of 1 to 7 (ranging from strongly disagree to strongly agree) and based on similar 103
6
studies in literature (Blake et al. 2003; Burthem et al. 2005; Koch et al. 2009; Evered & Dudding 104
2011; Hanna et al. 2019): 105
1. The Virtual Slide Images and OlyVIA software were easy to install; 106
2. The guidance and supporting material provided were sufficient for helping me prepare for the 107
QC exercise; 108
3. The OlyVIA software was easy to use; 109
4. The manoeuvrable images studied with the OlyVIA software were of sufficient resolution to 110
allow identification of pollen; 111
5. The ability to conduct the laboratory exercise on my own schedule with the computer 112
technology was an advantage; 113
6. Navigating the images with the computer and OlyVIA software was easier than that of glass 114
slides with a microscope; 115
7. The computer technology saved me time compared to using light microscopy. 116
There were also questions about gender and the number of years of experience counting pollen 117
(< 5 years, 5-10 years and >10 years). In addition, the questionnaire included two open ended 118
questions where participants could say what they liked most about using Virtual Slide Images and 119
their suggestions for improving the system. 120
121
2.5. Data analysis 122
The results from the analyses of Virtual Slide Images were examined in relation to coefficients of 123
variation (CV%) as described in EN 16868:2019 (CEN 2019) and z-scores as presented in previous 124
QC studies of aerobiological data (Galán et al. 2014; Šikoparija et al. 2017). Acceptable coefficients 125
of variation were calculated based on the assigned values determined from the analysis of 126
7
microscope slides (CEN 2019). Questionnaire data were analysed using the non-parametric 127
Kruskal–Wallis one-way analysis of variance to determine if there were significant differences 128
between responses based on the number of years of experience counting pollen. Results were 129
deemed significant with a p-value < 0.05. The analysis packages used were Microsoft® Excel for 130
Mac Version 16.32 and SPSS 26. 131
132
3. Results 133
134
3.1. Assigned values and tests for repeatability and intralaboratory reproducibility 135
Six counters from two laboratories: Laboratory for palynology University of Novi Sad Faculty of 136
Sciences, Serbia (Lab A) and Belgian Institute for Health, Sciensano (Lab B), examined microscope 137
Slide 1 (11-03-2018) and microscope Slide 2 (10-08-2019). Following analysis of the microscope 138
slides, assigned values were determined for Alnus, Ambrosia, Artemisia, Corylus, 139
Cupressaceae/Taxaceae, Poaceae and Urticaceae. The acceptable coefficients of variation (CV%) 140
were calculated for each pollen type. One daily average Urticaceae pollen concentration from Lab 141
A was deemed to be an outlier following the Hampel test and was removed from the analysis and 142
not used for calculating the assigned value (Table I). 143
Repeatability was tested using data from the glass slides for one counter from Lab A as 144
defined in the norm EN 16868:2019 (Section 8.4.2)(CEN 2019): one slide; same analyst; same 145
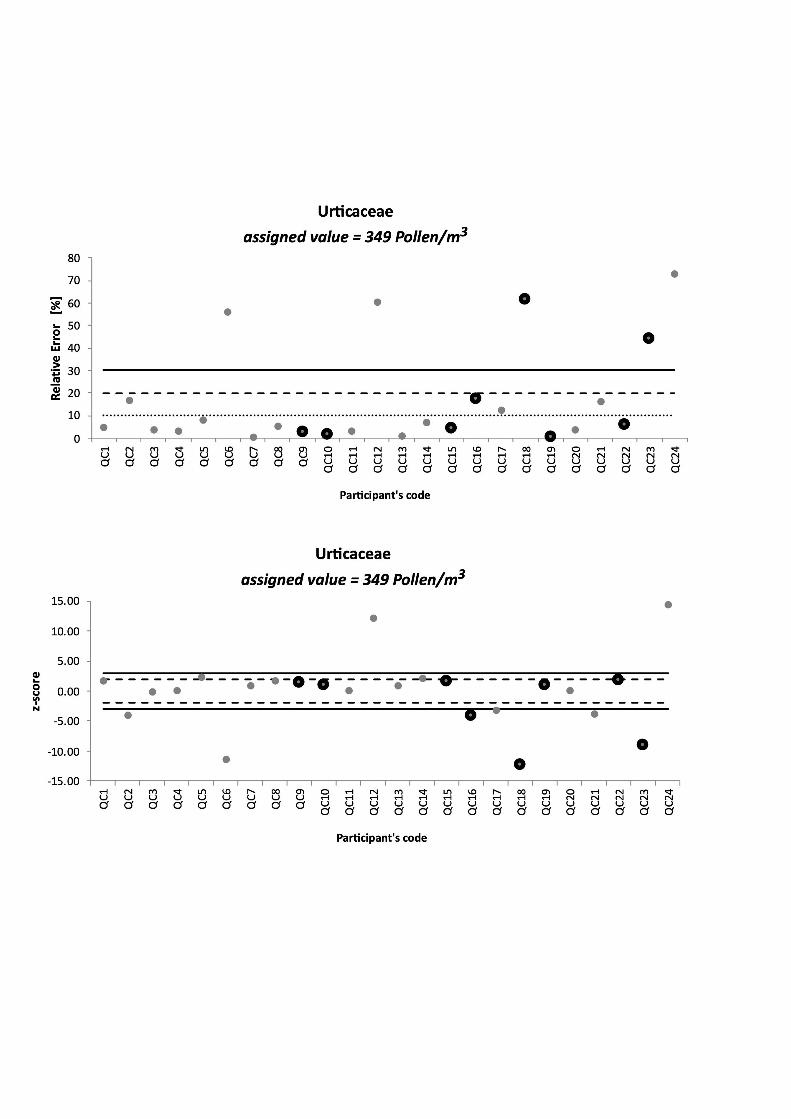
method; minimum three replicates per analyst. All results were within the acceptable coefficients 146
of variation for each pollen type (Table I). 147
Intralaboratory reproducibility was examined using data from the glass slides for Lab A, Lab 148
B and all laboratory staff together following EN 16868:2019 (Section 8.4.3), with the same 149
8
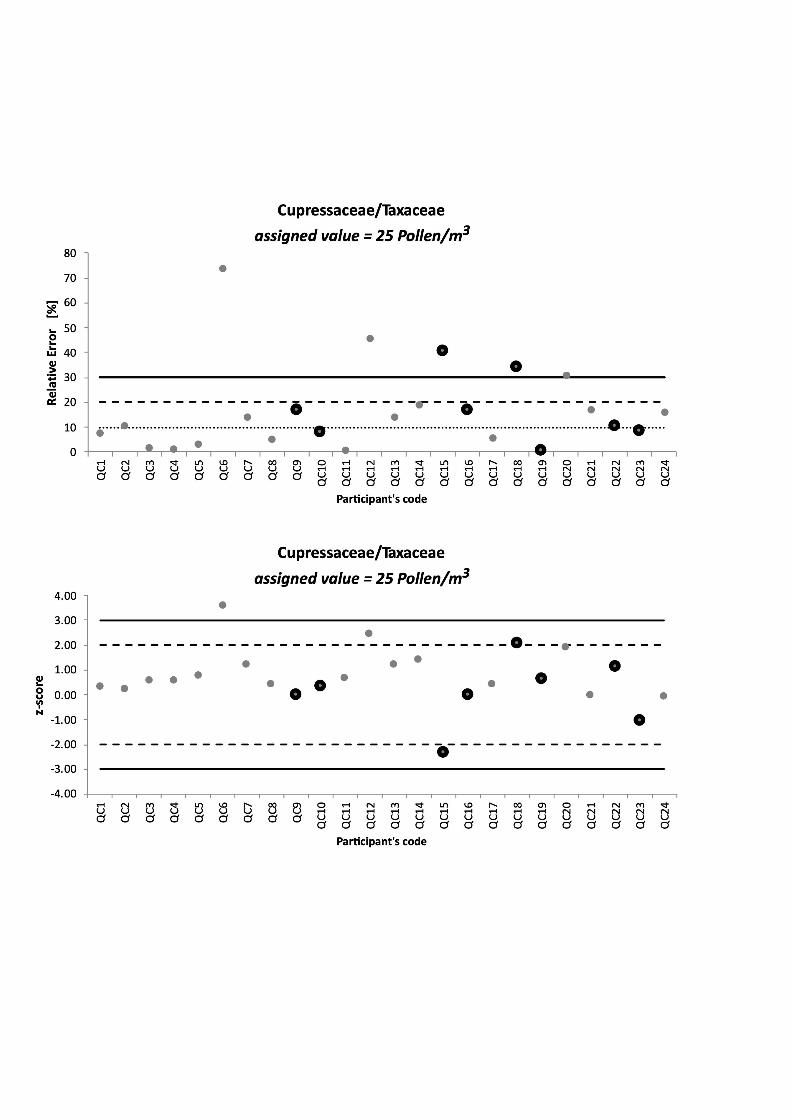
acceptable coefficients of variation used as those for repeatability (CEN 2019). The majority of 150
results were within the acceptable coefficients of variation for each pollen type. There was one 151
result for Cupressaceae/Taxaceae that was outside acceptable limits from Lab B (CV% of 34). As 152
previously mentioned, one participant from Lab A also reported an anomalously low Urticaceae 153
pollen concentration and this was removed as an outlier (before it was removed the CV% for Lab A 154
and all labs together was > 10) (Table I). 155
Following the norm (CEN 2019), only pollen types with an assigned value more than 10 156
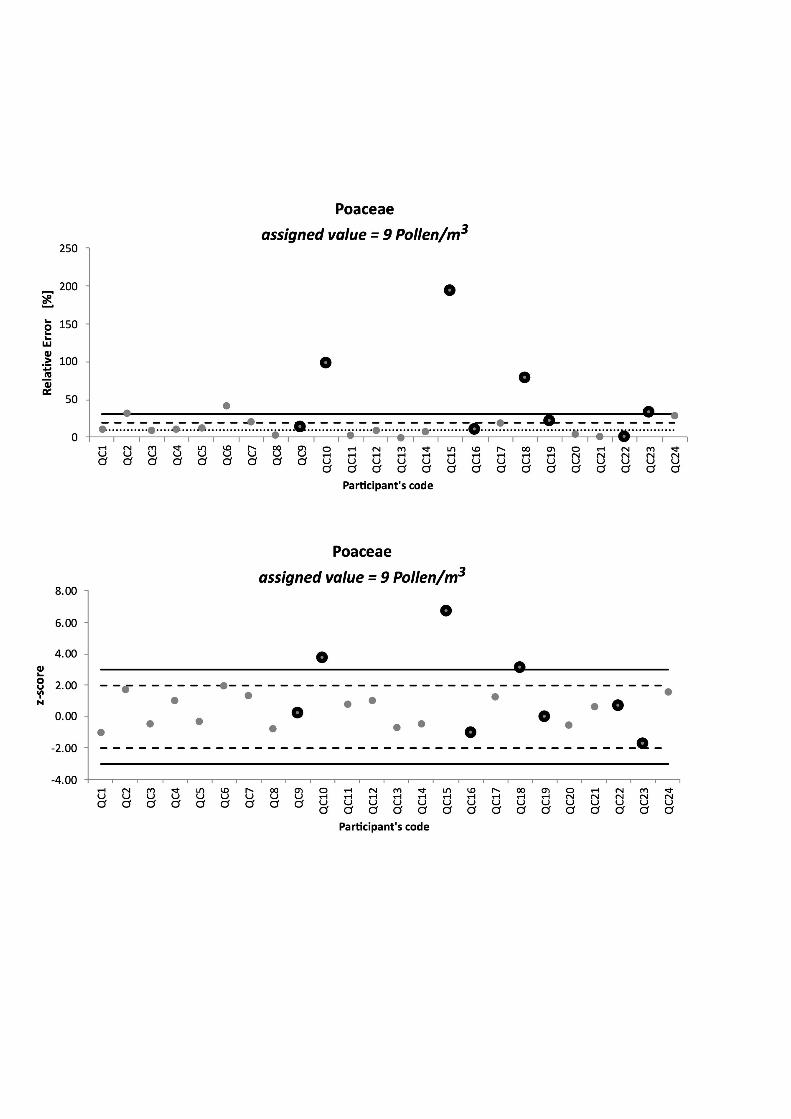
pollen/m3 were deemed suitable for further analysis. Poaceae had an assigned value of 9 157
pollen/m3 and as a result should not have been examined further, but it is interesting to note that 158
the CV% was greater than 30 for all tests of repeatability and intralaboratory reproducibility for 159
this pollen type (Table I). 160
161
3.2. Virtual slides between analysts comparison 162
A total of 24 analysts (Appendix 2) participated in the study from 12 countries (Belgium, France, 163
Germany, Italy, Lithuania, Netherlands, Portugal, Serbia, Slovakia, Spain, Switzerland, Turkey). We 164
initially gave participants 2 months to submit their results, but this deadline was extended for an 165
additional month because of a number of delays. The first information was received within one 166
month of commencing the exercise. Most data were delivered during the third month of the 167
exercise after the deadline was extended. 168
Data from Virtual Slide Images were compared to the assigned values and thresholds for 169
acceptable coefficients of variation (CV%) calculated from examining microscope slides. Results of 170
the analyses are shown in Figures 1–7, both for acceptable coefficients of variation (CV%) as used 171
in tests for repeatability and intralaboratory reproducibility following the norm EN 16868:2019 172
9
(CEN 2019) and z-scores as described in previous exercises carried out by the European 173
Aerobiology Society Working Group on Quality Control (Galán et al. 2014; Šikoparija et al. 2017). 174
Four of the counters who analysed the microscope slides also analysed virtual slides (QC1, 175
QC8, QC9, and QC10). The change to virtual slides did not noticeably affect their performance, as 176
all of their results were within the limits of CV% for pollen types with an assigned value >10 177
pollen/m3. On the whole, however, coefficients of variation were generally larger for virtual slides 178
than glass slides. 179
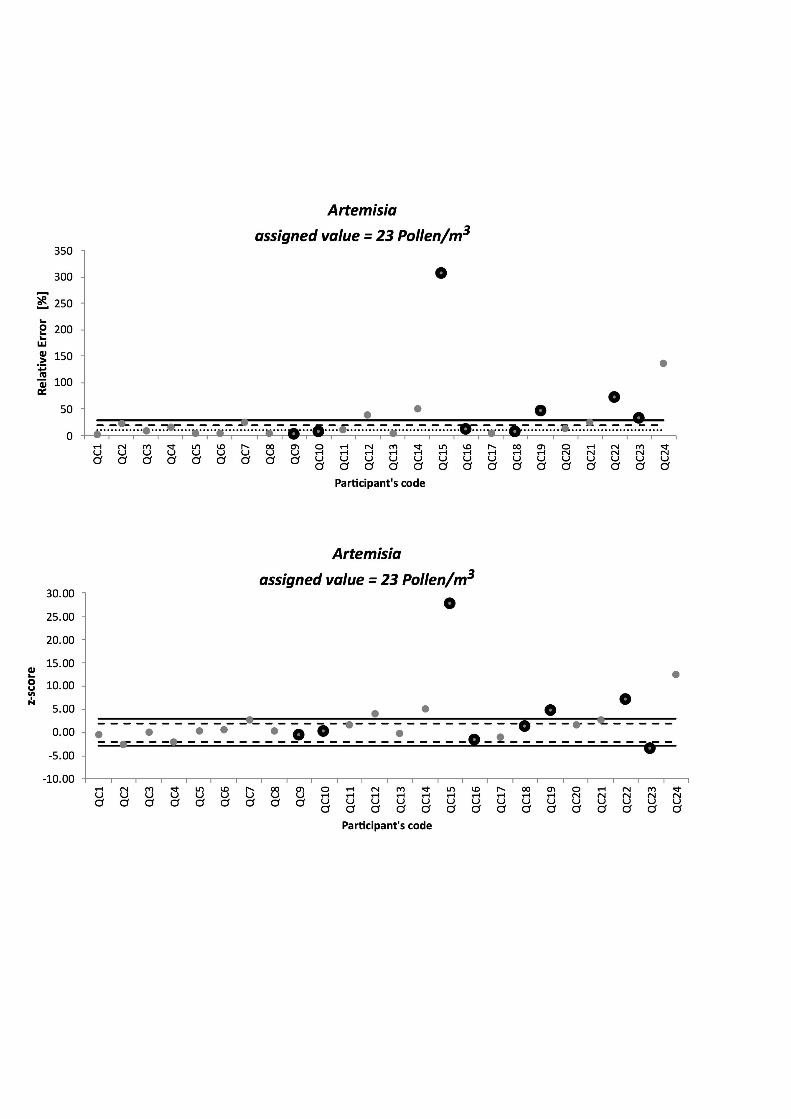
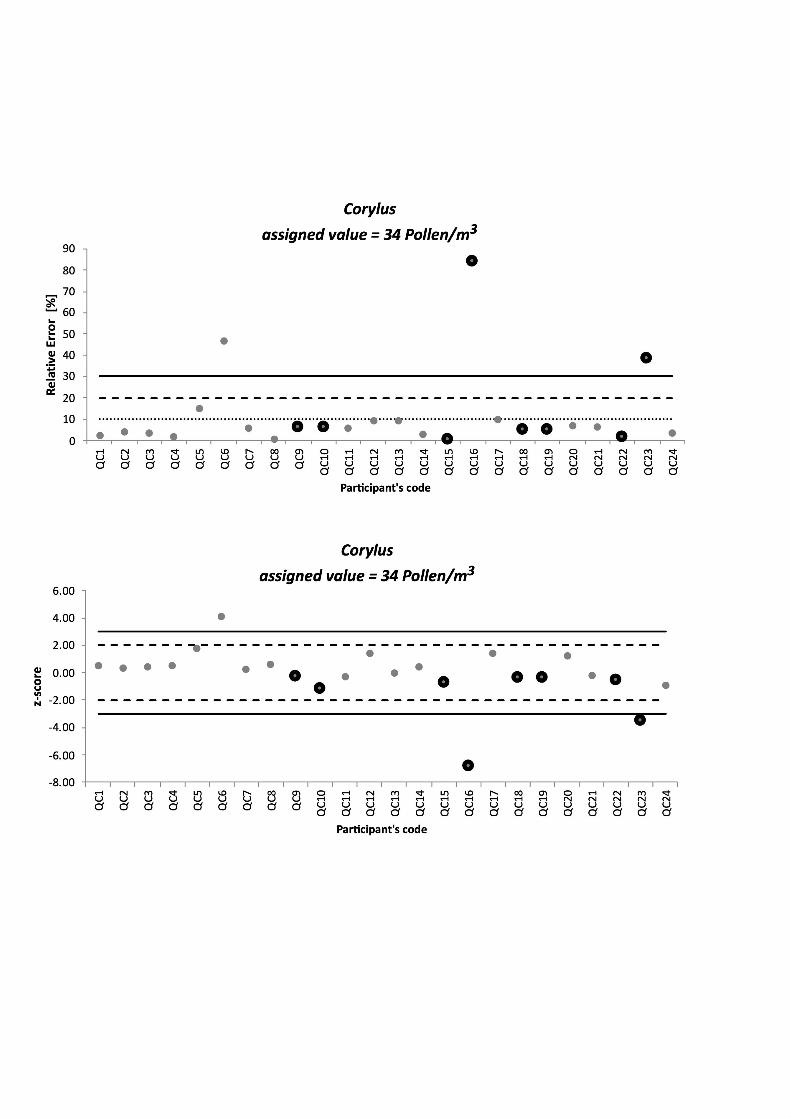
A number of results for each pollen type exceeded the CV thresholds, and from the data it 180
was possible to identify several potential errors in identification. For example, participant QC15 181
appeared to have mis-identified a pollen type as being Artemisia (Fig. 3), participant QC16 seemed 182
to count the majority of Corylus as Betula (Fig. 4) and participants QC6 and QC18 counted 183
Urticaceae as Cannabaceae (Fig. 7). 184
The area of the virtual slides analysed by participants had a notable impact on the results. 185
Better results were achieved if a larger area of the slide was analysed. Four counters (QC1, QC2, 186
QC3 and QC4) analysed the whole of the virtual slide surface (100% of the virtual slide and ~36% 187
of the original glass slide) and generally recorded low CV%. A total of 8 out of the 24 participants 188
(33%) examined <10% of the surface of the slides (<10% of the whole slide, not just the virtual 189
slide). It was observed that 24 results exceeded the limits of the study and 12 of these (50%) were 190
from participants who examined <10% of the slide (Figs 1–7). 191
192
3.3. User opinion 193
All 24 participants responded to the questionnaire survey. Seventeen respondents were female 194
and 7 were male. Seven respondents had less than 5 years’ experience counting pollen, 5 195
respondents had between 5 and 10 years’ experience and 11 had more than 10-years’ experience 196

10
counting pollen (1 respondent did not answer this question). The results of questionnaire (Fig. 8) 197
show that the majority (>70%) of respondents agreed that the Virtual Slide Images and OlyVIA 198
software were easy to install, the guidance and supporting material provided were sufficient for 199
helping them prepare for the QC exercise, the OlyVIA software was easy to use and having the 200
ability to conduct the laboratory exercise on their own schedule with the computer technology 201
was an advantage. Responses were particularly positive about the guidance and supporting 202
material (87.5% agreed). Less people agreed that the manoeuvrable images studied with the 203
OlyVIA software were of sufficient resolution to allow identification of pollen (62.5%). There were 204
fewer positive responses (<30%) when people were asked about the ease of navigating the images 205
with the computer and OlyVIA software and whether the computer technology saved them time 206
compared to using light microscopy. The results of the Kruskal Wallis test showed there were no 207
significant differences in responses based on years of experience. 208
When participants were asked what they liked most about using Virtual Slide Images, over 209
a third mentioned advantages of using the computer rather than a microscope. These included the 210
possibility of more than one person being able view the same image at the same time, the large 211
field of view, ease of handling and that there was no time pressure and they were able to perform 212
the analysis anywhere at any time. In addition, several respondents recognised that virtual slides 213
could potentially save time compared to a traditional QC exercise and highlighted the fact that 214
virtual slides could not be damaged and can be permanently stored. 215
On the other hand, three respondents had nothing positive to say about the Virtual Slide 216
Images (they responded to both open ended questions, but all their responses were negative). 217
Suggestions for improving the use of Virtual Slide Images were primarily concerned with the focus 218
(z-axis) and the manoeuvrability of the slide image (x- and y-axis). Comments largely supported 219
the answers to the Likert scale questions, with several participants complaining the virtual slides 220

11
took longer to analyse (one respondent saying that one slide had taken all day) and that it was not 221
as ergonomically comfortable as sitting at a microscope. 222
223
3.4 Technical difficulties 224
Slide 3 (24-04-2019) was removed from the study because of reported problems in the way the 225
images were stitched together in the virtual slide and because some participants complained that 226
analysis was rather complicated due to the fact that not all pollen types on Slide 3 were 227
frequently encountered in all parts of Europe (Appendix 1). A common complaint was that the 228
slide images were too large and took too long to download. Approximately one third of 229
participants reported problems with focussing, including blurry images. 230
231
4. Discussion 232
233
The digital capture of glass slide preparations to produce Virtual Slide Images is still a relatively 234
new technology (Evered & Dudding 2011). Although digital slides are increasingly being employed 235
in medicine for the teaching and assessment of histology and pathology (Vyas et al. 2016) and can 236
also be used for training, intralaboratory quality control, interlaboratory quality assurance and 237
image analysis (Rocha et al. 2009; Evered & Dudding 2011). Digital images are not expensive to 238
duplicate, they do not deteriorate, break or disappear, they are easy to store and are available to 239
multiple users simultaneously (Koch et al. 2009; Pantanowitz et al. 2011). 240
Light microscopy using traditional glass slides, on the other hand, is the established tool in 241
aerobiology (Oteros et al. 2015) and can be considered the gold standard for the analysis of 242
aerobiological samples. There are certain advantages to traditional microscopy, as analysts are 243
12
familiar with the equipment and have full control of XYZ stages, and glass slides are cheap to 244
prepare (Evered & Dudding 2011). However, glass slides are easily broken (Evered & Dudding 245
2011) which is a potential problem when conducting large scale interlaboratory QC exercises 246
where samples are sent to multiple sites (Galán et al. 2014; Šikoparija et al. 2017). 247
248
4.1 Virtual slides between analysts comparison 249
In this investigation, glass slide microscopy was considered to be the gold standard as described 250
for previous studies related to dermatitis and pathology (Koch et al. 2009; Vyas et al. 2016). The 251
results from the glass slides produced by one analyst were examined for repeatability and all data 252
from counters who used traditional microscopy were included in tests for intralaboratory 253
reproducibility following the norm EN 16868:2019 (CEN 2019). In addition, a total of 24 analysts 254
participated in between analyst comparisons using Virtual Slide Images. It was found that data 255
from traditional glass and virtual slides were comparable but coefficients of variation were 256
generally larger for virtual slides than glass slides. Some of this variation could be attributed to 257
reported problems with focusing the OlyVIA software and analysts coming into contact with pollen 258
types they were not normally accustomed to seeing. However, the results allowed identification of 259
several possible errors in identification, thereby highlighting the potential for the system to be 260
used in training and Quality Control. 261
It was noticeable that 33% of participants looked at less than 10% of the slide but made up 262
50% of results that were outside of the limits of the study. This is not particularly surprising as a 263
number of studies have now highlighted the fact that the area of the slide examined has a 264
significant impact on the quality of the data produced (Galán et al. 2014; Šikoparija et al. 2017; 265
Smith et al. 2019). This is further evidence that networks should follow the recommendations that 266
analysts should examine at least 10% of the slide surface (Mandrioli et al. 1998; Šikoparija et al. 267

13
2011; Galán et al. 2014). In addition, Poaceae had an assigned value of <10 pollen/m3 and a CV% 268
greater than 30 for all tests of repeatability and intralaboratory reproducibility, thereby 269
highlighting the importance of selecting pollen types that are present on the slides in sufficient 270
numbers (Šikoparija et al. 2017; Smith et al. 2019). 271
272
4.2 User opinion 273
Participants were invited to give their opinion on the efficacy and usability of digital slides. On a 274
positive note, participants were satisfied with the amount of guidance and supporting material 275
provided, and generally agreed that the virtual slides and OlyVIA software were easy to install and 276
use. However, it is known that one disadvantage of digital microscopy is the large amount of 277
digital storage space needed for image data (Vyas et al. 2016). Indeed, several participants 278
commented that they experienced problems when downloading the slides because of their size. 279
Results of the questionnaire survey showed that many participants also liked the fact that 280
they could conduct the exercise in their own time. Moreover, participants mentioned the benefit 281
of being able to examine and discuss the slides with colleagues. This highlights the potential of 282
using Virtual Slide Images as a training tool. 283
The survey did, however, identify some issues with the usability of the system and 284
respondents were not impressed by the ability of the OlyVIA software to navigate around the 285
slides and did not think the virtual slides saved time compared to traditional glass slides. This is in 286
agreement with a previous study conducted by Vyas et al. (2016) who compared whole slide 287
digital images and traditional glass slides in the detection of common microscopic features seen in 288
dermatitis. The authors observed the efficiency of using glass slides was superior to digital slides, 289
and that glass slides were generally read faster (Vyas et al. 2016). Hanna et al. (2019) also 290
witnessed a 19% decrease in efficiency (increase in turnaround time) using digital pathology slides. 291

14
It should be remembered, however, that virtual slides are not meant to test all microscope 292
skills as field selection and focussing with virtual slides has been likened to operating a camera 293
(Burthem et al. 2005). With this in mind, it is important to note that more than 60% of participants 294
in the current study agreed there was sufficient resolution to allow identification of pollen. 295
Similarly, Blake et al. (2003) described the successful change from using traditional microscopes 296
and glass slides to using virtual slides. In their study the authors reported that, when asked, the 297
vast majority of medical students on the histology course they delivered rated digital images as 298
having excellent resolution (Blake et al. 2003). 299
300
4.3. Evaluation 301
Rocha et al. (2009) defined digital slide quality by the following factors: (A) Quality - condition of 302
the original slide; (B) Completeness - the slide should be accessible in its entirety; (C) Image quality 303
- attributes of the digital slide (e.g. sharpness, contrast, colour) should be comparable to those of a 304
real microscope; (D) Usability – such as smooth scrolling and magnification options. 305
The quality of the scanned slide is important (Rocha et al. 2009) but so is the spectrum of 306
pollen types present and previous QC exercises have focused on only a few regionally important 307
allergenic pollen (Galán et al. 2014; Šikoparija et al. 2017). It was clear that a number of 308
participants struggled with the sample on Slide 3 collected in Serbia during the Spring of 2018, 309
which contained pollen types with similar morphological characteristics such as Broussonetia, 310
Celtis, Morus, and Urticaceae (Appendix 1). These pollen types are not commonly encountered in 311
large numbers in all parts of Europe, and this contributed to Slide 3 being omitted from the final 312
analysis. It should also be remembered that different aerobiological laboratories use different 313
methods, which include a variety of staining agents that result in pollen of different hues (or no 314
stain at all) and a range of adhesives that can make slides look different. Indeed, one participant 315

15
did mention that the colouration of the slides made it difficult to identify the pollen. Analysts 316
become accustomed to the techniques used in their own labs and this needs to be considered in 317
interlaboratory QC tests and compromises made. However, there should also be recognition that 318
you cannot please everyone all the time. 319
In an attempt to reduce the size of the virtual image, only part of the exposed portion of 320
the slide (5x48mm) was digitised. This is, however, the area typically examined during routine 321
monitoring using longitudinal transects (e.g. Galán et al. (2007)). Assigned values were calculated 322
using the data from the glass slides. This allowed us to compare counts made from traditional 323
glass slides with those from and Virtual Slide Images, although the results show there was more 324
variation in the data from virtual slides than traditional glass slides. 325
The quality of all images is extremely important when using virtual slides as a testing tool 326
(Koch et al. 2009). The high-resolution multi focus micrographs used in this study were generally of 327
sufficient resolution for the identification of pollen, but there were limitations and participants 328
often requested improvements in this regard. Problems related to the stitching together of the 329
images also caused Slide 3 to be omitted from the study. 330
The usability of the current system is also rather limited, and the ultimate goal would be 331
for technology that can rapidly upload images, proficiently focus, and effortlessly navigate across 332
virtual slides in the same way as operators do with glass slides (Koch et al. 2009). In order to make 333
the files used in this study acceptable for online transfer, the size of the files had to be reduced 334
and the image spacing of the z-stack restricted (i.e. 28 microns with 20 layers at 1.4 micron step). 335
The results of our study indicate that, for more precise identification of pollen where fine 336
morphological features need to be seen, a thicker z-stack with finer step must be used. This is 337
particularly important in melissopalynology. As a result, much larger files would need to be 338
produced for use in quality control following the norm DIN 10760: 2002 (DIN 2002) for the 339
16
determination of the relative frequency of pollen in the analysis of honey. For smooth online views 340
of virtual slide images the application of a client-server-based data management system such as 341
the Net Image Server SQL would be needed (https://www.olympus-342
lifescience.com/en/microscopes/virtual/vs120/net-image-server-sql/). 343
The use of virtual slides as a tool for quality assurance programmes has certain advantages, 344
not least the ability to distribute identical images from a single original slide to multiple users at 345
different sites thereby avoiding the problems and costs related to sending slides between 346
laboratories by post (Burthem et al. 2005; Rocha et al. 2009). Such exercises can customarily take 347
months to complete, as shown in aerobiology (Šikoparija et al. 2017) and other disciplines such as 348
pathology (Rocha et al. 2009). Whereas, in this study, all data were returned within three months. 349
It is important that participants in proficiency tests examine the same material, and there is 350
potential for the use of digital slides in quality control programmes and for measuring accuracy 351
(Rocha et al. 2009). For instance, in a pilot study assessing the use of virtual slides in 352
haematological quality assessment, Burthem et al. (2005) reported comparable results from both 353
glass and digital slides. As a result, the authors recommended that digital virtual slides could be 354
used as a supplementary resource to glass slides in educational aspects of haematological 355
morphology and external quality assessment (Burthem et al. 2005). However, the use of virtual 356
slide technology is not for everyone and, in the current study, we have found that opinion was 357
polarised but it was interesting to note that there were no differences in response based on years 358
of experience. Both traditional glass and virtual slides test common skills such as identification, 359
and it is recognised there are advantages and disadvantages of the two (Burthem et al. 2005; Koch 360
et al. 2009). We therefore recommend that, as with the study by Burthem et al. (2005), virtual 361
slides are used as an adjunct to glass slides for use in aerobiology quality control and other aspects 362
of palynological training and assessment. 363
17
364
Acknowledgement 365
366
The authors thank Mr Tomáš Pop (OLYMPUS CZECH GROUP, S.R.O., ČLEN KONCERNU) for his 367
invaluable help digitalizing the slides. Branko Šikoparija has been financed by Ministry of Education, 368
Science and Technological Development of the Republic of Serbia (Grant No. 451-03-68/2020-14/ 369
200358). 370
371
Figure Legends 372
373
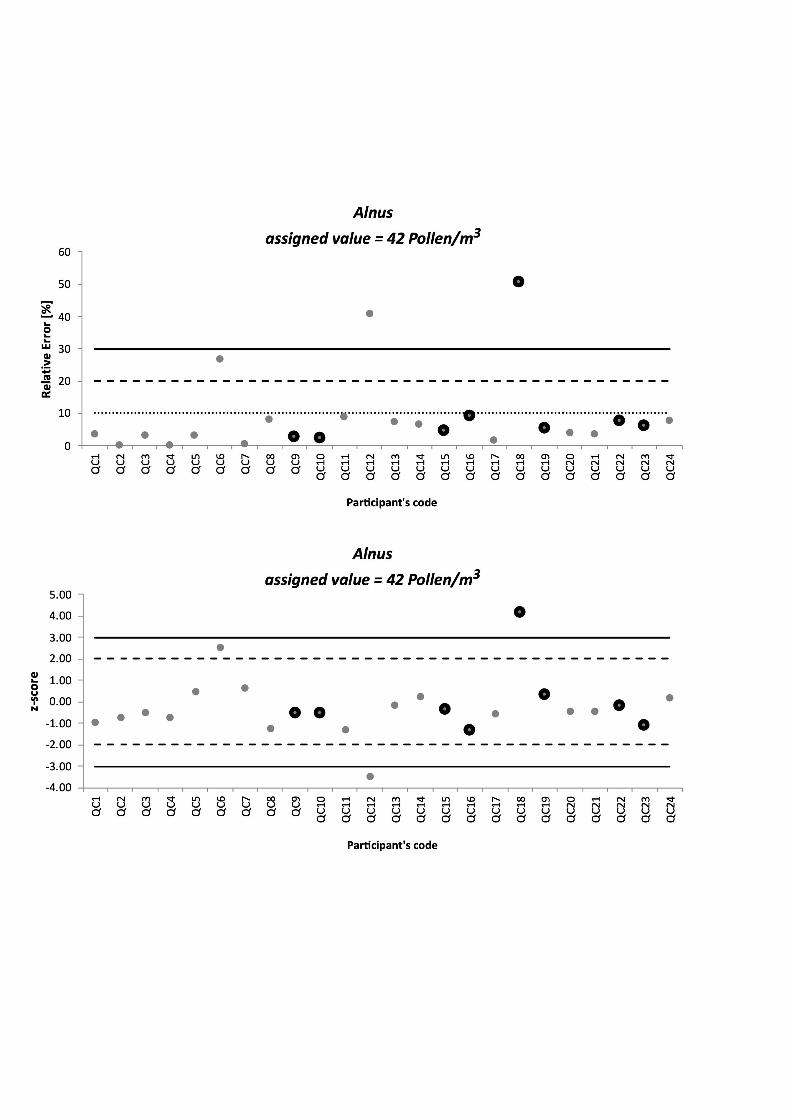
Figure 1. Results between analyst comparison using virtual slides for Alnus: (A) Acceptable 374
coefficients of variation(CV%) as used for repeatability and intralaboratory reproducibility 375
following the norm EN 16868:2019; (B) z-scores as described in previous exercises carried out by 376
the European Aerobiology Society Working Group on Quality Control (Galán et al. 2014; Sikoparija 377
et al. 2017). Results from participants who examined <10% of the digital slide marked in bold. 378
379
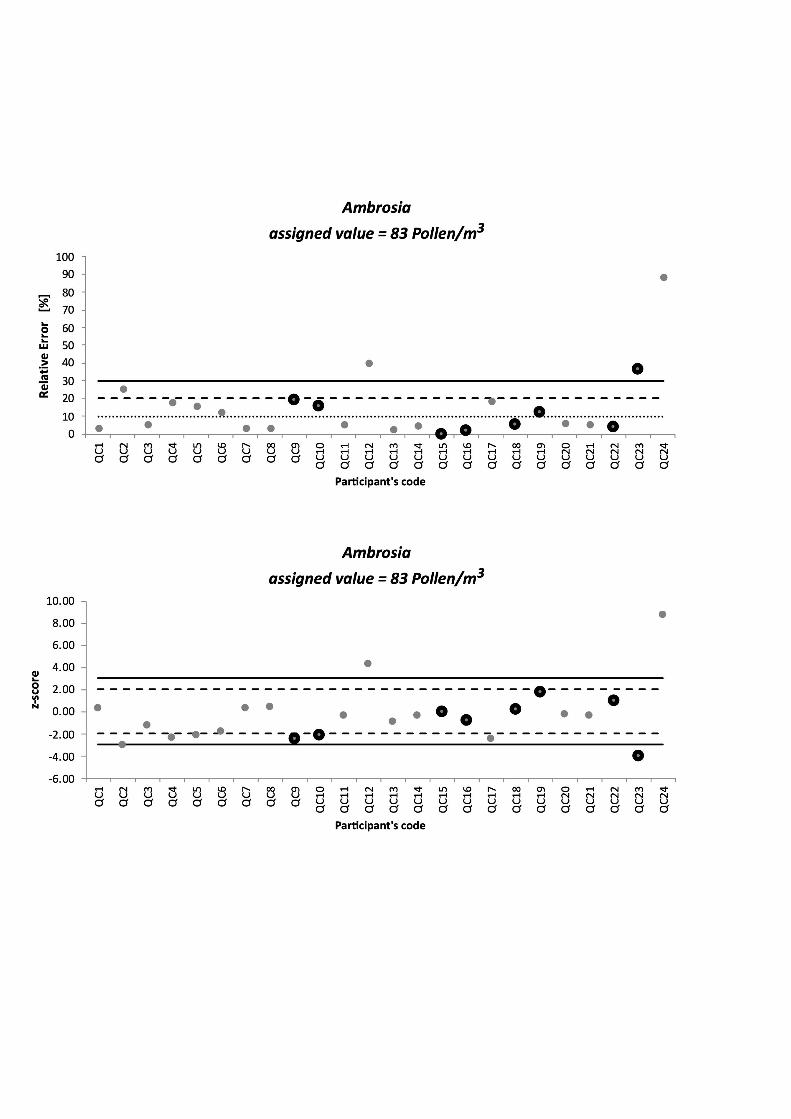
Figure 2. Results between analyst comparison using virtual slides for Ambrosia: (A) Acceptable 380
coefficients of variation(CV%) as used for repeatability and intralaboratory reproducibility 381
following the norm EN 16868:2019; (B) z-scores as described in previous exercises carried out by 382
the European Aerobiology Society Working Group on Quality Control (Galán et al. 2014; Sikoparija 383
et al. 2017). Results from participants who examined <10% of the digital slide marked in bold. 384
385
Figure 3. Results between analyst comparison using virtual slides for Artemisia: (A) Acceptable 386
coefficients of variation(CV%) as used for repeatability and intralaboratory reproducibility 387
following the norm EN 16868:2019; (B) z-scores as described in previous exercises carried out by 388
18
the European Aerobiology Society Working Group on Quality Control (Galán et al. 2014; Sikoparija 389
et al. 2017). Results from participants who examined <10% of the digital slide marked in bold. 390
391
Figure 4. Results between analyst comparison using virtual slides for Corylus: (A) Acceptable 392
coefficients of variation(CV%) as used for repeatability and intralaboratory reproducibility 393
following the norm EN 16868:2019; (B) z-scores as described in previous exercises carried out by 394
the European Aerobiology Society Working Group on Quality Control (Galán et al. 2014; Sikoparija 395
et al. 2017). Results from participants who examined <10% of the digital slide marked in bold. 396
397
Figure 5. Results between analyst comparison using virtual slides for Cupressaceae/Taxaceae: (A) 398
Acceptable coefficients of variation (CV%) as used for repeatability and intralaboratory 399
reproducibility following the norm EN 16868:2019; (B) z-scores as described in previous exercises 400
carried out by the European Aerobiology Society Working Group on Quality Control (Galán et al. 401
2014; Sikoparija et al. 2017). Results from participants who examined <10% of the digital slide 402
marked in bold. 403
404
Figure 6. Results between analyst comparison using virtual slides for Poaceae: (A) Acceptable 405
coefficients of variation (CV%) as used for repeatability and intralaboratory reproducibility 406
following the norm EN 16868:2019; (B) z-scores as described in previous exercises carried out by 407
the European Aerobiology Society Working Group on Quality Control (Galán et al. 2014; Sikoparija 408
et al. 2017). Results from participants who examined <10% of the digital slide marked in bold. 409
410
Figure 7. Results between analyst comparison using virtual slides for Urticaceae: (A) Acceptable 411
coefficients of variation (CV%) as used for repeatability and intralaboratory reproducibility 412
following the norm EN 16868:2019; (B) z-scores as described in previous exercises carried out by 413

19
the European Aerobiology Society Working Group on Quality Control (Galán et al. 2014; Sikoparija 414
et al. 2017). Results from participants who examined <10% of the digital slide marked in bold. 415
416
Figure 8. Results of the questionnaire study to participants involved in the interlaboratory 417
proficiency test using virtual slides (% responses) 418
419
420
421
References 422
423
Blake CA, Lavoie HA, Millette CF. 2003. Teaching medical histology at the University of South 424
Carolina School of Medicine: Transition to virtual slides and virtual microscopes. The 425
Anatomical Record Part B: The New Anatomist, 275B, 196-206. 10.1002/ar.b.10037 426
Burthem J, Brereton M, Ardern J, Hickman L, Seal L, Serrant A, Hutchinson C, Wells E, McTaggart P, 427
De la Salle B. 2005. The use of digital ‘virtual slides’ in the quality assessment of 428
haematological morphology: results of a pilot exercise involving UK NEQAS (H) participants. 429
British journal of haematology, 130, 293-296. 430
CEN. 2019. EN 16868:2019 Ambient air - Sampling and analysis of airborne pollen grains and 431
fungal spores for allergy networks - Volumetric Hirst method. CEN-CENELEC Management 432
Centre: Rue de la Science 23, B-1040 Brussels, European Committee For Standardization. 433
DIN. 2002. DIN10760:2002. Analysis of honey - Determination of the relative frequency of pollen, 434
German Institute for Standardisation (Deutsches Institut für Normung). 435
Evered A, Dudding N. 2011. Accuracy and perceptions of virtual microscopy compared with glass 436
slide microscopy in cervical cytology. Cytopathology, 22, 82-87. 437
20
Galán C, Cariñanos P, Alcázar P, Dominguez-Vilches E. 2007. Spanish Aerobiology Network (REA) 438
Management and Quality Manual. Servicio de Publicaciones Universidad de Córdoba. ISBN 439
978-84-690-6353-8. 440
Galán C, Smith M, Thibaudon M, Frenguelli G, Oteros J, Gehrig R, Berger U, Clot B, Brandao R. 2014. 441
Pollen monitoring: minimum requirements and reproducibility of analysis. Aerobiologia, 30, 442
385-395. 10.1007/s10453-014-9335-5 443
Hanna MG, Reuter VE, Hameed MR, Tan LK, Chiang S, Sigel C, Hollmann T, Giri D, Samboy J, 444
Moradel C, Rosado A, Otilano JR, England C, Corsale L, Stamelos E, Yagi Y, Schüffler PJ, 445
Fuchs T, Klimstra DS, Sirintrapun SJ. 2019. Whole slide imaging equivalency and efficiency 446
study: experience at a large academic center. Modern Pathology, 32, 916-928. 447
10.1038/s41379-019-0205-0 448
Koch LH, Lampros JN, Delong LK, Chen SC, Woosley JT, Hood AF. 2009. Randomized comparison of 449
virtual microscopy and traditional glass microscopy in diagnostic accuracy among 450
dermatology and pathology residents. Human Pathology, 40, 662-667. 451
https://doi.org/10.1016/j.humpath.2008.10.009 452
Mandrioli P, Comtois P, Levizzani V. 1998. Methods in Aerobiology, Bologna, Pitagora Editrice. 453
Oteros J, Pusch G, Weichenmeier I, Heimann U, Möller R, Röseler S, Traidl-Hoffmann C, Schmidt-454
Weber C, Buters JTM. 2015. Automatic and Online Pollen Monitoring. International 455
Archives of Allergy and Immunology, 167, 158-166. 456
Pantanowitz L, Valenstein PN, Evans AJ, Kaplan KJ, Pfeifer JD, Wilbur DC, Collins LC, Colgan TJ. 2011. 457
Review of the current state of whole slide imaging in pathology. Journal of pathology 458
informatics, 2. 459
Rocha R, Vassallo J, Soares F, Miller K, Gobbi H. 2009. Digital slides: present status of a tool for 460
consultation, teaching, and quality control in pathology. Pathology-Research and Practice, 461
205, 735-741. 462
21
Šikoparija B, Galán C, Smith M, EAS_QC_Working_Group. 2017. Pollen-monitoring: between 463
analyst proficiency testing. Aerobiologia, 33, 191. https://doi.org/10.1007/s10453-016-464
9461-3 465
Šikoparija B, Pejak-Šikoparija T, Radišić P, Smith M, Galan-Soldevilla C. 2011. The effect of changes 466
to the method of estimating the pollen count from aerobiological samples. Journal of 467
Environmental Monitoring, 13, 384-390. 10.1039/c0em00335b 468
Smith M, Oteros J, Schmidt-Weber C, Buters JT. 2019. An abbreviated method for the quality 469
control of pollen counters. Grana, 58, 185-190. 470
Vyas NS, Markow M, Prieto-Granada C, Gaudi S, Turner L, Rodriguez-Waitkus P, Messina JL, Jukic 471
DM. 2016. Comparing whole slide digital images versus traditional glass slides in the 472
detection of common microscopic features seen in dermatitis. Journal of pathology 473
informatics, 7. 474
Weinstein RS, Graham AR, Richter LC, Barker GP, Krupinski EA, Lopez AM, Erps KA, Bhattacharyya 475
AK, Yagi Y, Gilbertson JR. 2009. Overview of telepathology, virtual microscopy, and whole 476
slide imaging: prospects for the future. Human Pathology, 40, 1057-1069. 477
https://doi.org/10.1016/j.humpath.2009.04.006 478
479

Appendices
Appendix 1
The list of pollen types likely to be found on each slide (not exhaustive), which was supplied
to counters to aid identification:
• Slide 1 (11-03-2018): Alnus, Corylus, Fraxinus, Populus, Taxaceae/Cupressaceae, Ulmus.
• Slide 2 (10-08-2014): Ambrosia, Apiaceae, Artemisia, Cannabaceae, Chenopodiaceae,
Plantago Poaceae, Urticaceae, Xanthium.
• Slide 3 (24-04-2018): Alnus, Apiaceae, Betula, Brassicaceae, Broussonetia, Carpinus,
Celtis, Cyperaceae, Fagus, Fraxinus, Juglans, Morus, Pinaceae, Platanus, Poaceae,
Quercus, Rumex, Salix, Taxaceae/Cupressaceae, Urticaceae.
Appendix 2
The following counters participated in this QC exercise: Arandjelovic, A.; Bekil, S.; Bruffaerts,
N.; Bucher, E.; Cislaghi, G.; de Weger, L.; Dovydaityte, D.; Kolek, F.; Graber, M-J.: Hoebeke,
L.; Iannotta, M.P.; Leier-Wirtz, V.; Martínez-Bracero, M.; Navarro, D.; Oliver, G.; Pereira, C.;
Pereira, J.; Plaza, M.; Radisic, P.; Ribeiro, H.; Sallin, C; Ščevková, J.; Šikoparija, B.; Trajkovska,
G.; Tosunoglu, A.; Verstraeten, C.

Table I. Assigned values and results of repeatability and intralaboratory reproducibility as defined in the norm (EN 16868:2019). SPT (standard deviation for proficiency testing = Robust standard deviation); Assigned value (Assigned value (X) = robust average); n = Datasets after the removal of outliers (Hampel test); 1 counter CV% = Repeatability; Lab A CV% = Laboratory A Intralaboratory Reproducibility; Lab B CV% = Laboratory B Intralaboratory Reproducibility; All CV% = All counter Intralaboratory Reproducibility; Allowed CV% = The acceptable coefficients of variation (CV)
Pollen type
SPT Assigned value
n = 1 counter CV%
Lab A CV%
Lab B CV%
All CV%
Allowed CV%
Alnus 6.12 42 8 19 19 5 15 20 Ambrosia 9.01 83 8 12 12 3 11 20 Artemisia 2.58 23 8 3 5 4 11 30 Corylus 4.61 34 8 15 12 18 14 20 †Cup/Tax 6.26 25 8 14 22 34 25 30 Poaceae 2.81 9 8 33 33 31 32 NA Urticaceae 18.61 349 7 3 3* 4 5* 10
†Cupressaceae/Taxaceae *Outliers removed (Hampel test) Repeatability - EN 16868:2019 CV% (Section 8.4.2) Intralaboratory Reproducibility - EN 16868:2019 CV% (Section 8.4.3) The acceptable coefficients of variation (CV), calculated only for taxa with an assigned value > 10 EN 16868:2019 CV% (Section 8.4.2).