Intergenic DNA sequences from the human X chromosome reveal high rates of global gene flow
12
BioMed Central Page 1 of 12 (page number not for citation purposes) BMC Genetics Open Access Research article Intergenic DNA sequences from the human X chromosome reveal high rates of global gene flow Murray P Cox 1 , August E Woerner 1 , Jeffrey D Wall 2 and Michael F Hammer* 1 Address: 1 ARL Division of Biotechnology, University of Arizona, AZ 85721, USA and 2 Institute for Human Genetics, University of California San Francisco, San Francisco, CA 94143, USA Email: Murray P Cox - [email protected]; August E Woerner - [email protected]; Jeffrey D Wall - [email protected]; Michael F Hammer* - [email protected] * Corresponding author Abstract Background: Despite intensive efforts devoted to collecting human polymorphism data, little is known about the role of gene flow in the ancestry of human populations. This is partly because most analyses have applied one of two simple models of population structure, the island model or the splitting model, which make unrealistic biological assumptions. Results: Here, we analyze 98-kb of DNA sequence from 20 independently evolving intergenic regions on the X chromosome in a sample of 90 humans from six globally diverse populations. We employ an isolation-with-migration (IM) model, which assumes that populations split and subsequently exchange migrants, to independently estimate effective population sizes and migration rates. While the maximum effective size of modern humans is estimated at ~10,000, individual populations vary substantially in size, with African populations tending to be larger (2,300–9,000) than non-African populations (300–3,300). We estimate mean rates of bidirectional gene flow at 4.8 × 10 -4 /generation. Bidirectional migration rates are ~5-fold higher among non-African populations (1.5 × 10 -3 ) than among African populations (2.7 × 10 -4 ). Interestingly, because effective sizes and migration rates are inversely related in African and non-African populations, population migration rates are similar within Africa and Eurasia (e.g., global mean Nm = 2.4). Conclusion: We conclude that gene flow has played an important role in structuring global human populations and that migration rates should be incorporated as critical parameters in models of human demography. Background Reconstructing human history requires an accurate pic- ture of global human population structure [1]. However, methods currently used to describe structure among human groups typically rely on very simple demographic models that make unrealistic biological assumptions. Two commonly used models include the island model, which assumes that populations have no shared ancestry and are related only through gene flow (Figure 1A), and the phylogenetic branching or splitting model, which assumes that populations diverged at some time in the past and have remained completely isolated ever since (i.e., no gene flow) (Figure 1B). Despite increasingly sophisticated genetic datasets, most contemporary studies still assume these unrealistic models to infer aspects of human demographic history [2-8]. Published: 27 November 2008 BMC Genetics 2008, 9:76 doi:10.1186/1471-2156-9-76 Received: 16 July 2008 Accepted: 27 November 2008 This article is available from: http://www.biomedcentral.com/1471-2156/9/76 © 2008 Cox et al; licensee BioMed Central Ltd. This is an Open Access article distributed under the terms of the Creative Commons Attribution License (http://creativecommons.org/licenses/by/2.0 ), which permits unrestricted use, distribution, and reproduction in any medium, provided the original work is properly cited.
-
Upload
independent -
Category
Documents
-
view
2 -
download
0
Transcript of Intergenic DNA sequences from the human X chromosome reveal high rates of global gene flow

BioMed CentralBMC Genetics
ss
Open AcceResearch articleIntergenic DNA sequences from the human X chromosome reveal high rates of global gene flowMurray P Cox1, August E Woerner1, Jeffrey D Wall2 and Michael F Hammer*1Address: 1ARL Division of Biotechnology, University of Arizona, AZ 85721, USA and 2Institute for Human Genetics, University of California San Francisco, San Francisco, CA 94143, USA
Email: Murray P Cox - [email protected]; August E Woerner - [email protected]; Jeffrey D Wall - [email protected]; Michael F Hammer* - [email protected]
* Corresponding author
AbstractBackground: Despite intensive efforts devoted to collecting human polymorphism data, little isknown about the role of gene flow in the ancestry of human populations. This is partly becausemost analyses have applied one of two simple models of population structure, the island model orthe splitting model, which make unrealistic biological assumptions.
Results: Here, we analyze 98-kb of DNA sequence from 20 independently evolving intergenicregions on the X chromosome in a sample of 90 humans from six globally diverse populations. Weemploy an isolation-with-migration (IM) model, which assumes that populations split andsubsequently exchange migrants, to independently estimate effective population sizes and migrationrates. While the maximum effective size of modern humans is estimated at ~10,000, individualpopulations vary substantially in size, with African populations tending to be larger (2,300–9,000)than non-African populations (300–3,300). We estimate mean rates of bidirectional gene flow at4.8 × 10-4/generation. Bidirectional migration rates are ~5-fold higher among non-Africanpopulations (1.5 × 10⁻³) than among African populations (2.7 × 10⁻⁴). Interestingly, because effectivesizes and migration rates are inversely related in African and non-African populations, populationmigration rates are similar within Africa and Eurasia (e.g., global mean Nm = 2.4).
Conclusion: We conclude that gene flow has played an important role in structuring global humanpopulations and that migration rates should be incorporated as critical parameters in models ofhuman demography.
BackgroundReconstructing human history requires an accurate pic-ture of global human population structure [1]. However,methods currently used to describe structure amonghuman groups typically rely on very simple demographicmodels that make unrealistic biological assumptions.Two commonly used models include the island model,which assumes that populations have no shared ancestry
and are related only through gene flow (Figure 1A), andthe phylogenetic branching or splitting model, whichassumes that populations diverged at some time in thepast and have remained completely isolated ever since(i.e., no gene flow) (Figure 1B). Despite increasinglysophisticated genetic datasets, most contemporary studiesstill assume these unrealistic models to infer aspects ofhuman demographic history [2-8].
Published: 27 November 2008
BMC Genetics 2008, 9:76 doi:10.1186/1471-2156-9-76
Received: 16 July 2008Accepted: 27 November 2008
This article is available from: http://www.biomedcentral.com/1471-2156/9/76
© 2008 Cox et al; licensee BioMed Central Ltd. This is an Open Access article distributed under the terms of the Creative Commons Attribution License (http://creativecommons.org/licenses/by/2.0), which permits unrestricted use, distribution, and reproduction in any medium, provided the original work is properly cited.
Page 1 of 12(page number not for citation purposes)

BMC Genetics 2008, 9:76 http://www.biomedcentral.com/1471-2156/9/76
Furthermore, human population structure is often consid-ered only from the perspective of a single summary statis-tic, FST, which is a standardized measure of the geneticvariation shared between populations. However, FST isdependent on the effective size (N), migration rate (m)and divergence time (t) of individual demes, and by itselfhas no straightforward demographic interpretation. Asmall FST between two populations may indicate largeeffective population sizes, high rates of gene flow sincediverging from a common ancestral population, or recentpopulation divergence. For instance, under Wright's [9]island model, N, m and FST are linked by a nonlinear rela-tionship independent of t (equation 2) [10]. Assuming aglobal effective size for modern humans of ~104, an Xchromosome FST of 0.2 [11,12] suggests that human pop-ulations have exchanged ~4 gene copies per generation.Conversely, under a simple divergence and isolationmodel, N, t and FST are related by a nonlinear relationshipindependent of m (equation 4) [13]. Assuming a meangeneration time of 25 years, an X chromosome FST of 0.2suggests that global human populations diverged on aver-age ~84 Kya. However, despite being in common usage,gene flow-only and divergence-only models probablyhave little relevance to actual human demographic his-tory.
Here, we examine the structure of human populations bymeans of the isolation-with-migration (IM) model [14],which incorporates both population splitting and geneflow (Figure 1C). The IM model describes two daughterpopulations, which can expand or contract in size, thatdiverge from a constant-sized ancestral population withcontinuing migration between the two demes. The IMmodel has seven demographic parameters: effective pop-ulation size of the ancestral deme (NA), effective popula-tion sizes of the two descendent demes (N1 and N2),unidirectional migration rates between the descendentpopulations (m1 and m2), proportion of the ancestralpopulation founding the first deme (S), and populationdivergence time (t). Unlike the island model, whichassumes infinite divergence times, or the splitting model,which assumes zero migration, IM makes no a prioriassumptions about these two demographic parameters. Itis therefore a more flexible model system for inferringhuman history from genetic data.
Here, we apply a Bayesian inference framework togetherwith a maximum likelihood algorithm [15] to determinedemographic parameters for a range of human popula-tions under the IM model. Marginal Bayesian posteriorprobabilities are calculated using Markov chain Monte
Models of population structure reflecting the (A) island, (B) splitting and (C) isolation-with-migration (IM) modelsFigure 1Models of population structure reflecting the (A) island, (B) splitting and (C) isolation-with-migration (IM) models. The island model assumes equilibrium gene flow (m) between subpopulations that have no shared ancestry. The divergence model describes an ancestral population, which splits at time t into two daughter populations that do not exchange genes in subsequent generations. The isolation-with-migration model describes a constant-sized ancestral population that splits into two daughter populations that can exchange genes and change in size. There are seven parameters in the isolation-with-migration model: effective population size of the ancestral deme (NA), effective population sizes of the two descendent demes (N1 and N2), unidirectional migration between the descendent populations (m1 and m2), proportion of the ancestral population founding deme 1 (S), and population divergence time (t).
Page 2 of 12(page number not for citation purposes)

BMC Genetics 2008, 9:76 http://www.biomedcentral.com/1471-2156/9/76
Carlo, and best-fit parameterizations are inferred for eachpopulation pair (N = 15) for each of the seven demo-graphic parameters. We analyze a multilocus resequenc-ing dataset comprising 20 intergenic regions on the Xchromosome, each of which represents ~5 kb of DNA[16]. To minimize any potential confounding effects ofnatural selection, the sequenced loci were chosen fromsingle-copy non-coding (i.e., putatively non-functional)DNA in regions of medium or high recombination (r ≥ 0.9cM/Mb). Such regions are recombinationally unlinkedfrom genic regions. Because we use resequence data (i.e.,all sites were sequenced in each individual) and not pre-ascertained single nucleotide polymorphisms (SNPs)[3,17,18], we avoid some biases in aspects of the data thatrely on the site frequency spectrum (e.g., FST) [19,20].These data are also well suited for testing the role of geneflow in the history of anatomically modern humansbecause multiple, diverse populations are represented inour survey (i.e., Biaka from Central African Republic,Mandenka from Senegal, San from Namibia, Basque fromsouthern France, Han from northern China, and Melane-sians from Papua New Guinea).
ResultsPopulation differentiationWright's FST for our global sample averages to 0.25. Whenwe calculate FST between all pairs of populations, we findthe greatest FST values between sub-Saharan African andnon-African groups (i.e., FST ranges from 0.160–0.450)(Table 1). However, there is also a substantial amount ofdifferentiation within sub-Saharan African (mean FST of0.137) and within non-African groups (mean FST of
0.174), with FST values as high as 0.226 between Melane-sians and Basque [16].
Demographic inference under the isolation-with-migration modelMarginal Bayesian posterior probabilities were calculatedusing Markov chain Monte Carlo, and best-fit parameter-izations were inferred for each unique population pair(e.g., see Figure 1 in Additional file 1). Results for theseven demographic parameters are discussed individuallybelow (also see Table 1).
Effective population sizesModern effective population sizes (N) were inferred mul-tiple times under the IM model (i.e., once for each pairedpopulation, Tables 1 and 2 in Additional file 1). Althoughindividual estimates of N have some uncertainty, meaneffective sizes are statistically larger for African popula-tions (2,300–9,000) than non-African (300–3,300) pop-ulations (t20 = 6.9, P << 0.001). Some non-African groupshave especially small effective sizes, such as Melanesians(N0 <1,500). Mean ancestral sizes (10,500, range 6,600–12,800) are generally larger than modern effective sizes,and are also often larger than the sum of their descendantpopulations (t19 = 3.42, P = 0.0029).
Population split proportionsOur dataset has little power to infer how ancestral effec-tive sizes were apportioned among descendent demes.Most estimates of the split proportion, S, have large confi-dence intervals (Table 3 in Additional file 1). The fewinformative estimates indicate substantial retention of
Table 1: Mean effective population sizes, migration rates, divergence times and FST.
Pop 1 Pop 2 NA N1 N2 m12/gen ×10-4 m21/gen ×10-4 Nm t (kya) FST
AfricanBIA MAN 9,980 3,980 6,600 2.8 1.9 4.9 48.7 0.117BIA SAN 6,620 5,560 5,340 0.86 1.9 3.0 50.0 0.169MAN SAN 9,530 6,930 3,790 0.72 0.020 0.8 46.8 0.126
African/Non-AfricanBIA BAS 11,200 4,650 3,250 1.1 0.43 1.2 61.4 0.311BIA HAN 12,800 2,330 2,600 0.30 0.075 0.2 27.7 0.374BIA MEL 11,600 6,900 1,570 0.48 0.71 1.0 88.5 0.331MAN BAS 9,970 4,530 2,750 5.8 0.036 4.2 23.4 0.160MAN HAN 11,000 2,750 nd 2.2 0.18 nd 15.5 0.236MAN MEL 9,420 7,110 318 2.1 3.0 3.8 12.4 0.221SAN BAS 10,400 5,820 2,490 0.42 0.0012 0.3 83.0 0.344SAN HAN 10,200 7,270 1,880 0.24 0.46 0.6 151 0.450SAN MEL 10,500 8,990 1,210 <<0.001 1.6 1.6 68.5 0.390
Non-African/Non-AfricanBAS HAN 11,900 2,230 1,940 9.2 1.4 4.4 85.6 0.085BAS MEL 11,600 2,120 283 0.26 12 3.0 62.5 0.226HAN MEL 11,300 1,770 592 0.18 21 5.0 61.2 0.210
Mean 10,500 3,700 2.4 2.4 59.1 0.25
Abbreviations: BIA, Biaka; MAN, Mandenka; SAN, San; BAS, Basque; HAN, Han; MEL, Melanesians; nd: not determined.
Page 3 of 12(page number not for citation purposes)

BMC Genetics 2008, 9:76 http://www.biomedcentral.com/1471-2156/9/76
ancestral effective size in African populations; forinstance, less than ~10% of the ancestral population sizeof Mandenka and Papua New Guineans is retained in thelatter population today. Similarly, among non-Africans,the Han Chinese retain less than ~10% of the diversity car-ried when their ancestral deme still included the ancestorsof modern Papua New Guineans (upper bounds of the95% confidence interval for S).
Migration ratesStationary estimates of long-term unidirectional migra-tion rates average to 2.4 × 10⁻⁴/generation (range: 8.7 × 10-
8 – 2.1 × 10⁻³/generation), thereby suggesting that geneflow between global populations is relatively frequent(Table 4 in Additional file 1). The highest bidirectionalmigration rate (2.1 × 10⁻³; lowest rate: 3.8 × 10⁻⁵) impliesa movement of ~1 X chromosome every 2 years. Bidirec-tional migration rates within and between continents varysignificantly (F2,12 = 21.5, P = 0.0001, η = 0.78), with con-tinental assignment accounting for 61% of the variationin migration rates. Mean bidirectional migration rateswithin Africa (2.7 × 10⁻⁴), and between Africans and Eur-asians (2.1 × 10⁻⁴), are relatively low compared to migra-tion rates within Eurasia (1.5 × 10⁻³). Furthermore,migration patterns between populations are largely sym-metric. Han Chinese and Melanesians provide a keyexception; migration from China to the Pacific (2.1 × 10-
3/generation) has significantly exceeded migration in theopposite direction (1.8 × 10⁻⁵/generation) (see 95% con-fidence intervals in Table 4 in Additional file 1).
Population divergence timesMarginal posterior distributions for t indicate that diver-gence times between African populations all occur ~50kya, with the largest upper confidence interval for any twoAfrican populations at ~140 kya (Table 5 in Additionalfile 1. Estimates of non-African split times are made diffi-cult by diffuse posterior distributions with very high vari-ance, and thus caution is advised in interpreting thehigher mean non-African divergence time (~67 kya). Esti-mates of the lower bounds for non-African divergencetimes, with a mean of ~30 kya, are more consistent withprevious estimates. The mean divergence time betweenAfrican and non-African populations is ~58 kya (or~2,100 generations), which is very similar to previous esti-mates of the out-of-Africa expansion inferred from othergenetic data [21-23].
Validation of inferred demographic parametersThe inference system employed here has been validatedelsewhere [15], and our own tests indicate that knowndemographic parameters (including m) for data simu-lated under an IM model are recovered within 95% confi-dence intervals (unpublished data). However, to furtherassess the suitability of the IM model to explain observed
patterns of variation, we used coalescent simulation tomodel each population pair (N = 15) using the parametervalues of NA, N1, N2, m1, m2 and t inferred above. Due topoor estimates of the split proportion, we assumed S =0.5. To check whether these coalescent simulations returndata similar to the empirical loci, we compared observedsummary statistics for all twenty X chromosome loci withsummary distributions from these parameterized simula-tion models. We focused on four summaries of the data:i) FST, which describes the genetic distance between popu-lations; ii and iii) θW and θπ, which are unbiased estima-tors of the population mutation rate θ (= 3Neμ); and iv)Tajima's D, which summarizes the site frequency spec-trum.
Observed FST values are correlated with FST values simu-lated under these 15 simulation models (Mantel test, r =0.49, P = 0.039). Although this only explains 24% of thevariance, we obtain mean FST values that are just slightlylower than those actually observed (i.e., mean FST of 0.21versus 0.25, not significantly different). The simulationmodels also provide good fits to observed data for theremaining summaries, all of which reflect aspects of thepopulation site frequency spectrum. A Bonferroni correc-tion holding the experiment-wise type-I error rate con-stant at α = 0.05 was applied to accommodate multipletests for each population and each summary. We observe2% of loci as outliers under the corrected 95% confidenceintervals for the 360 tests performed on our parameter-ized simulation models (i.e., 6 populations, 20 loci, and3 summary statistics) (Table 6 in Additional file 1). Thisdegree of consistency between observed and simulateddata is similar for both African and non-African popula-tions (e.g., Figure 2). This similarity suggests that our esti-mates of demographic parameters are not strongly biasedby the inference method, and that the IM model is capableof portraying the evolutionary processes underlyinghuman population structure, at least at the geographicscale examined here [24].
DiscussionIt is generally appreciated that migration affects manyimportant ecological and evolutionary properties of pop-ulations [25]. Yet there is little consensus in the literatureon the role of gene flow in shaping patterns of humanpopulation structure. Equilibrium models, like the islandmodel [9], were favored historically because analyticalexpectations are relatively simple to obtain. On the otherhand, while it is accepted that migration occurs frequentlyamong human populations [26-31], gene flow is oftenignored in models of human demography. Recent exam-ples ignoring gene flow include studies of African replace-ment models [32] and serial-founder models for thesettlement of Eurasia [5]. Other studies of human demo-graphic history analyze data separately for each popula-
Page 4 of 12(page number not for citation purposes)

BMC Genetics 2008, 9:76 http://www.biomedcentral.com/1471-2156/9/76
tion sample and simply neglect any effects of sharedcommon ancestry or gene flow [7].
As pointed out by Whitlock and McCauley [25], bothdirect and indirect measures of migration and gene floware fraught with difficulty. The use of summary statisticssuch as FST is limiting because it provides no insight intowhich historical processes are responsible for the
observed genetic differences between populations. It istherefore left up to individual investigators to choosewhich model of population structure is used to interpretdata, and inferences depend heavily upon the assump-tions inherent in each model. We set out to directly esti-mate rates of gene flow between human populationsthrough the use of the isolation-with-migration (IM)model, which incorporates both population splitting and
Observed values (bars) of Tajima's D for 20 X chromosome loci in (A) Biaka pygmies and (B) Melanesians compared to simu-lated distributions for each population (curves)Figure 2Observed values (bars) of Tajima's D for 20 X chromosome loci in (A) Biaka pygmies and (B) Melanesians compared to simulated distributions for each population (curves). Tajima's D values for the majority of empirical loci are consistent with simulated distributions that are obtained from an isolation-with-migration model parameterized with the inferred demography of these two populations.
Page 5 of 12(page number not for citation purposes)
BMC Genetics 2008, 9:76 http://www.biomedcentral.com/1471-2156/9/76
gene flow. For this purpose, we have analyzed a large DNAsequence database collected with the expressed purpose ofconstructing models of human demographic history, andhence, is focused on intergenic (i.e., putatively neutral)regions on the X chromosome [16]. Values of FST for thisdataset were found to be slightly higher than those esti-mated from other large X chromosome resequence data-sets [11,12]. This difference is probably driven, at least inpart, by the inclusion of more isolated groups than wereincluded in other DNA sequence surveys of X-linked loci(i.e., the San from Namibia, Biaka from Central AfricanRepublic, and Melanesians from Papua New Guinea)[16].
To disentangle the evolutionary processes underlying FSTin real human populations, we inferred N, m and t sepa-rately for the six populations in our survey using the IMmodel. While the mean global value for ancestral popula-tion size, ~104, is consistent with previous estimates of theglobal population size of modern humans [33-37], noindividual population approaches the effective size ofmodern humans as a whole. Although sizes of individualpopulations estimated from nuclear loci remain sparse,other studies have produced similar results [2,38-40],including previous applications of the IM model tohuman genomic sequences [41]. Non-African populationsizes (N0 ≈ 3000) estimated from linkage disequilibrium(LD) [42] are particularly noteworthy because recombina-tion information is independent of the site frequencyspectrum, which we used to infer effective sizes here. Thatsimilar results are obtained using unrelated subsets of thegenetic information, and different populations, reinforcesour confidence in these low estimates of effective popula-tion size.
This finding is important because many studies make thesimplifying assumption that individual human popula-tions have an effective population size of 104 [e.g., [43]].We note that estimates of N based on the standard neutralmodel (i.e., θ = 3Nμ) are 2–4 times higher than thosereturned by IM for individual African and Eurasian sam-ples, and are even higher for our Melanesian sample (seeTable 1 in Wall et al. [16]). We suspect that this differenceis largely due to violations of assumptions of the Wright-Fisher model rather than a systematic bias in parametersreturned by IM (see Results). For example, populationsubstructure and gene flow are expected to upwardly biasestimates of within population diversity (e.g., θ) whenapplying models that do not incorporate these variables.
Indeed, we demonstrate here that rates of gene flowbetween subdivided human populations are non-zero.For unidirectional migration rates (m1, m2), ~87% of pair-wise comparisons (i.e., 42 of 48) showed gene flow in atleast one direction (i.e., their 95% confidence intervals
exclude zero migration; Table 4 in Additional file 1).When bidirectional migration rates (m = m1 + m2) areconsidered, lower bounds of 95% confidence intervals aregreater than zero for all 15 pairwise comparisons. Further-more, mean bidirectional migration rates within Africa(2.7 × 10⁻⁴/generation), and between Africans and Eura-sians (2.1 × 10⁻⁴), are significantly lower than migrationrates within Eurasia (1.5 × 10⁻³).
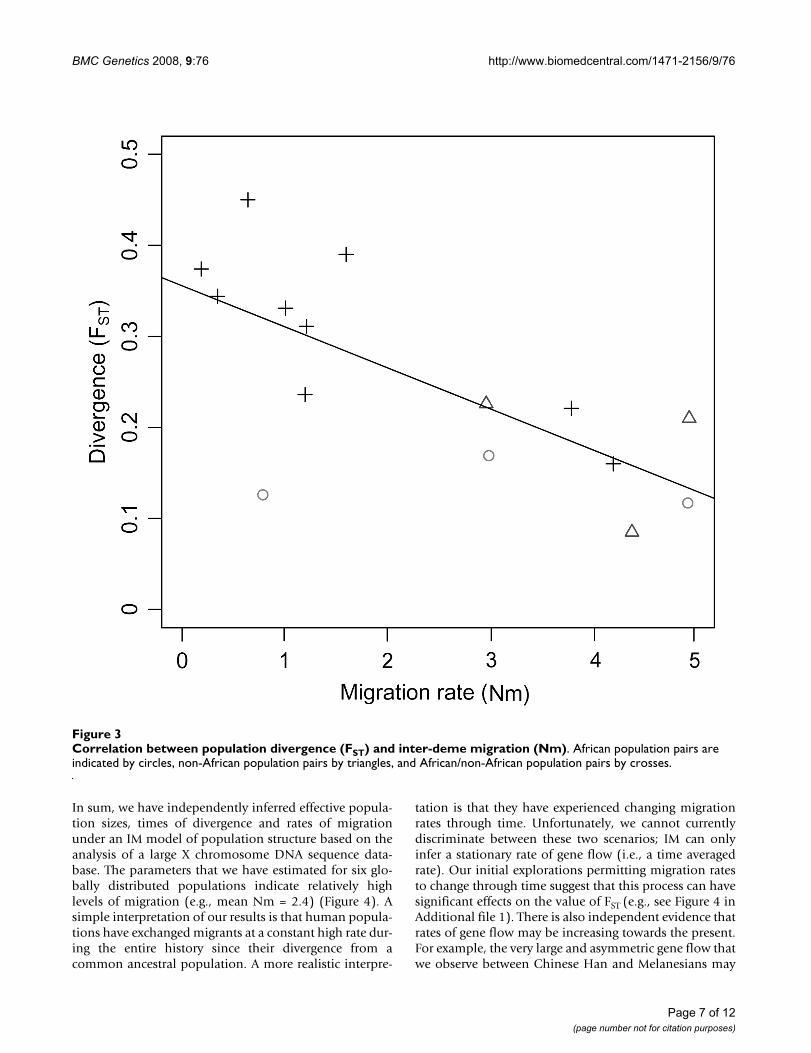
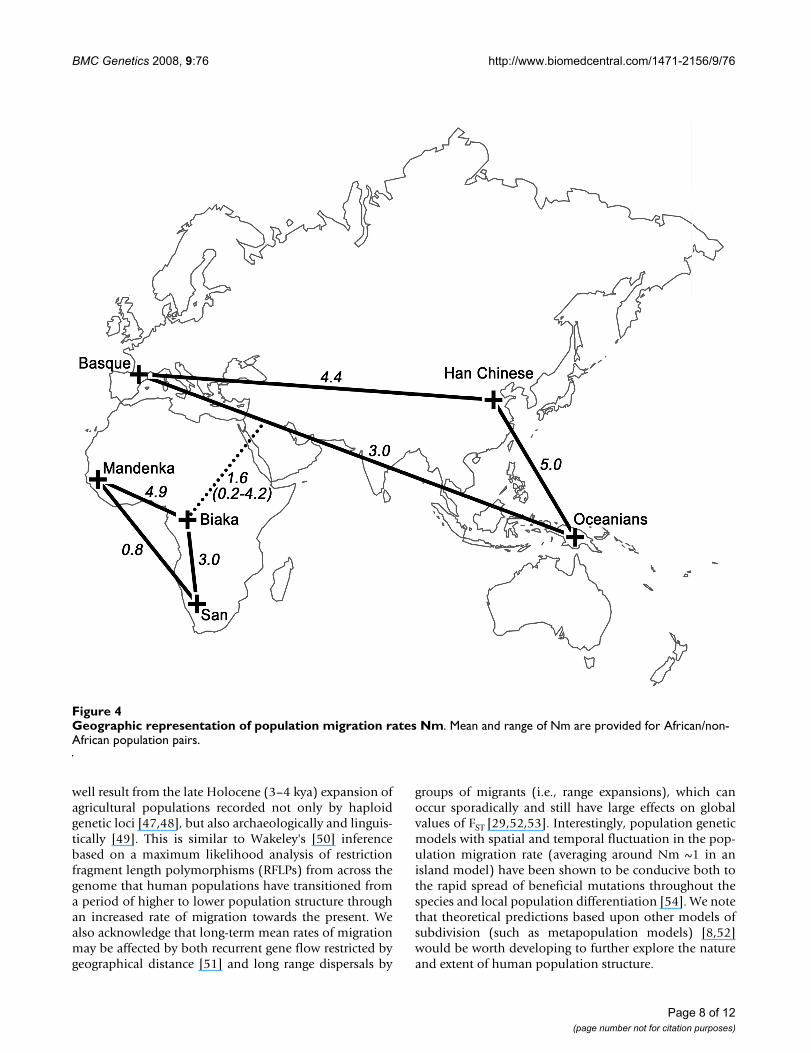
Correspondingly, estimates of the population migrationrate range from 0.2–4.9 (mean Nm = 2.4). This impliesthat 2–3 X chromosome copies, on average, movebetween human populations every generation, althoughthis stationary estimate does not explain how migrationevents are distributed through time. We infer slightlyhigher population migration rates within Africa andwithin Eurasia than between continents (Figure 3). Inter-estingly, because effective sizes and migration rates areinversely related in African and non-African populations,values of Nm are similar within Africa and Eurasia (Figure4). Furthermore, migration rates are not associated withgeographic proximity in any simple fashion. For instance,Basque and Han are located far apart geographically, butexhibit one of the highest rates of gene flow. This presum-ably reflects factors affecting historical mobility that aremore complex than simple isolation-by-distance.
Clearly, our results cannot be interpreted under either thepure splitting or island models, which assume no geneflow and no shared ancestry, respectively. In any case,under an island model, a population migration rate Nmgreater than ~0.25 would be too high to explain the valueof FST observed here (cf. Figure 2A in Additional file 1).Indeed, no further differentiation of local island popula-tions is expected when Nm > 1 [44,45]. Note, however,that the axiom whereby exchanging one gene copy pergeneration inhibits population divergence does not holdfor the IM model; populations can continue to diverge,albeit slowly, even when Nm = 3.3 (Figure 2C in Addi-tional file 1). Importantly too, FST depends on interactionsbetween a suite of demographic parameters, including N,m and t (Figure 3 in Additional file 1). These results high-light the limited power of FST to yield insights into humandemographic processes without further knowledge ofpopulation divergence times, effective sizes and migrationrates (i.e., the very parameters that we often attempt toinfer from FST). Although FST is often considered directlyproportional to divergence time, where migration isassumed to be absent and all population sizes identical[46:29–30], these assumptions do not hold for thehuman populations examined here. Thus, caution is war-ranted when interpreting FST as a simple proxy for popula-tion history [e.g., [5,46]].
Page 6 of 12(page number not for citation purposes)
BMC Genetics 2008, 9:76 http://www.biomedcentral.com/1471-2156/9/76
In sum, we have independently inferred effective popula-tion sizes, times of divergence and rates of migrationunder an IM model of population structure based on theanalysis of a large X chromosome DNA sequence data-base. The parameters that we have estimated for six glo-bally distributed populations indicate relatively highlevels of migration (e.g., mean Nm = 2.4) (Figure 4). Asimple interpretation of our results is that human popula-tions have exchanged migrants at a constant high rate dur-ing the entire history since their divergence from acommon ancestral population. A more realistic interpre-
tation is that they have experienced changing migrationrates through time. Unfortunately, we cannot currentlydiscriminate between these two scenarios; IM can onlyinfer a stationary rate of gene flow (i.e., a time averagedrate). Our initial explorations permitting migration ratesto change through time suggest that this process can havesignificant effects on the value of FST (e.g., see Figure 4 inAdditional file 1). There is also independent evidence thatrates of gene flow may be increasing towards the present.For example, the very large and asymmetric gene flow thatwe observe between Chinese Han and Melanesians may
Correlation between population divergence (FST) and inter-deme migration (Nm)Figure 3Correlation between population divergence (FST) and inter-deme migration (Nm). African population pairs are indicated by circles, non-African population pairs by triangles, and African/non-African population pairs by crosses.
Page 7 of 12(page number not for citation purposes)
BMC Genetics 2008, 9:76 http://www.biomedcentral.com/1471-2156/9/76
well result from the late Holocene (3–4 kya) expansion ofagricultural populations recorded not only by haploidgenetic loci [47,48], but also archaeologically and linguis-tically [49]. This is similar to Wakeley's [50] inferencebased on a maximum likelihood analysis of restrictionfragment length polymorphisms (RFLPs) from across thegenome that human populations have transitioned froma period of higher to lower population structure throughan increased rate of migration towards the present. Wealso acknowledge that long-term mean rates of migrationmay be affected by both recurrent gene flow restricted bygeographical distance [51] and long range dispersals by
groups of migrants (i.e., range expansions), which canoccur sporadically and still have large effects on globalvalues of FST [29,52,53]. Interestingly, population geneticmodels with spatial and temporal fluctuation in the pop-ulation migration rate (averaging around Nm ~1 in anisland model) have been shown to be conducive both tothe rapid spread of beneficial mutations throughout thespecies and local population differentiation [54]. We notethat theoretical predictions based upon other models ofsubdivision (such as metapopulation models) [8,52]would be worth developing to further explore the natureand extent of human population structure.
Geographic representation of population migration rates NmFigure 4Geographic representation of population migration rates Nm. Mean and range of Nm are provided for African/non-African population pairs.
Page 8 of 12(page number not for citation purposes)

BMC Genetics 2008, 9:76 http://www.biomedcentral.com/1471-2156/9/76
Finally, the finding of high rates of gene flow amonghuman populations has important implications for howwe interpret the distribution of SNPs associated with dis-ease [55] and the role of natural selection in shaping pat-terns of diversity [31,52,53]. For instance, recentmigration produces haplotypes with extended linkage dis-equilibrium that could be misinterpreted as recent selec-tion [56]. Gene flow can also significantly skew the sitefrequency spectrum within populations [8], and maytherefore lead to erroneous inferences regarding demogra-phy.
ConclusionWhile the maximum effective size of modern humans isestimated at ~10,000, individual populations vary sub-stantially in size. African populations tend to be larger(2,300–9,000) than non-African populations (300–3,300). We independently estimate mean rates of bidirec-tional gene flow at 4.8 × 10⁻⁴/generation, and these ratesare higher among non-African populations (1.5 × 10⁻³)than among African populations (2.7 × 10⁻⁴). Interest-ingly, because effective sizes and migration rates areinversely related in African and non-African populations,effective migration rates are similar globally (e.g., meanNm = 2.4). While significant theoretical challengesremain in disentangling the evolutionary factors thatstructure human populations, it is clear that migration canno longer be treated as a simple, equilibrium parameter –or ignored – as it often is in reconstructions of human his-tory.
MethodsGenomic dataOur database comprises 20 loci from intergenic regionson the X chromosome. Each region chosen for sequencingspans ~20 kb of primarily single-copy non-coding (i.e.,putatively non-functional) DNA in regions of medium orhigh recombination, which are at least 50 kb away andrecombinationally unlinked from the nearest gene [16].No two regions are within one megabase of each other.Within each region, there are ~4–6 kb of sequence datafrom 3 discrete subsections that span most of the distanceof each region. 10–24 X chromosomes are sampled fromeach population, which include 3 from Africa (10 Sanfrom Namibia, 16 Biaka pygmies from Central AfricanRepublic, 18 Mandenka from Senegal) and 3 from Eura-sia/Oceania (16 French Basque, 16 Han Chinese, 24 Mela-nesians) (see Wall et al. [16] for a complete description ofthe sequencing strategy).
FST estimatesFST can be calculated using several different algorithms.Here, we adopt the approach of Hudson et al. [57],defined in terms of polymorphic site heterozygosity,
which we have amended to accommodate unequal sam-ple sizes [58] and missing data.
where Hw (≡ πw) is the mean distance per polymorphic sitesampled from the same population, and Hb (≡ πb) is themean distance per polymorphic site sampled from bothpopulations. Reported values represent the mean FST at allsegregating sites across all 20 X chromosome loci.
The expected value of FST for X chromosome loci under theisland model with an infinite number of demes dependsonly on the product of the effective population size N,and the migration rate per generation m [10: 294-5]
�FST� ≈ (1 + 3 Nm)-1 (2)
FST estimates must be corrected if a finite number of demesd are intended instead [59]
The population-scaled rate of gene flow Nm can bederived by simple rearrangement of equation 3.
Correspondingly, the expected value of FST for X chromo-some loci under a divergence model depends only on thedivergence time t, in generations, scaled by the effectivepopulation size N [13]
Demographic inferenceGenetic diversity at twenty X chromosome loci is appliedto determine the most likely parameterization for a seriesof paired population isolation-with-migration models.Seven demographic parameters are inferred from thegenomic data under each two-deme IM model: effectivepopulation size of the ancestral deme (NA), effective pop-ulation sizes of the two descendent demes (N1 and N2),unidirectional migration rates between descendent popu-lations (m1 and m2), proportion of the ancestral popula-tion founding the first deme (S), and populationdivergence time (t). Populations are analyzed in all pair-wise combinations using the Markov chain Monte CarloBayesian/maximum likelihood framework implementedin the 31 July 2006 version of IM http://lifesci.rutgers.edu/~heylab/heylabsoftware.htm#IM. More com-plete descriptions of this method are available elsewhere
F 1HwHb
1 wb
ST = − = − ππ
(1)
F 1d2
d 1 23NmST ≈ +
−( )( )
⎛
⎝
⎜⎜
⎞
⎠
⎟⎟
−1
(3)
F 1
t3
2NST = − e
−(4)
Page 9 of 12(page number not for citation purposes)

BMC Genetics 2008, 9:76 http://www.biomedcentral.com/1471-2156/9/76
[14,15,41,60,61]. The IM software infers all coalescentparameters, except S, as mutation-scaled rates – θ1 = 3N1μ,θ2 = 3N2μ, θA = 3NAμ, m1 = m1/μ, m2 = m2/μ, and t = tμ –which, if mutation rates are known, can subsequently betransformed to real world values (i.e., actual populationsizes, migration rates and chronological dates). Mutationrates per year are estimated for each locus from meanHomo/Pan sequence divergence assuming a split time of 6× 10⁶ years. Per generation rates assume a mean genera-tion interval of 28 years, as estimated from cross-culturalethnographic data [62]. A 1:1 mating ratio is also assumedthroughout. Migration rates m1 and m2 are inferred in thecoalescent (i.e., backward in time), and bidirectionalmigration rates m are simply the summation of m1 andm2.
Because the IM algorithm has most power with perfectlytreelike data (an infinite sites implementation), datasetswith no evidence of recombination were extracted fromeach locus using the four-gamete approach of Hudsonand Kaplan [63]. Individuals and segregating sites aregiven equal weighting, and the largest non-recombiningblock maximizing overall information content is selectedfor each locus, a practice that minimizes any bias in theresulting dataset [64]. Analyses are run at a mean CPUspeed of 2.5 GHz on an ~100 core Condor grid at the Uni-versity of Arizona Computer Science Department. Alldatasets are initially parameterized from a single run withbounded uniform priors: θ1, θ2, θA ∈ U(0, 40), m1, m2 ∈U(0, 20), S ∈ U(0, 1) and t ∈ U(0, 3). Ranges are raised orlowered in subsequent runs to incorporate complete mar-ginal posterior probability densities. Once these boundsare established, a minimum of four replicate jobs each of>5 chains are run for a minimum of 107 steps. Chain mix-ing by Metropolis-Hasting coupling, long run times andmultiple independent runs allow us to identify conver-gence on each parameter's underlying stationary distribu-tion.
Because we observe little variation among multiple inde-pendent runs (e.g., Figure 1 in Additional file 1), marginalposterior probability densities for a given parameter arecombined and analyzed as a single probability distribu-tion. Maximum probability estimates and 95% confi-dence intervals are reported as modes and {0.025, 0.975}quantiles of posterior probability densities, respectively.We estimate all seven parameters of the model (Tables 1–5 in Additional file 1) for all population pairs. Unin-formative posterior distributions are sometimes encoun-tered for some population pairs; in particular, theancestral population split time parameter t often provesdifficult to infer (Table 5 in Additional file 1). However,the seven demographic parameters are inferred as mar-ginal densities, and therefore uncertainty in one parame-ter has no impact on the remaining parameters. Parameter
values are treated as unknown unless we observe clearmaximum likelihood peaks that are replicated across mul-tiple independent IM jobs.
Coalescent simulations for demographic parameter validationThe nonlinear relationship between gene flow, divergencetime and FST under the isolation-with-migration model isexplored using coalescent simulation with the softwarems [65]. An IM model conditioned on mean values for theseven demographic parameters, as inferred from theempirical dataset (Tables 1–5 in Additional file 1), isimplemented for each population pair. A suite of sum-mary statistics is explored under these models: θW and θπ,which are unbiased estimators of the population muta-tion rate; Tajima's D, which summarizes the populationsite frequency spectrum; and FST, which summarizes thejoint site frequency spectrum. Observed values of thesefour summary statistics, calculated from the empiricaldataset, are compared to the summary statistic distribu-tions returned by coalescent simulation. A Bonferroni cor-rection holding the experiment-wise type-I error rateconstant at α = 0.05 is applied to account for the use ofmultiple per-population tests. A Mantel test is used todetermine the correlation for FST, a between-population(i.e., matrix) test.
Authors' contributionsMPC participated in the design of the study, contributedto data collection, ran analyses, and wrote the manuscript.AEW contributed to data collection. JDW advised on dataanalysis, and provided comments on the manuscript.MFH participated in the design of the study, advised ondata analysis, and helped revise the manuscript. Allauthors read and approved the final manuscript.
Additional material
AcknowledgementsWe are grateful to J Hey (Rutgers University) and F Mendez (University of Arizona) for helpful discussion; and S Kobourov for access to the dis-persed-computing cluster in the Department of Computer Science (Uni-versity of Arizona). The National Science Foundation helped fund genetic data collection and analysis via the grant BCS-0423670 to M.F.H. and J.D.W, as well as providing computational support via the San Diego Supercomput-ing Center under TeraGrid grant DBS060002T to M.P.C.
Additional file 1Supplemental Materials for "Intergenic DNA sequences from the human X chromosome reveal high rates of global gene flow". This doc-ument contains tables and figures showing additional results referenced in the main text.Click here for file[http://www.biomedcentral.com/content/supplementary/1471-2156-9-76-S1.pdf]
Page 10 of 12(page number not for citation purposes)

BMC Genetics 2008, 9:76 http://www.biomedcentral.com/1471-2156/9/76
References1. Garrigan D, Hammer MF: Reconstructing human origins in the
genomic era. Nat Rev Genet 2006, 7:669-680.2. Frisse L, Hudson RR, Bartoszewicz A, Wall JD, Donfack J, Di Rienzo
A: Gene conversion and different population histories mayexplain the contrast between polymorphism and linkage dis-equilibrium levels. Am J Hum Genet 2001, 69:831-843.
3. Keinan A, Mullikin JC, Patterson N, Reich D: Measurement of thehuman allele frequency spectrum demonstrates greatergenetic drift in East Asians than in Europeans. Nat Genet 2007,39:1251-1255.
4. Prugnolle F, Manica A, Balloux F: Geography predicts neutralgenetic diversity of human populations. Curr Biol 2005,15:R159-160.
5. Ramachandran S, Deshpande O, Roseman CC, Rosenberg NA, Feld-man MW, Cavalli-Sforza LL: Support from the relationship ofgenetic and geographic distance in human populations for aserial founder effect originating in Africa. Proc Natl Acad Sci USA2005, 102:15942-15947.
6. Ray N, Currat M, Excoffier L: Intra-deme molecular diversity inspatially expanding populations. Mol Biol Evol 2003, 20:76-86.
7. Voight BF, Adams AM, Frisse LA, Qian Y, Hudson RR, Di Rienzo A:Interrogating multiple aspects of variation in a full rese-quencing data set to infer human population size changes.Proc Natl Acad Sci USA 2005, 102:18508-18513.
8. Wakeley J, Aliacar N: Gene genealogies in a metapopulation.Genetics 2001, 159:893-905.
9. Wright S: Breeding structure of populations in relation to spe-ciation. Amer Nat 1940, 74:232-248.
10. Wright S: Evolution and the Genetics of Populations. In TheTheory of Gene Frequencies Volume 2. Chicago: University of ChicagoPress; 1969.
11. Akey JM, Zhang G, Zhang K, Jin L, Shriver MD: Interrogating ahigh-density SNP map for signatures of natural selection.Genome Res 2002, 12:1805-1814.
12. International HapMap Consortium: A haplotype map of thehuman genome. Nature 2005, 437:1299-1320.
13. Nei M: Molecular Evolutionary Genetics. New York: ColumbiaUniversity Press; 1987.
14. Nielsen R, Wakeley J: Distinguishing migration from isolation:A Markov chain Monte Carlo approach. Genetics 2001,158:885-896.
15. Hey J, Nielsen R: Multilocus methods for estimating populationsizes, migration rates and divergence time, with applicationsto the divergence of Drosophila pseudoobscura and D. persimi-lis. Genetics 2004, 167:747-760.
16. Wall JD, Cox MP, Mendez FL, Woerner A, Severson T, Hammer MF:A novel DNA sequence database for analyzing human demo-graphic history. Genome Res 2008, 18:1354-1361.
17. Jakobsson M, Scholz SW, Scheet P, Gibbs JR, VanLiere JM, Fung H-C,Szpiech ZA, Degnan JH, Wang K, Guerreiro R, et al.: Genotype,haplotype and copy-number variation in worldwide humanpopulations. Nature 2008, 451:998-1003.
18. Li JZ, Absher DM, Tang H, Southwick AM, Casto AM, RamachandranS, Cann HM, Barsh GS, Feldman MW, Cavalli-Sforza LL, et al.: World-wide human relationships inferred from genome-wide pat-terns of variation. Science 2008, 319:1100-1104.
19. Clark AG, Hubisz MJ, Bustamante CD, Williamson SH, Nielsen R:Ascertainment bias in studies of human genome-wide poly-morphism. Genome Res 2005, 15:1496-1502.
20. Weir BS, Cardon LR, Anderson AD, Nielsen R, Hill WG: Measuresof human population structure show heterogeneity amonggenomic regions. Genome Res 2005, 15:1468-1476.
21. Liu H, Prugnolle F, Manica A, Balloux F: A geographically explicitgenetic model of worldwide human-settlement history. Am JHum Genet 2006, 79:230-237.
22. Ingman M, Kaessmann H, Pääbo S, Gyllensten U: Mitochondrialgenome variation and the origin of modern humans. Nature2000, 408:708-713.
23. Karafet TM, Mendez FL, Meilerman MB, Underhill PA, Zegura SL,Hammer MF: New binary polymorphisms reshape andincrease resolution of the human Y chromosomal haplo-group tree. Genome Res 2008, 18:830-838.
24. Wilkins JF, Marlowe FW: Sex-biased migration in humans: whatshould we expect from genetic data? Bioessays 2006,28:290-300.
25. Whitlock MC, McCauley DE: Indirect measures of gene flow andmigration: FST ≠ 1/(4Nm + 1). Heredity 1999, 82:117-125.
26. Eller E: Population substructure and isolation by distance inthree continental regions. Am J Phys Anthropol 1999, 108:147-159.
27. Fix AG: Migration and Colonization in Human Microevolu-tion. Cambridge: Cambridge University Press; 1999.
28. Jorde LB: Human genetic distance studies: Present status andfuture prospects. Ann Rev Anthropol 1985, 14:343-373.
29. Relethford JH: Genetics and modern human origins. EvolAnthropol 1995, 4:53-63.
30. Santos EJM, Epplen JT, Epplen C: Extensive gene flow in humanpopulations as revealed by protein and microsatellite DNAmarkers. Hum Hered 1997, 47:165-172.
31. Wijsman EM, Cavalli-Sforza LL: Migration and genetic populationstructure with special reference to humans. Ann Rev Ecol Syst1984, 15:279-301.
32. Fagundes NJR, Ray N, Beaumont M, Neuenschwander S, Salzano FM,Bonatto SL, Excoffier L: Statistical evaluation of alternativemodels of human evolution. Proc Natl Acad Sci USA 2007,104:17614-17619.
33. Erlich HA, Bergstrom TF, Stoneking M, Gyllensten U: HLAsequence polymorphism and the origin of humans. Science1996, 274:1552-1554.
34. Haigh J, Maynard Smith J: Population size and protein variationin man. Genet Res 1972, 19(1):73-89.
35. Lahr MM, Foley RA: Towards a theory of modern human ori-gins: Geography, demography and diversity in recent humanevolution. Am J Phys Anthropol 1998:137-176.
36. Sherry ST, Harpending HC, Batzer MA, Stoneking M: Alu evolutionin human populations: Using the coalescent to estimateeffective population size. Genetics 1997, 147:1977-1982.
37. Takahata N: Allelic genealogy and human evolution. Mol BiolEvol 1993, 10:2-22.
38. Garrigan D, Kingan SB, Metni Pilkington M, Wilder JA, Cox MP,Soodyall H, Strassmann B, Destro-Bisol G, de Knijff P, Novelletto A,et al.: Inferring human population sizes, divergence times andrates of gene flow from mitochondrial, X and Y chromo-some resequencing data. Genetics 2007, 177:2195-2207.
39. Bataillon T, Mailund T, Thorlacius S, Steingrimsson E, Rafnar T, Hall-dorsson MM, Calian V, Schierup MH: The effective size of the Ice-landic population and the prospects for LD mapping:Inference from unphased microsatellite markers. Eur J HumGenet 2006, 14:1044-1053.
40. Harris EE, Hey J: X chromosome evidence for ancient humanhistories. Proc Natl Acad Sci USA 1999, 96:3320-3324.
41. Hey J: On the number of New World founders: A populationgenetic portrait of the peopling of the Americas. PLoS Biol2005, 3:e193.
42. Tenesa A, Navarro P, Hayes BJ, Duffy DL, Clarke GM, Goddard ME,Visscher PM: Recent human effective population size esti-mated from linkage disequilibrium. Genome Res 2007,17:520-526.
43. Harpending H, Rogers A: Genetic perspectives on human ori-gins and differentiation. Annu Rev Genomics Hum Genet 2000,1:361-385.
44. Crow J, Kimura M: An Introduction to Population GeneticsTheory. Minneapolis, MN: Burgess Publishing Company; 1970.
45. Spieth PT: Gene flow and genetic differentiation. Genetics 1974,78:961-965.
46. Cavalli-Sforza LL, Menozzi P, Piazza A: The History and Geogra-phy of Human Genes. Princeton: Princeton University Press;1994.
47. Cox MP: Indonesian mitochondrial DNA and its opposition toa Pleistocene era origin of proto-Polynesians in Island South-east Asia. Hum Biol 2005, 77:179-188.
48. Cox MP, Lahr MM: Y-Chromosome diversity is inversely asso-ciated with language affiliation in paired Austronesian- andPapuan-speaking communities from Solomon Islands. Am JHum Biol 2006, 18:35-50.
49. Bellwood P: The First Farmers: The Origins of AgriculturalSocieties. Oxford: Blackwell Publishing; 2005.
50. Wakeley J: Nonequilibrium migration in human history. Genet-ics 1999, 153:1863-1871.
51. Wright S: Isolation by distance. Genetics 1943, 28:114-138.52. Slatkin M: Gene flow in natural populations. Ann Rev Ecol Syst
1985, 16:393-430.
Page 11 of 12(page number not for citation purposes)
http://www.ncbi.nlm.nih.gov/entrez/query.fcgi?cmd=Retrieve&db=PubMed&dopt=Abstract&list_uids=9988378
http://www.ncbi.nlm.nih.gov/entrez/query.fcgi?cmd=Retrieve&db=PubMed&dopt=Abstract&list_uids=9988378
http://www.ncbi.nlm.nih.gov/entrez/query.fcgi?cmd=Retrieve&db=PubMed&dopt=Abstract&list_uids=9156328
http://www.ncbi.nlm.nih.gov/entrez/query.fcgi?cmd=Retrieve&db=PubMed&dopt=Abstract&list_uids=9156328
http://www.ncbi.nlm.nih.gov/entrez/query.fcgi?cmd=Retrieve&db=PubMed&dopt=Abstract&list_uids=9156328
http://www.ncbi.nlm.nih.gov/entrez/query.fcgi?cmd=Retrieve&db=PubMed&dopt=Abstract&list_uids=8966622
http://www.ncbi.nlm.nih.gov/entrez/query.fcgi?cmd=Retrieve&db=PubMed&dopt=Abstract&list_uids=8966622
http://www.ncbi.nlm.nih.gov/entrez/query.fcgi?cmd=Retrieve&db=PubMed&dopt=Abstract&list_uids=5024715
http://www.ncbi.nlm.nih.gov/entrez/query.fcgi?cmd=Retrieve&db=PubMed&dopt=Abstract&list_uids=5024715
http://www.ncbi.nlm.nih.gov/entrez/query.fcgi?cmd=Retrieve&db=PubMed&dopt=Abstract&list_uids=9881525
http://www.ncbi.nlm.nih.gov/entrez/query.fcgi?cmd=Retrieve&db=PubMed&dopt=Abstract&list_uids=9881525
http://www.ncbi.nlm.nih.gov/entrez/query.fcgi?cmd=Retrieve&db=PubMed&dopt=Abstract&list_uids=9881525
http://www.ncbi.nlm.nih.gov/entrez/query.fcgi?cmd=Retrieve&db=PubMed&dopt=Abstract&list_uids=9409852
http://www.ncbi.nlm.nih.gov/entrez/query.fcgi?cmd=Retrieve&db=PubMed&dopt=Abstract&list_uids=9409852
http://www.ncbi.nlm.nih.gov/entrez/query.fcgi?cmd=Retrieve&db=PubMed&dopt=Abstract&list_uids=9409852
http://www.ncbi.nlm.nih.gov/entrez/query.fcgi?cmd=Retrieve&db=PubMed&dopt=Abstract&list_uids=8450756

BMC Genetics 2008, 9:76 http://www.biomedcentral.com/1471-2156/9/76
Publish with BioMed Central and every scientist can read your work free of charge
"BioMed Central will be the most significant development for disseminating the results of biomedical research in our lifetime."
Sir Paul Nurse, Cancer Research UK
Your research papers will be:
available free of charge to the entire biomedical community
peer reviewed and published immediately upon acceptance
cited in PubMed and archived on PubMed Central
yours — you keep the copyright
Submit your manuscript here:http://www.biomedcentral.com/info/publishing_adv.asp
BioMedcentral
53. Templeton AR: Human races: A genetic and evolutionary per-spective. Am Anthropologist 1999, 100:632-650.
54. Barton NH, Rouhani S: Adaptation and the 'shifting balance'.Genet Res Camb 1993, 61:57-74.
55. Reich DE, Cargill M, Bolk S, Ireland J, Sabeti PC, Richter DJ, Lavery T,Kouyoumjian R, Farhadian SF, Ward R, et al.: Linkage disequilib-rium in the human genome. Nature 2001, 411:199-204.
56. Hawks J, Wang ET, Cochran GM, Harpending HC, Moyzis RK:Recent acceleration of human adaptive evolution. Proc NatlAcad Sci USA 2008, 104:20753-20758.
57. Hudson RR, Slatkin M, Maddison WP: Estimation of levels of geneflow from DNA sequence data. Genetics 1992, 132:583-589.
58. Plagnol V, Wall JD: Possible ancestral structure in human pop-ulations. PLoS Genet 2006, 2:e105.
59. Slatkin M, Voelm L: FST in a hierarchical island model. Genetics1991, 127:627-629.
60. Hey J, Won YJ, Sivasundar A, Nielsen R, Markert JA: Using nuclearhaplotypes with microsatellites to study gene flow betweenrecently separated Cichlid species. Mol Ecol 2004, 13:909-919.
61. Won YJ, Hey J: Divergence population genetics of chimpan-zees. Mol Biol Evol 2005, 22:297-307.
62. Fenner JN: Cross-cultural estimation of the human generationinterval for use in genetics-based population divergencestudies. Am J Phys Anthropol 2005, 128:415-423.
63. Hudson RR, Kaplan NL: Statistical properties of the number ofrecombination events in the history of a sample of DNAsequences. Genetics 1985, 111:147-164.
64. Woerner AE, Cox MP, Hammer MF: Recombination-filteredgenomic datasets by information maximization. Bioinformatics2007, 23:1851-1853.
65. Hudson RR: Generating samples under a Wright-Fisher neu-tral model of genetic variation. Bioinformatics 2002, 18:337-338.
Page 12 of 12(page number not for citation purposes)
http://www.ncbi.nlm.nih.gov/entrez/query.fcgi?cmd=Retrieve&db=PubMed&dopt=Abstract&list_uids=1427045
http://www.ncbi.nlm.nih.gov/entrez/query.fcgi?cmd=Retrieve&db=PubMed&dopt=Abstract&list_uids=1427045
http://www.ncbi.nlm.nih.gov/entrez/query.fcgi?cmd=Retrieve&db=PubMed&dopt=Abstract&list_uids=2016058
http://www.ncbi.nlm.nih.gov/entrez/query.fcgi?cmd=Retrieve&db=PubMed&dopt=Abstract&list_uids=4029609
http://www.ncbi.nlm.nih.gov/entrez/query.fcgi?cmd=Retrieve&db=PubMed&dopt=Abstract&list_uids=4029609