
H3K27me3 forms BLOCs over silent genes and intergenic regions and specifies a histone banding...
14
10.1101/gr.080861.108 Access the most recent version at doi: 2009 19: 221-233 originally published online December 1, 2008 Genome Res. Florian M. Pauler, Mathew A. Sloane, Ru Huang, et al. chromosome and specifies a histone banding pattern on a mouse autosomal H3K27me3 forms BLOCs over silent genes and intergenic regions Material Supplemental http://genome.cshlp.org/content/suppl/2009/01/06/gr.080861.108.DC1.html References http://genome.cshlp.org/content/19/2/221.full.html#related-urls Article cited in: http://genome.cshlp.org/content/19/2/221.full.html#ref-list-1 This article cites 39 articles, 16 of which can be accessed free at: License Commons Creative . http://creativecommons.org/licenses/by-nc/3.0/ described at as a Creative Commons License (Attribution-NonCommercial 3.0 Unported License), ). After six months, it is available under http://genome.cshlp.org/site/misc/terms.xhtml for the first six months after the full-issue publication date (see This article is distributed exclusively by Cold Spring Harbor Laboratory Press service Email alerting click here top right corner of the article or Receive free email alerts when new articles cite this article - sign up in the box at the http://genome.cshlp.org/subscriptions go to: Genome Research To subscribe to © 2009, Published by Cold Spring Harbor Laboratory Press Cold Spring Harbor Laboratory Press on December 20, 2012 - Published by genome.cshlp.org Downloaded from
-
Upload
independent -
Category
Documents
-
view
2 -
download
0
Transcript of H3K27me3 forms BLOCs over silent genes and intergenic regions and specifies a histone banding...

10.1101/gr.080861.108Access the most recent version at doi: 2009 19: 221-233 originally published online December 1, 2008Genome Res.
Florian M. Pauler, Mathew A. Sloane, Ru Huang, et al. chromosomeand specifies a histone banding pattern on a mouse autosomal H3K27me3 forms BLOCs over silent genes and intergenic regions
MaterialSupplemental http://genome.cshlp.org/content/suppl/2009/01/06/gr.080861.108.DC1.html
References
http://genome.cshlp.org/content/19/2/221.full.html#related-urlsArticle cited in:
http://genome.cshlp.org/content/19/2/221.full.html#ref-list-1This article cites 39 articles, 16 of which can be accessed free at:
LicenseCommons
Creative
.http://creativecommons.org/licenses/by-nc/3.0/described atasa Creative Commons License (Attribution-NonCommercial 3.0 Unported License),
). After six months, it is available underhttp://genome.cshlp.org/site/misc/terms.xhtmlfor the first six months after the full-issue publication date (seeThis article is distributed exclusively by Cold Spring Harbor Laboratory Press
serviceEmail alerting
click heretop right corner of the article orReceive free email alerts when new articles cite this article - sign up in the box at the
http://genome.cshlp.org/subscriptions go to: Genome ResearchTo subscribe to
© 2009, Published by Cold Spring Harbor Laboratory Press
Cold Spring Harbor Laboratory Press on December 20, 2012 - Published by genome.cshlp.orgDownloaded from

Letter
H3K27me3 forms BLOCs over silent genes andintergenic regions and specifies a histone bandingpattern on a mouse autosomal chromosomeFlorian M. Pauler,1,3 Mathew A. Sloane,1,3,4 Ru Huang,1 Kakkad Regha,1
Martha V. Koerner,1 Ido Tamir,2 Andreas Sommer,2 Andras Aszodi,2
Thomas Jenuwein,2 and Denise P. Barlow1,5
1CeMM Research Center for Molecular Medicine, Austrian Academy of Sciences, A1030 Vienna, Austria; 2Research Institute of
Molecular Pathology, A1030, Vienna, Austria
In mammals, genome-wide chromatin maps and immunofluorescence studies show that broad domains of repressivehistone modifications are present on pericentromeric and telomeric repeats and on the inactive X chromosome. However,only a few autosomal loci such as silent Hox gene clusters have been shown to lie in broad domains of repressive histonemodifications. Here we present a ChIP-chip analysis of the repressive H3K27me3 histone modification along chr 17 inmouse embryonic fibroblast cells using an algorithm named broad local enrichments (BLOCs), which allows the identi-fication of broad regions of histone modifications. Our results, confirmed by BLOC analysis of a whole genome ChIP-seqdata set, show that the majority of H3K27me3 modifications form BLOCs rather than focal peaks. H3K27me3 BLOCsmodify silent genes of all types, plus flanking intergenic regions and their distribution indicates a negative correlationbetween H3K27me3 and transcription. However, we also found that some nontranscribed gene-poor regions lackH3K27me3. We therefore performed a low-resolution analysis of whole mouse chr 17, which revealed that H3K27me3 isenriched in mega-base-pair-sized domains that are also enriched for genes, short interspersed elements (SINEs) and activehistone modifications. These genic H3K27me3 domains alternate with similar-sized gene-poor domains. These are de-ficient in active histone modifications, as well as H3K27me3, but are enriched for long interspersed elements (LINEs) andlong-terminal repeat (LTR) transposons and H3K9me3 and H4K20me3. Thus, an autosome can be seen to contain al-ternating chromatin bands that predominantly separate genes from one retrotransposon class, which could offer uniquedomains for the specific regulation of genes or the silencing of autonomous retrotransposons.
[Supplemental material is available online at www.genome.org. The microarray and sequence data from this study havebeen submitted to Gene Expression Omnibus (GEO) (http://www.ncbi.nlm.nih.gov/geo/) under accession no. GSE11389.]
Post-translational modifications on histone tails either reflect or
directly influence the transcriptional status of genes and are clas-
sified as active, when they correlate with expressed genes, or, as
repressive, when they correlate with silent genes. Chromatin im-
munoprecipitation (ChIP) using histone modification antibodies
and tiling array analysis (ChIP-chip) or new generation sequenc-
ing technology (ChIP-seq), has been used to profile histone
modifications of mouse and human chromosomes (Bernstein et al.
2007; Schones and Zhao 2008). Together these analyses show that
active histone modifications such as H3K4 methylation and his-
tone acetylation are enriched on expressed genes over short focal
regions at promoters and nonpromoter putative gene-regulatory
regions (Heintzman et al. 2007). However, these active marks can
also be found at silent gene promoters in undifferentiated em-
bryonic stem (ES) cells and in T cells, and, active transcription has
been found to correlate with additional modifications such as
H3K36 tri-methylation (me3), that spreads through the tran-
scribed gene body (Bernstein et al. 2006b; Roh et al. 2006; Barski
et al. 2007). Repressive histone modifications, such as H3K9me3,
H4K20me3, and H3K27me3 have been associated in many cells
types with gene silencing or heterochromatin formation (Martens
et al. 2005; Boyer et al. 2006; Regha et al. 2007; Wutz 2007). In
contrast to active histone modifications that are restricted to gene
regulatory elements or the transcribed gene body, repressive his-
tone modifications have also been shown to cover much larger
regions, such as silent gene clusters, pericentromeric and telomeric
repeats or mega-base-pair domains on the inactive X chromosome
(Chadwick and Willard 2004; Schotta et al. 2004; Squazzo et al. 2006).
Repressive H3K27me3 modifications have attracted particu-
lar attention as they have been shown to repress developmentally
important genes and are thought to maintain stem cell pluri-
potency (Boyer et al. 2006). However, while some studies have
shown that Polycomb repressor complex 2 (PRC2) that catalyzes
H3K27me3, is required for ES cell differentiation (Pasini et al.
2007), other studies have shown that ES cells retain pluripotency
in the absence of functional PRC2 (Chamberlain et al. 2008). A
role for H3K27me3 in repressing developmentally important
genes is, however, supported by genome-wide mapping in com-
bination with functional studies. Thus, H3K27me3 or PRC2 have
been identified on key ES cell developmental regulatory genes, on
genes showing lineage-specific activation and on highly con-
served noncoding elements (Azuara et al. 2006; Bernstein et al.
2006a; Bracken et al. 2006; Lee et al. 2006; Squazzo et al. 2006).
3These authors contributed equally to this work.4Present address: CeMM, c/o AKH, Leitstelle 5H.J2.09, WahringerGurtel 18-20, A1090 Vienna, Austria.5Corresponding author.E-mail [email protected]; fax 43 1 4277 9546.Article published online before print. Article and publication date are at http://www.genome.org/cgi/doi/10.1101/gr.080861.108.
19:221–233 �2009 by Cold Spring Harbor Laboratory Press; ISSN 1088-9051/09; www.genome.org Genome Research 221www.genome.org
Cold Spring Harbor Laboratory Press on December 20, 2012 - Published by genome.cshlp.orgDownloaded from

These studies focused on gene promoters or genomic regions
containing key developmental genes and demonstrated that
H3K27me3 mainly forms focal peaks of enrichment on CG-rich
silent gene promoters. However, in some regions notably the four
mammalian Hox gene clusters, both PRC2 and H3K27me3 covered
broad domains from 10 kb up to 140 kb, which spanned entire
genes or gene clusters (Ringrose 2007). Four studies have also
mapped H3K27me3 modifications across the whole mouse or hu-
man genome (Barski et al. 2007; Mikkelsen et al. 2007; Pan et al.
2007; Zhao et al. 2007). These studies came to generally similar
conclusions: that H3K27me3 largely formed focal modifications at
silent gene promoters with a few exceptions showing modifications
of broad domains containing gene clusters. In contrast, genome-
wide profiles of the Drosophila genome show that H3K27me3 covers
large genomic domains containing silent genes that included genic
and intergenic regions (Schwartz et al. 2006; Beisel et al. 2007).
Mammalian chromosomes are known to be longitudinally
organized in a manner that can be visualized as a banding pattern in
stained metaphase chromosomes, which shows that dark Giemsa
(or G-bands) alternate with light reverse-Giemsa (or R-bands), along
the chromosome length (Craig and Bickmore 1993). Cytological
studies based on DNA probe hybridization have shown that genes
and repeats are differently distributed between dark and light
bands. Dark bands are enriched for au-
tonomous long interspersed elements
(LINEs) retrotransposons, while light
bands are enriched for genes and non-
autonomous short interspersed elements
(SINEs) retrotransposons (Boyle et al.
1990). These banding patterns are sug-
gested to reflect differences in chromatin
structure with dark G-bands containing
more condensed late-replicating chroma-
tin. However, a detailed comparison of
chromatin composition between dark and
light bands has not yet been made.
Here we used ChIP-chip to profile
active and repressive histone mod-
ifications on mouse chr 17 in a differenti-
ated cell type, to examine the relationship
between histone modifications, silent and
expressed genes and interspersed repeats,
along the chromosomal length. Our
results using an algorithm that identified
broad regions of histone modifications
named broad local enrichments (BLOCs),
were confirmed by unsupervised seg-
mentation of continuous genomic data by
hidden Markov models (Day et al. 2007)
and by ChIP-seq analysis, and show that
while active, H3K4me and acetylation
modifications form peaks—H3K27me3
forms BLOCs with an average size of 43 kb
that overlap silent genes and intergenic
regions. Furthermore, we show that
H3K27me3 is not randomly distributed
along the chromosome length instead it is
enriched in regions of high gene and SINE
density and depleted in regions of high
LINE/long-terminal repeat (LTR) and low
gene density. We also show that regions of
high LINE/LTR density are depleted of
active histone modifications, but are enriched for repressive
H3K9me3 and H4K20me3 histone modifications. Together this
shows that specific enriched histone modifications distinguish
gene-poor/LINE–LTR-rich chromosomal domains from gene-rich/
SINE-rich domains, which have previously been shown to correlate,
respectively, with dark and light Giemsa bands in metaphase
chromosomes. These two types of chromosome histone domains
may provide unique compartments for the specific regulation of
gene expression or the silencing of autonomous retrotransposons.
Results
Active histone modifications form peaks, but H3K27me3forms BLOCs
The distribution of active histone modifications H3K4me2,
H3K4me3 and H3K9Ac and the repressive H3K27me3 modifica-
tion were mapped across nonrepeat regions of mouse chr 17 in
two independent mouse embryonic fibroblast (MEF) cell lines
MEFB1 and MEFF (Regha et al. 2007; Supplemental Table 1) using
a custom chr 17 oligonucleotide NimbleGen tiling array chip
described in Methods (Fig. 1). Focal sites of enrichment (peaks)
were identified by ChIPOTle (Buck et al. 2005) using 1.5 kb sliding
Figure 1. H3K27me3 forms BLOCs covering silent genes and intergenic regions. A screen shot fromthe UCSC genome browser showing the distribution of histone modifications across a 650 kb region ofmouse chr 17 (UCSC Mouse [mm6], March 2005) in mouse embryo fibroblasts (MEFs). Profiles forthree active histone modifications (H3K4me3, H3K4me2, and H3K9Ac) and the repressive H3K27me3are displayed. Active histone modifications form peaks detected by ChIPOTle (Buck et al. 2005) (shortblack bars), while H3K27me3 spreads over large regions (orange bars) called BLOCs (broad localenrichments) that are also detected as dense clusters of ChIPOTle peaks. Expression was determined byhybridizing polyA RNA to the tiling array (RNA chip track). Black and gray bars above the RNA chip trackrepresent, respectively, expressed and silent genes (Supplemental Fig. 4). Positions of genes are shownby Ensembl predictions. Y-axis: log2 ChIP/input ratio or cDNA/input. X-axis: 50 bp oligonucleotidesfrom repeat-masked sequence included on the NimbleGen custom mouse chr 17 tiling array.
222 Genome Researchwww.genome.org
Pauler et al.
Cold Spring Harbor Laboratory Press on December 20, 2012 - Published by genome.cshlp.orgDownloaded from

windows and peaks within 0.5 kb were fused into one peak.
The number of active histone modification peaks was similar
in both MEF cell lines (data not shown). Combining the data
from both the MEFF and the MEFB1 cell line (Fig. 2A), the most
abundant active histone modification was H3K4me2 (758 peaks),
followed by H3K9Ac (425 peaks) and H3K4me3 (275 peaks).
H3K27me3 was initially analyzed using ChIPOTle and 476 var-
iably sized peaks of H3K27me3 were identified with an aver-
age width of 2.2 kb (61.5 kb). However, upon visual inspection
it was evident that H3K27me3 peaks were contained in broadly
enriched large genomic regions (Fig. 1). The ChIPOTle program
is designed to identify peaks and it detected irregular enrichments
and depletions within these broadly enriched regions as peaks.
We therefore developed a new algorithm (BLOCs) to identify
broad regions of H3K27me3 enrichment that identified 257 and
344 H3K27me3 BLOCs along chr 17 in MEFB1 and MEFF, re-
spectively. 91% of ChIPOTle identified H3K27me3 peaks lie
within BLOCs.
All three active histone modifications formed typical peak
shapes with an average width of 2.4–2.9 kb, while H3K27me3
BLOCs had an average size of 43 kb with a high variation (Fig. 2A).
22 H3K27me3 BLOCs exceeded 100 kb and the maximum BLOC
was 337 kb. Peaks of active histone modifications covered only
a small portion of the total chromosome (2%–4%), while
H3K27me3 BLOCs covered 11% of chr 17 (Fig. 2B). Active histone
modification peaks were more often on genes with a stronger bias
toward promoters than intergenic regions, most notable for
H3K4me3 and H3K9Ac (Fig. 2C). H3K4me3 had the strongest as-
sociation with genes, followed by H3K9Ac and H3K4me2. In
contrast, H3K27me3 BLOCs (as well as H3K27me3 ChIPOTle
peaks) did not specifically mark promoters, but were more equally
distributed over genes and intergenic regions (Fig. 2C).
Silent and expressed genes cluster close to H3K27me3 BLOCs
Visual inspection of H3K27me3 BLOCs across chr 17 indicated
that although they contain silent genes they are often closely
flanked by expressed genes (Fig. 1) Supplemental Figures 1–3 show
different screen shots showing respectively that H3K27me3 neg-
atively correlates with transcription, that H3K27me3 BLOCs mark
intergenic regions bounded on both sides by a transcribed region
lacking H3K27me3 and last, that a H3K27me3 BLOC extends over
a silent gene and intergenic region up to the next expressed gene.
We therefore determined how H3K27me3 BLOCs and active
histone peaks are spatially distributed across whole chr 17 in re-
lation to expressed and silent genes. Gene expression status was
determined by cDNA hybridization to the same tiling array used
for ChIP-chip (see Methods). An RNA chip analysis was performed
independently on MEFB1 and MEFF and both cell lines gave
similar results (Supplemental Fig. 4; data not shown). This analysis
Figure 2. Overview of active and repressive marks on mouse chr 17 inMEFs. The analysis of modifications forming peaks (H3K4me2, H3K4me3,and H3K9Ac) was based on the sum of all chr 17 regions with a probedensity of at least eight oligonucleotides per 1500 bp. The analysis ofmodifications forming BLOCs (H3K27me3) was based on the wholemouse chr 17 tiling array. Data from two independent MEF cell lines(MEFB1 and MEFF) were merged for all analyses (Supplemental Table 1).(A) Chromosome-wide analysis showing the average width of genomicregions enriched by four histone modifications on chr 17, as analyzed byChIPOTle (all modifications) or the BLOCs algorithm (H3K27me3). Onlyregions found to be enriched in all technical and biological replicates(Supplemental Table 1) were used in this analysis. (B) The percentage ofchr 17 covered by four histone modifications analyzed by ChIPOTle peaks(all modifications) or the BLOCs algorithm (H3K27me3). (C) The per-centage of ChIPOTle peaks (all modifications) or BLOCs (H3K27me3)located at the gene body excluding the promoter (solid bar), promoters(diagonally striped bar), and intergenic regions (horizontally striped bar).(D) The significance of overlap between genomic regions enriched fordifferent histone modifications was calculated by identifying Z-scores forall possible pairs of ChIPOTle peaks (all modifications) and BLOCs(H3K27me3) (details in Methods). A high Z-score identifies an overlapthat occurs more often than expected compared to a randomized dataset.
Alternating histone domains band a mouse autosome
Genome Research 223www.genome.org
Cold Spring Harbor Laboratory Press on December 20, 2012 - Published by genome.cshlp.orgDownloaded from

showed that H3K4me2, H3K4me3, and H3K9Ac were most often
associated with expressed genes. On average 89% of expressed
genes were marked by H3K4me2, 64% by H3K4me3, and 73% by
H3K9Ac (data not shown). A small number of silent genes also
contained active histone modification peaks, 26% with H3K4me2,
6% with H3K4me3, and 1% with H3K9Ac (data not shown). These
three active histone modifications were frequently located on the
same genomic regions, but were rarely
found to associate with H3K27me3,
whether analyzed as ChIPOTle peaks or
as BLOCs (Fig. 2D). Figure 3A shows the
combined H3K27me3 log2 ChIP/input
ratios relative to the transcription start
site (TSS), gene length and flanking
regions for all expressed genes on mouse
chr 17 (Fig. 3A, top), all silent genes an-
alyzed together (Fig. 3A, middle), and si-
lent genes lying in BLOCs (Fig. 3A,
bottom). The analysis shows that
expressed genes are depleted for
H3K27me3 for the gene length, but not
for the immediate flanking sequences
possibly indicating a negative correlation
between transcription and H3K27me3.
Silent genes lying within BLOCs show
a significant H3K27me3 enrichment over
the gene body, but not specifically over
the promoter, compared to expressed
genes (P < 10�4). The same enrichment is
detectable at a reduced level if all silent
genes are analyzed together. The com-
parison between these two groups of si-
lent genes indicates a population of silent
genes that lack H3K27me3.
Since the analysis of expressed genes
in Figure 3A indicated a negative corre-
lation between transcription and
H3K27me3, we plotted the distribution
of silent and expressed genes relative to
H3K27me3 BLOCs for MEFF (Fig. 3B) and
MEFB1 (Supplemental Fig. 5A). The dis-
tance of each gene to the closest
H3K27me3 BLOC was calculated for the
whole of chr 17 using three groups of
genes: all genes, expressed genes and
silent genes and grouped into 10 kb dis-
tance bins. ‘‘All genes’’ showed a char-
acteristic three-peak pattern—enriched
within H3K27me3 BLOCs, but also in the
0–10 kb flanking distance bins. Silent
genes are enriched within H3K27me3
BLOCs, but not in the flanking distance
bins. In contrast, the opposite pattern is
seen for expressed genes, which are rarely
found within BLOCs, but are enriched in
the 0–10 kb flanking distance bins. This
analysis, which shows that silent genes
lie inside H3K27me3 BLOCs, while active
genes immediately flank BLOCs, also
indicates a negative correlation between
H3K27me3 and transcription.
Validation of H3K27me3ChIP-chip BLOCs
We performed two tests on the H3K27me3 ChIP-chip data. First,
we determined the statistical significance of the difference of the
H3K27me3 enrichment within BLOCs and the remaining chip,
which shows the signal within BLOCs is significantly higher (P <
Figure 3. Silent and expressed genes cluster close to H3K27me3 BLOCs. (A) The combined log2
ChIP/input ratios from one MEFF chr 17 ChIP-chip replicate are shown for all expressed genes (top) allsilent genes (middle), and silent genes in BLOCs (bottom) relative to the transcription start site (TSS),gene length, and flanking regions. All positions are relative and the length of the gene (black box:expressed/gray box: silent) is defined as 100% and the flanking regions are 650% of the gene length.Orange line: continuous log2 ChIP/input values, black line: randomized data set. (B) The graph indi-cates the distance of all genes (dotted line) or of expressed (black line) or silent (gray line) genes relativeto the closest H3K27me3 BLOC (gray shaded area) in the MEFF cell line. Distances were calculatedseparately for each gene and then combined into distance bins (black boxes underneath). The per-centage of genes in each bin is indicated on the y-axis. Silent genes are inside and expressed genes areoutside, but close to H3K27me3 BLOCs.
Pauler et al.
224 Genome Researchwww.genome.org
Cold Spring Harbor Laboratory Press on December 20, 2012 - Published by genome.cshlp.orgDownloaded from

10�4) (Supplemental Fig. 6). Second, we
performed an analysis of whole chr 17
H3K27me3 ChIP-chip profiles and ex-
pression identified by RNA chip using
hidden Markov modeling (HMM) and
Viterbi segmentation (Day et al. 2007),
which confirmed that H3K27me3 and
transcription show a negative correlation
and that H3K27me3 forms BLOCs (Sup-
plemental Fig. 7). Previous descriptions
of H3K27me3 profiles across whole
mouse and human genomes, based on
ChIP-chip or on ChIP-seq analyses, have
mostly shown that H3K27me3 forms fo-
cal modifications at silent gene pro-
moters with a few exceptions showing
modifications of broad domains con-
taining gene clusters (Barski et al. 2007;
Mikkelsen et al. 2007; Pan et al. 2007;
Zhao et al. 2007). In order to test if the
identification of H3K27me3 BLOCs was
a consequence of the low dynamic range
of tiling arrays, we selected one large
365.4 kb BLOC on mouse chr 17 and
performed a scanning qPCR assay
throughout the BLOC, using primers
spaced at ;10 kb intervals and the same
MEFF ChIP material used for the ChIP-
chip analysis (Fig. 4A). The results show
that significant H3K27me3 enrichment
is found only inside the ChIP-chip iden-
tified BLOC, P = 10�4 for qPCR bars 4–31
(Fig. 4A, numbered left to right), com-
pared with the 10 flanking primers. The
scanning qPCR assay shows that levels of
H3K27me3 enrichment are not uniform
throughout the BLOC and six enriched
peaks (defined as signals > mean + 1
standard deviation of all signals) could be
seen. The boundaries of the enriched
domain detected by qPCR coincide with
ends of expressed genes (Supplemental
Fig. 4), in a similar manner as shown
above for the identified ChIP-chip
H3K27me3 BLOCs.
We next analyzed the same MEFF
chip material by whole genome se-
quencing (ChIP-seq, see Methods for
details) and the results are similar to the
scanning qPCR assay and show a broad
enriched domain with oscillating peaks
coincident with the ChIP-chip identified
H3K27me3 BLOC. In Figure 4B a high-
resolution (25 base pair [bp]) map of se-
quence tag density is shown and the
peaks in ChIP-seq data were analyzed
using a high and low cutoff (Supple-
mental Fig. 9). Only the low cutoff
identified all six qPCR peaks from the
scanning qPCR assay shown in Figure 4A.
Supplemental Figure 8 shows screenshots
of H3K27me3 ChIP-seq densities for the
Figure 4. qPCR and ChIP-seq validation of H3K27me3 ChIP-chip BLOCs. (A) Scanning qPCR of oneMEFF H3K27me3 ChIP-chip BLOC spanning 365.4 kb in a 650 kb region on mouse chr 17 (12.05–12.70Mb, UCSC Mouse [mm8], February 2006) with 38 primers (orange bars, error bars indicate variation inthree technical replicates) spaced ;10 kb. Y-axis: %ChIP/input. Mock IP samples were lower than 10%of input with two exceptions (marked with X). Asterisk: low relative qPCR value. M: qPCR assay locatedin H3K27me3 peaks previously identified in this region by ChIP-seq (Mikkelsen et al. 2007). Lowerdotted line indicates the cutoff for significant signals, upper dotted line indicates cutoff for enrichedpeaks. Primer sequences, qPCR assay details and Ct values are shown in Supplemental Table 2. (B) ChIP-seq of the H3K27me3 ChIP sample assayed by qPCR in A (details in Methods). The ChIP-seq sequence-tag abundance is displayed as 25 bp densities (high density). ChIP-seq BLOCs (horizontal dark red bar)in this region as well as significantly enriched regions (vertical dark red bars) are shown above the ChIP-seq track. Ensembl genes (expressed: black font, silent: gray font, see Supplemental Fig.4) are shownunderneath. (C) H3K27me3 ChIP-chip profile (orange peaks) for the region analyzed in (A,B). The or-ange bar marks the BLOC identified in this region. Genes in this region (black font: expressed, gray font:silent, see Supplemental Fig. 4) are indicated with CG-poor promoters indicated underneath by a barand CG-rich promoters indicated by a bar plus circle. (D) ChIP-seq BLOCs are identified on all mousechromosomes in one MEFF data set. Box and whisker plots illustrate the size distribution for eachchromosome. The number of BLOCs per Mb and % chromosome coverage by BLOCs is shown below.The ChIP-chip (orange) and ChIP-seq (black) BLOCs from one MEFF data set across chr 17 correlate well,as 82.3% of 1 kb windows show the same H3K27me3 BLOC state (BLOC or no BLOC). Note that MEFFcells are XO (data not shown) and thus have one active X chromosome.
Alternating histone domains band a mouse autosome
Genome Research 225www.genome.org
Cold Spring Harbor Laboratory Press on December 20, 2012 - Published by genome.cshlp.orgDownloaded from

same regions in Figure 1 and Supplemental Figures 1–3 showing
correspondence between BLOCs identified by ChIP-seq and ChIP-
chip. Together, these experiments verify the existence of
H3K27me3 BLOCs along mouse chr 17 and additionally show that
a small number of enriched peaks are found within a BLOC. We
then used the whole genome ChIP-seq data set to test if
H3K27me3 BLOCs are a feature of the whole mouse genome.
Figure 4D shows that H3K27me3 BLOCs
are found on all mouse chromosomes
with a mean size of 31.4 kb and a per-
centage chromosome coverage ranging
from 11% to 26%. A genome-wide dis-
tance plot analysis of known genes
(mm8) relative to the H3K27me3 ChIP-
seq-BLOCs shows the same three-peak
pattern as ChIP-chip BLOCs on chr 17,
indicating a similar spatial distribution of
H3K27me3 BLOCs across the whole ge-
nome (Supplemental Fig. 5B).
As an additional validation test for
the H3K27me3 ChIP-chip BLOCs identi-
fied here, we compared our data with
published H3K27me3 profiles from the
same mouse region obtained by ChIP-seq
of MEF cells (Mikkelsen et al. 2007). A
distance distribution analysis (Supple-
mental Fig. 5C) performed on the Mik-
kelsen et al. (2007) data shows that
H3K27me3 ChIP-seq peaks are located
inside silent genes and intergenic regions,
but not in expressed genes, similar to the
analysis of H3K27me3 BLOCs shown in
Figure 3B. The Mikkelsen et al. (2007)
ChIP-seq data set identified 275
H3K27me3 peaks on chr 17 of which
79% lie inside ChIP-chip BLOCs identi-
fied here (Supplemental Fig. 9). Finally,
we also compared our H3K27me3 ChIP-
chip BLOCs with human ES cell ChIP-
chip data (Pan et al. 2007). Notably, an
orthologous human region shows con-
servation of most H3K27me3 BLOCs
identified in the mouse region (Supple-
mental Fig. 9). Together, this shows that
a generally similar H3K27me3 organiza-
tion can be found in different data sets.
Histone modifications identify twotypes of chromosome domain on chr17 that correlate with gene and repeatdensity
While the H3K27me3 data analysis in-
dicated a negative correlation between
transcription and H3K27me3 when the
analysis focused on genes and intergenic
regions, visual inspection of 5 Mb win-
dows across whole chr 17 identified
nontranscribed regions that lacked
H3K27me3. We tested if H3K27me3
preferentially modifies genes in specific
chromosomal domains regions by gen-
erating histone modification and gene and repeat density profiles
at a low resolution across the whole of chr 17. Figure 5 shows log2
ChIP/input ratios in 200 kb nonoverlapping windows across the
whole 93 Mb chr 17. All histone modification replicates were used
for this analysis (Supplemental Table 1) and average signals from
each 200 kb window were calculated (Methods) and aligned using
the UCSC genome browser. Figure 5A shows that the gene density
Figure 5. Histone modifications identify two types of chromosome bands that correlate with geneand repeat density. (A) Gene density (http://genome.ucsc.edu) and probe tiling density (repeat-masked, see Methods for details) on the whole chr 17 tiling array chip, were analyzed in 200 kbnonoverlapping windows. The red area marks the imprinted Igf2r cluster (shown in Fig. 4) that containsthree small H3K9me3/H4K20me3 peaks and lacks H3K27me3 (Regha et al. 2007). (B) CumulativeChIP-chip profiles (log2 ChIP/Input hybridization signal means from MEFF and MEFB1 cells, Supple-mental Table 1) for H3K27me3, H3Ac, H4Ac, H4K20me1 (blue bars), and SINE density (black bars).Each vertical bar indicates an average signal from 200 kb nonoverlapping windows. (C) CumulativeChIP-chip profiles for H3K9me3 and H4K20me3 (green bars) and LINEs and LTRs (black bars). Details asin (B).
Pauler et al.
226 Genome Researchwww.genome.org
Cold Spring Harbor Laboratory Press on December 20, 2012 - Published by genome.cshlp.orgDownloaded from

(calculated as the percent sequence coverage in nonoverlapping
200 kb windows from known genes (http://genome.ucsc.org as-
sembly Mar05), is not uniform across mouse chr 17. The chip oligo
probe tiling density was similarly calculated. Next the repeat density
in these 200 kb nonoverlapping windows was calculated separately
for three different interspersed repeat types: LINEs and LTRs (long
autonomous retrotransposons) and SINEs (nonautonomous short
<300 bp retrotransposons that co-opt the LINE transposition ma-
chinery) (Kazazian 2004). The tile density is reduced in LINE/LTR-
rich regions compared to SINE-rich region, which is a consequence
of the large size of LINE/LTR repeats compared to SINEs when the
tiling array is designed from repeat-masked sequence. Figure 5B
shows that H3K27me3, H3Ac, H4Ac, and H4K20me1 all identify the
same gene-rich domains that correlate with SINE density, but not
with LINE or LTR density. Figure 5C shows that the spaces between
these gene-rich domains are enriched for the repressive histone
modifications H3K9me3 and H4K20me3 and also for LINE and LTR
repeats.
The profiles obtained for these two histone domain types
were next quantitatively analyzed with the HMM-Seg program
(Day et al. 2007) to identify enriched
domains along chr 17 (Fig. 6). Figure 6A
(top) shows the annotated metaphase
Giemsa banding pattern (obtained from
http://genome.ucsc.edu and based on
size estimations of Giemsa stained meta-
phase chromosomes). Figure 6A (bottom)
shows a banding pattern predicted from
the histone domains identified here in
nonsynchronized MEF cells, using the
HMM-Seg patterns shown in Figure 6B
(see Methods). Figure 6B shows enriched
domains for H3K27me3, H3Ac, H4Ac,
and H4K20me1 that are pooled and dis-
played separately for MEFF and MEFB1
along the length of chr 17 to show the
concordance of these patterns between
these two MEF cell lines (Fig. 6B, blue
boxes). Enriched domains along
the length of chr 17 for H3K9me3 and
H4K20me3 were pooled for MEFF and
MEFB1 (Fig. 6B, green boxes). Enriched do-
mains for LINEs/LTRs (Fig. 6B, black
boxes above line), SINEs (black boxes
below line), and gene density (gray
boxes), are shown as separate tracks. Fig-
ure 6, B and C, show that blue colored
domains (H3K27me3, H3Ac, H4Ac, and
H4K20me1, 95% of all windows showed
the same segmentation state) correlate
with gene density (77% of windows
showing the same segmentation state).
The segmentation of SINE, LINE, and LTR
repeats revealed that LINEs and LTRs
formed segments that were interspersed
with SINE segments. SINEs (83% of win-
dows with same segmentation state), but
not LINE/LTRs (17% of windows show
the same segmentation status) positively
correlated with ‘‘blue’’ histone mod-
ifications. The H3K9me3 and H4K20me3
repressive histone modifications also
formed segments (Fig. 6B, green boxes) that positively correlate
with LINE/LTR repeat segmentation (77% windows show the same
segmentation state), and negatively correlate with gene density
(31% windows show the same segmentation state) (Fig. 6C). To-
gether, the HMM-Seg analysis of the ChIP-chip profiles of active
and repressive histone modifications show that mouse chr 17 in
MEFs is organized into two alternating domain types. Type 1 is gene-
rich and correlates with active histone modifications, repressive
H3K27me3 modifications and SINE repeats. Type 2 is gene-poor and
correlates with repressive H3K9me3 and H4K20me3 modifications
and LINEs and LTR repeats.
A similar analysis of the Mikkelsen et al. (2007) ChIP-seq data
set derived from formaldehyde-fixed chromatin, did not identify
two alternating domain types on mouse chr 17 in MEF cells (see
comment in Supplemental Fig. 10 legend; data not shown).
However, two alternating domain types were seen on human chr
18 in human T cells using ChIP-seq data (Barski et al. 2007) that
was derived from native ChIP, similarly to the data obtained here.
Supplemental Figure 10 shows that on human chr 18 the re-
pressive H3K27me3 and the active H3K4me3 marks form enriched
Figure 6. Chromosome band features analyzed by hidden Markov modeling with Viterbi segmen-tations. (A, top) Giemsa annotated, shows the whole chr 17 Giemsa banding pattern obtained fromhttp://genome.ucsc.edu that is derived from measurement of Giemsa bands relative to whole chro-mosome length. (Bottom) Predicted, shows the whole chr 17 banding pattern predicted from theenriched histone domains shown in (B) that is based on a nonsynchronized, mainly interphase cellpopulation. Gray shading indicates the predicted relationship between the two binding patterns. Lightbands: gene-rich domains enriched for H3K27me3, H3Ac, H4Ac, H4K20me1, and SINEs. Dark bands:gene-poor domains enriched for H3K9me3, H4K20me3, and LINEs/LTRs. Domains sizes larger than 2.5Mbp are shown and an asterisk marks the imprinted Igf2r cluster analyzed in Figure 4. (B) HiddenMarkov modeling with Viterbi segmentations (HMM-Seg) for H3K27me3, H3Ac, H4Ac and H4K20me1ChIP-chip hybridizations shown as blue boxes, separately for MEFF and MEFB1 cells. Note that all fourhistone modifications identify the same domains in two independent MEF cell lines. HMM-Seg forH3K9me3 and H3K20me3 is shown as green boxes using the combined MEFF and MEFB1 data. HMM-Seg is shown separately for LINEs + LTRs and for SINEs (black boxes). Note that areas of LINE and LTRdensity are distinct from areas of SINE density. HMM-Seg for gene density is shown underneath as darkgray boxes. (C) Quantitative analysis comparing the similarity of the above sets of HMM-Seg analyses.Pie charts show the amount of overlap of two groups of segments (similar: black) and the amount ofnonoverlap (different: gray). Blue: H3K27me3, H3Ac, H4Ac, and H4K20me1.
Alternating histone domains band a mouse autosome
Genome Research 227www.genome.org
Cold Spring Harbor Laboratory Press on December 20, 2012 - Published by genome.cshlp.orgDownloaded from
domains that alternate with H3K9me3 enriched domains and the
HMM-Seg algorithm also identifies these alternating domains.
While repeat and gene density patterns on human chr 18 were
not as clearly mutually exclusive as found on mouse chr 17, the
H3K9me3 domains show a similar tendency to correlate with
gene-poor and SINE-poor regions (Supplemental Fig. 10).
DiscussionHere we present an analysis of active and repressive histone
modifications and their relationship to gene expression as well as
to gene and retrotransposon density, along the length of mouse
chr 17 in MEF differentiated cells. We show, using ChIP-chip and
ChIP-seq data, that repressive H3K27me3 modifications are found
as broad localized regions that we call BLOCs, which are also
a feature of all mouse chromosomes. H3K27me3 BLOCs on chr 17
cover all types of silent genes as well as intergenic regions.
Expressed genes are excluded from BLOCs, but are found in the
immediate flanking regions. We expanded this gene-centered
100 bp high-resolution analysis of H3K27me3 to a chromosome-
wide low-resolution analysis of the averaged H3K27me3 distribu-
tion over 200 kb windows. This lower
resolution analysis showed that
H3K27me3 is enriched in gene-rich/
SINE-rich domains and depleted in gene-
poor/LINE-rich domains. We further
show that two active histone mod-
ifications (H3Ac, H4Ac) as well as
H4K20me1 (whose role in gene expres-
sion is not yet clear), show the same
chromosome domain enrichment as
H3K27me3. In contrast, repressive
H3K9me3 and H4K20me3 modifications
show the opposite pattern and are
enriched in gene-poor/LINE-rich chro-
mosome domains. As metaphase chro-
mosomes have been shown to contain
alternating light R-bands and dark G-
bands that are, respectively, gene-rich/
SINE-rich and gene-poor/LINE-rich
(Boyle et al. 1990), these results indicate
that R- and G-bands are also associated
with specific combinations of histone
modification in nonsynchronized cell
populations that principally contain in-
terphase chromosomes.
Active histone modifications formpeaks, but H3K27me3 forms BLOCs
The histone modification profiles identi-
fied here show characteristic features in
terms of size of modified region, total
chromosome coverage and position rela-
tive to genes and gene activity. Peaks of
active histone modification had an aver-
age width of 2.6 kb and covered 2%–4%
of mouse chr 17, with H3K4me2 being
two- to threefold more abundant than
H3K9Ac and H3K4me3. In contrast, re-
pressive H3K27me3 modifications were
found in broad localized regions named
BLOCs that had an average size of 43 kb and covered 11% of
mouse chr 17. These modifications also differed in position rela-
tive to genes and intergenic regions with active histone mod-
ifications mostly found on genes with a bias toward promoters.
However, repressive H3K27me3 BLOCs were equally distributed
over genes and intergenic regions and did not specifically mark
promoters.
The ChIP-chip profiles described here for H3K4me2,
H3K4me3, and H3K9Ac are in agreement with those obtained
using ChIP-chip or ChIP-seq from different mammalian cell types,
which have generally shown that these active histone mod-
ifications are enriched over short focal regions at promoters and
nonpromoter putative gene-regulatory regions (Bernstein et al.
2007; Heintzman et al. 2007; Schones and Zhao 2008). In contrast,
the ChIP-chip profiles described here for H3K27me3 show differ-
ences with previous results in terms of the types of genes modified
and the size and position of the modified region. Our interest in
H3K27me3 arose from a study of an imprinted gene cluster in
MEFs where we noted that flanking silent nonimprinted genes,
which lack clear developmental roles, were modified by broad
regions of H3K27me3 (Regha et al. 2007). Previous results mainly
from ES cells identified an association between H3K27me3 and
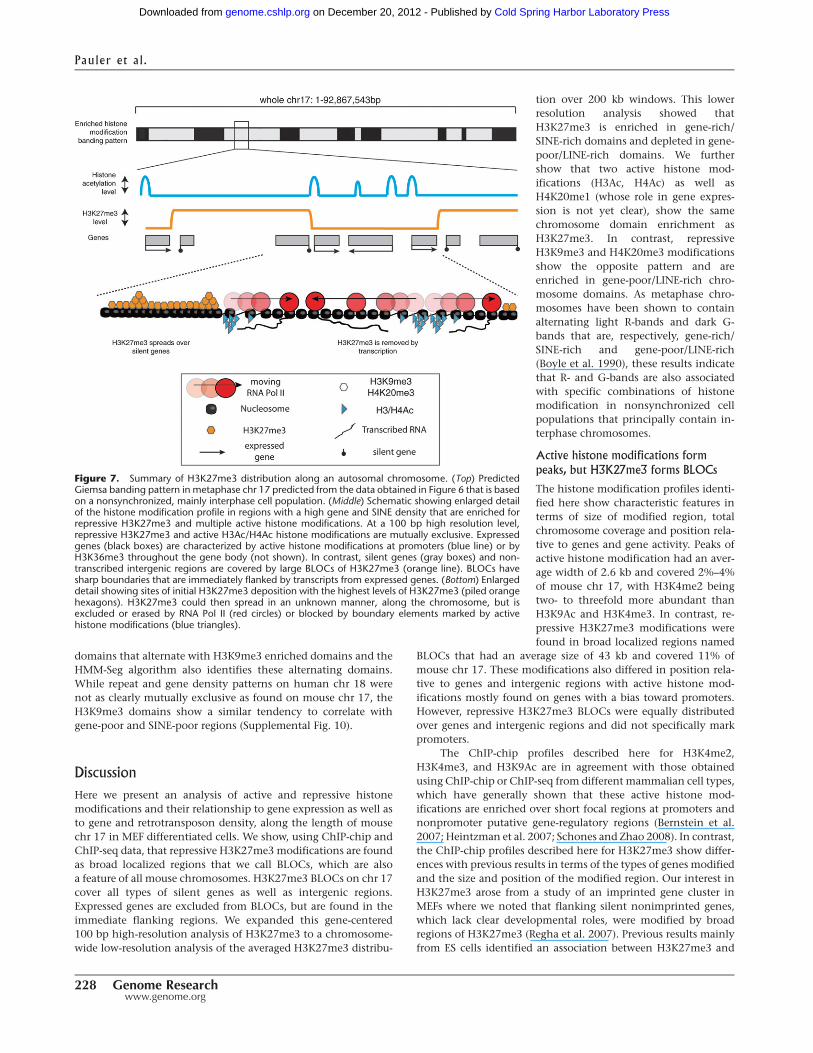
Figure 7. Summary of H3K27me3 distribution along an autosomal chromosome. (Top) PredictedGiemsa banding pattern in metaphase chr 17 predicted from the data obtained in Figure 6 that is basedon a nonsynchronized, mainly interphase cell population. (Middle) Schematic showing enlarged detailof the histone modification profile in regions with a high gene and SINE density that are enriched forrepressive H3K27me3 and multiple active histone modifications. At a 100 bp high resolution level,repressive H3K27me3 and active H3Ac/H4Ac histone modifications are mutually exclusive. Expressedgenes (black boxes) are characterized by active histone modifications at promoters (blue line) or byH3K36me3 throughout the gene body (not shown). In contrast, silent genes (gray boxes) and non-transcribed intergenic regions are covered by large BLOCs of H3K27me3 (orange line). BLOCs havesharp boundaries that are immediately flanked by transcripts from expressed genes. (Bottom) Enlargeddetail showing sites of initial H3K27me3 deposition with the highest levels of H3K27me3 (piled orangehexagons). H3K27me3 could then spread in an unknown manner, along the chromosome, but isexcluded or erased by RNA Pol II (red circles) or blocked by boundary elements marked by activehistone modifications (blue triangles).
Pauler et al.
228 Genome Researchwww.genome.org
Cold Spring Harbor Laboratory Press on December 20, 2012 - Published by genome.cshlp.orgDownloaded from

silent developmental regulatory genes (Bernstein et al. 2006a; Lee
et al. 2006). While an association with silent lineage-specific
genes was also noted in differentiated cell types (Squazzo et al.
2006), the results presented here differ, as they show a general
association between H3K27me3 and silent genes that lie in gene-
rich/SINE-rich chromosomal domains in MEF differentiated cells.
Thus, while H3K27me3 has been shown to play a role in repres-
sing genes that promote ES cell differentiation (Boyer et al. 2006;
Pasini et al. 2007), our results indicate that H3K27me3 may also
play a general repressive role in gene regulation in differentiated
cells.
The ChIP-chip profiles presented here show that H3K27me3
modifications mostly form BLOCs, not peaks. Previous studies
that mainly focused on gene promoters identified punctate
H3K27me3 patterns and a small number of broad or ‘‘blanket’’
H3K27me3 patterns covering silent gene clusters (Ringrose 2007).
Only a few studies have generated continuous H3K27me3 profiles
across large chromosomal regions in the mammalian genome,
however, these also identified the majority of H3K27me3 en-
richment as narrow peaks on silent gene promoters, although
broad H3K27me3 enrichment was seen over silent Hox gene
clusters and sometimes in the gene body of silent genes (Squazzo
et al. 2006; Barski et al. 2007; Mikkelsen et al. 2007; Pan et al. 2007;
Zhao et al. 2007). Despite these differences with published
maps, there are four arguments that indicate the H3K27me3
BLOCs identified here accurately describe its profile across mouse
chr 17 in MEFs. First, the specificity of the H3K27me3 antibody
used here has been fully demonstrated (Peters et al. 2003; Perez-
Burgos et al. 2004; Schwartz et al. 2006). Second, the native
ChIP-chip technique used here produces profiles of active his-
tone modification profiles in agreement with previous results
(Bernstein et al. 2007; Heintzman et al. 2007; Schones and Zhao
2008). Third, the estimated chromosomal coverage of
H3K27me3 BLOCs of 11%–26% in MEFs, is in agreement with
quantitative mass spectrometry estimates that 10%–20% of
histones are modified in ES cells by H3K27me3 (Peters et al.
2003). Lastly, we show that two alternative techniques (qPCR
and ChIP-seq) identify H3K27me3 BLOCs similar to those seen
in ChIP-chip analysis.
It is possible that identification of H3K27me3 modification
patterns is influenced by the chosen peak-finding threshold that
can affect the ability to detect peaks or BLOCs. In the example
shown in Supplemental Figure 9, we also apply the BLOC algo-
rithm to the ChIP-chip data from human ES cells previ-
ously characterized as mostly containing H3K27me3 peaks (Pan
et al. 2007), which identifies H3K27me3 BLOCs that are conserved
between the mouse and human genome. The BLOC algorithm
failed to identify broad modified regions in a published ChIP-seq
data set from mouse MEF cells (Mikkelsen et al. 2007), however
79% of H3K27me3 peaks indentified in this data set coincide with
the BLOCs identified here. Notably, while the H3K27me3 ChIP-
seq data generated here show oscillating peaks of enrichment
throughout the BLOC, only 10%–15% of identified ChIP-seq
peaks correlate with promoters (Supplemental Fig. 9; data not
shown). This is in contrast to published ChIP-seq data (Mikkelsen
et al. 2007), which show that 41% of observed H3K27me3
peaks correlate with promoters. While we currently have no ex-
planation for this difference, our analysis of the published
H3K27me3 ChIP-seq peaks (Mikkelsen et al. 2007) does show that
they maintain the same spatial correlation relative to expressed
and silent genes and intergenic regions as observed for H3K27me3
BLOCs.
Silent and expressed genes cluster close to H3K27me3 BLOCs
We used distance plots to show that silent genes lie within
H3K27me3 BLOCs, which is in agreement with previous results
that identify this modification as repressive (Boyer et al. 2006;
Pasini et al. 2007). Notably, expressed genes were preferentially
located in regions immediately flanking H3K27me3 BLOCs. This
produced a characteristic three-peak pattern when expressed and
silent genes on chr 17 were analyzed together, that is also repro-
duced in a whole genome ChIP-seq data set. As visual inspection
of the data identified many incidents where H3K27me3 BLOCs
appeared to be abruptly terminated by active transcription (Fig. 1;
Supplemental Figs. 1–3), we suggest this indicates that active
transcription may limit or erase H3K27me3 BLOCs. In support of
this it has recently been shown in Drosophila that UTX, an
H3K27me3 demethylase, co-localizes with the elongating form of
RNA polymerase II (Smith et al. 2008). In the model shown in
Figure 7, sites of initial H3K27me3 deposition are proposed to
show the highest modification levels. This modification would
then spread along the chromosome in an unknown manner, until
it is excluded or erased by active transcription. This model is
supported by observations in Drosophila, which show that initial
targeting of H3K27me3 catalytic enzymes is directed to PREs
(polycomb response elements) in genes and intergenic regions,
while H3K27me3 forms broad domains including the entire
transcription unit and regulatory regions (Schwartz et al. 2006).
Similarly, in mammalian cells a nucleation model that leads to
spreading of H3K27me3 has also been suggested from mapping
sites of SUZ12 binding (Squazzo et al. 2006).
Histone modifications identify two types of chromosome bandsthat correlate with gene and repeat density
The analysis of H3K27me3 BLOCs relative to silent and expressed
genes indicates it is induced by lack of active transcription rather
than sequence-specific features. However, this interpretation is
contradicted by the presence of gene-poor nontranscribed geno-
mic regions that lack H3K27me3, which prompted us to examine
the relationship between histone modifications and sequence
features, such as genes and retrotransposon repeats along mouse
chr 17. Our results show that histone modifications identify two
types of alternating chromosomal domains that correlate with
gene density and different types of retrotransposon elements.
Type 1 is gene-rich and correlates with active H3Ac and H4Ac
histone modifications, H4K20me1 (whose role in transcription
is not clear) (Karachentsev et al. 2005; Papp and Muller 2006),
repressive H3K27me3 modifications and nonautonomous SINE
retrotransposons. Type 2 is gene poor and correlates with re-
pressive H3K9me3 and H4K20me3 modifications and autono-
mous LINES and LTR retrotransposons. As previous studies of
metaphase chromosomes (Boyle et al. 1990; Craig and Bickmore
1993) have shown that gene-rich/SINE-rich regions are lightly
stained by Giemsa (known as light R-bands), while gene-poor/
LINE-rich regions are darkly stained by Giemsa (known as dark G-
bands), this indicates that specific patterns of histone mod-
ifications may discriminate Giemsa bands in nonsynchronized
cell populations principally composed of interphase cells. The
tiling array used in this ChIP-chip study was repeat masked, thus
the obtained histone profiles do not directly result from hybrid-
ization to repeats themselves, but from hybridization to single
copy sequences flanking the repeats. However, LTR retro-
transposons have been shown to be enriched for H3K9me3 and/or
Alternating histone domains band a mouse autosome
Genome Research 229www.genome.org
Cold Spring Harbor Laboratory Press on December 20, 2012 - Published by genome.cshlp.orgDownloaded from

H4K20me3 (Martens et al. 2005; Mikkelsen et al. 2007), thus the
enrichment on flanking single copy regions may reflect retro-
transposon epigenetic modifications.
A connection between histone modifications and chromo-
some domains has previously been made in human T cells, which
similarly showed that dark G-bands correlate with H3K4 methyl-
ation depletion and H3K9me3 enrichment, while light R-bands
correlate with H3K4 methylation enrichment and reduced
H3K9me3 (Barski et al. 2007). Our low-resolution analysis of this
data set supports this observation by showing that alternating
domains of H3K4me3 (plus H3K27me3) and H3K9me3 occur
along human chr 18 and that the H3K9me3 domains correlate
with dark staining Giemsa bands (Supplemental Fig. 10). Mutual
exclusive distribution of H3K27me3 and H3K9me3 based on
ChIP-chip data has also been demonstrated in several mammalian
cell lines (Squazzo et al. 2006). A published analysis of ENCODE
regions (Thurman et al. 2007) using the same computational ap-
proach that we applied in Figure 6, also identified two types of
domains. One domain termed ‘‘active’’ was gene and SINE rich
and also enriched for active histone modifications, as we show
here for Type 1 domains. The other domain termed ‘‘repressed’’
was gene poor and LINE/LTR rich, but in contrast to our results,
was enriched for H3K27me3. This discrepancy may result from the
analysis not including H3K9/H4K20 trimethylation and because
ENCODE regions comprise 1% of the human genome from 100
dispersed regions, instead of a continuous chromosomal region.
Support for the existence of two types of repressive chromatin
similar to that described here comes from two other studies. The
first study demonstrated that human alpha- and beta-globin genes
are silenced by different mechanisms; alpha-globin that lies in a
gene-rich domain was repressed by H3K27me3, while beta-globin
that lies in a gene-poor domain was not (Garrick et al. 2008). In
a second study, immunofluorescence of human metaphase chro-
mosomes was used to identify two nonoverlapping chromatin
states spread over mega-base-pair-sized domains, one defined by
H3K27me3 and the other by H3K9me3 + HP1 + H4K20me3
(Chadwick, 2007). This study focused on the inactive X chromo-
some and concluded that alternating H3K27me3/H3K9me3
banding patterns reflect the specific organization of the inactive X
chromosome into a heterochromatin state. Our results do not
disagree with this conclusion that concerned the inactive X chro-
mosome at metaphase, instead we show that a typical autosome is
also organized into alternate H3K27me3 and H3K9me3 domains in
nonsynchronized principally interphase, cell populations.
The findings in this study refine our understanding of the
distribution of histone modifications in two ways. First we show
by high-resolution ChIP profiling that H3K27me3 is not restricted
to the promoter regions of silent genes, but instead generally
marks broad localized regions that include silent genes and
intergenic regions. Second, we use a low-resolution analysis to
show that large chromosomal domains on an autosome are al-
ternately enriched for distinctive histone modifications that cor-
relate with gene density and different retrotransposon elements.
While these low-resolution histone-banding patterns do not ex-
clude the existence of smaller domains within them that may
show contrary patterns, they do indicate the possibility that
chromosomes are subdivided into domains that largely regulate
genes and domains that largely silence autonomous retro-
transposons. These two regions may impose different epigenetic
constraints, e.g., genes lying close to LINE/LTR-rich bands may be
more affected by epigenetic mechanisms normally directed to-
ward transposon silencing, as has been well demonstrated in the
plant genome (Weil and Martienssen 2008). An improved un-
derstanding of genes and their relative position to specific
enriched histone domains may also give new insights into genes
showing epigenetic dysregulation in development and disease.
Methods
Chromatin immunoprecipitation (ChIP), microarray design,and hybridizationsNative ChIP, T7 in vitro amplification, RNA-chip, and the MEFFand MEFB1 cell lines were described previously (Regha et al. 2007).Antibodies, cells, and replicates are listed in Supplemental Table 1.The custom mouse chr 17 NimbleGen tiling array was designed byidentifying 50 bp windows containing at least 18 unique 17-merswith a maximum distance of 15 bp (Thomas Jenuwein and theGEN-AU bioinformatics team, pers. comm.). This identified390,000/50-mers giving a resolution of ;100 bp from single copysequences (program is available on request) from mouse chr 17:3021,656 to 92,867,543 (UCSC [mm6], March 2005, Build 34).chip hybridizations and scanning were performed by NimbleGenSystems Iceland and involved two technical replicates (with a dyeswap) for 2 MEF cell lines (MEFB1 and MEFF) for most histonemodification. The data were Tukey bi-weight normalized beforeanalysis.
Identification of focal regions enriched in active histonemodifications and H3K27me3 from ChIP-chip data
Using an implementation of ChIPOTle (Buck et al. 2005), a P-valuewas calculated for each 1500 bp window with at least 8 probesand assigned to bins of size 1 3 10�5. The cutoff for selection ofenriched windows was determined by generating a null distribu-tion through permutation of the signals (400 times) and assigningthe resulting P-values to bins. The bin where the ratio of summedaveraged randomized counts/summed real counts was still smallerthan the chosen false discovery rate (1 3 10�7) was the upper limitfor the P-value. A second selection step removed windows wherethe intensity of less than one-third of the probes was below thesum of the mean and the standard deviation of all the experi-mental probes. Peaks were joined if they overlapped or werewithin 500 bp of each other.
Identification of H3K27me3 broad local enrichments (BLOCs)
The start of a BLOC is defined by 10–13 consecutive probes, where10 probes show a positive log2 (ChIP/input) value. The BLOC endwas defined by 6–8 probes where six probes show a negative log2
(ChIP/input) value. BLOCs with a median log2 (ChIP/input) valuegreater than 0.253 standard deviations above the median log2
(ChIP/input) value of all probes of the chip were used. BLOCs thatwere separated by less than 10 kb were merged and only BLOCslarger than 5 kb in length were used for data analyses. In the casewhere several H3K27me3 chip replicates were available for one cellline, BLOCs were identified separately for each replicate. TheBLOCs were fused by taking the overlapping BLOC regions andexcluding regions that did not overlap. ChIP-seq BLOC findingwas performed on 25 bp fragment density maps (see ChIP-seqbelow) from one MEFF genome data set. The BLOC start was de-fined by 20–23 windows, where 20 windows show a fragmentdensity >0 and the BLOC end was defined by 6–8 windows wheresix windows show a fragment density <0. All 25 bp windows withno fragment density were assigned the value �1. The BLOCsprogram is available at http://genauwiki.imp.ac.at.
Pauler et al.
230 Genome Researchwww.genome.org
Cold Spring Harbor Laboratory Press on December 20, 2012 - Published by genome.cshlp.orgDownloaded from

Gene expression analysis
These were based on cDNA hybridization to the NimbleGen chr 17array relative to genomic DNA (RNA-chip). Informative genes wereidentified in two steps. First, only genes with at least five tilingarray probes in exons were considered informative (750 of the1282 genes on chr 17). The median signal of probes within exonswas calculated. Genes with a value above the median value of allprobes with a positive log2 (ChIP/input) value on the array wereclassified as expressed, while genes with a value below the medianwere classified as silent. Second, only genes with a coverage of atleast eight tiling array probes per 1500 bp over >70% of the genelocus were used for data analyses. In MEFB1 cells this identified553 of the 1282 genes on chr 17 from one replicate. In MEFF cellswe only counted genes with the same expression status in tworeplicates and analyzed 518 of the 1282 genes on chr 17.
Combined analysis of histone modifications and locationin genes
Focal regions enriched for active histone modifications as definedby ChIPOTle were identified for each hybridization replicate ofa respective histone modification. The enriched regions from allhybridizations (Supplemental Table 1) were pooled for each histonemodification. Overlap between the enriched regions was de-termined and those common to all files were pooled and used fordata analyses in Figure 2. To determine how much of the singlecopy portion of chr 17 was covered by focal active histone mod-ifications, informative regions with a probe density of at least eightoligos per 1500 bp were analyzed by ChIPOTle. 89,832,667 bp ofchr 17 was present on the array, but only 53,415,732 bp (60%) wasinformative for analysis. The repetitive part was underrepresented.The total length covered by each histone modification was summedand divided by 53,415,732 to determine the proportion of singlecopy regions covered. For each histone modification the size of eachenriched region was determined and the average size was calculatedby dividing the summed length by the total number of enrichedregions. For H3K27me3 the same analysis was performed, but herethe whole of chr 17 was taken as informative. Genes were Ensembltranscripts. Promoters were defined as 1 kb upstream and 1 kbdownstream of the exon 1 start position (2 kb region). The re-mainder of the gene was defined as the gene body. The percentageof ChIPOTle (H3K4me2, H3K4me3, H3K9Ac, and H3K27me3) orBLOC (H3K27me3) enriched regions that overlapped with genes orintergenic regions were then calculated.
Z-score analysis
We calculated an estimate of whether the observed overlap be-tween two enriched regions for histone modifications was signif-icant by randomly reshuffling the enriched regions 10,000 timesto generate an empirical null distribution of the total overlaplengths. Only regions with a probe density >8 probes/1500 bpwere used for analysis. The observed total overlap length wasexpressed as a Z-score relative to this null distribution: for examplea Z-score of 10.0 indicates the actual overlap length was 10 stan-dard deviation units higher than the mean of the random overlaplength distribution.
Distance distribution analysis
The distance of the midpoint of each gene to the borders of theclosest H3K27me3 BLOC was calculated. The distances were com-bined into 10 kb distance bins and plotted using MS-Excel.H3K27me3 BLOCs located completely within genes were excludedfrom the analysis. Genes that were more than 50% overlapped byan H3K27me3 BLOC were put into the ‘‘inside’’ bin (genes in BLOCs).
Histone profiling relative to gene expression
For each probe, the distance to the transcriptional start site of thegenes of each category (expressed, silent, genes in BLOCs, seeabove) was calculated and normalized to the length of the gene.The normalized log2 (ChIP/input) values of the probes weresmoothened by fitting a cubic smoothing spline, with the relativedistances as predictors. A randomization and eventual smoothingof all the log2 (ChIP/input) values from the array across the relativedistances indicates the background level of the array.
ChIP-seq
Sequencing libraries were obtained from 10 ng of ChIP DNA byadaptor ligation, gel purification and 18 cycles of PCR. Sequencingwas carried out using the Illumina Genome Analyzer (GA) I systemaccording to the manufacturer’s protocol. 4468,089 uniquelyalignable sequence tags were mapped to the mouse genome (NCBIbuild 36) using the GA-Pipeline V0.3. Tags passing the standardGA-Pipeline quality threshold and mapping uniquely with notmore than two mismatches were used for data analyses. Highdensity map: A theoretical fragment density for each 25 bp windowwas calculated. Uniquely aligned tags within 200 bp and orientedtoward it, were counted as 1 for each 25 bp window and as 0.25 ifthey were within 200 bp and 300 bp. Low-density map: For each200 bp window the uniquely aligned tags were counted. Peaks ofsignificant enrichment were identified using the USeq toolkit(http://useq.sourceforge.net/): A sliding window of 1 kb was usedto calculate smoothened window scores (ScanSeqs). For each win-dow a Bonferroni corrected P-value was estimated using a globalPoisson distribution and windows with a minimum score of 10(low cut off) or 60 (high cut off) and a maximum distance of 500 bpwere combined to enriched regions (EnrichedRegionMaker).
Statistical significance
P-values were calculated using an unpaired t-test on http://www.graphpad.com using the mean and the standard deviation.
Whole chromosome profiles
The average normalized log2 (ChIP/input) ratios of all probeswithin nonoverlapping 200 kb windows was calculated for eachreplicate (Supplemental Table 1) of each histone modificationexamined in MEFF and MEFB1 cell lines. The data of all replicateswere combined by averaging the 200 kb windows. Repeat and genedensities (‘‘known genes’’) were calculated as percent sequencecoverage of 200 kb nonoverlapping windows. The positions ofSINE, LINE, LTR repeats, and known genes were obtained from theUCSC genome browser (http://genome.ucsc.edu).
HMM-Seg
Paired H3K27me3 and RNA chr 17 profiles were analyzed byHMM-Seg with described parameters, except that the data were‘‘smoothened’’ over 15 kb in Supplemental Figure 7 (Day et al.2007). The unmodified ChIP/input ratios were averaged over 1 kbnonoverlapping windows and these data sets were used as theHMM-Seg input. In Figure 6, single H3K27me3, H3Ac, H4Ac, andH4K20me1 profiles were analyzed separately for the MEFF andMEFB1 cell line by averaging the unmodified ChIP/input ratiosover 1 kb nonoverlapping windows and the data ‘‘smoothed’’over 200 kb. For H3K9me3 and H4K20me3 profiles in Figure 6,the average log2 (ChIP/input) ratios were calculated togetherfor all available replicates (Supplemental Table 1). The repeat
Alternating histone domains band a mouse autosome
Genome Research 231www.genome.org
Cold Spring Harbor Laboratory Press on December 20, 2012 - Published by genome.cshlp.orgDownloaded from
segmentation was obtained by calculating the LINE, SINE, andLTR repeat coverage for 1 kb nonoverlapping windows that werecumulatively analyzed. The gene segmentation was obtained bycalculating the coverage of known genes for 1 kb nonoverlappingwindows. The repeat and gene data sets were the same as for wholechromosome profile described above. The ‘‘predicted’’ bandingpattern on chr 17 was estimated by defining a pattern that best fitsthe combined H3K27me3, H3Ac, H4Ac, and H4K20me1 profilesand the SINE profiles (forming the light staining bands) or thecombined H3K9me3 and H4K20me3 profiles and the LINE/LTRprofiles (forming the dark staining bands). Small gaps in the pro-file were neglected and the overall structure of the annotatedGiemsa bands was retained where possible. The sizes of the pre-dicted bands were calculated based on their coverage of chr.17.
Quantitative analysis of HMM-Seg overlap
HMM-Seg converts the whole chromosome into blocks of twostates, 0 and 1. Two HMM-Seg results were compared by testingthe whole chromosome in 1 kb nonoverlapping windows to de-termine if both segmentations showed the same state (0 or 1). Thepercentage of similarity was calculated by dividing the number ofwindows showing the same state by the total number of windowson chr 17. The result was visualized as pie charts using MS-Excel.
Real-time qPCR
Primers (Supplemental Table 2) were designed by PrimerExpressand qPCR performed with the ABI PRISM 7000 using MESAGREEN qPCR (Mastermix Plus for SYBR ASSAY- dTTP), with theprimers under the following cycling conditions: 2 min 50°C, 10min 95°C, 40 cycles of 15 s 95°C and 1 min 60°C. ChIP and Mockmaterial were assayed undiluted, while input DNA was diluted1:100. DNA quantification was made by the standard curvemethod using serial dilutions of input DNA. Relative quantifica-tion and statistics were performed as described in the manu-facturer’s protocol (Applied Biosystems).
AcknowledgmentsWe thank all members of the Barlow group and members of theGEN-AU Epigenetics project for support, Leonie Ringrose andAnton Wutz, for their comments on the paper. Project support wasfrom GEN-AU Epigenetic Plasticity of the Mammalian Genome(GZ200.141/1-VI/2006), the EU-FW6 IP ‘‘HEROIC’’ (LSHG-CT-2005-018883), the NoE ‘‘The Epigenome’’ (LSHG-CT-2004-053433),and FWF SFB F17 Modulators of RNA Fate and Function (SFBF01718B10).
References
Azuara, V., Perry, P., Sauer, S., Spivakov, M., Jorgensen, H.F., John, R.M.,
Gouti, M., Casanova, M., Warnes, G., Merkenschlager, M. et al. 2006.
Chromatin signatures of pluripotent cell lines. Nat. Cell Biol. 8: 532–
538.Barski, A., Cuddapah, S., Cui, K., Roh, T.Y., Schones, D.E., Wang, Z., Wei, G.,
Chepelev, I., and Zhao, K. 2007. High-resolution profiling of histone
methylations in the human genome. Cell 129: 823–837.Beisel, C., Buness, A., Roustan-Espinosa, I.M., Koch, B., Schmitt, S., Haas,
S.A., Hild, M., Katsuyama, T., and Paro, R. 2007. Comparing active and
repressed expression states of genes controlled by the Polycomb/
Trithorax group proteins. Proc. Natl. Acad. Sci. 104: 16615–16620.Bernstein, B.E., Mikkelsen, T.S., Xie, X., Kamal, M., Huebert, D.J., Cuff, J.,
Fry, B., Meissner, A., Wernig, M., Plath, K. et al. 2006a. A bivalent
chromatin structure marks key developmental genes in embryonic stem
cells. Cell 125: 315–326.
Bernstein, E., Duncan, E.M., Masui, O., Gil, J., Heard, E., and Allis, C.D.2006b. Mouse polycomb proteins bind differentially to methylatedhistone H3 and RNA and are enriched in facultative heterochromatin.Mol. Cell. Biol. 26: 2560–2569.
Bernstein, B.E., Meissner, A., and Lander, E.S. 2007. The mammalianepigenome. Cell 128: 669–681.
Boyer, L.A., Plath, K., Zeitlinger, J., Brambrink, T., Medeiros, L.A., Lee, T.I.,Levine, S.S., Wernig, M., Tajonar, A., Ray, M.K., et al. 2006. Polycombcomplexes repress developmental regulators in murine embryonic stemcells. Nature 441: 349–353.
Boyle, A.L., Ballard, S.G., and Ward, D.C. 1990. Differential distribution oflong and short interspersed element sequences in the mouse genome:Chromosome karyotyping by fluorescence in situ hybridization. Proc.Natl. Acad. Sci. 87: 7757–7761.
Bracken, A.P., Dietrich, N., Pasini, D., Hansen, K.H., and Helin, K. 2006.Genome-wide mapping of Polycomb target genes unravels their roles incell fate transitions. Genes & Dev. 20: 1123–1136.
Buck, M.J., Nobel, A.B., and Lieb, J.D. 2005. ChIPOTle: A user-friendly toolfor the analysis of ChIP-chip data. Genome Biol. 6: R97. doi: 10.1186/gb-2005-6-11-r97.
Chadwick, B.P. 2007. Variation in Xi chromatin organization andcorrelation of the H3K27me3 chromatin territories to transcribedsequences by microarray analysis. Chromosoma 116: 147–157.
Chadwick, B.P. and Willard, H.F. 2004. Multiple spatially distinct types offacultative heterochromatin on the human inactive X chromosome.Proc. Natl. Acad. Sci. 101: 17450–17455.
Chamberlain, S.J., Yee, D., and Magnuson, T. 2008. Polycomb repressivecomplex 2 is dispensable for maintenance of embryonic stem cellpluripotency. Stem Cells 26: 1496–1505.
Craig, J.M. and Bickmore, W.A. 1993. Chromosome bands—Flavours tosavour. Bioessays 15: 349–354.
Day, N., Hemmaplardh, A., Thurman, R.E., Stamatoyannopoulos, J.A., andNoble, W.S. 2007. Unsupervised segmentation of continuous genomicdata. Bioinformatics 23: 1424–1426.
Garrick, D., De Gobbi, M., Samara, V., Rugless, M., Holland, M., Ayyub, H.,Lower, K., Sloane-Stanley, J., Gray, N., Koch, C., et al. 2008. The role ofthe polycomb complex in silencing a-globin gene expression innonerythroid cells. Blood 112: 3889–3899.
Heintzman, N.D., Stuart, R.K., Hon, G., Fu, Y., Ching, C.W., Hawkins, R.D.,Barrera, L.O., Van Calcar, S., Qu, C., Ching, K.A., et al. 2007. Distinctand predictive chromatin signatures of transcriptional promoters andenhancers in the human genome. Nat. Genet. 39: 311–318.
Karachentsev, D., Sarma, K., Reinberg, D., and Steward, R. 2005. PR-Set7-dependent methylation of histone H4 Lys 20 functions in repression ofgene expression and is essential for mitosis. Genes & Dev. 19: 431–435.
Kazazian Jr., H.H. 2004. Mobile elements: Drivers of genome evolution.Science 303: 1626–1632.
Lee, T.I., Jenner, R.G., Boyer, L.A., Guenther, M.G., Levine, S.S., Kumar,R.M., Chevalier, B., Johnstone, S.E., Cole, M.F., Isono, K., et al. 2006.Control of developmental regulators by Polycomb in humanembryonic stem cells. Cell 125: 301–313.
Martens, J.H., O’Sullivan, R.J., Braunschweig, U., Opravil, S., Radolf, M.,Steinlein, P., and Jenuwein, T. 2005. The profile of repeat-associatedhistone lysine methylation states in the mouse epigenome. EMBO J. 24:800–812.
Mikkelsen, T.S., Ku, M., Jaffe, D.B., Issac, B., Lieberman, E., Giannoukos, G.,Alvarez, P., Brockman, W., Kim, T.K., Koche, R.P., et al. 2007. Genome-wide maps of chromatin state in pluripotent and lineage-committedcells. Nature 448: 552–560.
Pan, G., Tian, S., Nie, J., Yang, C., Ruotti, V., Wei, H., Jonsdottir, G.A.,Stewart, R., and Thomson, J.A. 2007. Whole-genome analysis of histoneH3 lysine 4 and lysine 27 methylation in human embryonic stem cells.Cell Stem Cell 1: 299–312.
Papp, B. and Muller, J. 2006. Histone trimethylation and the maintenanceof transcriptional ON and OFF states by trxG and PcG proteins. Genes &Dev. 20: 2041–2054.
Pasini, D., Bracken, A.P., Hansen, J.B., Capillo, M., and Helin, K. 2007. Thepolycomb group protein Suz12 is required for embryonic stem celldifferentiation. Mol. Cell. Biol. 27: 3769–3779.
Perez-Burgos, L., Peters, A.H., Opravil, S., Kauer, M., Mechtler, K., andJenuwein, T. 2004. Generation and characterization of methyl-lysinehistone antibodies. Methods Enzymol. 376: 234–254.
Peters, A.H., Kubicek, S., Mechtler, K., O’Sullivan, R.J., Derijck, A.A., Perez-Burgos, L., Kohlmaier, A., Opravil, S., Tachibana, M., Shinkai, Y. et al.2003. Partitioning and plasticity of repressive histone methylationstates in mammalian chromatin. Mol. Cell 12: 1577–1589.
Regha, K., Sloane, M.A., Huang, R., Pauler, F.M., Warczok, K.E., Melikant, B.,Radolf, M., Martens, J.H., Schotta, G., Jenuwein, T., et al. 2007. Activeand repressive chromatin are interspersed without spreading in animprinted gene cluster in the mammalian genome. Mol. Cell 27: 353–366.
Pauler et al.
232 Genome Researchwww.genome.org
Cold Spring Harbor Laboratory Press on December 20, 2012 - Published by genome.cshlp.orgDownloaded from
Ringrose, L. 2007. Polycomb comes of age: Genome-wide profiling of targetsites. Curr. Opin. Cell Biol. 19: 290–297.
Roh, T.Y., Cuddapah, S., Cui, K., and Zhao, K. 2006. The genomic landscapeof histone modifications in human T cells. Proc. Natl. Acad. Sci. 103:15782–15787.
Schones, D.E. and Zhao, K. 2008. Genome-wide approaches to studyingchromatin modifications. Nat. Rev. Genet. 9: 179–191.
Schotta, G., Lachner, M., Sarma, K., Ebert, A., Sengupta, R., Reuter, G.,Reinberg, D., and Jenuwein, T. 2004. A silencing pathway to induce H3-K9 and H4-K20 trimethylation at constitutive heterochromatin. Genes& Dev. 18: 1251–1262.
Schwartz, Y.B., Kahn, T.G., Nix, D.A., Li, X.Y., Bourgon, R., Biggin, M., andPirrotta, V. 2006. Genome-wide analysis of Polycomb targets inDrosophila melanogaster. Nat. Genet. 38: 700–705.
Smith, E.R., Lee, M.G., Winter, B., Droz, N.M., Eissenberg, J.C., Shiekhattar,R., and Shilatifard, A. 2008. Drosophila UTX is a histone H3 Lys27demethylase that colocalizes with the elongating form of RNApolymerase II. Mol. Cell. Biol. 28: 1041–1046.
Squazzo, S.L., O’Geen, H., Komashko, V.M., Krig, S.R., Jin, V.X., Jang, S.W.,Margueron, R., Reinberg, D., Green, R., and Farnham, P.J. 2006. Suz12binds to silenced regions of the genome in a cell-type-specific manner.Genome Res. 16: 890–900.
Thurman, R.E., Day, N., Noble, W.S., and Stamatoyannopoulos, J.A. 2007.Identification of higher-order functional domains in the humanENCODE regions. Genome Res. 17: 917–927.
Weil, C.andMartienssen,R.2008. Epigenetic interactionsbetween transposonsand genes: Lessons from plants. Curr. Opin. Genet. Dev. 18: 188–192.
Wutz, A. 2007. Xist function: Bridging chromatin and stem cells. TrendsGenet. 23: 457–464.
Zhao, X.D., Han, X., Chew, J.L., Liu, J., Chiu, K.P., Choo, A., Orlov, Y.L., Sung,W.K., Shahab, A., Kuznetsove, V.A., et al. 2007. Whole-genome mappingof histone H3 Lys4 and 27 trimethylations reveals distinct genomiccompartments in human embryonic stem cells. Cell Stem Cell 1: 286–298.
Received May 13, 2008; accepted in revised form November 17, 2008.
Alternating histone domains band a mouse autosome
Genome Research 233www.genome.org
Cold Spring Harbor Laboratory Press on December 20, 2012 - Published by genome.cshlp.orgDownloaded from