A ribosomal RNA gene intergenic spacer based PCR and DGGE fingerprinting method for the analysis of...
14
A ribosomal RNA gene intergenic spacer based PCR and DGGE fingerprinting method for the analysis of specific rhizobial communities in soil Vale ´ria Maia de Oliveira a , Gilson Paulo Manfio a , Heitor Luiz da Costa Coutinho b , Anneke Christina Keijzer-Wolters d , Jan Dirk van Elsas c, * a Centro Pluridisciplinar de Pesquisas Quı ´micas, Biolo ´gicas e Agrı ´colas- CPQBA/UNICAMP, CP 6171,CEP 13081-970, Campinas, SP, Brazil b Embrapa Solos, Rua Jardim Bota ˆnico, 1024, CEP 22460-000, Rio de Janeiro, RJ, Brazil c Microbial Ecology Department, University of Groningen, P.O.Box 14, 9750AA, Haren, The Netherlands d Plant Research International, P.O. Box 16, 6700AAWageningen, The Netherlands Received 26 May 2005; received in revised form 30 May 2005; accepted 30 May 2005 Available online 12 July 2005 Abstract A direct molecular method for assessing the diversity of specific populations of rhizobia in soil, based on nested PCR amplification of 16S-23S ribosomal RNA gene (rDNA) intergenic spacer (IGS) sequences, was developed. Initial generic amplification of bacterial rDNA IGS sequences from soil DNA was followed by specific amplification of (1) sequences affiliated with Rhizobium leguminosarum bsensu latoQ and (2) R. tropici . Using analysis of the amplified sequences in clone libraries obtained on the basis of soil DNA, this two-sided method was shown to be very specific for rhizobial subpopulations in soil. It was then further validated as a direct fingerprinting tool of the target rhizobia based on denaturing gradient gel electrophoresis (DGGE). The PCR-DGGE approach was applied to soils from fields in Brazil cultivated with common bean (Phaseolus vulgaris ) under conventional or no-tillage practices. The community fingerprints obtained allowed the direct analysis of the respective rhizobial community structures in soil samples from the two contrasting agricultural practices. Data obtained with both primer sets revealed clustering of the community structures of the target rhizobial types along treatment. Moreover, the DGGE profiles obtained with the R. tropici primer set indicated that the abundance and diversity of these organisms were favoured under NT practices. These results suggest that the R. leguminosarum—as well as R. tropici —targeted IGS-based nested PCR and DGGE are useful tools for monitoring the effect of agricultural practices on these and related rhizobial subpopulations in soils. D 2005 Elsevier B.V. All rights reserved. Keywords: Culture-independent analysis; Rhizobia; rDNA spacer; Soil management; Diversity; DGGE 0167-7012/$ - see front matter D 2005 Elsevier B.V. All rights reserved. doi:10.1016/j.mimet.2005.05.015 * Corresponding author. Tel.: +31 50 3632151; fax: +31 50 3632154. E-mail address: [email protected] (J.D. van Elsas). Journal of Microbiological Methods 64 (2006) 366 – 379 www.elsevier.com/locate/jmicmeth
Transcript of A ribosomal RNA gene intergenic spacer based PCR and DGGE fingerprinting method for the analysis of...

www.elsevier.com/locate/jmicmeth
Journal of Microbiological Methods 6
A ribosomal RNA gene intergenic spacer based PCR and
DGGE fingerprinting method for the analysis of
specific rhizobial communities in soil
Valeria Maia de Oliveira a, Gilson Paulo Manfio a, Heitor Luiz da Costa Coutinho b,
Anneke Christina Keijzer-Wolters d, Jan Dirk van Elsas c,*
aCentro Pluridisciplinar de Pesquisas Quımicas, Biologicas e Agrıcolas- CPQBA/UNICAMP, CP 6171, CEP 13081-970, Campinas, SP, BrazilbEmbrapa Solos, Rua Jardim Botanico, 1024, CEP 22460-000, Rio de Janeiro, RJ, Brazil
cMicrobial Ecology Department, University of Groningen, P.O.Box 14, 9750AA, Haren, The NetherlandsdPlant Research International, P.O. Box 16, 6700AA Wageningen, The Netherlands
Received 26 May 2005; received in revised form 30 May 2005; accepted 30 May 2005
Available online 12 July 2005
Abstract
A direct molecular method for assessing the diversity of specific populations of rhizobia in soil, based on nested PCR
amplification of 16S-23S ribosomal RNA gene (rDNA) intergenic spacer (IGS) sequences, was developed. Initial generic
amplification of bacterial rDNA IGS sequences from soil DNA was followed by specific amplification of (1) sequences
affiliated with Rhizobium leguminosarum bsensu latoQ and (2) R. tropici. Using analysis of the amplified sequences in clone
libraries obtained on the basis of soil DNA, this two-sided method was shown to be very specific for rhizobial subpopulations in
soil. It was then further validated as a direct fingerprinting tool of the target rhizobia based on denaturing gradient gel
electrophoresis (DGGE).
The PCR-DGGE approach was applied to soils from fields in Brazil cultivated with common bean (Phaseolus vulgaris)
under conventional or no-tillage practices. The community fingerprints obtained allowed the direct analysis of the respective
rhizobial community structures in soil samples from the two contrasting agricultural practices. Data obtained with both primer
sets revealed clustering of the community structures of the target rhizobial types along treatment. Moreover, the DGGE profiles
obtained with the R. tropici primer set indicated that the abundance and diversity of these organisms were favoured under NT
practices.
These results suggest that the R. leguminosarum—as well as R. tropici—targeted IGS-based nested PCR and DGGE are
useful tools for monitoring the effect of agricultural practices on these and related rhizobial subpopulations in soils.
D 2005 Elsevier B.V. All rights reserved.
Keywords: Culture-independent analysis; Rhizobia; rDNA spacer; Soil management; Diversity; DGGE
0167-7012/$ - s
doi:10.1016/j.mi
* Correspondin
E-mail addre
4 (2006) 366–379
ee front matter D 2005 Elsevier B.V. All rights reserved.
met.2005.05.015
g author. Tel.: +31 50 3632151; fax: +31 50 3632154.
ss: [email protected] (J.D. van Elsas).

V.M. de Oliveira et al. / Journal of Microbiological Methods 64 (2006) 366–379 367
1. Introduction
The use of the microbial diversity of soil to ensure
environmental sustainability is a major challenge in
agriculture (Van Elsas et al., 2002; http://www.biodiv.
org/). In particular, biological nitrogen fixation (BNF)
mediated by rhizobia is likely to become increasingly
important in this respect (Hirsh, 1992; Kahindi et al.,
1997), as it may allow a significant reduction of
nitrogen fertiliser input (Coutinho et al., 2000).
Since rhizobial-host plant interactions are often highly
specific (Hungria and Stacey, 1997), the diversity of
rhizobial species in soil will certainly affect the effi-
ciency of natural BNF. For instance, BNF in most
bean crops in the tropics is typically carried out by
different rhizobial species within the Rhizobium legu-
minosarum/R. tropici radiation, e.g. R. legumino-
sarum, R. tropici and several other related groups
(Laguerre et al., 1996; Vlassak et al., 1996; Aguilar
et al., 1999).
There is great conservation potential in the use of
no-tillage (NT) instead of conventional-tillage (CT)
agricultural systems (e.g. Kahindi et al., 1997). In
Brazil, NT has already been applied to large areas
of commercial legume (including soybean and com-
mon bean) cropping and it is widely used in the
Brazilian Cerrado biome.
Given the importance of natural rhizobial commu-
nities for legume cropping, a better understanding of
the extant rhizobial diversity in soil is primordial for a
sound assessment of the efficiency of these agricul-
tural practices. Rhizobial communities might even
serve as bioindicators to estimate the impact caused
by the agricultural practices (Coutinho et al., 1999).
Hence, a method for the direct monitoring of these
target rhizobial populations in soil is needed.
In particular due to the non-culturability conun-
drum (Pace, 1997), traditional microbiological techni-
ques based on cultivation are not adequate as the sole
basis for the monitoring of soil rhizobial communities
(Hugenholtz et al., 1998). Common techniques for
isolating and enumerating rhizobia from soil involve
the use of trap plants, a practice which only selects for
those strains that are efficient in nodulating the very
plant species used as the trap (Handley et al., 1998;
Mercante et al., 1998). Direct soil DNA-based molec-
ular techniques are the methods of choice to overcome
the limitations of these culture-dependent approaches
(Hugenholtz et al., 1998; Van Elsas et al., 2000). For
instance, the use of PCR in conjunction with cloning
and sequencing for the analysis of ribosomal RNA
gene (rDNA) fragments directly from soil can be
highly informative (Akkermans et al., 1995; Kowal-
chuk et al., 2004). In addition, denaturing gradient gel
electrophoresis (DGGE) of PCR-amplified DNA frag-
ments offers a rapid means for the study of complex
bacterial populations in environmental samples, either
at a gross taxonomic level (Muyzer et al., 1993, 1995;
Heuer and Smalla, 1997) or at more refined, e.g.
genus, levels (Garbeva et al., 2003, 2004; Salles et
al., 2002).
In the current study, we aimed at the development
and validation of a soil DNA based method for gen-
erating 16S–23S rDNA IGS fragments specific for
rhizobial groups that commonly nodulate bean, cen-
tered around (1) R. leguminosarum (R. legumino-
sarum bsensu latoQ, including R. tropici) and (2) R.
tropici. We then used the method to assess its suit-
ability in the evaluation of the effect of NT versus CT
practices on the diversity of the target rhizobial com-
munities in soil.
2. Materials and methods
2.1. Bacterial strains and growth conditions
The bacterial strains used and their sources are
listed in Table 1. Rhizobium strains were grown in
yeast–mannitol (YM) broth (0.5 g KH2PO4, 0.2 g
MgSO4d 7H2O, 0.1 g NaCl, 0.5 g yeast extract, 10 g
mannitol and 0.5% bromothymol blue litre�1 distilled
water) for 48 h at 28 8C under constant shaking.
Long-term storage was at �80 8C in 50% (v/v) glyc-
erol and by lyophilization.
2.2. Field experiment and soil samples
Soil samples were collected, as outlined below,
from a field experiment conducted by Embrapa
Meio Ambiente (http://www.cnpma.embrapa.br) in
Guaıra, located in the North of the State of Sao
Paulo, Brazil. The soil was typical of the Brazilian
Cerrado (acid oxisol), with an average pH (CaCl2) of
5.0 and an organic matter content of 2.8% in the top
layer (0–20 cm). The experimental area comprised

Table 1
Bacterial strains and responses to specific primer sets I and II
Strains Host plant/remark PCR with set: DGGE band:
I II
R. leguminosarum
bv trifolii R62 Trifolium repens + � I A
bv phaseoli CCT4168 Phaseolus vulgaris + � I B
bv viciae CCT5087 Vicia sativa + � I C
CCT 6305* Trifolium pratense + � I D
CCT 6308* V. sativa + � I E
CCT 6310 T. procumbens + � I F
CCT 6314 P. vulgaris + � I G
CCT 6315 P. vulgaris + � I H, I
CCT 6317 Lathyrus sp. + � I J
CCT 6323 Lathyrus sp. + � I K
R. tropici
CCT4160 + + I L1 II, A
CCT4164 + + I L2 II, B
Sinorhizobium meliloti
CCT4167 � � NA
Sinorhizobium loti Lotus spp.
CCT4063 � � NA
Agrobacterium spp.* Compiled data � � NA
Rhodopseudomonas palustris* Tested close relatives � � NA
Soil isolates (unidentified) Random isolates from soil � � NA
CCT, Tropical Culture Collection, Fundacao Andre Tosello (Campinas, SP, Brazil).
*CCT6305: also at this position: CCT6306 (from T. repens) and CCT6320 (Lens sp). CCT6308: also at this position: CCT6321 (Lathyrus sp)
and G49 (Cajanus Cajan).
Agrobacterium spp.: A. tumefaciens, A. rhizogenes and A. vitis (Partially from De Oliveira et al., 1999). R. palustris: strains NCIB8288 and
WS17. Ten random soil isolates were also subjected to PCR amplification with systems I and II.
DGGE band: I indicates system I band visualised on DGGE, II similarly for system II. NA: not applicable. A, B, . . .: indicate different positions
in gel.
V.M. de Oliveira et al. / Journal of Microbiological Methods 64 (2006) 366–379368
four plots established at random: two no-tillage treat-
ment plots (NT I and NT II) and two plots under
conventional tillage (CT I and CT II). In the former
plots, the remains from the previous soybean crop
were treated with 2.0 L ha�1 of glyphosate bNortoxQand 1.5 L ha�1 of 2,4-dichlorophenoxyacetate-amine
20 days prior to sowing common bean, and the top
soil was not ploughed or disc-harrowed. In the latter
plots, the remains from the previous crop were incor-
porated into the soil by ploughing and disc-harrowing
the top soil. Common bean (Phaseolus vulgaris) was
sown over rows supplemented with 300 kg ha�1 N–
P–K (2 :20 :20) fertiliser.
Thirty days after sowing, ten individual samples
(approx. 100 g each) from each plot were collected at
random, from the top soil layers (20 cm), between the
bean rows. These samples were pooled per plot and
stored at �20 8C for subsequent DNA extraction. In
addition, a pooled sample was similarly obtained from
the area before establishment of the experiment, yield-
ing a time-zero (T0) sample.
2.3. Extraction of DNA from pure cultures and soil
Total genomic DNA was isolated from pure cul-
tures of reference strains essentially according to
Pitcher et al. (1989). As evidenced by gel electropho-
resis (Sambrook et al., 1989), high molecular weight
genomic DNA of sufficient purity to allow direct PCR
was obtained from all strains under study.
Direct extraction of soil DNA using mechanical lysis
was based on a modification of a previously described

Table 2
Sequence, target and reference of primers used in this study
Primer Sequencea (5VY3V) Target group Reference
pHr TGC GGC TGG ATC ACC TCC TT Bacteria Massol-Deya et al., 1995
p23S uni322anti GGT TCT TTT CAC CTT TCC CTC Bacteria Honeycutt et al., 1995
U968 AAC GCG AAG AAC CTT AC Bacteria Heuer et al., 1997
L1401 CGG TGT GTA CAA GGC CCG GGA ACG Bacteria Heuer et al., 1997
rhizo2f GAT GGC ACC AGT CAG GTG AC R. leguminosarum
and R. tropici
De Oliveira et al., 1999
trop1f CGG ACR TGS CCC GAT AT R. tropici De Oliveira et al., 1999
rhizo3r GGA AGA CTT GAA YTT CCG A R. leguminosarum
and R. tropici
De Oliveira et al., 1999
GC clampb CGCCCGGGGCGCGCCCCGGGCGGGGCGGGGGCACGGGGGG – Muyzer et al., 1993
a Y=T or C; R=A or G; S=C or G.b GC clamp was attached to the 5V end of the primer rhizo3r.
V.M. de Oliveira et al. / Journal of Microbiological Methods 64 (2006) 366–379 369
protocol (Smalla et al., 1993), using 2 g of soil. Two
final purification steps with theWizard DNAClean-Up
System (Promega, Madison, WI, USA) were used, as
recommended (Van Elsas et al., 1997). To assess the
robustness of the method, duplicate DNA extractions
were performed for each composite soil sample. The
integrity and concentration of the purified soil DNA
were assessed by electrophoresis on 0.8% agarose gels
(Sambrook et al., 1989). All soil DNA obtained was
10–25 kb in size. On estimation from gel (visual com-
parison to bands of marker DNA at known quantity),
5–15 Ag DNAwas obtained per g of each soil.
2.4. PCR amplification of 16S–23S rDNA IGS
fragments
A nested PCR approach was used with soil DNA to
amplify R. leguminosarum and/or R. tropici IGS frag-
ments. Two sets of primers were used (Table 2).
Independent nested PCRs were performed using com-
munity DNA from each soil. In the first PCR reaction,
bacterial 16S–23S rDNA IGS sequences were gener-
ically amplified using the conserved primers pHr
(Massol-Deya et al., 1995) and p23Suni322anti (Hon-
eycutt et al., 1995). PCR was performed in 50 ALreaction volumes as described previously (Rosado et
al., 1996). Phage T4 gene 32 protein and formamide
were added to improve the efficiency of target ampli-
fication when using soil DNA (Tebbe and Vahjen,
1993; Van Elsas et al., 1997). PCR amplifications
were carried out using initial denaturation at 95 8Cfor 2 min, followed by 30 cycles of 1 min at 94 8C, 1min at 60 8C and 3 min at 72 8C; and a final extension
at 72 8C for 5 min, in a Perkin Elmer thermal cycler
model 480 (Perkin-Elmer, Nieuwerkerk aan de IJssel,
The Netherlands).
In the second PCR, the primer sets I (rhizo2f/rhi-
zo3r) and II (trop1f/rhizo3r) as in De Oliveira et al.
(1999) were employed, in separate reactions, to ampli-
fy R. leguminosarum/R. tropici and R. tropici-specific
rDNA spacer fragments, respectively. Products for
subsequent DGGE analyses were prepared with the
GC-clamped reverse primer rhizo3r (Table 2). Aliquots
of 1 AL from the first PCRwere used as templates in the
subsequent (50 AL) reactions, from which formamide
or phage T4 gene 32 protein were omitted. Touchdown
PCR (Muyzer et al., 1995) was performed in order to
optimize both specificity and sensitivity. An initial
denaturation step at 95 8C for 2 min and a final exten-
sion step at 72 8C for 10 min were performed for all
samples. For primer set I, after denaturation at 94 8C for
1 min, the annealing temperature was initially set at 62
8C for 30 s, and then decreased to 60 8C by 1 8C every 3
cycles, followed by 26 additional cycles at 58 8C;primer extension was performed at 72 8C for 45 sec.
For primer set II, after denaturation at 94 8C for 1 min,
the annealing temperature was set at 55 8C for 1 min
and then decreased to 51 8C by 2 8C every 3 cycles;
then 26 additional cycles were carried out at 50 8C;primer extensionwas performed at 72 8C for 1min. The
same amplification conditions were used to amplify
IGS fragments from the reference strains, using 50 ng
of genomic DNA.
On the basis of an analysis of database sequences,
the expected fragment sizes were 200–320 bp (primer
set I) and 240–400 bp (primer set II). The amplicons

V.M. de Oliveira et al. / Journal of Microbiological Methods 64 (2006) 366–379370
were checked by electrophoresis on 1.4% agarose gels
in 0.5 strength TBE buffer (Sambrook et al., 1989)
and stored at �20 8C for subsequent cloning and
DGGE analyses.
2.5. Construction and analysis of IGS fragment clone
libraries
Clone libraries were constructed on the basis of
IGS fragments generated with both primer set I and II
from soil DNA obtained from treatments T0, NT and
0.1
Brucella abortus (X95889)
RH CL78 (=RH CL117; RH CL191; RH CLAgrobacterium rhizogenes CCT 4832T (AAgrobacterium rhizogenes CCT 4842 (AF
RH CL8
RH CL59Rhizobium leguminosarum CCT 6323 (AF17604
Rhizobium leguminosarum CCT 6308 (AF1
Rhizobium leguminosarum bv. trRhizobium leguminosarum strain D
RH CL64
RH CL57 RH CL46 (=RH CL49)
RH CL14 (=RH CLRhizobium leguminos
RH CL7 (=RH CL6; RH CL56; RH CL73RH CL11 (=RH CL4; RH CL
Rhizobium leguminosarum bv. phRhizobium sp. Glm 12 (AF510884)
TR CL126 (=TR CL136; TR CL142) Rhizobium sp. vgs 5 (AF510902)
Rhizobium etli strain LMG 17827 (AF5Rhizobium mongolense USD
Rhizobium gallicum strain R602 clonTR CL119
RH CL93 (=RH CL22; RH CL76; RH Rhizobium sp. Glm 10 (AF510882)
TR CL108 (=TR CL121) Rhizobium tropici CCT 4160T (A
Rhizobium tropici LMG 9503 (AF34
TR CL148 (=TR CL127; TR CL128TR CL157 (=TR CL149; TR CL15Rhizobium hainanense USDA 3TR CL125
RH CL196 (=RH CL9; RH CL10; RH CL
RH CL198 RH CL29 (=RH CL66; RH CL83; R
RH CL19 (=RH CL81) Agrobacterium vitis (U4532
Rhizobium galegae LMG 61Agrobacterium tumefaciens DSM 3020Rhizobium sp. Phr 8 (AF510898)
RhizoRH CL50
RH CL21 (=RH CL20; RH CL24; RHRH CL203 (=RH CL32
Rhizobium sp. Phr 9
SinorhizobiumSinorhizobium
SinorhizoRH CL183
TR CL103 TR CL113 (=TR
RH CL15 (=RH CL38) RH CL31
Rhizobium rubi DSM 6772 clone
Rhizobium sp. IRBG 74 clone 20 (AF364839)
100
100
74
100
100
96
100
96
79
91
77
92
83
98
78 100
100
95
100
99 96
98
Fig. 1. Phylogenetic analysis of partial 16S–23S rDNA IGS sequences of
(clones named TR), and related species mostly obtained from RISSC (Ga
and the neighbor joining method for tree reconstruction. Bootstrap values (
in brackets showed z97% similarity with the clone represented in the b
Brucella abortus was used as the outgroup (distantly-related group used
CT. The PCR products were first purified using the
bHigh-pure PCR product purification kitQ (Roche).
They were then ligated into the pGEM-T vector
using the Promega (Oss, NL) cloning kit, after
which competent Escherichia coli cells were trans-
formed with the ligation mixes. Using blue/white
screening, for each treatment 19 clones with putative
inserts were selected, and the presence of inserts was
verified by specific PCR. The products generated
from the clones were (1) assessed for migration on
DGGE gel (after re-amplification to introduce the GC
199; RH CL205) F091795) 091797)
7) 76046)
ifolii CCT 4179 (AF091791) SM 30141 (AF345272)
5; RH CL33; RH CL71)arum bv. viceae CCT 5087T (AF091793) ; RH CL90; RH CL194) 52; RH CL75; RH CL79; RH CL87; RH CL184; RH CL187) aseoli CCT 4168 (AF091789)
41974) A 1844 (AF321873) e1 (AF345267)
CL84; RH CL92; RH CL192)
F091801) 5278)
; TR CL129; TR CL131; TR CL147; TR CL153; TR CL155; TR CL197) 8)
588 (AF345269)
12; RH CL55; RH CL67; RH CL72)
H CL85; RH CL86; RH CL200)
9) 24 (AF345265) 5 (AF345274)
bium sp. Trr 9 (AF510897)
CL37; RH CL43) ) (AF510901)
xinjiangense strain CCBAU 110 (AF284450) fredii LMG 6217 (AF345282)
bium arboris LMG 14919 (AF345281)
CL109; TR CL115; TR CL116; TR CL118; TR CL122; TR CL123; TR CL124)
2 (AF345277)
Cluster I
Cluster II
Cluster III
Cluster IV
Cluster V
Cluster VI
Cluster VII
Cluster VIII
soil clones, obtained with PCR systems I (clones named RH) and II
rcia-Martinez et al., 2001) using the Kimura 2p evolutionary model
1000 replicate runs, shown as %) greater than 70% are listed. Clones
ranch. GenBank accession numbers are listed after species names.
for tree rooting).

V.M. de Oliveira et al. / Journal of Microbiological Methods 64 (2006) 366–379 371
clamp), and (2) electrophoresed on agarose gel to
assess their sizes. Clones with inserts of the expected
sizes were selected for sequencing. About 190–200 bp
of high-quality sequence was obtained per clone, and
all analyses were based on this sequence information.
For phylogenetic analysis and tree construction, 91
clones from the total (102) were used. The sequences
removed from the analyses were mostly too small or
of too low quality to be analysed, as described later.
2.6. DGGE analysis
DGGE was carried out in the PhorU2 System
(Ingeny, Goes, The Netherlands), as described else-
where (Rosado et al., 1998), using a linear denaturing
gradient of urea and formamide ranging from 45% to
65%. Gels were run at 100 Vand 60 8C for 16 h in 0.5
X TAE buffer (Sambrook et al., 1989). A DGGE
marker, composed of a mixture of 16S rDNA frag-
ments from Enterobacter cloaceae BE1; Listeria
innocua ALM105; R. leguminosarum bv. trifolii
R62; Arthrobacter sp. Ar1 and Burkholderia cepacia
P2 (listed in order of migration on DGGE gel) gener-
ated with primer set U968-GC and L1401 (Table 2),
was used as the reference in the gels (De Oliveira et
al., 1999). Gels were stained and documented as
described (Rosado et al., 1998).
DGGE patterns were analysed by using GelCom-
par v. 4.1 (Applied Maths, Kortrijk, Belgium) and
UPGMA-based dendrograms constructed from Pear-
son (product–moment) correlation coefficient matrices
(Pearson, 1926).
2.7. Sequencing of clone inserts and DGGE bands
To obtain sequences from the IGS fragment clones,
specific PCR products were generated by primer sets I
and II. To obtain sequences from DGGE bands, small
blocks of acrylamide gel containing fragments of
interest were excised from gel and DNAwas extracted
by using the bcrush and soakQ method (Sambrook et
al., 1989). Pellets were resuspended in 15 AL TE
buffer for subsequent PCR and cloning. The DNA
from selected bands was then diluted and subjected to
PCR using the DGGE primer set. The dilution that
yielded one single band with migration distance
equivalent to the band of interest in DGGE was then
used as the template in subsequent PCR reactions,
using primers without GC clamp. PCR products (2
AL) were cloned into the pCRR2.1 vector (TA cloning
kit; Invitrogen, Leek, The Netherlands).
Sequencing of the inserts of IGS clones was per-
formed on PCR products generated from the respec-
tive clones. Sequencing of DGGE bands was
performed on both strands. The Thermo sequenase
fluorescently-labelled primer cycle sequencing kit
was used with 7-deaza-dGTP (Amersham Nederland
BV, s Hertogenbosch, The Netherlands) in an auto-
matic sequence analyser (ALF DNA sequencer;
Amersham).
2.8. Phylogenetic analysis of 16S–23S rDNA IGS
fragments
Sequences of the 16S–23S rDNA IGS fragments
generated in this study were compared with reference
sequences that showed highest similarity values in
BLAST-N searches as well as a selected outgroup
sequence, all recovered from GenBank and/or RISSC
(Garcia-Martinez et al., 2001). The sequences were
aligned using the CLUSTAL-X program (Thompson
et al., 1994) and analysed using PAUP (version 4.0
beta 10) (Swofford, 2000). Evolutionary distances
were calculated using the Kimura 2p DNA substitution
model with settings for gap spacing of 10 and gap
extension of 5 (Kimura, 1980). The phylogenetic re-
construction (Fig. 1) was done using the neighbor-
joining algorithm (Saitou and Nei, 1987), with boot-
strap values calculated from 1000 replicate runs, using
the routines included in the PAUP software.
2.9. Genbank accession numbers
Sequences obtained from the clone libraries were
deposited in the Genbank database under the acces-
sion numbers AY736379 to AY736469.
3. Results
3.1. Development and validation of PCR for detection
of target rhizobial groups in soil
The primers composing the R. leguminosarum
bsensu latoQ (rhizo2f/rhizo3r-primer set I) and R. tro-
pici (trop1f/rhizo3r-primer set II)-targeted detection

V.M. de Oliveira et al. / Journal of Microbiological Methods 64 (2006) 366–379372
systems (De Oliveira et al., 1999) were checked for
their specificities by BLAST-N versus the GenBank
database in March 2004. The analysis of primer rhi-
zo2f revealed a total of 89 hits at full homology, all
belonging to bacterial IGS sequences. Of these, 81
(91%) were classified as brhizobialQ and 8 (9%) as
bagrobacterialQ. Similar analysis of the rhizo3r primer
sequence revealed a total of 488 hits, all representing
bacterial IGS sequences. Of these, 466 (95%) were
brhizobialQ, 8 (b2%) from Nitrobacter spp., 8 (b2%)
from Rhodopseudomonas palustris, 4 (b1%) of di-
verse origin and 2 others (b0.5%) bagrobacterialQ.Surprisingly, the R. tropici forward primer sequence
did not show homology to any database sequence.
However, previous work showed that it— in combi-
nation with primer rhizo3r — specifically amplifies
sequences that all belong to or are closely related to R.
tropici (De Oliveira et al., 1999). On the basis of these
combined data, it was hypothesized that the two sys-
tems would specifically amplify sequences centered
around the target species R. leguminosarum and R.
tropici from soils. Prior to assessing soil, we exten-
sively tested the specificity of the two primer sets
directly with selected rhizobial strains as well as
other, related and non-related strains (Table 1). This
analysis corroborated the view that both primer sets
were specific for their intended targets (De Oliveira et
al., 1999).
Amplification products were not obtained when
primer sets I and II were used directly on DNA
from any of the (NT, CT, T0) soils (data not
shown). In contrast, both primer sets yielded PCR
products from all treatments in the nested set-up, as
evidenced by direct gel electrophoresis. Primer set I
generated amplicons of about 200–400 bp, whereas
primer set II yielded amplicons estimated to be about
240 to 450 bp in size. The products appeared as one to
up to four discrete bands on agarose gel, indicating the
occurrence of size heterogeneity in the targets that
were amplified (data not shown).
3.2. Evaluation of IGS-based PCR for the detection of
rhizobial diversity in soil
To evaluate the specificity of the R. legumino-
sarum bsensu latoQ and R. tropici primer sets when
used with DNA from soil communities, clone libraries
were constructed on the basis of soil-extracted DNA
from the NT and CT treatments, as well as from T0
soil. A total of 71 clones was obtained with primer set
I (31 clones from treatment NT, 25 from CT and 15
from T0). For primer set II, another 31 clones were
generated in total (16 from NT, 15 from CT, none
from T0). All clones were subjected to sequence
analysis and the sequences obtained were analysed
for (1) their similarity to database sequences using
BLAST-N, and (2) their phylogenetic relatedness,
both to each other and to a limited set of reference
sequences selected from the database.
BLAST-N analysis revealed that, without any ex-
ception, the sequences of all clones had as their
closest affiliates database entries of IGS regions of
diverse rhizobial/agrobacterial species, including
those of as-yet-uncultured rhizobial-type organisms
(18% of the sequences). The latter (obtained with
primer set I) exclusively referred to hits with three
sequences previously obtained by us from pasture soil
from a field adjacent to the soils under study here (De
Oliveira, unpublished).
Primer set I specifically generated sequences that
showed hits with a range of database entries, mainly
described as belonging to R. leguminosarum, R. tro-
pici, R. gallicum and Rhizobium spp. with diverse
strain designations. In respect of the similarity levels,
about 50% of these sequences had N97% similarity
with database entries, however often with rhizobia
without species designation, or with the aforemen-
tioned as-yet-uncultured putative rhizobia. The per-
centage of hits with database sequences using the 95%
similarity level was 80%, leaving 20% of the
sequences at 89– 95% similarity to database entries.
Primer set II generated sequences which by BLAST-N
analysis fell into only a limited number of types. A
large group of sequences (14 /31; 43%) had IGS
regions of R. tropici as their closest affiliates, all at
97% similarity or higher. A second group of
sequences resembled database sequences assigned to
just a few Rhizobium spp.: phr-9 (12 /31; 37%– N97%
homology), vgs-5 (2 /31; 7%– 90% homology), glm-
10 (1 /31; 3%– 90%) and IRBG74 (1 /31; 3%– 91%).
One sequence resembled R. hainanense (1 /31– N99%
homology).
After removal of repeat sequences from the analysis
and addition of relevant database sequences of closely-
related strains, a phylogenetic tree was constructed
(Fig. 1). When taken together, all sequences clustered,

Fig. 2. a — PCR-DGGE analysis of agricultural treatments using
primer set I (R. leguminosarum/R.tropici specific; primers rhizo2f/
rhizo3r-GC clamp), showing amplification products from replicate
plots (I and II) and duplicate soil DNA extractions (a and b). Lanes:
1—T0, 2—void; 3a, 3b—NTI; 4a, 4b—CTI; 5a, 5b—NTII; 6a,
6b—CTII. M—marker composed of 16S rDNA fragments from
E. cloaceae BE1; L. innocua ALM105; R. leguminosarum bv.
trifolii R62; Arthrobacter sp. Ar1 and B. cepacia P2 (listed in
order of migration on DGGE gel). R—R. leguminosarum
CCT6306. Arrows indicate bands used for identification; upper
arrow: band 1, lower arrow: band 1V. b — Cluster analysis of the
DGGE profiles generated with primer set I, using the Pearson
correlation coefficient and UPGMA method. The marker was
used as an outgroup.
V.M. de Oliveira et al. / Journal of Microbiological Methods 64 (2006) 366–379 373
at high bootstrap values, into eight clearly separable
clusters (clusters I through VIII, Fig. 1). All clusters
exclusively contained sequences from the rhizobial/
agrobacterial radiation, and will be denoted by the
rhizobial species central to it. Cluster I (9 sequences)
was denoted the R. leguminosarum bv trifolii cluster,
although R. rhizogenes (formerly Agrobacterium rhi-
zogenes) also made part of it. Cluster II (6 sequences)
was, after its main identifier, denoted the R. legumino-
sarum bv viciae cluster, cluster III (24 sequences) the
R. leguminosarum bv phaseoli cluster (although
sequences of strains designated as R. gallicum, R.
etli, R. mongolense and Rhizobium spp. also made
part of it), and cluster IV (15 sequences) the R. tropici
cluster (including R. hainanense). Cluster V (8
sequences) had no identifier, as it only contained
sequences from clones. Cluster VI (16 sequences)
was denoted the R. galegae cluster, although sequences
of R. radiobacter (formerly A. tumefaciens) and R. vitis
(formerly A. vitis) also made part if it. Cluster VII (10
sequences) was denoted the Sinorhizobium sp. cluster,
as several different species of Sinorhizobum were in-
cluded. Finally, cluster VIII (3 sequences) was denoted
the R. rubi cluster. Sequences generated with primer set
I were distributed among most of the clusters, whereas
those generated with primer set II were spread only
among clusters III, IV and VII, of which cluster IV
contained the sequences of strains designated as R.
tropici. Probably as a result of the relatively low num-
ber of sequences analysed, we could not discern any
bpreferenceQ of clusters for soil treatment.
3.3. Analysis of rhizobial PCR-DGGE profiles
Amplicons generated with primer set I from the
various R. leguminosarum and two R. tropici strains
were clearly separable on denaturing gels (Table 1),
and in most cases single bands were found per strain,
confirming the results published earlier (De Oliveira
et al., 1999). Bands from strains or clones of clusters I
through IV mostly migrated to different positions in
the gel, but this was not fully consistent, not allowing
a clear rhizobial type-migration distance relationship
(Table 1).
Primer set I yielded relatively complex fingerprints
for all soil samples analysed (Fig. 2a). The profiles
obtained from the T0, NT and CT soil samples consis-
tently contained a total of about 25 to 30 bands (both
faint and clearly visible to intense), of which 12 to 19
appeared as intense bands. Visual inspection of the
profiles revealed a high consistency of the profiles
between the replicate plots per treatment. In addition,
there were substantial similarities across treatments.
This is reflected in the clustering data performed by
using GelCompar software (Fig. 2b). As expected,
profiles obtained by replicate extractions from the
same plot clustered most closely together (similarity
levels of roughly 84–90%), whereas profiles from rep-
licate plots clustered at lower similarity levels (82%

CT
I-b
NT
II-b
NT
I-b
CT
II-b
CT
II-a
CT
I-a
NT
II-a
NT
I-a
M M
a
b
CT I-aCT I-bCT II-a CT II-bNT I-aNT I-bNT II-bNT II-a
100806040200
Fig. 3. a — DGGE analysis of agricultural treatments NT and CT
(T0 not included, as amplification yielded only faint products) using
primer set II (R. tropici specific; trop1f/rhizo3r-GC clamp), showing
amplification products from duplicate soil DNA extractions (a, b).
from replicate plots (I, II) M: DGGE marker (see Fig. 2a). b —
Cluster analysis of the R. tropici DGGE profiles.
M CTI a b c d e f M g h I j k l m n o CTII M
Fig. 4. Example of matching of clones generated by primer set I and
directly obtained DGGE profiles of agricultural treatments. Treat-
ment CT (CTI, CTII) is shown. Letters indicate different clones. M
DGGE marker (see Fig. 2a). A fair representation of the direc
DGGE patterns is reflected in the clones.
V.M. de Oliveira et al. / Journal of Microbiological Methods 64 (2006) 366–379374
NT; 72% CT). Since the between-treatment differences
were often larger than the within-treatment differences,
this resulted in a predicted overall clustering of the
community profiles approximately along treatment
(Fig. 2b).
Primer set II generated clearly less complex DGGE
profiles from the DNA from the NT and CT soils, with
7–8 (NT) and 4–5 (CT) bands per profile found (Fig.
3a). The within-treatment variation of the DGGE
profiles obtained with primer set II was dependent
on the treatment. Whereas the profiles from replicate
plots of treatment CT (each performed in duplicate)
showed a high level of similarity (96%, Fig. 3b), those
of treatment NT showed greater variation (~80% sim-
ilarity, Fig. 3b). One profile from the NT treatment
appeared distinct from the remaining ones (Fig. 3a,
NT I-a), showing bands also found in the CT profiles.
However, there were remarkable differences between
the treatments, with both CT-derived profiles being
dominated by just one very strong band in contrast to
the more even NT-derived profiles.
3.4. Matching of clones with bands in DGGE gels
In an attempt to match the clones obtained with the
rhizobial community DGGE profiles generated from
the differently-treated soils, GC-clamped amplicons
produced from all clones were run on denaturing
gels side-by-side with the soil-derived community
profiles they were generated from. Overall, the analy-
ses showed that the clone fragments generated with
primer set I migrated to a total of 22 gel positions.
Visual comparison indicated that these gel positions all
carried (faint to intense) bands in the original soil-
derived profiles. Per soil community profile, coverage
by the GC-clamped clone-derived products was vari-
able but substantial (generally over 60% of discernable
bands), but it was in no case complete. Fig. 4 shows an
example of this analysis (primer set I, CT treatment).
The GC-clamped amplicons generated with primer
set II in all cases each migrated to a single dominant
:
t
V.M. de Oliveira et al. / Journal of Microbiological Methods 64 (2006) 366–379 375
band position, often accompanied by two fainter (pos-
sibly heteroduplex) bands. Analysis of all clones
showed that a total of 6 to 8 dominant band positions
were occupied on gel, of which most were associated
with the bands in the original soil-derived profiles
(data not shown).
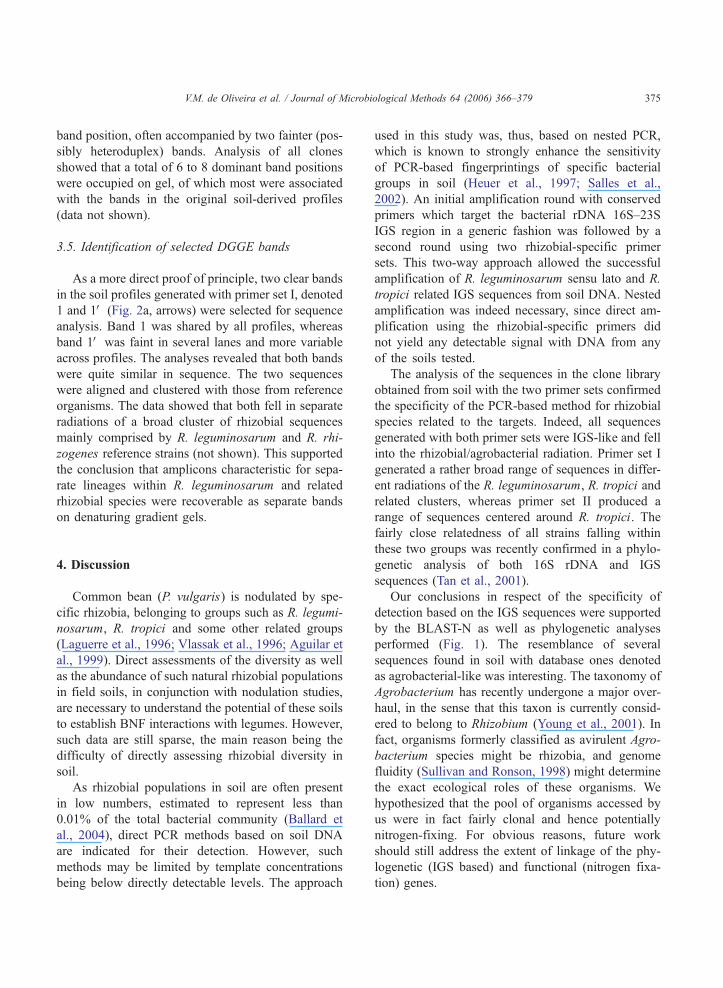
3.5. Identification of selected DGGE bands
As a more direct proof of principle, two clear bands
in the soil profiles generated with primer set I, denoted
1 and 1V (Fig. 2a, arrows) were selected for sequence
analysis. Band 1 was shared by all profiles, whereas
band 1V was faint in several lanes and more variable
across profiles. The analyses revealed that both bands
were quite similar in sequence. The two sequences
were aligned and clustered with those from reference
organisms. The data showed that both fell in separate
radiations of a broad cluster of rhizobial sequences
mainly comprised by R. leguminosarum and R. rhi-
zogenes reference strains (not shown). This supported
the conclusion that amplicons characteristic for sepa-
rate lineages within R. leguminosarum and related
rhizobial species were recoverable as separate bands
on denaturing gradient gels.
4. Discussion
Common bean (P. vulgaris) is nodulated by spe-
cific rhizobia, belonging to groups such as R. legumi-
nosarum, R. tropici and some other related groups
(Laguerre et al., 1996; Vlassak et al., 1996; Aguilar et
al., 1999). Direct assessments of the diversity as well
as the abundance of such natural rhizobial populations
in field soils, in conjunction with nodulation studies,
are necessary to understand the potential of these soils
to establish BNF interactions with legumes. However,
such data are still sparse, the main reason being the
difficulty of directly assessing rhizobial diversity in
soil.
As rhizobial populations in soil are often present
in low numbers, estimated to represent less than
0.01% of the total bacterial community (Ballard et
al., 2004), direct PCR methods based on soil DNA
are indicated for their detection. However, such
methods may be limited by template concentrations
being below directly detectable levels. The approach
used in this study was, thus, based on nested PCR,
which is known to strongly enhance the sensitivity
of PCR-based fingerprintings of specific bacterial
groups in soil (Heuer et al., 1997; Salles et al.,
2002). An initial amplification round with conserved
primers which target the bacterial rDNA 16S–23S
IGS region in a generic fashion was followed by a
second round using two rhizobial-specific primer
sets. This two-way approach allowed the successful
amplification of R. leguminosarum sensu lato and R.
tropici related IGS sequences from soil DNA. Nested
amplification was indeed necessary, since direct am-
plification using the rhizobial-specific primers did
not yield any detectable signal with DNA from any
of the soils tested.
The analysis of the sequences in the clone library
obtained from soil with the two primer sets confirmed
the specificity of the PCR-based method for rhizobial
species related to the targets. Indeed, all sequences
generated with both primer sets were IGS-like and fell
into the rhizobial/agrobacterial radiation. Primer set I
generated a rather broad range of sequences in differ-
ent radiations of the R. leguminosarum, R. tropici and
related clusters, whereas primer set II produced a
range of sequences centered around R. tropici. The
fairly close relatedness of all strains falling within
these two groups was recently confirmed in a phylo-
genetic analysis of both 16S rDNA and IGS
sequences (Tan et al., 2001).
Our conclusions in respect of the specificity of
detection based on the IGS sequences were supported
by the BLAST-N as well as phylogenetic analyses
performed (Fig. 1). The resemblance of several
sequences found in soil with database ones denoted
as agrobacterial-like was interesting. The taxonomy of
Agrobacterium has recently undergone a major over-
haul, in the sense that this taxon is currently consid-
ered to belong to Rhizobium (Young et al., 2001). In
fact, organisms formerly classified as avirulent Agro-
bacterium species might be rhizobia, and genome
fluidity (Sullivan and Ronson, 1998) might determine
the exact ecological roles of these organisms. We
hypothesized that the pool of organisms accessed by
us were in fact fairly clonal and hence potentially
nitrogen-fixing. For obvious reasons, future work
should still address the extent of linkage of the phy-
logenetic (IGS based) and functional (nitrogen fixa-
tion) genes.
V.M. de Oliveira et al. / Journal of Microbiological Methods 64 (2006) 366–379376
On a more specific note, several of the sequences
generated with primer sets I and II were shown to be
related to Rhizobium species designated as R. etli-, R.
mongolense-, R. gallicum-, R. rubi-and Sinorhizo-
bium-like (Fig. 1), thus indicating that a broader
range of target species was amplified than had been
anticipated on the basis of the original primer design
(De Oliveira et al., 1999). The phylogenetic relation-
ships between the rhizobial taxa observed in this
study, based on the 16S–23S IGS sequences (Fig.
1), were also observed when analyses were performed
using 16S rDNA sequences (Phylip Interface, RDP;
http://rdp.cme.msu.edu/html/analyses.html). Hence,
the R. gallicum/R. mongolense, R. galegae/R. vitis/
R. tumefaciens, R. etli/R. leguminosarum and Sinor-
hizobium species clusterings were all confirmed.
These results thus corroborate the robustness of the
groupings found by the IGS analysis.
Analysis of the clone library further showed that
there was no discernible relationship between the
sets of IGS types found and soil treatment. In
other words, similar, apparently brandomQ numbers
of different sequences were obtained from the repli-
cates of the different treatments. This result was not
unexpected, as the time elapsed since the different
land use (CT versus NT) was established was short,
and the numbers of sequences recovered per treat-
ment were likely to be too low for any inference
about the environmental impact to be made with
sound statistical support.
Additional analysis of rhizobial diversity in pasture
soils adjacent to the treatment plots using primer set I
corroborated the results presented here. Briefly, anal-
ysis of a limited set of IGS based sequences revealed
the presence of sequences related to R. tropici (type
strain) as well as that of a cluster of four sequences of
potentially novel rhizobial strains within the cluster
(not shown). These combined data validated the use-
fulness of the specific PCR/DGGE system described
herein.
As already predicted (De Oliveira et al., 1999), the
PCR-DGGE system yielded rhizobial community fin-
gerprints useful for the comparison of soils under
different treatment (e.g. Fig. 2a), albeit with the
biases inherent in all PCR-DGGE analyses of com-
plex bacterial communities. First, we cannot exclude
that IGS microheterogeneity within one organism
played a role, as at least one reference strain, R.
leguminosarum CCT 6315, yielded two different
DGGE bands with primer set I. Such microhetero-
geneity has also been observed for IGS regions of
other taxons such as Enterococcus faecalis (Gortler et
al., 1999), as well as for Paenibacillus species 16S
ribosomal RNA regions (Da Silva et al., 2003). Sec-
ondly, migration distance on gel can only be used as
a very rough, presumptive, estimator of sequence
identity. In our system, migration is governed by
both the melting behaviour (related to G+C% and
nucleotide sequence— Muyzer et al., 1993, 1995),
and the length of the DNA fragments. This combi-
nation of factors, whilst adding extra separation
power to the method, also introduces uncertainty
about the exact nature of separated bands (fragment
length versus sequence). Hence, assigning identity to
the bands in the DGGE profiles should ideally be
supported by sequence analysis, as performed for two
bands of the community in the NT treatment. There-
fore, individual bands in the rhizobial DGGE gels
should not be taken as precise measures of organis-
mal diversity in these communities, since numbers of
bands cannot be strictly related to numbers of differ-
ent bacterial types. On the other hand, it is likely that
the highly similar DGGE profiles produced with
primer set I for the NT and CT soils comprised
related sets of co-migrating bands. Hence, we feel
confident in our conclusion that the differences in the
R leguminosarum sensu lato communities brought
about by the short-term effect of the treatment, al-
though detectable, were likely of fairly minor nature.
Vallaeys et al. (1997) also assessed that co-migrating
bands derived from similar environmental samples
represent fragments with identical sequences, and
thus, the same organisms. On the other hand, larger
differences between NT and CT treatments were
detected when using primer set II, albeit in a more
variable data landscape. The numbers of bands in the
profiles from the CT samples were reduced in com-
parison to those in the NT samples. These data
suggested that the short-term impact of the agricul-
tural practices on the rhizobial community structures
was related to the specific organisms targeted.
Whereas the R. tropici community might have under-
gone a change, changes in the diversities of natural R.
leguminosarum sensu lato populations were minor.
However, interpretation of the dataset obtained with
primer set II needs great caution, as there was en-

V.M. de Oliveira et al. / Journal of Microbiological Methods 64 (2006) 366–379 377
hanced variation in the data. This greater variability
may have been related to the presence of lower
numbers of specific targets in the soils, as DNA
template number can affect the amplification in com-
plex template mixtures (Chandler et al., 1997). Spe-
cifically, targets of low prevalence may be amplified
in a non-representative manner as a result of erratic
amplification in the first cycles (Heuer et al., 1997).
Hence, the extent of the community divergence be-
tween the NT and CT treatments needs further as-
sessment, also in the light of the rather small clone
libraries analysed.
The strategy developed in the current study,
based on IGS-based clone libraries and DGGE
analysis of soil community DNA, enabled us to
rapidly estimate the relative diversity of R. legumi-
nosarum, R. tropici and related rhizobial types in
soils subjected to different treatments. The same
approach should be used and validated in future
studies, of longer duration, to evaluate and monitor
the impact of agricultural practices on natural rhi-
zobial populations.
Acknowledgements
The authors are grateful to Rob Pastoor and Lud-
wina Lankwarden for technical assistance and to P.
Valarini for allowing access to the field experiment.
V.M.O was supported by an SPE grant from Conselho
Nacional de Desenvolvimento Cientıfico e Tecnolo-
gico (RHAE/CNPq, Brazil) and a doctoral fellowship
from Fundacao de Amparo a Pesquisa do Estado de
Sao Paulo (FAPESP, Brazil). H.L.C.C. was supported
by a Research Productivity grant from CNPq. The
support by the EU project POTATOCONTROL to
JDVE is acknowledged.
References
Aguilar, O.M., Grasso, D.H., Riccillo, P.M., Lopez, M.V., Szafer,
E., 1999. Rapid identification of bean Rhizobium isolates by a
nifH gene-PCR assay. Soil Biol. Biochem. 30, 1655–1661.
Akkermans, A.D.L., De Bruijn, F.J., Van Elsas, J.D., 1995. Molec-
ular Microbial Ecology Manual I. Kluwer Acad. Press, Dor-
drecht, NL.
Ballard, R.A., Charman, N., McInnes, A., Davidson, J.A., 2004.
Size, symbiotic effectiveness and genetic diversity of field pea
rhizobia (Rhizobium leguminosarum bv. viciae) populations in
South Australian soils. Soil Biol. Biochem. 36, 1347–1355.
Chandler, D.P., Fredrickson, J.K., Brockman, F.J., 1997. Effect of
PCR template concentration on the composition and distribution
of total community 16S rDNA clone libraries. Mol. Ecol. 6,
475–482.
Coutinho, H.L.C., De Oliveira, V.M., Lovato, A., Maia, A.H.N.,
Manfio, G.P., 1999. Evaluation of the diversity of rhizobia in
Brazilian agricultural soils cultivated with soybeans. Appl. Soil
Ecol. 13, 159–167.
Coutinho, H.L.C., De Oliveira, V.M., Moreira, F.M.S., 2000. Sys-
tematics of legume nodule nitrogen fixing bacteria: agronomic
and ecological applications. In: Priest, F.G., Goodfellow, M.
(Eds.), Applied Microbial Systematics. Kluwer Academic Pub-
lishers, The Netherlands, pp. 107–134.
Da Silva, K.R.A., Salles, J.F., Seldin, L., Van Elsas, J.D., 2003.
Application of a novel Paenibacillus-specific PCR-DGGE
method and sequence analysis to assess the diversity of Paeni-
bacillus spp. in the maize rhizosphere. J. Microbiol. Methods
54, 213–231.
De Oliveira, V.M., Coutinho, H.L.C., Sobral, B.W.S., Guimaraes,
C.T., Van Elsas, J.D., Manfio, G.P., 1999. Discrimination of
Rhizobium tropici and R. leguminosarum strains by PCR-spe-
cific amplification of 16S–23S rDNA spacer region fragments
and denaturing gradient gel electrophoresis (DGGE). Lett. Appl.
Microbiol. 28, 137–141.
Garbeva, P., Van Veen, J.A., Van Elsas, J.D., 2003. Predominant
Bacillus spp. in agricultural soil under different management
regimes detected via PCR-DGGE. Microb. Ecol. 45, 302–316.
Garbeva, P., Van Veen, J.A., Van Elsas, J.D., 2004. Assessment of
the diversity and antagonism towards Rhizoctonia solani AG3
of Pseudomonas species in soil from different agricultural
regimes. FEMS Microbiol. Ecol. 47, 51–64.
Garcia-Martinez, J., Bescos, I., Rodriguez-Sala, J.J., Rodriguez-
Valera, F., 2001. RISSC: a novel database for ribosomal
16S–23S RNA gene spacer regions. Nucleic Acids Res.
29, 178–180.
Gortler, V., Rao, Y., Pearson, S.R., Bates, S.M., Mayall, B.C., 1999.
DNA sequence heterogeneity in three copies of the long 16S–
23S rDNA spacer of Enterococcus faecalis isolates. Microbiol-
ogy 145, 1785–1796.
Handley, B.A., Hedges, A.J., Beringer, J.E., 1998. The importance
of host plants for detecting the population diversity of Rhizobi-
um leguminosarum biovar viciae in soil. Soil Biol. Biochem.
30, 241–249.
Heuer, H., Smalla, K., 1997. Application of denaturing gradient gel
electrophoresis (DGGE) and temperature gradient gel electro-
phoresis for studying soil microbial communities. In: van Elsas,
J.D., Wellington, E.M.H., Trevors, J. (Eds.), Modern Soil Mi-
crobiology. Marcel Dekker Inc., New York, pp. 353–373.
Heuer, H., Krsek, M., Baker, P., Smalla, K., Wellington, E.M.H.,
1997. Analysis of actinomycete communities by specific ampli-
fication of genes encoding 16S rRNA and gel-electrophoretic
separation in denaturing gradients. Appl. Environ. Microbiol.
63, 3233–3241.
Hirsh, A.M., 1992. Developmental biology of legume nodulation.
New Phytologist 122, 211–237.

V.M. de Oliveira et al. / Journal of Microbiological Methods 64 (2006) 366–379378
Honeycutt, R.J., Sobral, B.W.S., McClelland, M., 1995. tRNA
intergenic spacers reveal polymorphisms diagnostic for Xantho-
monas albilineans. Microbiology 141, 3229–3239.
Hugenholtz, P., Goebel, B.M., Pace, N.R., 1998. Impact of culture-
independent studies on the emerging phylogenetic view of
bacterial diversity. J. Bacteriol. 180, 4765–4774.
Hungria, M., Stacey, G., 1997. Molecular signals exchanged be-
tween host plants and rhizobia: basic aspects and potential
application in agriculture. Soil Biol. Biochem. 29, 819–830.
Kahindi, J.H.P., Woomer, P., George, T., Moreira, F.M.S., Karanja,
N.K., Giller, K.E., 1997. Agricultural intensification, soil bio-
diversity and ecosystem function in the tropics: the role of
nitrogen-fixing bacteria. Appl. Soil Ecol. 6, 55–76.
Kimura, M., 1980. A simple method for estimating evolutionary
rate of base substitutions through comparative studies of nucle-
otide sequences. J. Mol. Evol. 16, 111–120.
Kowalchuk, G., Akkermans, A.D.L., De Bruijn, F.J., Head, I.M.,
Van Elsas, J.D., 2004. Molecular Microbial Ecology Manual II.
Kluwer Acad. Press, Dordrecht, NL.
Laguerre, G., Mavingui, P., Allard, M.R., Charnay, M.P., Louvrier,
P., Mazurier, S.I., Rigottier-Gois, L., Amarger, N., 1996. Typing
of rhizobia by PCR DNA fingerprinting and PCR-restriction
fragment length polymorphism analysis of chromosomal and
symbiontic gene regions — application to Rhizobium legumi-
nosarum and its different biovars. Appl. Environ. Microbiol. 62,
2029–2036.
Massol-Deya, A.A., Odelson, D.A., Hickey, R.F., Tiedje, J.M.,
1995. Bacterial community fingerprinting of amplified 16S
and 16S–23S ribosomal DNA gene sequences and restriction
endonuclease analysis (ARDRA). In: Akkermans, A.D.L., Van
Elsas, J.D., De Bruijn, F.J. (Eds.), Molecular Microbial Ecology
Manual. Kluwer Academic Press, Dordrecht, The Netherlands,
pp. 1–8 (section 3.3.2).
Mercante, F.M., Cunha, C.O., Straliotto, R., Ribeiro Jr., W.Q.,
Vanderleyden, J., Franco, A.A., 1998. Leucaena leucocephala
as a trap-host for Rhizobium tropici strains from the Brazilian
bcerradoQ region. Rev. Microbiol. 29, 49–58.
Muyzer, G., De Waal, E.C., Uitterlinden, A.G., 1993. Profiling of
complex microbial populations by denaturing gradient gel elec-
trophoresis analysis of polymerase chain reaction-amplified
genes coding for 16S rRNA. Appl. Environ. Microbiol. 59,
695–700.
Muyzer, G., Hottentrager, S., Teske, A., Wawer, C., 1995. Denatur-
ing gradient gel electrophoresis of PCR-amplified 16S rDNA—
a new molecular approach to analyse the genetic diversity of
mixed microbial communities. In: Akkermans, A.D.L., Van
Elsas, J.D., De Bruijn, F.J. (Eds.), Molecular Microbial Ecology
Manual. Kluwer Academic Publishers, Dordrecht, The Nether-
lands, pp. 1–23 (section 3.4.4).
Pace, N.R., 1997. A molecular view of the microbial diversity and
the biosphere. Science 276, 734–740.
Pearson, K., 1926. On the coefficient of racial likeliness. Biometrika
18, 105–117.
Pitcher, D.G., Saunders, N.A., Owen, R.J., 1989. Rapid extraction
of bacterial genomic DNA with guanidium thiocyanate. Lett.
Appl. Microbiol. 8, 151–156.
Rosado, A.S., Seldin, L., Wolters, A.C., Van Elsas, J.D., 1996.
Quantitative 16S rDNA-targeted polymerase chain reaction
and oligonucleotide hybridization for the detection of Paeniba-
cillus azotofixans in soil and the wheat rhizosphere. FEMS
Microbiol. Ecol. 19, 153–164.
Rosado, A.S., Duarte, G.F., Seldin, L., Van Elsas, J.D., 1998.
Genetic diversity of nifH gene sequences in Paenibacillus azo-
tofixans strains and soil samples analysed by denaturing gradi-
ent gel electrophoresis of PCR-amplified gene fragments. Appl.
Environ. Microbiol. 64, 2770–2779.
Saitou, N., Nei, M., 1987. The neighbor-joining method: a new
method for reconstructing phylogenetic trees. Mol. Biol. Evol.
4, 406–425.
Salles, J.F., De Souza, F.A., Van Elsas, J.D., 2002. Molecular
method to assess the diversity of Burkholderia species in envi-
ronmental samples. Appl. Environ. Microbiol. 68, 1595–1603.
Sambrook, J., Fritsch, E.F., Maniatis, T., 1989. Molecular Cloning:
A Laboratory Manual, 2nd ed. Cold Spring Harbor Laboratory
Press, Cold Spring Harbor, NY, USA.
Smalla, K., Cresswell, N., Mendonca-Hagler, L.C., Wolters, A.C.,
Van Elsas, J.D., 1993. Rapid DNA extraction protocol from soil
for polymerase chain reaction-mediated amplification. J. Appl.
Bacteriol. 74, 78–85.
Sullivan, J.T., Ronson, C.W., 1998. Evolution of rhizobia by acqui-
sition of a 500-kb symbiosis island that integrates into the phe-
tRNA gene. Proc. Nat. Acad. Sc. U. S. A. 95, 5145–5149.
Swofford, D.L., 2000. PAUP*. Phylogenetic Analysis Using Parsi-
mony (*and Other Methods). Sinauer Associates, Sunderland,
MA.
Tan, Z., Hurek, T., Vinuesa, P., Muller, P., Ladha, J.K., Reinhold-
Hurek, B., 2001. Specific detection of Bradyrhizobium and
Rhizobium strains colonizing rice (Oryza sativa) roots by
16S–23S ribosomal DNA intergenic spacer-targeted PCR.
Appl. Environ. Microbiol. 67, 3655–3664.
Tebbe, C.C., Vahjen, W., 1993. Interference of humic acids and
DNA extracted directly from soil in detection and transforma-
tion of recombinant DNA from bacteria and a yeast. Appl.
Environ. Microbiol. 59, 2657–2665.
Thompson, J.D., Higgins, D.G., Gibson, T.J., 1994. CLUSTAL W:
improving the sensitivity of progressive multiple sequence
alignment through sequence weighting, position specific gap
penalties and weight matrix choice. Nucleic Acids Res. 22,
4673–4680.
Vallaeys, T., Top, E., Muyzer, G., Macheret, V., Laguerre, G.,
Rigaud, A., Souglas, G., 1997. Evaluation of denaturing gradi-
ent gel electrophoresis in the detection of 16S rDNA sequence
variation in rhizobia and methanotrophs. FEMS Microbiol.
Ecol. 24, 279–285.
Van Elsas, J.D., Mantynen, V., Wolters, A.C., 1997. Soil DNA
extraction and assessment of the fate of Mycobacterium chlor-
ophenolicum strain PCP-1 in different soils by 16S ribosomal
RNA gene sequence based most-probable-number PCR and
immunofluorescence. Biol. Fertil. Soils 24, 188–195.
Van Elsas, J.D., Smalla, K., Tebbe, A.C., 2000. Extraction and
analysis of microbial community nucleic acids from environ-
mental matrices. In: Jansson, J.K., Van Elsas, J.D., Bailey, M.J.
V.M. de Oliveira et al. / Journal of Microbiological Methods 64 (2006) 366–379 379
(Eds.), Tracking Genetically-Engineered Microorganisms.
Landes Bioscience, Georgetown, Texas, USA, pp. 29–52.
Van Elsas, J.D., Garbeva, P., Salles, J.F., 2002. Effects of agrono-
mical measures on the microbial diversity of soils as related to
the suppression of soil-borne plant pathogens. Biodegradation
13, 29–40.
Vlassak, K., Vanderleyden, J., Franco, A.A., 1996. Competition and
persistence of Rhizobium tropici and Rhizobium etli in tropical
soil during successive bean (Phaseolus vulgaris L) cultures.
Biol. Fertil. Soils 21, 61–68.
Young, J.M., Kuykendall, I.D., Martinez-Romero, E., Kerr, A.,
Sawada, H., 2001. A revision of Rhizobium Frank 1889, with
an emended description of the genus, and the inclusion of all
species of Agrobacterium Conn 1942 and Allorhizobium undi-
cola de Lajudie et al. 1998 as new combinations: Rhizobium
radiobacter, R. rhizogenes, R. rubi, R. undicola and R. vitis. Int.
J. Syst. Evol. Microbiol. 51, 89–103.