![[Posterior cortical atrophy]](https://static.fdokumen.com/doc/165x107/6331b9d14e01430403005392/posterior-cortical-atrophy.jpg)
Pax6 controls cerebral cortical cell number by regulating exit from the cell cycle and specifies...
32
Pax6 controls cerebral cortical cell number by regulating exit from the cell cycle and specifies cortical cell identity by a cell autonomous mechanism Jane C. Quinn a , Michael Molinek a , Ben S. Martynoga a , Paulette A. Zaki a , Andrea Faedo b,1 , Alessandro Bulfone b , Robert F. Hevner c , John D. West d , and David J. Price a,⁎ a Genes and Development Group, Department of Biomedical Sciences, Centres for Integrative Physiology and Neuroscience Research, University of Edinburgh, Hugh Robson Building, George Square, Edinburgh, EH8 9XD, UK. b Stem Cell Research Institute, Dibit, H. S. Raffaele, Via Olgettina 58, 20132 Milan, Italy. c Department of Pathology, University of Washington, Seattle, Washington, WA 98104, USA. d Division of Reproductive and Developmental Sciences, Genes and Development Group, University of Edinburgh, Hugh Robson Building, George Square, Edinburgh, EH8 9XD, UK. Abstract Many cerebral cortical neurons and glia are produced by apical progenitors dividing at the ventricular surface of the embryonic dorsal telencephalon. Other neurons are produced by basal progenitor cells, which are derived from apical progenitors, dividing away from the ventricular surface. The transcription factor Pax6 is expressed in apical progenitors and is downregulated in basal progenitors, which upregulate the transcription factor Tbr2. Here we show that Pax6 −/− cells are under- represented in the cortex of Pax6 +/+ ↔Pax6 −/− chimeras early in corticogenesis, indicating that Pax6 is required for the production of normal numbers of cortical cells. We provide evidence that this underproduction is attributable to an early depletion of the progenitor pool caused by greater than normal proportions of newly divided cells exiting the cell cycle. We show that most progenitor cells dividing away from the ventricular surface in Pax6 −/− embryos fail to express the transcription factor Tbr2 and that Pax6 is required cell autonomously for Tbr2 expression in the developing cortex of Pax6 +/+ ↔Pax6 −/− chimeras. Transcription factors normally expressed ventrally in the telencephalic ganglionic eminences (Mash1, Dlx2 and Gsh2) are upregulated cell autonomously in mutant cells in the developing cortex of Pax6 +/+ ↔Pax6 −/− chimeras; Nkx2.1, which is expressed only in the medial ganglionic eminence, is not. These data indicate that early functions of Pax6 in developing cortical cells are to repress expression of transcription factors normally found in the lateral ganglionic eminence, to prevent precocious differentiation and depletion of the progenitor pool, and to induce normal development of cortical basal progenitor cells. © 2007 Elsevier Inc. This document may be redistributed and reused, subject to certain conditions. ⁎Corresponding author. Fax: +1 44 131 651 1706. [email protected]. 1 Current address: Nina Ireland Laboratory of Developmental Neurobiology, Center for Neurobiology and Psychiatry Genetics, Development and Behavioral Sciences Building, 1550 4th Street, University of California at San Francisco, San Francisco, CA 94143-2611, USA. This document was posted here by permission of the publisher. At the time of deposit, it included all changes made during peer review, copyediting, and publishing. The U.S. National Library of Medicine is responsible for all links within the document and for incorporating any publisher-supplied amendments or retractions issued subsequently. The published journal article, guaranteed to be such by Elsevier, is available for free, on ScienceDirect. Sponsored document from Developmental Biology Published as: Dev Biol. 2007 February 01; 302(1-5): 50–65. Sponsored Document Sponsored Document Sponsored Document
-
Upload
independent -
Category
Documents
-
view
1 -
download
0
Transcript of Pax6 controls cerebral cortical cell number by regulating exit from the cell cycle and specifies...

Pax6 controls cerebral cortical cell number by regulating exit fromthe cell cycle and specifies cortical cell identity by a cellautonomous mechanism
Jane C. Quinna, Michael Molineka, Ben S. Martynogaa, Paulette A. Zakia, Andrea Faedob,1,Alessandro Bulfoneb, Robert F. Hevnerc, John D. Westd, and David J. Pricea,⁎aGenes and Development Group, Department of Biomedical Sciences, Centres for IntegrativePhysiology and Neuroscience Research, University of Edinburgh, Hugh Robson Building, GeorgeSquare, Edinburgh, EH8 9XD, UK.bStem Cell Research Institute, Dibit, H. S. Raffaele, Via Olgettina 58, 20132 Milan, Italy.cDepartment of Pathology, University of Washington, Seattle, Washington, WA 98104, USA.dDivision of Reproductive and Developmental Sciences, Genes and Development Group, Universityof Edinburgh, Hugh Robson Building, George Square, Edinburgh, EH8 9XD, UK.
AbstractMany cerebral cortical neurons and glia are produced by apical progenitors dividing at the ventricularsurface of the embryonic dorsal telencephalon. Other neurons are produced by basal progenitor cells,which are derived from apical progenitors, dividing away from the ventricular surface. Thetranscription factor Pax6 is expressed in apical progenitors and is downregulated in basal progenitors,which upregulate the transcription factor Tbr2. Here we show that Pax6−/− cells are under-represented in the cortex of Pax6+/+↔Pax6−/− chimeras early in corticogenesis, indicating that Pax6is required for the production of normal numbers of cortical cells. We provide evidence that thisunderproduction is attributable to an early depletion of the progenitor pool caused by greater thannormal proportions of newly divided cells exiting the cell cycle. We show that most progenitor cellsdividing away from the ventricular surface in Pax6−/− embryos fail to express the transcription factorTbr2 and that Pax6 is required cell autonomously for Tbr2 expression in the developing cortex ofPax6+/+↔Pax6−/− chimeras. Transcription factors normally expressed ventrally in the telencephalicganglionic eminences (Mash1, Dlx2 and Gsh2) are upregulated cell autonomously in mutant cells inthe developing cortex of Pax6+/+↔Pax6−/− chimeras; Nkx2.1, which is expressed only in the medialganglionic eminence, is not. These data indicate that early functions of Pax6 in developing corticalcells are to repress expression of transcription factors normally found in the lateral ganglioniceminence, to prevent precocious differentiation and depletion of the progenitor pool, and to inducenormal development of cortical basal progenitor cells.
© 2007 Elsevier Inc.This document may be redistributed and reused, subject to certain conditions.
⁎Corresponding author. Fax: +1 44 131 651 1706. [email protected] address: Nina Ireland Laboratory of Developmental Neurobiology, Center for Neurobiology and Psychiatry Genetics,Development and Behavioral Sciences Building, 1550 4th Street, University of California at San Francisco, San Francisco, CA94143-2611, USA.This document was posted here by permission of the publisher. At the time of deposit, it included all changes made during peer review,copyediting, and publishing. The U.S. National Library of Medicine is responsible for all links within the document and for incorporatingany publisher-supplied amendments or retractions issued subsequently. The published journal article, guaranteed to be such by Elsevier,is available for free, on ScienceDirect.
Sponsored document fromDevelopmental Biology
Published as: Dev Biol. 2007 February 01; 302(1-5): 50–65.
Sponsored Docum
ent Sponsored D
ocument
Sponsored Docum
ent
KeywordsChimera; Pax6; Proliferation; Telencephalon; Mouse; Tbr2; Mash1; Nkx2.1; Gsh2; Dlx2; Apicalprogenitor cell; Basal progenitor cell
IntroductionCorrect development requires regulation of the number of cells and the types of cell producedin each region. Regulating the numbers of postmitotic cells generated in the cortex requirescontrol of two key aspects of proliferation: (i) the length of the cell cycle and (ii) the proportionof newly generated cells that re-enter the cell cycle as opposed to leaving it to differentiate. Anumber of cell cycle regulators and transcription factors, including Pax6, have been implicatedin the control of these processes (Calegari and Huttner, 2003; Estivill-Torrus et al., 2002; Heinset al., 2002; Iacopetti et al., 1999; Roy et al., 2004). Two types of progenitor cell exist in thedeveloping neocortex. Radial glia, also known as apical progenitor cells (APCs), divide at theventricular surface either symmetrically, giving rise to two mitotic offspring, or asymmetricallyto produce one mitotic and one postmitotic daughter [for review see Fishell and Kriegstein,2003]. A second proliferative population, derived from the APCs, forms in the subventricularzone: the majority of these cells divide symmetrically to produce two postmitotic neurons, andthey have been designated non-surface dividing cells or basal progenitor cells (BPCs)(Haubensak et al., 2004; Miyata et al., 2004; Noctor et al., 2004; Smart, 1976; Takahashi etal., 1995b). BPCs are thought to generate many of the neurons in the upper cortical layers(Altman and Bayer, 1990; Tarabykin et al., 2001). Pax6 is expressed in APCs and isdownregulated in BPCs (Englund et al., 2005) and, in the present study, we addressedunanswered questions about the functions of Pax6 in the development of these cell types so asto generate a coherent model of the early functions of Pax6 in cortical development.
First, we examined how the overall production of Pax6−/− cortical cells compared to that ofPax6+/+ cells early in corticogenesis. The fact that the dorsal telencephalon of Pax6−/−
embryos is smaller than that of wild types is not sufficient evidence for underproduction sinceit does not exclude the possibility that cells are more densely packed in the mutants, which iscertainly the case in the later stages of corticogenesis (Caric et al., 1997; Kroll and O'Leary,2005; Schmahl et al., 1993). We examined the production of Pax6−/− cells in the cortex ofPax6+/+↔Pax6−/− chimeras, allowing us to compare the numbers of cells with the twogenotypes in the same animals and to test whether abnormalities persist even in the presenceof wild-type cells, i.e., whether they likely reflect a cell autonomous requirement for Pax6. Theresults showed reduced production of mutant cells in our chimeras. We then investigatedwhether Pax6 is required to prevent excessive cell death, to regulate the length of the corticalprogenitor cell cycle or to control the proportion of newly generated cells that re-enter the cellcycle as opposed to leaving it to differentiate. We found that the last of these parameters wasaltered in the Pax6−/− cortex, indicating that Pax6 expression is required to maintain the sizeof the cortical progenitor pool. Next, we examined the BPCs in Pax6−/− embryos. A recentstudy (Englund et al., 2005) showed that BPCs express the transcription factor Tbr2. Thenumber of progenitors dividing away from the ventricular zone (or abventricularly) is increasedin Pax6−/− mutants (Estivill-Torrus et al., 2002; Haubst et al., 2004).We tested whether thesecells resemble normal BPCs in expressing Tbr2 and found that the majority of abventricularmitoses in the Pax6−/− mutant cortex did not express Tbr2. Since Pax6 is normally expressedin APCs and downregulated in BPCs, we determined whether Pax6 is required cellautonomously for Tbr2 expression using Pax6+/+↔Pax6−/− chimeras.
The dorsal telencephalon of Pax6−/− mutants becomes progressively ventralized throughoutcorticogenesis and this is due to a change in the fate of dorsal telencephalic progenitors (Kroll
Quinn et al. Page 2
Published as: Dev Biol. 2007 February 01; 302(1-5): 50–65.
Sponsored Docum
ent Sponsored D
ocument
Sponsored Docum
ent
and O'Leary, 2005). What remains unclear is whether this fate change is a direct cellautonomous consequence of the loss of Pax6 in cortical progenitors or whether it resultsindirectly from a loss of Pax6 in interacting cells. We addressed this issue by examining theexpression of ventral genes in mutant cells in the cortex of Pax6+/+↔Pax6−/− chimeras.
MethodsProduction of Pax6+/+↔Pax6−/− chimeras
Chimeras used to estimate the numbers of mutant cells contributing to the cortex were producedas described in Quinn et al. (1996). In brief, eight-cell embryos were obtained from the parentalcross Pax6Sey-Neu/+, Gpi1b/b female × Pax6+/Sey, Gpi1b/b, Tg/Tg male, where Tg denotes thepresence of the reiterated β-globin transgene TgN(Hbb-b1)83Clo (Keighren and West, 1993;Lo et al., 1987). Embryos of the following four genotypes were obtained from this parentalcross: Pax6+/+, Pax6Sey-Neu/+, Pax6+/Sey and Pax6Sey-Neu/Sey, all of which were Gpi1b/b andcontained a single copy of the β-globin transgene (Tg+). Donor embryos for aggregation wereobtained from (BALB/c x A/J) F2 intercrosses, producing embryos that were Pax6+/+,Gpi1a/a and negative for the β-globin transgene (Tg−). Embryos were collected fromsuperovulated females at 2.5 days post coitum and aggregated according to West and Flockhart(1994). Aggregated embryos were cultured overnight, transferred to recipient pseudopregnantF1 females (Pax6+/+, Gpi1c/c, Tg−).
To increase the efficiency of return of Pax6+/+↔Pax6−/− chimeras for subsequent studies ofthe identities of Pax6−/− cells, we derived Pax6−/− mutant embryonic stem (ES) cells frommice on an inbred 129/Sv background that were hemizygous for the β-globin transgene TgN(Hbb-b1)83Clo (Keighren and West, 1993; Lo et al., 1987) (designated 129SeyD). 129SeyD1ES cells (Pax6−/−, Gpi1a/a, Tg+) were injected into (C57Bl/6 x CBA/Ca) F2 intercrossblastocysts (Pax6+/+, GpiIb/b, Tg−), which were transferred to the uterus of a pseudopregnantrecipient and allowed to develop to the appropriate embryonic stage.
Fetuses were dissected into cold PBS and staged according to forelimb development (Palmerand Burgoyne, 1991; Wanek et al., 1989). Tail and forelimb samples were taken for analysisof glucose phosphate isomerase (GPI1) isotype contribution to give a proportion of globalchimerism for each embryo (West and Flockhart, 1994). A mean percentage GPI1 wasdetermined to give the proportion of cells in the chimera derived from thePax6Sey-Neu/+ × Pax6+/Sey 8-cell embryo or 129SeyD1 ES cells. The genotype of each chimerawas determined by PCR and restriction digest analysis of genomic DNA as describedpreviously (Quinn et al., 1996). The use of two predicted null mutant Pax6 alleles, Pax6Sey andPax6Sey-Neu (Hill et al., 1991), allowed distinction between aggregation chimeras containingPax6Sey-Neu/Sey compound heterozygous (described here as Pax6−/−) cells and those containingPax6Sey-Neu/+ or Pax6+/Sey heterozygous (described as Pax6+/-) cells. Chimeric embryosobtained by ES cell injection were genotyped for the presence of the Pax6Sey allele alone.Histological visualization of cells derived from the Pax6Sey-Neu/+ × Pax6+/Sey embryos or from129SeyD1 ES cells was achieved by DNA–DNA in situ hybridization using a digoxigenin-labeled probe to the reiterated β-globin transgene (Keighren and West, 1993; Quinn et al.,1996). Detection of in situ signal was achieved either with peroxidase-labeled antibodyvisualized with diaminobenzidine (DAB) (Keighren and West, 1993) or by reaction with ananti-digoxigenin rhodamine antibody (Roche). We observed no phenotypic differencesbetween Pax6+/+↔Pax6−/− chimeras obtained by aggregation or ES cell injection.
Quantitative analysis of contribution of Pax6−/− cells to Pax6+/+↔Pax6−/− chimerasPercentages of Tg+ cells in various regions of the forebrain and other tissues of E12.5 chimeraswere measured in a minimum of three non-consecutive sections, with 300–700 cells counted
Quinn et al. Page 3
Published as: Dev Biol. 2007 February 01; 302(1-5): 50–65.
Sponsored Docum
ent Sponsored D
ocument
Sponsored Docum
ent

per area per section, depending on tissue. As in previous studies (Quinn et al., 1996), observedpercentages for each tissue (O) were corrected to allow for failure to identify Tg+ signals inall Tg+ cells due to sectioning artefact. To generate tissue-specific correction factors (c),percentages of Tg+ nuclei in Pax6+/+, Tg+ embryos (i.e., non-chimeric embryos in which allcells should be Tg+) were counted at E12.5. Corrected observed percentages of Tg+ cellcontribution (Oc) for each chimeric tissue were then divided by the percentage of cells expectedin that tissue (E) if the percentage was to equal the global percentage chimerism estimated byGPI1B analysis (Oc/E). Values were compared by Student's t-test.
Production of Pax6−/− miceAll non-chimeric mouse embryos designated Pax6−/− were derived from Pax6Sey heterozygotecrosses maintained on an inbred Swiss background. Wild-type siblings were used as controls.The day of the vaginal plug following mating was designated E0.5. Pregnant females werekilled by cervical dislocation. Fetuses were dissected from the uterus at the required gestationalage before fixing and processing to either wax or plastic sections. Wax sections were cut at10 μm and plastic sections at 5 μm.
Quantitative analysis of cell densities and cortical depthIn all cases, images were captured using Leica NTS confocal microscopy. Areas for cell densityanalysis were defined using Image-Tool™. Cells were counted on a minimum of 5 non-consecutive sections at E12.5. Cell counts/densities were compared using Sigmastat™.Cortical depths were measured in the center of the neocortex using Image Tool and datacompared using Sigmastat™.
Studying cell cycle with iododeoxyuridine (IdU) and bromodeoxyuridine (BrdU)On embryonic day E10.5 or E12.5, IdU was injected i.p. into pregnant dams followed by BrdUinjection (both at 70 μg/g body weight) 1.5 h later (Fig. 2A). Dams were killed at 2.0 h afterthe first injection; embryos were fixed, sectioned and processed to reveal IdU/BrdU usingmouse monoclonal anti-BrdU (Becton Dickson Ltd., UK), which recognized both IdU andBrdU, in conjunction with rat monoclonal anti-BrdU (Abcam Ltd., UK) which recognizedBrdU alone. Directly conjugated AlexaFluor® secondary antibodies were anti-mouseAlexaFluor® 488 and anti-rat AlexaFluor® 568. Images were captured using Leica NTSconfocal microscope, viewed using LCS Lite (Leica) and imported into Adobe Photoshop forcounting. Proportions of IdU/BrdU-labeled cells in the ventricular zone of telencephalon werecounted in a minimum of three (E10.5) or five (E12.5) non-adjacent sections from each embryo.Cell cycle lengths were calculated using the following paradigm (Martynoga et al., 2005): cellsin the initial IdU-labeled cohort that leave S-phase during the interval between IdU and BrdU(Ti = 1.5 h), designated the leaving fraction (Lcells), will be labeled with IdU but not BrdU. Theproportion of cells labeled with BrdU is designated Scells. The length of S-phase (Ts) can becalculated using the formula:
and the length of the cell cycle (Tc) estimated from the formula:
Quinn et al. Page 4
Published as: Dev Biol. 2007 February 01; 302(1-5): 50–65.
Sponsored Docum
ent Sponsored D
ocument
Sponsored Docum
ent

where Pcells is the total number of proliferating cells in the ventricular zone (VZ) (Martynogaet al., 2005). Since previous studies have shown that a prolonged pulse of BrdU will labelvirtually all VZ cells at E12.5, in both wild-type and Pax6−/− embryos, Pcells was estimatedby counting all VZ cells (Estivill-Torrus et al., 2002).
Cumulative BrdU analysesBrdU was given (70 μg/g body weight, i.p.) to E12.5 pregnant dams either once or every 2 hover a 12-h period. Dams were killed 0.5 and 12.5 h after the first injection; embryos werefixed, sectioned and processed to reveal BrdU as described previously (Gillies et al., 1990).The relative intensity of BrdU label in the nucleus of each BrdU-labeled cell in three 200-μm-wide strips through the cortex, in three non-adjacent sections from each embryo, was measuredusing a Leica digital camera and QWin (Leica) software.
Immunocytochemistry on cortical cellsCells from E12.5 neocortex of Pax6+/+ and Pax6−/− embryos were dissociated using papainas per manufacturer's instructions (Papain Dissociation System, Worthington Biochemicals,UK) and stained for β-tubulin isotype III (mouse monoclonal IgG2b, 1:100, Sigma, UK).Visualization was achieved using directly conjugated AlexaFluor® 488 (goat anti-mouse IgG,1:200) or AlexaFluor® 546 (goat anti-mouse IgG, 1:200) (Molecular Probes, Inc.). For cellcounts, 800–1500 viable cells per culture were assessed in six randomly selected microscopefields.
Flow cytometric analysis of cortical cellsCortices were dissociated as above and fixed in ice cold 70% ethanol. Cortical tissue wascollected from E12.5 and E14.5 embryos from 4 separate litters and a minimum of 3 individualsof each genotype pooled at dissection. Dissociated cells were stained for β-tubulin isotype III(1:800); primary antibody binding was revealed using directly conjugated AlexaFluor® 488(1:800) as above. Cells were then stained with propidium iodide (PI) to allow discriminationof single cells and analysis of DNA content. Staining reactions were carried out in duplicate.Cells were analyzed on a Beckman-Coulter XL flow cytometer with Expo32 software(Beckman-Coulter, Inc.). 8000–20,000 cells were analyzed per sample.
Cell death analysisCells from E12.5 neocortex of Pax6+/+ and Pax6−/− fetuses were dissociated and cultured for24 h as described previously (Estivill-Torrus et al., 2002). Cultures contained cells of eithergenotype alone or both genotypes mixed, with one set of cells stained using PKH26 fluorescentcell linker (Sigma) according to the manufacturer's instructions. Cells were fixed with 4%paraformaldehyde and visualized for localization of activated caspase-3 using rabbit polyclonalanti-caspase-3 antibody (Chemicon International; 1:100). Secondary amplification was withanti-rabbit biotin-conjugated antibody (DAKO; 1:200) and visualization was with streptavidin-conjugated AlexaFluor® 488 (Molecular Probes; 1:200). Cells were counterstained withbisbenzimide. Apoptotic cells were identified either by immunoreactivity for activatedcaspase-3 activity (Lesuisse and Martin, 2002; Srinivasan et al., 1998) and/or nuclearchromatin condensation, as described previously (Kerr et al., 1972). Cell counts were done insix randomly selected microscope fields per culture.
Microarray hybridizationTotal RNA from E14.5 neocortex was isolated using a method based on guanidinium lysis andphenol–chloroform extraction (ToTALLY RNA, Ambion). Labeling of total RNA wasperformed using the dendrimer technology (3DNA Submicro Expression Array Detection Kit,Genisphere). The cDNA was then hybridized to a cDNA chip representing 1026 different genes
Quinn et al. Page 5
Published as: Dev Biol. 2007 February 01; 302(1-5): 50–65.
Sponsored Docum
ent Sponsored D
ocument
Sponsored Docum
ent

of the TESS subtractive cDNA library (Faedo et al., 2004) which had been generated bysubtracting genes expressed in adult telencephalon from those expressed in E14.5 cortex(Porteus et al., 1992). Differential gene expression was assessed by scanning the hybridizedarrays as described previously (Faedo et al., 2004). Changes in Tbr2 gene expression wereconfirmed at a protein level by Western blotting for Tbr2 protein expression using standardprotocols. Equal loading of lanes was confirmed using β-actin immunostaining.
ImmunohistochemistryEmbryos were fixed overnight in 4% paraformaldehyde/PBS and processed to wax. Allembryos were sectioned in the coronal plane. Slides were microwaved in 10 mM sodium citrateto achieve maximal antigen retrieval before addition of primary antibody. Antibodies usedwere mouse monoclonal anti-β-tubulin isotype III (Sigma, UK), mouse anti-phosphohistone 3(Abcam Ltd., UK), rabbit polyclonal Tbr2 (Englund et al., 2005), mouse anti-Mash1 (BDBiosciences), rabbit anti-Dlx2 antibody (Abcam Ltd., UK), anti-Gsh2 (Toresson et al., 2000),anti-Nkx2.1 (Biopat) and directly conjugated AlexaFluor® secondary antibodies (MolecularProbes). Nuclei were stained with TOPRO3 (Molecular Probes). Where necessary, signalamplification was achieved using either Dako ABC or Dako Envision Kit prior to staining withDAB.
ResultsCortical thickness is reduced at E12.5 in the Pax6−/− mutant embryo
A reduction in cortical thickness is a reported feature of the homozygous Pax6−/− telencephalicphenotype during mid-late corticogenesis (Caric et al., 1997; Fukuda et al., 2000; Haubst etal., 2004; Schmahl et al., 1993; Warren et al., 1999). To determine whether reduction hadoccurred by E12.5, we measured thickness in the center of the neocortex of Pax6−/− embryosand their wild-type siblings. Neocortical thickness was significantly reduced in Pax6−/−
embryos (Pax6+/+cortex: mean cortical depth 135 μm ± 6.2, SEM; Pax6−/− cortex: meancortical depth 114 μm ± 7.1, SEM; n = 9 in both cases; Student's t-test, p < 0.05).
Pax6−/− cells are under-represented in the dorsal telencephalon of E12.5 Pax6−/−↔Pax6+/+
chimeric miceTo directly compare Pax6−/− and Pax6+/+ cell production in vivo, we createdPax6−/−↔Pax6+/+ chimeras. There are two advantage of this approach. First, it allows a directcomparison of the productivity of mutant and wild-type cells in the same embryo. Second,abnormalities in the production of Pax6−/− cells in chimeras are attributable to a cellautonomous requirement for Pax6 in progenitors (Pratt et al., 2002; Quinn et al., 1996;Talamillo et al., 2003). In Pax6−/− embryos, an absence of Pax6 could affect progenitorsindirectly, as a consequence of a primary effect on other cells (a cell non-autonomous effect),but this is less likely in chimeras where mutant cells can interact with wild-type cells.
We generated chimeras in which a β-globin transgene (designated Tg) labels one of the twosets of cells used to make the chimeras (Pax6−/− cells in Pax6−/−↔Pax6+/+ chimeras or oneset of Pax6+/+ cells in Pax6+/+↔Pax6+/+ control chimeras). Telencephalic regions known toexpress Pax6 in wild-type embryos were examined (Figs. 1C, D). Observation of sections ofE12.5 Pax6−/−↔ Pax6+/+ chimeras indicated lower densities of Pax6−/− cells in Pax6-expressing regions than in Pax6 non-expressing regions. Fig. 1E shows an example of this.The density of Pax6−/− cells (marked with dark dots) in the Pax6-expressing hippocampus waslower than the density of Pax6−/− cells in the cortical hem, in which the majority of cells arePax6 non-expressing (Fig. 1D).
Quinn et al. Page 6
Published as: Dev Biol. 2007 February 01; 302(1-5): 50–65.
Sponsored Docum
ent Sponsored D
ocument
Sponsored Docum
ent
The proportions of Tg+ cells in various tissues were then quantified in these chimeras. Regionsanalyzed were Pax6-expressing hippocampus, neocortex, dorsolateral ganglionic eminence(dLGE) and Pax6 non-expressing midbrain and head mesenchyme. If Pax6 status was neutralin terms of the generation of cell number in these regions, we would expect the percentages ofTg+ cells found in each structure in all chimeras to be similar to the overall percentage of Tg+ cells throughout the embryo; this expected percentage (designated E) was estimated for eachchimera as described in Methods. The percentages of Tg+ cells observed in the structuresstudied, corrected for sectioning artefact (Oc), were obtained and the ratio Oc/E was calculatedfor each region analyzed in each chimera (see Methods). As inclusion of the Tg marker isdevelopmentally neutral (West et al., 1996), we would expect this ratio to be close to 1.0 in allstructures in Pax6+/+;Tg+↔Pax6+/+ chimeras and in structures that do not normally expressPax6 in Pax6−/−;Tg+↔Pax6+/+ chimeras. Mean Oc/E ratios (± SEMs, n = 4 in all cases) arerepresented in Fig. 1F and agree with this expectation. Mean Oc/E ratios were significantlylower in hippocampus, neocortex and dLGE in Pax6−/−;Tg+↔Pax6+/+ chimeras than inPax6+/+;Tg+↔Pax6+/+ chimeras (Fig. 1F).
Cell death is not increased early in corticogenesis in the Pax6−/− neocortexOne possible explanation for the reduced size of the Pax6−/− mutant cortex and the under-representation of Pax6−/− cells in Pax6−/−↔Pax6+/+ chimeras was increased cell death.Although previous studies found no increase in the proportions of apoptotic cells in the cortexof Pax6−/− mutant embryos (Estivill-Torrus et al., 2002; Fukuda et al., 2000; Lotto et al., 2001;Warren et al., 1999), these studies were at later stages of development. We found very fewpyknotic cells in the E10.5–E12.5 cortex of either (i) Pax6−/− embryos (Figs. 1A, B) or (ii)Pax6−/−↔Pax6+/+ embryos (e.g., none are seen in Fig. 1E). Since the proportion of dyingcells at a given time depends on clearance of cells from the tissue, which in this case is unknownand may vary between genotypes, we carried out a further comparison of viability in vitro,where clearance cannot occur. There were no significant differences in the proportions ofapoptotic Pax6−/− and Pax6+/+ E12.5 neocortical cells after 24 h when the two types of cellwere cultured either separately or mixed in a 1:1 ratio. In the mixed cultures, percentages ofapoptotic cells identified (i) by nuclear morphology were 9.16% (± 0.55, SEM, n = 4) amongPax6+/+ cells and 11.14% (± 0.93 SEM, n = 4) among Pax6−/− cells and (ii) by activatedcaspase-3 were 7.75% (± 0.77 SEM, n = 4) among Pax6+/+ cells and 7.53% (± 0.87 SEM,n = 4) among Pax6−/− cells. Proportions of apoptotic cells were also examined in cells acutelydissociated from E12.5 neocortex of Pax6−/− and Pax6+/+ embryos by staining with PI andusing flow cytometry. The proportion of cells in a sub-G1 peak (cells with a hypodiploid DNAcontent) can be used to indicate the proportion of cells undergoing apoptosis (Ormerod,2000). Sub-G1 fractions were not significantly different between Pax6−/− mutant andPax6+/+ neocortex (Pax6+/+ neocortex: 0.45% ± 0.13 SEM, n = 4; Pax6−/− neocortex:1.43% ± 0.59 SEM, n = 3, Student's t-test p = 0.119).
Cell cycle length is not altered in E10.5 and E12.5 Pax6−/− telencephalonUnder-representation of Pax6 mutant cells in the cortex of Pax6−/−↔Pax6+/+ chimeras in theabsence of increased cell death among mutant cells increased the likelihood that the explanationfor the reduced production of Pax6−/− cells results from a cell autonomous alteration in someaspect of their cell cycle. Paradoxically, previous studies indicated that the cell cycle ofPax6−/− telencephalic progenitors is abnormally rapid at E12.5 (Estivill-Torrus et al., 2002;Warren et al., 1999), which might increase cell production. We re-investigated cell cycle lengthin the Pax6−/− telencephalon using a method illustrated in Fig. 2A(Martynoga et al., 2005).Cell cycle lengths for wild-type and mutant telencephalon are shown in Table 1. Consistentwith previous studies (Takahashi et al., 1995a), cell cycle lengths increased between E10.5 andE12.5. At E10.5 similar values for cell cycle length were observed in wild-type and mutantdorsal telencephalon (Table 1, Figs. 2B, C). At E12.5, no significant difference was observed
Quinn et al. Page 7
Published as: Dev Biol. 2007 February 01; 302(1-5): 50–65.
Sponsored Docum
ent Sponsored D
ocument
Sponsored Docum
ent

in cell cycle length between mutant and wild-type neocortex or hippocampus (Table 1; Figs.2D, E). At E12.5, cell cycle lengths in the hippocampus were longer than in the neocortex ofboth mutant and wild-type animals (Table 1). No significant differences were observedbetween wild-type and mutant embryos in the ratio between the length of S-phase and the entirecell cycle length (Ts/Tc) in either hippocampus or neocortex (Table 1). The reasons why thismethod gave a different outcome to that used previously (Estivill-Torrus et al., 2002) arepresented in Discussion. In any case, neither this nor the previous estimates provide evidencethat a lengthening of the cell cycle is the cause of an underproduction of Pax6−/− cells.
Loss of Pax6 reduces S-phase re-entry and increases the proportions of differentiatingneurons
The most likely explanation remaining for a reduction in the production of Pax6−/−
telencephalic cells is premature withdrawal of newborn cells from the cell cycle, causing anincrease in the proportion of differentiated cells with concurrent depletion in the size of theprogenitor pool. Evidence that proportions of dividing cells exiting the cell cycle were higherin Pax6−/− neocortex was obtained by measuring the proportions of lightly and heavily BrdU-labeled cells (Fig. 3A) in the ventricular zone after administering BrdU to E12.5 embryos foreither 30 min or continuously over 12.5 h. Immunocytochemical detection of the amount ofBrdU contained within cells is a well-established method for monitoring progression throughthe cell cycle in flow cytometry experiments (Ormerod, 2000). Similarly, previous studies intissue sections have shown that a pulse of BrdU given to an animal results in cells with differentrelative levels of BrdU labeling. Cells in S-phase at the time of the pulse remain relativelyheavily labeled unless they undergo subsequent divisions, in which case their levels of BrdUare diluted and their labeling becomes relatively lighter (del Rio and Soriano, 1989; Gilliesand Price, 1993; Price et al., 1997). Here, the method was used as follows. After a short pulseof BrdU, cells in S-phase and cells that had just left S-phase would be detected by heavy labeling(Fig. 3B, example 1). After longer pulses, a more lightly labeled population of cells wouldemerge as cells carrying BrdU divide in M-phase and distribute their BrdU load between theirdaughters (Fig. 3B, example 2). The proportion of cells in the lightly labeled population wouldincrease with increasing length of BrdU pulse until a maximum is reached as some cells re-enter S-phase and incorporate more BrdU (Fig. 3B, example 3). We predicted that if more cellsbecome postmitotic in Pax6−/− mutants than in wild-type embryos, then proportions of lightlylabeled cells would be higher in mutants after a continuous 12.5-h pulse of BrdU, which islong enough to allow proliferating cells to re-enter S-phase. Our data are consistent with thisprediction (Figs. 3C–E). After a short pulse (0.5 h), normal distributions of labeling intensitywere obtained from both genotypes (Fig. 3C). After longer pulses (12.5 h), both Pax6+/+ andPax6−/− embryos showed bimodal distributions, but in the Pax6−/− embryos the proportionsof lightly labeled cells were higher than in Pax6+/+ embryos (Figs. 3D, E).
If more cells are exiting the cell cycle from E10.5–E12.5, we predicted a corresponding increasein the proportion of differentiated neurons in Pax6−/− telencephalon by E12.5. To confirm this,we examined the expression of the early neuronal marker β-III-tubulin in wild-type andPax6−/− neocortex (Figs. 4A–C). We observed β-III-tubulin-expressing cells located withinthe VZ of the mutant neocortex (Figs. 4B–C) and it appeared that the proportions of β-III-tubulin-expressing cells were increased, especially given the overall thinning of the corticalwall (Figs. 4A, B). To quantify this, we dissociated E12.5 cortical cells and counted theproportions of β-III-tubulin-labeled and unlabeled cells. Manual counts showed a significantincrease (Student's t-test; p < 0.025) in the proportions of β-III-tubulin-expressing cells(mean = 38.7% ± 3.4% SEM, n = 3) compared to Pax6+/+ neocortex (mean = 23.2% ± 2.5%SEM, n = 3). This was confirmed using flow cytometry (Pax6−/− neocortex: 29.43 ± 1.68%SEM, n = 3; Pax6+/+ neocortex; 19.15 ± 1.21% SEM, n = 5; Student's t-test p < 0.005). Figs.3D–F show representative flow cytometry plots demonstrating this effect. It also reveals that
Quinn et al. Page 8
Published as: Dev Biol. 2007 February 01; 302(1-5): 50–65.
Sponsored Docum
ent Sponsored D
ocument
Sponsored Docum
ent

the expression of this marker is restricted mainly to cells with a diploid DNA content,suggesting that β-III-tubulin expression within the cell cycle is not significantly altered by lossof Pax6 expression.
DNA staining using PI in flow cytometry experiments identified a significant decrease in theproportions of cells in S-phase in Pax6−/− neocortex (Pax6+/+ neocortex; mean: 30.62%,± 1.09 SEM, n = 5; Pax6−/− neocortex: 24.73%, ± 1.31 SEM, n = 3; Student's t-test p = 0.011),consistent with a relative depletion of the Pax6−/− mutant progenitor pool. Thus, three linesof evidence using different techniques all pointed to the conclusion that a larger proportion ofcells exit the cell cycle and differentiate in the absence of Pax6.
The transcription factor Tbr2 is downregulated in the Pax6−/− neocortexMicroarray analysis was performed to screen for candidate genes up- or downregulated inPax6−/− neocortex (Faedo et al., 2004). The transcript that was most reduced at E14.5 was thatof the T-domain containing transcription factor Tbr2 (Bulfone et al., 1999; Kimura et al.,1999) (downregulated by a factor of 2.52). Downregulation of Tbr2 protein was confirmedearlier, at E12.5, as well as at E14.5 in total protein isolated from Pax6+/+ and Pax6−/−
neocortex (Fig. 5A).
Tbr2 is expressed in both postmitotic neurons and BPCs in the dorsal telencephalon (Englundet al., 2005). Localization of Tbr2 protein in Pax6−/− mutant and wild-type neocortex wascompared (Figs. 5B–G). In wild-type E12.5 dorsal telencephalon, Tbr2-expressing cells werefound mainly in the preplate with some in the proliferative zone (Fig. 5B,D) in a highlateralto lowmedial density gradient (Fig. 5B). This distribution of Tbr2-labeled cells closely mirrorsexpression of Pax6 in the ventricular zone (Fig. 1A; see also Englund et al., 2005). In the E12.5Pax6−/− cortex, almost all Tbr2-expressing cells were in the preplate (Figs. 5C, E) and veryfew were in the underlying proliferative zone. The highlateral to lowmedial gradient of Tbr2-expressing cells was lost (Fig. 5C); this was confirmed by quantitation of Tbr2-expressing celldensity (Fig. 5G). The gradient was flattened: there was a small but significant increase in thenumber of Tbr2-expressing cells in the mutant hippocampus while lateral cortical regionsshowed large reductions in the number of Tbr2-expressing cells (Fig. 5G). These changes werenot explained by overall differences in total cell densities between wild-type and mutanttelencephalon in any area examined (Fig. 5F). Thus, expression of Tbr2 is stronglydownregulated in the proliferative cells of mutants.
Examining the nature of Tbr2-expressing cells in Pax6−/− neocortexTo determine the nature of the Tbr2-expressing cells in mutant embryos, we first examinedexpression of a marker of early postmitotic neurons, β-III-tubulin. In the differentiating wild-type preplate, β-III-tubulin-expressing postmitotic neurons were either Tbr2-expressing orTbr2-non-expressing (Fig. 6A). This is consistent with the previous description of up regulationof Tbr2 in early postmitotic neurons and subsequent downregulation of Tbr2 in these cells asneuronal differentiation proceeds (Englund et al., 2005). Cells of both types were also seen inthe Pax6−/− preplate (Fig. 6B). Beneath the preplate of wild types, many Tbr2-expressing, β-III-tubulin-non-expressing cells were present and, as previously described, had condensedchromatin indicative of cells undergoing mitosis, confirming them as BPCs (Englund et al.,2005) (Fig. 6A). Beneath the preplate in Pax6−/− cortex, most of the small number of Tbr2-expressing cells were also β-III-tubulin-positive (Fig. 6B), suggesting these cells aremislocated Tbr2-expressing neurons rather than Tbr2-positive BPCs. No Tbr2-positive mitoticfigures were observed in mutants.
As Tbr2 is normally expressed in BPCs (Englund et al., 2005), we wanted to determine whetheractively cycling Tbr2-expressing cells were present in mutant embryos. A short (2 h) pulse of
Quinn et al. Page 9
Published as: Dev Biol. 2007 February 01; 302(1-5): 50–65.
Sponsored Docum
ent Sponsored D
ocument
Sponsored Docum
ent

BrdU was given at E12.5 to label cells during S-phase of the cell cycle (Figs. 6C, D). In wild-type cortex, co-localization of Tbr2 with BrdU was observed frequently in BPCs in all sectionsthrough the basal proliferative zone and preplate (Fig. 6C). In contrast, we observed very fewBrdU/Tbr2-expressing cells in Pax6−/− cortex; Fig. 6D shows two examples but most sectionscontained none. These data indicated either that BPCs do not exist in significant numbers inPax6−/− mutants or that cells dividing non-apically do not express Tbr2 in mutants.
Pulse labeling with BrdU does not distinguish clearly between APCs and BPCs, both of whichundergo S-phase in a similar location. Therefore, we examined co-expression of the mitoticmarker phosphohistone-3 (pH3) and Tbr2 (Fig. 7). pH3 is expressed strongly in cellsundergoing late G2/M-phase and is used as a marker of mitosis in cycling cell populations(Scott et al., 2004; Scott et al., 2003). In wild-type neocortex, two pH3-expressing cellpopulations were observed: (1) pH3-expressing/Tbr2 non-expressing APCs located at theapical ventricular surface; and (2) pH3-expressing/Tbr2-expressing BPCs located in the basalproliferating zone (Figs. 7A, C–E). In wild-type neocortex, all non-apically located pH3-expressing cells were Tbr2 expressing (Figs. 7A, C–E) consistent with the reported expressionof Tbr2 in this proliferative population (Englund et al., 2005). In Pax6−/− cortex (Figs. 7B, F–H), as in wild-type animals, pH3-expressing cells at the apical ventricular surface were alwaysTbr2-non-expressing. Cells expressing pH3 were also seen at non-apical locations, as in wild-type animals, but the vast majority did not express Tbr2 (Fig. 7G); one double-labeled cell isshown in (Figs. 7F–H), but all other sections showed none. Thus, the early Pax6−/− cortexcontains a population of cells undergoing abventricular mitoses in the location where BPCsare found in wild-type cortex, but hardly any express Tbr2.
Some cortical cells undergoing abventricular mitoses in Pax6−/− embryos express the ventralmarker Mash1
Abventricular mitoses occur with high frequency in normal ventral telencephalon (Sheth andBhide, 1997), which does not express Tbr2 but does express the transcription factor Mash1(Fig. 8A) (Guillemot and Joyner, 1993; Lo et al., 1991). Many dividing pH3-positive cells inthe wild-type lateral ganglionic eminence express Mash1 (Figs. 8C, E, G). Ectopic dorsalexpression of normally ventrally restricted Mash1 mRNA has been reported in Pax6−/−
mutants (Kroll and O'Leary, 2005; Muzio et al., 2002a; Muzio et al., 2002b; Stoykova et al.,2000; Toresson et al., 2000). We confirmed that Mash1 protein is expressed in many cells inthe Pax6−/− cortex (Fig. 8B); this ectopic expression does not co-localize with Tbr2 expressionin the preplate. In many sections through Pax6−/− embryos, we observed examples ofabventricular mitoses expressing Mash1 (Figs. 8D, F, H) suggesting at least a partialtransformation of the population of abventricularly dividing cells to a ventral telencephaliccharacter.
Pax6 is required cell autonomously in cortex for expression of Tbr2 and repression of genesnormally expressed in the lateral ganglionic eminence
In normal mice, Pax6 is downregulated in cells expressing Tbr2 (Englund et al., 2005), raisingthe question of whether Tbr2 expression in cortical cells requires (i) Pax6 expression in thesame cells at an earlier time (i.e., a cell autonomous requirement) or (ii) signals from nearbyPax6-expressing cells (i.e., a cell non-autonomous requirement). To distinguish between thesepossibilities we examined Tbr2 expression in Pax6−/− cells that were mixed with wild-typecells in Pax6−/−↔Pax6+/+ chimeras; Pax6−/− cells were identified by the presence of signalfor the β-globin transgene (see Methods; Quinn et al., 1996; Talamillo et al., 2003). Weobserved many small clusters of Pax6−/− cells intermingled with and surrounded by wild-typecells expressing Tbr2 (Figs. 9A, B). Almost all Pax6−/− cells were negative for Tbr2 (Figs.9A, B) indicating that Pax6 is required cell autonomously by progenitor cells for their normalexpression of Tbr2.
Quinn et al. Page 10
Published as: Dev Biol. 2007 February 01; 302(1-5): 50–65.
Sponsored Docum
ent Sponsored D
ocument
Sponsored Docum
ent

We then tested whether cells lacking Pax6 in Pax6−/−↔Pax6+/+ chimeras upregulate geneswhose expression is normally restricted ventrally in the telencephalon (Fig. 9). We found thatmost Pax6−/− cortical cells in chimeras express Mash1 (Fig. 9C), Gsh2 (Figs. 9E, F) and Dlx2(Figs. 9G–I). Wild-type cortical cells in chimeras do not express these genes (Figs. 9C, E, I),indicating that the presence of mutant cells does not induce expression in wild-type cells. Inthe ventral telencephalon of chimeras, Mash1, Gsh2 and Dlx2 are expressed by cells of bothgenotypes (seen for Mash1 in Fig. 9D). Nkx2.1 is also expressed by cells of both genotypes inthe proliferative zone and around the internal capsule in the medial ganglionic eminence (Fig.9J) but not by Pax6−/− cells in the cortex of chimeras (Fig. 9K). We observed the lack of Tbr2expression and activation of Mash 1, Gsh2 and Dlx2 (and not Nkx2.1) expression in thePax6−/− cells of chimeras throughout the full extent of the cortex, including its most medialregions. Fig. 10 shows examples of the absence of Tbr2 and expression of Mash1 in mutantcells in the hippocampus of chimeras. We conclude that Pax6 has cell autonomous actionswithin the cortical cells expressing it to activate expression of Tbr2 and to repress expressionof genes normally expressed in the lateral ganglionic eminence.
DiscussionOur aim was to use in vivo methods to study early defects in cortical cells lacking Pax6 so asto obtain a clearer picture of the likely primary cell autonomous actions of this transcriptionfactor. Previous studies have demonstrated that, from the onset of corticogenesis, Pax6−/− cellshave a cell autonomous defect in their adhesion properties (Stoykova et al., 1997; Talamilloet al., 2003; Tyas et al., 2003). It is less clear how many of the other cortical defects that havebeen reported in Pax6−/− mutants reflect cell autonomous, rather than indirect cell non-autonomous, requirements for Pax6 in the affected processes. Our results indicate that Pax6 isrequired cell autonomously to regulate the production of correct numbers of dorsaltelencephalic cells with the correct identities.
Pax6 reduces cell cycle exit among early cortical progenitorsOur conclusion that Pax6−/− cells exit the cell cycle in abnormally large numbers at the onsetof corticogenesis rests on evidence from multiple experimental approaches. We showed that,early in corticogenesis, newly divided progenitors do not re-enter S-phase in normal numbersand that there is a corresponding increase in proportions of neurons and reduction in proportionsof cortical cells in S-phase. A reduction in size of the pool of mutant progenitors provides anexplanation for the underproduction of mutant cells and the reduced size of the mutant cortex.Further evidence supporting this conclusion came from experiments to exclude other possibleexplanations for underproduction of mutant cells, namely increased cell death and lengtheningof the cell cycle.
These findings provide a possible explanation for results described in the study by Heins et al.(2002) which showed that cortical radial glial cells (or APCs) isolated from older, E14,Pax6−/− embryos have a reduced neurogenic potential. They found that proportions of radialglial progenitors and postmitotic neurons were abnormally low in Pax6−/− embryos at this laterage. This is readily explained by premature exit of progenitors from the cell cycle and theconsequent depletion of the neurogenic progenitor pool during the preceding days. In addition,Heins et al. (2002) showed that those radial glial progenitors that are present at E14 produceabnormally small numbers of neuronal clones in vitro, suggesting that their neurogenicpotential has altered. This might be a direct consequence of the lack of Pax6 in theseprogenitors. Alternatively, it might be an indirect consequence due, perhaps, to a change in thesize of the radial progenitor population altering cell–cell signaling between progenitors andredefining their developmental fates.
Quinn et al. Page 11
Published as: Dev Biol. 2007 February 01; 302(1-5): 50–65.
Sponsored Docum
ent Sponsored D
ocument
Sponsored Docum
ent
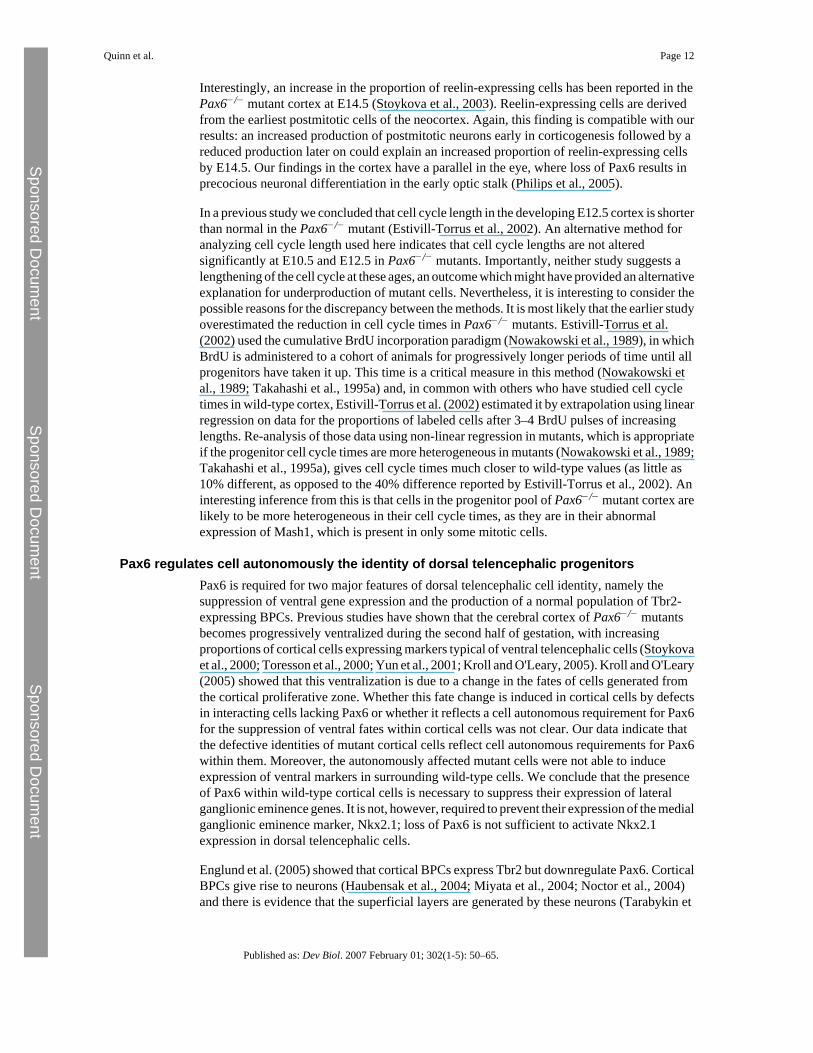
Interestingly, an increase in the proportion of reelin-expressing cells has been reported in thePax6−/− mutant cortex at E14.5 (Stoykova et al., 2003). Reelin-expressing cells are derivedfrom the earliest postmitotic cells of the neocortex. Again, this finding is compatible with ourresults: an increased production of postmitotic neurons early in corticogenesis followed by areduced production later on could explain an increased proportion of reelin-expressing cellsby E14.5. Our findings in the cortex have a parallel in the eye, where loss of Pax6 results inprecocious neuronal differentiation in the early optic stalk (Philips et al., 2005).
In a previous study we concluded that cell cycle length in the developing E12.5 cortex is shorterthan normal in the Pax6−/− mutant (Estivill-Torrus et al., 2002). An alternative method foranalyzing cell cycle length used here indicates that cell cycle lengths are not alteredsignificantly at E10.5 and E12.5 in Pax6−/− mutants. Importantly, neither study suggests alengthening of the cell cycle at these ages, an outcome which might have provided an alternativeexplanation for underproduction of mutant cells. Nevertheless, it is interesting to consider thepossible reasons for the discrepancy between the methods. It is most likely that the earlier studyoverestimated the reduction in cell cycle times in Pax6−/− mutants. Estivill-Torrus et al.(2002) used the cumulative BrdU incorporation paradigm (Nowakowski et al., 1989), in whichBrdU is administered to a cohort of animals for progressively longer periods of time until allprogenitors have taken it up. This time is a critical measure in this method (Nowakowski etal., 1989; Takahashi et al., 1995a) and, in common with others who have studied cell cycletimes in wild-type cortex, Estivill-Torrus et al. (2002) estimated it by extrapolation using linearregression on data for the proportions of labeled cells after 3–4 BrdU pulses of increasinglengths. Re-analysis of those data using non-linear regression in mutants, which is appropriateif the progenitor cell cycle times are more heterogeneous in mutants (Nowakowski et al., 1989;Takahashi et al., 1995a), gives cell cycle times much closer to wild-type values (as little as10% different, as opposed to the 40% difference reported by Estivill-Torrus et al., 2002). Aninteresting inference from this is that cells in the progenitor pool of Pax6−/− mutant cortex arelikely to be more heterogeneous in their cell cycle times, as they are in their abnormalexpression of Mash1, which is present in only some mitotic cells.
Pax6 regulates cell autonomously the identity of dorsal telencephalic progenitorsPax6 is required for two major features of dorsal telencephalic cell identity, namely thesuppression of ventral gene expression and the production of a normal population of Tbr2-expressing BPCs. Previous studies have shown that the cerebral cortex of Pax6−/− mutantsbecomes progressively ventralized during the second half of gestation, with increasingproportions of cortical cells expressing markers typical of ventral telencephalic cells (Stoykovaet al., 2000; Toresson et al., 2000; Yun et al., 2001; Kroll and O'Leary, 2005). Kroll and O'Leary(2005) showed that this ventralization is due to a change in the fates of cells generated fromthe cortical proliferative zone. Whether this fate change is induced in cortical cells by defectsin interacting cells lacking Pax6 or whether it reflects a cell autonomous requirement for Pax6for the suppression of ventral fates within cortical cells was not clear. Our data indicate thatthe defective identities of mutant cortical cells reflect cell autonomous requirements for Pax6within them. Moreover, the autonomously affected mutant cells were not able to induceexpression of ventral markers in surrounding wild-type cells. We conclude that the presenceof Pax6 within wild-type cortical cells is necessary to suppress their expression of lateralganglionic eminence genes. It is not, however, required to prevent their expression of the medialganglionic eminence marker, Nkx2.1; loss of Pax6 is not sufficient to activate Nkx2.1expression in dorsal telencephalic cells.
Englund et al. (2005) showed that cortical BPCs express Tbr2 but downregulate Pax6. CorticalBPCs give rise to neurons (Haubensak et al., 2004; Miyata et al., 2004; Noctor et al., 2004)and there is evidence that the superficial layers are generated by these neurons (Tarabykin et
Quinn et al. Page 12
Published as: Dev Biol. 2007 February 01; 302(1-5): 50–65.
Sponsored Docum
ent Sponsored D
ocument
Sponsored Docum
ent

al., 2001). Previous studies in Pax6−/− mutants have shown downregulation of expression ofa variety of molecules normally expressed in cortex, including R-cadherin and Svet1 (Stoykovaet al., 1997; Tarabykin et al., 2001). In the present study, we identified a loss of Tbr2 in cellsdeep to the cortical plate, a population that includes cells undergoing abventricular mitoseswhich would normally express Tbr2 (i.e., BPCs). It is likely that Pax6−/− BPCs are not correctlyspecified. Interestingly, whereas Pax6 is required cell autonomously to generate a normalpopulation of Tbr2-expressing BPCs, Caric et al. (1997) showed that E16 Pax6−/− corticalcells transplanted into a wild-type environment were able to contribute in large numbers to thesuperficial layers. The function of Tbr2 in cortical development is not clear but it is possiblethat expression of neither Pax6 nor Tbr2 is required within cortical progenitors for them togenerate neurons capable of populating the superficial layers. More likely, these genes may berequired to specify the types of cells produced rather than their locations.
The differential expression of transcription factors confers different regional characteristics toprogenitor cells in both dorsal and ventral telencephalon (Zaki et al., 2003). Pax6 plays asignificant role in regionalization of the developing telencephalon both prior to and duringcorticogenesis (Bishop et al., 2000; Muzio et al., 2002a; Toresson et al., 2000; Yun et al.,2001). In the developing neocortex, regional differences in cell proliferation may underlieregional differences in the cortical areas produced (Polleux et al., 1997). Tbr2 is expressed atdifferent levels in different parts of the wild-type cortex, exhibiting a matching highlateralto lowdorsal gradient of expression to that of Pax6 (present results; Englund et al., 2005). Wefound that loss of Pax6 expression causes loss of graded Tbr2 expression, the greatest lossoccurring in the lateral cortex of the Pax6−/− mutant telencephalon, where Pax6 is most highlyexpressed in the wild-type embryo. It seems likely that loss of graded Tbr2 expressioncontributes to the loss of cortical regionalization observed in the late-gestation Pax6−/− embryo(Bishop et al., 2000; Muzio et al., 2002a).
ConclusionsOur findings point to three early cell autonomous roles for Pax6 in developing cortex: (i)maintenance of the size of the cortical progenitor pool; (ii) activation of Tbr2 expression; (iii)repression of genes normally expressed ventrally, in the lateral ganglionic eminence. Wesuggest that Pax6 is required cell autonomously to keep dorsal telencephalic progenitor cellsin the cell cycle and maintain their dorsal identities.
AcknowledgmentsThe authors thank Jean Flockhart, Margaret Keighren, Katy Gillies, Ian Simpson, Duncan McNeil and Maureen Rossfor their expert assistance. J.C.Q. was a Medical Research Council (MRC) Fellow. P.A.Z. was supported bypostdoctoral fellowships from the American Association of University Women and National Institutes for Health.B.S.M. was supported by The Wellcome Trust. Research in the authors' laboratory is supported by MRC, TheWellcome Trust and Biotechnology and Biological Sciences Research Council.
ReferencesAltman J. Bayer S.A. Vertical compartmentation and cellular transformations in the germinal matrices
of the embryonic rat cerebral cortex. Exp. Neurol. 1990;107:23–35. [PubMed: 2295317]Bishop K.M. Goudreau G. O'Leary D.D. Regulation of area identity in the mammalian neocortex by
Emx2 and Pax6. Science 2000;288:344–349. [PubMed: 10764649]Bulfone A. Martinez S. Marigo V. Campanella M. Basile A. Quaderi N. Gattuso C. Rubenstein J.L.
Ballabio A. Expression pattern of the Tbr2 (Eomesodermin) gene during mouse and chick braindevelopment. Mech. Dev. 1999;84:133–138. [PubMed: 10473127]
Calegari F. Huttner W.B. An inhibition of cyclin-dependent kinases that lengthens, but does not arrest,neuroepithelial cell cycle induces premature neurogenesis. J. Cell Sci. 2003;116:4947–4955.[PubMed: 14625388]
Quinn et al. Page 13
Published as: Dev Biol. 2007 February 01; 302(1-5): 50–65.
Sponsored Docum
ent Sponsored D
ocument
Sponsored Docum
ent

Caric D. Gooday D. Hill R.E. McConnell S.K. Price D.J. Determination of the migratory capacity ofembryonic cortical cells lacking the transcription factor Pax-6. Development 1997;124:5087–5096.[PubMed: 9362466]
del Rio J.A. Soriano E. Immunocytochemical detection of 5'-bromodeoxyuridine incorporation in thecentral nervous system of the mouse. Brain Res. Dev. Brain Res. 1989;49:311–317.
Englund C. Fink A. Lau C. Pham D. Daza R.A. Bulfone A. Kowalczyk T. Hevner R.F. Pax6, Tbr2, andTbr1 are expressed sequentially by radial glia, intermediate progenitor cells, and postmitotic neuronsin developing neocortex. J. Neurosci. 2005;25:247–251. [PubMed: 15634788]
Estivill-Torrus G. Pearson H. vanHeyningen V. Price D.J. Rashbass P. Pax6 is required to regulate thecell cycle and the rate of progression from symmetrical to asymmetrical division in mammalian corticalprogenitors. Development 2002;129:455–466. [PubMed: 11807037]
Faedo A. Quinn J.C. Stoney P. Long J.E. Dye C. Zollo M. Rubenstein J.L. Price D.J. Bulfone A.Identification and characterization of a novel transcript down-regulated in Dlx1/Dlx2 and up-regulatedin Pax6 mutant telencephalon. Dev. Dyn. 2004;231:614–620. [PubMed: 15376329]
Fishell G. Kriegstein A.R. Neurons from radial glia: the consequences of asymmetric inheritance. Curr.Opin. Neurobiol. 2003;13:34–41. [PubMed: 12593980]
Fukuda T. Kawano H. Osumi N. Eto K. Kawamura K. Histogenesis of the cerebral cortex in rat fetuseswith a mutation in the Pax-6 gene. Dev. Brain Res. 2000;120:65–75. [PubMed: 10727731]
Gillies K. Price D.J. The fates of cells in the developing cerebral cortex of normal andmethylazoxymethanol acetate-lesioned mice. Eur. J. Neurosci. 1993;5:73–84. [PubMed: 8261092]
Gillies K. Price D.J. Spears N. The use of bromodeoxyuridine to label proliferating cells in the nervous-system of the fetal mouse. J. Physiol. (London) 1990;420:4.
Guillemot F. Joyner A.L. Dynamic expression of the murine achaete-scute homologue Mash-1 in thedeveloping nervous system. Mech. Dev. 1993;42:171–185. [PubMed: 8217843]
Haubensak W. Attardo A. Denk W. Huttner W.B. Neurons arise in the basal neuroepithelium of the earlymammalian telencephalon: a major site of neurogenesis. Proc. Natl. Acad Sci. U. S. A.2004;101:3196–3201. [PubMed: 14963232]
Haubst N. Berger J. Radjendirane V. Graw J. Favor J. Saunders G.F. Stoykova A. Gotz M. Moleculardissection of Pax6 function: the specific roles of the paired domain and homeodomain in braindevelopment. Development 2004;131:6131–6140. [PubMed: 15548580]
Heins N. Malatesta P. Cecconi F. Nakafuku M. Tucker K.L. Hack M.A. Chapouton P. Barde Y.A. GotzM. Glial cells generate neurons: the role of the transcription factor Pax6. Nat. Neurosci. 2002;5:308–315. [PubMed: 11896398]
Hill R.E. Favor J. Hogan B.L.M. Ton C.C.T. Saunders G.F. Hanson I.M. Prosser J. Jordan T. Hastie N.D.Vanheyningen V. Mouse small eye results from mutations in a paired-like homeobox-containinggene. Nature 1991;354:522–525. [PubMed: 1684639]
Iacopetti P. Michelini M. Stuckmann I. Oback B. Aaku-Saraste E. Huttner W.B. Expression of theantiproliferative gene TIS21 at the onset of neurogenesis identifies single neuroepithelial cells thatswitch from proliferative to neuron-generating division. Proc. Natl. Acad. Sci. U. S. A.1999;96:4639–4644. [PubMed: 10200315]
Keighren M. West J.D. Analysis of cell ploidy in histological sections of mouse tissues by DNA–DNAin situ hybridization with digoxigenin-labelled probes. Histochem. J. 1993;25:30–44. [PubMed:8432662]
Kerr J.F. Wyllie A.H. Currie A.R. Apoptosis: a basic biological phenomenon with wide-rangingimplications in tissue kinetics. Br. J. Cancer 1972;26:239–257. [PubMed: 4561027]
Kimura N. Nakashima K. Ueno M. Kiyama H. Taga T. A novel mammalian T-box-containing gene, Tbr2,expressed in mouse developing brain. Brain Res. Dev. Brain Res. 1999;115:183–193.
Kroll T.T. O'Leary D.D. Ventralized dorsal telencephalic progenitors in Pax6 mutant mice generateGABA interneurons of a lateral ganglionic eminence fate. Proc. Natl. Acad. Sci. U. S. A.2005;102:7374–7379. [PubMed: 15878992]
Lesuisse C. Martin L.J. Long-term culture of mouse cortical neurons as a model for neuronaldevelopment, aging, and death. J. Neurobiol. 2002;51:9–23. [PubMed: 11920724]
Quinn et al. Page 14
Published as: Dev Biol. 2007 February 01; 302(1-5): 50–65.
Sponsored Docum
ent Sponsored D
ocument
Sponsored Docum
ent
Lo C.W. Coulling M. Kirby C. Tracking of mouse cell lineage using microinjected DNA sequences:analyses using genomic Southern blotting and tissue-section in situ hybridizations. Differentiation1987;35:37–44. [PubMed: 3428512]
Lo L.C. Johnson J.E. Wuenschell C.W. Saito T. Anderson D.J. Mammalian achaete-scute homolog 1 istransiently expressed by spatially restricted subsets of early neuroepithelial and neural crest cells.Genes Dev. 1991;5:1524–1537. [PubMed: 1909283]
Lotto R.B. Asavaritikrai P. Vali L. Price D.J. Target-derived neurotrophic factors regulate the death ofdeveloping forebrain neurons after a change in their trophic requirements. J. Neurosci. 2001;21:3904–3910. [PubMed: 11356878]
Martynoga B. Morrison H. Price D.J. Mason J.O. Foxg1 is required for specification of ventraltelencephalon and region-specific regulation of dorsal telencephalic precursor proliferation andapoptosis. Dev. Biol.. 2005
Miyata T. Kawaguchi A. Saito K. Kawano M. Muto T. Ogawa M. Asymmetric production of surface-dividing and non-surface-dividing cortical progenitor cells. Development 2004;131:3133–3145.[PubMed: 15175243]
Muzio L. DiBenedetto B. Stoykova A. Boncinelli E. Gruss P. Mallamaci A. Conversion of cerebral cortexinto basal ganglia in Emx2(−/−) Pax6(Sey/Sey) double-mutant mice. Nat. Neurosci. 2002;5:737–745. [PubMed: 12118260]
Muzio L. DiBenedetto B. Stoykova A. Boncinelli E. Gruss P. Mallamaci A. Emx2 and Pax6 controlregionalization of the pre-neuronogenic cortical primordium. Cereb Cortex 2002;12:129–139.[PubMed: 11739261]
Noctor S.C. Martinez-Cerdeno V. Ivic L. Kriegstein A.R. Cortical neurons arise in symmetric andasymmetric division zones and migrate through specific phases. Nat. Neurosci. 2004;7:136–144.[PubMed: 14703572]
Nowakowski R.S. Lewin S.B. Miller M.W. Bromodeoxyuridine immunohistochemical determination ofthe lengths of the cell cycle and the DNA-synthetic phase for an anatomically defined population. J.Neurocytol. 1989;18:311–318. [PubMed: 2746304]
Ormerod, M.G. Flow Cytometry. Oxford Univ. Press; Oxford: 2000.Palmer S.J. Burgoyne P.S. In situ analysis of fetal, prepuberal and adult XX–XY chimaeric mouse testes:
Sertoli cells are predominantly, but not exclusively, XY. Development 1991;112:265–268. [PubMed:1769333]
Philips G.T. Stair C.N. Young Lee H. Wroblewski E. Berberoglu M.A. Brown N.L. Mastick G.S.Precocious retinal neurons: Pax6 controls timing of differentiation and determination of cell type.Dev. Biol. 2005;279:308–321. [PubMed: 15733660]
Polleux F. Dehay C. Kennedy H. The timetable of laminar neurogenesis contributes to the specificationof cortical areas in mouse isocortex. J. Comp. Neurol. 1997;385:95–116. [PubMed: 9268119]
Porteus M.H. Brice A.E. Bulfone A. Usdin T.B. Ciaranello R.D. Rubenstein J.L. Isolation andcharacterization of a library of cDNA clones that are preferentially expressed in the embryonictelencephalon. Brain Res. Mol. Brain Res. 1992;12:7–22. [PubMed: 1372074]
Pratt T. Quinn J.C. Simpson T.I. West J.D. Mason J.O. Price D.J. Disruption of early events inthalamocortical tract formation in mice lacking the transcription factors pax6 or foxg1. J. Neurosci.2002;22:8523–8531. [PubMed: 12351726]
Price D.J. Aslam S. Tasker L. Gillies K. Fates of the earliest generated cells in the developing murineneocortex. J. Comp. Neurol. 1997;377:414–422. [PubMed: 8989655]
Quinn J.C. West J.D. Hill R.E. Multiple functions for Pax6 in mouse eye and nasal development. GenesDev. 1996;10:435–446. [PubMed: 8600027]
Roy K. Kuznicki K. Wu Q. Sun Z. Bock D. Schutz G. Vranich N. Monaghan A.P. The Tlx gene regulatesthe timing of neurogenesis in the cortex. J. Neurosci. 2004;24:8333–8345. [PubMed: 15385616]
Schmahl W. Knoedlseder M. Favor J. Davidson D. Defects of neuronal migration and the pathogenesisof cortical malformations are associated with small eye (Sey) In the mouse, a point mutation at thepax-6-locus. Acta Neuropathol. 1993;86:126–135. [PubMed: 8213068]
Scott I.S. Morris L.S. Bird K. Davies R.J. Vowler S.L. Rushbrook S.M. Marshall A.E. Laskey R.A. MillerR. Arends M.J. Coleman N. A novel immunohistochemical method to estimate cell-cycle phase
Quinn et al. Page 15
Published as: Dev Biol. 2007 February 01; 302(1-5): 50–65.
Sponsored Docum
ent Sponsored D
ocument
Sponsored Docum
ent

distribution in archival tissue: implications for the prediction of outcome in colorectal cancer. J.Pathol. 2003;201:187–197. [PubMed: 14517835]
Scott I.S. Heath T.M. Morris L.S. Rushbrook S.M. Bird K. Vowler S.L. Arends M.J. Coleman N. A novelimmunohistochemical method for estimating cell cycle phase distribution in ovarian serousneoplasms: implications for the histopathological assessment of paraffin-embedded specimens. Br.J. Cancer 2004;90:1583–1590. [PubMed: 15083189]
Sheth A.N. Bhide P.G. Concurrent cellular output from two proliferative populations in the earlyembryonic mouse corpus striatum. J. Comp. Neurol. 1997;383:220–230. [PubMed: 9182850]
Smart I.H. A pilot study of cell production by the ganglionic eminences of the developing mouse brain.J. Anat. 1976;121:71–84. [PubMed: 1254534]
Srinivasan A. Roth K.A. Sayers R.O. Shindler K.S. Wong A.M. Fritz L.C. Tomaselli K.J. In situimmunodetection of activated caspase-3 in apoptotic neurons in the developing nervous system. CellDeath Differ. 1998;5:1004–1016. [PubMed: 9894607]
Stoykova A. Gotz M. Gruss P. Price J. Pax6-dependent regulation of adhesive patterning, R-cadherinexpression and boundary formation in developing forebrain. Development 1997;124:3765–3777.[PubMed: 9367432]
Stoykova A. Treichel D. Hallonet M. Gruss P. Pax6 modulates the dorsoventral patterning of themammalian telencephalon. J. Neurosci. 2000;20:8042–8050. [PubMed: 11050125]
Stoykova A. Hatano O. Gruss P. Gotz M. Increase in reelin-positive cells in the marginal zone of Pax6mutant mouse cortex. Cereb. Cortex 2003;13:560–571. [PubMed: 12764029]
Takahashi T. Nowakowski R.S. Caviness V.S. The cell cycle of the pseudostratified ventricularepithelium of the embryonic murine cerebral wall. J. Neurosci. 1995;15:6046–6057. [PubMed:7666188]
Takahashi T. Nowakowski R.S. Caviness V.S. Early ontogeny of the secondary proliferative populationof the embryonic murine cerebral wall. J. Neurosci. 1995;15:6058–6068. [PubMed: 7666189]
Talamillo A. Quinn J.C. Collinson J.M. Caric D. Price D.J. West J.D. Hill R.E. Pax6 regulates regionaldevelopment and neuronal migration in the cerebral cortex. Dev. Biol. 2003;255:151–163. [PubMed:12618140]
Tarabykin V. Stoykova A. Usman N. Gruss P. Cortical upper layer neurons derive from the subventricularzone as indicated by Svet1 gene expression. Development 2001;128:1983–1993. [PubMed:11493521]
Toresson H. Potter S.S. Campbell K. Genetic control of dorsal–ventral identity in the telencephalon:opposing roles for Pax6 and Gsh2. Development 2000;127:4361–4371. [PubMed: 11003836]
Tyas D.A. Pearson H. Rashbass P. Price D.J. Pax6 regulates cell adhesion during cortical development.Cereb. Cortex 2003;13:612–619. [PubMed: 12764036]
Wanek N. Muneoka K. Holler-Dinsmore G. Burton R. Bryant S.V. A staging system for mouse limbdevelopment. J. Exp. Zool. 1989;249:41–49. [PubMed: 2926360]
Warren N. Caric D. Pratt T. Clausen J.A. Asavaritikrai P. Mason J.O. Hill R.E. Price D.J. The transcriptionfactor, Pax6, is required for cell proliferation and differentiation in the developing cerebral cortex.Cereb. Cortex 1999;9:627–635. [PubMed: 10498281]
West J.D. Flockhart J.H. Genotypically unbalanced diploid⇔diploid foetal mouse chimaeras: possiblerelevance to human confined mosaicism. Genet. Res. 1994;63:87–99. [PubMed: 8026741]
West J.D. Keighren M.A. Flockhart J.H. A quantitative test for developmental neutrality of a transgeniclineage marker in mouse chimaeras. Genet. Res. 1996;67:135–146. [PubMed: 8801186]
Yun K. Potter S. Rubenstein J.L. Gsh2 and Pax6 play complementary roles in dorsoventral patterning ofthe mammalian telencephalon. Development 2001;128:193–205. [PubMed: 11124115]
Zaki P.A. Quinn J.C. Price D.J. Mouse models of telencephalic development. Curr. Opin. Genet. Dev.2003;13:423–437. [PubMed: 12888017]
Quinn et al. Page 16
Published as: Dev Biol. 2007 February 01; 302(1-5): 50–65.
Sponsored Docum
ent Sponsored D
ocument
Sponsored Docum
ent
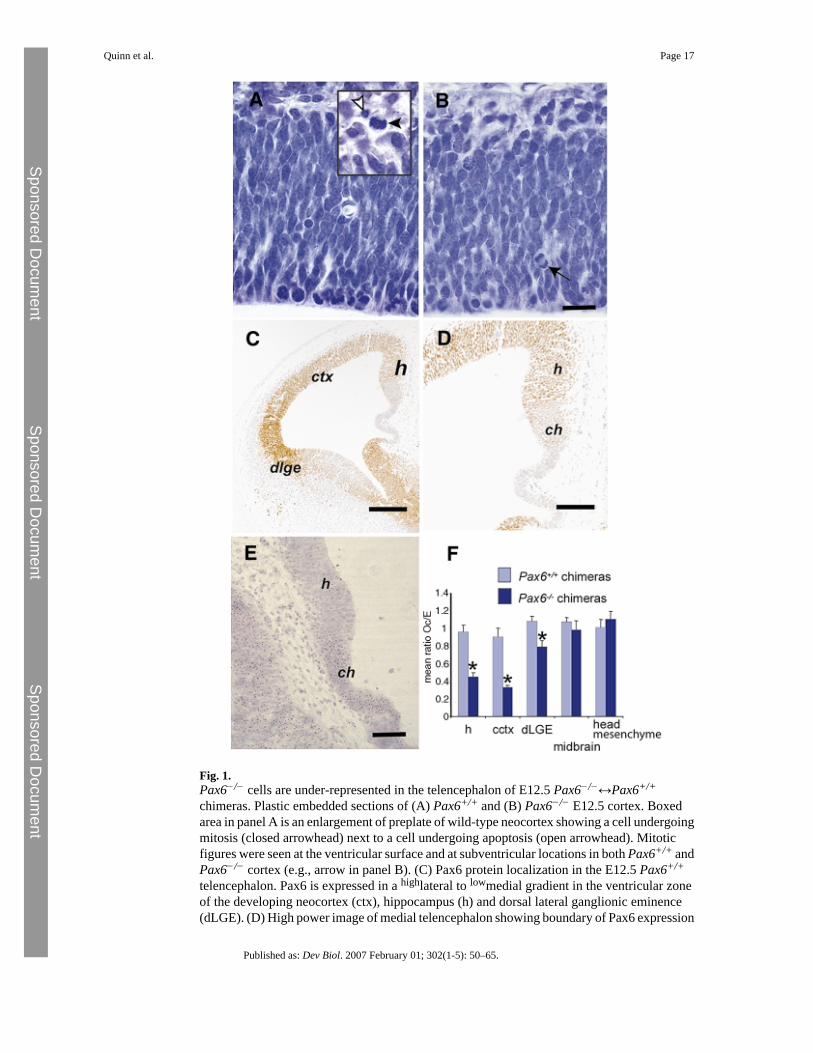
Fig. 1.Pax6−/− cells are under-represented in the telencephalon of E12.5 Pax6−/−↔Pax6+/+
chimeras. Plastic embedded sections of (A) Pax6+/+ and (B) Pax6−/− E12.5 cortex. Boxedarea in panel A is an enlargement of preplate of wild-type neocortex showing a cell undergoingmitosis (closed arrowhead) next to a cell undergoing apoptosis (open arrowhead). Mitoticfigures were seen at the ventricular surface and at subventricular locations in both Pax6+/+ andPax6−/− cortex (e.g., arrow in panel B). (C) Pax6 protein localization in the E12.5 Pax6+/+
telencephalon. Pax6 is expressed in a highlateral to lowmedial gradient in the ventricular zoneof the developing neocortex (ctx), hippocampus (h) and dorsal lateral ganglionic eminence(dLGE). (D) High power image of medial telencephalon showing boundary of Pax6 expression
Quinn et al. Page 17
Published as: Dev Biol. 2007 February 01; 302(1-5): 50–65.
Sponsored Docum
ent Sponsored D
ocument
Sponsored Docum
ent

between hippocampus and cortical hem (ch). (E) Pax6−/−↔Pax6+/+ chimera (with a globalcontribution of 53% Pax6−/−, Tg+ cells determined by GPI1 analysis) showing under-representation of Pax6−/−, Tg+ cells (brown spots in nucleus) in the Pax6-expressinghippocampus but not in the cortical hem. (F) Composition of telencephalic regions of E12.5Pax6+/+↔Pax6+/+ and Pax6−/−↔Pax6+/+ chimeras. Mean ratios ± SEM of correctedpercentages of Tg+ cells in each tissue to global GPI1B percentage in the embryo (Oc/E) areshown for both Pax6+/+↔Pax6+/+ (light bars) and Pax6−/−↔Pax6+/+ (dark bars) chimeras.At E12.5, there is a significant reduction in the number of Pax6−/− cells contributing tohippocampus (Student's t-test, p < 0.001), neocortex (p < 0.03) and dLGE (p < 0.02) inPax6−/−↔Pax6+/+ (dark bars) chimeras. Significant differences are marked with an asterisk(*). Scale bars: (A, B) = 20 μm, (C) = 200 μm, (D) = 100 μm, (E) = 50 μm.
Quinn et al. Page 18
Published as: Dev Biol. 2007 February 01; 302(1-5): 50–65.
Sponsored Docum
ent Sponsored D
ocument
Sponsored Docum
ent

Fig. 2.Analysis of cell cycle characteristics using IdU/BrdU co-labeling. (A) Injection at T0 h withIdU and T1.5 h with BrdU followed by sacrifice at T2.0 h allows identification of three celltypes: those within S-phase at T0–1.5 but within G2/M at T1.5–2.0 (Lcells: IdU-labeled only—green in panels B–E); cells entering S-phase at T1.5–2.0 (BrdU-labeled only—red in panelsB–E); cells within S-phase at both T0 and T1.5 (IdU/BrdU co-labeled—yellow in panels B–E). By counting the numbers of cells in each of these three populations, cell cycle characteristicscan be determined as described in Methods. Cell cycle characteristics were examined at E10.5(B, C) and E12.5 (D, E) in wild-type (B, D) and Pax6−/− (C, E) telencephalon. Scalebar = 50 μm.
Quinn et al. Page 19
Published as: Dev Biol. 2007 February 01; 302(1-5): 50–65.
Sponsored Docum
ent Sponsored D
ocument
Sponsored Docum
ent
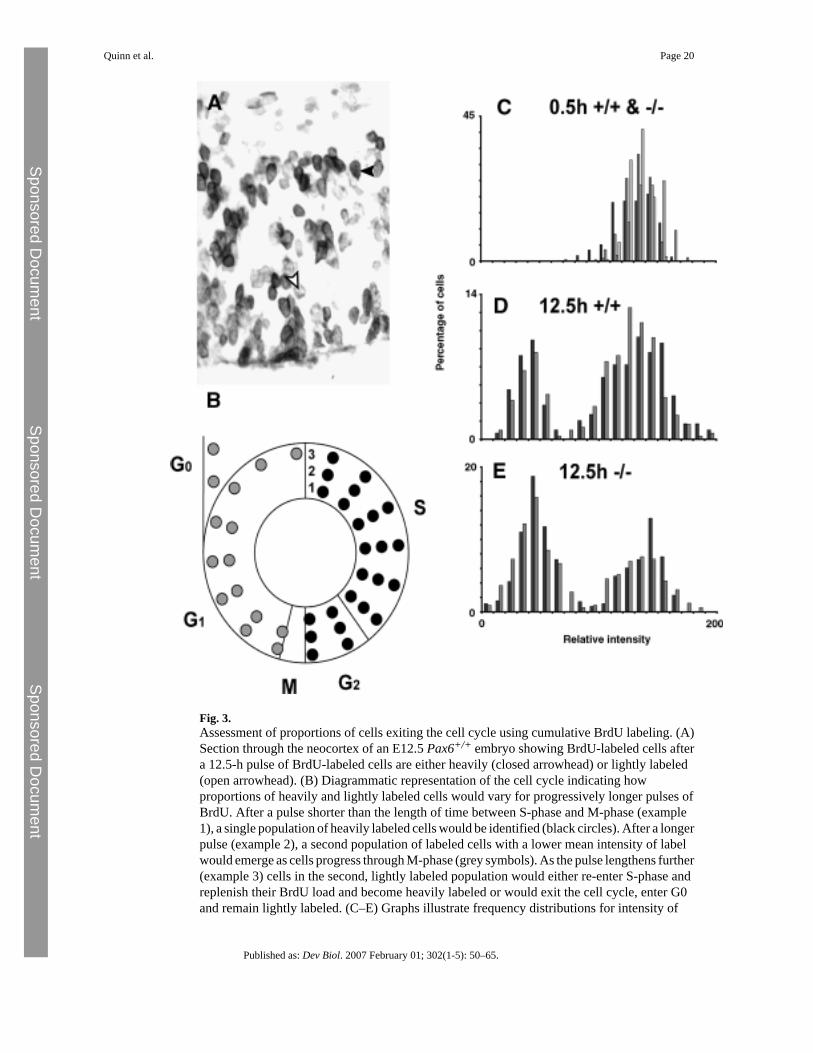
Fig. 3.Assessment of proportions of cells exiting the cell cycle using cumulative BrdU labeling. (A)Section through the neocortex of an E12.5 Pax6+/+ embryo showing BrdU-labeled cells aftera 12.5-h pulse of BrdU-labeled cells are either heavily (closed arrowhead) or lightly labeled(open arrowhead). (B) Diagrammatic representation of the cell cycle indicating howproportions of heavily and lightly labeled cells would vary for progressively longer pulses ofBrdU. After a pulse shorter than the length of time between S-phase and M-phase (example1), a single population of heavily labeled cells would be identified (black circles). After a longerpulse (example 2), a second population of labeled cells with a lower mean intensity of labelwould emerge as cells progress through M-phase (grey symbols). As the pulse lengthens further(example 3) cells in the second, lightly labeled population would either re-enter S-phase andreplenish their BrdU load and become heavily labeled or would exit the cell cycle, enter G0and remain lightly labeled. (C–E) Graphs illustrate frequency distributions for intensity of
Quinn et al. Page 20
Published as: Dev Biol. 2007 February 01; 302(1-5): 50–65.
Sponsored Docum
ent Sponsored D
ocument
Sponsored Docum
ent

BrdU label in cells in histological sections after pulses of BrdU lasting (C) 0.5 h and (D, E)12.5 h in wild-type (C, D) and mutant (C, E) neocortex. Each set of differently shaded barscorresponds to an individual animal. (C) At 0.5 h in both mutant and wild type all cells areheavily labeled with BrdU. (D, E) After a 12.5-h pulse with BrdU, heavily and lightly labeledcell populations can be identified but more lightly labeled cells are present in the mutant (E)than in wild type (D).
Quinn et al. Page 21
Published as: Dev Biol. 2007 February 01; 302(1-5): 50–65.
Sponsored Docum
ent Sponsored D
ocument
Sponsored Docum
ent
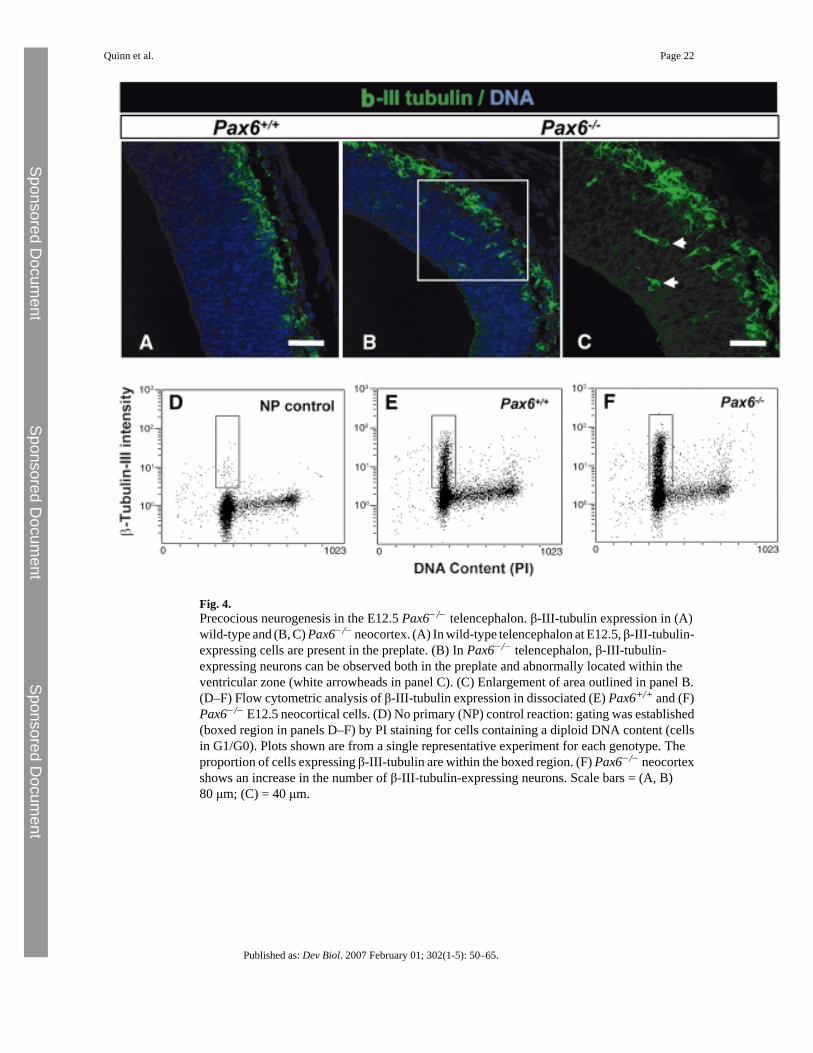
Fig. 4.Precocious neurogenesis in the E12.5 Pax6−/− telencephalon. β-III-tubulin expression in (A)wild-type and (B, C) Pax6−/− neocortex. (A) In wild-type telencephalon at E12.5, β-III-tubulin-expressing cells are present in the preplate. (B) In Pax6−/− telencephalon, β-III-tubulin-expressing neurons can be observed both in the preplate and abnormally located within theventricular zone (white arrowheads in panel C). (C) Enlargement of area outlined in panel B.(D–F) Flow cytometric analysis of β-III-tubulin expression in dissociated (E) Pax6+/+ and (F)Pax6−/− E12.5 neocortical cells. (D) No primary (NP) control reaction: gating was established(boxed region in panels D–F) by PI staining for cells containing a diploid DNA content (cellsin G1/G0). Plots shown are from a single representative experiment for each genotype. Theproportion of cells expressing β-III-tubulin are within the boxed region. (F) Pax6−/− neocortexshows an increase in the number of β-III-tubulin-expressing neurons. Scale bars = (A, B)80 μm; (C) = 40 μm.
Quinn et al. Page 22
Published as: Dev Biol. 2007 February 01; 302(1-5): 50–65.
Sponsored Docum
ent Sponsored D
ocument
Sponsored Docum
ent

Fig. 5.The transcription factor Tbr2 is downregulated in the Pax6−/− telencephalon. (A) Western blotfor Tbr2 protein from E12.5 and E14.5 cortex of Pax6+/+ and Pax6−/− embryos. A significantreduction in Tbr2 protein is observed in the homozygous mutant lateral cortex at both E12.5and E14.5. (B–E) Tbr2 localization in Pax6+/+ (B, D) and Pax6−/− (C, E) telencephalon atE12.5. In Pax6+/+ telencephalon, Tbr2-expressing cells are located in the preplate (pp) andwithin the ventricular and subventricular zone (vz). In the Pax6−/− telencephalon, almost allTbr2-expressing cells are present in the preplate. (F) Quantification of telencephalic celldensity and (G) Tbr2-expressing cell density in hippocampus (h), dorsal cortex (dcxt), centralneocortex (cctx) and lateral neocortex (lctx) (boxed areas in panel B) at E12.5 in Pax6+/+ (openbars) and Pax6−/− mutant (filled bars) telencephalon. (F) No significant difference is observedin cell density between mutant and wild-type animals in any telencephalic region examined.(G) A significant increase is observed in the density of Tbr2-expressing cells present in thePax6−/− hippocampus and a significant decrease in the densities observed in the Pax6−/−
central neocortex and lateral neocortex compared to wild types. Significant differences(Student's t-test, p < 0.05) are marked with an asterisk (*).
Quinn et al. Page 23
Published as: Dev Biol. 2007 February 01; 302(1-5): 50–65.
Sponsored Docum
ent Sponsored D
ocument
Sponsored Docum
ent

Fig. 6.Tbr2-expressing postmitotic neurons are present in the Pax6−/− telencephalon. (A) In theproliferative layer of E12.5 wild-type neocortex, Tbr2 labels cells that are β-III-tubulin negative(red arrowheads). Some of these cells appear to be dividing indicating they are BPCs (redarrowhead containing white m). In the preplate, Tbr2/β-III-tubulin co-expressing postmitoticneurons are observed (yellow arrowhead) as well as β-III-tubulin-expressing neurons whichare down regulating or have down regulated Tbr2 expression (white arrowhead). (B) In theproliferative layer of E12.5 Pax6−/− neocortex, many Tbr2-positive cells are β-III-tubulin-positive (yellow arrowheads) while some are not (red arrowhead). In the preplate, co-expressing (yellow arrowhead) and β-III-tubulin-positive/Tbr2 negative (white arrowhead)cells are seen. (C, D) A 2-h BrdU pulse was used to label cells that are actively cycling in theE12.5 Pax6+/+ and Pax6−/− telencephalon. (C) In Pax6+/+ telencephalon, Tbr2/BrdU co-labeled BPCs can be observed in the basal ventricular zone and preplate (white arrowheads).(D) In the Pax6−/− telencephalon, very few of the BrdU-labeled cells express Tbr2 (whitearrows). Scale bars: (A, B) = 20 μm; (C, D) = 40 μm.
Quinn et al. Page 24
Published as: Dev Biol. 2007 February 01; 302(1-5): 50–65.
Sponsored Docum
ent Sponsored D
ocument
Sponsored Docum
ent
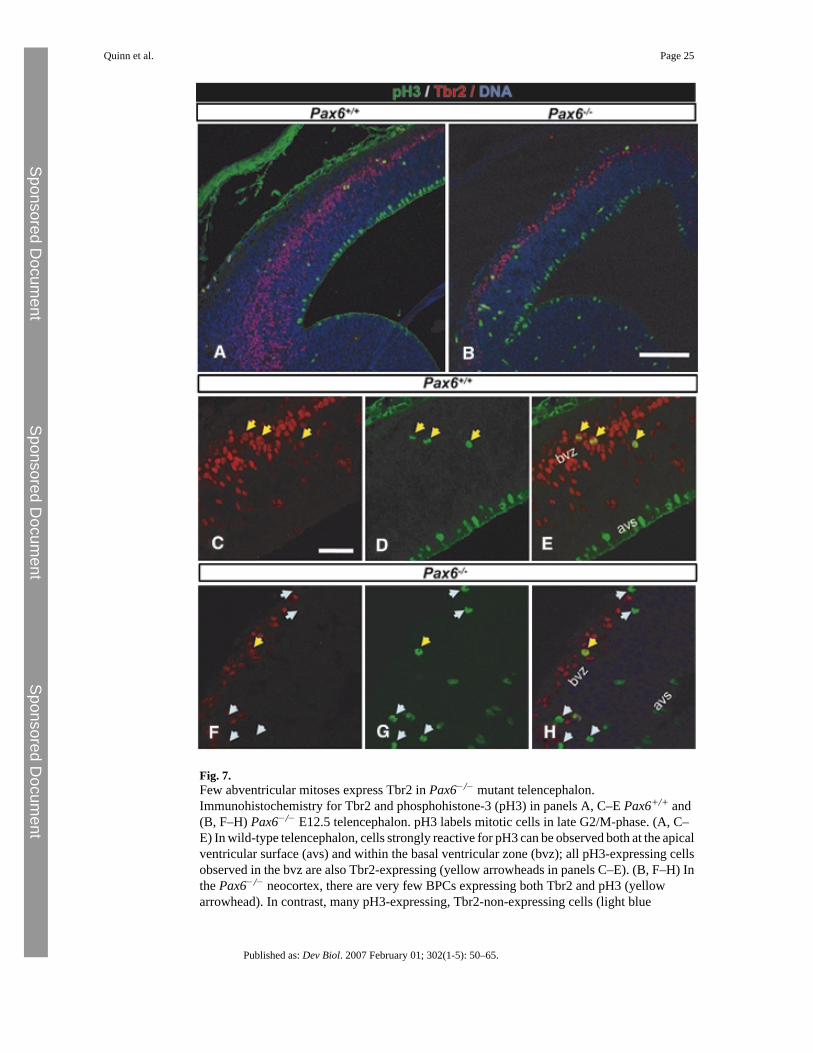
Fig. 7.Few abventricular mitoses express Tbr2 in Pax6−/− mutant telencephalon.Immunohistochemistry for Tbr2 and phosphohistone-3 (pH3) in panels A, C–E Pax6+/+ and(B, F–H) Pax6−/− E12.5 telencephalon. pH3 labels mitotic cells in late G2/M-phase. (A, C–E) In wild-type telencephalon, cells strongly reactive for pH3 can be observed both at the apicalventricular surface (avs) and within the basal ventricular zone (bvz); all pH3-expressing cellsobserved in the bvz are also Tbr2-expressing (yellow arrowheads in panels C–E). (B, F–H) Inthe Pax6−/− neocortex, there are very few BPCs expressing both Tbr2 and pH3 (yellowarrowhead). In contrast, many pH3-expressing, Tbr2-non-expressing cells (light blue
Quinn et al. Page 25
Published as: Dev Biol. 2007 February 01; 302(1-5): 50–65.
Sponsored Docum
ent Sponsored D
ocument
Sponsored Docum
ent

arrowheads) are present within the proliferating zone. Scale bars (A, B) = 100 μm, (C–H) = 80 μm.
Quinn et al. Page 26
Published as: Dev Biol. 2007 February 01; 302(1-5): 50–65.
Sponsored Docum
ent Sponsored D
ocument
Sponsored Docum
ent
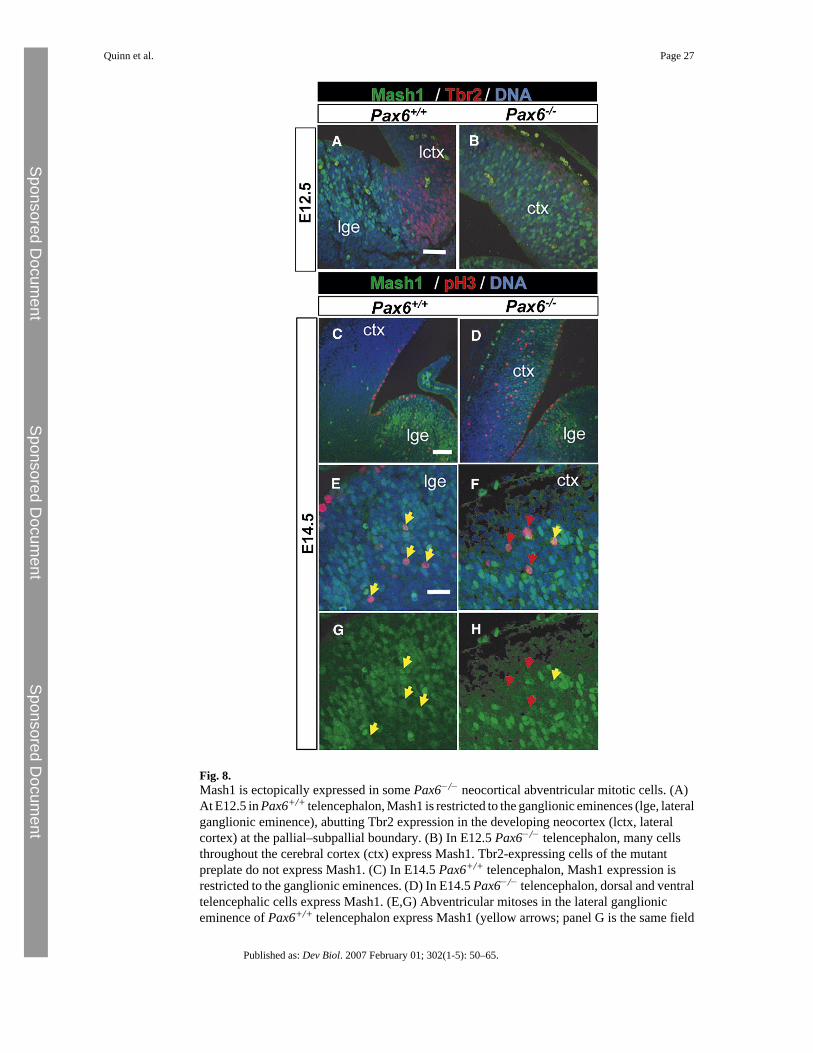
Fig. 8.Mash1 is ectopically expressed in some Pax6−/− neocortical abventricular mitotic cells. (A)At E12.5 in Pax6+/+ telencephalon, Mash1 is restricted to the ganglionic eminences (lge, lateralganglionic eminence), abutting Tbr2 expression in the developing neocortex (lctx, lateralcortex) at the pallial–subpallial boundary. (B) In E12.5 Pax6−/− telencephalon, many cellsthroughout the cerebral cortex (ctx) express Mash1. Tbr2-expressing cells of the mutantpreplate do not express Mash1. (C) In E14.5 Pax6+/+ telencephalon, Mash1 expression isrestricted to the ganglionic eminences. (D) In E14.5 Pax6−/− telencephalon, dorsal and ventraltelencephalic cells express Mash1. (E,G) Abventricular mitoses in the lateral ganglioniceminence of Pax6+/+ telencephalon express Mash1 (yellow arrows; panel G is the same field
Quinn et al. Page 27
Published as: Dev Biol. 2007 February 01; 302(1-5): 50–65.
Sponsored Docum
ent Sponsored D
ocument
Sponsored Docum
ent

as panel E in green channel alone). (F, H) Most pH3-expressing cells undergoing mitosis inabventricular locations in the Pax6−/− neocortex do not express Mash1 (red arrows); a minorityof these cells do express low levels of Mash1 (yellow arrows; panel H is the same field as panelF in the green channel alone). Scale bars (A, B) = 80 μm; (C, D) = 160 μm; (E–H) = 40 μm.
Quinn et al. Page 28
Published as: Dev Biol. 2007 February 01; 302(1-5): 50–65.
Sponsored Docum
ent Sponsored D
ocument
Sponsored Docum
ent

Fig. 9.Pax6 is required cell autonomously for Tbr2 expression and repression of lateral ganglioniceminence markers in cortical cells. (A, B) Sections of cortex of Pax6−/−↔Pax6+/+ chimeradouble-labeled for Tbr2 protein (green) and Pax6−/− cells (red dots resulting from DNA–DNAin situ hybridization to a reiterated β-globin transgene, β-glb). Most Pax6−/− cells do notexpress Tbr2 (Panel A, rostral section; Panel B, central section). (C, D) Sections of cortex (C)and lateral ganglionic eminence (D) of Pax6−/−↔Pax6+/+ chimera double-labeled for Mash1protein (grey) and Pax6−/− cells (brown dots). In cortex, Mash1 expression is in Pax6−/− cellsbut not in wild-type cells. In the lateral ganglionic eminence, Mash1 is expressed in both wild-type and Pax6−/− cells. (E, F) Sections of rostral (E) and caudal (F) cortex ofPax6−/−↔Pax6+/+ chimera double-labeled for Gsh2 protein (grey) and Pax6−/− cells (browndots). Gsh2 expression coincides with the Pax6−/− cells. (G) Dlx2-positive cells in the cortexof a Pax6−/−↔Pax6+/+ chimera. (H) Dlx2-positive cells in the lateral ganglionic eminence(lge), medial ganglionic eminence (mge) and cortex (ctx) of a Pax6−/−↔Pax6+/+ chimera; (I)Dlx2-positive cells in the cortex are Pax6−/− (i.e., Tg-positive). (J) Nkx2.1-positive cells in
Quinn et al. Page 29
Published as: Dev Biol. 2007 February 01; 302(1-5): 50–65.
Sponsored Docum
ent Sponsored D
ocument
Sponsored Docum
ent

the medial ganglionic eminence (mge) and around the internal capsule (ic) of aPax6−/−↔Pax6+/+ chimera; (K) Pax6−/− (Tg+) cortical cells are Nkx2.1-negative. Scale bars:(A, B, G, K) = 40 μm; (C–F, I) = 20 μm; (H, J) = 60 μm.
Quinn et al. Page 30
Published as: Dev Biol. 2007 February 01; 302(1-5): 50–65.
Sponsored Docum
ent Sponsored D
ocument
Sponsored Docum
ent

Fig. 10.Pax6−/− cells in the medial regions of the cortex downregulate Tbr2 and upregulate ventraltelencephalic markers. (A) Hippocampus of Pax6−/−↔Pax6+/+ chimera double-labeled forTbr2 protein (green) and Pax6−/− cells (red dots, as in Fig. 9). (B) Hippocampus ofPax6−/−↔Pax6+/+ chimera double-labeled for Mash1 protein (grey) and Pax6−/− cells (browndots). Scale bar = 20 μm.
Quinn et al. Page 31
Published as: Dev Biol. 2007 February 01; 302(1-5): 50–65.
Sponsored Docum
ent Sponsored D
ocument
Sponsored Docum
ent

Sponsored Docum
ent Sponsored D
ocument
Sponsored Docum
ent
Quinn et al. Page 32
Table 1
Average lengths (mean ± SEM) of S-phase (Ts) and total cell cycle (Tc) for Pax6+/+ and Pax6−/− telencephalonat E10.5 and E12.5 estimated by IdU/BrdU double labeling method
Dorsal telencephalon Ts (h) Tc (h) Ts/Tc
E10.5
Pax6+/+ (n = 2) 4.4 7.5 0.58
Pax6−/− (n = 2) 5.0 8.6 0.58
Neocortex Ts (h) ± SEM Tc (h) ± SEM Ts/Tc ± SEM
E12.5
Pax6+/+ (n = 3) 5.8 ± 0.78 11.9 ± 1.69 0.48 ± 0.22
Pax6−/− (n = 4) 6.9 ± 0.09 14.4 ± 0.24 0.47 ± 0.61
p= 0.15 0.24 0.61
Hippocampus
Pax6+/+ (n = 3) 6.9 ± 1.36 17.1 ± 4.18 0.40 ± 0.02
Pax6−/− (n = 4) 7.3 ± 0.45 16.5 ± 1.04 0.44 ± 0.03
p= 0.81 0.89 0.47
Data were compared using a Student's t-test to obtain p values.
Published as: Dev Biol. 2007 February 01; 302(1-5): 50–65.