Interannual variability of wheat yield in the Argentine Pampas ...

Deep-Sea Research II ] (]]]]) ]]]–]]]
Contents lists available at SciVerse ScienceDirect
Deep-Sea Research II
0967-06
http://d
n Corr
E-m
laural@
varelaal
luis.troc
mary.sc
druedar
PleasDeep
journal homepage: www.elsevier.com/locate/dsr2
Interannual variability in sea surface temperature and fCO2 changesin the Cariaco Basin
Y.M. Astor a,n, L. Lorenzoni b, R. Thunell c, R. Varela a, F. Muller-Karger b, L. Troccoli d, G.T. Taylor e,M.I. Scranton e, E. Tappa c, D. Rueda b
a Fundacion La Salle de Ciencias Naturales, EDIMAR, Punta de Piedras, Edo. Nueva Esparta, Venezuelab University of South Florida, College of Marine Science, 140 7th Ave. S., St. Petersburg, FL 33701, USAc University of South Carolina, Department of Earth and Ocean Sciences, Columbia, SC 29208, USAd Universidad de Oriente, ECLAM, Boca del Rıo, Edo. Nueva Esparta, Venezuelae Stony Brook University, School of Marine and Atmospheric Sciences, Stony Brook, NY 11794-5000, USA
a r t i c l e i n f o
Keywords:
CO2 fugacity
Upwelling
Cariaco Basin
Sea surface temperature
Climate variability
45/$ - see front matter & 2013 Elsevier Ltd. A
x.doi.org/10.1016/j.dsr2.2013.01.002
esponding author. Tel.: þ58 295 808 3804; f
ail addresses: [email protected] (Y.M. A
marine.usf.edu (L. Lorenzoni), [email protected]
[email protected] (R. Varela), carib@marine
[email protected] (L. Troccoli), gordon.taylor@s
[email protected] (M.I. Scranton), tapp
[email protected] (D. Rueda).
e cite this article as: Astor, Y.M., et a-Sea Res. II (2013), http://dx.doi.org
a b s t r a c t
We examined the variability of sea surface carbon dioxide fugacity (fCO2sea) and its relation to
temperature at the Cariaco Basin ocean time-series location (101300N, 641400W) for the period from
1996 through 2008. Periods of warm (positive) and cold (negative) anomalies at the station were
related to variability in coastal upwelling intensity. A positive temporal trend in monthly-
deseasonalized sea surface temperatures (SST) was observed, leading to an overall increase of 1.13 1C
over 13 years. Surface fCO2sea displayed significant short-term variation (month to month) with a range
of 330–445 matm. In addition to a large seasonal range (58717 matm), deseasonalized fCO2sea data
showed an interannual positive trend of 1.7770.43 matm yr�1. In the Cariaco Basin, positive and
negative anomalies of temperature and fCO2sea are in phase. An increase/decrease of 1 1C coincides with
an increase/decrease of 16–20 matm of fCO2sea. Deseasonalized fCO2sea normalized to 26.05 1C, the mean
Cariaco SST, shows a lower rate of increase (0.5170.49 matm yr�1). Based on these observations, 72% of
the increase in fCO2sea in Cariaco Basin between 1996 and 2008 can be attributed to an increasing
temperature trend of surface waters, making this the primary factor controlling fugacity at this
location. During this period, a decrease in upwelling intensity was also observed. The phytoplankton
community changed from large diatom-dominated blooms during upwelling in the late 1990’s to
blooms dominated by smaller cells in the first decade of the 21st century. The average net sea-air CO2
flux over the study period is 2.072.6 mol C m�2 yr�1 employing the Wanninkhof parameterization,
and 2.172.5 mol C m�2 yr�1 based on Nightingale’s model. To further understand the connection
between the changes observed in the Cariaco Basin, the relationships between interannual variability in
the temperature anomaly with three modes of climate variability (AMO, NAO and ENSO) were
examined. The correlations between SSTA and two of these climate modes (AMO and ENSO) only
show very weak relationships, although they were significant.
& 2013 Elsevier Ltd. All rights reserved.
1. Introduction
Although continental margins represent only about 0.5% of theocean volume and occupy less than 8% of the seafloor, they playan important role in regulating the exchange of carbon dioxide(CO2) and the storage of carbon within the global ocean (Doney
ll rights reserved.
ax: þ58 295 239 8051.
stor),
.edu (R. Thunell),
.usf.edu (F. Muller-Karger),
tonybrook.edu (G.T. Taylor),
[email protected] (E. Tappa),
l., Interannual variability in/10.1016/j.dsr2.2013.01.002
et al., 2009; Liu et al., 2000; Muller-Karger et al., 2005). Due tohigh primary production and carbon storage rates in sediments,many continental margin areas are considered CO2 sinks (Chenand Borges, 2009). However, the balance between biogeochemicalprocesses (CO2 uptake/production, CaCO3 fixation/dissolution),transport (advection/turbulent diffusion), convective mixing, air-sea gas exchange, and riverine input determine whether aparticular region functions as a net source or sink of CO2.
Long-term and frequent observations of fugacity of seawaterCO2 (fCO2sea) are required to help reduce the large uncertainties inthe global estimates of CO2 flux (Nemoto et al., 2009). Indeed,both seasonal and spatial variability of CO2 concentrations in theocean may mask any long-term changes if careful observationsare not conducted within a time series framework (Bates, 2001).
sea surface temperature and fCO2 changes in the Cariaco Basin.i

Y.M. Astor et al. / Deep-Sea Research II ] (]]]]) ]]]–]]]2
Long time-series are a powerful tool for investigating biogeo-chemical cycles and marine ecosystems and their role in andresponse to climate variability. This important concept has led tothe initiation of a number of biogeochemical ocean time-seriesstations, both in open ocean and continental margin sites. Forexample, in the deep North Pacific Ocean at ocean time-seriesstation ALOHA (A Long-term Oligotrophic Habitat Assessment;221450N, 1581000W), observations have revealed an increase of2.8470.28 mmol kg�1 yr�1 in surface total carbon dioxide (TCO2)between 1989 and 2001 (Dore et al., 2003). In the deep sub-tropical North Atlantic, at the Bermuda Atlantic Time-series Study(BATS; 311450N, 641100W), surface TCO2 increased by1.3770.16 mmol kg�1 yr�1 between 1983 and 2005 (Bates,2007), with surface and atmospheric pCO2 increasing at1.6770.28 matm yr�1 and 1.7870.02 matm yr�1 respectivelyover this 22 year period (Bates, 2007).
However, whether surface water CO2 varies over similar timescales in continental margin settings within the tropics are yetunknown. Since November 1995, the Cariaco Basin ocean time-series program (CARIACO) has conducted biogeochemical andecological observations at a location on the northern Venezuelanmargin (101300N, 641400W, Fig. 1) to examine the linkagesbetween water column processes and the flux of particles settlingto the seafloor. The Cariaco Basin is an ideal location to examinethis question because past changes in surface ocean processes arewell preserved in the sediment record accumulating in the basin.The Cariaco Basin has a unique set of oceanographic character-istics. The open exchange of water and materials with theCaribbean Sea only occurs above a 140 m deep sill. Consequently,there is a restriction (or limitation) of deep water circulation andmixing, which allows the formation of anoxic waters below320 m. The restricted circulation within the basin isolates it fromthe open ocean and makes it a trap for sinking materials. Theseasonally alternating coastal wind-driven upwelling controls thehigh seasonal biological productivity and particulate sedimentflux.
Fig. 1. Map depicting the Cariaco Basin and indicating
Please cite this article as: Astor, Y.M., et al., Interannual variability inDeep-Sea Res. II (2013), http://dx.doi.org/10.1016/j.dsr2.2013.01.002
While the Cariaco Basin has a long history of oceanographicstudies, very few have focused on the carbon dioxide system.Avila-Melean (1976) analyzed the relationship between TCO2 anddissolved oxygen in the nearby Gulf of Santa Fe. Hastings andEmerson (1988) measured TCO2 and total alkalinity (TA) in astudy of sulfate reduction above the O2–H2S interface. Zhang andMillero (1993) measured TCO2, pH, and TA in the eastern andwestern basins of the Cariaco Basin. Astor et al. (2005a,b)observed the interactions between physical and biochemicalparameters that lead to temporal variations in fCO2sea, findingthat even during periods of high production, the CO2 flux betweenthe ocean and the atmosphere decreased but remained positive,i.e. CO2 escaped from the ocean to the atmosphere.
In this paper, we report the results of CO2 observations at theCARIACO time-series station. We look at changes observed duringperiods of upwelling (dry season) and non-upwelling (rainyseason). We evaluate the rates of change of several hydrographicparameters over the period 1996–2008, and examine possibleconnections with different modes of climate variability.
1.1. Study area
The Cariaco Basin, located on the continental margin of Vene-zuela, is a tectonic depression (�1400 m deep) subject to seasonalchanges in atmospheric forcing that affect the water column’s upperlayers. Intermittent easterly trade winds (46 m s�1) are responsi-ble for offshore surface Ekman transport and wind-driven coastalupwelling during winter and early spring (January–April). Rainyconditions and weak winds are typical between September andDecember, the months of non-upwelling. A transition period occursbetween June and August when a short and relatively weaksecondary upwelling event occurs with characteristics and timingthat vary from year to year (Astor et al., 2003). The causes of thissecondary upwelling event are linked to variations in the wind curl(Rueda-Roa, 2012). During the primary upwelling event, high
the location of the CARIACO time series station.
sea surface temperature and fCO2 changes in the Cariaco Basin.i

Y.M. Astor et al. / Deep-Sea Research II ] (]]]]) ]]]–]]] 3
salinity (S436.8) Subtropical Underwater (SUW) reaches the sur-face (Morrison and Smith, 1990). This nutrient- and carbon-richwater stimulates primary production (41.5 gC m�2 d�1, Muller-Karger et al., 2001) during the period of upwelling. The reminer-alization of the sinking particulate organic matter and limitedcirculation maintain a suboxic zone (dissolved oxygen and sulfideo5 mM) between 200 and 320 m, with anoxic conditions fullydeveloped deeper than about 320 m.
2. Methods
Observations of the inorganic carbon system were made betweenJanuary 1996 and December 2000, and from March 2002 to Decem-ber 2008 on board the R/V Hermano Gines (Fundacion La Salle deCiencias Naturales de Venezuela). All data, including the time series ofpH (pH on the total hydrogen ion concentration, pHT), total alkalinity(TA), TCO2, and fCO2sea are publicly available on the CARIACO webpage (/http://www.imars.usf.edu/CAR/index.htmlS) and through theOcean Carbon and Biogeochemistry (OCB) Data Management Office(/http://mapservice.bco-dmo.org/mapsbin/global/mapS). Continu-ous hydrographic profiles and water samples were collected using aCTD system (SeaBird SBE-19 from January to September 1996; SBE-25 for all subsequent cruises). Sampling details were described inAstor et al. (2003, 2005a).
The parameters measured to characterize the various compo-nents of the carbonate system are pH and TA. TA samples werecollected in 250-mL glass amber bottles and poisoned with 50 mLof saturated HgCl2 solution (final Hg concentration of about50 mM). Samples were stored at 4 1C and analyzed in the labora-tory. For pH, seawater samples were drawn directly from eachNiskin bottle into a 10 cm spectrophotometer cell. Colorimetricanalyses were made on board ship within 1 h of sample collec-tion. Samples for pH were measured using the spectrophoto-metric method of Clayton and Byrne (1993) as modified byDelValls and Dickson (1998) and Dickson et al. (2007). TAanalyses followed the method of Breland and Byrne (1993), andYao and Byrne (1998), with modifications suggested by Dr.Wensheng Yao (personal communication). Further details on thealkalinity and pH methods can be found in Astor et al. (2005a).The precision of the alkalinity and pH measurements are4 mmol kg�1 and 0.003 units of pH, respectively. Certified alkali-nity reference materials (CRM’s) supplied by A.G. Dickson (ScrippsInstitute of Oceanography) were analyzed for TA with each batchof samples for each cruise. The standard deviation between themean value of alkalinity measurements of the standards and thecertified value was 2 mmol kg�1.
TCO2 and fCO2sea were calculated using CO2SYS (Lewis andWallace, 1998), applying the carbonic acid dissociation constantsof Mehrbach et al. (1973) as modified by Dickson and Millero(1987), and equilibrium constants from Millero (1995). Theprecision of TCO2 and fCO2sea measurements were estimatedthrough 1000 Monte Carlo simulations using the average andstandard deviation for each input parameter. The uncertaintyassociated with TCO2 was about 2 mmol kg�1 and for fCO2sea
about 4 matm. Surface TA and TCO2 data were normalized (nTAand nTCO2) to the mean surface salinity (36.8) at the Cariacotime-series site (nTA¼36.8TA/S; nTCO2¼36.8TCO2/S) to removethe effects of local precipitation and evaporation. To normalizethe fCO2sea data (nfCO2sea), fCO2sea was recalculated at a constantT (using CO2SYS). The temperature used was 26.05 1C, which isthe mean of SST observations at the Cariaco station. Then, therecalculated fCO2sea was deseasonalized, and this data set wasregressed linearly against time (year).
The shallow cast (1–160 m) was always collected as close tolocal noon (16:30 UTC) as possible; therefore, heating effects on
Please cite this article as: Astor, Y.M., et al., Interannual variability inDeep-Sea Res. II (2013), http://dx.doi.org/10.1016/j.dsr2.2013.01.002
the ocean’s surface are strong. The effect of daytime warmingtogether with low wind speeds may enhance air-sea CO2 flux(Ward et al., 2004). Therefore, we used the average of fCO2sea
estimates at 1 and 7 m to minimize the temperature effect and toassess air-sea CO2 flux. TCO2, TA, salinity and temperature werealso averaged between 1 and 7 m, and the average was used asrepresentative of surface layer values.
Estimates of the mixed-layer depth (MLD) were determined asthe depth where the difference between in situ density andsurface density exceeded 0.125 kg m�3. The coastal upwellingindex was estimated as the cross-shore Ekman transport per100 m coastline (M, m3 s�1 per 100 m of coastline; Bakun, 1973;Schwing et al., 1996) as follows:
M¼ tx=f ð1Þ
where M is the meridional Ekman transport resulting from thezonal wind stress (tx), and f is the Coriolis parameter. Because thezonal wind at the CARIACO site is negative by convention, the signof the offshore component of the Ekman transport estimatedalong the Venezuelan shoreline was modified to reflect thatnegative (offshore) Ekman transport leads to positive (upwelling)vertical transport. Thus, transport values reported here are shownas positive.
Wind data were derived from two meteorological stations locatedto the northeast of the CARIACO time-series station on MargaritaIsland, Venezuela (one at 101560N 641060W in Punta de Piedras, andthe other at a nearby station at 101540N 631580W in PorlamarInternational Airport). Zonal wind stress was estimated from themonthly mean wind speed since wind speeds are relatively stableover periods of weeks to months in this tropical setting.
Phytoplankton biomass was estimated as chlorophyll a (Chla)extracted in methanol and measured on a Turner Designs fluorom-eter using standard methods (Falkowski and Kiefer, 1985; Holm-Hansen et al., 1965). Primary productivity observations were made atthe same depths as Chla using a modified Steeman Nielsen (1952)NaH14CO3 uptake assay. Further details on the primary productionmethod can be found in Muller-Karger et al. (2001). Primaryproductivity and Chla values were integrated from 1 to 7 m forconsistency with all other parameters. Phytoplankton samples fortaxonomy were fixed with neutralized formalin and were analyzedin the laboratory with the Utermohl technique (Hasle, 1978).
A single mooring containing five automated sediment traps isused to measure the vertical flux of particles at various depths inthe Cariaco Basin water column. Further details on the character-istics of this mooring can be found in Thunell et al. (2008). Theratio of organic to inorganic carbon (Co/Ci) in the total carbon fluxderived from sediment trap samples collected at 225 m at thestudy site was calculated.
The sea-air CO2 flux, F, was calculated according to:
F ¼ kaDf CO2 ð2Þ
where k is the transfer velocity for sea-air CO2 exchange, a is thesolubility of CO2 and DfCO2 is the sea-air fCO2 difference (fCO2sea–fCO2 atm). DfCO2 was calculated from the difference between theaverage value of fCO2sea and the fugacity of CO2 in the atmosphere(fCO2 atm). Data for atmospheric CO2 was taken from Conway et al.(2009) for Ragged Point in Barbados (131100N 591260W) withinthe period of 1996 and 2008. An average value of atmosphericCO2 at this site for each month was used for calculations.
The solubility of CO2 is a function of temperature and salinityand was calculated according to Weiss (1974). The CO2 gastransfer velocity is the exchange parameter between the oceanand the atmosphere, and different parameterizations yieldroughly a factor of two differences in gas transfer values overthe oceans (Wanninkhof et al., 2004); therefore, to assess the
sea surface temperature and fCO2 changes in the Cariaco Basin.i
21
22
23
24
25
26
27
28
29
30
Sea
Surf
ace
Tem
pera
ture
(°C
)
35.8
36.0
36.2
36.4
36.6
36.8
37.0
37.2
Salin
ity
0
500
1000
1500
2000
2500
3000
3500
996
997
998
999
000
001
002
003
004
005
006
007
008
009
M (
m3 s
-1 p
er 1
00 m
of
coas
tline
)
0
1
2
3
4
5
6
7
8
9
Win
d sp
eed
(m s
-1)
Y.M. Astor et al. / Deep-Sea Research II ] (]]]]) ]]]–]]]4
uncertainty in the estimates of sea-air CO2 fluxes, two parame-terizations were considered, namely Nightingale et al. (2000) andWanninkhof (1992)
k¼ 0:31u2 Sc=660� ��0:5
Wanninkhof ð1992Þ ð3Þ
k¼ 0:222u2þ0:333u� �
Sc=600� ��0:5
Nightingale et al: ð2000Þ
ð4Þ
where Sc is the Schmidt number and u is the monthly meanwind speed measured at 10 m above the ground. The Schmidtnumber is the ratio of the kinematic viscosity of seawater to theaqueous diffusion coefficient of CO2 in water, and it was calcu-lated using the Wanninkhof (1992).
Three indices designed to assess climate variability (the NorthAtlantic Oscillation (NAO), the Southern Oscillation Index (SOI),and the Atlantic Multidecadal Oscillation (AMO) index) wereobtained from NOAA’s Climate Prediction Center (/http://www.cpc.noaa.govS) and compared to the time series of CARIACO seasurface temperature anomalies (SSTA). The NAO describes a large-scale meridional oscillation in atmospheric mass between theAzores High and the Iceland Low. The Southern Oscillation Index(SOI), an indicator of large-scale variability in the Pacific Oceanassociated with the El Nino phenomenon, is calculated frommonthly fluctuations of atmospheric sea level pressure betweenDarwin, Australia and Tahiti. The AMO is an index that tracksvariability in temperatures of the North Atlantic Ocean.
2.1. Statistical analyses
The annual cycle was statistically removed (deseasonalized)from SST, salinity, pH, TA, TCO2, and fCO2 by subtracting monthlyobservations from 13-yr means (for SST and salinity) and 11-yrmeans (for CO2 parameters) and adding the overall mean (e.g.,Bates, 2007). The years 2001 and 2002 were excluded from CO2
statistics in this analysis because all CO2 data from 2001 and sixmonths from 2002 were missing due to equipment failure. Theobserved and deseasonalized monthly values were regressedlinearly against time (year) to obtain the rate of change. Anoma-lies were derived by subtracting the climatological mean frommonthly observations. The relationship among 10 environmentalvariables (TCO2, temperature, salinity, MLD, chlorophyll a, fCO2sea,primary production, upwelling index, ratio of organic to inorganiccarbon (Co/Ci), and diatom/coccolithophore (D/C) ratio) wereanalyzed by Principal Coordinate Analysis (PCO or PCoA). PCO isan ordination method similar to Principal Component Analysis(PCA). The PCO is an eigenanalysis routine where the analysisplaces the samples onto Euclidean axes using only a matrix ofinter-point dissimilarities, rather than from a correlation orcovariance matrix. The values for each variable were normalizedby having their mean subtracted and were divided by theirstandard deviation. Euclidean distances among centroids in thespace were calculated to normalized data to produce a resem-blance matrix that formed the basis of the analyses. This matrixwas used as an ordination method to visually compare groupdifferences and patterns through a projection of the data ontoaxes (Anderson et al., 2008). The analysis was performed usingPermanovaþ add-on package for Primer software.
1 1 1 1 2 2 2 2 2 2 2 2 2 2
Fig. 2. Time-series of monthly observations of (a) SST (1C), (b) SSS, and
(c) upwelling index (m3 s�1 per 100 m of coastline, black line-closed diamonds)
and wind speed (m s�1, dashed line-open triangles) at the CARIACO time-series
station from January 1996 to December 2008. In (a) and (b), the thin black line and
dashed line-open squares indicate monthly individual and deseasonalized mea-
surements, respectively. Linear trends are indicated in a and b for individual
values (black solid line) and deseasonalized data (dashed line). Trends are given in
Table 1. In (c), linear trend for upwelling index is indicated by the black line and
for wind speed by the dashed line.
3. Results and discussion
3.1. Hydrography
Several authors have documented the seasonal hydrographic,biological, and chemical characteristics of the water column at theCARIACO station (Astor et al., 1998, 2003, 2005a,b, 2006; Muller-
Please cite this article as: Astor, Y.M., et al., Interannual variability inDeep-Sea Res. II (2013), http://dx.doi.org/10.1016/j.dsr2.2013.01.002
Karger et al., 2001, 2010; Scranton et al., 2001, 2006a,b; Taylor et al.,2012; Virmani and Weisberg, 2009). Fig. 2 shows time-series of seasurface temperature (SST), sea surface salinity (SSS), wind speed andupwelling index. The highest SST typically occurred in associationwith the lowest SSS in September and October (Fig. 2a and b).Conversely, the lowest SST and highest SSS were observed fromJanuary through April, when stronger winds resulted in greatervertical mixing and upwelling. In addition to this pronouncedseasonal cycle, there was significant interannual variability in SSTand SSS, particularly in the seasonal minima for both parameters. Anaverage seasonal SST range 670.6 1C, and a seasonal range of SSSof 0.6370.22 were observed between 1996 and 2008. The MLD
sea surface temperature and fCO2 changes in the Cariaco Basin.i

CARIACO Time Series
-4 -2 0 2 4PCO1 (63% of total variation)
-2
0
2
PCO
2 (1
4.9%
of t
otal
var
iatio
n)
NormaliseResemblance: D1 Euclidean distance
1996
1996
1997
1997199819981999
1999
2000
2000
2003
20032004
2004
20052005
20062006
2007
2007
2008
200819981999
000
2
200602000000200
2000
1996997
2003 200
9971998
1999000199199
2003
2006
20072
200
1996
22
20
0
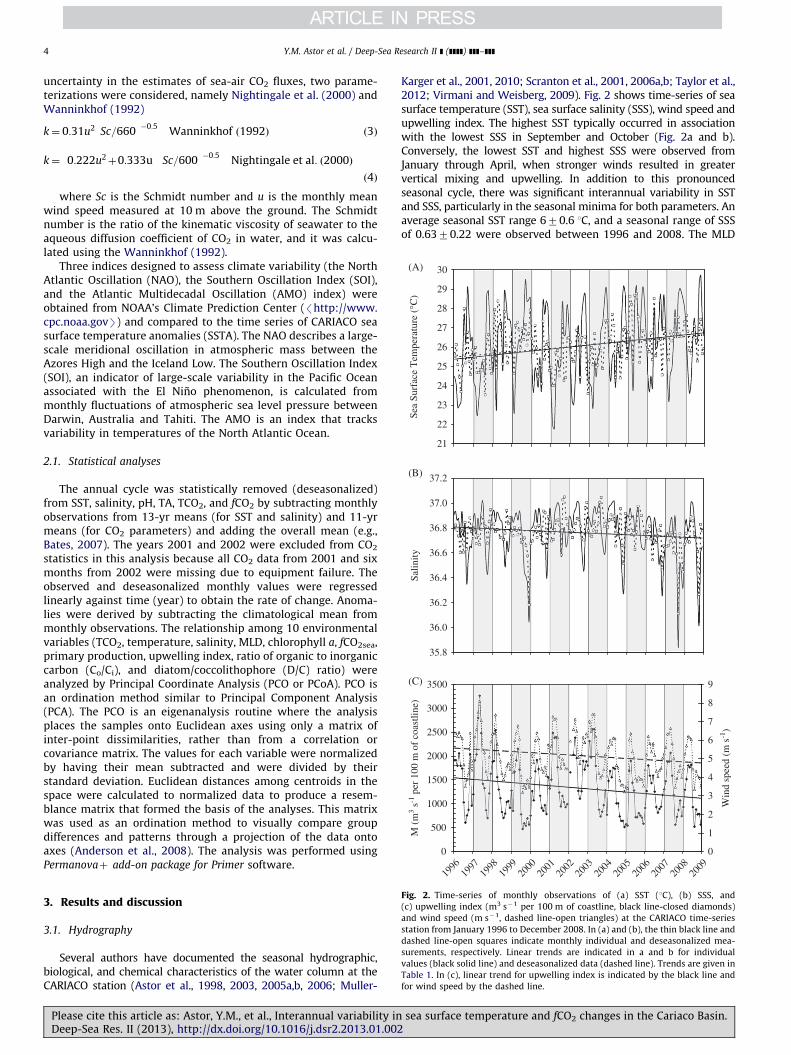
Fig. 4. Principal coordinates analysis PCO of distances among centroids on the
basis of Euclidean distances of normalized data of the CARIACO time-series
station. The upwelling periods are represented by triangles and non-upwelling
by squares. The years corresponding to the cold periods are circled in blue and
years of warm periods in red. Both axes combined explain 77.9% of the total
variation.
Y.M. Astor et al. / Deep-Sea Research II ] (]]]]) ]]]–]]] 5
was typically shallow with an average seasonal range of2177.6 m. Occasionally, eddies drifting near the shelf breakinjected oxygenated nutrient rich water into the basin enhancingbiological activity that resulted in a drawdown of CO2 (Astor et al.,2003, 2005a). Unfortunately, our data on the influence of eddieson the biogeochemistry of the basin is limited and precludes usfrom drawing further conclusions on the importance of thesesporadic events.
The wind speed also showed strong seasonal and interannualfluctuations, leading to variations in the strength of the upwelling(Fig. 2c). Periods with stronger upwelling (1996–1998, 2001–2003) were followed by years of weak upwelling (1999–2000,2004–2008). A linear fit model between SST and the upwellingindex shows a correlation coefficient equals to �0.60 (R2
¼0.37)indicating a moderately strong relationship between the twovariables.
Fig. 3 illustrates the SSTA from 1996 to 2008. A 12-monthrunning mean was applied to the monthly values. The SSTA datarevealed two cold periods (January 1996–March 1998, June 2000–December 2003) and two warm periods (April 1998–May 2000,January 2004–December 2008). Between 1996 and 2008, SSTAvalues oscillated 71 1C around the mean. When compared to theupwelling index, the periods of cold and warm anomalies coin-cided with periods of strong and weak upwelling intensities,respectively (Fig. 2c). A PCO analysis shows similar patterns inthe distribution. The years with similar characteristics occupy thesame location in multivariate space separating the years into coldand warm periods. The first axis (PCO1) is strongly associatedwith the separation between the upwelling and the non-upwelling season, and it explains 63% of the total variation(Fig. 4). Temperature differences among periods (warm and coldyears) are discernible along the second axis (PCO2), whichaccounts for an additional 14.9%. Together, both axes explain77.9% of the total variation. Overall, there is a clear separationbetween the upwelling and the non-upwelling season duringboth the cold and warm periods.
3.2. CO2 parameters: Surface values
Over the 13-year study period, surface pH fluctuated from 8.014to 8.113 (Fig. 5a). This range is similar to what we had observedpreviously over the shorter period of 1996–2000 (Astor et al.,2005a). Surface TA and nTA (Fig. 5b, nTA not shown) had meanvalues of 2413719 and 2416715 mmol kg�1, respectively.
-3
-2
-1
0
1
2
3
1996 1997 1998 1999 2000 2001 2002 2003 2004 2005 2006 2007 2008 2009
SSTA
(o C)
-40
-30
-20
-10
0
10
20
30
40
Surf
ace fC
O2s
ea a
nom
aly
(µat
m)
Fig. 3. Time-series of anomalies of sea surface temperature (SSTA) and surface
fCO2sea at the CARIACO time-series station from January 1996 to December 2008.
Anomalies were derived by subtracting the climatological mean from monthly
observations. Anomalies were smoothed using a 12-month running mean where
black line is for SSTA and gray line for fCO2sea anomaly.
Please cite this article as: Astor, Y.M., et al., Interannual variability inDeep-Sea Res. II (2013), http://dx.doi.org/10.1016/j.dsr2.2013.01.002
The high standard deviation at CARIACO reflects the higher envir-onmental variability of coastal waters, where controlling factorssuch as upwelling of a water mass and changing productivity areimportant. At the CARIACO station, TA changes may also occur dueto biogenic precipitation of calcium carbonate and the dissolutionof calcareous shells or skeletons. Biogenic precipitation was evidenton January 1997, January 1999, March 2007, and February 2008,when nTA values dropped by more than 20 mmol kg�1 and thenumber of coccolithophore cells in surface waters increased sig-nificantly (Luis Troccoli, pers. comm., Universidad de Oriente).Elevated TA values were usually associated to salinities greaterthan 36.8 which identifies Subtropical Underwater (Astor et al.,2003). This water mass may reach the surface during the peak ofupwelling (February–March) with high TA values.
Surface TCO2 and nTCO2 (Fig. 5c, nTCO2 not shown) variedbetween 1988 and 2137 (mean value 2072726 mmol kg�1), and1978 and 2132 mmol kg�1 (mean value 2074721 mmol kg�1),respectively, over the 13-year study period. Higher surface values(42100 mmol kg�1) were typical during periods of high upwel-ling and low precipitation. The relationship between TCO2 andsalinity was significant (R2
¼0.38, po0.01). In 2004, surfacevalues throughout the year were closer to the overall mean(2070 mmol kg�1). Seasonal variation of TCO2 over the entirestudy period had an average range of 83718 mmol kg�1. Sincedifferences between surface TA and nTA, and TCO2 and nTCO2 areminimal, we can say that changes in salinity due to mixing,evaporation, and precipitation had minimal effects on the CO2
parameters at the CARIACO station.Fig. 6a and b shows surface fCO2sea and normalized fCO2sea
(nfCO2sea) at a constant temperature at the CARIACO station overthe study period. Average surface fCO2sea was 395722 matmconsistent with our previous calculations for the period 1996–2000 (Astor et al., 2005a). Over the entire period, we observevalues that range from 330 to 445 matm, which is in the rangeobserved for the western tropical North Atlantic and the Carib-bean Sea (320–400 matm; Park and Wanninkhof, 2012;Wanninkhof et al., 2007).
3.3. Interannual trends from 1996 to 2008 at the CARIACO
Time-series station
3.3.1. Observed hydrographic and CO2 parameters.
Salinity, pH, TCO2, nTCO2, TA and nTA did not show significantchanges through time. For all these parameters, seasonality
sea surface temperature and fCO2 changes in the Cariaco Basin.i

8.00
8.02
8.04
8.06
8.08
8.10
8.12
8.14
pH
2340
2360
2380
2400
2420
2440
2460
2480
TA
(µm
ol k
g-1)
1960
1980
2000
2020
2040
2060
2080
2100
2120
2140
1996
1997
1998
1999
2000
2001
2002
2003
2004
2005
2006
2007
2008
2009
TC
O2
(µm
ol k
g-1)
Fig. 5. Time-series of monthly observations (individual and deseasonalized) of
(a) pH; (b) total alkalinity (mmol kg�1) and (b) total CO2 (mmol kg�1) at the
CARIACO time-series station from January 1996 to December 2008. The thin line
and dashed line-open squares indicate monthly individual and deseasonalized
measurements, respectively. Linear trends are indicated for individual and
deseasonalized data (black and dashed lines). Trends are given in Table 1.
300
320
340
360
380
400
420
440
460
480
f CO
2sea
(µa
tm)
300
320
340
360
380
400
420
440
460
480
1996
1997
1998
1999
2000
2001
2002
2003
2004
2005
2006
2007
2008
2009
nf C
O2s
ea (
µatm
)
Fig. 6. Time-series of monthly individual and deseasonalized of: (a) surface CO2
fugacity, (fCO2sea, matm) and (b) normalized CO2 fugacity (nfCO2sea, matm) at the
CARIACO time-series station from January 1996 to December 2008. The thin line
and dashed line-open squares indicate monthly individual and deseasona-
lized measurements, respectively. Linear trends are indicated for individual
values (black line) and deseasonalized data (dashed black line). Trends are given
in Table 1.
Table 1Summary linear least squares statistics for observations (1996�2008) at the
CARIACO time-series station. Both observed and deseasonalized statistics are
presented. The years 2001 and 2002 were excluded from CO2 statistics because all
CO2 data from 2001 and six months from 2002 were missing due to equipment
failure.
Parameter Slope Intercept Standard error n R2 p-value
ObservedT 0.1 �174.5 0.04 150 0.04 o0.01
S �0.01 49.9 0.004 150 0.01 0.14
pH �0.0004 8.825 0.0005 118 0.01 0.44
TA �0.37 3161 0.44 114 0.01 0.39
nTA 0.10 2216 0.33 114 o0.01 0.76
TCO2 �0.19 2451 0.61 112 o0.01 0.76
nTCO2 0.23 1622 0.49 112 o0.02 0.64
fCO2 1.95 �3505 0.48 112 0.13 o0.01
nfCO2 0.40 �406 0.61 112 o0.01 0.51
Upwelling index �29.3 60050 12.3 151 0.04 o0.02
Wind speed �0.05 111.9 0.02 151 0.03 o0.03
DeseasonalizedT 0.09 �148.2 0.02 150 0.09 o0.01
S 0.11 �177.8 0.06 150 0.03 0.1
pH �0.0005 8.974 0.0004 118 0.01 0.25
TA �0.29 2988 0.35 114 0.01 0.41
nTA 0.12 2175 0.31 114 o0.01 0.70
TCO2 �0.04 2143 0.46 112 o0.01 0.94
nTCO2 0.30 1480 0.44 112 o0.02 0.50
fCO2 1.77 �3142 0.43 112 0.13 o0.01
nfCO2 0.51 �631 0.49 112 o0.01 0.29
Y.M. Astor et al. / Deep-Sea Research II ] (]]]]) ]]]–]]]6
dominates variability, thus increasing the uncertainty in calculat-ing interannual trends. In contrast, the observed SST, the upwel-ling index, and fCO2sea at the CARIACO time-series station alldisplay linear interannual trends for the period 1996–2008(Figs. 2 and 6, and Table 1).
A statistically significant change was observed for SST. The rate ofchange of measured SST at CARIACO was 0.170.04 1C yr�1
(R2¼0.04, po0.01; Fig. 2a, Table 1). This is similar to the surface
warming (0.1170.03 1C yr�1) reported by Padin et al. (2010) for theequatorial upwelling system of the Atlantic Ocean. During this time,upwelling intensity (measured through the Bakun upwelling index)
Please cite this article as: Astor, Y.M., et al., Interannual variability in sea surface temperature and fCO2 changes in the Cariaco Basin.Deep-Sea Res. II (2013), http://dx.doi.org/10.1016/j.dsr2.2013.01.002i

Y.M. Astor et al. / Deep-Sea Research II ] (]]]]) ]]]–]]] 7
and wind speed at CARIACO have been decreasing (Fig. 2c). Theseparameters showed a rate of change of �29.3712.3 m3 s�1 per100 m of coastline yr�1 (R2
¼0.04, po0.02) and �0.0570.02m s�1 yr�1 (R2
¼0.03, po0.03), respectively. Upwelling intensityand wind speed are closely related and have a great influence on SSTat the station.
The fCO2sea data also showed a statistical significant positivetrend of 1.9570.48 matm yr�1 (R2
¼0.13, po0.01; Fig. 6a,Table 1). The total observed variation in fCO2sea at the CARIACOstation from 1996 to 2008 was �24 matm, representing a changeof 6% during the study period. If the effect of temperature isremoved, the nfCO2sea shows a lower rate of increase of0.4070.61 matm yr�1, which yields a statistically insignificanttrend (R2
¼o0.01, p40.5, Fig. 6b and Table 1). Therefore, theeffect of SST on fCO2sea at CARIACO is very significant.
3.3.2. Deseasonalized hydrographic and CO2 parameters
The amplitude of the seasonal variability in many of themeasured parameters is large and can easily mask low-amplitude,low-frequency interannual changes. Therefore, the annual cyclewas removed (deseasonalized) to evaluate long-term trends (e.g.,Bates, 2007). Deseasonalized SST and fCO2sea trends were statis-tically significant (Table 1, Figs. 2 and 6a). SST increased0.0970.02 1C yr�1 (R2
¼0.09, po0.01), and fCO2sea increased at1.7770.43 matm yr�1(R2
¼0.13, po0.01). Deseasonalized nfCO2
data showed an increase of 0.5170.49 matm yr�1 (R2¼o0.01,
p40.3), but this change was not statistically significant.
3.4. Factors controlling fCO2 variability
From thermodynamics considerations, temperature changesmay cause variations of 4.13–4.23% fCO2sea per 1 1C (Gordon andJones, 1973; Takahashi et al., 1993). Therefore, surface warming of1 1C would drive a �16 matm increase in fCO2sea at CARIACO.Fig. 3 shows that SSTA and fCO2sea anomalies are mostly in phasewith each other. An increase/decrease of 1 1C is usually followedby an increase/decrease of 16–20 matm of fCO2sea. Thus, the SSTincrease of 1.3 1C between 1996 and 2008 accounted for 16 matmincrease in fCO2sea explaining around 72% of the fCO2sea observedvariation. This suggests that the changes measured in fCO2sea
were primarily the result of surface-ocean warming inCariaco Basin.
Upwelling of subsurface water plays an important role in bring-ing high concentrations of TCO2 to the surface, favoring an increaseof fCO2sea. However, upwelling also brings low-temperature, high-nutrient waters to the surface, which can counter the effect of highTCO2 concentrations by lowering fCO2sea through an increase in CO2
solubility and changes in H2CO3 dissociation constants, togetherwith an increase in carbon fixation that enhances the removal of CO2
from surface waters. There is a strong inverse relationship betweenchlorophyll a concentration and SST (R2
¼0.45, po0.01). The highestchlorophyll a levels were observed at the surface in 1996 and 2001in conjunction with temperatures below 22 1C. After 2004, surfacewater temperatures were consistently above the annual mean, whilechlorophyll a levels were low and TCO2 concentrations were high.
The decrease in intensity of upwelling events since 2004,associated with a weakening in wind stress during boreal winter,resulted in the upwelling of waters from shallower depths.However, higher concentrations of TCO2, likely from subsurfacewaters, still reach the surface during this period, as noted in asharp increase in TCO2 below 15 m during the upwelling season.Changes in SST, nutrients and TCO2 concentrations observed insurface waters depend not only on upwelling intensity, but alsoon the vertical gradients of these parameters beneath the mixed
Please cite this article as: Astor, Y.M., et al., Interannual variability inDeep-Sea Res. II (2013), http://dx.doi.org/10.1016/j.dsr2.2013.01.002
layer (Mahadevan et al., 2004). Surface waters at CARIACOnormally show consistently low nutrients levels in the upper35–55 m and only occasionally during strong upwelling events,when upwelled waters come from 60–80 m, do they have nitrateconcentrations above 1 mM (Scranton et al., 2006b). The weakupwelling that prevailed between 2004 and 2008 at the CARIACOstation only brought shallow subsurface water (20–30 m) to thesurface. Hence, the low nutrient concentration effectively reducedcarbon fixation, which led to an accumulation of CO2 in surfacewaters. Additionally, weaker winds decreased vertical mixing,exposing the recently upwelled water to heating for a longerperiod. The warming of this upwelled subsurface water with highTCO2 concentration strengthened the thermally driven evasion ofCO2 from the sea to the atmosphere.
Another source of CO2 to surface waters is the respiration ofdissolved organic carbon (DOC) by bacteria (Jiao et al., 2010). DOCconcentrations at the CARIACO site are controlled by biologicaland physical processes, mainly extracellular release of DOC byphytoplankton, grazing by zooplankton, and decomposition bybacteria, and upwelling/stratification of the water column(Lorenzoni et al., submitted for publication). The CARIACO sitedoes not receive significant input of DOC from land (Lorenzoniet al., 2009). Variations in the concentration of DOC between theupwelling and rainy season is �6%, with higher DOC concentra-tions during the rainy season due to the strong thermal stratifica-tion the basin experiences. During upwelling, the SubtropicalUnderwater that is injected into the surface is DOC-poor (averageof �57 mMC, Del Castillo, 1998; CLIVAR-Repeat Hydrography,transect 22). It is possible that a fraction of the surface DOC iseventually degraded by bacteria upwelled with the underlyingwater. Carlson et al. (2004) showed that bacteria in the uppermesopelagic can consume surface accumulated DOM. Unfortu-nately, we currently have no estimate of what fraction of surfaceDOC can be degraded by microbial respiration, but it is our beliefthat this process is not one of the most significant controls ofsurface fCO2 in the Cariaco Basin.
Diatoms historically dominated the phytoplankton populationat the CARIACO station during the upwelling season (Goni et al.,2003; Thunell et al., 2000). Carbon fixation by these organismsreduces TCO2 and fCO2sea. When upwelling decreases and surfacewaters warm smaller phytoplankton, such as coccolithophores,become more abundant. These organisms can affect surface waterfCO2sea through calcification, leading to depletion of dissolvedcarbonate ion (CO2�
3 ) and an increase in CO2 (Archer, 2003)according to the reactions:
CO2þCO2�3 þH2O22HCO�3 þCa2þ2CaCO3þH2OþCO2
In order to evaluate the influence of this biological process onfugacity, we examined the ratio of organic to inorganic carbon(Co/Ci) in the total carbon flux derived from sediment trapsamples collected at 225 m at the study site. This ratio was thencompared to the ratio of diatom to coccolithophore (D/C) cellnumbers in surface water samples collected monthly at the studysite. Previous work has shown that a decrease in surface fCO2sea
occurs when the Co/Ci ratio is larger than about 0.7 due to CO2
uptake during net photosynthesis (Honda et al., 1997). Conver-sely, a Co/Ci ratio below 0.7 is associated with the prevalence ofcalcification processes in surface waters that increases fCO2sea.Before 2005, Co/Ci values were above 0.7 in 48% of the sedimenttrap samples, while after 2005 only 13% of the samples had Co/Ci
ratios above 0.7. This is consistent with a shift in the phytoplank-ton community from diatoms to CaCO3-fixing organisms in thearea. Before 2005, the D/C ratio was 41 in 68% of the watersamples, suggesting that diatoms were dominant in most of thesamples. This number decreased to 52% after 2005. In addition toa shift in the composition of the phytoplankton community at the
sea surface temperature and fCO2 changes in the Cariaco Basin.i

-60
-40
-20
0
20
40
60
80
Del
ta f
CO
2 (µ
atm
)
-25
-20
-15
-10
-5
0
5
10
15
20
25
1996
1997
1998
1999
2000
2001
2002
2003
2004
2005
2006
2007
2008
2009
CO
2 fl
ux (
mm
ol C
m-2
d-1
)
Fig. 7. Time-series of (a) DfCO2 (matm, DfCO2sea¼ fCO2sea� fCO2atm) and (b) CO2
fluxes (mmol C m�2 d�1) at the CARIACO time-series station from January 1996 to
December 2008. In (b), black line-closed circles denote flux estimated based on the
formulation for the gas exchange constant, k, of Wanninkhof (1992). Gray line-
closed diamonds denote flux estimated with k based on Nightingale et al. (2000).
Y.M. Astor et al. / Deep-Sea Research II ] (]]]]) ]]]–]]]8
station, there was also a significant decrease in overall phyto-plankton biomass. The increase in calcifying organisms likelycontributed to the observed increase in surface water CO2;additionally, the decrease in upwelling observed after 2005 alsoaffected the efficiency of the biological pump’s ability to removeCO2. The coupling of these processes (i.e., the lack of removal ofthe upwelled TCO2 due to a decrease in carbon fixation and theshift in phytoplankton population) may explain the remaining28% increase observed in fCO2sea, and these two processes,together with temperature, potentially contributed to the highfCO2sea values observed during 2005–2008.
3.5. Sea-air CO2 fluxes
At the CARIACO station, the monthly DfCO2sea (DfCO2sea¼
fCO2sea� fCO2atm) values (Fig. 7a) for 1996–2008 did not showsignificant differences relative to what was found for 1996–2000(Astor et al., 2005a). The average value for the entire period was23721.5 matm. High positive values were present most of theyear except during months of maximum upwelling (Februaryand/or March). These observations confirm that this area is aconsistent source of CO2 to the atmosphere. Smaller variabilitywas observed during months of relaxation, when temperatureswere high (428 1C) and primary production was low(o1 gC m�2 d�1). Strong negative DfCO2sea were associated withthe drawdown of CO2 during strong upwelling events and anincrease in net primary production above 3 gC m�2 d�1. Duringthese events, the area becomes a sink of CO2.
Fig. 7b illustrates the sea-air CO2 fluxes at the CARIACO station.Negative CO2 flux values denote net air to sea CO2 flux, whereaspositive values denote net evasion from the sea. Over the entire
Please cite this article as: Astor, Y.M., et al., Interannual variability inDeep-Sea Res. II (2013), http://dx.doi.org/10.1016/j.dsr2.2013.01.002
time series, values ranged between �16.2 mmol C m�2 d�1 inFebruary 2003 and 16.9 mmol C m�2 d�1 in March 2007. Only16% of the observations (n¼112) have negative values. The lowwind speeds (5.271.1 m s�1) and the large positive DfCO2 values(0oDfCO2sea matmo60) led to moderate supersaturation withrespect to atmospheric CO2 most of the time. Only during times ofvery high primary production was the system undersaturated.Due to the large difference in DfCO2sea, the average net sea-airCO2 flux over the study period was 2.072.6 mol C m�2 yr�1
employing the Wanninkhof (1992) parameterization, and2.172.5 mol C m�2 yr�1 based on Nightingale et al. (2000). Thesevalues were large compared to fluxes calculated in other upwellingsystems (0.56 mol C m�2 yr�1 in the north of the Benguela system;Santana-Casiano et al., 2009; 0.9 mol C m�2 yr�1 in the Gulf ofOman; Goyet et al., 1998). However, they were lower than the ratecalculated by Astor et al. (2005a), 2.873.6 mol C m�2 yr�1 withthe Wanninkhof (1992) parameterization for a shorter period ofCARIACO observations. In the Cariaco Basin, the primary factorsregulating sea-air CO2 flux are the high seasonal variability ofupwelling and its direct effect on both oceanographic conditionsand biological production.
3.6. Effects of modes of climate variability on SST
Major changes have been observed from year to year inmeteorological and oceanographic conditions in the CariacoBasin. In order to establish whether the interannual variabilityobserved in the SST at the CARIACO station is associated withmodes of low-frequency climate variability, the SSTA time serieswas compared with several indices of climatic variability, includ-ing the North Atlantic Oscillation (NAO), the Atlantic MeridionalOscillation (AMO) and the El Nino/Southern Oscillation (ENSO).
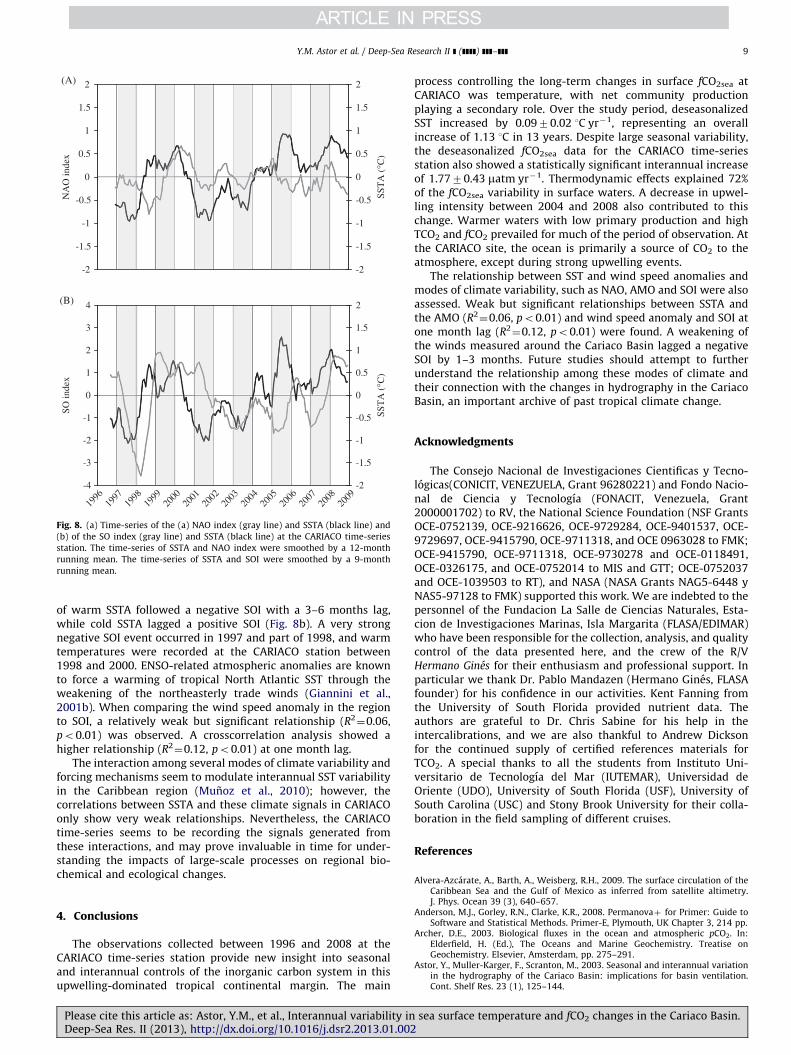
Although the dominant mode of atmospheric variability in theNorth Atlantic region appears to be the NAO (Bates, 2001), wefound very weak correlation between NAO and the SSTA at theCARIACO station. Crosscorrelation analysis between SSTA and theNAO index shows no significant relationship at a number ofdifferent lags. However, a visual examination of a 12-monthrunning mean for SSTA and the NAO index (Fig. 8) does suggestthat NAO and SSTA show a similar behavior between 2000 and2004, and between 2007 and 2008.
The AMO (Enfield et al., 2001) is a global signal that is mostintense in the North Atlantic, affecting the entire basin. The AMOindex shows a cool phase when negative and a warm phase whenpositive. For our entire study period, AMO was in a cool phase.However, a well-defined periodicity in this index still needs to beestablished (Poore et al., 2009). The index has been linked tomulti-year precipitation anomalies over North America, andappears to modulate ENSO teleconnections (Enfield et al., 2001;McCabe et al., 2004). When compared to the SSTA of the CARIACOstation, a weak but significant relationship (R2
¼0.06, po0.01)was observed.
Changes in the tropical Atlantic Ocean lag the ENSO variabilityin the tropical Pacific Ocean by 3–9 months (Enfield and Mayer,1997; Giannini et al., 2000; Klein et al., 1999; Saravanan andChan, 2000). More specifically, modes of climate variabilityoriginating in the Atlantic and Pacific affect the Intra-AmericasSea (IAS, Gulf of Mexico-Caribbean Sea; Giannini and Cane,2001a). ENSO teleconnections affect multiple processes in theCaribbean Sea, including geostrophic transport (Alvera-Azcarateet al., 2009), precipitation (Jury et al., 2007), and the phytoplank-ton community structure within the Cariaco Basin (Romero et al.,2009). When the Southern Oscillation index (SOI) was comparedto SSTA at CARIACO, no statistically significant relationship wasobserved. However, when a 9-month running mean was appliedto both the SSTA and SOI, a pattern was observed where periods
sea surface temperature and fCO2 changes in the Cariaco Basin.i
-2
-1.5
-1
-0.5
0
0.5
1
1.5
2
NA
O in
dex
-2
-1.5
-1
-0.5
0
0.5
1
1.5
2
SST
A (
°C)
-4
-3
-2
-1
0
1
2
3
4
1996
1997
1998
1999
2000
2001
2002
2003
2004
2005
2006
2007
2008
2009
SO in
dex
-2
-1.5
-1
-0.5
0
0.5
1
1.5
2
SST
A (
°C)
Fig. 8. (a) Time-series of the (a) NAO index (gray line) and SSTA (black line) and
(b) of the SO index (gray line) and SSTA (black line) at the CARIACO time-series
station. The time-series of SSTA and NAO index were smoothed by a 12-month
running mean. The time-series of SSTA and SOI were smoothed by a 9-month
running mean.
Y.M. Astor et al. / Deep-Sea Research II ] (]]]]) ]]]–]]] 9
of warm SSTA followed a negative SOI with a 3–6 months lag,while cold SSTA lagged a positive SOI (Fig. 8b). A very strongnegative SOI event occurred in 1997 and part of 1998, and warmtemperatures were recorded at the CARIACO station between1998 and 2000. ENSO-related atmospheric anomalies are knownto force a warming of tropical North Atlantic SST through theweakening of the northeasterly trade winds (Giannini et al.,2001b). When comparing the wind speed anomaly in the regionto SOI, a relatively weak but significant relationship (R2
¼0.06,po0.01) was observed. A crosscorrelation analysis showed ahigher relationship (R2
¼0.12, po0.01) at one month lag.The interaction among several modes of climate variability and
forcing mechanisms seem to modulate interannual SST variabilityin the Caribbean region (Munoz et al., 2010); however, thecorrelations between SSTA and these climate signals in CARIACOonly show very weak relationships. Nevertheless, the CARIACOtime-series seems to be recording the signals generated fromthese interactions, and may prove invaluable in time for under-standing the impacts of large-scale processes on regional bio-chemical and ecological changes.
4. Conclusions
The observations collected between 1996 and 2008 at theCARIACO time-series station provide new insight into seasonaland interannual controls of the inorganic carbon system in thisupwelling-dominated tropical continental margin. The main
Please cite this article as: Astor, Y.M., et al., Interannual variability inDeep-Sea Res. II (2013), http://dx.doi.org/10.1016/j.dsr2.2013.01.002
process controlling the long-term changes in surface fCO2sea atCARIACO was temperature, with net community productionplaying a secondary role. Over the study period, deseasonalizedSST increased by 0.0970.02 1C yr�1, representing an overallincrease of 1.13 1C in 13 years. Despite large seasonal variability,the deseasonalized fCO2sea data for the CARIACO time-seriesstation also showed a statistically significant interannual increaseof 1.7770.43 matm yr�1. Thermodynamic effects explained 72%of the fCO2sea variability in surface waters. A decrease in upwel-ling intensity between 2004 and 2008 also contributed to thischange. Warmer waters with low primary production and highTCO2 and fCO2 prevailed for much of the period of observation. Atthe CARIACO site, the ocean is primarily a source of CO2 to theatmosphere, except during strong upwelling events.
The relationship between SST and wind speed anomalies andmodes of climate variability, such as NAO, AMO and SOI were alsoassessed. Weak but significant relationships between SSTA andthe AMO (R2
¼0.06, po0.01) and wind speed anomaly and SOI atone month lag (R2
¼0.12, po0.01) were found. A weakening ofthe winds measured around the Cariaco Basin lagged a negativeSOI by 1–3 months. Future studies should attempt to furtherunderstand the relationship among these modes of climate andtheir connection with the changes in hydrography in the CariacoBasin, an important archive of past tropical climate change.
Acknowledgments
The Consejo Nacional de Investigaciones Cientificas y Tecno-logicas(CONICIT, VENEZUELA, Grant 96280221) and Fondo Nacio-nal de Ciencia y Tecnologıa (FONACIT, Venezuela, Grant2000001702) to RV, the National Science Foundation (NSF GrantsOCE-0752139, OCE-9216626, OCE-9729284, OCE-9401537, OCE-9729697, OCE-9415790, OCE-9711318, and OCE 0963028 to FMK;OCE-9415790, OCE-9711318, OCE-9730278 and OCE-0118491,OCE-0326175, and OCE-0752014 to MIS and GTT; OCE-0752037and OCE-1039503 to RT), and NASA (NASA Grants NAG5-6448 yNAS5-97128 to FMK) supported this work. We are indebted to thepersonnel of the Fundacion La Salle de Ciencias Naturales, Esta-cion de Investigaciones Marinas, Isla Margarita (FLASA/EDIMAR)who have been responsible for the collection, analysis, and qualitycontrol of the data presented here, and the crew of the R/VHermano Gines for their enthusiasm and professional support. Inparticular we thank Dr. Pablo Mandazen (Hermano Gines, FLASAfounder) for his confidence in our activities. Kent Fanning fromthe University of South Florida provided nutrient data. Theauthors are grateful to Dr. Chris Sabine for his help in theintercalibrations, and we are also thankful to Andrew Dicksonfor the continued supply of certified references materials forTCO2. A special thanks to all the students from Instituto Uni-versitario de Tecnologıa del Mar (IUTEMAR), Universidad deOriente (UDO), University of South Florida (USF), University ofSouth Carolina (USC) and Stony Brook University for their colla-boration in the field sampling of different cruises.
References
Alvera-Azcarate, A., Barth, A., Weisberg, R.H., 2009. The surface circulation of theCaribbean Sea and the Gulf of Mexico as inferred from satellite altimetry.J. Phys. Ocean 39 (3), 640–657.
Anderson, M.J., Gorley, R.N., Clarke, K.R., 2008. Permanovaþ for Primer: Guide toSoftware and Statistical Methods. Primer-E, Plymouth, UK Chapter 3, 214 pp.
Archer, D.E., 2003. Biological fluxes in the ocean and atmospheric pCO2. In:Elderfield, H. (Ed.), The Oceans and Marine Geochemistry. Treatise onGeochemistry. Elsevier, Amsterdam, pp. 275–291.
Astor, Y., Muller-Karger, F., Scranton, M., 2003. Seasonal and interannual variationin the hydrography of the Cariaco Basin: implications for basin ventilation.Cont. Shelf Res. 23 (1), 125–144.
sea surface temperature and fCO2 changes in the Cariaco Basin.i

Y.M. Astor et al. / Deep-Sea Research II ] (]]]]) ]]]–]]]10
Astor, Y., Scranton, M.I., Muller-Karger, F., Bohrer, R., Garcıa, J., 2005b. Variabilidadinteranual y estacional del CO2 y nutrientes en la Fosa de Cariaco. Mem. Fund.La Salle Cienc. Nat. 64 (161–162), 235–252.
Astor, Y.M., Meri, J.A., Muller-Karger, F., 1998. Variabilidad estacional hidrograficaen la Fosa de Cariaco. Mem. Soc. Cienc. Nat. La Salle 58 (149), 61–72.
Astor, Y.M., Scranton, M.I., Muller-Karger, F., Bohrer, R., Garcıa, J., 2005a. fCO2
variability at the CARIACO tropical upwelling time series station. Mar. Chem.97 (3–4), 245–261.
Astor, Y.M., Scranton, M., Guzman, L., Thunell, R., Muller-Karger, F., Taylor, G.,Fanning, K., Varela, R., 2006. Variabilidad estacional en la estructura hidro-quımica de las aguas suboxicas en la estacion Serie de Tiempo Cariaco. Gayana70 (supplement), 1–5.
Avila-Melean, R., 1976. Dioxido de carbono total y su relacion con el oxıgenodisuelto en las aguas del Golfo de Santa Fe, Estado Sucre. Venezuela. Bol. Inst.Oceanogr. Univ. Oriente 15 (2), 133–139.
Bakun, A., 1973. Coastal upwelling indices, west coast of North America, 1946–71.U.S. Department of Commerce, NOAA Technical Report NMFS SSRF-671, 103p.
Bates, N. R. (2007), Interannual variability of the oceanic CO2 sink in thesubtropical gyre of the North Atlantic Ocean over the last 2 decades, J.Geophys. Res., 112, C09013, http://dx.doi.org/10.1029/2006JC003759.
Bates, N.R., 2001. Interannual variability of oceanic CO2 and biogeochemicalproperties in the Western North Atlantic subtropical gyre. Deep-Sea ResearchII 48 (8–9), 1507–1528.
Breland II, J.A., Byrne, R.H., 1993. Spectrophotometric procedures for determina-tion of seawater alkalinity using bromocresol green. Deep-Sea Research I 40(3), 629–641.
Carlson, C.A., Giovannoni, S.J., Hansell, D.A., Goldberg, S.J., Parsons, R., Vergin, K.,2004. Interactions between DOC, microbial processes, and community struc-ture in the mesopelagic zone of the northwestern Sargasso Sea. Limnol.Oceanogr. 49 (4), 1073–1083.
Chen, C.T.-A., Borges, A.V., 2009. Reconciling opposing views on carbon cycling inthe coastal ocean: continental shelves as sinks and near-shore ecosystems assources of atmospheric CO2. Deep-Sea Research II 56 (8–10), 578–590.
Clayton, T.D., Byrne, R.H., 1993. Spectrophotometric seawater pH measurements:total hydrogen ion concentration scale calibration of m-cresol purple and at-sea results. Deep-Sea Research I 40 (10), 2115–2129.
Conway, T.J., Lang, P.M., Masarie, K.A., 2009. Atmospheric carbon dioxide dry airmole fractions from the NOAA ESRL Carbon Cycle Cooperative Global AirSampling Network. 1968–2008, Version: 2009-07-15, Path: /ftp://ftp.cmdl.noaa.gov/ccg/co2/flask/month/S.
Del Castillo, C., 1998. Optical Characteristics of the Colored Dissolved OrganicMatter in the Eastern Caribbean, West Florida Shelf and the Arabian Sea:Relationship Between Chemical Characteristics and Optical Responses. Ph.D.Thesis, University of South Florida, p. 132.
DelValls, T.A., Dickson, A.G., 1998. The pH of buffers based on 2-amino-2-hydroxymethyl-1,3-propanediol (‘tris’) in synthetic sea water. Deep-SeaResearch I 45 (9), 1541–1554.
Dickson, A.G., Millero, F.J., 1987. A comparison of the equilibrium constants for thedissociation of carbonic acid in seawater media. Deep-Sea Research Part A 34(10), 1733–1743.
Dickson, A.G., Sabine, C.L., Christian, J.R. (Eds.), 2007. Guide to Best Practices forOcean CO2 Measurements PICES Special Publications 3, Chapter 4, SOB6b,Canada, 191 pp.
Doney, S.C., Tilbrook, B., Roy, S., Metzl, N., Le Quere, C., Hood, M., Feely, R.A.,Bakker, D., 2009. Surface-ocean CO2 variability and vulnerability. Deep-SeaResearch II 56 (8–10), 504–511.
Dore, J.E., Lukas, R., Sadler, D.W., Karl, D.M., 2003. Climate-driven changes to theatmospheric CO2 sink in the subtropical North Pacific Ocean. Nature 424,754–757, http://dx.doi.org/10.1038/nature01885.
Enfield, D.B., Mayer, D.A., 1997. Tropical Atlantic sea surface variability and itsrelation to El Nino-Southern Oscillation. J. Geophys. Res. 102 (C1), 929–945.
Enfield, D.B., Mestas-Nunez, A.M., Trimble, P.J., 2001. The Atlantic MultidecadalOscillation and its relation to rainfall and river flows in the continental US.Geophys. Res. Lett. 28 (10), 2077–2080, http://dx.doi.org/10.1029/2000GL012745.
Falkowski, P., Kiefer, D.A., 1985. Chlorophyll fluorescence in phytoplankton:relationship to photosynthesis and biomass. J. Plankton Res. 7 (5), 715–731.
Giannini, A., Cane, M.A., 2001a. Interdecadal changes in the ENSO teleconnectionto the Caribbean region and the North Atlantic Oscillation. J. Clim. 14 (13),2867–2879.
Giannini, A., Kushnir, Y., Cane, M.A., 2000. Interannual variability of Caribbeanrainfall, ENSO, and the Atlantic Ocean. J. Clim. 13 (2), 297–311.
Giannini, A., Chiang, J.C.H., Cane, M.A., Kushnir, Y., 2001b. The ENSO teleconnectionto the Tropical Atlantic Ocean: contributions of the remote and local SSTs torainfall variability in the Tropical Americas. J. Clim. 14 (24), 4530–4544.
Goni, M.A., Aceves, H.L., Thunell, R.C., Tappa, E., Black, D., Astor, Y., Varela, R.,Muller-Karger, F., 2003. Biogenic fluxes in the Cariaco Basin: a combined studyof sinking particulates and underlying sediments. Deep-Sea Research I 50 (6),781–807.
Gordon, L.I., Jones, L.B., 1973. The effect of temperature on carbon dioxide partialpressure in seawater. Mar. Chem. 1 (4), 317–322.
Goyet, C., Millero, F.J., O’Sullivan, D.W., Eischeid, E., Mccue, S.J., Bellerby, R.G.J.,1998. Temporal variations of pCO2 in surface seawater of the Arabian Sea in1995. Deep-Sea Research I 45 (4–5), 609–623.
Please cite this article as: Astor, Y.M., et al., Interannual variability inDeep-Sea Res. II (2013), http://dx.doi.org/10.1016/j.dsr2.2013.01.002
Hasle, S., 1978. The inverted microscope method. In: A. Sournia (Ed.), Phytoplank-ton Manual, Chapter 5.2.1. United Nations Educational, Scientific and CulturalOrganization. Paris, 88–96.
Hastings, D., Emerson, S., 1988. Sulfate reduction in the presence of low oxygenlevels in the water column of the Cariaco Trench. Limnol. Oceanogr. 33 (3),391–396.
Holm-Hansen, O., Lorenzen, C.J., Holmes, R.W., Strickland, J.D.H., 1965. Fluoro-metric determination of chlorophyll. J. Cons. Int. Explor. Mer. 30 (1), 3–15.
Honda, M.C., Kusakabe, M., Nakabayashi, S., Manganini, S.J., Honjo, S., 1997.Change in pCO2 through biological activity in the marginal seas of the westernNorth Pacific: the efficiency of the biological pump estimated by a sedimenttrap experiment. J. Oceanogr. 53 (6), 645–662.
Jiao, N., Herndl, G.J., Hansell, D.A., Benner, R., Kattner, G., Wilhelm, S.W., Kirchman,D.L., Weinbauer, M.G., Luo, T., Chen, F., Azam, F., 2010. Microbial produc-tion of recalcitrant dissolved organic matter: long term carbon storagein the global ocean. Nat. Rev. Microbiol. 8, 593–599, http://dx.doi.org/10.1038/nrmicro2386.
Jury, M., Malmgren, B.A., Winter, A., 2007. Subregional precipitation climate of theCaribbean and relationships with ENSO and NAO. J. Geophys. Res. 112(D16107), 10, http://dx.doi.org/10.1029/2006JD007541.
Klein, S.A., Soden, B., Lau, N.-C., 1999. Remote sea surface temperature variationsduring ENSO: evidence for a tropical atmospheric bridge. J. Clim. 12 (4),917–932.
Lewis, E., Wallace, D., 1998. Program developed for CO2 system calculations.Report ORNL/CDIAC-105, Carbon Dioxide Information and Analysis Center,Oak Ridge National Laboratory, U.S. Department of Energy, Oak Ridge,Tennessee, USA.
Liu, K.K., Iseki, K., Chao, S.Y., 2000. Continental margin carbon fluxes. In: thechanging ocean carbon cycle: a midterm synthesis of the Joint Global OceanFlux Study. In: Hanson, R.B., Ducklow, H.W., Field, J.G. (Eds.), InternationalGeosphere-Biosphere Programme Book Series. Cambridge University Press,Cambridge, pp. 187–239.
Lorenzoni, L., Taylor, G.T., Benitez-Nelson, C., Hansell, D.A., Montes, E., Masserini,R., Fanning, K., Varela, R., Astor, Y., Guzman, L., Muller-Karger, F., submitted.Spatial and seasonal variability of dissolved organic matter in the CariacoBasin. Global Biogeochem. Cycles, submission number 2013GB00457.
Lorenzoni, L., Thunell, R.C., Benitez-Nelson, C.R., Hollander, D., Martinez, N., Tappa,E., Varela, R., Astor, Y., Muller-Karger, F.E., 2009. The importance of subsurfacenepheloid layers in transport and delivery of sediments to the eastern CariacoBasin Venezuela. Deep-Sea Research I 56 (12), 2249–2262.
Mahadevan, A., Levy, M., Memery, L., 2004. Mesoscale variability of sea surfacepCO2: what does it respond to? Global Biogeochem. Cycles 18 (GB1017), 10,http://dx.doi.org/10.1029/2003GB002102.
McCabe, G.J., Palecki, M.A., Betancourt, J.L., 2004. Pacific and Atlantic Oceaninfluences on multidecadal drought frequency in the United States. Proc. Natl.Acad. Sci. USA 101 (12), 4136–4141.
Mehrbach, C., Culberson, C.H., Hawley, J.E., Pytkowicz, R.M., 1973. Measurement ofthe apparent dissociation constants of carbonic acid in seawater at atmo-spheric pressure. Limnol. Oceanogr. 18 (6), 897–907.
Millero, F., 1995. Thermodynamics of the carbon dioxide system in the oceans.Geochim. Cosmochim. Acta 59 (4), 661–677.
Morrison, J.M., Smith, O.P., 1990. Geostrophic transport variability along the Avesridge in the Eastern Caribbean Sea during 1985 and 1986. J. Geophys. Res. 95(C1), 699–710.
Muller-Karger, F.E., Varela, R., Thunell, R., Scranton, M., Bohrer, R., Taylor, G.,Capelo, J., Astor, Y., Tappa, E., Ho, T.-Y., Walsh, J.J., 2001. Annual cycle ofprimary production in the Cariaco Basin: response to upwelling and implica-tions for vertical export. J. Geophys. Res. 106 (C3), 4527–4542.
Muller-Karger, F.E., Varela, R., Thunell, R., Luerssen, R., Hu, Ch., Walsh, J.J., 2005.The importance of continental margins in the global carbon cycle. Geophys.Res. Lett. 32 (L01602), http://dx.doi.org/10.1029/2004GL021346.
Muller-Karger, F.E., Varela, R., Thunell, R.C., Scranton, M.I., Taylor, G.T., Astor, Y.,Benitez-Nelson, C.R., Lorenzoni, L., Tappa, E., Goni, M.A., Rueda, D., Hu, C., 2010.The CARIACO oceanographic time series. In: Liu, Kon-Kee, Larry, Atkinson,Renato, Quinones, Liana, Talaue-McManus (Eds.), Carbon and Nutrient Fluxesin Continental Margins: a Global Synthesis. JGOFS Continental Margins TaskTeam (CMTT). Springer-Verlag, Berlin/Heidelberg, pp. 454–464.
Munoz, E., Wang, C., Enfield, E., 2010. The Intra-Americas springtime sea surfacetemperature anomaly dipole as fingerprint of remote influences. J. Clim. 23 (1),43–56, http://dx.doi.org/10.1175/2009JCLI3006.1.
Nemoto, K., Midorikawa, T., Wada, A., Ogawa, K., Takatani, S., Kimoto, H., Ishii, M.,Inoue, H.Y., 2009. Continuous observations of atmospheric and oceanic CO2
using a moored buoy in the East China Sea: variations during the passage oftyphoons. Deep-Sea Research II 56 (8–10), 542–553.
Nightingale, P.D., Malin, G., Law, C.A., Watson, A.J., Liss, P.S., Liddicoat, M.I., Boutin,J., 2000. In situ evaluation of air-sea gas exchange parameterizations usingnovel conservative and volatile tracers. Global Biogeochem. Cycles 14 (1),373–387.
Padin, X.A., Vasquez-Rodrıguez, M., Castano, M., Velo, A., Alonso-Perez, A., Gago, J.,Gilcoto, M., Alvarez, M., Pardo, P.C., de la Paz, M., Rıos, A.F., Perez, F.F., 2010.Air-Sea CO2 fluxes in the Atlantic as measured during boreal spring. Biogeos-ciences 7 (5), 1587–1606.
Park, G.-H., Wanninkhof, R., 2012. A large increase of the CO2 sink in the westerntropical North Atlantic from 2002 to 2009. J. Geophys. Res. 117 (C08029), 10,http://dx.doi.org/10.1029/2011JC007803.
sea surface temperature and fCO2 changes in the Cariaco Basin.i

Y.M. Astor et al. / Deep-Sea Research II ] (]]]]) ]]]–]]] 11
Poore, R.Z., DeLong, K.L., Richey, J.N., Quinn, T.M., 2009. Evidence of multidecadalclimate variability and the Atlantic Multidecadal Oscillation from a Gulf ofMexico sea-surface temperature-proxy record. Geo-Mar. Lett. 29 (6), 477–484,http://dx.doi.org/10.1007/s00367-009-0154-6.
Romero, O.E., Thunell, R.C., Astor, Y., Varela, R., 2009. Seasonal and interannualdynamics in diatom production in the Cariaco Basin, Venezuela. Deep-SeaResearch I 56 (4), 571–581.
Rueda-Roa, D., 2012. On the Spatial and Temporal Variability of Upwelling in theSouthern Caribbean Sea and its Influence on the Ecology of Phytoplankton andof the Spanish Sardine (Sardinella aurita). Ph.D. Dissertation, University ofSouth Florida.
Santana-Casiano, J.M., Gonzalez-Davila, M., Ucha, I.R., 2009. Carbon dioxide fluxesin the Benguela upwelling system during winter and spring: a comparisonbetween 2005 and 2006. Deep-Sea Research II 56 (8–10), 533–541.
Saravanan, R., Chan, P., 2000. Interaction between Tropical Atlantic Variability andEl Nino–Southern Oscillation. J. Clim. 13 (13), 2177–2194.
Schwing, F., O’Farrell, M., Steger, J.M., Baltz, K., 1996. Coastal-upwelling indicesWest coast of North America 1946–95. U.S. Department of Commerce. NOAATechnical Memorandum NMFS SWFSC-23, 32p.
Scranton, M., Astor, Y., Percy, D., Li, X., Lin, X., Taylor, G., 2006a. Biogeoquımica dela zona suboxica y anoxica en la Fosa de Cariaco. Gayana 70 (Suppl. 6), 83–86.
Scranton, M.I., Astor, Y., Bohrer, R., Ho, T.-Y., Muller-Karger, F., 2001. Controls ontemporal variability of the geochemistry of the deep Cariaco Basin. Deep SeaResearch I 48 (7), 1605–1625.
Scranton, M.I., McIntyre, M., Taylor, G.T., Muller-Karger, F., Fanning, K., Astor, Y.,2006b. Temporal variability in the nutrient chemistry of the Cariaco Basin. In:Neretin, L.N. (Ed.), Past and Present Water Column Anoxia. NATO ScienceSeries. Springer, Netherlands, pp. 139–160.
Steeman Nielsen, E., 1952. The use of radioactive carbon (14C) for measuringorganic production in the sea. J. Cons. Int. Explor. Mer. 18 (2), 117–140.
Takahashi, T., Olafsson, J., Goddard, J., Chipman, D.W., Sutherland, S., 1993.Seasonal variation of CO2 and nutrients in the high-latitude surface oceans:a comparative study. Global Biogeochem. Cycles 7 (4), 843–878.
Please cite this article as: Astor, Y.M., et al., Interannual variability inDeep-Sea Res. II (2013), http://dx.doi.org/10.1016/j.dsr2.2013.01.002
Taylor, G.T., Muller-Karger, F., Thunell, R.C., Scranton, M.I., Astor, Y., Varela, R.,Troccoli-Ghinaglia, L., Lorenzoni, L., Fanning, K.A., Hameed, S., Doherty, O.,2012. Ecosystem response to global climate change in the southern Caribbean
Sea. Proc. Natl. Acad. Sci. USA 109 (47), 19315–19320.Thunell, R., Benitez-Nelson, C., Muller-Karger, F., Lorenzoni, L., Fanning, K.,
Scranton, M., Varela, R., Astor, Y., 2008. Si cycle in the Cariaco Basin,Venezuela: Seasonal variability in silicate availability and the Si:C:N composi-tion particles. Global Biogeochem. Cycles 22 (GB4001), 14, http://dx.doi.org/
10.1029/2007GB003096.Thunell, R.C., Varela, R., Llano, M., Collister, J., Muller-Karger, F., Bohrer, R., 2000.
Organic carbon fluxes, degradation, and accumulation in an anoxic basin:sediment trap results from the Cariaco Basin. Limnol. Oceanogr. 45 (2), 300–308.
Virmani, J.I., Weisberg, R.H., 2009. Fish effects on ocean current observations in theCariaco Basin. J. Geophys. Res. 114 (C03028), http://dx.doi.org/10.1029/2008JC004889.
Wanninkhof, R., Sullivan, K.F., Top, Z., 2004. Air-sea gas transfer in the SouthernOcean. J. Geophys. Res. 109 (C08S19), http://dx.doi.org/10.1029/2003JC001767.
Wanninkhof, R., Olsen, A., Trinanes, J., 2007. Air-sea CO2 fluxes in the CaribbeanSea from 2002–2004. J. Mar. Syst. 66 (1–4), 272–284.
Wanninkhof, R.H., 1992. Relationship between wind speed and gas exchange overthe ocean. J. Geophys. Res. 97 (5), 7373–7382.
Ward, B., Wanninkhof, R., McGillis, W.R., Jessup, A.T., DeGrandpre, M.D., Hare, J.E.,Edson, J.B., 2004. Biases in the air-sea flux of CO2 resulting from ocean surface
temperature gradients. J. Geophys. Res. 109 (C08S08), http://dx.doi.org/10.1029/2003JC001800.
Weiss, R.F., 1974. Carbon dioxide in water and seawater: the solubility of a non-
ideal gas. Mar. Chem. 2 (3), 203–215.Yao, W., Byrne, R.H., 1998. Simplified seawater alkalinity analysis: use of linear
array spectrometers. Deep-Sea Research I 45 (8), 1383–1392.Zhang, J.-Z., Millero, F.J., 1993. The chemistry of the anoxic waters in the Cariaco
Trench. Deep-Sea Research I 40 (5), 1023–1041.
sea surface temperature and fCO2 changes in the Cariaco Basin.i
Copyright © 2022 FDOKUMEN