Providing seasonal-to-interannual climate information for risk management and decision-making
Upload
independentCategory
view
0download
0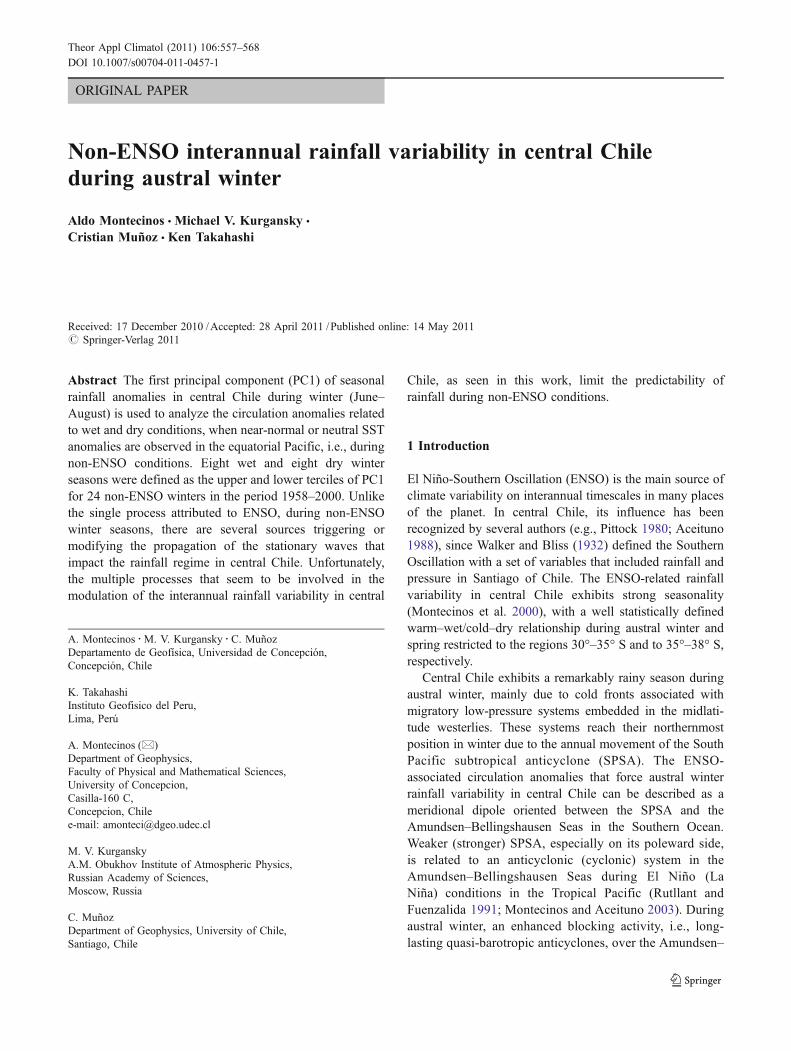
ORIGINAL PAPER
Non-ENSO interannual rainfall variability in central Chileduring austral winter
Aldo Montecinos & Michael V. Kurgansky &
Cristian Muñoz & Ken Takahashi
Received: 17 December 2010 /Accepted: 28 April 2011 /Published online: 14 May 2011# Springer-Verlag 2011
Abstract The first principal component (PC1) of seasonalrainfall anomalies in central Chile during winter (June–August) is used to analyze the circulation anomalies relatedto wet and dry conditions, when near-normal or neutral SSTanomalies are observed in the equatorial Pacific, i.e., duringnon-ENSO conditions. Eight wet and eight dry winterseasons were defined as the upper and lower terciles of PC1for 24 non-ENSO winters in the period 1958–2000. Unlikethe single process attributed to ENSO, during non-ENSOwinter seasons, there are several sources triggering ormodifying the propagation of the stationary waves thatimpact the rainfall regime in central Chile. Unfortunately,the multiple processes that seem to be involved in themodulation of the interannual rainfall variability in central
Chile, as seen in this work, limit the predictability ofrainfall during non-ENSO conditions.
1 Introduction
El Niño-Southern Oscillation (ENSO) is the main source ofclimate variability on interannual timescales in many placesof the planet. In central Chile, its influence has beenrecognized by several authors (e.g., Pittock 1980; Aceituno1988), since Walker and Bliss (1932) defined the SouthernOscillation with a set of variables that included rainfall andpressure in Santiago of Chile. The ENSO-related rainfallvariability in central Chile exhibits strong seasonality(Montecinos et al. 2000), with a well statistically definedwarm–wet/cold–dry relationship during austral winter andspring restricted to the regions 30°–35° S and to 35°–38° S,respectively.
Central Chile exhibits a remarkably rainy season duringaustral winter, mainly due to cold fronts associated withmigratory low-pressure systems embedded in the midlati-tude westerlies. These systems reach their northernmostposition in winter due to the annual movement of the SouthPacific subtropical anticyclone (SPSA). The ENSO-associated circulation anomalies that force austral winterrainfall variability in central Chile can be described as ameridional dipole oriented between the SPSA and theAmundsen–Bellingshausen Seas in the Southern Ocean.Weaker (stronger) SPSA, especially on its poleward side,is related to an anticyclonic (cyclonic) system in theAmundsen–Bellingshausen Seas during El Niño (LaNiña) conditions in the Tropical Pacific (Rutllant andFuenzalida 1991; Montecinos and Aceituno 2003). Duringaustral winter, an enhanced blocking activity, i.e., long-lasting quasi-barotropic anticyclones, over the Amundsen–
A. Montecinos :M. V. Kurgansky :C. MuñozDepartamento de Geofísica, Universidad de Concepción,Concepción, Chile
K. TakahashiInstituto Geofisico del Peru,Lima, Perú
A. Montecinos (*)Department of Geophysics,Faculty of Physical and Mathematical Sciences,University of Concepcion,Casilla-160 C,Concepcion, Chilee-mail: [email protected]
M. V. KurganskyA.M. Obukhov Institute of Atmospheric Physics,Russian Academy of Sciences,Moscow, Russia
C. MuñozDepartment of Geophysics, University of Chile,Santiago, Chile
Theor Appl Climatol (2011) 106:557–568DOI 10.1007/s00704-011-0457-1

Bellingshausen Seas contributes to northward migration ofthe baroclinic storm track in the eastern South Pacific,when El Niño develops in the Tropical Pacific. Dryconditions in central Chile are favored by long-lasting andsemi-permanent intense ridges in subtropical latitudes and asouthward migration of the midlatitude storm track in theeastern South Pacific, and they are relatively more frequentduring La Niña events (Montecinos and Aceituno 2003).
In the Southern Hemisphere, the main modes ofvariability of the atmospheric circulation on interannualand longer timescales have been amply described in theliterature (see Mo 2000 and references therein). The firstmode is a zonally symmetric pattern in the sea levelpressure field with opposite signs between the Antarcticaand midlatitudes. This mode has been named the High-Latitude Mode (Kidson 1999) or Southern Annular Mode,or Antarctic Oscillation (AAO) (Thompson and Wallace2000), and it is not related to ENSO. The second and thirdmodes of variability consist of wave train patterns calledthe Pacific South American (PSA) patterns: PSA1 andPSA2, respectively. They are in quadrature and depict asequence of large-scale cyclones and anticyclones extend-ing from the tropical Pacific into the Southern Ocean andeastern South America. The PSA1 has been related toENSO forcing with the Rossby wave train source regionlocated near the dateline in the Tropical Pacific. The PSA2seems to be also generated in the Tropical Pacific, neareastern Australia, and related to a quasi-biennial componentof ENSO (Mo 2000). In particular, the anticyclonic(cyclonic) system in the Amundsen–Bellingshausen Seasassociated with wet (dry) conditions in central Chile is partof the PSA1 pattern generated by El Niño (La Niña)conditions in the central tropical Pacific (Rutllant andFuenzalida 1991; Montecinos and Aceituno 2003).
Themain extratropical source of interannual-to-interdecadalrainfall variability in the Southern Hemisphere is the AAO.The AAO forces rainfall fluctuations in southeastern SouthAmerica during austral winter and late spring (Silvestri andVera 2003), western South Africa during austral winter andspring (Reason and Rouault 2005), southeastern and south-western Australia and western Tasmania (Hendon et al.2007), northern Australia (Meneghini et al. 2007), and NewZealand (Renwick and Thompson 2006). On interannualtimescales, an anti-correlation between an AAO index(linearly detrended) and rainfall in southern-central Chile isfound, with the maximum effect at 40°S (Gillett et al. 2006).Thus, during the positive (negative) phase of the AAO, thereis a reduction (increase) of rainfall. This relationship can beexplained by the reduction in the midlatitude zonal flow andthe associated frontal activity during the AAO (Garreaudet al. 2008). On the other hand, Quintana (2004) showedthat AAO partially explains the observed negative long-
term trend of annual precipitation in the southern portionof central Chile (37°–43°S).
Several authors have demonstrated the influence of therecently discovered Indian Ocean Dipole (IOD) on therainfall variability in many regions of the planet (e.g., Sajiet al. 1999). The positive phase of the IOD mode ischaracterized by positive (negative) sea surface temperature(SST) anomalies in the western (southeastern) tropicalIndian Ocean. The IOD mode has been related to rainfallinterannual fluctuations in the Indonesian region (Saji et al.1999), Indian summer Monsoon region (Terray et al. 2003),Australia (Ashok et al. 2003), Zimbabwe-East Africa (e.g.,Conway et al. 2007; Manatsa et al. 2008), among otherremote regions over Europe, northeast Asia, North andSouth America and South Africa (Saji and Yamagata 2003).In particular, Chan et al. (2008) found that SST forces aRossby wave train from subtropical south Indian Ocean tothe subtropical South Atlantic, reinforcing the SouthAtlantic subtropical anticyclone. According to Chan et al.(2008), this anomalous anticyclone drives anomalousdivergence (convergence) of moisture over central Brazil(subtropical La Plata Basin).
The influence of extratropical SST anomalies on rainfallhas been studied by several authors. For instance, Reasonet al. (2002) showed that austral winter rainfall variabilityin the southwestern South Africa (SWSA) can be modulatedby SST anomalies in the midlatitude South Atlantic and alsoby sea-ice extent in the Southern Ocean. These SSTanomalies favor an increased (decreased) upstream cyclo-genesis, a more northward (southward) position of midlat-itude cold fronts, and an enhancement (decrease) of rainfallover SWSA. Ting et al. (1996) demonstrated the modulatingimpact of SST anomalies in the North Pacific on winterrainfall anomalies over the USA, which they related tomidlatitude zonal mean flow variability. In this regard,Wang and Ting (2000) showed that about 45% of the winterrainfall variations are related to the Pacific SST anomalies,among which 35% are related to the North Pacific SST andassociated extratropical atmospheric circulation anomaliesand 10% are related to the tropical Pacific SST.
On the other hand, several authors have recently pointedout that there are two types of El Niño events, which arecharacterized by different SST anomaly patterns in theequatorial Pacific and different driving mechanisms (e.g.,Ashok et al. 2007; Kao and Yu 2009). The canonical ElNiño develops in the eastern equatorial Pacific, whereasduring the new type of El Niño, the positive SST anomaliesare located in the central equatorial Pacific. Larkin andHarrison (2005) presented evidence that these two distinctEl Niño events lead to different temperature and rainfallanomalies during boreal fall and winter around the globe.Similarly, Weng et al. (2007) found changes in the
558 A. Montecinos et al.
teleconnection patterns in the Pacific Ocean and theirassociated rainfall anomalies during austral winter.
The aim of the present paper is to describe theextratropical atmospheric circulation patterns associatedwith wet and dry austral winter seasons (hereafter justwinter seasons) in central Chile that are not explained byteleconnection patterns generated in the tropical Pacific, i.e.,occurring during non-ENSO winter seasons. The paper isorganized as follows: Section 2 describes the used data andmethodology. The obtained results are presented in Section 3.Finally, the results are discussed and concluding remarks aregiven in Section 4.
2 Data and methodology
The analysis is focused on the rainy season in central Chile,i.e., during the winter months from June to August, in theperiod 1958–2000. We used monthly rainfall time seriesfrom 63 stations in central Chile (30°–42°S). Large-scaleatmospheric circulation anomalies are analyzed by usingmonthly National Center for Environmental Prediction/National Center for Atmospheric Research (NCEP-NCAR)reanalysis (NNR) (Kalnay et al. 1996): 500-hPa geo-potential height (H500), sea level pressure (SLP), 300-hPazonal wind component (U300), 1,000–200 hPa thickness(Z), precipitation rate, and the 200-hPa streamfunction.Also, the monthly values of the extended reconstructedglobal SST version 3 (Smith et al. 2008) and griddedsurface air temperature and precipitation over SouthAmerica produced by the University of Delaware (UD)(Legates and Willmont 1990a, b) are used. The linear trendwas removed from all time series.
The standardization of rainfall data in central Chileconsisted in the transformation of each time series into theirpercentiles, using the cumulative probability estimator p(xi)=i/(n+1) (Wilks 2006), where i represents the position in time(rank) of an individual rainfall series (xi), after the n values(43) are sorted from lower to higher values. Thus, allstandardized rainfall anomalies vary from −0.48 to 0.48,with a standard deviation of 0.28. The Empirical OrthogonalFunction (EOF) is used to describe the spatial and temporalcovariability of the fields. To determine the significance ofthe EOF modes, the sampling error criteria of North et al.(1982) is used. In other analyses, the statistical significanceis evaluated by Monte Carlo tests at 95% of confidence level(von Storch and Zwiers 1999).
The non-ENSO rainfall variability and its associatedlarge-scale circulation anomalies are found by focusing onwinter seasons characterized by neutral SST conditions inthe tropical Pacific. The SST anomaly in the region Niño3.4 is widely used in ENSO related studies, i.e., in the
identification of El Niño and La Niña events. However, ithas been proven that Niño 3.4 SST anomalies cannotdistinguish between the two types of El Niño (Trenberthand Stepaniak 2001; Kao and Yu 2009). For that reason, thenon-ENSO winters are defined as those ones when none ofthe SST Niño's indices in the equatorial central Pacific hadstandardized SST anomalies exceeding in magnitude onestandard deviation (Fig. 1). According to this procedure, 24non-ENSO events were found during the winter season inthe period 1958–2000.
Following Vera et al. (2004), the source of stationarywave activity is diagnosed by computing the horizontalcomponents of the wave activity flux vector as defined byPlumb (1985); see Schubert and Park (1991) for thedefinition of the horizontal flux components based on theeddy component of the 200-hPa streamfunction. Accordingto Karoly et al. (1989), the horizontal stationary waveactivity flux is a useful method to diagnose the horizontalpropagation of quasi-stationary waves. As in Karoly et al.(1989), the wave activity flux is calculated from the zonallyasymmetric part of the 200-hPa streamfunction anomalies.Regions with divergent flux vectors denote the export ofwave activity. This diagnostic procedure is able to identifythe Rossby waves generated by a tropical heating source, toidentify the source region and to make evident propagationof stationary wave activity (Vera et al. 2004, and referencetherein).
Finally, the main—after ENSO—large-scale climatevariability modes, i.e., the AAO and IOD are used. TheAAO index is defined as the first principal component ofthe 850-hPa geopotential height anomalies south of 20°S(Thompson and Wallace 2000; http://jisao.washington.edu/data/aao/). Also, the IOD index was calculated as thedifference between the SST anomalies in the tropicalwestern Indian Ocean (50°–70° E, 10° S–10° N) and thetropical southeastern Indian Ocean (90°–110° E, 10° S–0° S),
1960 1965 1970 1975 1980 1985 1990 1995 2000
−2
0
2
4 Nino 4Nino 3Nino 3.4
Fig. 1 Time series of the winter (June–August) SST anomalies(SSTA) in the region Niño 4 (5° S–5° N, 160° E–150° W), Niño 3(5° S–5° N, 150°–90° W), and Niño 3.4 (5° S–5° N, 170°–120° W)in the period 1958–2000. The time series were standardized. Black(open) circles show winter seasons with SSTA equal or higher (lower)than 1 (−1) standard deviation in any of the three Niño's SSTA indices
Non-ENSO interannual rainfall variability 559

following Saji et al. (1999). In both cases, the linear trendwas removed.
3 Results
3.1 Rainfall index
The first EOF mode of the 63 standardized rainfallanomalies in central Chile, using the 24 non-ENSO winterseasons, accounts for 91% of the total variance, while thesecond EOF mode explains 4%. According to the criteria ofNorth et al. (1982), the first and second EOF modes arewell separated from the subsequent modes. Figure 2 showsthe first EOF pattern. Most of the variance of the main EOFmode in concentrated between 33° and 36° S, althoughcorrelations larger than 0.7 between the first principalcomponent and individual standardized rainfall anomaliesspan from 30.5° to 39.5° S. The second EOF pattern (notshown) exhibits a meridional dipole with the largest valuesin the northern part of central Chile (30°–31° S).
Figure 3 depicts the scatter diagram of the first andsecond principal components (PC1 and PC2, respectively).Vertical segmented lines show the lower and upper tercilelimits based on the cumulative probability distribution ofthe PC1. Thus, eight wet (1961, 1963, 1966, 1977, 1978,
1984, 1995, and 2000) and eight dry (1962, 1967, 1968,1976, 1981, 1985, 1990, and 1996) conditions are definedas the upper and lower terciles. The most clear meridionaldipole for wet conditions occurs during 1984 and 1995, butwith opposite PC2 sign. While in the winter of 1984, thewet (dry to normal) conditions were confined to the north(south) of 36° S; in 1995, the wet (dry to normal)conditions were observed to the south (north) of 35° S(not shown). When this analysis is performed using the 43non-ENSO and ENSO seasons, both the EOF patterns andthe PCs are very close to those described previously.
A straightforward analysis of the rainfall anomalies incentral Chile during non-ENSO conditions is the directcomparison with the large-scale climate modes: AAO andIOD. This comparison is shown in Fig. 4 as scatterdiagrams of PC1 and both climate modes during the 24non-ENSO winters. The correlations between PC1 andAAO, and IOD are near zero (−0.21 and 0.12, respectively).There exists a slight tendency to have dry (wet) conditionsduring the negative (positive) phase of IOD. The sameoccurs with AAO. Five of eight dry (wet) winters appearduring the positive (negative) phase of AAO. These resultssuggest a rather complicated non-linear functional relation-ship, in which AAO and IOD would play, at most, asecondary role.
3.2 Circulation anomalies for individual wetand dry winters
In principle, a single process responsible for wet and drywinters during non-ENSO conditions is not expected.
Fig. 2 First EOF pattern ofrainfall in central Chile(30º–42ºS), using 63standardized rainfall anomaliesduring 24 non-ENSO winters(June–August) in the period1958–2000. The EOF is shownas correlation between the firstprincipal component andthe individual time series.Correlations are shaded every0.1 for magnitudes of at least0.5. Solid (segmented) linesindicate positive (negative)correlations
−4 −3 −2 −1 0 1 2 3 4
−2
−1
0
1
2
58
59
60
616263
66
67
68
69
76
7778
79
80
81
84
85
86
8990
95
96
00
PC1 PP
PC
2 P
P
central Chile JJA
Fig. 3 Scatter diagram between the first and second principalcomponents (PC1 and PC2) of rainfall in central Chile (30°–42° S),using 63 standardized rainfall anomalies during 24 non-ENSO winters(June–August) in the period 1958–2000. Vertical segmented linesindicate the upper and lower limit of terciles, defining wet and drywinter seasons in central Chile during non-ENSO conditions
560 A. Montecinos et al.

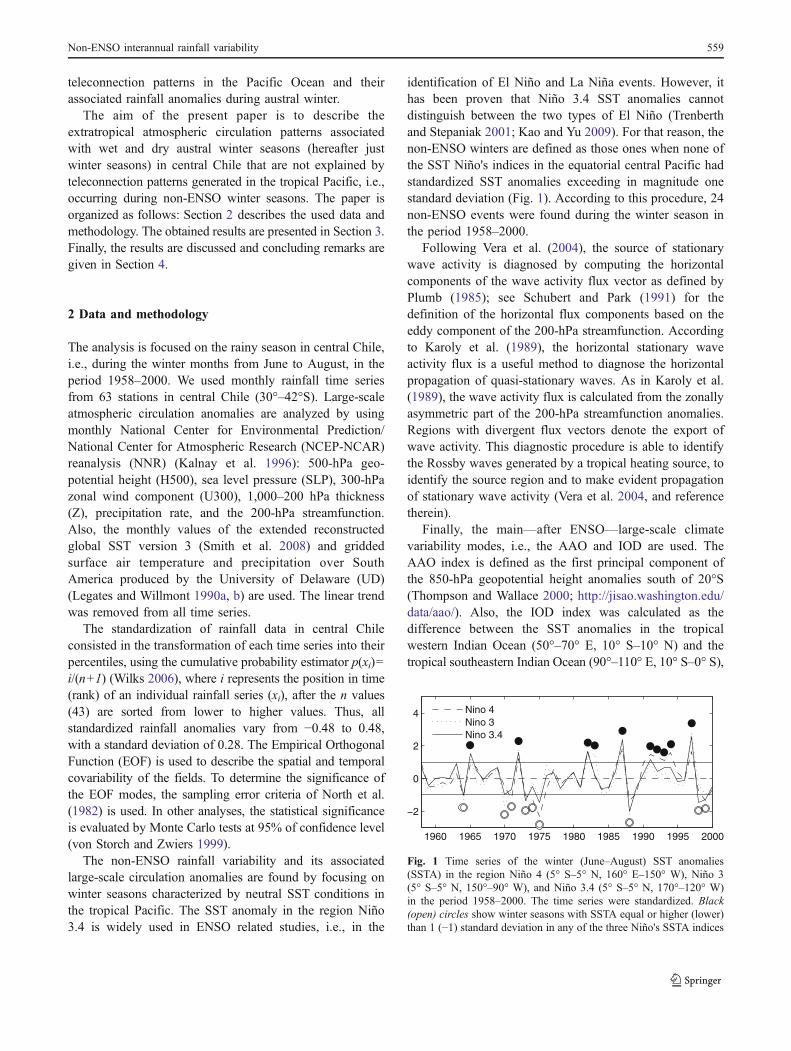
Figures 5 and 6 show the standardized H500 and U300anomalies during each of the eight wet and eight dry winterseasons, respectively. Both U300 and H500 are commonlyused in climate variability studies.
In Fig. 5, positive standardized U300 anomalies arelocated over central Chile during most of wet winterseasons, with a tendency of founding negative U300 tothe south during 1963, 1977, 1984, and 1995. This patternis not clear in year 2000, during which positive U300appear in northern Chile, and is completely reversed in1978, when negative U300 are located over central Chile.
For wet conditions in central Chile, the standardizedH500 anomalies show a variety of patterns (Fig. 5) that arenot simple to classify. Positive U300 over central Chile arepart of a negative H500 pattern (cyclonic circulationanomaly) centered to the south (1977, 1984, and 1995). In1963, negative H500 anomalies are located in the easternSouth Pacific with a northwest–southeast orientation. Thesecyclonic anomalies at 500 hPa have their manifestation atthe surface. In fact, standardized SLP anomalies alsopresent negative values during these wet winters (notshown). In 1966, a negative H500 pattern is found overcentral Chile, but it seems to be too weak to have a clearcyclonic circulation anomaly. In this case, negative SLPanomalies are also located over central Chile.
In the wet winter of 1977, there is a cyclonic anomalypattern over the tip of South America (Fig. 5). Unlike 1995,with the strongest cyclone in the same region, in 1977 theanticyclonic counterpart in the Southern Ocean is locatedover the Weddell Sea. It is remarkable that the positiveH500 pattern, centered at about 35°S–100°W, is alsopresent at the surface as strong positive SLP anomalies(not shown). In the polar flank of this anticyclone, positiveU300 appear off central Chile. This pattern, which ischaracterized by positive–negative–positive H500 and SLP
anomalies oriented from the eastern South Pacific to theWeddell Sea is very similar to that observed in 2000. In1978, the anticyclone is also present along 35° S in theeastern South Pacific, but with negative SLP anomalies(not shown).
During the dry winter seasons (Fig. 6), negative U300anomalies appear over central Chile with positive standard-ized anomalies located to the south during 1962, 1968,1981, 1985, 1990, and 1996. In all these winter seasons, thedescribed upper circulation pattern is accompanied bypositive H500 values, defining a well-structured anticy-clonic anomaly with positive standardized SLP anomaliesat the surface (not shown). The described pattern is notobserved in 1976, being the opposite during 1967, i.e., withpositive U300 and negative H500 anomalies when dryconditions are present in central Chile.
In general, the anticyclonic anomaly is located at about45°–50° S over Patagonia, although in 1968, it is clearlyshifted to the southwestern South Atlantic, while in 1981 itis located off southern Chile (Fig. 6). In 1990, theanticyclonic anomaly is located at about 35° S off centralChile that resembles the pattern for the wet austral winterseasons of 1977, 1978, and 2000 (Fig. 5). Unlike these wetseason-related patterns, the anticyclonic anomaly in 1990 islocated close to the continent with its center at about 80° W,driving negative U300 anomalies over central Chile.
Similar to 1976, in 1967, there is no correspondencebetween the upper and surface circulation anomalies overcentral Chile. While the upper circulation shows negativeH500 anomalies (Fig. 6), the SLP pattern exhibits positiveanomalies (not shown). It is worth noting that an SPSAindex, computed as the spatial average of SLP in the region35°–20° S and 110°–80° W, shows its largest positiveanomaly during 1967 compared with all non-ENSO australwinter seasons (not shown).
−1.5 −1 −0.5 0 0.5 1 1.5−4
−3
−2
−1
0
1
2
3
4
−4
−3
−2
−1
0
1
2
3
4
5859
60
61
62
6366
67
68
69
76
77
78
79
80
81
84
85
86
89
90
95
96
00
AAO
PC
1 P
P
Antarctic Oscillation
−1 −0.5 0 0.5 1
5859
60
61
62
6366
67
68
69
76
77
78
79
80
81
84
85
86
89
90
95
96
00
IOD
Indian Ocean DipoleFig. 4 Scatter diagram betweenthe first principal component(PC1) of the standardizedrainfall in winter characterizedby neutral SST conditions inthe tropical Pacific, and the aAntarctic Oscillation (AAO)index and the b Indian OceanDipole (IOD) index (see textfor details). Horizontalsegmented lines indicate theupper and lower limit ofterciles, defining wet and drywinter seasons in central Chileduring non-ENSO conditions
Non-ENSO interannual rainfall variability 561
3.3 Regional circulation pattern
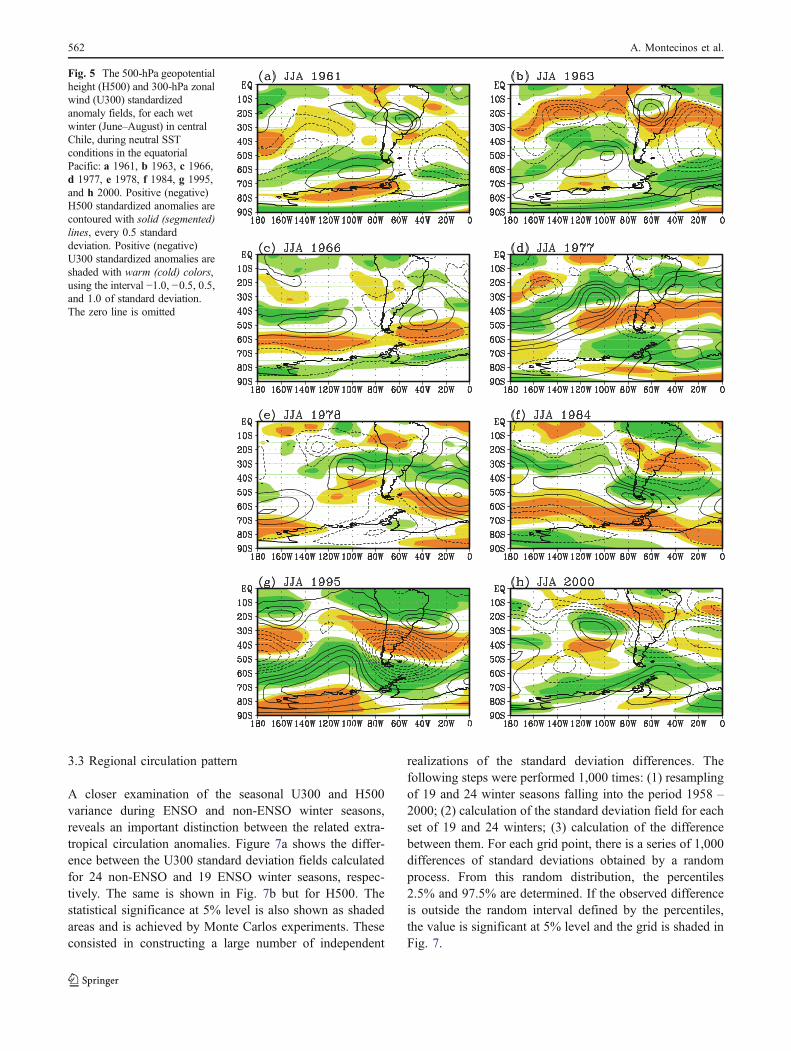
A closer examination of the seasonal U300 and H500variance during ENSO and non-ENSO winter seasons,reveals an important distinction between the related extra-tropical circulation anomalies. Figure 7a shows the differ-ence between the U300 standard deviation fields calculatedfor 24 non-ENSO and 19 ENSO winter seasons, respec-tively. The same is shown in Fig. 7b but for H500. Thestatistical significance at 5% level is also shown as shadedareas and is achieved by Monte Carlos experiments. Theseconsisted in constructing a large number of independent
realizations of the standard deviation differences. Thefollowing steps were performed 1,000 times: (1) resamplingof 19 and 24 winter seasons falling into the period 1958 –2000; (2) calculation of the standard deviation field for eachset of 19 and 24 winters; (3) calculation of the differencebetween them. For each grid point, there is a series of 1,000differences of standard deviations obtained by a randomprocess. From this random distribution, the percentiles2.5% and 97.5% are determined. If the observed differenceis outside the random interval defined by the percentiles,the value is significant at 5% level and the grid is shaded inFig. 7.
Fig. 5 The 500-hPa geopotentialheight (H500) and 300-hPa zonalwind (U300) standardizedanomaly fields, for each wetwinter (June–August) in centralChile, during neutral SSTconditions in the equatorialPacific: a 1961, b 1963, c 1966,d 1977, e 1978, f 1984, g 1995,and h 2000. Positive (negative)H500 standardized anomalies arecontoured with solid (segmented)lines, every 0.5 standarddeviation. Positive (negative)U300 standardized anomalies areshaded with warm (cold) colors,using the interval −1.0, −0.5, 0.5,and 1.0 of standard deviation.The zero line is omitted
562 A. Montecinos et al.
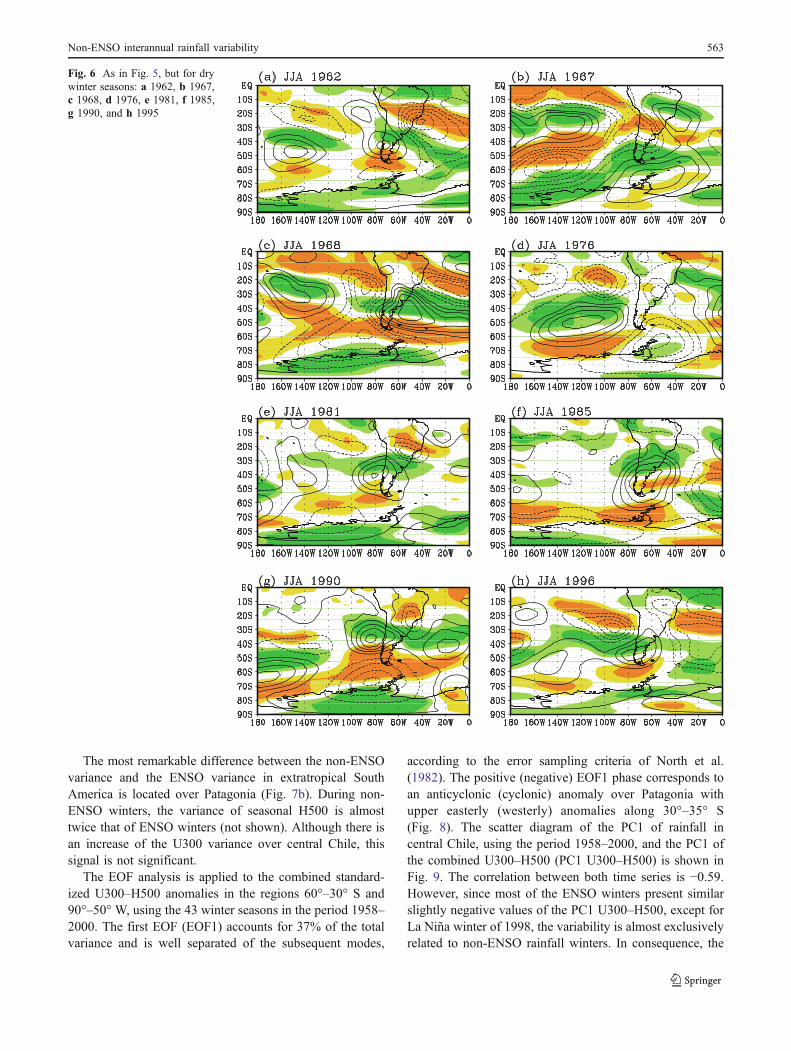
The most remarkable difference between the non-ENSOvariance and the ENSO variance in extratropical SouthAmerica is located over Patagonia (Fig. 7b). During non-ENSO winters, the variance of seasonal H500 is almosttwice that of ENSO winters (not shown). Although there isan increase of the U300 variance over central Chile, thissignal is not significant.
The EOF analysis is applied to the combined standard-ized U300–H500 anomalies in the regions 60°–30° S and90°–50° W, using the 43 winter seasons in the period 1958–2000. The first EOF (EOF1) accounts for 37% of the totalvariance and is well separated of the subsequent modes,
according to the error sampling criteria of North et al.(1982). The positive (negative) EOF1 phase corresponds toan anticyclonic (cyclonic) anomaly over Patagonia withupper easterly (westerly) anomalies along 30°–35° S(Fig. 8). The scatter diagram of the PC1 of rainfall incentral Chile, using the period 1958–2000, and the PC1 ofthe combined U300–H500 (PC1 U300–H500) is shown inFig. 9. The correlation between both time series is −0.59.However, since most of the ENSO winters present similarslightly negative values of the PC1 U300–H500, except forLa Niña winter of 1998, the variability is almost exclusivelyrelated to non-ENSO rainfall winters. In consequence, the
Fig. 6 As in Fig. 5, but for drywinter seasons: a 1962, b 1967,c 1968, d 1976, e 1981, f 1985,g 1990, and h 1995
Non-ENSO interannual rainfall variability 563
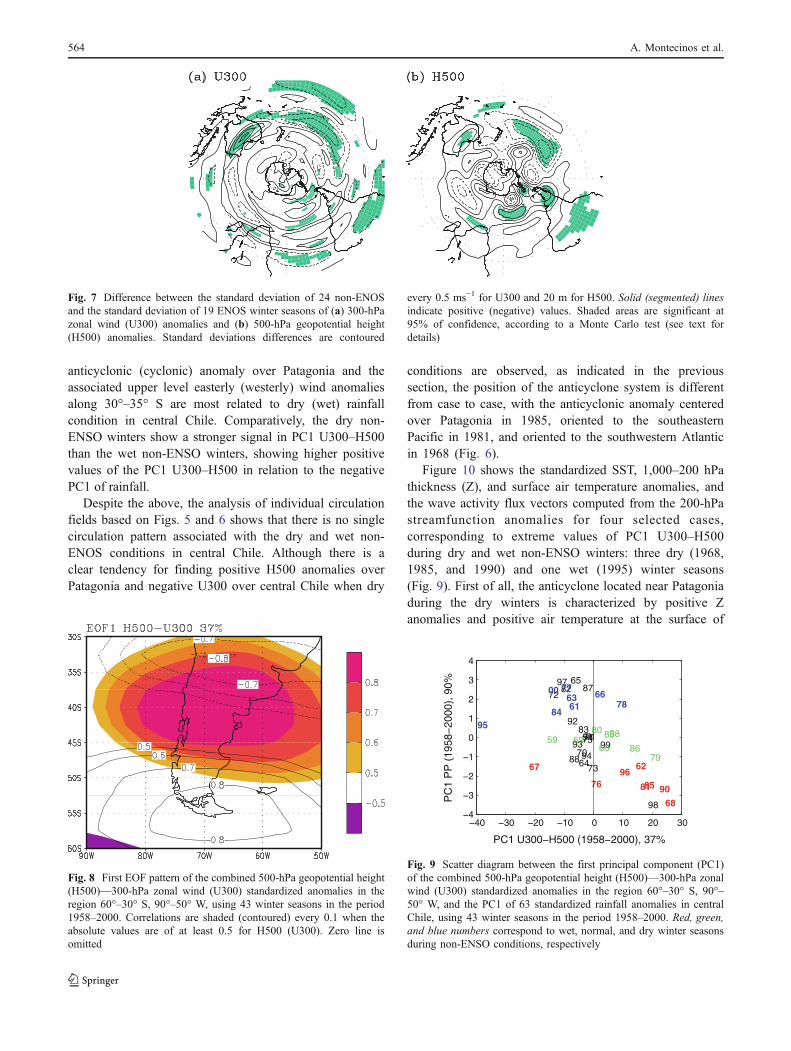
anticyclonic (cyclonic) anomaly over Patagonia and theassociated upper level easterly (westerly) wind anomaliesalong 30°–35° S are most related to dry (wet) rainfallcondition in central Chile. Comparatively, the dry non-ENSO winters show a stronger signal in PC1 U300–H500than the wet non-ENSO winters, showing higher positivevalues of the PC1 U300–H500 in relation to the negativePC1 of rainfall.
Despite the above, the analysis of individual circulationfields based on Figs. 5 and 6 shows that there is no singlecirculation pattern associated with the dry and wet non-ENOS conditions in central Chile. Although there is aclear tendency for finding positive H500 anomalies overPatagonia and negative U300 over central Chile when dry
conditions are observed, as indicated in the previoussection, the position of the anticyclone system is differentfrom case to case, with the anticyclonic anomaly centeredover Patagonia in 1985, oriented to the southeasternPacific in 1981, and oriented to the southwestern Atlanticin 1968 (Fig. 6).
Figure 10 shows the standardized SST, 1,000–200 hPathickness (Z), and surface air temperature anomalies, andthe wave activity flux vectors computed from the 200-hPastreamfunction anomalies for four selected cases,corresponding to extreme values of PC1 U300–H500during dry and wet non-ENSO winters: three dry (1968,1985, and 1990) and one wet (1995) winter seasons(Fig. 9). First of all, the anticyclone located near Patagoniaduring the dry winters is characterized by positive Zanomalies and positive air temperature at the surface of
Fig. 8 First EOF pattern of the combined 500-hPa geopotential height(H500)—300-hPa zonal wind (U300) standardized anomalies in theregion 60°–30° S, 90°–50° W, using 43 winter seasons in the period1958–2000. Correlations are shaded (contoured) every 0.1 when theabsolute values are of at least 0.5 for H500 (U300). Zero line isomitted
Fig. 7 Difference between the standard deviation of 24 non-ENOSand the standard deviation of 19 ENOS winter seasons of (a) 300-hPazonal wind (U300) anomalies and (b) 500-hPa geopotential height(H500) anomalies. Standard deviations differences are contoured
every 0.5 ms−1 for U300 and 20 m for H500. Solid (segmented) linesindicate positive (negative) values. Shaded areas are significant at95% of confidence, according to a Monte Carlo test (see text fordetails)
−40 −30 −20 −10 0 10 20 30−4
−3
−2
−1
0
1
2
3
4
64
65
70
71
72
73
7475
82
83
87
88
91
92
9394
97
98
9958
5960
69
79
80
86
89
6163 66
77
7884
95
00
6267
68
76 8185 90
96
PC1 U300−H500 (1958−2000), 37%
PC
1 P
P (
1958
−20
00),
90%
Fig. 9 Scatter diagram between the first principal component (PC1)of the combined 500-hPa geopotential height (H500)—300-hPa zonalwind (U300) standardized anomalies in the region 60°–30° S, 90°–50° W, and the PC1 of 63 standardized rainfall anomalies in centralChile, using 43 winter seasons in the period 1958–2000. Red, green,and blue numbers correspond to wet, normal, and dry winter seasonsduring non-ENSO conditions, respectively
564 A. Montecinos et al.

the extratropical South America. The opposite is alsoevident for the wet winter of 1995. The thermal structureof the circulation system over Patagonia is a commonfeature for almost all wet and dry winter seasons (notshown). The horizontal wave activity fluxes suggest avariety of sources of the stationary waves over the SouthPacific and Southern Ocean. A clear wave train is seenduring 1995, starting from the Southern Ocean, south ofAustralia, into South America. In the winter of 1990, theanticyclone located off central Chile seems to be part of ananticyclone–cyclone pair originated along 30° S at about120° W. Similarly, in 1985, the source seems to be located
off central Chile in the subtropics at about 90° W. Finally,in the dry winter of 1968, the anticyclone located overPatagonia but centered in the southwestern Atlantic Oceanseems to be a part of two wave trains, one originated along50° S at about 150° E and the other moving from thesubtropics at about 120° W.
4 Discussion and concluding remarks
The first principal component (PC1) of rainfall anomalies incentral Chile during winter (June–August) is used to
Fig. 10 Horizontal wave activityfluxes (vectors), standardizedSST (shading), and 1,000–200 hPa thickness (Z) (contour)anomalies [left panels], and thestandardized air surfacetemperature anomalies (shading)[right panels], during the drywinters of a 1968, b 1985, andc 1990, and during the wetwinter of d 1995. The Zanomalies are contoured every0.5 standard deviation, withsolid (segmented) lines indicatingpositive (negative) values.Positive (negative) standardizedSST and surface air temperatureanomalies are shaded withwarm (cold) colors, using theinterval −1.0, −0.5, 0.5, and 1.0of standard deviation
Non-ENSO interannual rainfall variability 565

analyze the circulation anomalies related to wet and dryconditions, when near-normal or neutral SST anomalies areobserved in the equatorial Pacific, i.e., during non-ENSOconditions. Eight wet and eight dry winter seasons weredefined as the upper and lower terciles of PC1 for 24 non-ENSO winters in the period 1958–2000.
The individual circulation anomalies during wet and drywinter seasons (Figs. 5 and 6), as well as the EOF analysisof the combined H500-U300 standardized anomalies(Figs. 8 and 9), show that most wet and dry winter seasonsare related to upper westerly and easterly wind anomaliesover central Chile, respectively. Garreaud (2007) found asignificant and positive correlation between rainfall andU300 based on monthly anomalies, particularly overmidlatitudes in the South Pacific and along the westernside of the Andes. He argued that orographic effectssuperimposed to the frontal activity increased the correla-tion locally. When seasonal and annual means were usedfor the correlation analysis, Garreaud (2007) found similarpatterns, but a weakening in the relationship. Here, the localcorrelation between PC1 and U300 is in average at about0.52, which is significant albeit rather small. However,seven (six) out of eight wet (dry) non-ENSO winter seasonsoccur in the presence of upper level westerlies (easterlies)over central Chile.
The larger variance in seasonal H500 during non-ENSOwinters indicates a stronger variability over Patagonia,indicating that the mechanism involving cyclonic andanticyclonic anomalies is not as active during ENSOwinters. To this respect, the EOF1 of the combinedU300–H500 standardized anomalies and its associationwith the PC1 of the rainfall anomalies in the period1958–2000, suggest that there is a statistically significantlinear relationship between them. However, the scatterdiagram in Fig. 9 suggests that dry winter seasons areclosely related to anticyclonic conditions over Patagoniawith the subsequent zonal flow blocking over central Chile.The analysis of individual circulation anomalies shows thatthe anticyclone systems can be centered over Patagonia orcan be elongated eastward into the Atlantic Ocean or to thewest in the South Pacific, but the upper level easterlies overcentral Chile are similar.
Berbery and Núñez (1989) studied a blocking episodeoccurred in the period June 2–9, 1985. During this period,precipitation was not registered in stations located between30° S and 38° S in central Chile, and 1985 is one of the drywinter seasons during non-ENSO conditions selected in thiswork. Based on numerical simulations performed with ahemispheric shallow-water model, Berbery and Núñez(1989) supported the mechanisms proposed by Charneyand DeVore (1979) and Kalnay-Rivas and Merkine (1981),in which the persistence and stationary position of the
blocking anticyclone can occur as a result of resonanceenhancement of Rossby lee waves. The idea is that a sourceof transient Rossby waves upstream of the large-scaleorography interact with the forced stationary Rossby wavesexcited by orography, by generating an anticyclone–cyclone pair-oriented southwest–northeast. According toKalnay-Rivas and Merkine (1981), this pattern resemblesan omega-type blocking pattern (see their Fig. 4.11), wherethe blocking system is located southeast of the mountain.To simulate the blocking system located over Patagonia inJune 1985 (see Fig. 1 in Berbery and Núñez 1989), theupstream transient source of Rossby waves was located at35° S–135° W. The transient source of Rossby waves in theeastern Pacific Ocean at midlatitudes can be related to SSTanomalies and enhanced baroclinicity with regular cyclo-genesis (Kalnay-Rivas and Merkine 1981; Berbery andNúñez 1989; Schubert and Park 1991). In order to obtain amore comprehensive picture on the origin of the systemsforcing interannual rainfall variability in central Chile,numerical experiments are needed.
As a reference, the number of days with precipitation inConcepción (∼37° S) in central Chile during the wintermonths (June to August) is 45. This climatological numberdecreases (increases) to the north (south) in central Chile. Inaverage, there are 52 days with rainfall during the eight wetwinter seasons in comparison to 38 days during the eightdry winter seasons. The difference between wet and dryconditions during the rainy seasons is at about 2 weeks.Thus, the occurrence of two or three blocking episodes canproduce a quite large difference in the rainfall regime incentral Chile.
To conclude, most of wet (dry) winter seasons duringnon-ENSO conditions are related to upper westerly (easterly)wind anomalies over central Chile. In most cases where apositive relation between U300 and rainfall anomalies exists,positive (negative) H500 anomalies over Patagonia arecharacterized by warm (cold) conditions from surface to theentire troposphere. For dry winter seasons, it is argued that theresonance between transient Rossby waves generated in theeastern South Pacific at midlatitudes, and stationary Rossbywaves generated by Andes produces a blocking systemlocated in southern South America. Unlike the single processattributed to ENSO, during non-ENSO winter seasons, thereare several sources in the South Pacific and Southern Oceantriggering or modifying the propagation of the stationarywaves that impact the rainfall regime in central Chile.Unfortunately, the multiple processes that seem to be involvedin the modulation of the interannual rainfall variability incentral Chile, as seen in this work, limit the predictability ofrainfall during non-ENSO conditions. Considering theseresults, it is not surprising that the relationship between thePC1 and two leading climate modes related to interannual
566 A. Montecinos et al.

rainfall variability in several places in the Southern Hemi-sphere, i.e., the AAO and IOD, is not significant.
Acknowledgments We wish to thank H. Graβl and an anonymousreviewer for their helpful comments on the original manuscript. Thiswork was supported by Comisión Nacional de Investigación Científicay Tecnológica (CONICYT)-Chile through grant Fondecyt 1080058.NCEP–NCAR reanalysis data were provided by the Climate DiagnosticCenter (NOAA). Rainfall data was supplied by the National WeatherService (DMC) and the Bureau of Water Management (DGA-MOP).Most figures were produced with the Grid Analysis and Display System(GrADS).
References
Aceituno P (1988) On the functioning of the Southern Oscillation inthe South American sector. Part 1: surface climate. Mon WeatherRev 116:505–524
Ashok K, Guan Z, Yamagata T (2003) Influence of the Indian OceanDipole on the Australian winter rainfall. Geophys Res Lett30:1821. doi:10.1029/2003GL017926
Ashok K, Behera SK, Rao SA, Weng H, Yamagata T (2007) El NiñoModoki and its possible teleconnection. J Geophys Res 112:C11007. doi:10.1029/2006JC003798
Berbery EH, Núñez MN (1989) An observational and numericalstudy of blocking episodes near South America. J Clim 2:1352–1361
Chan SC, Behera SK, Yamagata T (2008) Indian ocean dipoleinfluence on South American rainfall. Geophys Res Lett 35:L14S12, 10.1029/2008GL034204
Charney JG, DeVore JG (1979) Multiple flow equilibria in theatmosphere and blocking. J Atmos Sci 36:1205–1216
Conway D, Hanson CE, Doherty R, Persechino A (2007) GCMsimulations of the Indian Ocean dipole influence on East Africanrainfall: present and future. Geophys Res Lett 34:L03705.doi:10.1029/2006GL027597
Garreaud RD (2007) Precipitation and circulation covariability in theextratropics. J Clim 20:4789–4797
Garreaud RD, Vuille M, Compagnucci R, Marengo J (2008) Present-daySouth American climate. Palaeogeography, Palaeoclimatology,Palaeoecology 281:180–195. doi:10.1016/j.paleo.2007.10.032
Gillett NP, Kell TD, Jones PD (2006) Regional climate impacts of theSouthern Annular Mode. Geophys Res Lett 33:L23704.doi:10.1029/2006GL027721
Hendon HH, Thompson DWJ, Wheeler MC (2007) Australian rainfalland surface temperature variations associated with the SouthernHemisphere Annular Mode. J Clim 20:2452–2467
Kalnay-Rivas E, Merkine LO (1981) A simple mechanism forlocking. J Atmos Sci 38:2077–2091
Kalnay E et al (1996) The NCEP/NCAR 40-year reanalysis project.Bull Am Meteorol Soc 77:437–471
Kao H-Y, Yu J-Y (2009) Contrasting Eastern-Pacific and Central-Pacific types of ENSO. J Clim 22:615–632
Karoly DJ, Plumb RA, Ting M (1989) Examples of the horizontalpropagation of quasi-stationary waves. J Atmos Sci 46:2802–2811
Kidson JW (1999) Principal modes of Southern Hemisphere lowfrequency variability obtained from NCEP–NCAR reanalysis. JClim 12:2808–2830
Larkin NK, Harrison DE (2005) On the definition of El Niño andassociated seasonal average U.S. weather anomalies. GeophysRes Lett 32:L16705. doi:10.1029/2005GL022860
Legates DR, Willmont C (1990a) Mean seasonal and spatialvariability in gauge-corrected, global precipitation. Int J Climatol10:111–127
Legates DR, Willmont C (1990b) Mean seasonal and spatialvariability in global surface air temperature. Theor Appl Climatol41:11–21
Manatsa D, Chingombe W, Matarira CH (2008) The impact of thepositive Indian Ocean dipole on Zimbabwe droughts. Int JClimatol 28:2011–2029
Meneghini B, Simmonds I, Smith IN (2007) Association betweenAustralian rainfall and the southern annular mode. Int J Climatol27:109–121. doi:10.1002/joc.1370
Mo KC (2000) Relationships between low-frequency variability in theSouthern Hemisphere and sea surface temperature anomalies. JClim 13:3599–3620
Montecinos A, Díaz A, Aceituno P (2000) Seasonal diagnostic andpredictability of rainfall in subtropical South America based ontropical Pacific SST. J Clim 13:746–758
Montecinos A, Aceituno P (2003) Seasonality of the ENSO-relatedrainfall variability in central Chile and associated circulationanomalies. J Clim 16:281–296
North GR, Bell TL, Cahalan RF, Moeng FJ (1982) Sampling errors inthe estimation of empirical orthogonal functions. Mon WeatherRev 110:699–706
Pittock AB (1980) Patterns of climatic variation in Argentina andChile. Part I: precipitation, 1931–1960. Mon Weather Rev108:1347–1361
Plumb RA (1985) On the three-dimensional propagation of stationarywaves. J Atmos Sci 42:217–229
Quintana J (2004) Factors involved in the interdecadal precipitationvariability in Chile (in Spanish). M.S. thesis, Department ofGeophysics, Universidad de Chile, 88 pp
Reason CJC, Rouault M (2005) Links between the AntarcticOscillation and winter rainfall over western South Africa.Geophys Res Lett 32:L07705. doi:10.1029/2005GL022419
Reason CJC, Rouault M, Melice J-L, Jagadheesha D (2002)Interannual winter rainfall variability in SW South Africa andlarge scale ocean–atmosphere interactions. Meteorol Atmos Phys80:19–29
Renwick J, Thompson DWJ (2006) The southern annular mode andNew Zealand climate. Water Atmos 14:24–25
Rutllant J, Fuenzalida H (1991) Synoptic aspects of the central Chilerainfall variability associated with the Southern Oscillation. Int JClimatol 11:63–76
Saji NH, Yamagata T (2003) Possible impacts of Indian Ocean Dipolemode events on global climate. Clim Res 25:151–169
Saji NH, Goswami BN, Vinayachandran PN, Yamagata T (1999) Adipole mode in the tropical Indian Ocean. Nature 401:360–363
Schubert SD, Park C-K (1991) Low-frequency intraseasonal tropical-extratropical interactions. J Atmos Sci 48:629–650
Silvestri GE, Vera CS (2003) Antarctic Oscillation signal onprecipitation anomalies over southeastern South America. GeophysRes Lett 30:2115. doi:10.1029/2003GL018277
Smith TM, Reynolds RW, Peterson TC, Lawrimore J (2008) Improve-ments to NOAA's historical merged land–ocean surface temperatureanalysis (1880–2006). J Clim 21:2283–2296
Terray P, Delecluse P, Labattu S, Terray L (2003) Sea surfacetemperature associations with the late Indian summer monsoon.Clim Dynam 21:593–618
Thompson DWJ, Wallace JM (2000) Annular modes in the extra-tropical circulation. part I: month-to-month variability. J Clim13:1000–1016
Ting M, Hoerling MP, Xu T, Kumar A (1996) Northern Hemisphereteleconnection patterns during extreme phases of the zonal-meancirculation. J Clim 9:2614–2640
Non-ENSO interannual rainfall variability 567

Trenberth KE, Stepaniak DP (2001) Indices of El Niño evolution. JClim 14:1697–1701
Vera C, Silvestri G, Barros V, Carril A (2004) Differences in El Niñoresponse over the Southern Hemisphere. J Clim 17:1741–1753
von Storch H, Zwiers FW (1999) Statistical analysis in climateresearch. Cambridge University Press, p 484
Walker GT, Bliss EW (1932) World weather V. Mem R Meteor Soc4:53–84
Wang H, Ting M (2000) Covariabilities of winter U.S. precipitationand Pacific sea surface temperatures. J Clim 13:3711–3719
Weng H, Ashok K, Behera S, Rao SA, Yamagata T (2007) Impacts ofrecent El Niño Modoki on dry/wet conditions in the Pacific rimduring boreal summer. Clim Dyn 29. doi:10.1007/s00382-008-0394-6
Wilks DS (2006) Statistical methods in the atmospheric sciences, 2ndedn. Elsevier, Amsterdam, p 627
568 A. Montecinos et al.
Copyright © 2022 FDOKUMEN