The ENSO signature in sea-surface temperature in the Gulf of California
17
Journal of MARINE RESEARCH Volume 65, Number 5 The ENSO signature in sea-surface temperature in the Gulf of California by Hugo Herrera-Cervantes 1,2 , Daniel B. Lluch-Cota 1 , Salvador E. Lluch-Cota 1,3 and Guillermo Gutie ´rrez-de-Velasco S 2 ABSTRACT We analyzed 21 years of sea-surface temperature satellite images to explore the spatial signature of the El Nin ˜o-Southern Oscillation signal in the Gulf of California. We used empirical orthogonal function analysis to extract the principal mode of the nonseasonal sea-surface temperature variability and compared it to the spatial signature of the Southern Oscillation Index. The first mode accounted for 80% of nonseasonal variability and its amplitude time series was significantly correlated to the Southern Oscillation Index (r – 0.58, P 0.01). The amplitude of this mode and its statistical relation to the El Nin ˜o is stronger during winter, which suggests that forcing of sea-surface temperature variability occurs through the disruption of the wind-driven upwelling corridor along the eastern coast due to El Nin ˜o-related atmospheric teleconnections. We also examined weekly time series of coastal sea-surface temperature coastal anomalies along the coast of North America, including the interior of the Gulf of California, during the strong 1997–98 El Nin ˜o. We found a poleward propagating signal that reached the mouth of the Gulf of California at the end of spring and continued its poleward propagation along the west coast of the peninsula slightly delayed; it also resulted in warming inside the Gulf of California. This observation may provide an explanation for the variable extension of the El Nin ˜ o signature along the Pacific coast of North America. 1. Introduction The Gulf of California (GC) is a subtropical, semi-closed sea with unrestricted communication with the Pacific Ocean. It is located between mainland Mexico and the 1. Centro de Investigaciones Biolo ´gicas del Noroeste (CIBNOR). P.O. Box 128, La Paz, Baja California Sur, Me ´xico 23000. 2. Unidad La Paz, Centro de Investigacio ´n Cientı ´fica y de Educacio ´n Superior de Ensenada, La Paz, Baja California Sur, Me ´xico 23050. 3. Corresponding author. [email protected] Journal of Marine Research, 65, 589 – 605, 2007 589
Transcript of The ENSO signature in sea-surface temperature in the Gulf of California

Journal ofMARINE RESEARCHVolume 65 Number 5
The ENSO signature in sea-surface temperature in the Gulfof California
by Hugo Herrera-Cervantes12 Daniel B Lluch-Cota1 Salvador E Lluch-Cota13
and Guillermo Gutierrez-de-Velasco S2
ABSTRACTWe analyzed 21 years of sea-surface temperature satellite images to explore the spatial signature of
the El Nino-Southern Oscillation signal in the Gulf of California We used empirical orthogonalfunction analysis to extract the principal mode of the nonseasonal sea-surface temperature variabilityand compared it to the spatial signature of the Southern Oscillation Index The first mode accountedfor 80 of nonseasonal variability and its amplitude time series was significantly correlated to theSouthern Oscillation Index (r ndash058 P 001) The amplitude of this mode and its statisticalrelation to the El Nino is stronger during winter which suggests that forcing of sea-surfacetemperature variability occurs through the disruption of the wind-driven upwelling corridor along theeastern coast due to El Nino-related atmospheric teleconnections We also examined weekly timeseries of coastal sea-surface temperature coastal anomalies along the coast of North Americaincluding the interior of the Gulf of California during the strong 1997ndash98 El Nino We found apoleward propagating signal that reached the mouth of the Gulf of California at the end of spring andcontinued its poleward propagation along the west coast of the peninsula slightly delayed it alsoresulted in warming inside the Gulf of California This observation may provide an explanation forthe variable extension of the El Nino signature along the Pacific coast of North America
1 Introduction
The Gulf of California (GC) is a subtropical semi-closed sea with unrestrictedcommunication with the Pacific Ocean It is located between mainland Mexico and the
1 Centro de Investigaciones Biologicas del Noroeste (CIBNOR) PO Box 128 La Paz Baja California SurMexico 23000
2 Unidad La Paz Centro de Investigacion Cientıfica y de Educacion Superior de Ensenada La Paz BajaCalifornia Sur Mexico 23050
3 Corresponding author slluchcibnormx
Journal of Marine Research 65 589ndash605 2007
589
narrow Baja California peninsula (Fig 1) Its climate results from remote and local heatingand wind stress forcing that interact to produce a complex environment and a strongvariability in its physical and biological processes (Baumgartner and Christensen 1985Ripa 1997 Lluch-Cota et al 2007)
Figure 1 Location and bathymetry of the Gulf of California
590 [65 5Journal of Marine Research
Atmospheric circulation near the sea-surface level is largely monsoonal with windsflowing from the northwest during winter and from the southeast during summer (Douglaset al 1993) This pattern occurs because the mountain chains over both coasts cause windto be funneled along the Gulfrsquos longitudinal axis (Pares-Sierra et al 2003) The GC isdivided in two by the Midriff Islands a shallow northern area that is mostly controlled bylocal climate and tidal dynamics and a deep southern portion mostly influenced by thePacific Ocean (Marinone 1988) High biological productivity results from enrichmentprocesses due to tidal mixing and wind-driven coastal upwelling along the eastern coastduring winter (Lluch-Cota 2000)
Interannual variability in physical and biological processes is also present in the GC(Lluch-Cota et al 2007) Several studies of the basin-wide distribution of physicalvariables have shown warm temperatures high sea levels and low salinity during El Ninoepisodes (Robles and Marinone 1987 Marinone 1988 Lavın et al 2003) However theeffects of El Nino on primary and secondary producers is less clear some authors reportedreductions in phytoplankton (Thunell 1998 Santamarıa-del-Angel and Alvarez-Borrego1994 Kahru et al 2004) whereas others report no significant changes in phytoplankton orzooplankton populations (Valdez-Holguın 1986 Alvarez-Borrego and Lara-Lara 1991)or zooplankton (Jimenez-Perez and Lara-Lara 1988 Lavaniegos-Espejo and Lara-Lara1990)
Two physical mechanisms are thought to contribute the most to the link between the GCand ENSO (Strub and James 2002) (1) increased poleward (or decreased equatorward)winds caused by changes in the midlatitude atmospheric circulation related to ENSOthrough atmospheric dynamics (Emery and Hamilton 1985 Latif and Barnett 1994) and(2) poleward advection along the ocean-continent boundary which form a wave guide forvarious modes of coastal trapped waves (Pares-Sierra and OrsquoBrien 1989 Subbotina et al2001) Regarding the potential propagation of coastal waves along the coast of NorthAmerica Bakun (1996) noted that waves would have to somehow bypass the interruptionin the coastal wave guide caused by the entrance to the GC or travel into and around one ormore of the interior topographic basins and then re-emerge at the tip of the Baja Californiapeninsula to continue poleward
Lluch-Cota et al (2001 2003) and Strub and James (2002) analyzed records ofsea-surface temperature (SST) sea-surface height (SSH) and geostrophic transport inconnection with the propagation of ENSO signals along the coast of North America Theynoted that changes along the coast are caused both by propagation of signals from the south(stronger between the equator and the entrance to the Gulf of California) and by local andbasin-scale winds (stronger between the Pacific Northwest and the Alaska Peninsula)However the spatial resolution of the data prevented them from including variabilityinside the GC in their analyses
Several authors have analyzed GC variability from satellite-derived SST data with highspatial resolution but relatively short temporal coverage For example Soto-Mardones etal (1999) and Lavın et al (2003) examined the seasonal and interannual SST variability
2007] 591Herrera-Cervantes et al ENSO signature in sea-surface temperatures
for different periods (1984ndash1995 and 1984ndash2000 respectively) They found that changesrelated to both cold and warm ENSO episodes were evident in the central region south ofthe Midriff Islands but not in the northern GC Lavın et al (2003) also compared a spatiallyaveraged anomaly series of the GC to the Southern Oscillation Index (SOI) and found asignificant relationship during the strongest ENSO events
In this work we extend the analysis of Lavın et al (2003) using a longer satellite-derived SST dataset First we use empirical orthogonal function (EOF) analysis to extractthe principal mode of the nonseasonal SST variability (EOF1) and compare the time seriesto the SOI Then we compared the spatial pattern of this main mode to that of ENSO usinglinear regression analysis (LRA) Finally we examine weekly time series of coastal SSTanomalies including the inside of the GC to investigate its effects on the propagation of theENSO signal during the strong 1997ndash1998 El Nino
2 Data and methods
The main data used in this analysis are monthly composites of SST satellite images fromJanuary 1984 to December 2004 The area of interest is the Gulf of California and thePacific coast of North America between 10N to 40N (see Fig 1)
For the period 1984ndash2000 we used the data set compiled by Lavın et al (2003) from dataprovided by the Physical Oceanography Distributed Active Archive Center (PODAACwebpage http podaacjplnasagov) To update this dataset we used 225 daily imagesobtained from afternoon passes of the NOAA-12 and NOAA-16 satellites over the area ofinterest between January 2001 and December 2004 These images were provided by theCICESE-BCS Satellite Oceanography Station (httpwwwcicesemxlapazcatalogo2)Only cloud-free images were selected using the criteria provided by Paden et al (1991)After masking land and clouds and rotating the images 18 x 18 km pixel arrays wereaveraged to produce monthly SST composites with the same spatial resolution used byLavın et al (2003)
This process resulted in a matrix of SST(xt) values where x stands for the pixels withineach image and t stands for each month between January 1984 and December 2004 Toremove the seasonal signal we fitted the monthly time series of each pixel to the periodicfunction as follows
St A0 A1cosw1t 1 (1)
where A0 is the annual mean A1 w1 and 1 are the amplitude frequency and phase of theannual signal Next we obtained a matrix of temperature anomalies (ie nonseasonalvariability) as
TAx t SSTx t Sx t (2)
This matrix was transformed into one of normalized anomalies NA(xt) by dividing theTA(t) series of each pixel by its standard deviation (ie series were re-scaled to make
592 [65 5Journal of Marine Research
them comparable) We analyzed the resulting NA(xt) matrix using EOF analysis toidentify the main modes of SST nonseasonal variability To investigate the potentialconnections of this variability to ENSO we applied the EOF analysis to the complete dataset and also to two subsets one of winter values (December to January) and the other ofsummer anomalies (June to August) For a comprehensive description of EOF analysis seePeixoto and Oort (1992) and Wilks (1995)
The spatial signature of the ENSO in the GC was revealed using LRA We computed thesimple linear regression between each NA(t) series and the SOI We applied this procedureto the two subsets SOI series was obtained from the Climate Prediction Center of theNational Center of Environmental Prediction at the National Oceanic and AtmosphericAdministration (CPC-NCEP-NOAA) website (httpwwwcpcncepnoaagov) In the SOIseries warm El Nino (cold La Nina) episodes corresponded to negative (positive) SOIvalues thus we normalized and reversed the sign of the SOI values prior to the LRA tomake a direct comparison with local temperature changes For comparison we used theldquoTropical Pacific Cold and Warm Episodes by Seasonrdquo list compiled by the CPC-NCEP(available at httpwwwcpcncepnoaagov productsanalysis_monitoringensostuffensoyearsshtml) to identify ENSO episodes during the analyzed period
Finally we examined SST time-series data since January to December of 1997 within 50km of the coast of North America (10N to 40N) including the east and west coasts of theGC For this analysis we used SST weekly 18 x 18 km pixel arrays composites filtering outthe seasonal cycle subtracting the SST weekly climatology provided by the NOAANASAAVHRR Oceans Pathfinder sea-surface temperature data (PODAAC webpage httppodaacjplnasagov) After computing weekly anomalies we normalized the series in thesame way that the monthly composites to build time plots of SST anomalies along the coast(Hovmoller diagrams)
3 Results
Figure 2 shows a surface plot (time-averaged SST(xt) values) and a time plot(space-averaged SST (xt)) of the satellite-derived SST observations in the GC As wouldbe expected SST followed a latitudinal gradient that is particularly evident at the southerndeep basin Relatively cool conditions exist around the Midriff Islands and in the shallownorthern area due to strong tidal mixing This produces a persistent pool of cold water inthe Midriff Island region spreading through advection and horizontal mixing and resultingin a general cooling of the northern gulf that creates large temperature gradients (Paden etal 1991) SST time variability was dominated by a strong seasonal cycle although largeinterannual changes were still evident during ENSO events (Fig 2 lower)
Figure 3 shows the eigenvalues of the first five EOFs from the NA(xt) matrix (ie afterremoving the seasonal signal) SST interannual variability in the GC clearly conformed to asingle dominant mode EOF1 accounted for 80 of the variance and no other mode couldbe resolved because sampling errors were large enough to prevent neighboring eigenvaluesfrom being statistically different (North et al 1982)
2007] 593Herrera-Cervantes et al ENSO signature in sea-surface temperatures
Figure 4 shows the spatial pattern of this single dominant mode as surface plot of theEOF1 loadings (upper panel) and the amplitude time series (time plot of the EOF1 scoreslower panel) Over time the SST interannual variability in the GC was forced byENSO-related events (eg the signals of the 1988ndash89 La Nina 1991ndash1992 and 1997ndash98El Nino) This variability was not spatially homogeneous but tended to be high along theeast coast and south of the Midriff Islands as compared to the coast of the peninsula and thenorthern area The figure also shows the time series of the (negative) SOI index and itsspatial signature as the surface plot of the R values obtained from the linear regression ofeach NA(t) series to the ndashSOI(t) (Fig 4 lower) Although the R values indicate a weak
Figure 2 Surface plot (time averaged) and monthly time series (spatially averaged) of thesatellite-derived SST observations Shaded areas indicate El Nino (red) and La Nina (blue)episodes as reported by the Climate Prediction Center of the National Center of EnvironmentalPrediction at the National Oceanic and Atmospheric Administration (CPC-NCEP-NOAA)
594 [65 5Journal of Marine Research
statistical relationship between the ndashSOI(t) and the individual NA(t) series (R 028 to038) their spatial patterns were close to that of the EOF1 In agreement the EOF1 seriesand the ndashSOI(t) showed similar trends and were well correlated (r 058 P 001)
Figure 5 shows the spatial patterns of the EOF1 for the subset corresponding to winterand summer anomalies Winter EOF1 accounted for 90 of the winter variance andshowed a spatial signature close to those shown in Figure 4 with high values along the eastcoast and south of the Midriff Islands The R values obtained from the linear regression ofthe individual NA(t) winter series to the ndashSOI(t) were significant (R 040 to 057) Forsummer EOF1 accounted for 77 of the variance (a percentage smaller than that forwinter) and showed a different spatial pattern with high values that appear to have stalledaround the Midriff Islands and in some areas near the mouth of the GC In this case the Rvalues obtained from linear regression indicated a weaker statistical relationship of theindividual NA(t) summer series to the ndashSOI(t) (R 004 to 045)
Figure 6 shows the time evolution of El Nino-1997 along the equator (2N) using theTAOTRITON array data from January to December 1997 Left panel represents SSTanomalies and right panel heat content anomalies Moored data show an anomalous earlywarm event identified from early 1997 (March) and intensified from mid-1997 (June)through the end of the year and culminating in a mature phase with maximum SSTanomalies around November-December 1997 Time-longitude contours of these variablesshowed that warm signal propagated eastward across the basin at Kelvin wave-like speedsreported by Chelton et al (1998)
Figure 3 Graph of the first five Empirical Orthogonal Functions (modes) indicating percent ofexplained variance and standard deviation error bars (sampling error)
2007] 595Herrera-Cervantes et al ENSO signature in sea-surface temperatures
Figure 7 shows three Hovmoller diagrams of weekly averaged coastal SST anomaliesfrom January to December 1997 Upper panel covers the coast from 10N to 40N but doesnot includes the GC Although large portions of this diagram are affected by missing datadue to cloudiness a poleward propagation of warming anomalies from February (near10N) to November (35N) is clearly evident It should be noted that the signal reached themouth of the GC at the end of spring (dashed line about 23N) and continued its poleward
Figure 4 Surface plots of the EOF1 of SST anomalies and the correlation coefficients from the linearregression between the SST anomalies and the sign-reversed SOI as the independent variableTime-series data indicate the temporal evolution of the EOF1 and the sign-reversed SOI bothsmoothed by a five-term running mean Shaded areas indicate El Nino (red) and La Nina (blue)episodes as reported by the Climate Prediction Center of the National Center of EnvironmentalPrediction at the National Oceanic and Atmospheric Administration (CPC-NCEP-NOAA)
596 [65 5Journal of Marine Research
propagation along the west coast of the peninsula seemingly bypassing the mouth withoutany significant delay
Middle panel shows the temporal evolution of the SST anomalies along the entirecoastline inside the GC from the mainland coast at the mouth (at the bottom of the graph)to the southern tip of the peninsula (at the top the black line at the middle corresponds tothe northernmost portion of the coast) Slope in the contours suggests that warmingpropagation in the Gulf took approximately 3 weeks (MayndashJune) along both coasts of theGulf (3200 km) Using these scaling arguments the theoretical phase speed of this warmsignal is 150 km day-1 resulting in warm anomalies that stalled south of the MidriffIslands (ie about the middle portion of each coast) and at the mouth of the GC in apattern that is similar to that found for the summer EOF1 (Fig 5)
Finally the lower panel shows the coastal propagation of the warm signal both outsideand inside the GC created by combining the two previously described panels This figure
Figure 5 Spatial patterns of the EOF1 of SST anomalies for (a) winter (December January andFebruary) and (b) summer (June July and August)
2007] 597Herrera-Cervantes et al ENSO signature in sea-surface temperatures
shows that the warming anomalies appeared first at the south and then propagatedpoleward along the coast reaching the mouth of the GC at the end of spring somehowbypassing the Midriff Islands and then reaching the tip of the peninsula and continuedalong the west coast of the peninsula Warming anomalies presented a slight attenuationpoleward north of 25N and finally reinforced by strong anomalies reported since Octoberand November along the coast of California (Dever and Winant 2002 Ryan and Noble2002)
4 Discussion
In this study we analyzed satellite-derived SST data for the GC which allowed us toexamine SST interannual variability with a spatial resolution of 18 x 18 km for a relativelylong period of time that includes several ENSO events In addition we followed the coastalpropagation of the warming anomalies related to the very strong 1997 El Nino with atemporal resolution of one week and the same spatial resolution in monthly composites (18km) To our knowledge this is the first time that the possible effects of ENSO on SSTinside the GC have been examined at this level of detail
EOF analysis of the entire dataset (ie of the total variance) yielded a single dominantmode for the analyzed period (Fig 3) The evidence linking this mode to ENSO variability
Figure 6 Time-longitude sections of weekly SST anomaly and head content anomalies along 2degNfrom January to December 1997 The data are provided by TAOTRITON project officePMELNOAA Dotted contours indicate negative values
598 [65 5Journal of Marine Research
may seem contradictory On one hand we found a strong similarity between this mode andthe spatial signature of ENSO as revealed by the linear regression of the SOI (Fig 4) Onthe other the statistical relationship between the SOI and the SST anomalies accounted33 of the variance of the EOF1 amplitude series Beyond the obvious consideration thatthe SOI refers to a tropical atmospheric phenomenon only indirectly related to extra-tropical variability the GC exhibits complex dynamics resulting not only from oceanic and
Figure 7 Hovmoller diagrams of weekly averaged coastal SST anomalies (values within 50 km ofthe coast) from January to December 1997 covering (a) the coast from 10N to 40N (white areasindicate missing data due to clouds and dotted line 24N) (b) both coasts of the Gulf of California(the black lines indicate the northernmost portion of the Gulf coast) and (c) the two combinedshowing the coastal propagation of the signal both outside and inside the Gulf of California (dottedlines) and along the coast from 10N to 40N Units of the color bar are in degC
2007] 599Herrera-Cervantes et al ENSO signature in sea-surface temperatures
atmospheric forcing but also from dissipative phenomena related to winds stress localtopography bottom friction and tidal forcing (Ripa and Marinone 1989) Any signal ofthe ENSO on SST would be masked by these local processes thus obscuring theirstatistical relationships Therefore we believe that the similarity of the spatial patterns andthe parallel trends between the series shown in Figure 4 indicate an important role of ENSOin forcing interannual variations in the GC
Both spatial patterns the EOF1 and the linear regression of the SOI show that variabilityis higher south of Midriff Islands and along the eastern coast where the continental shelf iswider (see Fig 1) and wind-driven upwelling occurs during winter Our interpretation ofthese patterns is that this similarity is indicative of the disruption of the wind-drivenupwelling process during El Nino events which may result from a weakening of the winds(ie from atmospheric teleconnections) from deepening of the thermocline due to coastalwaves (an oceanic connection) or from both mechanisms The fact that this spatialstructure (EOF1) and its statistical relation to the ENSO index is more evident when onlythe winter anomalies are considered (Fig 5) suggesting that atmospheric teleconnectionsmostly restricted to the winter (Tribbia 1991) are major phenomena behind ENSO forcingof SST interannual variability in the GC
Nevertheless EOF analysis of the summer data subset revealed a spatial structure ofhigh SST variability around of the Midriff Islands and near the mouth of the GC (Fig 5)Although the physical processes that cause this pattern are not clear the fact that a similarpattern emerged from the analysis of the coastal propagation of the 1997 El Nino warminginside the GC (Fig 7 panel b) strongly suggests that this pattern may occur after thepropagation of ENSO-related coastal waves into the GC While the poleward propagationof coastal waves must occur along the east coast of the GC the signal may be transmittedacross the GC to its west coast over a period of three weeks (Beier 1997) by propagation ofcoastal waves smoothed by bottom friction and masked by local dynamic
Figure 7 clearly shows that the strong 1997 El Nino the signal of coastal wavescontinued its poleward propagation along the west coast of the peninsula Although ENSOeffects in the northeast Pacific are most often related to basin-scale atmospheric teleconnec-tions (Emery and Hamilton 1985 Hollowed and Wooster 1992 Wooster and Hollowed1995) some modeling studies have suggested that coastal waves generated during El Ninoevents can propagate poleward along California (Pares-Sierra and OrsquoBrien 1989) andreach latitudes as high as the Gulf of Alaska (Jacobs et al 1994)
To understand the evolution of the warming signals associated with El Nino 1997 asshown in Figure 7 we computed the phase speed of internal Kelvin waves and internalRossby radius of deformation using expressions proposed by Gill (1982 p122 249) andhydrographic data monitored during 1997 in different points of continental shelf between10N and 40N including the GC (Filonov and Tereschenko 2000 Amador-Buenrostro etal2003 Durazo and Baumgartner 2002 Dever and Winant 2002 Ryan and Noble2002) The expression used for phase speed is c1 (g middot H1 middot H2HT)12 where g is thereduced gravity calculated with typical density values in upper and lower layer H1 the
600 [65 5Journal of Marine Research
maximum thickness of upper layer H2 the thickness of lower layer and HT H1 H2mean depth of the continental shelf
For the coastal region between 10N and 21N where the continental shelf is narrowphase speed was estimated at 100 km day-1 and internal Rossby deformation radiusbetween 30 and 35 km (Filonov and Tereschenko 2000) Time for a coastal wave travelingsome 7600 km of coastline from the equator to the mouth of the Gulf of California shouldbe 76 days For inside the Gulf of California we used H1 80 m and HT 730 m themean depth of the Gulf (Beier 1997) Typical values of phase speed for a coastal wavepropagating to the interior the Gulf are 140 km day-1 Internal Rossby deformation radiuscorresponding to this phase speed is between 30 -21 km smaller than the average width ofthe Gulf (150 km) Signals associated with coastal waves travel around the Gulf (some3200 km of coastline) in 23 days and could be affected by friction thus some dampeningwould be expected For the northern coastline between 21N and 40N (5050 km) meanphase speeds were 75 km day-1 and the internal Rossby deformation radius approxi-mately 10 km According to these computations coastal wave take 67 days to arrive at40N
Phase speed calculations as explained above suggest that a coastal signal generated nearthe equator and propagated poleward arrives at 40N in approximately 5 months Figure 6showed that the El Nino signal associated with an equatorial Kelvin wave arrived to theeast boundary in March generating a poleward propagation coastal wave This signalarrived at the mouth of the Gulf in May continuing its propagation along both coasts of theGulf reaching the tip of the peninsula in the middle of June and continued polewardpropagation along the west coast of the peninsula (north of 25N) reaching 35N byJuly-August A second episode of strong anomalies was observed at the end of 1997(October- December) in the California coast
Filonov and Tereschenko (2000) observed an El Nino signal in temperature profilesmeasured over the continental shelf at 19N in May and June Dever and Winant (2002)showed that an El Nino initial signal arrived at Point Conception (34N) concentrated in theupper 25 m by early-July Ryan and Noble (2002) using time-series of daily SSTanomalies near to 37N observed the same evolution of the event and a reinforcementstarting in November with no direct correlation to local winds Dever and Winant (2002)and Strub and James (2002) suggest that this initial anomaly observed clearly in the Gulfwas the northern tail of a coastally trapped Kelvin wave propagating poleward from BajaCalifornia (24N) and farther north during a transient event
Outside the upwelling period during summer-fall atmospheric effects may not result inlarge SST changes in the GC First atmospheric teleconnections are unlikely to occur insummer (Tribbia 1991) and also surface winds in the GC reach their seasonal minimaduring this period (Pares-Sierra et al 2003) thus no major interannual warming would beexpected from atmospheric effects Multivariate ENSO Index shows that El Nino 1997 hada decline in the temperatures anomalies during August-October and intensified again from
2007] 601Herrera-Cervantes et al ENSO signature in sea-surface temperatures
mid-November through the end of the year (httpwwwcdcnoaagovpeopleklauswolterMEI)
The GC has the higher phase speed for a coastal trapped wave This could explain thefact that the signal detected in May at the mouth of the Gulf (Fig 7 central panel) takesabout one month to travel around the Gulf The contour slope in this panel suggests that thesignal takes 21 days (150 km day-1) very close to phase speed calculated above Beier(1997) based on numerical experiments concluded that the Pacific Ocean forces throughincoming baroclinic waves in the mouth of the Gulf in phase with the wind stressmoreover total circulation can be explained by means of an internal wave trapped againstthe wall that propagates around the coast of the Gulf Strub and James (2002) proposed thathigh SSH during El Nino 1997 initially filled the lower Gulf and created a SSH gradients atthe mouth of the Gulf that allowed geostrophic flows past the mouth and northward alongBaja California
Lluch-Cota et al (2001) analyzed the variability of coastal SST along the Pacific coastof North America from 1950 to 1999 as revealed by the multiple linear regression ofmonthly SST anomalies to the Multivariate ENSO Index (MEI Wolter and Timlin 1993)and the Pacific Decadal Oscillation Index (Mantua 2001) Lluch-Cota et al (2001)illustrated that the highest latitude at which the partial regression of the MEI still explains alarge fraction of the SST variability is not the same for every ENSO event For most eventsthis latitude corresponded to the west coast of the Baja California peninsula but for someothers the signal reached the Gulf of Alaska Strub and James (2002) demonstrated ENSOsignal asymmetry is related to the influence of topographic features local winds and localcurrents
Our results clearly show that the GC plays a significant role in the poleward propagationof ENSO-related coastal waves Internal Rossby deformation radius corresponding tophase speed values computed for the GC are narrower than the separation between themainland coast and the southern tip of the Baja California peninsula Coastal waves relatedto El Nino events would enter the GC along its eastern coast and would probably undergo asignificant weakening through friction and dispersion as they travel into and around one ormore of the interior topographic basins On the other hand if the amplitude and duration ofstrong El Nino events (as 1997-1998) result in more than one peak of persistent warm SSTand thermocline depth anomalies coastal trapped wave modes could generate more intensepoleward advection The first episode could enter the GC along both coasts and weakendue to friction and dispersion leaving the Gulf at the southern tip of the peninsula some 3-4weeks later and continue its poleward propagation along the west coast A second episode(2-3 months later) would be more consistent north of 24N and probably reach highlatitudes
This hypothesis is consistent with the observation that the poleward propagation ofcoastal SST anomalies during the 1997 El Nino seemingly bypassed the GC without anynoticeable delay (Fig 7) and may provide an explanation for the results of Lluch-Cota et al
602 [65 5Journal of Marine Research
(2001) and Strub and James (2002) regarding the variable extension of the ENSO signaturealong the Pacific coast of North America
5 Conclusions
ENSO is a major source of SST interannual variability in the GC The spatial signatureof ENSO suggests that its most significant effect is the disruption of the wind-drivenupwelling corridor along the eastern coast of the GC This signal is more evident duringwinter which suggests that ENSO forcing of SST variability occurs through atmosphericteleconnections Nevertheless evidence on the propagation of SST coastal anomalies alsosuggests that ENSO-related coastal waves enter the GC thus the GC could play animportant role in their poleward propagation along the longer and convoluted Pacific coastof North America
Acknowledgments This research was supported by PROJECT SEMARNAT-2002-C01-0278 andCIBNOR EP-3 grants We thank M Lavın (CICESE) for the SST monthly data and A Pares-Sierra(CICESE) and E Beier (CICESE-BCS) for their comments E Gonzalez (CICESE-BCS) provideddaily AVHRR-images HHC is doctoral student at CIBNOR and holds a CONACYT scholarship(94964)
REFERENCESAlvarez-Borrego S and J R Lara-Lara 1991 The physical environment and primary productivity
of the Gulf of California in The Gulf and Peninsular Province of the Californias BRT Simoneitand J P Drophin eds American Association of Petroleum Geologists Memoir 47 555ndash567
Amador-Buenrostro A A Trasvina-Castro A Muhlia-Melo and M A Argote-Espinoza 2003Influence of EBES seamount and Farallon Basin on coastal circulation in the Gulf of CaliforniaMexico Geofısica Internacional 42 407ndash418
Bakun A 1996 Patterns in the ocean in Ocean Processes and Marine Population DynamicsCalifornia Sea Grant Centro de Investigaciones Biologicas del Noroeste La Paz BCS Mexico323 pp
Baumgartner T R and N Christensen 1985 Coupling of the Gulf of California to large-scaleinterannual climatic variability J Mar Res 43 825ndash848
Beier E 1997 A numerical investigation of the annual variability in the Gulf of California J PhysOceanogr 27 615ndash632
Chelton D B R A de Szoeke M G Schlax K El Naggar and N Siwertz 1998 Geographicalvariability of the first-baroclinic Rossby radius of deformation J Phys Oceanogr 28 433ndash460
Dever E P and C D Winant 2002 The evolution and depth structure of shelf and slopetemperatures and velocities during the 1997ndash1998 El Nino near Point Conception CaliforniaProg Oceanogr 54 77ndash103
Douglas M W R A Maddox K Howard and S Reyes 1993 The Mexican monsoon J Climate 61665ndash1677
Durazo R and T R Baumgartner 2002 Evolution of oceanographic condition off Baja California1997ndash1998 Prog Oceanogr 54 7ndash31
Emery W and K Hamilton 1985 Atmospheric forcing of interannual variability in the northeastPacific Ocean Connections with El Nino J Geophys Res 90 857ndash868
Filonov A and I Tereshchenko 2000 El Nino 1997ndash1998 monitoring in mixed layer at the PacificOcean near Mexicorsquos west coast Geophys Res Lett 27 705ndash707
2007] 603Herrera-Cervantes et al ENSO signature in sea-surface temperatures
Gill A E 1982 Atmosphere -Ocean Dynamics Academic Press 662 ppHollowed A B and W S Wooster 1992 Variability of winter ocean conditions and strong year
classes of northeast Pacific groundfish ICES Marine Science Symposium 195 433ndash444Jacobs G A H E Hulburt J C Kindle E J Metzger J L Mitchell W J Teague and A J
Wallcraft 1994 Decade-scale trans-Pacific propagation and warming effect of an El Ninoanomaly Nature 370 360ndash363
Jimenez-Perez L C and J R Lara-Lara 1988 Zooplankton biomass and copepod communitystructure in the Gulf of California during the 1982ndash1983 El Nino event CalCOFI Report 12122ndash128
Kahru M S G Marinone S E Lluch-Cota A Pares-Sierra and B G Mitchell 2004 Ocean-colorvariability in the Gulf of California Scales from days to ENSO Deep-Sea Res II 51 139ndash146
Latif M and T P Barnett 1994 Causes of decadal climate variability over the North Pacific andNorth America Science 266 634ndash637
Lavaniegos-Espejo B and J R Lara-Lara 1990 Zooplankton of the Gulf of California after the1982ndash1983 El Nino event Biomass distribution and abundance Pacific Science 44 297ndash310
Lavın M F E Palacios-Hernandez and C Cabrera 2003 Sea surface temperature anomalies andtrend in the Gulf of California in Effects of El Nino in Mexico Geofısica Internacional-Specialvolume 42 363ndash375
Lluch-Cota D B W S Wooster and S R Hare 2001 Sea surface temperature variability in coastalareas of the northeastern Pacific related to the El Nino-Southern Oscillation and Pacific DecadalOscillation Geophys Res Lett 28 2029ndash2032
Lluch-Cota D B W S Wooster S R Hare D Lluch-Belda and A Pares-Sierra 2003 Principalmodes and related frequencies of sea surface temperatures variability in the Pacific Coast of NorthAmerica J Oceanogr 59 477ndash488
Lluch-Cota S E 2000 Coastal upwelling in the eastern Gulf of California Oceanologica Acta 23731ndash740
Lluch-Cota S E E A Aragon-Noriega F Arreguin-Sanchez D Aurioles-Gamboa J Bautista-Romero R C Brusca R Cervantes-Duarte R Cortez-Altamirano P Del-Monte-Luna AEsquivel-Herrera G Fernandez M E Hendrickx S Hernandez-Vazquez H Herrera-CervantesM Kahru M Lavin D Lluch-Belda D Lluch-Cota J Lopez-Martınez S G Marinone M ONevarez-Martınez S Ortega-Garcıa E Palacios-Castro A Pares-Sierra G Ponce-Dıaz MRamırez-Rodrıguez C A Salinas-Zavala R A Schwartzlose and A P Sierra-Beltran 2007 TheGulf of California Review of ecosystem status and sustainability challenges Prog Oceanogrdoi 101016j pocean 200701013
Mantua N J 2001 The Pacific decadal oscillation in The Encyclopedia of Global EnvironmentalChange Vol 1 The Earth System Physical and Chemical Dimension of Global EnvironmentalChange M C McCracken and J S Perry eds 592ndash594
Marinone S G 1988 A note on non-seasonal variability in the central Gulf of California CienciasMarinas 115 887ndash913
North G R T L Bell R F Calahan and F J Moeng 1982 Sampling errors in the estimation ofempirical orthogonal functions Mon Weath Rev 110 699ndash706
Paden C A C D Winant and M Abbott 1991 Tidal and atmospheric forcing of the upper ocean inthe Gulf of California 1 Sea surface temperatures variability J Geophys Res 96 18337ndash18359
Pares-Sierra A A Mascarenhas S G Marinone and R Castro 2003 Temporal and spatialvariation of the surface winds in the Gulf of California Geophys Res Lett 30 451ndash454
Pares-Sierra A and J J OrsquoBrien 1989 The seasonal and interannual variability of the CaliforniaCurrent System A numerical model J Geophys Res 93 3159ndash3180
Peixoto J P and A H Oort 1992 Physics of Climate American Institute of Physics 520 pp
604 [65 5Journal of Marine Research
Ripa P 1997 Toward a physical explanation of the seasonal dynamics and thermodynamics of theGulf of California J Phys Oceanogr 27 597ndash614
Ripa P and S G Marinone 1989 Seasonal variability of temperature salinity velocity vorticityand sea level in the central Gulf of California as inferred from historical data Q J Roy MeteorSoc 115 887ndash913
Robles J M and S G Marinone 1987 Seasonal and interannual thermohaline variability in theGuaymas Basin of the Gulf of California Cont Res Sci 7 715ndash733
Ryan H F and M Noble 2002 Sea level response to ENSO along the central California coast howthe 1997ndash1998 event compares with the historic record Prog Oceanogr 54 149ndash169
Santamaria-del-Angel E and S Alvarez-Borrego 1994 Gulf of California biogeographic regionsbased on coastal zone color scanner imagery J Geophys Res 99 7411ndash7421
Soto-Mardones L S G Marinote and A Pares-Sierra 1999 Time and spatial variability of seasurface temperature in the Gulf of California Ciencias Marinas 25 1ndash30
Strub P T and C James 2002 Altimeter-derived surface circulation in the large-scale Pacific gyresPart 2 1997ndash1998 El Nino anomalies Prog Oceanogr 53 185ndash214
Subbotina M M R E Thomson and A B Rabinovich 2001 Spectral characteristics of sea levelvariability along the coast of North America during the 1982ndash83 and 1997ndash98 El Nino eventsProg Oceanogr 49 353ndash372
Thunell R 1998 Seasonal and annual variability in particle fluxes in the Gulf of California Aresponse to climate forcing Deep-Sea Res I 45 2059ndash2083
Tribbia J J 1991 The rudimentary theory of atmospheric teleconnections associated with ENSO inTeleconnections linking worldwide climate anomalies Scientific basis and societal impacts M HGlantz R K Waltz and N Nicholls eds Cambridge University Press NY 285ndash307
Valdez-Holguın J E 1986 Distribucion de la biomasa y productividad del fitoplancton en el Golfode California durante el evento de El Nino 1982ndash1983 MS Thesis Cent de Invest Cient y EducSuper de Ensenada Ensenada Baja California Mexico 90 pp
Wilks D S 1995 Statistical methods in the atmospheric sciences An introduction InternationalGeophysics Series 59 Academic Press 464 pp
Wolter K and M S Timlin 1993 Monitoring ENSO in COADS with a seasonally adjustedprincipal component index Proc 17th Climate Dynamics Workshop Norman OK NOAANMCCAC NSSL Oklahoma Clim Survey CIMMS and School of Meteorology Univ Oklahoma52ndash57
Wooster W S and A B Hollowed 1995 Decadal scale variations in the eastern subarctic Pacific IWinter ocean conditions Climate change and northern fish populations R J Beamish edCanadian Special Publication of Fisheries Aquatic Sciences 121 81ndash85
Received 16 February 2007 revised 9 August 2007
2007] 605Herrera-Cervantes et al ENSO signature in sea-surface temperatures
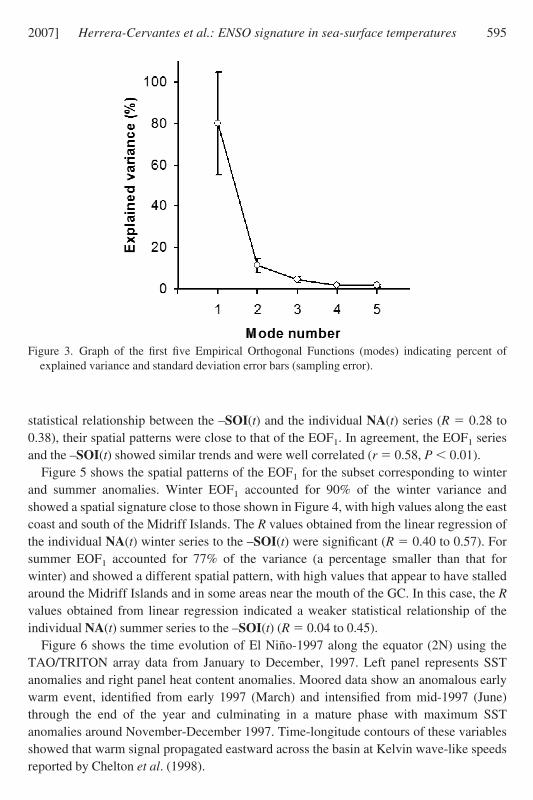
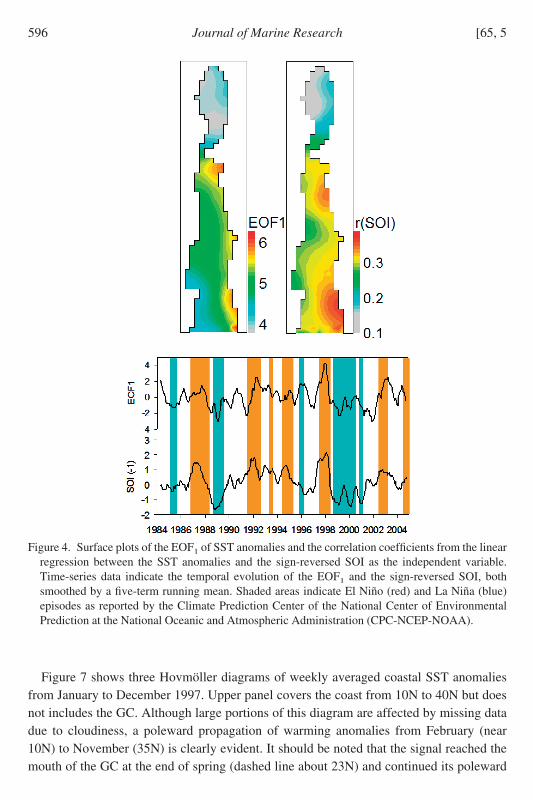
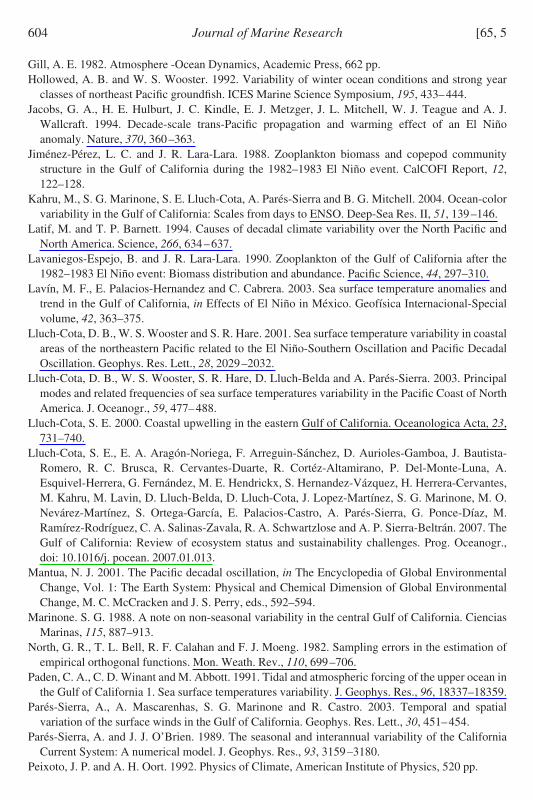