Deadlock-free dynamic reconfiguration over InfiniBand™ NETWORKS
38 May/June2008 PublishedbytheIEEEComputerSociety 0272-1716/08/$25.00©2008IEEE
ProceduralMethodsforUrbanModeling
Interactive Reconfiguration of Urban LayoutsDaniel G. Aliaga, Bedrich Beneš, Carlos A. Vanegas, and Nathan Andrysco ■ Purdue University
The ability to create, extend, and change a model of a large-scale urban environment is useful for a variety of computer graphics
applications. For example, it lets urban planning applications simulate changes to city layouts or newly proposed neighborhoods, create hypotheti-cal views of an urban area after applying develop-ment and growth algorithms, and show architects the results of using common building blocks to design a new city layout. Emergency-response
simulations can train personnel in current and speculative ur-ban layouts, including planning evacuation routes for various catastrophes, and can suggest emergency deployments of com-munication networks, resources, and policing. Finally, reconnais-sance applications can visualize and analyze existing cities for which only partial information is known. The structural char-acteristics of a historically sig-nificant region are important aspects of urban visualization.
Capturing the layout of an ur-ban space in images (for example,
satellite and aerial photographs) loses the layout’s structural information, which can then no longer be exploited. An urban layout consists of a com-plex collection of man-made structures arranged in roads, parcels, city blocks, and neighborhoods. Applications can treat the content as unstructured images and use current image-processing tools to change the images or generate similar imagery synthetically. However, this yields undesirable results, including deformations and structural discontinuities. Or, applications can assume the
structure of the urban space is known, in the form of an explicit or procedural model, and can alter it by directly changing model parameters. However, it’s difficult to know all model parameters, and even more so for large urban spaces. Represent-ing an existing urban layout as a set of procedural rules typically involves significant manual labor. (See the “Related Work in Urban Layout Genera-tion” sidebar, page 40.)
We used the records of parcel boundaries, roads, and other metadata maintained by counties in digital form (such as that used by Google Maps) as a starting point for inferring higher-level struc-ture automatically and for supporting urban lay-out editing. We decompose an urban layout into a collection of adjacent tiles, separated by road or parcel boundaries, to cluster tiles based on their similarity and to support a variety of editing and reconfiguration tools that minimize the tiles’ de-formation and the distortion of the grid of tiles. We support intuitive notions such as stretching an urban layout to occupy a new space, partition-ing and reassembling an urban map, and copying and replacing parts of the map in one area with parts from other areas. All the while, our system maintains a similarly connected street network and reuses the existing tiles of the urban layout with minimal or no deformations.
We’ve applied our system to the editing and reconfiguration of portions of various real-world cities, as Figure 1 shows. We also show various ex-amples of modifications that are difficult to achieve using previous techniques (see the sidebar).
Urban layout editingOur system lets us interactively edit an urban lay-out and visualize the results. Adjacent tiles (for example, parcels of land), interconnected by a
Thelayoutofanurbanspaceisacomplexcollectionofman-madestructuresarrangedinparcels,cityblocks,andneighborhoods.Aneditorforinteractivelyreconfiguringcitylayoutsexploitsgeographicalinformationsystem(GIS)dataandprovidestoolstoexpand,scale,replace,andmoveparcelsandblockswhileefficientlyexploitingtheirconnectivityandzoning.
Authorized licensed use limited to: University of Minnesota. Downloaded on September 6, 2009 at 18:44 from IEEE Xplore. Restrictions apply.

IEEEComputerGraphicsandApplications 39
network of streets, and together creating a collec-tion of neighborhoods, forms a city’s urban layout. Our system supports moving (translate or rotate), copying, cutting, and pasting tiles to edit or cre-ate a new city arrangement. In the context of our system, moving implies selecting one or more tiles and displacing them. The system automatically re-places tiles that must be excessively deformed to accommodate the overall changes with tiles that better fit in the deformed space and represent an equivalent urban structure. Copying, cutting, and pasting is the process of selecting a collection of tiles and placing them in another part of the city. We can copy or remove tiles in the source location while replacing tiles in the destination location with the new ones. After any editing operation, the system attempts to accommodate the position and orientation of nearby tiles to the changes and maintain a consistent layout.
The input to our system is the same as that in mapping applications: an array of high-resolution images, a set of lines identifying street layout, and per-tile information, all available from geographi-cal information systems (GISs). We extract perti-nent features from these data sets using an open source tool such as the Geospatial Data Abstrac-tion Library (GDAL) or the Shapefile C library. A polyline defines each street or parcel boundary. For streets, each polyline segment has an associ-ated street width. For parcel boundaries (that is, logical land boundaries), the polyline has no width
parameter. The collection of intersecting polylines partitions the plane into adjacent polygons or tiles. A tile fully surrounded by street polylines corresponds to a block, and a tile with at least one street edge corresponds to a parcel (thus, by definition, blocks and parcels include no streets). Although not strictly enforced, we assume the use of an egress rule that implies that each tile has direct access to a street segment.
Figure 2a (page 41) shows an example urban lay-out, and Figure 2b contains a diagram of the cor-responding interconnected set of tiles, streets, and boundaries. Each tile is annotated with its zoning classification. Without loss of generality, we clas-sify zones as residential, commercial, industrial, park, or other. Figure 2c depicts zoning informa-tion using color modulation of the tiles.
To execute the editing operations, the system per-forms tile-layout management and tile-similarity estimation. The layout-management component ensures that the result after editing is a valid and sensible street network and that no tile is excessive-ly deformed. To help obtain tiles of similar function (and shape), the similarity-estimation component places each tile into one of a set of clusters and then compares tiles within each cluster. For example, the system groups houses together, then places similar houses into subgroups.
Layout managementOur layout-management component uses a linear
(a)
(b) (c)
Figure1.Editingandconfigurationofanurbanlayout.(a)Satelliteimageoftheoriginal(left)andmodified(right)layoutofIstanbul.(b)Theoriginal(top)andmodified(bottom)topologyoftheaffectedarea.(c)Selectedtilesfromthecity’sindustrialzonecopied(red)andrelocatedtotheresidentialarea(blue).
Authorized licensed use limited to: University of Minnesota. Downloaded on September 6, 2009 at 18:44 from IEEE Xplore. Restrictions apply.
40 May/June2008
ProceduralMethodsforUrbanModeling
system of constraints that during editing simulta-neously attempts to keep streets unchanged and minimize tile deformation. Although multiple approaches to managing an urban layout editing process exist, we focus on the easy editing of an existing layout using only GIS-like data and min-imal user input. Furthermore, to avoid having to generate new and synthetic imagery, we reuse the imagery of the existing overhead views. This leads to an approach whereby we must rearrange the original, arbitrarily shaped tiles and maintain a validly connected and similarly styled street
layout. To accommodate layout changes, we ob-serve that while we want to keep the tiles mostly rigid, the segments of the street network have some flexibility in width and relative orientation. Thus, if we want to insert a particular urban tile into another part of the layout, we accommodate the additional space needed for the insertion by mildly changing the width and angle of all near-by streets. However, if the required change is too large, we resort to small deformations of the tiles and eventually to collapsing (or removing) tiles from the layout to support the operation.
Related Work in Urban Layout GenerationOur work lies between image processing and procedural modeling and borrows concepts from computational geometry.
Recently, researchers have proposed several image- processing algorithms to enable editing images. For example, Avidan and Shamir describe a method to resize and retarget images.1 Fang and Hart propose a technique to resynthesize image texture when reshaping a textured portion of an image and reduce unwanted deformations.2 These methods provide powerful tools for image editing but aren’t suitable for images with highly structured in-formation. An urban layout consists of building contours, road networks, and local details that can’t be treated the same as a patch of grass or sand. Important boundaries, angular relationships, and logical connectivity must be maintained, and tiles shouldn’t be deformed.
Texture and image synthesis provide another group of techniques for image processing. In general, such synthe-sis algorithms support creating new image content similar to a provided sample. For example, Zhou and colleagues provide a method to generate a synthetic terrain follow-ing the style of a source image.3 However, they offer no facility to modify the source image’s content, but propose a mechanism to generate a completely different terrain.
Hertzmann and colleagues use a source image and color coding combined with a target color coding to produce an image analogous to the source.4 They rearrange both terrain layouts and urban spaces. Nevertheless, the newly generated urban layouts recombine the patches by treat-ing them as collections of pixels and use blending to yield new images. Thus, upon closer inspection, their system doesn’t maintain connectivity and close-up details.
Procedural modeling methods exhibit a high degree of detail amplificationfor example, significant details can be synthetically generated or modified using only a few rule attributes. However, because a small change in the parameters can cause massive changes in the result-ing model, it’s difficult to use these systems; thus, system users need great experience and insight to obtain good
results. Nonetheless, researchers have demonstrated procedural techniques in various contexts, including urban spaces. For instance, Parish and Müller describe 3D city generation using procedural techniques.5 Their City Engine system takes images of existing areas to generate road maps using L-systems. The system then divides the road map into lots that are filled by buildings provided by another stochastic parametric L-system.
More recently, researchers have extended the genera-tion of buildings to fully procedural modeling of build-ings6 and to a hybrid procedural and computer-vision approach to generating building facades.7 The methods for generating urban layouts require careful handcrafting of a set of procedural rules or significant a priori informa-tion about the urban environment. Furthermore, they don’t necessarily reproduce or start with existing urban layouts. The challenge for procedural methods is the automatic generation of rules from given input data. Our system presents a step in this direction because it derives high-level structural information from given input data that’s reused during urban layout editing.
Also related to our system are several image- and model-reconfiguration methods. For example, Aliaga and colleagues use partially annotated images of buildings (analogous to our mapping data input) to edit and recon-figure buildings.8 This system takes uncalibrated images of a building, performs a photogrammetric reconstruction with user assistance, and then infers the parameters for a procedural model of the captured building. The system easily performs interactive modifications, such as resizing and copy/paste, while maintaining the buidling’s style. Kim and Pellacini introduce an image mosaic algorithm whereby arbitrary images of objects are composed to-gether to form the final picture, also of arbitrary shape.9
Our approach also has some similarity to parametric CAD models,10 where a parameterized model defines an object whereby each parameter has a valid range. The set of valid ranges of all parameters defines the object’s po-tential shapes. The urban layout’s parameters are the tiles’ location and the streets’ width and orientation.
In general, our work extends this work to urban layouts. We enable similar operations but for much larger physical
Authorized licensed use limited to: University of Minnesota. Downloaded on September 6, 2009 at 18:44 from IEEE Xplore. Restrictions apply.

IEEEComputerGraphicsandApplications 41
Constraint solverOur solver attempts to find a planar transformation for each tile that best accommodates the changes caused by the editing operations. Conceptually, we wish to keep each tile exactly touching its neighbor-ing tiles and also exactly abutting the segment of road it touches. If an editing operation displaces a tile, we seek to displace the neighboring tiles to keep the tiles from overlapping and the affected streets of the same width and size. Geometrically, tiles are polygons that partition the urban layout, so each tile shares its vertices with the neighboring tiles.
If a tile moves, the neighboring tiles’ vertices must also move to maintain the tile layout’s connectiv-ity. To keep tiles adjacent, we set up a collection of constraints whose nominal value is zero, and we use an optimization to discover the transformation to apply to each tile to best satisfy the constraints. To formulate the constraints, we first place all tiles into a graph. In the graph, a node corresponds to a tile and an edge corresponds to a vertex that two tiles share. Each graph edge effectively becomes a constraint to keep abutting tiles exactly touching.
The constraint solver evaluates two types of
spaces and for generally rigid tiles of a functional city. Unlike parametric CAD, our method sup-ports larger changes by adopting the strategy of joining (or removing) a group of tiles and replac-ing it with a similar-function tile of larger (or smaller) size. This provides significant flexibility. Unlike the procedural models, our system, once provided with the input data, is fully automatic and interactive.
References
S. Avidan and A. Shamir, “Seam Carving for
Content-Aware Image Resizing,” ACM Trans.
Graphics (Proc. Siggraph), vol. 26, no. 3, 2007.
H. Fang and J. Hart, “Detail Preserving Shape
Deformation in Image Editing,” ACM Trans.
Graphics (Proc. Siggraph), vol. 26, no. 3, 2007.
H. Zhou et al., “Terrain Synthesis from Digital
Elevation Models,” IEEE Trans. Visualization and
Computer Graphics, vol. 13, no. 4, 2007, pp.
834–848.
A. Hertzmann et al., “Image Analogies,” Proc.
Siggraph, ACM Press, 2001, pp. 327–340.
Y. Parish and P. Müller, “Procedural Modeling of
Cities,” Proc. Siggraph, 2001, pp. 301–308.
P. Müller et al., “Procedural Modeling of Buildings,”
ACM Trans. Graphics (Proc. Siggraph), vol. 25, no.
3, 2006, pp. 614–623.
P. Müller et al., “Image-Based Procedural Modeling
of Façades,” ACM Trans. Graphics (Proc. Siggraph),
vol. 26, no. 3, 2007.
D. Aliaga, P. Rosen, and D. Bekins, “Style Grammars
for Interactive Visualization of Architecture,” IEEE
Trans. Visualization and Computer Graphics, vol. 13,
no. 4, 2007, pp. 786–797.
J. Kim and F. Pellacini, “Jigsaw Image Mosaics,”
Proc. Siggraph, ACM Press, 2002, pp. 657–664.
C. Hoffmann and K.-J. Kim, “Towards Valid
Parametric CAD Models,” Computer-Aided Design,
vol. 33, 2001, pp. 81–90.
1.
2.
3.
4.
5.
6.
7.
8.
9.
10.
(a)
(b)
(c)
Figure2.Urbanlayoutdata.(a)Severalmutuallyregisteredaerialviewsusedtocreateanurbanlayout.(b)Underlyinggeometricconfigurationofthelayout.(c)Color-codedrepresentationofper-tilezoninginformation.
Authorized licensed use limited to: University of Minnesota. Downloaded on September 6, 2009 at 18:44 from IEEE Xplore. Restrictions apply.
42 May/June2008
ProceduralMethodsforUrbanModeling
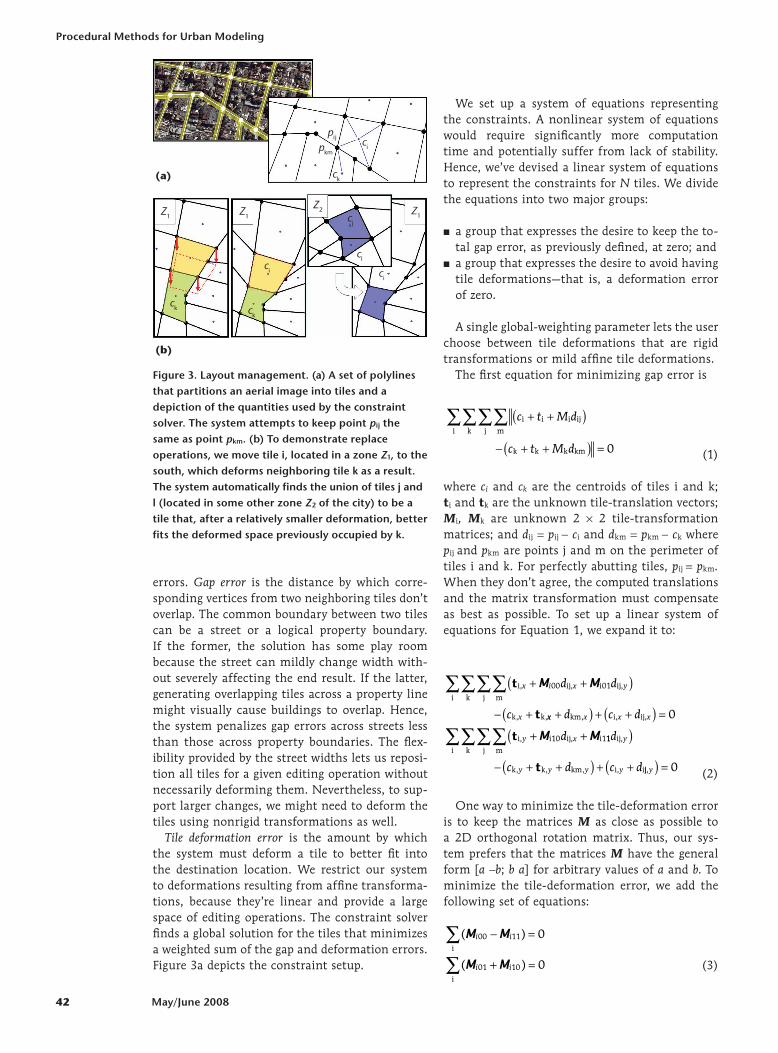
errors. Gap error is the distance by which corre-sponding vertices from two neighboring tiles don’t overlap. The common boundary between two tiles can be a street or a logical property boundary. If the former, the solution has some play room because the street can mildly change width with-out severely affecting the end result. If the latter, generating overlapping tiles across a property line might visually cause buildings to overlap. Hence, the system penalizes gap errors across streets less than those across property boundaries. The flex-ibility provided by the street widths lets us reposi-tion all tiles for a given editing operation without necessarily deforming them. Nevertheless, to sup-port larger changes, we might need to deform the tiles using nonrigid transformations as well.
Tile deformation error is the amount by which the system must deform a tile to better fit into the destination location. We restrict our system to deformations resulting from affine transforma-tions, because they’re linear and provide a large space of editing operations. The constraint solver finds a global solution for the tiles that minimizes a weighted sum of the gap and deformation errors. Figure 3a depicts the constraint setup.
We set up a system of equations representing the constraints. A nonlinear system of equations would require significantly more computation time and potentially suffer from lack of stability. Hence, we’ve devised a linear system of equations to represent the constraints for N tiles. We divide the equations into two major groups:
a group that expresses the desire to keep the to-tal gap error, as previously defined, at zero; and a group that expresses the desire to avoid having tile deformations—that is, a deformation error of zero.
A single global-weighting parameter lets the user choose between tile deformations that are rigid transformations or mild affine tile deformations.
The first equation for minimizing gap error is
c t M d
c t M d
i i i ij
mjki
k k k km
+ +( )
− + +( ) =
∑∑∑∑0 (1)
where ci and ck are the centroids of tiles i and k; ti and tk are the unknown tile-translation vectors; Mi, Mk are unknown 2 × 2 tile-transformation matrices; and dij = pij − ci and dkm = pkm − ck where pij and pkm are points j and m on the perimeter of tiles i and k. For perfectly abutting tiles, pij = pkm. When they don’t agree, the computed translations and the matrix transformation must compensate as best as possible. To set up a linear system of equations for Equation 1, we expand it to:
t
t
i ij i ij
mjki
k k
, , ,
, ,
x i x y
x
d d
c
+ +( )
− +
∑∑∑∑ MM MM00 01
xx x x x
y x
d c d
d
+( ) + +( ) =
+ +
km i ij
i i ij i
, , ,
, ,
0
10 1t MM MM 11d
c d c d
y
y y y y
ij
mjki
k k km i i
,
, , , ,
( )
− + +( ) + +
∑∑∑∑t jj,y( ) = 0 (2)
One way to minimize the tile-deformation error is to keep the matrices M as close as possible to a 2D orthogonal rotation matrix. Thus, our sys-tem prefers that the matrices M have the general form [a −b; b a] for arbitrary values of a and b. To minimize the tile-deformation error, we add the following set of equations:
( )
( )
MM MM
MM MM
i i
i i
00 11
01 10
0
0
− =
+ =
∑∑
i
i
(3)
■
■
(a)
(b)
Z1 Z1
Z2 Z1
pkm
pij ci
ck
ck ck
cicl
cj
ci
Figure3.Layoutmanagement.(a)Asetofpolylinesthatpartitionsanaerialimageintotilesandadepictionofthequantitiesusedbytheconstraintsolver.Thesystemattemptstokeeppointpijthesameaspointpkm.(b)Todemonstratereplaceoperations,wemovetilei,locatedinazoneZ1,tothesouth,whichdeformsneighboringtilekasaresult.Thesystemautomaticallyfindstheunionoftilesjandl(locatedinsomeotherzoneZ2ofthecity)tobeatilethat,afterarelativelysmallerdeformation,betterfitsthedeformedspacepreviouslyoccupiedbyk.
Authorized licensed use limited to: University of Minnesota. Downloaded on September 6, 2009 at 18:44 from IEEE Xplore. Restrictions apply.
IEEEComputerGraphicsandApplications 43
We can write these two groups of equations as a system of linear equations in the form Ax = b, where x is constructed as an array of 6N unknown variables, namely {ti,x , ti,y, Mi00, Mi01, Mi10, Mi11}. The number of columns in A is 6N, and the num-ber of rows depends on the number of vertices per tile. Because all tiles have at least three vertices, there are at least 6N equations from Equation 2 and 2N equations from Equation 3. This yields a typically overconstrained and sparse linear system of equations that we can efficiently solve using lin-ear least squares.
Editing operationsGiven the aforementioned graph and constraint system, editing operations amount to changing the graph and recomputing the tile transforma-tion to best satisfy the constraints. In general, editing operations fall into two categories: those preserving the graph topology and those chang-ing the graph topology. An example of a topology- preserving operation is an interactive displace-ment of a set of tiles to a new location. The system adjusts the transformation applied to the nearby tiles to best accommodate the move. The linear constraint solver minimizes gap error and tile- deformation error. The system tries to replace tiles that yield an excessively large gap or deformation error with other tiles of similar classification cho-sen manually or automatically. Potential replace-ment tiles are those tiles that are most similar (nondeformed) to the deformed tile. The system replaces a tile only if using the candidate tile results in a solution with lower overall error, as defined by the constraint equations. Thus, during editing, the system computes each tile’s deformation error and tries to replace those exceeding a threshold with another tile. After the system replaces several (or all) tiles exceeding the threshold, it executes the constraint solver, again yielding a new set of tile transformations. This process repeats in an itera-tive fashion until no more replacement operations can be performed. Figure 3b shows an example move-and-replace sequence.
Copy/paste and cut/paste are example topol-ogy-changing operations that transfer a part of the urban layout from one location to another. In this case, the system places an interactively se-lected group of tiles at a new location by replacing the most similar tiles with the selected tiles. We use the similarity notion to naively find the best mapping between the selected and the destination tiles. The system precomputes subsets of these computations and stores them in a similarity ma-trix, which helps improve performance.
Similarity estimationAn important building block for performing the editing operations is quantifying the tile similarity. This problem is analogous to the polygon-mapping problem (for example, how to best correspond an n-vertex polygon with another m-vertex polygon). Sander and colleagues introduce a texture stretch metric to minimize texture deformation while constructing progressive meshes,1 and Zhang and colleagues propose a scheme to partition the sur-face into patches to minimize surface parameter-ization stretch.2 In our case, the decomposition is given (as roads, parcels, blocks, and so on), so we focus on keeping the shape minimally deformed in the context of an urban space. We therefore es-tablish a penalty function that discourages scaling and shearing the parcels and permits a controlled amount of street deformation, which follows the simple intuition that roads can twist, bend, and change width. Furthermore, we consider two tiles alike if they serve a similar function in the urban layout and if we can substitute one for another with only a small geometric distortion. Hence, our system determines similarity in two phases:
In the first phase, we group tiles into similarity clusters. Each cluster represents a set of tiles of similar function, style, and approximate shape. In the second phase, we use a more expensive and accurate metric to measure the geometric similar-ity between tiles of the same cluster. We compute a 2D similarity matrix to represent the further similarity data between tiles in the same cluster.
To generate the first level of similarity, we use a weighted k-means clustering algorithm to group tiles into clusters of similar function and form. The metadata defining a tile includes its zoning classification, construction date, building type, and numerous other characteristics. The general shape is characterized, for instance, by the area, number of vertices, and interior angles of the tile’s geometry. Without loss of generality, we define a 5D vector si = [z, a, n, µ, σ] to represent a tile i, where z is the tile’s zone (industrial, residential, commercial, park, or other), a is the tile’s area, n is its number of vertices, µ denotes the mean interior angle, and σ is the interior angle’s standard devia-tion. The user specifies the number of clusters as a percentage of the total number of tiles (see Figure 4, next page).
To generate the second level of geometric similar-ity between two tiles (typically of the same cluster), we iterate through a subset of all vertex-to-vertex mappings and estimate a similarity value. For each
■
■
Authorized licensed use limited to: University of Minnesota. Downloaded on September 6, 2009 at 18:44 from IEEE Xplore. Restrictions apply.

44 May/June2008
ProceduralMethodsforUrbanModeling
mapping, we compute the best linear transforma-tion to align the two tiles’ perimeters. We use the mapping that produces the least tile distortion and smallest perimeter mismatch to indicate the simi-larity between the tiles. To explain our method, we define tile A to contain n vertices and tile B to contain m vertices, with n ≥ m. If both tiles have the same number of vertices, we try O(n) possible vertex mappings by sequentially attempting to map the vertices of A to those of B with an offset vary-ing from 0 to n − 1. If tile A has more vertices than tile B, we remove each vertex of A individually and recursively call the similarity method. Although this might yield numerous potential mappings, in practice the difference between the number of vertices of A and B is small. Furthermore, we use several trivial-reject heuristics to significantly re-duce the number of potential mappings:
If removing a vertex of A significantly reduces the tile’s area, the system ignores that branch of potential mappings.If the sequence of vertices around a pair of tiles with the same number of vertices doesn’t match in the type of the vertex (for example, street or parcel boundary vertex), the system ignores the case.
Our system also finds the similarity between one-to-many tiles, which lets it compare, and thus replace, one tile with multiple tiles (for example, a large tile replacing a collection of smaller tiles). The system performs this computation by recursively merging the smaller of the two tiles with an adjacent tile. It performs the similarity estimation analogously on the merged tiles. The system doesn’t perform the merging process if the area difference between two tiles is too large, and it stops when the merged tile is sufficiently larger than the other tile.
■
■
To choose the best mapping between a pair of tiles A and B, we distort tile A to tile B, estimate a measure of the tile distortion error, edistortion, and compute a difference between perimeter shapes. Tile distortion error is computed as a weighted sum of undesired shearing, scaling, and change in aspect ratio, namely edistortion = k0escale + k1easpect + k2eshear and
escale =++
−max( , )min( , )
a ba b
22
1 ,
easpect =( )( ) −
max ,
min ,
a b
a b1
,
eshear =⋅( )
⋅( )
−
−
max cos ,
min cos ,
1
1
2a b
a b
π
ππ2
1
−
, (4)
where a is the vector (1, 0) transformed by the matrix computed for tile A, b is the vector (0, 1) transformed by the same matrix, and ki are weights for establishing the relative importance of the distortion error components. Although we don’t directly force the angles between streets and the angles between perimeter segments to remain un-changed, including the shearing and aspect ratio into the error metric indirectly encourages the sys-tem to maintain the original layout’s angular re-lationships. We compute the perimeter mismatch error, eperimeter, straightforwardly as the summed distance between corresponding tile vertices. The total similarity error, e, is a weighted sum of the two error metrics:
e = (1 − α)edistortion + αeperimeter , (5)
where α controls each error’s relative influence. The clustering and tile similarity information can be precomputed to accelerate the performance of the paste and replace operations during interactive editing. To improve the move operation’s perfor-mance, we compare a deformed tile that we want to replace with a representative from each clus-ter (for example, the tile closest to the midpoint of the tile’s description vector) and then further compare it with the members of the cluster of the best-matched representative.
ResultsWe used our system to edit the urban layouts of subsets of several real-world cities. We imple-
(a) (b)
Figure4.Similarityclustering.Inthefirstpartofsimilarityestimation,tilescanbepartitionedinto,forexample,(a)clustersbasedprimarilyonthetile’sareaor(b)clustersbasedprimarilyontileshapesimilarity.Subsequently,wecomputesimilaritybetweentilesinthesameclusterusingageometricsimilaritymeasure.
Authorized licensed use limited to: University of Minnesota. Downloaded on September 6, 2009 at 18:44 from IEEE Xplore. Restrictions apply.

IEEEComputerGraphicsandApplications 45
mented the software system in C++. To render the layouts, we use standard OpenGL, the OpenGL Utility Kit, and the GLUT-based user interface (GLUI). To improve performance, we make a one-time simplification of the graph of tiles to reduce the number of constraints. The system collapses pairs of vertices that are very near each other into one vertex and merges existing constraints between the affected tiles. It removes additional, noncorner edges that are approximately collinear with their surrounding edges. It also precomputes the similarity clustering and tile-to-tile similarity matrix and stores this information to disk.
Our four example data sets are Buenos Aires, Istanbul, Madrid, and Paris. Each city consists of 9 to 16 1,024 × 1,024-pixel images obtained from Google Maps and arranged in a 2D grid. Table 1 gives additional information about the cities and their layouts. We precomputed the clustering and tile similarity information to accelerate the per-formance of paste and replace operations; this preprocessing varies from 1 to 3 hours for each data set. During runtime, the system computes on demand the tile-similarity information for newly created and significantly deformed tiles. It can parse the input data automatically from a GIS da-tabase/county office or input the data manually. In our prototype system, instead of focusing on pars-ing the mapping files, we use a simple interactive system to specify streets and parcel boundaries.
Figures 5 and 6 demonstrate topology-preserv-ing operations. We compare the results of bend-ing the layout using a common image-processing program to the results obtained using our method. Figure 5a is a view of the original urban space. Figure 5b shows the result using our linear con-straint solver without any tile deformations, and Figure 5c shows a similar result but with mild tile deformations. The average gap error in Figure 5c is smaller than in Figure 5b, but with a small average tile deformation. Figure 5d demonstrates an image after naive mesh warping using Adobe Photoshop and without considering any structural informa-tion; large deformation error is evident.
Figure 6 (next page) shows two more examples of moving operations. In particular, Figures 6a−6c depict a sequence of breaking an urban layout into pieces, displacing the pieces outward, and re-assembling a stretched version of the layout. The stretching of the entire layout is distributed by rigid/affine transformations among hundreds of constituting tiles, so each block’s size and aspect ratio presents only a small variation. Figures 6d−6f show some parts of Paris rotated around the Place de la Concorde. Both examples are generated in-
teractively and comprise core topology-preserving operations.
Figure 7 depicts the copy/cut and paste opera-tions. Using the Buenos Aires layout, we replicate an urban structure in several locations of the lay-out. For each placement, we resolve the constraint system, yielding a slightly perturbed layout that accommodates the new tile. Figures 7a−7c show the major steps of this operation. Despite placing pieces of different connectivity and size into the
Table 1. Example of data sets.
City Streets Boundaries Tiles
Buenos Aires 20 440 686
Istanbul 174 1,073 2,012
Madrid 79 568 802
Paris 33 373 535
(a)
(b)
(c)
(d)
Figure5.Imagecomparison.(a)AviewoftheBuenosAireslayout.(b)Thelayoutdeformedusingourconstraintsolverwithrigidand(c)withmildnonrigidtransformations.(d)Thelayoutdeformedusingastandardimage-processingprogram.
Authorized licensed use limited to: University of Minnesota. Downloaded on September 6, 2009 at 18:44 from IEEE Xplore. Restrictions apply.

46 May/June2008
ProceduralMethodsforUrbanModeling
grid, the system can reconfigure the tiles to accom-modate the changes. We calculate the pasted tile’s position and orientation to maximize the match-ing to the tile or set of tiles that it replaces. Then, the pasted tile inherits its connectivity from the replaced tiles, and we recalculate and maximize the gap error between the tile and its neighbors by resolving the constraint system. The user can select the type of transformation used to reduce gap error (rigid or affine).
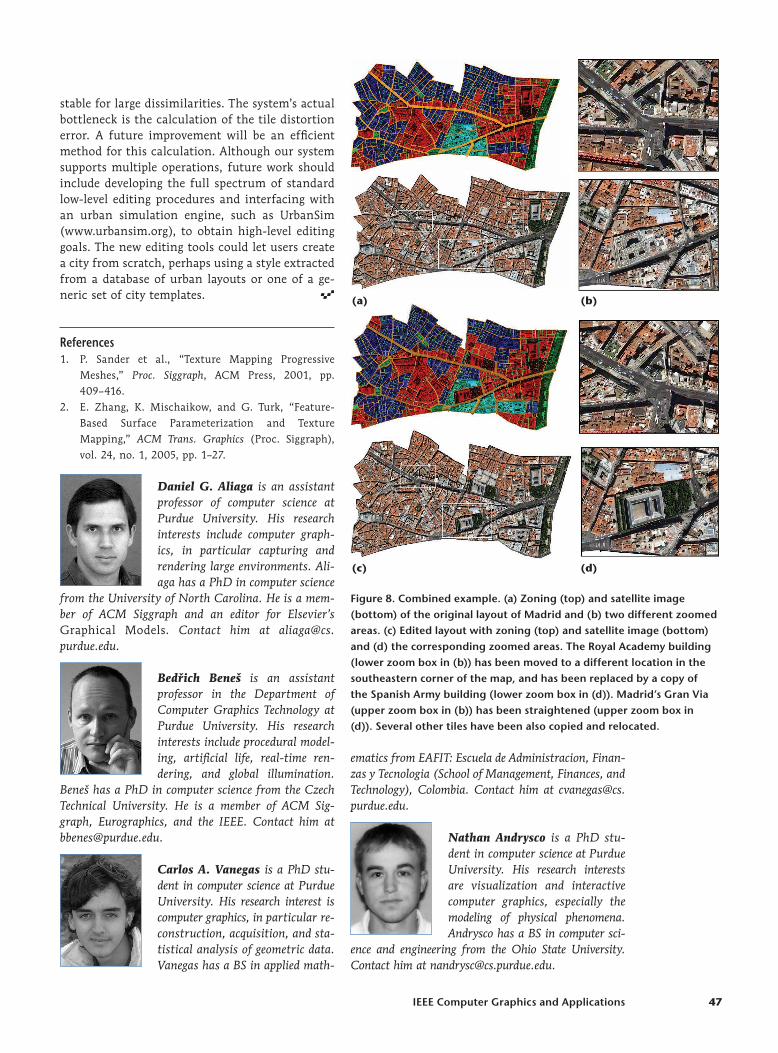
The example in Figure 8 combines multiple operations. Figure 8a shows the original zoning division and street network of downtown Ma-drid (top), and a satellite view (bottom). Figure 8b shows two zoomed areas: a curve in Gran Via Avenue (top), and the building of the Museum of the Royal Academy (bottom). We perform several copy/paste operations (Figure 8c). First, we copy and paste the museum to a set of tiles in the southeastern corner that was initially occupied by residential buildings. Then, we copy and paste the
Spanish Army building to the museum’s former location (Figure 8d, bottom), and to a set of tiles with residential buildings (center of the map). We then apply two specific rotations to some tiles in the city’s northwestern corner, aiming to elimi-nate the curve in Gran Via Avenue. Such rotations result in overlapping tiles with large gap errors. Fi-nally, we resolve the constraint system for the en-tire layout and obtain a straightening of Gran Via (Figure 8d, top). The process takes approximately 10−15 minutes (once the source and destination tiles have been identified). Getting a similar solu-tion using an image editor would require an expe-rienced user and several hours of editing.
We could improve the system in several ways. The similarity estimation method we de-
scribe is efficient and accurate when comparing relatively similar tiles, as are common in urban layouts. However, the quantitative result is less
(a) (b) (c)
(d) (e) (f)
Figure6.Topology-preservingoperations.(a)AnoriginalviewofIstanbul.(b)Thelayoutdividedintodistinctpartsand(c)reassembledwithastretch.(d)AviewofPariswith(e−f)partsofthelayoutrotatedaroundthePlacedelaConcorde.
(a) (b) (c)
Figure7.Copy/cutandpasteoperations.(a)AviewofBuenosAires.(b)Theresultafterperformingapasteoperationand(c)afterresolvingtheconstraintsystem.
Authorized licensed use limited to: University of Minnesota. Downloaded on September 6, 2009 at 18:44 from IEEE Xplore. Restrictions apply.
IEEEComputerGraphicsandApplications 47
stable for large dissimilarities. The system’s actual bottleneck is the calculation of the tile distortion error. A future improvement will be an efficient method for this calculation. Although our system supports multiple operations, future work should include developing the full spectrum of standard low-level editing procedures and interfacing with an urban simulation engine, such as UrbanSim (www.urbansim.org), to obtain high-level editing goals. The new editing tools could let users create a city from scratch, perhaps using a style extracted from a database of urban layouts or one of a ge-neric set of city templates.
ReferencesP. Sander et al., “Texture Mapping Progressive Meshes,” Proc. Siggraph, ACM Press, 2001, pp. 409–416.E. Zhang, K. Mischaikow, and G. Turk, “Feature-Based Surface Parameterization and Texture Mapping,” ACM Trans. Graphics (Proc. Siggraph), vol. 24, no. 1, 2005, pp. 1–27.
Daniel G. Aliaga is an assistant professor of computer science at Purdue University. His research interests include computer graph-ics, in particular capturing and rendering large environments. Ali-aga has a PhD in computer science
from the University of North Carolina. He is a mem-ber of ACM Siggraph and an editor for Elsevier’s Graphical Models. Contact him at aliaga@cs. purdue.edu.
Bedrich Beneš is an assistant professor in the Department of Computer Graphics Technology at Purdue University. His research interests include procedural model-ing, artificial life, real-time ren-dering, and global illumination.
Beneš has a PhD in computer science from the Czech Technical University. He is a member of ACM Sig-graph, Eurographics, and the IEEE. Contact him at [email protected].
Carlos A. Vanegas is a PhD stu-dent in computer science at Purdue University. His research interest is computer graphics, in particular re-construction, acquisition, and sta-tistical analysis of geometric data. Vanegas has a BS in applied math-
1.
2.
ematics from EAFIT: Escuela de Administracion, Finan-zas y Tecnologia (School of Management, Finances, and Technology), Colombia. Contact him at [email protected].
Nathan Andrysco is a PhD stu-dent in computer science at Purdue University. His research interests are visualization and interactive computer graphics, especially the modeling of physical phenomena. Andrysco has a BS in computer sci-
ence and engineering from the Ohio State University. Contact him at [email protected].
(a) (b)
(c) (d)
Figure8.Combinedexample.(a)Zoning(top)andsatelliteimage(bottom)oftheoriginallayoutofMadridand(b)twodifferentzoomedareas.(c)Editedlayoutwithzoning(top)andsatelliteimage(bottom)and(d)thecorrespondingzoomedareas.TheRoyalAcademybuilding(lowerzoomboxin(b))hasbeenmovedtoadifferentlocationinthesoutheasterncornerofthemap,andhasbeenreplacedbyacopyoftheSpanishArmybuilding(lowerzoomboxin(d)).Madrid’sGranVia(upperzoomboxin(b))hasbeenstraightened(upperzoomboxin(d)).Severalothertileshavebeenalsocopiedandrelocated.
Authorized licensed use limited to: University of Minnesota. Downloaded on September 6, 2009 at 18:44 from IEEE Xplore. Restrictions apply.
Copyright © 2022 FDOKUMEN