microgrid intelligent management system based on a multi ...
Real Time Implementation of Microgrid Reconfiguration
F. Shariatzadeh, R. Zamora, and A.K. Srivastava
Smart Grid Demonstration and Research Investigation Lab (SGDRIL) School of Electrical Engineering and Computer Science
Washington State University Pullman, WA 99164
Abstract—Reconfiguration is a control action including topology changes, load/ generation shedding and other measures to redirect power flow to the remaining unaffected loads in a microgrid. In this paper, genetic algorithm (GA) and graph theory based methodologies were used to reconfigure a network, satisfying the operational requirements and priorities of loads. Applications of the GA for reconfiguration were implemented in MATLAB and tested on 8-bus shipboard power system (SPS) and modified CERTS microgrids with consideration of distributed generation and islanding operation. Satisfactory simulations results were obtained for several possible test case scenarios in a real-time and non-real-time case study.
Index Terms—Reconfiguration, genetic algorithm (GA), graph theory, islanding, microgrid, shipboard power system (SPS).
I. INTRODUCTION ehnological development of distributed generation (DG) and microgrid has introduced changes on power systems, especially related to power distribution systems. The
conventional power system with unidirectional power flow, generations-transmission-distribution, has gradually been modified by installing small-scale generations, DGs, on distribution side. The existence of DGs as local generations which primarily supply local loads can be optimally utilized by treating these DGs and local loads as a cluster [1, 2]. This cluster is considered as a microgrids which can be defined as an interconnection of distributed generations (DGs), such as microturbines, wind turbines, fuel cells and photovoltaics (PVs) integrated with storage devices, such as batteries, flywheels and power capacitors to the load on low voltage distribution systems [3]. Microgrid is a very promising solution for today’s electricity problems due to its potential benefits to provide reliable, secure, efficient, environmental friendly and sustainable electricity from renewable energy sources (RES) [4].
A microgrid can operate in grid-connected or islanded mode. In normal condition, a microgrid integrates to main grid and acts as a subsystem of distribution systems. In this mode, local loads inside the microgrid are supplied by DGs located near the loads. The connection to main grid is aimed to transfer power between the microgrid and main grid if there is insufficiency or excess generations in either side. When there is a problem with the utility supply, microgrid will disconnect from the main grid and work autonomously [5, 6]. This mode of operation is called
islanded mode. Not all microgrids have two modes of operations. Some microgrids fully operate as islanded microgrid because they do not have access to the main grid. Due to its similar properties, such as a cluster small-scale local generations and loads in a small region, a shipboard power system (SPS) can be considered as a microgrid, an islanded microgrid [7-9].
A successful transition between grid-connected and islanded modes and vice versa and a stable operation in both modes are very important for microgrid operation. Between these two modes, islanded mode of operation requires more consideration due to the limit of DG capacity to fulfill local load demands. The ratio of available generation and load demand is a very important factor for the successful of islanded operation. This ratio will be more important in case of a fault inside microgrid. This kind of fault will require a microgrid to reconfigure in order to isolate the faulted area while minimizing unsupplied loads. Reconfiguration is a type of emergency control including topology changes, load and generation shedding and other control measures to redirect power flow to the remaining loads [10, 11]. An effective and optimal reconfiguration requires intelligent and fast actions. Hence, finding an accurate heuristic or numerical method is very essential [10].
Much research has been conducted on conventional distribution system reconfiguration. However, conventional system reconfiguration is not suitable for microgrid reconfiguration due to the uniqueness of microgrid as discussed above. A reconfiguration of IEEE standard distribution systems containing a microgrid is addressed in [12], while [13] discussed conventional distribution system reconfiguration by creating a combination of microgrids as the reconfigured system. These both research works more focus on distribution system reconfiguration by embedding microgrid paradigm, not really microgid reconfiguration. several reconfiguration algorithms have been proposed for SPS. The heuristic-search approach for SPS reconfiguration problem has been discussed in [14]. This method is very simple but has problems in restoration with an increasing number of loads. In the method of network flow approach [15, 16], the load priorities have not been considered. Self healing approach for SPS reconfiguration presented in [17] was based on predictive analysis in stored database causing problems for bigger system. Several other intelligent reconfiguration methodologies including ant colony, genetic algorithm, hybrid methods and particle swarm optimization were discussed in [18-25] for distribution system.
T
This paper discusses evolutionary reconfiguration algorithm based on genetic algorithm (GA). This algorithm is applied to 8-bus SPS and the modified Consortium for Electric Reliability Technology Solutions (CERTS) microgrids to find post-fault optimal configuration meeting designated objectives and system constraints. Both systems in normal condition will be simplified by using graph representation in order to generate their matrix representation. The reconfiguration algorithm will use these matrices to find their optimal solutions so that the power balance of the remainder system after fault isolation can be maintained and the impact of the fault can be minimized. Reconfiguration algorithm have been implemented in real time using real time digital simulator and dSPACE controller. Contributions of this paper are optimization algorithms application to reconfigure the microgrid with considerations of load priority, distributed generations, zonal distribution and islanding using intelligent approach developed by authors previously.
This paper is organized as follows. Section II describes the graph representation of SPS and CERTS microgrids. Section III presents the simulation results for different fault scenarios. Section IV includes real-time implementation of reconfiguration algorithm for 8-bus SPS. Summary and future work is given in Section V.
II. GRAPH REPRESENTATION OF SPS AND CERTS MICROGRID
A. Graph Representation of SPS Graph theory was used to represent SPS. A simple SPS
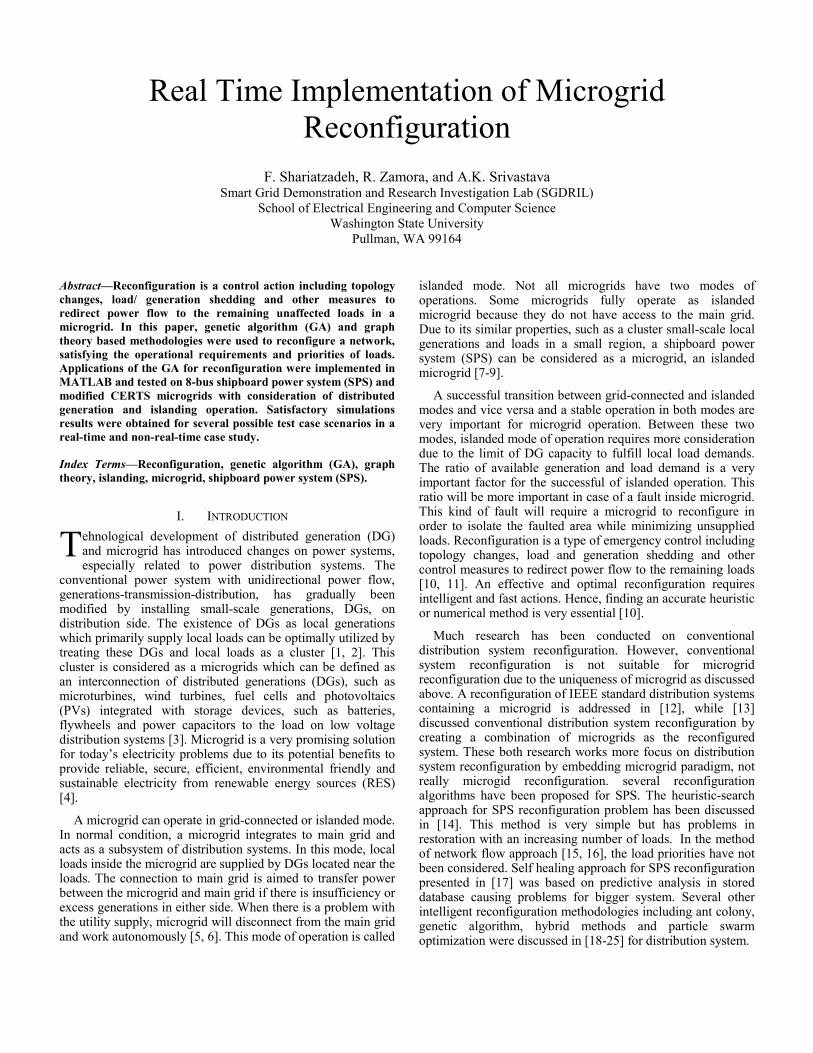
model is shown in Fig. 1. Initial formulation of the representation of the SPS test system was done in [24-26]. This system consists of four generators and six loads. Graphical representation of system is shown in Fig. 2. The main components of a shipboard power distribution system, which include service switchboards, buses, cables, generators, and load feeders, are interconnected by breakers. The relationship between the major components of SPS and the corresponding graphical elements are shown in Table I.
TABLE I
GRAPH REPRESENTATION OF SHIPBOARD POWER SYSTEM MODEL
SPS model shown in Fig. 1 consists of six switchboards
(bus 1, bus2, bus 3, bus 5, bus 6 and bus 7), two cables (bus 4 and bus 8), four generators (G1, G2, G3, and G4), and eighteen breakers (with current transformer). The direction of flow of power through the breaker is represented by direction of the edge in the graph representation. The power system is divided into several zones. Each zone contains a bus with directly connected breakers. In the corresponding graph representation, each zone is represented by a vertex with the directly connected edges [24-26].
Fig. 1. A shipboard power system model
TABLE II
INPUT DATA FOR SPS RECONFIGURATION ALGORITHM
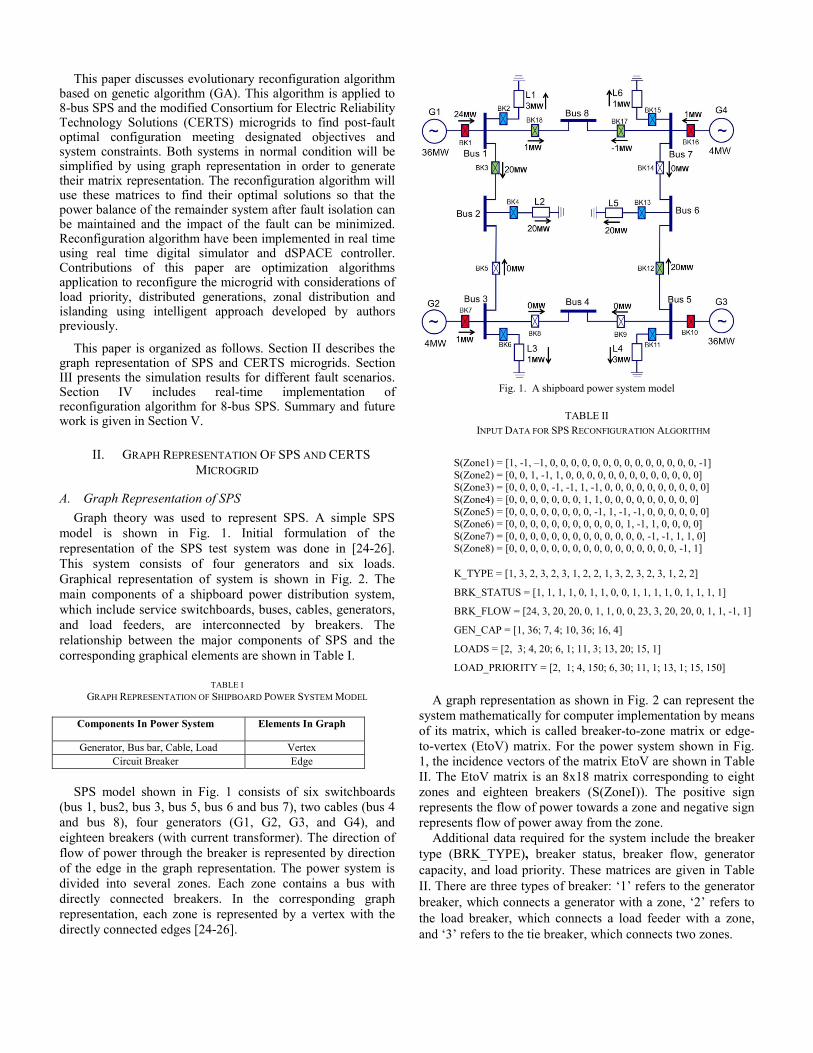
A graph representation as shown in Fig. 2 can represent the
system mathematically for computer implementation by means of its matrix, which is called breaker-to-zone matrix or edge-to-vertex (EtoV) matrix. For the power system shown in Fig. 1, the incidence vectors of the matrix EtoV are shown in Table II. The EtoV matrix is an 8x18 matrix corresponding to eight zones and eighteen breakers (S(ZoneI)). The positive sign represents the flow of power towards a zone and negative sign represents flow of power away from the zone.
Additional data required for the system include the breaker type (BRK_TYPE), breaker status, breaker flow, generator capacity, and load priority. These matrices are given in Table II. There are three types of breaker: ‘1’ refers to the generator breaker, which connects a generator with a zone, ‘2’ refers to the load breaker, which connects a load feeder with a zone, and ‘3’ refers to the tie breaker, which connects two zones.
Components In Power System Elements In Graph
Generator, Bus bar, Cable, Load Vertex Circuit Breaker Edge
S(Zone1) = [1, -1, –1, 0, 0, 0, 0, 0, 0, 0, 0, 0, 0, 0, 0, 0, 0, -1] S(Zone2) = [0, 0, 1, -1, 1, 0, 0, 0, 0, 0, 0, 0, 0, 0, 0, 0, 0, 0] S(Zone3) = [0, 0, 0, 0, -1, -1, 1, -1, 0, 0, 0, 0, 0, 0, 0, 0, 0, 0] S(Zone4) = [0, 0, 0, 0, 0, 0, 0, 1, 1, 0, 0, 0, 0, 0, 0, 0, 0, 0] S(Zone5) = [0, 0, 0, 0, 0, 0, 0, 0, -1, 1, -1, -1, 0, 0, 0, 0, 0, 0] S(Zone6) = [0, 0, 0, 0, 0, 0, 0, 0, 0, 0, 0, 1, -1, 1, 0, 0, 0, 0] S(Zone7) = [0, 0, 0, 0, 0, 0, 0, 0, 0, 0, 0, 0, 0, -1, -1, 1, 1, 0] S(Zone8) = [0, 0, 0, 0, 0, 0, 0, 0, 0, 0, 0, 0, 0, 0, 0, 0, -1, 1]
K_TYPE = [1, 3, 2, 3, 2, 3, 1, 2, 2, 1, 3, 2, 3, 2, 3, 1, 2, 2]
BRK_STATUS = [1, 1, 1, 1, 0, 1, 1, 0, 0, 1, 1, 1, 1, 0, 1, 1, 1, 1]
BRK_FLOW = [24, 3, 20, 20, 0, 1, 1, 0, 0, 23, 3, 20, 20, 0, 1, 1, -1, 1]
GEN_CAP = [1, 36; 7, 4; 10, 36; 16, 4]
LOADS = [2, 3; 4, 20; 6, 1; 11, 3; 13, 20; 15, 1]
LOAD_PRIORITY = [2, 1; 4, 150; 6, 30; 11, 1; 13, 1; 15, 150]
The breaker status matrix (BRK_STATUS) represents the system breaker open/close status. A “1” means that the breaker is closed, and a “0” means that the breaker is open. The instantaneous power flow through each breaker can be obtained from the three phase power flow [27]. The generator capacity (GEN_CAPACITY) matrix is a two-column matrix. The first column contains the index of the generator breaker and the second column contains the corresponding generator capacity. The instantaneous power flow (BRK_FLOW) matrix and generator capacity matrix are also shown in Table II. The load priority (LOAD_PRIORITY) matrix is one of the important information used by reconfiguration algorithm for possible load shedding. In the load priority matrix shown in Table II, the first column contains the index of the breaker; the second column contains the load priority, larger numbers indicate the higher priority. In the power system model shown in Fig. 1, loads 2, 3, and 6 have higher priority than loads 1, 4 and 5.
Fig. 2. Graph representation of SPS model
B. Graph Representation of Modified CERTS Microgrid As mentioned above, graph theory was used in the
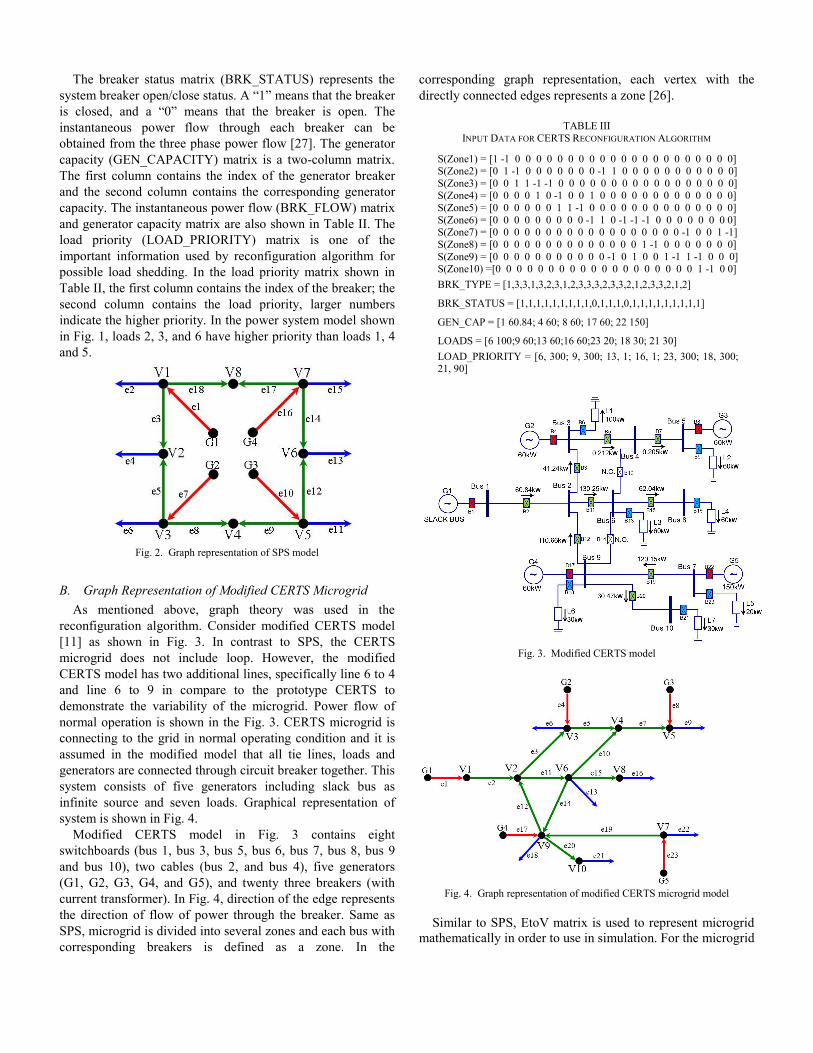
reconfiguration algorithm. Consider modified CERTS model [11] as shown in Fig. 3. In contrast to SPS, the CERTS microgrid does not include loop. However, the modified CERTS model has two additional lines, specifically line 6 to 4 and line 6 to 9 in compare to the prototype CERTS to demonstrate the variability of the microgrid. Power flow of normal operation is shown in the Fig. 3. CERTS microgrid is connecting to the grid in normal operating condition and it is assumed in the modified model that all tie lines, loads and generators are connected through circuit breaker together. This system consists of five generators including slack bus as infinite source and seven loads. Graphical representation of system is shown in Fig. 4.
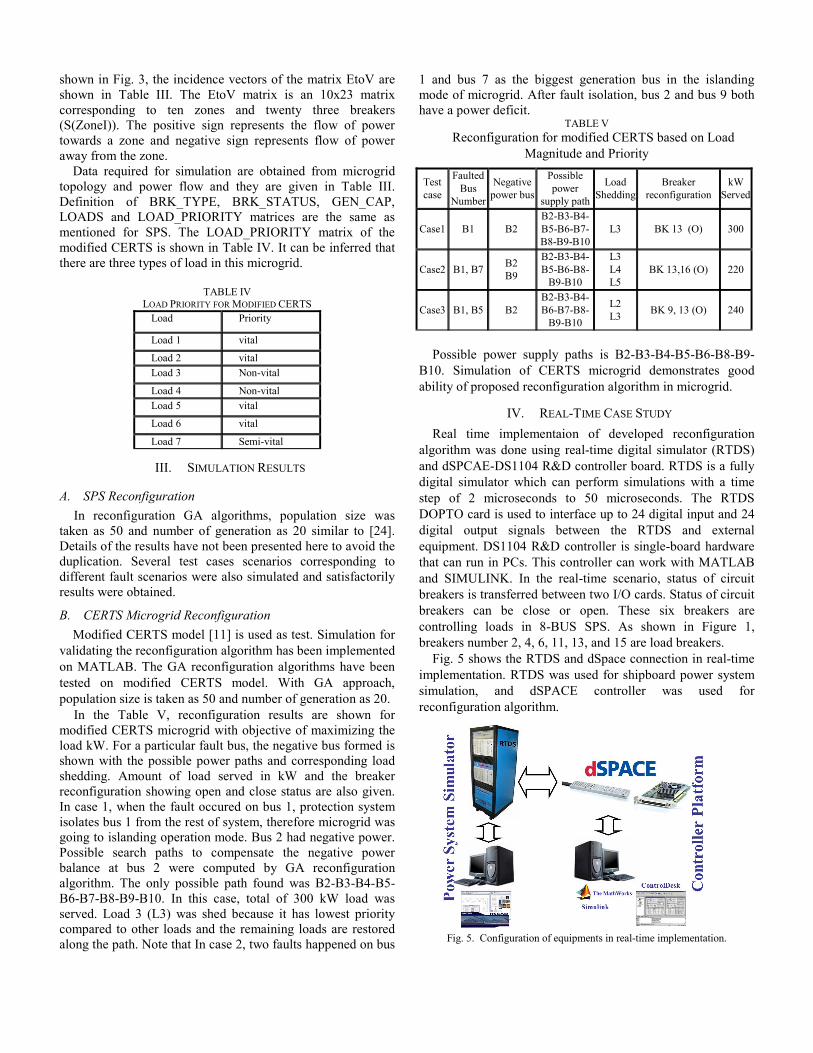
Modified CERTS model in Fig. 3 contains eight switchboards (bus 1, bus 3, bus 5, bus 6, bus 7, bus 8, bus 9 and bus 10), two cables (bus 2, and bus 4), five generators (G1, G2, G3, G4, and G5), and twenty three breakers (with current transformer). In Fig. 4, direction of the edge represents the direction of flow of power through the breaker. Same as SPS, microgrid is divided into several zones and each bus with corresponding breakers is defined as a zone. In the
corresponding graph representation, each vertex with the directly connected edges represents a zone [26].
TABLE III
INPUT DATA FOR CERTS RECONFIGURATION ALGORITHM
Fig. 3. Modified CERTS model
Fig. 4. Graph representation of modified CERTS microgrid model
Similar to SPS, EtoV matrix is used to represent microgrid
mathematically in order to use in simulation. For the microgrid
S(Zone1) = [1 -1 0 0 0 0 0 0 0 0 0 0 0 0 0 0 0 0 0 0 0 0 0] S(Zone2) = [0 1 -1 0 0 0 0 0 0 0 -1 1 0 0 0 0 0 0 0 0 0 0 0] S(Zone3) = [0 0 1 1 -1 -1 0 0 0 0 0 0 0 0 0 0 0 0 0 0 0 0 0] S(Zone4) = [0 0 0 0 1 0 -1 0 0 1 0 0 0 0 0 0 0 0 0 0 0 0 0] S(Zone5) = [0 0 0 0 0 0 1 1 -1 0 0 0 0 0 0 0 0 0 0 0 0 0 0] S(Zone6) = [0 0 0 0 0 0 0 0 0 -1 1 0 -1 -1 -1 0 0 0 0 0 0 0 0] S(Zone7) = [0 0 0 0 0 0 0 0 0 0 0 0 0 0 0 0 0 0 -1 0 0 1 -1] S(Zone8) = [0 0 0 0 0 0 0 0 0 0 0 0 0 0 1 -1 0 0 0 0 0 0 0] S(Zone9) = [0 0 0 0 0 0 0 0 0 0 0 -1 0 1 0 0 1 -1 1 -1 0 0 0] S(Zone10) =[0 0 0 0 0 0 0 0 0 0 0 0 0 0 0 0 0 0 0 1 -1 0 0] BRK_TYPE = [1,3,3,1,3,2,3,1,2,3,3,3,2,3,3,2,1,2,3,3,2,1,2]
BRK_STATUS = [1,1,1,1,1,1,1,1,1,0,1,1,1,0,1,1,1,1,1,1,1,1,1]
GEN_CAP = [1 60.84; 4 60; 8 60; 17 60; 22 150]
LOADS = [6 100;9 60;13 60;16 60;23 20; 18 30; 21 30] LOAD_PRIORITY = [6, 300; 9, 300; 13, 1; 16, 1; 23, 300; 18, 300; 21, 90]
shown in Fig. 3, the incidence vectors of the matrix EtoV are shown in Table III. The EtoV matrix is an 10x23 matrix corresponding to ten zones and twenty three breakers (S(ZoneI)). The positive sign represents the flow of power towards a zone and negative sign represents flow of power away from the zone.
Data required for simulation are obtained from microgrid topology and power flow and they are given in Table III. Definition of BRK_TYPE, BRK_STATUS, GEN_CAP, LOADS and LOAD_PRIORITY matrices are the same as mentioned for SPS. The LOAD_PRIORITY matrix of the modified CERTS is shown in Table IV. It can be inferred that there are three types of load in this microgrid.
TABLE IV LOAD PRIORITY FOR MODIFIED CERTS
Load Priority
Load 1 vital
Load 2 vital Load 3 Non-vital
Load 4 Non-vital Load 5 vital
Load 6 vital
Load 7 Semi-vital
III. SIMULATION RESULTS
A. SPS Reconfiguration In reconfiguration GA algorithms, population size was
taken as 50 and number of generation as 20 similar to [24]. Details of the results have not been presented here to avoid the duplication. Several test cases scenarios corresponding to different fault scenarios were also simulated and satisfactorily results were obtained.
B. CERTS Microgrid Reconfiguration Modified CERTS model [11] is used as test. Simulation for
validating the reconfiguration algorithm has been implemented on MATLAB. The GA reconfiguration algorithms have been tested on modified CERTS model. With GA approach, population size is taken as 50 and number of generation as 20.
In the Table V, reconfiguration results are shown for modified CERTS microgrid with objective of maximizing the load kW. For a particular fault bus, the negative bus formed is shown with the possible power paths and corresponding load shedding. Amount of load served in kW and the breaker reconfiguration showing open and close status are also given. In case 1, when the fault occured on bus 1, protection system isolates bus 1 from the rest of system, therefore microgrid was going to islanding operation mode. Bus 2 had negative power. Possible search paths to compensate the negative power balance at bus 2 were computed by GA reconfiguration algorithm. The only possible path found was B2-B3-B4-B5-B6-B7-B8-B9-B10. In this case, total of 300 kW load was served. Load 3 (L3) was shed because it has lowest priority compared to other loads and the remaining loads are restored along the path. Note that In case 2, two faults happened on bus
1 and bus 7 as the biggest generation bus in the islanding mode of microgrid. After fault isolation, bus 2 and bus 9 both have a power deficit.
TABLE V Reconfiguration for modified CERTS based on Load
Magnitude and Priority
Possible power supply paths is B2-B3-B4-B5-B6-B8-B9-
B10. Simulation of CERTS microgrid demonstrates good ability of proposed reconfiguration algorithm in microgrid.
IV. REAL-TIME CASE STUDY Real time implementaion of developed reconfiguration
algorithm was done using real-time digital simulator (RTDS) and dSPCAE-DS1104 R&D controller board. RTDS is a fully digital simulator which can perform simulations with a time step of 2 microseconds to 50 microseconds. The RTDS DOPTO card is used to interface up to 24 digital input and 24 digital output signals between the RTDS and external equipment. DS1104 R&D controller is single-board hardware that can run in PCs. This controller can work with MATLAB and SIMULINK. In the real-time scenario, status of circuit breakers is transferred between two I/O cards. Status of circuit breakers can be close or open. These six breakers are controlling loads in 8-BUS SPS. As shown in Figure 1, breakers number 2, 4, 6, 11, 13, and 15 are load breakers.
Fig. 5 shows the RTDS and dSpace connection in real-time implementation. RTDS was used for shipboard power system simulation, and dSPACE controller was used for reconfiguration algorithm.
Fig. 5. Configuration of equipments in real-time implementation.
Test case
FaultedBus
Number
Negative power bus
Possible power
supply path
Load Shedding
Breaker reconfiguration
kW Served
Case1 B1 B2 B2-B3-B4-B5-B6-B7-B8-B9-B10
L3 BK 13 (O) 300
Case2 B1, B7 B2 B9
B2-B3-B4-B5-B6-B8-
B9-B10
L3 L4 L5
BK 13,16 (O) 220
Case3 B1, B5 B2 B2-B3-B4- B6-B7-B8-
B9-B10
L2 L3 BK 9, 13 (O) 240
Steps of real-time implementation are as follow:
1- RTDS simulates shipboard power system and sends fault signal to dSPACE
2- dSPACE observes the fault signal a. if dSPACE detects fault, it will run the
reconfiguration algorithm b. if dSPACE does not detect fault, it will keep the
same status of breakers 3- dSPACE sends back the status of six load breakers to
RTDS.
RSCAD simulation model is shown in Fig. 6
Fig. 6. 8 bus SPS model in RSCAD
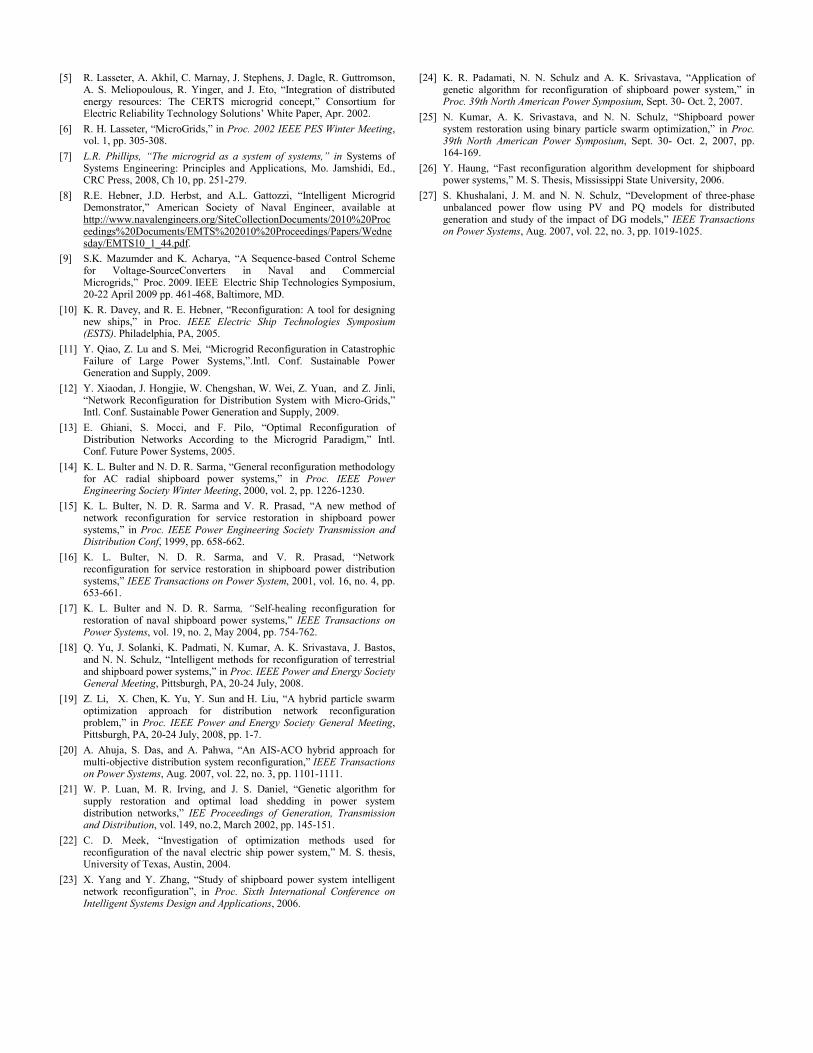
Only one example of fault test case 6 has been presented for
real time implementation. Figs. 7 and 8 presents the results of running GA reconfiguration algorithm on dSPACE controller All load breakers are close in normal operation condition, but after fault, only two breakers are close.
Fig. 7. Load breakers status on the normal condition (dSPACE side)
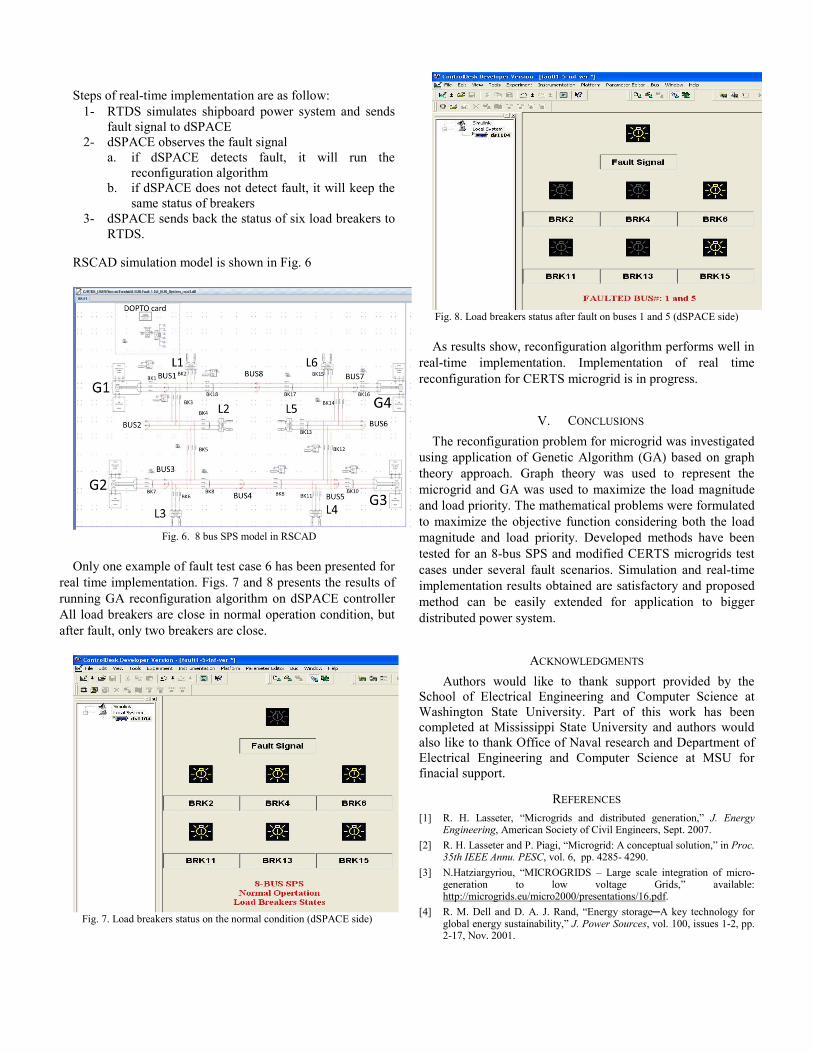
Fig. 8. Load breakers status after fault on buses 1 and 5 (dSPACE side)
As results show, reconfiguration algorithm performs well in
real-time implementation. Implementation of real time reconfiguration for CERTS microgrid is in progress.
V. CONCLUSIONS The reconfiguration problem for microgrid was investigated
using application of Genetic Algorithm (GA) based on graph theory approach. Graph theory was used to represent the microgrid and GA was used to maximize the load magnitude and load priority. The mathematical problems were formulated to maximize the objective function considering both the load magnitude and load priority. Developed methods have been tested for an 8-bus SPS and modified CERTS microgrids test cases under several fault scenarios. Simulation and real-time implementation results obtained are satisfactory and proposed method can be easily extended for application to bigger distributed power system.
ACKNOWLEDGMENTS Authors would like to thank support provided by the
School of Electrical Engineering and Computer Science at Washington State University. Part of this work has been completed at Mississippi State University and authors would also like to thank Office of Naval research and Department of Electrical Engineering and Computer Science at MSU for finacial support.
REFERENCES [1] R. H. Lasseter, “Microgrids and distributed generation,” J. Energy
Engineering, American Society of Civil Engineers, Sept. 2007. [2] R. H. Lasseter and P. Piagi, “Microgrid: A conceptual solution,” in Proc.
35th IEEE Annu. PESC, vol. 6, pp. 4285- 4290. [3] N.Hatziargyriou, “MICROGRIDS – Large scale integration of micro-
generation to low voltage Grids,” available: http://microgrids.eu/micro2000/presentations/16.pdf.
[4] R. M. Dell and D. A. J. Rand, “Energy storage─A key technology for global energy sustainability,” J. Power Sources, vol. 100, issues 1-2, pp. 2-17, Nov. 2001.
[5] R. Lasseter, A. Akhil, C. Marnay, J. Stephens, J. Dagle, R. Guttromson, A. S. Meliopoulous, R. Yinger, and J. Eto, “Integration of distributed energy resources: The CERTS microgrid concept,” Consortium for Electric Reliability Technology Solutions’ White Paper, Apr. 2002.
[6] R. H. Lasseter, “MicroGrids,” in Proc. 2002 IEEE PES Winter Meeting, vol. 1, pp. 305-308.
[7] L.R. Phillips, “The microgrid as a system of systems,” in Systems of Systems Engineering: Principles and Applications, Mo. Jamshidi, Ed., CRC Press, 2008, Ch 10, pp. 251-279.
[8] R.E. Hebner, J.D. Herbst, and A.L. Gattozzi, “Intelligent Microgrid Demonstrator,” American Society of Naval Engineer, available at http://www.navalengineers.org/SiteCollectionDocuments/2010%20Proceedings%20Documents/EMTS%202010%20Proceedings/Papers/Wednesday/EMTS10_1_44.pdf.
[9] S.K. Mazumder and K. Acharya, “A Sequence-based Control Scheme for Voltage-SourceConverters in Naval and Commercial Microgrids,” Proc. 2009. IEEE Electric Ship Technologies Symposium, 20-22 April 2009 pp. 461-468, Baltimore, MD.
[10] K. R. Davey, and R. E. Hebner, “Reconfiguration: A tool for designing new ships,” in Proc. IEEE Electric Ship Technologies Symposium (ESTS). Philadelphia, PA, 2005.
[11] Y. Qiao, Z. Lu and S. Mei, “Microgrid Reconfiguration in Catastrophic Failure of Large Power Systems,”.Intl. Conf. Sustainable Power Generation and Supply, 2009.
[12] Y. Xiaodan, J. Hongjie, W. Chengshan, W. Wei, Z. Yuan, and Z. Jinli, “Network Reconfiguration for Distribution System with Micro-Grids,” Intl. Conf. Sustainable Power Generation and Supply, 2009.
[13] E. Ghiani, S. Mocci, and F. Pilo, “Optimal Reconfiguration of Distribution Networks According to the Microgrid Paradigm,” Intl. Conf. Future Power Systems, 2005.
[14] K. L. Bulter and N. D. R. Sarma, “General reconfiguration methodology for AC radial shipboard power systems,” in Proc. IEEE Power Engineering Society Winter Meeting, 2000, vol. 2, pp. 1226-1230.
[15] K. L. Bulter, N. D. R. Sarma and V. R. Prasad, “A new method of network reconfiguration for service restoration in shipboard power systems,” in Proc. IEEE Power Engineering Society Transmission and Distribution Conf, 1999, pp. 658-662.
[16] K. L. Bulter, N. D. R. Sarma, and V. R. Prasad, “Network reconfiguration for service restoration in shipboard power distribution systems,” IEEE Transactions on Power System, 2001, vol. 16, no. 4, pp. 653-661.
[17] K. L. Bulter and N. D. R. Sarma, “Self-healing reconfiguration for restoration of naval shipboard power systems,” IEEE Transactions on Power Systems, vol. 19, no. 2, May 2004, pp. 754-762.
[18] Q. Yu, J. Solanki, K. Padmati, N. Kumar, A. K. Srivastava, J. Bastos, and N. N. Schulz, “Intelligent methods for reconfiguration of terrestrial and shipboard power systems,” in Proc. IEEE Power and Energy Society General Meeting, Pittsburgh, PA, 20-24 July, 2008.
[19] Z. Li, X. Chen, K. Yu, Y. Sun and H. Liu, “A hybrid particle swarm optimization approach for distribution network reconfiguration problem,” in Proc. IEEE Power and Energy Society General Meeting, Pittsburgh, PA, 20-24 July, 2008, pp. 1-7.
[20] A. Ahuja, S. Das, and A. Pahwa, “An AIS-ACO hybrid approach for multi-objective distribution system reconfiguration,” IEEE Transactions on Power Systems, Aug. 2007, vol. 22, no. 3, pp. 1101-1111.
[21] W. P. Luan, M. R. Irving, and J. S. Daniel, “Genetic algorithm for supply restoration and optimal load shedding in power system distribution networks,” IEE Proceedings of Generation, Transmission and Distribution, vol. 149, no.2, March 2002, pp. 145-151.
[22] C. D. Meek, “Investigation of optimization methods used for reconfiguration of the naval electric ship power system,” M. S. thesis, University of Texas, Austin, 2004.
[23] X. Yang and Y. Zhang, “Study of shipboard power system intelligent network reconfiguration”, in Proc. Sixth International Conference on Intelligent Systems Design and Applications, 2006.
[24] K. R. Padamati, N. N. Schulz and A. K. Srivastava, “Application of genetic algorithm for reconfiguration of shipboard power system,” in Proc. 39th North American Power Symposium, Sept. 30- Oct. 2, 2007.
[25] N. Kumar, A. K. Srivastava, and N. N. Schulz, “Shipboard power system restoration using binary particle swarm optimization,” in Proc. 39th North American Power Symposium, Sept. 30- Oct. 2, 2007, pp. 164-169.
[26] Y. Haung, “Fast reconfiguration algorithm development for shipboard power systems,” M. S. Thesis, Mississippi State University, 2006.
[27] S. Khushalani, J. M. and N. N. Schulz, “Development of three-phase unbalanced power flow using PV and PQ models for distributed generation and study of the impact of DG models,” IEEE Transactions on Power Systems, Aug. 2007, vol. 22, no. 3, pp. 1019-1025.
Copyright © 2022 FDOKUMEN