Design of Microgrid Protection Schemes Using PSCAD ... - MDPI
19
energies Article Design of Microgrid Protection Schemes Using PSCAD/EMTDC and ETAP Programs Hyun Shin 1 , Sang Heon Chae 2 and Eel-Hwan Kim 3, * 1 Faculty of Applied Energy System, Jeju National University, Jeju 63243, Korea; [email protected] 2 Electric Energy Research Center, Jeju National University, Jeju 63243, Korea; [email protected] 3 Department of Electrical Engineering, Jeju National University, Jeju 63243, Korea * Correspondence: [email protected]; Tel.: +82-64-756-3678 Received: 6 October 2020; Accepted: 2 November 2020; Published: 4 November 2020 Abstract: Steady-state, harmonics, and transient analysis of a power system by using a detailed simulation model is essential to microgrid operation before the installation of new power facilities, because the microgrid, which is a small-scale independent power grid consisting of distributed resources and an energy storage system, has no choice but to include many inverters consisting of switching devices. Accordingly, in the case of an accident in a microgrid system, various power system simulation tools must be used to calculate the fault current for grid protection components. Specifically, Modelling using Power System Computer Aided Design (PSCAD)/Electro-Magnetic Transient Design and Control (EMTDC) can perform detailed modeling of switching devices into each inverter, and Electrical Transient Analyzer Program (ETAP) can design protection relays. From this perspective, this study designed whole protection components in a microgrid system, including the capacity of switching devices for fault ride through a protective relay and the capacity of the circuit breaker. The parameters of an actual microgrid on the San Cristobal Island, Galapagos, were used to make a detailed simulation model in both PSCAD/EMTDC and ETAP. The capacities of the switching devices were estimated by using PSCAD/EMTDC. Additionally, the rated breaking capacities and the setting values of the protective relay were also calculated from the result of an ETAP simulation. Keywords: ETAP; fault current analysis; microgrid; protection system; PSCAD/EMTDC 1. Introduction According to advanced research, computer modeling and power system analysis are very important for the stable operation and management of power systems [1]. Specifically, before connecting a new power facility to a sensitive power system such as a microgrid, detailed analysis using computer simulation must be performed to check normal operation, transient state, harmonics, and dynamic characteristics. As the microgrid is a small-scale independent power grid, which consists of renewable energy sources, such as solar or wind power, with an energy storage system (ESS), a detailed power system analysis should be completed [2,3]. Several inspiring papers, such as ”Fault analysis of 380V DC-microgrid” and ”An inverter-only supplied microgrid analysis,” have analyzed various results on microgrids using power system simulation tools [4–9]. However, there are no papers that design whole protection components of the microgrid using the Power System Computer Aided Design (PSCAD)/Electro-Magnetic Transient Design and Control (EMTDC) and Electrical Transient Analyzer Program (ETAP) programs. In addition, in the event of an accident on the microgrid, the calculation of the fault current requires the use of various simulation tools to improve accuracy. Currently, PSCAD/EMTDC is specialized in various types of AC and DC power facilities, namely PCS simulation studies, including power electronics, subsynchronous resonance, and lightning overvoltage [10–13]. Thus, detailed modeling of the inverter switching device and the conventional Energies 2020, 13, 5784; doi:10.3390/en13215784 www.mdpi.com/journal/energies
-
Upload
khangminh22 -
Category
Documents
-
view
0 -
download
0
Transcript of Design of Microgrid Protection Schemes Using PSCAD ... - MDPI
energies
Article
Design of Microgrid Protection Schemes UsingPSCAD/EMTDC and ETAP Programs
Hyun Shin 1, Sang Heon Chae 2 and Eel-Hwan Kim 3,*1 Faculty of Applied Energy System, Jeju National University, Jeju 63243, Korea; [email protected] Electric Energy Research Center, Jeju National University, Jeju 63243, Korea; [email protected] Department of Electrical Engineering, Jeju National University, Jeju 63243, Korea* Correspondence: [email protected]; Tel.: +82-64-756-3678
Received: 6 October 2020; Accepted: 2 November 2020; Published: 4 November 2020�����������������
Abstract: Steady-state, harmonics, and transient analysis of a power system by using a detailedsimulation model is essential to microgrid operation before the installation of new power facilities,because the microgrid, which is a small-scale independent power grid consisting of distributedresources and an energy storage system, has no choice but to include many inverters consisting ofswitching devices. Accordingly, in the case of an accident in a microgrid system, various powersystem simulation tools must be used to calculate the fault current for grid protection components.Specifically, Modelling using Power System Computer Aided Design (PSCAD)/Electro-MagneticTransient Design and Control (EMTDC) can perform detailed modeling of switching devices into eachinverter, and Electrical Transient Analyzer Program (ETAP) can design protection relays. From thisperspective, this study designed whole protection components in a microgrid system, including thecapacity of switching devices for fault ride through a protective relay and the capacity of the circuitbreaker. The parameters of an actual microgrid on the San Cristobal Island, Galapagos, were used tomake a detailed simulation model in both PSCAD/EMTDC and ETAP. The capacities of the switchingdevices were estimated by using PSCAD/EMTDC. Additionally, the rated breaking capacities and thesetting values of the protective relay were also calculated from the result of an ETAP simulation.
Keywords: ETAP; fault current analysis; microgrid; protection system; PSCAD/EMTDC
1. Introduction
According to advanced research, computer modeling and power system analysis are very importantfor the stable operation and management of power systems [1]. Specifically, before connecting a newpower facility to a sensitive power system such as a microgrid, detailed analysis using computersimulation must be performed to check normal operation, transient state, harmonics, and dynamiccharacteristics. As the microgrid is a small-scale independent power grid, which consists of renewableenergy sources, such as solar or wind power, with an energy storage system (ESS), a detailed powersystem analysis should be completed [2,3]. Several inspiring papers, such as ”Fault analysis of380V DC-microgrid” and ”An inverter-only supplied microgrid analysis,” have analyzed variousresults on microgrids using power system simulation tools [4–9]. However, there are no papersthat design whole protection components of the microgrid using the Power System ComputerAided Design (PSCAD)/Electro-Magnetic Transient Design and Control (EMTDC) and ElectricalTransient Analyzer Program (ETAP) programs. In addition, in the event of an accident on themicrogrid, the calculation of the fault current requires the use of various simulation tools to improveaccuracy. Currently, PSCAD/EMTDC is specialized in various types of AC and DC power facilities,namely PCS simulation studies, including power electronics, subsynchronous resonance, and lightningovervoltage [10–13]. Thus, detailed modeling of the inverter switching device and the conventional
Energies 2020, 13, 5784; doi:10.3390/en13215784 www.mdpi.com/journal/energies

Energies 2020, 13, 5784 2 of 19
power system can be performed. ETAP is useful to calculate the fault current, design a protectionsystem, and analyze power system stability [14–17]. With ETAP, unlike PSCAD/EMTDC, it is notpossible to model the inverter’s switching device in detail, but the advantages of simple modeling ofthe power system, the result of the accident current calculation, and setting the protective relay in theevent of a system accident can be derived within a short time.
This study proposed to design a method of whole protection components in a microgrid system byusing various power system simulation programs. First, the simulation models of the microgrid weremade using the PSCAD/EMTDC and ETAP programs. In this study, the PSCAD/EMTDC simulationmodel was focused on inverter facilities, including the topology, filter, and even the controller. The ETAPmodel was created by using its well-made libraries. Second, the ground and short-circuit fault currentvalues were calculated. Then, the calculation results were compared with each program to improve theaccuracy and reliability of the simulation models. Third, the circuit breaker capacities were decided bythe worst fault current flowing into the bus at each distributed resources-side, calculated through theETAP program. Fourth, the capacities of the switching devices in the inverter system were estimatedto consider the self-protection sequence and the capable low voltage ride through (LVRT) operationthrough the PSCAD/EMTDC simulation result in which the maximum fault current flows to theinsulated gate bipolar transistors (IGBTs) [18–22]. Finally, the setting values of the protective relayswere corrected in consequence of the ETAP simulation results. To verify the effectiveness of theproposed method, the parameters for San Cristobal Island, Galapagos, where the actual average loadis about 1.8 MW, were applied to each simulation tool. The example microgrid was installed withdistributed resources, including 6.39 MW diesel generators, a 2.095 MWh ESS, 1 MW photovoltaics(PVs), and three 0.8 MW wind turbines. The simulation analysis scenarios assumed that the faultoccurred at the zero-crossing point of phase A in normal conditions. This is shown as a single linediagram in Figure 1. The power system of this study operates only two 1.67 MW diesel generatorsaccording to the load size, PV generates 1 MW output, and ESS controls PV output fluctuations [23].In addition, the wind turbine (WT) was operated at only two 800 kW to prevent light-load operation ofdiesel generators.
Figure 1. Overview of San Cristobal Island power system.
2. Protection Theory
There are many studies on how to protect microgrids [24,25]. In this paper, we focused on twoitems necessary for microgrid protection. The first is the LVRT control of the inverter. It is a method toprevent drop from the power system by supplying reactive power in consideration of the accidenttime and voltage reduction rate when low voltage of the system occurs. Therefore, the capacity of the
Energies 2020, 13, 5784 3 of 19
inverter’s IGBT must be designed in accordance with the LVRT condition. Second, the short-circuitcurrent calculation needs to be considered. In the event of an accident in the power system, not onlythe inverter, but also the circuit breaker and protection relay must be managed. Accordingly, it ispossible to quickly prevent the spread of an accident by the proper breaker capacity and the set valueof the protection relay through accurate short-circuit current calculation.
2.1. LVRT Control Method
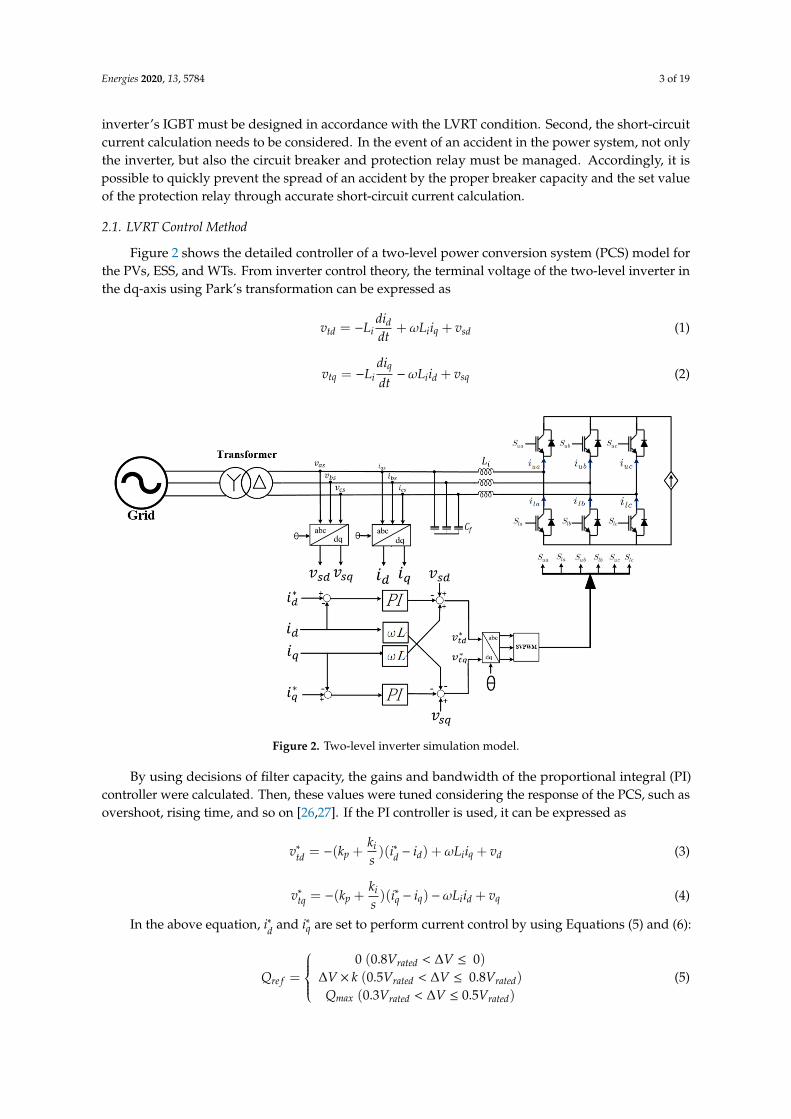
Figure 2 shows the detailed controller of a two-level power conversion system (PCS) model forthe PVs, ESS, and WTs. From inverter control theory, the terminal voltage of the two-level inverter inthe dq-axis using Park’s transformation can be expressed as
vtd = −Lididdt
+ωLiiq + vsd (1)
vtq = −Lidiqdt−ωLiid + vsq (2)
Figure 2. Two-level inverter simulation model.
By using decisions of filter capacity, the gains and bandwidth of the proportional integral (PI)controller were calculated. Then, these values were tuned considering the response of the PCS, such asovershoot, rising time, and so on [26,27]. If the PI controller is used, it can be expressed as
v∗td = −(kp +kis)(i∗d − id) +ωLiiq + vd (3)
v∗tq = −(kp +kis)(i∗q − iq) −ωLiid + vq (4)
In the above equation, i∗d and i∗q are set to perform current control by using Equations (5) and (6):
Qre f =
0 (0.8Vrated < ∆V ≤ 0)
∆V × k (0.5Vrated < ∆V ≤ 0.8Vrated)
Qmax (0.3Vrated < ∆V ≤ 0.5Vrated)
(5)
Energies 2020, 13, 5784 4 of 19
i∗d = Qre f /32
vq (6)
i∗q = Pre f /32
vq (7)
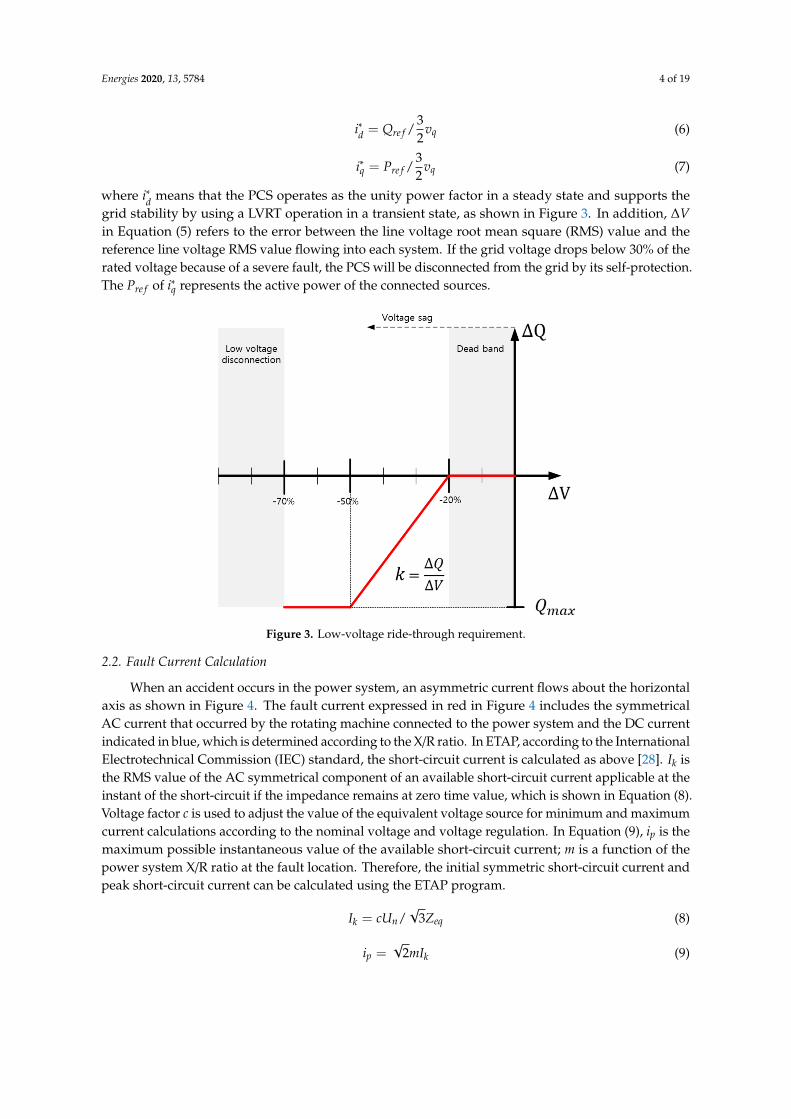
where i∗d means that the PCS operates as the unity power factor in a steady state and supports thegrid stability by using a LVRT operation in a transient state, as shown in Figure 3. In addition, ∆Vin Equation (5) refers to the error between the line voltage root mean square (RMS) value and thereference line voltage RMS value flowing into each system. If the grid voltage drops below 30% of therated voltage because of a severe fault, the PCS will be disconnected from the grid by its self-protection.The Pre f of i∗q represents the active power of the connected sources.
Figure 3. Low-voltage ride-through requirement.
2.2. Fault Current Calculation
When an accident occurs in the power system, an asymmetric current flows about the horizontalaxis as shown in Figure 4. The fault current expressed in red in Figure 4 includes the symmetricalAC current that occurred by the rotating machine connected to the power system and the DC currentindicated in blue, which is determined according to the X/R ratio. In ETAP, according to the InternationalElectrotechnical Commission (IEC) standard, the short-circuit current is calculated as above [28]. Ik isthe RMS value of the AC symmetrical component of an available short-circuit current applicable at theinstant of the short-circuit if the impedance remains at zero time value, which is shown in Equation (8).Voltage factor c is used to adjust the value of the equivalent voltage source for minimum and maximumcurrent calculations according to the nominal voltage and voltage regulation. In Equation (9), ip is themaximum possible instantaneous value of the available short-circuit current; m is a function of thepower system X/R ratio at the fault location. Therefore, the initial symmetric short-circuit current andpeak short-circuit current can be calculated using the ETAP program.
Ik = cUn/√
3Zeq (8)
ip =√
2mIk (9)

Energies 2020, 13, 5784 5 of 19
Figure 4. The form of fault current.
3. Power System Modeling of a Microgrid
The example power system model of Galapagos’ San Cristobal Island was made by using thePSCAD/EMTDC and ETAP programs. The distributed resources of the island consist of a 6.39 MWdiesel power plant, 1 MW PV, a 2.095 MWh ESS, and a 2.4 MW wind power plant. In addition, the inputparameters in each program were set to match the actual values.
3.1. Power System Modeling Using PSCAD/EMTDC
Figure 5 represents the overall PSCAD/EMTDC model of the island. All of the distributedresources, including the diesel generators, PV, ESS, and wind farm, are connected to the same bus inthe substation. In addition, there are three load buses, which are linked to the urban area with twolines and the rural area with one line. The real line parameters of the overhead lines and undergroundcables are used for the simulation model. The 1.8 MW averaged power loads are modeled as a variableload with the actual load data applied.
Figure 5. Overall simulation model in PSCAD/EMTDC.
Energies 2020, 13, 5784 6 of 19
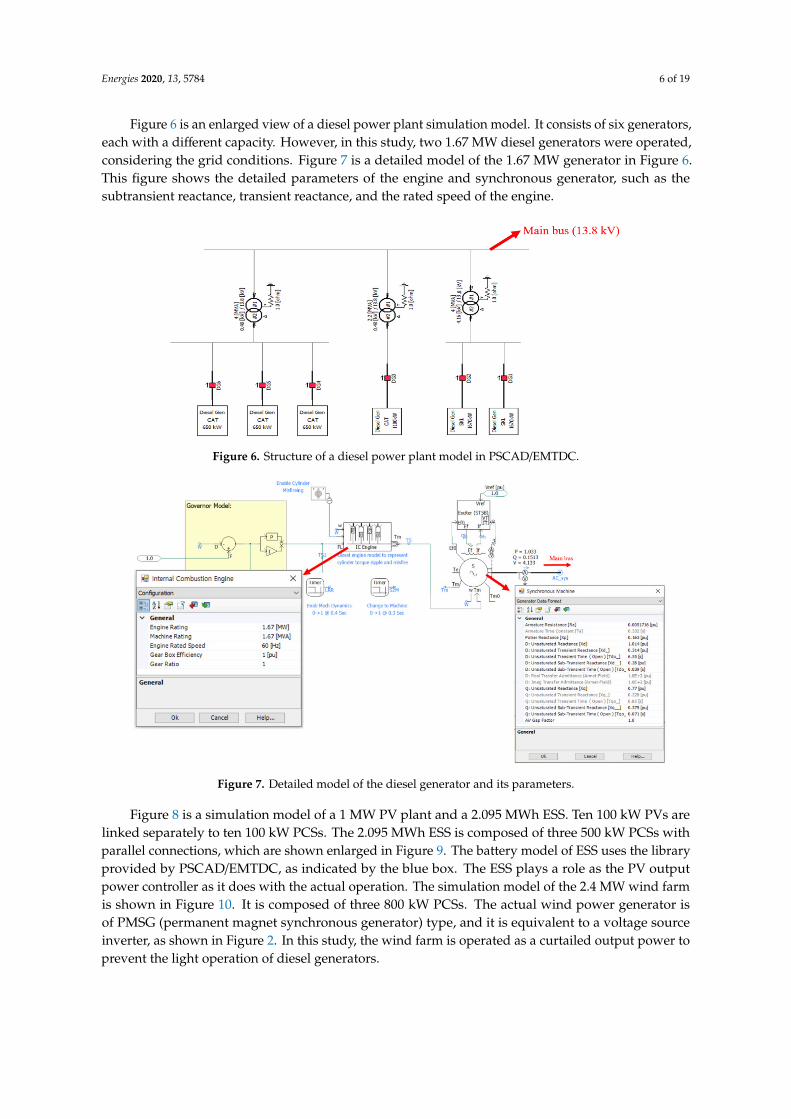
Figure 6 is an enlarged view of a diesel power plant simulation model. It consists of six generators,each with a different capacity. However, in this study, two 1.67 MW diesel generators were operated,considering the grid conditions. Figure 7 is a detailed model of the 1.67 MW generator in Figure 6.This figure shows the detailed parameters of the engine and synchronous generator, such as thesubtransient reactance, transient reactance, and the rated speed of the engine.
Figure 6. Structure of a diesel power plant model in PSCAD/EMTDC.
Figure 7. Detailed model of the diesel generator and its parameters.
Figure 8 is a simulation model of a 1 MW PV plant and a 2.095 MWh ESS. Ten 100 kW PVs arelinked separately to ten 100 kW PCSs. The 2.095 MWh ESS is composed of three 500 kW PCSs withparallel connections, which are shown enlarged in Figure 9. The battery model of ESS uses the libraryprovided by PSCAD/EMTDC, as indicated by the blue box. The ESS plays a role as the PV outputpower controller as it does with the actual operation. The simulation model of the 2.4 MW wind farmis shown in Figure 10. It is composed of three 800 kW PCSs. The actual wind power generator isof PMSG (permanent magnet synchronous generator) type, and it is equivalent to a voltage sourceinverter, as shown in Figure 2. In this study, the wind farm is operated as a curtailed output power toprevent the light operation of diesel generators.

Energies 2020, 13, 5784 7 of 19
Figure 8. Photovoltaic (PV) plant and energy storage system (ESS) simulation models inPSCAD/EMTDC.
Figure 9. ESS model and battery model parameters in PSCAD/EMTDC.
Figure 10. Wind farm simulation model in PSCAD/EMTDC.

Energies 2020, 13, 5784 8 of 19
In this paper, we assume the worst situation considering the light load operation of the dieselgenerator. Therefore, for the situation of 2.7 MW of power load, the output of the 1.6 MW diesel generatoris operated at the output of 30%, which is the limit of light load operation. Accordingly, the dieselgenerator is operated at 0.7 MW, output power of the PV inverter is 1 MW, and output power of theWT inverter is 1 MW. In the case of ESS, because the PV maintains its rating, it already regulates theoutput fluctuation of PV. Table 1 represents the detailed parameters for the PCS controllers.
Table 1. Detailed parameters for the power conversion systems (PCSs).
Items Values
Common parametersGrid frequency 60 Hz
Primary side transformer voltage 13.8 kV
PV
Secondary side transformer voltage 0.38 kVRated converter capacity 100 kW
Filter inductance 0.89 mHFilter capacitance 90 uF
Switching frequency 5000 HzController bandwidth
DC link voltage2000 rad/s
0.8 kV
ESS
Secondary side transformer voltage 0.38 kVRated converter capacity 500 kW
Filter inductance 0.36 mHFilter capacitance 459 uF
Switching frequency 2500 HzController bandwidth
DC link voltage1000 rad/s
0.8 kV
Wind turbine
Secondary side transformer voltage 0.44 kVRated converter capacity 800 kW
Filter inductance 0.22 mHFilter capacitance 734 uF
Switching frequency 2500 HzController bandwidth
DC link voltage1000 rad/s
1 kV
3.2. Power System Modeling Using ETAP
Figure 11 shows the modeling results using the ETAP program. The capacity of the distributedpower source is modeled in the same way as with PSCAD/EMTDC. Unlike PSCAD/EMTDC,the equivalent line is set to a calculated line parameter that is based on the actual line length.In addition, it is modeled using breakers and relays provided by ETAP, as shown in the blue box,to derive the set values of the breakers and protective relays.
In ETAP, detailed generator parameters can be set, as shown in Figure 12. The generator’s ratedvalue, impedance, and dynamic model are set to match the actual parameters.
Figure 13 is a simulation model of the ESS. Three 500 kW PCSs are connected in parallel, and thedetailed parameters are shown on the right side of the figure. In addition, 34 batteries in one rack,each with a capacity of 68.476 kWh, are connected, resulting in a total capacity of 2.095 MWh.
The detailed parameters and structure of the 100 kW PCSs are the same as the setting values onthe right side of Figure 14.
Figure 15 shows the result of modeling a wind farm composed of three 800 kW units. The ratedvalue of the wind power generator can be set through the parameters on the left side of Figure 16,and the cut-in speed, cut-out speed, power coefficient, etc., of the wind power generator were designedaccording to the characteristics of the actual wind power generator.

Energies 2020, 13, 5784 9 of 19
Figure 11. Overall simulation model in ETAP.
Figure 12. The 1.67 MW diesel generator parameters in ETAP.
Figure 13. ESS simulation model.

Energies 2020, 13, 5784 10 of 19
Figure 14. PV simulation model.
Figure 15. Wind farm simulation model.
Figure 16. The 800 kW wind turbine generator parameters.

Energies 2020, 13, 5784 11 of 19
4. Simulation Results
4.1. Scenario 1—Ground Fault Accident of Main Power Plant Bus (13.8 kV)
4.1.1. Using PSCAD/EMTDC
In order to confirm the result of the system accident through PSCAD/EMTDC, it is assumed that asingle line ground fault occurred in about 5 s. Figure 17a shows the three-phase instantaneous voltageof the main bus and Figure 17b represents the three-phase instantaneous current of the main bus. It canbe seen that the voltage of phase A becomes 0 V through the instantaneous three-phase voltage inFigure 17a. The maximum value of the ground fault current is about 2.5 kA.
Figure 17. Simulation results of scenario 1: (a) instantaneous three-phase voltage of main bus and (b)instantaneous three-phase current of main bus.
Figure 18a shows the active and reactive power values of a 1 MW PV plant. In the case of anaccident, the active power value at the top of the figure is controlled to 0 MW and the reactive powervalue is about 0.2 MVAr, depending on the LVRT. In addition, Figure 18b shows the current values ofthe upper IGBT and the lower IGBT of the inverter, and it can be confirmed that a maximum current of0.65 kA occurs. The ESS PCS and wind farm’s PCS shown in Figures 19 and 20 also perform active andreactive power control in the same way as the PV PCS, and a current of up to about 0.7 kA flows intothe IGBT devices of the 500 kW PCS for the ESS. Figure 20b shows that up to about 2.5 kA flows into theIGBT devices of the 800 kW PCS for the wind turbines. The effective power shown in Figures 18a, 19aand 20a is designed to be controlled by 0 MW in the event of an accident, but not controlled by 0 MWin a short period of time due to a transient state, and this energy is consumed by DC choppers [29,30].
Figure 18. Simulation results of scenario 1: (a) 1 MW PV plant (top: active power; bottom: reactivepower) and (b) 100 kW PCS (top: current of upper insulated gate bipolar transistor (IGBT); bottom:current of lower IGBT).

Energies 2020, 13, 5784 12 of 19
Figure 19. Simulation results of scenario 1: (a) 1.5 MW PCS of ESS (top: active power; bottom: reactivepower) and (b) 500 kW PCS (top: upper current of IGBT; bottom: lower current of IGBT).
Figure 20. Simulation results of scenario 1: (a) 2.4 MW PCS of wind farm (top: active power; bottom:reactive power) and (b) 800 kW PCS (top: upper current of IGBT; bottom: lower current of IGBT).
4.1.2. Using ETAP
Figure 21 shows the result of the analysis of the magnitude of the accident current in the event ofa ground fault in the power system through ETAP. The magnitude of the accident current flowing intothe distributed power and load can be known, but only the magnitude of the accident current of themain bus of the power plant is enlarged, compared with the result value of PSCAD/EMTDC. In ETAP,it can be confirmed that the accident current is 2.27 kA, which indicates that there is an error of about0.23 kA with PSCAD/EMTDC.
4.2. Scenario 2—Three-Phase Fault Accident of Main Power Plant Bus (13.8 kV)
4.2.1. Using PSCAD/EMTDC
In scenario 2, a three-phase short-circuit accident is assumed at about 5 s. Figure 22a shows thethree-phase instantaneous voltage of the main bus, and Figure 22b shows the three-phase instantaneouscurrent on the side of the main bus. It can be seen that a three-phase short-circuit accident occursbecause the voltage on the abc-phase when the accident occurs is 0 V. At this time, the maximum valueof the short-circuit current is about 1.8 kA.
Energies 2020, 13, 5784 13 of 19
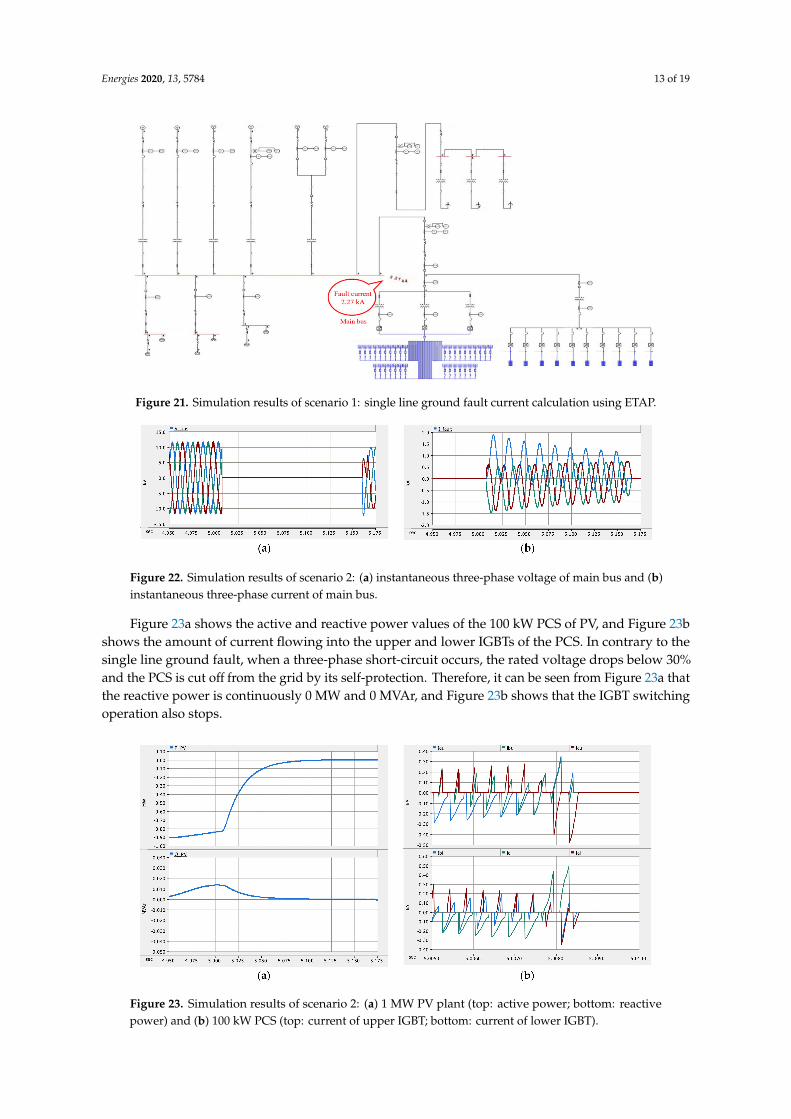
Figure 21. Simulation results of scenario 1: single line ground fault current calculation using ETAP.
Figure 22. Simulation results of scenario 2: (a) instantaneous three-phase voltage of main bus and (b)instantaneous three-phase current of main bus.
Figure 23a shows the active and reactive power values of the 100 kW PCS of PV, and Figure 23bshows the amount of current flowing into the upper and lower IGBTs of the PCS. In contrary to thesingle line ground fault, when a three-phase short-circuit occurs, the rated voltage drops below 30%and the PCS is cut off from the grid by its self-protection. Therefore, it can be seen from Figure 23a thatthe reactive power is continuously 0 MW and 0 MVAr, and Figure 23b shows that the IGBT switchingoperation also stops.
Figure 23. Simulation results of scenario 2: (a) 1 MW PV plant (top: active power; bottom: reactivepower) and (b) 100 kW PCS (top: current of upper IGBT; bottom: current of lower IGBT).

Energies 2020, 13, 5784 14 of 19
It can be seen from Figures 24 and 25 that the ESS’s PCS and the wind farm’s PCS also stop theactive and reactive power control and stop the IGBT switching operation in the same way as the PV’sPCS results above.
Figure 24. Simulation results of scenario 2: (a) 1.5 MW PCS of ESS (top: active power; bottom: reactivepower) and (b) 500 kW PCS (top: upper current of IGBT; bottom: lower current of IGBT).
Figure 25. Simulation results of scenario 2: (a) 2.4 MW PCS of wind farm (top: active power; bottom:reactive power) and (b) 800 kW PCS (top: upper current of IGBT; bottom: lower current of IGBT).
4.2.2. Using ETAP
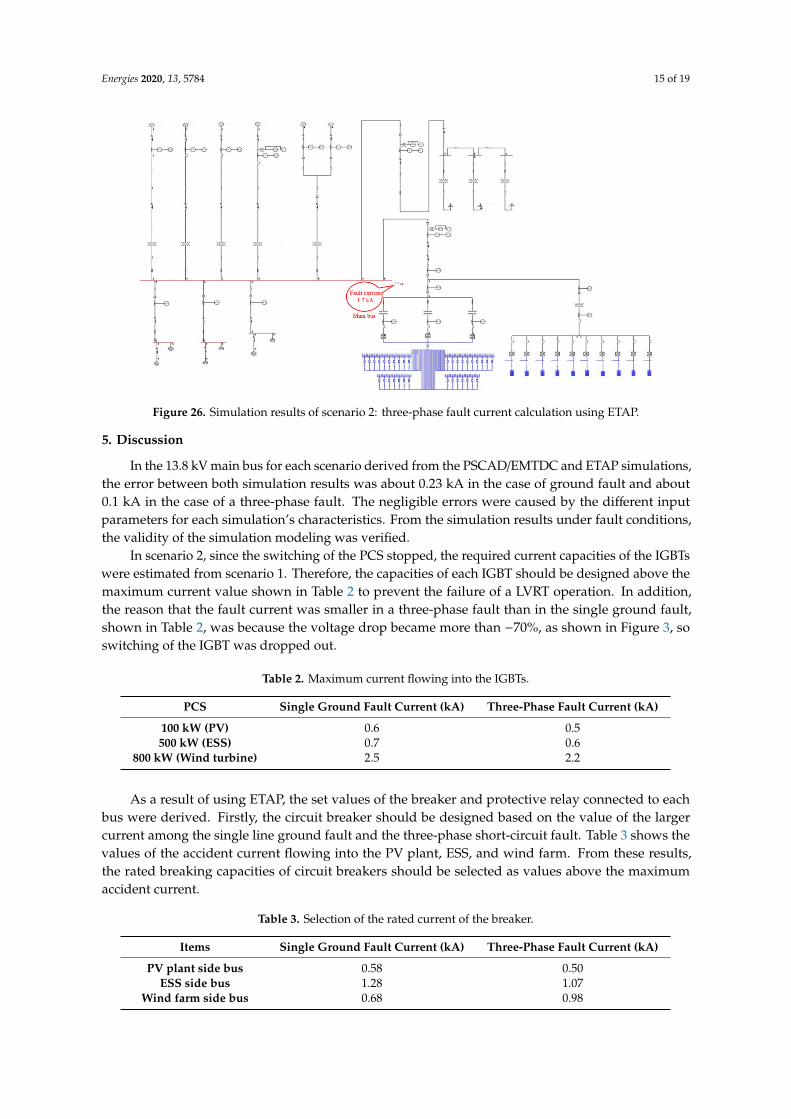
Figure 26 shows the analysis result indicating the magnitude of the accident current when athree-phase short-circuit accident occurs in the power system through ETAP. The magnitude of theaccident current of the main bus of the power plant is 1.7 kA, and it can be seen that there is an error ofabout 0.1 kA with PSCAD/EMTDC.
Energies 2020, 13, 5784 15 of 19
Figure 26. Simulation results of scenario 2: three-phase fault current calculation using ETAP.
5. Discussion
In the 13.8 kV main bus for each scenario derived from the PSCAD/EMTDC and ETAP simulations,the error between both simulation results was about 0.23 kA in the case of ground fault and about0.1 kA in the case of a three-phase fault. The negligible errors were caused by the different inputparameters for each simulation’s characteristics. From the simulation results under fault conditions,the validity of the simulation modeling was verified.
In scenario 2, since the switching of the PCS stopped, the required current capacities of the IGBTswere estimated from scenario 1. Therefore, the capacities of each IGBT should be designed above themaximum current value shown in Table 2 to prevent the failure of a LVRT operation. In addition,the reason that the fault current was smaller in a three-phase fault than in the single ground fault,shown in Table 2, was because the voltage drop became more than −70%, as shown in Figure 3, soswitching of the IGBT was dropped out.
Table 2. Maximum current flowing into the IGBTs.
PCS Single Ground Fault Current (kA) Three-Phase Fault Current (kA)
100 kW (PV) 0.6 0.5500 kW (ESS) 0.7 0.6
800 kW (Wind turbine) 2.5 2.2
As a result of using ETAP, the set values of the breaker and protective relay connected to eachbus were derived. Firstly, the circuit breaker should be designed based on the value of the largercurrent among the single line ground fault and the three-phase short-circuit fault. Table 3 shows thevalues of the accident current flowing into the PV plant, ESS, and wind farm. From these results,the rated breaking capacities of circuit breakers should be selected as values above the maximumaccident current.
Table 3. Selection of the rated current of the breaker.
Items Single Ground Fault Current (kA) Three-Phase Fault Current (kA)
PV plant side bus 0.58 0.50ESS side bus 1.28 1.07
Wind farm side bus 0.68 0.98
Energies 2020, 13, 5784 16 of 19
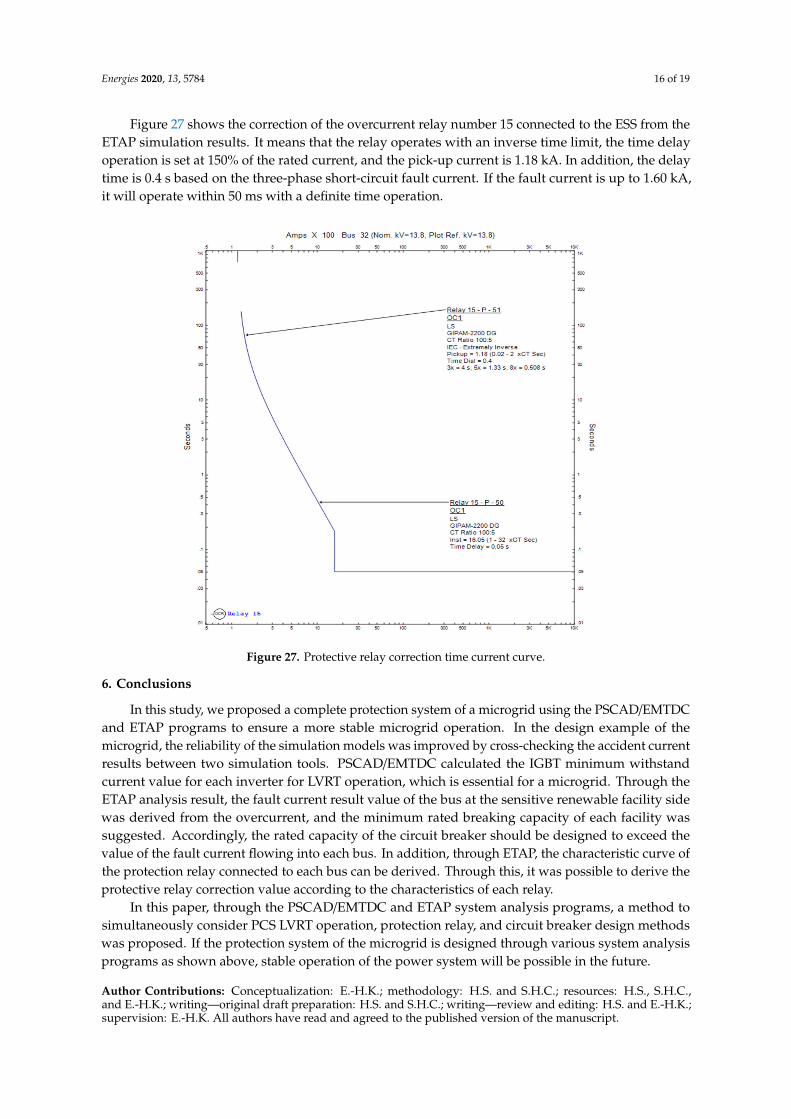
Figure 27 shows the correction of the overcurrent relay number 15 connected to the ESS from theETAP simulation results. It means that the relay operates with an inverse time limit, the time delayoperation is set at 150% of the rated current, and the pick-up current is 1.18 kA. In addition, the delaytime is 0.4 s based on the three-phase short-circuit fault current. If the fault current is up to 1.60 kA,it will operate within 50 ms with a definite time operation.
Figure 27. Protective relay correction time current curve.
6. Conclusions
In this study, we proposed a complete protection system of a microgrid using the PSCAD/EMTDCand ETAP programs to ensure a more stable microgrid operation. In the design example of themicrogrid, the reliability of the simulation models was improved by cross-checking the accident currentresults between two simulation tools. PSCAD/EMTDC calculated the IGBT minimum withstandcurrent value for each inverter for LVRT operation, which is essential for a microgrid. Through theETAP analysis result, the fault current result value of the bus at the sensitive renewable facility sidewas derived from the overcurrent, and the minimum rated breaking capacity of each facility wassuggested. Accordingly, the rated capacity of the circuit breaker should be designed to exceed thevalue of the fault current flowing into each bus. In addition, through ETAP, the characteristic curve ofthe protection relay connected to each bus can be derived. Through this, it was possible to derive theprotective relay correction value according to the characteristics of each relay.
In this paper, through the PSCAD/EMTDC and ETAP system analysis programs, a method tosimultaneously consider PCS LVRT operation, protection relay, and circuit breaker design methodswas proposed. If the protection system of the microgrid is designed through various system analysisprograms as shown above, stable operation of the power system will be possible in the future.
Author Contributions: Conceptualization: E.-H.K.; methodology: H.S. and S.H.C.; resources: H.S., S.H.C.,and E.-H.K.; writing—original draft preparation: H.S. and S.H.C.; writing—review and editing: H.S. and E.-H.K.;supervision: E.-H.K. All authors have read and agreed to the published version of the manuscript.

Energies 2020, 13, 5784 17 of 19
Funding: This research was funded by Jeju National University and the Korea Institute of Energy TechnologyEvaluation and Planning (KETEP).
Acknowledgments: This research was supported by the 2019 scientific promotion program funded by JejuNational University and the Korea Institute of Energy Technology Evaluation and Planning (Project number:20194030202310).
Conflicts of Interest: The authors declare no conflict of interest.
Nomenclature
Vtd d-axis terminal voltageVtq q-axis terminal voltageVsd d-axis grid voltageVsq q-axis grid voltageid d-axis currentiq q-axis currentSux Upper arm IGBT ( x = Phase a, b, c)Slx Lower arm IGBT ( x = Phase a, b, c)iux Upper arm current ( x = Phase a, b, c)ilx Lower arm current ( x = Phase a, b, c)Li Filter inductancekp Proportional gainki Integral gainω Grid’s angular frequency∆V Voltage errorPre f Reference of active powerQre f Reference of reactive powerIk Initial symmetrical short-circuit currentUn Nominal voltageZeq Equivalent impedanceip Peak short-circuit currentIEC International Electrotechnical CommissionRMS Root mean squareAC Alternating currentDC Direct currentESS Energy storage systemPCS Power conversion systemLVRT Low voltage ride throughIGBT Insulated gate bipolar transistorPV PhotovoltaicWT Wind turbine
References
1. Hay, S.; Ferguson, A. A Review of Power System Modelling Platforms and Capabilities; IET Special InterestPublication for the Council for Science and Technology on, 2015. Available online: https://www.theiet.org/
media/1291/pnjv-3-15.pdf (accessed on 4 November 2020).2. Mohammadhassani, A.; Teymouri, A.; Mehrizi-Sani, A.; Tehrani, K. Performance Evaluation of an
Inverter-Based Microgrid under Cyberattacks. In Proceedings of the 2020 IEEE 15th International Conferenceof System of Systems Engineering (SoSE), Budapest, Hungary, 2–4 June 2020.
3. Kazerani, M.; Tehrani, K. Grid of Hybrid AC/DC Microgrids: A New Paradigm for Smart City of Tomorrow.In Proceedings of the 2020 IEEE 15th International Conference of System of Systems Engineering (SoSE),Budapest, Hungary, 2–4 June 2020.
4. Brucoli, M.; Green, T.C.; McDonald, J.D.F. Modelling and Analysis of Fault Behaviour of Inverter Microgridsto Aid Future Fault Detection. In Proceedings of the System of Systems Engineering, San Antonio, TX, USA,16–18 September 2007.

Energies 2020, 13, 5784 18 of 19
5. Niewind, J.; Hemdan, N.G.A.; Klosinski, C.; Kurrat, M.; Gerdinand, F.; Meisner, J.; Passon, S.PSCAD/EMTDC-based simulations for fault analysis and fault identification in 380V ring DC systems.In Proceedings of the 2017 IEEE Second International Conference on DC Microgrids, Nuremburg, Germany,27–29 June 2017.
6. Zhang, Z.; Xiang, M.; Liu, Y.; Zhou, M. PSCAD/EMTDC based SVPWM inverter simulation. In Proceedingsof the International Conference on Sustainable Power Generation and Supply, 2012., Hangzhou, China,8–9 September 2012.
7. Farrokhabadi, M.; Canizares, C.; Bhattacharya, K. A voltage-based frequency controller for inverter-basedsystems in microgrids. In Proceedings of the 2016 IEEE Power and Energy Society General Meeting,Boston, MA, USA, 17–21 July 2016.
8. Farkhani, J.S.; Zareein, M.; Soroushmehr, H.; Mortazavi, H. Coordination of Directional OvercurrentProtection Relay for Distribution Network with Embedded DG. In Proceedings of the 2019 5th Conferenceon Knowledge Based Engineering and Innovation, Tehran, Iran, 28 February–1 March 2019.
9. Pathan, M.; Shah, A. Co-ordination of protective relays for 16MW load system using ETAP. In Proceedingsof the 2017 International Conference on Energy, Communication, Data Analytics and Soft Computing,Chennai, India, 1–2 August 2017.
10. Freitas, W.; Morelato, A. Comparative Study between Power System Blockset and PSCAD / EMTDC forTransient Analysis of Custom Power Devices Based on Voltage Source Converter. In Proceedings of the 2003International Conference on Power Systems Transients, New Orleans, USA, 28 September–2 October 2003.
11. Awalin, L.J.; Tasnim, T.; Tien, T.L.; Suyono, H. Comparison study of fault location on distribution networkusing PSCAD and DIgSILENT power factory by using matching approaches. Indones. J. Electr. Eng.Comput. Sci. 2020, 17, 78–85. [CrossRef]
12. Yang, S.; Franklin, G.A. Switching transient overvoltage study simulation comparison using PSCAD/EMTDCand EMTP-RV. In Proceedings of the IEEE Southeastcon, Orlando, FL, USA, 15–18 March 2012.
13. Li, Y.; Meng, K.; Dong, Z.Y.; Zhang, W. Sliding Framework for Inverter-Based Microgrid Control. IEEE Trans.Power Syst. 2020, 35, 1657–1660. [CrossRef]
14. Sahoo, A.K. Protection of microgrid through coordinated directional over-current relays. In Proceedingsof the 2014 IEEE Global Humanitarian Technology Conference—South Asia Satellite, Trivandrum, India,26–27 September 2014.
15. Sharma, A.; Panigrahi, B.K. Phase Fault Protection Scheme for Reliable Operation of Microgrids. IEEE Trans.Ind. Appl. 2017, 54, 2646–2655. [CrossRef]
16. Kadukar, P.R.; Shete, P.S.; Gawande, S.P. Transient Analysis of Distributed Generation AC Microgridusing ETAP. In Proceedings of the 2018 International Conference on Current Trends towards ConvergingTechnologies, Coimbatore, India, 1–3 March 2018.
17. Dewadasa, M.; Ghosh, A.; Ledwich, G. Protection of microgrids using differential relays. In Proceedingsof the 2011 the Australasian Universities Power Engineering Conference, Brisbane, QLD, Australia,25–28 September 2011.
18. Lee, W.G.; Nguyen, T.T.; Yoo, H.J.; Kim, H.M. Low-Voltage Ride-Through Operation of Grid-ConnectedMicrogrid Using Consensus-Based Distributed Control. Energies 2018, 11, 2867. [CrossRef]
19. Shin, H.; Jung, H.S.; Sul, S.K. Low Voltage Ride through(LVRT) control strategy of grid-connected variablespeed Wind Turbine Generator System. In Proceedings of the 8th International Conference on PowerElectronics—ECCE Asia, Jeju, Korea, 30 May–3 June 2011.
20. Peng, X.; Wang, W. A new lvrt method applied on the integration of distributed wind power generation.In Proceedings of the 2012 China International Conference on Electricity Distribution, Shanghai, China,10–14 September 2012.
21. Micallef, A.; Staines, C.S. Voltage rise mitigation and low voltage ride through capabilities for grid-connectedlow voltage microgrids. In Proceedings of the 2017 19th European Conference on Power Electronics andApplications, Warsaw, Poland, 11–14 September 2017.
22. Georgious, R.; Garcia, J.; Sumner, M.; Saeed, S.; Garcia, P. Fault Ride-Through Power Electronic Topologiesfor Hybrid Energy Storage Systems. Energies 2020, 13, 257. [CrossRef]
23. Liu, W.; Gong, Y.; Geng, G.; Jiang, Q. Optimal control of PV ramp rate using multiple energy storage system.Refined ramp event characterisation for wind power ramp control using energy storage system. IET Renew.Power Gener. 2019, 13, 1731–1740. [CrossRef]
Energies 2020, 13, 5784 19 of 19
24. Senarathna, T.S.S.; Hemapala, K.T.M.U. Optimized Adaptive Overcurrent Protection Using HybridizedNature-Inspired Algorithm and Clustering in Microgrids. Energies 2020, 13, 3324. [CrossRef]
25. Baloch, S.; Jamali, S.Z.; Mehmood, K.K.; Bukhari, S.B.A.; Zaman, M.S.U.; Hussain, A.; Kim, C.Microgrid Protection Strategy Based on the Autocorrelation of Current Envelopes Using the Squaringand Low-Pass Filtering Method. Energies 2020, 13, 2350. [CrossRef]
26. Dogruer, T.; Tan, N. Design of PI Controller using Optimization Method in Fractional Order Control System.IFAC 2018, 51, 841–846. [CrossRef]
27. Yaniv, O.; Nagurka, M. Robust pi controller design satisfying sensitivity and uncertainty specifications.IEEE Trans. Autom. Control 2003, 48, 2069–2072. [CrossRef]
28. Operation Technology, Inc. ETAP 16 User Guide 2016; Operation Technology, Inc.: Irvine, CA, USA, 2016.29. Ntare, R.; Abbasy, N.H.; Youssef, K.H.M. Low Voltage Ride through Control Capability of a Large Grid
Connected PV System Combining DC Chopper and Current Limiting Techniques. J. Power Energy Eng. 2019,7, 62–79. [CrossRef]
30. Jin, Y.; Wu, D.; Ju, P.; Rehtanz, C.; Wu, F.; Pan, X. Modeling of Wind Speeds Inside a Wind Farm withApplication to Wind Farm Aggregate Modeling Considering LVRT Characteristic. IEEE Trans. Energy Convers.2020, 35, 508–519. [CrossRef]
Publisher’s Note: MDPI stays neutral with regard to jurisdictional claims in published maps and institutionalaffiliations.
© 2020 by the authors. Licensee MDPI, Basel, Switzerland. This article is an open accessarticle distributed under the terms and conditions of the Creative Commons Attribution(CC BY) license (http://creativecommons.org/licenses/by/4.0/).