Perceptual-based quality assessment of error protection schemes for wireless JPEG2000
38
QUALITY ASSESSMENT OF ERROR PROTECTION SCHEMES FOR WIRELESS JPEG2000 Muhammad Imran Iqbal and Hans-Jürgen Zepernick Blekinge Institute of Technology Research report No. 2010:04
Transcript of Perceptual-based quality assessment of error protection schemes for wireless JPEG2000
ISSN 1103-1581
ISRN BTH-RES–04/10–SE
Quality assessment of error Protection schemes for Wireless JPeG2000
Muhammad Imran Iqbal and Hans-Jürgen Zepernick
Copyright © 2010 by individual authors. All rights reserved.
Printed by Printfabriken, Karlskrona 2010.
Quality assessment of error Protection schemes for Wireless JPeG2000
Muhammad Imran Iqbal and Hans-Jürgen Zepernick
Blekinge Institute of TechnologyResearch report No. 2010:04
Quality Assessment of Error ProtectionSchemes for Wireless JPEG2000
Muhammad Imran Iqbal and Hans-Jurgen Zepernick
July 2010

Abstract
Wireless imaging services suffer large impairments due to the hostile na-ture of the wireless channel. Given the limited and expensive channel band-width and the high data demanding nature of these services, it becomesa challenging task to provide high quality of service in such error pronechannels. Clearly, suitable error protection is necessary in order to main-tain sufficient quality of these services under various channel conditions. Inthis report, therefore, we have investigated different channel error protectionschemes for a wide range of channel conditions and coding rates. Two un-equal error protection (UEP) schemes have been examined for JPEG2000images exploiting useful features of the JPEG2000 codestream and using theerror protection tool set provided by wireless JPEG2000 (JPWL). Takingthe importance of the initial codestream packets on the reconstruction of theimage at the receiver into account, the first scheme uses all the additionalbandwidth resources in protecting the initial packets of the codestream. Therest of the packets, which are of relatively low importance, are transmittedwithout any parity symbols assigned to them. In the second UEP scheme,the initial parts of the codestream are strongly protected by assigning theman increased amount of parity symbols. In addition, the tail packets of thecodestream are also protected but using a weaker error control code comparedto the initial packets.
The performance of the proposed UEP schemes has been investigated interms of the peak signal-to-noise ratio as a typical fidelity metric and threeperceptual quality metrics, namely, the Lp-norm, the structural similarityindex, and the visual information fidelity criterion. Numerical results of theproposed UEP schemes have been compared with conventional equal errorprotection (EEP) over additive white Gaussian noise (AWGN) channel aswell as Rayleigh fading channel in the presence of AWGN. The results revealthe superior performance of the suggested UEP schemes compared to EEPover a range of channel signal-to-noise ratios and code rates.


Contents
1 Introduction 3
2 Wireless JPEG2000 62.1 JPWL System Description . . . . . . . . . . . . . . . . . . . . 62.2 JPWL Marker Segments . . . . . . . . . . . . . . . . . . . . . 8
3 Image Quality Assessment 103.1 Fidelity Metrics . . . . . . . . . . . . . . . . . . . . . . . . . . 10
3.1.1 Mean Squared Error . . . . . . . . . . . . . . . . . . . 103.1.2 Peak Signal-to-noise Ratio . . . . . . . . . . . . . . . . 11
3.2 Perceptual Quality Metrics . . . . . . . . . . . . . . . . . . . . 113.2.1 Perceptual Relevance Weighted Lp-norm . . . . . . . . 113.2.2 Structural Similarity Index . . . . . . . . . . . . . . . . 123.2.3 Visual Information Fidelity Criterion . . . . . . . . . . 12
4 Error Protection for Wireless JPEG2000 144.1 Equal Error Protection . . . . . . . . . . . . . . . . . . . . . . 164.2 Unequal Error Protection - Strategy 1 . . . . . . . . . . . . . 164.3 Unequal Error Protection - Strategy 2 . . . . . . . . . . . . . 17
5 Results and Discussions 185.1 Performance Comparison for Additive
White Gaussian Noise Channel . . . . . . . . . . . . . . . . . 195.2 Performance Comparison for Fading
Channel . . . . . . . . . . . . . . . . . . . . . . . . . . . . . . 20
6 Conclusions 30
1

Chapter 1
Introduction
With the advent of third generation mobile radio networks, there has beena growing interest in multimedia services such as imaging along with strin-gent demands on quality of service (QoS). This type of services is usuallysource encoded to conserve bandwidth but at the cost of rendering the com-pressed signals highly susceptible to transmission errors. As such, powerfulerror control coding is typically utilized to offer sufficient error resilience tomultimedia services in mobile radio systems. In addition, unequal error pro-tection (UEP) may be applied to exploit the different importance of sourceencoded signals for the reconstruction at the receiver such that bandwidth isconserved by keeping the total overhead for error control small.
JPEG2000 [1] is a suitable candidate for the deployment of wireless imag-ing services due to its favorable features. These include excellent compres-sion performance, error resilience, hierarchical nature of the generated code-stream, support of progressive encoding and decoding with respect to qualityand spatial resolution, and region of interest (ROI) coding. These featuresof JPEG2000 may help wireless imaging applications to deal with the errorsthat the image codestream may have encountered during transmission overwireless channel, and to help maintain the quality of these services. More-over, its most recent part referred to as wireless JPEG2000 (JPWL) [2] hasprovided a complete tool set for error detection and correction by offeringa wide range of error control codes. As such, JPWL has further elevatedthe suitability of JPEG2000 images among the contemporary image codingstandards for wireless imaging services. However, the task of configuring thistool set and choosing the error control codes that meet the requirements ofa particular wireless imaging system within the available resources is left tothe system designer to perform.
Accordingly, different approaches have been reported in literature [3, 4, 5],trying to find suitable channel codes to cope with channel errors and revealing
3

4 Muhammad Imran Iqbal and Hans-Jurgen Zepernick
the superior performance of UEP schemes over classical equal error protec-tion (EEP) scheme. The UEP scheme proposed in [3] optimizes combinedsource and channel coding rates using bit error rate (BER) statistics and ratedistortion information of JPEG2000 encoded codestream. Rate-compatiblepunctured convolutional (RCPC) codes have been applied to provide errorprotection to the multilayered JPEG2000 codestream at the given total cod-ing rate. A binary symmetric channel (BSC) with bit error rate of 10−2 wasadopted in simulations for performance analysis of the UEP scheme. The ap-proach reported in [4] applies UEP to the JPEG2000 image codestream suchthat only image header and the first few packets are protected using RCPCcodes along with an interleaver. Certain assumptions have been made forthe encoding of the JPEG2000 images including single tile and single layerencoding as well as inclusion of the start of packet (SOP) marker and thepacked packet headers (PPM) marker segment into the codestream. In [5],a technique has been proposed that searches for a suboptimal UEP schemefor JPEG2000 codestream which maximizes the peak signal-to-noise ratio(PSNR) for a given channel BER and coding rate using Reed-Solomon (RS)codes. A virtual interleaving is also performed before transmission to helpthe decoder in recovering the lost packets in a packet loss channel.
Apart from the fact that the above discussed schemes are not consistentwith JPWL, their performance assessment is based on link layer metricssuch as BER or fidelity metrics such as PSNR. These metrics are widelycriticized for their poor correlation with human quality assessment [6, 7]. Onthe other hand, subjective tests as an ultimate tool to judge user-perceivedquality are expensive, time consuming and not suitable for quality monitoringin live systems [6, 8]. Therefore, a number of perceptual quality metricshave been developed to mimic the operation of the human visual system(HVS) including the perceptual relevance weighted Lp-norm [9], structuralsimilarity (SSIM) index [6] and visual information fidelity (VIF) criterion[12]. In contrast to fidelity metrics that quantify the quality through pixel bypixel comparisons between distorted and reference images, perceptual qualitymetrics are based on analyzing impairments in the structural information ofan image. As such, using perceptual quality metrics in technical systems forquality monitoring and evaluation of the error protection schemes insteadof fidelity metrics may improve the system performance which better suitshuman viewers.
In this report, we have introduced two UEP strategies for JPEG2000 im-ages. The first strategy utilizes all the additional bandwidth resources forinitial and most important packets of the JPWL codestream by applying er-ror protection to these packets while the ending packets are left unprotected.In the second strategy, the available bandwidth is shared among the pack-

Introduction 5
ets in such a way that initial packets get a better protection while the tailpackets get a comparatively weaker protection against channel errors. Thesestrategies are computationally simple yet very effective in many scenariosspecifically in the cases where different parts of the image codestream canbe divided into two levels of importance. One application of this type ofstrategies is in ROI coded images where ROI part of the codestream is moreimportant in terms of reconstructed image quality compared to the rest ofthe codestream. Though these strategies are investigated for two levels ofprotection, they are easily extendable to any number of levels. Furthermore,both of the proposed UEP strategies are fully consistent with JPWL.
As mentioned above, the perceptual quality metrics possess a better corre-lation with human perception, we therefore base our performance assessmentof UEP and EEP schemes on the aforementioned perceptual quality metrics.In particular, the examined UEP schemes take advantage of the progressiveencoding of JPEG2000 and the related different levels of importance of theinvolved packets for image reconstruction at the receiver. The numerical re-sults reveal the superior perceptual quality performance of the selected UEPschemes over EEP for a range of channel conditions and code rates.
The rest of this report is organized as follows. In Chapter 2, some back-ground on wireless JPEG2000 is provided. Chapter 3 gives a brief overviewon image quality assessment in terms of fidelity metrics and perceptual qual-ity metrics. The proposed UEP strategies are introduced in Chapter 4 andrelated numerical results along with discussions are presented in Chapter 5.Finally, conclusions are drawn in Chapter 6.
Chapter 2
Wireless JPEG2000
The JPEG2000 image coding standard [1] contains several tools for error re-silient image coding including error concealment and decoding process syn-chronization that help the decoder in dealing with errors [10]. These tools,however, do not provide sufficient error resilience necessary for keeping thedesirable quality of wireless imaging services under different channel condi-tions and bandwidth constraints. JPWL [2], on the other hand, addressesthis shortcoming by providing a complete tool set for protection against chan-nel errors. JPWL provides the applications with the flexibility of choosingerror control codes from a wide range of channel codes ranging from simple16 and 32-bit cyclic redundancy check codes to more powerful RS codes, thatsuit them under given constraints.
2.1 JPWL System Description
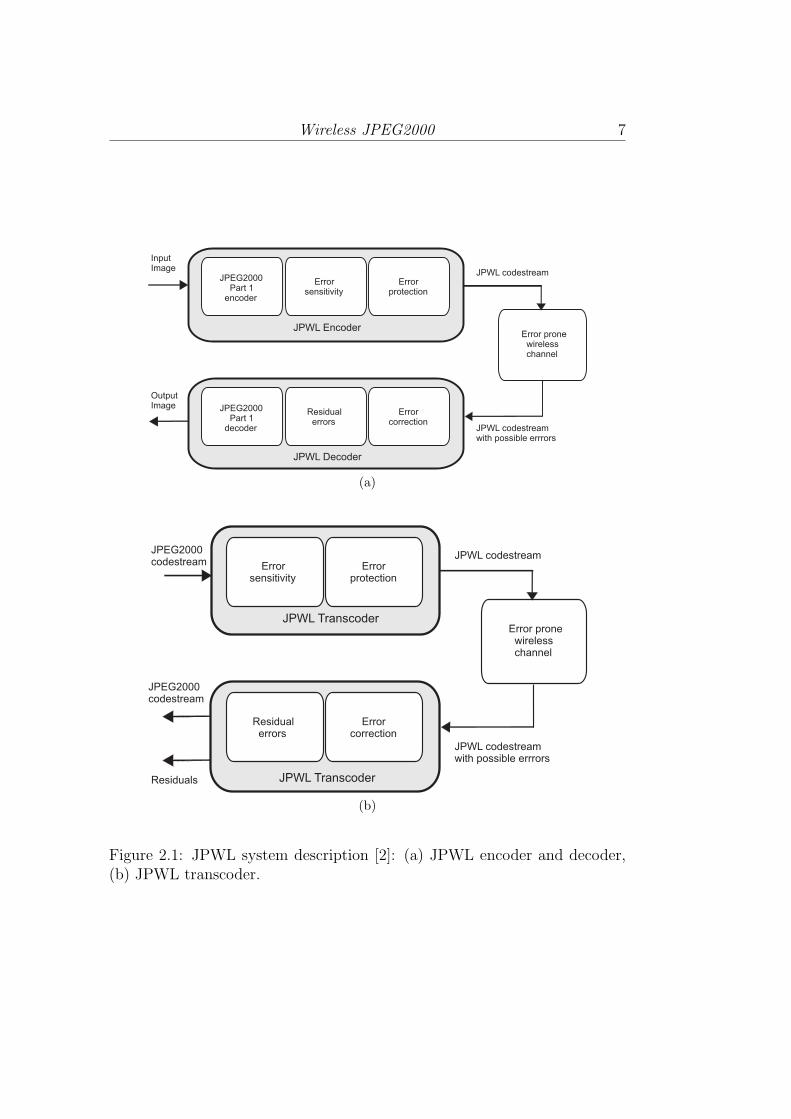
A JPWL system can be applied to an input source image or to a JPEG2000Part 1 encoded image. Typical configurations for both the aforementionedcases are shown in Fig. 2.1. In the former case, on the transmitter side, theJPWL encoder consists of three concurrent modules: A JPEG2000 Part 1encoder, an error sensitivity generator and an error protection tool. Afterconverting the input image to JPEG2000 Part 1, computing error sensitivityof different parts of the generated codestream for bit errors and applyingerror protection, the JPWL encoder generates the codestream which can betransmitted over any error prone channel. On the receiving end, an errorcorrecting process, a residual error description generation and JPEG2000Part 1 decoder constitute the JPWL decoder as shown in Fig. 2.1a.
In the later case, the JPWL encoder and decoder are composed of JPWLtranscoders for both transmitter and receiver sides. Specifically, at the trans-
6
Wireless JPEG2000 7
JPEG2000Part 1
encoder
Errorsensitivity
Errorprotection
JPEG2000Part 1
decoder
Residualerrors
Errorcorrection
InputImage
OutputImage
Error pronewirelesschannel
JPWL Encoder
JPWL Decoder
JPWL codestream
JPWL codestreamwith possible errrors
(a)
Errorsensitivity
Errorprotection
Residualerrors
Errorcorrection
JPEG2000codestream
Error pronewirelesschannel
JPWL Transcoder
JPWL codestream
JPWL codestreamwith possible errrors
JPEG2000codestream
Residuals JPWL Transcoder
(b)
Figure 2.1: JPWL system description [2]: (a) JPWL encoder and decoder,(b) JPWL transcoder.
8 Muhammad Imran Iqbal and Hans-Jurgen Zepernick
mitter, the JPWL transcoder applies error protection to the JPEG2000Part 1 codestream and generates the JPWL codestream while the JPWLtranscoder at the receiver end does the reverse and generates a JPEG2000Part 1 codestream out of the JPWL codestream as shown in Fig. 2.1b. Inaddition, the transcoder at the receiver generates a residual error descriptorwhich can be used by the JPEG2000 decoder to deal with residual errors.
2.2 JPWL Marker Segments
In order to provide error protection to JPEG2000 images, JPWL introducesthe following four new marker segments [2] in the JPEG2000 codestream.The error protection capability (EPC) marker segment contains the infor-mation about different normative and informative tools used for error pro-tection. The parity symbols added to the codestream for its protection arecontained in the error protection block (EPB) marker segment. Locating theuncorrectable errors in the codestream is the purpose of the residual errordescriptor (RED) marker segment. In addition, the RED marker segment de-scribes the categories of these errors. The sensitivity of different parts of thecodestream to channel errors is described in the error sensitivity descriptor(ESD) marker segment. The ESD marker segment represents the contribu-tion of each part of the codestream in the reconstructed image quality. Inother words, it represents the quality loss that might occur in the case ofloosing any part of the codestream.
Different fidelity metrics are included to indicate the error sensitivity ofthe codestream including mean squared error (MSE), PSNR, absolute peakerror and total squared error. The error sensitivity information may assist inselecting a suitable error protection strategy for protecting the codestreamagainst channel errors. Another powerful feature of the ESD marker segmentis to give the decoder an estimate of the image quality (or quality loss) forpartial image decoding made by combining only the initial error free partsof the codestream and discarding the erroneous parts.
The usefulness of the ESD marker segment can be further enhanced inthe following two ways. Firstly, the perceptual quality metrics exhibit bet-ter correlation with human perception. Using a perceptual quality metric aserror sensitivity descriptor instead of the fidelity metrics suggested in JPWLwill give a better perceptual quality estimate to the decoder for both partialand complete decoding of the image. Secondly, the existing ESD constella-tions for JPWL fail to give any quality estimate if the decoder has to decodeerroneous parts of the codestream. This shortcoming is due to the use of fullreference metrics in ESD marker segments. Using reduced-reference quality

Wireless JPEG2000 9
metrics may overcome this shortcoming by computing these error sensitivityvalues for the reconstructed image and comparing them with the same val-ues calculated by the encoder. Further, this quality assessment can be doneeven for codestreams having residual errors which is not the case with thefull-reference metrics specified for the JPWL-ESD marker segment.
It should be noted that JPWL offers an option for future use that allowsfor inclusion of an additional error sensitivity descriptor other than the ex-isting metrics. This may be exploited by using reduced-reference perceptualimage quality metrics such as the Lp-norm as suggested in [11]. In this way,objective image quality assessment can be executed that is more consistentwith subjective quality without requiring the presence of the reference imageat the receiver.
Chapter 3
Image Quality Assessment
Several ways have been used to assess and quantify the quality of an im-age. Subjective experiments are considered to be the best as for as qualityassessment is concerned. On the other hand, as mentioned earlier, they aretime consuming, expensive and not possible to implement in most of the liveimaging systems [8, 6]. The objective quality metrics such as fidelity metricsand perceptual quality metrics, are most commonly used alternatives to thesubjective tests. Some of the objective quality metrics are described in thesequel.
3.1 Fidelity Metrics
These classical approaches use simple mathematical techniques to quantifythe quality of an image without considering the properties of the humanvisual system.
3.1.1 Mean Squared Error
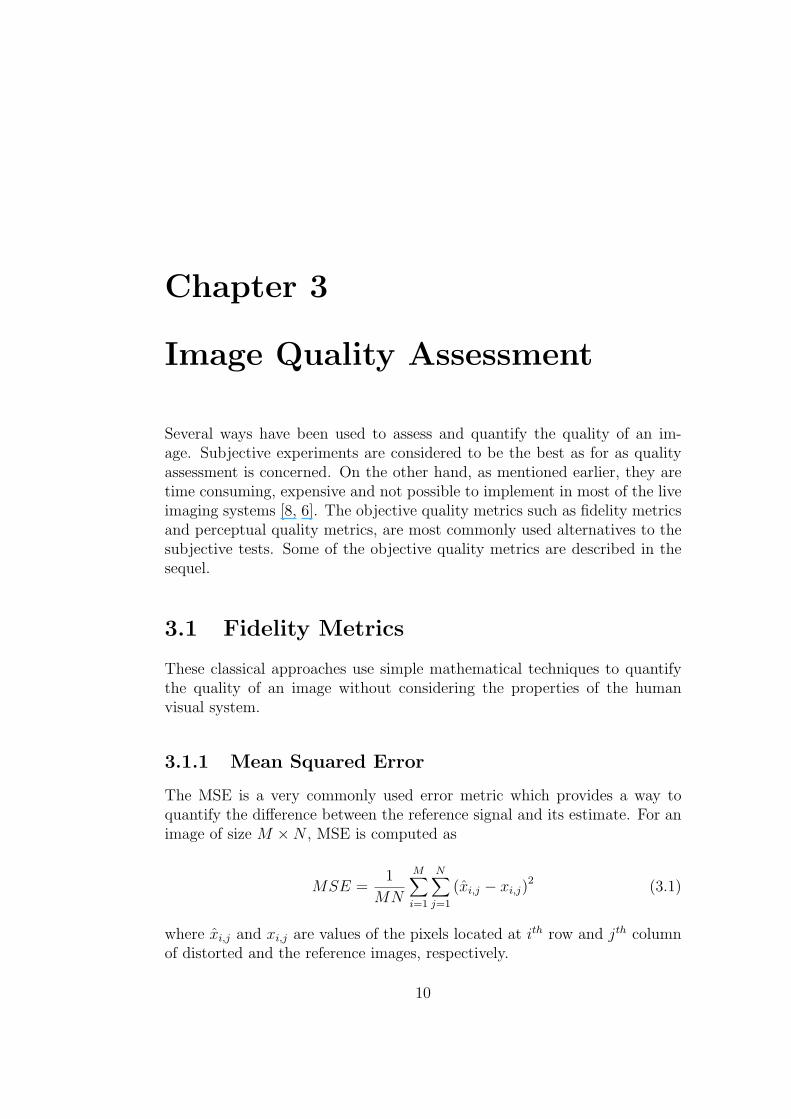
The MSE is a very commonly used error metric which provides a way toquantify the difference between the reference signal and its estimate. For animage of size M ×N , MSE is computed as
MSE =1
MN
M∑i=1
N∑j=1
(xi,j − xi,j)2 (3.1)
where xi,j and xi,j are values of the pixels located at ith row and jth columnof distorted and the reference images, respectively.
10
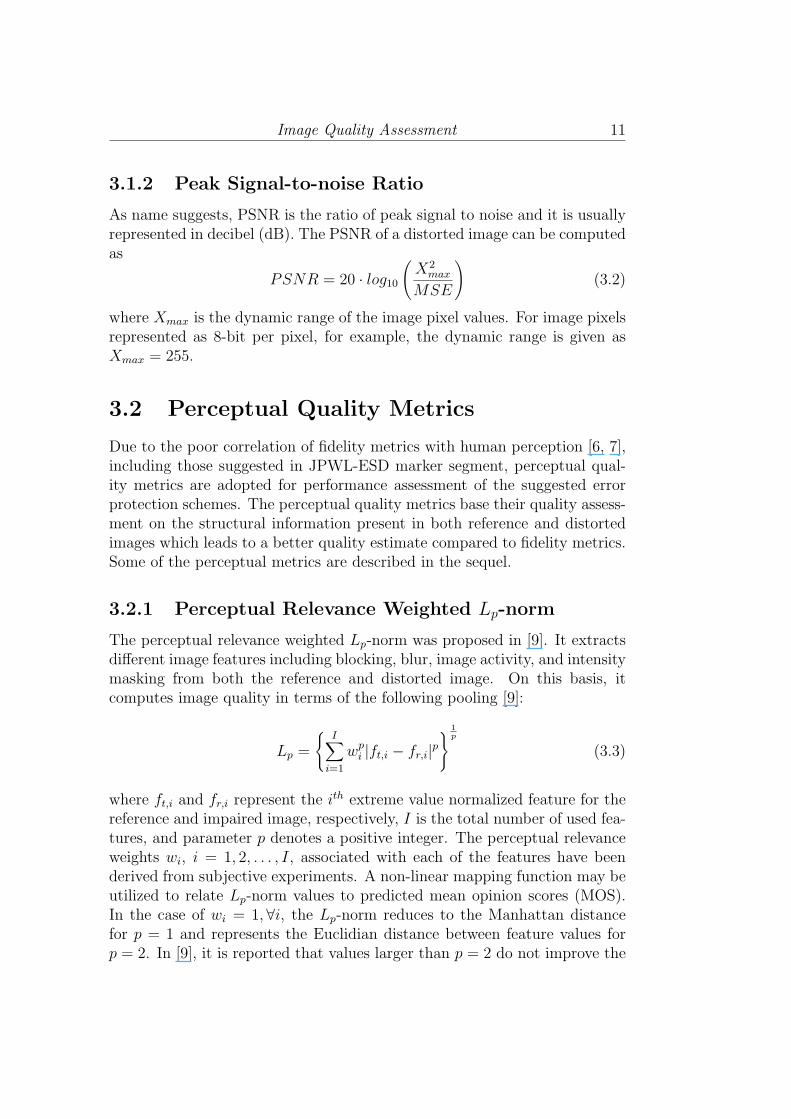
Image Quality Assessment 11
3.1.2 Peak Signal-to-noise Ratio
As name suggests, PSNR is the ratio of peak signal to noise and it is usuallyrepresented in decibel (dB). The PSNR of a distorted image can be computedas
PSNR = 20 · log10(X2
max
MSE
)(3.2)
where Xmax is the dynamic range of the image pixel values. For image pixelsrepresented as 8-bit per pixel, for example, the dynamic range is given asXmax = 255.
3.2 Perceptual Quality Metrics
Due to the poor correlation of fidelity metrics with human perception [6, 7],including those suggested in JPWL-ESD marker segment, perceptual qual-ity metrics are adopted for performance assessment of the suggested errorprotection schemes. The perceptual quality metrics base their quality assess-ment on the structural information present in both reference and distortedimages which leads to a better quality estimate compared to fidelity metrics.Some of the perceptual metrics are described in the sequel.
3.2.1 Perceptual Relevance Weighted Lp-norm
The perceptual relevance weighted Lp-norm was proposed in [9]. It extractsdifferent image features including blocking, blur, image activity, and intensitymasking from both the reference and distorted image. On this basis, itcomputes image quality in terms of the following pooling [9]:
Lp =
{I∑
i=1
wpi |ft,i − fr,i|p
} 1p
(3.3)
where ft,i and fr,i represent the ith extreme value normalized feature for thereference and impaired image, respectively, I is the total number of used fea-tures, and parameter p denotes a positive integer. The perceptual relevanceweights wi, i = 1, 2, . . . , I, associated with each of the features have beenderived from subjective experiments. A non-linear mapping function may beutilized to relate Lp-norm values to predicted mean opinion scores (MOS).In the case of wi = 1, ∀i, the Lp-norm reduces to the Manhattan distancefor p = 1 and represents the Euclidian distance between feature values forp = 2. In [9], it is reported that values larger than p = 2 do not improve the
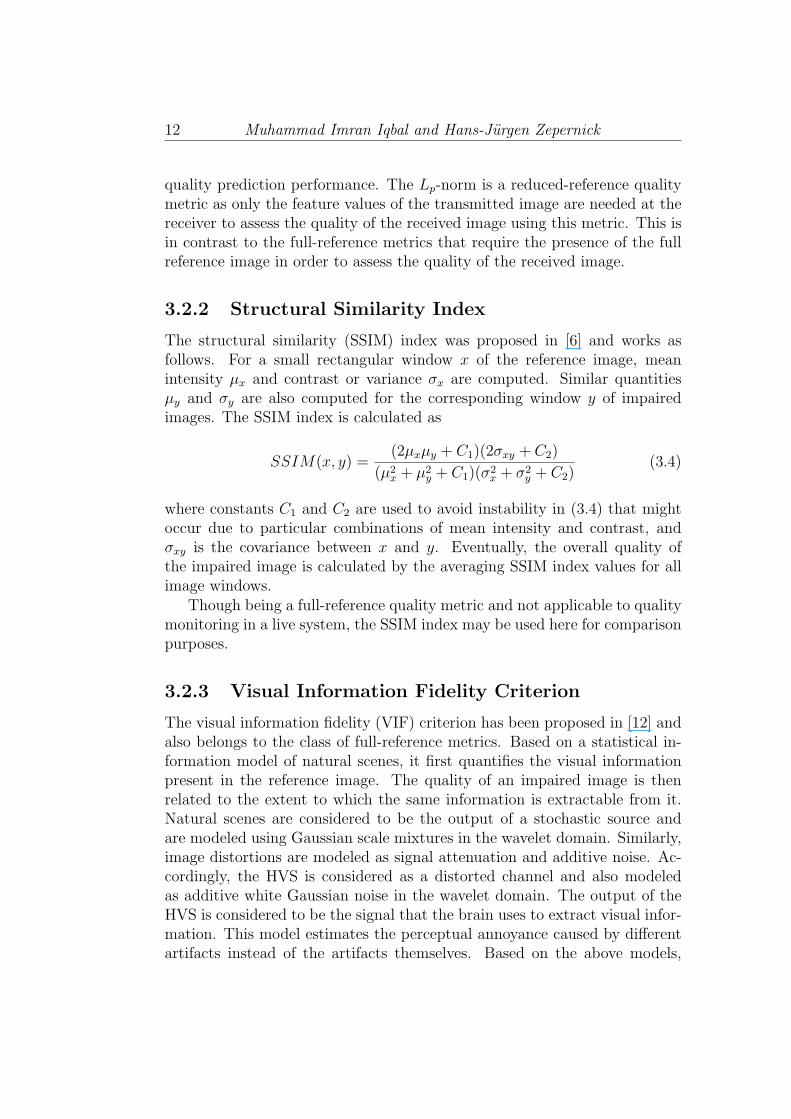
12 Muhammad Imran Iqbal and Hans-Jurgen Zepernick
quality prediction performance. The Lp-norm is a reduced-reference qualitymetric as only the feature values of the transmitted image are needed at thereceiver to assess the quality of the received image using this metric. This isin contrast to the full-reference metrics that require the presence of the fullreference image in order to assess the quality of the received image.
3.2.2 Structural Similarity Index
The structural similarity (SSIM) index was proposed in [6] and works asfollows. For a small rectangular window x of the reference image, meanintensity µx and contrast or variance σx are computed. Similar quantitiesµy and σy are also computed for the corresponding window y of impairedimages. The SSIM index is calculated as
SSIM(x, y) =(2µxµy + C1)(2σxy + C2)
(µ2x + µ2
y + C1)(σ2x + σ2
y + C2)(3.4)
where constants C1 and C2 are used to avoid instability in (3.4) that mightoccur due to particular combinations of mean intensity and contrast, andσxy is the covariance between x and y. Eventually, the overall quality ofthe impaired image is calculated by the averaging SSIM index values for allimage windows.
Though being a full-reference quality metric and not applicable to qualitymonitoring in a live system, the SSIM index may be used here for comparisonpurposes.
3.2.3 Visual Information Fidelity Criterion
The visual information fidelity (VIF) criterion has been proposed in [12] andalso belongs to the class of full-reference metrics. Based on a statistical in-formation model of natural scenes, it first quantifies the visual informationpresent in the reference image. The quality of an impaired image is thenrelated to the extent to which the same information is extractable from it.Natural scenes are considered to be the output of a stochastic source andare modeled using Gaussian scale mixtures in the wavelet domain. Similarly,image distortions are modeled as signal attenuation and additive noise. Ac-cordingly, the HVS is considered as a distorted channel and also modeledas additive white Gaussian noise in the wavelet domain. The output of theHVS is considered to be the signal that the brain uses to extract visual infor-mation. This model estimates the perceptual annoyance caused by differentartifacts instead of the artifacts themselves. Based on the above models,
Image Quality Assessment 13
mutual information is extracted between the input and output of the HVSfor the reference image both with and without channel distortions for everysubband. Finally, the VIF criterion is calculated as the ratio of these twomutual information values.

Chapter 4
Error Protection for WirelessJPEG2000
The release of JPWL has now equipped the JPEG2000 standard with apowerful and flexible error control tool set to cope with transmission errors fora wide range of channel conditions. However, the choice among the channelcodes from JPWL code set, that may fulfill the end user quality requirementsunder given channel conditions and bandwidth constraints, is left to thewireless imaging service designer. In order to help selecting a suitable errorprotection for a wireless imaging system, we have examined two simple butvery effective UEP strategies. A comparison of the suggested UEP strategieswill be made with the classic EEP scheme to explore their effectiveness indifferent channel conditions and available bandwidth. To keep the scopeof this research broader, the performance analysis will be made based on anumber of quality metrics ranging from fidelity metric PSNR to perceptualquality metrics Lp-norm, SSIM index and VIF criterion. This will connectthe error protection scheme design and the quality monitoring in a live systemthrough fidelity metrics and more importantly, through perceptual qualitymetrics.
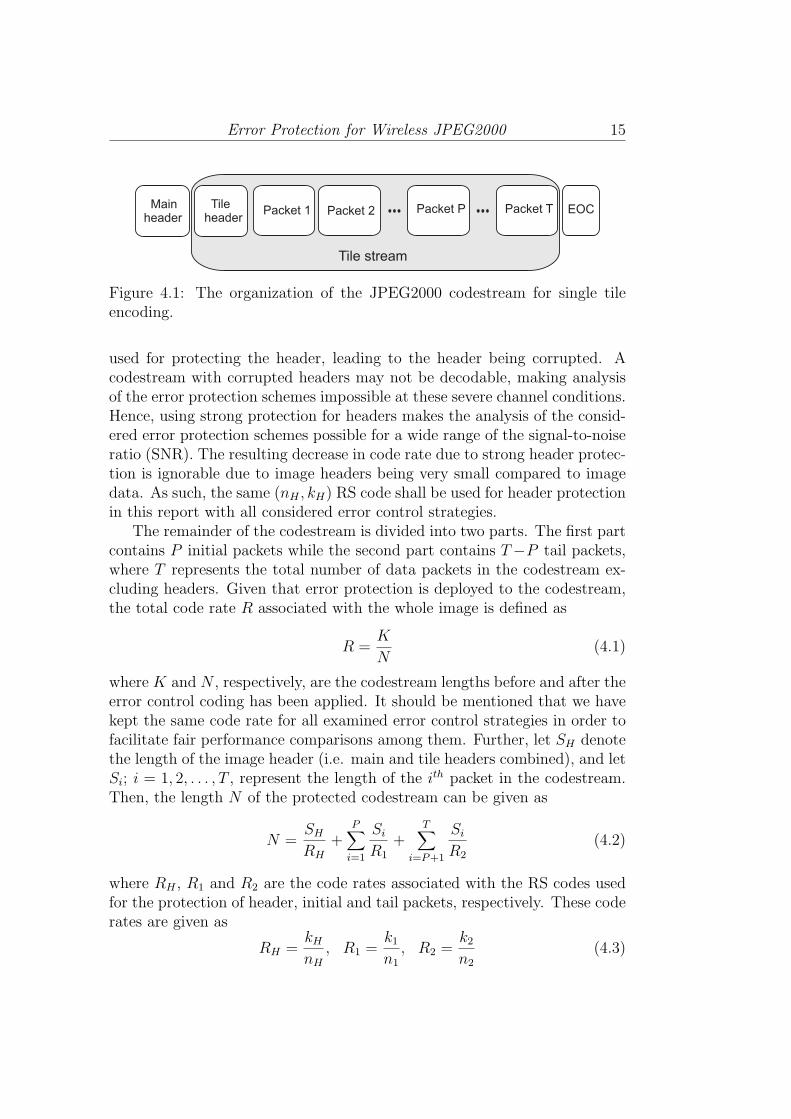
Fig. 4.1 shows the organization of the JPEG2000 image codestream whenit is encoded using single tile. The codestream starts withe the main header,followed by the tile-stream. The tile-stream consists of tile header and thedata packets. An end-of-code (EOC) marker indicates the end of the code-stream. Further, if the image is coded using ROI coding, initial packetscontain ROI while the tail packets represent image background.
Specifically, the image main header and the tile header are protected usinga strong (nH , kH) RS code due to the reasons described in the following. Thenumber of errors introduced by wireless channel increases at severe channelconditions and can go beyond the correction capabilities of a weaker code
14
Error Protection for Wireless JPEG2000 15
Mainheader
Tile stream
EOCTileheader
Packet 1 Packet PPacket 2 Packet T
Figure 4.1: The organization of the JPEG2000 codestream for single tileencoding.
used for protecting the header, leading to the header being corrupted. Acodestream with corrupted headers may not be decodable, making analysisof the error protection schemes impossible at these severe channel conditions.Hence, using strong protection for headers makes the analysis of the consid-ered error protection schemes possible for a wide range of the signal-to-noiseratio (SNR). The resulting decrease in code rate due to strong header protec-tion is ignorable due to image headers being very small compared to imagedata. As such, the same (nH , kH) RS code shall be used for header protectionin this report with all considered error control strategies.
The remainder of the codestream is divided into two parts. The first partcontains P initial packets while the second part contains T−P tail packets,where T represents the total number of data packets in the codestream ex-cluding headers. Given that error protection is deployed to the codestream,the total code rate R associated with the whole image is defined as
R =K
N(4.1)
where K and N , respectively, are the codestream lengths before and after theerror control coding has been applied. It should be mentioned that we havekept the same code rate for all examined error control strategies in order tofacilitate fair performance comparisons among them. Further, let SH denotethe length of the image header (i.e. main and tile headers combined), and letSi; i = 1, 2, . . . , T , represent the length of the ith packet in the codestream.Then, the length N of the protected codestream can be given as
N =SH
RH
+P∑i=1
Si
R1
+T∑
i=P+1
Si
R2
(4.2)
where RH , R1 and R2 are the code rates associated with the RS codes usedfor the protection of header, initial and tail packets, respectively. These coderates are given as
RH =kHnH
, R1 =k1n1
, R2 =k2n2
(4.3)
16 Muhammad Imran Iqbal and Hans-Jurgen Zepernick
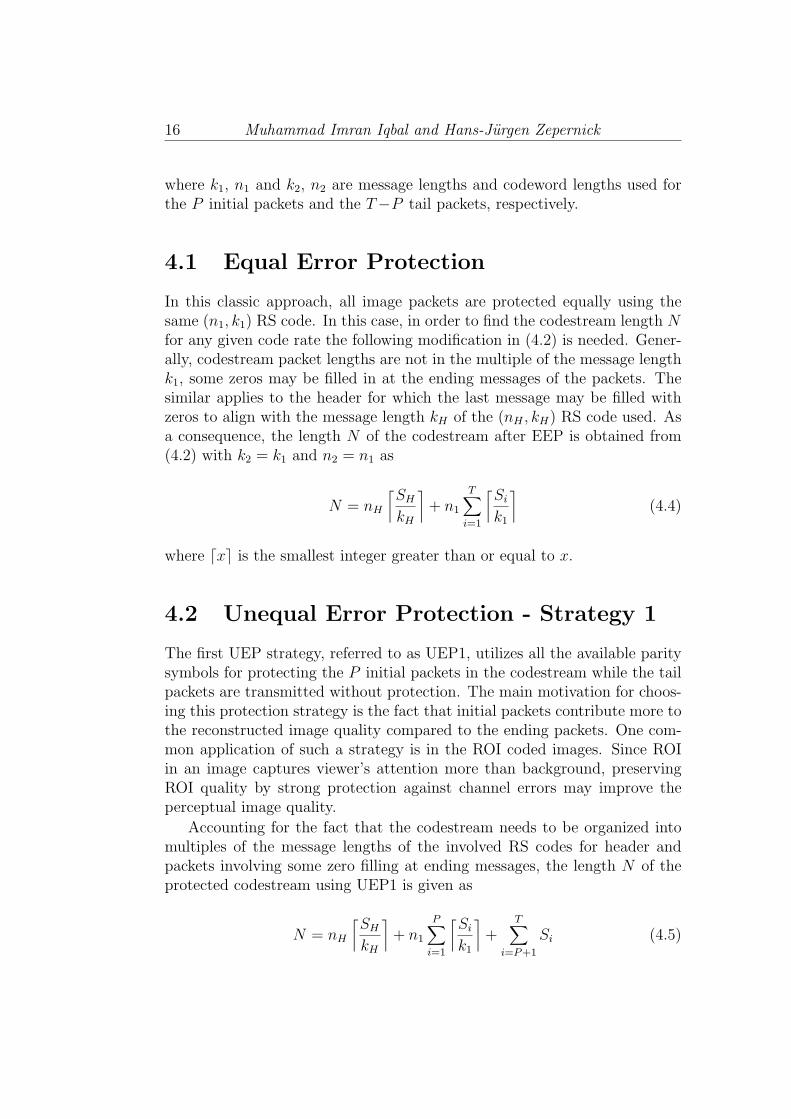
where k1, n1 and k2, n2 are message lengths and codeword lengths used forthe P initial packets and the T−P tail packets, respectively.
4.1 Equal Error Protection
In this classic approach, all image packets are protected equally using thesame (n1, k1) RS code. In this case, in order to find the codestream length Nfor any given code rate the following modification in (4.2) is needed. Gener-ally, codestream packet lengths are not in the multiple of the message lengthk1, some zeros may be filled in at the ending messages of the packets. Thesimilar applies to the header for which the last message may be filled withzeros to align with the message length kH of the (nH , kH) RS code used. Asa consequence, the length N of the codestream after EEP is obtained from(4.2) with k2 = k1 and n2 = n1 as
N = nH
⌈SH
kH
⌉+ n1
T∑i=1
⌈Si
k1
⌉(4.4)
where ⌈x⌉ is the smallest integer greater than or equal to x.
4.2 Unequal Error Protection - Strategy 1
The first UEP strategy, referred to as UEP1, utilizes all the available paritysymbols for protecting the P initial packets in the codestream while the tailpackets are transmitted without protection. The main motivation for choos-ing this protection strategy is the fact that initial packets contribute more tothe reconstructed image quality compared to the ending packets. One com-mon application of such a strategy is in the ROI coded images. Since ROIin an image captures viewer’s attention more than background, preservingROI quality by strong protection against channel errors may improve theperceptual image quality.
Accounting for the fact that the codestream needs to be organized intomultiples of the message lengths of the involved RS codes for header andpackets involving some zero filling at ending messages, the length N of theprotected codestream using UEP1 is given as
N = nH
⌈SH
kH
⌉+ n1
P∑i=1
⌈Si
k1
⌉+
T∑i=P+1
Si (4.5)
Error Protection for Wireless JPEG2000 17
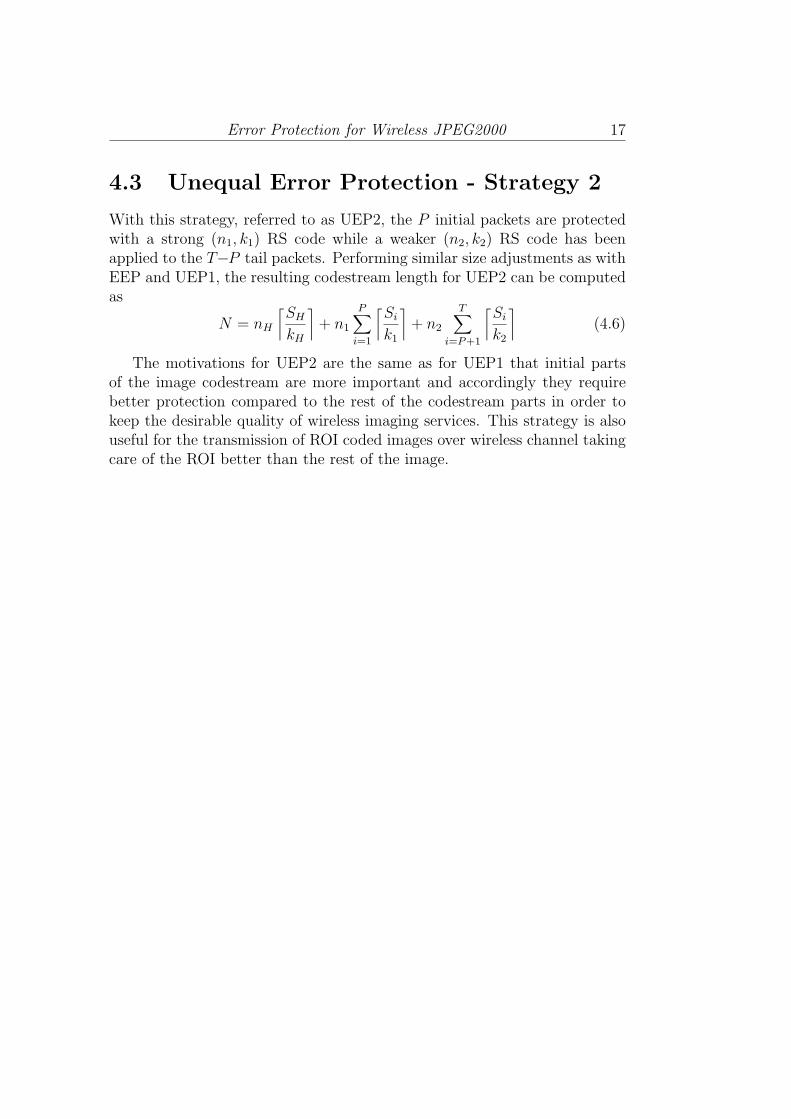
4.3 Unequal Error Protection - Strategy 2
With this strategy, referred to as UEP2, the P initial packets are protectedwith a strong (n1, k1) RS code while a weaker (n2, k2) RS code has beenapplied to the T−P tail packets. Performing similar size adjustments as withEEP and UEP1, the resulting codestream length for UEP2 can be computedas
N = nH
⌈SH
kH
⌉+ n1
P∑i=1
⌈Si
k1
⌉+ n2
T∑i=P+1
⌈Si
k2
⌉(4.6)
The motivations for UEP2 are the same as for UEP1 that initial partsof the image codestream are more important and accordingly they requirebetter protection compared to the rest of the codestream parts in order tokeep the desirable quality of wireless imaging services. This strategy is alsouseful for the transmission of ROI coded images over wireless channel takingcare of the ROI better than the rest of the image.
Chapter 5
Results and Discussions
The performance of the suggested error control strategies has been examinedin terms of both fidelity metrics and perceptual quality metrics. Wirelessimaging scenarios were simulated using AWGN and Rayleigh fading channelmodel with a wide range of channel conditions and channel code rates. Theimages used in simulations were taken from the LIVE Quality AssessmentDatabase [13] that were converted to black and white images and eventuallyencoded in JPEG2000 format. The JPEG2000 codestream generated for eachimage contained 4 quality layers and a bit rate of 0.5 bits per pixel with a totalof 24 packets. The hierarchical nature of the JPEG2000 codestream and thepowerful error control tool set provided by JPWL are the main motivationsfor selecting JPEG2000 images for simulations.
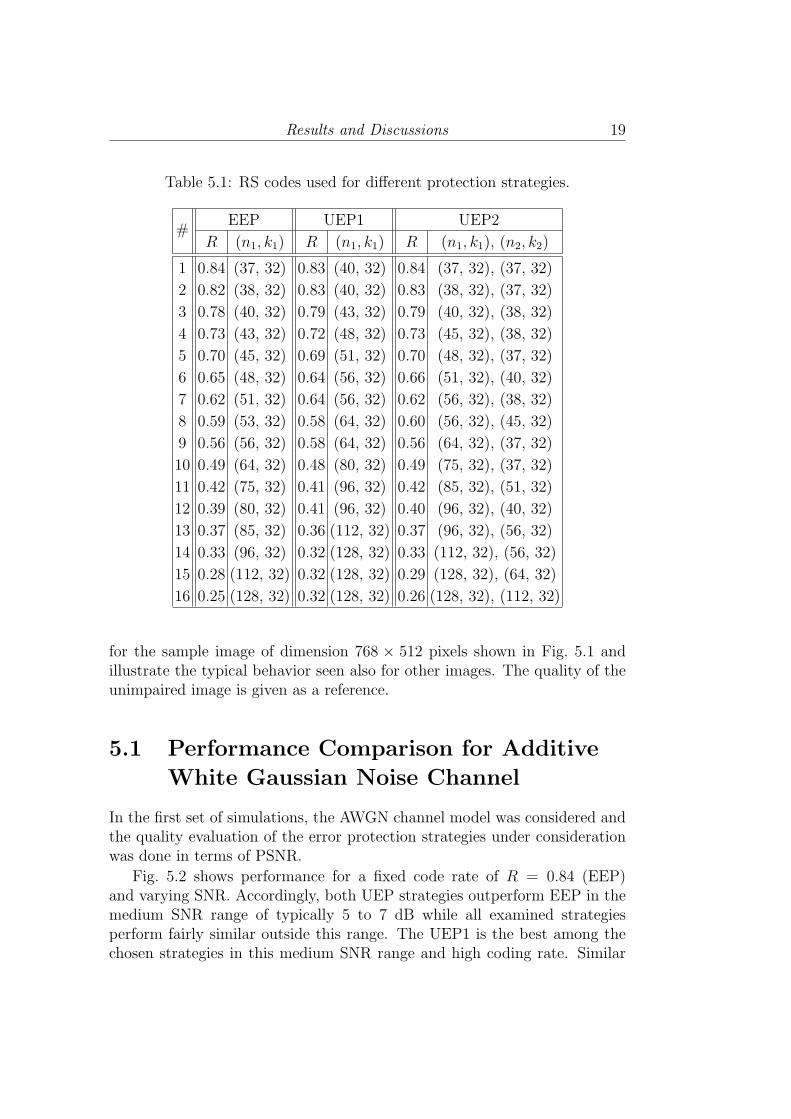
In all cases, image headers were strongly protected using an (nH , kH)RS code with message length kH = 32 and codeword length nH = 128.As for the codestream packets, Table 5.1 shows the different settings of RScodes and corresponding total code rates for the examined EEP, UEP1 andUEP2 strategies. The parameter P was chosen to be 18 on the basis ofresults obtained from experiments performed on a number of images. Inparticular, the values P = 6, 12, and 18 were examined with the latterproducing the best quality in terms of the considered metrics. Due to thelimited number of RS codes available in JPWL, the code rates differ slightlyamong the different UEP strategies but still have been kept within +0.07to −0.02 of the code rates for EEP, in every case. Finally, after protectingthe images with error control codes provided by these three strategies, theseimages were transmitted over two different simulated channels; AWGN andRayleigh fading in the presence of AWGN. To produce results of statisticalsignificance, 100 simulations were conducted for each system setting and theperformance results were averaged accordingly.
The numerical results that will be presented in the sequel were obtained
18
Results and Discussions 19
Table 5.1: RS codes used for different protection strategies.
#EEP UEP1 UEP2
R (n1, k1) R (n1, k1) R (n1, k1), (n2, k2)
1 0.84 (37, 32) 0.83 (40, 32) 0.84 (37, 32), (37, 32)
2 0.82 (38, 32) 0.83 (40, 32) 0.83 (38, 32), (37, 32)
3 0.78 (40, 32) 0.79 (43, 32) 0.79 (40, 32), (38, 32)
4 0.73 (43, 32) 0.72 (48, 32) 0.73 (45, 32), (38, 32)
5 0.70 (45, 32) 0.69 (51, 32) 0.70 (48, 32), (37, 32)
6 0.65 (48, 32) 0.64 (56, 32) 0.66 (51, 32), (40, 32)
7 0.62 (51, 32) 0.64 (56, 32) 0.62 (56, 32), (38, 32)
8 0.59 (53, 32) 0.58 (64, 32) 0.60 (56, 32), (45, 32)
9 0.56 (56, 32) 0.58 (64, 32) 0.56 (64, 32), (37, 32)
10 0.49 (64, 32) 0.48 (80, 32) 0.49 (75, 32), (37, 32)
11 0.42 (75, 32) 0.41 (96, 32) 0.42 (85, 32), (51, 32)
12 0.39 (80, 32) 0.41 (96, 32) 0.40 (96, 32), (40, 32)
13 0.37 (85, 32) 0.36 (112, 32) 0.37 (96, 32), (56, 32)
14 0.33 (96, 32) 0.32 (128, 32) 0.33 (112, 32), (56, 32)
15 0.28 (112, 32) 0.32 (128, 32) 0.29 (128, 32), (64, 32)
16 0.25 (128, 32) 0.32 (128, 32) 0.26 (128, 32), (112, 32)
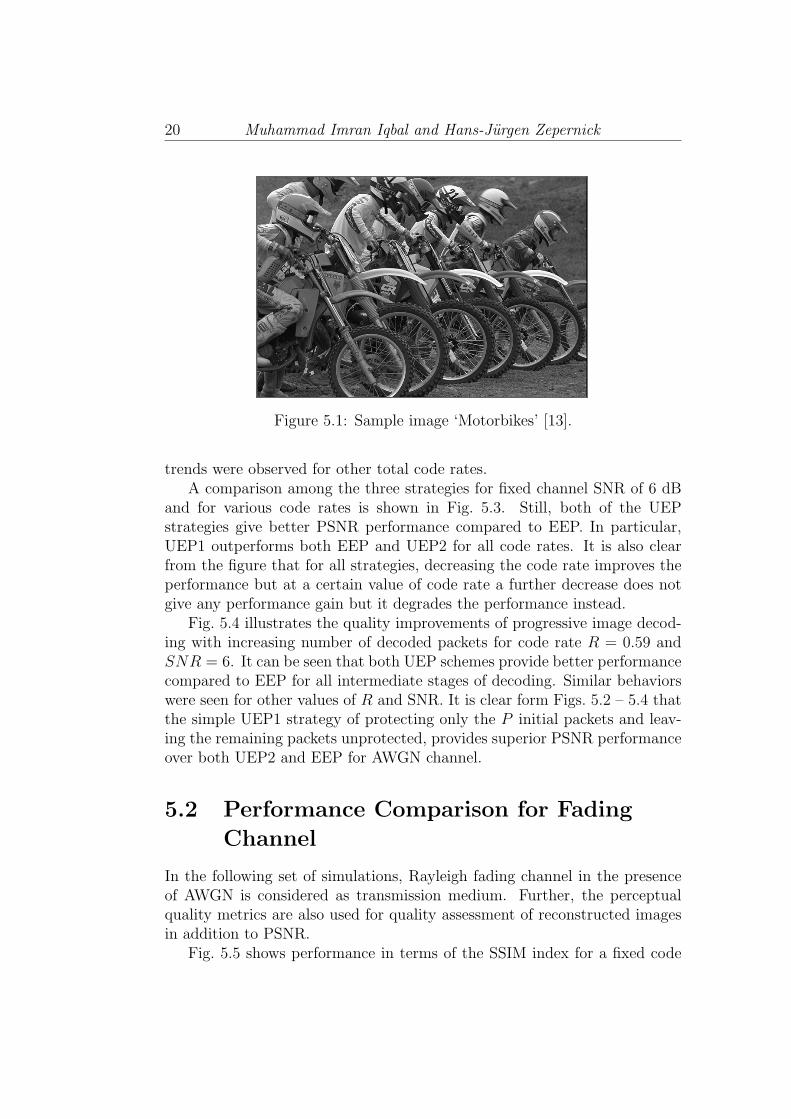
for the sample image of dimension 768 × 512 pixels shown in Fig. 5.1 andillustrate the typical behavior seen also for other images. The quality of theunimpaired image is given as a reference.
5.1 Performance Comparison for Additive
White Gaussian Noise Channel
In the first set of simulations, the AWGN channel model was considered andthe quality evaluation of the error protection strategies under considerationwas done in terms of PSNR.
Fig. 5.2 shows performance for a fixed code rate of R = 0.84 (EEP)and varying SNR. Accordingly, both UEP strategies outperform EEP in themedium SNR range of typically 5 to 7 dB while all examined strategiesperform fairly similar outside this range. The UEP1 is the best among thechosen strategies in this medium SNR range and high coding rate. Similar
20 Muhammad Imran Iqbal and Hans-Jurgen Zepernick
Figure 5.1: Sample image ‘Motorbikes’ [13].
trends were observed for other total code rates.A comparison among the three strategies for fixed channel SNR of 6 dB
and for various code rates is shown in Fig. 5.3. Still, both of the UEPstrategies give better PSNR performance compared to EEP. In particular,UEP1 outperforms both EEP and UEP2 for all code rates. It is also clearfrom the figure that for all strategies, decreasing the code rate improves theperformance but at a certain value of code rate a further decrease does notgive any performance gain but it degrades the performance instead.
Fig. 5.4 illustrates the quality improvements of progressive image decod-ing with increasing number of decoded packets for code rate R = 0.59 andSNR = 6. It can be seen that both UEP schemes provide better performancecompared to EEP for all intermediate stages of decoding. Similar behaviorswere seen for other values of R and SNR. It is clear form Figs. 5.2 – 5.4 thatthe simple UEP1 strategy of protecting only the P initial packets and leav-ing the remaining packets unprotected, provides superior PSNR performanceover both UEP2 and EEP for AWGN channel.
5.2 Performance Comparison for Fading
Channel
In the following set of simulations, Rayleigh fading channel in the presenceof AWGN is considered as transmission medium. Further, the perceptualquality metrics are also used for quality assessment of reconstructed imagesin addition to PSNR.
Fig. 5.5 shows performance in terms of the SSIM index for a fixed code

Results and Discussions 21
4 5 6 7 8 95
10
15
20
25
SNR (dB)
PS
NR
(dB
)
ReferenceEEPUEP 1UEP 2
Figure 5.2: Performance of EEP and UEP over AWGN for fixed code ratewith R(EEP ) = 0.84 and varying channel conditions.
0.40.50.60.70.85
10
15
20
25
Code rate
PS
NR
(dB
)
ReferenceEEPUEP1UEP2
Figure 5.3: Performance of EEP and UEP over AWGN for fixed channelconditions with SNR = 6dB and different code rates R.

22 Muhammad Imran Iqbal and Hans-Jurgen Zepernick
0 5 10 15 20 2514
16
18
20
22
24
26
28
Number of packets decoded
PS
NR
(dB
)
ReferenceEEPUEP1UEP2
Figure 5.4: Performance progression of the decoded image over AWGN forR(EEP ) = 0.59 and SNR = 6dB in terms of PSNR.
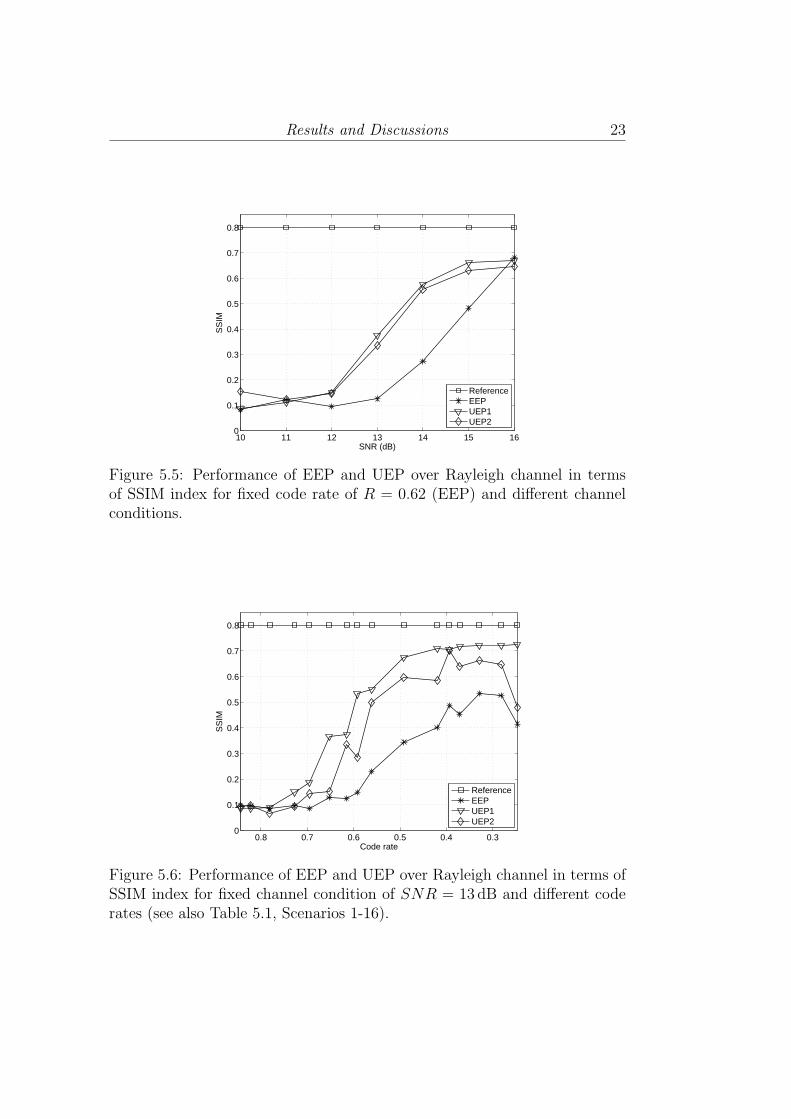
rate of R = 0.62 (EEP) and varying SNR. Accordingly, both UEP strategiesoutperform EEP with respect to the SSIM index in the medium SNR rangeof typically 11 to 16 dB while all examined strategies perform fairly similaroutside this range. It is noted that the superior performance of UEP overEEP was also observed with respect to the Lp-norm and VIF criterion aswell as PSNR.
Fig. 5.6 provides a performance comparison for the three error protectionstrategies for different code rates as shown in Table 5.1 but fixed SNR of13 dB. Clearly, UEP1 results in a better SSIM index as compared to UEP2and EEP for all examined code rates. It is also evident from the figure thatweak protection as indicated by high code rates results in poor performancefor all strategies.
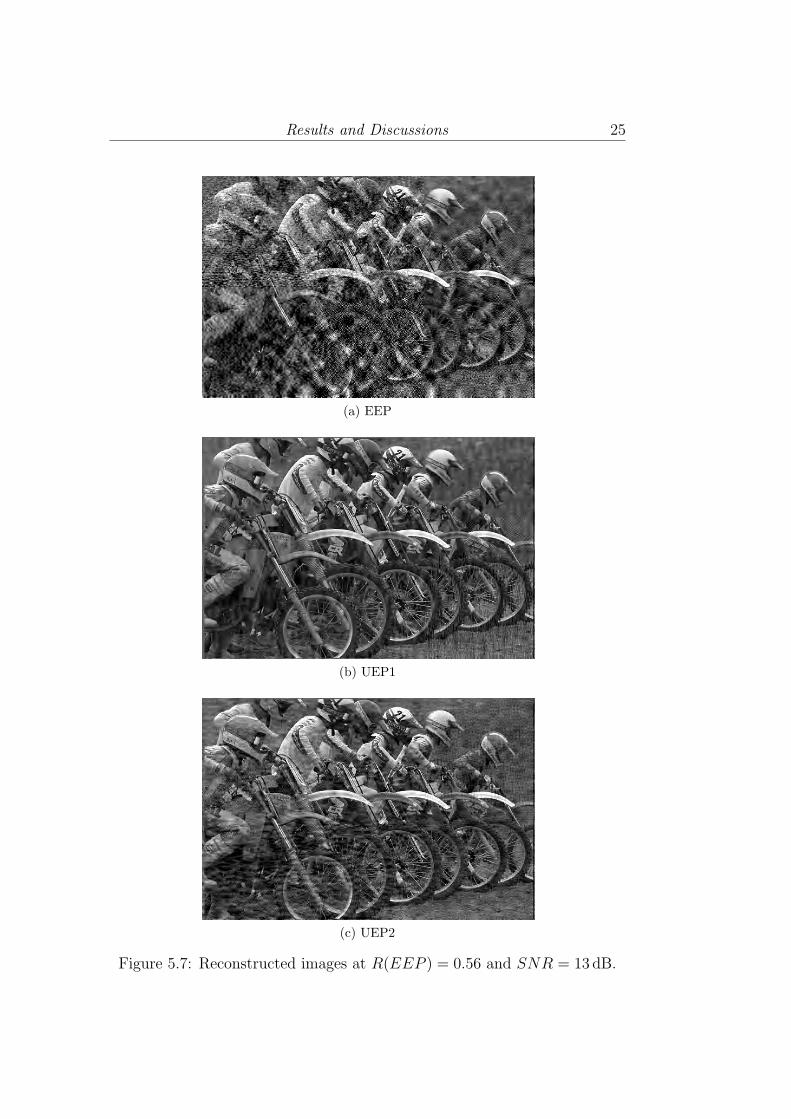
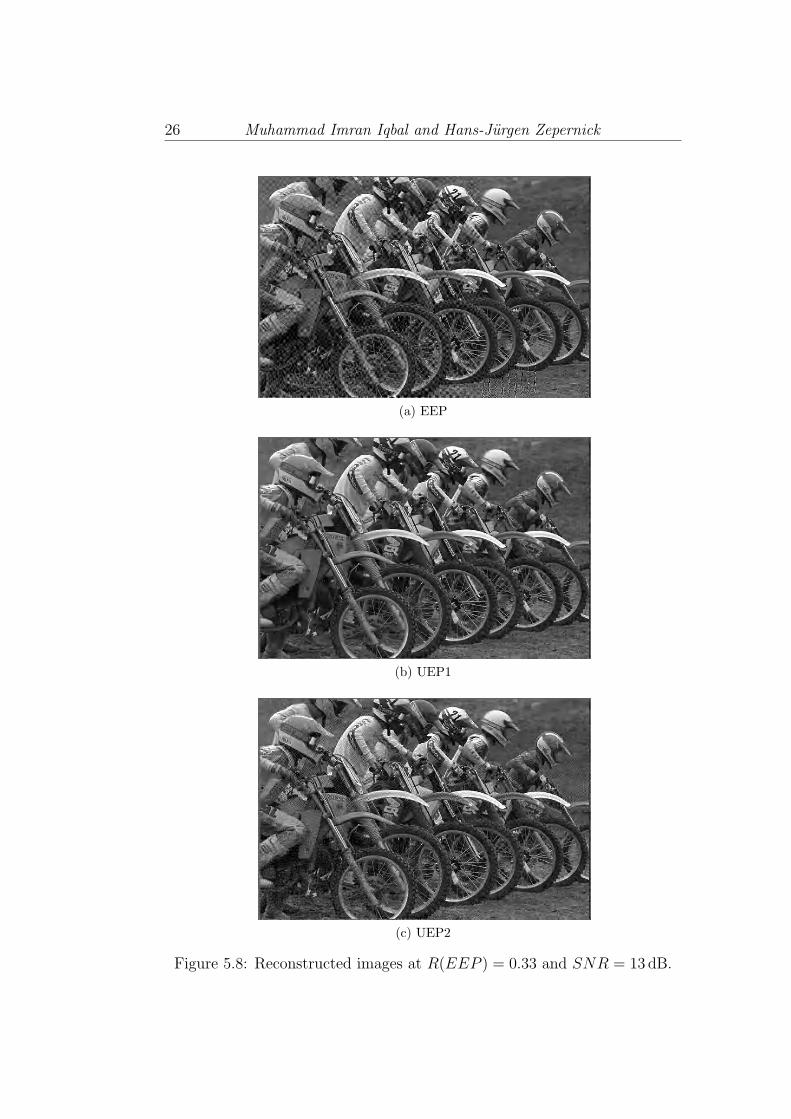
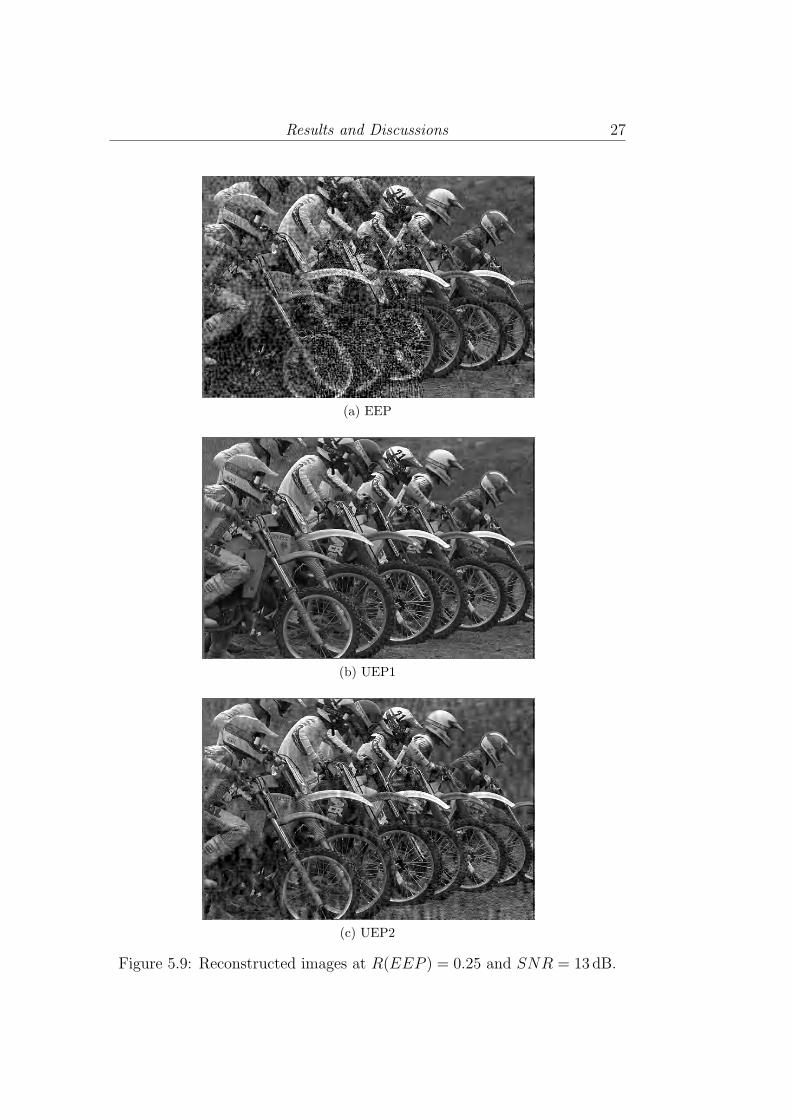
Figs. 5.7 – 5.9 show the reconstructed images for visual inspection of theperformance of the suggested UEP techniques. Specifically, the images weretransmitted over a simulated Rayleigh fading channel with SNR = 13dBusing coding rates of 0.56, 0.33 and 0.25. It can been seen from these figuresthat UEP1 is the best strategy among the considered strategies in terms ofreconstructed image quality. It should also be noted from Figs. 5.7 – 5.9that a decrease in coding rate improves the performance as can be seen fromFigs. 5.7 through 5.8 but it does not provide any gain beyond a criticallowest value. This fact can be seen in Figs. 5.8 – 5.9 where a decrease inthe coding rate from 0.33 to 0.25 does not improve the results for UEP1,it even degrades the performance of both UEP2 and EEP strategies. This
Results and Discussions 23
10 11 12 13 14 15 160
0.1
0.2
0.3
0.4
0.5
0.6
0.7
0.8
SNR (dB)
SS
IM
ReferenceEEPUEP1UEP2
Figure 5.5: Performance of EEP and UEP over Rayleigh channel in termsof SSIM index for fixed code rate of R = 0.62 (EEP) and different channelconditions.
0.30.40.50.60.70.80
0.1
0.2
0.3
0.4
0.5
0.6
0.7
0.8
Code rate
SS
IM
ReferenceEEPUEP1UEP2
Figure 5.6: Performance of EEP and UEP over Rayleigh channel in terms ofSSIM index for fixed channel condition of SNR = 13dB and different coderates (see also Table 5.1, Scenarios 1-16).

24 Muhammad Imran Iqbal and Hans-Jurgen Zepernick
lowest critical value of code rate may not be the same for all the investigatedstrategies and for any strategy, it may vary with varying SNR.
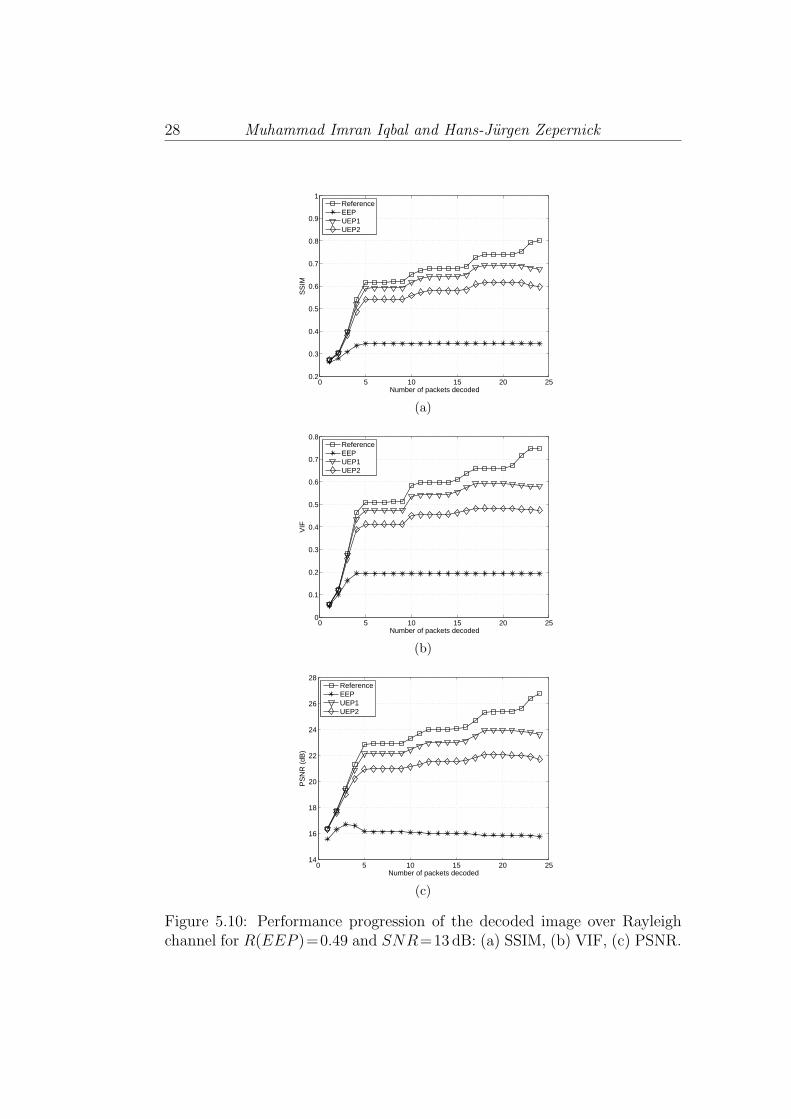
Fig. 5.10 illustrates the performance improvements of progressive im-age decoding with increasing number of decoded packets in terms of thetwo full-reference metrics SSIM index and VIF criterion for code rate R =0.49. PSNR performance is shown for comparison. It can be seen fromFigs. 5.10(a)–(c) that both UEP schemes outperform EEP in terms of allthe considered metrics. It is also observed that the simple UEP1 strategy,protecting only the P initial packets and leaving the remaining packets un-protected, provides superior performance over UEP2 in the considered case.
Fig. 5.11 shows the similar superior performance of the two UEP strate-gies over EEP for the reduced-reference metrics L1-norm and L2-norm. Whilethe SSIM index and the VIF criterion successfully provide the transition fromfidelity metrics to perceptual quality metrics, the Lp-norms additionally facil-itate adoption of such metrics to in-service quality monitoring in live systemsdue to their reduced-reference nature.
Results and Discussions 25
(a) EEP
(b) UEP1
(c) UEP2
Figure 5.7: Reconstructed images at R(EEP ) = 0.56 and SNR = 13dB.
26 Muhammad Imran Iqbal and Hans-Jurgen Zepernick
(a) EEP
(b) UEP1
(c) UEP2
Figure 5.8: Reconstructed images at R(EEP ) = 0.33 and SNR = 13dB.
Results and Discussions 27
(a) EEP
(b) UEP1
(c) UEP2
Figure 5.9: Reconstructed images at R(EEP ) = 0.25 and SNR = 13dB.
28 Muhammad Imran Iqbal and Hans-Jurgen Zepernick
0 5 10 15 20 250.2
0.3
0.4
0.5
0.6
0.7
0.8
0.9
1
Number of packets decoded
SS
IM
ReferenceEEPUEP1UEP2
(a)
0 5 10 15 20 250
0.1
0.2
0.3
0.4
0.5
0.6
0.7
0.8
Number of packets decoded
VIF
ReferenceEEPUEP1UEP2
(b)
0 5 10 15 20 2514
16
18
20
22
24
26
28
Number of packets decoded
PS
NR
(dB
)
ReferenceEEPUEP1UEP2
(c)
Figure 5.10: Performance progression of the decoded image over Rayleighchannel for R(EEP )=0.49 and SNR=13dB: (a) SSIM, (b) VIF, (c) PSNR.

Results and Discussions 29
0 5 10 15 20 250.1
0.2
0.3
0.4
0.5
0.6
0.7
0.8
0.9
1
Number of packets decoded
L 1−no
rm
ReferenceEEPUEP1UEP2
(a)
0 5 10 15 20 250.05
0.1
0.15
0.2
0.25
0.3
0.35
0.4
0.45
0.5
0.55
Number of packets decoded
L 2−no
rm
ReferenceEEPUEP1UEP2
(b)
Figure 5.11: Performance progression of the decoded image over Rayleighchannel for R(EEP ) = 0.49 and SNR = 13dB: (a) L1-norm, (b) L2-norm.
Chapter 6
Conclusions
In this report, we have introduced two simple but yet very effective UEPstrategies that are useful for wireless imaging systems. We have also exam-ined the performance of these strategies and compared them with conven-tional EEP for various amounts of redundancy when used over AWGN andRayleigh fading channels. The UEP1 strategy protects only few initial pack-ets of the JPWL codestream while the remaining packets are left withoutprotection. The UEP2 strategy applies strong protection to the initial pack-ets and weaker protection to the tail packets. The numerical results for bothAWGN and fading channels reveal that both UEP strategies outperform EEPin the medium SNR regime for all considered perceptual quality metrics aswell as the classical fidelity metric PSNR. Further, the simple UEP1 schemeperforms even better than UEP2.
It may also be concluded that the Lp-norm is a suitable candidate for fill-ing the available space in the ESD marker segment of the JPWL standard toserve as an error sensitivity descriptor. By doing so, in addition to providingbetter correlation with human perceived quality for the reconstructed image,it may also assist in-service quality monitoring and resource management forwireless imaging services.
30

Bibliography
[1] International Organization for Standardization, “Information Technol-ogy – JPEG 2000 Image Coding System – Part 1: Core coding system,”ISO/IEC 15444-1:2004(E), Sept. 2004.
[2] International Organization for Standardization, “Information Technol-ogy – JPEG 2000 Image Coding System – Part 11: Wireless,” ISO/IEC15444-11:2007, May 2007.
[3] Z. Wu, A. Bilgin, and M. W. Marcellin, “Unequal Error Protection forTransmission of JPEG2000 Codestreams Over Noisy Channels,” in Proc.International Conference on Image Processing, New York, USA, vol. 1,pp. I-213- I-216, Sept. 2002.
[4] V. Sanchez and M. K. Mandal, “Robust Transmission of JPEG 2000Images Over Noisy Channels,” 2002 Digest of Technical Papers, Inter-national Conf. on Consumer Electronics, pp. 80-81, June, 2002.
[5] G. Baruffa, P. Micanti, and F. Frescura, “Error Protection and Inter-leaving for Wireless Transmission of JPEG 2000 Images and Video,”IEEE Transactions on Image Processing, vol. 18, no. 2, pp. 346-356,Feb. 2009.
[6] Z. Wang, A. C. Bovik, H. R. Sheikh, and E. P. Simoncelli, “ImageQuality Assessment: From Error Visibility to Structural Similarity,”IEEE Transactions on Image Processing, vol. 13, no. 4, pp. 600-612,Apr. 2004.
[7] W. Zhou, A. C. Bovik, and L. Ligang, “Why is Image Quality As-sessment so Difficult?,” in Proc. of IEEE International Conference onAcoustics, Speech, and Signal Processing, Orlando, USA, vol. 4, pp. IV-3313 - IV-3316, May 2002.
[8] M. Martinez-Rach, O. Lopez, P. Pinol, M. P. Malumbres, J. Oliver, andC. T. Calafate, “Quality Assessment Metrics vs. PSNR under Packet
31

32 Muhammad Imran Iqbal and Hans-Jurgen Zepernick
Loss Scenarios in MANET Wireless Networks,” in Proc. of the ACMInt. Workshop on Mobile Video, Augsburg, Germany, pp. 31-36, Sept.2007.
[9] U. Engelke and H.-J. Zepernick, “Quality Evaluation in Wireless Imag-ing Using Feature-Based Objective Metrics,” in Proc. IEEE Int. Symp.on Wireless Pervasive Computing, San Juan, Puerto Rico, pp. 367-372,Feb. 2007.
[10] A. N. Skodras and T. Ebrahimi, “JPEG2000 Image Coding System The-ory and Applications,” in Proc. IEEE International Symposium on Cir-cuits and Systems, Kos, Greece, pp. 4, May 2006.
[11] M. I. Iqbal, H.-J. Zepernick, and U. Engelke, “Error Sensitivity Analy-sis for Wireless JPEG2000 Using Perceptual Quality Metrics,” in Proc.International Conference on Signal Processing and Communication Sys-tems, Gold Coast, Australia, Dec. 2008.
[12] H. R. Sheikh and A. C. Bovik, “Image Information and Visual Quality,”IEEE Transactions on Image Processing, vol. 15, no. 2, pp. 430-444,Feb. 2006.
[13] LIVE Quality Assessment Database, “Laboratory for Image and VideoEngineering,” [Online], Available http://live.ece.utexas.edu/research/quality/subjective.htm

ISSN 1103-1581
ISRN BTH-RES–04/10–SE
Quality assessment of error Protection schemes for Wireless JPeG2000
Muhammad Imran Iqbal and Hans-Jürgen Zepernick
Copyright © 2010 by individual authors. All rights reserved.
Printed by Printfabriken, Karlskrona 2010.
Quality assessment of error Protection schemes for Wireless JPeG2000
Muhammad Imran Iqbal and Hans-Jürgen Zepernick
Blekinge Institute of TechnologyResearch report No. 2010:04