Reconfiguration of the E&C Refinery Co. Crude Distillation ...
35
Upgrade Project: Reconfiguration of the E&C Refinery Co. Crude Distillation Column in Irvine Cara Chan Justin Chung Caitlin Lim Jacqueline Medina David Nguyen CBEMS 149B: Group 6 Professor Cesar Ruiz, P.E. University of California, Irvine Irvine, California June 9th, 2017
-
Upload
khangminh22 -
Category
Documents
-
view
0 -
download
0
Transcript of Reconfiguration of the E&C Refinery Co. Crude Distillation ...

Upgrade Project: Reconfiguration of the E&C Refinery Co. Crude Distillation Column in Irvine
Cara Chan
Justin Chung
Caitlin Lim
Jacqueline Medina
David Nguyen
CBEMS 149B: Group 6
Professor Cesar Ruiz, P.E. University of California, Irvine
Irvine, California
June 9th, 2017

Letter of Transmittal
Date: June 9th, 2017
To: Cesar Ruiz, P.E.
Fluor Process Engineer and Lecturer Department of Chemical Engineering and Materials Science
University of California, Irvine
Subject: Completion of the Upgrade Project: Reconfiguration of the E&C Refinery Co. Column
We are pleased to submit to you the report on “Upgrade Project: Reconfiguration of the E&C Refinery Co. Crude Distillation Column in Irvine.”
This report utilized the knowledge and experience that we have accumulated throughout our studies from the Chemical Engineering Curriculum; specifically, the Chemical Engineering Design series that provided much insight on how process engineers conduct their work. This senior design project was to imitate real-life scenarios, and our team treated it as such.
Within this paper includes our findings and upgrade recommendations of the equipments involved in the crude distillation process. These recommendations are to satisfy the process rate of 265,000 BPSD per request from the E&C Refinery Co, Irvine. If any clarification is needed, we will happily be able to answer your questions.
Thank you for passing your knowledge to us,
David Nguyen
Cara Chan
Justin Chung
Jackie Medina
Caitlin Lim

Executive Summary
This document is a proposal to the E&C Refinery Company for a chemical plant with the
capacity of processing 265,000 BPSD of crude. The proposal details the following: equipment
sizing for distillation columns, heat exchangers, pumps, and vessels are outlined including
calculations; the cost estimates of the plant include the capital cost of purchasing equipment
and ISBL fixed capital costs; risk assessments are considered based on FMEA guidelines; the
environmental impact is discussed concerning air pollutants, process hazards, and how to
mitigate them. The main saleable products from the plant are naphtha, kerosene, turbosene
and diesel. The proposed heat integration is designed to conserve energy by first utilizing the
heat in the product streams to preheat the raw crude before using utility to obtain the desired
operating temperature of 708 °F. The estimated fixed capital investment is $62 million which will
be recovered in 10 days of the plant operating at full capacity. The ISBL fixed capital costs are
estimated at $326 million which can be recovered within 2 months when at full capacity.

Table of Contents Introduction
1: Process Description and Feed Specification
1.1 Process Description
1.2 Feed Specification
2: Product Rate and Properties
3: Heat Integration
4: Heat Exchangers
4.1 The Required Heat Exchangers for the Preheat Process
4.2 Product Temperature Specification and Utility Usage
5: Pump Calculations
6: Column Sizing
6.1 Wall Thickness
7: Vessel Sizing
7.1 Raw Crude Charge Drum Dimensions
7.2 Crude Flash Drum Dimensions
7.3 Vessel Wall Thickness
8: Estimated Cost of Equipment
8.1 Estimated Plant Cost
8.2 Estimated Return on Investments
9: Risk Assessment and Adverse Health Effects
10: Environmental Impacts
11: Failure Mode Effect Analyses (FMEA) on Crude Flash Drum
Conclusion
References
Appendices
page
01
02
02
02
03
05
07
07
10
11
14
14
15
16
17
19
20
25
26
27
28
29
30
31
32

1
Introduction
E&C Refinery Company plans to redesign its refinery in Irvine, CA, to process 265,000
BPSD of petroleum. Currently, the Crude Distillation Unit (Unit 1) operates at 100,000 BPSD
and cannot account for the remaining 165,000 BPSD. Therefore, a new unit will be required to
fully process the 265,000 BPSD of raw crude oil.
The main crude unit in the refinery uses distillation to separate the crude oil’s
components into useful, marketable products. This project will focus on the atmospheric
distillation column and support equipment (piping, preheaters, desalter, vessels, and pumps).
This project aimed to design the different equipment components to optimize the process of
refining the petroleum and determining cost-effective designs; however, safety and
environmental precautions also need to be considered to meet standard guidelines in protecting
civilians and the environment.

2
1: Process Description and Feed Specification
1.1 Process Description
The raw crude oil will be heated, partially vaporized and then fed into the atmospheric
tower. The vapors from the tower will be fractioned off at defined boiling points to produce a
variety of products. Lighter products such as Naphtha are recovered at low temperatures at the
top of the distillation unit. Mid-range products such as Turbosene and Kerosene are sent from
the atmospheric tower to side strippers where they are recovered. Heavier products, such as
residual fuel oil, are recovered at high temperatures from the bottom of the unit.
The hot final products leaving the distillation columns will be contacted with the cold feed
through a heat exchanger system. This is to conserve energy by taking advantage of heat
already present in the system. This also limits the use of utilities such as water and air in the
process of heating the crude and cooling the products. The amount of shells required and the
streams of interest for this heat exchange system are available in the heat integration.
The feed and products are moved from one equipment to another by using single stage
centrifugal pumps. The overall process can be seen in Appendix A.
1.2 Feed Specification
The feed will be a mixture of 2 different crudes: crude A and crude B. The operating
conditions and flowrate are presented in Table I.
Table I: Feed Operating Conditions
Stream Operating Condition Value
Crude A Temperature 68 F
Pressure 5 PSIG
Rate 107,250 BPSD
Average Specific Gravity 0.8628
Crude B Temperature 65 F
Pressure 5 PSIG
Rate 57,750 BPSD
Average Specific Gravity 0.9277
3
Other known specifications for the feed such as true boiling point (TBP) distillation data, lightend
composition, Nickel content, Vanadium content, basic Nitrogen content, Sulfur content,
Neutralize number (ANEU), Asphaltene content, and kinematic viscosity are available in
Appendix A.
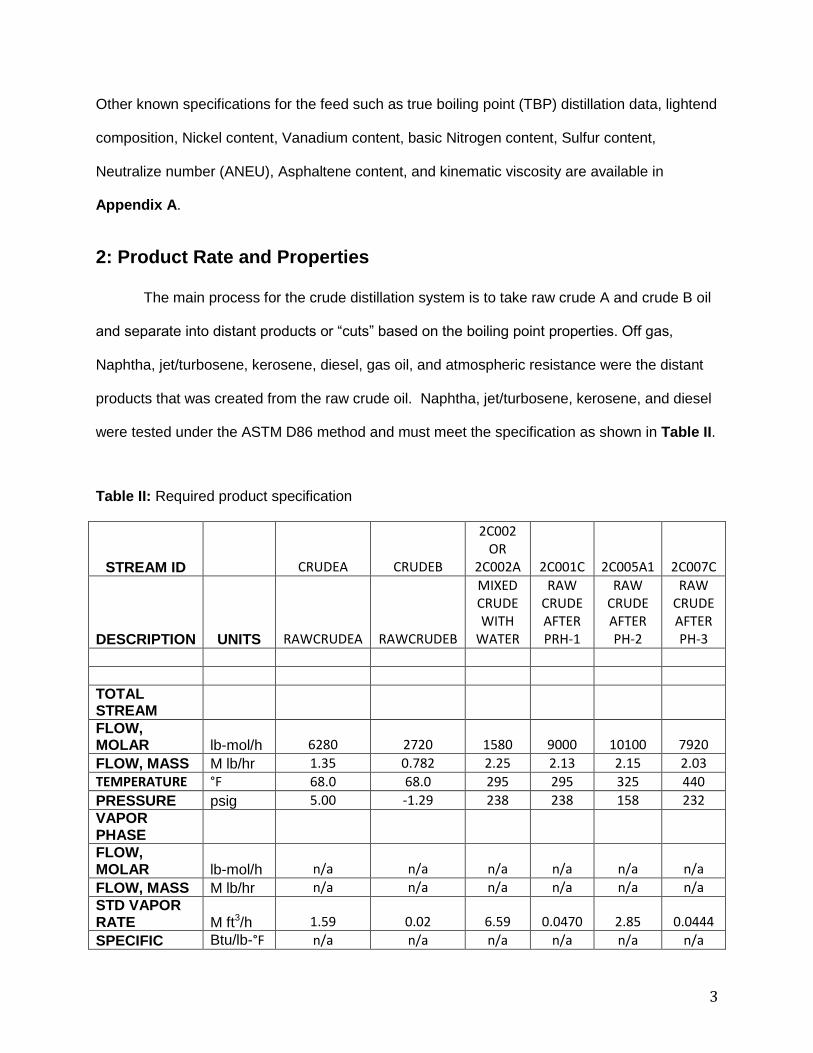
2: Product Rate and Properties
The main process for the crude distillation system is to take raw crude A and crude B oil
and separate into distant products or “cuts” based on the boiling point properties. Off gas,
Naphtha, jet/turbosene, kerosene, diesel, gas oil, and atmospheric resistance were the distant
products that was created from the raw crude oil. Naphtha, jet/turbosene, kerosene, and diesel
were tested under the ASTM D86 method and must meet the specification as shown in Table II.
Table II: Required product specification
STREAM ID CRUDEA CRUDEB
2C002 OR
2C002A 2C001C 2C005A1 2C007C
DESCRIPTION UNITS RAWCRUDEA RAWCRUDEB
MIXED CRUDE WITH
WATER
RAW CRUDE AFTER PRH-1
RAW CRUDE AFTER PH-2
RAW CRUDE AFTER PH-3
TOTAL STREAM FLOW, MOLAR lb-mol/h 6280 2720 1580 9000 10100 7920
FLOW, MASS M lb/hr 1.35 0.782 2.25 2.13 2.15 2.03
TEMPERATURE °F 68.0 68.0 295 295 325 440
PRESSURE psig 5.00 -1.29 238 238 158 232 VAPOR PHASE FLOW, MOLAR lb-mol/h n/a n/a n/a n/a n/a n/a
FLOW, MASS M lb/hr n/a n/a n/a n/a n/a n/a STD VAPOR RATE M ft3/h 1.59 0.02 6.59 0.0470 2.85 0.0444
SPECIFIC Btu/lb-°F n/a n/a n/a n/a n/a n/a

4
HEAT (CP)
VISCOSITY cP n/a n/a n/a n/a n/a n/a LIQUID PHASE FLOW, MOLAR lb-mol/h 6280 2720 15800 9000 10100 7920
FLOW, MASS M lb/hr 1.35 0.782 2.25 2.13 2.15 2.03 FLOW, VOLUME gal/min 3140 1690 5610 5350 5490 5380 SPECIFIC HEAT (CP) Btu/lb-°F 0.436 0.406 0.582 0.557 0.576 0.618
DENSITY lb/ft3 53.6 57.7 50.1 49.7 48.9 47.0
VISCOSITY cP 6.27 22.8 0.648 1.28 0.922 0.715 SURFACE TENSION dyne/cm 29.0 32.2 32.5 19.4 21.1 14.9
STREAM ID 2C100 2C400 2C510B 2C600B 2C710B 2C800B 2C900
DESCRIPTION UNITS OFFGAS NAPHTHA PRODUCT
Turbosene PRODUCT
KEROSENE PRODUCT
DIESEL PRODUCT
GAS OIL PRODUCT
ATMOSPHERIC RESID
TOTAL STREAM
FLOW, MOLAR lb-mol/h 312 3510 1370 1030 708 319 1830
FLOW, MASS M lb/hr 0.0192 0.362 0.217 0.221 0.190 0.106 1.02
TEMPERATURE °F 128 128 396 535 519 610 695
PRESSURE psig 1.85 1.85 8.75 10.3 11.4 12.4 13.9
VAPOR PHASE
FLOW, MOLAR lb-mol/h 312 n/a n/a n/a n/a n/a n/a
FLOW, MASS M lb/hr 0.0192 n/a n/a n/a n/a n/a n/a STD VAPOR RATE M ft3/h 0.147 1.57 0.544 0.285 0.00420 0.00232 0.0207 SPECIFIC HEAT (CP) Btu/lb-°F 0.429 n/a n/a n/a n/a n/a n/a
VISCOSITY cP 0.00809 n/a n/a n/a n/a n/a n/a
LIQUID PHASE
FLOW, MOLAR lb-mol/h n/a 3510 1370 1030 708 319 1830
FLOW, MASS M lb/hr n/a 0.362 0.217 0.221 0.190 0.106 1.02 FLOW, VOLUME gal/min n/a 1040 665 680 533 296 2490 SPECIFIC HEAT (CP) Btu/lb-°F n/a 0.538 0.634 0.673 0.653 0.681 0.684
DENSITY lb/ft3 n/a 43.3 40.8 40.5 44.4 44.8 50.9
VISCOSITY cP n/a 0.355 0.218 0.216 0.352 0.341 1.27 SURFACE TENSION dyne/cm n/a 19.0 12.1 10.3 14.0 13.3 17.1

5
Table III: List of Product Properties from PRO/II Simulation
By using PRO/II simulation, listed in Table III, the product rate and properties were determined
and compared to the required specifications.
3: Heat Integration
The raw crude needs to be preheated to 708°F before reaching the main distillation
column. To accomplish this, the crude feed would go through four separate networks of heat
exchangers. The exchangers were labeled as Preheat 1, Preheat 2, Preheat 3, and HXR-
1. Preheat 1 and 2 was used to heat the crude to a specific temperature, 289°F and 310°F
respectively. The final temperature of Preheat 3 was adjustable because HXR-1 provided the
remainder duty (Q) necessary to reach the final temperature of 708°F. This feed would be ready
for retrieval by the distillation column. Figure A depicts the heat integration graph.

6
Figure A: Heat integration chart. Preheat 1 required 7 steps, Preheat 2 required 1 step, and Preheat 3 required 3 steps
Each Preheat utilized product streams from the distillation column (such as naphtha, diesel,
AGO, etc.) to preheat the crude feed. This is done to fully optimize the heating process to
reduce the need of using air or water utilities; essentially, this optimization would save E&C
Refinery Co. in Irvine the cost of production from utility usage.
Table IV shows the duty and temperature input/output for each stream utilized in the
preheating process. Notice in Table IV that some streams had gone through multiple passes of
specific preheats; these streams are denoted as Upper and Lower to signify upper limit
temperature and lower limit temperature. For example, HX-1G heat exchanger housed the initial
kerosene product which is set at the upper limit of 534.8°F. A duty of 32.3 MMBtu/h was
exchanged with the crude feed to provide a kerosene temperature output of 300°F. The

7
adjusted temperature of the kerosene stream goes to HX-1B for further heat exchange with the
crude feed to cool the product to 100°F.
Table IV: Duty and temperature for each stream according to the heat integration chart. Hot streams are the product in each description and the cold stream is the crude feed
4: Heat Exchangers
4.1 The Required Heat Exchangers for the Preheat Process
Utilizing the heat integration graph, heat exchangers were designed as
appropriate. Figure B shows the flow diagram of the heat exchangers and Table V provides
the specifications of each heat exchanger. The overall heat transfer coefficient (U) and
correction factor (fT) was provided by E&C Refining Co. Log mean temperature difference
(LMTD) and shell surface areas were calculated with the following equations:
Eq. 1 LMTD = ∆𝑇𝐴−∆𝑇𝐵
ln (∆𝑇𝐴∆𝑇𝐵
)
Where: ∆𝑇𝐴 = 𝑇ℎ𝑜𝑡 𝑜𝑢𝑡 − 𝑇𝑐𝑜𝑙𝑑 𝑖𝑛
∆𝑇𝐵 = 𝑇ℎ𝑜𝑡 𝑖𝑛 − 𝑇𝑐𝑜𝑙𝑑 𝑜𝑢𝑡
Eq. 2 Surface Area (A) = 𝑄∗106
𝑈∗𝐿𝑀𝑇𝐷∗𝑓𝑇

8
Table V: Each heat exchanger with the calculated surface area
Figure B: Flow diagram of the heat exchangers. Preheat 1 is boxed in blue, Preheat 2 boxed in red, Preheat 3 in grey, and Utilities Only in black. HXR-1 is omitted.

9
The surface area for each heat exchanger had a limit of 5000 ft2; therefore, any stream that
needed a surface area greater than the limit would be divided evenly between multiple
exchangers. Kerosene lower (HX-1B), for instance, required a total area of 5590 ft2. Due to the
constraint, two heat exchangers in parallel would require 2795 ft2 each. Sample calculations of
this can be seen in the appendix. Also note that HX-3A required 17 separate heat exchangers
running in three series of six in parallel. Figure C and Figure D shows an example layout of
HX-1B and HX-3A.
Figure C: Lower kerosene product stream utilized in two heat exchangers in parallel
Figure D: Preheat 3 consist of 17 heat exchangers that utilized ATM residual product stream. This layout is favorable compared to utility use

10
4.2 Product Temperature Specification and Utility Usage
Product streams such as AGO, turbosene, diesel, naphtha and diesel pumparound used
utility to meet the required temperature specification for each product. Provided in Table IV are
the mandatory temperatures for each product and utility usage:
Table VI: Type of utility used in each product to reach specific temperature goals
All applicable products used utilities after the preheating exchange to reach the temperature
goals except for AGO. In Figure B, AGO can be seen going through Preheat 2 first before
transferring to Preheat 1. In between the preheats will be a utility to provide a duty of 2.93
MMBtu/h with a temperature difference of 50°F. Diesel Pumparound and Naphtha only used
utilities to reach the necessary final temperature and was not used in the preheating process.
Once the preheating process was completed, the crude was at 480°F. The target temperature
was 708°F; therefore, a heater with a tag number of HXR-1 was utilized. Table VII provides the
heater’s specifications.
Table VII: Duty and temperature range of the heater

11
5: Pump Calculations
Pumps assist in the movement of fluid from one location to the next. Without pumps, the
fluid will not reach its destination due to the frictional pressure loss from the pipes and
equipment [1]. To account for the pressure loss, the pumps are designed to provide additional
pressure to overcome the pressure loss. Determining the best specifications for each pump is
crucial in terms of compatibility and efficiency. The pump needs to be compatible to the type of
fluid and sized correctly for the process. If the pumps are not sized properly for the process, the
amount of pressure provided will be insufficient in terms of driving the fluid to its destination,
causing the pump to be inefficient. Certain fluids can corrode the pump’s material; also, the
viscosity of the fluid can affect the amount of power at the pump output.
In order to correctly choose the most suitable pump for the crude and product streams,
the Gobi pump calculation method was performed. Pump calculations, provided in Appendix B,
gathers information about the fluid properties and pressure drops for the streams and
equipment. The PRO/II program is used to determine the stream properties of the fluid as
shown in Table VIII.
Table VII: Stream Properties from PRO/II
Stream Name
2C001A2 2C007 2COLREFLUX 2C400
Stream Description
Raw Crude Flashed Crude
Reflux Naphtha Product
Temperature F 67.6 303.0 128 128
Pressure PSIG -1.29 30.0 1.85 1.85
Boiling Point Pressure at Stream T
psia 2.79 41.5 13.4 13.4
Flowrate kg-
mol/min 68.0 59.9 36.3 26.5
Liquid Act. Rate (vol)
gal/min 4830 5020 1430 1040
Liquid Std. Sp. Gr.
0.886 0.899 0.725 0.725
Liquid Act. Density
kg/m3 882 808 694 694

12
Other important information for the pump is provided from the company's specification as shown
in Table IX.
Table IX: Pump Specification
Service Rated Flow
Minimum Flow
Suction Pressure
psig
Destination Pressure
psig
Destination Height
ft
Destination Line Loss
psi
Pump Efficiency
%
Motor Efficiency
%
Raw Crude Charge Pump
110% of
Normal 50% of Normal 10 250 45 20 75 90
Flashed Crude Charge Pump
110% of
Normal 50% of Normal
From Simulation 16 50 20 75 90
Reflux Pump
110% of
Normal 50% of Normal
From Simulation
From Simulation 145 20 75 90
Naphtha Product Pump
110% of
Normal 50% of Normal
From Simulation
Atmospheric Tank 25 20 75 90
Liquid Viscosity
cP 9.46 1.46 0.355 0.355
Stream Name
2C510B 2C600B 2C710B 2C800B 2C900
Stream Description
Jet Product
Kerosene Product
Diesel Product
Gas Oil Product
ATM Resid
Temperature F 396 535 519 610 695
Pressure PSIG 8.75 10.3 11.4 12.4 13.9
Boiling Point Pressure at Stream T
psia 20.3 21.8 22.9 23.9 25.4
Flowrate kg-
mol/min 10.4 7.82 5.36 2.41 13.9
Liquid Act. Rate (vol)
gal/min 665 680 533 296 2490
Liquid Std. Sp. Gr.
0.797 0.841 0.877 0.906 1.01
Liquid Act. Density
kg/m3 653 649 711 717 815
Liquid Viscosity
cP 0.218 0.216 0.352 0.341 1.27

13
Jet/Turbo Product Pump
110% of
Normal 50% of Normal
From Simulation
Atmospheric Tank 25 20 75 90
Kerosene Product Pump
110% of
Normal 50% of Normal
From Simulation
Atmospheric Tank 25 20 75 90
Diesel Product Pump
110% of
Normal 50% of Normal
From Simulation
Atmospheric Tank 25 20 75 90
Gas Oil Product Pump
110% of
Normal 50% of Normal
From Simulation
Atmospheric Tank 25 20 75 90
Atmospheric Resid Pump
110% of
Normal 50% of Normal
From Simulation
Atmospheric Tank 25 20 75 90
As seen in Table IX, the rated flow and the minimum flow is 110% and 50% respectively of the
normal flow for each of the pumps. The suction pressures, also known as the source pressures,
are the operating pressures of streams which can be found in Table VIII. The maximum source
pressure is assumed to be 50 psi for each pump calculation.
Besides the maximum source pressure, there are a few other assumptions made for the
meter loss, skirt height, and pump elevation. The meter loss was assumed to be 2 psi and the
line loss 1 psi. The skirt height was assumed to be 20 ft. Lastly, the pump elevation was
assumed to be 3ft for each pump calculation.
For the equipment loss, most values were obtained from the heaters. Based on the heat
integration, the amount of shells present affected the equipment loss. For each shell, the
pressure loss was 10 psi. Some streams are part of the utilities and are assumed to have
equipment loss from coolers. The pressure loss by the coolers was 5 psi.
There are a few criteria that must be addressed when handling pump calculations. There
are four criteria for the control valves: 15 psi minimum at normal flow, 10 psi minimum at rated
flow, 50% variable system drop at normal flow, and 25% variable system drop at rated flow. For
some pump calculation, the valves fulfilled all four criteria. The chosen control valve value was
the one that equated to a larger total discharge pressure. For majority of the pump calculation,

14
the rated flow condition was used due to the criteria listed and contributed to a larger total
discharge pressure. Another criterion that must be followed is the safety margin for the NPSH
calculation. The safety margin is 10% of the NPSH calculation and must be equal or greater
than 3 ft. If the value is less than 3 ft, then the safety margin must be 3 ft.
6: Column Sizing
The plant consisted of 5 distillation columns in total: 1 main column and 4 side columns.
The main column will distill the crude oil, separating them into useful products:
AGO
Diesel
Naphtha
Kerosene
Turbosene
For instance, Naphtha is used in gasoline and as a petrochemical feedstock. In addition,
kerosene is used as jet fuel.
It is important to size the columns to estimate costs for economic analysis and determine
their measurements for the plant layout. Each column’s length, diameter, thickness, and number
of trays determined the size of the equipment.
6.1 Wall Thickness
To calculate for wall thickness, the equations specified by the ASME BPV Code for hoop
stress (Eq. 3) and for longitudinal stress (Eq. 4) were used.
Eq. 3:
Eq. 4:

15
Where: t = wall thickness
Pi = internal pressure
Di = internal diameter
S = maximum allowable stress
E = welded joint efficiency
The values for wall thickness were calculated and compared (See Sample Calculations in
Appendix D). The larger of the two values for each column was chosen as the design wall
thickness. The results are summarized in Table X.
Table X: Column Dimensions
Column Length [ft] Diameter [ft] Thickness [in.] No. of Trays
Main 150 26.5 0.411 25
Turbosene 50 4.5 0.0625 2
Kerosene 50 9 0.127 2
Diesel 50 5 0.0732 3
AGO 50 5 0.0720 3
*Length information was given by E&C Co.
*Diameter values calculated from PRO/II
For more information for each column refer to column sheets Appendix C.
7: Vessel Sizing
The vessels also need to be sized to generate cost estimates for economic analysis and
determine the general vessel proportions for plant layout purposes. Two of the four vessels in
the plant design were sized: the raw crude charge drum and crude flash drum. The other two
vessels were desalters and will be obtained from a desalter package. The raw crude charge
drum was oriented horizontally and will separate the raw crude and water. The crude flash drum

16
was oriented vertically and will separate the desalted crude vapor and liquid phases. This
section reports the steps and results for determining the vessel’s dimensions and stream
specifications.
Each vessel’s volume, length, and diameter were determined to specify the vessel’s
shape and size. The typical range of 2 to 5 for the length to diameter ratio was used to
determine an appropriate length and diameter for each vessel.
7.1 Raw Crude Charge Drum Dimensions
The raw crude charge drum’s dimensions were determined using a horizontal cylindrical
segment relationship and the following specifications provided by the E&C Refining Co.:
Horizontal drum
3 feet from HHLL to top of drum
10 minute hold up time
5 minute surge time
Alarms for HHLL and LLLL
12.510 ft3/s flow rate generated from Pro II
The volume of the liquid in the vessel was calculated using the following equation:
Eq. 5:
Where: Q = flow rate
tsurge = surge time
thold up = hold up time
tHHLL = time allowance for HHLL (1 minute)
tLLLL = time allowance for LLLL (1 minute)
The horizontal cylindrical segment equation was used to derive a relationship between vessel
length and diameter (Eq. 6):

17
Eq. 6: Where: D = vessel diameter
L = vessel’s tangent to tangent length
V = volume of the liquid in the vessel
Using Eq. 6 with trial and error, the length was calculated by estimating the diameter until the
length to diameter ratio was greater than 2 to less than 5 range (see Sample Calculations in
Appendix D). Table XI summarizes the final dimensions.
Table XI: Final dimensions of the raw crude charge drum
Diameter [ft] Length [ft] Volume [ft3]
17.0 64.0 14,500
*For more information, refer to vessel sheets in Appendix C
7.2 Crude Flash Drum Dimensions
The crude flash drum dimensions were determined using the Souder’s and Brown
correlation and the following specifications provided by the E&C Refining Co.:
16 inch inlet nozzle
10 minute hold up time
5 minute surge time
Alarms for HHLL and LLLL
No demister pad
Pro/II generated the flowrate, density, viscosity, and pressure estimates of each outlet stream.
Table XII summarizes the results

18
Table XII: Crude Flash Drum outlet stream properties from PRO/II
Tag No. Phase Flowrate [ft3/s] Density [lb/ft3] Viscosity [cP] Pressure [psig]
2C006 Vapor 122 0.283 0.0108 28.9
2C007 Liquid 11.2 50.5 1.47 28.9
The minimum area and diameter were determined using Table XII and the following equations:
Eq. 7:
Eq. 8:
Eq. 9:
Eq. 10:
Where: P = operating pressure
vt = terminal velocity
ρL = liquid density
ρG = vapor density
The liquid height at HHLL was calculated using Eq. 11.
Eq. 11:
To determine the total height of the vessel, the following allowances for the vessel were added
to the liquid height:
1.00ft for disaster

19
3.67ft above liquid height
2.67ft above liquid height
0.500ft for the bottom
The total height was the addition of all the allowance and the calculated liquid height at HHLL.
Using Equation 11 with trial and error, the length was calculated by estimating the diameter
until the length to diameter ratio was within the 2 to 5 range (see Sample Calculations in
Appendix). Table XIII summarizes the final dimensions.
Table XIII: Final dimensions of the crude flash drum
Diameter [ft] Length [ft] Volume [ft3]
15.0 72.5 12,800
*For more information refer to vessel sheets in Appendix C
7.3 Vessel Wall Thickness
To calculate for wall thickness, the equation specified by the ASME BPV Code for hoop stress
(Eq. 3) and for longitudinal stress (Eq. 4) was used. The wall thickness was calculated similarly
to the column wall thickness in 6.1.
Table XIV: Vessel wall thicknesses
Tag. No Vessel Wall Thickness [in.]
V-1 Raw Crude Charge Drum 1.88
V-3 Crush Flash Drum 0.247

20
8: Estimated Cost of Equipment
Equipment required for plant operations were priced using Eq. 12 [2] with constants obtained
from Table 7.2 compiled by Gavin Towler and Ray Sinnott [2].
Eq. 12: 𝐶𝑒 = 𝑎 + 𝑏𝑆𝑛
Where: 𝐶𝑒 is the cost of equipment on a U.S. Gulf Coast basis, January 2010
𝑎 and 𝑏 are cost constants found in Table 7.2
𝑆 is the size parameter, for example, mass, flowrate, duty, surface area, etc.
𝑛 exponent for the type of equipment.
Yearly indexes for equipment were obtained from the Chemical Engineering Plant Cost Index [3]
to estimate a current price. Since the plant is to be built in Irvine, the West Coast location factor
obtained from Table 7.7 [2] was utilized. The indexes and location factors are presented in
Table XV where it can be applied to Eq. 13.
Eq. 13: 𝐶𝑜𝑠𝑡 𝑖𝑛 𝑦𝑒𝑎𝑟 2017 = 𝐶𝑜𝑠𝑡 𝑖𝑛 𝑦𝑒𝑎𝑟 2010 ∗𝐶𝑜𝑠𝑡 𝑖𝑛𝑑𝑒𝑥 𝑖𝑛 𝑦𝑒𝑎𝑟 2017
𝐶𝑜𝑠𝑡 𝑖𝑛 𝑦𝑒𝑎𝑟 2010
Table XV: Constants Applied to Calculated Prices
CEPCI January 2010 532.9
CEPCI January 2017 664.1
Location Factor: West Coast 1.07
Distillation column costs were estimated by adding the price of the pressure vessel shell and
valve trays. The size parameter required for the pressure vessel shell was its mass, so it was
priced based on its mass. The valve trays were priced based on diameter. The main column
and side column prices are presented in Table XVI.

21
Table XVI: Cost of Distillation Column
The distillation column cost breakdown for shell and trays are presented in Table XVII
Table XVII: Column Cost Breakdown
The costs of vessels are presented in Table XVIII. The costs of shells were estimated based on
mass. The desalter package and atmospheric tower accumulator prices were provided by the
supplier.
Tag No. Equipment Cost Comments
Columns
TWR-1 Crude Column $1,548,149.68
Cost is for shell and trays only.
TWR-2 Turbosene Sidestripper $31,842.65
Cost is for shell and trays only.
TWR-3 Kerosene Sidestripper $70,221.93
Cost is for shell and trays only.
TWR-4 Diesel Sidestripper $37,654.24
Cost is for shell and trays only.
TWR-5 AGO Sidestripper $38,109.15
Cost is for shell and trays only.
Total $1,725,977.66
Column Shell Price Tray Price Number of Trays Total
Crude Column $835,210.23 $28,517.58 25 $1,446,868.86
Turbosene Sidestripper $29,338.18 $1,252.24 2 $29,759.50
Kerosene Sidestripper $62,406.00 $3,907.97 2 $65,627.97
Diesel Sidestripper $33,251.11 $1,467.71 3 $35,190.88
AGO Sidestripper $33,706.02 $1,467.71 3 $35,616.03

22
Table XVIII: Cost of Vessels
The cost of single stage centrifugal pumps are presented in Table XIX. The cost estimate was
based on the flowrate of the pump. Though the flowrates for the raw crude charge pump
exceeded the upper limit of the size parameter given in Table 7.2, extrapolation was considered
unnecessary because the function did not increase exponentially beyond the limits.
Table XIX: Cost of Pumps
Tag No. Vessels Cost Comments
V-1 Raw Crude Charge Drum $950,842.95 Cost is for shell only.
V-3 Crude Flash Drum $181,774.55 Cost is for shell only.
V-4 Desalter Package $3,745,000.00
V-5 Atmospheric Tower Accumulator $481,500.00
Total $5,359,117.50
Tag No. Pumps Cost Comments
P-1 Raw Crude Charge Pump
$90,401.98
Cost is for 2 pumps, one operating and one spare.
P-2 Flashed Crude Charge Pump
$21,822.57
Cost is for 2 pumps, one operating and one spare.
P-3 Reflux Pump $44,461.2
0 Cost is for 2 pumps, one operating and one spare.
P-4 Naphtha Product Pump $38,769.7
1 Cost is for 2 pumps, one operating and one spare.
P-5 Jet/Turbo Product Pump $32,967.9
5 Cost is for 2 pumps, one operating and one spare.
P-6 Kerosene Product Pump
$34,272.20
Cost is for 2 pumps, one operating and one spare.
P-7 Diesel Product Pump $30,866.2
1 Cost is for 2 pumps, one operating and one spare.
P-8 Gas Oil Product Pump $26,959.6
9 Cost is for 2 pumps, one operating and one spare.
P-9 Atmospheric Resid Pump
$59,567.48
Cost is for 2 pumps, one operating and one spare.
P-10 Top PA Pump $374,500.
00 Cost is for 2 pumps, one operating and one spare.
P-11 Turbosene PA Pump $214,000.
00 Cost is for 2 pumps, one operating and one spare.
P-12 Diesel PA Pump $321,000. Cost is for 2 pumps, one operating and one

23
The cost of for the U-tube shell and tube heat exchangers are presented in Table XX. Heat
exchangers were priced were based on contact surface area. If the area required for a service
exceeded 5000 ft2 additional shells were purchased to divide the load. The number of shells
required was based on the heat integration. The streams that required air and water cooling
were priced based on a local cost factor of $10,000 per MMBtu/hr. The breakdown costs for
each stream is presented in Table XXI.
Table XX: Cost of Heat Exchangers
Tag No.
Heat Exchangers
Cost Comments
WC Cooling Water Cost
$1,021,776.00
Cost is to cool atm, turbo, diesel, diesel PA and naptha.
PH-1 Preheat 1 $18,333,243.54
PH-2 Preheat 2 $1,670,702.47
PH-3 Preheat 3 $33,143,981.09
Total $54,241,227.42
Table XXI: Heat Exchanger Cost Breakdown
Type Service Cost per Shell Number of Shells Cost
Water Cooling Atm Resid $29,262.00
Turbosene $149,312.00
Diesel $155,166.00
Diesel PA $634,317.00
Naphtha $53,719.00
Subtotal $1,021,776.00
Preheat 1 AGO $900,535.64 1 $900,535.64
00 spare.
Total $1,289,589.00

24
Kerosene $1,021,304.96 2 $2,042,609.92
Top PA $1,826,124.72 3 $5,478,374.15
Turbo PA $1,389,564.59 3 $4,168,693.76
Turbosene $965,550.42 2 $1,931,100.84
Diesel $1,835,785.06 1 $1,835,785.06
Kerosene $988,072.09 2 $1,976,144.17
Subtotal $18,333,243.54
Preheat 2 AGO $1,670,702.47 1 $1,670,702.47
Subtotal $1,670,702.47
Preheat 3 Atm Resid $1,949,645.95 17 $33,143,981.09
Subtotal $33,143,981.09
Total $54,169,703.10
The total cost summary is presented in Table XXII.
Table XXII: Total Cost Summary
Tag No. Equipment Cost Comments
Columns
TWR-1 Crude Column
$1,548,149.68 Cost is for shell and trays only.
TWR-2 Turbosene Sidestripper $31,842.66 Cost is for shell and trays only.
TWR-3 Kerosene Sidestripper $70,221.93 Cost is for shell and trays only.
TWR-4 Diesel Sidestripper $37,654.24 Cost is for shell and trays only.
TWR-5 AGO Sidestripper $38,109.15 Cost is for shell and trays only.
Vessels
V-1 Raw Crude Charge Drum $181,774.56 Cost is for shell only.
V-3 Crude Flash Drum $950,842.95 Cost is for shell only.
V-4 Desalter Package $3,745,000.
00
V-5 Atmospheric Tower Accumulator $481,500.00
Pumps
P-1 Raw Crude Charge Pump $90,401.98 Cost is for 2 pumps, one operating and one spare.
P-2 Flashed Crude Charge Pump $21,822.57
Cost is for 2 pumps, one operating and one spare.
P-3 Reflux Pump $44,461.20 Cost is for 2 pumps, one operating and one

25
spare.
P-4 Naphtha Product Pump $38,769.71 Cost is for 2 pumps, one operating and one spare.
P-5 Jet/Turbo Product Pump $32,967.95 Cost is for 2 pumps, one operating and one spare.
P-6 Kerosene Product Pump $34,272.20 Cost is for 2 pumps, one operating and one spare.
P-7 Diesel Product Pump $30,866.21 Cost is for 2 pumps, one operating and one spare.
P-8 Gas Oil Product Pump $26,959.69 Cost is for 2 pumps, one operating and one spare.
P-9 Atmospheric Resid Pump $59,567.48 Cost is for 2 pumps, one operating and one spare.
P-10 Top PA Pump $374,500.00 Cost is for 2 pumps, one operating and one spare.
P-11 Turbosene PA Pump $214,000.00 Cost is for 2 pumps, one operating and one spare.
P-12 Diesel PA Pump $321,000.00 Cost is for 2 pumps, one operating and one spare.
Heat Exchangers
WC Cooling Water Cost $1,021,776.
00 Cost is to cool atm, turbo, diesel, diesel PA and naptha.
PH-1 Preheat 1 $18,333,243
.54
PH-2 Preheat 2 $1,670,702.
47
PH-3 Preheat 3 $33,143,981
.09
Total $62,544,387.26
8.1 Estimated Plant Cost
The plant cast was estimated by determining ISBL fixed capital cost of a plant (FCI)
based off of the equipment cost and delivery. By using Equation 14 [2] the ISBL fixed capital
cost can be obtained.
Eq. 14 𝐶 = 𝐹(Σ𝐶𝑒)
Where 𝐶 is the total plant ISBL capital cost including engineering costs
𝐹 is the installation factor or the Lang factor.
Σ𝐶𝑒 is the total delivered cost of all the major equipment items.
Table XXIII outlines the calculation of the total plant ISBL capital cost. This includes a delivery
fee that is 10% of the total equipment purchase cost.

26
Table XXIII: Total ISBL Capital Cost
Component Cost
Purchase Equipment $62,544,387.26
10% Delivery $6,254,438.73
Lang Factor 4.74 [1]
Fixed-Capital Investment $326,106,435.20
8.2 Estimated Return on Investments
Based on the market prices for the main saleable products naphtha, turbosene, and
kerosene, as shown in Table XXIV, the gross income can be calculated and a return on
investment time can be estimated.
Table XXIV: 2017 Market Value of Main Products
Product 2017 Market Value
Naptha $522 per metric ton
Turbosene $1.51 per gallon
Kerosene $1.58 per gallon
Diesel $2.97 per gallon
At the flowrates specified in the H&MB for the product streams the gross income per day for
each product stream is shown in Table XXV.
Table XXV Gross Income per Day at Full Capacity
Product Gross Income
Naphtha $2,055,418.84 per day
Turbosene $1,214,970.16 per day
Kerosene $1,222,172.66 per day
Diesel $1,866,266.91 per day

27
With these rates of revenue, the capital costs of purchasing equipment can be recovered in 9.84
days and the ISBL fixed capital costs of the plant can be recovered in 51.28 days.
9: Risk Assessment and Adverse Health Effects
Occupational hazards are plentiful in raw crude distillation refineries which consist of
exposure, fires, employee fatigue, etc. In the case study of the Texas City Refinery explosion in
2005, the tragedy surmounted to understaffing, neglect of routine maintenance, and exposure to
hydrocarbon vapors [4]. The Chemical Safety Board (CSB) and Occupational Safety and
Health Administration (OSHA) enforce strict regulations to ensure refineries are safe for workers
and the public. All hydrocarbon products that will be produced in the E&C Refining Co. in Irvine
have chemical hazards and potential fire outbreaks.
The raw crude and its byproducts also causes skin and eye irritation. Long-term
exposures to any of the hydrocarbons are carcinogenic [5]. It is recommended that safety
goggles and protective gear are utilized if handling products directly. Inhalation of the
hydrocarbon vapors are also a safety issue. Breathing the vapors can cause dizziness,
headaches, and nausea. In rare cases, the vapors can render a worker unconscious. If
exposed to the product vapor, move to a well ventilated area and avoid long term exposure.
Raw crude and its byproducts are highly flammable. The hydrocarbon flash points can
be as low as 100°F. The distillation process will be handling product streams that are well
above this and extreme caution is needed. The refining process is in a closed system but leaks
can occur and ignite. Some ignition sources are heaters such as the HXR-1 heat exchanger,
sparks from pumps, and external fires [6]. In the case study of the Tosco Avon Refinery in 1999
by the US Chemical Safety and Hazard Investigation Board (2001), the ignition source was the
hot surface of the fractionator [7]. Personnel were attempting to isolate and repair a naphtha
leak from a pipe while the refinery was in operation. After numerous attempts, frustration and
impaired judgment ensued. A cut was made on the pipe, but it was not properly drained. The

28
maintenance supervisor ordered to open a flange to drain the line, but naphtha suddenly
backfired and spilled out from the cut made previously. Naphtha was ignited by the fractionator
and resulted in 4 deaths.
Following guidelines by the CSB and OSHA is imperative for safety of personnel and
public alike. Proper protocols can be found in the General EHS Guidelines given by the
International Finance Corporation and on the OSHA website.
10: Environmental Impacts
The chemical plant can emit several toxic airborne pollutants. These typically include:
nitrogen oxides (NOX)
sulfur oxides (SOX)
carbon dioxide (CO2)
volatile organic compounds (VOCs)
particulates (PM10 and PM2.5)
Polluting greenhouse gas (e.g. CO2) induced global warming by trapping infrared radiation within
Earth’s surface, thus increasing the Earth’s temperature [1]. The three main pollutants consist of
NOX, SOX, and CO2. NOX emissions can be controlled using many methods. NOX can be
managed using selective catalytic reduction (SCR) with NH3. Although expensive, flue gas
scrubbing (FGD) can be applied to SOX to monitor its emissions. Amine scrubbing can also be
used to capture CO2 emissions.
The plant’s location poses human safety hazards as well. Being situated in Irvine, the plant is
near thousands of people. Oil refinery plants typically carry noisy machinery (e.g. pumps,
compressors, and turbines) to facilitate petroleum processing and mass distribution [2]. Due to
the refinery’s proximity to residences, noise pollution can impair residents’ hearing. Oil
refineries, as previously mentioned, carry highly flammable hydrocarbons that can lead to

29
explosions. Improper handling of materials and machinery can consequently decimate the
surrounding area and lead to multiple deaths and injuries.
11: Failure Mode Effect Analyses (FMEA) on Crude Flash Drum
HAZOP of the crude flash drum was done to provide some of the hazards that can be
produced and affect the operations of the refinery.

30
Conclusion
The design of the crude distillation unit for processing 165,000 BPSD was achieved. The
necessary equipment was designed appropriately. Three heat exchangers and a heater were
designed using a heat integration curve to get the product streams to the desired temperatures
while minimizing utility usage. Information about the pumps were specified to ensure the
procurement of sufficient pumps. A column was added and sized using PRO/II to separate the
components of the crude oil. The dimensions for the raw crude charge and crude flash drum
were determined using the horizontal cylinder relationship and souder and brown correlation
respectively. Overall, the estimated fixed capital investment is $62 million which will be
recovered in 10 days of the plant operating at full capacity. The ISBL fixed capital costs are
estimated at $326 million which can be recovered within 2 months when at full capacity. Those
working in the plant are at risk to health effects from exposure to the present chemicals and
injury from equipment malfunction. The risks can be reduced by following the CSB and OSHA
guidelines. The plant can release toxic pollutants such as SOx whose emission can be controlled
by implementing techniques such as flue gas and amine scrubbing. A HAZOP report is provided
to anticipate potentially hazardous scenarios.

31
References
[1] C. Ruiz, "Process Hydraulics and Fluid Handling Equipment", UC Irvine, 2017.
[2] G. Towler and R. Sinnott, Chemical engineering design, 1st ed. Amsterdam: Butterworth-
Heinemann, 2013.
[3] Economic Indicators, WWW.CHEMENGONLINE.COM, 2017.
[4] G. Poje, I. Rosenthal, A. Taylor. Investigation Report Refinery Fire Incident: Tosco Avon
Refinery. US Chemical Safety and Hazard Investigation Board, 99-014-I-CA, 2001, p. 1-
70.
[5] U. NOAA Office of Response and Restoration, "CRUDE OIL, PETROLEUM,
[COMBUSTIBLE LIQUID LABEL] | CAMEO Chemicals | NOAA",
Cameochemicals.noaa.gov, 2017. [Online]. Available:
https://cameochemicals.noaa.gov/chemical/11018. [Accessed: 03- Jun- 2017].
[6] "OSHA Technical Manual (OTM) | Section IV: Chapter 2 - Petroleum Refining Process |
Occupational Safety and Health Administration", Osha.gov, 2017. [Online]. Available:
https://www.osha.gov/dts/osta/otm/otm_iv/otm_iv_2.html. [Accessed: 03- Jun- 2017].
[7] Investigation Report Refinery Explosion and Fire: BP. US Chemical Safety and Hazard
Investigation Board, 2005-04-I-TX, 2007, p. 1-341.