
Architectural Structure for Information System Intended ... - DIVA
Upload
khangminh22Category
view
0download
0
CENTER FOR HEALTH ECONOMICS AND POLICY STUDIES
CHEPS
WORKING PAPER SERIES
Intended and Unintended Effects of E-cigaretteTaxes on Youth Tobacco Use
CENTER FOR HEALTH ECONOMICS AND POLICY STUDIES
San Diego State University
AUGUST 30, 2021 Rahi Abouk William Paterson University
Charles Courtemanche University of Kentucky, NBER & IZA
Dhaval Dave Bentley University, NBER & IZA
Bo Feng
Georgia State University
Abigail S. FriedmanYale School of Public Health
Johanna Catherine Maclean
Temple University, NBER & IZA
Michael F. Pesko Georgia State University & IZA
Joseph J. Sabia San Diego State University & IZA
Samuel Safford San Diego State University
WORKING PAPER NO. 2021801

Intended and Unintended Effects of E-cigarette Taxes on Youth Tobacco Use*+
Rahi Abouka Charles Courtemancheb,h,i
Dhaval Davec,h,i Bo Fengd
Abigail S. Friedmane Johanna Catherine Macleanf,h,i
Michael F. Peskod,i,+ Joseph J. Sabiag,i Samuel Saffordg
Abstract
Over the past decade, rising youth use of e-cigarettes and other electronic nicotine delivery systems (ENDS) has prompted aggressive regulation by state and local governments. Between 2010 and 2019, ten states and two large counties adopted ENDS taxes. Applying a continuous treatment difference-in-differences approach to data from two large national datasets (Monitoring the Future and the Youth Risk Behavior Surveillance System), this study explores the impact of ENDS taxes on youth tobacco use. We find that ENDS taxes reduce youth e-cigarette consumption, with estimated e-cigarette tax elasticities of -0.06 to -0.21. However, we estimate sizable positive cigarette cross-tax elasticities, suggesting economic substitution between cigarettes and e-cigarettes for youth. These substitution effects are particularly large for frequent cigarette smoking. We conclude that the unintended effects of ENDS taxation may more than fully offset any public health gains. Keywords: Electronic nicotine delivery systems (ENDS), e-cigarettes, vaping, cigarettes, smoking, taxes, youth.
JEL codes: H2; I1; I18
* Acknowledgements and notes: Author order is alphabetic and lead authorship is shared amongst all the authors. Research reported in this publication was supported by the National Institute on Drug Abuse of the National Institutes of Health under award number R01DA045016 (PI: Michael Pesko), R01DA039968 (PI: Dhaval Dave), and an Evidence for Action grant from the Robert Wood Johnson Foundation (grant #74869; PI: Friedman). Dr. Sabia acknowledges support from San Diego State University’s Center for Health Economics & Policy Studies (CHEPS), Dr. Courtemanche acknowledges support from the University of Kentucky’s Institute for the Study of Free Enterprise, and Dr. Abouk acknowledges support from William Paterson University’s Cannabis Research Institute. a Department of Economics, Finance, and Global Business, William Paterson University, Wayne, NJ. b Department of Economics, Gatton College of Business and Economics, University of Kentucky, Lexington, KY. c Department of Economics, Bentley University, Waltham, MA. d Department of Economics, Andrew Young School of Policy Studies, Georgia State University, Atlanta, GA. e Department of Health Policy & Management, Yale School of Public Health, Yale University, New Haven, CT. f Department of Economics, Temple University, Philadelphia, PA. g Department of Sociology & Center for Health Economics & Policy Studies, Michigan State University, East Lansing, MI. h National Bureau of Economics Research, Cambridge, MA. i Institute for Labor Studies, Bonn, Germany + Corresponding author: Michael F. Pesko, Associate Professor; Department of Economics; Andrew Young School of Policy Studies; Georgia State University; and IZA; [email protected].

1
1. Introduction
In 2009, public health officials in the United States established Healthy People 2020 goals,
one of which was to reduce the youth smoking rate from 19.5% to 16.0% by 2019
(HealthyPeople.gov 2020). In the introduction to a 2012 Surgeon General report on smoking,
Department of Health and Human Services Secretary Kathleen Sebelius warned that “youth and
adult smoking rates that had been dropping for many years have stalled” (US Department of Health
Human Services 2012). This situation quickly changed, however, as youth smoking rates fell to 6.0%
by 2019, thus surpassing the Healthy People 2020 objective by 386%. What caused such an
unanticipated decline in youth cigarette smoking?1 One candidate is the introduction of electronic
cigarettes and other electronic nicotine delivery systems (‘ENDS’). ENDS were first imported into
the US in August 2006 (CASAA 2020), and overtook cigarettes as the most commonly used tobacco
product among youth in 2014 (Pesko and Warman 2021). In 2019, 32.9% of youth used an ENDS
over the past 30 days, while 10.7% used ENDS frequently; that is, on 20 or more of the past 30 days
(Centers for Disease Control and Prevention 2020).
On the whole, the current scientific consensus is that ENDS are likely substantially less
dangerous than combustible tobacco products (e.g., cigarettes), which are estimated to kill 480,000
Americans annually (United States Surgeon General 2014). However, the exact relative risks remain
uncertain. Based on data from an August 2020 survey of 137 tobacco scholars, the mean (median)
tobacco expert believed that the effect of vaping ENDS on quality-adjusted life expectancy was 37%
(25%) as large as the effect of smoking (Allcott and Rafkin 2021). Accounting for harms to others as
well as the user, a 2013 expert panel concluded that ENDS were unlikely to exceed 5% of the harm
of cigarettes (Nutt et al. 2014), a statistic cited in subsequent reviews of evidence on ENDS’ effects
sponsored by Public Health England (McNeill et al. 2018). While the US debate does not use a
specific estimate for these products’ relative risks, the National Academies of Sciences, Engineering,
and Medicine’s 2018 report concluded that “e-cigarettes appear to pose less risk to an individual
than combustible tobacco cigarettes” and “e-cigarette aerosol contains fewer numbers and lower
1 Some data sources, such as the National Youth Tobacco Survey, show an acceleration in youth cigarette use reductions starting in 2012 (Meza, Jimenez-Mendoza, and Levy 2020), but this acceleration is not obvious in other data sources. However, assuming that demand curves are convex in the left and/or straighter or concave in the middle, cigarette regulation would yield less impact in terms of reducing smoking from lower levels of use than higher levels of use. Therefore, the continuation of smoking reductions even through low levels of youth cigarette use as we have seen recently could suggest e-cigarette introduction had an impact larger than is immediately obvious from observing raw consistent trends in youth smoking declines.

2
levels of toxicants than smoke from combustible tobacco cigarettes.” Health costs may be higher,
however, for informally sourced e-cigarette products (e.g., related to unknown additives) than
mainstream commercial e-cigarettes.
ENDS may affect youth health differently than adult health. One commonly cited reason is
the potential deleterious effects of nicotine on youth brain development. However, as this evidence
is based mostly on studies of rodents (United States Surgeon General 2016), the relationship’s
generalizability to humans is unclear (Balfour et al. 2021). Similarly, the magnitude of the danger
posed by nicotine compared to other substances like alcohol, tetrahydrocannabinol (THC), caffeine,
and sugar on adolescent brain development is also unclear.
Another commonly-voiced concern is the 2016 Surgeon General report’s conclusion that “e-
cigarette use is strongly associated with combustible tobacco product use” (United States Surgeon
General 2016). However, the idea that this association reflects a causal effect of e-cigarette use on
subsequent smoking is inconsistent with the typical directionality of uptake over time—daily
smoking is more common among young adults who tried cigarettes before e-cigarettes (Friedman,
Buckell, and Sindelar 2019; Etter 2018). This stated association also fails to accurately forecast
rapidly declining youth cigarette use. Despite limited causal evidence that ENDS access negatively
impacts youth health, the Surgeon General has declared high rates of youth ENDS use to be an
epidemic (United States Surgeon General 2018).
Policies designed to reduce access to ENDS therefore appear to prioritize the goal of
reducing nicotine exposure over the goal of harm reduction. Such regulations have been increasing
over time, beginning with ENDS minimum legal sales ages of 18 or higher implemented in all states
between 2010 and 2016. As of March 2021, 30 states had adopted ENDS taxes (Public Health Law
Center 2021) while 23 had added ENDS to their existing indoor smoking laws (American Non-
Smokers Rights Foundation 2021).
Further, the future of ENDS sales in the US is uncertain. To authorize marketing for
individual ENDS products, the Food and Drug Administration (FDA) must determine that these
products are appropriate for public health. While the FDA reviews millions of premarket tobacco
product applications, it is currently allowing the sale of ENDS through enforcement discretion. But
some localities are unwilling to wait out this review process: as of June 2020, 33 cities and three
American Indian reservations had banned the sale of all ENDS (Truth Initiative 2020).
3
Despite significant interest in the effect of regulation on youth ENDS use in particular,
studies have not yet estimated the effect of differential ENDS taxes on youth ENDS and
combustible tobacco product use. We explore this question using two nationally representative
datasets: Monitoring the Future (MTF) and the Youth Risk Behavior Surveillance System (YRBSS).
Specifically, we use a continuous treatment difference-in-differences research design to estimate the
relationship between ENDS taxes and a variety of outcomes, including ENDS use, combustible
tobacco product use, sources of ENDS products (e.g., online purchasing, brick-and-mortar retailers,
informal sources), and perceived risk of ENDS use.
By documenting both intended and unintended effects of ENDS taxation on youths, this
study’s findings inform optimal ENDS tax policy. In particular, our results speak directly to the
question of whether ENDS accessibility reduces youth combustible tobacco use. If this indirect
effect on youth tobacco use is positive and large, and the direct harms of ENDS use are small, then
imposing large taxes on ENDS products could worsen public health on net.
2. Background and related literature
2.1 ENDS taxation literature
There is a nascent but growing economic literature studying the effect of ENDS taxes on
vaping and smoking outcomes. Broadly, the available literature suggests that ENDS and cigarettes
are economic substitutes,2 although the magnitude of this relationship may vary across populations.
This finding of substitution is consistent with literature finding minimum legal sales ages for ENDS
reduce youth ENDS use (Nguyen 2020; Dave, Feng, and Pesko 2019; Abouk and Adams 2017) and
increase youth smoking (Friedman 2015; Pesko et al. 2016; Pesko and Currie 2019; Dave, Feng, and
Pesko 2019). A substitution relationship between cigarettes and ENDS is concerning for
policymakers as, if true, restricting access to one good may increase demand for the other. Below,
we review existing studies on ENDS taxes and tobacco use, and highlight our contributions to this
literature. This section also provides evidence that ENDS accessibility, proxied by the price of the
product, has a public health benefit in reducing combustible tobacco use.
2 One key exception is that Abouk and Adams (2017) find that minimum legal sales ages for ENDS reduces cigarette use among senior high school students, suggesting a complementary relationship between ENDS and cigarettes for this particular population group.
4
Overall population: Using Nielsen Retail Scanner Data (NRSD) from 2011 to 2017, Cotti et al. (2021)
show that a $1.00 increase in the ENDS tax reduces ENDS sales by 29% and increases cigarette
sales by 10%. Instrumenting prices with taxes, the authors also calculate an ENDS own-price
elasticity of -1.3 and positive cross-price elasticities of demand between ENDS and cigarettes,
indicating economic substitution. Allcott and Rafkin (2021) also use Nielsen data within the context
of a broader shift-share paper, finding some evidence of substitution depending on whether time
trends are included in the regression model or not.
Adults: Pesko, Courtemanche, and Maclean (2020) use 2011-2018 data from the Behavioral Risk
Factor Surveillance Survey and the National Health Interview Survey to study the effects of ENDS
and cigarette taxes on adult vaping and smoking. The authors find that a $1.00 increase in the
ENDS tax rate increases adult daily smoking propensity by 5.3% and the probability of “dual use”
(i.e., consuming both ENDS and cigarettes) by 24.4%. Further, a $1.00 increase in the cigarette tax
rate leads to a 14.2% increase in adult daily vaping (Pesko, Courtemanche, and Maclean 2020).
Considering the experience of Minnesota, which adopted the first in the nation ENDS tax in August
2010, Saffer et al. (2020) test the effect of ENDS taxation on adult smoking. Using synthetic control
methods, the authors find that adult smoking increases while cessation decreases following an
ENDS tax hike. The results imply a cross-elasticity of current smoking participation with respect to
ENDS taxes of 0.13.
Pregnant women: Abouk et al. (2020) study the effects of state and local ENDS taxes on pregnant
women’s smoking behaviors. The authors use national birth record data from 2013 to 2017 and
investigate the effect of ENDS taxes on pre-pregnancy smoking, prenatal smoking, and birth
outcomes. They find that raising ENDS taxes by $1.00 increases pre-pregnancy and prenatal
smoking by 0.4 percentage points (pp). Using data from the Pregnancy Risk Assessment Monitoring
System, the authors also find that ENDS taxes reduce pre-pregnancy ENDS use by 1.3 pp.

5
Youth: Two studies examine taxation effects among youth and are therefore arguably most relevant
to the current paper. Pesko and Warman (2021) examine the effect of Minnesota’s 2013 ENDS tax
increase—that is, above the tax level when first adopted in 2010—on youth smoking. The authors
find that a 100% ad valorem tax increases cigarettes smoked among youth (unconditional on
smoking status) by five additional cigarettes per month, or a little over three packs monthly for
smokers using the mean youth smoking rate of 7.9%. Anderson, Matsuzawa, and Sabia (2020)
primarily study the effect of cigarette taxes on youth marijuana use, but include an extension to the
main analysis estimating the effect of ENDS tax adoption in three states (California, Pennsylvania,
and West Virginia) using two waves of YRBSS data (2015 and 2017), one of the datasets we employ.
Their empirical models use an indicator variable for ENDS taxes, implicitly treating all taxes
equivalently regardless of their size and ignoring later changes in state ENDS tax rates. They find
that ENDS tax adoption reduces current ENDS use by 3.4 pp and daily ENDS use by 0.8 pp, with
imprecisely estimated effects on cigarette use.
To further our understanding of how ENDS taxes impact youth vaping and smoking, we
build on these two studies in several ways. First, we leverage variation in ENDS taxes generated by
ten states and two counties rather than a single state (Pesko and Warman 2021) or three states
(Anderson, Matsuzawa, and Sabia 2020). Second, we quantify and exploit heterogeneity in ENDS
tax magnitudes. These tax sizes vary substantially, from $0.05 per fluid milliliter (mL) in Delaware,
Kansas, Louisiana, and North Carolina to over a $1.00 per fluid mL in California, Minnesota, and
Washington DC. Considering these differences allows us to report our findings in standard tax-
elasticity terms and informs policy discussions by quantifying effects on youth tobacco product use
for a specific tax policy. Third, we explore ENDS tax effects on how youth obtain ENDS. Given
evidence that the 2019 outbreak of vaping-associated lung injuries was driven by additives in
informally-sourced vaping products, shifts in youth product sourcing—e.g., from licensed retailers
to informal contacts who may mix their own vaping concentrates outside of a retail setting like a
vape shop—could have substantive health implications. Fourth, we consider a range of tobacco
products that are common among youth but are taxed less aggressively (e.g., cigars), allowing us to
characterize multiple margins along which youth may respond to ENDS taxes.
6
3. Data and methods
3.1. Data
Our analyses match policy data to two survey datasets, each of which has complementary
strengths: the annual MTF dataset and the biennial YRBSS. Restricted-use, annual MTF data cover a
nationally representative sample of 8th-, 10th-, and 12th-grade students in middle and high schools in
the contiguous US, interviewing about 45,000 youth from nearly 400 public and private schools each
year. Our main analytic sample is comprised of the 2014 to 2019 MTF data, as the survey first asked
about ENDS use in 2014 and the most recent data available are from 2019. However, we extend the
sample back to 2011 for cigarette use outcomes in a sensitivity analysis. Restricted-use MTF data
allow us to identify the county where each respondent’s school is located, in order to match
respondents to their tobacco policy exposure at the county level.
The MTF survey includes several questions about cigarette and ENDS use and perceived
risk of regular ENDS use. We use different questions to create the following variables, as described
in detail in the Online Data Appendix: current ENDS use,3 frequent ENDS use (20 or more days
over the past 30 days), ENDS initiation during the school year, ever ENDS use, current cigarette
use, current cigarette or cigar use, current half pack daily cigarette use, and perceived likelihood of
regular ENDS use being highly risky. In general, MTF information is collected across six different
surveys (forms) each year, with ENDS questions included on a subset of these forms. Consequently,
ENDS sample sizes are somewhat smaller than cigarette sample sizes. Ever ENDS use and ENDS
initiation in particular were not collected in 2014 and only on select forms thereafter. For some
years, some small states do not have any schools participating in the MTF survey. We focus our
main MTF analyses to a balanced sample of states in order to reduce sampling variability, which
causes six small states to fall out of regression analysis, including two with e-cigarette taxes.4
Reassuringly, our results also hold when estimated on an unbalanced panel.
3 Since 2017, MTF has asked respondents more detailed questions about ENDS use, including questions on whether respondents “vape” nicotine, marijuana, or flavoring. For these years, we consider vaping nicotine as ENDS use, but not vaping marijuana. This general change in the wording of the ENDS-related questions will be captured in the models by the period fixed-effects. We also show later (Appendix Table 8) that redefining our outcome as “any vaping” to be consistent with the pre-2017 questionnaire wording and ignoring the detail provided from the post-2017 change, has very little effect on the main estimates. 4 MTF disclosure rules prevent naming specific states.

7
The National and State YRBSS survey high school students in public and private schools
across the US about their health behaviors biennially. The Centers for Disease Control and
Prevention (CDC) administer the National YRBSS, while State YRBSS data are collected by state
education and health departments under CDC supervision, using a similar survey instrument. As
YRBSS first asked about ENDS use in 2015, our analytic sample is limited to 2015-2019. Pooling
the National and State datasets provides for greater statistical power due to an increased sample size
(N>580,000), and ensures that all states that adopted an ENDS tax by the end of June 2019 are
represented.
YRBSS asks about ever use and frequency of past-30-day use for cigarettes, “electronic
vapor product[s]” followed by example brand names marketed as nicotine e-cigarettes (e.g., Juul,
Vuse, blu),5 and “cigars, cigarillos, or little cigars,” as well as how respondents usually obtain ENDS
products. Additionally, the final two surveys also collected information on youth source of ENDS
(e.g., retail, internet, social, other). While National and State YRBSS identify the state where a
respondents’ school is located, they do not provide county or other substate identifiers.
We weight both the MTF and the state and national YRBSS to return nationally
representative results. To construct weights, we use the National Cancer Institute’s Surveillance,
Epidemiology and End Results Program (SEER) data to calculate the state-by-year share of the
youth population that falls in each age-by-gender-by-race/ethnicity bin i, sist (age 14, age 15, age 16,
age 17, age 18, male, female, non-Hispanic white, non-Hispanic Black, Hispanic, and other
race/ethnicity). We then calculate each respondent's sample weight as [sist/nist]*StatePop14_18st,
where nist is the number of YRBSS sampled individuals in age-by-gender-by-race-ethnicity bin i in
state s at year t and StatePop14_18st is the SEER estimated population of 14-to-18-year-olds in state
s at year t. In this construction, we are following the recent literature that applies similar SEER-
constructed weights in analyses of the combined YRBSS data (Rees, Sabia, and Kumpas (2020);
Bryan et al. (2020); and Sabia and Anderson (2016)). We use the SEER-constructed weights to
accommodate the multi-year and multi-grade MTF analysis, and to maintain consistency with the
YRBSS analysis. Sensitivity analyses also show that our results are similar when using unweighted
data.
5 Please see Online Data Appendix for question prompts and wording.

8
We match tobacco control and other related policy data from public and proprietary sources
to respondents by county for MTF and by state for YRBSS (since we do not have sub-state level
information for YRBSS). We match these policy data by quarter for MTF and by year for YRBSS,
since the YRBSS does not include month or quarter of interview information. In particular, we
average values across the 1st and 2nd quarters of each YRBSS survey year to match that survey’s
spring semester time frame. Policy variables include cigarette excise taxes (the summation of federal,
state, and local), comprehensive smoking bans, comprehensive vaping bans, ENDS MLSA laws,
Tobacco 21 laws, beer taxes, vertical ID laws, medical and recreational marijuana laws,
unemployment rates, and poverty rates. See the Online Data Appendix for further information and
sources. All local laws are population-weighted to the county level for MTF and to the state level for
YRBSS. All monetary variables are adjusted to 2019 dollars using the Bureau of Labor Statistics’
Consumer Price Index.
Our main policy variable of interest is the state or local ENDS tax rate. ENDS taxes are
levied in different ways, including as an excise tax per unit or fluid mL of liquid, or as an ad valorem
tax on wholesale prices. These data are standardized to a single ENDS tax per fluid mL measure as
shown in Table 1. For reference, one Juul pod has 0.7 fluid mL, equivalent to approximately one
pack of cigarettes (Truth Initiative 2019).6
Table 2 reports MTF and YRBSS descriptive statistics with weights for the variables
discussed above, separately for the overall sample and two sub-samples: areas that implemented
ENDS taxes by the end of 2019 and areas that did not. Current ENDS use rates are 15.1% in MTF
and 21.1% in YRBSS, with mean rates approximately 1.5 pp higher in non-treated than treated
states. Current cigarette use rates are approximately 6.6% in the MTF and 8.1% in the YRBSS, and
are also moderately higher in non-treated states. YRBSS results may report higher ENDS use in part
because YRBSS only includes high school students, whereas MTF also includes 8th graders, who are
less likely to use these products.
Non-adopting states appear to have higher shares of white, non-Hispanic youth, and less
restrictive tobacco control regulation generally, though higher beer taxes and less marijuana access.
Unweighted descriptive results are provided in Appendix Table 1.
6 Between 2014 to 2019, the correlation between population-weighted state-level, quarterly e-cigarette taxes and cigarette taxes was 30.4%, suggesting significant independent variation remains in both variables.

9
3.2. Methods
To investigate the effect of ENDS taxes on youth vaping and smoking outcomes, we
estimate the following regression model for county-level MTF data:
(1) 𝑌𝑌𝑖𝑖𝑖𝑖𝑖𝑖 = 𝛼𝛼 + 𝛾𝛾𝑖𝑖 + 𝛿𝛿𝑖𝑖 + 𝛽𝛽1𝐸𝐸𝐸𝐸𝐸𝐸𝐸𝐸 𝑡𝑡𝑡𝑡𝑡𝑡𝑖𝑖𝑖𝑖 + 𝑋𝑋𝑖𝑖𝑖𝑖𝛽𝛽2 + 𝑍𝑍𝑐𝑐𝑖𝑖𝛽𝛽3 + 𝜀𝜀𝑖𝑖𝑖𝑖𝑖𝑖.
The parameter 𝛽𝛽1 is the coefficient of interest, which captures the effect of ENDS taxes on our
outcomes. 𝑋𝑋𝑖𝑖𝑖𝑖 is a covariate matrix comprised of individual-level sociodemographic variables
(gender, age, grade, and race/ethnicity [white, Black, Hispanic, and other], along with missing-value
indicators for each sociodemographic variable). 𝑍𝑍𝑐𝑐𝑖𝑖 adjusts for the policies described above.
Standard errors are clustered by state for both data sources.
Distinct analyses will consider each of the following outcomes as 𝑌𝑌𝑖𝑖𝑖𝑖𝑖𝑖: any ENDS use in the
past 30 days, frequent ENDS use (20 or more days over the past 30 days), initiating ENDS use
during the school year, current cigarette use, various measures of heavy cigarette use, current
cigarette or cigar use, perceived likelihood of regular ENDS use being highly risky, and source of
ENDS (e.g., retail, internet, social, other).
The above specification is based on a continuous treatment difference-in-differences
research design, capitalizing on the variation in treatment intensity generated from states newly
adopting ENDS taxes of varying levels and some states making further changes to their tax rates
post-adoption. The specification includes “two-way fixed effects” (TWFE) to account for spatial
and temporal heterogeneity. Fixed-effects for year-quarter of interview (𝛿𝛿𝑖𝑖) adjust for national time
trends, while area fixed-effects (𝛾𝛾𝑖𝑖) adjust for time-invariant differences in the outcome variable by
tax jurisdiction l, defined here as states with two exceptions: Cook County, Illinois and Montgomery
County, Maryland, both of which are separated from their respective states due to local ENDS
taxes, as in other work (Cotti et al. 2021; Allcott and Rafkin 2021). As the vast majority of our
identifying variation comes from time-varying state-policies and the data are not representative at
the county-level, tax jurisdiction fixed effects were preferred to county-fixed-effects (to avoid losing
variation from counties that were not surveyed before and after an ENDS tax change).
10
As YRBSS data lack interview quarter and county identifiers, we conduct those analyses at
the state-by-year level rather than tax jurisdiction-by-quarter level. Otherwise, the MTF and YRBSS
specifications are identical.
4. Results
4.1 Effects on ENDS outcomes
Table 3 presents estimates of the standardized ENDS tax rate’s effects on youth ENDS use.
The first four columns’ specifications leverage the MTF’s ENDS data availability to estimate
responses along various consumption margins. Coefficient estimates generally suggest that higher
ENDS taxes are effective in reducing use among youth, with marginally significant reductions (10%
level) in current and regular ENDS use, and a statistically significant decline in ever-use. Specifically,
a $1.00 increase in the standardized tax, which represents about twice the observed standard
deviation in the tax, reduces the likelihood of currently using ENDS by 1.9 pp (model 1). The
estimated ENDS participation tax elasticity is -0.08, which under reasonable assumptions translates
into an ENDS participation price elasticity of -0.47 for the youth population.7,8
The ENDS participation margin here combines regular users and occasional users. Most
adolescents (about three out of four) who report currently using ENDS do so occasionally and are
not regular users (see Table 2). When we expressly consider whether higher ENDS taxes impact
those who use ENDS more frequently, we continue to find a marginally significant negative effect.
Comparing the coefficient estimates between current use and regular use indicates that about two-
thirds of the reduction in current use associated with higher ENDS taxes is driven by a reduction in
regular use (1.3/1.9 pp), suggesting that this latter, more intense, margin of use is especially elastic.
7 The elasticity is estimated based on the mean tax rate and e-cigarette outcome for the treated units. In other words, ε = β∙𝔼𝔼(x)/𝔼𝔼(y), where 𝔼𝔼(x) and 𝔼𝔼(y) are calculated using data points from the treated units over the sample period. We use the treated units for this calculation for two reasons. First, note that 𝔼𝔼(x) is by definition zero for the non-treated units. Second, this measure of the elasticity captures the average treatment effect on the treated (ATT), summarizing what would have happened to the tobacco use outcomes in the treated states in the absence of the treatment. 8 The price elasticity can be derived from the tax elasticity as follows: εPrice = εTax * (1/Tax pass-through) * (1/Share of tax in the price). Cotti et al. (2020) estimate that e-cigarette taxes are generally fully passed on to retail prices, and comprise about 16% of the observed retail price. If the tax pass-through is larger than one, which is possible under monopsony market conditions, then the implied price elasticity would be lower in magnitude. For instance, if the tax pass-through is 1.33 (see Saffer et al. 2020), then the implied e-cigarette price-participation elasticity would be -0.35.
11
This pattern is borne out by the estimated tax elasticity of regular use, which is more than double the
participation elasticity (-0.21 vs. -0.08).
Current ENDS participation also includes first-time consumers. The initiation margin is
particularly salient for adolescents given the rising prevalence of youth ENDS use and because
adolescent initiation may influence future transitions and paths to nicotine dependence. Column
(3)’s results suggest that higher ENDS taxes may deter initiation, with an imprecisely estimated but
meaningful effect magnitude: implied tax and price elasticities (-0.06 and -0.38) are similar to those
for ENDS participation. This imprecision may be due to initiation being a noisy measure.9 We
therefore turn to ever-use of ENDS, which is directly reported in the data, as a proxy for initiation
and experimentation (Dave et al. 2019). By definition, changes in ever-use between years (t-1) and (t)
— the variation being leveraged in fixed-effects models — equal the prevalence of new initiates and
experimenters in year (t). Thus, taxes’ effects on ever-use should reflect their impacts on new
initiation and experimentation. We find a significant and relatively large effect of ENDS taxes on
ever-use of ENDS: the estimated tax elasticity of -0.15 suggests that the initiation and
experimentation margins for youths are responsive to higher taxes, and perhaps even more so than
participation.10 Estimates based on the ever-use measure, however, should be interpreted with care:
this measure’s ability to capture initiation and experimentation effects relies on certain assumptions
that we test below.11
Reassuringly, the last column in Table 3 confirms that higher taxes significantly and
effectively reduce current ENDS use in a different adolescent sample (YRBSS). That coefficient
estimate is larger than the MTF estimate, perhaps due in part to higher mean ENDS use in the
9 Initiation generally cannot be measured directly in surveys, including MTF. As noted in the Online Data Appendix, a youth is defined as initiating e-cigarette use if their grade at the time of interview matches the grade they reported first trying e-cigarettes. The measurement error in initiation may stem from potential recall errors in the reported grade at first use, and potential temporal mismatch between the academic year (when the initiation occurred over this period) and the calendar year/month over which our e-cigarette tax measures are matched. 10 The confidence intervals across these estimates overlap, however, and we are not able to reject the null that the tax elasticities for participation, regular use, and ever-use are similar. 11 Specifically, since ever-use is a cumulative “stock” measure, and changes in ever-use across adjacent periods capture the “flow” of new initiates and experimenters, the implicit assumption for the estimate in column (4) to capture effects on initiation and experimentation is absence of policy endogeneity (tax policy in period t is orthogonal to ever-use in t-1). We assess this assumption and present various checks in the results that follow.
12
YRBSS, which started collecting ENDS data later and considered older respondents (high school
students only) than MTF (Table 2).12
The own-tax elasticity ranges from -0.06 to -0.21 across these margins and datasets.13
Estimates of the cross-effects of cigarette taxes on ENDS use are generally insignificant, in line with
recent evidence that cigarette taxes may have lost their bite in terms of affecting youth (Hansen et al.
2017). Only for regular ENDS use is there a marginally significant effect of cigarette taxes,
suggesting that higher cigarette taxes may drive some adolescents to substitute towards frequent
ENDS use, consistent with the products being economic substitutes for youth.
Table 4 reports estimates for other outcomes related to ENDS use, including perceived risk
(from the MTF) and source of ENDS purchases (from the YRBSS). Column (1) suggests that higher
ENDS taxes significantly increase the perceived risk of using that product. While stricter tax policy
might lead adolescents to adjust their risk beliefs directly, perhaps by reducing the general availability
of ENDS and drying up the social market, an alternative explanation is that risk beliefs are
concurrent to (or bundled with) individuals’ consumption decisions. For instance, Viscusi (2016)
finds that cigarettes users expect ENDS to be less risky than non-users. In this context, the
reduction in ENDS use and initiation (Table 3) and the upward adjustment of the perceived risk of
ENDS use (Table 4, column 1) go hand-in-hand.
Given that retailers are restricted from selling ENDS to youth (by federal law since August
2016 and in most states even earlier than that), the finding that youth are responding to the
monetary cost of a product that they are legally restricted from purchasing may appear
counterintuitive.14 However, as shown in Table 2, a sizeable fraction (25%) of adolescents who use
ENDS report purchasing the product themselves either through retail or internet sources (25%).
These individuals would be directly affected by any increase in the monetary cost. Others who
12 The imputed tax elasticity based on the YRBSS estimates is around -0.16, about double the estimate from the MTF, though overlapping confidence intervals do not permit us to reject the null of no difference. 13 These estimates and the implied own-price elasticity estimates (-0.38 to -1.31) are very similar to those derived for cigarettes in the 1990’s and 2000’s (Ross and Chaloupka 2003; Carpenter and Cook 2008), though the most recent evidence suggests that youth are now far less responsive to cigarette taxes and prices. 14 All models control for state adoption of minimum legal sales age restrictions for e-cigarettes.

13
obtain ENDS through social sources or third-party purchases may also be affected (e.g., if price
increases are passed on via the third party or affect peers’ willingness to share).15
As expected, retail purchases by youth are the most responsive to higher ENDS taxes (see
Table 4). A $1.00 increase in ENDS taxes reduces the likelihood that youth obtain their ENDS
through retail sources by about 7.6 pp (41.1% relative to the sample mean). Moreover, we also find a
significant reduction in “other sources” (e.g., taking ENDS from a store or person). These findings
are consistent with Table 3’s coefficient estimates, corroborating the hypothesis that higher taxes
decrease youth ENDS consumption primarily through retail purchases. Moreover, the indication
that higher taxes may shift how teens acquire ENDS is notable. Specifically, among those who
continue to use ENDS, there is evidence of substitution away from retail and other sources into
social sources (10.1 pp or 16.1% increase), a shift which may have direct adverse health effects if
such informally, socially-sourced ENDS products are more likely to be contaminated with unknown
additives. Critically, higher cigarette taxes, which lower the relative cost of ENDS, appear to have
inverse effects, encouraging significant substitution towards retail ENDS purchases and away from
the social market.
4.2 Effects on cigarettes and other tobacco use
While higher ENDS taxes appear to significantly deter youth from using ENDS, the public
health implications of this impact depend on potential substitution towards other higher-risk
tobacco products. We assess this possibility with the results reported in Table 5, considering
reported use of combustible tobacco products (cigarettes and cigars) from MTF (columns 1-3) and
YRBSS (columns 4-7). Coefficient estimates based on the MTF sample suggest that higher ENDS
taxes significantly increase cigarette use, on both the extensive and intensive margins. Consumption
of at least a half pack per day is particularly responsive to shifts in ENDS tax policy, with an
estimated elasticity of 0.34 (compared to the cross-tax participation elasticity of 0.12). YRBSS
sample estimates suggest a similar pattern of substitution into cigarette use from higher ENDS taxes,
with coefficient estimates largely similar to the MTF estimates though highly imprecise due to
15 In the case of cigarettes, youth acquisition in the social market has generally not been found to be responsive to cost, though higher cigarette taxes do reduce the likelihood of youth obtaining their cigarettes through third-party purchases (Katzman, Markowitz, and McGeary 2007; Hansen, Rees, and Sabia 2013)

14
inflated standard errors. Across outcomes, own-effects of cigarette taxes are negative but not
statistically distinguishable from zero.16
If ENDS taxes impact the demand for other tobacco products only through their direct
effects on the demand for ENDS, the own-tax effects on ENDS use in Table 3 can be construed as
a “first-stage” effect, bounding the size of the impacted adolescent population that may substitute
towards other tobacco products. Specifically, MTF estimates suggest that a $1.00 increase in the
ENDS tax reduces ENDS participation by about two pp. We would therefore not expect the
spillover effects of ENDS taxes on cigarettes to be larger than this magnitude. About 2% of
adolescents (based on the MTF) are changing their ENDS use behaviors due to higher ENDS
taxation, and a subset of these (1.3 pp or about 68% of the impacted population) are switching to
cigarettes. This “treatment-on-the-treated” effect is smaller if we use the YRBSS estimates, which
suggest that as many as 23% of teens who respond to higher ENDS taxes with reduced ENDS use
are substituting towards regular cigarette use. Such scaled estimates should be interpreted with
caution, and are meant to be suggestive, since they can vary dramatically with small changes in the
underlying parameters. Nevertheless, they provide a means to gauge the credibility of estimated
ENDS tax effect-sizes, and broadly suggest that a non-negligible fraction of teens incentivized to
reduce their use of ENDS could be substituting into combustible tobacco use instead.
4.3 Effects on dual-use and any use outcomes
Across our sample period, approximately 30% of current (past-month) ENDS users also
currently use cigarettes. From a health perspective, “dual-use” could represent a good or bad
outcome. Dual-use of e-cigarettes and a combustible tobacco product could be health-improving if
it represents attempts to quit and/or reduce cigarette smoking, or health-deteriorating if it facilitates
continued smoking among individuals who would otherwise quit (e.g., if they could not continue
using nicotine in smoke-free locations). In Table 6, we do not find statistically-significant evidence
that e-cigarette taxes affect youth dual-use or for that matter, an indicator for any use indicator (i.e.,
of e-cigarette or combustible tobacco).
16 The cigarette participation elasticity ranges from -0.03 to -0.36, and is not statistically significant in any of the specifications. This pattern is in line with recent evidence suggesting that youth are no longer very responsive to changes in cigarette taxes (Hansen, Sabia, and Rees 2017).
15
4.4 Heterogeneous effects of ENDS taxes
In Figures 2-4, we assess whether vaping- and smoking-responses to ENDS taxes differ
across gender, age, and race. These figures summarize estimates from stratified samples, parallel to
the pooled-sample coefficient estimates presented in Tables 3-5. In our discussion of these results,
we draw on the weight of the evidence across broad patterns that emerge from these coefficient
estimates.
Figures 2a and 2b respectively present heterogeneous responses in ENDS use across sub-
populations from the MTF and the YRBSS. The effect of higher ENDS taxes on ENDS use is
largely negative for all groups, though some interesting differentials emerge. While ENDS taxes
affect male and female ever-use similarly, only females show statistically significant current- and
regular-use responses. The tax effect is also generally larger for older adolescents (ages 16+) than
younger adolescents (ages < 16), consistent with more ENDS use among older teens. This pattern
may also reflect greater reliance on retail sources among older teens, as retail purchases are expected
to be more elastic to cost.17 Though not statistically-significantly different, whites may also be
somewhat more tax-responsive in their ENDS use than non-whites.
When it comes to risk perceptions regarding ENDS, there is some indication that female
teens’ risk beliefs are more elastic with respect to taxes than males (Figure 3a). Differences are even
more evident by race: white teens exhibit a much stronger and significant upward revision of their
perceived risk of ENDS in response to ENDS taxes, while effects for non-white teens are close to
zero and insignificant.
Figure 3b presents differential effects across sources of ENDS acquisition based on the
YRBSS. Mirroring the heterogeneity in consumption and use by age, we find that retail purchases (a
much more important source of ENDS for older teens and teens that regularly use e-cigarettes) are
more responsive to taxes for older than younger adolescents. Similarly, higher ENDS taxes appear
to significantly limit younger teens’ reliance on the social market, a source which tends to be
17 According to 2017 and 2019 YRBSS data, 27.7% of teens ages 16+, who are e-cigarette users, report obtaining their e-cigarettes via retail sources; in contrast, only 5.5% of younger e-cigarette users report that they acquired their e-cigarettes via retail sources. Additionally, only 21.2% of current ENDS users report retail sources of e-cigarettes, but this rises to 38.7% and 42.9% for frequent and daily users.

16
relatively more important for that age-group.18 This relationship may operate as a chain reaction,
since many younger teens obtain ENDS by borrowing them from friends or older peers. Specifically,
if ENDS taxes constrain older peers’ ability to purchase ENDS from retail sources, downstream
effects may limit younger teens’ ENDS access through social sources. Figure 3b also suggests that
older teens may respond to ENDS taxes by substituting towards social sources (Figure 3b) and
constraining their own retail purchases, though the substitution here is less than one-to-one. This
behavior might be explained if, ex ante, older teens are more likely to pay for their ENDS, while
younger teens rely more on “bumming” a vape. In this case, ENDS taxes would have more impact
for older teens, and thus larger effects on their current and frequent ENDS use, in line with Figures
2a and 2b. Those who substantially reduce their ENDS use in response to taxes may fall back on
bumming ENDS from social sources—a habit that might be less socially acceptable or viewed as
freeloading for regular or heavy users—instead of purchasing ENDS themselves.19
Finally, we assess heterogeneity in the cross-tax effects on combustible cigarette use in
Figures 4a (for the MTF) and 4b (for the YRBSS). While the YRBSS effect estimates are too
imprecise to discern meaningful patterns, spillover effects on cigarette use in the MTF sample
mainly line up with the first-order effects on ENDS use. In particular, older and white teens tend to
display a stronger substitution response towards cigarettes than younger and non-white teens.
5. Checks of validity and robustness
Table 7 and appendix materials provide additional checks to assess the identifying
assumption’s validity and explore our main results’ sensitivity to alternate specifications,
measurement error in the ENDS tax rate, added observable confounders, and sampling and other
estimation issues.
The tax-response parameters are identified off within-state changes over the sample period
in the two-way fixed effects models, drawing on the assumption of strict exogeneity (Wooldridge
18 According to 2017 and 2019 YRBSS data, 74.2% of e-cigarette users under age 16 report obtaining e-cigarettes through borrowing from family or friends, a source less commonly reported by older teens (56.6%). 19 We also find that older teens may have substituted from retail outlets to internet purchases, potentially allowing some to evade ENDS taxes, particularly prior to the US Supreme Court’s June 2018 South Dakota v Wayfair Inc decision. Before then, responsibility to pay remote sellers’ sales taxes largely fell on consumers, making it difficult to enforce tax collections, including for ENDS. That case’s ruling allowed states to require remote sellers to collect these taxes, a policy most states adopted towards the end of 2018 or later; that is, at the end of our period of analysis.
17
2010). This implicitly presumes that states that have not adopted any ENDS taxes, or states that
have not changed their ENDS taxes, are valid counterfactuals for the “treated” states. More
specifically, a consistent estimate of the tax-response parameter (β1 in equation 1) requires that the
tax rate in a given state/locality and period t be orthogonal to that locality’s error term in all periods.
Violations of this assumption are usually driven by either time-varying state-specific unobservables
correlated with the ENDS tax, or policy endogeneity, wherein the state’s past experiences with youth
ENDS use may influence its enactment and level of ENDS taxation.
The recency of ENDS taxes in most adopting states, combined with the start of the
availability of ENDS data in youth surveys, prevents estimation of flexible event-study models for
ENDS use outcomes. We therefore check for potential policy endogeneity and assess the broader
identifying assumption by re-estimating all models with the inclusion of the one-period lead in tax
adoption (Table 7), with the reference being prior leads.20 These models underscore two points
which instill some degree of confidence in the credibility of the research design. First, coefficient
estimates on the lead for ENDS adoption are statistically insignificant, invariably smaller than the
main effect, and largely close to zero in all models. This finding suggests that trends in ENDS use
outcomes prior to the adoption of the tax do not materially differ between treated and control
states. Second, our main ENDS tax effects on ENDS and cigarette use and the implied elasticities
are not materially altered by controlling for the lead on policy adoption.
An emerging literature has identified important issues that arise with a TWFE setting with
staggered adoption of the treatment, as in our case with multiple states/localities shifting their
ENDS tax policy at different times. In the presence of dynamic treatment effects, the treatment
effect recovered by the TWFE model may be biased and may capture the true treatment effect plus
additional terms that reflect deviations from parallel trends and bias due to treatment effect
dynamics (Goodman-Bacon 2021). The latter bias is often largely due to using earlier-treated units as
a counterfactual for later-treated units. This issue of heterogenous treatment effect dynamics may be
less problematic here than in other contexts given that only nine states plus Washington DC and
two large counties imposed taxes on ENDS by mid-2019, when our sample ends. Consequently, we
have a large untreated comparison group and, as ENDS taxes are relatively recent phenomena
20 In Appendix Table 2, we present alternate specifications for the lead effects based on the date of enactment (as opposed to when the tax became effective in the state/locality) in order to capture potential anticipation or “announcement” effects. These estimates remain largely similar to those presented in Table 7.

18
within US markets, few instances of earlier-treated units serving as a counterfactual for later-treated
units, minimizing such concerns. This hypothesis is confirmed by a formal Goodman-Bacon
decomposition (Goodman-Bacon 2021) of the comparisons driving the estimated treatment effects
in our MTF analyses (we dichotomize our tax variable). This decomposition indicates that between
91.6% and 94.4% of the weight of our estimator (depending on outcome) can be attributed to the
comparison of treated states (states that have imposed an ENDS tax) versus never adopters, and
between 1.9% to 3.0% can be attributed to the comparisons of earlier-adopting versus later-adopting
states. The potentially problematic comparison—using earlier-treated or already-treated states as a
counterfactual for later-treated states—drives only about 3.7% to 5.4% of the average treatment
effect in our estimation.
As an additional check, we also applied the recently proposed “stacked estimator,” which
can account for bias attributable to heterogeneous treatment effects with a staggered treatment
rollout (Cengiz et al. 2019). First, drawing on the full MTF and YRBSS samples, for each treatment
state we identify “clean” controls two years prior to and one year after an event (“event window”),
where an event is the year an ENDS tax went into effect as defined in a cohort OR became effective
for all youth surveyed in that year. “Clean” controls are states that did not adopt an ENDS tax
during the event window. Thus, we avoid “forbidden” comparisons (i.e., using previously treated
observations as a control) by construction. Constraining the length of the event window similarly for
each treatment cohort minimizes concerns related to differential treatment variance that impacts the
OLS weighting scheme. Each treated tax state is entered and matched separately, even if multiple
states may have enacted their tax in the same year, due to differences in the level of the treatment
(tax amount). For states that have multiple tax changes, we do not consider later tax changes that
occurred outside the event window since these states are already treated and the effects of later tax
changes may be conflated with potential dynamic effects of the earlier tax changes. We also drop
Minnesota as this state is a treated control. The regressions include cohort-specific time and state
fixed-effects.
Appendix Table 3 presents estimates of the tax response from this stacked continuous
treatment difference-in-differences model. Reassuringly, our previous findings stand: we find
consistent and robust evidence that higher ENDS taxes significantly reduce adolescent ENDS use
along multiple margins. The stacked DD estimates further suggest, as before, that higher ENDS
taxes are associated with greater perceived risk of ENDS and substitution into cigarettes; though the
19
coefficient magnitudes of the substitution effects are similar to those from the standard DD model,
these are imprecisely estimated.21
Further checks assess our findings’ plausibility and verify that they are robust to alternate
specifications, measurement error in the tax measure, and adjustment for sampling issues. First, we
confirm that our estimated tax effects are not sensitive to correcting for potential measurement error
in our constructed standardized ENDS tax rate. In Appendix Table 4, we present instrumental (IV)
estimates from models where the standardized tax rate is instrumented with the separate tax
components (i.e., ad valorem tax rate, liquid excise tax rate, container excise tax rate). The F-statistic
is large, and the results are virtually identical to those discussed above.
Second, we consider potential confounding from cigar taxes (Appendix Table 5). Results are
similar to our main findings.
Third, we estimate various sensitivity checks of the MTF in particular since these data are
more detailed than the YRBSS data. We add controls for parental education and the county’s
urban/rural status from the MTF (Appendix Table 6),22 use a non-balanced panel of states
(Appendix Table 7), and use a broader “any vaping” variable (including of THC) that became
available in 2017 (Appendix Table 8). Our conclusions are not materially altered from these
alternative approaches.
Fourth, we re-implement our analyses to confirm that our estimates are not sensitive to
modeling the dichotomous outcomes via probit regression (marginal effects presented in Appendix
Table 9), and to various sampling issues. Specifically, our findings are largely robust in terms of
magnitude and statistical significance, to not utilizing sampling weights (Appendix Table 10),
extending our sample back to 2011 for models of cigarette use outcomes (Appendix Table 11), and
adjusting our inferential statistics to account for the small number of treated units through wild
cluster bootstrapping (Appendix Table 12).
21 We are not able to apply the stacked DD estimator to model e-cigarette use and source of purchase from the YRBSS as these measures are only available for three (biennial) waves. Thus it is not possible to form the grouped treatment and controls with sufficient pre- and post-windows of a fixed length that are needed for this estimator. 22 These latter individual-level controls are not available in the YRBSS. We therefore did not include them in our main analyses in order to keep the specifications for the MTF and the YRBSS samples consistent.
20
6. Discussion
The FDA is currently assessing whether specific ENDS products are sufficiently appropriate
for public health to be legally sold in the United States. The FDA is currently allowing the sale of
ENDS through enforcement discretion while these products undergo review for public health
benefit.23 Policy evaluation research is particularly well-suited to assessing ENDS’ overall effect on
public health by estimating how reducing the accessibility or appeal of ENDS affects use of more
lethal, combustible tobacco products. If reducing ENDS accessibility increases combustible tobacco
use, as suggested by this and other studies (Pesko, Courtemanche, and Maclean 2020; Saffer et al.
2020; Pesko and Warman 2021; Abouk et al. 2020; Cotti et al. 2021; Friedman 2015; Dave, Feng,
and Pesko 2019; Pesko, Hughes, and Faisal 2016; Pesko and Currie 2019), this finding provides
evidence of a public health benefit to allow ENDS sales: reduced cigarette use. This benefit should
be used alongside other estimates of public health benefits and harms of ENDS, which are beyond
the scope of this study, to inform the FDA’s decisions on approving ENDS products.
While the FDA does not control ENDS taxes, this study’s findings can still inform tobacco
regulatory sciences because an ENDS ban is analogous to an infinite ENDS tax increase. Thus, the
FDA has the ability to “tax” ENDS at that one level (i.e., infinite) by banning them, as has done in
at least 30 other countries (Global Tobacco Control 2018). More generally, the FDA’s interest in
understanding transitions across tobacco products can benefit from ENDS policy evaluation
research, even studies of policies outside the FDA’s purview, since these studies provide plausibly
exogenous variation in ENDS use that can be leveraged to estimate the causal effect of ENDS use
on subsequent combustible tobacco product use.
Our study is particularly unique by 1) using multiple large-scale youth survey datasets to
provide some of the first national evidence on ENDS taxes on youth, and 2) studying the effect of
ENDS taxes on youth using four types of outcomes: ENDS use, cigarette use, perceptions of the
risk of ENDS, and source of ENDS. By estimating ENDS taxes’ effects on youth use of both
ENDS and cigarettes, as well as intensity of use, ENDS sources, and ENDS risk perceptions, this
research provides the most comprehensive picture to date of ENDS taxes’ effects on youth, whom
the taxes are intended to “protect.“ While our results yield e-cigarette tax elasticities ranging from -
23 The FDA has granted marketing orders for a heat-not-burn product (iQOS), implying that this particular product’s availability was judged appropriate for public health. https://www.fda.gov/media/144700/download (last accessed August 24th, 2021).
21
0.06 to -0.21 depending on the measure of ENDS use, and indicate that ENDS taxes increase
perceptions of ENDS risks, other findings suggest concurrent costs: cross-tax elasticities are positive
and particularly large for frequent cigarette use outcomes, and sourcing results suggest that ENDS
taxes shift youth towards informal ENDS sources. The latter change may have implications for
short- and long-run health outcomes, as observed during the 2019 outbreak of vaping-associated
lung injuries, when use of off market cannabis vaping products containing vitamin E acetate led to a
rash of illnesses and deaths.
As of March 2021, 30 US states had adopted an ENDS tax (Public Health Law Center
2021), often as a means to reduce youth vaping. However, if reducing ENDS accessibility increases
combustible tobacco use, as suggested by this study and prior work (Pesko, Courtemanche, and
Maclean 2020; Saffer et al. 2020; Pesko and Warman 2021; Abouk et al. 2020; Cotti et al. 2021;
Friedman 2015; Dave, Feng, and Pesko 2019; Pesko, Hughes, and Faisal 2016; Pesko and Currie
2019), these taxes could prove harmful to public health. That is, given current evidence suggesting
smoking is substantially more dangerous than using ENDS, the health costs from greater youth
smoking as a result of ENDS taxes may outweigh benefits from reduced youth ENDS use, though
an exact calculation is beyond the scope of this research.
Currently, Congress is considering doubling the cigarette excise tax (to $2.01 per pack) and
setting the ENDS tax to parity with the new cigarette tax (Durbin 2021). This tax, if adopted, would
imply a roughly $2.01 tax per 0.7 fluid mL of nicotine, assuming a Juul pod is equivalent to a pack of
cigarettes (Truth Initiative 2019), or $2.87 per fluid mL. Our MTF results suggest that this would
reduce youth current ENDS use by 5.5 pp but raise current cigarette use by 3.7 pp, assuming that
the cigarette tax portion of the bill has no effect as suggested by the small, statistically insignificant
cigarette tax effects estimated in this paper, and other recent studies (Hansen, Sabia, and Rees 2017).
The YRBSS results meanwhile suggest much larger reductions in youth current ENDS use, but a
sizable increase in youth current cigarette use of 2.3 pp. If ENDS are substantially safer products as
suggested by several major government-commissioned reviews (McNeill et al. 2018; National
Academies of Sciences, Engineering, and Medicine 2018; UK Committee on Toxicity of Chemicals
in Food, Consumer Products and the Environment 2020), our results suggest that the proposed bill
may harm youth health in the United States.
Due to the recency of ENDS taxation, our results are based on the experiences of ten early
adopting states and two large counties. Thus, we may be capturing responses to relatively lower

22
levels of taxes than will be in place in future periods. Still, this study’s research design provides an
important and useful starting point for extending these analyses as future work revisits these
questions as more years of data and ENDS tax variation become available.

23
References: Abouk, Rahi, and Scott Adams. 2017. “Bans on Electronic Cigarette Sales to Minors and Smoking
among High School Students.” Journal of Health Economics 54: 17–24. Abouk, Rahi, Scott Adams, Bo Feng, Johanna Catherine Maclean, and Michael F. Pesko. 2020. “The
Effect of E-Cigarette Taxes on Pre-Pregnancy and Prenatal Smoking.” NBER Work Pap Ser No. 26126. https://doi.org/10.3386/w26126.
Allcott, Hunt, and Charlie Rafkin. 2021. “Optimal Regulation of E-Cigarettes: Theory and Evidence.” NBER Work Pap Series No. 27000. https://doi.org/10.3386/w27000.
American Non-Smokers Rights Foundation. 2021. “States and Municipalities with Laws Regulating Use of Electronic Cigarettes.” April 1, 2021. https://no-smoke.org/wp-content/uploads/pdf/ecigslaws.pdf.
Anderson, D. Mark, Kyutaro Matsuzawa, and Joseph J. Sabia. 2020. “Cigarette Taxes and Teen Marijuana Use.” National Tax Journal 73 (2): 475–510. http://dx.doi.org/10.17310/ntj.2020.2.06.
Balfour, David J. K., Neal L. Benowitz, Suzanne M. Colby, Dorothy K. Hatsukami, Harry A. Lando, Scott J. Leischow, Caryn Lerman, et al. 2021. “Balancing Consideration of the Risks and Benefits of E-Cigarettes.” American Journal of Public Health, August, e1–12. https://doi.org/10.2105/AJPH.2021.306416.
Bryan, Calvin, Benjamin Hansen, Drew McNichols, and Joseph Sabia. 2020. “Do State Tobacco 21 Laws Work?” w28173. Cambridge, MA: National Bureau of Economic Research. https://doi.org/10.3386/w28173.
CASAA. 2020. “History of Vaping - Historical Timeline of Events.” CASAA (blog). 2020. https://casaa.org/education/vaping/historical-timeline-of-electronic-cigarettes/.
Cengiz, Doruk, Arindrajit Dube, Attila Lindner, and Ben Zipperer. 2019. “The Effect of Minimum Wages on Low-Wage Jobs*.” The Quarterly Journal of Economics 134 (3): 1405–54. https://doi.org/10.1093/qje/qjz014.
Centers for Disease Control and Prevention. 2020. “Trends in the Prevalence of Tobacco Use National YRBS: 1991—2019 | YRBSS | Adolescent and School Health | CDC.” August 17, 2020. https://www.cdc.gov/healthyyouth/data/yrbs/factsheets/2019_tobacco_trend_yrbs.htm.
Cotti, Chad D., Charles J. Courtemanche, Johanna Catherine Maclean, Erik T. Nesson, Michael F. Pesko, and Nathan Tefft. 2021. “The Effects of E-Cigarette Taxes on e-Cigarette Prices and Tobacco Product Sales: Evidence from Retail Panel Data.” NBER Work Pap Ser No. 26724. https://doi.org/10.3386/w26724.
Dave, Dhaval, Bo Feng, and Michael F Pesko. 2019. “The Effects of E‐cigarette Minimum Legal Sale Age Laws on Youth Substance Use.” Health Economics 28 (3): 419–36.
Durbin, Richard J. 2021. “Text - S.1314 - 117th Congress (2021-2022): Tobacco Tax Equity Act of 2021.” Legislation. 2021/2022. April 22, 2021. https://www.congress.gov/bill/117th-congress/senate-bill/1314/text.
Etter, Jean-François. 2018. “Gateway Effects and Electronic Cigarettes.” Addiction 113 (10): 1776–83. https://doi.org/10.1111/add.13924.
Friedman, Abigail S. 2015. “How Does Electronic Cigarette Access Affect Adolescent Smoking?” J Health Econ 44 (December): 300–308. https://doi.org/10.1016/j.jhealeco.2015.10.003.
Friedman, Abigail S., John Buckell, and Jody L. Sindelar. 2019. “Patterns of Youth Cigarette Experimentation and Onset of Habitual Smoking.” American Journal of Preventive Medicine 56 (6): 803–10. https://doi.org/10.1016/j.amepre.2019.02.009.

24
Global Tobacco Control. 2018. “Country Laws Regulating E-Cigarettes - Sale.” November 20, 2018. https://www.globaltobaccocontrol.org/e-cigarette/sale.
Goodman-Bacon, Andrew. 2021. “Difference-in-Differences with Variation in Treatment Timing.” Journal of Econometrics, June, S0304407621001445. https://doi.org/10.1016/j.jeconom.2021.03.014.
Hansen, Benjamin, Daniel I. Rees, and Joseph J. Sabia. 2013. “Cigarette Taxes and How Youths Obtain Cigarettes.” National Tax Journal 66 (2): 371–93. https://doi.org/10.17310/ntj.2013.2.04.
Hansen, Benjamin, Joseph J. Sabia, and Daniel I. Rees. 2017. “Have Cigarette Taxes Lost Their Bite? New Estimates of the Relationship between Cigarette Taxes and Youth Smoking.” American Journal of Health Economics 3 (1): 60–75. https://doi.org/10.1162/AJHE_a_00067.
HealthyPeople.gov. 2020. “Adolescent Cigarette Smoking in Past 30 Days.” 2020. https://www.healthypeople.gov/2020/data/Chart/5342?category=1&by=Total&fips=-1.
Katzman, Brett, Sara Markowitz, and Kerry Anne McGeary. 2007. “An Empirical Investigation of the Social Market for Cigarettes.” Health Economics 16 (10): 1025–39. https://doi.org/10.1002/hec.1215.
McNeill, Ann, Leonie S Brose, Robert Calder, Linda Bauld, and Debbie Robson. 2018. “Evidence Review of E-Cigarettes and Heated Tobacco Products 2018.” London, UK: Public Health England. https://assets.publishing.service.gov.uk/government/uploads/system/uploads/attachment_data/file/684963/Evidence_review_of_e-cigarettes_and_heated_tobacco_products_2018.pdf.
Meza, Rafael, Evelyn Jimenez-Mendoza, and David T. Levy. 2020. “Trends in Tobacco Use Among Adolescents by Grade, Sex, and Race, 1991-2019.” JAMA Network Open 3 (12): e2027465–e2027465. https://doi.org/10.1001/jamanetworkopen.2020.27465.
National Academies of Sciences, Engineering, and Medicine. 2018. “Public Health Consequences of E-Cigarettes.” Washington, DC: National Academies of Sciences, Engineering, and Medicine. https://www.nap.edu/resource/24952/012318ecigaretteHighlights.pdf.
Nguyen, Hai V. 2020. “Association of Canada’s Provincial Bans on Electronic Cigarette Sales to Minors with Electronic Cigarette Use among Youths.” JAMA Pediatr 174 (1): e193912–e193912. https://doi.org/10.1001/jamapediatrics.2019.3912.
Nutt, David J., Lawrence D. Phillips, David Balfour, H. Valerie Curran, Martin Dockrell, Jonathan Foulds, Karl Fagerstrom, et al. 2014. “Estimating the Harms of Nicotine-Containing Products Using the MCDA Approach.” European Addiction Research 20 (5): 218–25. https://doi.org/10.1159/000360220.
Pesko, Charles J Courtemanche, and Johanna Catherine Maclean. 2020. “The Effects of Traditional Cigarette and E-Cigarette Taxes on Adult Tobacco Product Use.” Journal of Risk & Uncertainty 60 (3): 229–58.
Pesko, and Janet M. Currie. 2019. “E-Cigarette Minimum Legal Sale Age Laws and Traditional Cigarette Use among Rural Pregnant Teenagers.” J Health Econ 66 (July): 71–90. https://doi.org/10.1016/j.jhealeco.2019.05.003.
Pesko, M. F., J. M. Hughes, and F. S. Faisal. 2016. “The Influence of Electronic Cigarette Age Purchasing Restrictions on Adolescent Tobacco and Marijuana Use.” Prev Med 87 (June): 207–12. https://doi.org/10.1016/j.ypmed.2016.02.001.
Pesko, M. F., D. S. Kenkel, H. Wang, and J. M. Hughes. 2016. “The Effect of Potential Electronic Nicotine Delivery System Regulations on Nicotine Product Selection.” Addiction 111 (4): 734–44.
25
Pesko, and C. Warman. 2021. “The Effect of Prices on Youth Cigarette and E-Cigarette Use: Economic Substitutes or Complements?” Social Science Research Network Working Paper Series. Social Science Research Network.
Public Health Law Center. 2021. “E-Cigarette Tax: States & Territories with Laws Taxing e-Cigarettes.” Saint Paul, Minnesota: Mitchell Hamline School of Law. https://www.publichealthlawcenter.org/sites/default/files/States-with-Laws-Taxing-ECigarettes-March2021.pdf.
Rees, Daniel I., Joseph J. Sabia, and Gokhan Kumpas. 2020. “Anti-Bullying Laws and Suicidal Behaviors among Teenagers.” w26777. National Bureau of Economic Research. https://doi.org/10.3386/w26777.
Sabia, Joseph J., and D. Mark Anderson. 2016. “The Effect of Parental Involvement Laws on Teen Birth Control Use.” Journal of Health Economics 45 (January): 55–62. https://doi.org/10.1016/j.jhealeco.2015.10.002.
Saffer, Henry, Daniel L Dench, Michael Grossman, and Dhaval M Dave. 2020. “E-Cigarettes and Adult Smoking: Evidence from Minnesota.” Journal of Risk & Uncertainty 30 (3).
Truth Initiative. 2019. “How Much Nicotine Is in JUUL?” Truth Initiative. February 2019. https://truthinitiative.org/research-resources/emerging-tobacco-products/how-much-nicotine-juul.
UK Committee on Toxicity of Chemicals in Food, Consumer Products and the Environment. 2020. “Statement on the Potential Toxicological Risks from Electronic Nicotine (and Non-Nicotine) Delivery Systems (E(N)NDS – e-Cigarettes).” https://cot.food.gov.uk/sites/default/files/2020-09/COT%20E%28N%29NDS%20statement%202020-04.pdf.
United States Surgeon General. 2014. “The Health Consequences of Smoking -- 50 Years of Progress: A Report of the Surgeon General.” https://doi.org/10.1037/e510072014-001.
———. 2016. “E-Cigarette Use Among Youth and Young Adults: A Report of the Surgeon General.” Washington, DC: Department of Health and Human Services.
———. 2018. “Surgeon General’s Advisory on E-Cigarette Use Among Youth.” Washington, DC: Department of Health and Human Services. https://e-cigarettes.surgeongeneral.gov/documents/surgeon-generals-advisory-on-e-cigarette-use-among-youth-2018.pdf.
US Department of Health Human Services. 2012. “Preventing Tobacco Use among Youth and Young Adults: A Report of the Surgeon General.” US Department of Health Human Services.
Viscusi, W. Kip. 2016. “Risk Beliefs and Preferences for E-Cigarettes.” American Journal of Health Economics 2 (2): 213–40. https://doi.org/10.1162/AJHE_a_00042.
Wooldridge, Jeffrey M. 2010. Econometric Analysis of Cross Section and Panel Data. 2nd ed. Cambridge, Mass: MIT Press.

26
Table 1: ENDS Tax Changes Through 2nd Quarter of 2019
Locality Effective Date Unit Taxed Tax Amount Tax per mL, Q1-2 2015 ($)
Tax per mL, Q1-2 2017 ($)
Tax per mL, Q1-2 2019 ($)
District/State California 4/2017, 7/2017,
7/2018 Wholesale price 27.3%, 65.1%, 62.8% $0 $0.72 $1.65
Delaware 1/2018 Per fluid milliliter $0.05 $0 $0 $0.05 Kansas 1/2017, 7/2017 Per fluid milliliter $0.20, $0.05 $0 $0.20 $0.05 Louisiana 7/2015 Per fluid milliliter $0.05 $0 $0.05 $0.05 Minnesota 8/2010, 7/2013 Wholesale price 35.0%, 95.0% $2.49 $2.49 $2.49 North Carolina 6/2015 Per fluid milliliter $0.05 $0.02 $0.05 $0.05 New Jersey 10/2018 Per fluid milliliter $0.10 $0 $0 $0.10 Pennsylvania 7/2016 Wholesale price 40.0% $0 $1.05 $1.05 Washington, DC 10/2015, 10/2016,
10/2017, 10/2018 Wholesale price 67.0%, 65.0%, 60%, 96% $0 $1.70 $2.52
West Virginia 7/2016 Per fluid milliliter $0.08 $0 $0.08 $0.08
County/City
Chicago, Illinois 1/2016, 1/2019 Per container / per fluid
milliliter1 $0.80 / $0.55, $1.50
/ $1.20
Cook County, IL 5/2016 Per fluid milliliter $0.20 $0 $0.94 $1.50 Montgomery County, MD 8/2015 Wholesale price 30.00% $0 $0.79 $0.79
Notes: Please see the online data appendix for further details. 1 The Chicago tax is added to the Cook County tax based on the share of the population residing in Chicago.

27
Table 2: Descriptive Statistics, 2014-2019 (MTF); 2015-2019 (YRBSS)
MTF YRBSS
Overall Treated Non-Treated Overall Treated Non-Treated
Outcomes Current ENDS User 0.152 0.142 0.156 0.211 0.198 0.215
[N=126,306] [N=40,298] [N=86,008] [N=538,992] [N=126,637] [N=412,355] Frequent ENDS User 0.038 0.035 0.039 0.047 0.049 0.047
[N=126,306] [N=40,298] [N=86,008] [N=538,992] [N=126,637] [N=412,355] Ever ENDS User 0.066 0.060 0.069 0.081 0.073 0.084 Current Cigarette Smoker [N=244,360] [N=78,538] [N=165,822] [N=580,788] [N=135,993] [N=444,795]
0.080 0.073 0.083 0.113 0.093 0.117 Current Cigarette or Cigar Smoker [N=246,192] [N=79,112] [N=167,080] [N=580,788] [N=135,993] [N=444,795]
0.192 0.199 0.189 0.211 0.198 0.215 ENDS Perception of Harm Risk [N=86,486] [N=27,804] [N=58,682] - - -
0.012 0.010 0.012 - - - Current Cigarette Smoker (at least a half pack a day in the past month)
[N=244,360] [N=78,538] [N=165,822] - - - 0.006 0.005 0.006 - - -
Frequent Cigarette Smoker - - - 0.022 0.015 0.023
- - - [N=580,788] [N=135,993] [N=444,795] ENDS Sources*
Retail Source - - - 0.212 0.185 0.227 - - - [N=55,902] [N=22,260] [N=33,642]
Internet - - - 0.038 0.042 0.035 - - - [N=55,902] [N=22,260] [N=33,642]
Social Source - - - 0.617 0.628 0.611 - - - [N=55,902] [N=22,260] [N=33,642]
Other Source - - - 0.133 0.145 0.126 - - - [N=55,902] [N=22,260] [N=33,642]
Individual Covariates Female 0.516 0.514 0.517 0.489 0.489 0.490 Age 16.005 15.997 16.009 16.003 16.014 16.000
(1.985) (1.994) (1.981) (1.426) (1.424) (1.426) White, non-Hispanic
0.550 0.472 0.585 0.543 0.487 0.560
Black/African American, non-Hispanic 0.148 0.129 0.156 0.148 0.146 0.149
Hispanic/Latino 0.237 0.307 0.206 0.240 0.281 0.228
Other Races, non-Hispanic 0.066 0.092 0.054 0.068 0.085 0.063
Grade 10.050 10.083 10.035 10.445 10.481 10.434 (1.665) (1.647) (1.673) (1.190) (1.195) (1.188)
Policy/Economic Covariates
ENDS Tax Rate (2019 $) 0.174 0.562 - 0.166 0.703 - (0.516) (0.801) - (0.456) (0.709)

28
Cigarette Tax Rate (2019 $) 2.967 3.137 2.890 2.954 3.260 2.859 (1.379) (1.421) (1.353) (1.285) (0.972) (1.353)
Beer Tax Rate (2019 $) 0.302 0.241 0.330 0.314 0.255 0.332 (0.277) (0.161) (0.312) (0.286) (0.175) (0.310)
Tobacco 21 Law 0.146 0.300 0.077 0.174 0.462 0.085
ENDS Minimum Legal Sale Age 0.873 0.936 0.844 0.924 1.000 0.900
Indoor Smoking Restrictions 0.802 0.896 0.760 0.792 0.928 0.750
Indoor ENDS Restrictions 0.229 0.425 0.141 0.264 0.532 0.181
Recreational Marijuana Laws 0.128 0.218 0.087 0.163 0.378 0.096
Medical Marijuana Laws 0.526 0.761 0.420 0.579 0.807 0.508
Vertical License Law 0.968 0.963 0.970 0.975 0.959 0.980
Unemployment Rate 4.862 5.195 4.713 4.544 4.480 4.563 (1.576) (1.732) (1.476) (0.880) (0.499) (0.967)
Poverty Rates 14.200 14.076 14.256 12.697 12.015 12.908 (5.219) (4.764) (5.411) (2.513) (2.693) (2.416)
N 254,516 81,823 172,693 600,877 139,509 461,368 Notes: Means and standard deviations (in parenthesis) are reported. Since state/county-level information is available in the MTF data, policy/economic controls are at the county level except for beer taxes, vertical ID, and marijuana laws in which we only have state-level data. Since county information is not available in the national / state YRBSS, policy/economic controls are population-weighted state averages. *ENDS sources are only for the years 2017-2019 and are conditional on an individual being a current ENDS user.

29
Table 3: Effects of ENDS Tax on ENDS Use
Outcome Current ENDS User
Regular ENDS User ENDS Initiation Ever Use ENDS Current ENDS
User ENDS Tax Rate (2019 $) -0.019+ -0.013+ -0.008 -0.052*** -0.071**
(0.010) (0.007) (0.014) (0.010) (0.025)
[-0.040,0.002] [-0.028,0.001] [-0.036,0.021] [-0.072,-0.031] [-0.120, -0.022]
<0.071> <0.073> <0.581> <0.000> <0.006> Cigarette Tax Rate (2019 $) -0.005 0.009+ -0.003 0.012 0.041
(0.008) (0.005) (0.013) (0.008) (0.026)
[-0.021,0.012] [-0.001,0.019] [-0.029,0.022] [-0.004,0.028] [-0.012, 0.094]
<0.552> <0.065> <0.789> <0.135> <0.129>
Data MTF MTF MTF MTF YRBSS
Years 2014-2019 2014-2019 2015-2019 2015-2019 2015-2019
N 126,306 126,306 66,124 85,541 538,992
Dependent Variable Mean 0.152 0.038 0.104 0.287 0.213
ENDS Elasticity -0.075 -0.212 -0.059 -0.146 -0.164
Cigarette Elasticity -0.095 0.712 -0.097 0.127 0.568 + p<0.10, * p<0.05, ** p<0.01, *** p<0.001 Notes: All MTF models include tax jurisdiction fixed-effects, year-by-quarter fixed-effects, and each of the individual controls and policy/economic covariates listed in Table 2. All YRBSS models include state fixed-effects, year fixed-effects, and each of the individual controls and policy/economic covariates listed in Table 2. Regressions are weighted, standard errors are corrected for clustering at the state level, 95% confidence intervals are shown in [ ] and p-values are shown in < >.
Table 4: Effects of ENDS Tax on ENDS Perceived Risk and Sources
Outcome ENDS Perceived Risk Retail Source Social Source Internet Source Other Source
ENDS Tax Rate (2019 $) 0.029* -0.076* 0.101* 0.019 -0.044* (0.014) (0.034) (0.046) (0.015) (0.021)
[0.001,0.057] [-0.143, -0.008] [0.008, 0.194] [-0.012, 0.049] [-0.086, -0.002] <0.041> <0.029> <0.034> <0.220> <0.040>
Cigarette Tax Rate (2019 $) -0.003 0.086** -0.105* 0.006 0.014 (0.007) (0.031) (0.049) (0.019) (0.021)
[-0.017,0.011] [0.023, 0.148] [-0.204, -0.006] [-0.032, 0.044] [-0.029, 0.056] <0.671> <0.009> <0.038> <0.747> <0.522>
Data MTF YRBSS YRBSS YRBSS YRBSS Years 2014-2018 2015-2019 2015-2019 2015-2019 2015-2019 N 86,486 55,902 55,902 55,902 55,902 Dependent Variable Mean 0.192 0.185 0.627 0.042 0.145 + p<0.10, * p<0.05, ** p<0.01, *** p<0.001 Notes: All YRBSS models include state fixed-effects, year fixed-effects, and each of the individual controls and policy/economic covariates listed in Table 2. Regressions are weighted, standard errors are corrected for clustering at the state level, 95% confidence intervals are shown in [ ] and p-values are shown in < >.

30
Table 5: Effects of ENDS Tax on Combustible Tobacco Product Use
Outcome Current Cigarette Use
Current Cigarette Use
(half pack a day)
Current Cigarette or Cigar Use
Current Cigarette Use
Regular Cigarette Use
Daily Cigarette Use
Current Cigarette or Cigar Use
ENDS Tax Rate (2019 $) 0.013* 0.006** 0.012+ 0.008 0.016 0.014 0.007 (0.006) (0.002) (0.006) (0.013) (0.014) (0.012) (0.016)
[0.001,0.026] [0.002,0.010] [-0.001,0.024] [-0.019, 0.035] [-0.011, 0.043] [-0.011, 0.039] [-0.024, 0.038] <0.041> <0.008> <0.069> <0.544> <0.244> <0.257> <0.658>
Cigarette Tax Rate (2019 $) -0.001 -0.002 -0.002 -0.010 -0.012 -0.008 -0.011 (0.005) (0.002) (0.007) (0.013) (0.014) (0.012) (0.017)
[-0.011,0.010] [-0.005,0.001] [-0.015,0.012] [-0.035, 0.016] [-0.039, 0.016] [-0.033, 0.016] [-0.045, 0.023] <0.892> <0.227> <0.819> <0.544> <0.398> <0.491> <0.502>
Data MTF MTF MTF YRBSS YRBSS YRBSS YRBSS Years 2014-2019 2014-2019 2014-2019 2015-2019 2015-2019 2015-2019 2015-2019 N 244,360 244,360 246,192 580,788 580,788 580,788 504,639 Dependent Variable Mean 0.066 0.012 0.080 0.080 0.019 0.014 0.107 ENDS Elasticity 0.123 0.341 0.089 0.041 0.336 0.412 0.031 Cigarette Elasticity -0.032 -0.530 -0.056 -0.355 -1.792 -1.784 -0.321 + p<0.10, * p<0.05, ** p<0.01, *** p<0.001 Notes: All MTF models include tax jurisdiction fixed-effects, year-by-quarter fixed-effects, and each of the individual controls and policy/economic covariates listed in Table 2. All YRBSS models include state fixed-effects, year fixed-effects, and each of the individual controls and policy/economic covariates listed in Table 2. Regressions are weighted, standard errors are corrected for clustering at the state level, 95% confidence intervals are shown in [ ] and p-values are shown in < >.
Notes: All YRBSS models include state fixed-effects, year fixed-effects, and each of the individual controls and policy/economic covariates listed in Table

31
Table 6: Effects of ENDS Tax on ENDS and Combustible Tobacco Product Use
Outcome Current Dual Use Current Any Use Current Dual Use Current Any Use
ENDS Tax Rate (2019 $)
0.004 -0.01 0.005 -0.046
(0.004) (0.013) (0.012) (0.034)
[-0.004,0.012] [-0.036,0.017] [-0.020, 0.030] [-0.115, 0.034]
<0.371> <0.462> <0.701> <0.187>
Cigarette Tax Rate (2019 $)
0.002 -0.004 -0.004 0.035
(0.004) (0.010) (0.012) (0.028)
[-0.006,0.009] [-0.024,0.016] [-0.028, 0.021] [-0.021, 0.091]
<0.691> <0.682> <0.775> <0.216>
Data MTF MTF YRBSS YRBSS
Years 2014-2019 2014-2019 2015-2019 2015-2019
N 123,631 123,631 524,842 474,336
Dependent Variable Mean 0.041 0.178 0.059 0.231
ENDS Elasticity 0.053 -0.033 0.032 -0.093
Cigarette Elasticity 0.112 -0.068 -0.177 0.455 + p<0.10, * p<0.05, ** p<0.01, *** p<0.001 Notes: All MTF models include tax jurisdiction fixed-effects, year-by-quarter fixed-effects, and each of the individual controls and policy/economic covariates listed in Table 2. All YRBSS models include state fixed-effects, year fixed-effects, and each of the individual controls and policy/economic covariates listed in Table 2. Regressions are weighted, standard errors are corrected for clustering at the state level, 95% confidence intervals are shown in [ ] and p-values are shown in < >.
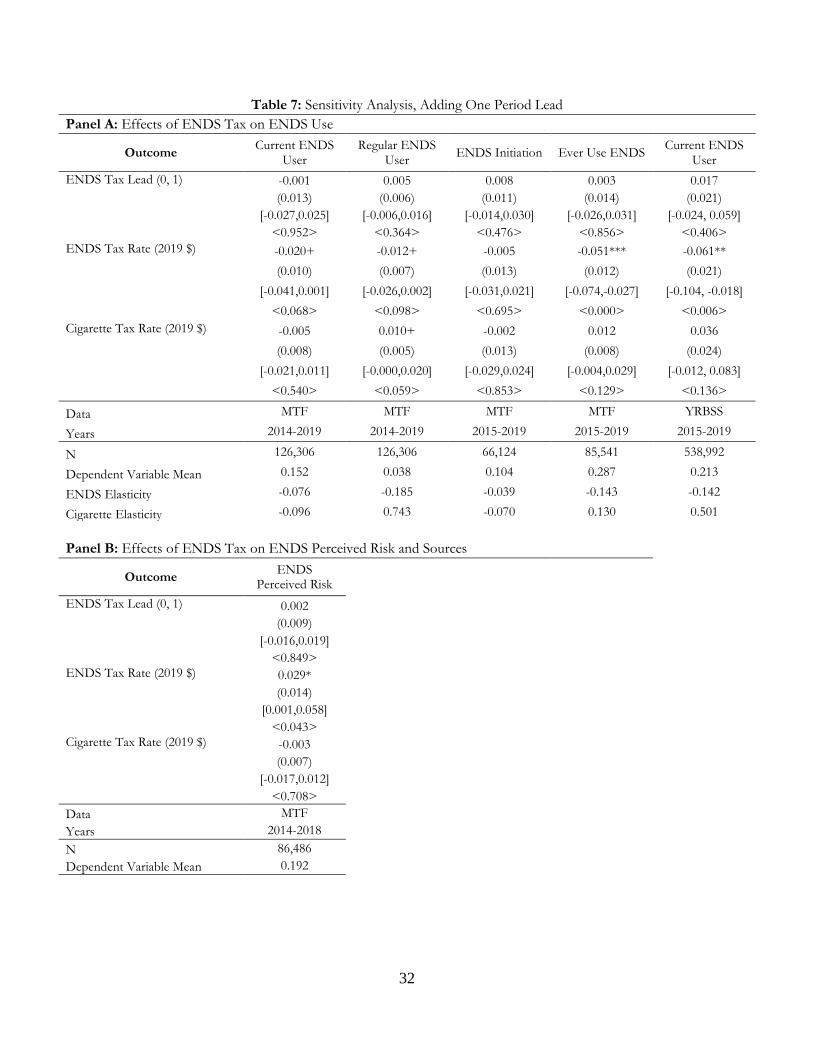
32
Table 7: Sensitivity Analysis, Adding One Period Lead Panel A: Effects of ENDS Tax on ENDS Use
Outcome Current ENDS User
Regular ENDS User ENDS Initiation Ever Use ENDS Current ENDS
User ENDS Tax Lead (0, 1) -0.001 0.005 0.008 0.003 0.017
(0.013) (0.006) (0.011) (0.014) (0.021) [-0.027,0.025] [-0.006,0.016] [-0.014,0.030] [-0.026,0.031] [-0.024, 0.059]
<0.952> <0.364> <0.476> <0.856> <0.406> ENDS Tax Rate (2019 $) -0.020+ -0.012+ -0.005 -0.051*** -0.061**
(0.010) (0.007) (0.013) (0.012) (0.021) [-0.041,0.001] [-0.026,0.002] [-0.031,0.021] [-0.074,-0.027] [-0.104, -0.018]
<0.068> <0.098> <0.695> <0.000> <0.006> Cigarette Tax Rate (2019 $) -0.005 0.010+ -0.002 0.012 0.036
(0.008) (0.005) (0.013) (0.008) (0.024) [-0.021,0.011] [-0.000,0.020] [-0.029,0.024] [-0.004,0.029] [-0.012, 0.083]
<0.540> <0.059> <0.853> <0.129> <0.136>
Data MTF MTF MTF MTF YRBSS
Years 2014-2019 2014-2019 2015-2019 2015-2019 2015-2019
N 126,306 126,306 66,124 85,541 538,992
Dependent Variable Mean 0.152 0.038 0.104 0.287 0.213
ENDS Elasticity -0.076 -0.185 -0.039 -0.143 -0.142
Cigarette Elasticity -0.096 0.743 -0.070 0.130 0.501
Panel B: Effects of ENDS Tax on ENDS Perceived Risk and Sources
Outcome ENDS Perceived Risk
ENDS Tax Lead (0, 1) 0.002
(0.009)
[-0.016,0.019]
<0.849>
ENDS Tax Rate (2019 $) 0.029*
(0.014)
[0.001,0.058]
<0.043> Cigarette Tax Rate (2019 $) -0.003
(0.007)
[-0.017,0.012]
<0.708>
Data MTF
Years 2014-2018
N 86,486
Dependent Variable Mean 0.192

33
Panel C: Effects of ENDS Tax on Combustible Tobacco Product Use
Outcome Current Cigarette Use
Current Cigarette Use
(half pack a day)
Current Cigarette or Cigar Use
Current Cigarette Use
Regular Cigarette Use
Daily Cigarette Use
Current Cigarette or Cigar Use
ENDS Tax Lead (0, 1) -0.003 -0.002 -0.003 0.004 0.002 0.0005 0.0005 (0.006) (0.002) (0.007) (0.008) (0.006) (0.006) (0.010)
[-0.015,0.009] [-0.006,0.002] [-0.016,0.010] [-0.012, 0.021] [-0.011, 0.014] [-0.012, 0.013] [-0.019, 0.020] <0.646> <0.358> <0.643> <0.607> <0.794> <0.942> <0.960>
ENDS Tax Rate (2019 $) 0.012* 0.006* 0.011+ 0.011 0.017 0.015 0.007 (0.005) (0.002) (0.006) (0.010) (0.011) (0.010) (0.014)
[0.001,0.023] [0.001,0.010] [-0.001,0.022] [-0.009, 0.031] [-0.006, 0.040] [-0.006, 0.035] [-0.021, 0.036] <0.029> <0.012> <0.066> <0.291> <0.145> <0.166> <0.612>
Cigarette Tax Rate (2019 $) -0.001 -0.002 -0.002 -0.010 -0.012 -0.009 -0.012 (0.006) (0.002) (0.007) (0.012) (0.013) (0.012) (0.017)
[-0.012,0.010] [-0.006,0.001] [-0.016,0.012] [-0.034, 0.013] [-0.038, 0.015] [-0.032, 0.015] [-0.045, 0.022] <0.855> <0.187> <0.787> <0.378> <0.372> <0.471> <0.492>
Data MTF MTF MTF YRBSS YRBSS YRBSS YRBSS Years 2014-2019 2014-2019 2014-2019 2015-2019 2015-2019 2015-2019 2015-2019 N 244,360 244,360 246,192 580,788 580,788 580,788 504,639 Dependent Variable Mean 0.066 0.012 0.080 0.080 0.019 0.014 0.107 ENDS Elasticity 0.115 0.314 0.083 0.053 0.356 0.420 0.032 Cigarette Elasticity -0.046 -0.580 -0.068 -0.379 -1.833 -1.800 -0.324 + p<0.10, * p<0.05, ** p<0.01, *** p<0.001 Notes: All MTF models include tax jurisdiction fixed-effects, year-by-quarter fixed-effects, and each of the individual controls and policy/economic covariates listed in Table 2. All YRBSS models include state fixed-effects, year fixed-effects, and each of the individual controls and policy/economic covariates listed in Table 2. Regressions are weighted, standard errors are corrected for clustering at the state level, 95% confidence intervals are shown in [ ] and p-values are shown in < >.

34
Figure 1: Weighted ENDS and Cigarette Tax Rates Over Time

35
Figure 2a: Table 3 Heterogeneity Check, Box-Whisker Graphs for Standardized ENDS Tax Rate (MTF)
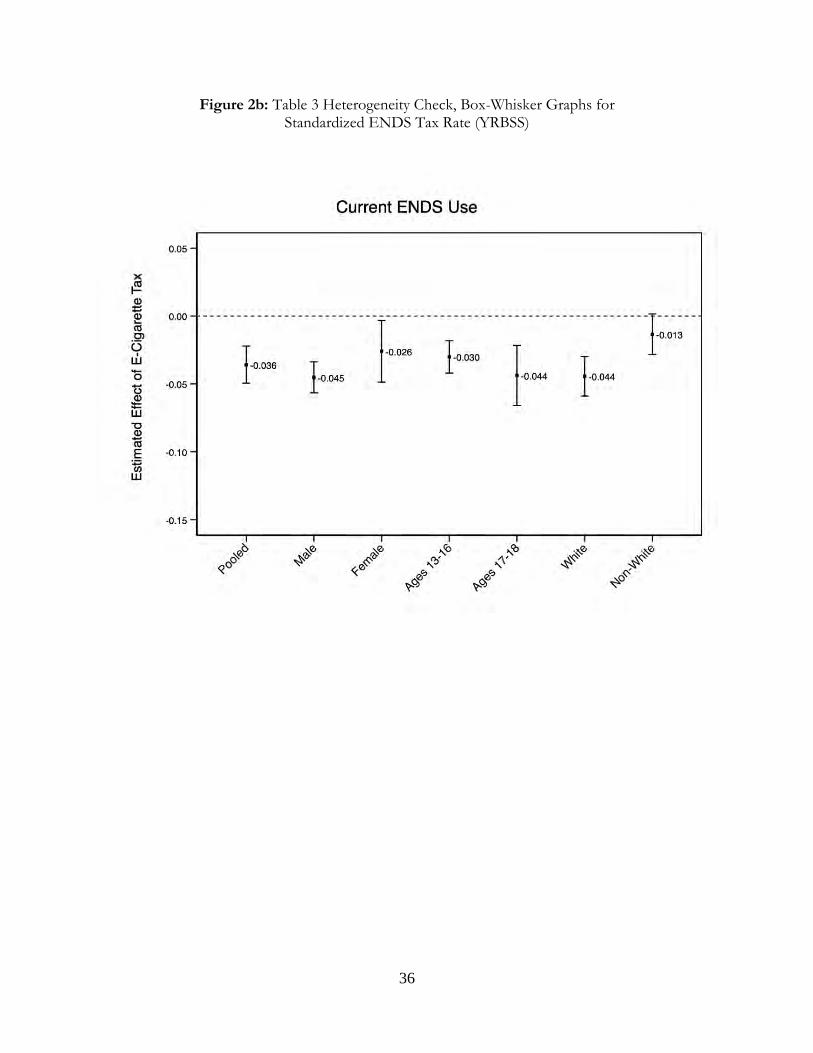
36
Figure 2b: Table 3 Heterogeneity Check, Box-Whisker Graphs for Standardized ENDS Tax Rate (YRBSS)

37
Figure 3a: Table 4 Heterogeneity Check, Box-Whisker Graphs for Standardized ENDS Tax Rate (MTF)
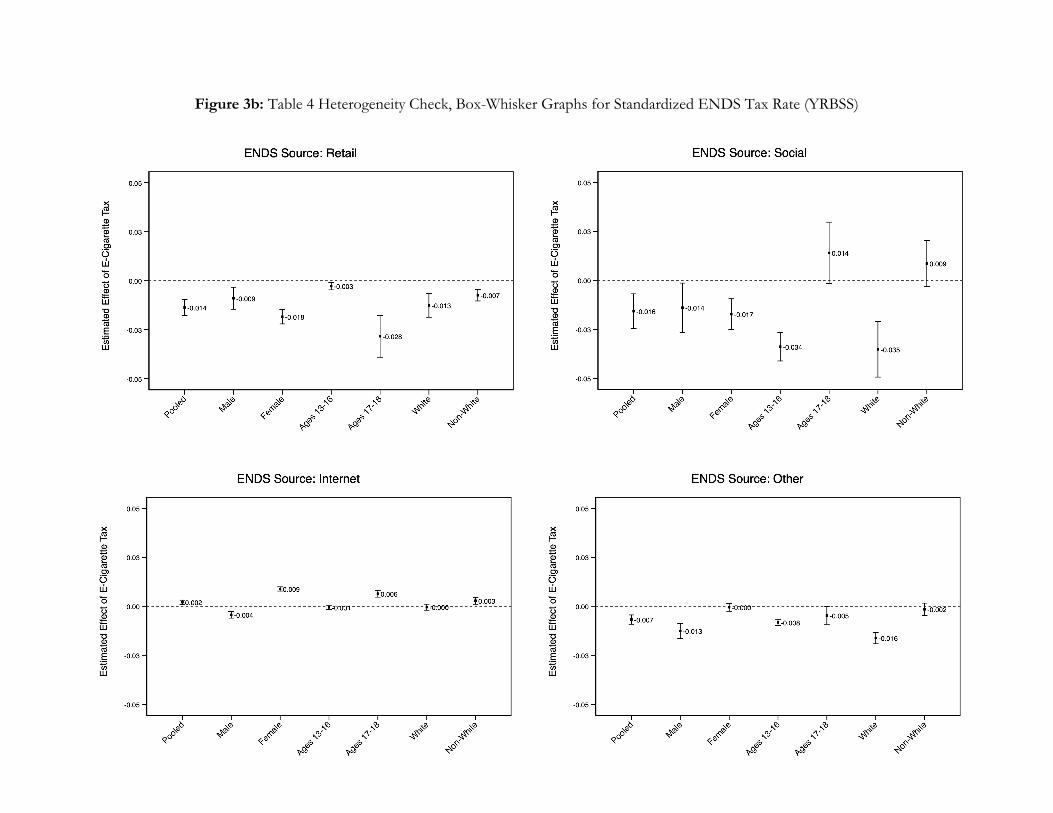
38
Figure 3b: Table 4 Heterogeneity Check, Box-Whisker Graphs for Standardized ENDS Tax Rate (YRBSS)
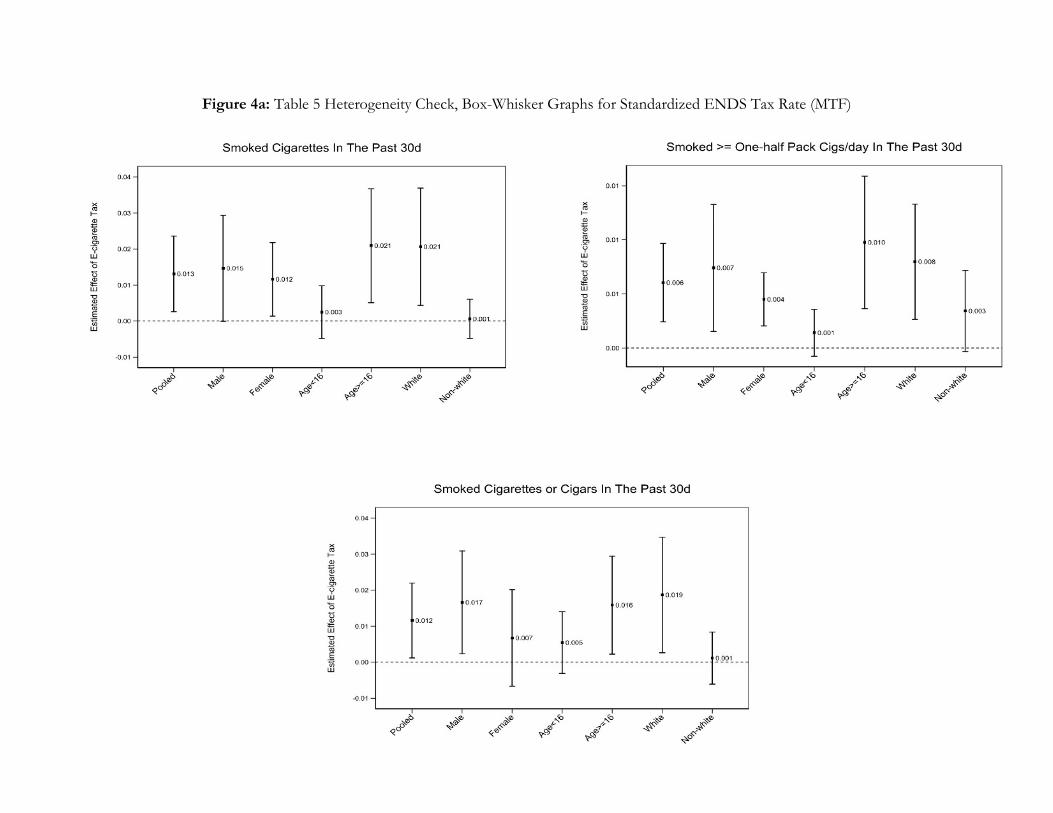
39
Figure 4a: Table 5 Heterogeneity Check, Box-Whisker Graphs for Standardized ENDS Tax Rate (MTF)
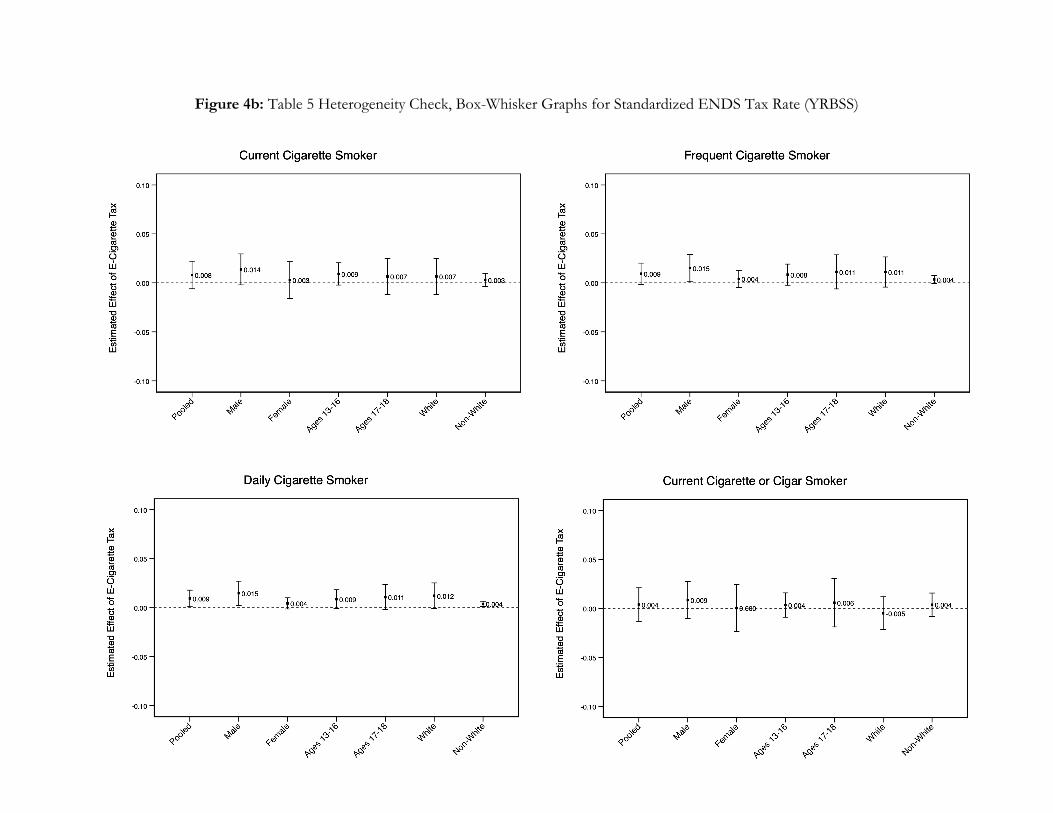
40
Figure 4b: Table 5 Heterogeneity Check, Box-Whisker Graphs for Standardized ENDS Tax Rate (YRBSS)
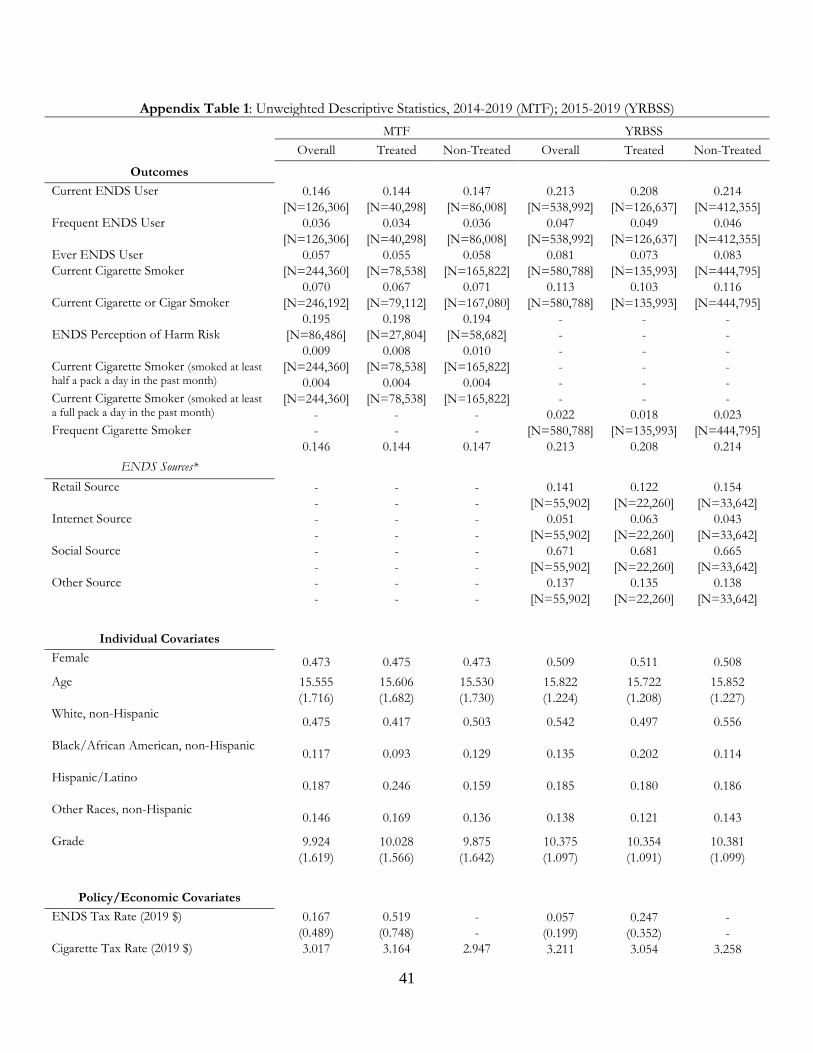
41
Appendix Table 1: Unweighted Descriptive Statistics, 2014-2019 (MTF); 2015-2019 (YRBSS)
MTF YRBSS
Overall Treated Non-Treated Overall Treated Non-Treated
Outcomes Current ENDS User 0.146 0.144 0.147 0.213 0.208 0.214
[N=126,306] [N=40,298] [N=86,008] [N=538,992] [N=126,637] [N=412,355] Frequent ENDS User 0.036 0.034 0.036 0.047 0.049 0.046
[N=126,306] [N=40,298] [N=86,008] [N=538,992] [N=126,637] [N=412,355] Ever ENDS User 0.057 0.055 0.058 0.081 0.073 0.083 Current Cigarette Smoker [N=244,360] [N=78,538] [N=165,822] [N=580,788] [N=135,993] [N=444,795]
0.070 0.067 0.071 0.113 0.103 0.116 Current Cigarette or Cigar Smoker [N=246,192] [N=79,112] [N=167,080] [N=580,788] [N=135,993] [N=444,795]
0.195 0.198 0.194 - - - ENDS Perception of Harm Risk [N=86,486] [N=27,804] [N=58,682] - - -
0.009 0.008 0.010 - - - Current Cigarette Smoker (smoked at least half a pack a day in the past month)
[N=244,360] [N=78,538] [N=165,822] - - - 0.004 0.004 0.004 - - -
Current Cigarette Smoker (smoked at least a full pack a day in the past month)
[N=244,360] [N=78,538] [N=165,822] - - - - - - 0.022 0.018 0.023
Frequent Cigarette Smoker - - - [N=580,788] [N=135,993] [N=444,795] 0.146 0.144 0.147 0.213 0.208 0.214
ENDS Sources*
Retail Source - - - 0.141 0.122 0.154 - - - [N=55,902] [N=22,260] [N=33,642]
Internet Source - - - 0.051 0.063 0.043 - - - [N=55,902] [N=22,260] [N=33,642]
Social Source - - - 0.671 0.681 0.665 - - - [N=55,902] [N=22,260] [N=33,642]
Other Source - - - 0.137 0.135 0.138 - - - [N=55,902] [N=22,260] [N=33,642]
Individual Covariates Female 0.473 0.475 0.473 0.509 0.511 0.508 Age 15.555 15.606 15.530 15.822 15.722 15.852
(1.716) (1.682) (1.730) (1.224) (1.208) (1.227) White, non-Hispanic
0.475 0.417 0.503 0.542 0.497 0.556
Black/African American, non-Hispanic 0.117 0.093 0.129 0.135 0.202 0.114
Hispanic/Latino 0.187 0.246 0.159 0.185 0.180 0.186
Other Races, non-Hispanic 0.146 0.169 0.136 0.138 0.121 0.143
Grade 9.924 10.028 9.875 10.375 10.354 10.381 (1.619) (1.566) (1.642) (1.097) (1.091) (1.099)
Policy/Economic Covariates
ENDS Tax Rate (2019 $) 0.167 0.519 - 0.057 0.247 - (0.489) (0.748) - (0.199) (0.352) -
Cigarette Tax Rate (2019 $) 3.017 3.164 2.947 3.211 3.054 3.258
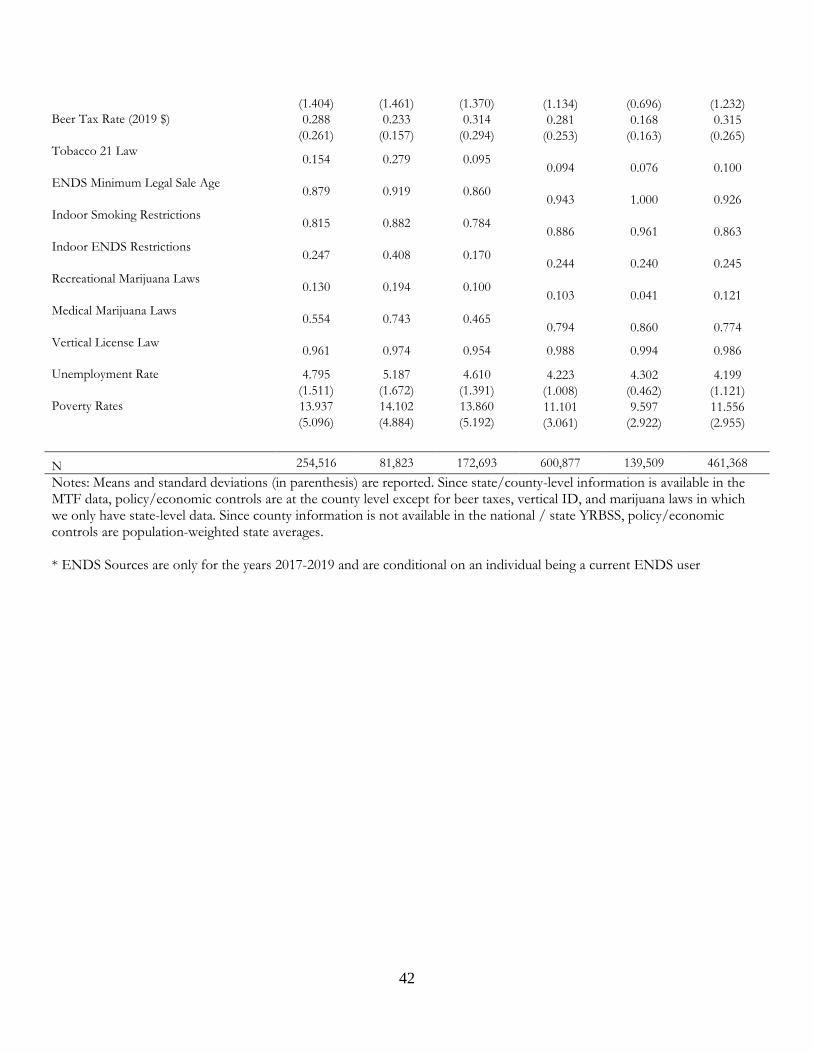
42
(1.404) (1.461) (1.370) (1.134) (0.696) (1.232) Beer Tax Rate (2019 $) 0.288 0.233 0.314 0.281 0.168 0.315
(0.261) (0.157) (0.294) (0.253) (0.163) (0.265) Tobacco 21 Law
0.154 0.279 0.095 0.094 0.076 0.100
ENDS Minimum Legal Sale Age 0.879 0.919 0.860
0.943 1.000 0.926 Indoor Smoking Restrictions
0.815 0.882 0.784 0.886 0.961 0.863
Indoor ENDS Restrictions 0.247 0.408 0.170
0.244 0.240 0.245 Recreational Marijuana Laws
0.130 0.194 0.100 0.103 0.041 0.121
Medical Marijuana Laws 0.554 0.743 0.465
0.794 0.860 0.774 Vertical License Law 0.961 0.974 0.954 0.988 0.994 0.986
Unemployment Rate 4.795 5.187 4.610 4.223 4.302 4.199 (1.511) (1.672) (1.391) (1.008) (0.462) (1.121)
Poverty Rates 13.937 14.102 13.860 11.101 9.597 11.556 (5.096) (4.884) (5.192) (3.061) (2.922) (2.955)
N 254,516 81,823 172,693 600,877 139,509 461,368 Notes: Means and standard deviations (in parenthesis) are reported. Since state/county-level information is available in the MTF data, policy/economic controls are at the county level except for beer taxes, vertical ID, and marijuana laws in which we only have state-level data. Since county information is not available in the national / state YRBSS, policy/economic controls are population-weighted state averages. * ENDS Sources are only for the years 2017-2019 and are conditional on an individual being a current ENDS user

43
Appendix Table 2: Sensitivity Analysis, Adding One Period Lead from Date of Enactment
Outcome Current ENDS Use
Regular ENDS Use
ENDS Initiation
Ever Use ENDS
Perceived ENDS Risk
Current Cigarette Use
Current Cigarette Use
(half pack a day)
Current Cigarette or Cigar Use
ENDS Tax Lead (0, 1) -0.003 0.004 0.008 0.000 0.019* -0.001 -0.001 -0.002 (0.013) (0.005) (0.011) (0.013) (0.007) (0.006) (0.002) (0.007)
[-0.030,0.024] [-0.007,0.015] [-0.013,0.030] [-0.026,0.027] [0.004,0.034] [-0.014,0.011] [-0.005,0.003] [-0.015,0.012] <0.819> <0.448> <0.45> <0.983> <0.014> <0.827> <0.599> <0.806>
ENDS Tax Rate (2019 $) -0.020+ -0.012+ -0.005 -0.052*** 0.033* 0.013* 0.006** 0.011+ (0.010) (0.007) (0.013) (0.012) (0.015) (0.005) (0.002) (0.006) [-0.041,0.001] [-0.026,0.002] [-0.031,0.021] [-0.076,-0.027] [0.004,0.063] [0.002,0.023] [0.002,0.010] [-0.000,0.022] <0.059> <0.092> <0.707> <0.000> <0.029> <0.02> <0.006> <0.052> Cigarette Tax Rate (2019 $) -0.005 0.010+ -0.002 0.012 0.000 -0.001 -0.002 -0.002
(0.008) (0.005) (0.013) (0.008) (0.008) (0.006) (0.002) (0.007) [-0.021,0.011] [-0.000,0.020] [-0.029,0.025] [-0.004,0.028] [-0.015,0.015] [-0.013,0.011] [-0.006,0.001] [-0.016,0.012]
<0.514> <0.058> <0.867> <0.131> <0.991> <0.877> <0.218> <0.805> Data MTF MTF MTF MTF MTF MTF MTF MTF N 126,306 126,306 66,124 85,541 86,486 244,360 244,360 246,192 Dependent Variable Mean 0.152 0.038 0.104 0.287 0.192 0.066 0.012 0.080 ENDS Elasticity -0.080 -0.190 -0.037 -0.146 0.060 0.119 0.324 0.086 Cigarette Elasticity -0.101 0.744 -0.064 0.128 -0.001 -0.040 -0.566 -0.063 + p<0.10, * p<0.05, ** p<0.01, *** p<0.001 Notes: All MTF models include tax jurisdiction fixed-effects, year-by-quarter fixed-effects, and each of the individual controls and policy/economic covariates listed in Table 2. Regressions are weighted, standard errors are corrected for clustering at the state level, 95% confidence intervals are shown in [ ] and p-values are shown in < >.
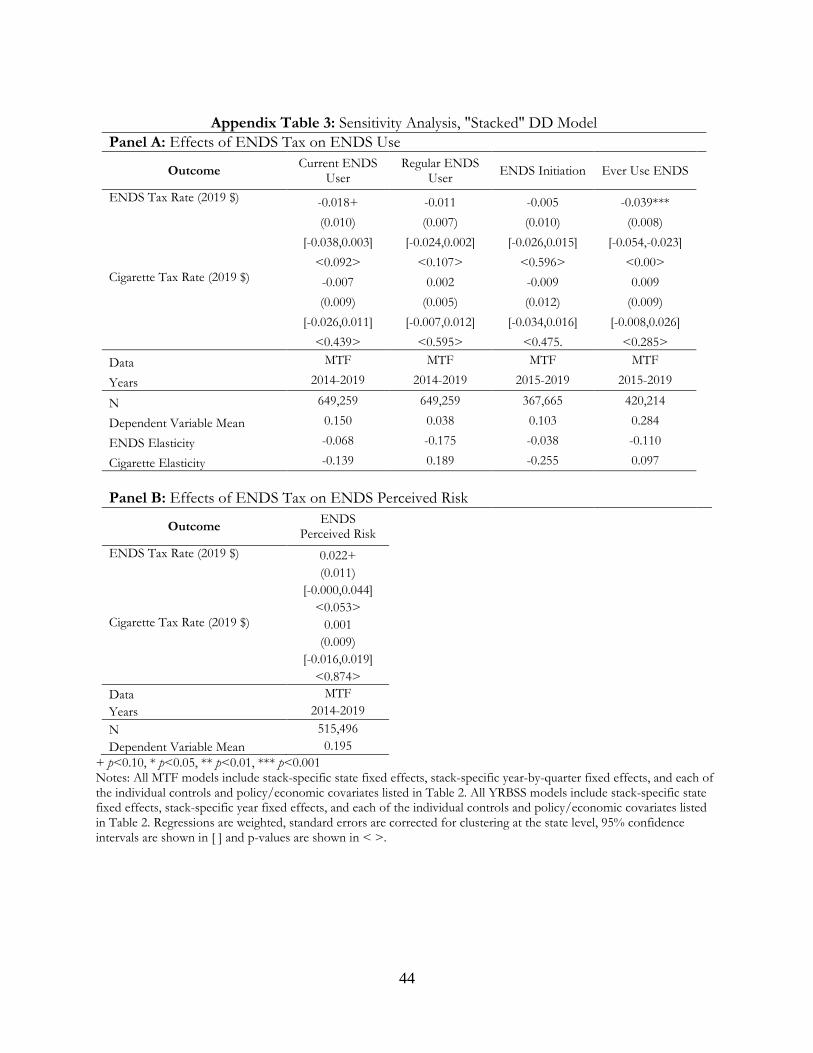
44
Appendix Table 3: Sensitivity Analysis, "Stacked" DD Model
Panel A: Effects of ENDS Tax on ENDS Use
Outcome Current ENDS User
Regular ENDS User ENDS Initiation Ever Use ENDS
ENDS Tax Rate (2019 $) -0.018+ -0.011 -0.005 -0.039*** (0.010) (0.007) (0.010) (0.008)
[-0.038,0.003] [-0.024,0.002] [-0.026,0.015] [-0.054,-0.023] <0.092> <0.107> <0.596> <0.00>
Cigarette Tax Rate (2019 $) -0.007 0.002 -0.009 0.009 (0.009) (0.005) (0.012) (0.009)
[-0.026,0.011] [-0.007,0.012] [-0.034,0.016] [-0.008,0.026] <0.439> <0.595> <0.475. <0.285>
Data MTF MTF MTF MTF
Years 2014-2019 2014-2019 2015-2019 2015-2019
N 649,259 649,259 367,665 420,214
Dependent Variable Mean 0.150 0.038 0.103 0.284
ENDS Elasticity -0.068 -0.175 -0.038 -0.110
Cigarette Elasticity -0.139 0.189 -0.255 0.097
Panel B: Effects of ENDS Tax on ENDS Perceived Risk
Outcome ENDS Perceived Risk
ENDS Tax Rate (2019 $) 0.022+
(0.011)
[-0.000,0.044]
<0.053> Cigarette Tax Rate (2019 $) 0.001
(0.009)
[-0.016,0.019]
<0.874>
Data MTF
Years 2014-2019
N 515,496
Dependent Variable Mean 0.195 + p<0.10, * p<0.05, ** p<0.01, *** p<0.001 Notes: All MTF models include stack-specific state fixed effects, stack-specific year-by-quarter fixed effects, and each of the individual controls and policy/economic covariates listed in Table 2. All YRBSS models include stack-specific state fixed effects, stack-specific year fixed effects, and each of the individual controls and policy/economic covariates listed in Table 2. Regressions are weighted, standard errors are corrected for clustering at the state level, 95% confidence intervals are shown in [ ] and p-values are shown in < >.
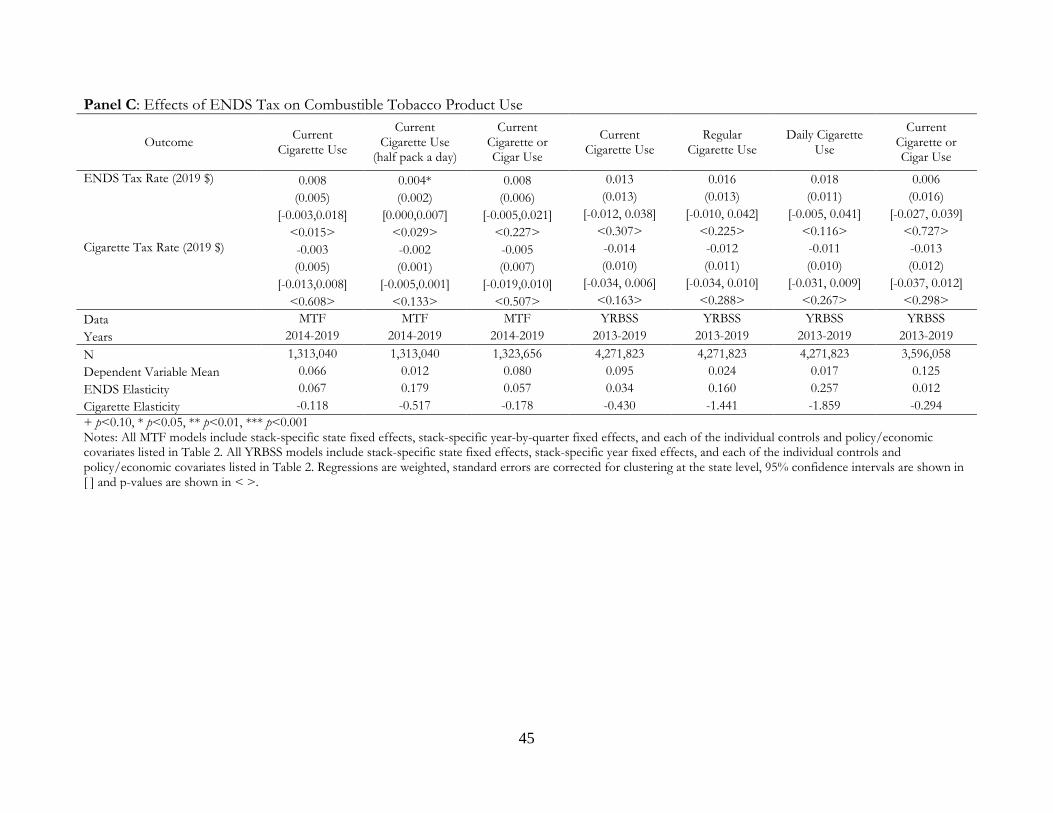
45
Panel C: Effects of ENDS Tax on Combustible Tobacco Product Use
Outcome Current Cigarette Use
Current Cigarette Use
(half pack a day)
Current Cigarette or Cigar Use
Current Cigarette Use
Regular Cigarette Use
Daily Cigarette Use
Current Cigarette or Cigar Use
ENDS Tax Rate (2019 $) 0.008 0.004* 0.008 0.013 0.016 0.018 0.006 (0.005) (0.002) (0.006) (0.013) (0.013) (0.011) (0.016)
[-0.003,0.018] [0.000,0.007] [-0.005,0.021] [-0.012, 0.038] [-0.010, 0.042] [-0.005, 0.041] [-0.027, 0.039] <0.015> <0.029> <0.227> <0.307> <0.225> <0.116> <0.727>
Cigarette Tax Rate (2019 $) -0.003 -0.002 -0.005 -0.014 -0.012 -0.011 -0.013 (0.005) (0.001) (0.007) (0.010) (0.011) (0.010) (0.012)
[-0.013,0.008] [-0.005,0.001] [-0.019,0.010] [-0.034, 0.006] [-0.034, 0.010] [-0.031, 0.009] [-0.037, 0.012] <0.608> <0.133> <0.507> <0.163> <0.288> <0.267> <0.298>
Data MTF MTF MTF YRBSS YRBSS YRBSS YRBSS Years 2014-2019 2014-2019 2014-2019 2013-2019 2013-2019 2013-2019 2013-2019 N 1,313,040 1,313,040 1,323,656 4,271,823 4,271,823 4,271,823 3,596,058 Dependent Variable Mean 0.066 0.012 0.080 0.095 0.024 0.017 0.125 ENDS Elasticity 0.067 0.179 0.057 0.034 0.160 0.257 0.012 Cigarette Elasticity -0.118 -0.517 -0.178 -0.430 -1.441 -1.859 -0.294 + p<0.10, * p<0.05, ** p<0.01, *** p<0.001 Notes: All MTF models include stack-specific state fixed effects, stack-specific year-by-quarter fixed effects, and each of the individual controls and policy/economic covariates listed in Table 2. All YRBSS models include stack-specific state fixed effects, stack-specific year fixed effects, and each of the individual controls and policy/economic covariates listed in Table 2. Regressions are weighted, standard errors are corrected for clustering at the state level, 95% confidence intervals are shown in [ ] and p-values are shown in < >.

46
Appendix Table 4: Sensitivity Analysis, 2SLS IV Model
Panel A: Effects of ENDS Tax on ENDS Use
Outcome Current ENDS User
Regular ENDS User ENDS Initiation Ever Use ENDS Current ENDS
User ENDS Tax Rate (2019 $) -0.020 -0.014 -0.007 -0.050*** -0.070**
(0.012) (0.008) (0.015) (0.012) (0.024) [-0.044,0.004] [-0.030,0.003] [-0.037,0.022] [-0.073,-0.027] [-0.117, -0.022]
<0.103> <0.106> <0.619> <0> <0.004> Cigarette Tax Rate (2019 $) -0.005 0.009+ -0.004 0.012 0.040
(0.009) (0.005) (0.013) (0.008) (0.026) [-0.022,0.012] [-0.001,0.019] [-0.029,0.022] [-0.005,0.028] [-0.012, 0.091]
<0.598> <0.075> <0.783> <0.168> <0.130>
Data MTF MTF MTF MTF YRBSS
Years 2014-2019 2014-2019 2015-2019 2015-2019 2015-2019
N 126,306 126,306 66,124 85,541 538,992
Dependent Variable Mean 0.152 0.038 0.104 0.287 0.213
ENDS Elasticity -0.079 -0.214 -0.057 -0.142 -0.161
Cigarette Elasticity -0.089 0.717 -0.100 0.122 0.551
F-Statistic 15,837 15,837 18,300 23,132 25,451.45
Hansen's J-Statistic (p-value) 0.006 0.009 0.328 0.013 0.313 Panel B: Effects of ENDS Tax on ENDS Perceived Risk and Sources
Outcome ENDS Perceived Risk Retail Source Social Source Internet Source Other Source
ENDS Tax Rate (2019 $)
0.033* -0.070* 0.097* 0.018 -0.045* (0.014) (0.030) (0.043) (0.015) (0.021)
[0.006,0.059] [-0.128, -0.011) [0.012, 0.181] [-0.011, 0.047] [-0.086, -0.004] <0.015> <0.020> <0.026> <0.220> <0.031>
Cigarette Tax Rate (2019 $)
-0.004 0.076** -0.099* 0.006 0.016 (0.007) (0.028) (0.047) (0.019) (0.020)
[-0.017,0.009] [0.022, 0.130] [-0.191, -0.006] [-0.030, 0.043] [-0.024, 0.056] <0.531> <0.006> <0.036> <0.729> <0.438>
Data MTF YRBSS YRBSS YRBSS YRBSS Years 2014-2018 2015-2019 2015-2019 2015-2019 2015-2019 N 86,486 55,902 55,902 55,902 55,902 Dependent Variable Mean 0.192 0.185 0.627 0.042 0.145 F-Statistic 26,277 28,588.33 28,588.33 28,588.33 28,588.33 Hansen's J-Statistic (p-value) 0.620 0.335 0.208 0.187 0.314 + p<0.10, * p<0.05, ** p<0.01, *** p<0.001 Notes: All MTF models include tax jurisdiction fixed-effects, year-by-quarter fixed-effects, and each of the individual controls and policy/economic covariates listed in Table 2. All YRBSS models include state fixed-effects, year fixed-effects, and each of the individual controls and policy/economic covariates listed in Table 2. Regressions are weighted, standard errors are corrected for clustering at the state level, 95% confidence intervals are shown in [ ] and p-values are shown in < >.
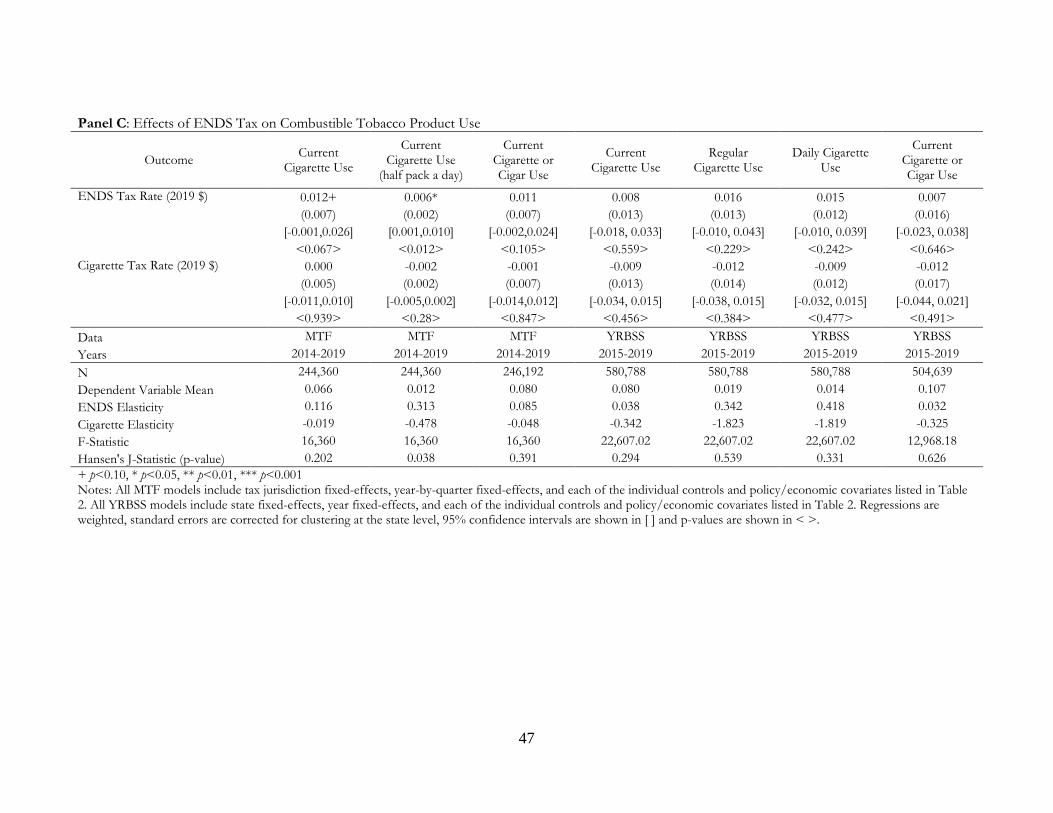
47
Panel C: Effects of ENDS Tax on Combustible Tobacco Product Use
Outcome Current Cigarette Use
Current Cigarette Use
(half pack a day)
Current Cigarette or Cigar Use
Current Cigarette Use
Regular Cigarette Use
Daily Cigarette Use
Current Cigarette or Cigar Use
ENDS Tax Rate (2019 $) 0.012+ 0.006* 0.011 0.008 0.016 0.015 0.007 (0.007) (0.002) (0.007) (0.013) (0.013) (0.012) (0.016)
[-0.001,0.026] [0.001,0.010] [-0.002,0.024] [-0.018, 0.033] [-0.010, 0.043] [-0.010, 0.039] [-0.023, 0.038] <0.067> <0.012> <0.105> <0.559> <0.229> <0.242> <0.646>
Cigarette Tax Rate (2019 $) 0.000 -0.002 -0.001 -0.009 -0.012 -0.009 -0.012 (0.005) (0.002) (0.007) (0.013) (0.014) (0.012) (0.017)
[-0.011,0.010] [-0.005,0.002] [-0.014,0.012] [-0.034, 0.015] [-0.038, 0.015] [-0.032, 0.015] [-0.044, 0.021] <0.939> <0.28> <0.847> <0.456> <0.384> <0.477> <0.491>
Data MTF MTF MTF YRBSS YRBSS YRBSS YRBSS Years 2014-2019 2014-2019 2014-2019 2015-2019 2015-2019 2015-2019 2015-2019 N 244,360 244,360 246,192 580,788 580,788 580,788 504,639 Dependent Variable Mean 0.066 0.012 0.080 0.080 0.019 0.014 0.107 ENDS Elasticity 0.116 0.313 0.085 0.038 0.342 0.418 0.032 Cigarette Elasticity -0.019 -0.478 -0.048 -0.342 -1.823 -1.819 -0.325 F-Statistic 16,360 16,360 16,360 22,607.02 22,607.02 22,607.02 12,968.18 Hansen's J-Statistic (p-value) 0.202 0.038 0.391 0.294 0.539 0.331 0.626 + p<0.10, * p<0.05, ** p<0.01, *** p<0.001 Notes: All MTF models include tax jurisdiction fixed-effects, year-by-quarter fixed-effects, and each of the individual controls and policy/economic covariates listed in Table 2. All YRBSS models include state fixed-effects, year fixed-effects, and each of the individual controls and policy/economic covariates listed in Table 2. Regressions are weighted, standard errors are corrected for clustering at the state level, 95% confidence intervals are shown in [ ] and p-values are shown in < >.

48
Appendix Table 5: Sensitivity Analysis, Add Cigar Tax Variables
Panel A: Effects of ENDS Tax on ENDS Use
Outcome Current ENDS User
Regular ENDS User ENDS Initiation Ever Use ENDS Current ENDS
User ENDS Tax Rate (2019 $) -0.006 -0.016* -0.026** -0.058*** -0.066*
(0.009) (0.007) (0.008) (0.012) (0.030) [-0.025,0.012] [-0.030,-0.002] [-0.041,-0.010] [-0.083,-0.034] [-0.126, -0.005]
<0.503> <0.024> <0.002> <0.000> <0.034> Cigarette Tax Rate (2019 $) 0.001 0.006 -0.015 0.007 0.046
(0.011) (0.007) (0.014) (0.010) (0.041) [-0.021,0.022] [-0.007,0.020] [-0.044,0.014] [-0.013,0.026] [-0.036, 0.128]
<0.946> <0.338> <0.304> <0.499> <0.261>
Data MTF MTF MTF MTF YRBSS
Years 2014-2019 2014-2019 2015-2019 2015-2019 2015-2019
N 126,306 126,306 66,124 85,541 538,992
Dependent Variable Mean 0.152 0.038 0.104 0.287 0.213
ENDS Elasticity -0.024 -0.256 -0.193 -0.164 -0.151
Cigarette Elasticity 0.014 0.500 -0.423 0.070 0.644 Panel B: Effects of ENDS Tax on ENDS Perceived Risk and Sources
Outcome ENDS Perceived Risk Retail Source Social Source Internet Source Other Source
ENDS Tax Rate (2019 $) 0.044* -0.042 0.033 0.028** -0.020 (0.017) (0.036) (0.031) (0.009) (0.018)
[0.010,0.079] [-0.114, 0.029] [-0.030, 0.097] [0.010, 0.047] [-0.056, 0.017] <0.012> <0.241> <0.295> <0.003> <0.285>
Cigarette Tax Rate (2019 $) 0.003 0.065+ -0.116** -0.013 0.065+ (0.008) (0.038) (0.042) (0.026) (0.032)
[-0.014,0.019] [-0.012, 0.142] [-0.020, -0.031] [-0.065, 0.038] [-0.002, 0.132] <0.765> <0.096> <0.009> <0.602> <0.056>
Data MTF YRBSS YRBSS YRBSS YRBSS Years 2014-2018 2015-2019 2015-2019 2015-2019 2015-2019 N 86,486 55,902 55,902 55,902 55,902 Dependent Variable Mean 0.192 0.185 0.627 0.042 0.145 + p<0.10, * p<0.05, ** p<0.01, *** p<0.001 Notes: All MTF models include tax jurisdiction fixed-effects, year-by-quarter fixed-effects, and each of the individual controls and policy/economic covariates listed in Table 2. All YRBSS models include state fixed-effects, year fixed-effects, and each of the individual controls and policy/economic covariates listed in Table 2. Regressions are weighted, standard errors are corrected for clustering at the state level, 95% confidence intervals are shown in [ ] and p-values are shown in < >.

49
Panel C: Effects of ENDS Tax on Combustible Tobacco Product Use
Outcome Current Cigarette Use
Current Cigarette Use
(half pack a day)
Current Cigarette or Cigar Use
Current Cigarette Use
Regular Cigarette Use
Daily Cigarette Use
Current Cigarette or Cigar Use
ENDS Tax Rate (2019 $) -0.003 0.002 -0.001 -0.009 -0.004 -0.004 -0.010 (0.005) (0.003) (0.005) (0.012) (0.005) (0.005) (0.007)
[-0.012,0.007] [-0.004,0.008] [-0.010,0.008] [-0.033, 0.016] [-0.014, 0.006] [-0.015, 0.006] [-0.023, 0.004] <0.553> <0.535> <0.783> <0.471> <0.425> <0.416> <0.150>
Cigarette Tax Rate (2019 $) -0.009 -0.004+ -0.008 -0.034 -0.041 -0.036 -0.044 (0.006) (0.002) (0.009) (0.025) (0.029) (0.027) (0.038)
[-0.022,0.004] [-0.008,0.000] [-0.026,0.010] [-0.085, 0.017] [-0.100, 0.018] [-0.090, 0.017] [-0.121, 0.033] <0.159> <0.052> <0.364> <0.191> <0.168> <0.178> <0.257>
Data MTF MTF MTF YRBSS YRBSS YRBSS YRBSS Years 2014-2019 2014-2019 2014-2019 2015-2019 2015-2019 2015-2019 2015-2019 N 244,360 244,360 246,192 580,788 580,788 580,788 504,639 Dependent Variable Mean 0.066 0.012 0.080 0.080 0.019 0.014 0.107 ENDS Elasticity -0.026 0.112 -0.010 -0.044 -0.085 -0.123 -0.042 Cigarette Elasticity -0.409 -0.967 -0.307 -1.231 -6.327 -7.679 -1.233 + p<0.10, * p<0.05, ** p<0.01, *** p<0.001 Notes: All MTF models include tax jurisdiction fixed-effects, year-by-quarter fixed-effects, and each of the individual controls and policy/economic covariates listed in Table 2. All YRBSS models include state fixed-effects, year fixed-effects, and each of the individual controls and policy/economic covariates listed in Table 2. Regressions are weighted, standard errors are corrected for clustering at the state level, 95% confidence intervals are shown in [ ] and p-values are shown in < >.
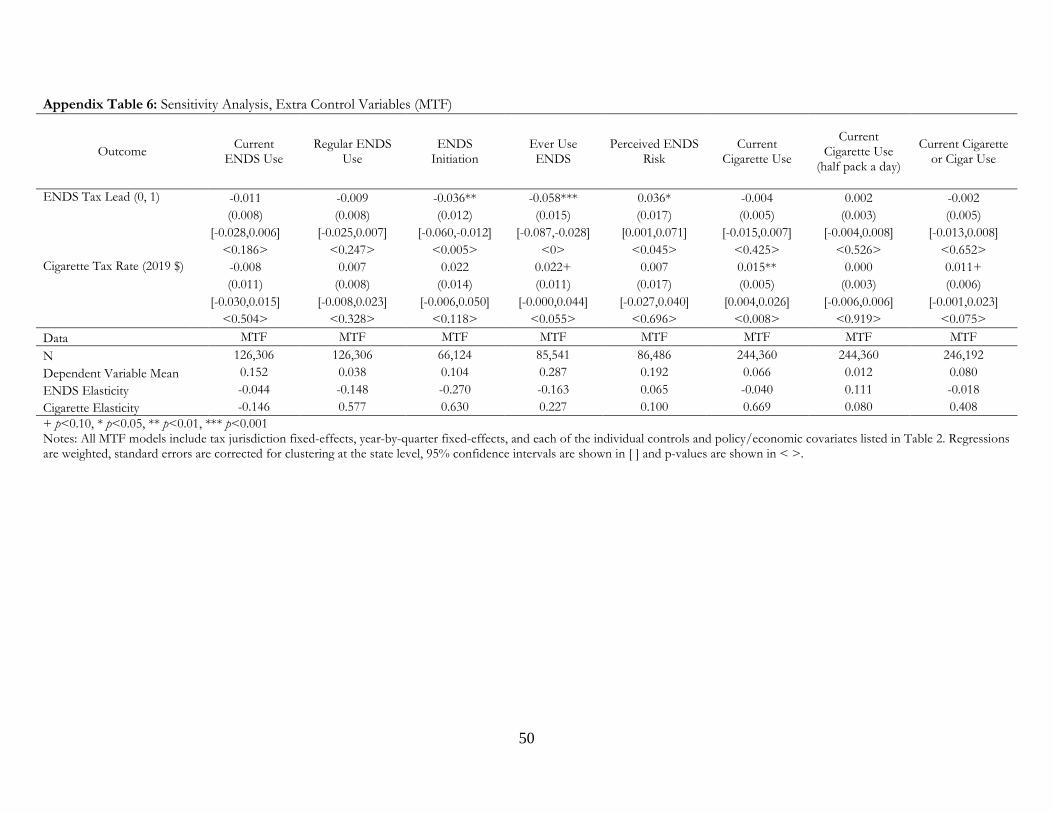
50
Appendix Table 6: Sensitivity Analysis, Extra Control Variables (MTF)
Outcome Current ENDS Use
Regular ENDS Use
ENDS Initiation
Ever Use ENDS
Perceived ENDS Risk
Current Cigarette Use
Current Cigarette Use
(half pack a day)
Current Cigarette or Cigar Use
ENDS Tax Lead (0, 1) -0.011 -0.009 -0.036** -0.058*** 0.036* -0.004 0.002 -0.002 (0.008) (0.008) (0.012) (0.015) (0.017) (0.005) (0.003) (0.005)
[-0.028,0.006] [-0.025,0.007] [-0.060,-0.012] [-0.087,-0.028] [0.001,0.071] [-0.015,0.007] [-0.004,0.008] [-0.013,0.008] <0.186> <0.247> <0.005> <0> <0.045> <0.425> <0.526> <0.652>
Cigarette Tax Rate (2019 $) -0.008 0.007 0.022 0.022+ 0.007 0.015** 0.000 0.011+ (0.011) (0.008) (0.014) (0.011) (0.017) (0.005) (0.003) (0.006)
[-0.030,0.015] [-0.008,0.023] [-0.006,0.050] [-0.000,0.044] [-0.027,0.040] [0.004,0.026] [-0.006,0.006] [-0.001,0.023] <0.504> <0.328> <0.118> <0.055> <0.696> <0.008> <0.919> <0.075>
Data MTF MTF MTF MTF MTF MTF MTF MTF N 126,306 126,306 66,124 85,541 86,486 244,360 244,360 246,192 Dependent Variable Mean 0.152 0.038 0.104 0.287 0.192 0.066 0.012 0.080 ENDS Elasticity -0.044 -0.148 -0.270 -0.163 0.065 -0.040 0.111 -0.018 Cigarette Elasticity -0.146 0.577 0.630 0.227 0.100 0.669 0.080 0.408 + p<0.10, * p<0.05, ** p<0.01, *** p<0.001 Notes: All MTF models include tax jurisdiction fixed-effects, year-by-quarter fixed-effects, and each of the individual controls and policy/economic covariates listed in Table 2. Regressions are weighted, standard errors are corrected for clustering at the state level, 95% confidence intervals are shown in [ ] and p-values are shown in < >.

51
Appendix Table 7: Sensitivity Analysis, Unbalanced Panel of States
Outcome Current ENDS Use
Regular ENDS Use
ENDS Initiation
Ever Use ENDS
Perceived ENDS Risk
Current Cigarette Use
Current Cigarette Use
(half pack a day)
Current Cigarette or Cigar Use
ENDS Tax Lead (0, 1) -0.020+ -0.013+ -0.009 -0.053*** 0.028* 0.013* 0.006** 0.011+ (0.010) (0.007) (0.013) (0.010) (0.013) (0.006) (0.002) (0.006)
[-0.041,0.000] [-0.027,0.002] [-0.037,0.018] [-0.073,-0.033] [0.001,0.054] [0.001,0.024] [0.002,0.010] [-0.001,0.023] <0.055> <0.086> <0.489> <0.000> <0.039> <0.037> <0.008> <0.071>
Cigarette Tax Rate (2019 $) -0.005 0.008+ -0.003 0.014 -0.002 -0.001 -0.002 -0.001 (0.008) (0.005) (0.012) (0.008) (0.007) (0.005) (0.002) (0.006)
[-0.021,0.012] [-0.001,0.018] [-0.028,0.022] [-0.003,0.030] [-0.016,0.011] [-0.011,0.009] [-0.005,0.001] [-0.014,0.011] <0.573> <0.081> <0.803> <0.100> <0.751> <0.869> <0.253> <0.817>
Data MTF MTF MTF MTF MTF MTF MTF MTF N 130,183 130,183 68,213 87,833 89,508 252,117 252,117 254,020 Dependent Variable Mean 0.151 0.038 0.104 0.287 0.192 0.066 0.012 0.080 ENDS Elasticity -0.079 -0.198 -0.071 -0.149 0.117 0.324 0.084 Cigarette Elasticity -0.089 0.656 -0.089 0.143 -0.038 -0.494 -0.055 + p<0.10, * p<0.05, ** p<0.01, *** p<0.001 Notes: All MTF models include tax jurisdiction fixed-effects, year-by-quarter fixed-effects, and each of the individual controls and policy/economic covariates listed in Table 2. Regressions are weighted, standard errors are corrected for clustering at the state level, 95% confidence intervals are shown in [ ] and p-values are shown in < >.

52
Appendix Table 8: Sensitivity Analysis, Any Vaping for Years 2017+
Outcome Current ENDS User Regular ENDS User
ENDS Tax Rate (2019 $)
-0.020* -0.014* (0.008) (0.007)
[-0.037,-0.004] [-0.028,-0.001] <0.019> <0.038>
Cigarette Tax Rate (2019 $)
-0.005 0.008+ (0.006) (0.004)
[-0.017,0.008] [-0.001,0.017] <0.453> <0.069>
Data MTF MTF
Years 2014-2019 2014-2019
N 152,674 152,674
Dependent Variable Mean 0.162 0.043
ENDS Elasticity -0.081 -0.220
Cigarette Elasticity -0.086 0.578 + p<0.10, * p<0.05, ** p<0.01, *** p<0.001 Notes: All MTF models include tax jurisdiction fixed-effects, year-by-quarter fixed-effects, and each of the individual controls and policy/economic covariates listed in Table 2. Regressions are weighted, standard errors are corrected for clustering at the state level, 95% confidence intervals are shown in [ ] and p-values are shown in < >.
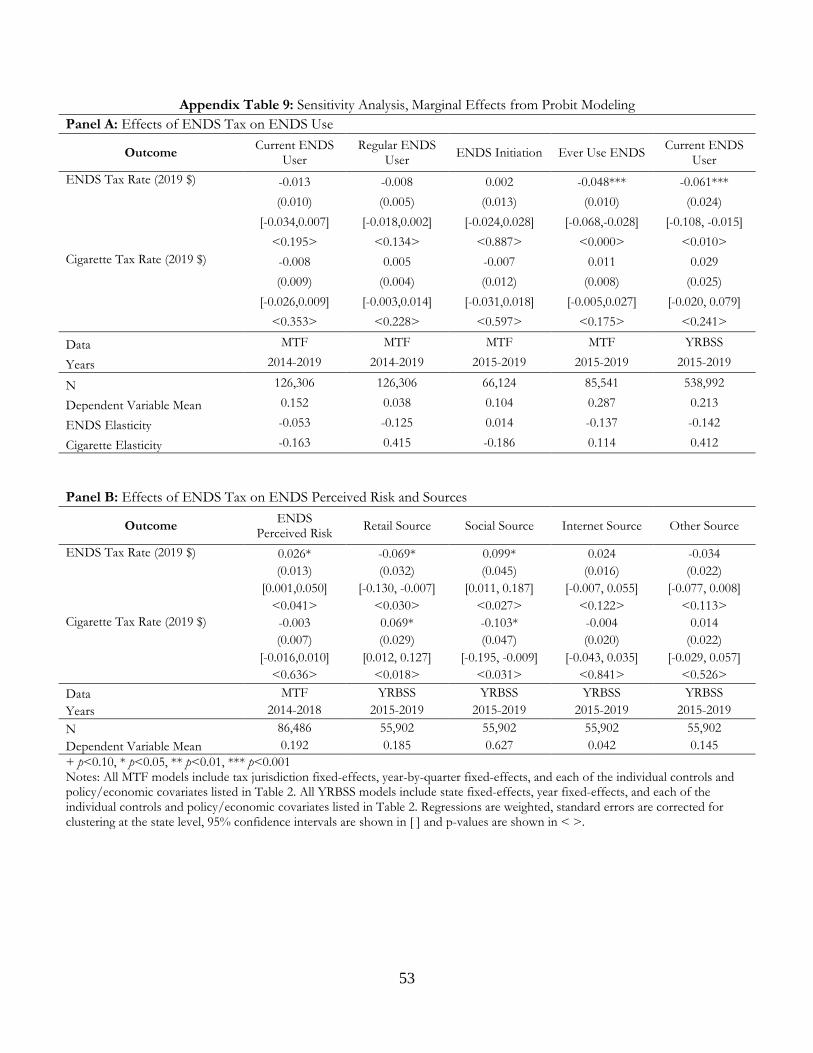
53
Appendix Table 9: Sensitivity Analysis, Marginal Effects from Probit Modeling Panel A: Effects of ENDS Tax on ENDS Use
Outcome Current ENDS User
Regular ENDS User ENDS Initiation Ever Use ENDS Current ENDS
User ENDS Tax Rate (2019 $) -0.013 -0.008 0.002 -0.048*** -0.061***
(0.010) (0.005) (0.013) (0.010) (0.024) [-0.034,0.007] [-0.018,0.002] [-0.024,0.028] [-0.068,-0.028] [-0.108, -0.015]
<0.195> <0.134> <0.887> <0.000> <0.010> Cigarette Tax Rate (2019 $) -0.008 0.005 -0.007 0.011 0.029
(0.009) (0.004) (0.012) (0.008) (0.025) [-0.026,0.009] [-0.003,0.014] [-0.031,0.018] [-0.005,0.027] [-0.020, 0.079]
<0.353> <0.228> <0.597> <0.175> <0.241>
Data MTF MTF MTF MTF YRBSS
Years 2014-2019 2014-2019 2015-2019 2015-2019 2015-2019
N 126,306 126,306 66,124 85,541 538,992
Dependent Variable Mean 0.152 0.038 0.104 0.287 0.213
ENDS Elasticity -0.053 -0.125 0.014 -0.137 -0.142
Cigarette Elasticity -0.163 0.415 -0.186 0.114 0.412
Panel B: Effects of ENDS Tax on ENDS Perceived Risk and Sources
Outcome ENDS Perceived Risk Retail Source Social Source Internet Source Other Source
ENDS Tax Rate (2019 $) 0.026* -0.069* 0.099* 0.024 -0.034 (0.013) (0.032) (0.045) (0.016) (0.022)
[0.001,0.050] [-0.130, -0.007] [0.011, 0.187] [-0.007, 0.055] [-0.077, 0.008] <0.041> <0.030> <0.027> <0.122> <0.113>
Cigarette Tax Rate (2019 $) -0.003 0.069* -0.103* -0.004 0.014 (0.007) (0.029) (0.047) (0.020) (0.022)
[-0.016,0.010] [0.012, 0.127] [-0.195, -0.009] [-0.043, 0.035] [-0.029, 0.057] <0.636> <0.018> <0.031> <0.841> <0.526>
Data MTF YRBSS YRBSS YRBSS YRBSS Years 2014-2018 2015-2019 2015-2019 2015-2019 2015-2019 N 86,486 55,902 55,902 55,902 55,902 Dependent Variable Mean 0.192 0.185 0.627 0.042 0.145 + p<0.10, * p<0.05, ** p<0.01, *** p<0.001 Notes: All MTF models include tax jurisdiction fixed-effects, year-by-quarter fixed-effects, and each of the individual controls and policy/economic covariates listed in Table 2. All YRBSS models include state fixed-effects, year fixed-effects, and each of the individual controls and policy/economic covariates listed in Table 2. Regressions are weighted, standard errors are corrected for clustering at the state level, 95% confidence intervals are shown in [ ] and p-values are shown in < >.

54
Panel C: Effects of ENDS Tax on Combustible Tobacco Product Use
Outcome Current Cigarette Use
Current Cigarette Use
(half pack a day)
Current Cigarette or Cigar Use
Current Cigarette Use
Regular Cigarette Use
Daily Cigarette Use
Current Cigarette or Cigar Use
ENDS Tax Rate (2019 $) 0.011 0.007** 0.009 -0.001 0.009 0.008 -0.007 (0.008) (0.002) (0.008) (0.010) (0.008) (0.006) (0.012)
[-0.004,0.026] [0.002,0.012] [-0.006,0.024] [-0.020, 0.019] [-0.006, 0.024] [-0.005, 0.020] [-0.030, 0.017] <0.145> <0.006> <0.233> <0.956> <0.266> <0.235> <0.567>
Cigarette Tax Rate (2019 $) 0.002 -0.002 0.002 0.001 -0.0005 0.001 -0.0004 (0.006) (0.002) (0.007) (0.009) (0.007) (0.006) (0.013)
[-0.009,0.014] [-0.006,0.002] [-0.013,0.016] [-0.017, 0.019] [-0.014, 0.013] [-0.010, 0.012] [-0.026, 0.025] <0.7> <0.326> <0.829> <0.924> <0.947> <0.836> <0.977>
Data MTF MTF MTF YRBSS YRBSS YRBSS YRBSS Years 2014-2019 2014-2019 2014-2019 2015-2019 2015-2019 2015-2019 2015-2019 N 244,360 244,360 246,192 580,788 580,788 580,788 504,639 Dependent Variable Mean 0.066 0.012 0.080 0.080 0.019 0.014 0.107 ENDS Elasticity 0.104 0.385 0.071 -0.003 0.179 0.221 -0.030 Cigarette Elasticity 0.101 -0.508 0.058 0.032 -0.071 0.251 -0.011 + p<0.10, * p<0.05, ** p<0.01, *** p<0.001 Notes: All MTF models include tax jurisdiction fixed-effects, year-by-quarter fixed-effects, and each of the individual controls and policy/economic covariates listed in Table 2. All YRBSS models include state fixed-effects, year fixed-effects, and each of the individual controls and policy/economic covariates listed in Table 2. Regressions are weighted, standard errors are corrected for clustering at the state level, 95% confidence intervals are shown in [ ] and p-values are shown in < >.
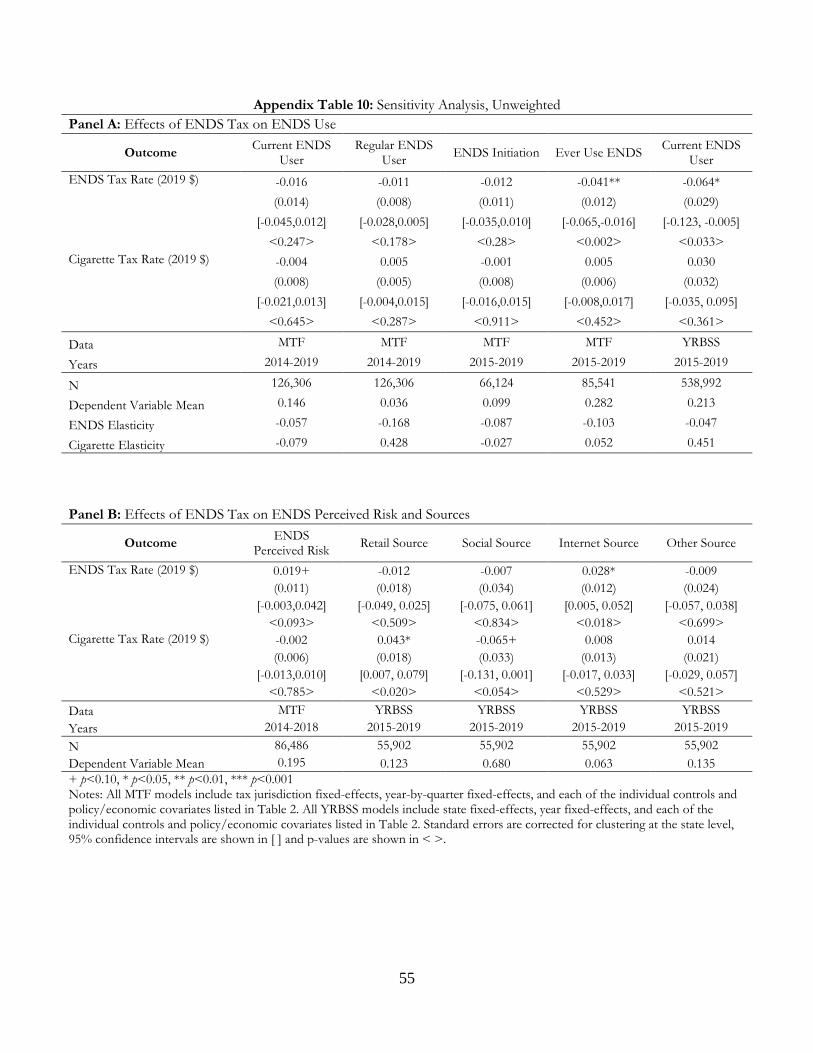
55
Appendix Table 10: Sensitivity Analysis, Unweighted Panel A: Effects of ENDS Tax on ENDS Use
Outcome Current ENDS User
Regular ENDS User ENDS Initiation Ever Use ENDS Current ENDS
User ENDS Tax Rate (2019 $) -0.016 -0.011 -0.012 -0.041** -0.064*
(0.014) (0.008) (0.011) (0.012) (0.029) [-0.045,0.012] [-0.028,0.005] [-0.035,0.010] [-0.065,-0.016] [-0.123, -0.005]
<0.247> <0.178> <0.28> <0.002> <0.033> Cigarette Tax Rate (2019 $) -0.004 0.005 -0.001 0.005 0.030
(0.008) (0.005) (0.008) (0.006) (0.032) [-0.021,0.013] [-0.004,0.015] [-0.016,0.015] [-0.008,0.017] [-0.035, 0.095]
<0.645> <0.287> <0.911> <0.452> <0.361>
Data MTF MTF MTF MTF YRBSS
Years 2014-2019 2014-2019 2015-2019 2015-2019 2015-2019
N 126,306 126,306 66,124 85,541 538,992
Dependent Variable Mean 0.146 0.036 0.099 0.282 0.213
ENDS Elasticity -0.057 -0.168 -0.087 -0.103 -0.047
Cigarette Elasticity -0.079 0.428 -0.027 0.052 0.451
Panel B: Effects of ENDS Tax on ENDS Perceived Risk and Sources
Outcome ENDS Perceived Risk Retail Source Social Source Internet Source Other Source
ENDS Tax Rate (2019 $) 0.019+ -0.012 -0.007 0.028* -0.009 (0.011) (0.018) (0.034) (0.012) (0.024)
[-0.003,0.042] [-0.049, 0.025] [-0.075, 0.061] [0.005, 0.052] [-0.057, 0.038] <0.093> <0.509> <0.834> <0.018> <0.699>
Cigarette Tax Rate (2019 $) -0.002 0.043* -0.065+ 0.008 0.014 (0.006) (0.018) (0.033) (0.013) (0.021)
[-0.013,0.010] [0.007, 0.079] [-0.131, 0.001] [-0.017, 0.033] [-0.029, 0.057] <0.785> <0.020> <0.054> <0.529> <0.521>
Data MTF YRBSS YRBSS YRBSS YRBSS Years 2014-2018 2015-2019 2015-2019 2015-2019 2015-2019 N 86,486 55,902 55,902 55,902 55,902 Dependent Variable Mean 0.195 0.123 0.680 0.063 0.135 + p<0.10, * p<0.05, ** p<0.01, *** p<0.001 Notes: All MTF models include tax jurisdiction fixed-effects, year-by-quarter fixed-effects, and each of the individual controls and policy/economic covariates listed in Table 2. All YRBSS models include state fixed-effects, year fixed-effects, and each of the individual controls and policy/economic covariates listed in Table 2. Standard errors are corrected for clustering at the state level, 95% confidence intervals are shown in [ ] and p-values are shown in < >.
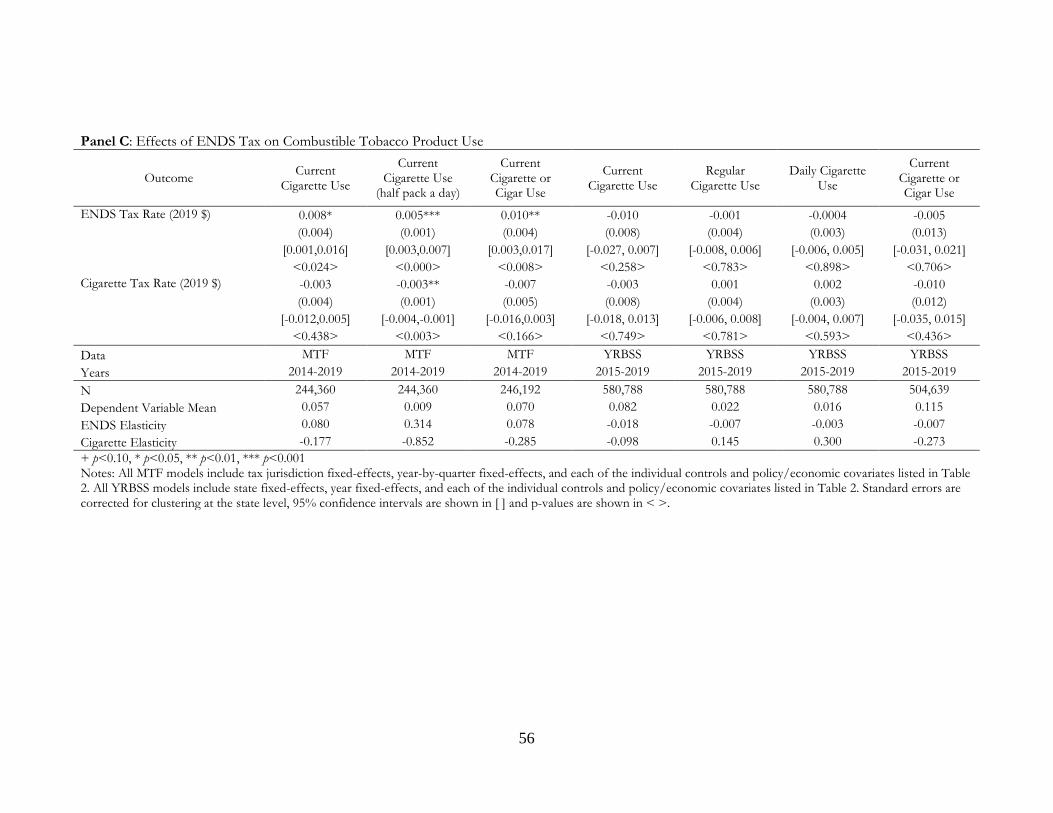
56
Panel C: Effects of ENDS Tax on Combustible Tobacco Product Use
Outcome Current Cigarette Use
Current Cigarette Use
(half pack a day)
Current Cigarette or Cigar Use
Current Cigarette Use
Regular Cigarette Use
Daily Cigarette Use
Current Cigarette or Cigar Use
ENDS Tax Rate (2019 $) 0.008* 0.005*** 0.010** -0.010 -0.001 -0.0004 -0.005 (0.004) (0.001) (0.004) (0.008) (0.004) (0.003) (0.013)
[0.001,0.016] [0.003,0.007] [0.003,0.017] [-0.027, 0.007] [-0.008, 0.006] [-0.006, 0.005] [-0.031, 0.021] <0.024> <0.000> <0.008> <0.258> <0.783> <0.898> <0.706>
Cigarette Tax Rate (2019 $) -0.003 -0.003** -0.007 -0.003 0.001 0.002 -0.010 (0.004) (0.001) (0.005) (0.008) (0.004) (0.003) (0.012)
[-0.012,0.005] [-0.004,-0.001] [-0.016,0.003] [-0.018, 0.013] [-0.006, 0.008] [-0.004, 0.007] [-0.035, 0.015] <0.438> <0.003> <0.166> <0.749> <0.781> <0.593> <0.436>
Data MTF MTF MTF YRBSS YRBSS YRBSS YRBSS Years 2014-2019 2014-2019 2014-2019 2015-2019 2015-2019 2015-2019 2015-2019 N 244,360 244,360 246,192 580,788 580,788 580,788 504,639 Dependent Variable Mean 0.057 0.009 0.070 0.082 0.022 0.016 0.115 ENDS Elasticity 0.080 0.314 0.078 -0.018 -0.007 -0.003 -0.007 Cigarette Elasticity -0.177 -0.852 -0.285 -0.098 0.145 0.300 -0.273 + p<0.10, * p<0.05, ** p<0.01, *** p<0.001 Notes: All MTF models include tax jurisdiction fixed-effects, year-by-quarter fixed-effects, and each of the individual controls and policy/economic covariates listed in Table 2. All YRBSS models include state fixed-effects, year fixed-effects, and each of the individual controls and policy/economic covariates listed in Table 2. Standard errors are corrected for clustering at the state level, 95% confidence intervals are shown in [ ] and p-values are shown in < >.

57
Appendix Table 11: Sensitivity Analysis, Cigarette Outcomes, 2011-2019
Outcome Current Cigarette Use
Current Cigarette Use (half pack a
day)
Current Cigarette or Cigar Use
Current Cigarette Use
Regular Cigarette Use
Daily Cigarette Use
Current Cigarette or Cigar Use
ENDS Tax Rate (2019 $) 0.018* 0.011*** 0.018** -0.005 0.007 0.008 -0.008 (0.007) (0.003) (0.006) (0.011) (0.008) (0.007) (0.011)
[0.004,0.032] [0.005,0.016] [0.005,0.030] [-0.027, 0.017] [-0.009, 0.022] [-0.007, 0.022] [-0.030, 0.013] <0.013> <0.001> <0.007> <0.665> <0.388> <0.293> <0.438>
Cigarette Tax Rate (2019 $) -0.009 -0.007** -0.009+ -0.003 -0.006 -0.004 -0.001 (0.005) (0.002) (0.005) (0.008) (0.006) (0.006) (0.008)
[-0.019,0.002] [-0.011,-0.003] [-0.018,0.000] [-0.018, 0.013] [-0.017, 0.006] [-0.015, 0.007] [-0.016, 0.015] <0.101> <0.002> <0.060> <0.714> <0.335> <0.464> <0.928>
Data MTF MTF MTF YRBSS YRBSS YRBSS YRBSS N 369,764 369,764 371,596 880,750 880,750 880,750 755,063 Dependent Variable Mean 0.0848 0.0162 0.0937 0.110 0.031 0.023 0.143 ENDS Elasticity 0.0874 0.2969 0.0785 -0.010 0.051 0.077 -0.016 Cigarette Elasticity -0.3001 -1.3026 -0.2797 -0.075 -0.521 -0.494 -0.014 + p<0.10, * p<0.05, ** p<0.01, *** p<0.001 Notes: All MTF models include tax jurisdiction fixed-effects, year-by-quarter fixed-effects, and each of the individual controls and policy/economic covariates listed in Table 2. All YRBSS models include state fixed-effects, year fixed-effects, and each of the individual controls and policy/economic covariates listed in Table 2. Regressions are weighted, standard errors are corrected for clustering at the state level, 95% confidence intervals are shown in [ ] and p-values are shown in < >.

58
Appendix Table 12: Sensitivity Analysis, Small Clusters Procedure (Wild Cluster Bootstrap) Panel A: Effects of ENDS Tax on ENDS Use
Outcome Current ENDS User
Regular ENDS User ENDS Initiation Ever Use ENDS Current ENDS
User ENDS Tax Rate (2019 $) -0.019+ -0.013+ -0.008 -0.052* -0.071*
[-0.06,0.024] [-0.041,0.013] [-0.116,0.049] [-0.077,-0.024] [-0.147, -0.014] <0.208> <0.226> <0.687> <0.014> <0.010>
Cigarette Tax Rate (2019 $) -0.005 0.009+ -0.003 0.012 0.041 [-0.025,0.016] [-0.002,0.026] [-0.032,0.053] [-0.005,0.034] [-0.025, 0.116]
<0.585> <0.082> <0.931> <0.128> <0.280> Data MTF MTF MTF MTF YRBSS Years 2014-2019 2014-2019 2015-2019 2015-2019 2015-2019 N 126,306 126,306 66,124 85,541 538,992 Dependent Variable Mean 0.152 0.038 0.104 0.287 0.213 ENDS Elasticity -0.075 -0.212 -0.059 -0.146 -0.164 Cigarette Elasticity -0.095 0.712 -0.097 0.127 0.568
Panel B: Effects of ENDS Tax on ENDS Perceived Risk and Sources
Outcome ENDS Perceived Risk Retail Source Social Source Internet Source Other Source
ENDS Tax Rate (2019 $) 0.029* -0.076+ 0.101+ 0.019 -0.044 [-0.036,0.063] [-0.230, 0.017] [-0.030, 0.335] [-0.063, 0.060] [-0.108, 0.038]
<0.331> <0.076> <0.094> <0.392> <0.144> Cigarette Tax Rate (2019 $) -0.003 0.086* -0.105+ 0.006 0.014
[-0.018,0.021] [0.013, 0.306] [-0.037, 0.028] [-0.054, 0.107] [-0.077, 0.081] <0.679> <0.032> <0.070> <0.820> <0.628>
Data MTF YRBSS YRBSS YRBSS YRBSS Years 2014-2018 2015-2019 2015-2019 2015-2019 2015-2019 N 86,486 55,902 55,902 55,902 55,902 Dependent Variable Mean 0.192 0.185 0.627 0.042 0.145 + p<0.10, * p<0.05, ** p<0.01, *** p<0.001 Notes: All MTF models include tax jurisdiction fixed-effects, year-by-quarter fixed-effects, and each of the individual controls and policy/economic covariates listed in Table 2. All YRBSS models include state fixed-effects, year fixed-effects, and each of the individual controls and policy/economic covariates listed in Table 2. Regressions are weighted, 95% confidence intervals are shown in [ ] and p-values from wild cluster bootstrap are shown in < >.
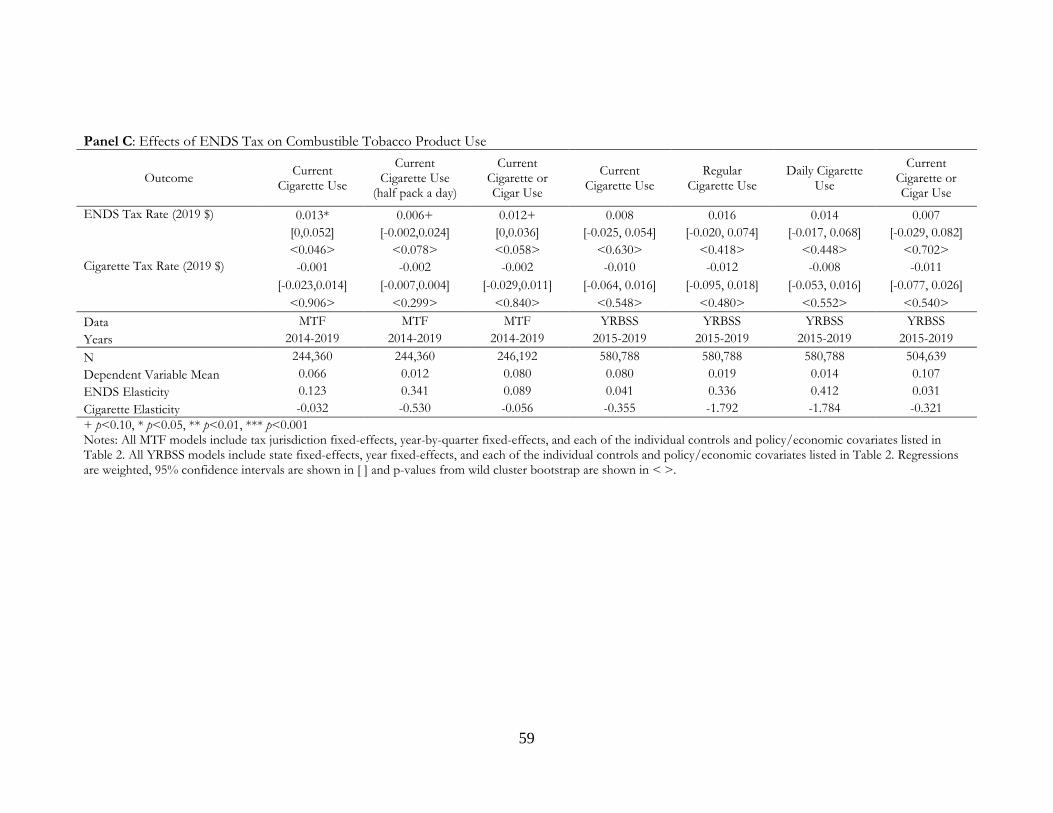
59
Panel C: Effects of ENDS Tax on Combustible Tobacco Product Use
Outcome Current Cigarette Use
Current Cigarette Use
(half pack a day)
Current Cigarette or Cigar Use
Current Cigarette Use
Regular Cigarette Use
Daily Cigarette Use
Current Cigarette or Cigar Use
ENDS Tax Rate (2019 $) 0.013* 0.006+ 0.012+ 0.008 0.016 0.014 0.007 [0,0.052] [-0.002,0.024] [0,0.036] [-0.025, 0.054] [-0.020, 0.074] [-0.017, 0.068] [-0.029, 0.082] <0.046> <0.078> <0.058> <0.630> <0.418> <0.448> <0.702>
Cigarette Tax Rate (2019 $) -0.001 -0.002 -0.002 -0.010 -0.012 -0.008 -0.011 [-0.023,0.014] [-0.007,0.004] [-0.029,0.011] [-0.064, 0.016] [-0.095, 0.018] [-0.053, 0.016] [-0.077, 0.026]
<0.906> <0.299> <0.840> <0.548> <0.480> <0.552> <0.540> Data MTF MTF MTF YRBSS YRBSS YRBSS YRBSS Years 2014-2019 2014-2019 2014-2019 2015-2019 2015-2019 2015-2019 2015-2019 N 244,360 244,360 246,192 580,788 580,788 580,788 504,639 Dependent Variable Mean 0.066 0.012 0.080 0.080 0.019 0.014 0.107 ENDS Elasticity 0.123 0.341 0.089 0.041 0.336 0.412 0.031 Cigarette Elasticity -0.032 -0.530 -0.056 -0.355 -1.792 -1.784 -0.321 + p<0.10, * p<0.05, ** p<0.01, *** p<0.001 Notes: All MTF models include tax jurisdiction fixed-effects, year-by-quarter fixed-effects, and each of the individual controls and policy/economic covariates listed in Table 2. All YRBSS models include state fixed-effects, year fixed-effects, and each of the individual controls and policy/economic covariates listed in Table 2. Regressions are weighted, 95% confidence intervals are shown in [ ] and p-values from wild cluster bootstrap are shown in < >.

60
Online Data Appendix:
MTF In general, MTF uses six different questionnaire forms to survey 12-th graders and four different forms to survey 8-th and 10-th graders. Identical forms are used for both 8-th and 10-th graders. To reduce burden on respondents, not all questions are included in every form. For the outcome variables that we study, only cigarette use (IRN 00780) exists in all forms. Sample sizes for the other outcome variables are thus smaller by construction. The MTF variables are coded as follows.
• ENDS current and frequent use: Questions in MTF on youth use of ENDS have changed wordings over our study period, we thus use the following variables to collectively define youth use of ENDS: IRN33710, IRN33840, IRN34370, IRN35340, and IRN35160. In particular, we define youth as a current ENDS user if they used ENDS at least once in the past month and as a frequent ENDS user if they used ENDS in 20 or more days over the past 30 days. As a sensitivity analysis, starting in 2017 we also include questions IRN34260, IRN34290, IRN34320, IRN35190, and IRN35220 for any vaping, which could include THC and flavoring products.
• ENDS initiation: We define youth ENDS initiation via the survey question (IRN33960), which asks, "When (if ever) did you FIRST do each of the following things? Don’t count anything you took because a doctor told you to. Try an ENDS, e-pen, etc." The answer responses are: "Grade 6 or below, Grade 7, Grade 8, Grade 9 (Freshman), Grade 10 (Sophomore), Grade 11 (Junior), Grade 12 (Senior), and Never." We define the ENDS initiation variable as an indicator, setting it equal to one if the answer matches youth current grade at the time of survey and zero if youth answered never. All other answer responses are coded as missing. IRN33960 entered the survey starting in year 2015.
• ENDS ever use: Like ENDS current and frequent use, we use the following variables to collectively define youth ever use of ENDS: IRN33830, IRN34230, IRN34240, IRN35140, and IRN35320. MTF included these questions starting in year 2015.
• Perceived risk of regular ENDS use being greatly risky: The indicator is set to one if youth believe that an individual is at great risk of harming themselves (physically or in other ways) if they use ENDS regularly and zero otherwise. The indicator is set to missing when youth did not provide a response to the question. MTF included this question (IRN33670) from 2014 to 2018. The question is not available in year 2019.
• Current and regular cigarette use: The relevant question (IRN 00780) asked is: “How frequently have you smoked cigarettes during the past 30 days?” Possible responses include: 1="Not at all," 2="Less than one cigarette per day," 3="One to five cigarettes per day," 4="About one-half pack per day," 5="About one pack per day," 6="About one and one-half packs per day," and 7="Two packs or more per day" We define youth as a current traditional cigarette user if he/she used traditional cigarettes at least once in the past month, and we also use a separate outcome for if he/she used at least one-half pack of traditional cigarettes per day in the past month. IRN 00780 exists in the MTF for all years that we study.
• Current Cigar or cigarette use: First, for the current cigar use variable we use three questions to collectively define this indicator: IRN33720, IRN33730, and IRN33740.

61
Question wordings across the three variables are similar except that IRN33720 focuses on large cigars, IRN33730 focuses on flavored small cigars, and IRN33740 focuses on non-flavored small cigars. The question wording is: “During the LAST 30 DAYS, on how many days (if any) have you . . . . . . smoked large (flavored small, or regular small) cigars?” Possible responses include: 1="None" 2="1-2" 3="3-5" 4="6-9" 5="10-19" 6="20-30." Hence, we first create an indicator for each of the three cigar use types by setting it equal to 1 if youth used at least one day in the past month and 0 otherwise. Current cigar use is then the union of the three separate current cigar use indicators and is missing only if all three cigar variables are missing. Analogously, current cigar or cigarette use is the union of current cigar use and current cigarette use variables. Like the cigarette use variable, all cigar use variables exist in the MTF for all years that we study though only on some forms.
YRBSS
The ordering of the questions preceding and following the current e-cigarette use have been the same between 2017-2019. However, e-cigarettes source questions were only asked starting in 2017. The prompt before the e-cigarette questions has changed marginally each year in a way that we believe signals to the youth that the question is specifically about nicotine vaping products, since the brand names are only for nicotine vapes. 2015: The next two questions ask about electronic vapor products, such as blu, NJOY, or Starbuzz. Electronic vapor products include e-cigarettes, e-cigars, e-pipes, vape pipes, vaping pens, ehookahs, and hookah pens. 2017: The next three questions ask about electronic vapor products, such as blu, NJOY, Vuse, MarkTen, Logic, Vapin Plus, eGo, and Halo. Electronic vapor products include ecigarettes, e-cigars, e-pipes, vape pipes, vaping pens, e-hookahs, and hookah pens. 2019: The next three questions ask about electronic vapor products, such as JUUL, Vuse, MarkTen, and blu. Electronic vapor products include e-cigarettes, vapes, vape pens, e-cigars, ehookahs, hookah pens, and mods. 34. Have you ever used an electronic vapor product? A. Yes B. No 35. During the past 30 days, on how many days did you use an electronic vapor product? A. 0 days B. 1 or 2 days C. 3 to 5 days D. 6 to 9 days E. 10 to 19 days F. 20 to 29 days G. All 30 days 36. During the past 30 days, how did you usually get your electronic vapor products? (Select only one response.)

62
A. I did not use any electronic vapor products during the past 30 days B. I got or bought them from a friend, family member, or someone else C. I bought them myself in a vape shop or tobacco shop D. I bought them myself in a convenience store, supermarket, discount store, or gas station E. I bought them myself at a mall or shopping center kiosk or stand F. I bought them myself on the Internet, such as from a product website, vape store website, or other website like eBay, Amazon, Facebook Marketplace, or Craigslist G. I took them from a store or another person H. I got them in some other way
Policy and economic covariates
The following policy and economic covariates are used, averaged across the first and second quarters of each year to match the data collection time-frames for both MTF and YRBSS surveys. Data is used at the county-level for MTF analyses, unless otherwise stated to be only available at the state level. Local data is population-weighted to the state level for all YRBSS analyses, given the lack of county geocodes in this data.
• Tobacco laws: 1. Standardized ENDS taxes per fluid mL, described in detail in Cotti et al. (2021).24 2. Cigarette taxes are the federal cigarette excise tax ($1.01 over the study period) +
state cigarette excise tax (from the CDC State System25) + local cigarette excise tax (from the American Non-Smokers Rights Foundation26).
3. State-level little cigar taxes from the CDC State System.2 Only little cigar tax rates are used, since these are the products believed to be most commonly used by youth. If a state does not have a specific little cigar tax rate, then the regular cigar tax rate is used instead. States either use an ad valorem tax or an excise tax, and both variables are controlled separately. Additionally, some states cap the maximum dollar amount of the cigar tax, which is controlled for as well.
4. ENDS minimum legal sales age laws, as obtained from Pesko and Currie (2019).27 5. Percent of residents living in areas with a state or local tobacco 21 law, derived from
state laws and local law information.28 6. Indoor air laws: We follow prior work in generating a smoke-free air law index3
based on American Non-Smokers Rights Foundation data on states and localities banning smoking in restaurants, bars, and private workplaces.5 Specifically, we use the percent of the population covered under these laws in each state, weighing laws applied to bars, restaurants, and private workplaces equally, and treating partial bans
24 Cotti CD, Nesson ET, Pesko MP, Phillips S, Tefft N. Standardizing the Measurement of E-cigarette Taxes in the United States, 2010-2020. 2021. 25 CDC State System. Available at: https://www.cdc.gov/statesystem/index.html (last accessed April 13th, 2021). 26 American Non-Smokers Rights Foundation. ANRF Deliverables for GSU 2019-12-31 (Pesko).zip. Maggie Hopkins <[email protected]> (last accessed January 31st, 2020). 27 Pesko, Michael F., and Janet M. Currie. "E-cigarette minimum legal sale age laws and traditional cigarette use among rural pregnant teenagers." Journal of health economics 66 (2019): 71-90. 28 Preventing Tobacco Addiction Foundation. US Communities with Tobacco21 Ordinances as of September 4, 2020. Tom Geist <[email protected]> (last accessed September 4th, 2020).

63
(e.g., separate smoking areas) with half the weight of a full ban. We use the same method to create a parallel vape-free air law index.
• Laws affecting availability of tobacco substitutes/complements: 1. The state’s beer tax,29 2. Indicator for presence of a state vertical ID law for youth,30 3. Indicators for state medical and recreational marijuana laws,31 and
• Economic climate:32 1. The unemployment rate, 2. The percent of residents living below the poverty line.
• For a sensitivity analysis, National Center for Health Statistics (NCHS) urban-rural classification schemes are controlled as a sensitivity analysis.33
29 Urban Institute & Brookings Institution. State Alcohol Excise Taxes. Available at: https://www.taxpolicycenter.org/statistics/state-alcohol-excise-taxes (last accessed April 13th, 2021). 30 Nesson, Erik, and Vinish Shrestha. "The effects of false identification laws on underage alcohol‐related traffic fatalities." Health Economics (2021). We supplemented data from this paper with newer dates: Minnesota (8/2018), Missouri (12/2012), New York (1/2013), Oregon (12/2018), and Tennessee (7/2018). 31 Marijuana Policy Project. State Laws With Alternatives to Incarceration for Marijuana Possession. Available at: https://www.mpp.org/assets/pdf/issues/decriminalization/State-Decrim-Chart.pdf (last accessed April 13th, 2021). 32 University of Kentucky Center for Poverty Research. (2021, Feb.). UKCPR National Welfare Data, 1980-2019. Lexington, KY. Available at http://ukcpr.org/resources/national-welfare-data (last accessed April 13th, 2021). 33 2013 NCHS Urban-Rural Classification Scheme for Counties. Available at: https://www.cdc.gov/nchs/data_access/urban_rural.htm. (last accessed June 7th, 2021).
Copyright © 2022 FDOKUMEN