Network Working Group O. Friel Internet-Draft Cisco Intended ...
Upload
khangminh22Category
view
5download
0
DEVELOPMENT OF A PAEDIATRIC-FRIENDLY FORMULATION INTENDED FOR
THE TREATMENT OF MULTI-DRUG RESISTANT TUBERCULOSIS
JETHRO NKOMO
2018

DEVELOPMENT OF A PAEDIATRIC-FRIENDLY FORMULATION INTENDED FOR
THE TREATMENT OF MULTI-DRUG RESISTANT TUBERCULOSIS
By
JETHRO NKOMO
Submitted in fulfilment of the requirements for the degree of
MASTER OF SCIENCE (GENERAL HEALTH SCIENCES)
In the
FACULTY OF HEALTH SCIENCES
At the
NELSON MANDELA UNIVERSITY
April 2018
Supervisor: Prof Gareth Kilian
Co-supervisor: Mr Yakub Kadernani

i
DECLARATION
I, Jethro Nkomo, declare that the work contained in this dissertation is original (except
where references have been made) and that neither parts of or the full dissertation
has been submitted for another degree in this institute or any other institutes.
………………………………..
Jethro Nkomo
Signed on the 12th day of April 2017 at the Nelson Mandela University

ii
DEDICATION
This dissertation is dedicated to my mentor, father and teacher – a selfless and
visionary man - Mr. C Moyo (Cornelius).
iii
ACKNOWLEDGEMENTS
I am grateful to the following;
My industrious supervisors, Prof Gareth Kilian and Mr Yakub Esmail Kadernani for
their unwavering support and guidance through my exciting journey in postgraduate
studies. Many thanks!
My ever-keen cheerleader, Khanyi, who constantly encouraged me to push on, even
towards a PhD, keep your fingers crossed.
Mr C. Moyo, who saw a potential in me from the day we first met and has always had
my back in my pursuit of greatness, a special bowel of gratitude goes out to you sir.
Dr W. Ndebele, who has played the mentorship role well in my walk, your wise counsel
has kept me going. I will always come back for more.
The sponsors that helped initiate this research project, Aspen Pharmacare and the
Nelson Mandela University Post Graduate Scholarship.
The Nelson Mandela University Department of Pharmacy, special mention to Mrs Jean
van Jaarsveld who was always eager to help by providing the research excipients and
equipment at the lab as well as words of encouragement. The warm and welcoming
atmosphere kept me fueled to work harder. The student tutoring and assistance
sessions you facilitated added richly to my academia experience.
My fellow postgraduate eagles, it was such a pleasure sharing both research
challenges and the laboratory with you, as well as J-Rush, my enthusiastic editor, you
are a star!
My family and friends who provided morally and emotional support – especially my
grandpa who ever wonders when I will eventually finish school, it is still not over sir. A
big thank you to my Every Nation Port Elizabeth family for the prayers.
Above all, God, I will forever be grateful to you, I do not have suitable words to express
my gratitude to you
iv
SUMMARY
Children suffering from multidrug-resistant tuberculosis (MDR-TB) are treated with at
least four drugs a day for at least twenty-four months. Approximately 25 000 - 32 000
children worldwide become infected with MDR-TB each year, yet there is a lack of
adequate paediatric MDR-TB options for child-friendly dosage forms for the treatment
of the condition. The available options are limited to manipulating different dosage
forms intended for adults by means of breaking the tablets or otherwise, to deliver the
drugs to children. This challenge that is faced by both health care professionals and
caregivers subsequently poses drug quality, efficacy, and safety concerns to children
being treated for MDR-TB.
The objective of this study was to formulate a paediatric-friendly dosage form for the
treatment of MDR-TB in children below the age of eight years. A fixed-dose
combination (FDC) in form of a dispersible-tablet that contains two core drugs used in
treatment of MDR-TB; levofloxacin and pyrazinamide, was developed.
Quality by design principles was employed in developing the product. The systematic
procedure ensures that quality is built into the product throughout the manufacturing
process. It allows for identification of the critical quality attributes and modification of
critical process parameters to lie within desired ranges. Preformulation studies were
conducted on the active ingredients to investigate potential interactions and
compatibility. Some of the analytical techniques employed in the process included an
HPLC assay method that was developed to simultaneously separate levofloxacin and
pyrazinamide, differential scanning calorimetry (DSC), infrared spectroscopy (IR),
thermogravimetric analysis (TGA), and powder density studies.
A direct compression tableting process was selected as the method of choice for
product formulation. Active ingredients were blended with the excipients and
compressed using tableting equipment to successfully produce FDC fast-
disintegrating tablets containing 150 mg of levofloxacin and 300 mg pyrazinamide. The
product quality was analysed and optimised using mathematical and statistical
techniques such as response surface methodology (RSM) and ANOVA, to meet the
required standards recommended by the United States Pharmacopoeia. The FDC
v
dispersible tablet containing levofloxacin and pyrazinamide in the potential treatment
of MDR-TB in children was successfully formulated, manufactured and evaluated. The
tablet dosage form passed all the relevant quality criteria that governed the scope of
this study and disintegrate in approximately 37 seconds when placed in water.
It is generally a sizeable challenge to manufacture fixed-dose combination drug
products due to physicochemical differences of various drugs, however, with adequate
resources researchers may still find a way to formulate more child-friendly dosage
forms for MDR-TB. This may lead to improved drug efficacy, reduced safety risks and
decreased burden on caregivers and healthcare workers who must administer the
treatment.
Key Words: fixed-dose combination (FDC), levofloxacin, pyrazinamide, dispersible
tablet, high performance liquid chromatography (HPLC), quality by design (QbD),
response surface methodology (RSM)
vi
TABLE OF CONTENTS
DECLARATION .......................................................................................................... i
DEDICATION ............................................................................................................. ii
ACKNOWLEDGEMENTS ......................................................................................... iii
SUMMARY ................................................................................................................ iv
LIST OF FIGURES.................................................................................................. xiii
LIST OF TABLES .................................................................................................... xv
LIST OF CRONYMS .............................................................................................. xvii
CHAPTER ONE ......................................................................................................... 1
INTRODUCTION ........................................................................................................ 1
1.1 BACKGROUND ................................................................................................... 1
1.2 APPLICATION OF QUALITY BY DESIGN .......................................................... 5
1.3 PROBLEM STATEMENT .................................................................................... 7
1.4 AIM AND OBJECTIVES ...................................................................................... 7
1.4.1 Aim ............................................................................................................. 7
1.4.2 Objectives .................................................................................................. 7
CHAPTER TWO......................................................................................................... 8
PROPERTIES OF LEVOFLOXACIN AND PYRAZINAMIDE .................................... 8
2.1 INTRODUCTION .................................................................................................. 8
2.2.1 Levofloxacin ............................................................................................... 9
2.2.1.1 Description ........................................................................................... 9
2.2.1.2 Solubility ............................................................................................ 10
2.2.1.3 Melting Point and Stability ................................................................. 10
2.2.1.3 Crystal Morphology ............................................................................ 10
2.2.2 Pyrazinamide ........................................................................................... 11
2.2.2.1 Description ......................................................................................... 11
2.2.2.2 Solubility ............................................................................................ 11
2.2.2.3 Melting Point and Stability ................................................................. 12
2.2.2.4 Crystal Morphology ............................................................................ 12
vii
2.3 CLINICAL PHARMACOLOGY OF LEVOFLOXACIN AND PYRAZINAMIDE .. 13
2.3.1 Levofloxacin ............................................................................................. 13
2.3.1.1 Mode of action ................................................................................... 13
2.3.1.2 Spectrum of activity and resistance ................................................... 13
2.3.1.3 Clinical use ........................................................................................ 14
2.3.1.4 Side effects and interactions .............................................................. 14
2.3.1.5 Substantial risk groups ...................................................................... 15
2.3.2 Pyrazinamide ........................................................................................... 16
2.3.2.1 Mode of action ................................................................................... 16
2.3.2.2 Spectrum of activity and Resistance .................................................. 17
2.3.2.3 Clinical uses ...................................................................................... 17
2.3.2.4 Side effects and interactions .............................................................. 18
2.3.2.5 Substantial risk groups ...................................................................... 18
2.4 PHARMACOKINETICS OF LEVOFLOXACIN AND PYRAZINAMIDE .............. 19
2.4.1 Levofloxacin ............................................................................................. 19
2.4.1.1 Dosage .............................................................................................. 19
2.4.1.2 Absorption and Distribution ................................................................ 19
2.4.1.3 Metabolism and Elimination ............................................................... 20
2.4.2 Pyrazinamide ........................................................................................... 20
2.4.2.1 Dosage .............................................................................................. 20
2.4.2.2 Absorption and Distribution ................................................................ 20
2.4.2.3 Metabolism and Elimination ............................................................... 21
2.5 CONCLUSION ................................................................................................... 22
CHAPTER THREE ................................................................................................... 23
DEVELOPMENT AND VALIDATION OF HPLC METHOD FOR THE
DETERMINATION OF LEVOFLOXACIN AND PYRAZINAMIDE............................ 23
3.1 INTRODUCTION ................................................................................................ 23
3.1.1 Overview .................................................................................................. 23
3.1.2 Classification of HPLC .............................................................................. 24

viii
3.1.2.1 Normal-Phase HPLC (NP-HPLC) ...................................................... 24
3.1.2.2 Reversed-phase HPLC (RP-HPLC) ................................................... 24
3.1.2.3 Ion-exchange HPLC (IE-HPLC) ......................................................... 25
3.1.2.4 Size-exclusion HPLC (SE-HPLC) ...................................................... 26
3.2 Analytical methods for the analysis of levofloxacin and pyrazinamide ........ 26
3.3 EXPERIMENTAL ............................................................................................... 29
3.3.1 Materials and reagents ............................................................................. 29
3.3.2 HPLC System ........................................................................................... 29
3.3.2.1 Column selection ................................................................................... 29
3.3.2.2 Preparation of stock solutions ............................................................ 31
3.3.2.3 Preparation of buffers ........................................................................ 31
3.3.2.4 Preparation of mobile phase .............................................................. 31
3.4 RESULTS AND DISCUSSION........................................................................... 32
3.4.1 Effect of organic solvent composition ....................................................... 32
3.4.2 Effect of buffer concentration ................................................................... 33
3.4.3 Effect of buffer pH .................................................................................... 34
3.4.4 Effect of flow rate ..................................................................................... 35
3.4.5 Chromatographic conditions ..................................................................... 35
3.5 METHOD VALIDATION ..................................................................................... 37
3.5.1 Introduction .............................................................................................. 37
3.5.2 Linearity and range................................................................................... 37
3.5.3 Precision .................................................................................................. 40
3.5.3.1 Repeatability ...................................................................................... 40
3.5.3.2 Intermediate precision ....................................................................... 41
3.5.3.3 Reproducibility ................................................................................... 41
3.5.4 Accuracy .................................................................................................. 42
3.5.5 Limit of quantitation (LOQ) and limit of detection (LOD) ........................... 43
3.5.6 Specificity and selectivity .......................................................................... 45
3.5.7 Forced Degradation Studies ..................................................................... 45

ix
3.5.7.1 Sample Preparation ........................................................................... 46
3.5.7.2 Oxidative degradation ........................................................................ 46
3.5.7.3 Hydrolytic degradation ....................................................................... 46
3.5.7.4 Photolytic degradation ....................................................................... 47
3.5.7.5 Results and Discussion ..................................................................... 47
3.6 CONCLUSIONS ................................................................................................. 51
CHAPTER FOUR ..................................................................................................... 52
PREFORMULATION AND POWDER ASSESSMENT ............................................ 52
4.1 INTRODUCTION ................................................................................................ 52
4.1.1 Physiochemical properties ....................................................................... 53
4.1.1.1 Particle size and shape...................................................................... 53
4.1.1.2 Powder density .................................................................................. 56
4.1.2 Drug-excipient compatibility ..................................................................... 59
4.1.2.1. Beneficial and detrimental drug-excipient interactions ...................... 60
4.2 METHODS ......................................................................................................... 62
4.2.1 Powder density ......................................................................................... 62
4.2.2 Infrared (IR) spectroscopy ........................................................................ 62
4.2.3 Thermogravimetric analysis (TGA) and differential scanning calorimetry
(DSC) ................................................................................................................ 63
4.3 RESULTS AND DISCUSSION........................................................................... 63
4.3.1 Powder density ......................................................................................... 63
4.3.1.1 True density ....................................................................................... 63
4.3.1.2 Bulk and tapped density .................................................................... 64
4.3.2 IR spectroscopy ....................................................................................... 64
4.3.3 Thermogravimetric analysis ..................................................................... 66
4.3.4 Differential scanning calorimetry .............................................................. 68
4.4 CONCLUSIONS ................................................................................................. 71
CHAPTER FIVE ....................................................................................................... 73
x
FORMULATION DEVELOPMENT AND MANUFACTURE OF FIXED-DOSE
COMBINATION DISPERSIBLE TABLETS ............................................................. 73
5.1 INTRODUCTION ................................................................................................ 73
5.1.1 Dispersible tablets overview ..................................................................... 74
5.1.1.1 Advantages of dispersible tablets ...................................................... 75
5.1.1.2 Limitations of dispersible tablets ........................................................ 75
5.1.2 Manufacturing methods ............................................................................ 75
5.1.3 Manufacturing method of choice .............................................................. 76
5.1.3 Excipients ................................................................................................. 76
5.1.3.1 Superdisintegrants ............................................................................. 79
5.1.3.2 Binders .............................................................................................. 79
5.1.3.3 Diluents .............................................................................................. 80
5.1.3.4 Anti-frictional agents .......................................................................... 80
5.2 METHODS ......................................................................................................... 81
5.2.1 Materials ................................................................................................... 81
5.2.1.1 Microcrystalline cellulose (MCC) ....................................................... 81
5.2.1.2 Crospovidone (CRP).......................................................................... 82
5.2.1.3 Croscarmellose sodium (CCS) .......................................................... 82
5.2.1.4 Sodium starch glycolate (SSG) .......................................................... 82
5.2.1.5 Colloidal silicon dioxide (CSD) ........................................................... 83
5.2.1.6 Magnesium stearate .......................................................................... 83
5.2.2 Manufacturing equipment ......................................................................... 83
5.2.3 Method of manufacture ............................................................................ 84
5.2.3.1 Direct compression procedure ........................................................... 84
5.2.3.2 Physical characterization of powder blends ....................................... 86
5.2.4 Physical characterization of dispersible tablets ........................................ 86
5.2.4.1 Physical Appearance ......................................................................... 86
5.2.4.2 Weight Variation ................................................................................ 86
5.2.4.3 Breaking Force .................................................................................. 86
xi
5.2.4.4 Friability ............................................................................................. 87
5.2.4.5 Disintegration test .............................................................................. 87
5.2.4.6 Tablet assay ...................................................................................... 88
5.3. APPLICATION OF QUALITY BY DESIGN ....................................................... 88
5.3.1 Defining the quality target product profile (QTPP) for the formulation ...... 88
5.3.2 Identification of the critical quality attributes (cQAs) ................................. 89
5.3.3 Quality Risk Assessment .......................................................................... 92
5.3.4 Failure Mode and Effects Analysis ........................................................... 93
5.4 RESULTS AND DISCUSSION........................................................................... 95
5.4.1 Micromeritic analysis of powder ............................................................... 95
5.4.2 Physico-mechanical properties of the tablets ........................................... 95
5.4.3 Quality by design ...................................................................................... 96
5.5 CONCLUSIONS ................................................................................................. 97
CHAPTER SIX ......................................................................................................... 98
OPTIMISATION OF A DISPERSIBLE TABLET FORMULATION........................... 98
6.1 INTRODUCTION ................................................................................................ 98
6.1.1 Optimisation ............................................................................................. 98
6.1.2 Response surface methodology ............................................................... 98
6.2 EXPERIMENTAL ............................................................................................... 99
6.2.1 Proposed evaluation design ..................................................................... 99
6.2.2 Materials and equipment ........................................................................ 100
6.2.3 Design of Experiments ........................................................................... 100
6.2.3.1 Central composite design (CCD) ..................................................... 100
6.2.3.2 Central composite design model ..................................................... 102
6.2.3.3 Evaluation of model ......................................................................... 104
6.2.3.4 Effect on disintegration time response (cQA) .................................. 106
6.2.4 Process optimisation .............................................................................. 112
6.2.4.1 Statistical Optimisation .................................................................... 112
6.2.3.2 Analysis of confirmatory batch ......................................................... 115
xii
6.3 CONTROL STRATEGY AND QUALITY RISK MITIGATION .......................... 116
6.4 CONCLUSION ................................................................................................. 120
CHAPTER SEVEN ................................................................................................. 122
CONCLUSIONS AND RECOMMENDATIONS ...................................................... 122
REFERENCES ....................................................................................................... 126

xiii
LIST OF FIGURES
Figure 1.1: Quality management in formulation development using Quality by Design
(QbD) (Adapted: Zhang and Mao, 2017). ................................................................... 6
Figure 2.1: Chemical structure of Levofloxacin hemihydrate ...................................... 9
Figure 2.2: Pyrazine-2-carboxylic acid ..................................................................... 11
Figure 2.3: The proposed mode of action of pyrazinamide (Adapted: Zhang, et al.,
2003) ........................................................................................................................ 17
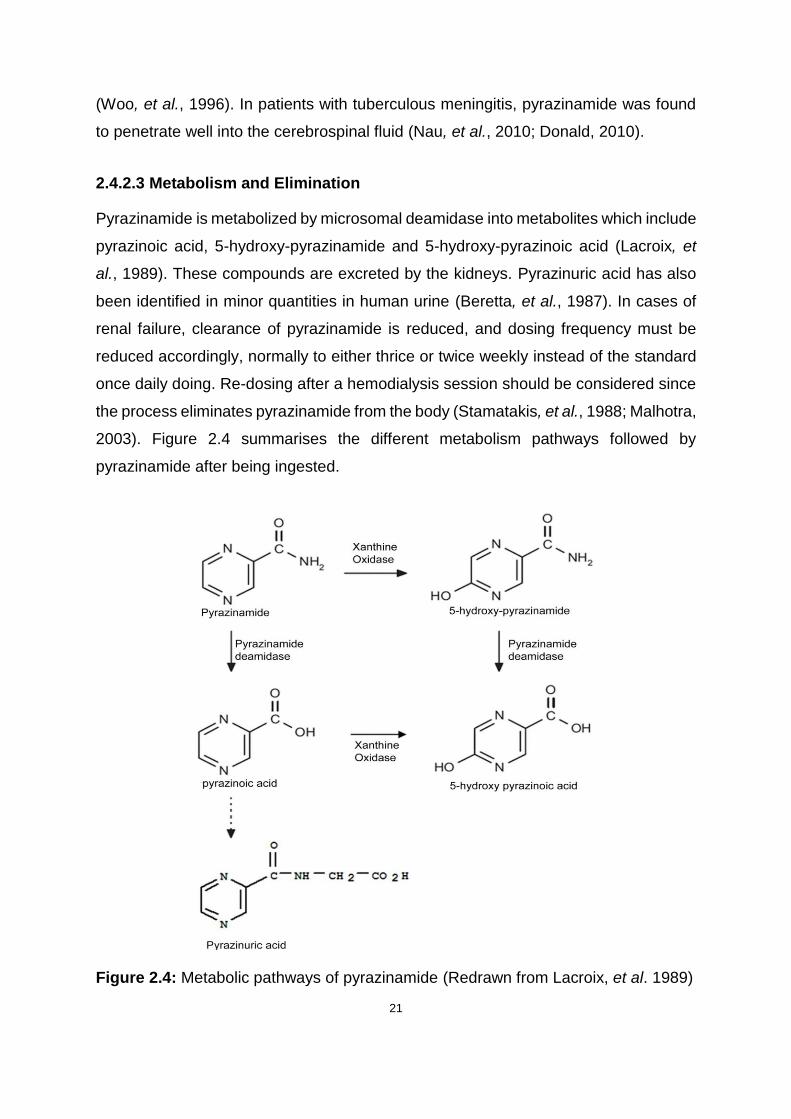
Figure 2.4: Metabolic pathways of pyrazinamide (Redrawn from Lacroix, et al. 1989)
................................................................................................................................. 21
Figure 3.1: The effect of ACN content on Rt of levofloxacin and pyrazinamide ........ 32
Figure 3.2: Chromatogram of pyrazinamide and levofloxacin obtained under the
conditions described in Table 3.7 ............................................................................. 36
Figure 3.3: Linearity and range curve for Levofloxacin plotted using the data
displayed in Table 3.8 .............................................................................................. 39
Figure 3.4: Linearity and range curve for pyrazinamide plotted using the data
displayed in Table 3.8 .............................................................................................. 39
Figure 3.5: Chromatograms of levofloxacin in 3% v/v hydrogen peroxide solution .. 47
Figure 3.6: Chromatograms of pyrazinamide in 3% v/v hydrogen peroxide solution 48
Figure 3.7: Chromatograms of levofloxacin in 0.1 M hydrochloric acid .................... 49
Figure 3.8: Chromatograms of pyrazinamide in 0.1 M hydrochloric acid .................. 49
Figure 3.9: Chromatograms of levofloxacin in 0.1 M sodium hydroxide solution ...... 49
Figure 3.10: Chromatograms of pyrazinamide in 0.1 M sodium hydroxide solution . 50
Figure 3.11: Chromatograms of levofloxacin in water after exposure to sunlight ..... 50
Figure 3.12: Chromatograms of pyrazinamide in after exposure to sunlight ............ 51
Figure 4.1: The experimental infrared spectrum of levofloxacin (I), pyrazinamide (II)
and their binary mixture (III) generated at 4 scans and 4 cm-1 resolution ................. 65
Figure 4.2: Typical TGA plot of levofloxacin at 10°C/min heating rate ..................... 67
Figure 4.3: Typical TGA plot of pyrazinamide at 10°C/min heating rate ................... 68
Figure 4.4: Typical DSC thermogram for levofloxacin hemihydrate at a heating rate
of 10°C/min .............................................................................................................. 69
xiv
Figure 4.5: Typical DSC thermogram for pyrazinamide at a heating rate of 10°C/min
................................................................................................................................. 70
Figure 4.6: Typical DSC thermogram for binary mixture of levofloxacin and
pyrazinamide at a heating rate of 10 °C/min ............................................................ 71
Figure 5.1: Dispersible tablet manufacturing method ............................................... 85
Figure 6.1: Basic central composite design with three variables (Adapted: Lundstedt,
et al., 1998) ............................................................................................................ 101
Figure 6.2: FDS plot for the RSM quadratic model showing the standard error within
most of the design space ....................................................................................... 105
Figure 6.3: 3D contour plot indicating predicted standard error of the design space
for RSM for the optimisation of dispersible tablets formulation ............................... 106
Figure 6.4: Normal probability plot of the residuals for disintegration time ............. 108
Figure 6.5: Predicted versus actual value plot for disintegration time .................... 109
Figure 6.6: Externally studentised residual plot for disintegration time response ... 110
Figure 6.7: Interaction graph of effect of independent variables on response ........ 111
Figure 6.8: A 3D display of the response surface of disintegration as a function of
disintegrant quantity and blending time .................................................................. 112
Figure 6.9: Contour plot depicting process optimisation for desirability and response
as functions of variables ......................................................................................... 113
Figure 6.10: 3D surface for process optimisation for desirability and response ..... 114
Figure 6.11: Comparison of RPN of failure modes pre- and post-implementation of
control strategy ....................................................................................................... 119

xv
LIST OF TABLES
Table 1.1: Recommended drugs used in the treatment of MDR-TB ........................... 4
Table 2.1: Solubility of levofloxacin in different solvents (Adapted: Indian
Pharmacopoeia Commission, 2007) ........................................................................ 10
Table 2.2: Solubility of pyrazinamide in different solvents ........................................ 12
Table 3.1 HPLC system and conditions for the analysis of levofloxacin and
pyrazinamide ............................................................................................................ 27
Table 3.2: The effect of ACN content on Rs and Peak tailing factor of levofloxacin .. 33
Table 3.3: The effect of buffer concentration on and retention time ......................... 34
Table 3.4: The effect of buffer concentration on peak tailing .................................... 34
Table 3.5: The effect of buffer pH on retention time ................................................. 34
Table 3.6: The effect of Flow rate on retention time ................................................. 35
Table 3.7: Chromatographic conditions .................................................................... 36
Table 3.8: The resultant mean-peak area as a function of concentration for
levofloxacin and pyrazinamide ................................................................................. 38
Table 3.9: Data representing repeatability and intermediate precision for the
simultaneous analysis of levofloxacin and pyrazinamide ......................................... 41
Table 3.10: Accuracy and bias results for the simultaneous analysis of levofloxacin
and pyrazinamide ..................................................................................................... 43
Table 4.1: Impact of manufacturing process on molecular and physiochemical
properties of the drug substance (Cavatur, et al., 2008). ......................................... 54
Table 4.2: Powder flowability in relationship to Carr’s index and Hausner ratio ....... 59
Table 4.3: Examples of excipients used in tablets manufacture and their functions
(modified from Haywood and Glass (2011). ............................................................. 61
Table 4.4: True density values for levofloxacin and pyrazinamide ........................... 63
Table 4.5: True density values for levofloxacin and pyrazinamide ........................... 64
Table 4.6: Typical IR absorption band assignments ................................................. 66
Table 5.1: Methods most commonly used in dispersible tablet manufacturing ......... 77
Table 5.2: Preliminary formulation design with varied disintegrants but constant total
mass per tablet of 900 mg ........................................................................................ 84
xvi
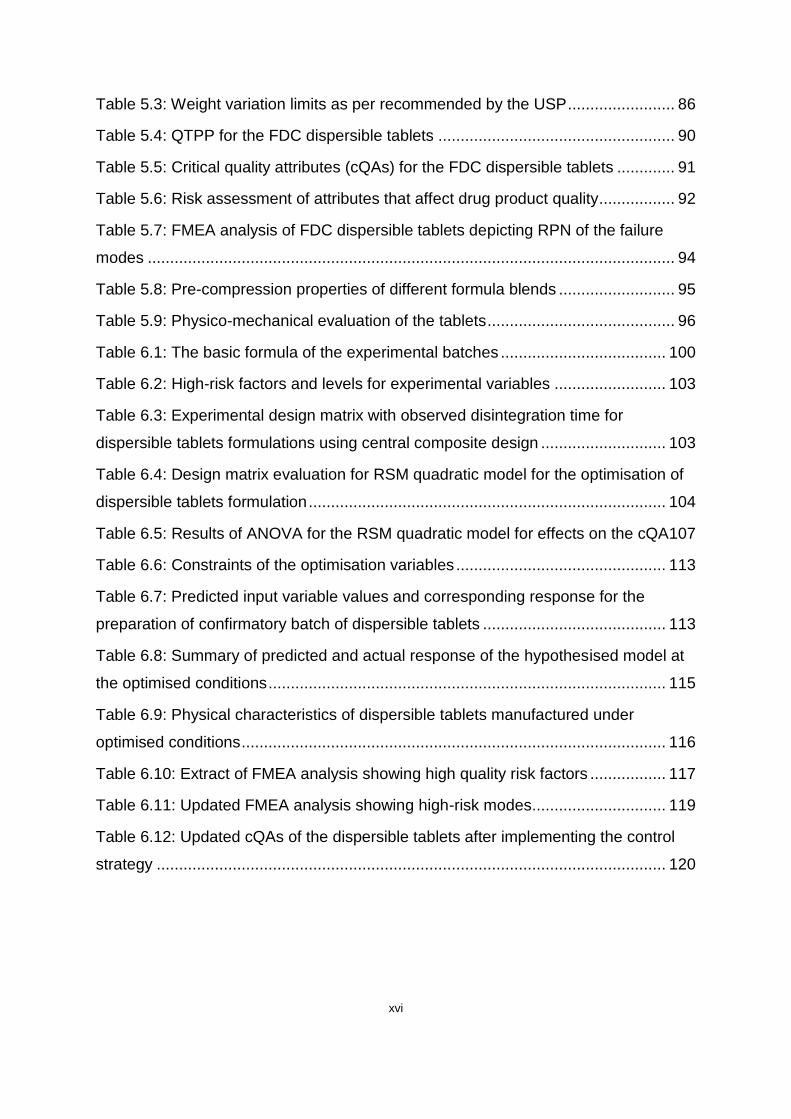
Table 5.3: Weight variation limits as per recommended by the USP ........................ 86
Table 5.4: QTPP for the FDC dispersible tablets ..................................................... 90
Table 5.5: Critical quality attributes (cQAs) for the FDC dispersible tablets ............. 91
Table 5.6: Risk assessment of attributes that affect drug product quality................. 92
Table 5.7: FMEA analysis of FDC dispersible tablets depicting RPN of the failure
modes ...................................................................................................................... 94
Table 5.8: Pre-compression properties of different formula blends .......................... 95
Table 5.9: Physico-mechanical evaluation of the tablets .......................................... 96
Table 6.1: The basic formula of the experimental batches ..................................... 100
Table 6.2: High-risk factors and levels for experimental variables ......................... 103
Table 6.3: Experimental design matrix with observed disintegration time for
dispersible tablets formulations using central composite design ............................ 103
Table 6.4: Design matrix evaluation for RSM quadratic model for the optimisation of
dispersible tablets formulation ................................................................................ 104
Table 6.5: Results of ANOVA for the RSM quadratic model for effects on the cQA107
Table 6.6: Constraints of the optimisation variables ............................................... 113
Table 6.7: Predicted input variable values and corresponding response for the
preparation of confirmatory batch of dispersible tablets ......................................... 113
Table 6.8: Summary of predicted and actual response of the hypothesised model at
the optimised conditions ......................................................................................... 115
Table 6.9: Physical characteristics of dispersible tablets manufactured under
optimised conditions ............................................................................................... 116
Table 6.10: Extract of FMEA analysis showing high quality risk factors ................. 117
Table 6.11: Updated FMEA analysis showing high-risk modes .............................. 119
Table 6.12: Updated cQAs of the dispersible tablets after implementing the control
strategy .................................................................................................................. 120

xvii
LIST OF CRONYMS
ACN Acetonitrile
ANOVA Analysis of Variance
AOR Angle of Repose
API Active Pharmaceutical Ingredient
BCS Biopharmaceutics Classification System
BP British Pharmacopoeia
CCD Central Composite Design
CCS Croscarmellose Sodium
cGMP Current Good Manufacturing Practice Guide
cMAs Critical Material Attributes
cPPs Critical Process Parameters
cQAs Critical Quality Attributes
CRP Crospovidone
CSD Colloidal Silicon Dioxide
DoE Design of Experiments
DSC Differential Scanning Calorimetry
FDA Food and Drug Administration
FDC Fixed-dose combination
HPLC High Performance Liquid Chromatography
ID Internal Diameter
IE Ion Exchange
ICH International Conference on Harmonization
IR Infrared
LOD Limit of Detection
LOQ Limit of Quantitation
MCC Microcrystalline Cellulose
MDR-TB Multidrug-resistant tuberculosis
MeOH Methanol
NaOH Sodium Hydroxide
NMR Nuclear Magnetic Resonance
NP Normal Phase

xviii
QbD Quality by design
QbT Quality by testing
QTPP quality target product profile
RH Relative Humidity
RP Reverse Phase
RPN Risk Priority Number
RSD Relative Standard Deviation
RSM Response Surface Methodology
SEM Scanning Electron Microscope
SSG Sodium Starch Glycolate
TB Tuberculosis
TGA Thermogravimetric Analysis
USP United States Pharmacopoeia
UV Ultraviolet
WHO World Health Organisation
1
CHAPTER ONE
INTRODUCTION
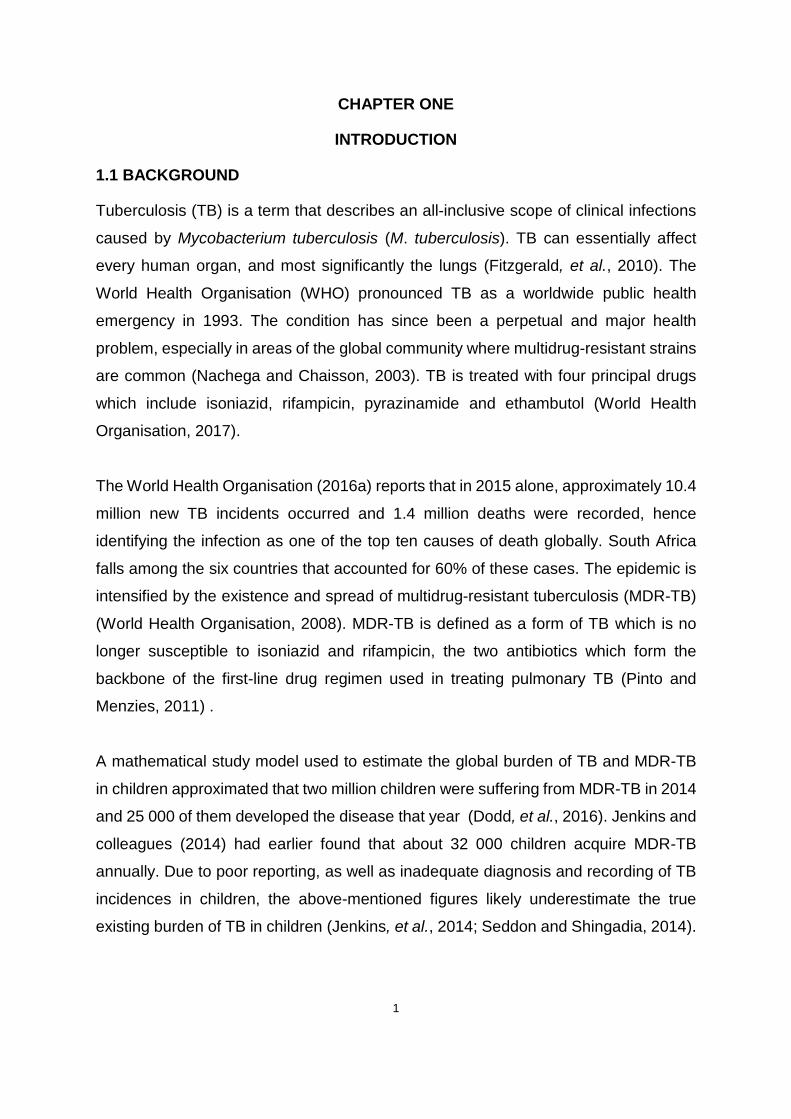
1.1 BACKGROUND
Tuberculosis (TB) is a term that describes an all-inclusive scope of clinical infections
caused by Mycobacterium tuberculosis (M. tuberculosis). TB can essentially affect
every human organ, and most significantly the lungs (Fitzgerald, et al., 2010). The
World Health Organisation (WHO) pronounced TB as a worldwide public health
emergency in 1993. The condition has since been a perpetual and major health
problem, especially in areas of the global community where multidrug-resistant strains
are common (Nachega and Chaisson, 2003). TB is treated with four principal drugs
which include isoniazid, rifampicin, pyrazinamide and ethambutol (World Health
Organisation, 2017).
The World Health Organisation (2016a) reports that in 2015 alone, approximately 10.4
million new TB incidents occurred and 1.4 million deaths were recorded, hence
identifying the infection as one of the top ten causes of death globally. South Africa
falls among the six countries that accounted for 60% of these cases. The epidemic is
intensified by the existence and spread of multidrug-resistant tuberculosis (MDR-TB)
(World Health Organisation, 2008). MDR-TB is defined as a form of TB which is no
longer susceptible to isoniazid and rifampicin, the two antibiotics which form the
backbone of the first-line drug regimen used in treating pulmonary TB (Pinto and
Menzies, 2011) .
A mathematical study model used to estimate the global burden of TB and MDR-TB
in children approximated that two million children were suffering from MDR-TB in 2014
and 25 000 of them developed the disease that year (Dodd, et al., 2016). Jenkins and
colleagues (2014) had earlier found that about 32 000 children acquire MDR-TB
annually. Due to poor reporting, as well as inadequate diagnosis and recording of TB
incidences in children, the above-mentioned figures likely underestimate the true
existing burden of TB in children (Jenkins, et al., 2014; Seddon and Shingadia, 2014).

2
At the beginning of 2016, the WHO introduced a new fixed-dose combination (FDC)
for the first-line treatment of TB in children (Graham, et al., 2015). Children suffering
from MDR-TB, however, still use child-inappropriate formulations whereby tablets
need to be broken and crushed and dispersed in a solvent to achieve an appropriate
dose. This does not always accomplish the intended outcomes as there are clinical
implications around the practice. It may, instead, result in incorrect doses being
administered and subsequently place lives in jeopardy (Ivanovska, et al., 2014; Liu, et
al., 2014).
Use of non-fixed dosage forms increases the TB burden on the healthcare systems by
augmenting challenges in procurement of TB medicines. In addition, use of treatment
involving separate individual drugs poses a struggle to the children under treatment,
as well as their caregivers (Blomberg, et al., 2001). The awareness of these challenges
brings a suggestion of the need for paediatric-friendly formulations for MDR-TB.
The standardised regimen for the treatment of MDR-TB in South Africa is outlined in
the standard treatment guidelines and essential medicines list for South Africa. For
children below the age of eight years, the regimen is divided into two phases, namely,
the intensive and continuation phases. In the intensive phase that stretches over 6
months, children receive the following drugs and doses; oral levofloxacin 15–20
mg/kg/dose once daily, intravenous amikacin 15–22.5 mg/kg daily, oral terizidone 15–
20 mg/kg daily, oral ethionamide 15–20 mg/kg daily and oral pyrazinamide 30–40
mg/kg daily. The continuation phase is the same as the intensive phase but without
amikacin and extends over 18 months (South African National Department of Health,
2014). Delamanid is a newer drug that is on trial as a possible treatment for MDR-TB
in children with and without HIV. High-dose isoniazid is also being investigated for the
same condition in children while high-dose rifampicin and levofloxacin might soon find
a place in treatment of paediatric TB meningitis (World Health Organisation, 2017).
Liquid dosage forms are the most preferred of the paediatric dosage forms for children
under the age of five years. They are easy to swallow and allow for easy dose
adjustments (Ali, et al., 2014). Oral solids are associated with the risk of choking and
present limited dose flexibility (Sam, et al., 2012). However, considering that TB is
3
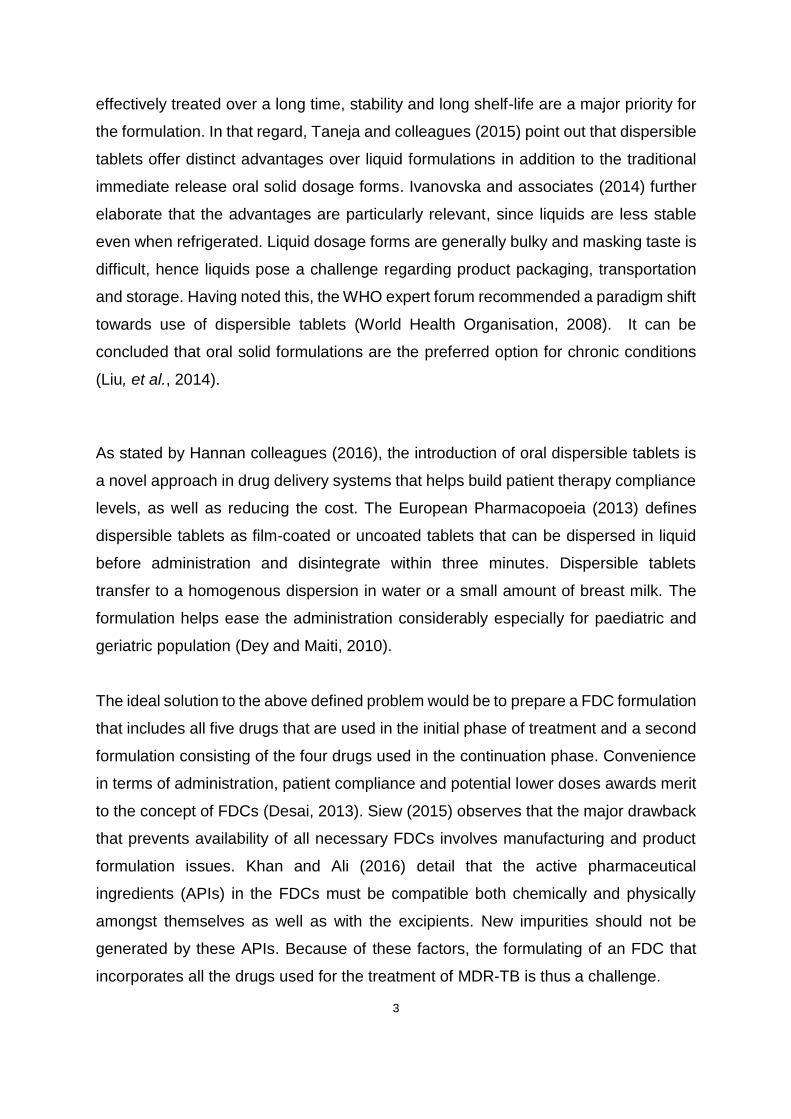
effectively treated over a long time, stability and long shelf-life are a major priority for
the formulation. In that regard, Taneja and colleagues (2015) point out that dispersible
tablets offer distinct advantages over liquid formulations in addition to the traditional
immediate release oral solid dosage forms. Ivanovska and associates (2014) further
elaborate that the advantages are particularly relevant, since liquids are less stable
even when refrigerated. Liquid dosage forms are generally bulky and masking taste is
difficult, hence liquids pose a challenge regarding product packaging, transportation
and storage. Having noted this, the WHO expert forum recommended a paradigm shift
towards use of dispersible tablets (World Health Organisation, 2008). It can be
concluded that oral solid formulations are the preferred option for chronic conditions
(Liu, et al., 2014).
As stated by Hannan colleagues (2016), the introduction of oral dispersible tablets is
a novel approach in drug delivery systems that helps build patient therapy compliance
levels, as well as reducing the cost. The European Pharmacopoeia (2013) defines
dispersible tablets as film-coated or uncoated tablets that can be dispersed in liquid
before administration and disintegrate within three minutes. Dispersible tablets
transfer to a homogenous dispersion in water or a small amount of breast milk. The
formulation helps ease the administration considerably especially for paediatric and
geriatric population (Dey and Maiti, 2010).
The ideal solution to the above defined problem would be to prepare a FDC formulation
that includes all five drugs that are used in the initial phase of treatment and a second
formulation consisting of the four drugs used in the continuation phase. Convenience
in terms of administration, patient compliance and potential lower doses awards merit
to the concept of FDCs (Desai, 2013). Siew (2015) observes that the major drawback
that prevents availability of all necessary FDCs involves manufacturing and product
formulation issues. Khan and Ali (2016) detail that the active pharmaceutical
ingredients (APIs) in the FDCs must be compatible both chemically and physically
amongst themselves as well as with the excipients. New impurities should not be
generated by these APIs. Because of these factors, the formulating of an FDC that
incorporates all the drugs used for the treatment of MDR-TB is thus a challenge.

4
The WHO 2016 guidelines for treatment of MDR-TB recommend that patients with
MDR-TB should be on a regimen with at least five effective TB medicines during the
intensive phase including pyrazinamide and four-core second-line TB medicines. The
four-core second-line drugs are chosen as follows; one chosen from Group A, one
from Group B, and at least two from Group C. The groups are shown in Table 1.1.
Pyrazinamide is the constant drug in this regimen and is added routinely to the
treatment, unless noted that the patient is infected with strains strongly suspected of
or known to be resistant to pyrazinamide (World Health Organisation, 2016b).
Table 1.1: Recommended drugs used in the treatment of MDR-TB
A. Fluoroquinolones
Levofloxacin
Moxifloxacin
Gatifloxacin
B. Second-line injectable agents
Amikacin
Capreomycin
Kanamycin
Streptomycin
C. Other core second-line agents
Ethionamide or Prothionamide
Cycloserine or Terizidone
Linezolid
Clofazimine
The WHO confirmed in the 2016 MDR-TB treatment guidelines that fluoroquinolones,
specifically high-dose levofloxacin, moxifloxacin, and gatifloxacin, significantly
improve therapeutic outcomes in children. This group of drugs is regarded as the
integral element of the core MDR-TB regimen. The benefits resulting from their use
outweigh the potential known risks. Levofloxacin is the first in line in order of
preference for the inclusion of the fluoroquinolones in the regimen. It is followed by
moxifloxacin and lastly, gatifloxacin (World Health Organisation, 2016).
Since levofloxacin and pyrazinamide will be required in most patients, these two drugs
are consequently going to be the drugs of focus in this study. They are also both
5
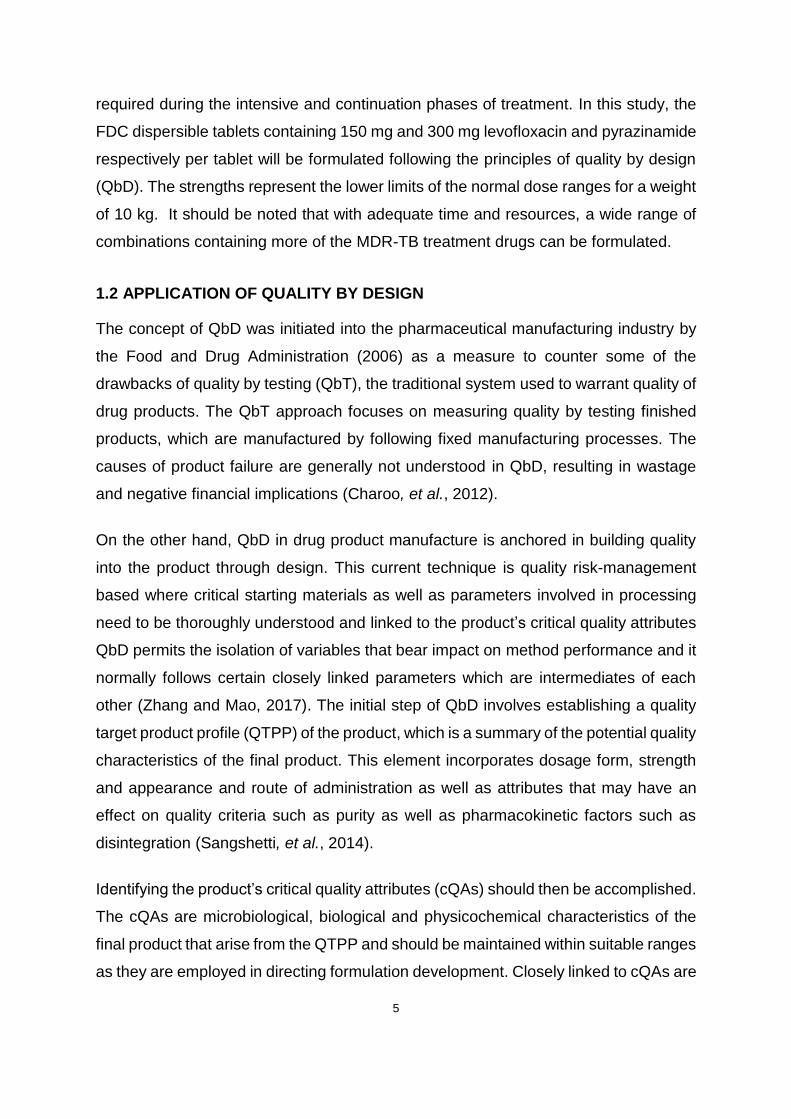
required during the intensive and continuation phases of treatment. In this study, the
FDC dispersible tablets containing 150 mg and 300 mg levofloxacin and pyrazinamide
respectively per tablet will be formulated following the principles of quality by design
(QbD). The strengths represent the lower limits of the normal dose ranges for a weight
of 10 kg. It should be noted that with adequate time and resources, a wide range of
combinations containing more of the MDR-TB treatment drugs can be formulated.
1.2 APPLICATION OF QUALITY BY DESIGN
The concept of QbD was initiated into the pharmaceutical manufacturing industry by
the Food and Drug Administration (2006) as a measure to counter some of the
drawbacks of quality by testing (QbT), the traditional system used to warrant quality of
drug products. The QbT approach focuses on measuring quality by testing finished
products, which are manufactured by following fixed manufacturing processes. The
causes of product failure are generally not understood in QbD, resulting in wastage
and negative financial implications (Charoo, et al., 2012).
On the other hand, QbD in drug product manufacture is anchored in building quality
into the product through design. This current technique is quality risk-management
based where critical starting materials as well as parameters involved in processing
need to be thoroughly understood and linked to the product’s critical quality attributes
QbD permits the isolation of variables that bear impact on method performance and it
normally follows certain closely linked parameters which are intermediates of each
other (Zhang and Mao, 2017). The initial step of QbD involves establishing a quality
target product profile (QTPP) of the product, which is a summary of the potential quality
characteristics of the final product. This element incorporates dosage form, strength
and appearance and route of administration as well as attributes that may have an
effect on quality criteria such as purity as well as pharmacokinetic factors such as
disintegration (Sangshetti, et al., 2014).
Identifying the product’s critical quality attributes (cQAs) should then be accomplished.
The cQAs are microbiological, biological and physicochemical characteristics of the
final product that arise from the QTPP and should be maintained within suitable ranges
as they are employed in directing formulation development. Closely linked to cQAs are
6
the critical material attributes (cMAs) which should also be within certain standards
and limits to guarantee correct quality of the input materials such as drug substances
and excipients. Critical process parameters (cPPs) are process characteristics that
may influence the cQAs of the product and should be examined before or during
process. It is important that cMAs and cPPs be linked to cQAs to meet the product’s
QTPP (Zhang and Mao, 2017).
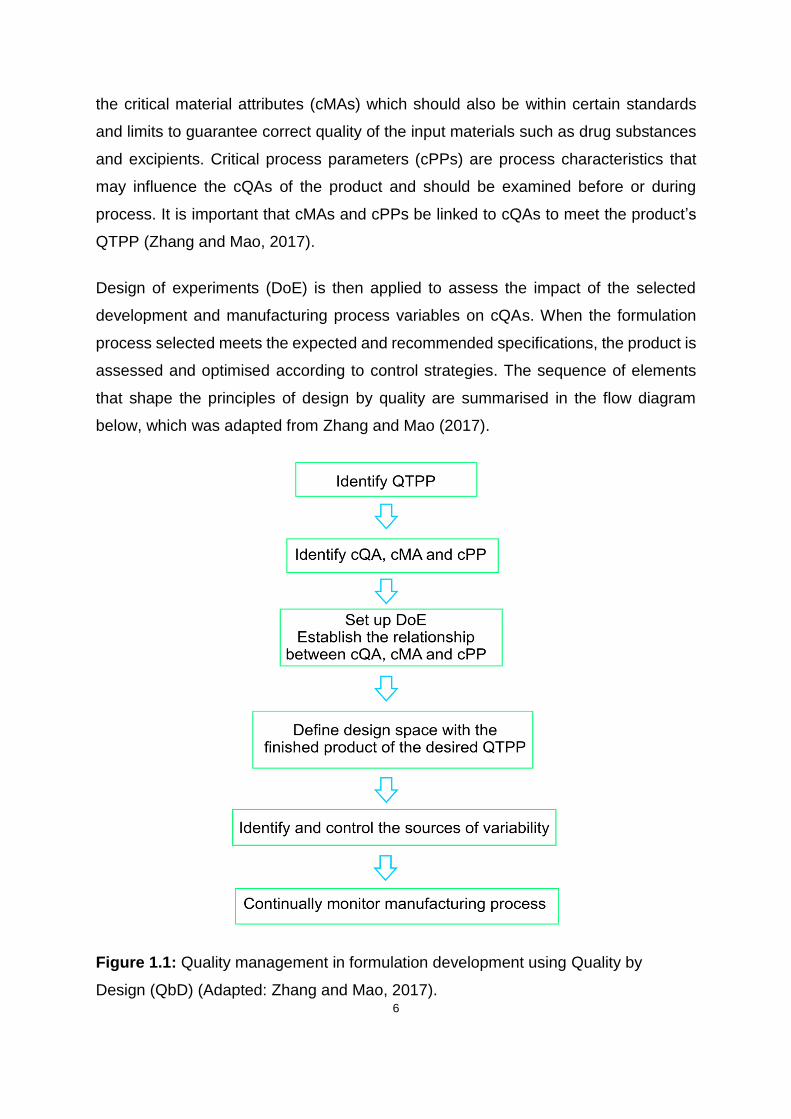
Design of experiments (DoE) is then applied to assess the impact of the selected
development and manufacturing process variables on cQAs. When the formulation
process selected meets the expected and recommended specifications, the product is
assessed and optimised according to control strategies. The sequence of elements
that shape the principles of design by quality are summarised in the flow diagram
below, which was adapted from Zhang and Mao (2017).
Figure 1.1: Quality management in formulation development using Quality by
Design (QbD) (Adapted: Zhang and Mao, 2017).

7
1.3 PROBLEM STATEMENT
MDR-TB is widespread in both adults and children. Unfortunately, there is currently no
approved paediatric-friendly FDC for the five and four drug combinations used in the
initial and continuation phases of treatment, respectively. This reduces patient
compliance and may result in loss of lives. Formulating and manufacturing a prototype
dispersible FDC tablet may therefore prevent challenges that come with using
traditional tablets and capsules, lessening pill burden at each dosing period thereby
improving adherence and treatment outcomes.
1.4 AIM AND OBJECTIVES
1.4.1 Aim
This study aims to develop an FDC dispersible tablet containing 150 mg of levofloxacin
and 300 mg of pyrazinamide for paediatric use.
1.4.2 Objectives
Based on the aim stated above, the objectives of this study are therefore to:
• Determine the preformulation characteristics of both levofloxacin and
pyrazinamide;
• Define the Quality Target Product Profile (QTPP) for the FDC formulation;
• Identify the critical quality attributes (cQAs), critical material attributes (cMAs)
and critical process parameters (cPPs) for the formulation;
• Determine the relationship between cMAs, cPPs and cQAs through the
application of Design of Experiments (DoE);
• Establish, formulate and characterise an optimised FDC dispersible tablet
containing levofloxacin and pyrazinamide;
8
CHAPTER TWO
PROPERTIES OF LEVOFLOXACIN AND PYRAZINAMIDE
2.1 INTRODUCTION
Levofloxacin and pyrazinamide will be the major components of the finished product.
It is therefore essential that characteristics of the drug substances be well
comprehended to facilitate quality risk management and sound science in product
manufacturing. In understanding the physicochemical properties of the drugs, possible
factors that affect pharmacokinetic performance of the drug product are be identified,
hence in this chapter, the foundations of defining the QTPP are laid (Yu, et al., 2014).
Levofloxacin is a second-generation quinolone. This class of antibiotics was
discovered in the early 1960s, first with the identification of nalidixic acid (Andersson
and MacGowan, 2003; Andriole, 2005). As much as levofloxacin has a wide range of
potential uses, it is mainly focused on the treatment of respiratory conditions
(Andersson and MacGowan, 2003). Aldred and colleagues (2014) in agreement with
Kabbara and fellow research team (2015) observe and agree that fluoroquinolones
are among the most frequently prescribed antibiotic classes globally. Furthermore, a
study conducted by Davis and colleagues (2014) indicates that levofloxacin falls within
the group of most used antimicrobial agents in its class.
Quinolones compose the mainstay of the treatment regimens for MDR-TB (Thee, et
al., 2015). In South Africa, only levofloxacin and moxifloxacin are approved for use in
MDR-TB treatment. Levofloxacin is recommended mainly in children below eight years
of age whereas the rest of the population uses moxifloxacin (The National Department
of Health, 2013). Though a higher dose levofloxacin is needed to achieve similar
effectiveness of moxifloxacin, levofloxacin was found to inflict lesser toxicity in its users
compared to moxifloxacin, hence it is used in younger children (Johnson, et al., 2006).
Developed in 1952 by Kushner and colleagues while investigating analogs of
nicotinamide, pyrazinamide has since been used to treat TB, though it was first
considered to be a highly toxic drug (Kushner, et al., 1952; Pretet and Perdrizet, 1980).
It is an important sterilizing agent that shortens TB treatment duration in combination
with other anti-TB drugs. Pyrazinamide is used in treatment of both TB and MDR-TB.

9
It is bactericidal and has activity against non-replicating and semi-dormant tubercle
bacilli that are not killed by other TB drugs (Zhang, et al., 2003; Zhang, et al., 2014;
Pullan, et al., 2016).
Studies were conducted in New Zealand to develop a phospholipid-based
pyrazinamide inhalable powder dosage form for treating tuberculosis. Successful
development of the dosage form should help deposit pyrazinamide deeper into the
lungs and improve drug delivery (Eedara, et al., 2016). FDC formulations available
for the treatment of TB in children contain rifampicin, isoniazid and pyrazinamide, then
rifampicin and isoniazid, for use during intensive phase and continuation phase
respectively (Graham, et al., 2015).
2.2.1 Levofloxacin
2.2.1.1 Description
Levofloxacin is an odourless and bitter to taste, light-yellowish to yellow-white
crystalline powder. It is a chiral fluorinated carboxyquinolone, an L-isomer and a pure
(S)-enantiomer of the racemic quinolone antimicrobial agent. Chemically, levofloxacin
is presented as (-)-(S)-9-fluoro-2,3-dihydro-3-methyl-10-(4-methyl-1-piperazinyl)-7-
oxo-7H-pyrido-[1,2,3-de]-1,4-benzoxazine-6-carboxylic acid. Levofloxacin’s empirical
formula is C18H20FN3O4•½H2O and the relative molecular weight is 361.37 g/mol
(Singh, et al., 2002; World Health Organisation, 2010). The chemical structure of
levofloxacin is depicted in Figure 2.1
Figure 2.1: Chemical structure of Levofloxacin hemihydrate
10
2.2.1.2 Solubility
Levofloxacin is sparingly soluble in water. The solubility profile is quite flat, with a range
of 73-108 mg/ml between pH 0.56-5.84. Solubility increases proportionally with pH to
a maximum of 272 mg/ml at pH 6.74. The minimum pH solubility profile is found within
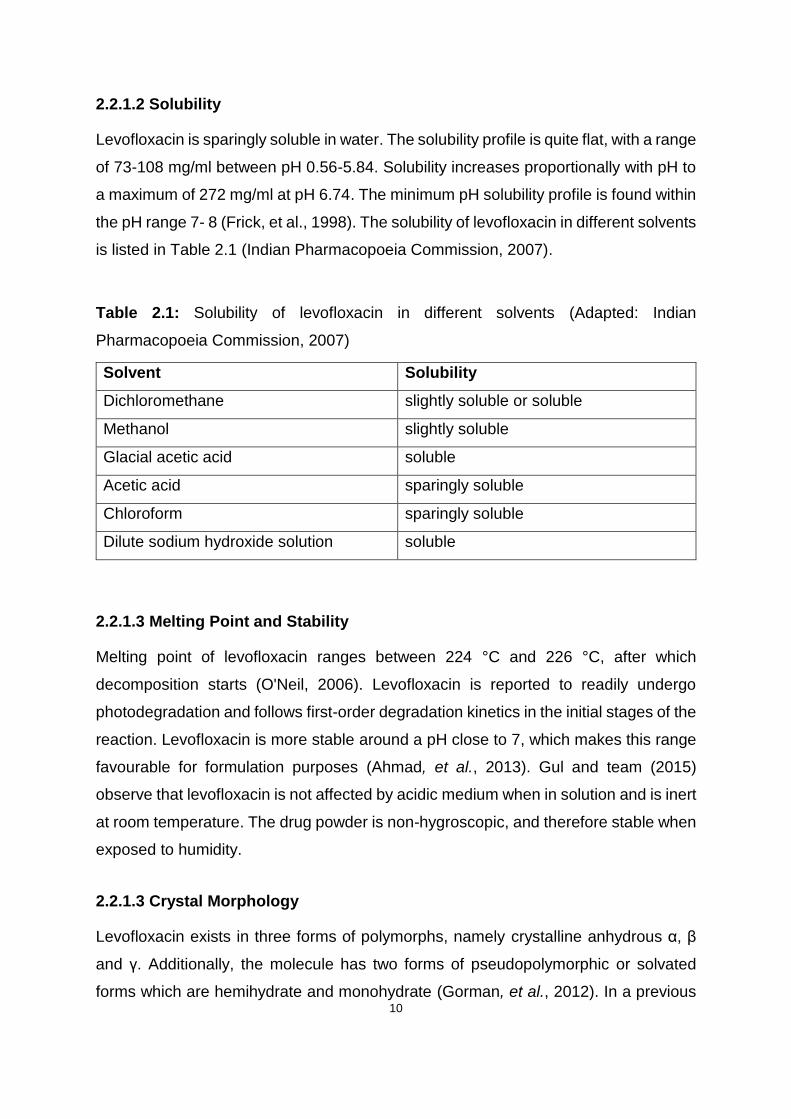
the pH range 7- 8 (Frick, et al., 1998). The solubility of levofloxacin in different solvents
is listed in Table 2.1 (Indian Pharmacopoeia Commission, 2007).
Table 2.1: Solubility of levofloxacin in different solvents (Adapted: Indian
Pharmacopoeia Commission, 2007)
Solvent Solubility
Dichloromethane slightly soluble or soluble
Methanol slightly soluble
Glacial acetic acid soluble
Acetic acid sparingly soluble
Chloroform sparingly soluble
Dilute sodium hydroxide solution soluble
2.2.1.3 Melting Point and Stability
Melting point of levofloxacin ranges between 224 °C and 226 °C, after which
decomposition starts (O'Neil, 2006). Levofloxacin is reported to readily undergo
photodegradation and follows first-order degradation kinetics in the initial stages of the
reaction. Levofloxacin is more stable around a pH close to 7, which makes this range
favourable for formulation purposes (Ahmad, et al., 2013). Gul and team (2015)
observe that levofloxacin is not affected by acidic medium when in solution and is inert
at room temperature. The drug powder is non-hygroscopic, and therefore stable when
exposed to humidity.
2.2.1.3 Crystal Morphology
Levofloxacin exists in three forms of polymorphs, namely crystalline anhydrous α, β
and γ. Additionally, the molecule has two forms of pseudopolymorphic or solvated
forms which are hemihydrate and monohydrate (Gorman, et al., 2012). In a previous
11
study that investigated the effect of dehydration on the formation of levofloxacin
pseudopolymorphs, Kitaoka and fellow researchers (1995) discovered that application
of heat on the hemihydrate eliminates the hydrated water and collapses the crystalline
lattice to produce the anhydrous γ form. Further heating produces anhydrous β form
which ultimately results in the formation of the α anhydrous form when more heat is
applied.
2.2.2 Pyrazinamide
2.2.2.1 Description
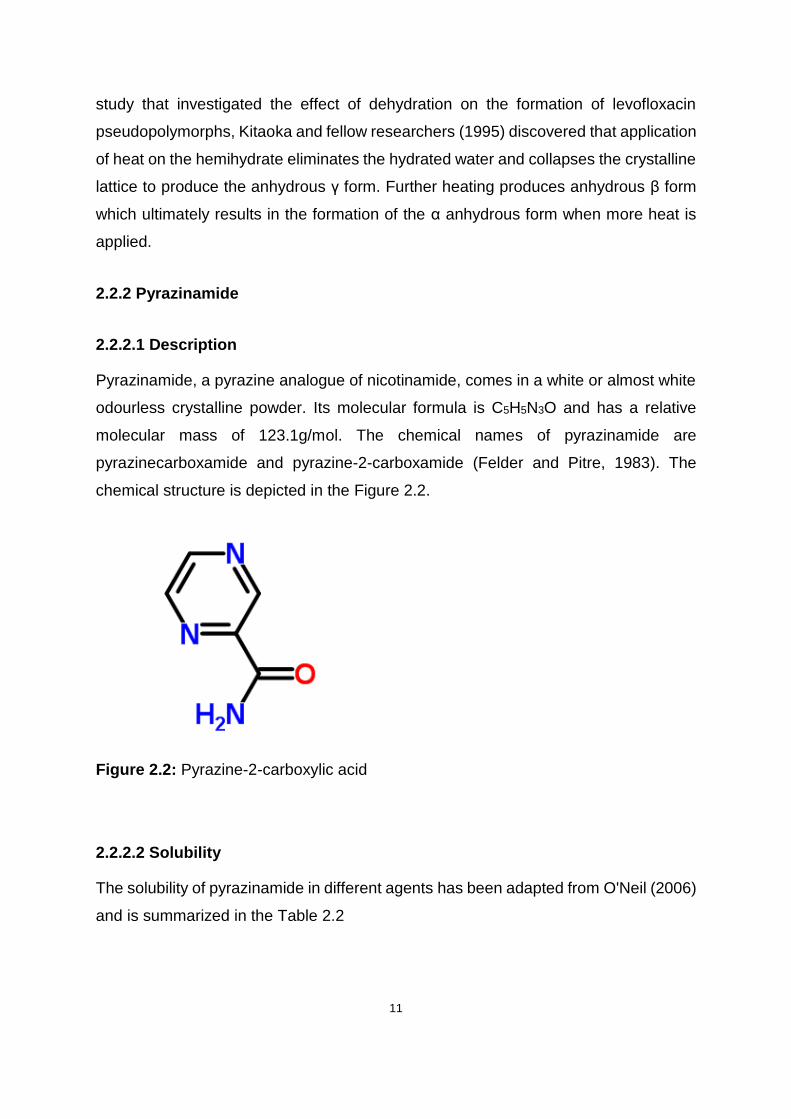
Pyrazinamide, a pyrazine analogue of nicotinamide, comes in a white or almost white
odourless crystalline powder. Its molecular formula is C5H5N3O and has a relative
molecular mass of 123.1g/mol. The chemical names of pyrazinamide are
pyrazinecarboxamide and pyrazine-2-carboxamide (Felder and Pitre, 1983). The
chemical structure is depicted in the Figure 2.2.
Figure 2.2: Pyrazine-2-carboxylic acid
2.2.2.2 Solubility
The solubility of pyrazinamide in different agents has been adapted from O'Neil (2006)
and is summarized in the Table 2.2

12
Table 2.2: Solubility of pyrazinamide in different solvents
Solvent Solubility
Water sparingly soluble
Chloroform sparingly soluble
Ethanol (95 per cent) slightly soluble
Ether slightly soluble
Benzene less soluble
2.2.2.3 Melting Point and Stability
Pyrazinamide powder melts within the temperature ranges of 189 °C and 191 °C
(O'Neil, 2006). In powder or solid form, pyrazinamide exhibits good stability. There is
no apparent degradation of bulk sample displayed due to exposure to either a dry or
wet atmosphere. Pyrazinamide maintains stability when exposed to natural daylight
(Felder and Pitre, 1983; Singh, et al., 2002).
2.2.2.4 Crystal Morphology
Pyrazinamide is reported to occur in four distinct polymorphic forms, namely,
α-pyrazinamide, β-pyrazinamide, γ-pyrazinamide and δ-pyrazinamide (Takaki, et al.,
1960; Tamura, et al., 1961). Furthermore, Takaki and associates (1960) as well as
Tamura and fellow partners (1961) agree that α-pyrazinamide is synthesised at room
temperature. These findings, however contrast with those compiled by Castro and co-
workers (2010) who give an account that the δ-pyrazinamide form is the most stable
polymorph at low temperatures. Pyrazinamide polymorphs’ relative stability and
vibrational spectroscopy have been investigated by Cherukuvada and associates
(2010) and they conclude that commercial α-pyrazinamide is the form which is most
thermodynamically stable at room temperature.
13
2.3 CLINICAL PHARMACOLOGY OF LEVOFLOXACIN AND PYRAZINAMIDE
2.3.1 Levofloxacin
2.3.1.1 Mode of action
All antibiotic agents under the chemical class of fluoroquinolones have the same
mechanism of action against bacteria. Normal transcription and replication requires
relaxation of positively supercoiled DNA. DNA gyrase is responsible for this relaxation
process. Topoisomerase IV is responsible for the separation of the replicated daughter
cell chromosomal DNA (Deck and Winston, 2015). Levofloxacin targets and blocks the
bacterial topoisomerase II (DNA gyrase) and topoisomerase IV enzymes, thereby
inhibiting bacterial DNA synthesis (Hooper and Strahilevitz, 2010).
2.3.1.2 Spectrum of activity and resistance
Levofloxacin has been known to possess moderate to good activity against Gram-
positive bacteria, including Streptococcus pneumoniae (S. Pneumoniae). On the other
hand, it displays excellent activity against gram-negative aerobic bacteria (Deck and
Winston, 2015). In vitro investigations conducted by Akcali and co-researchers (2005)
to test the activity of ciprofloxacin, ofloxacin and levofloxacin against M. tuberculosis
revealed these agents as being highly potent against the bacteria. As observed by
Oethinger and collegues (2000) as well as Hooper (2002), resistance of bacteria to
levofloxacin develops due to mutations in the bacterial chromosomal genes that
encode topoisomerase IV DNA gyrase. Bacteria may also develop a pump-mediated
efflux mechanism through which the drug is actively transported out of the bacteria
(Aldred, et al., 2014).
Gold and Moellering (1996) reported that there is no quinolone-modifying or
inactivation activities identified in bacteria. This theory was nullified after a decade by
further studies performed and reported by Robicsek and collegues (2006). The
findings maintain that some bacteria reduce activity of quinolones through a
mechanism that modifies the piperazinyl substituent by N-acetylation of the amino
nitrogen. The latter idea was to be later echoed by Hernández and colleagues (2011)

14
who detail the compromise of enzymatic potency of quinolones by specific gene
possessing bacteria.
2.3.1.3 Clinical use
Levofloxacin is reported to have increased activity against Gram-positive organisms
when weighed against ciprofloxacin or ofloxacin. It is clinically indicated for the
treatment of lower respiratory tract, sinus, urinary tract and soft tissue infections
(Langtry and Lamb, 1998; Rossiter, 2014). Relative to other quinolones, levofloxacin
has enhanced activity against aerobic Gram-positive bacteria and is effective in the
treatment of severe infections caused by S. pneumoniae, including those strains that
are penicillin resistant. Though not quite as active against aerobic Gram-negative
bacteria, levofloxacin is effective against Pseudomonas aeruginosa (P. aeruginosa)
and most infections caused by these bacteria (Hauser, 2015).
Levofloxacin has also been established as a possible prophylaxis agent against
Aeromonas infections during leech therapy (Bauters, et al., 2014). The revision of the
South African DR-TB treatment guidelines in 2012 recommended the use of
levofloxacin for prevention or treatment of DR-TB in children below eight years of age
(Thee, et al., 2014).
2.3.1.4 Side effects and interactions
As with all the fluoroquinolones, levofloxacin is generally well tolerated.
Pseudomembranous colitis remains the main potential adverse effect, just like virtually
all the antimicrobial agents (Wimer, et al., 1998). Gastrointestinal symptoms, including
diarrhoea, are the most common side effects (Deck and Winston, 2015). They are
experienced by 5% to 10% of individuals taking levofloxacin. It is documented that
about 5% of patients on levofloxacin experience adverse effects involving the central
nervous system such as headache and dizziness. Rashes occur in approximately 1%
to 2% of the patients (Hauser, 2015; Liu, 2010; Anderson and Perry, 2008).
It has been observed that fluoroquinolones have a potential of causing reversible
arthropathy whereby growing cartilage is damaged. Levofloxacin is no exception in

15
this regard (Liu, 2010; Deck and Winston, 2015). Deck and Winston (2015) further
elaborate that tendonitis and tendon rupture may occur in adults where the tendons
are fully developed. However, this is a rare complication resulting from levofloxacin
use. Recent studies conducted by Lee and associates (2015) point out that
fluoroquinolones are associated with aortic aneurysm and dissection resulting from
collagen degradation.
Reports of levofloxacin risk in prolongation of the QTc interval have been recorded.
To a lesser extent than other quinolones, levofloxacin can block potassium channels.
This delays repolarization in cardiac tissue, subsequently resulting in ventricular
arrhythmias such as torsades de pointes (Hooper and Strahilevitz, 2010; Deck and
Winston, 2015; Patel, et al., 2010). Studies have revealed that hypoglycaemia may be
precipitated using levofloxacin, especially in the geriatric population (Kanbay, et al.,
2006; El Ghandour and Azar, 2015).
Co-administration of levofloxacin with magnesium, calcium and aluminum containing
antacids markedly reduces oral bioavailability. This is presumably due to the formation
of poorly absorbed cation-quinolone complexes (Radandt, et al., 1992). Multivitamin-
mineral supplements that contain both iron and zinc or zinc alone, have also been
found to reduce quinolone absorption (Hooper and Strahilevitz, 2010; Radandt, et al.,
1992). Levofloxacin shows weak inhibition of the cytochrome P450 isoform CYP2C9
enzymes (Zhang, et al., 2008). Consequently, levofloxacin displays insignificant
potential to alter CYP2C9 substrate drug pharmacokinetics (Fish and Chow, 1997).
The clearance of levofloxacin is predominantly via the renal route. The rate of
elimination is decreased by co-administration with cimetidine and probenecid,
resulting in increased levofloxacin half-life (Baxter, 2010).
2.3.1.5 Substantial risk groups
As fluoroquinolones possess a similar core structure, individuals who are
hypersensitive to any fluoroquinolone should also avoid using levofloxacin due to
cross sensitivity (Anovadiya, et al., 2011). Researchers found that athletes and
sporting individuals are at risk of developing tendinopathy and potential tendon rupture
with levofloxacin and other fluoroquinolone usage (Ganske and Horning, 2012; Lewis
16
and Cook, 2014). Several cases in literature reveal that diabetes mellitus patients are
a high-risk group with regards to use of levofloxacin and some fluoroquinolones. Life-
threatening metabolic coma, severe hypoglycemia, induced crystal nephropathy and
increased hepatotoxicity are some of the reported cases which researchers conclude
are linked to use of levofloxacin in diabetics (Bansal, et al., 2015; Micheli, et al., 2012;
Liu, et al., 2015; Coelho, et al., 2011).
The geriatric population appears to be more susceptible to the potential risks of
levofloxacin use. Cases of levofloxacin associated hypoglycemia, as well as Stevens
- Johnson syndrome in the elderly have been reported (Kanbay, et al., 2006; Burgos
Arguijo, et al., 2010). Due to the potential risk of adverse musculoskeletal effects
following fluoroquinolone treatment, fluoroquinolones are generally not recommended
for use in children below the age of 18. Since the resulting arthropathy is reversible,
research supports fluoroquinolone use in children in cases where standard antibiotic
therapy is not responding well (Choi, et al., 2013; Deck and Winston, 2015).
With fear that they could be teratogenic, fluoroquinolones have been labelled as
unsafe during pregnancy. However, there is no clinically supported evidence to solidify
these assumptions (Loebstein, et al., 1998). The growing body of data suggests that
the drugs may in fact be safe for use during pregnancy (Bar-Oz, et al., 2009; Yefet, et
al., 2015).
2.3.2 Pyrazinamide
2.3.2.1 Mode of action
Pyrazinoic acid, the active metabolite of pyrazinamide, disrupts membrane transport
function in Mycobacterium tuberculosis (Zhang, et al., 2003). Bacterial energy
production, coenzyme A functionality and trans-translation mechanism in proteins
synthesis are also inhibited (Zhang, et al., 2014). Pyrazinamide is more effective
against old non-replicating bacilli due to their low membrane potential. The highest
rate of activity of the drug is displayed in acidic environment (Zhang, et al., 2003).
Figure 2.3 shows the possible mechanism of action which pyrazinamide adopts to
damage bacterial cell membrane.
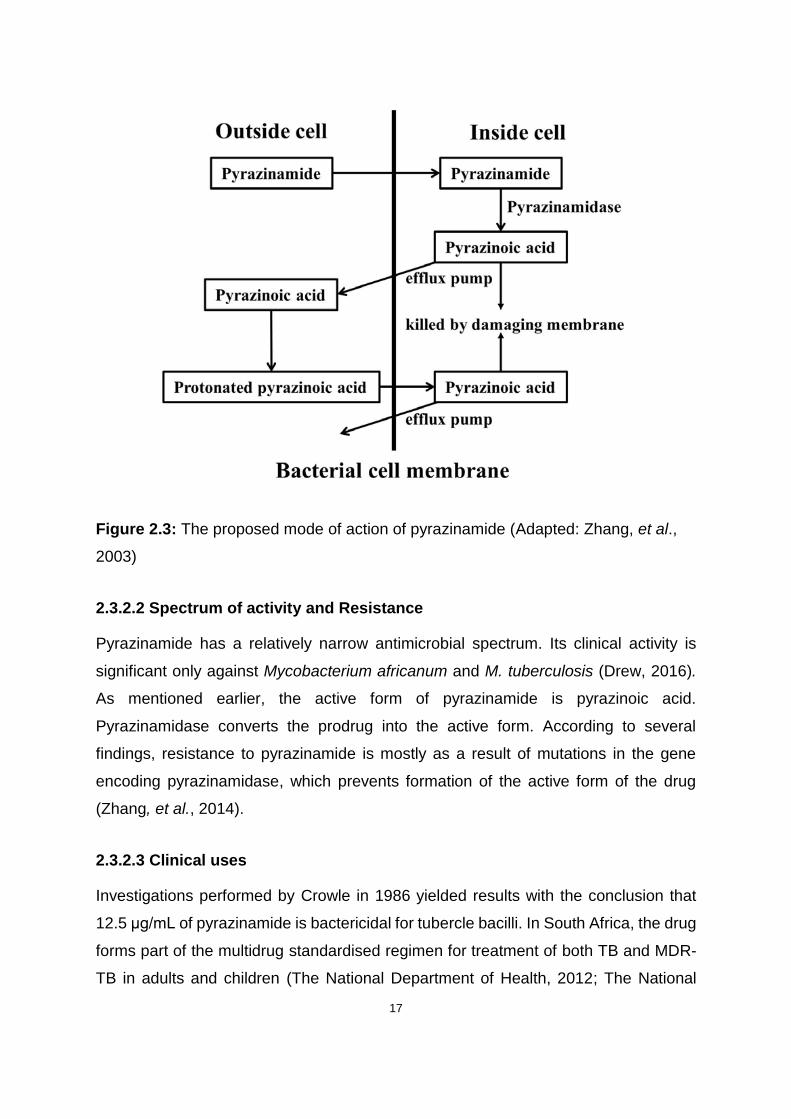
17
Figure 2.3: The proposed mode of action of pyrazinamide (Adapted: Zhang, et al.,
2003)
2.3.2.2 Spectrum of activity and Resistance
Pyrazinamide has a relatively narrow antimicrobial spectrum. Its clinical activity is
significant only against Mycobacterium africanum and M. tuberculosis (Drew, 2016).
As mentioned earlier, the active form of pyrazinamide is pyrazinoic acid.
Pyrazinamidase converts the prodrug into the active form. According to several
findings, resistance to pyrazinamide is mostly as a result of mutations in the gene
encoding pyrazinamidase, which prevents formation of the active form of the drug
(Zhang, et al., 2014).
2.3.2.3 Clinical uses
Investigations performed by Crowle in 1986 yielded results with the conclusion that
12.5 μg/mL of pyrazinamide is bactericidal for tubercle bacilli. In South Africa, the drug
forms part of the multidrug standardised regimen for treatment of both TB and MDR-
TB in adults and children (The National Department of Health, 2012; The National

18
Department of Health, 2013). Co-administering pyrazinamide with rifampicin or
isoniazid leads to a significant reduction in the anti-TB therapy duration, while also
lowering the likelihood of TB relapse (Gumbo, 2011).
2.3.2.4 Side effects and interactions
Adverse effects of pyrazinamide include elevated uric acid levels in the serum which
may lead to gout. Hepatotoxicity has been reported from approximately 15% of
patients and jaundice in about 2-3% of users (Felder and Pitre, 1983; Chang, et al.,
2008). In rare instances, death due to hepatic necrosis has also been reported
(Chang, et al., 2008). Gastrointestinal-related adverse manifestations are common,
whereas dermatological reactions due to pyrazinamide use are rare (Khayyam, et al.,
2010).
According to a study done to determine the pharmacokinetics of pyrazinamide under
fasting conditions, antacids were found to cause no clinically significant changes in
pyrazinamide pharmacokinetic parameters (Peloquin, et al., 1998). Upon
administration with antacids, the absorption peak time of pyrazinamide was reduced
by approximately 17%, nevertheless, this effect is not clinically important (Peloquin, et
al., 1998). As highlighted earlier, it is common for pyrazinamide to cause
hyperuricaemia and as a result, uricosuric effects of anti-gout drugs may be
antagonised (Cullen, et al., 1957; Pham, et al., 2014).
2.3.2.5 Substantial risk groups
In their review of the data with regards to TB treatment in pregnant women, Loto and
Awowole (2012) discovered that use of pyrazinamide in pregnancy is now
recommended by most international health organisations. Physicians had initially
avoided its use on grounds of unavailability of concrete information on its
teratogenicity. However, despite the inclusion of pyrazinamide in the treatment of
tuberculosis in pregnant women, there have been no reports of significant adverse
events (Anderson, 1997; Bothamley, 2001).
19
The analysis of the published data to review occurrences of anti-TB drug-induced
hepatotoxicity in children was carried out by Donald (2011). Results approximate that
0.06% of children treated with pyrazinamide in combination with isoniazid and
rifampicin developed jaundice (n=12 708), while 8% of the children studied displayed
abnormal liver function test results (n=1 225). In another study conducted on Japanese
paediatric patients, it was reported that eight in 99 children receiving pyrazinamide
developed severe hepatotoxicity. All the eight were below the age of five years
(Ohkawa, et al., 2002). Age is one of the major risk factors of drug-induced
hepatotoxicity. Close monitoring of liver function should be carried out on younger
children and the elderly receiving pyrazinamide for tuberculosis chemotherapy
(Ohkawa, et al., 2002; Tanizaki, et al., 2013).
Individuals known or suspected to have liver injury should avoid use of pyrazinamide.
Similarly, patients suffering from gout or who are hypersensitive to pyrazinamide or its
components should not be re-challenged (Saukkonen, et al., 2006). Dosing frequency
should be reduced to thrice a week in patients with chronic renal failure (Stamatakis,
et al., 1988).
2.4 PHARMACOKINETICS OF LEVOFLOXACIN AND PYRAZINAMIDE
2.4.1 Levofloxacin
2.4.1.1 Dosage
With relevance to this study, the standardised treatment guidelines for tuberculosis in
children below eight years old suffering from MDR-TB in South Africa exists (The
National Department of Health, 2013). A dose of between 15 mg and 20 mg/kg/dose
once daily of oral levofloxacin is recommended. The maximum dose of levofloxacin is
1 000 mg per day.
2.4.1.2 Absorption and Distribution
Following oral administration, levofloxacin’s absorption from the gastrointestinal tract
is rapid and approximately 100%, with the absolute bioavailability also approaching
100% (Chien, et al., 1997; North, et al., 1998). The plasma-concentration time profiles

20
following oral or intravenous infusion over an hour have insignificant differences. Time
to reach peak plasma concentrations (tmax) ranges from 0.8 to 2.4 hours and the peak
concentration (Cmax) ranges from 0.6 to 9.4 mg/L upon administration of 50 to
1000 mg (Fish and Chow, 1997).
Levofloxacin is widely distributed throughout the body, in tissues and fluids (Zhu, et
al., 2016). In one research, it was found that the mean volume of distribution is 1.1
L/kg with relatively poor penetration into the cerebrospinal fluid. It is further
approximated that 24 to 38% of the drug is bound to albumin serum proteins (Fish and
Chow, 1997).
2.4.1.3 Metabolism and Elimination
Studies show that levofloxacin undergoes limited metabolism in humans. This is
confirmed by results concluding that approximately 80% of the drug is excreted
unchanged in the urine, with formation of no metabolites (Fish and Chow, 1997). The
majority of the elimination of levofloxacin is accounted for by renal metabolism (Hooper
and Strahilevitz, 2010).
2.4.2 Pyrazinamide
2.4.2.1 Dosage
The paediatric standard treatment guidelines and essential medicines list for South
Africa (The National Department of Health, 2013) spells out the recommended drug
doses for treatment of various conditions. For the treatment of MDR-TB in children
under the age of eight years, oral pyrazinamide 30 to 40 mg/kg daily is recommended.
The dose is maintained through both the intensive and continuation phases.
2.4.2.2 Absorption and Distribution
Through evaluations made in both healthy adult volunteers and patients, outcomes
show that pyrazinamide is rapidly absorbed, with more than 90% bioavailability. Tmax
is reached within an hour or two, with a half-life of eight to 11 hours (Ellard, 1969;
Lacroix, et al., 1989; Roy, et al., 1999). About 15 to 40% of the drug is protein bound
21
(Woo, et al., 1996). In patients with tuberculous meningitis, pyrazinamide was found
to penetrate well into the cerebrospinal fluid (Nau, et al., 2010; Donald, 2010).
2.4.2.3 Metabolism and Elimination
Pyrazinamide is metabolized by microsomal deamidase into metabolites which include
pyrazinoic acid, 5-hydroxy-pyrazinamide and 5-hydroxy-pyrazinoic acid (Lacroix, et
al., 1989). These compounds are excreted by the kidneys. Pyrazinuric acid has also
been identified in minor quantities in human urine (Beretta, et al., 1987). In cases of
renal failure, clearance of pyrazinamide is reduced, and dosing frequency must be
reduced accordingly, normally to either thrice or twice weekly instead of the standard
once daily doing. Re-dosing after a hemodialysis session should be considered since
the process eliminates pyrazinamide from the body (Stamatakis, et al., 1988; Malhotra,
2003). Figure 2.4 summarises the different metabolism pathways followed by
pyrazinamide after being ingested.
Figure 2.4: Metabolic pathways of pyrazinamide (Redrawn from Lacroix, et al. 1989)
22
2.5 CONCLUSION
Levofloxacin and pyrazinamide share some common physical properties. They both
exhibit high melting and are stable at room temperatures while also being non-
hygroscopic at ambient conditions. These properties facilitate easy handling in the
laboratory, as well as during tablet manufacturing.
The similarities allow for the compounding of an FDC formulation containing
levofloxacin and pyrazinamide. The adverse effects of the two drugs are clearly
detrimental to the target children population. These drugs have, however, been used
for decades and it has been concluded that the benefits outweigh their risk.
Pharmaceutical care remains essential in ensuring that the side effects do not go
unnoticed and are managed accordingly.
23
CHAPTER THREE
DEVELOPMENT AND VALIDATION OF HPLC METHOD FOR THE
DETERMINATION OF LEVOFLOXACIN AND PYRAZINAMIDE
3.1 INTRODUCTION
3.1.1 Overview
Several chemical and spectroscopic analytical techniques exist in this technological
era. Miller (2005) reports that in a study conducted in America, it was found that
approximately 5% of all laboratory-based researchers in 2013 used chromatographic
analysis in one form or another. It is tradition to acknowledge Mikhail Semenovich
Tswett as the first to describe the chromatographic analysis technique, shortly after
1900 (Zolotov, 2003; Rouessac and Rouessac, 2007). After their literature survey,
Siddiqui and colleagues (2013) drew the conclusion that high-performance liquid
chromatography (HPLC) is the most popular of the chromatographic tools.
HPLC is a modern form of preparative liquid chromatography improved from the earlier
forms. The technique is highly enhanced with regards to resolution and selectivity
(Rouessac and Rouessac, 2007). Amidst the analytical techniques and technology
advancements, HPLC remains the preferred analytical tool for analysing API. It is the
principal method endorsed by most official compendia (Shabir, 2003; Misiuk, 2010;
Siddiqui, et al., 2013).
Levofloxacin and pyrazinamide have previously been analysed in biological fluids and
pharmaceutical dosage forms. Most of the analytical methods, however, report the
simultaneous analysis of these compounds in a sample matrix containing both
levofloxacin and pyrazinamide with other chemicals at a time. The objective of this
study was to develop and validate an HPLC method for the simultaneous
determination of levofloxacin and pyrazinamide in their pharmaceutical solid dosage
forms.

24
3.1.2 Classification of HPLC
There are many advantages of HPLC over other separation techniques. The primary
benefit of HPLC lies in its ability to perform its functions with great precision, speed
and sensitivity, yielding high resolution outcomes (Ahuja, 2006). There are four main
types of HPLC techniques, namely; normal-phase (NP-), reversed-phase (RP-), ion-
exchange (IE-) and size-exclusion (SE-) HPLC (Braithwaite and Smith, 1999). The
techniques’ identities are defined by the differences in dominant types of molecular
interactions that prevail during the separation process (Kazekevich and LoBrutto,
2007).
3.1.2.1 Normal-Phase HPLC (NP-HPLC)
NP-HPLC is a technique whose separation mode utilises polar stationary phases and
organic solvents as mobile phases (Jandera, 2011). It exploits the polar interaction
strength differences that exist between each analyte within a matrix and the stationary
phase. The relatively less polar analyte elutes quicker along the chromatography
column as a result of weak analyte-stationary phase interaction and vice versa
(Kazekevich and LoBrutto, 2007).
Benefits of NP-HPLC, amongst others, are its usability for samples that decompose in
aqueous solutions and the stability of columns. NP-HPLC is however not without
unfavourable conditions, these include, but not limited to, limitations in types of sample
mixtures that can be separated, limitation in range of solvents and high cost (Snyder,
et al., 1997c). The shortcomings of NP-HPLC gave rise to the development of RP-
HPLC (Chinou, 2010).
3.1.2.2 Reversed-phase HPLC (RP-HPLC)
Undoubtedly the most popular technique of chromatography, RP-HPLC is used in up
to 90% of all HPLC separation modes (Kumar and Kumar, 2012). RP-HPLC employs
mainly van der Waals or hydrophobic forces (dispersive forces) for the analysis of low
molecular weight compounds. Popularity of RP-HPLC lies in its ability to identify and
quantify closely related substances with favourable retention and selectivity
(Kazekevich and LoBrutto, 2007). As opposed to NP-HPLC method, RP-HPLC makes

25
effective use of non-polar stationary phase in collaboration with polar mobile phases
(Kenkel, 2014).
As described in literature, the backbone of the non-polar stationary phase is a structure
framed with silica particles. Chemically bonded to the structure are carbon chains of
varying lengths. Classic representations of the workhorse include octyl-(C8) and
octadecyl-(C18) groups (Engelhardt, 2011; Kenkel, 2014). A dynamic array of
stationary phases that comprise silica support bonded to other functional groups exist
commercially. Phases containing phenyl groups, aminopropyl, cyano, nitrile, ethers
and diols, among others, show pronounced selectivity and retention towards specific
analytes under certain conditions (Engelhardt, 2011). Mobile phases ordinarily consist
of water-based solutions with varying concentrations of miscible organics. Methanol
(MeOH), acetonitrile (ACN) and tetrahydrofuran are the most commonly used eluents
(Snyder and Kirkland, 1979; Snyder, et al., 1997c).
The mechanisms surrounding separation techniques of RP-HPLC have been studied
over years. Consequently, research has shown that pH of the mobile phase plays a
significant role in sample separation. It has been established that the recommended
pH range is between 2 and 8 (Snyder, et al., 1997c).
3.1.2.3 Ion-exchange HPLC (IE-HPLC)
High-resolution IE-HPLC concept was routinely used for amino acid analysis since its
introduction in the early 1960s. With time, the procedure found its functionality being
recruited in analysing physiological fluids such as urine and serum compounds
(Snyder and Kirkland, 1979). IE-HPLC exploits the difference in affinities of analyte
ions for the oppositely charged groups of the hydrophobic stationary phase packing in
the column. The mechanism of separation can be described using Equation 3.1, where
an exchange between two positively charged ions, X+ and Y+ in a solution and
exchange resin R− occurs (Snyder, et al., 1997c; Kazekevich and LoBrutto, 2007).
X·R + Y+ ↔ Y·R + X+ Equation 3.1
26
3.1.2.4 Size-exclusion HPLC (SE-HPLC)
As the name suggests, size-exclusion chromatography technique separates
molecules in relation to their relative sizes. Through the use of well-defined and
distributed porous spaces in the packing material, molecules in the analyte are
excluded depending on their molecule hydrodynamic radius (Kazekevich and
LoBrutto, 2007; Trojer, et al., 2011).
Contrary to other HPLC modes, bigger molecules are eluted faster than the smaller
ones. This is because small sized molecules flow through the pore spaces where they
are distributed throughout the entire column volume and larger particles only move
around the adsorbent particles (Barth and Boyes, 1992; Ricker and Sandoval, 1996).
SE-HPLC is the only chromatographic separation technique where the analyte and the
stationary phase should not have any positive interaction (Kazekevich and LoBrutto,
2007).
3.2 Analytical methods for the analysis of levofloxacin and pyrazinamide
To derive the most suitable conditions for the development of a method for the
simultaneous analysis of levofloxacin and pyrazinamide, related published methods
were examined and compared. Close attention was paid to HPLC methods evolved to
analyse the single drug compounds. This information was used to compose a method
that allows for analysis of the two compounds simultaneously. Table 3.1 exhibits a
summary of some of the observations reported by different researchers.
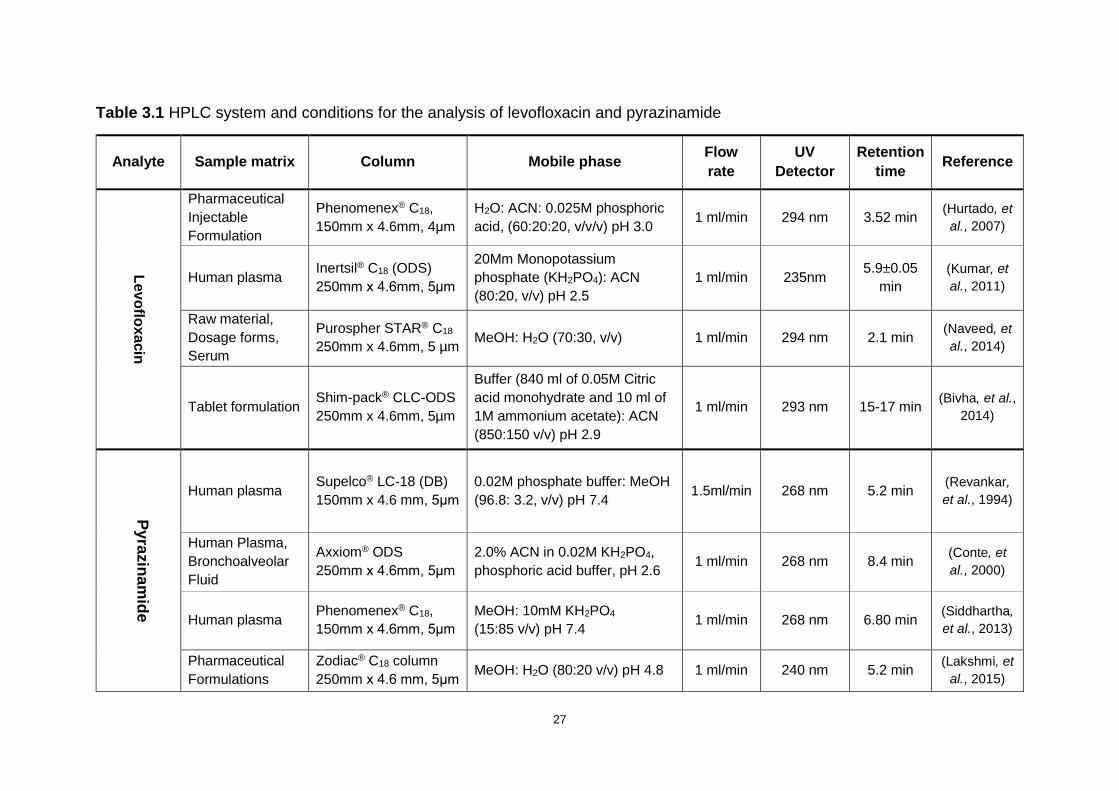
27
Table 3.1 HPLC system and conditions for the analysis of levofloxacin and pyrazinamide
Analyte Sample matrix Column Mobile phase Flow
rate
UV
Detector
Retention
time Reference
Lev
oflo
xa
cin
Pharmaceutical
Injectable
Formulation
Phenomenex® C18,
150mm x 4.6mm, 4μm
H2O: ACN: 0.025M phosphoric
acid, (60:20:20, v/v/v) pH 3.0 1 ml/min 294 nm 3.52 min
(Hurtado, et
al., 2007)
Human plasma Inertsil® C18 (ODS)
250mm x 4.6mm, 5μm
20Mm Monopotassium
phosphate (KH2PO4): ACN
(80:20, v/v) pH 2.5
1 ml/min 235nm 5.9±0.05
min
(Kumar, et
al., 2011)
Raw material,
Dosage forms,
Serum
Purospher STAR® C18
250mm x 4.6mm, 5 µm MeOH: H2O (70:30, v/v) 1 ml/min 294 nm 2.1 min
(Naveed, et
al., 2014)
Tablet formulation Shim-pack® CLC-ODS
250mm x 4.6mm, 5µm
Buffer (840 ml of 0.05M Citric
acid monohydrate and 10 ml of
1M ammonium acetate): ACN
(850:150 v/v) pH 2.9
1 ml/min 293 nm 15-17 min (Bivha, et al.,
2014)
Py
razin
am
ide
Human plasma Supelco® LC-18 (DB)
150mm x 4.6 mm, 5μm
0.02M phosphate buffer: MeOH
(96.8: 3.2, v/v) pH 7.4 1.5ml/min 268 nm 5.2 min
(Revankar,
et al., 1994)
Human Plasma,
Bronchoalveolar
Fluid
Axxiom® ODS
250mm x 4.6mm, 5μm
2.0% ACN in 0.02M KH2PO4,
phosphoric acid buffer, pH 2.6 1 ml/min 268 nm 8.4 min
(Conte, et
al., 2000)
Human plasma Phenomenex® C18,
150mm x 4.6mm, 5μm
MeOH: 10mM KH2PO4
(15:85 v/v) pH 7.4 1 ml/min 268 nm 6.80 min
(Siddhartha,
et al., 2013)
Pharmaceutical
Formulations
Zodiac® C18 column
250mm x 4.6 mm, 5μm MeOH: H2O (80:20 v/v) pH 4.8 1 ml/min 240 nm 5.2 min
(Lakshmi, et
al., 2015)
28
HPLC analyses for quantification of levofloxacin have been performed on a wide
spectrum of diverse types of samples including biological fluids, raw materials and
pharmaceutical formulations (Hurtado, et al., 2007; Kumar, et al., 2011; Naveed, et al.,
2014). On the contrary, there is dearth of reports that show that there is analysis of the
drugs in their pure forms and pharmaceutical dosage forms (Revankar, et al., 1994;
Conte, et al., 2000).
Generality, as displayed by the facts compiled in the Table 3.1 suggests that previous
methods have derived benefit from RP-HPLC with C18 or C8 non-polar stationary
phases for compound separation. Mobile phases were composed of organic modifiers
and buffer components such as ACN, MeOH and KH2PO4. In cases where ACN was
not included in the mobile phase mixture, MeOH was employed instead (Siddhartha,
et al., 2013; Naveed, et al., 2014; Lakshmi, et al., 2015). The amount of ACN range
was 15-20% of the mixture composition, whilst MeOH was 3.2-85% (Table 3.1).
Although both drugs exhibit retention times of 15 minutes or less, retention times of up
to 17 minutes have been reported in analysis of levofloxacin (Bivha, et al., 2014).
Pyrazinamide is a weakly acidic drug (Gu, et al., 2008) and on the other end,
levofloxacin is amphoteric (Kumar, et al., 2012). Buffer systems were used to suppress
ionisation of the compounds during separation, although non-buffered methods have
also proved to yield satisfactory results (Naveed, et al., 2014; Lakshmi, et al., 2015).
Consequently, pH was modified and ranged between 2.5 and 7.4. The methods
employed ultraviolet (UV) absorption spectroscopy, where detector wavelength was
set between 235-294nm for levofloxacin and 240-268nm for pyrazinamide. Three of
the four instances (Table 3.1) show the wavelength of 268 nm in detection of
pyrazinamide.
The published data, as referenced in Table 3.1, on conditions for analysis of the
separate compounds in various sample matrices was manipulated to develop a
suitable HPLC method for simultaneous detection of levofloxacin and pyrazinamide in
raw materials and tablet dosage form.

29
3.3 EXPERIMENTAL
3.3.1 Materials and reagents
Levofloxacin was purchased from Sgonek® Biological Technology Co, Ltd (Xian Shi,
Shaanxi Sheng, China) and pyrazinamide was kindly sponsored by Aspen
Pharmacare® (Eastern Cape, South Africa). ACN, orthophosphoric acid and tri-
ethylamine were procured from Merck KGaA (Darmstadt, Germany).
HPLC grade water for preparation of samples and buffers was purified using a Purite®
water purification system (Suez Water Purification Systems Ltd, Thames, Oxford
shire). Water was then filtered through 0.2 µm GVS Cellulose acetate filters (GVS Life
Sciences, Massachusetts, USA) before use.
3.3.2 HPLC System
A Shimadzu® Prominence LC-20A Modular HPLC system (Shimadzu Corporation,
Tokyo, Japan) consisting of separate modules was used. The unit included a model
LC-20AT solvent delivery unit, absorbance detector model SPD-20A fitted with UV-
VIS dual detectors and SPD-M20A diode array detector component, model CTO-20AC
column oven as well as a model SIL-20AC HT auto-sampler module. Degassing of all
the liquids was done using DGU-20A5 degasser unit. LCSolution® version 1.25
operation software was used to read and capture all HPLC data. Successful
separation was reached through a Luna® C18, 150 mm x 4.6 mm, 5 μm column
(Phenomenex, Milford, Massachusetts, USA). Temperatures were maintained at 25
°C throughout the separation process.
3.3.2.1 Column selection
Selecting a suitable column for the RP-HPLC system analysis depends on a range of
factors. Markedly, the inherent physicochemical properties of the drug compound to
be analysed determine the type and extent of forces of interaction that occur between
the analyte and stationary phase during separation (Braithwaite and Smith, 1999;
Ahuja, 2006; Engelhardt, 2011).
30
As discussed earlier in this chapter (Section 3.2), pyrazinamide is a weak acid whereas
levofloxacin is amphoteric. Acidic compounds are known to protonate in environments
where the pH values are higher than the pKa of the organic acid and the opposite
conditions cause basic compounds to dissociate. Mixing the two compounds alters the
pH values of the individual solutions which necessitates the use of a buffer to maintain
a suitable environment with a desired retention during separation. The final mixture
formed plays a role in the selection process of a stationary phase (Snyder, et al.,
1997c). Following review of literature as compiled in Table 3.1 and evaluation of
physicochemical properties of the drug compounds, a silica based reverse phase C18
column was selected for use in the analysis.
Particle size and mean diameter of the packing material of the stationary phase
significantly influence the concomitant peak-height and resolution of HPLC. There is
evidence to support that columns whose particle size ranges between 3 - 10 µm
display favorable performance responses in the selection of an HPLC method. The
best compromise of reproducibility, efficiency and reliability have been observed when
employing stationary phases with the packing of adsorbing materials which are 5 µm
in size (Snyder, et al., 1997a). Although presenting with higher clogging risks, columns
that contain 3.5 µm sized particles offer outstanding compromise between good
performance and column durability compared to those of 5 µm particles (Kirkland, et
al., 1994). However, the benefits of the latter column outweigh those of the former,
which led to a column packed with 5 µm particles being selected for this study.
Column length and internal diameter (I.D) are selected as per specifications of the
analysis. For conventional analytical applications, a column length of 150 mm with I.D
ranging between 3 - 4.6 mm is acceptable. Columns with I.D of 8 - 50mm are generally
preferred for pilot, preparative and semi-preparative assays of analytical samples
(Snyder, et al., 1997a). The theoretical plate number of a 3 mm I.D column diminishes
by 10-20% in comparison with a 4.6 mm I.D column packed with the same particles
due to the elevated proportion of column dead volume (Trojer, et al., 2011). The
4.6 mm I.D column is more economic and for the above stated reasons, a column with
4.6 mm I.D and 150 mm length was employed in this analysis.
31
3.3.2.2 Preparation of stock solutions
For the preparation of stock solutions, 60±0.05 mg of levofloxacin and 120±0.05 mg
pyrazinamide powders were weighed accurately using a Model XP205 Mettler Toledo®
analytical precision balance (Mettler Instruments, Zurich, Switzerland). The measured
powders were each quantitatively transferred into clean, separate
100 ml A-grade volumetric flasks. The drug powders were dissolved in mobile phase
and stirred for two minutes to fashion 600 μg/ml levofloxacin and 1200 μg/ml
pyrazinamide stock solutions using a Model STR-MH-180 magnetic hotplate stirrer
(FMH Instruments®, Cape Town, South Africa). These concentrations represented
300% of the target concentrations. Stock samples were kept in the fridge at a
temperature of ±4 °C for the duration of the experimental study.
Aliquots were extracted from the stock solutions and transferred into clean 50 ml
A-grade volumetric flasks to create solutions containing levofloxacin and
pyrazinamide. The resultant separate drug solutions were serially diluted using the
mobile phase mixture. These solutions were mixed to produce two sets of solutions in
which each set had one constant drug concentration while the other was varied. The
first set contained levofloxacin in concentrations of 300, 250, 200, 150, 100 and 50
μg/ml while pyrazinamide was kept constant at 200 μg/ml. The second set carried
solutions with pyrazinamide in concentrations of 600, 500, 400, 300, 200 and 100
μg/ml while levofloxacin was maintained at 100 μg/ml.
3.3.2.3 Preparation of buffers
The conditions for the separation were optimized by employing a 0.025 M
orthophosphoric acid buffer. In preparation of the buffer, 2 ml of orthophosphoric acid
(85%) was slowly added to about 230 ml of HPLC grade water, then altered to a final
volume of 1169 ml with the water. The pH was adjusted to 3.7 using triethylamine and
the pH was monitored using Model 744 Metrohm pH meter (Metrohm SA (Pty) Ltd,
Cape Town, South Africa).
3.3.2.4 Preparation of mobile phase
The mobile phase consisted of water, 0.025 M orthophosphoric acid buffer and ACN
in a ratio of 68:20:12, respectively. The water and buffer were filtered through 0.2 µm
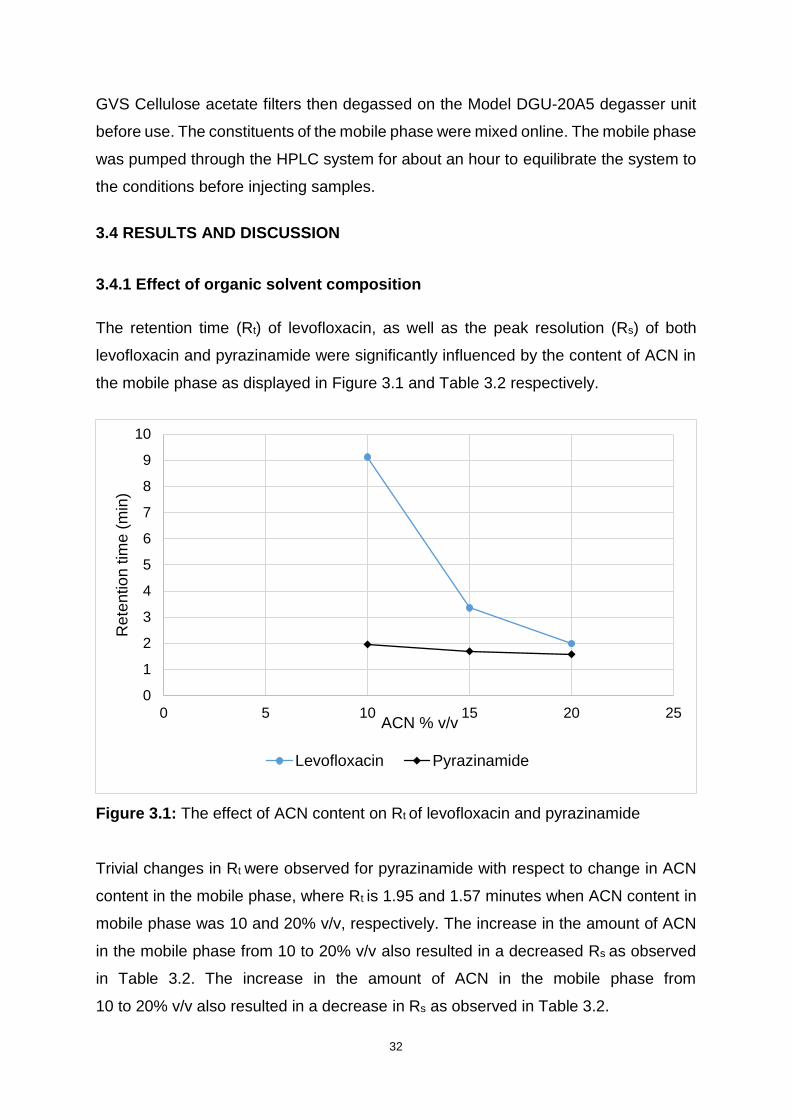
32
GVS Cellulose acetate filters then degassed on the Model DGU-20A5 degasser unit
before use. The constituents of the mobile phase were mixed online. The mobile phase
was pumped through the HPLC system for about an hour to equilibrate the system to
the conditions before injecting samples.
3.4 RESULTS AND DISCUSSION
3.4.1 Effect of organic solvent composition
The retention time (Rt) of levofloxacin, as well as the peak resolution (Rs) of both
levofloxacin and pyrazinamide were significantly influenced by the content of ACN in
the mobile phase as displayed in Figure 3.1 and Table 3.2 respectively.
Figure 3.1: The effect of ACN content on Rt of levofloxacin and pyrazinamide
Trivial changes in Rt were observed for pyrazinamide with respect to change in ACN
content in the mobile phase, where Rt is 1.95 and 1.57 minutes when ACN content in
mobile phase was 10 and 20% v/v, respectively. The increase in the amount of ACN
in the mobile phase from 10 to 20% v/v also resulted in a decreased Rs as observed
in Table 3.2. The increase in the amount of ACN in the mobile phase from
10 to 20% v/v also resulted in a decrease in Rs as observed in Table 3.2.
0
1
2
3
4
5
6
7
8
9
10
0 5 10 15 20 25
Rete
ntio
n tim
e (
min
)
ACN % v/v
Levofloxacin Pyrazinamide

33
The mobile phase containing12 % v/v ACN produced results with the most acceptable
Rt for both drug compounds, that is, 1.836 minutes for pyrazinamide and 5.751
minutes for levofloxacin, in addition to a good Rs of 7.9. Although the Rs delivered by
ACN content of 10% is the highest, at 9.11, the resultant peak tailing factor of
levofloxacin is above 2, therefore the mobile phase containing 10% ACN did not
produce fully acceptable chromatograph results (Figure 3.1 and Table 3.2).
Table 3.2: The effect of ACN content on Rs and Peak tailing factor of levofloxacin
ACN content (% v/v) Peak resolution (Rs) Peak tailing factor
10 9.11 3.82
12 7.90 1.26
15 2.43 1.57
20 1.13 1.62
3.4.2 Effect of buffer concentration
The Rt of solutes may be affected by buffer concentration in reverse-phase
chromatographic technique due to effects of interactions between the ionised acidic
residual silanols on the silica stationary phase support surface and the protonated
basic solutes (Snyder, et al., 1997c). Table 3.3 exhibits how pyrazinamide Rt is almost
constant through the changes of buffer concentration due to incomplete dissociation
of the compound. Similar results have been documented in a previous study (Thoithi,
et al., 2002). In contrast, the zwitterionic levofloxacin Rt increase with increase in buffer
molarity presumably due to non-hydrophobic interactions as well as silanophilic
interactions (Pistos, et al., 2005).
Manipulating buffer concentration may lead to improvement of peak shape and
symmetry because the cation of the buffer represses the ion exchange interactions
occurring between the ionised residual silanols on the silica stationary phase support
surface and the protonated base. Buffers of concentration in the range of
0.010 – 0.050 M are generally adequate for use in most reverse-phase HPLC and
seldom concentrations bigger than 0.100 M (LoBrutto, 2007). Using the buffer

34
concentration of 0.010 M resulted in an unacceptable tailing of the levofloxacin peak,
as shown in Table 3.4. Food and Drug Administration (1994) suggests that a peak
tailing factor of ≤ 2 is considered desirable for general HPLC quantitative analysis.
Table 3.3: The effect of buffer concentration on and retention time
Buffer Concentration (M) Retention time (min)
Levofloxacin Pyrazinamide
0.010 4.791 1.847
0.025 5.751 1.836
0.100 6.157 1.823
Table 3.4: The effect of buffer concentration on peak tailing
Buffer concentration (M) Peak tailing factor
Levofloxacin Pyrazinamide
0.010 3.61 1.10
0.025 1.46 1.06
0.100 1.13 1.04
3.4.3 Effect of buffer pH
Change in buffer pH had effect on Rt of levofloxacin and almost no effect on the Rt of
pyrazinamide as displayed in Table 3.5. Pyrazinamide is a weak acid with minor
interactions with the residual silanols of the silica stationary phase. Levofloxacin’s
retention is due to non-hydrophobic and silanophilic interactions (Pistos, et al., 2005;
LoBrutto, 2007).
Table 3.5: The effect of buffer pH on retention time
Buffer pH Retention time
Levofloxacin Pyrazinamide
1.7 4.884 1.828
3.7 5.751 1.836
6.7 10.530 1.832

35
When a high pH of 6.7 was used, analytical run time had to be increased beyond 10
minutes. This is shown in Table 3.4. At low pH of 1.7, there is coelution of pyrazinamide
and the solvent front that is detected as impurity at 1.63 minutes.
3.4.4 Effect of flow rate
Mobile phase flow rate through the column has a significant effect on the retention
time. A change in flow rate gives an opposite effect on the analytical run time, that is,
increasing the rate decreases the analytical run time as shown in Table 3.6. In general
terms, run time can be significantly reduced with no detrimental effect on column
efficiency and quality of separation. However, lower flow rates are preferred for their
lower flow resistance and lower backpressure (Kazekevich and LoBrutto, 2007). To
maintain a reasonable run time of 10 minutes and a good resolution, a rate of 1.0
ml/min was used.
Table 3.6: The effect of Flow rate on retention time
Flow rate (ml/min) Analytical run time (min)
Levofloxacin Pyrazinamide
0.5 11.166 3.622
1.0 5.751 1.836
1.5 3.835 1.229
2.0 2.899 0.931
3.4.5 Chromatographic conditions
Considering the conditions examined above, the following set of conditions were used
for successful simultaneous analysis of levofloxacin and pyrazinamide as displayed in
Figure 3.2 and outlined in Table 3.6.
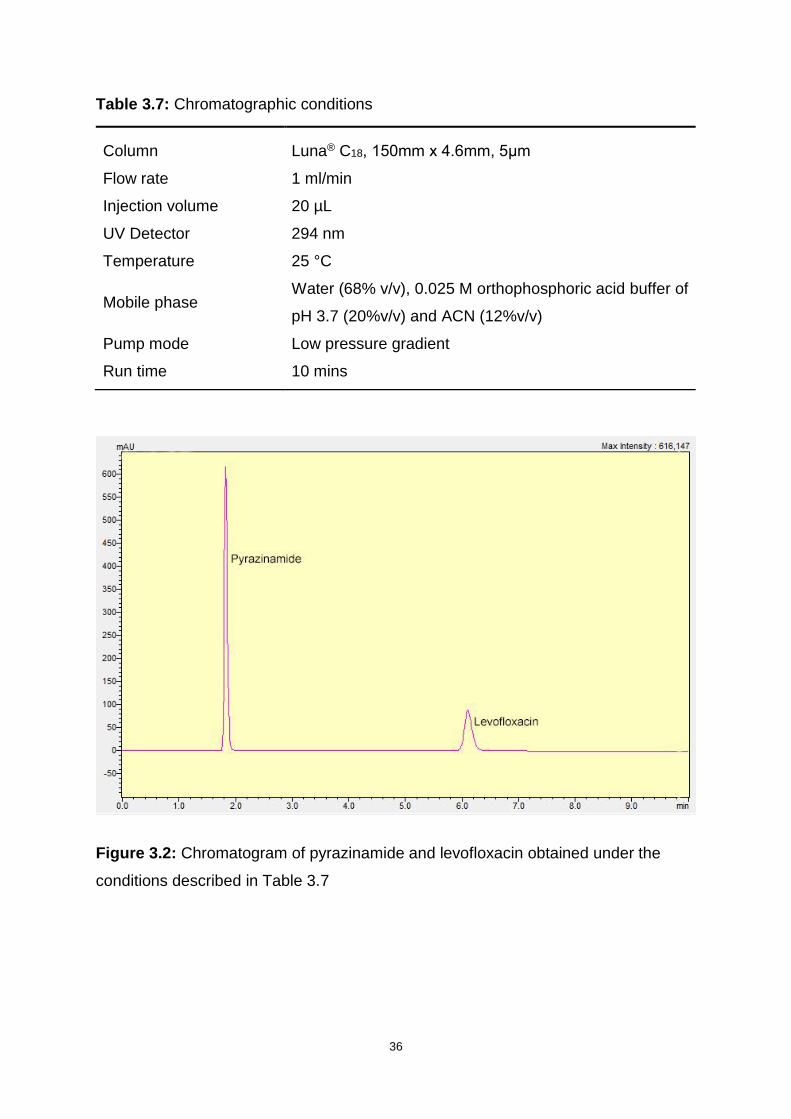
36
Table 3.7: Chromatographic conditions
Column Luna® C18, 150mm x 4.6mm, 5μm
Flow rate 1 ml/min
Injection volume 20 µL
UV Detector 294 nm
Temperature 25 °C
Mobile phase Water (68% v/v), 0.025 M orthophosphoric acid buffer of
pH 3.7 (20%v/v) and ACN (12%v/v)
Pump mode Low pressure gradient
Run time 10 mins
Figure 3.2: Chromatogram of pyrazinamide and levofloxacin obtained under the
conditions described in Table 3.7
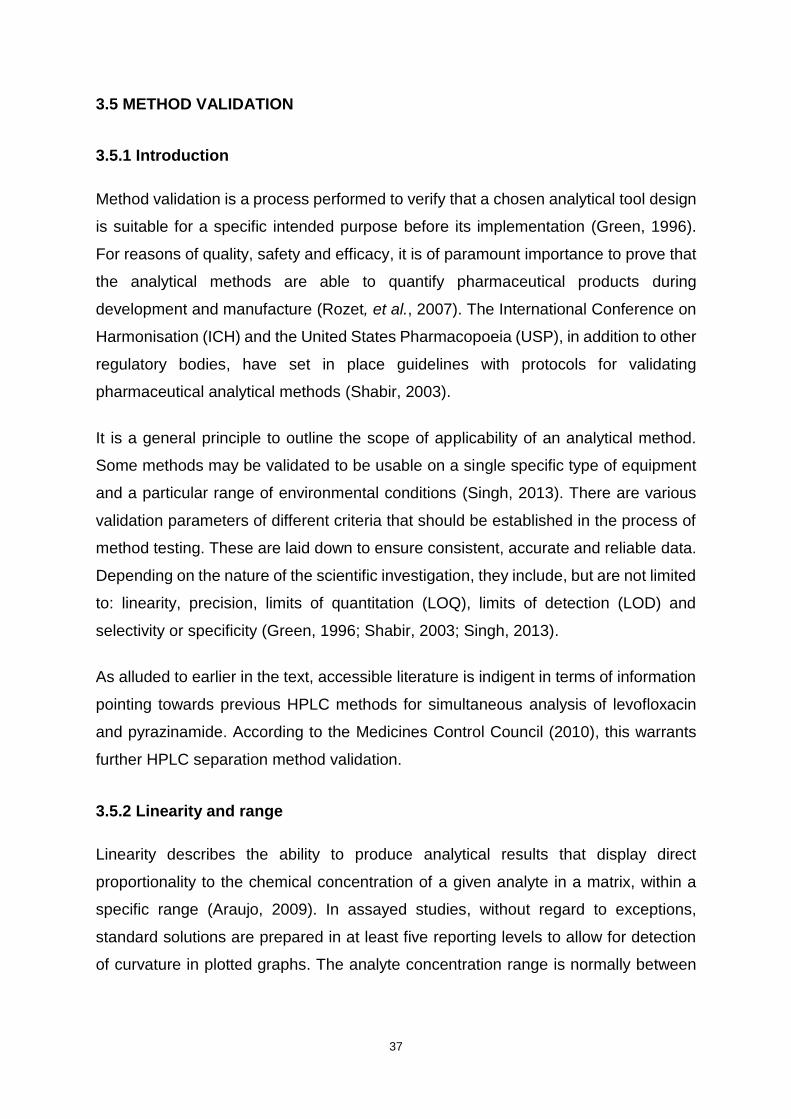
37
3.5 METHOD VALIDATION
3.5.1 Introduction
Method validation is a process performed to verify that a chosen analytical tool design
is suitable for a specific intended purpose before its implementation (Green, 1996).
For reasons of quality, safety and efficacy, it is of paramount importance to prove that
the analytical methods are able to quantify pharmaceutical products during
development and manufacture (Rozet, et al., 2007). The International Conference on
Harmonisation (ICH) and the United States Pharmacopoeia (USP), in addition to other
regulatory bodies, have set in place guidelines with protocols for validating
pharmaceutical analytical methods (Shabir, 2003).
It is a general principle to outline the scope of applicability of an analytical method.
Some methods may be validated to be usable on a single specific type of equipment
and a particular range of environmental conditions (Singh, 2013). There are various
validation parameters of different criteria that should be established in the process of
method testing. These are laid down to ensure consistent, accurate and reliable data.
Depending on the nature of the scientific investigation, they include, but are not limited
to: linearity, precision, limits of quantitation (LOQ), limits of detection (LOD) and
selectivity or specificity (Green, 1996; Shabir, 2003; Singh, 2013).
As alluded to earlier in the text, accessible literature is indigent in terms of information
pointing towards previous HPLC methods for simultaneous analysis of levofloxacin
and pyrazinamide. According to the Medicines Control Council (2010), this warrants
further HPLC separation method validation.
3.5.2 Linearity and range
Linearity describes the ability to produce analytical results that display direct
proportionality to the chemical concentration of a given analyte in a matrix, within a
specific range (Araujo, 2009). In assayed studies, without regard to exceptions,
standard solutions are prepared in at least five reporting levels to allow for detection
of curvature in plotted graphs. The analyte concentration range is normally between

38
50 and 150% of the target concentration (Green, 1996). In this study, the range was
between 25 and 150%.
As mentioned by Green (1996), it is common practice to examine the correlation
coefficient (R2) to qualify linearity of data, where R2 > 0.999 is regarded as sufficient
proof of an acceptable quality of fit for data presented by the regression line. Some
analytical validation sources further encourage the use of statistical methods in testing
for linearity (Analytical Methods Committee, 1988; Araujo, 2009; Miller and Miller,
2010).
The term range represents the lower and upper analyte concentration intervals within
which appropriate linearity, precision and accuracy are found. Accuracy and linearity
studies enable determination of the range (Green, 1996; Araujo, 2009). Linearity and
range for the analysis of levofloxacin and pyrazinamide were determined through
plotting the average peak area of the drugs against their concentrations of calibration
samples, as summarized in Table 3.8.
Table 3.8: The resultant mean-peak area as a function of concentration for
levofloxacin and pyrazinamide
Levofloxacin Pyrazinamide
Concentration (μg/ml)
(n=6)
Mean peak area
% RSD
Concentration (μg/ml)
(n=6)
Mean peak area
% RSD
50 131972 0.21 100 384439 0.03
100 270934 0.04 200 769677 0.14
150 232081 0.54 300 1116750 0.02
200 550056 0.40 400 1505460 0.09
250 701583 0.18 500 1843320 0.08
300 836290 0.99 600 2193510 0.02
The resultant calibration curves of levofloxacin (Figure 3.3) and pyrazinamide (Figure
3.4) showed the regression line equation and subsequent R2 values as follows:
Levofloxacin: y = 2 818x – 59 989 with R2 value of 0.999
Pyrazinamide: y = 3 615.7x + 36 693 with R2 value of 0.9996
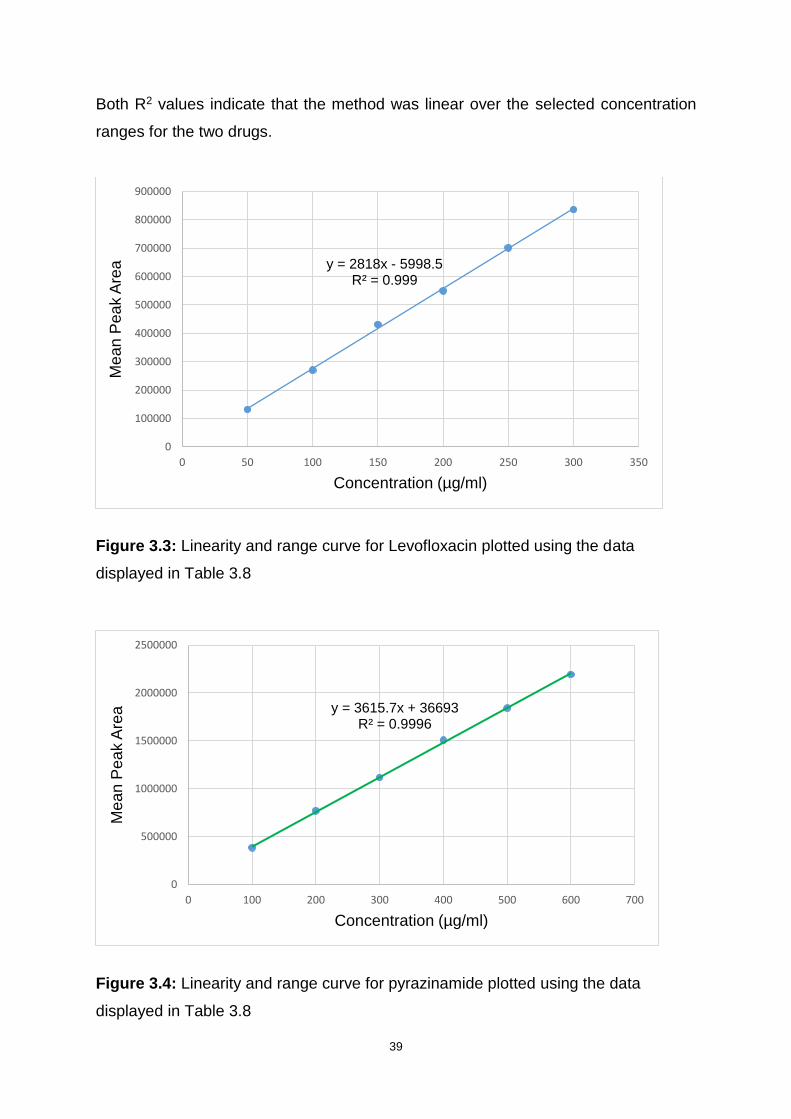
39
Both R2 values indicate that the method was linear over the selected concentration
ranges for the two drugs.
Figure 3.3: Linearity and range curve for Levofloxacin plotted using the data
displayed in Table 3.8
Figure 3.4: Linearity and range curve for pyrazinamide plotted using the data
displayed in Table 3.8
y = 2818x - 5998.5R² = 0.999
0
100000
200000
300000
400000
500000
600000
700000
800000
900000
0 50 100 150 200 250 300 350
Me
an
Pe
ak A
rea
Concentration (µg/ml)
y = 3615.7x + 36693R² = 0.9996
0
500000
1000000
1500000
2000000
2500000
0 100 200 300 400 500 600 700
Me
an
Pe
ak A
rea
Concentration (µg/ml)
40
3.5.3 Precision
The ISO International Vocabulary of Basic and General Terms in Metrology (ISO-VIM)
(2004) defines precision as the degree of agreement among individual quantity results
of replicate multiple tests of a quantity, under constant conditions. Rosing and
colleagues (2000) further elaborate that precision indicates the random error in terms
of the degree of scatter.
In 1995, a more concise definition was proposed by the ICH. Precision is categorised
into three levels, namely, repeatability, intermediate precision and reproducibility. The
precision of an analytical analysis is conventionally expressed numerically as
measurement of percent relative standard deviation (%RSD) for a significant number
of tests (International Organisation for Standardization, 2004). In this study, tolerance
limit for %RSD was set at < 5%.
3.5.3.1 Repeatability
Repeatability, also recognised as intra-assay precision, represents the outcomes of a
measurement procedure, employing the same measuring system over a short-time
interval under constant conditions carried out by the same analyst (Shabir, et al.,
2007). Repeatability should be determined using at least nine determinations that
cover the specified concentration range for the analysis. Normally, three replicates of
three concentration levels are acceptable. Alternatively, a minimum of six samples of
100% concentration may be determined (International Conference on Harmonisation,
1995; Snyder, et al., 1997b).
In assessing repeatability, triplicate injections and assessment of each sample of the
three concentration levels, 25, 75 and 150% were performed and they represented
low, medium and high concentrations. Three days were set aside for precision
parameter testing. The repeatability data for the predetermined calibration range was
generated on Day 1. The statistical representation of the information summarising
repeatability and intermediate precision data is shown in Table 3.9. The % RSD values
were below 5%. These calculations satisfy the limit set in our laboratory and therefore
demonstrate acceptable repeatability of the method.

41
Table 3.9: Data representing repeatability and intermediate precision for the
simultaneous analysis of levofloxacin and pyrazinamide
Levofloxacin Pyrazinamide
Day Concentration (μg/ml)
Mean peak area
% RSD
Concentration (μg/ml)
Mean peak area
% RSD
1
50 131972 0.21 100 384439 0.03
150 232081 0.54 300 1116750 0.02
300 836290 0.99 600 2193510 0.02
3
50 131821 0.60 100 385475 0.13
150 231962 0.18 300 1126852 0.14
300 839667 0.19 600 2184594 0.33
5
50 131412 0.32 100 386231 0.10
150 231827 0.11 300 1120654 0.07
300 836798 0.27 600 2200513 0.18
3.5.3.2 Intermediate precision
International Conference on Harmonisation (1995) in agreement with Snyder and
colleagues (1997b) interpret intermediate precision as the agreement of all performed
measurement results, standards included, where the method is utilised a number of
times in the same laboratory but on various days, non-identical equipment and
different analysts. Intermediate precision tests the reliability of the method when
employed under various conditions outside the initial environment where the method
was developed (Segall, et al., 2000).
Precision parameter testing were used to establish the intermediate precision of the
method on day 1, 3 and 5. The analysis was carried out using the three predetermined
samples of low, medium and high concentration levels in triplicate. The intermediate
precision data for analysis is exhibited in Table 3.9.
3.5.3.3 Reproducibility
Reproducibility of a method examines the analytical method precision when analysis
is run using the method in question, in different laboratories (Food and Drug
Administration, 2013). This type of precision is necessary when methodology
42
standardisation is required across laboratories, due to laboratory transfer, or in cases
where there are changes of software platforms, instrumentation, or critical reagents
(Liao, et al., 2006). In this study, however, analytical methodology standardisation
needed not be determined, since the same laboratory was utilised and the service of
the same equipment was employed by the same analyst throughout the duration of
the study.
3.5.4 Accuracy
Accuracy expresses the extent of how close the resultant measurement value is, in
relation to the accepted nominal or reference true value, under a set of specific
conditions (Shah, et al., 2000). Coupled with precision, accuracy plays an integral role
in determining the error of the analysis. In that effect, accuracy is one of the significant
criteria in analytical method evaluation (Rosing, et al., 2000).
There are numerous ways to ascertain accuracy. In one of their articles, Shabir (2003)
outline at least three techniques of assessing the criterion. The first suggested
pathway involves comparing test measurements with an alternative, existing, accurate
and well characterised approach. The second and third approaches, respectively, as
also stated by Rosing and colleagues (2000), encompass comparing measurements
of a sample of known concentration against the true reference value and spiking
measured amounts of analyte into blank matrices then calculating percent recovery.
In a manner conforming to the Food and Drug Administration recommendations,
accuracy studies data collection was done from nine determinations (Food and Drug
Administration, 1994). Analysis was run in triplicate on three concentration levels
(80%, 100% and 120%) of the target product concentration in the interest of covering
the required range of concentrations under investigation. Accuracy results were
displayed as % RSD and percent bias.
Bias refers to the average deviation of the determined value for the analyte under
scrutiny from the accepted true value and serves to express the systematic extent of
trueness in numerical values (Taverniers, et al., 2004; Johnson, 2008). The accuracy
test results had a 5% tolerance set for the % RSD while <5% was allowed for the %
bias. A summary of the assessment is shown in the following table (Table 3.10). The
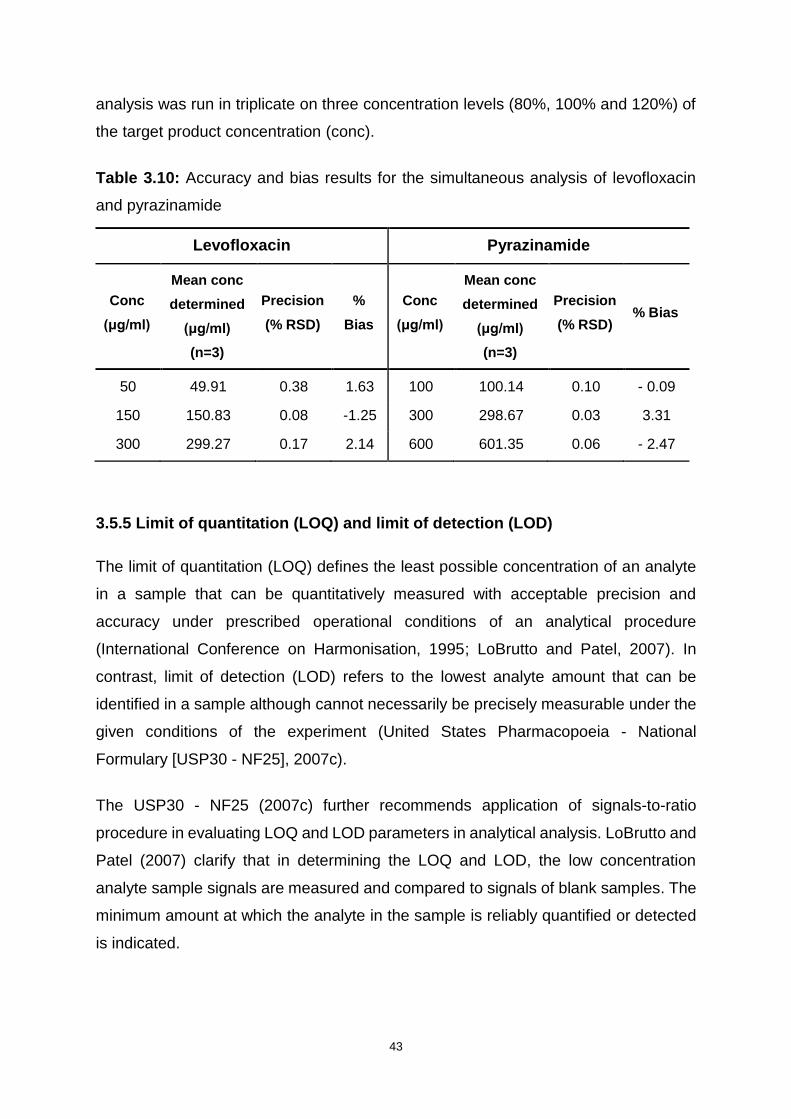
43
analysis was run in triplicate on three concentration levels (80%, 100% and 120%) of
the target product concentration (conc).
Table 3.10: Accuracy and bias results for the simultaneous analysis of levofloxacin
and pyrazinamide
Levofloxacin Pyrazinamide
Conc
(μg/ml)
Mean conc
determined
(μg/ml)
(n=3)
Precision
(% RSD)
%
Bias
Conc
(μg/ml)
Mean conc
determined
(μg/ml)
(n=3)
Precision
(% RSD) % Bias
50 49.91 0.38 1.63 100 100.14 0.10 - 0.09
150 150.83 0.08 -1.25 300 298.67 0.03 3.31
300 299.27 0.17 2.14 600 601.35 0.06 - 2.47
3.5.5 Limit of quantitation (LOQ) and limit of detection (LOD)
The limit of quantitation (LOQ) defines the least possible concentration of an analyte
in a sample that can be quantitatively measured with acceptable precision and
accuracy under prescribed operational conditions of an analytical procedure
(International Conference on Harmonisation, 1995; LoBrutto and Patel, 2007). In
contrast, limit of detection (LOD) refers to the lowest analyte amount that can be
identified in a sample although cannot necessarily be precisely measurable under the
given conditions of the experiment (United States Pharmacopoeia - National
Formulary [USP30 - NF25], 2007c).
The USP30 - NF25 (2007c) further recommends application of signals-to-ratio
procedure in evaluating LOQ and LOD parameters in analytical analysis. LoBrutto and
Patel (2007) clarify that in determining the LOQ and LOD, the low concentration
analyte sample signals are measured and compared to signals of blank samples. The
minimum amount at which the analyte in the sample is reliably quantified or detected
is indicated.
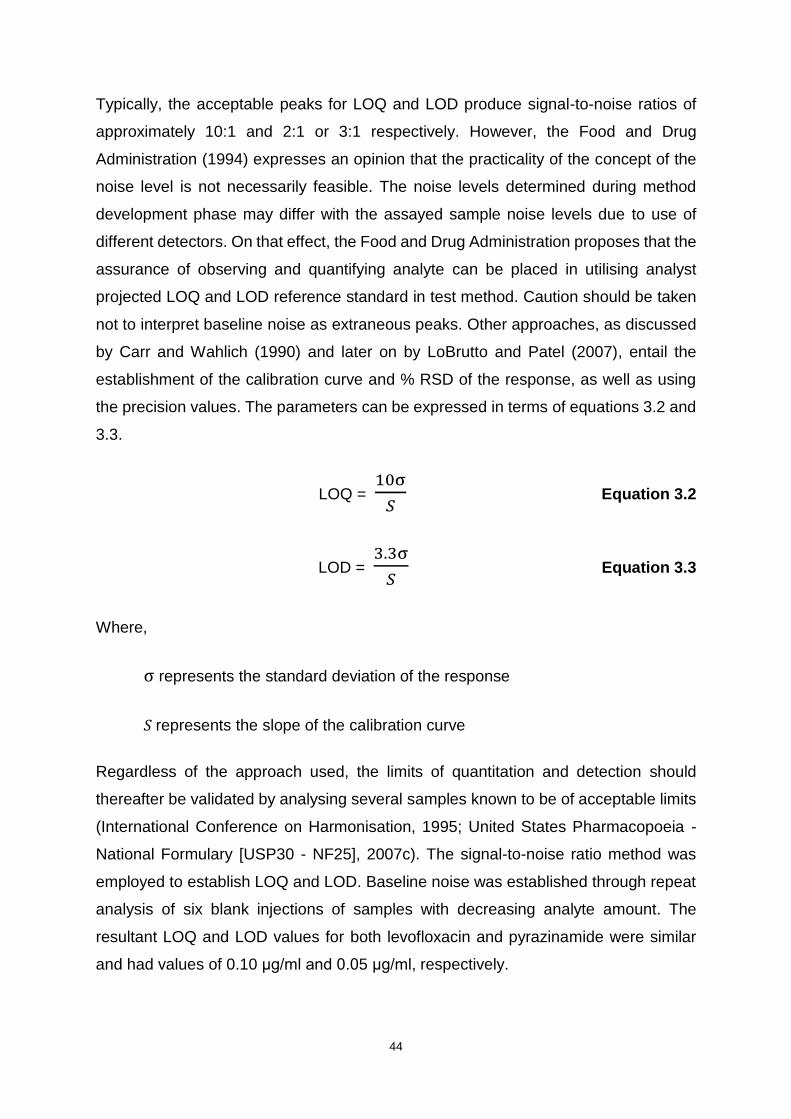
44
Typically, the acceptable peaks for LOQ and LOD produce signal-to-noise ratios of
approximately 10:1 and 2:1 or 3:1 respectively. However, the Food and Drug
Administration (1994) expresses an opinion that the practicality of the concept of the
noise level is not necessarily feasible. The noise levels determined during method
development phase may differ with the assayed sample noise levels due to use of
different detectors. On that effect, the Food and Drug Administration proposes that the
assurance of observing and quantifying analyte can be placed in utilising analyst
projected LOQ and LOD reference standard in test method. Caution should be taken
not to interpret baseline noise as extraneous peaks. Other approaches, as discussed
by Carr and Wahlich (1990) and later on by LoBrutto and Patel (2007), entail the
establishment of the calibration curve and % RSD of the response, as well as using
the precision values. The parameters can be expressed in terms of equations 3.2 and
3.3.
LOQ = 10σ
𝑆 Equation 3.2
LOD = 3.3σ
𝑆 Equation 3.3
Where,
σ represents the standard deviation of the response
S represents the slope of the calibration curve
Regardless of the approach used, the limits of quantitation and detection should
thereafter be validated by analysing several samples known to be of acceptable limits
(International Conference on Harmonisation, 1995; United States Pharmacopoeia -
National Formulary [USP30 - NF25], 2007c). The signal-to-noise ratio method was
employed to establish LOQ and LOD. Baseline noise was established through repeat
analysis of six blank injections of samples with decreasing analyte amount. The
resultant LOQ and LOD values for both levofloxacin and pyrazinamide were similar
and had values of 0.10 μg/ml and 0.05 μg/ml, respectively.
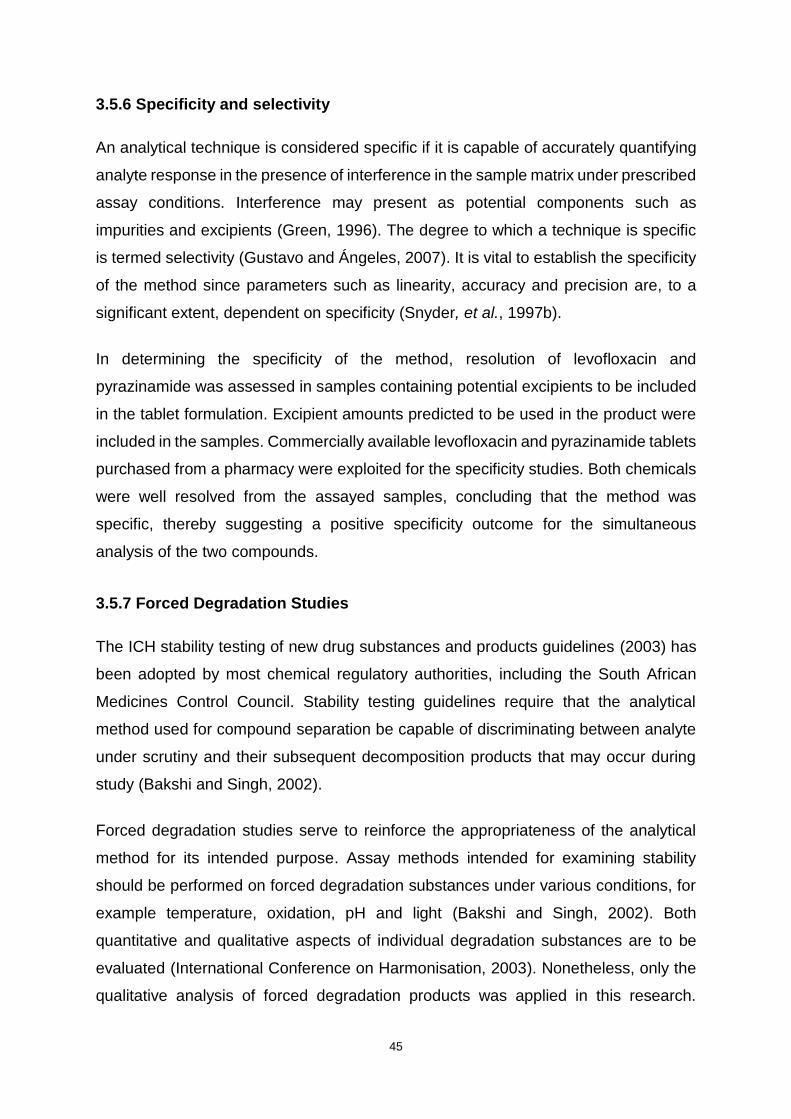
45
3.5.6 Specificity and selectivity
An analytical technique is considered specific if it is capable of accurately quantifying
analyte response in the presence of interference in the sample matrix under prescribed
assay conditions. Interference may present as potential components such as
impurities and excipients (Green, 1996). The degree to which a technique is specific
is termed selectivity (Gustavo and Ángeles, 2007). It is vital to establish the specificity
of the method since parameters such as linearity, accuracy and precision are, to a
significant extent, dependent on specificity (Snyder, et al., 1997b).
In determining the specificity of the method, resolution of levofloxacin and
pyrazinamide was assessed in samples containing potential excipients to be included
in the tablet formulation. Excipient amounts predicted to be used in the product were
included in the samples. Commercially available levofloxacin and pyrazinamide tablets
purchased from a pharmacy were exploited for the specificity studies. Both chemicals
were well resolved from the assayed samples, concluding that the method was
specific, thereby suggesting a positive specificity outcome for the simultaneous
analysis of the two compounds.
3.5.7 Forced Degradation Studies
The ICH stability testing of new drug substances and products guidelines (2003) has
been adopted by most chemical regulatory authorities, including the South African
Medicines Control Council. Stability testing guidelines require that the analytical
method used for compound separation be capable of discriminating between analyte
under scrutiny and their subsequent decomposition products that may occur during
study (Bakshi and Singh, 2002).
Forced degradation studies serve to reinforce the appropriateness of the analytical
method for its intended purpose. Assay methods intended for examining stability
should be performed on forced degradation substances under various conditions, for
example temperature, oxidation, pH and light (Bakshi and Singh, 2002). Both
quantitative and qualitative aspects of individual degradation substances are to be
evaluated (International Conference on Harmonisation, 2003). Nonetheless, only the
qualitative analysis of forced degradation products was applied in this research.
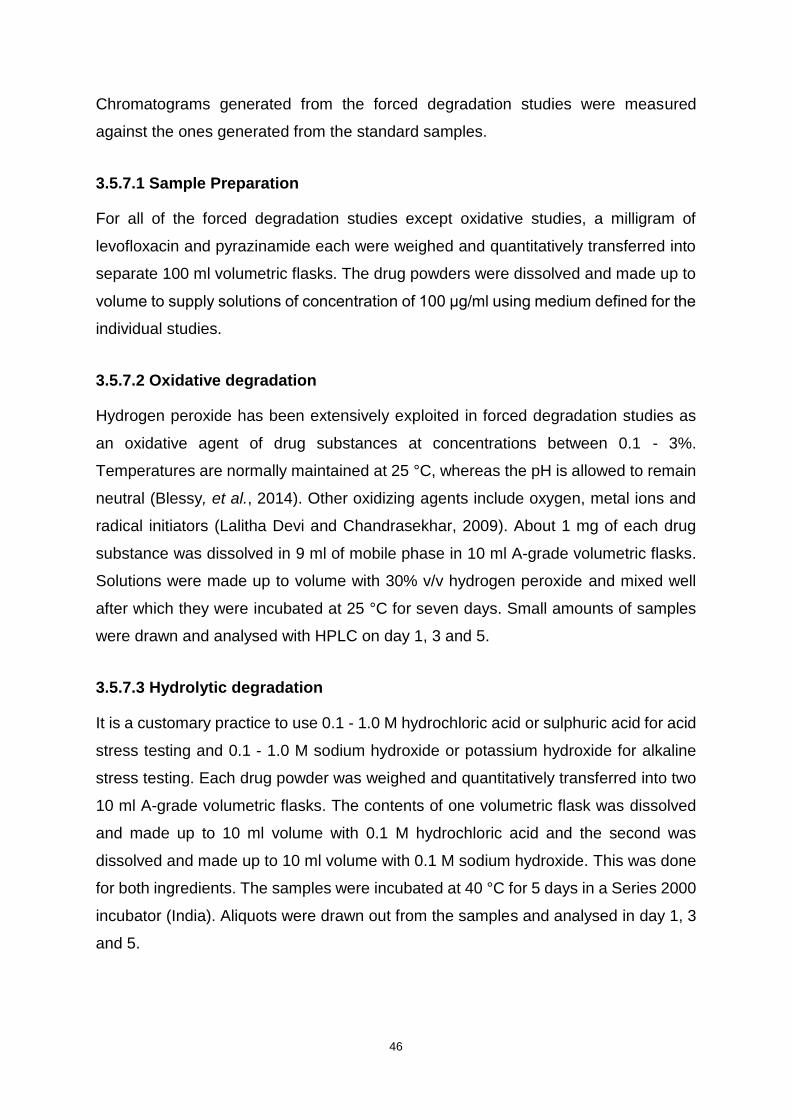
46
Chromatograms generated from the forced degradation studies were measured
against the ones generated from the standard samples.
3.5.7.1 Sample Preparation
For all of the forced degradation studies except oxidative studies, a milligram of
levofloxacin and pyrazinamide each were weighed and quantitatively transferred into
separate 100 ml volumetric flasks. The drug powders were dissolved and made up to
volume to supply solutions of concentration of 100 μg/ml using medium defined for the
individual studies.
3.5.7.2 Oxidative degradation
Hydrogen peroxide has been extensively exploited in forced degradation studies as
an oxidative agent of drug substances at concentrations between 0.1 - 3%.
Temperatures are normally maintained at 25 °C, whereas the pH is allowed to remain
neutral (Blessy, et al., 2014). Other oxidizing agents include oxygen, metal ions and
radical initiators (Lalitha Devi and Chandrasekhar, 2009). About 1 mg of each drug
substance was dissolved in 9 ml of mobile phase in 10 ml A-grade volumetric flasks.
Solutions were made up to volume with 30% v/v hydrogen peroxide and mixed well
after which they were incubated at 25 °C for seven days. Small amounts of samples
were drawn and analysed with HPLC on day 1, 3 and 5.
3.5.7.3 Hydrolytic degradation
It is a customary practice to use 0.1 - 1.0 M hydrochloric acid or sulphuric acid for acid
stress testing and 0.1 - 1.0 M sodium hydroxide or potassium hydroxide for alkaline
stress testing. Each drug powder was weighed and quantitatively transferred into two
10 ml A-grade volumetric flasks. The contents of one volumetric flask was dissolved
and made up to 10 ml volume with 0.1 M hydrochloric acid and the second was
dissolved and made up to 10 ml volume with 0.1 M sodium hydroxide. This was done
for both ingredients. The samples were incubated at 40 °C for 5 days in a Series 2000
incubator (India). Aliquots were drawn out from the samples and analysed in day 1, 3
and 5.
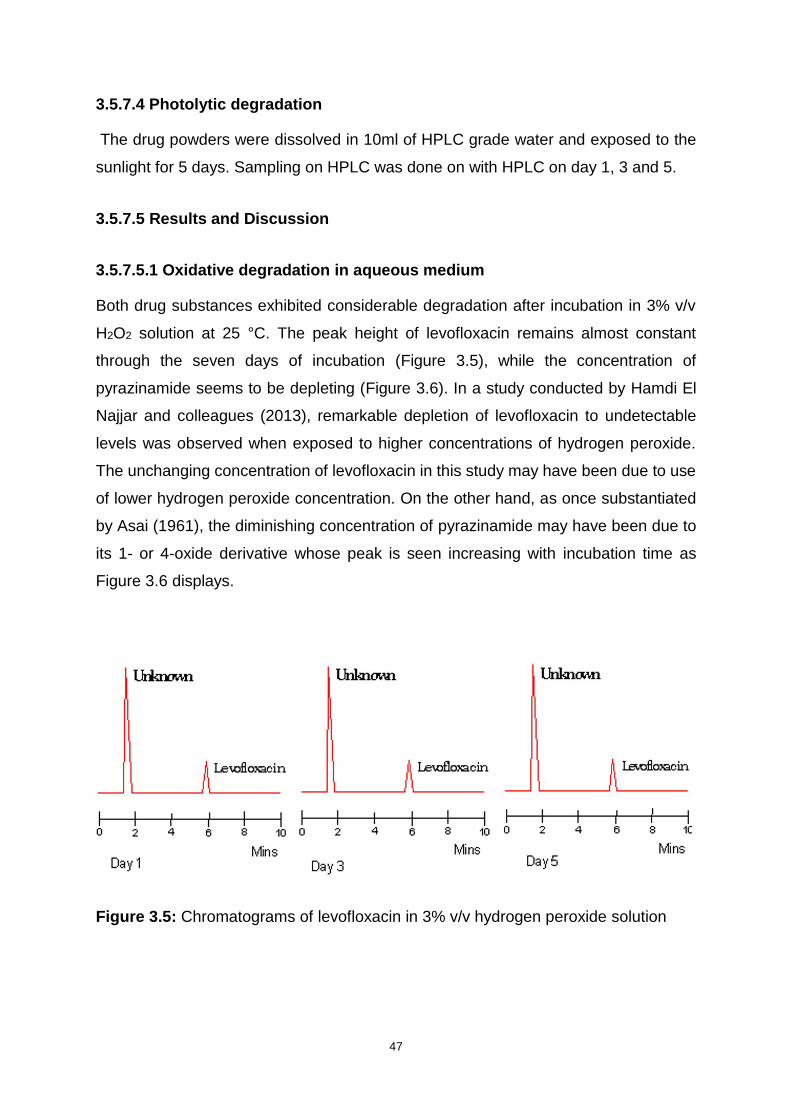
47
3.5.7.4 Photolytic degradation
The drug powders were dissolved in 10ml of HPLC grade water and exposed to the
sunlight for 5 days. Sampling on HPLC was done on with HPLC on day 1, 3 and 5.
3.5.7.5 Results and Discussion
3.5.7.5.1 Oxidative degradation in aqueous medium
Both drug substances exhibited considerable degradation after incubation in 3% v/v
H2O2 solution at 25 °C. The peak height of levofloxacin remains almost constant
through the seven days of incubation (Figure 3.5), while the concentration of
pyrazinamide seems to be depleting (Figure 3.6). In a study conducted by Hamdi El
Najjar and colleagues (2013), remarkable depletion of levofloxacin to undetectable
levels was observed when exposed to higher concentrations of hydrogen peroxide.
The unchanging concentration of levofloxacin in this study may have been due to use
of lower hydrogen peroxide concentration. On the other hand, as once substantiated
by Asai (1961), the diminishing concentration of pyrazinamide may have been due to
its 1- or 4-oxide derivative whose peak is seen increasing with incubation time as
Figure 3.6 displays.
Figure 3.5: Chromatograms of levofloxacin in 3% v/v hydrogen peroxide solution

48
Figure 3.6: Chromatograms of pyrazinamide in 3% v/v hydrogen peroxide solution
3.5.7.5.2 Acid degradation and alkali degradation
Results of analyses performed following forced hydrolysis of the drug substances by
0.1 M hydrochloric acid and 0.1 M sodium hydroxide are displayed in Figures 3.7 -
3.10. Observations conducted after exposure of levofloxacin to acidic conditions unveil
by-products of levofloxacin that appear as two peaks between 1.8 and 2 minutes
(Figure 3.7). The peak heights of the by-products decrease with length of exposure
time. Different observations following treatment of levofloxacin using 0.1 M
hydrochloric acid and 0.1 M sodium hydroxide have been reported, where levofloxacin
was concluded to be stable under these conditions (Gul, et al., 2015).
An impurity peak is observed at 6 minutes in the analysis of pyrazinamide in
hydrochloric acid chromatogram (Figure 3.8). The peak height increases with the
number of days, probably due to the increase in the presence of a product of
hydrolysis. As noted earlier in the report, converting pyrazinamide compound into a
pharmacologically active form involves its hydrolysis in an acidic medium. A bacterial
enzyme known as pyrazinamide amidohydrolase catalyses the hydrolysis of
pyrazinamide into pyrazinoic acid and ammonium (Zhang, et al., 2003). Remarkable
stability is observed during the five-day exposure of pyrazinamide to 0.1 M sodium
hydroxide solution (Figure 3.10), as no unknown compounds are detected in the 10-
minute analysis of the sample.
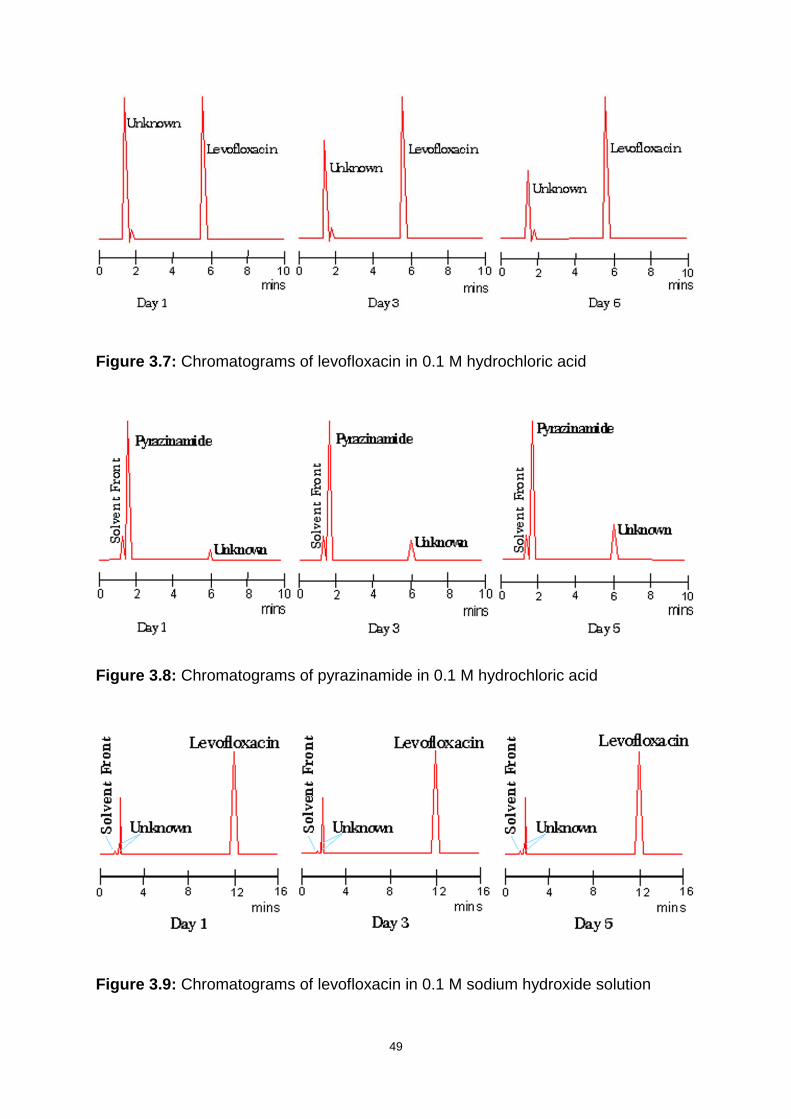
49
Figure 3.7: Chromatograms of levofloxacin in 0.1 M hydrochloric acid
Figure 3.8: Chromatograms of pyrazinamide in 0.1 M hydrochloric acid
Figure 3.9: Chromatograms of levofloxacin in 0.1 M sodium hydroxide solution

50
Figure 3.10: Chromatograms of pyrazinamide in 0.1 M sodium hydroxide solution
3.5.7.5.4 Photo degradation in aqueous medium
Analysis of levofloxacin in water after exposure to sunlight showed four distinct
degradation products (Figure 3.11). In another study performed to determine
photodegradation products of levofloxacin in aqueous solutions using near ultraviolet
light, it was discovered that nine decomposition products of levofloxacin were
produced (Yoshida, et al., 1993). In contrast, no decomposition products were isolated
during the analysis of pyrazinamide that was treated with similar conditions. This
confirms the statement that pyrazinamide is stable when exposed to natural daylight
(Felder and Pitre, 1983).
Figure 3.11: Chromatograms of levofloxacin in water after exposure to sunlight
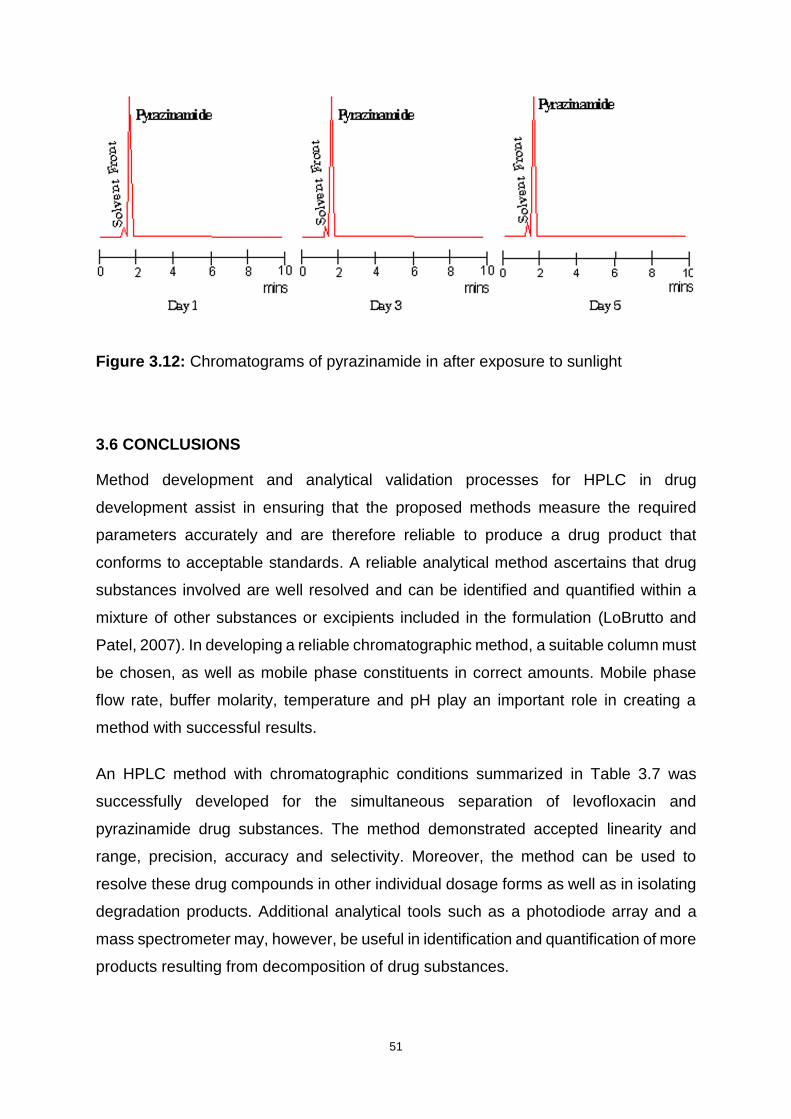
51
Figure 3.12: Chromatograms of pyrazinamide in after exposure to sunlight
3.6 CONCLUSIONS
Method development and analytical validation processes for HPLC in drug
development assist in ensuring that the proposed methods measure the required
parameters accurately and are therefore reliable to produce a drug product that
conforms to acceptable standards. A reliable analytical method ascertains that drug
substances involved are well resolved and can be identified and quantified within a
mixture of other substances or excipients included in the formulation (LoBrutto and
Patel, 2007). In developing a reliable chromatographic method, a suitable column must
be chosen, as well as mobile phase constituents in correct amounts. Mobile phase
flow rate, buffer molarity, temperature and pH play an important role in creating a
method with successful results.
An HPLC method with chromatographic conditions summarized in Table 3.7 was
successfully developed for the simultaneous separation of levofloxacin and
pyrazinamide drug substances. The method demonstrated accepted linearity and
range, precision, accuracy and selectivity. Moreover, the method can be used to
resolve these drug compounds in other individual dosage forms as well as in isolating
degradation products. Additional analytical tools such as a photodiode array and a
mass spectrometer may, however, be useful in identification and quantification of more
products resulting from decomposition of drug substances.
52
CHAPTER FOUR
PREFORMULATION AND POWDER ASSESSMENT
4.1 INTRODUCTION
A pharmaceutical dosage form consists of API(s) and different excipients that help
warrant efficient drug delivery to the respective biological target, in addition to
facilitating the drug fabrication process. Prior to selecting the final ingredients of a
dosage form, the compounds undergo a phase known as preformulation. This stage
was aptly described by Akers (1976) as test activities imposed on a new drug
compound to fashion beneficial facts for development of a drug dosage form that is
stable and displays optimum bioavailability. Furthermore, Lau (2001) in agreement
with Vilegave and associates (2013) have clarified preformulation testing as
characterisation of the physicochemical properties of the drug compound(s) for the
subsequent formulation process. The aim is to produce ideal conditions for
manufacturing the dosage form.
Since the 1950s, preformulation studies have proven useful in minimising
experimental errors in drug product development (Vilegave, et al., 2013). As an
exhortation to pharmaceutical scientists and a conclusion to a book on the same
matter, Wells (1988) emphasises that preformulation studies erect foundations which
predestine the drug manufacturing process for favourable outcomes. Myriads of
possible tests can be executed as part of preformulation analysis. Due to the diverse
nature of tests encompassing preformulation activity, the investigation has taken a
multidisciplinary study form that involves different branches of expertise. It should thus
be regarded as paramount by all involved parties (Lau, 2001).
Preformulation studies can be performed on different scales. The scope is contingent
on the nature of drug substance, the formulation scientist’s expertise and preference
as well as the availability of resources. Some of the drug compound properties that
can be examined include, amongst others, salt formation, pH-dependent solubility
profile, dissociation constant (pKa), polymorphism or crystallinity and particle size
(Steele, 2004; Allen and Ansel, 2014).
There is a wide range of commercially available excipients to choose from in
formulating a pharmaceutical dosage form. The excipients to be included in the
53
formulation are picked based on their compatibility with the API and their integral role
in the dosage form to be created (Chaurasia, 2016). If accomplished effectively,
preformulation studies establish compatibility properties of all the ingredients involved
in the drug development process (Vilegave, et al., 2013).
4.1.1 Physiochemical properties
4.1.1.1 Particle size and shape
The particle size of the API and other powders in the formulation has an impact on the
physical activity of the dosage form, subsequently influencing the performance of the
final drug product, including content uniformity, bioavailability and dissolution
(Staniforth and Taylor, 2013). Moreover, both API and excipient particle size have
effects on the manufacturing process with regards to blend uniformity and powder
flowability. These factors ultimately have consequences on medicine quality, safety
and efficacy (Gaisford, 2013).
In pharmaceutical solid dosage form development, improving the efficiency of the
physical properties of ingredient powder flowability is of critical significance. Powder
flow properties affect drug product manufacturing processes such as tablet
compressibility, granulation, blending, powder density and conveyance (Sarraguça, et
al., 2010). Both the particle size and shape attributes are pivotal in characterisation of
powder flowability (Guo, et al., 1985; Yu, et al., 2011). Expressions which qualitatively
define particle shapes have been coined and adopted into the pharmaceutical
industry. The shapes comprise of fibrous, spherical, crystalline and flaky categories
(Prasad and Wan, 1987; Abdullah and Geldart, 1999).
It has been observed that, generally, more spherical particles contribute to better
powder flow properties and hence, blend homogeneity compared to irregularly shaped
particles. The more spherical the particles, the less weight variance is shown in tablets
during compression (Gaisford, 2013). However, uniformity is not entirely a function of
particle shape, as size, density and morphology factors reportedly have equally
significant effects. It has been documented that achieving blend homogeneity during
formulation of low dose drugs can prove to be a daunting task owing to challenges
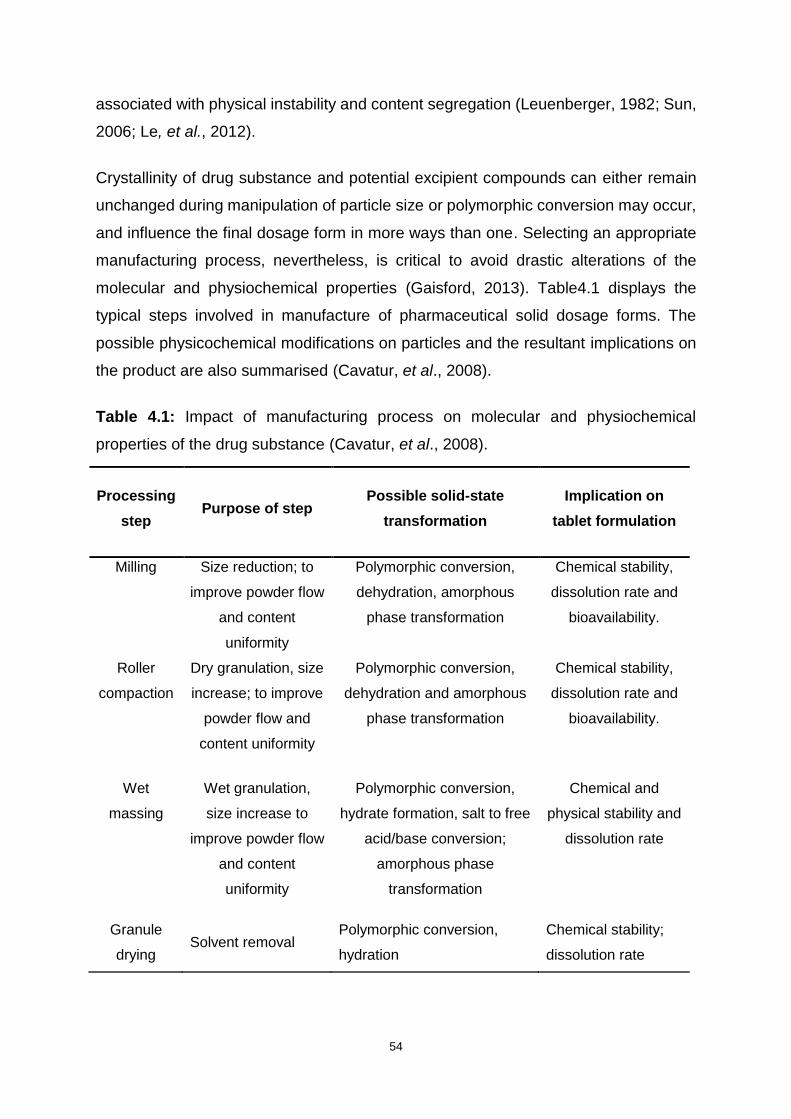
54
associated with physical instability and content segregation (Leuenberger, 1982; Sun,
2006; Le, et al., 2012).
Crystallinity of drug substance and potential excipient compounds can either remain
unchanged during manipulation of particle size or polymorphic conversion may occur,
and influence the final dosage form in more ways than one. Selecting an appropriate
manufacturing process, nevertheless, is critical to avoid drastic alterations of the
molecular and physiochemical properties (Gaisford, 2013). Table4.1 displays the
typical steps involved in manufacture of pharmaceutical solid dosage forms. The
possible physicochemical modifications on particles and the resultant implications on
the product are also summarised (Cavatur, et al., 2008).
Table 4.1: Impact of manufacturing process on molecular and physiochemical
properties of the drug substance (Cavatur, et al., 2008).
Processing
step Purpose of step
Possible solid-state
transformation
Implication on
tablet formulation
Milling Size reduction; to
improve powder flow
and content
uniformity
Polymorphic conversion,
dehydration, amorphous
phase transformation
Chemical stability,
dissolution rate and
bioavailability.
Roller
compaction
Dry granulation, size
increase; to improve
powder flow and
content uniformity
Polymorphic conversion,
dehydration and amorphous
phase transformation
Chemical stability,
dissolution rate and
bioavailability.
Wet
massing
Wet granulation,
size increase to
improve powder flow
and content
uniformity
Polymorphic conversion,
hydrate formation, salt to free
acid/base conversion;
amorphous phase
transformation
Chemical and
physical stability and
dissolution rate
Granule
drying Solvent removal
Polymorphic conversion,
hydration
Chemical stability;
dissolution rate
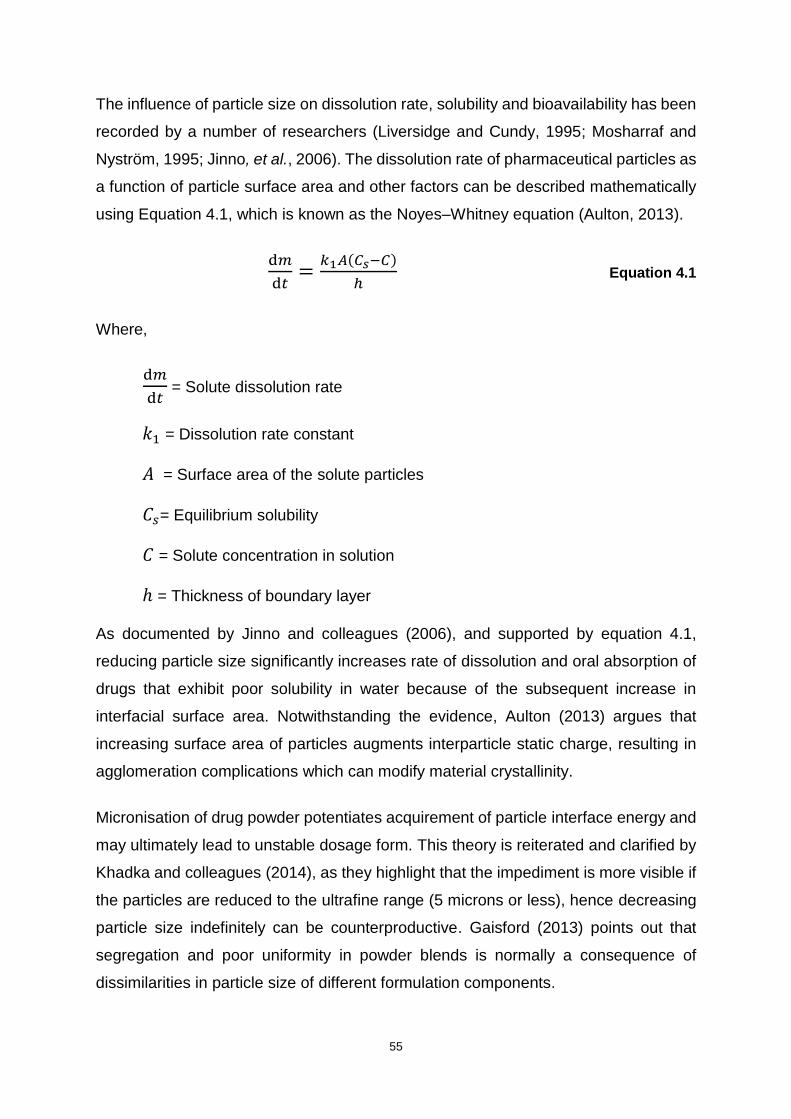
55
The influence of particle size on dissolution rate, solubility and bioavailability has been
recorded by a number of researchers (Liversidge and Cundy, 1995; Mosharraf and
Nyström, 1995; Jinno, et al., 2006). The dissolution rate of pharmaceutical particles as
a function of particle surface area and other factors can be described mathematically
using Equation 4.1, which is known as the Noyes–Whitney equation (Aulton, 2013).
ⅆ𝑚
ⅆ𝑡=
𝑘1𝐴(𝐶𝑠−𝐶)
ℎ Equation 4.1
Where,
ⅆ𝑚
ⅆ𝑡 = Solute dissolution rate
𝑘1 = Dissolution rate constant
𝐴 = Surface area of the solute particles
𝐶𝑠= Equilibrium solubility
𝐶 = Solute concentration in solution
ℎ = Thickness of boundary layer
As documented by Jinno and colleagues (2006), and supported by equation 4.1,
reducing particle size significantly increases rate of dissolution and oral absorption of
drugs that exhibit poor solubility in water because of the subsequent increase in
interfacial surface area. Notwithstanding the evidence, Aulton (2013) argues that
increasing surface area of particles augments interparticle static charge, resulting in
agglomeration complications which can modify material crystallinity.
Micronisation of drug powder potentiates acquirement of particle interface energy and
may ultimately lead to unstable dosage form. This theory is reiterated and clarified by
Khadka and colleagues (2014), as they highlight that the impediment is more visible if
the particles are reduced to the ultrafine range (5 microns or less), hence decreasing
particle size indefinitely can be counterproductive. Gaisford (2013) points out that
segregation and poor uniformity in powder blends is normally a consequence of
dissimilarities in particle size of different formulation components.

56
4.1.1.2 Powder density
Individual drug(s) and excipient component densities may have a sizeable impact on
the overall powder blend behavioural characteristics during the formulation process.
In a study conducted by Murakami and colleagues (2001), densities of individual
materials were found to have a close relationship with flowability, compressibility and
compatibility of the powder blend. During powder characterisation in the development
of solid dosage forms, powdered drug substances and excipients are commonly
characterised based on their true, bulk and tapped densities (Hancock, et al., 2003).
4.1.1.2.1 True density
The true density of a matter, also known as absolute density, is defined as the average
mass per unit volume of the solid substance, completely disregarding all pores and
voids that do not compose the fundamental part of the molecular packing (Amidon, et
al., 2009; Ma and Hadzija, 2013). In solid dosage form development, the true density
parameter occupies a significant role. It has been used in the evaluation of porosity
and mechanical behaviour (Sun, 2005; Deepika, et al., 2013) as well as powder
fluidization aspects of pharmaceutical powders (Hancock, et al., 2006).
Various systems that are suitable for distinct types of substances are employed in
calculating true density for materials. All the methods may present with their own
relative beneficial factors, challenges and limitations (Cao, et al., 2008). However, gas
pycnometry is the most commonly used method to measure true density when a small
amount of material is used. The technique is reliable, non-destructive and simple to
reproduce (Amidon, et al., 2009). Conversely, gas pycnometry has its flaws when
employed in systems that comprise loosely packed solvents where gas may adsorb
onto powder or when the channel hydrates with volatile contaminants. In such cases,
measurement errors may be introduced (Sun, 2004; Amidon, et al., 2009). The true
density, 𝜌, can be expressed numerically using Equation 4.2.
𝜌 =𝜔
𝑉𝑝 Equation 4.2
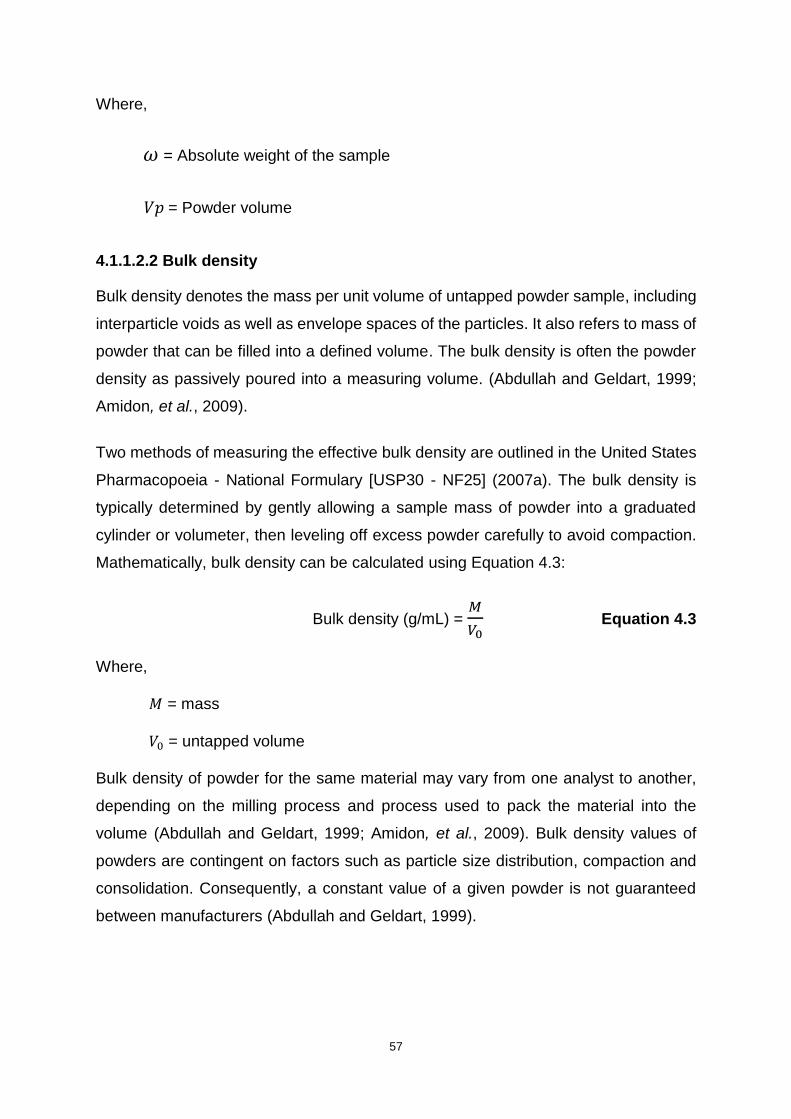
57
Where,
𝜔 = Absolute weight of the sample
𝑉𝑝 = Powder volume
4.1.1.2.2 Bulk density
Bulk density denotes the mass per unit volume of untapped powder sample, including
interparticle voids as well as envelope spaces of the particles. It also refers to mass of
powder that can be filled into a defined volume. The bulk density is often the powder
density as passively poured into a measuring volume. (Abdullah and Geldart, 1999;
Amidon, et al., 2009).
Two methods of measuring the effective bulk density are outlined in the United States
Pharmacopoeia - National Formulary [USP30 - NF25] (2007a). The bulk density is
typically determined by gently allowing a sample mass of powder into a graduated
cylinder or volumeter, then leveling off excess powder carefully to avoid compaction.
Mathematically, bulk density can be calculated using Equation 4.3:
Bulk density (g/mL) = 𝑀
𝑉0 Equation 4.3
Where,
𝑀 = mass
𝑉0 = untapped volume
Bulk density of powder for the same material may vary from one analyst to another,
depending on the milling process and process used to pack the material into the
volume (Abdullah and Geldart, 1999; Amidon, et al., 2009). Bulk density values of
powders are contingent on factors such as particle size distribution, compaction and
consolidation. Consequently, a constant value of a given powder is not guaranteed
between manufacturers (Abdullah and Geldart, 1999).

58
4.1.1.2.3 Tapped density
Tapped density is the ratio of mass to volume of a powder sample after the vessel in
which the powder is contained has been mechanically tapped for a defined time period
at a constant velocity (United States Pharmacopoeia - National Formulary [USP30 -
NF25], 2007a; Aulton, 2009). The tapped density values show the random dense
packing of a powder once it has consolidated. They are, in general, numerically lower
for particles of irregular shape such as flakes in contrast to regularly shaped particles
such as spherical particles (Aulton, 2009). Equation 4.4 shows how tapped density
can be calculated:
Bulk density (g/mL) = 𝑀
𝑉𝑓 Equation 4.4
Where,
𝑀 = mass
𝑉𝑓 = final tapped volume
The forces that exist among particles of powder have an impact on both the bulking
and flow properties of the powder (United States Pharmacopoeia - National Formulary
[USP30 - NF25], 2007a). The World Health Organisation (2012) points out that
comparing the bulk and tapped powder densities gives an accurate measure of
interactions for a specific powder. Such quantification is expressed as an indication of
powder flowability, for example, the Carr’s index (compressibility index) and the
Hausner ratio.
Carr’s index is the percentage compressibility of a powder and represents a direct
measure of the possible arch or bridge strength of the powder. Hausner ratio, on the
other hand, is associated with interparticulate interaction and is expressed as the ratio
of the tapped density to the bulk density (Aulton, 2009). Equations 4.5 and 4.6 express
the mathematical calculations of the Carr’s index and Hausner ratio respectively:
Carr’s Index = Tapped Density – Bulk Density
Bulk Density x 100 Equation 4.5
Hausner ratio = Tapped Density
Bulk Density Equation 4.6

59
The interpretations of Carr’s index and the Hausner ratio values are displayed in Table
4.2.
Table 4.2: Powder flowability in relationship to Carr’s index and Hausner ratio
Powder flowability Carr’s index Hausner ratio
Excellent ≤10 1.00–1.11
Good 11–15 1.12–1.18
Fair 16–20 1.19–1.25
Passable 21–25 1.26–1.34
Poor 26–31 1.35–1.45
Very 32–37 1.46–1.59
Very, very poor >38 >1.60
4.1.2 Drug-excipient compatibility
Excipients are commonly regarded as ingredients that are included in a formulation
along with the API(s) to serve various purposes. Some of their functions, amongst
many others, are to facilitate manufacture of a drug dosage form, secure the stability
of the formulation, improve the bioavailability of the API(s) as well as to enhance
patient acceptability (Bhattacharyya, et al., 2006). Ideally, excipients should not exert
any pharmacological effect but should assist to build a robust and reliable drug product
that delivers precise amounts of API to the site of action (Moreton, 2006).
In the past, excipients were assumed to be inert ingredients, which has been proven
to be inaccurate through various studies (Bayomi, et al., 2001; Bozdağ-Pehlivan, et
al., 2011). Instead, excipients have shown to have the potential of interacting with each
other or the API in the formulation and may be responsible for causing adverse effects
and hypersensitivity reactions in final product users. The excipient-excipient and drug-
excipient interactions result in alteration of drug safety and efficacy (Haywood and
Glass, 2011).
Excipient interactions are found in physical, chemical and biopharmaceutical or
physiological categories. They may either be beneficial or detrimental. In physical

60
interactions, molecular structures of the components are retained. Chemical
interactions result in formation of new compounds whereas physiological interactions
are fundamentally physical in nature whereby excipient interacts with body fluids after
administration (Moreton, 2006).
4.1.2.1. Beneficial and detrimental drug-excipient interactions
Favourable drug-excipient interactions have been exploited to facilitate drug
manufacturing processes. Many beneficial drug-excipient interactions are known. An
example include lubrication benefits as an outcome of adding magnesium stearate to
a formulation (Steele, 2004). Magnesium stearate has hydrophobic properties that
enable it to reduce adhesion of ingredient powder blend to equipment during tableting
process. Therefore, magnesium stearate ultimately improves powder flow. However,
excessive blending time has proved to result in magnesium stearate particle abrasion,
leading to their increased surface area and consequently formation of poor tablet
dissolution and disintegration. If excessive blending with magnesium stearate occurs,
it results in poor disintegration. The tablet is said to be ‘waterproofed’, as a result of
excessive hydrophobic material present, which prevents sufficient water entry for
disintegration to occur (Moreton, 2006; Adeyeye, 2008). Some more examples of
beneficial drug-excipient interactions are summarised in Table 4.3.
A drug- excipient interaction known as the Maillard reaction occurs between amines
and reducing sugars of drugs and excipients. When the primary amine and the
glycosidic hydroxyl terminal on the reducing sugar react, an imine is formed. The imine
disintegrates into yellow-brown coloured molecules called Amadori compounds. The
reaction is catalyzed by magnesium ions, for example magnesium stearate, in high
humidity environment (Moreton, 2006).
A study conducted by Adeyeye (2008) concluded that the chemical drug-excipient
interaction through the Maillard reaction is promoted by the availability of amorphous
compounds in the powder blend. Furthermore, increasing drug and excipient surface
areas by milling or other means spurs on the reaction. Table 4.3 displays some of the
excipients commonly used in manufacturing tablets as well as their beneficial
interactions.

61
Table 4.3: Examples of excipients used in tablets manufacture and their functions
(modified from Haywood and Glass (2011).
Excipient Beneficial Interaction Examples
Diluents Provide bulk and enable
accurate dosing of API
Sugar compounds - lactose,
dextrin and glucose.
Inorganic compounds - silicates,
calcium and magnesium salts
Binders,
compression
agents
Bind the tablet ingredients
together, giving form and
mechanical strength
natural or synthetic polymers -
starches, sugars, sugar alcohols
and cellulose derivatives
Disintegrants
Aid dispersion of the tablet,
releasing the active ingredient
and increasing the surface
area for dissolution
Compounds which swell or
dissolve in water - starch,
cellulose derivatives and
alginates, crospovidone (CRP)
Glidants
Improve the flow of powders by
reducing interparticle friction
and adhesion. Can be used as
anti-caking agents.
Colloidal anhydrous silicon and
other silica compounds
Lubricants Reduce interaction between
particles and equipment
Stearic acid and its salts -
magnesium stearate
Tablet
coatings and
films
Protect tablet from the
environment, increase
mechanical strength, modify
release of the API
Polymers that are insoluble in
acid - are used for enteric
coatings to delay release of the
active ingredient.
Colouring
agents
Improve acceptability to
patients, aid identification and
prevent counterfeiting.
Increase stability of light-
sensitive drugs
Mainly synthetic dyes and natural
colours
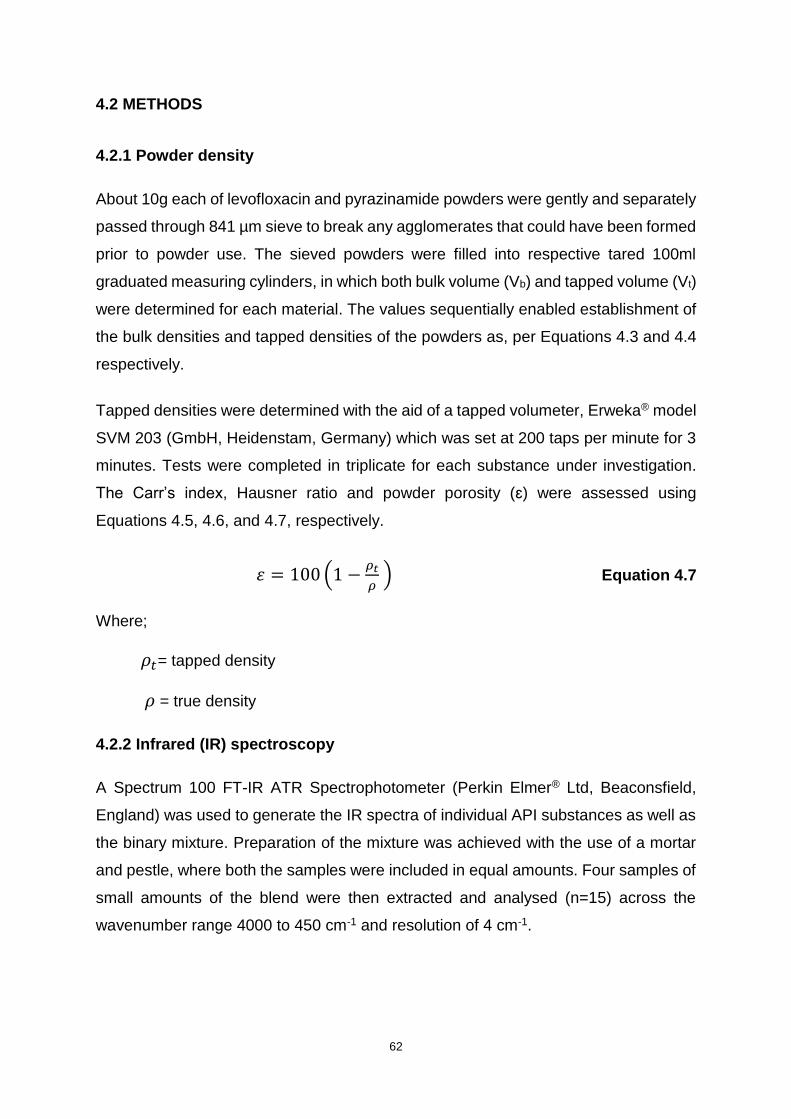
62
4.2 METHODS
4.2.1 Powder density
About 10g each of levofloxacin and pyrazinamide powders were gently and separately
passed through 841 µm sieve to break any agglomerates that could have been formed
prior to powder use. The sieved powders were filled into respective tared 100ml
graduated measuring cylinders, in which both bulk volume (Vb) and tapped volume (Vt)
were determined for each material. The values sequentially enabled establishment of
the bulk densities and tapped densities of the powders as, per Equations 4.3 and 4.4
respectively.
Tapped densities were determined with the aid of a tapped volumeter, Erweka® model
SVM 203 (GmbH, Heidenstam, Germany) which was set at 200 taps per minute for 3
minutes. Tests were completed in triplicate for each substance under investigation.
The Carr’s index, Hausner ratio and powder porosity (ɛ) were assessed using
Equations 4.5, 4.6, and 4.7, respectively.
𝜀 = 100 (1 −𝜌𝑡
𝜌 ) Equation 4.7
Where;
𝜌𝑡= tapped density
𝜌 = true density
4.2.2 Infrared (IR) spectroscopy
A Spectrum 100 FT-IR ATR Spectrophotometer (Perkin Elmer® Ltd, Beaconsfield,
England) was used to generate the IR spectra of individual API substances as well as
the binary mixture. Preparation of the mixture was achieved with the use of a mortar
and pestle, where both the samples were included in equal amounts. Four samples of
small amounts of the blend were then extracted and analysed (n=15) across the
wavenumber range 4000 to 450 cm-1 and resolution of 4 cm-1.
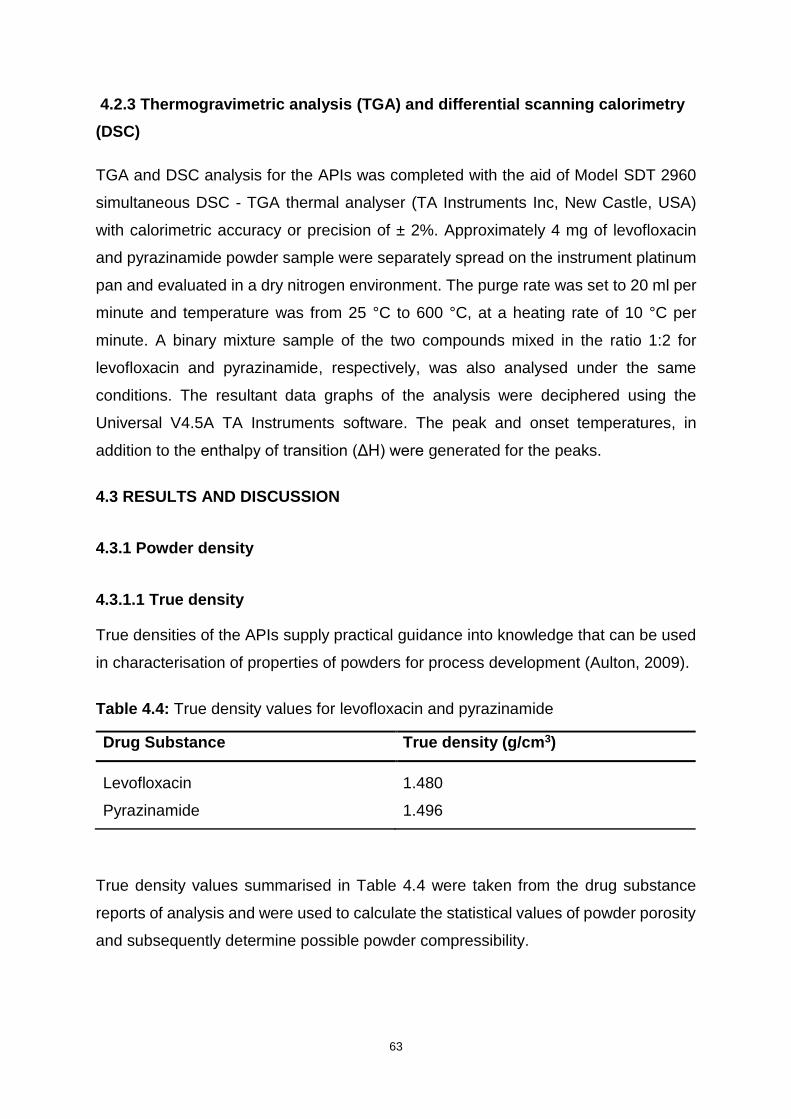
63
4.2.3 Thermogravimetric analysis (TGA) and differential scanning calorimetry
(DSC)
TGA and DSC analysis for the APIs was completed with the aid of Model SDT 2960
simultaneous DSC - TGA thermal analyser (TA Instruments Inc, New Castle, USA)
with calorimetric accuracy or precision of ± 2%. Approximately 4 mg of levofloxacin
and pyrazinamide powder sample were separately spread on the instrument platinum
pan and evaluated in a dry nitrogen environment. The purge rate was set to 20 ml per
minute and temperature was from 25 °C to 600 °C, at a heating rate of 10 °C per
minute. A binary mixture sample of the two compounds mixed in the ratio 1:2 for
levofloxacin and pyrazinamide, respectively, was also analysed under the same
conditions. The resultant data graphs of the analysis were deciphered using the
Universal V4.5A TA Instruments software. The peak and onset temperatures, in
addition to the enthalpy of transition (ΔH) were generated for the peaks.
4.3 RESULTS AND DISCUSSION
4.3.1 Powder density
4.3.1.1 True density
True densities of the APIs supply practical guidance into knowledge that can be used
in characterisation of properties of powders for process development (Aulton, 2009).
Table 4.4: True density values for levofloxacin and pyrazinamide
Drug Substance True density (g/cm3)
Levofloxacin 1.480
Pyrazinamide 1.496
True density values summarised in Table 4.4 were taken from the drug substance
reports of analysis and were used to calculate the statistical values of powder porosity
and subsequently determine possible powder compressibility.
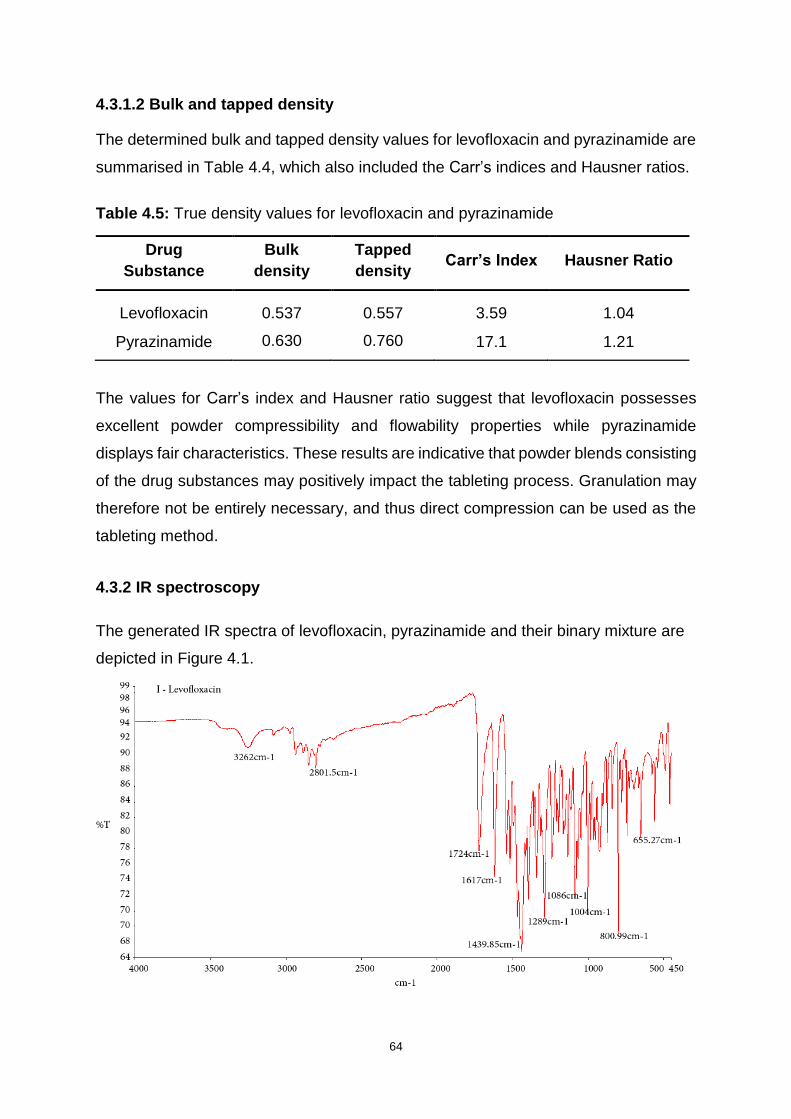
64
4.3.1.2 Bulk and tapped density
The determined bulk and tapped density values for levofloxacin and pyrazinamide are
summarised in Table 4.4, which also included the Carr’s indices and Hausner ratios.
Table 4.5: True density values for levofloxacin and pyrazinamide
Drug
Substance
Bulk
density
Tapped
density Carr’s Index Hausner Ratio
Levofloxacin 0.537 0.557 3.59 1.04
Pyrazinamide 0.630 0.760 17.1 1.21
The values for Carr’s index and Hausner ratio suggest that levofloxacin possesses
excellent powder compressibility and flowability properties while pyrazinamide
displays fair characteristics. These results are indicative that powder blends consisting
of the drug substances may positively impact the tableting process. Granulation may
therefore not be entirely necessary, and thus direct compression can be used as the
tableting method.
4.3.2 IR spectroscopy
The generated IR spectra of levofloxacin, pyrazinamide and their binary mixture are
depicted in Figure 4.1.
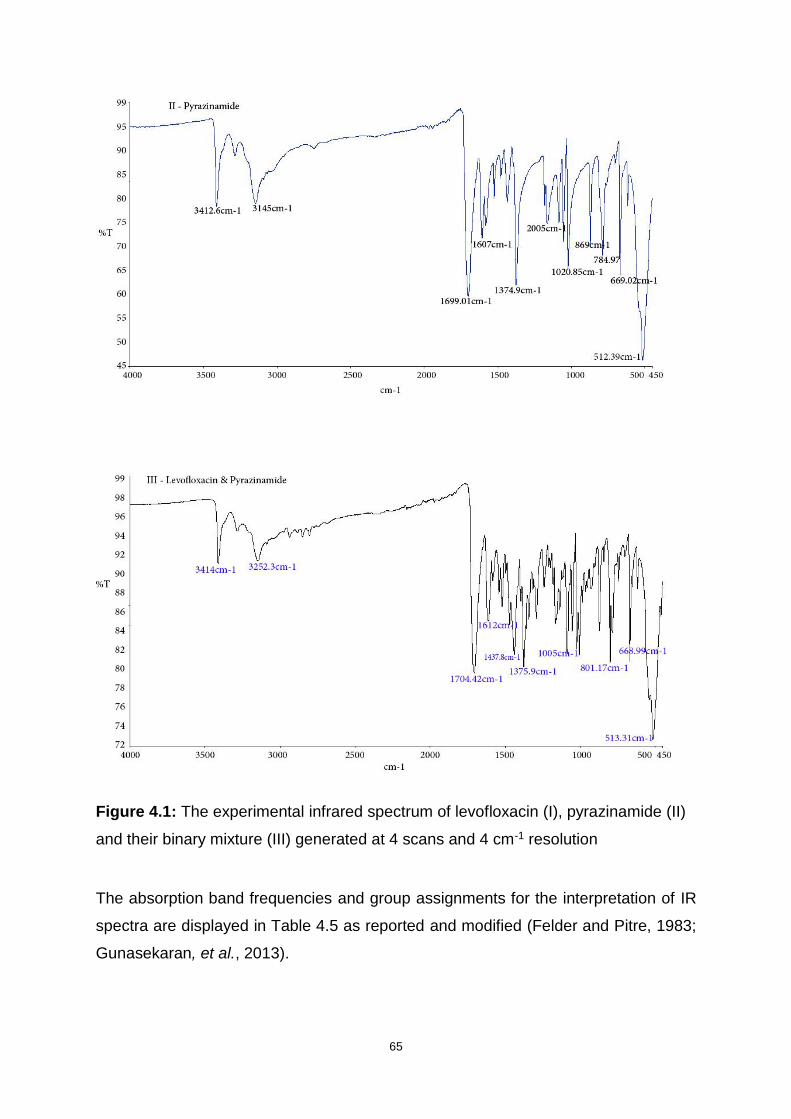
65
Figure 4.1: The experimental infrared spectrum of levofloxacin (I), pyrazinamide (II)
and their binary mixture (III) generated at 4 scans and 4 cm-1 resolution
The absorption band frequencies and group assignments for the interpretation of IR
spectra are displayed in Table 4.5 as reported and modified (Felder and Pitre, 1983;
Gunasekaran, et al., 2013).
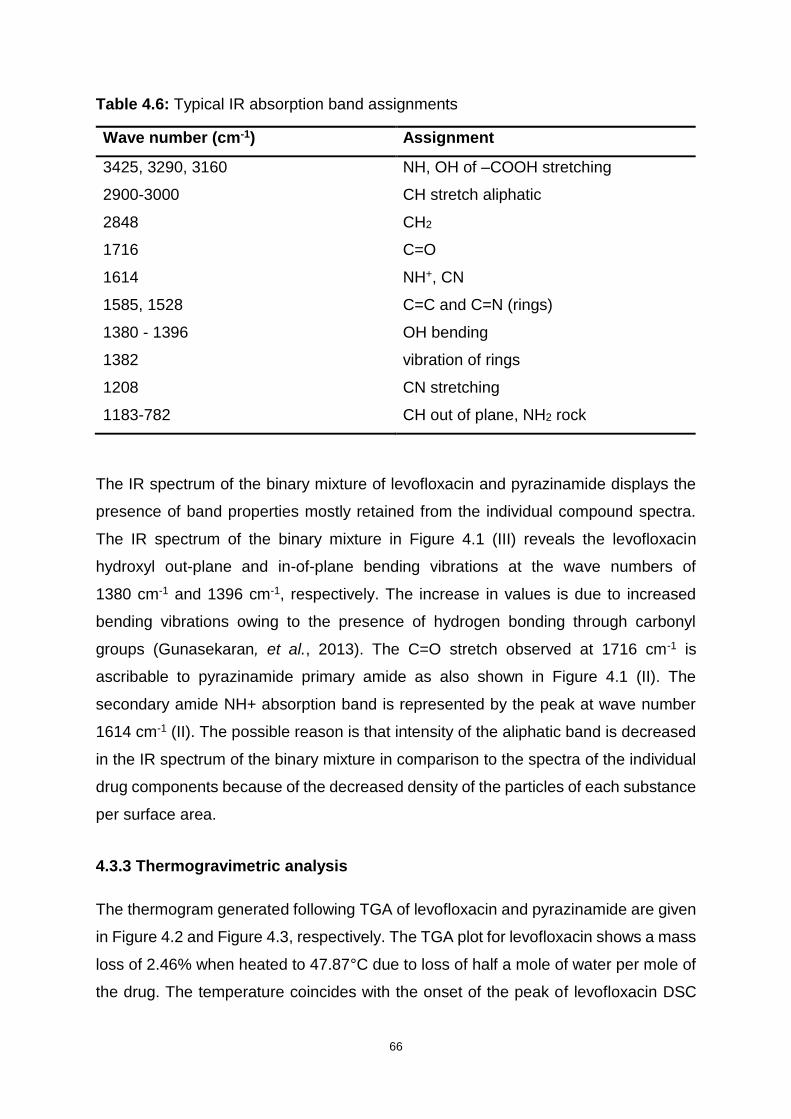
66
Table 4.6: Typical IR absorption band assignments
Wave number (cm-1) Assignment
3425, 3290, 3160 NH, OH of –COOH stretching
2900-3000 CH stretch aliphatic
2848 CH2
1716 C=O
1614 NH+, CN
1585, 1528 C=C and C=N (rings)
1380 - 1396 OH bending
1382 vibration of rings
1208 CN stretching
1183-782 CH out of plane, NH2 rock
The IR spectrum of the binary mixture of levofloxacin and pyrazinamide displays the
presence of band properties mostly retained from the individual compound spectra.
The IR spectrum of the binary mixture in Figure 4.1 (III) reveals the levofloxacin
hydroxyl out-plane and in-of-plane bending vibrations at the wave numbers of
1380 cm-1 and 1396 cm-1, respectively. The increase in values is due to increased
bending vibrations owing to the presence of hydrogen bonding through carbonyl
groups (Gunasekaran, et al., 2013). The C=O stretch observed at 1716 cm-1 is
ascribable to pyrazinamide primary amide as also shown in Figure 4.1 (II). The
secondary amide NH+ absorption band is represented by the peak at wave number
1614 cm-1 (II). The possible reason is that intensity of the aliphatic band is decreased
in the IR spectrum of the binary mixture in comparison to the spectra of the individual
drug components because of the decreased density of the particles of each substance
per surface area.
4.3.3 Thermogravimetric analysis
The thermogram generated following TGA of levofloxacin and pyrazinamide are given
in Figure 4.2 and Figure 4.3, respectively. The TGA plot for levofloxacin shows a mass
loss of 2.46% when heated to 47.87°C due to loss of half a mole of water per mole of
the drug. The temperature coincides with the onset of the peak of levofloxacin DSC

67
thermogram in Figure 4.4, thereby confirming the presence of the hemihydrate. An
article for a study of the same compound in a previous study, however, reported a
2.59% mass loss at 70°C (Gorman, et al., 2012). The differences in these results could
be accredited to the possible dissimilarities in the methods used to synthesise the
compound, as well as the differences in instrumentation used for analysis.
Subsequently, there is negligible weight loss until the temperature of 231.18°C, where
the compound rapidly melts.
Figure 4.2: Typical TGA plot of levofloxacin at 10°C/min heating rate
Figure 4.3 displays a rapid loss in mass from the temperature of 134.2°C to 206°C due
to decomposition of pyrazinamide. The thermogravimetric curve depicts
thermostability of pyrazinamide in the heating range of 25°C to approximately 134°C,
after which degradation occurs. The graph shows a decrease of only 1.2% in weight
of the drug as a probable consequence of loss of moisture. Similar behaviour of
pyrazinamide has been previously observed (Liu, et al., 2016). A total of 100% of
pyrazinamide is lost to decomposition when the temperature reaches 206°C. The two
compounds display distinct thermodynamics at ambient temperature, with no
temperature induced interactions.
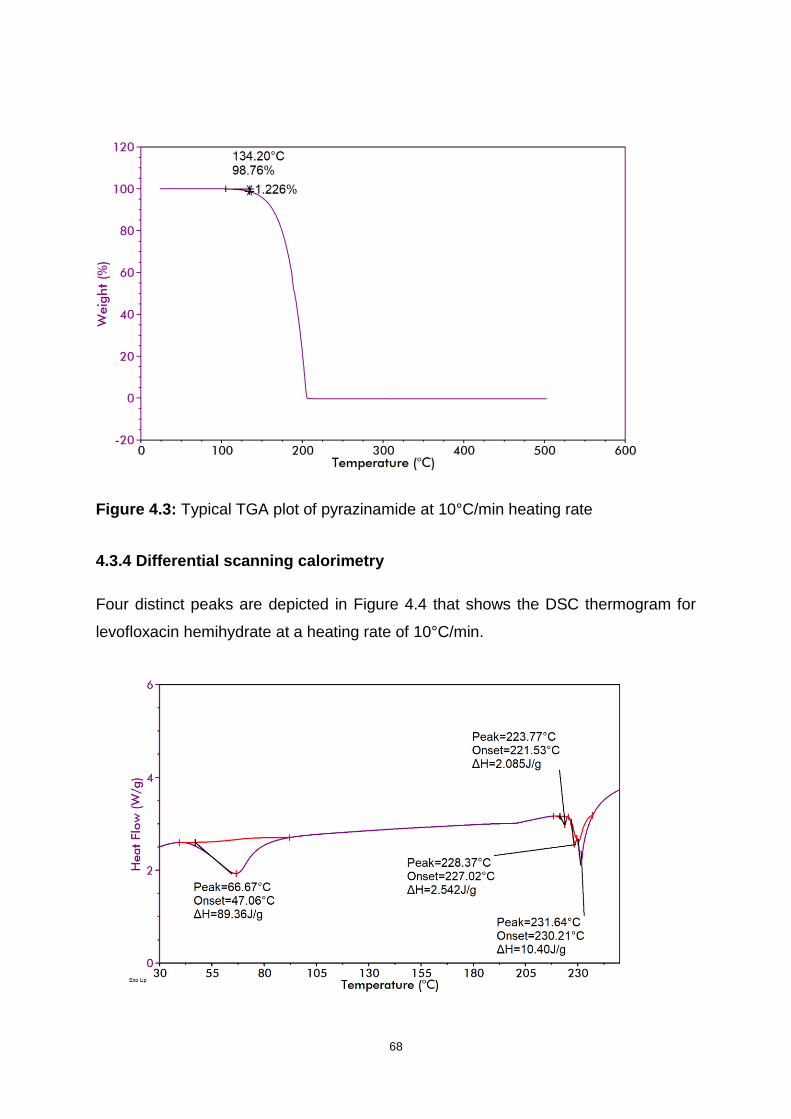
68
Figure 4.3: Typical TGA plot of pyrazinamide at 10°C/min heating rate
4.3.4 Differential scanning calorimetry
Four distinct peaks are depicted in Figure 4.4 that shows the DSC thermogram for
levofloxacin hemihydrate at a heating rate of 10°C/min.
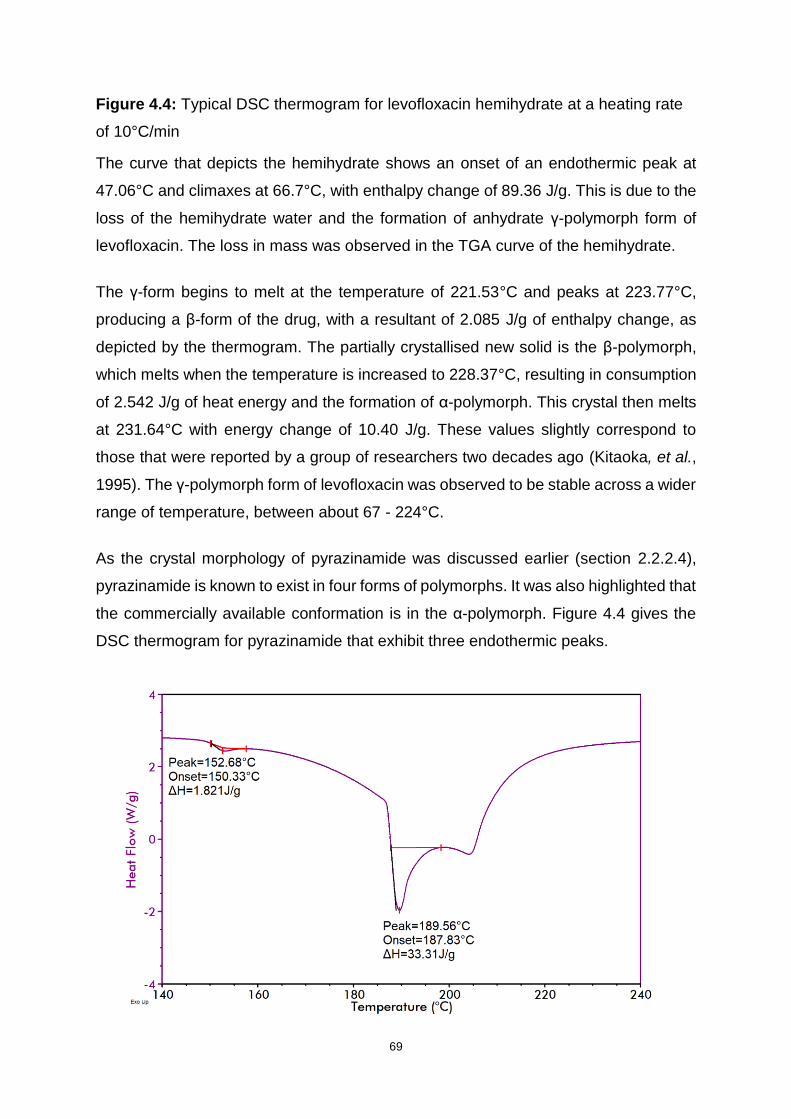
69
Figure 4.4: Typical DSC thermogram for levofloxacin hemihydrate at a heating rate
of 10°C/min
The curve that depicts the hemihydrate shows an onset of an endothermic peak at
47.06°C and climaxes at 66.7°C, with enthalpy change of 89.36 J/g. This is due to the
loss of the hemihydrate water and the formation of anhydrate γ-polymorph form of
levofloxacin. The loss in mass was observed in the TGA curve of the hemihydrate.
The γ-form begins to melt at the temperature of 221.53°C and peaks at 223.77°C,
producing a β-form of the drug, with a resultant of 2.085 J/g of enthalpy change, as
depicted by the thermogram. The partially crystallised new solid is the β-polymorph,
which melts when the temperature is increased to 228.37°C, resulting in consumption
of 2.542 J/g of heat energy and the formation of α-polymorph. This crystal then melts
at 231.64°C with energy change of 10.40 J/g. These values slightly correspond to
those that were reported by a group of researchers two decades ago (Kitaoka, et al.,
1995). The γ-polymorph form of levofloxacin was observed to be stable across a wider
range of temperature, between about 67 - 224°C.
As the crystal morphology of pyrazinamide was discussed earlier (section 2.2.2.4),
pyrazinamide is known to exist in four forms of polymorphs. It was also highlighted that
the commercially available conformation is in the α-polymorph. Figure 4.4 gives the
DSC thermogram for pyrazinamide that exhibit three endothermic peaks.

70
Figure 4.5: Typical DSC thermogram for pyrazinamide at a heating rate of 10°C/min
The first peak at 152.68°C with ΔH of 1.821 J/g indicates a non-reversible solid-solid
phase transformation from α-form to the γ-form. The second peak at 189.56°C with
ΔH of 33.31 J/g indicates the melting phase of the γ-form. Both values are fairly similar
to those observed by Pharm and research team (2013). The endothermic peak that
evolves after the melting phase at 204°C corresponds to the sublimation of the γ-
polymorph, as shown by the TGA plot in Figure 4.3 and confirmed in an article by
Cherukuvada and colleagues (2010). This suggests that the compound purely consists
of the α-polymorph.
The thermogram for the binary mixture of levofloxacin and pyrazinamide at a heating
rate of 10°C/min is depicted in Figure 4.6. The curve at 62.21°C is indicative of the
presence of levofloxacin, which would have been expected to peak at approximately
66°C as in the individual drug compound. However, the peak onset values do not differ.
The three peaks at 160.85°C, 164°C and 179.13°C do not coincide with any of the
endotherms observed from the two separate thermograms, therefore are non-
reflective of any of the individual compounds. This implies that levofloxacin and
pyrazinamide interact at higher temperatures, possibly with the formation of a eutectic
mixture.
71
Figure 4.6: Typical DSC thermogram for binary mixture of levofloxacin and
pyrazinamide at a heating rate of 10 °C/min
4.4 CONCLUSIONS
Preformulation studies minimise trial-and-error attempts in optimising dosage form
manufacture conditions during formulation development. The studies help predict
important characteristics of the pharmaceutical product in question. Preformulation
studies may not necessarily offer product certainty, but the data forms crucial
foundation on which quality may be constructed into the product (Lau, 2001).
Data from powder density studies indicates that both drug compounds exhibit
potentially satisfactory flow and compressibility properties. This prediction is according
to the respective numerical values of Carr’s Index, Hausner ratio and powder porosity.
Furthermore, since both powders have good flowability, the individual powders are
highly likely to be physically compatible with each other in the resultant blend during
mixing and direct compression process.
The IR spectroscopy results (Figure 4.1) suggest that there is no significant interaction
of levofloxacin and pyrazinamide in this formulation. The IR spectrum of the binary
compound mixture (Figure 4.1 (III)) showed that the components remained intact and
maintained their individual properties after being mixed. The major peaks that define
the separate substances could still be identified in the spectrum of the mixture. This is
because in an IR spectrometer, samples are examined under ambient temperatures.
Thermogravimetric analysis of the compounds concluded that levofloxacin and
pyrazinamide are stable under the conditions of formulation. TGA and DSC plots of
the separate compounds display different thermogravimetric degradation profiles for
the two drug materials, with no apparent cross over of pathways. However, the DSC
thermogram for binary mixture of the drugs (Figure 4.6) suggests that interactions may
occur between the two substances at high temperatures. This evidence also suggests
that long term stability testing of the dispersible tablet may be necessary in
formulations that contain both levofloxacin and pyrazinamide.
The preformulation studies have been useful in providing data that is essential for
laying the foundation of the dosage form formulation and point a favourable direction

72
towards the more suitable methods to subsequently follow in accomplishing a
successful manufacturing process. The studies helped to eliminate possible active
drug-drug interaction speculations.

73
CHAPTER FIVE
FORMULATION DEVELOPMENT AND MANUFACTURE OF FIXED-DOSE
COMBINATION DISPERSIBLE TABLETS
5.1 INTRODUCTION
Drug administration via the oral route has maintained its status as the most prevalent
and favoured method of drug delivery for decades, for both local and systemic
pharmacological effects in adults and children. For reasons that include ease of
administration and accuracy of dosage, solid dosage forms have wide acceptance in
the pharmaceutical field (Dey and Maiti, 2010). Moore (1998) establishes that children
are by no means fractions of adults. Children form an exceptional group of patients,
with distinct pharmacotherapeutic requirements and those needs should be
investigated and satisfied. Children are a heterogenous group that exhibit distinct
aspects in terms of drug pharmacokinetics and pharmacodynamics.
In conjunction with oral liquid preparations, dispersible tablets have become part of
the solution to the challenges involving paediatric-unfriendly dosage forms, and are
now recommended worldwide (Ivanovska, et al., 2014). The advent of child-friendly
FDC formulations for the management of drug-sensitive TB in 2016 has been a game-
changing approach so far. Development of similar child-friendly formulations for the
treatment of MDR-TB would be a milestone.
Manufacturers need to overcome several hurdles in their quest to develop child-
friendly dosage forms for MDR-TB. One basic challenge lies with the unavailability of
an approved paediatric dosing guideline for FDC dispersible tablet formulation
intended for the treatment of MDR-TB. The lack of child-friendly dosage forms is
aggravated by the fact that the worldwide drug-regulatory policies decelerating the
pace of innovative formulations towards the market. The process for registration of is
tedious and bureaucratic, especially for medicines intended for children (Taneja, et al.,
2015). Regarding the challenge of attaining bioequivalence between the independent
drug products and the FDC product, oftentimes, the possibility of combining multiple
APIs in a single preparation may alter the expected biopharmaceutical and
pharmacokinetic outcomes (Mitra and Wu, 2012).

74
Mitra and Wu (2012) discuss the challenge of attaining bioequivalence between the
independent drug products and the FDC product. Oftentimes, the possibility of
combining multiple APIs in a single preparation may alter the expected
biopharmaceutical and pharmacokinetic outcomes.
5.1.1 Dispersible tablets overview
Dispersible tablet systems were first developed approximately three decades ago to
resolve dysphagia problems related to conventional oral dosage forms for psychotic,
paediatric and geriatric patients (Dey and Maiti, 2010). Dispersible tablets contain API
substances and disintegrate rapidly, normally within a minute when in contact with a
liquid (Mali, et al., 2014).
Dispersible tablets are ordinarily designed to be dispersed in liquid to form a
homogeneous solution prior to administration (World Health Organisation, 2008).
Dispersible tablets have also been referred to as fast-melting tablets (Fu, et al., 2005),
fast-dissolving tablets (Nagendrakumar, et al., 2009), fast-disintegrating tablets
(Parkash, et al., 2011), and orodispersible tablets for the tablets that dissolve rapidly
in the mouth without the aid of water or chewing (Dey and Maiti, 2010) among other
terms. Dispersible tablets take the form of the typical solid dosage preparations,
except that dispersible tablets have superdisintegrants with resultant near-
instantaneous dispersal (Parkash, et al., 2011).
An ideal dispersible tablet must possess certain qualities. Essentially, the preparation
should be able to disintegrate in saliva or small amount of liquid in a short space of
time. The formulation should present with high drug loading capacity while preserving
stability in environmental conditions such as humidity and temperature, satisfactory
taste-masking properties with pleasurable mouthfeel as well as have no residue
remaining in the mouth after administration (Mali, et al., 2014; Ivanovska, et al., 2014).
Due to its numerous benefits, dispersible tablet system is gaining even wider
preference. There are several methods of manufacturing dispersible tablets. However,
product properties may differ subject to the method of preparation followed (Parkash,
et al., 2011).
75
5.1.1.1 Advantages of dispersible tablets
Dispersible tablets provide unique features of combined dual benefits of solid and
liquid dosage forms (Garg and Gupta, 2013). As alluded to earlier (Section 1.1),
dispersible tablets allow for easy administration to younger children, the elderly,
psychiatric patients and patients who experience swallowing challenges. Risks of
choking or suffocation normally accredited to solid dosage forms are reduced. As
opposed to conventional dosage forms, dispersible formulations are convenient for
use and hence enhance compliance and effective therapy (Mali, et al., 2014).
As a virtue of being solid dosage forms, disperse tablets offer accurate dosing and
ease of transportation. Owing to easy, rapid disintegration and fast dissolution,
absorption and drug bioavailability are improved (Patil, et al., 2014). Manufacturing
techniques are based on use of conventional tableting procedures, yet enabling high
drug loading capacity, thereby producing the tablets is cost effective. There are
opportunities in innovative formulation differentiation for a large number of legacy and
novel drug products which provide new business avenues for manufacturers (Garg
and Gupta, 2013; Roy, 2016).
5.1.1.2 Limitations of dispersible tablets
The major drawback of dispersible tablets is associated with tablet mechanical
strength. Roy (2016) and Masih, et al. (2017) assert that the porous and soft
compressed structure render dispersible tablets friable and brittle, consequently
causing them to require careful handling. Mali, et al. (2014) and Roy (2016) agree that
it is difficult to formulate large doses of drugs into dispersible tablets and another
challenge arises when taste-masking of certain drugs is required. The hygroscopic
nature of the product necessitates a need for special packaging to keep the dispersible
tablets stable in wet climates.
5.1.2 Manufacturing methods
A broad variety of technologies for manufacture of dispersible tablets have been
developed. These include direct compression, amongst many others (Table 5.1; Roy
2016). The molding and lyophilisation technologies are some of the most exploited
methods. They have been found to yield dispersible tablets which disintegrate in less
76
than 30 seconds, although the tablets are highly friable and have low mechanical
strength (Abdelbary, et al., 2004). On the other hand, although dispersible tablets
produced through direct compression may take longer than a minute to disintegrate,
they display relatively low friability.
5.1.3 Manufacturing method of choice
Direct compression involves a limited number of process steps and is a cost-effective
and rapid process that employs the widely used excipients and equipment. Moreover,
the technique can accommodate high doses of API and larger final weight of the
product (Dobetti, 2001). Direct compression was therefore the preferred method in this
study.
5.1.3 Excipients
Excipients are ingredients that are included in pharmaceutical formulations to serve
various purposes, such as diluents, protective agents or materials used to improve
bioavailability of active ingredients. Excipients also facilitate smooth manufacture of
the drug products (Haywood and Glass, 2011). Some materials possess multi-
functionality properties, where the same ingredient can be employed for a different
purpose, depending on the concentration at which they are added (Jivraj, et al., 2000).
The following section covers some of the most commonly used excipients.
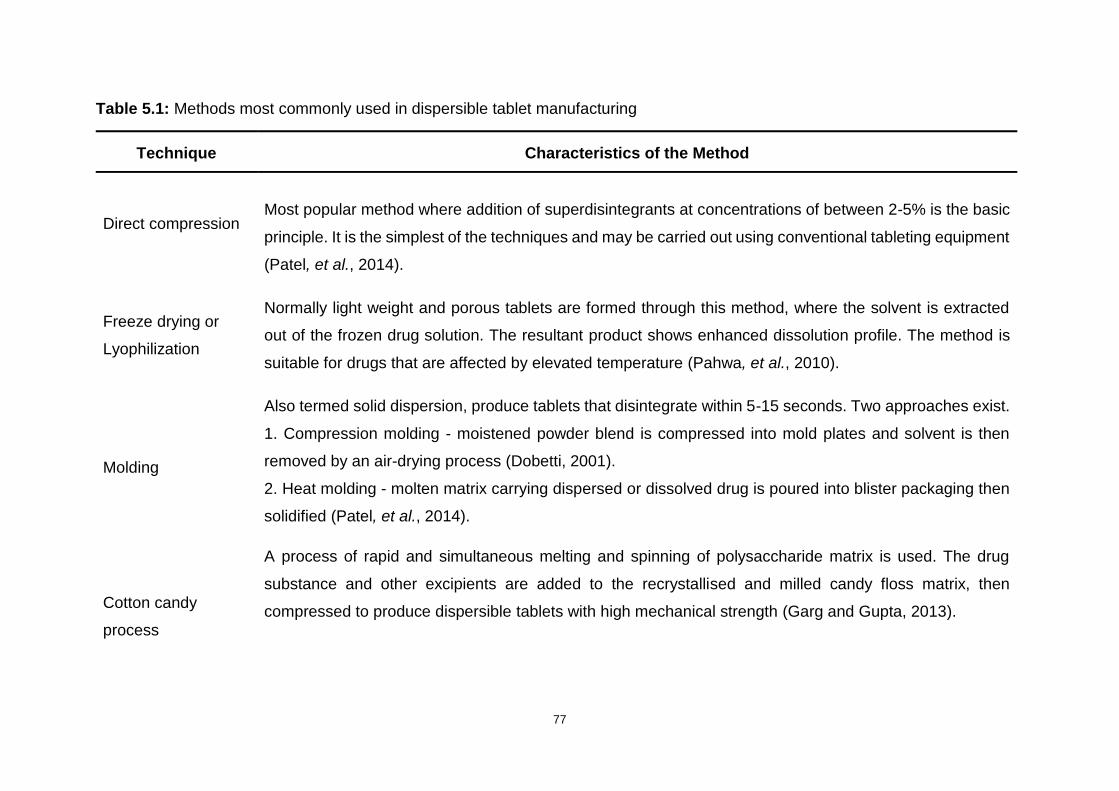
77
Table 5.1: Methods most commonly used in dispersible tablet manufacturing
Technique Characteristics of the Method
Direct compression Most popular method where addition of superdisintegrants at concentrations of between 2-5% is the basic
principle. It is the simplest of the techniques and may be carried out using conventional tableting equipment
(Patel, et al., 2014).
Freeze drying or
Lyophilization
Normally light weight and porous tablets are formed through this method, where the solvent is extracted
out of the frozen drug solution. The resultant product shows enhanced dissolution profile. The method is
suitable for drugs that are affected by elevated temperature (Pahwa, et al., 2010).
Molding
Also termed solid dispersion, produce tablets that disintegrate within 5-15 seconds. Two approaches exist.
1. Compression molding - moistened powder blend is compressed into mold plates and solvent is then
removed by an air-drying process (Dobetti, 2001).
2. Heat molding - molten matrix carrying dispersed or dissolved drug is poured into blister packaging then
solidified (Patel, et al., 2014).
Cotton candy
process
A process of rapid and simultaneous melting and spinning of polysaccharide matrix is used. The drug
substance and other excipients are added to the recrystallised and milled candy floss matrix, then
compressed to produce dispersible tablets with high mechanical strength (Garg and Gupta, 2013).

78
Continuation of Table 5.1
Melt granulation
The process requires that the binder be molten liquid or solid that can melt. The molten binder is used to
agglomerate the powder blends during granulation. polyethylene glycol (PEG) is the most widely used melt
binder (Seo and Schæfer, 2001)
Mass extrusion
Powder blend of drug substance(s) and excipients are mixed with solvent mixture that contains water
soluble PEG and methanol. The resultant softened powder mass is extruded through a syringe or extruder
to produce cylindrical product that is divided into tablets (Parkash, et al., 2011).
Phase transition
This method revolves around phase transition of sugar alcohol to produce tablets with adequate hardness.
The tablets that contain two sugar alcohols of high and low melting points, are initially prepared using the
conventional compression method followed by heating. The heating subsequently increases bond strength
between tablet particles, leading to formation of improved tablet hardness (Kuno, et al., 2008).
Nanonisation
A recent technology that involves reducing drug particle size milling it into nanoparticle size. The technology
produces rapidly disintegrating tablets that have an improved drug absorption profile and bioavailability. It
also comes in handy during the formulation of drugs that show poor water solubility (Hannan, et al., 2016).
79
5.1.3.1 Superdisintegrants
A superdisintegrant is a type of excipient that is added in lower concentrations than
conventional disintegrants to the formulation to accelerate break up and dispersion of
the solid tablet matrix rapidly. The disintegration of the tablet containing
superdisintegrants occurs once the tablet encounters water or a fluid environment
(Preethi, et al., 2013). There are several mechanisms through which tablet
disintegration occurs. These include, amongst others, swelling, water wicking, heat of
wetting and strain recovery (Augsburger, et al., 2007).
Depending on the characteristics of the API and the required drug release profile,
superdisintegrants are normally included at 1-10 %, and in other cases, up to 20% of
the total weight of the dosage unit. Inclusion of effective superdisintegrants may
improve ingredient compatibility and allow compressibility without any negative effect
on physical strength of tablets carrying a high-dose drug (Dobetti, 2001). Sodium
starch glycolate (SSG), croscarmellose sodium (CCS) and CRP are the most
commonly used superdisintegrants (thereafter in the text simply referred to as
disintegrants). SSG is spherical in shape and therefore improves powder flow. It also
possesses strong swelling properties. CRP, on the other hand, is fibrous in nature and
highly compactable (Augsburger, et al., 2007). Alginic acid, soy polysaccharides,
calcium silicate, xanthan gum, and gellan gum have also been listed as some of the
commercially available disintegrants employed in rapid disintegrating formulations
(Mando and Hasan, 2015).
5.1.3.2 Binders
Binders are also known as adhesives and are normally added to impart cohesive
qualities to the powdered mass. Binding agents may be used in liquid (solution binder)
or dry (dry binder) form to facilitate agglomeration and granule formation during direct
compression. The binder form used is contingent on the type of process employed in
producing material for compression. In direct compression, the binding agent is added
to powder mixture in dry form while it may be dissolved in granulating fluid during wet
granulation processes (Mahato and Narang, 2012).
Widely used binding agents in direct compression processes include microcrystalline
cellulose (MCC) and silicified MCC. MCC, in particular, has been ranked as one of the

80
most effective binding agents due to its exceptional dry binding properties (Thoorens,
et al., 2014). Binders utilised in wet granulation are mostly polymeric in nature and
include polyvinylpyrrolidone (PVP), saccharides, gelatin, cellulose derivatives (such
as methylcellulose), as well as alginic acid derivatives (such as sodium alginate)
(Jivraj, et al., 2000). The type and concentration of binding agent has an impact on the
ultimate friability and physical strength of the tablet (Mahato and Narang, 2012).
5.1.3.3 Diluents
Diluents are also termed fillers or bulking agents. A tablet must be of reasonable
weight for practical compressible size and improved physical strength, especially in
tablets that contain a low dose of API. Diluents are included in the tablet formulation
to make up the bulk volume or weight of tablet unit if the weight of the drug is less than
50 mg. For easy patient handling purposes, a tablet must have a weight of at least 50
mg. Examples of diluents are MCC, mannitol, sodium chloride, dicalcium phosphate
dehydrate, sorbitol, lactose, starches, dextrose and sucrose (Mahato and Narang,
2012).
5.1.3.4 Anti-frictional agents
5.1.3.4.1 Lubricants
Lubricants are ingredients that prevent tablet material from sticking to the punch and
die surfaces during the compression stage, thereby aiding smooth ejection of tablet
units from the dies. Directly after compression, tablets may expand and bind to the die
surfaces. Lubricants improve powder flow characteristics and reduce friction following
compression. High friction during compression may cause capping and fragmentation
of tablets. Lubricants are mostly used in concentration of less or equal to 1% by weight,
however, talc is ordinarily used in higher quantities (Mahato and Narang, 2012; Sakr
and Alanazi, 2013).
Frequently used lubricants are hydrophobic materials and include stearic acid,
magnesium stearate, calcium stearate, hydrogenated vegetable oils, PEG, talc as well
as glyceryl behanate. Magnesium stearate is generally used most often, except in
instances where it is chemically incompatible. In such cases, stearic acid or talc are
used as substitutes (Sakr and Alanazi, 2013). Some lubricants are water-soluble and
81
are utilised in the formulation of water-soluble tablets. Sodium benzoate, carbowax
4000, sodium chloride, as well as a mixture of sodium acetate and sodium benzoate
are typical examples of such lubricants (Mahato and Narang, 2012).
5.1.3.4.2 Glidants
Glidants are included in tablet preparations to decrease inter-particulate friction and
improve powder mixture flow characteristics. On all occasions, glidants are added in
dry form immediately before compression. Fumed (colloidal) silica is the most
exploited glidant, whereas asbestos-free talc is used as both lubricant and glidant
(Sakr and Alanazi, 2013). Starch may also be used as a glidant (Mahato and Narang,
2012).
5.1.3.4.3 Anti-adherents
Anti-adherents act to reduce the sticking of powder mixture particles to the punch
faces. This prevents occurrence of a phenomenon known as picking or sticking.
Sticking occurs especially on punch surfaces that have markings such as symbols or
engravings, where thin layers of powder may build up, leading to uneven tablet
surfaces (Alderborn, 2013)
5.2 METHODS
5.2.1 Materials
Levofloxacin was procured from Sgonek® Biological Technology Co, Ltd (Xian Shi,
Shaanxi Sheng, China) and pyrazinamide was sponsored by Aspen Pharmacare®
(Eastern Cape, South Africa). Mannitol, SSG, CRP and CCS were purchased from
Aspen Pharmacare (Eastern Cape, South Africa), whereas MCC, colloidal silicon
dioxide (CSD), talc and magnesium stearate were purchased from JRS Pharma
(Johannesburg, Gauteng, South Africa).
5.2.1.1 Microcrystalline cellulose (MCC)
MCC is one material with various excipient functions. Thoorens and colleagues (2014)
summarise MCC as the most widely used binder in direct compression tableting
processes. It offers broad compatibility with many APIs in addition to exhibiting
82
physiological inertness. Furthermore, it is considered as an important diluent with
lubricant and disintegrant properties both in wet granulation and direct compression.
However, Bala and fellow research team (2013) agree with Mastafa and colleagues
(2013) that these characteristics should not replace the necessity of including true
lubricants and disintegrants when MCC has been used. Instead, MCC can be used in
collaboration with superdisintegrants to promote more rapid disintegration.
5.2.1.2 Crospovidone (CRP)
CRP is a highly hydrophilic yet insoluble form of PVP that possesses rapid moisture
sorption properties along with good swelling characteristics. On the other hand, the
excipient has been documented to have good binding properties because of its
excellent flow and plastic deformability characteristics (Barabas and Adeyey, 1996). It
is therefore a good tablet disintegrant and binder. Studies suggest that CRP may
improve solubility of steroid APIs and is compatible with a wide range of organic and
inorganic tableting ingredients. It is normally used at concentrations of 2–5% by weight
(Rowe, et al., 2009).
5.2.1.3 Croscarmellose sodium (CCS)
CCS is an example of crosslinked polymer of carboxymethyl cellulose sodium. It is
used as a disintegrant at concentrations of up to 5% w/w, although normally, 2% w/w
is sufficient for use in direct compression tablet formation process. Though a
hygroscopic material, CCS is stable at ambient conditions (Rowe, et al., 2009).
5.2.1.4 Sodium starch glycolate (SSG)
SSG is a sodium salt of cross-linked or non-cross-linked carboxymethyl ether of starch
that is commonly employed in tablet and capsule formulation as a disintegrant (United
States Pharmacopoeia - National Formulary [USP30 - NF25], 2007b). As summarised
by Rowe and colleagues (2009), SSG is usually used in both wet granulation and
direct compression at optimum concentrations of about 4% w/w, though
concentrations of up to 8% w/w are sometimes added. In most cases, 2% w/w of SSG
in a formulation is normally sufficient. In another study, it was found that the inclusion
of SSG as a disintegrant by direct compression method improved the photo-stability
83
of norfloxacin in a tablet formulation due to a phenomenon known as barrier effect of
the starch granules (Córdoba-Borrego, et al., 1999).
5.2.1.5 Colloidal silicon dioxide (CSD)
CSD is a fumed silica manufactured by vapor hydrolysis of chlorosilanes has has
various excipient functions, although it has been primarily employed in pharmaceutical
formulations as a glidant at concentrations between 0.1–1% w/w. It has been
categorised as an anti-caking agent, adsorbent, viscosity-increasing agent,
suspending agent, disintegrant, as well as an emulsion stabiliser (Rowe, et al., 2009).
It may be necessary to add extra lubricant when including CSD in a powder mixture to
circumvent sticking and picking complications (Mahalingam, et al., 2008).
5.2.1.6 Magnesium stearate
The chief function of magnesium stearate in pharmaceutical formulations is to provide
lubrication in capsule and tablet manufacture. The usual recommended concentrations
range from 0.25% to 5.0 % w/w. Recent studies have confirmed that lubrication by
magnesium stearate in high concentrations may lead to a decrease in tensile strength
and an increase in the brittleness of tablets (Paul and Sun, 2017). As mentioned earlier
(section 4.1.3.1), magnesium stearate improves powder flow at low concentrations
and sufficient blending time. Excessive blending time results in magnesium stearate
particle abrasion, and ultimately, poor tablet dissolution and disintegration (Moreton,
2006). It can be concluded that the amount of lubricant added, and the time of blending
needs to be closely monitored for optimal tableting results.
5.2.2 Manufacturing equipment
All the raw materials were weighed using a Model XP205 Mettler Toledo® analytical
precision balance (Mettler Instruments, Zurich, Switzerland). Prior to use, the materials
were sieved through stainless steel mesh cloths that conform to the requirements of
the International Standards (ISO 565). Powder blending was accomplished using a
cube mixer attached to Model AR 403 All-purpose Erweka drive unit (Erweka® GmbH,
Heusenstamm, Germany). The direct compression process was achieved on a
Version-2 single punch eccentric tablet press EP-1 (Erweka® GmbH, Heusenstamm,
Germany).
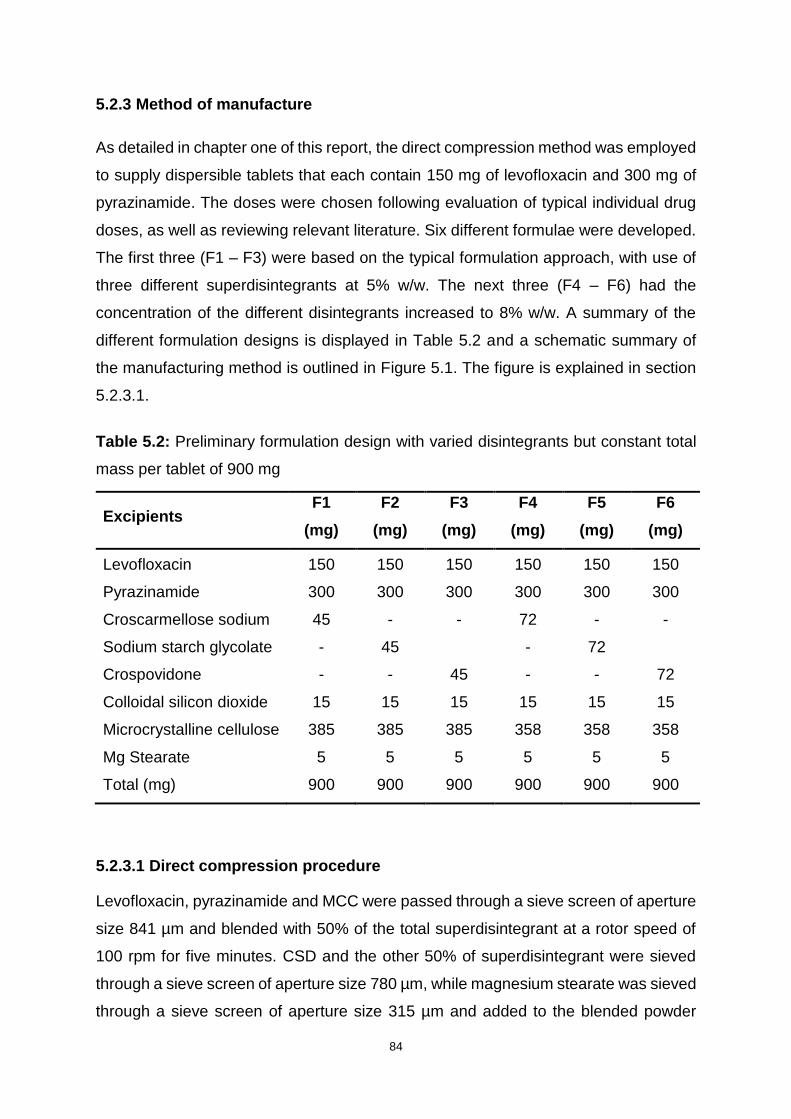
84
5.2.3 Method of manufacture
As detailed in chapter one of this report, the direct compression method was employed
to supply dispersible tablets that each contain 150 mg of levofloxacin and 300 mg of
pyrazinamide. The doses were chosen following evaluation of typical individual drug
doses, as well as reviewing relevant literature. Six different formulae were developed.
The first three (F1 – F3) were based on the typical formulation approach, with use of
three different superdisintegrants at 5% w/w. The next three (F4 – F6) had the
concentration of the different disintegrants increased to 8% w/w. A summary of the
different formulation designs is displayed in Table 5.2 and a schematic summary of
the manufacturing method is outlined in Figure 5.1. The figure is explained in section
5.2.3.1.
Table 5.2: Preliminary formulation design with varied disintegrants but constant total
mass per tablet of 900 mg
Excipients F1
(mg)
F2
(mg)
F3
(mg)
F4
(mg)
F5
(mg)
F6
(mg)
Levofloxacin 150 150 150 150 150 150
Pyrazinamide 300 300 300 300 300 300
Croscarmellose sodium 45 - - 72 - -
Sodium starch glycolate - 45 - 72
Crospovidone - - 45 - - 72
Colloidal silicon dioxide 15 15 15 15 15 15
Microcrystalline cellulose 385 385 385 358 358 358
Mg Stearate 5 5 5 5 5 5
Total (mg) 900 900 900 900 900 900
5.2.3.1 Direct compression procedure
Levofloxacin, pyrazinamide and MCC were passed through a sieve screen of aperture
size 841 µm and blended with 50% of the total superdisintegrant at a rotor speed of
100 rpm for five minutes. CSD and the other 50% of superdisintegrant were sieved
through a sieve screen of aperture size 780 µm, while magnesium stearate was sieved
through a sieve screen of aperture size 315 µm and added to the blended powder
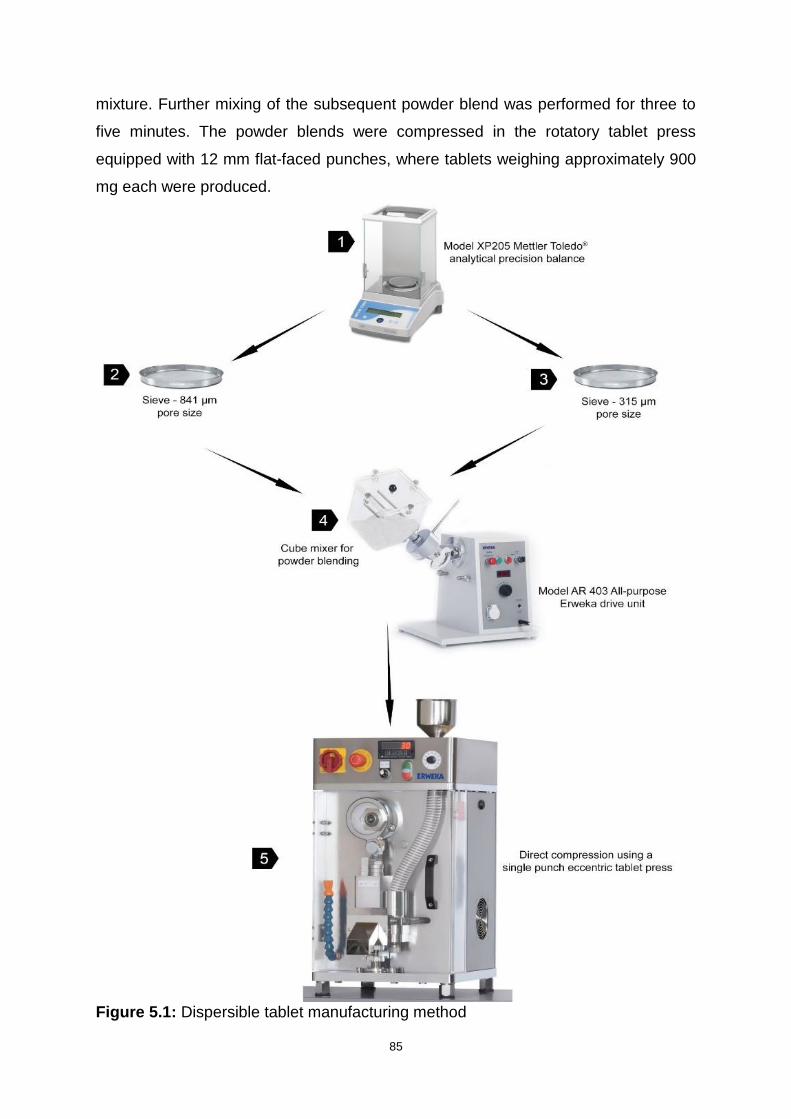
85
mixture. Further mixing of the subsequent powder blend was performed for three to
five minutes. The powder blends were compressed in the rotatory tablet press
equipped with 12 mm flat-faced punches, where tablets weighing approximately 900
mg each were produced.
Figure 5.1: Dispersible tablet manufacturing method
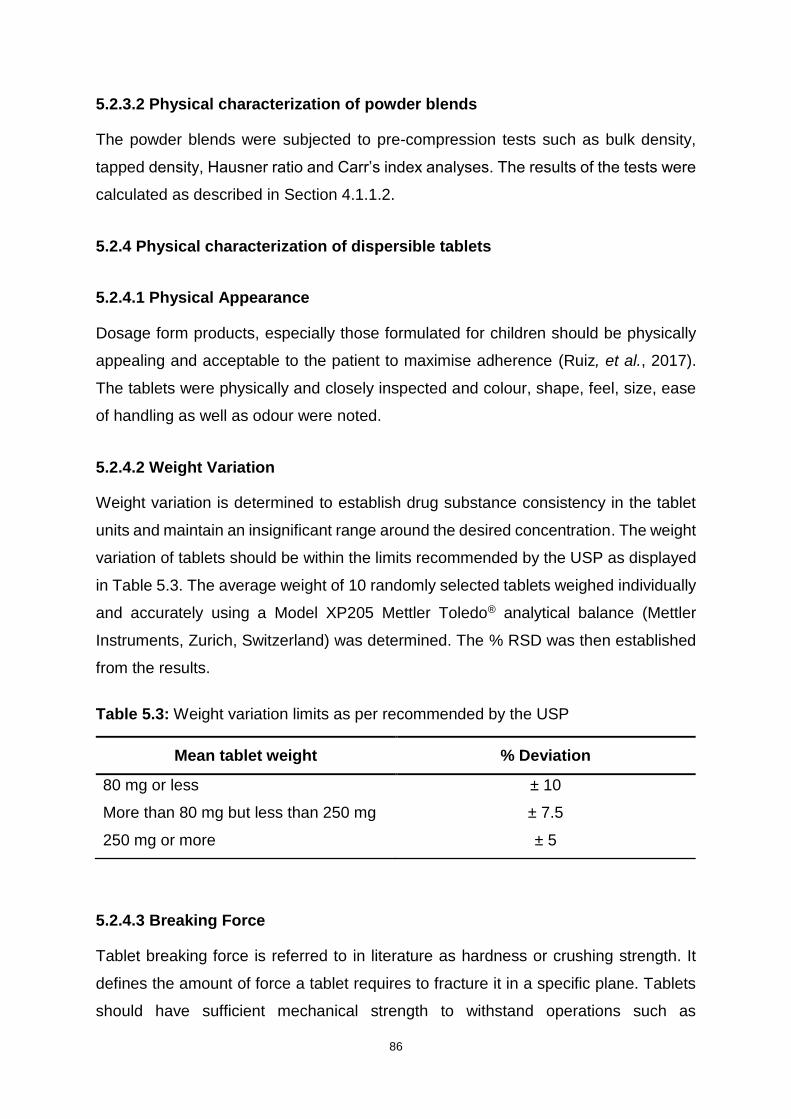
86
5.2.3.2 Physical characterization of powder blends
The powder blends were subjected to pre-compression tests such as bulk density,
tapped density, Hausner ratio and Carr’s index analyses. The results of the tests were
calculated as described in Section 4.1.1.2.
5.2.4 Physical characterization of dispersible tablets
5.2.4.1 Physical Appearance
Dosage form products, especially those formulated for children should be physically
appealing and acceptable to the patient to maximise adherence (Ruiz, et al., 2017).
The tablets were physically and closely inspected and colour, shape, feel, size, ease
of handling as well as odour were noted.
5.2.4.2 Weight Variation
Weight variation is determined to establish drug substance consistency in the tablet
units and maintain an insignificant range around the desired concentration. The weight
variation of tablets should be within the limits recommended by the USP as displayed
in Table 5.3. The average weight of 10 randomly selected tablets weighed individually
and accurately using a Model XP205 Mettler Toledo® analytical balance (Mettler
Instruments, Zurich, Switzerland) was determined. The % RSD was then established
from the results.
Table 5.3: Weight variation limits as per recommended by the USP
Mean tablet weight % Deviation
80 mg or less ± 10
More than 80 mg but less than 250 mg ± 7.5
250 mg or more ± 5
5.2.4.3 Breaking Force
Tablet breaking force is referred to in literature as hardness or crushing strength. It
defines the amount of force a tablet requires to fracture it in a specific plane. Tablets
should have sufficient mechanical strength to withstand operations such as
87
processing, packaging, transportation and handling without breaking, yet still be able
to disintegrate and liberate the active ingredient at the proper site (Mahato and
Narang, 2012). The breaking force and diameter parameters of tablets were
simultaneously established using Model TBH125 series tablet hardness tester
(Erweka® GmbH, Heusenstamm, Germany).
5.2.4.4 Friability
Friability describes the propensity of a tablet to crumble or shed powder due to falling
or from mechanical stress. The extent of tablet fragility depends on factors such as
compressed powder blend, hardness and shape (Allen and Ansel, 2014). As
recommended by the USP, the mean weight loss from samples should not exceed
1%. A sample of 10 tablets was tested for friability using a Model TA3R friabilator
(Erweka® GmbH, Heusenstamm, Germany). The tablets were dedusted and weighed
accurately using a Model XP205 Mettler Toledo® analytical balance (Mettler
Instruments, Zurich, Switzerland). They were then placed in the friabilator and the
device was set to rotate at 25 rpm for four minutes, allowing the tablets to tumble 100
times. The tablets were dedusted once more and accurately weighed. The friability
was evaluated using Equation 5.1:
Fr = (𝑤1−𝑤2
𝑤1) x100 Equation 5.1
Where,
Fr = friability
𝑤1= weight before rotation
𝑤2= weight after rotation
5.2.4.5 Disintegration test
Disintegration must occur for drug to be released and for dissolution and absorption
to take place. Disintegration is mainly a function of mechanical hardness and a
disintegration test is performed to measure the time it takes for tablets to completely
break up under specified conditions (Allen and Ansel, 2014). The test was performed
on all prepared batches using a model ZT 320 Series Disintegration Tester equipped
with an external temperature sensor and two beakers (Erweka®, Germany). The
apparatus beakers were filled with 900 ml of distilled water maintained at 25 ± 0.2 °C,
88
then six, randomly selected tablets were placed in the separate tubes of the basket-
rack and covered with a disk. The basket was set to oscillate vertically at a constant
frequency rate of 30 cycles per minute. The time for disintegration for each tablet was
recorded.
5.2.4.6 Tablet assay
To ensure that the tablets contain the prescribed dose of drug substance, tablets must
be assayed. Twenty randomly selected tablets were ground into fine powder using a
mortar and pestle. An amount equivalent to one tablet (900 mg) of the powder was
accurately weighed and quantitatively transferred into a 100 ml A-grade volumetric
flask. The drug substances were extracted by dissolving the powder using a mobile
phase solution consisting of distilled water, 0.025 M orthophosphoric acid buffer and
ACN in a ratio of 68:20:12, respectively, then made up to volume with the same
solution. The resultant solution was stirred using a Model STR-MH-180 magnetic
hotplate stirrer (FMH Instruments®, Cape Town, South Africa) then passed through a
12 µm pore sized filter paper. Exactly 1 ml was transferred into a 100 ml A-grade
volumetric flask and made up to volume with the mobile phase solution. This was
filtered once more again using a 12 µm pore sized filter paper. Samples of the resultant
solution were analysed in triplicate using the validated HPLC method detailed in
Chapter Three.
5.3. APPLICATION OF QUALITY BY DESIGN
5.3.1 Defining the quality target product profile (QTPP) for the formulation
As defined in Section 1.2, QTPP is a summary of ideal attributes or characteristics of
a drug product that ensure its efficacy and patient safety. These attributes need to be
achieved as they constitute the basis of a successful drug development design
(Sangshetti, et al., 2014). The QTPP prospectively sets the boundaries and goals of
the drug product and may be reviewed and improved as useful data is gathered at the
various steps of the development. The established QTPP helps to ensure that the
product is suitable for its intended use as the attributes are designed into the formula.
The identified QTPP are expressed as targets which form the basis for the
establishment of the cQAs (Food and Drug Administration, 2006).
89
Table 5.4 lays out the QTPP for the levofloxacin-pyrazinamide dispersible tablet.
Notwithstanding the fact that significant elements such as product stability and factors
of packaging may be identified as part of QTPP (Charoo, et al., 2012). This can provide
a scope for future studies to explore.
5.3.2 Identification of the critical quality attributes (cQAs)
The cQAs were derived from the identified targets of the QTPP. The cQAs express
the possible attributes that impact quality, safety and efficacy of the product. These
attributes are evaluated and monitored to determine the ones whose impact on drug
product is of high risk. The predicted risks are evaluated and prevented through quality
risk management (Charoo, et al., 2012). Table 5.5 displays the identified cQAs for the
formulation, and the table indicates that tablet disintegration is the most likely cQAs
that can be influenced by formulation and process variables. Subsequently, risk
assessment on tablet disintegration time attribute was performed and prioritised as
displayed in Tables 5.6 and 5.7, respectively.
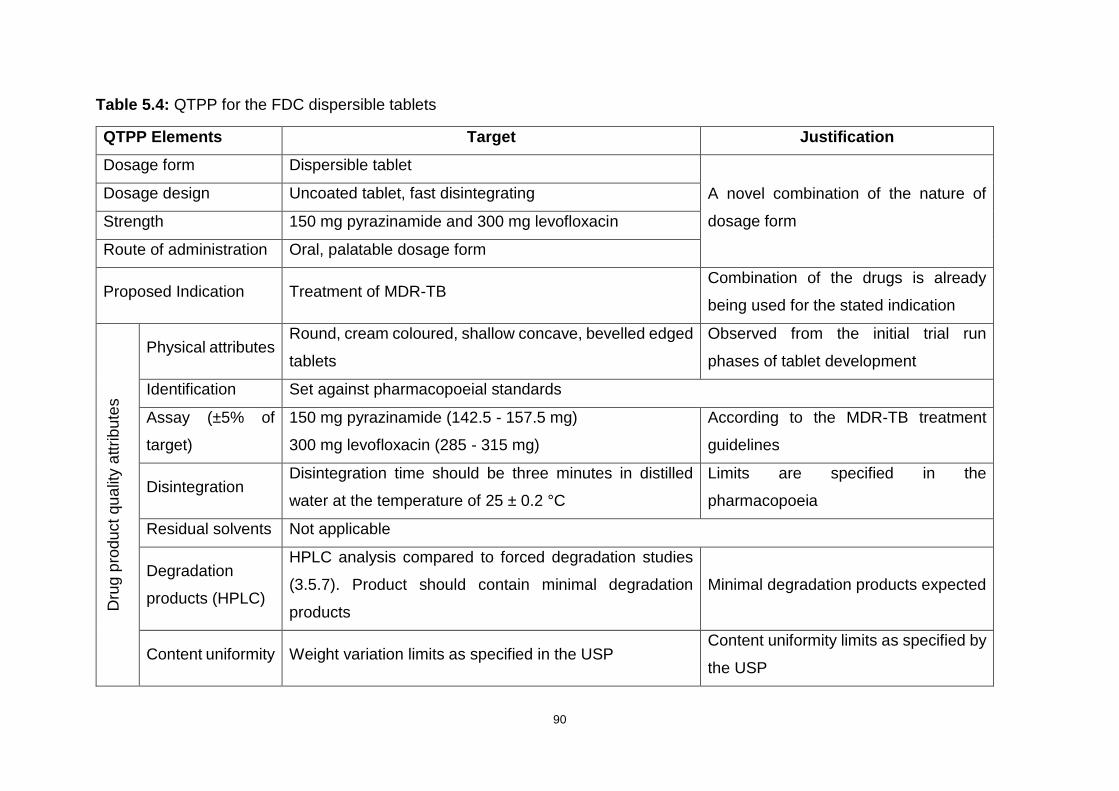
90
Table 5.4: QTPP for the FDC dispersible tablets
QTPP Elements Target Justification
Dosage form Dispersible tablet
A novel combination of the nature of
dosage form
Dosage design Uncoated tablet, fast disintegrating
Strength 150 mg pyrazinamide and 300 mg levofloxacin
Route of administration Oral, palatable dosage form
Proposed Indication Treatment of MDR-TB Combination of the drugs is already
being used for the stated indication
Dru
g p
rodu
ct
qu
alit
y a
ttrib
ute
s
Physical attributes Round, cream coloured, shallow concave, bevelled edged
tablets
Observed from the initial trial run
phases of tablet development
Identification Set against pharmacopoeial standards
Assay (±5% of
target)
150 mg pyrazinamide (142.5 - 157.5 mg)
300 mg levofloxacin (285 - 315 mg)
According to the MDR-TB treatment
guidelines
Disintegration Disintegration time should be three minutes in distilled
water at the temperature of 25 ± 0.2 °C
Limits are specified in the
pharmacopoeia
Residual solvents Not applicable
Degradation
products (HPLC)
HPLC analysis compared to forced degradation studies
(3.5.7). Product should contain minimal degradation
products
Minimal degradation products expected
Content uniformity Weight variation limits as specified in the USP Content uniformity limits as specified by
the USP

91
Table 5.5: Critical quality attributes (cQAs) for the FDC dispersible tablets
Quality Attributes Target cQA? Justification
Ph
ysic
al Im
pre
ssio
n
Appearance Round, white shallow concave,
bevelled edged tablets No
Tablet colour and shape are for patient acceptability and are not
directly linked to safety and efficacy.
Size Diameter and thickness to be
established No
Since the dispersible tablet will be dissolved in water before
swallowing, size is not a crucial factor
Odour No unpleasant odour No Noticeable odour affects patient acceptability and not directly
linked to safety and efficacy.
Uniformity of dosage
units Conforms to the USP No
Weight variation test was conducted for control of drug substance
uniformity in dosage units.
Breaking force To be established No Hardness may affect disintegration time, but is not critical
relating to safety and efficacy
Friability <1.0% w/w after 25 rpm for four
minutes No
As per compendial requirements for tablets, friability of less than
1.0% w/w of mean weight loss is acceptable for low impact on
patient safety and efficacy.
Disintegration Must be less than three minutes Yes Tablets should completely disintegrate rapidly in a small amount
of liquid and facilitate swallowing.
Assay
Positive for levofloxacin and
pyrazinamide. API doses to fall
within the ±5% allowance
Yes
Preformulation studies showed that assay for the drugs is within
specification, therefore, will not discussed as a cQA
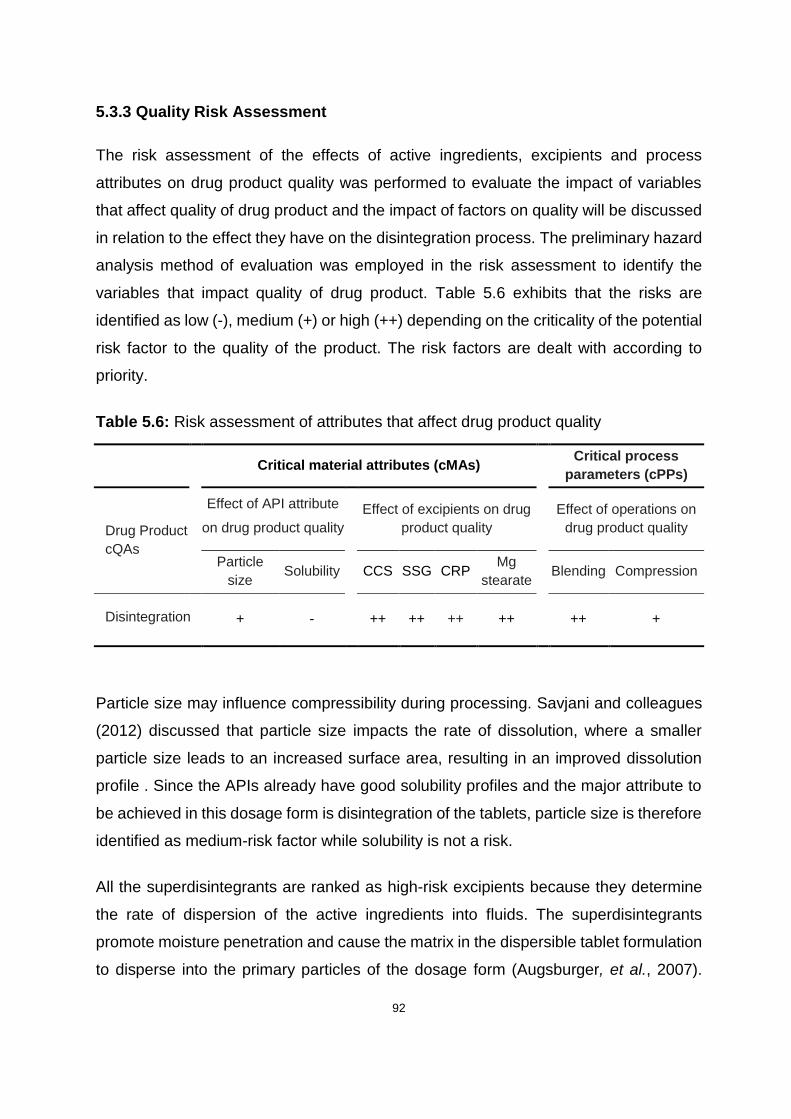
92
5.3.3 Quality Risk Assessment
The risk assessment of the effects of active ingredients, excipients and process
attributes on drug product quality was performed to evaluate the impact of variables
that affect quality of drug product and the impact of factors on quality will be discussed
in relation to the effect they have on the disintegration process. The preliminary hazard
analysis method of evaluation was employed in the risk assessment to identify the
variables that impact quality of drug product. Table 5.6 exhibits that the risks are
identified as low (-), medium (+) or high (++) depending on the criticality of the potential
risk factor to the quality of the product. The risk factors are dealt with according to
priority.
Table 5.6: Risk assessment of attributes that affect drug product quality
Critical material attributes (cMAs)
Critical process
parameters (cPPs)
Drug Product
cQAs
Effect of API attribute
on drug product quality
Effect of excipients on drug
product quality
Effect of operations on
drug product quality
Particle
size Solubility CCS SSG CRP
Mg
stearate Blending Compression
Disintegration
+ - ++ ++ ++ ++ ++ +
Particle size may influence compressibility during processing. Savjani and colleagues
(2012) discussed that particle size impacts the rate of dissolution, where a smaller
particle size leads to an increased surface area, resulting in an improved dissolution
profile . Since the APIs already have good solubility profiles and the major attribute to
be achieved in this dosage form is disintegration of the tablets, particle size is therefore
identified as medium-risk factor while solubility is not a risk.
All the superdisintegrants are ranked as high-risk excipients because they determine
the rate of dispersion of the active ingredients into fluids. The superdisintegrants
promote moisture penetration and cause the matrix in the dispersible tablet formulation
to disperse into the primary particles of the dosage form (Augsburger, et al., 2007).

93
Magnesium stearate is used as a lubricant and mainly influences the bonding strength
of particles within the tablets. Larger amounts of magnesium stearate have been shown
to cause tablet brittleness (Paul and Sun, 2017). Effects of magnesium stearate are
therefore classified as high-risk effects due to its possible high impact on tablet
disintegration. Research has found that powder blending time for the lubricant as well
as compression force applied in tableting during the direct compression stage may
have potential to affect the rate of tablet disintegration (Marais, et al., 2003).
5.3.4 Failure Mode and Effects Analysis
Failure mode and effects analysis (FMEA) has been implemented in diverse production
activities as a quality management tool to improve product quality. A FMEA is a
methodical system of predicting the likelihood of occurrence of process and product
failures and eliminating or ameliorating their consequences before they materialise. It
is normally conducted during the stages of product development and ensures
production of products that are without defect and safe for use (McDermott, et al.,
2009). The FMEA identifies the cMAs and the cPPs that tilt the cQAs of the product
outside the criteria described by the QTPP. Moreover, FMEA exposes and prioritises
possible effects of specific failure modes due to various materials and manufacturing
processes within.
Failure modes are possible ways in which a formulation process or product can fail
(Davis, et al., 2008). Potential effects of failure modes are determined by factors of
severity, occurrence and detection. Severity is the impact of failure, should it arise,
whereas occurrence estimates the probability of occurrence of failure and detection is
the probability that failure can be detected before the effects are displayed (McDermott,
et al., 2009). With the use of preformulation data, failure modes were identified and
rated according to estimated severity, occurrence and detection, on a scale of one to
ten, with ten being the highest. A risk priority number (RPN) was then generated by
determining the numerical product of the ranking for the three factors, as shown in
Table 5.7.

94
Table 5.7: FMEA analysis of FDC dispersible tablets depicting RPN of the failure modes
Attributes Item Process
Step/Input Potential
Failure Mode
Potential Effect of Failure S
eve
rity
Potential Cause for
Failure
Oc
cu
rren
ce
Current Risk Control
De
tec
tio
n
RPN
APIs Particle size Disintegration
Low
disintegration
in water
Failed
disintegration 8
Chemical
property of APIs 2
Control
disintegration 1 16
Excipients
Type &
percentage
of
disintegrant
composition
Disintegration
Undesirable
disintegration
time
Failed
disintegration 8
Incorrect
disintegrant or
disintegrant
quantity
7 Quality
control 3 168
Mg Stearate
Effects Disintegration
Long
disintegration
time
Failed
disintegration 7
Over or under
lubrication 3
Quality
control 1 21
Manufacturing
process
Blending Disintegration
Non-
homogenous
powder blend
Failed
disintegration 7
Powders not well
mixed 7
Control
blending time 3 174
Compression Disintegration
Tablet too
hard to
disintegrate
Failed
disintegration 5
Compression
force 4
Establish
best
compression
force
2 40
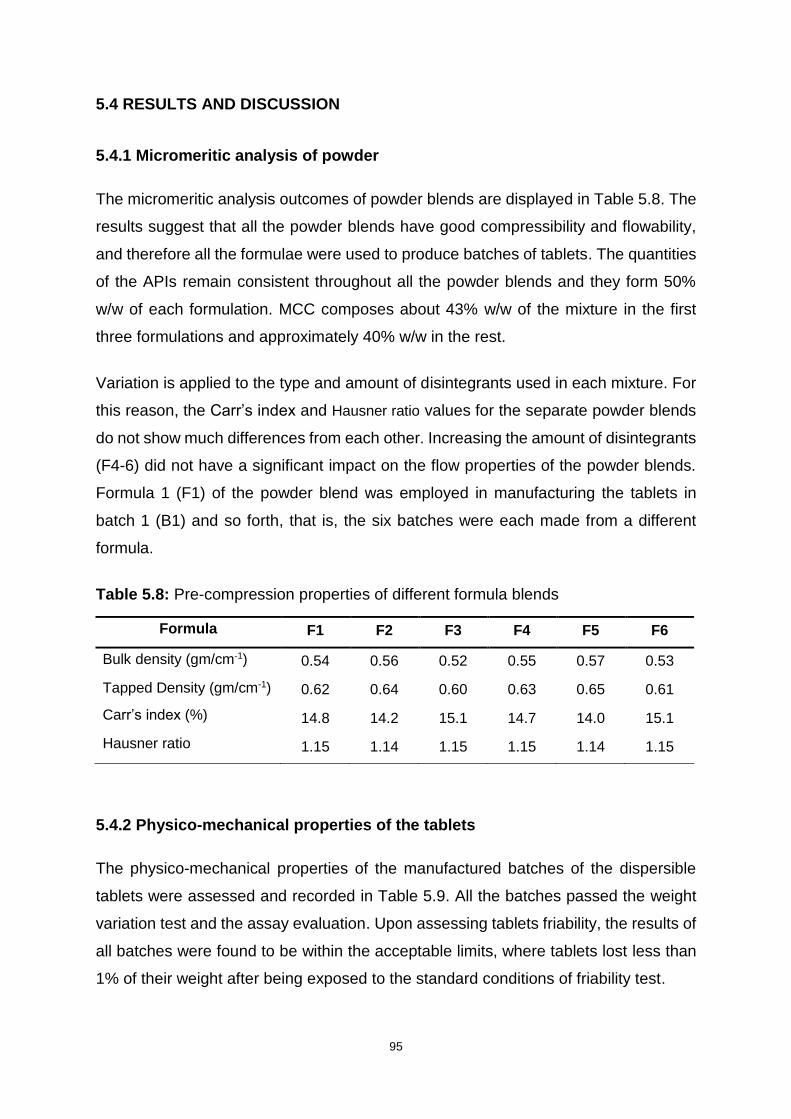
95
5.4 RESULTS AND DISCUSSION
5.4.1 Micromeritic analysis of powder
The micromeritic analysis outcomes of powder blends are displayed in Table 5.8. The
results suggest that all the powder blends have good compressibility and flowability,
and therefore all the formulae were used to produce batches of tablets. The quantities
of the APIs remain consistent throughout all the powder blends and they form 50%
w/w of each formulation. MCC composes about 43% w/w of the mixture in the first
three formulations and approximately 40% w/w in the rest.
Variation is applied to the type and amount of disintegrants used in each mixture. For
this reason, the Carr’s index and Hausner ratio values for the separate powder blends
do not show much differences from each other. Increasing the amount of disintegrants
(F4-6) did not have a significant impact on the flow properties of the powder blends.
Formula 1 (F1) of the powder blend was employed in manufacturing the tablets in
batch 1 (B1) and so forth, that is, the six batches were each made from a different
formula.
Table 5.8: Pre-compression properties of different formula blends
Formula F1 F2 F3 F4 F5 F6
Bulk density (gm/cm-1) 0.54 0.56 0.52 0.55 0.57 0.53
Tapped Density (gm/cm-1) 0.62 0.64 0.60 0.63 0.65 0.61
Carr’s index (%) 14.8 14.2 15.1 14.7 14.0 15.1
Hausner ratio 1.15 1.14 1.15 1.15 1.14 1.15
5.4.2 Physico-mechanical properties of the tablets
The physico-mechanical properties of the manufactured batches of the dispersible
tablets were assessed and recorded in Table 5.9. All the batches passed the weight
variation test and the assay evaluation. Upon assessing tablets friability, the results of
all batches were found to be within the acceptable limits, where tablets lost less than
1% of their weight after being exposed to the standard conditions of friability test.

96
The disintegration test times were acceptable for all batches. However, the batches
that were formulated with 5% w/w of disintegrants were found to be, on average, about
twice slower to disintegrate in comparison to those formulated with 8% w/w of the
disintegrant. The batch that contained SSG displayed the best disintegration
performance at 44 seconds, thereby selected as the most ideal batch. These results
coincide with those found in a research conducted by Desai and colleagues (2014)
where SSG was optimal at 8% w/w in aspirin and ibuprofen orodispersible tablets.
Table 5.9: Physico-mechanical evaluation of the tablets
Batch B1 B2 B3 B4 B5 B6
Weight
variation (mg) 897±0.91 905±1.13 855±0.97 912±0.97 909±1.18 879±1.17
Breaking
Force (N) 44.9±1.12 44.2±1.1 45.5±1.21 42.0±1.42 43.1±1.77 42.7±1.50
Friability
(% w/w) 0.81±0.07 0.75±0.10 0.69±0.09 0.65±0.06 0.64±0.04 0.70±0.07
Disintegration
(sec) 96.12±1.3 93.68±1.2 99.21±1.3 49.87±1.4 44.82±1.0 52.36±1.2
Levofloxacin
content (%) 101±0.89 99±1.2 99±1.8 98±2.13 98±1.21 101±0.91
Pyrazinamide
content (%) 99±1.05 98±2.01 102±0.66 97±1.14 99±1.11 101±1.01
* All values are presented as mean ± SD
5.4.3 Quality by design
As detailed in Chapter one and highlighted again in this chapter, the QbD method
gathers data already known about components and processes of manufacturing and
establishes the most suitable pathway to produce a quality product. After the QTPP
was defined and the cQAs identified, characteristics and parameters of the desired
drug product were set. This enabled prediction of possible problems that could
potentially upset the acceptable limits, hence quality risk assessment, as well as the
FMEA tool were utilised. The RPN then ranks the urgency for corrective action to avoid
or minimise potential failure mode.
97
Disintegration time due to the disintegrant used and its percentage composition
(% w/w) in formulation as well as blending time after addition of magnesium stearate
were the potential failure modes with RPN higher above 100 (Table 5.7), and therefore
called for further investigations, which were accomplished through DoE. All the other
modes were within the acceptable levels. The extent of impact of these variables were
investigated in the subsequent step of QbD in the next chapter.
5.5 CONCLUSIONS
Following a literature review, a suitable formulation design was developed, with six
different formulae from which six batches of the dispersible tablets were successfully
manufactured using direct compression method. Physical assessment of the tablets
showed that the rate of disintegration improved with use of 8% w/w of any of the
disintegrants compared to the 5% w/w composition, an indication that varying the
quantity of disintegrants has an impact on the rate of disintegration.
The variation test for all the batches was found to be within the ±5 limit as
recommended by the USP for uncoated tablets weighing more than 250 mg. In
addition, the batches passed the drug content assay test for both drug substances,
evidence that the blending time was adequate (Poux, et al., 1991). The batch
containing 5% w/w CSP (K90) displayed the slowest disintegration profile while the
batch formulated with 8% w/w of SSG showed the best performance from all the
formulations. Attributes that potentially affect quality of the dosage form were identified
and controlled using QbD. These variables will be used to pool data that will facilitate
optimisation of conditions to manufacture an improved version of the drug product in
the next chapter.
98
CHAPTER SIX
OPTIMISATION OF A DISPERSIBLE TABLET FORMULATION
6.1 INTRODUCTION
6.1.1 Optimisation
The term optimisation defines improving the performance of an existing process or
system so that it can deliver the maximum possible value. In pharmaceutical product
development relevance, optimisation refers to discovering the most suitable conditions
or proportions of excipients that allow a procedure or formulation to produce the best
response (Araujo and Brereton, 1996). The conventional optimisation techniques
monitored the influence of a single variable at a time while all the other parameters
were kept constant. As observed by Lundstedt (1998) and colleagues, the consequent
drawback of the method is that the entire effects of the factor on the response are not
shown. The other downside includes the use of an increased number of resources as
more experiments must be conducted.
The use of multivariate statistical techniques have been employed to overcome the
problems of conventional methods of pharmaceutical formulation optimisation. Among
the applicable multivariate methods used in analytical optimisation is a tool known as
statistical design of experiment (DoE) or experimental design (Tye, 2004). In DoE,
experiments are drawn up in a matrix manner and used to predict the possible
coefficients in an empirical mathematical model. The model subsequently predicts the
output of the formulation within limits (Lewis, 2007). Together with other statistical and
mathematical models, DoE is applied in a technique termed response surface
methodology (RSM), that maps the next experimentation phase (Tye, 2004).
6.1.2 Response surface methodology
Researchers agree that RSM is a set of carefully selected statistical strategies coupled
with mathematical techniques that are used to simultaneously establish a practical
relationship between various independent variables and a response from an
experimental design (Bezerra, et al., 2008; Khuri and Mukhopadhyay, 2010). In their
publication on the experimental attainment of optimum conditions, Box and Wilson

99
(1951) outline the details of their development of the RSM technique. The
experimental methodology creates a mathematical model that can be represented
graphically by a three-dimensional (3D) image or contour plot. The relationship
between the control (independent) variables and the (dependent) response is
expressed as shown by Equation 6.1 (Baş and Boyacı, 2007).
𝑦 = 𝑓(𝑥1 , 𝑥2 . . . , 𝑥𝑛) + 𝜀 Equation 6.1
Where,
𝑦 = Response
𝑥1 , 𝑥2 . . . , 𝑥𝑛 = Control Variables
𝑛 = Number of control variables
𝜀 = Error observed in the response
As per recommendations by Khuri (2017), a RSM study should always start with
specifying the problem and planning the experimental variables. The study can be
accomplished by following the steps outlined below.
i. Setting up the selected experimental design to adequately approximate response
values for given control variables.
ii. Determining the significance of data obtained from the selected design through
fitting the hypothesised empirical model.
iii. Establishing the optimal composition of the model’s control variables that produce
the most favourable response.
6.2 EXPERIMENTAL
6.2.1 Proposed evaluation design
After the potential high-risk factors that affect the cQAs had been identified, an
experimental design had to be performed to determine the significance of the effects
of these risks. The risk assessment segment of QbD, coupled with literature search,
pre-formulation studies and preliminary tablet formulations completed in the previous
chapter identified the major parameters that have important influence on cQAs. These
were found to be blending time, in addition to disintegrant quantity in the formulation.

100
The aim of experimental screening phase is to discern the extent that each of the
factors have on the overall formulation performance in respect to the cQAs. Due to the
disintegration performance of the batch (B5) formulated using formula (F5) as
displayed in Table 5.2, the formula was adopted and employed to work as a basic
reference. The disintegrant quantity in the formulation as well as blending time after
addition of magnesium stearate were varied. Table 6.1 shows the basic formula for
experimental batches.
Table 6.1: The basic formula of the experimental batches
Excipients Quantity
Levofloxacin 150 mg
Pyrazinamide 300 mg
Sodium starch glycolate (SSG) 5-8%
Colloidal silicon dioxide (CSD) 15 mg
MCC (Avicel® PH-102) q.s.
Mg Stearate 5 mg
Total 900 mg
6.2.2 Materials and equipment
The materials and equipment described in Sections 5.2.1 and 5.2.2 respectively were
the same as utilised during the optimisation phase of this study.
6.2.3 Design of Experiments
6.2.3.1 Central composite design (CCD)
The initial protocol of optimising dispersible tablets formulation involved experimental
design which was accomplished by screening the batches using response surface
method in a nature of central composite design. The CCD with three levels and two
factors was selected as the method of choice and applied to in the optimisation of
parameters of manufacturing the dispersible tablets.
The CCD was described by Box and Wilson and the design can be represented by a
cube with different marking points as exhibited in Figure 6.1, where (ο) is the center

101
point, (●) is factorial design and (×) denotes axial or star points (Lundstedt, et al.,
1998). There are six axial or star points that lie in the center of each face of the cube
which represent experimental runs and when projected, they cross each other at the
center point of the cube.
Figure 6.1: Basic central composite design with three variables (Adapted: Lundstedt,
et al., 1998)
The independent factors are investigated at five levels which are signified by -α, -1, 0,
+1 and +α coded values. The space that separates star points from the center point of
a uniformly routable CCD is determined by the number of variable factors and may be
calculated using Equation 6.2 (Bezerra, et al., 2008).
𝑎 =𝑘
24 Equation 6.2
Where,
α = axial point
𝑘 = factor number
Several experiments are required for the design to be successful, and the number of
experiments can be determined by Equation 6.3. The experiment number provides an
indication of the resources required to produce adequate data for the study.
N = 𝑘 2 +2 𝑘 + C0 Equation 6.3
Where,
N = experiment number
102
𝑘 = factor number
C0 = replicate number of the central point
The advantages of CCD include the fact that the system efficiently generates adequate
data on effects of experimental variables from a minimum number of runs, even when
the experimental plan involves only two variables. Other designs such as Box-
Behnken require three or more input variables. There is a good range of CCD forms
which permits a flexible choice of different types of experimental conditions. The
design also allows for sequential analysis, where the first set analyses two-factor and
linear interaction effects, followed by estimation of curvature effects. Should the initial
set of experiments indicate insignificant curvature effects, the subsequent runs need
not be carried out (Montgomery, 2013).
In a study where CCD was eventually ranked as the best method of choice for
accomplishing DoE within that study, CCD was found to have the ability to combine
more extreme factors and include borderline regions compared to other designs
(Rakic´, et al., 2014). Drawbacks of CCD were revealed in another study that was
conducted to compare CCD and Taguchi method in an optimisation method. The study
concluded that CCD method required more experimental runs, showed low efficiency
in the product manufactured under the suggested conditions and quantification of
contribution of some factors was not possible (Asghar, et al., 2014).
6.2.3.2 Central composite design model
The set-up of experiments and evaluation of effects of the variable factors and
responses were performed using RSM based on CCD with center and axial points to
fit quadratic models. This was achieved with the aid of a statistical data analysis
software, Design-Expert® version 7.0.0 software (Stat-Ease Inc., Minneapolis, USA).
According to risk assessment of QbD, the most important parameters that affect
disintegration time of the dispersible tablets are disintegrant quantity in the formulation
and blending time after addition of a glidant. These factors are the control variables to
be investigated and optimised as shown in Table 6.2. The table also reveals the levels
within which the factors were investigated.
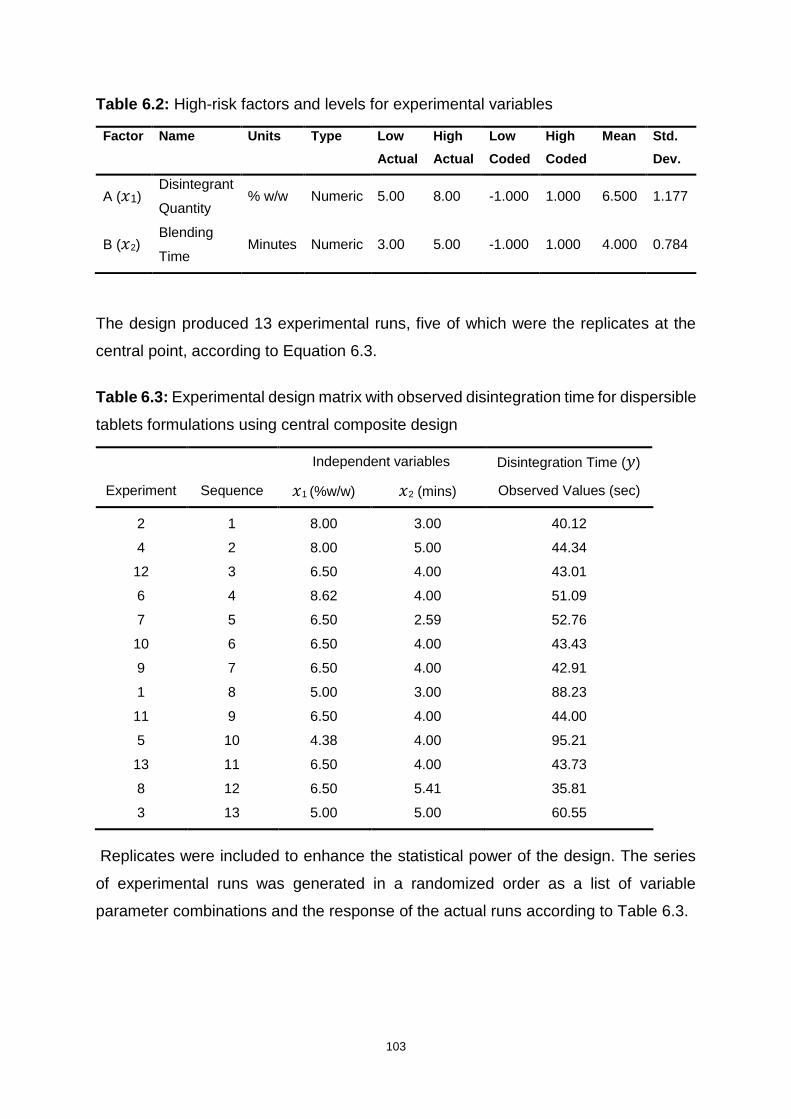
103
Table 6.2: High-risk factors and levels for experimental variables
Factor Name Units Type Low
Actual
High
Actual
Low
Coded
High
Coded
Mean Std.
Dev.
A (𝑥1) Disintegrant
Quantity % w/w Numeric 5.00 8.00 -1.000 1.000 6.500 1.177
B (𝑥2) Blending
Time Minutes Numeric 3.00 5.00 -1.000 1.000 4.000 0.784
The design produced 13 experimental runs, five of which were the replicates at the
central point, according to Equation 6.3.
Table 6.3: Experimental design matrix with observed disintegration time for dispersible
tablets formulations using central composite design
Independent variables Disintegration Time (𝑦)
Experiment Sequence 𝑥1 (%w/w) 𝑥2 (mins) Observed Values (sec)
2 1 8.00 3.00 40.12
4 2 8.00 5.00 44.34
12 3 6.50 4.00 43.01
6 4 8.62 4.00 51.09
7 5 6.50 2.59 52.76
10 6 6.50 4.00 43.43
9 7 6.50 4.00 42.91
1 8 5.00 3.00 88.23
11 9 6.50 4.00 44.00
5 10 4.38 4.00 95.21
13 11 6.50 4.00 43.73
8 12 6.50 5.41 35.81
3 13 5.00 5.00 60.55
Replicates were included to enhance the statistical power of the design. The series
of experimental runs was generated in a randomized order as a list of variable
parameter combinations and the response of the actual runs according to Table 6.3.
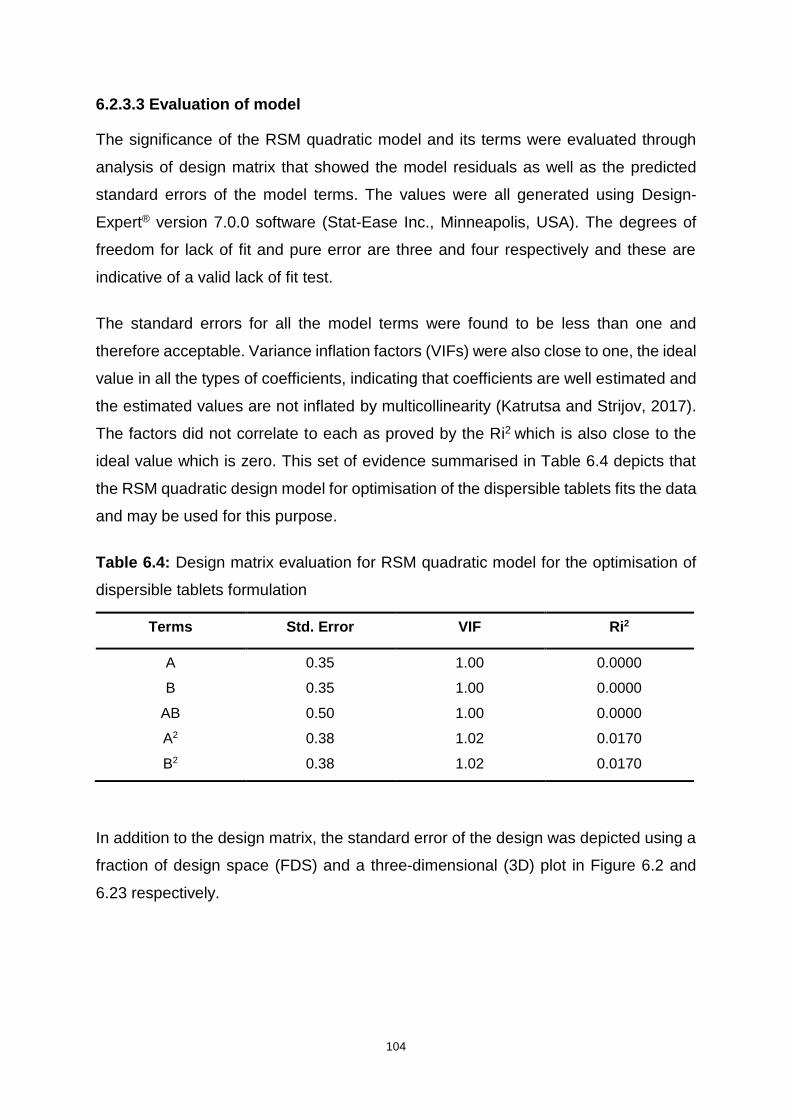
104
6.2.3.3 Evaluation of model
The significance of the RSM quadratic model and its terms were evaluated through
analysis of design matrix that showed the model residuals as well as the predicted
standard errors of the model terms. The values were all generated using Design-
Expert® version 7.0.0 software (Stat-Ease Inc., Minneapolis, USA). The degrees of
freedom for lack of fit and pure error are three and four respectively and these are
indicative of a valid lack of fit test.
The standard errors for all the model terms were found to be less than one and
therefore acceptable. Variance inflation factors (VIFs) were also close to one, the ideal
value in all the types of coefficients, indicating that coefficients are well estimated and
the estimated values are not inflated by multicollinearity (Katrutsa and Strijov, 2017).
The factors did not correlate to each as proved by the Ri2 which is also close to the
ideal value which is zero. This set of evidence summarised in Table 6.4 depicts that
the RSM quadratic design model for optimisation of the dispersible tablets fits the data
and may be used for this purpose.
Table 6.4: Design matrix evaluation for RSM quadratic model for the optimisation of
dispersible tablets formulation
Terms Std. Error VIF Ri2
A 0.35 1.00 0.0000
B 0.35 1.00 0.0000
AB 0.50 1.00 0.0000
A2 0.38 1.02 0.0170
B2 0.38 1.02 0.0170
In addition to the design matrix, the standard error of the design was depicted using a
fraction of design space (FDS) and a three-dimensional (3D) plot in Figure 6.2 and
6.23 respectively.
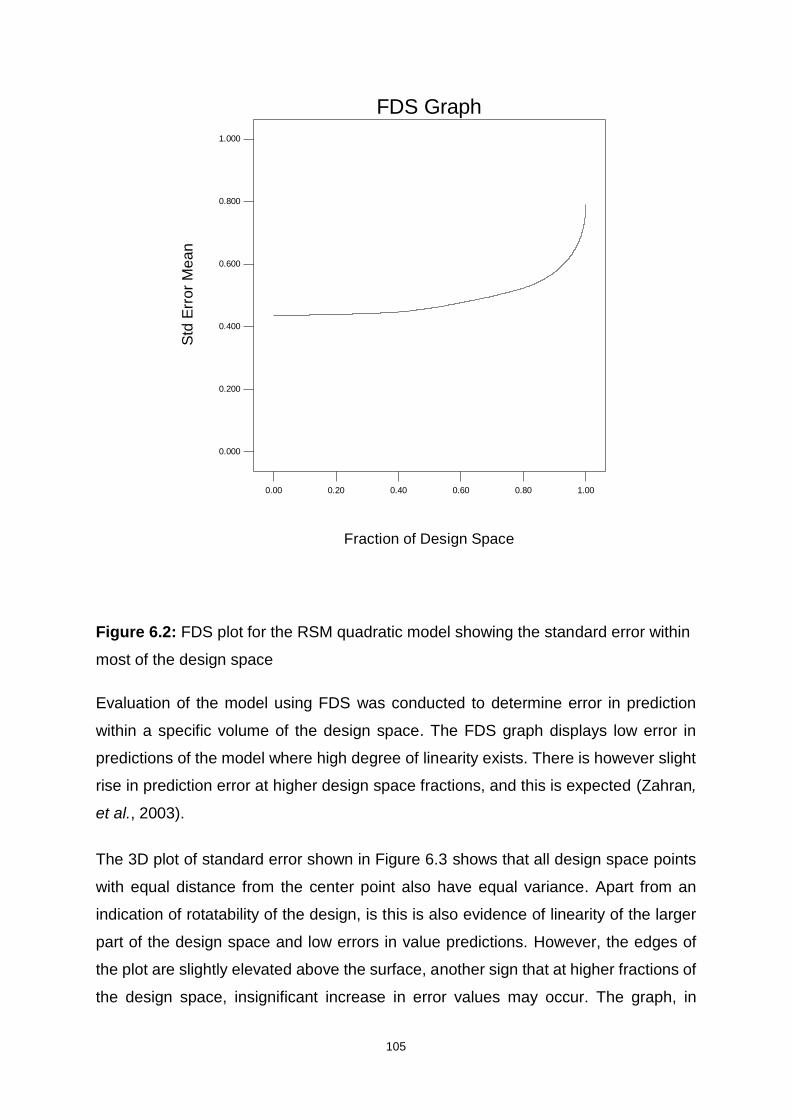
105
Figure 6.2: FDS plot for the RSM quadratic model showing the standard error within
most of the design space
Evaluation of the model using FDS was conducted to determine error in prediction
within a specific volume of the design space. The FDS graph displays low error in
predictions of the model where high degree of linearity exists. There is however slight
rise in prediction error at higher design space fractions, and this is expected (Zahran,
et al., 2003).
The 3D plot of standard error shown in Figure 6.3 shows that all design space points
with equal distance from the center point also have equal variance. Apart from an
indication of rotatability of the design, is this is also evidence of linearity of the larger
part of the design space and low errors in value predictions. However, the edges of
the plot are slightly elevated above the surface, another sign that at higher fractions of
the design space, insignificant increase in error values may occur. The graph, in
Design-Expert® Software
Min Std Error Mean: 0.436
Avg Std Error Mean: 0.490
Max Std Error Mean: 0.791
Cuboidal
radius = 1
Points = 100000
t(0.05/2,7) = 2.36462
0.00 0.20 0.40 0.60 0.80 1.00
0.000
0.200
0.400
0.600
0.800
1.000
FDS Graph
Fraction of Design Space
Std
Err
or
Me
an
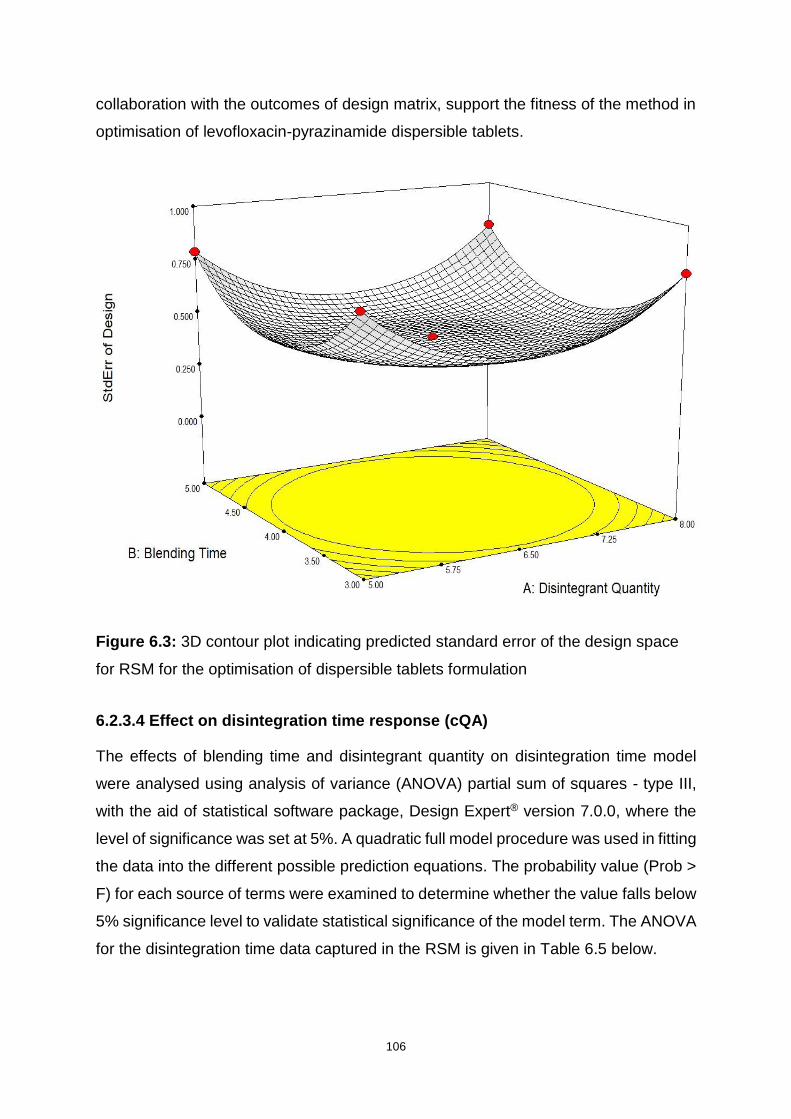
106
collaboration with the outcomes of design matrix, support the fitness of the method in
optimisation of levofloxacin-pyrazinamide dispersible tablets.
Figure 6.3: 3D contour plot indicating predicted standard error of the design space
for RSM for the optimisation of dispersible tablets formulation
6.2.3.4 Effect on disintegration time response (cQA)
The effects of blending time and disintegrant quantity on disintegration time model
were analysed using analysis of variance (ANOVA) partial sum of squares - type III,
with the aid of statistical software package, Design Expert® version 7.0.0, where the
level of significance was set at 5%. A quadratic full model procedure was used in fitting
the data into the different possible prediction equations. The probability value (Prob >
F) for each source of terms were examined to determine whether the value falls below
5% significance level to validate statistical significance of the model term. The ANOVA
for the disintegration time data captured in the RSM is given in Table 6.5 below.
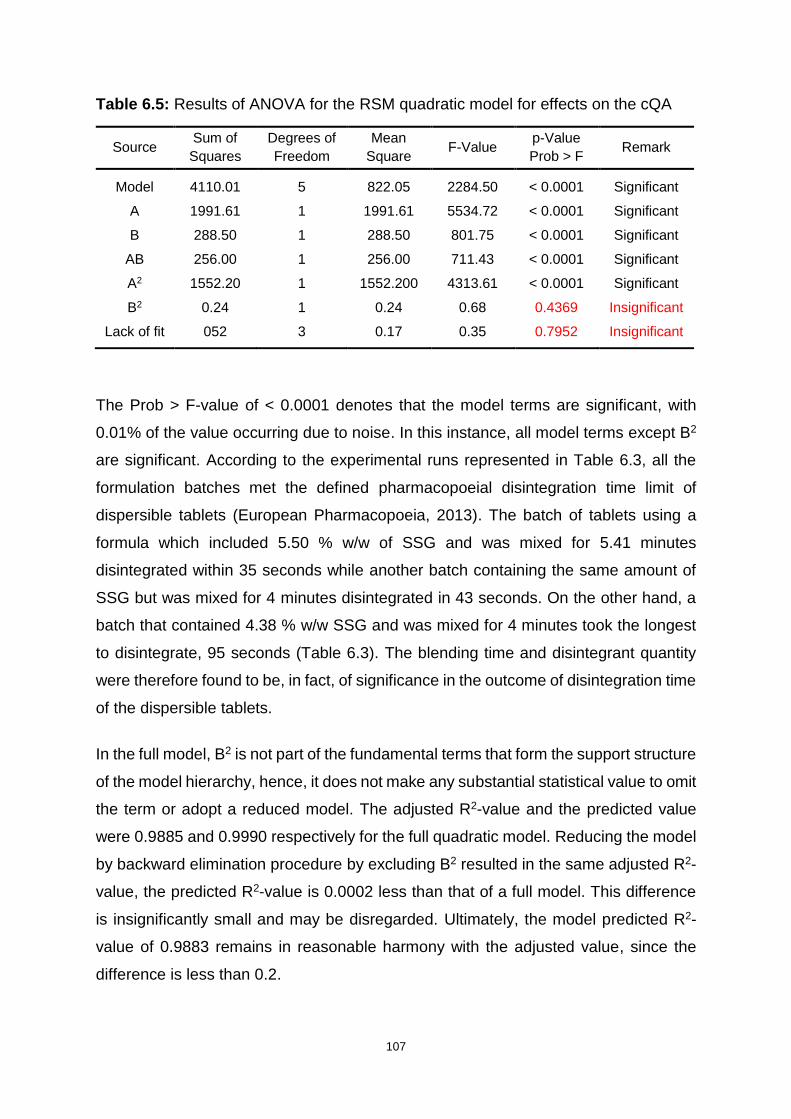
107
Table 6.5: Results of ANOVA for the RSM quadratic model for effects on the cQA
Source Sum of
Squares
Degrees of
Freedom
Mean
Square F-Value
p-Value
Prob > F Remark
Model 4110.01 5 822.05 2284.50 < 0.0001 Significant
A 1991.61 1 1991.61 5534.72 < 0.0001 Significant
B 288.50 1 288.50 801.75 < 0.0001 Significant
AB 256.00 1 256.00 711.43 < 0.0001 Significant
A2 1552.20 1 1552.200 4313.61 < 0.0001 Significant
B2 0.24 1 0.24 0.68 0.4369 Insignificant
Lack of fit 052 3 0.17 0.35 0.7952 Insignificant
The Prob > F-value of < 0.0001 denotes that the model terms are significant, with
0.01% of the value occurring due to noise. In this instance, all model terms except B2
are significant. According to the experimental runs represented in Table 6.3, all the
formulation batches met the defined pharmacopoeial disintegration time limit of
dispersible tablets (European Pharmacopoeia, 2013). The batch of tablets using a
formula which included 5.50 % w/w of SSG and was mixed for 5.41 minutes
disintegrated within 35 seconds while another batch containing the same amount of
SSG but was mixed for 4 minutes disintegrated in 43 seconds. On the other hand, a
batch that contained 4.38 % w/w SSG and was mixed for 4 minutes took the longest
to disintegrate, 95 seconds (Table 6.3). The blending time and disintegrant quantity
were therefore found to be, in fact, of significance in the outcome of disintegration time
of the dispersible tablets.
In the full model, B2 is not part of the fundamental terms that form the support structure
of the model hierarchy, hence, it does not make any substantial statistical value to omit
the term or adopt a reduced model. The adjusted R2-value and the predicted value
were 0.9885 and 0.9990 respectively for the full quadratic model. Reducing the model
by backward elimination procedure by excluding B2 resulted in the same adjusted R2-
value, the predicted R2-value is 0.0002 less than that of a full model. This difference
is insignificantly small and may be disregarded. Ultimately, the model predicted R2-
value of 0.9883 remains in reasonable harmony with the adjusted value, since the
difference is less than 0.2.
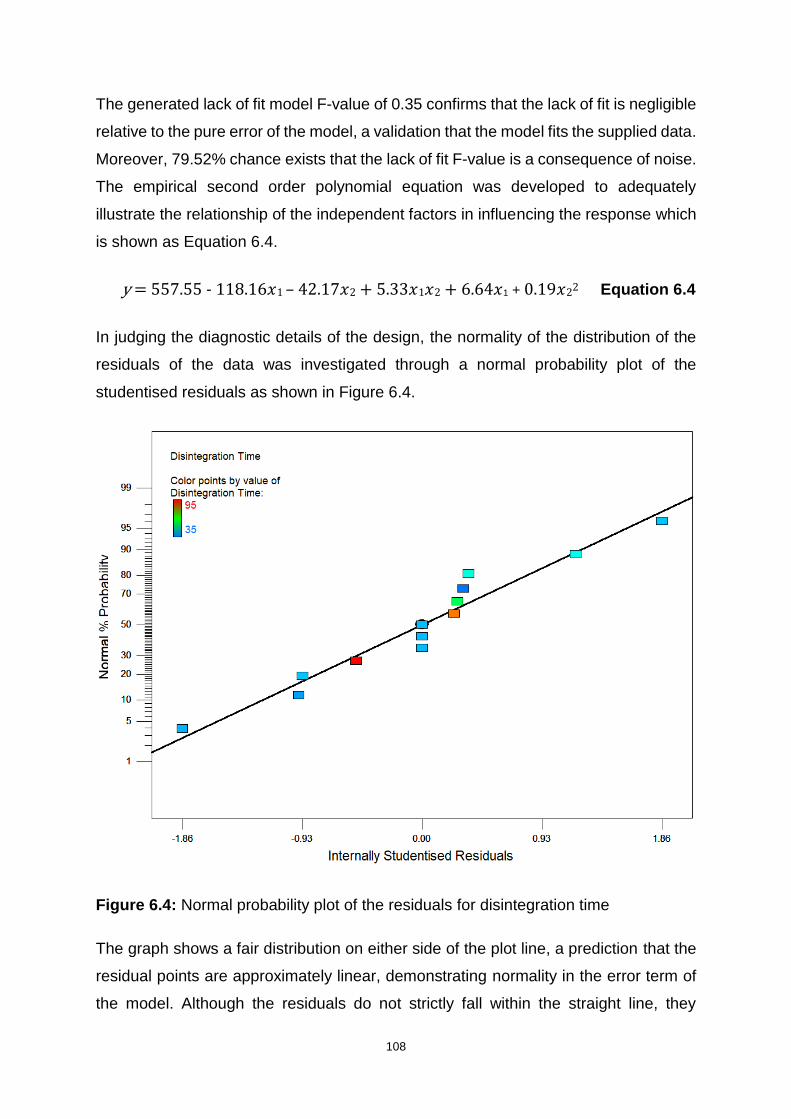
108
The generated lack of fit model F-value of 0.35 confirms that the lack of fit is negligible
relative to the pure error of the model, a validation that the model fits the supplied data.
Moreover, 79.52% chance exists that the lack of fit F-value is a consequence of noise.
The empirical second order polynomial equation was developed to adequately
illustrate the relationship of the independent factors in influencing the response which
is shown as Equation 6.4.
y = 557.55 - 118.16𝑥1 – 42.17𝑥2 + 5.33𝑥1𝑥2 + 6.64𝑥1 + 0.19𝑥22 Equation 6.4
In judging the diagnostic details of the design, the normality of the distribution of the
residuals of the data was investigated through a normal probability plot of the
studentised residuals as shown in Figure 6.4.
Figure 6.4: Normal probability plot of the residuals for disintegration time
The graph shows a fair distribution on either side of the plot line, a prediction that the
residual points are approximately linear, demonstrating normality in the error term of
the model. Although the residuals do not strictly fall within the straight line, they

109
however do not show trending towards one side of the graph. This implies that there
might be other uncontrolled external factors that may be changing in the experiments
and are influencing the response. Nevertheless, these factors appear to have
negligible impact on the overall trend of the response.
Furthermore, predicted values of response weighed against actual experimental
response values were used to determine suitability of the proposed model to make
estimations within the design space. Figure 6.5 shows the predicted against actual
data obtained from the experiments to check for constant error. A near-linear graph
was produced as evidence that the disintegration time that was observed from
experimental runs was in a reasonably descent range from that predicted by the
model. This suggests that the model is an acceptable prediction tool in manufacturing
dispersible tablets using the materials and conditions set in this study.
Figure 6.5: Predicted versus actual value plot for disintegration time
110
A plot of externally studentised residuals was generated to check the consistence of
each run, in relation to other runs - a way to detect outliers. Outliers are observations
that appear to distinctly deviate from the rest of the sample members due to different
causes factors (Grubbs, 1969). Shalabh (2009) reports that using externally
studentised residuals instead of other types of residuals increases the sensitivity in
detecting outliers. As observed in Figure 6.6, all the response values are found within
the 95% confidence interval and satisfy the three-sigma rule, with no outliers. The 13
runs all show externally studentised residual values within the calculated limits of -4.56
and +4.56.
Figure 6.6: Externally studentised residual plot for disintegration time response
As mentioned earlier, both disintegrant quantity and blending time factors have
significant influence in determining the disintegration time. The response values will
vary depending on the different levels of these two variables. An interaction exists as
shown by the interaction graph in Figure 6.7. The two non-parallel lines intersect,
indicating that the effect of one factor is dependent on the level of the other.
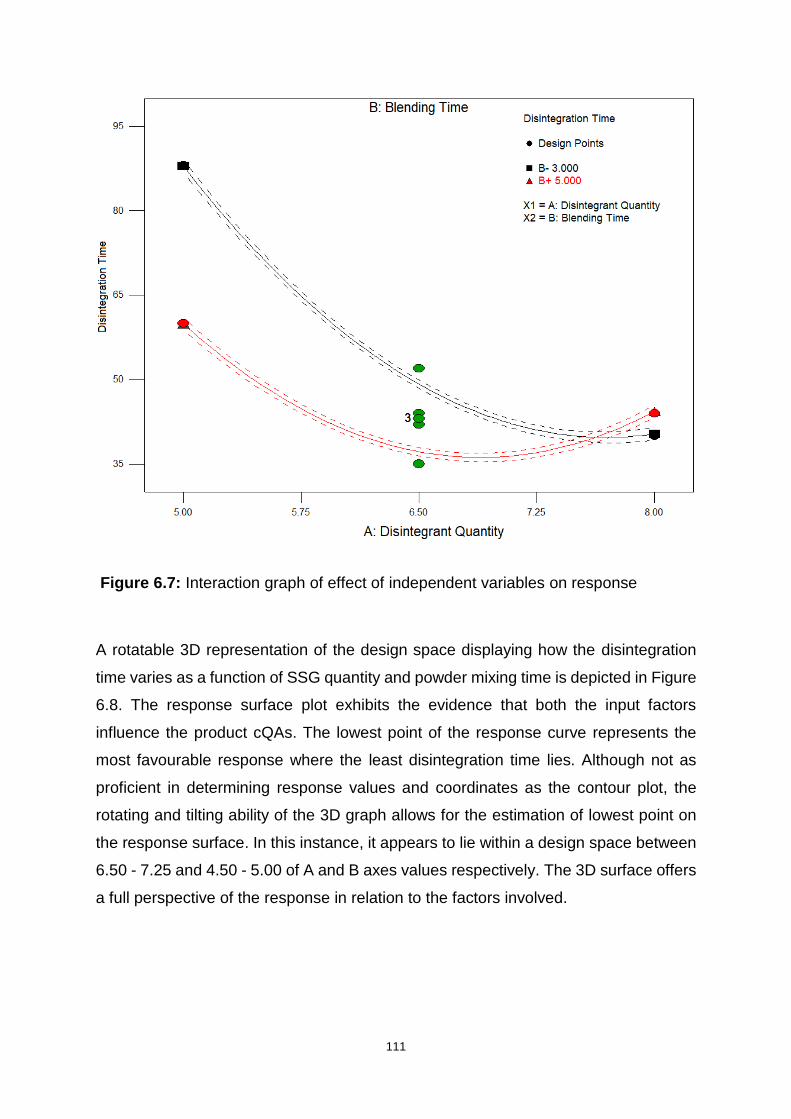
111
Figure 6.7: Interaction graph of effect of independent variables on response
A rotatable 3D representation of the design space displaying how the disintegration
time varies as a function of SSG quantity and powder mixing time is depicted in Figure
6.8. The response surface plot exhibits the evidence that both the input factors
influence the product cQAs. The lowest point of the response curve represents the
most favourable response where the least disintegration time lies. Although not as
proficient in determining response values and coordinates as the contour plot, the
rotating and tilting ability of the 3D graph allows for the estimation of lowest point on
the response surface. In this instance, it appears to lie within a design space between
6.50 - 7.25 and 4.50 - 5.00 of A and B axes values respectively. The 3D surface offers
a full perspective of the response in relation to the factors involved.
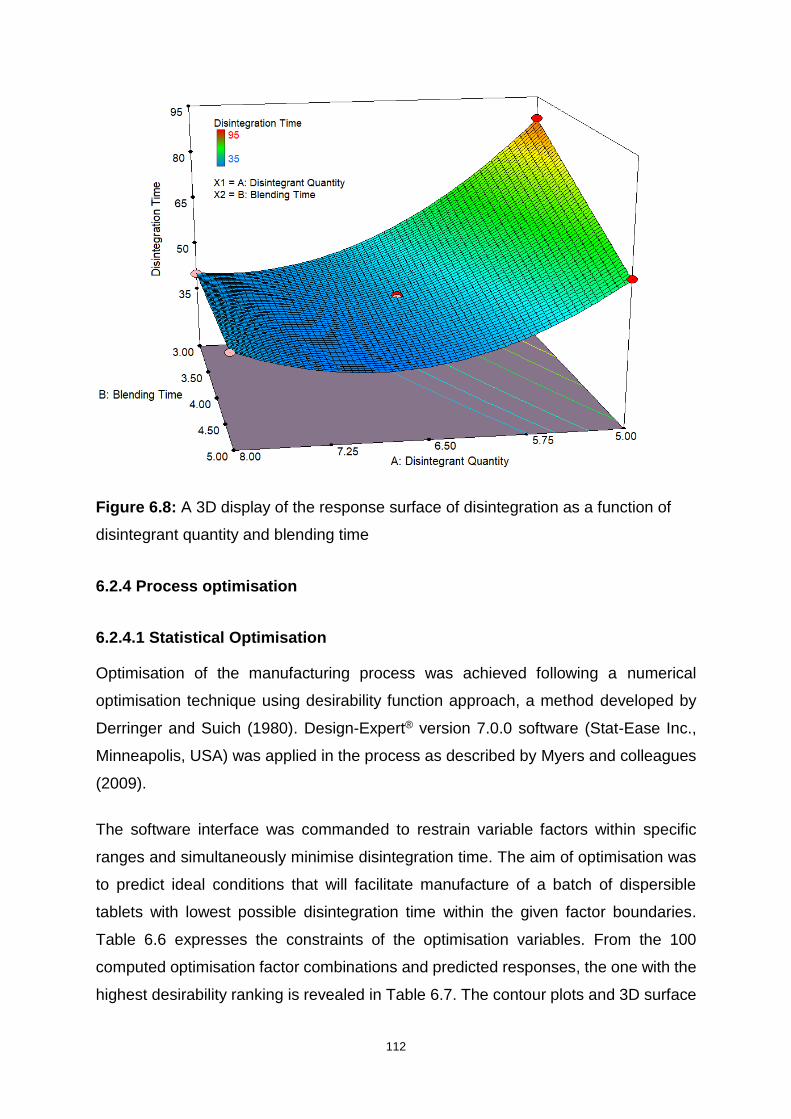
112
Figure 6.8: A 3D display of the response surface of disintegration as a function of
disintegrant quantity and blending time
6.2.4 Process optimisation
6.2.4.1 Statistical Optimisation
Optimisation of the manufacturing process was achieved following a numerical
optimisation technique using desirability function approach, a method developed by
Derringer and Suich (1980). Design-Expert® version 7.0.0 software (Stat-Ease Inc.,
Minneapolis, USA) was applied in the process as described by Myers and colleagues
(2009).
The software interface was commanded to restrain variable factors within specific
ranges and simultaneously minimise disintegration time. The aim of optimisation was
to predict ideal conditions that will facilitate manufacture of a batch of dispersible
tablets with lowest possible disintegration time within the given factor boundaries.
Table 6.6 expresses the constraints of the optimisation variables. From the 100
computed optimisation factor combinations and predicted responses, the one with the
highest desirability ranking is revealed in Table 6.7. The contour plots and 3D surface
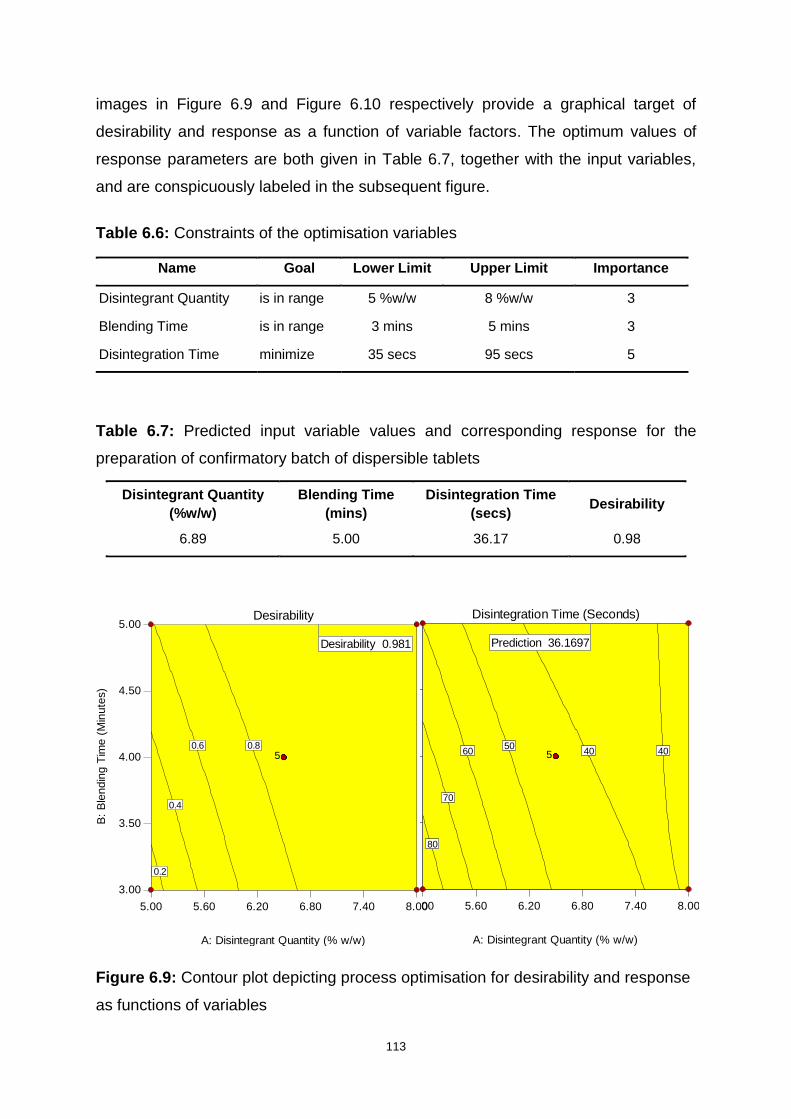
113
images in Figure 6.9 and Figure 6.10 respectively provide a graphical target of
desirability and response as a function of variable factors. The optimum values of
response parameters are both given in Table 6.7, together with the input variables,
and are conspicuously labeled in the subsequent figure.
Table 6.6: Constraints of the optimisation variables
Name Goal Lower Limit Upper Limit Importance
Disintegrant Quantity is in range 5 %w/w 8 %w/w 3
Blending Time is in range 3 mins 5 mins 3
Disintegration Time minimize 35 secs 95 secs 5
Table 6.7: Predicted input variable values and corresponding response for the
preparation of confirmatory batch of dispersible tablets
Disintegrant Quantity
(%w/w)
Blending Time
(mins)
Disintegration Time
(secs) Desirability
6.89 5.00 36.17 0.98
Figure 6.9: Contour plot depicting process optimisation for desirability and response
as functions of variables
Design-Expert® SoftwareFactor Coding: ActualAll Responses
Design Points1.000
0.000
X1 = A: Disintegrant QuantityX2 = B: Blending Time
5.00 5.60 6.20 6.80 7.40 8.00
3.00
3.50
4.00
4.50
5.00Desirability
A: Disintegrant Quantity (% w/w)
B:
Ble
ndin
g T
ime (
Min
ute
s)
0.2
0.4
0.6 0.85
Desirability 0.981
5.00 5.60 6.20 6.80 7.40 8.00
3.00
3.50
4.00
4.50
5.00Disintegration Time (Seconds)
A: Disintegrant Quantity (% w/w)
B:
Ble
ndin
g T
ime (
Min
ute
s)
40 4050
60
70
80
5
Prediction 36.1697
Design-Expert® SoftwareFactor Coding: ActualAll Responses
Design Points1.000
0.000
X1 = A: Disintegrant QuantityX2 = B: Blending Time
5.00 5.60 6.20 6.80 7.40 8.00
3.00
3.50
4.00
4.50
5.00Desirability
A: Disintegrant Quantity (% w/w)
B:
Ble
nd
ing
Tim
e (
Min
ute
s)
0.2
0.4
0.6 0.85
Desirability 0.981
5.00 5.60 6.20 6.80 7.40 8.00
3.00
3.50
4.00
4.50
5.00Disintegration Time (Seconds)
A: Disintegrant Quantity (% w/w)
B:
Ble
nd
ing
Tim
e (
Min
ute
s)
40 4050
60
70
80
5
Prediction 36.1697
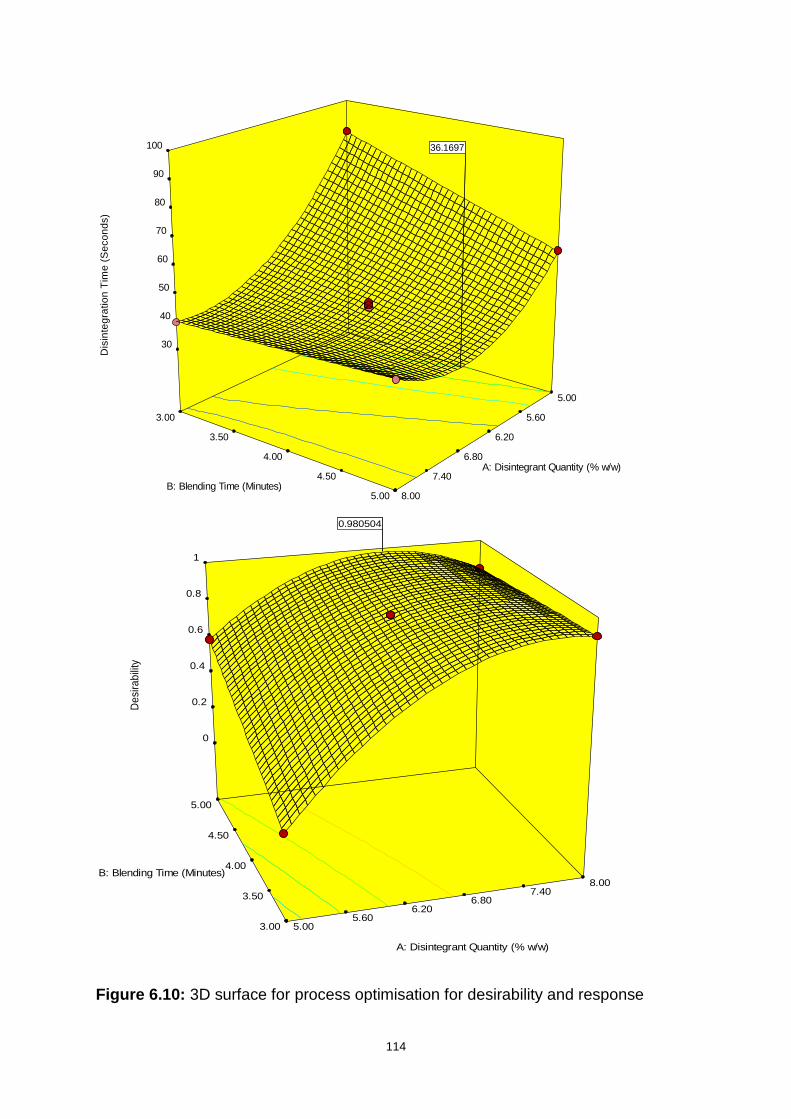
114
Figure 6.10: 3D surface for process optimisation for desirability and response
Design-Expert® Software
Factor Coding: Actual
Disintegration Time (Seconds)
Design points above predicted value
Design points below predicted value
95
35
X1 = A: Disintegrant Quantity
X2 = B: Blending Time
3.00
3.50
4.00
4.50
5.00
5.00
5.60
6.20
6.80
7.40
8.00
30
40
50
60
70
80
90
100
Dis
inte
gra
tio
n T
ime
(S
eco
nd
s)
A: Disintegrant Quantity (% w/w)
B: Blending Time (Minutes)
36.169736.1697
Design-Expert® Software
Factor Coding: Actual
Desirability
1
0
X1 = A: Disintegrant Quantity
X2 = B: Blending Time
3.00
3.50
4.00
4.50
5.00
5.00 5.60
6.20 6.80
7.40 8.00
0
0.2
0.4
0.6
0.8
1
De
sira
bili
ty
A: Disintegrant Quantity (% w/w)
B: Blending Time (Minutes)
0.9805040.980504

115
6.2.3.2 Analysis of confirmatory batch
Predicted input variable values from solution number 1 (Table 6.7) were used for the
actual preparation of the optimised batch. The aim of the exercise was to manufacture
a confirmatory batch of dispersible tablets using the optimised parameters. The actual
measured response of the batch should agree with the hypothesised product cQAs
values to affirm if the developed model is accurate and can be used for prediction of
similar manufacturing settings.
The batch was manufactured using materials and equipment described in Sections
5.2.1 and 5.2.2 respectively, where SSG composed 6.89% w/w of the total mass in
the formula, and the powder blend was mixed for five minutes after addition of
magnesium stearate (Table 6.7). The dispersible tablets were manufactured and their
cQA was assessed using the method and equipment described in Section 5.2.4.5. A
confidence interval of 95% was used for the response. The mean (n=100) of the actual
batches was compared to the predicted mean value as summarised in Table 6.8, and
the prediction error was found to be 2.2% more that the predicted value. The actual
mean value of 36.95 was also within the 95% predicted interval (PI) and closer to the
higher PI limit. The percentage prediction error was calculated using Formula 6.5.
% prediction error = Experimental Value - Predicted value
Predicted Value x 100 Equation 6.5
Table 6.8: Summary of predicted and actual response of the hypothesised model at
the optimised conditions
Response Predicted
Mean 95% PI low n
Actual
Mean 95% PI high Std Dev
Disintegration
Time (Secs) 36.17 35.40 100 36.95 37.00 0.599865
Physical characteristics of the resultant dosage form manufactured using optimised
process conditions were assessed. The confirmatory batch of tablets comply with the
set limits and the required compendial specifications. Although within the required
boundaries, friability parameter, however, appears to have increased towards the
upper USP recommended margin. Table 6.9 summarises the observed physical

116
parameters of the tablets prepared using the optimised formulation composition and
verifies that the proposed RSM model holds an accurate estimation ability for the
manufacturing settings stipulated above.
Table 6.9: Physical characteristics of dispersible tablets manufactured under
optimised conditions
Parameters Results
Weight variation (mg) 915.34 ± 4.28
Breaking Force (N) 38.9 ± 1.09
Friability (% w/w) 0.92 ± 0.59
Disintegration Time (secs) 36.95 ± 0.60
Levofloxacin content (%) 101 ± 1.44
Pyrazinamide content (%) 102 ± 1.91
6.3 CONTROL STRATEGY AND QUALITY RISK MITIGATION
Control strategy has been described in several ICH guidelines, and is summarised as
system that involves a set of controls that spring from understanding product and its
manufacturing process. The control strategy normally involves monitoring of material
attributes, the design of the manufacturing process as well as the product
(International Conference on Harmonisation, 2012). The International Conference on
Harmonisation (2005) classifies control strategy and risk reduction as part of quality
risk management, which is a methodical procedure for determining and evaluating risk
of quality during the drug product lifecycle. Risk mitigation concentrates on avoidance
or reduction of quality risk factors that may cause the product to fall outside acceptable
limits. Control strategy involves improving detectability of quality risks.
As previously revealed by the FMEA analysis and the QbD, the sources of cQAs
variability are the product quality risks. These risks were identified as input attributes
such as disintegration quantity in the formulation as well as the length of time taken to
mix the powder blends after the addition of magnesium stearate. These variables were
found to have distinct effects on the disintegration time of the dispersible tablets and
are therefore from the critical points of the design space. The FMEA analysis concept
was exploited in drawing up the risk mitigation and control strategy. Table 6.10 is a
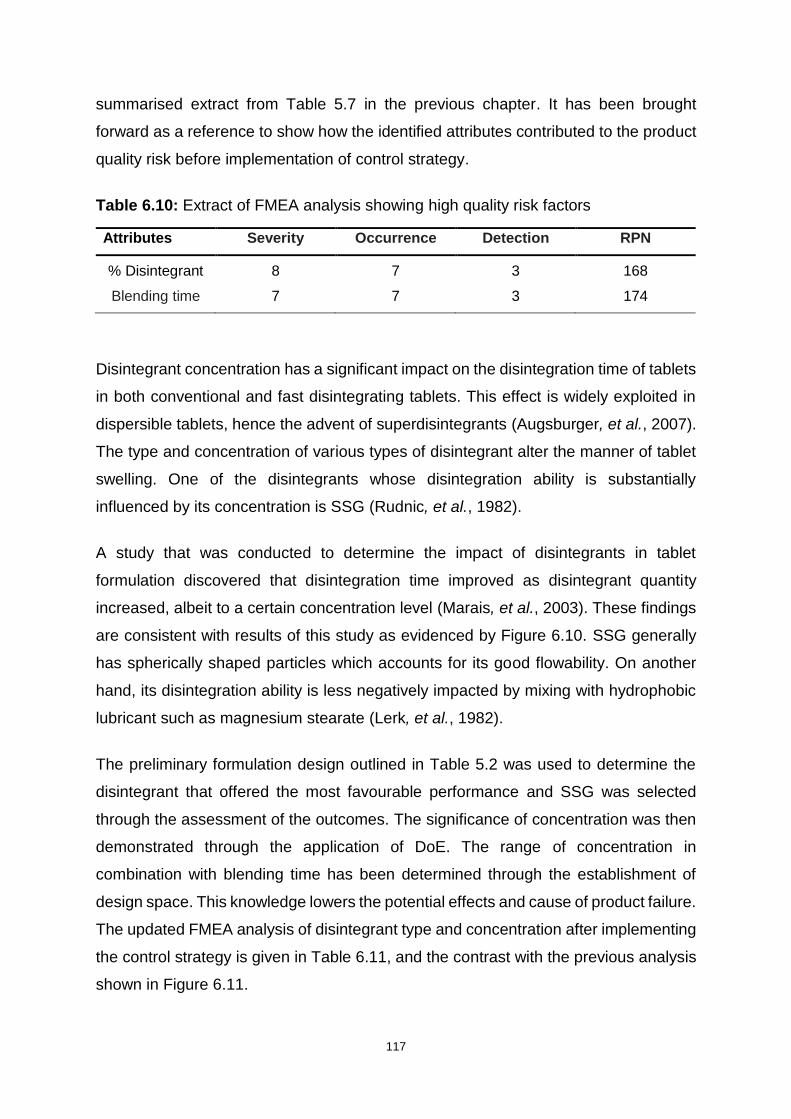
117
summarised extract from Table 5.7 in the previous chapter. It has been brought
forward as a reference to show how the identified attributes contributed to the product
quality risk before implementation of control strategy.
Table 6.10: Extract of FMEA analysis showing high quality risk factors
Attributes Severity Occurrence Detection RPN
% Disintegrant 8 7 3 168
Blending time 7 7 3 174
Disintegrant concentration has a significant impact on the disintegration time of tablets
in both conventional and fast disintegrating tablets. This effect is widely exploited in
dispersible tablets, hence the advent of superdisintegrants (Augsburger, et al., 2007).
The type and concentration of various types of disintegrant alter the manner of tablet
swelling. One of the disintegrants whose disintegration ability is substantially
influenced by its concentration is SSG (Rudnic, et al., 1982).
A study that was conducted to determine the impact of disintegrants in tablet
formulation discovered that disintegration time improved as disintegrant quantity
increased, albeit to a certain concentration level (Marais, et al., 2003). These findings
are consistent with results of this study as evidenced by Figure 6.10. SSG generally
has spherically shaped particles which accounts for its good flowability. On another
hand, its disintegration ability is less negatively impacted by mixing with hydrophobic
lubricant such as magnesium stearate (Lerk, et al., 1982).
The preliminary formulation design outlined in Table 5.2 was used to determine the
disintegrant that offered the most favourable performance and SSG was selected
through the assessment of the outcomes. The significance of concentration was then
demonstrated through the application of DoE. The range of concentration in
combination with blending time has been determined through the establishment of
design space. This knowledge lowers the potential effects and cause of product failure.
The updated FMEA analysis of disintegrant type and concentration after implementing
the control strategy is given in Table 6.11, and the contrast with the previous analysis
shown in Figure 6.11.
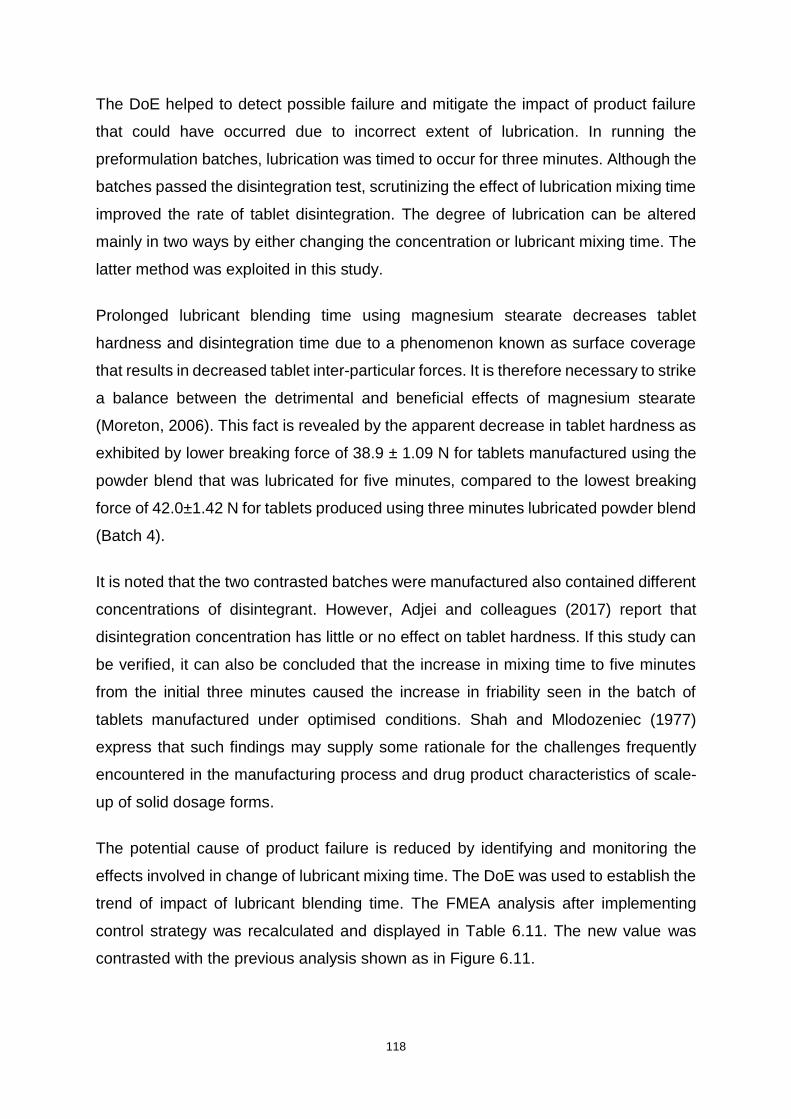
118
The DoE helped to detect possible failure and mitigate the impact of product failure
that could have occurred due to incorrect extent of lubrication. In running the
preformulation batches, lubrication was timed to occur for three minutes. Although the
batches passed the disintegration test, scrutinizing the effect of lubrication mixing time
improved the rate of tablet disintegration. The degree of lubrication can be altered
mainly in two ways by either changing the concentration or lubricant mixing time. The
latter method was exploited in this study.
Prolonged lubricant blending time using magnesium stearate decreases tablet
hardness and disintegration time due to a phenomenon known as surface coverage
that results in decreased tablet inter-particular forces. It is therefore necessary to strike
a balance between the detrimental and beneficial effects of magnesium stearate
(Moreton, 2006). This fact is revealed by the apparent decrease in tablet hardness as
exhibited by lower breaking force of 38.9 ± 1.09 N for tablets manufactured using the
powder blend that was lubricated for five minutes, compared to the lowest breaking
force of 42.0±1.42 N for tablets produced using three minutes lubricated powder blend
(Batch 4).
It is noted that the two contrasted batches were manufactured also contained different
concentrations of disintegrant. However, Adjei and colleagues (2017) report that
disintegration concentration has little or no effect on tablet hardness. If this study can
be verified, it can also be concluded that the increase in mixing time to five minutes
from the initial three minutes caused the increase in friability seen in the batch of
tablets manufactured under optimised conditions. Shah and Mlodozeniec (1977)
express that such findings may supply some rationale for the challenges frequently
encountered in the manufacturing process and drug product characteristics of scale-
up of solid dosage forms.
The potential cause of product failure is reduced by identifying and monitoring the
effects involved in change of lubricant mixing time. The DoE was used to establish the
trend of impact of lubricant blending time. The FMEA analysis after implementing
control strategy was recalculated and displayed in Table 6.11. The new value was
contrasted with the previous analysis shown as in Figure 6.11.
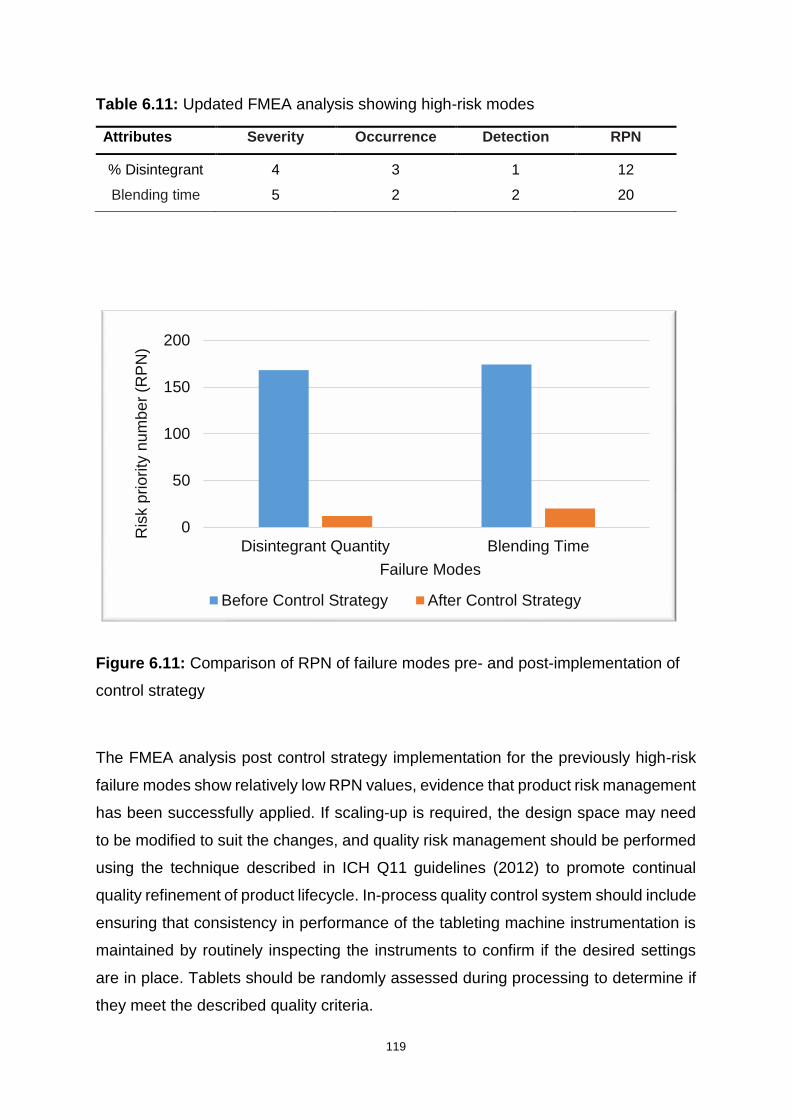
119
Table 6.11: Updated FMEA analysis showing high-risk modes
Attributes Severity Occurrence Detection RPN
% Disintegrant 4 3 1 12
Blending time 5 2 2 20
Figure 6.11: Comparison of RPN of failure modes pre- and post-implementation of
control strategy
The FMEA analysis post control strategy implementation for the previously high-risk
failure modes show relatively low RPN values, evidence that product risk management
has been successfully applied. If scaling-up is required, the design space may need
to be modified to suit the changes, and quality risk management should be performed
using the technique described in ICH Q11 guidelines (2012) to promote continual
quality refinement of product lifecycle. In-process quality control system should include
ensuring that consistency in performance of the tableting machine instrumentation is
maintained by routinely inspecting the instruments to confirm if the desired settings
are in place. Tablets should be randomly assessed during processing to determine if
they meet the described quality criteria.
0
50
100
150
200
Disintegrant Quantity Blending Time
Ris
k p
rio
rity
nu
mb
er
(RP
N)
Failure Modes
Before Control Strategy After Control Strategy
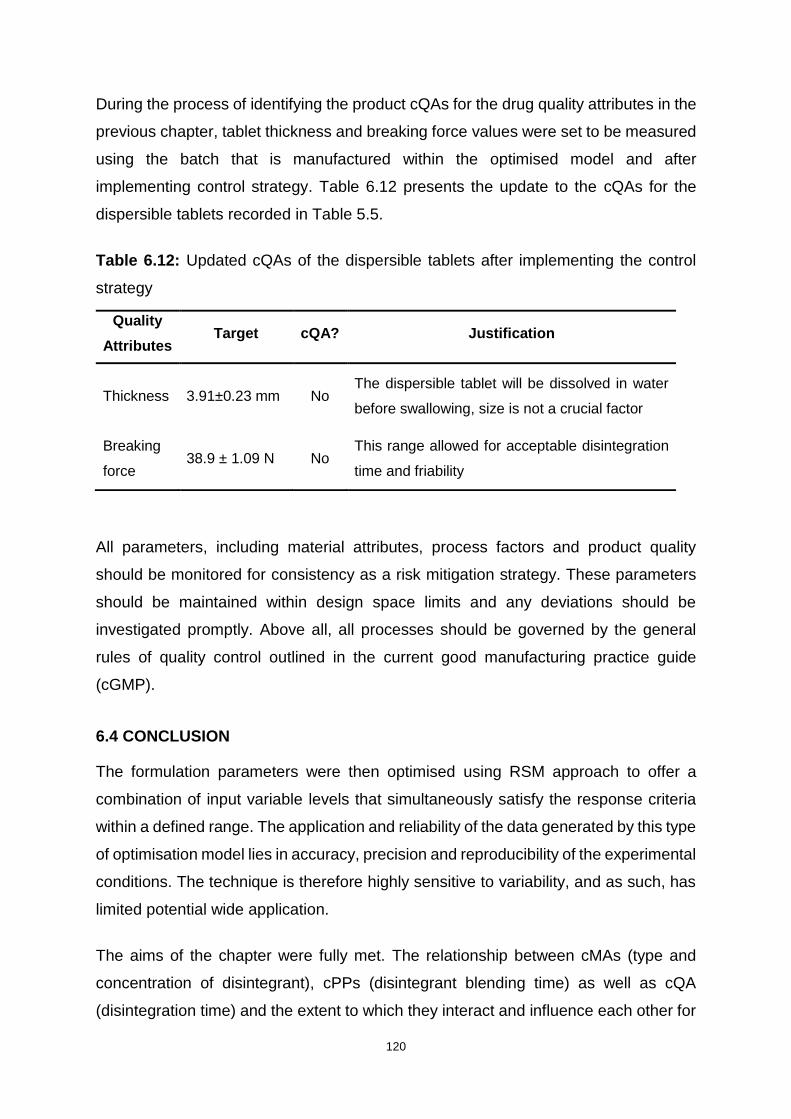
120
During the process of identifying the product cQAs for the drug quality attributes in the
previous chapter, tablet thickness and breaking force values were set to be measured
using the batch that is manufactured within the optimised model and after
implementing control strategy. Table 6.12 presents the update to the cQAs for the
dispersible tablets recorded in Table 5.5.
Table 6.12: Updated cQAs of the dispersible tablets after implementing the control
strategy
All parameters, including material attributes, process factors and product quality
should be monitored for consistency as a risk mitigation strategy. These parameters
should be maintained within design space limits and any deviations should be
investigated promptly. Above all, all processes should be governed by the general
rules of quality control outlined in the current good manufacturing practice guide
(cGMP).
6.4 CONCLUSION
The formulation parameters were then optimised using RSM approach to offer a
combination of input variable levels that simultaneously satisfy the response criteria
within a defined range. The application and reliability of the data generated by this type
of optimisation model lies in accuracy, precision and reproducibility of the experimental
conditions. The technique is therefore highly sensitive to variability, and as such, has
limited potential wide application.
The aims of the chapter were fully met. The relationship between cMAs (type and
concentration of disintegrant), cPPs (disintegrant blending time) as well as cQA
(disintegration time) and the extent to which they interact and influence each other for
Quality
Attributes Target cQA? Justification
Thickness 3.91±0.23 mm No The dispersible tablet will be dissolved in water
before swallowing, size is not a crucial factor
Breaking
force 38.9 ± 1.09 N No
This range allowed for acceptable disintegration
time and friability

121
the product to meet the QTPP was established using DoE within a RSM model. The
use of SSG at 6.89 %w/w and blending the lubricant for five minutes yielded a batch
of dispersible tablets that achieved complete disintegration in an average of 36.95
seconds, with physical characteristics summarised in Table 6.9. The value was within
the range predicted by the model, hence it was acceptable.
The control strategies were implemented as described in ICH guidelines Q11 (2009)
to ensure that the cQAs remains within specifications in subsequent model application.
Control strategy involves planning the experimental process while applying the
understanding of the material attributes, the process parameters as well as the factors
that affect the finished product. Possible failure was detected though the outcomes of
DoE.
122
CHAPTER SEVEN
CONCLUSIONS AND RECOMMENDATIONS
Over the past decade, there has been a significant rise in interest and research in
paediatric TB, which has led to the development of novel drugs and drug combinations
to treat TB and MDR-TB. Bedaquiline and delamanid are some of the novel anti-
tuberculosis drugs that have been recently been approved for use in South Africa.
Delamanid is especially meant for treatment of MDR-TB in children. There is, however,
still a shortfall of adequate paediatric MDR-TB options, other than using these drugs
at reduced doses (by breaking the dosage for, or otherwise) to deliver the drugs to
children. The major challenge that both health care professionals and caregivers are
faced with lies on the unavailability of paediatric-friendly dosage forms.
Levofloxacin and pyrazinamide are some of the long-standing drugs that have been
effective in treatment of MDR-TB. This study sought to develop a FDC containing
levofloxacin and pyrazinamide in the form of a dispersible tablet form for the treatment
of MDR-TB in children below the age of eight years. The study followed a systematic
approach where the physicochemical characteristics of the drug substances were
examined through analytical techniques such as HPLC, IR spectroscopy and TGA. A
framework of QbD was set as a guideline regulating the methodology of the research
and the optimisation segment was accomplished with the aid of a RSM model. The
physicochemical and pharmacokinetic properties of the APIs were explored as a
foundation to define the QTPP of the product, which fulfills the concept of beginning
with the end in mind, the pillar of QbD.
The HPLC method to simultaneously quantify levofloxacin and pyrazinamide was
developed and validated in compliance with the guidelines outlined by Food and Drug
Administration (1994) in agreement with the International Conference on
Harmonisation (1995). The linearity, accuracy and precision of the method were found
to be valid within a concentration range of 0.05 μg/ml and 0.10μg/ml for both drug
compounds. The statistical % RSD, as well as % bias for the experimental analyses
were maintained below 5% to facilitate confirmation of accuracy and precision of the
HPLC method. All the forced degradation studies which included oxidative, hydrolytic

123
and photolytic degradation showed that the method had the ability to resolve between
the analyte and decomposition products. The technique therefore proved to be
stability-indicating under constant chromatographic conditions.
Preformulation studies were performed as a crucial step of building quality into a
product. The characteristics of the APIs were investigated as individuals to identify
their general behaviour and in the presence of each other, to determine the extent of
potential interactions if they existed. This was achieved through the establishment of
powder densities, IR spectroscopy and TGA. The micromeritic evaluation results
showed that although the API powders did not show the best flowability, direct
compression as a tableting method was feasible with the incorporation of MCC as a
diluent. MCC possesses good flow properties and is often incorporated in dosage
forms to promote mechanical strength. Thermal analyses of levofloxacin and
pyrazinamide showed that both substances exhibited thermal stability at normal
formulation temperatures. The DSC thermograms suggested that the substances may
show potential interactions at higher temperatures, approximately above 160ºC.
Characteristics of excipients were studied further before the actual manufacturing
formulation design was developed. As a test run, three batches containing different
superdisintegrants consisting of 5% w/w of the total tablet weight were prepared (F1-
F3), after which three more formulations containing 8% w/w of the disintegrants were
prepared (F4-F6). Scaling up the concentration of the disintegrants was a method
used to check whether higher disintegrant quantity would boost the disintegration time
response as suggested in literature. The batch containing 8% w/w of SSG appeared
to perform better than all the other batches in terms of disintegration rate and was
therefore selected as a target for optimisation.
This preliminary batch offered a basis for the set-up of the QTPP for the formulation.
The cQA was identified from the target QTPP as being the tablet disintegration time.
This was achieved by determining the attributes of raw materials (cMAs) and
processing factors (cPPs) that alter the cQAs to levels that compromise safety and
efficacy of the drug product. A quality risk assessment method called Failure Mode
and Effects Analysis (FMEA) effectively aided in ranking the potential failure mode
according to priority. Quantity of disintegrant as well as lubricant blending time were
124
implicated as the possible failure modes that needed immediate attention compared
to others (Davis, et al., 2008).
Optimisation of the manufacturing process employed the RSM mathematical model
where the central composite statistical design model with two factors and a single
response was used to set up DoE for the formulation process. The technique first
determined the relationship of cMAs, cPPs and the cQA in the formula and
manipulated this relationship in creating a design space. The effects of SSG and
lubricant blending time factors were found to overlap, which implies that they could not
be manipulated as individuals to make a change on the response. A statistical analysis
software generated contour and 3D rotatable surface response plots which displayed
the effects of input variables on the response at varying levels.
The outcomes of the optimisation studies demonstrate that the disintegration time of
the FDC dispersible tablet do heavily rely on the SSG concentration and the period
taken to mix the lubricant with the powder blend. The best disintegration time achieved
after optimising the processing conditions was 36.95 seconds, obtained by using
6.89% w/w of SSG and blending magnesium stearate for five minutes. The response
values predicted by the model and the actual confirmatory experimental values were
within proximity of the 5% acceptable error, an indication that the model was accurate
and reliable. A control strategy to mitigate future product quality risks were put in place
and involve a rich background knowledge of the product. The plan also involves a
continuous assessment of risk modes from material attributes, processing and product
properties.
Future experimental analysis that would be vital to conduct would comprise
accelerated stability-indicating tests following the guidelines stipulated by Food and
Drug Administration (2003). The results of such a study would reveal possible long-
term compatibilities or interactions between the APIs as well as API and excipients,
where existence of interactions will lead to development of alternative or advanced
methods of formulation that would enable compatibility. DoE would investigate more
parameters such as the impact of concentration of lubricant, mixing time of lubricant
beyond five minutes in addition to effect of the rotation rate of cube mixer during
powder blending phase and compression force. Moreover, it would be of interest to

125
explore the disintegration behaviour of the FDC formulated using the novel commercial
premixed and ready-for-use excipient matrix.
Recommendations for this study would be to further investigate and formulate
paediatric-friendly dosage forms using various drugs that are already approved for the
treatment of MDR-TB. It is encouraged that various combinations of two or more of
these drugs be formulated into FDCs. This would further ameliorate the pill burden that
is currently faced nationwide. Is also recommended that the dosage forms be
furnished in a range of strengths to provide for all the age groups of children.
In conclusion, FDC dispersible tablets containing 150 mg of levofloxacin and
300 mg of pyrazinamide for treatment of MDR-TB in children were formulated,
manufactured and evaluated. The aim of the study was therefore fulfilled by meeting
all the objectives that were set in the beginning of the study. The tablets passed all the
relevant quality criteria that governed the scope of this study. However, potential
limitations of the study include the fact that laboratory scale equipment such as the
mixer and tablet press were used, and they may not be representation of the conditions
in industry.

126
REFERENCES
Abdelbary, G., Prinderre, P., Eouani, C., Joachim, J., Reynier, J.P. & Piccerelle, P.
2004. The preparation of orally disintegrating tablets using a hydrophilic waxy binder.
International Journal of Pharmaceutics, 278: 423-433.
Abdullah, E.C. & Geldart, D. 1999. The use of bulk density measurements as
flowability indicators. Powder Technology, 102: 151-165.
Adeyeye, M.C. 2008. Drug–Excipient Interaction Occurrences During Solid Dosage
Form Development. In: Adeyeye, M.C. & Brittain, H.G. (eds.) Preformulation in Solid
Dosage Form Development. New York: Informa Healthcare. 357
Adjei, F.K., Osei, Y.A., Kuntworbe, N. & Ofori-Kwakye, K. 2017. Evaluation of the
Disintegrant Properties of Native Starches of Five New Cassava Varieties in
Paracetamol Tablet Formulations. Journal of Pharmaceutics, 2017: 1-9.
Ahmad, I., Bano, R., Sheraz, M., Ahmed, S., Mirza, T. & Ansari, S. 2013.
Photodegradation of levofloxacin in aqueous and organic solvents: A kinetic study.
Acta Pharmaceutica, 63: 223–229.
Ahuja, S. 2006. High-pressure liquid chromatography. In: Ahuja, S. & Jespersen, N.
(eds.) Wilson & Wilson's Comprehensive Analytical Chemistry. Amsterdam: Elsevier.
485-559
Akcali, S., Surucuoglu, S., Cicek, C. & Ozbakkaloglu, B. 2005. In vitro activity of
ciprofloxacin, ofloxacin and levofloxacin against Mycobacterium tuberculosis. Annals
of Saudi Medicine, 25: 409-412.
Akers, M.J. 1976. Preformulation testing of solid oral dosage forms. Methodology,
management. and evaluation. Canadian Journal of Pharmaceutical Sciences, 11: 1-
10.
Alderborn, G. 2013. Tablets and compaction. In: Aulton, M.E. & M.G., K. (eds.)
Aulton’s Pharmaceutics: The Design and Manufacture o f Medicines. 4th ed. Toronto:
Elsevier Ltd. 515-519
127
Aldred, K.J., Kerns, R.J. & Osheroff, N. 2014. Mechanism of Quinolone Action and
Resistance. Biochemistry, 53: 1565-1574.
Allen, L.V. & Ansel, H.C. 2014. Dosage Form Design: Pharmaceutical and Formulation
Considerations. In: Howes, S. (ed.) Ansel’s Pharmaceutical Dosage Forms and Drug
Delivery Systems. Baltimore: Lippincott Williams & Wilkins. 102-165
Amidon, G.E., Secreast, P.J. & Mudie, D. 2009. Particle, Powder, and Compact
Characterization. In: Qiu, Y., Chen, Y., Zhang, G.G.Z., Liu, L. & Porter, W.R. (eds.)
Developing Solid Oral Dosage Forms: Pharmaceutical Theory and Practice.
Burlington: Academic Press. 167-170
Analytical Methods Committee 1988. Uses (proper and improper) of correlation
coefficients. Analyst, 113: 1469-1471.
Anderson, G.D. 1997. Tuberculosis in pregnancy. Seminars in perinatology, 21: 328-
335.
Anderson, V.R. & Perry, C.M. 2008. Levofloxacin: A Review of its Use as a High-Dose,
Short-Course Treatment for Bacterial Infection. Drugs, 68: 535-565.
Andersson, M.I. & MacGowan, A.P. 2003. Development of the quinolones. Journal of
Antimicrobial Chemotherapy, 51: 1-11.
Andriole, V.T. 2005. The quinolones: past, present, and future. Clinical Infectious
Diseases: An Official Publication Of The Infectious Diseases Society Of America, 41
Suppl 2: S113-S119.
Anovadiya, A.P., Barvaliya, M.J., Patel, T.K. & Tripathi, C.B. 2011. Cross sensitivity
between ciprofloxacin and levofloxacin for an immediate hypersensitivity reaction.
Journal of Pharmacology & Pharmacotherapeutics, 2: 187-188.
Araujo, P. 2009. Key aspects of analytical method validation and linearity evaluation.
Journal Of Chromatography. B, Analytical Technologies In The Biomedical And Life
Sciences, 877: 2224-2234.
128
Araujo, P.W. & Brereton, R.G. 1996. Experimental design II. Optimization. TrAC
Trends in Analytical Chemistry, 15: 63-70.
Asai, M. 1961. Chemotherapeutics VII: Synthesis of Pyrazinamide Derivatives. Journal
of the Pharmaceutical Society of Nippon, 81: 1475-1478.
Asghar, A., Raman, A.A.A. & Daud, W.M.A.W. 2014. A Comparison of Central
Composite Design and Taguchi Method for Optimizing Fenton Process. The Scientific
World Journal, 2014: 1-14.
Augsburger, L.L., Brzeczko, A.W., Shah, U. & Hahm, H.A. 2007. Super Disintegrants:
Characterization and Function. In: James, S. (ed.) Encyclopedia of Pharmaceutical
Technology. 3rd ed. New York: Informa Healthcare USA, Inc. 3553
Aulton, M.E. 2009. Powder flow. In: Qiu, Y., Chen, Y., Zhang, G.G.Z., Liu, L. & Porter,
W.R. (eds.) Developing Solid Oral Dosage Forms: Pharmaceutical Theory and
Practice. Burlington: Academic Press. 193-196
Aulton, M.E. 2013. Dissolution and solubility. In: Aulton, M.E. & M.G., K. (eds.) Aulton’s
Pharmaceutics: The Design and Manufacture o f Medicines. 4th ed. Toronto: Elsevier
Ltd. 20-26
Bakshi, M. & Singh, S. 2002. Development of validated stability-indicating assay
methods—critical review. Journal of Pharmaceutical and Biomedical Analysis, 28:
1011-1040.
Bala, R., Khanna, S. & Pawar, P.K. 2013. Formulation and optimization of fast
dissolving intraoral drug delivery system for clobazam using response surface
methodology. Journal of Advanced Pharmaceutical Technology & Research, 4: 151-
159.
Bansal, N., Manocha, D. & Madhira, B. 2015. Life-threatening metabolic coma caused
by levofloxacin. American Journal Of Therapeutics, 22: e48-e51.

129
Bar-Oz, B., Moretti, M.E., Boskovic, R., O’Brien, L. & Koren, G. 2009. The safety of
quinolones—A meta-analysis of pregnancy outcomes. European Journal of Obstetrics
& Gynecology and Reproductive Biology, 143: 75-78.
Barabas, E.S. & Adeyey, C.M. 1996. Crospovidone. In: Brittain, H.G. (ed.) Analytical
Profiles of Drug Substances and Excipients. California: Academic Press Inc. 90-91
Barth, H.G. & Boyes, B.E. 1992. Size exclusion chromatography. Analytical Chemistry,
64: 428R-442R.
Baş, D. & Boyacı, İ.H. 2007. Modeling and optimization I: Usability of response surface
methodology. Journal of Food Engineering, 78: 836-845.
Bauters, T., Buyle, F., Blot, S., Robays, H., Vogelaers, D., Landuyt, K., Vanhove, W.
& Claeys, G. 2014. Prophylactic use of levofloxacin during medicinal leech therapy.
International Journal of Clinical Pharmacy, 36: 995-999.
Baxter, K. (ed.) 2010. Stockley’s Drug Interactions, 9 ed. London: Pharmaceutical
Press.
Bayomi, M.A., Al-Suwayeh, S.A. & El-Helw, A.-R.M. 2001. Excipient-Excipient
Interaction in the Design of Sustained-Release Theophylline Tablets: In Vitro and In
Vivo Evaluation. Drug Development and Industrial Pharmacy, 27: 499-506.
Beretta, E., Botturi, S., Ferrari, P., Tuan, G. & Zerilli, L.F. 1987. Identification of 5-
hydroxypyrazinamide isolated from urine of subjects given pyrazinamide. Journal Of
Chromatography, 416: 144-149.
Bezerra, M.A., Santelli, R.E., Oliveira, E.P., Villar, L.S. & Escaleira, L.A. 2008.
Response surface methodology (RSM) as a tool for optimization in analytical
chemistry. Talanta, 76: 965-977.
Bhattacharyya, L., Schuber, S., Sheehan, C. & William, R. 2006. Excipients:
Background/Introduction. In: Katdare, A. & Chaubal, M.V. (eds.) Excipient
Development for Pharmaceutical, Biotechnology, and Drug Delivery Systems. New
York: Informa Healthcare USA, Inc. 1-2
130
Bivha, D., Sujata, M. & Prabhakar, T. 2014. Formulation & analysis of levofloxacin
hemihydrate by RP-HPLC in bulk & tablet dosage form. Journal Of Harmonized
Research in Pharmacy, 3: 64-77.
Blessy, M., Patel, R.D., Prajapati, P.N. & Agrawal, Y.K. 2014. Development of forced
degradation and stability indicating studies of drugs—A review. Journal of
Pharmaceutical Analysis, 4: 159-165.
Blomberg, B., Spinaci, S., Fourie, B. & Laing, R. 2001. The rationale for recommending
fixed-dose combination tablets for treatment of tuberculosis. Bulletin of the World
Health Organization, 79: 61-68.
Bothamley, G. 2001. Drug Treatment for Tuberculosis during Pregnancy: Safety
Considerations. Drug Safety, 24: 553-565.
Box, G.E.P. & Wilson, K.B. 1951. On the Experimental Attainment of Optimum
Conditions. Journal of the Royal Statistical Society. Series B (Methodological), 13: 1-
45.
Bozdağ-Pehlivan, S., Subaşi, B., Vural, I., Unlü, N. & Capan, Y. 2011. Evaluation of
drug-excipient interaction in the formulation of celecoxib tablets. Acta poloniae
pharmaceutica, 68: 423-433.
Braithwaite, A. & Smith, J.F. (eds.) 1999. Chromatographic Methods, 5th ed.
Netherlands: Kluwer Academic Publishers.
Burgos Arguijo, M., Blazquez Diaz, G., Burguillo Gallego, R., Cabezas Frances, E.,
Cadavid Garcia, V., De Toro Torrijos, L., Frias Garcia, I., Melero Colmenarejo, A.,
Rivas Diaz, L. & Salinero Hernando, M. 2010. Nursing care in elderly with Stevens-
Johnson Syndrome related to levofloxacin: case approach. Gerokomos, 21: 118-122.
Cao, X., Leyva, N., Anderson, S.R. & Hancock, B.C. 2008. Use of prediction methods
to estimate true density of active pharmaceutical ingredients. International Journal of
Pharmaceutics, 355: 231-237.

131
Carr, G.P. & Wahlich, J.C. 1990. A practical approach to method validation in
pharmaceutical analysis. Journal of Pharmaceutical and Biomedical Analysis, 8: 613-
618.
Castro, R.A.E., Maria, T.M.R., Évora, A.O.L., Feiteira, J.C., Silva, M.R., Beja, A.M.,
Canotilho, J. & Eusébio, M.E.S. 2010. A New Insight into Pyrazinamide Polymorphic
Forms and their Thermodynamic Relationships. Crystal Growth & Design, 10: 274-
282.
Cavatur, R.K., Vemuri, N.M. & Suryanarayanan, R. 2008. Preformulation Studies for
Tablet Formulation Development. In: Augsbuger, L.L. & Hoag, S.W. (eds.)
Pharmaceutical Dosage Forms - Tablets. 3rd ed. Boca Raton: CRC Press. 465
Chang, K.C., Leung, C.C., Yew, W.W., Lau, T.Y. & Tam, C.M. 2008. Hepatotoxicity of
pyrazinamide: cohort and case-control analyses. American Journal of Respiratory &
Critical Care Medicine, 177: 1391-1396.
Charoo, N.A., Shamsher, A.A.A., Zidan, A.S. & Rahman, Z. 2012. Quality by design
approach for formulation development: A case study of dispersible tablets.
International Journal of Pharmaceutics, 423: 167-178.
Chaurasia, G. 2016. A review on pharmaceutical preformulation studies in formulation
and development of new drug molecules. International Journal Of Pharmaceutical
Sciences And Research, 7: 2313-2320.
Cherukuvada, S., Thakuria, R. & Nangia, A. 2010. Pyrazinamide Polymorphs: Relative
Stability and Vibrational Spectroscopy. Crystal Growth & Design, 10: 3931-3941.
Chien, S.C., Rogge, M.C., Gisclon, L.G., Curtin, C., Wong, F., Natarajan, J., Williams,
R.R., Fowler, C.L., Cheung, W.K. & Chow, A.T. 1997. Pharmacokinetic profile of
levofloxacin following once-daily 500-milligram oral or intravenous doses.
Antimicrobial Agents And Chemotherapy, 41: 2256-2260.
Chinou, I. 2010. HerbaI Drugs and the Role of Chromatographie Methods in Their
Analysis. In: Waksmundzka-Hajnos, M. & Sherma, J. (eds.) High Performance Liquid
Chromatography in Phytochemical Analysis. New York: CRC Press. 16
132
Choi, S.-H., Kim, E.Y. & Kim, Y.-J. 2013. Systemic use of fluoroquinolone in children.
Korean Journal of Pediatrics, 56: 196-201.
Coelho, J., Gonçalves, C., Leitão, S., Marques Dos Santos, R. & Nascimento Costa,
J. 2011. Levofloxacin hepatotoxicity. Higher risk in diabetics? Acta Medica
Portuguesa, 24: 729-734.
Conte, J.E., Lin, E. & Zurlinden, E. 2000. High-Performance Liquid Chromatographic
Determination of Pyrazinamide In Human Plasma, Bronchoalveolar Lavage Fluid, and
Alveolar Cells. Journal Of Chromatographic Science, 38: 33-37.
Córdoba-Borrego, M., Córdoba-Dıaz, M. & Córdoba-Dıaz, D. 1999. Validation of a
high-performance liquid chromatographic method for the determination of norfloxacin
and its application to stability studies (photo-stability study of norfloxacin). Journal of
Pharmaceutical and Biomedical Analysis, 18: 919-926.
Crowle, A.J. 1986. Studies of antituberculosis chemotherapy with an in vitro model of
human tuberculosis. Seminars In Respiratory Infections, 1: 262-264.
Cullen, J.H., LeVine, M. & Fiore, J.M. 1957. Studies of hyperuricemia produced by
pyrazinamide. The American Journal Of Medicine, 23: 587-595.
Davis, S., Riley, W., Gurses, A.P., Miller, K. & Hansen, H. 2008. Failure Modes and
Effects Analysis Based on in Situ Simulations: A Methodology to Improve
Understanding of Risks and Failures. In: Henriksen, K., Battles, J.B., Keyes, M.A. &
Grady, M.L. (eds.) Advances in Patient Safety: New Directions and Alternative
Approaches. Rockville: Agency for Healthcare Research and Quality. 159-167
Davis, S.L., Neuhauser, M.M. & McKinnon, P.S. 2014. Quinolones. Infectious disease
& Antimicrobial agents [Online]. Available: http://www.antimicrobe.org/new/d17.asp
[Accessed 28/09/16].
Deck, D.H. & Winston, L.G. 2015. Sulfonamides, Trimethoprim, & Quinolones. In:
Katzung, B.G. (ed.) Basic & Clinical Pharmacology. 13th ed. New York: McGraw-Hill
Education. 807-814
133
Deepika, V., Jayaram Kumar, K. & Anima, P. 2013. Isolation and physicochemical
characterization of sustained releasing starches from Dioscorea of Jharkhand.
International Journal of Biological Macromolecules, 55: 193-200.
Derringer, G. & Suich, R. 1980. Simultaneous optimization of several response
variables. Journal of Quality Technology, 12: 214-219.
Desai, P.M., Er, P.X.H., Liew, C.V. & Heng, P.W.S. 2014. Functionality of
Disintegrants and Their Mixtures in Enabling Fast Disintegration of Tablets by a
Quality by Design Approach. AAPS PharmSciTech, 15: 1093-1104.
Dey, P. & Maiti, S. 2010. Orodispersible tablets: A new trend in drug delivery. Journal
of Natural Science, Biology, and Medicine, 1: 2-5.
Dobetti, L. 2001. Fast-Melting Tablets: Developments and Technologies.
Pharmaceutical Technology Drug Delivery: 44-45.
Dodd, P.J., Sismanidis, C. & Seddon, J.A. 2016. Global burden of drug-resistant
tuberculosis in children: a mathematical modelling study. The Lancet Infectious
Diseases, 16: 1193-1201.
Donald, P.R. 2010. Cerebrospinal fluid concentrations of antituberculosis agents in
adults and children. Tuberculosis, 90: 279-292.
Donald, P.R. 2011. Antituberculosis drug-induced hepatotoxicity in children. Pediatric
Reports, 3: 51-64.
Drew, R.H. 2016. Pyrazinamide: An overview. Available:
http://www.uptodate.com/contents/pyrazinamide-an-overview [Accessed 20/08/16].
Eedara, B.B., Tucker, I.G. & Das, S.C. 2016. Phospholipid-based pyrazinamide spray-
dried inhalable powders for treating tuberculosis. International Journal of
Pharmaceutics, 506: 174-183.
El Ghandour, S. & Azar, S.T. 2015. Dysglycemia associated with quinolones. Primary
Care Diabetes, 9: 168-171.

134
Ellard, G.A. 1969. Absorption, metabolism and excretion of pyrazinamide in man.
Tubercle, 50: 144-158.
Engelhardt, H. 2011. Bonded Stationary Phases. In: Corradini, D. & Phillips, T.M.
(eds.) Handbook of HPLC. 2nd ed. Boca Raton: CRC Press. 47-75
European Pharmacopoeia 2013. European Pharmacopoeia. 8th ed.: European
Pharmacopoeia Commission.
Felder, E. & Pitre, D. 1983. Pyrazinamide. In: Klaus, F. (ed.) Analytical Profiles of Drug
Substances. London: Academic Press. 433-462
Fish, D.N. & Chow, A.T. 1997. The Clinical Pharmacokinetics of Levofloxacin. Clinical
Pharmacokinetics, 32: 101-119.
Fitzgerald, D.W., Sterling, T.R. & Haas, D.W. 2010. Mycobacterium tuberculosis. In:
Mandell, G.L., Bennett, J.E. & Dolin, R. (eds.) Principles and Practice Of Infectious
Diseases. Philadelphia: Elsevier Inc. 3129
Food and Drug Administration 1994. Reviewer Guidance: Validation of
Chromatographic Methods. Rockville: Food and Drug Administration.
Food and Drug Administration 2003. Stability Testing of New Drug Substances and
Products Q1A (R2) Rockville: Food and Drug Administration,.
Food and Drug Administration 2006. Guidance for Industry - Q8 Pharmaceutical
Development. Rockville: Food and Drug Administration.
Food and Drug Administration 2013. Guidance for Industry Bioanalytical Method
Validation. Rockville: Food and Drug Administration.
Frick, A., Möller, H. & Wirbitzki, E. 1998. Biopharmaceutical characterization of oral
immediate release drug products. In vitro/in vivo comparison of
phenoxymethylpenicillin potassium, glimepiride and levofloxacin. European Journal Of
Pharmaceutics And Biopharmaceutics: Official Journal Of Arbeitsgemeinschaft Fur
Pharmazeutische Verfahrenstechnik E.V, 46: 305-311.

135
Gaisford, S. 2013. Pharmaceutical Preformulation. In: Aulton, M.E. & M.G., K. (eds.)
Aulton’s Pharmaceutics: The Design and Manufacture o f Medicines. 4th ed. Toronto:
Elsevier Ltd. 392
Ganske, C.M. & Horning, K.K. 2012. Levofloxacin-induced tendinopathy of the hip.
Annals of Pharmacotherapy, 46: e13-e13 11p.
Garg, A. & Gupta, M.M. 2013. Mouth Dissolving Tablets: A Review. Journal of Drug
Delivery & Therapeutics, 3: 207-214.
Gold, H.S. & Moellering, R.C., Jr. 1996. Antimicrobial-drug resistance. The New
England Journal Of Medicine, 335: 1445-1453.
Gorman, E.M., Samas, B. & Munson, E.J. 2012. Understanding the Dehydration of
Levofloxacin Hemihydrate. Journal Of Pharmaceutical Sciences, 101: 3319-3330.
Graham, S.M., Grzemska, M. & Gie, R.P. 2015. The background and rationale for a
new fixed-dose combination for first-line treatment of tuberculosis in children. The
International Journal Of Tuberculosis And Lung Disease: The Official Journal Of The
International Union Against Tuberculosis And Lung Disease, 19: 3-8.
Green, J.M. 1996. A Practical Guide to Analytical Method Validation. Analytical
Chemistry, 68: 305A-309A.
Grubbs, F.E. 1969. Procedures for Detecting Outlying Observations in Samples.
Technometrics, 11: 1-21.
Gu, P., Constantino, L. & Zhang, Y. 2008. Enhancement of the antituberculosis activity
of weak acids by inhibitors of energy metabolism but not by anaerobiosis suggests
that weak acids act differently from the front-line tuberculosis drug pyrazinamide.
Journal of Medical Microbiology, 57: 1129-1134.
Gul, W., Hamid, F., Ayub, S. & Bhatti, S. 2015. Degradation studies of selected
fluoroquinolones. European Journal of Pharmaceutical and Medical Research, 2: 6-
10.

136
Gumbo, T. 2011. Chemotherapy of Tuberculosis, Mycobacterium Avium Complex
Disease, and Leprosy. In: Brunton, L.L. (ed.) Goodman and Gilman's - The
Pharmacological Basis of Therapeutics. 12th ed. New York: The McGraw-Hill
Companies. 1549 - 1570
Gunasekaran, S., Rajalakshmi, K. & Kumaresan, S. 2013. Molecular Structure,
Vibrational Spectroscopic Analysis of Levofloxacin by Density Functional method.
Journal of Environmental Nanotechnology, 2: 6-9.
Guo, A., Beddow, J.K. & Vetter, A.F. 1985. A simple relationship between particle
shape effects and density, flow rate and Hausner Ratio. Powder Technology, 43: 279-
284.
Gustavo, G.A. & Ángeles, H.M. 2007. A practical guide to analytical method validation,
including measurement uncertainty and accuracy profiles. TrAC Trends in Analytical
Chemistry, 26: 227-238.
Hamdi El Najjar, N., Touffet, A., Deborde, M., Journel, R. & Leitner, N.K.V. 2013.
Levofloxacin oxidation by ozone and hydroxyl radicals: Kinetic study, transformation
products and toxicity. Chemosphere, 93: 604-611.
Hancock, B.C., Brone, D., Olsofsky, A., McCall, M., Prescott, J., Hedden, D.B., Patel,
P.J. & Clement, S. 2006. Development of an Improved Fluidization Segregation Tester
for Use With Pharmaceutical Powders. Pharmaceutical Technology, 30: 56–64.
Hancock, B.C., Colvin, J.T., Mullarney, M.P. & Zinchuk, A.V. 2003. The Relative
Densities of Pharmaceutical Powders, Blends, Dry Granulations, and Immediate-
Release Tablets. Pharmaceutical Technology, 27: 64-80.
Hannan, P.A., Khan, J.A., Khan, A. & Safiullah, S. 2016. Oral Dispersible System: A
New Approach in Drug Delivery System. Indian Journal of Pharmaceutical Sciences,
78: 2-7.
Hauser, A.R. 2015. Antibiotic Basics for Clinicians: The ABCs of Choosing the Right
Antibacterial Agent, 2nd ed., Baltimore: Lippincott Williams & Wilkins.
137
Haywood, A. & Glass, B.D. 2011. Pharmaceutical Excipients – Where Do We Begin?
Australian Prescriber, 34: 1-3.
Hernández, A., Sánchez, M.B. & Martínez, J.L. 2011. Quinolone Resistance: Much
More than Predicted. Frontiers in Microbiology, 2: 22.
Hooper, D.C. 2002. Fluoroquinolone resistance among Gram-positive cocci. The
Lancet. Infectious Diseases, 2: 530-538.
Hooper, D.C. & Strahilevitz, J. 2010. Quinolones In: Mandell, G., Bennett, J. & Dolin,
R. (eds.) Mandell, Douglas, and Bennett’s Principles and Practice of Infectious
Diseases. 7 ed. New York: Churchill Livingstone. 487-510
Hurtado, F.K., Nogueira, D.R., Bortolini, F., da Silva, L.M., Zimmermann, E., Souza,
M.J.e., de Melo, J. & Rolim, C.M.B. 2007. Determination of Levofloxacin in a
Pharmaceutical Injectable Formulation by Using HPLC and UV Spectrophotometric
Methods. Journal of Liquid Chromatography & Related Technologies, 30: 1981-1989.
Indian Pharmacopoeia Commission 2007. Indian Pharmacopoeia. Ghaziabad,
Government of India Ministry of Health & Family Welfare.
International Conference on Harmonisation 1995. Validation of Analytical Procedures:
Text and Methodology Q2 (R1). London: European Medicines Agency,.
International Conference on Harmonisation 2003. Stability Testing of New Drug
Substances and Products Q1A(R2). London: European Medicine Agency.
International Conference on Harmonisation 2005. Quality Risk Management Q9.
London: European Medicines Agency.
International Conference on Harmonisation 2012. Development and Manufacture of
Drug Substances (Chemical Entities and Biotechnological/Biological Entities) Q11.
London: International Conference on Harmonisation,.
International Organisation for Standardization 2004. International Vocabulary of Basic
and General Terms in Metrology. 3rd ed. Geneva: International Organization for
Standardization.
138
Ivanovska, V., Rademaker, C.M.A., van Dijk, L. & Mantel-Teeuwisse, A.K. 2014.
Pediatric Drug Formulations: A Review of Challenges and Progress. Pediatrics.
Jandera, P. 2011. Stationary and mobile phases in hydrophilic interaction
chromatography: a review. Analytica Chimica Acta, 692: 1-25.
Jenkins, H.E., Tolman, A.W., Yuen, C.M., Parr, J.B., Keshavjee, S., Pérez-Vélez,
C.M., Pagano, M., Becerra, M.C. & Cohen, T. 2014. Incidence of multidrug-resistant
tuberculosis disease in children: systematic review and global estimates. Lancet, 383:
1572–1579.
Jinno, J.-i., Kamada, N., Miyake, M., Yamada, K., Mukai, T., Odomi, M., Toguchi, H.,
Liversidge, G.G., Higaki, K. & Kimura, T. 2006. Effect of particle size reduction on
dissolution and oral absorption of a poorly water-soluble drug, cilostazol, in beagle
dogs. Journal of Controlled Release, 111: 56-64.
Jivraj, M., Martini, L.G. & Thomson, C.M. 2000. An overview of the different excipients
useful for the direct compression of tablets. Pharmaceutical Science & Technology
Today, 3: 58-63.
Johnson, J.L., Hadad, D.J., Boom, W.H., Daley, C.L., Peloquin, C.A., Eisenach, K.D.,
Jankus, D.D., Debanne, S.M., Charlebois, E.D., Maciel, E., Palaci, M. & Dietze, R.
2006. Early and extended early bactericidal activity of levofloxacin, gatifloxacin and
moxifloxacin in pulmonary tuberculosis. The International Journal Of Tuberculosis And
Lung Disease: The Official Journal Of The International Union Against Tuberculosis
And Lung Disease, 10: 605-612.
Johnson, R. 2008. Assessment of Bias with Emphasis on Method Comparison. The
Clinical Biochemist Reviews, 29: S37-S42.
Kabbara, W.K., Ramadan, W.H., Rahbany, P. & Al-Natour, S. 2015. Evaluation of the
appropriate use of commonly prescribed fluoroquinolones and the risk of dysglycemia.
Therapeutics and Clinical Risk Management, 11: 639-647.
139
Kanbay, M., Aydogan, T., Bozalan, R., Isik, A., Uz, B., Kaya, A. & Akcay, A. 2006. A
Rare But Serious Side Effect of Levofloxacin: Hypoglycemia in a Geriatric Patient.
Diabetes Care, 29: 1716-1717 1712p.
Katrutsa, A. & Strijov, V. 2017. Comprehensive study of feature selection methods to
solve multicollinearity problem according to evaluation criteria. Expert Systems with
Applications, 76: 1-11.
Kazekevich, Y. & LoBrutto, R. 2007. Introduction. In: Kazekevich, Y. & Lobrutto, R.
(eds.) HPLC for pharmaceutical scientists. New Jersey: John Wiley & Sons, Inc. 3-24
Kenkel, J. 2014. High-Performance Liquid Chromatography and Electrophoresis. In:
Glunn, B. (ed.) Analytical Chemistry for Technicians. Boca Raton: CRC Press. 341-
370
Khadka, P., Ro, J., Kim, H., Kim, I., Kim, J.T., Kim, H., Cho, J.M., Yun, G. & Lee, J.
2014. Pharmaceutical particle technologies: An approach to improve drug solubility,
dissolution and bioavailability. Asian Journal of Pharmaceutical Sciences, 9: 304-316.
Khan, H. & Ali, J. 2016. Fixed Dose Combination (FDC) Products: Introduction,
Development and Regulations. Research Journal of Pharmaceutical Dosage Forms
and Technology, 8: 207-210.
Khayyam, K.U., Imam, F., Sharma, M., Pillai, K.K. & Behera, D. 2010. Pyrazinamide-
induced Maculopapular rash. Indian Journal of Dermatology, 55: 384-386.
Khuri, A.I. 2017. A General Overview of Response Surface Methodology. Biometrics
& Biostatistics International Journal, 5: 1-8.
Khuri, A.I. & Mukhopadhyay, S. 2010. Response surface methodology. Wiley
Interdisciplinary Reviews: Computational Statistics, 2: 128-149.
Kirkland, K.M., McCombs, D.A. & Kirkland, J.J. 1994. Rapid, high-resolution high-
performance liquid chromatographic analysis of antibiotics. Journal of
Chromatography A, 660: 327-337.
140
Kitaoka, H., Wada, C., Moroi, R. & Hakusui, H. 1995. Effect of Dehydration on the
Formation of Levofloxacin Pseudopolymorphs. Chemical and Pharmaceutical Bulletin,
43: 649-653.
Kumar, A., Rahal, A., Ragvendra, R., Prakash, A., Mandil, R. & Garg, S.K. 2012.
Pharmacokinetics of Levofloxacin Following Intravenous and Intramuscular
Administration in Cattle Calves. Asian Journal of Animal and Veterinary Advances, 7:
1006-1013.
Kumar, S. & Kumar, D.R.H. 2012. Importance of RP-HPLC in Analytical Method
Development: A Review. International Journal Of Pharmaceutical Sciences And
Research, 3: 4626-4633.
Kumar, T.M., Srikanth, G., Rao, J.V. & Rao, K.S. 2011. Development and Validation
of HPLC-UV Method for the Estimation of Levofloxacin in Human Plasma. International
Journal of Pharmacy and Pharmaceutical Sciences, 3: 247-250.
Kuno, Y., Kojima, M., Nakagami, H., Yonemochi, E. & Terada, K. 2008. Effect of the
type of lubricant on the characteristics of orally disintegrating tablets manufactured
using the phase transition of sugar alcohol. European Journal of Pharmaceutics and
Biopharmaceutics, 69: 986-992.
Kushner, S., Dalalian, H., Sanjurjo, J.L., BachJr., F.L., Safir, S.R., SmithJr., V.K. &
Williams, J.H. 1952. Experimental Chemotherapy of Tuberculosis. II. The Synthesis of
Pyrazinamides and Related Compounds. Journal of the American Chemical Society,
74: 3617–3621.
Lacroix, C., Hoang, T.P., Nouveau, J., Guyonnaud, C., Laine, G., Duwoos, H. & Lafont,
O. 1989. Pharmacokinetics of pyrazinamide and its metabolites in healthy subjects.
European Journal Of Clinical Pharmacology, 36: 395-400.
Lakshmi, G.R., Rao, G.N., Nayak, I.B., Kumar, J.R., Gowthami, K., S.Prameela & Rao,
P.A.J. 2015. HPLC and UV Spectrophotometric Estimation of Pyrazinamide in
Pharmaceutical Formulations. South Pacific Journal of Pharma and Bio Science, 3:
247-253.

141
Lalitha Devi, M. & Chandrasekhar, K.B. 2009. A Validated Stability-Indicating RP-
HPLC Method for Levofloxacin in the Presence of Degradation Products, its Process
Related Impurities and Identification of Oxidative Degradant. Journal of
Pharmaceutical and Biomedical Analysis, 50: 710-717.
Langtry, H. & Lamb, H. 1998. Levofloxacin: its use in infections of the respiratory tract,
skin, soft tissues and urinary tract. Drugs, 56: 487-515 429p.
Lau, E. 2001. Preformulation Studies. In: Ahuja, S. & Scypinski, S. (eds.) Handbook
of Modern Pharmaceutical Analysis. London: Academic Press. 173-175
Le, V.N.P., Thi, T.H.H., Robins, E. & Flament, M.P. 2012. Dry Powder Inhalers: Study
of the Parameters Influencing Adhesion and Dispersion of Fluticasone Propionate.
AAPS PharmSciTech, 13: 477-484.
Lee, C., Lee, M., Chen, Y. & et al. 2015. Risk of aortic dissection and aortic aneurysm
in patients taking oral fluoroquinolone. JAMA Internal Medicine, 175: 1839-1847.
Lerk, C.F., Bolhuis, G.K., Smallenbroek, A.J. & Zuurman, K. 1982. Interaction of tablet
disintegrants and magnesium stearate during mixing. II. Effect on dissolution rate.
Pharmaceutica acta Helvetiae, 57 282-286.
Leuenberger, H. 1982. The compressibility and compactibility of powder systems.
International Journal of Pharmaceutics, 12: 41-55.
Lewis, G.A. 2007. Optimization Methods. In: James, S. (ed.) Encyclopedia of
Pharmaceutical Technology. 3rd ed. New York: Informa Healthcare USA, Inc. 2452 -
2465
Lewis, T. & Cook, J. 2014. Fluoroquinolones and Tendinopathy: A Guide for Athletes
and Sports Clinicians and a Systematic Review of the Literature. Journal of Athletic
Training, 49: 422-427.
Liao, J.J.Z., Capen, R.C. & Schofield, T.L. 2006. Assessing the reproducibility of an
analytical method. Journal Of Chromatographic Science, 44: 119-122.
142
Liu, F., Ranmal, S., Batchelor, H., Orlu-Gul, M., Ernest, T., Thomas, I., Flanagan, T. &
Tuleu, C. 2014. Patient-Centred Pharmaceutical Design to Improve Acceptability of
Medicines: Similarities and Differences in Paediatric and Geriatric Populations. Drugs,
74: 1871-1889 1819p.
Liu, H.H. 2010. Safety Profile of the Fluoroquinolones: Focus on Levofloxacin. Drug
Safety, 33: 353-369.
Liu, Q.-L., Yang, L.-J., Luo, Y.-H., Jiang, Y.-H. & Sun, B.-W. 2016. Synthesis, crystal
structure, Hirshfeld surface analysis and DNA binding properties of interactions with
lattice pyrazinamide and its zinc(II) coordination polymer. Research on Chemical
Intermediates, 42: 6947-6957.
Liu, Y., He, Q. & Wu, M. 2015. Levofloxacin-induced crystal nephropathy. Nephrology,
20: 437-438.
Liversidge, G.G. & Cundy, K.C. 1995. Particle size reduction for improvement of oral
bioavailability of hydrophobic drugs: I. Absolute oral bioavailability of nanocrystalline
danazol in beagle dogs. International Journal of Pharmaceutics, 125: 91-97.
LoBrutto, R. 2007. Method Development. In: Kazekevich, Y. & Lobrutto, R. (eds.)
HPLC for pharmaceutical scientists. New Jersey: John Wiley & Sons, Inc. 380
LoBrutto, R. & Patel, T. 2007. Method Validation. In: Kazekevich, Y. & Lobrutto, R.
(eds.) HPLC for pharmaceutical scientists. New Jersey: John Wiley & Sons, Inc. 455-
502
Loebstein, R., Addis, A., Ho, E., Andreou, R., Sage, S., Donnenfeld, A.E., Schick, B.,
Bonati, M., Moretti, M., Lalkin, A., Pastuszak, A. & Koren, G. 1998. Pregnancy
Outcome Following Gestational Exposure to Fluoroquinolones: a Multicenter
Prospective Controlled Study. Antimicrobial Agents And Chemotherapy, 42: 1336-
1339.
Loto, O.M. & Awowole, I. 2012. Tuberculosis in Pregnancy: A Review. Journal of
Pregnancy: 1-7.
143
Lundstedt, T., Seifert, E., Abramo, L., Thelin, B., Nyström, Å., Pettersen, J. & Bergman,
R. 1998. Experimental design and optimization. Chemometrics and Intelligent
Laboratory Systems, 42: 3-40.
Ma, J.K.H. & Hadzija, B. 2013. Micromeritics and Pharmaceutical Powders. In:
Birtcher, K. & Reilly, T. (eds.) Basic Physical Pharmacy. Burlington, MA: Jones &
Bartlett Learning. 238-239
Mahalingam, R., Li, X. & Jasti, B.R. 2008. Normal Dosage Forms. In: Gad, S.C. (ed.)
Pharmaceutical Manufacturing Handbook Production and Processes. New Jersey:
John Wiley & Sons, Inc. 297
Mahato, R.I. & Narang, A.S. 2012. Tablets. Pharmaceutical Dosage Forms and Drug
Delivery. 2nd ed. Boca Raton: CRC Press. 354-355
Malhotra, K. 2003. Treatment of tuberculosis in chronic renal failure, maintenance
dialysis and renal transplant. Indian Journal of Nephrology, 13: 69-69.
Mali, S.S., Jadhav, S.B., Bharkad, V.B., Mohmmad Jameeruddin Kadam, V.S., Kapse,
G.R. & Hadbe, N.B. 2014. An Overview On Fast Disintegrating Tablets. Pharma
Science Monitor, 5: 209-225.
Mando, H. & Hasan, A. 2015. Development And Validation Of RP-HPLC Method For
Determination Of Levofloxacin In Tablet Using Uv And Fluorescence Detectors
Simultaniously. International Journal Of Pharmaceutical Sciences And Research, 6:
1401-1406.
Marais, A.F., Song, M. & Villiers, M.M. 2003. Effect of Compression Force, Humidity
and Disintegrant Concentration on the Disintegration and Dissolution of Directly
Compressed Furosemide Tablets Using Croscarmellose Sodium as Disintegrant.
Tropical Journal of Pharmaceutical Research, 2: 125-135.
Masih, A., Kumar, A., Singh, S. & Tiwari, A.K. 2017. Fast dissolving tablets: A Review.
International Journal of Current Pharmaceutical Research, 9: 1-11.
144
Medicines Control Council 2010. Guide to good manufacturing practice for medicines
in South Africa. Pretoria: Department of Health.
Micheli, L., Sbrilli, M. & Nencini, C. 2012. Severe hypoglycemia associated with
levofloxacin in Type 2 diabetic patients receiving polytherapy: two case reports.
International Journal Of Clinical Pharmacology And Therapeutics, 50: 302-306.
Miller, J.M. 2005. Impact of industrial and governmental regulatory practices on
analytical chromatography. In: Miller, J.M. (ed.) Chromatography: Concepts and
Contrasts. 2nd ed. New Jersey: John Wiley & Sons, Inc.
Miller, J.N. & Miller, J.C. 2010. Calibration methods in instrumental analysis:
regression and correlation. In: A, R.C., Chilvers, N. & Ros Woodward (eds.) Statistics
and Chemometrics for Analytical Chemistry. 6th ed. Harlow: Pearson Education
Limited. 114-121
Misiuk, W. 2010. The role of assay methods in characterizing the quality of bulk
pharmaceuticals. Journal of Pharmacy and Bioallied Sciences, 2: 88-92.
Mitra, A. & Wu, Y. 2012. Challenges and Opportunities in Achieving Bioequivalence
for Fixed-Dose Combination Products. The AAPS Journal, 14: 646-655.
Montgomery, D.C. 2013. Design and Analysis of Experiments, 8th ed. New Jersey,
John Wiley & Sons, Inc.
Moore, P. 1998. Children are Not Small Adults. The Lancet, 352: 630.
Moreton, C.R. 2006. Excipient Interactions. In: Katdare, A. & Chaubal, M.V. (eds.)
Excipient Development for Pharmaceutical, Biotechnology, and Drug Delivery
Systems. New York: Informa Healthcare USA, Inc. 93-101
Mosharraf, M. & Nyström, C. 1995. The effect of particle size and shape on the surface
specific dissolution rate of microsized practically insoluble drugs. International Journal
of Pharmaceutics, 122: 35-47.
145
Mostafa, H.F., Ibrahim, M.A. & Sakr, A. 2013. Development and optimization of
dextromethorphan hydrobromide oral disintegrating tablets: effect of formulation and
process variables. Pharmaceutical Development and Technology, 18: 454-463.
Murakami, H., Yoneyama, T., Nakajima, K. & Kobayashi, M. 2001. Correlation
between loose density and compactibility of granules prepared by various granulation
methods. International Journal of Pharmaceutics, 216: 159-164.
Myers, R.H., Montgomery, D.C. & Anderson-Cook, C.M. 2009. Response Surface
Methodology: Process and product optimization using designed experiments, 3rd ed.
New Jersey, John Wiley & Sons, Inc.
Nachega, J.B. & Chaisson, R.E. 2003. Tuberculosis Drug Resistance: A Global
Threat. Clinical Infectious Diseases, 36: 24-30.
Nau, R., Sörgel, F. & Eiffert, H. 2010. Penetration of Drugs through the Blood-
Cerebrospinal Fluid/Blood-Brain Barrier for Treatment of Central Nervous System
Infections. Clinical Microbiology Reviews, 23: 858-883.
Naveed, S., Sultana, N., Arayne, M.S. & Dilshad, H. 2014. A new HPLC method for
the assay of levofloxacin and its application in drug-metal interaction studies. Journal
of Scientific and Innovative Research, 3: 91*96.
North, D.S., Fish, D.N. & Redington, J.J. 1998. Levofloxacin, a Second‐Generation
Fluoroquinolone. Pharmacotherapy, 18: 915-935.
O'Neil, M.J. 2006. The Merck Index - An Encyclopedia of Chemicals, Drugs, and
Biologicals, 13th Edition ed. New Jersey, Merck and Co., Inc.
Oethinger, M., Kern, W.V., Jellen-Ritter, A.S., McMurry, L.M. & Levy, S.B. 2000.
Ineffectiveness of topoisomerase mutations in mediating clinically significant
fluoroquinolone resistance in Escherichia coli in the absence of the AcrAB efflux pump.
Antimicrobial Agents And Chemotherapy, 44: 10-13.
Ohkawa, K., Hashiguchi, M., Ohno, K., Kiuchi, C., Takahashi, S., Kondo, S., Echizen,
H. & Ogata, H. 2002. Risk factors for antituberculous chemotherapy-induced
146
hepatotoxicity in Japanese pediatric patients. Clinical Pharmacology And
Therapeutics, 72: 220-226.
Pahwa, R., Piplani, M., Sharma, P.C., Kaushik, D. & Nanda2, S. 2010. Orally
Disintegrating Tablets - Friendly to Pediatrics and Geriatrics. Archives of Applied
Science Research, 2: 35-48.
Parkash, V., Maan, S., Deepika, Yadav, S.K., Hemlata & Jogpal, V. 2011. Fast
disintegrating tablets: Opportunity in drug delivery system. Journal of Advanced
Pharmaceutical Technology & Research, 2: 223-235.
Patel, P.D., Afshar, H. & Birnbaum, Y. 2010. Levofloxacin-induced torsades de
pointes. Texas Heart Institute Journal, 37: 216-217.
Patel, S.S., Patil, N.D., Bhushan, R.R., Gujrathi, N.A. & Pawar, S.P. 2014. A Review -
Mouth Dissolving Tablet. Pharma Science Monitor, 5: 230-246.
Patil, M.R., Gujarathi, N.A. & Rane, B.R. 2014. Formulation and Evaluation Of Mouth
Dissolving Tablet: Review Article. Pharma Science Monitor, 5: 7-20.
Paul, S. & Sun, C.C. 2017. Lubrication with magnesium stearate increases tablet
brittleness. Powder Technology, 309: 126-132.
Peloquin, C.A., Bulpitt, A.E., Jaresko, G.S., Jelliffe, R.W., James, G.T. & Nix, D.E.
1998. Pharmacokinetics of pyrazinamide under fasting conditions, with food, and with
antacids. Pharmacotherapy, 18: 1205-1211.
Pham, A.Q., Doan, A. & Andersen, M. 2014. Pyrazinamide-Induced Hyperuricemia.
Pharmacy and Therapeutics, 39: 695-715.
Pham, D.-D., Fattal, E., Ghermani, N., Guiblin, N. & Tsapis, N. 2013. Formulation of
pyrazinamide-loaded large porous particles for the pulmonary route: Avoiding crystal
growth using excipients. International Journal of Pharmaceutics, 454: 668-677.
Pinto, L. & Menzies, D. 2011. Treatment of drug-resistant tuberculosis. Infection And
Drug Resistance, 4: 129-135.
147
Pistos, C., Tsantili-Kakoulidou, A. & Koupparis, M. 2005. Investigation of the
retention/pH profile of zwitterionic fluoroquinolones in reversed-phase and ion-
interaction high performance liquid chromatography. Journal of Pharmaceutical and
Biomedical Analysis, 39: 438-443.
Poux, M., Fayolle, P., Bertrand, J., Bridoux, D. & Bousquet, J. 1991. Powder mixing:
Some practical rules applied to agitated systems. Powder Technology, 68: 213-234.
Prasad, K.P.P. & Wan, L.S.C. 1987. Measurement of the Particle Size of Tablet
Excipients with the Aid of Video Recording. Pharm Res, 4: 504-508.
Preethi, J., Farhana, M.D., Babu, B.C., Faizulla, M.D., Bhowmik, D. & Duraivel, S.
2013. Recent Trends of Polymer Usage In The Formulation of Orodispersible Tablets.
Indian Journal of Research in Pharmacy and Biotechnology: 170-174.
Pretet, S. & Perdrizet, S. 1980. Toxicity of pyrazinamide in antituberculous treatments
(author's transl). Revue Francaise Des Maladies Respiratoires, 8: 307-330.
Pullan, S.T., Allnutt, J.C., Devine, R., Hatch, K.A., Jeeves, R.E., Hendon-Dunn, C.L.,
Marsh, P.D. & Bacon, J. 2016. The effect of growth rate on pyrazinamide activity in
Mycobacterium tuberculosis - insights for early bactericidal activity? BMC Infectious
Diseases, 16: 1-11.
Radandt, J.M., Marchbanks, C.R. & Dudley, M.N. 1992. Interactions of
fluoroquinolones with other drugs: mechanisms, variability, clinical significance, and
management. Clinical Infectious Diseases: An Official Publication Of The Infectious
Diseases Society Of America, 14: 272-284.
Rakic´, T., Kasagic´-Vujanovic´, I., Jovanovic´, M., Jancˇic´-Stojanovic´, B. & Ivanovic,
D. 2014. Comparison of Full Factorial Design, Central Composite Design, and Box-
Behnken Design in Chromatographic Method Development for the Determination of
Fluconazole and Its Impurities. Analytical Letters, 47: 1334–1347.
Revankar, S., Desai, N., Vaidya, A., Bhatt, A. & Anjaneyulu, B. 1994. Determination
of pyrazinamide in human by high performance liquid chromatography. Journal of
Postgraduate Medicine, 40: 7-9.
148
Ricker, R.D. & Sandoval, L.A. 1996. Fast, reproducible size-exclusion chromatography
of biological macromolecules. Journal Of Chromatography. A, 743: 43-50.
Robicsek, A., Strahilevitz, J., Jacoby, G.A., Macielag, M., Abbanat, D., Hye Park, C.,
Bush, K. & Hooper, D.C. 2006. Fluoroquinolone-modifying enzyme: a new adaptation
of a common aminoglycoside acetyltransferase. Nature Medicine, 12: 83-88.
Rosing, H., Man, W.Y., Doyle, E., Bult, A. & Beijnen, J.H. 2000. Bioanalytical liquid
chromatographic method validation. A review of current practices and procedures.
Journal of Liquid Chromatography & Related Technologies, 23: 329-354.
Rossiter, D. (ed.) 2014. South African medicines formulary, 11 ed. Cape Town: Health
and Medical Pub. Group.
Rouessac, F. & Rouessac, A. 2007. Chemical Analysis - Modern Instrumentation
Methods and Techniques, 2nd ed. West Sussex, John Wiley & Sons Ltd.
Rowe, R.C., Sheskey, P.J. & Quinn, M.E. 2009. Handbook of Pharmaceutical
Excipients. London, Pharmaceutical Press.
Roy, A. 2016. Orodispersible Tablets: A Review. Asian Journal of Pharmaceutical and
Clinical Research, 9: 19-26.
Roy, V., Tekur, U. & Chopra, K. 1999. Pharmacokinetics of pyrazinamide in children
suffering from pulmonary tuberculosis. The International Journal Of Tuberculosis And
Lung Disease: The Official Journal Of The International Union Against Tuberculosis
And Lung Disease, 3: 133-137.
Rozet, E., Ceccato, A., Hubert, C., Ziemons, E., Oprean, R., Rudaz, S., Boulanger, B.
& Hubert, P. 2007. Analysis of recent pharmaceutical regulatory documents on
analytical method validation. Journal of Chromatography A, 1158: 111-125.
Rudnic, E.M., Rhodes, C.T., Welch, S. & Bernardo, P. 1982. Evaluations of the
Mechanism of Disintegrant Action. Drug Development and Industrial Pharmacy, 8: 87-
109.

149
Ruiz, F., Vallet, T., Pensé-Lhéritier, A.-M. & Aoussat, A. 2017. Standardized method
to assess medicines’ acceptability: focus on paediatric population. Journal of
Pharmacy and Pharmacology, 69: 406-416.
Sakr, A.A. & Alanazi, F.K. 2013. Oral Solid Dosage Forms. In: Felton, L.A. (ed.)
Remington - Essentials of Pharmaceutics. London: Pharmaceutical Press. 584-585
Sangshetti, J.N., Deshpande, M., Zaheer, Z., Shinde, D.B. & Arote, R. 2014. Quality
by design approach: Regulatory need. Arabian Journal of Chemistry.
Sarraguça, M.C., Cruz, A.V., Soares, S.O., Amaral, H.R., Costa, P.C. & Lopes, J.A.
2010. Determination of flow properties of pharmaceutical powders by near infrared
spectroscopy. Journal of Pharmaceutical and Biomedical Analysis, 52: 484-492.
Saukkonen, J.J., Cohn, D.L., Jasmer, R.M., Schenker, S., Jereb, J.A., Nolan, C.M.,
Peloquin, C.A., Gordin, F.M., Nunes, D., Strader, D.B., Bernardo, J., Venkataramanan,
R. & Sterling, T.R. 2006. An Official ATS Statement: Hepatotoxicity of Antituberculosis
Therapy. American Journal of Respiratory and Critical Care Medicine, 174: 935-952.
Savjani, K.T., Gajjar, A.K. & Savjani, J.K. 2012. Drug Solubility: Importance and
Enhancement Techniques. ISRN Pharmaceutics, 2012: 195727.
Seddon, J.A. & Shingadia, D. 2014. Epidemiology and disease burden of tuberculosis
in children: a global perspective. Infection And Drug Resistance, 7: 153-165.
Segall, A., Vitale, M., Perez, V., Hormaechea, F., Palacios, M. & Pizzorno, M.T. 2000.
A Stability-Indicating HPLC Method to Determine Cyproterone Acetate in Tablet
Formulations. Drug Development and Industrial Pharmacy, 26: 867-872.
Seo, A. & Schæfer, T. 2001. Melt agglomeration with polyethylene glycol beads at a
low impeller speed in a high shear mixer. European Journal of Pharmaceutics and
Biopharmaceutics, 52: 315-325.
Shabir, G.A. 2003. Validation of high-performance liquid chromatography methods for
pharmaceutical analysis: Understanding the differences and similarities between
validation requirements of the US Food and Drug Administration, the US
150
Pharmacopeia and the International Conference on Harmonization. Journal of
Chromatography A, 987: 57-66.
Shabir, G.A., John Lough, W., Arain, S.A. & Bradshaw, T.K. 2007. Evaluation and
Application of Best Practice in Analytical Method Validation. Journal of Liquid
Chromatography & Related Technologies, 30: 311-333.
Shah, A.C. & Mlodozeniec, A.R. 1977. Mechanism of Surface Lubrication: Influence
of Duration of Lubricant-Excipient Mixing on Processing Characteristics of Powders
Properties of Compressed Tablets. Journal Of Pharmaceutical Sciences, 66: 1377-
1382.
Shah, V.P., Midha, K.K., Findlay, J.W., Hill, H.M., Hulse, J.D., McGilveray, I.J., McKay,
G., Miller, K.J., Patnaik, R.N., Powell, M.L., Tonelli, A., Viswanathan, C.T. & Yacobi,
A. 2000. Bioanalytical method validation - a revisit with a decade of progress. Pharm
Res, 17: 1551-1557.
Shalabh, H.T. 2009. Statistical Analysis of Designed Experiments, 3rd ed. New York,
Springer
Siddhartha, T.S., Prasanthi, B., Santosh, T. & Ratna, J.V. 2013. Development and
validation of high performance liquid chromatographic method for the determination of
pyrazinamide in human plasma. Journal of Pharmacy Research, 7: 33-38.
Siddiqui, M.R., AlOthman, Z.A. & Rahman, N. 2013. Analytical techniques in
pharmaceutical analysis: A review. Arabian Journal of Chemistry: 1-13.
Singh, R. 2013. HPLC method development and validation- an overview. Journal of
Pharmaceutical Education & Research, 4: 26-33.
Singh, S., Bhutani, H., Mariappan, T.T., Kaur, H., Bajaj, M. & Pakhale, S.P. 2002.
Behavior of uptake of moisture by drugs and excipients under accelerated conditions
of temperature and humidity in the absence and the presence of light. 1. Pure anti-
tuberculosis drugs and their combinations. International Journal of Pharmaceutics,
245: 37-44.
151
Snyder, L.R. & Kirkland, J.J. 1979. Ion-exchange chromatography. Introduction to
Modern Liquid Chromatography. 2nd ed. New York: John Wiley & Sons, Inc. 410-452
Snyder, L.R., Kirkland, J.J. & Glajch, J.L. 1997a. The Column. In: Snyder, L.R.,
Kirkland, J.J. & Glajch, J.L. (eds.) Practical HPLC Method Development. New Jersey:
John Wiley & Sons, Inc. 188-190
Snyder, L.R., Kirkland, J.J. & Glajch, J.L. 1997b. Completing the Method: Validation
and Transfer. Practical HPLC Method Development. New Jersey: John Wiley & Sons,
Inc. 686-697
Snyder, L.R., Kirkland, J.J. & Glajch, J.L. 1997c. Non-Ionic Samples: Reversed- and
Normal-Phase HPLC. Practical HPLC Method Development. New Jersey: John Wiley
& Sons, Inc. 233-291
Stamatakis, G., Montes, C., Trouvin, J.H., Farinotti, R., Fessi, H., Kenouch, S. & Méry,
J.P. 1988. Pyrazinamide and pyrazinoic acid pharmacokinetics in patients with chronic
renal failure. Clinical Nephrology, 30: 230-234.
Staniforth, J.N. & Taylor, K.M.G. 2013. Particle size analysis. In: Aulton, M.E. & M.G.,
K. (eds.) Aulton’s Pharmaceutics: The Design and Manufacture o f Medicines. 4th ed.
Toronto: Elsevier Ltd. 138-142
Steele, G. 2004. Preformulation Predictions from Small Amounts of Compound as an
Aid to Candidate Drug Selection. In: Gibson, M. (ed.) Pharmaceutical Preformulation
and Formulation. Boca Raton: CRC Press. 21-58
Sun, C. 2004. A Novel Method for Deriving True Density of Pharmaceutical Solids
Including Hydrates and Water-Containing Powders. Journal Of Pharmaceutical
Sciences, 93: 646-653.
Sun, C. 2005. True Density of Microcrystalline Cellulose. Journal Of Pharmaceutical
Sciences, 94: 2132-2134.
152
Sun, C.C. 2006. A material-sparing method for simultaneous determination of true
density and powder compaction properties—Aspartame as an example. International
Journal of Pharmaceutics, 326: 94-99.
Takaki, Y., Sasada, Y. & Watanabe, T. 1960. The crystal structure of [alpha]-
pyrazinamide. Acta Crystallographica, 13: 693-702.
Tamura, C., Kuwano, H. & Sasada, Y. 1961. Crystallographic data of carboxylic acids
and carboxyamides of picoline and pyrazine derivatives. Acta Crystallographica, 14:
693-693.
Taneja, R., Garcia-Prats, A.J., Furin, J. & Maheshwari, H.K. 2015. Paediatric
Formulations of Second-Line Anti-Tuberculosis Medications: Challenges and
Considerations. The International Journal of Tuberculosis and Lung Disease, 19: 61-
68.
Tanizaki, R., Morino, E., Sugihara, J., Kanno, Y., Takasaki, J., Kobayashi, N. &
Sugiyama, H. 2013. Pyrazinamide therapy for pulmonary tuberculosis in elderly
patients. IDWeek press conference. Tokyo: National Center for Global Health and
Medicine.
Taverniers, I., De Loose, M. & Van Bockstaele, E. 2004. Trends in quality in the
analytical laboratory. II. Analytical method validation and quality assurance. TrAC
Trends in Analytical Chemistry, 23: 535-552.
The National Department of Health 2012. Standard Treatment Guidelines and
Essential Medicines List for South Africa Hospital Level, Adults. 2012 ed. Pretoria: The
National Department of Health.
The National Department of Health 2013. Standard Treatment Guidelines and
Essential Medicines List for South Africa Hospital Level, Paediatrics. 2013 ed.
Pretoria: The National Department of Health.
Thee, S., Garcia-Prats, A.J., Donald, P.R., Hesseling, A.C. & Schaaf, H.S. 2015.
Fluoroquinolones for the treatment of tuberculosis in children. Tuberculosis
(Edinburgh, Scotland), 95: 229-245.
153
Thee, S., Garcia-Prats, A.J., McIlleron, H.M., Wiesner, L., Castel, S., Norman, J.,
Draper, H.R., van der Merwe, P.L., Hesseling, A.C. & Schaaf, H.S. 2014.
Pharmacokinetics of ofloxacin and levofloxacin for prevention and treatment of
multidrug-resistant tuberculosis in children. Antimicrobial Agents And Chemotherapy,
58: 2948-2951.
Thoithi, G.N., Kibwage, I.O., King’ondu, O. & Hoogmartens, J. 2002. Liquid
Chromatographic Separation of Isoniazid, Pyrazinamide and Rifampicin on a
Reversed Phase Silica Column. East and Central African Journal Pharmaceutical
Sciences, 5: 8-14.
Thoorens, G., Krier, F., Leclercq, B., Carlin, B. & Evrard, B. 2014. Microcrystalline
cellulose, a direct compression binder in a quality by design environment—A review.
International Journal of Pharmaceutics, 473: 64-72.
Trojer, L., Greiderer, A., Bisjak, C.P., Wieder, W., Heigl, N., Huck, C.W. & Bonn, G.K.
2011. Monolithic Stationary Phases in HPLC. In: Corradini, D. & Phillips, T.M. (eds.)
Handbook of HPLC. 2nd ed. Boca Raton: CRC Press. 3-46
Tye, H. 2004. Application of statistical ‘design of experiments’ methods in drug
discovery. Drug Discovery Today, 9: 485-491.
United States Pharmacopoeia - National Formulary [USP30 - NF25] 2007a. Bulk
Density and Tapped Density. Rockville, United States Pharmacopeial Convention Inc.
United States Pharmacopoeia - National Formulary [USP30 - NF25] 2007b. Sodium
Starch Glycolate Rockville, United States Pharmacopeial Convention Inc.
United States Pharmacopoeia - National Formulary [USP30 - NF25] 2007c. Validation
of compendial methods. Rockville, United States Pharmacopeial Convention Inc.
Vilegave, K., Vidyasagar, G. & Chandankar, P. 2013. Preformulation Studies of
Pharmaceutical New Drug Molecule & Products: An Overview. American Journal of
Pharmacy & Health Research, 1: 1-20.

154
Wells, J.I. 1988. Pharmaceutical preformulation: The physicochemical properties of
drug substances. Chichester, Ellis Horwood Limited.
Wimer, S.M., Schoonover, L. & Garrison, M.W. 1998. Levofloxacin: a therapeutic
review. Clinical Therapeutics, 20: 1049-1070.
Woo, J., Cheung, W., Chan, R., Chan, H.S., Cheng, A. & Chan, K. 1996. In vitro protein
binding characteristics of isoniazid, rifampicin, and pyrazinamide to whole plasma,
albumin, and alpha-1-acid glycoprotein. Clinical Biochemistry, 29: 175-177.
World Health Organisation 2008. Guidelines for the programmatic management of
drug-resistant tuberculosis Emergency update 2008. Geneva: World Health
Organization.
World Health Organisation 2010. Levofloxacin draft proposal for the international
pharmacopoeia. Geneva: World Health Organization.
World Health Organisation 2012. S.3.6 Bulk Densities and Tapped Densities of
Powders. Geneva: World Health Organization.
World Health Organisation 2016a. Global Tuberculosis Report. Geneva: World Health
Organization.
World Health Organisation 2016b. WHO treatment guidelines for drug-resistant
tuberculosis 2016 update. Geneva: World Health Organization.
World Health Organisation 2017. Guidelines for treatment of drug-susceptible
tuberculosis and patient care 2017 update. Geneva: World Health Organization.
Yefet, E., Schwartz, N., Salim, R. & Nachum, Z. 2015. The safety of quinolones in
pregnancy – a meta-analysis. American Journal of Obstetrics and Gynecology, 212:
314.
Yoshida, Y., Sato, E. & Moroi, R. 1993. Photodegradation products of levofloxacin in
aqueous solution. Arzneimittel-Forschung, 43: 601-606.
155
Yu, L.X., Amidon, G., Khan, M.A., Hoag, S.W., Polli, J., Raju, G.K. & Woodcock, J.
2014. Understanding Pharmaceutical Quality by Design. The AAPS Journal, 16: 771-
783.
Yu, W., Muteki, K., Zhang, L. & Kim, G. 2011. Prediction of Bulk Powder Flow
Performance Using Comprehensive Particle Size and Particle Shape Distributions.
Journal Of Pharmaceutical Sciences, 100: 284-293.
Zahran, A., Anderson-Cook, C. & Myers, R.H. 2003. Fraction of Design Space to
Assess the Prediction Capability of Response Surface Designs. Journal of Quality
Technology, 35: 377-386.
Zhang, L. & Mao, S. 2017. Application of quality by design in the current drug
development. Asian Journal of Pharmaceutical Sciences, 12: 1-8.
Zhang, L., Wei, M.-j., Zhao, C.-y. & Qi, H.-m. 2008. Determination of the inhibitory
potential of 6 fluoroquinolones on CYP1A2 and CYP2C9 in human liver microsomes.
Acta Pharmacol Sin, 29: 1507-1514.
Zhang, Y., Shi, W., Zhang, W. & Mitchison, D. 2014. Mechanisms of Pyrazinamide
Action and Resistance. Microbiology Spectrum, 2: 1-12.
Zhang, Y., Wade, M.M., Scorpio, A., Zhang, H. & Sun, Z. 2003. Mode of action of
pyrazinamide: disruption of Mycobacterium tuberculosis membrane transport and
energetics by pyrazinoic acid. The Journal Of Antimicrobial Chemotherapy, 52: 790-
795.
Zhu, L., Zhang, Y., Yang, J., Wang, Y., Zhang, J., Zhao, Y. & Dong, W. 2016.
Prediction of the pharmacokinetics and tissue distribution of levofloxacin in humans
based on an extrapolated PBPK model. European Journal of Drug Metabolism and
Pharmacokinetics, 41: 395-402.
Zolotov, Y.A. 2003. The Centenary of Chromatography. Journal of Analytical
Chemistry, 58: 703-705.
Copyright © 2022 FDOKUMEN