The unintended consequences of the zero lower bound policy
22
Journal of Financial Economics 123 (2017) 59–80 Contents lists available at ScienceDirect Journal of Financial Economics journal homepage: www.elsevier.com/locate/jfec The unintended consequences of the zero lower bound policy Marco Di Maggio a , Marcin Kacperczyk b,∗ a Harvard Business School and NBER, Baker Library 265, Soldiers Field Boston, MA 02163, United States b Imperial College London and CEPR, South Kensington Campus. London SW7 2AZ, United Kingdom a r t i c l e i n f o Article history: Received 17 February 2015 Revised 1 February 2016 Accepted 3 February 2016 Available online 10 September 2016 JEL codes: E52 G11 G14 G23 Keywords: Unconventional monetary policy Money funds Risk taking Fund exit a b s t r a c t We study the impact of the zero lower bound interest rate policy on the industrial organi- zation of the U.S. money fund industry. We find that in response to policies that maintain low interest rates, money funds: change their product offerings by investing in riskier asset classes; are more likely to exit the market; and reduce the fees they charge their investors. The consequence of fund closures resulting from interest rate policy is the relocation of re- sources in affected fund families and in the asset management industry in general, as well as decline in capital of issuers borrowing from money funds. © 2016 Elsevier B.V. All rights reserved. 1. Introduction In the aftermath of the financial crisis of 2007–2008, the Federal Reserve took an unprecedented decision to lower short-term nominal interest rates to zero, a policy We thank Adi Sunderam (referee), Daron Acemoglu, Ashwini Agrawal, Franklin Allen, Andrea Buraschi, Andrew Ellul, Paul Glasserman, Tullio Jap- pelli, Charles Jones, Amir Kermani, Ralph Koijen, Emi Nakamura, Marco Pagano, Roberta Scarpato, Philipp Schnabl, Philip Strahan, Harald Uhlig, Paul Whelan, and seminar participants at the American Finance Associa- tion 2016 meeting, Aalto University, BI Oslo, Columbia Business School, Exeter University, Federico II University, HKUST, Hong Kong Polytechnic, Imperial College, London Empirical Asset Pricing Meeting, National Bank of Poland, National University of Singapore, Singapore Management Uni- versity, Tilburg University, and University of Hong Kong for helpful com- ments and discussions. We acknowledge financial support from Inquire Europe. ∗ Corresponding author. Fax: +442075949184. E-mail addresses: [email protected] (M. Di Maggio), [email protected] (M. Kacperczyk). commonly known as zero lower bound policy. This ini- tial action was followed by a sequence of announcements providing guidance that the short-term rate would stay near zero for a longer period. While several economists have argued that the Fed’s policy exerted a positive impact on the U.S. economy by stimulating a sluggish economic growth and boosting employment, some critics pointed out that the policy might have also produced undesired conse- quences, for example, inflation in asset prices, or ill-suited incentives to chase higher yields. In this paper, we show that the policy created a shock to an important part of the shadow banking system, money funds, which resulted in significant dislocations in terms of their market participa- tion and product offerings. By regulation, money market funds (henceforth MMFs) are obliged to invest in safe short-term assets with rates of return that are typically close to the Fed target rate. The monetary policy shock has thus driven the funds’ gross profit margins nearly to zero and has seen many fund http://dx.doi.org/10.1016/j.jfineco.2016.09.006 0304-405X/© 2016 Elsevier B.V. All rights reserved.
-
Upload
khangminh22 -
Category
Documents
-
view
1 -
download
0
Transcript of The unintended consequences of the zero lower bound policy
Journal of Financial Economics 123 (2017) 59–80
Contents lists available at ScienceDirect
Journal of Financial Economics
journal homepage: www.elsevier.com/locate/jfec
The unintended consequences of the zero lower bound
policy
�
Marco Di Maggio
a , Marcin Kacperczyk
b , ∗
a Harvard Business School and NBER, Baker Library 265, Soldiers Field Boston, MA 02163, United States b Imperial College London and CEPR, South Kensington Campus. London SW7 2AZ , United Kingdom
a r t i c l e i n f o
Article history:
Received 17 February 2015
Revised 1 February 2016
Accepted 3 February 2016
Available online 10 September 2016
JEL codes:
E52
G11
G14
G23
Keywords:
Unconventional monetary policy
Money funds
Risk taking
Fund exit
a b s t r a c t
We study the impact of the zero lower bound interest rate policy on the industrial organi-
zation of the U.S. money fund industry. We find that in response to policies that maintain
low interest rates, money funds: change their product offerings by investing in riskier asset
classes; are more likely to exit the market; and reduce the fees they charge their investors.
The consequence of fund closures resulting from interest rate policy is the relocation of re-
sources in affected fund families and in the asset management industry in general, as well
as decline in capital of issuers borrowing from money funds.
© 2016 Elsevier B.V. All rights reserved.
1. Introduction
In the aftermath of the financial crisis of 20 07–20 08,
the Federal Reserve took an unprecedented decision to
lower short-term nominal interest rates to zero, a policy
� We thank Adi Sunderam (referee), Daron Acemoglu, Ashwini Agrawal,
Franklin Allen, Andrea Buraschi, Andrew Ellul, Paul Glasserman, Tullio Jap-
pelli, Charles Jones, Amir Kermani, Ralph Koijen, Emi Nakamura, Marco
Pagano, Roberta Scarpato, Philipp Schnabl, Philip Strahan, Harald Uhlig,
Paul Whelan, and seminar participants at the American Finance Associa-
tion 2016 meeting, Aalto University, BI Oslo, Columbia Business School,
Exeter University, Federico II University, HKUST, Hong Kong Polytechnic,
Imperial College, London Empirical Asset Pricing Meeting, National Bank
of Poland, National University of Singapore, Singapore Management Uni-
versity, Tilburg University, and University of Hong Kong for helpful com-
ments and discussions. We acknowledge financial support from Inquire
Europe. ∗ Corresponding author. Fax: + 442075949184.
E-mail addresses: [email protected] (M. Di Maggio),
[email protected] (M. Kacperczyk).
http://dx.doi.org/10.1016/j.jfineco.2016.09.006
0304-405X/© 2016 Elsevier B.V. All rights reserved.
commonly known as zero lower bound policy. This ini-
tial action was followed by a sequence of announcements
providing guidance that the short-term rate would stay
near zero for a longer period. While several economists
have argued that the Fed’s policy exerted a positive impact
on the U.S. economy by stimulating a sluggish economic
growth and boosting employment, some critics pointed out
that the policy might have also produced undesired conse-
quences, for example, inflation in asset prices, or ill-suited
incentives to chase higher yields. In this paper, we show
that the policy created a shock to an important part of the
shadow banking system, money funds, which resulted in
significant dislocations in terms of their market participa-
tion and product offerings.
By regulation, money market funds (henceforth MMFs)
are obliged to invest in safe short-term assets with rates
of return that are typically close to the Fed target rate.
The monetary policy shock has thus driven the funds’ gross
profit margins nearly to zero and has seen many fund

60 M. Di Maggio, M. Kacperczyk / Journal of Financial Economics 123 (2017) 59–80
investors face investment opportunities with negative (net
of fees) expected returns. The deteriorating investment
environment, in turn, has triggered significant responses
of MMFs and the broader asset management industry in
terms of their product offerings, pricing policy, and organi-
zational structure. We study empirically these adjustments
using detailed micro-level data.
Traditionally, MMFs used to offer relatively low re-
turns for the provision of safety. While this idea has been
somewhat shattered with the collapse of the Reserve Pri-
mary Fund and the run on MMFs in September 2008 (e.g.,
Kacperczyk and Schnabl, 2013; Chernenko and Sunderam,
2014; Strahan and Tanyeri, 2015 ), until then, MMFs pro-
vided investors positive returns, even after paying fees. The
consequence of the unprecedented change in interest rates
to levels close to zero has been that returns on traditional
money market instruments, such as Treasuries, repos, or
deposits declined to similarly low levels. Therefore, any
fund investing in these assets was likely to produce neg-
ative net-of-fees nominal returns to their investors. It has
thus become obvious that such a business model cannot be
sustained for too long, as money would flow out of funds
with negative returns. 1
Such a dire situation has posed a dilemma for money
funds. On the one hand, they could accept the situa-
tion and keep their risk profiles unchanged. This, how-
ever, would force them to first reduce or even waive their
fees, and in the end, if the low rates persisted, to exit
the market. On the other hand, funds could change their
product offerings by shifting their risk into securities with
higher interest rates, thus accepting higher risk in their
portfolios, an idea coined as reaching for yield. Increas-
ing fund risk would boost returns and investor flows (e.g.,
Christoffersen, 2001 ), and would likely prevent funds from
exiting the market. The cost of increasing risk would be a
higher chance of being run on in the event of distress in
the money market industry. The consequence of such runs
would be distress of individual funds themselves, which
could generate high costs either in terms of the necessity
to bail out the fund or through a significant loss of repu-
tation for the fund organization and other related business
of a fund sponsor.
In this paper, we assess empirically the equilibrium re-
sponse of MMFs to the low interest rate environment us-
ing weekly data on the universe of U.S. prime funds. We
exploit both a time-series and cross-sectional variation in
the data to identify the causal effect of the unconventional
monetary policy on MMFs’ strategies. Our main empirical
identification comes from an event study analysis of five
Federal Open Market Committee (FOMC) announcements,
which signaled that interest rates would be kept near zero
into the future. These decisions were plausibly exogenous
with respect to the funds’ behavior; hence, they constitute
a useful shock. The access to high-frequency fund data al-
lows us to measure empirical effects within short event
1 A standard portfolio theory suggests that investors should look at
fund spread, returns net of Treasury bill, rather than fund returns as a
way of assessing their decisions. But in times of zero interest rates both
returns and spreads are virtually the same. In addition, our regression es-
timates account for any business-cycle variation in the data.
windows. Specifically, we compare MMFs’ choices of risky
product offerings, exit, and expense policy in the fund
data.
In the time series, we document an increase in the
probability of exit from the MMF industry, higher risk tak-
ing, lower expenses charged by MMFs, and higher fund
subsidies in the period of three to six months after the
announcements. Our results are economically and statisti-
cally significant. Notably, while we do not find any vari-
ation in expenses incurred by these funds over time, the
fees charged are significantly reduced during a zero inter-
est rate period, which suggests that MMFs were actively
maintaining their fees as a way of keeping their business
alive and did not simply go through a period of lower op-
erating costs.
In the cross section, we find that reaching for yield is
particularly strong for independent funds, that is, funds
whose sponsors are not affiliated with an insurance com-
pany, commercial, or investment bank. In contrast, rather
than taking more risk, affiliated funds exit the market.
We do not find significant differences across fund types in
terms of their expense policies. We further enhance these
findings by exploiting a variation in family-level percent-
age of assets managed by MMFs within a group of inde-
pendent sponsors. We find that funds whose families in-
vest a greater percentage of their assets in MMFs are less
likely to exit and more likely to take more risk. The results
are consistent with a hypothesis that reputational concerns
shape MMFs’ strategic decisions. In sum, to the extent that
any macroeconomic (time-series) shock would likely affect
all types of funds in a similar way, the results suggest that
ours is a leading mechanism explaining the data.
We conduct a number of tests to improve our identifi-
cation and alleviate any empirical concerns. Our first con-
cern is identification of the results on risk taking. To the
extent that safer funds are more likely to exit, our risk re-
sults could be driven by survival of the more risky funds.
The question is whether strategic behavior of individual
funds also contributes to risk changes over and above the
negative selection channel. To address this concern we
redo all our tests by removing funds that exit the sam-
ple after the shock. Our results remain qualitatively simi-
lar, which suggests that the negative selection and strategic
fund behavior are both responsible for changes in risk.
Our second concern is that our results are not specif-
ically about the role of zero-rate policy but rather are a
generic response to changes in interest rates, independent
of their levels. We address this concern by estimating our
basic models separately for two subperiods: a period with
rates higher than 1% (control group) and a period with
rates of at most 1% (treatment group). We find a strong
discontinuity in the way MMFs respond to changes in the
Fed target rate. While we observe no visible effect on exit,
risk, and fees when the rate is above 1%, we observe a sim-
ilar quality of results as our main findings in periods when
interest rates equal at most 1%.
Third, we include monetary policy surprises rather than
the Fed target rate changes in our regressions and con-
firm our results on fund exit and risk taking, which alle-
viates any concern that our results are driven by changes
in economic conditions proxied by the Fed target rate,
M. Di Maggio, M. Kacperczyk / Journal of Financial Economics 123 (2017) 59–80 61
3 Notable examples of recent contributions on money funds include
Christoffersen (2001), Christoffersen and Musto (2002), Baba, McCauley,
and Ramaswamy, (2009), McCabe (2010), Di Maggio (2013), Duygan-
Bump, B., Parkinson, Rosengren, Suarez, Willen, (2013), Kacperczyk and
Schnabl (2013), Chernenko and Sunderam (2014) , and Strahan and Tany-
eri (2015) . 4 Related literature on conducting the zero interest rate monetary pol-
rather than changes in monetary policy. Fourth, we posit a
stronger reaction of MMFs as they expect low interest rates
to last longer. We back out the date the market expects
the Fed target rate to increase from the Fed funds futures
data and find that funds reach for yield more the longer
the market expects interest rates to remain below 1%. Fi-
nally, we use evidence from detailed portfolio holdings for
a shorter sample of 2010–2013 and show that, as a result
of a shock, MMFs tend to acquire assets whose yields are
distinctly higher than those of the assets that were ac-
quired a month before. A similar analysis for a placebo
sample (periods without a policy change) gives opposite
results. In sum, our results suggest that the zero-bound
policy may drive changes in MMFs’ strategies.
Next, we show that the disruptions in the MMF indus-
try have real effects. On the one hand, in the absence of
search frictions we would not expect any effect on the
availability of credit to firms as they could easily substitute
one fund with another. On the other hand, firms might find
it difficult to borrow from different institutions with which
they do not have prior relationships. To test this hypothe-
sis, we collect information on the leverage of nonfinancial
firms borrowing from MMFs. We show that within a six-
month period after the closure of a given fund, leverage
of firms borrowing from the fund is significantly reduced
compared to that of firms borrowing from funds that re-
main active. This effect, however, is short lived, as it disap-
pears a year after the fund closure.
In our final set of results, we show that the strategic
adjustment in the MMF industry has broader industry or-
ganization implications for the entire mutual fund sector.
We investigate whether the fund families that decide to
close their MMFs in response to monetary shock open new
funds in a different asset class, possibly less stressed by
low interest rates. Empirically, we compare fund closures
and fund creations of fund families that have closed their
MMFs with those that did not. We find that the former
ones are significantly more likely to open new bond funds,
but not equity or balanced funds. We also show active re-
allocation of managerial talent either to other MMFs or to
bond funds. The above results suggest that the prolonged
period of low interest rates leads to the reallocation of re-
sources across largely similar asset classes.
Overall, our results highlight an important channel for
transmission of monetary policy that has been completely
overlooked by the academic literature, but one that is ex-
tremely relevant for practitioners and policy makers. This
message resonates well with the August 2009 Fitch report
about U.S. MMFs that states: "Over the longer term, more
conservative portfolio composition, combined with the cur-
rent low interest rate environment, may result in fund clo-
sures, fund consolidation, and/or a resurgent appetite for
credit and liquidity risk.”2
The rest of the paper proceeds as follows. In Section 2 ,
we discuss the related literature. Section 3 provides further
details about the institutional setting of money funds. Em-
pirical design, the data, and empirical results are discussed
2 "U.S. prime money market funds: Managing portfolio composition to
address credit & liquidity risks" is available on Fitch’s website at www.
fitchratings.com .
in Sections 4 and 5 . In Section 6 , we discuss broad impli-
cations for the industry organization of the mutual fund
sector. Section 7 concludes. In the Online Appendix, we re-
port a few additional results showing the robustness of our
main findings.
2. Related literature
Various papers have studied the role of money funds. 3
To the best of our knowledge our paper is the first to ex-
amine the impact of monetary policy on industrial orga-
nization of money funds—the change in product offerings
(risk taking) and in market structure (exit)—and its impli-
cations for capital supply to fund borrowers and the allo-
cation of resources within the industry. In this regard, the
closest studies to ours are Kacperczyk and Schnabl (2013),
Strahan and Tanyeri (2015) , and Di Maggio (2013) , which
analyze risk taking of MMFs before and after the collapse
of Lehman Brothers, and during the European debt crisis,
respectively. The key novelty of our paper is a new mech-
anism that explains risk taking. While in Kacperczyk and
Schnabl (2013) the key friction is the increase in yields dis-
persion of the different investable asset classes, the fric-
tion we emphasize here is the zero lower bound policy.
Moreover, we focus on funds’ strategic decisions to alter
their expense policy and moderate their entry and exit,
and quantify the value of subsidies provided by sponsors
to their funds. The last result allows us to assess the costs
of the monetary policy from the perspective of these inter-
mediaries.
Several papers studied the importance of conducting
monetary policy at the zero bound. These papers pri-
marily focus on aggregate macro quantities. 4 Our paper,
in turn, is one of the first to provide micro-level ev-
idence on the reaction of financial institutions to low
interest rates. 5 The benefit of using micro-level data is
better identification of the underlying economic mecha-
nism. In this vein, Maddaloni and Peydró (2011) find that
low short-term rates soften lending standards for retail
and corporate loans. Jimenez, Ongena, Peydró, and Saurina
(2014) show that lowering overnight interest rates induces
less-capitalized banks to lend to riskier firms. These stud-
ies, however, do not explicitly study the role of the zero
bound policy and their response variables and contexts are
different than ours.
Also related is a study by Chodorow-Reich (2014) who
considers high-frequency event studies to analyze the ef-
fects of the unconventional monetary policy on banks and
life insurance companies. He shows that such institutions
icy at the macro level includes Woodford (2003) and Bernanke, Reinhart,
Sack, (2004) . 5 One exception is Di Maggio, Kermani, and Palmer (2015) who con-
sider the effects of quantitative easing on the allocation of credit in the
mortgage market.
62 M. Di Maggio, M. Kacperczyk / Journal of Financial Economics 123 (2017) 59–80
Table 1
Zero Interest Rate Policy Events (ZIRP).
We report the dates of FOMC meetings in which the Fed decided to
change the Fed target rate or provided policy guidance about the prevail-
ing zero interest rate policy.
Date Event
December 16, 2008 Fed target rate reduced to 0–0.25%
March 18, 2009 Zero rates for “an extended period of time”
August 9, 2011 Zero rates at least until 2013
January 25, 2012 Zero rates at least until 2014
September 13, 2012 Zero rates at least until 2015
benefit from low interest rates. Incidentally, though not his
main focus, he also examines a time-series variation in risk
taking of MMFs. He documents evidence of a significant
reaching-for-yield behavior, especially in the period 2008–
2012. While he analyzes annual trends in funds’ risk tak-
ing, we consider narrow monetary policy event windows
to isolate a specific effect of interest rate policy changes
on industrial organization of the entire money fund sec-
tor. Further, a large and novel portion of our paper dis-
cusses: (i) a cross-sectional variation in fund strategies, (ii)
the tradeoff between risk taking and exit, (iii) evidence on
sponsors’ subsidies, (iv) real effects in the corporate sector,
and (v) broader asset management implications on the la-
bor and assets fronts. Finally, we show a distinct asymme-
try in fund strategies conditional on the level of the Fed
target rate.
More broadly, our paper sheds new light on the incen-
tives of asset managers to reach for yield—one of the core
factors contributing to the buildup of credit that preceded
the financial crisis ( Rajan, 2010; Yellen, 2011 ; and Stein,
2013 ). Popular explanations include competition among
fund managers, different preferences for risk, or desire to
offset constraints imposed by regulation. We provide a set-
ting in which the incentives to reach for yield on one hand
are limited by strict regulation, on the other hand they are
significantly affected by changes in interest rates and ex-
pectations about their future changes.
3. The institutional setting: money market funds
Money funds are important intermediaries between in-
vestors who want low-risk liquid investments and banks
and corporations that have short-term borrowing needs.
The funds are key buyers of short-term debt issued by
banks and corporations: commercial paper, bank certifi-
cates, and repurchase agreements, with an aggregate vol-
ume of $1.8 trillion. Given the importance of short-term
credit markets to both investors and businesses, any dis-
ruption in this sector would represent a potential threat to
financial stability.
In the United States, MMFs’ holdings are regulated by
Rule 2a-7 of the Investment Company Act of 1940. The
funds are prohibited from purchasing long-term assets
such as mortgage-backed securities, corporate bonds, or
equity and can only hold short-term assets; and even these
must be of high quality. As an additional requirement, to
enhance diversification, the funds cannot hold more than
5% of their assets in the securities of any individual issuer
with the highest rating and not more than 1% in the secu-
rities of any other issuer.
In January 2009, after a tumultuous year for MMFs,
the Securities Exchange Commission (SEC) voted to amend
the 2a-7 rules to strengthen MMFs. The new rules seek to
limit the risk and improve on fund disclosure. For instance,
funds are now required to have enhanced reserves of cash
and readily liquidated securities to meet redemption re-
quests and they can invest only 3% (down from 5%) of total
assets in tier-2 securities, the term on which is limited to a
maximum maturity of 45 days. Under the new rules, start-
ing in November 2010, MMFs have to make monthly dis-
closure of detailed data, including each fund’s holdings and
shadow net asset value (NAV). This information becomes
available to the public after 60 days. The new N-MFP form
on which it is filed constitutes one of the sources of data
for the present study.
4. Research design and data
4.1. Empirical design
In our empirical tests, we want to identify the impact of
interest rate policy on MMFs’ behavior. Our main focus is
on the effects due the zero lower bound policy, introduced
in December 2008. Since the policy set the short-term
rate to zero, any identification due to interest rate changes
would be difficult. To this end, we explore the importance
of additional communication from the Federal Reserve re-
garding the duration of the zero-rate policy—forward guid-
ance policy. In our context, the duration of the zero-rate
policy is crucial as it directly determines how long the
MMF business is subject to profit stress. In particular, one
could imagine that short-lasting policy would have dif-
ferent equilibrium implications as MMFs could withstand
temporary headwinds by taking short-term losses. The sit-
uation, in turn, would differ if the pressure were main-
tained for a longer time.
In our analysis, we focus on the MMFs’ behavior around
events related to FOMC meetings during which at least one
of the following outcomes occurred: (1) a change in the
interest rates, (2) forward guidance announcement. Table 1
provides a short description of the events in chronological
order. The first event date is December 16, 2008, which is
the date of the meeting at which the Fed target rate was
cut to 0–0.25%, and the other four event dates capture the
meetings at which the Fed outlined its forward guidance
regarding the duration of the zero-rate regime. Specifically,
on March 18, 2009, the Fed announced that it would keep
rates at zero for “an extended period of time,” while on
August 9, 2011, January 25, 2012, and September 13, 2012,
the Fed stated that the rates would remain at zero until
2013, 2014, and 2015, respectively.
Notably, during our period of analysis there have been
other policy-related events that might have affected finan-
cial markets, an important one being the quantitative eas-
ing (QE) interventions. We do not consider QE events for
two reasons. First, the QE interventions mainly targeted
the long-term part of the yield curve, but the opportunity
set of MMFs only spans short-term assets. Second, QE pri-
marily entails the purchase of mortgage-backed securities,
M. Di Maggio, M. Kacperczyk / Journal of Financial Economics 123 (2017) 59–80 63
and these securities cannot be held by MMFs due to regu-
latory constraints.
Our event-study analysis requires constructing reason-
able windows around the event dates. Given that various
MMFs’ strategies can be adopted with different speed we
consider two horizons: a short horizon of three months,
and a long horizon of six months after the event. In both
cases, the pre-event window is set at one month to ensure
that no pre-event trends drive the patterns in the data. Our
empirical strategy is to compare the average fund behavior
around the event dates.
In our empirical tests, we also exploit cross-sectional
differences across MMFs. In particular, we distinguish be-
tween funds whose sponsors are affiliated with a large fi-
nancial institution, such as commercial bank, investment
bank, or insurance company, and funds whose sponsors are
affiliated with an independent asset manager. We believe
the two groups exhibit distinct responses to the events
of interest rate changes. For example, the bank-affiliated
funds exhibit weaker incentives to reach for yield than
independent funds so as to limit the probability of the
bad outcome in which the bank would be forced to in-
vest resources to save the fund. Independent funds, in turn,
have stronger incentives to reach for yield in order to pro-
vide investors with higher returns, compensating investors
for giving up the implicit insurance of the bank. More-
over, bank-affiliated funds might have reputation at stake
in which case they might prefer to exit the less risky yet
unprofitable fund industry rather than improve its prof-
itability by ramping up risk.
4.2. Data
Our sample of funds includes the universe of U.S. tax-
able prime funds. We collect data for our tests from several
sources. First, the data on MMFs come from iMoneyNet
and cover the period from January 2005 to December 2013
including weekly fund-level data on yields, expense ratios
(charged and incurred), average maturity, holdings by in-
strument type, and fund sponsor. Second, we complement
the data with information from the CRSP Mutual Fund
Database, especially assets under management and en-
try/exit of other funds. Third, we use Compustat and com-
panies’ websites for information on sponsor characteristics.
Fourth, we collect data on fund managers from Investor
Observer, LinkedIn, Morningstar, Zabasearch, and Zoom-
info. Finally, information about Fed target rate changes and
the forward-guidance policy comes from the Federal Re-
serve Board website.
We conduct most of our analyses at the fund portfolio
level. We aggregate all share classes by fund and investor
type. We compute fund characteristics (e.g., expense ratio)
as weighted averages using share class assets as weights.
Some funds offer both retail and institutional share classes.
Institutional shares are generally larger; hence, we classify
a fund as institutional if it offers at least one institutional
class, and as retail if it does not offer institutional share
classes. 6
6 Following earlier studies, we also analyzed the data with institutional
funds only. The results are qualitatively similar.
Table A.1 in the Online Appendix provides summary
statistics of the data. Our sample includes 349 different
fund portfolios. The average fund size in our sample equals
approximately $8.3 billion. The average portfolio maturity
is 40 days and the average fund age equals 15.8 years.
The average Fed target rate in our sample equals 183 ba-
sis points while the average gross fund return equals 231
basis points. Hence, out of the abnormal profit of 47 basis
points, 38 basis points account for expenses, which leaves
about 10 basis points accruing to fund investors. Our sam-
ple is fairly balanced with respect to sponsor type as 59%
of funds have bank-affiliated sponsors and 41% have inde-
pendent asset management companies as sponsors.
We compare our sample properties in the high and low
interest-rate regimes. This sample split is based on the in-
terest rate level of 1% and reflects our view of what we
consider a period of profit stress. A number of interesting
patterns emerge. First, the spread during the low-rate pe-
riod is 25% lower than that in the high-rate period; also,
the nominal gross return is almost ten times larger in
the high-rate period. This suggests that MMFs face greater
challenges in obtaining high returns in a low interest rate
environment. Second, if we look at expenses charged they
are significantly lower in the low-rate period, with a drop
from 50 to 28 basis points, while expenses incurred remain
almost the same. This suggests that while the costs are not
affected by the monetary policy, the stress imposed on the
profit margin reduces the possibility for a fund to charge
fees to investors. In other words, funds are more likely to
offer subsidies to their fund investors. Third, while fund
flows are positive during the earlier period, they become
negative in the low interest rate environment. This is con-
sistent with the idea that investors have become less will-
ing to make investments in MMFs as their returns became
less attractive. Finally, we observe a significant decline of
more than 50 in the number of funds over the two peri-
ods: from 326 to 274 funds in the second period, which
constitutes a significant exit from the sector.
Finally, we focus on the period of low interest rates and
report separate summary statistics for two major groups
of funds: bank-affiliated and independent. Bank-affiliated
funds are on average smaller with the difference of about
$3 billion. They are also less risky as their spreads are
lower; they invest in shorter-maturity assets and in safer
assets such as repos or Treasuries. They charge slightly
lower fees and face higher outflows, consistent with the
flow-performance relationship observed in other studies
( Chevalier and Ellison, 1997 ; and Kacperczyk and Schnabl,
2013 ).
5. Empirical results
In this section, we present our main results. First, we
show the importance of interest rates in generating fund
returns and establish the link between fund returns and
subsequent fund flows. Next, we look at the effects of the
forward guidance policy on risk product offerings, fund
exit, and expenses in the time series and in the cross sec-
tion. Finally, we provide a series of robustness tests that
are meant to strengthen the identification of our mecha-
nism.
64 M. Di Maggio, M. Kacperczyk / Journal of Financial Economics 123 (2017) 59–80
Table 2
Fund gross returns and Fed target rate.
The sample is all U.S. prime money market funds over the period January 2005–December
2013. The dependent variable is Fund gross return computed as the annualized return. Fed rate
is the annualized Fed target rate. Control variables include the natural logarithm of fund as-
sets, the natural logarithm of family assets, the expense ratio (charged), fund age, fund flow
computed as a percentage change in total net assets from time t to time t + 1 adjusted for mar-
ket appreciation, standard deviation of fund flow growth, and an indicator variable equal to
one if the fund is offered to institutional investors and zero otherwise. All regressions are at
the weekly level. Column 1 includes year-fixed effects, column 2 includes fund-fixed effects,
column 3 includes sponsor-fixed effects, and column 4 includes year-fixed and sponsor-fixed
effects. Standard errors are clustered at the week level. ∗∗∗ , ∗∗ , ∗ represent 1%, 5%, and 10% sig-
nificance, respectively.
(1) (2) (3) (4)
Fed rate 93.025 ∗∗∗ 94.370 ∗∗∗ 62.291 ∗∗∗ 62.086 ∗∗∗
(1.012) (0.963) (5.087) (5.083)
Controls Yes Yes Yes Yes
Year-fixed effects No No Yes Yes
Fund-fixed effects Yes No No No
Sponsor-fixed effects No Yes No Yes
Observations 98,496 98,496 98,496 98,496
5.1. Asset returns and fund flows
The basic premise of our mechanism is that yields on
assets in which money funds can invest, and consequently
their portfolio returns, depend on the level of the Fed tar-
get rate. We begin our analysis by identifying such a link
in the data. To this end, we estimate the regression model
of fund gross returns ( Fund return ) on the Fed target rate
( Fed rate ) over our sample period. 7
F und retur n it = a 0 + a 1 F ed rat e t + b X it −1 + ε it (1)
In the regression, we control for other determinants of
fund returns possibly correlated with the level of interest
rates (subsumed by vector X ), such as the natural loga-
rithm of fund size ( Log ( Fund size )), the natural logarithm
of fund family size ( Log ( Family size )), the level of expenses
charged by funds ( Expenses ), fund age ( Age ), the percent-
age change in fund assets accounted for capital apprecia-
tion ( Fund flow ), the standard deviation of fund flows ( Fund
flow volatility ), and an indicator variable for the fund that
is marketed to institutional investors ( Institutional ). Fur-
ther, we account for any time-invariant fund and spon-
sor characteristics by introducing fund- and sponsor-fixed
effects. To address a potential concern that interest rates
might proxy for general macro trends in the data we in-
clude year-fixed effects. We cluster standard errors at the
year/week dimension to account for any cross-sectional de-
pendence of residuals due to the commonality of interest
rates across fund observations. We report the results in
Table 2.
Our results show that fund performance improves in
periods of high interest rates. The effect is statistically and
economically highly significant. Consistent with our hy-
pothesis that assets held by MMFs are highly correlated
with the level of short-term rates, we find that fund re-
turns respond almost one-to-one to changes in interest
7 Alternatively, we could consider returns net of inflation, as in this pe-
riod inflation is very low. This dimension of variation in the data is cap-
tured by time-fixed effects.
rates, as can be observed in columns 1 and 2. In sum, the
results underscore the importance of interest rates for gen-
erating fund performance. More important, they highlight
why the MMF industry is a great setting to study the con-
sequences of the prolonged period of low interest rates. In
fact, there is no other large industry whose performance
would depend so heavily on the Fed target rate. This is
one of the reasons why we think our paper can provide
novel insights regarding the consequences of the zero in-
terest rate policy.
In the next test, we show that fund returns matter in
that generating superior performance has important im-
plications for fund flows and thus for managers’ compen-
sation. To show this formally, we first use aggregate evi-
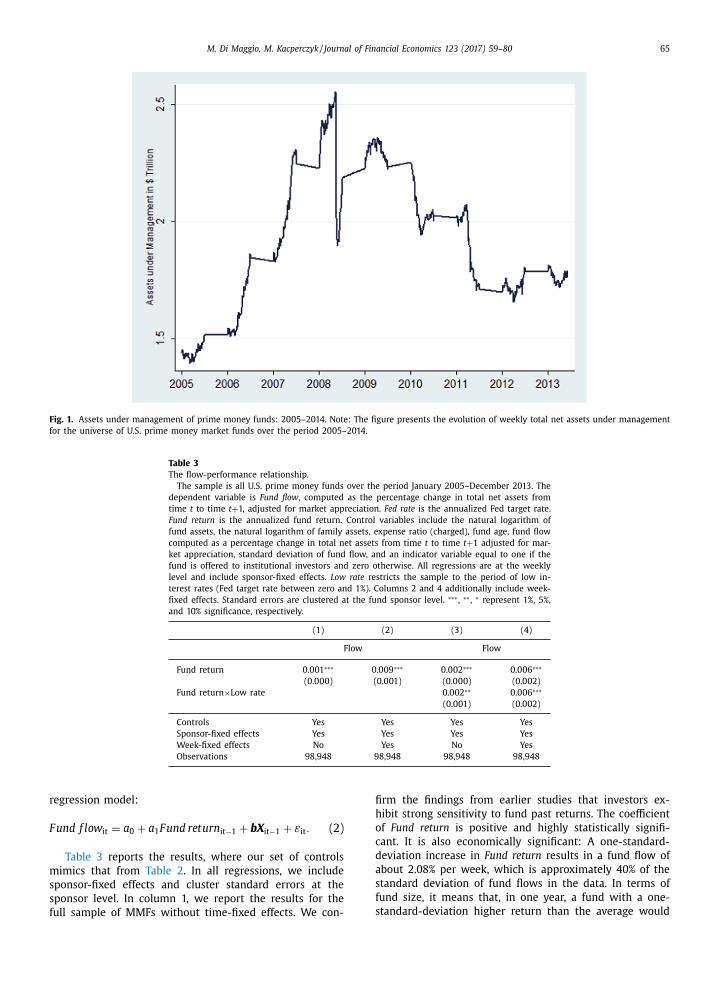
dence. In Fig. 1 , we plot the value of assets under man-
agement for the universe of prime funds for the period
2005–2013. The figure shows a significant decline in as-
sets from more than $2 trillion in 2007 to less than $1.5
trillion in 2013. This sharp decline coincides with the pe-
riod of declining interest rates and hence the declining ag-
gregate fund performance. Moreover, it seems that at least
the first two forward guidance policy announcements on
March 18, 2009 and August 9, 2011 preceded a significant
drop in assets invested in funds. This result is consistent
with the hypothesis that given the expectation of an ex-
tended period of low interest rates, fund investors might
have pulled out of these funds to find more profitable in-
vestment opportunities and/or the fund companies decided
to close down their operations.
Next, we provide micro-level evidence of this effect and
estimate the flow-performance relationship at the individ-
ual fund level. Investors’ portfolio choice problem is quite
straightforward: They might respond to a significant de-
crease in MMFs’ profitability by migrating from MMF ac-
counts to bank deposits, if they look to park their money
and save on fees, or by investing in other low-risk in-
vestment opportunities, such as blue chips or high-rated
corporate bonds, which pay higher returns than MMFs. In
all these cases, MMFs should experience outflows as in-
terest rates decrease. Formally, we estimate the following
M. Di Maggio, M. Kacperczyk / Journal of Financial Economics 123 (2017) 59–80 65
Fig. 1. Assets under management of prime money funds: 2005–2014. Note: The figure presents the evolution of weekly total net assets under management
for the universe of U.S. prime money market funds over the period 2005–2014.
Table 3
The flow-performance relationship.
The sample is all U.S. prime money funds over the period January 2005–December 2013. The
dependent variable is Fund flow , computed as the percentage change in total net assets from
time t to time t + 1, adjusted for market appreciation. Fed rate is the annualized Fed target rate.
Fund return is the annualized fund return. Control variables include the natural logarithm of
fund assets, the natural logarithm of family assets, expense ratio (charged), fund age, fund flow
computed as a percentage change in total net assets from time t to time t + 1 adjusted for mar-
ket appreciation, standard deviation of fund flow, and an indicator variable equal to one if the
fund is offered to institutional investors and zero otherwise. All regressions are at the weekly
level and include sponsor-fixed effects. Low rate restricts the sample to the period of low in-
terest rates (Fed target rate between zero and 1%). Columns 2 and 4 additionally include week-
fixed effects. Standard errors are clustered at the fund sponsor level. ∗∗∗ , ∗∗ , ∗ represent 1%, 5%,
and 10% significance, respectively.
(1) (2) (3) (4)
Flow Flow
Fund return 0.001 ∗∗∗ 0.009 ∗∗∗ 0.002 ∗∗∗ 0.006 ∗∗∗
(0.0 0 0) (0.001) (0.0 0 0) (0.002)
Fund return ×Low rate 0.002 ∗∗ 0.006 ∗∗∗
(0.001) (0.002)
Controls Yes Yes Yes Yes
Sponsor-fixed effects Yes Yes Yes Yes
Week-fixed effects No Yes No Yes
Observations 98,948 98,948 98,948 98,948
regression model:
F und f lo w it = a 0 + a 1 F und retur n it −1 + b X it −1 + ε it . (2)
Table 3 reports the results, where our set of controls
mimics that from Table 2 . In all regressions, we include
sponsor-fixed effects and cluster standard errors at the
sponsor level. In column 1, we report the results for the
full sample of MMFs without time-fixed effects. We con-
firm the findings from earlier studies that investors ex-
hibit strong sensitivity to fund past returns. The coefficient
of Fund return is positive and highly statistically signifi-
cant. It is also economically significant: A one-standard-
deviation increase in Fund return results in a fund flow of
about 2.08% per week, which is approximately 40% of the
standard deviation of fund flows in the data. In terms of
fund size, it means that, in one year, a fund with a one-
standard-deviation higher return than the average would
66 M. Di Maggio, M. Kacperczyk / Journal of Financial Economics 123 (2017) 59–80
almost double its size relative to the average fund. In col-
umn 2, we additionally account for the fine week-level
variation by introducing week-fixed effects and find that
the effect remains statistically and economically strong.
In the next set of results, we aim to understand if there
is any nonlinearity in the flow-performance relationship as
the Fed target rate approaches the zero lower bound. In
particular, we define an indicator variable Low rate that is
equal to one in times when the Fed target rate is at most
1%, and zero otherwise. Subsequently, we estimate the re-
gression model in Eq. (2) with an additional interaction
effect Fund return ×Low rate . The results are presented in
columns 3 and 4 for the models without and with week-
fixed effects.
The flow-performance relationship is stronger in
periods of low interest rates as the coefficient of the inter-
action term is positive and highly significant. We conclude
that the changes in interest rates towards zero bound alter
considerably the payoff per unit of extra performance: In-
vestors are about twice as sensitive to changes in fund per-
formance as they are in normal times. This further under-
scores the need for funds to adjust their operating strate-
gies along various dimensions, such as exit, risk taking, and
cost policy. We turn to these results in the next section.
5.2. Fund strategies around the zero interest rate policy
events
In this section, we evaluate MMFs’ behavior around the
forward-guidance policy announcements using an event-
study methodology. We first analyze changes in fund be-
havior in the time series—before and after FOMC events.
Subsequently, we explore the cross-section of MMFs with
respect to their sponsor types.
5.2.1. Time-series evidence
In our analysis, we consider two post-event windows: a
short one of three months and a long one of six months.
We analyze these two types of windows because there
are strategies that funds can immediately alter, such as
the riskiness of their portfolios or expense policy, but also
other strategies for which we might not observe any effect
for an extended period of time, such as the exit from the
market. In both cases, the pre-event window is short one
month to avoid any contamination with other events. For-
mally, we estimate the following regression model:
F und strateg y it = a 0 + a 1 Ev en t t + b X i2006 + ε it . (3)
We use a generic dependent variable, Fund strategy , to
measure three dimensions of fund adjustments: exit, risk
taking, and expense policy. Our independent variable of in-
terest in all tests is Event , an indicator variable equal to
one for the period after the event date (short or long), and
zero beforehand. We also include a set of controls from
Eqs. (1) to ( 2 ). These are measured as of January 2006 to
account for any endogenous movement in observables due
to monetary shocks. 8
8 We also entertained the models with simple one-week or one-month
lags and the results are very similar.
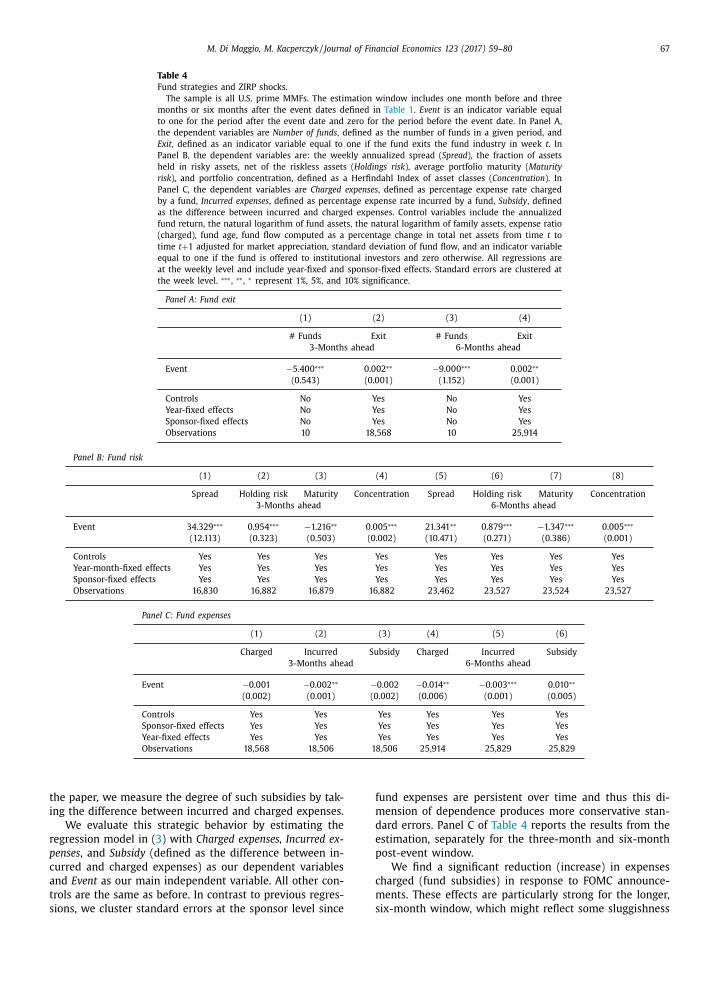
We begin with the analysis of the exit strategy. We pro-
vide more evidence on the industry’s evolution, investigat-
ing the changes in the number of active funds, and more
micro evidence on the fund’s probability of exiting the
market. Our dependent variables are # Funds , defined as
the number of MMFs available in week t , and Exit , defined
as an indicator variable equal to one if the fund spon-
sor closes its fund in week t , and zero otherwise. For the
first specification, we aggregate all controls at time t by
taking the value-weighted average across funds, with the
weight proportional to each fund’s assets under manage-
ment. Panel A of Table 4 reports the results. In columns 1
and 2, we present the results for the three-month window,
and in columns 3 and 4 for the six-month window.
We find that, on average, five and nine funds drop af-
ter the policy event within the shorter and longer horizons,
respectively. This is an economically large effect that, if cu-
mulated over five events, brings the total to more than 25
and 45 of lost funds. The funds leaving the market are of-
ten large funds, which corroborates our findings in Fig. 1 of
declining aggregated assets under management. Similarly,
we find that the probability of exiting the fund industry in-
creases significantly in both horizons following the event.
Though we report our results jointly for all the events, we
also find consistent results when looking at each event
separately. We also find that later events are more im-
portant than early ones, perhaps because extending the
forward-guidance policy into a longer future imposed more
stress on the fund industry.
In our next test, we turn to measuring funds’ incentives
to take risk. We use four different risk measures. Spread
is the difference between Fund return and the T-bill rate;
Holdings risk is a difference in fund weights in the riskiest
asset class (bank obligations) and the safest asset class (Re-
pos and U.S. Treasuries and Agency assets); Maturity risk is
the weighted average maturity of the fund; Concentration is
a Herfindahl index of the portfolio holdings in risky assets,
such as commercial paper, asset-backed commercial paper,
floating-rate notes, and bank obligations. Higher values of
each measure indicate a greater degree of risk taking. The
results are reported in Panel B of Table 4.
We find that as a result of the policy announcements,
three out of four measures of fund risk increase for both
investment horizons. The only risk measure that goes
down is Maturity risk . This difference is likely driven by
the provision in the Dodd-Frank Act, which implemented
a significantly higher lower bound for the fraction of as-
sets maturing within the next seven days that MMFs need
to hold. Comparing the results in columns 1–4 to those in
5–8 suggests that the risk profile of the MMF industry de-
pends on the policy announcements, and much of the risk
adjustment happens quickly.
The last dimension of adjustment we consider is the
expense policy. It is apparent that in the wake of low in-
terest rates and low fund returns, fund companies would
want to maintain their client relationship by reducing the
fees they charge, thus effectively increasing these investors’
net-of-fees returns. At the same time, there is no reason
to believe that expenses truly incurred by funds would
change. Consequently, by lowering their fees to investors,
fund companies would offer subsidies to their investors. In
M. Di Maggio, M. Kacperczyk / Journal of Financial Economics 123 (2017) 59–80 67
Table 4
Fund strategies and ZIRP shocks.
The sample is all U.S. prime MMFs. The estimation window includes one month before and three
months or six months after the event dates defined in Table 1 . Event is an indicator variable equal
to one for the period after the event date and zero for the period before the event date. In Panel A,
the dependent variables are Number of funds , defined as the number of funds in a given period, and
Exit , defined as an indicator variable equal to one if the fund exits the fund industry in week t. In
Panel B, the dependent variables are: the weekly annualized spread ( Spread ), the fraction of assets
held in risky assets, net of the riskless assets ( Holdings risk ), average portfolio maturity ( Maturity
risk ), and portfolio concentration, defined as a Herfindahl Index of asset classes ( Concentration ). In
Panel C, the dependent variables are Charged expenses , defined as percentage expense rate charged
by a fund, Incurred expenses , defined as percentage expense rate incurred by a fund, Subsidy , defined
as the difference between incurred and charged expenses. Control variables include the annualized
fund return, the natural logarithm of fund assets, the natural logarithm of family assets, expense ratio
(charged), fund age, fund flow computed as a percentage change in total net assets from time t to
time t + 1 adjusted for market appreciation, standard deviation of fund flow, and an indicator variable
equal to one if the fund is offered to institutional investors and zero otherwise. All regressions are
at the weekly level and include year-fixed and sponsor-fixed effects. Standard errors are clustered at
the week level. ∗∗∗ , ∗∗ , ∗ represent 1%, 5%, and 10% significance.
Panel A: Fund exit
(1) (2) (3) (4)
# Funds Exit # Funds Exit
3-Months ahead 6-Months ahead
Event −5.400 ∗∗∗ 0.002 ∗∗ −9.0 0 0 ∗∗∗ 0.002 ∗∗
(0.543) (0.001) (1.152) (0.001)
Controls No Yes No Yes
Year-fixed effects No Yes No Yes
Sponsor-fixed effects No Yes No Yes
Observations 10 18,568 10 25,914
Panel B: Fund risk
(1) (2) (3) (4) (5) (6) (7) (8)
Spread Holding risk Maturity Concentration Spread Holding risk Maturity Concentration
3-Months ahead 6-Months ahead
Event 34.329 ∗∗∗ 0.954 ∗∗∗ −1.216 ∗∗ 0.005 ∗∗∗ 21.341 ∗∗ 0.879 ∗∗∗ −1.347 ∗∗∗ 0.005 ∗∗∗
(12.113) (0.323) (0.503) (0.002) (10.471) (0.271) (0.386) (0.001)
Controls Yes Yes Yes Yes Yes Yes Yes Yes
Year-month-fixed effects Yes Yes Yes Yes Yes Yes Yes Yes
Sponsor-fixed effects Yes Yes Yes Yes Yes Yes Yes Yes
Observations 16,830 16,882 16,879 16,882 23,462 23,527 23,524 23,527
Panel C: Fund expenses
(1) (2) (3) (4) (5) (6)
Charged Incurred Subsidy Charged Incurred Subsidy
3-Months ahead 6-Months ahead
Event −0.001 −0.002 ∗∗ −0.002 −0.014 ∗∗ −0.003 ∗∗∗ 0.010 ∗∗
(0.002) (0.001) (0.002) (0.006) (0.001) (0.005)
Controls Yes Yes Yes Yes Yes Yes
Sponsor-fixed effects Yes Yes Yes Yes Yes Yes
Year-fixed effects Yes Yes Yes Yes Yes Yes
Observations 18,568 18,506 18,506 25,914 25,829 25,829
the paper, we measure the degree of such subsidies by tak-
ing the difference between incurred and charged expenses.
We evaluate this strategic behavior by estimating the
regression model in ( 3 ) with Charged expenses, Incurred ex-
penses , and Subsidy (defined as the difference between in-
curred and charged expenses) as our dependent variables
and Event as our main independent variable. All other con-
trols are the same as before. In contrast to previous regres-
sions, we cluster standard errors at the sponsor level since
fund expenses are persistent over time and thus this di-
mension of dependence produces more conservative stan-
dard errors. Panel C of Table 4 reports the results from the
estimation, separately for the three-month and six-month
post-event window.
We find a significant reduction (increase) in expenses
charged (fund subsidies) in response to FOMC announce-
ments. These effects are particularly strong for the longer,
six-month window, which might reflect some sluggishness

68 M. Di Maggio, M. Kacperczyk / Journal of Financial Economics 123 (2017) 59–80
Table 5
Fund strategies and ZIRP shocks: Conditioning on sponsor type.
The design follows Table 5. Independent sponsor is an indicator variable equal to one if the fund spon-
sor is an independent asset management company, and zero otherwise.
Panel A: Fund exit
(1) (2) (3) (4)
# Funds Exit # Funds Exit
3-Months ahead 6-Months ahead
Event −3.280 ∗∗∗ 0.002 ∗∗∗ −2.862 ∗∗∗ 0.002 ∗∗∗
(0.803) (0.001) (0.767) (0.001)
Independent sponsor ×Event 0.077 −0.002 0.178 ∗∗ −0.003 ∗∗
(0.067) (0.002) (0.081) (0.001)
Controls Yes Yes Yes Yes
Year-fixed effects No Yes No Yes
Sponsor-fixed effects No Yes No Yes
Observations 20 18,568 20 25,914
Panel B: Fund risk
(1) (2) (3) (4) (5) (6) (7) (8)
Spread Holding risk Maturity Concentration Spread Holding risk Maturity Concentration
3-Months ahead 6-Months ahead
Independent sponsor −3.837 6.642 ∗∗ 4.768 ∗∗∗ 0 −0.776 5.681 5.107 ∗∗∗ −0.011
(2.878) (3.309) (1.366) (0.020) (2.940) (3.492) (1.484) (0.021)
Independent 9.215 ∗∗∗ 1.821 ∗∗∗ −1.010 ∗∗ 0.008 ∗∗ 4.646 ∗∗∗ 3.405 ∗∗ −1.897 ∗∗∗ 0.026 ∗∗∗
Sponsor ×Event (1.239) (0.634) (0.460) (0.004) (1.668) (1.533) (0.709) (0.007)
Controls Yes Yes Yes Yes Yes Yes Yes Yes
Y/M-F.E. Yes Yes Yes Yes Yes Yes Yes Yes
Observations 16,830 16,882 16,879 16,882 23,462 23,527 23,524 23,527
Panel C: Fund expenses
(1) (2) (3) (4) (5) (6)
Charged Incurred Subsidy Charged Incurred Subsidy
3-Months ahead 6-Months ahead
Independent sponsor −0.003 0.030 0.032 −0.006 0.029 0.034
(0.020) (0.039) (0.027) (0.022) (0.039) (0.027)
Independent sponsor ×Event 0.005 0.008 0.003 0.011 0.011 0
(0.006) (0.005) (0.007) (0.012) (0.010) (0.013)
Controls Yes Yes Yes Yes Yes Yes
Week-fixed effects Yes Yes Yes Yes Yes Yes
Observations 18,568 18,506 18,506 25,914 25,829 25,829
with which fund companies respond in terms of their pric-
ing policies. We find no differences in incurred fund ex-
penses in response to the announced policies.
5.2.2. Cross-sectional evidence
In this section, we shed more light on our economic
mechanism by exploiting a sponsor-level variation in in-
centives to respond to profit margin squeeze. We hypoth-
esize that fund sponsors with greater reputation concerns
might want to internalize the negative spillovers by either
offering funds with less risk or leaving the fund indus-
try altogether. They might also entertain different pricing
strategies. We argue that one way to measure reputation
concerns is whether a fund is sponsored by a financial in-
stitution (large reputation concerns) or is sponsored by an
independent asset management company (less reputation
concerns). Formally, we estimate the following regression
model:
F und strateg y it = a 0 + a 1 Ev en t t + a 2 Ind epend ent sponso r i
+ a 3 Ev en t t × Ind epend ent sponso r i
+ b X i2006 + ε it . (4)
In this model, Independent sponsor is an indicator vari-
able equal to one if the sponsor is an independent man-
agement company and zero if it is an affiliated com-
pany. Fund strategy and X are defined as in model ( 3 ).
The incremental effect of change with respect to spon-
sor type is measured by the coefficient of the interaction
term Event ×Independent sponsor . We present the results in
Table 5.
In Panel A, we report the results for # Funds and Exit
for three-month (columns 1 and 2) and six-month event
windows. We find that funds sponsored by independent
companies are more likely to stay following the policy
M. Di Maggio, M. Kacperczyk / Journal of Financial Economics 123 (2017) 59–80 69
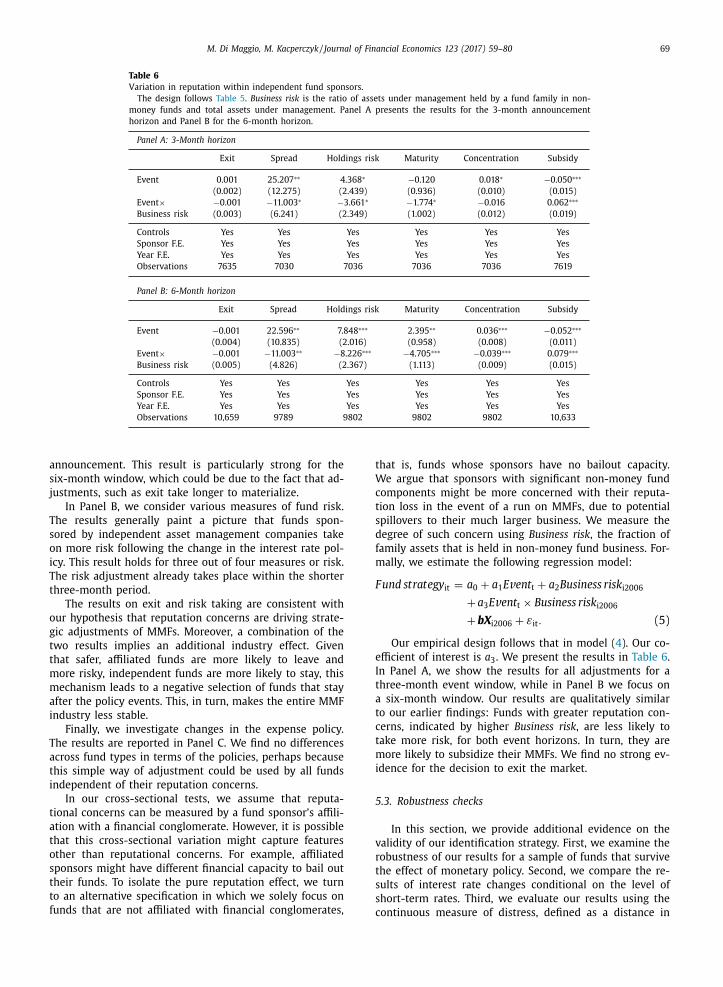
Table 6
Variation in reputation within independent fund sponsors.
The design follows Table 5 . Business risk is the ratio of assets under management held by a fund family in non-
money funds and total assets under management. Panel A presents the results for the 3-month announcement
horizon and Panel B for the 6-month horizon.
Panel A: 3-Month horizon
Exit Spread Holdings risk Maturity Concentration Subsidy
Event 0.001 25.207 ∗∗ 4.368 ∗ −0.120 0.018 ∗ −0.050 ∗∗∗
(0.002) (12.275) (2.439) (0.936) (0.010) (0.015)
Event × −0.001 −11.003 ∗ −3.661 ∗ −1.774 ∗ −0.016 0.062 ∗∗∗
Business risk (0.003) (6.241) (2.349) (1.002) (0.012) (0.019)
Controls Yes Yes Yes Yes Yes Yes
Sponsor F.E. Yes Yes Yes Yes Yes Yes
Year F.E. Yes Yes Yes Yes Yes Yes
Observations 7635 7030 7036 7036 7036 7619
Panel B: 6-Month horizon
Exit Spread Holdings risk Maturity Concentration Subsidy
Event −0.001 22.596 ∗∗ 7.848 ∗∗∗ 2.395 ∗∗ 0.036 ∗∗∗ −0.052 ∗∗∗
(0.004) (10.835) (2.016) (0.958) (0.008) (0.011)
Event × −0.001 −11.003 ∗∗ −8.226 ∗∗∗ −4.705 ∗∗∗ −0.039 ∗∗∗ 0.079 ∗∗∗
Business risk (0.005) (4.826) (2.367) (1.113) (0.009) (0.015)
Controls Yes Yes Yes Yes Yes Yes
Sponsor F.E. Yes Yes Yes Yes Yes Yes
Year F.E. Yes Yes Yes Yes Yes Yes
Observations 10,659 9789 9802 9802 9802 10,633
announcement. This result is particularly strong for the
six-month window, which could be due to the fact that ad-
justments, such as exit take longer to materialize.
In Panel B, we consider various measures of fund risk.
The results generally paint a picture that funds spon-
sored by independent asset management companies take
on more risk following the change in the interest rate pol-
icy. This result holds for three out of four measures or risk.
The risk adjustment already takes place within the shorter
three-month period.
The results on exit and risk taking are consistent with
our hypothesis that reputation concerns are driving strate-
gic adjustments of MMFs. Moreover, a combination of the
two results implies an additional industry effect. Given
that safer, affiliated funds are more likely to leave and
more risky, independent funds are more likely to stay, this
mechanism leads to a negative selection of funds that stay
after the policy events. This, in turn, makes the entire MMF
industry less stable.
Finally, we investigate changes in the expense policy.
The results are reported in Panel C. We find no differences
across fund types in terms of the policies, perhaps because
this simple way of adjustment could be used by all funds
independent of their reputation concerns.
In our cross-sectional tests, we assume that reputa-
tional concerns can be measured by a fund sponsor’s affili-
ation with a financial conglomerate. However, it is possible
that this cross-sectional variation might capture features
other than reputational concerns. For example, affiliated
sponsors might have different financial capacity to bail out
their funds. To isolate the pure reputation effect, we turn
to an alternative specification in which we solely focus on
funds that are not affiliated with financial conglomerates,
that is, funds whose sponsors have no bailout capacity.
We argue that sponsors with significant non-money fund
components might be more concerned with their reputa-
tion loss in the event of a run on MMFs, due to potential
spillovers to their much larger business. We measure the
degree of such concern using Business risk , the fraction of
family assets that is held in non-money fund business. For-
mally, we estimate the following regression model:
F und strategy it = a 0 + a 1 Ev ent t + a 2 Business risk i2006
+ a 3 Ev ent t × Business risk i2006
+ b X i2006 + ε it . (5)
Our empirical design follows that in model ( 4 ). Our co-
efficient of interest is a 3 . We present the results in Table 6 .
In Panel A, we show the results for all adjustments for a
three-month event window, while in Panel B we focus on
a six-month window. Our results are qualitatively similar
to our earlier findings: Funds with greater reputation con-
cerns, indicated by higher Business risk , are less likely to
take more risk, for both event horizons. In turn, they are
more likely to subsidize their MMFs. We find no strong ev-
idence for the decision to exit the market.
5.3. Robustness checks
In this section, we provide additional evidence on the
validity of our identification strategy. First, we examine the
robustness of our results for a sample of funds that survive
the effect of monetary policy. Second, we compare the re-
sults of interest rate changes conditional on the level of
short-term rates. Third, we evaluate our results using the
continuous measure of distress, defined as a distance in

70 M. Di Maggio, M. Kacperczyk / Journal of Financial Economics 123 (2017) 59–80
Fig. 2. Fed target rate: 2005–2014.
time to the expected increase of rates above the thresh-
old of 1%. Fourth, we consider monetary policy surprises.
Finally, we provide empirical evidence from the security-
level data.
5.3.1. Survivorship
Our results in Table 4 suggest that fund risk goes up
as a result of policy announcements. To understand these
findings, it is important to isolate their driving forces. In
particular, the average yields in the MMF sample can in-
crease for two reasons: (1) Average fund yields go up be-
cause of negative selection that retains more risky funds
in the data; (2) MMFs strategically adjust their risk in re-
sponse to policies. Our results so far, suggest the first chan-
nel is partially operating given that riskier funds are more
likely to stay. In this section, we check to what extent the
second channel also contributes to our average results.
We address this issue using a subset of funds that are
present in both periods of the event study. Conditioning
on surviving funds makes the selection issue obsolete. For-
mally, we estimate the regression models in ( 3 ) and ( 4 ). In
the Online Appendix, we report the results from the two
models. They are qualitatively similar to those reported in
Tables 4 and 5 . Hence, both economic mechanisms might
be jointly responsible for the average risk effects in the
data.
5.3.2. Interest rate regimes
So far, we interpreted our empirical results as being
explained by unconventional monetary policy. An alterna-
tive explanation could be that any change in interest rates
might cause similar effects in the data. While we have no
reason to believe that such an unconditional result holds,
largely because the argument about negative investors’ re-
turns only applies to periods with very low interest rates,
we check whether the data indeed show the expected
asymmetry.
In our first test, we examine general consequences of
changes in the Fed target rate over the longer period
2005–2013. The period of January 2005–December 2013 is
an attractive testing ground because it includes two dis-
tinct interest rate regimes: A regime in which the rate is
higher than zero percent (20 05–20 08) and a regime with
zero interest rates (2009–2013). As Fig. 2 indicates, in the
first regime, the rate had been gradually going up from 2%
at the beginning of 2005 to 5.25% in the middle of 2007
and then subsequently going down to 0–0.25% by the end
of 2008. The second regime has been manifested by a con-
tinuous zero interest rate policy (the rate has been cut to
zero on December 16, 2008).
Our identification comes from the various changes in
interest rates over the sample period. In particular, we are
interested to learn whether approaching zero-lower bound
alters fund incentives in a significant way relative to other
periods. To this end, we study fund responses separately
in periods with interest rates higher than 1% and in pe-
riods with rates equal to or less than 1%. In all specifica-
tions, we measure variables at the weekly level and then
include year-by-month- or year-fixed effects, thereby iso-
lating within-month or within-year variation, which helps
us control for any other macroeconomic shocks concurrent
with the monetary policy changes that might affect MMFs’
behavior. Formally, we estimate the following model:
F und strateg y it = a 0 + a 1 F ed rat e it + a 2 Low rat e i
+ a 3 F ed rat e it × Low rat e it + b X i2006 + ε it
(6)
M. Di Maggio, M. Kacperczyk / Journal of Financial Economics 123 (2017) 59–80 71
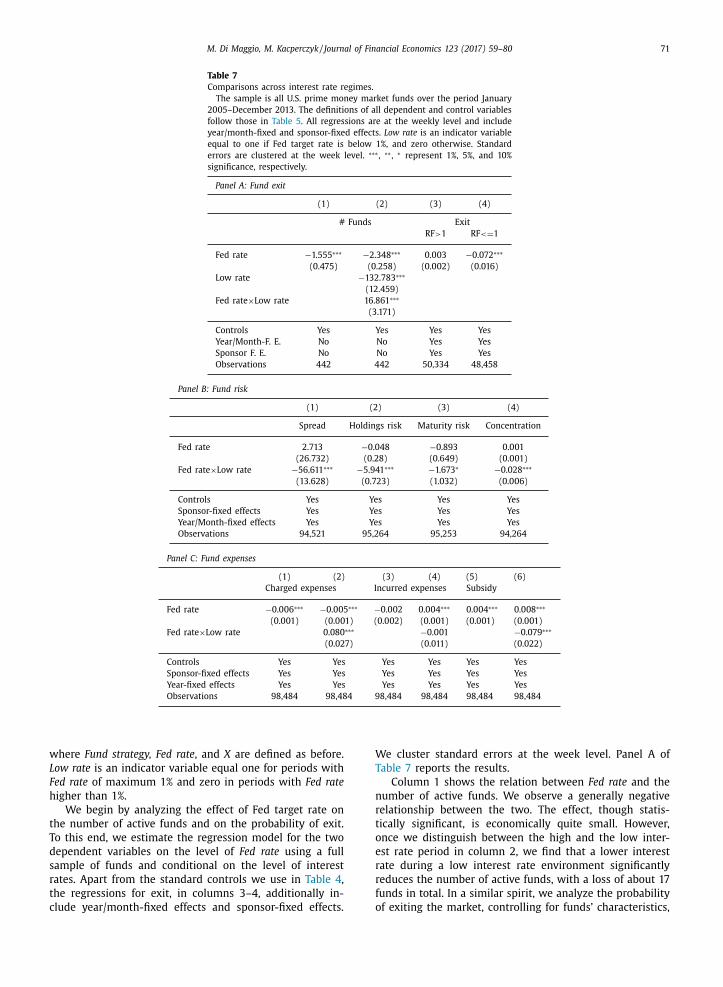
Table 7
Comparisons across interest rate regimes.
The sample is all U.S. prime money market funds over the period January
2005–December 2013. The definitions of all dependent and control variables
follow those in Table 5 . All regressions are at the weekly level and include
year/month-fixed and sponsor-fixed effects. Low rate is an indicator variable
equal to one if Fed target rate is below 1%, and zero otherwise. Standard
errors are clustered at the week level. ∗∗∗ , ∗∗ , ∗ represent 1%, 5%, and 10%
significance, respectively.
Panel A: Fund exit
(1) (2) (3) (4)
# Funds Exit
RF > 1 RF < = 1
Fed rate −1.555 ∗∗∗ −2.348 ∗∗∗ 0.003 −0.072 ∗∗∗
(0.475) (0.258) (0.002) (0.016)
Low rate −132.783 ∗∗∗
(12.459)
Fed rate ×Low rate 16.861 ∗∗∗
(3.171)
Controls Yes Yes Yes Yes
Year/Month-F. E. No No Yes Yes
Sponsor F. E. No No Yes Yes
Observations 442 442 50,334 48,458
Panel B: Fund risk
(1) (2) (3) (4)
Spread Holdings risk Maturity risk Concentration
Fed rate 2.713 −0.048 −0.893 0.001
(26.732) (0.28) (0.649) (0.001)
Fed rate ×Low rate −56.611 ∗∗∗ −5.941 ∗∗∗ −1.673 ∗ −0.028 ∗∗∗
(13.628) (0.723) (1.032) (0.006)
Controls Yes Yes Yes Yes
Sponsor-fixed effects Yes Yes Yes Yes
Year/Month-fixed effects Yes Yes Yes Yes
Observations 94,521 95,264 95,253 94,264
Panel C: Fund expenses
(1) (2) (3) (4) (5) (6)
Charged expenses Incurred expenses Subsidy
Fed rate −0.006 ∗∗∗ −0.005 ∗∗∗ −0.002 0.004 ∗∗∗ 0.004 ∗∗∗ 0.008 ∗∗∗
(0.001) (0.001) (0.002) (0.001) (0.001) (0.001)
Fed rate ×Low rate 0.080 ∗∗∗ −0.001 −0.079 ∗∗∗
(0.027) (0.011) (0.022)
Controls Yes Yes Yes Yes Yes Yes
Sponsor-fixed effects Yes Yes Yes Yes Yes Yes
Year-fixed effects Yes Yes Yes Yes Yes Yes
Observations 98,484 98,484 98,484 98,484 98,484 98,484
where Fund strategy, Fed rate , and X are defined as before.
Low rate is an indicator variable equal one for periods with
Fed rate of maximum 1% and zero in periods with Fed rate
higher than 1%.
We begin by analyzing the effect of Fed target rate on
the number of active funds and on the probability of exit.
To this end, we estimate the regression model for the two
dependent variables on the level of Fed rate using a full
sample of funds and conditional on the level of interest
rates. Apart from the standard controls we use in Table 4 ,
the regressions for exit, in columns 3–4, additionally in-
clude year/month-fixed effects and sponsor-fixed effects.
We cluster standard errors at the week level. Panel A of
Table 7 reports the results.
Column 1 shows the relation between Fed rate and the
number of active funds. We observe a generally negative
relationship between the two. The effect, though statis-
tically significant, is economically quite small. However,
once we distinguish between the high and the low inter-
est rate period in column 2, we find that a lower interest
rate during a low interest rate environment significantly
reduces the number of active funds, with a loss of about 17
funds in total. In a similar spirit, we analyze the probability
of exiting the market, controlling for funds’ characteristics,
72 M. Di Maggio, M. Kacperczyk / Journal of Financial Economics 123 (2017) 59–80
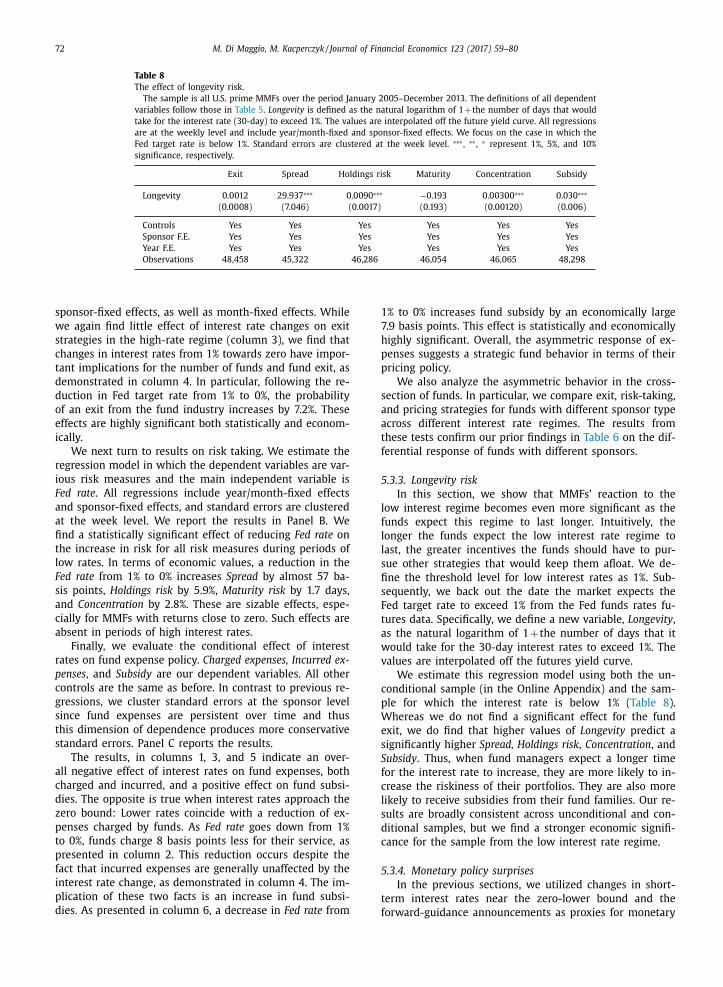
Table 8
The effect of longevity risk.
The sample is all U.S. prime MMFs over the period January 2005–December 2013. The definitions of all dependent
variables follow those in Table 5 . Longevity is defined as the natural logarithm of 1 + the number of days that would
take for the interest rate (30-day) to exceed 1%. The values are interpolated off the future yield curve. All regressions
are at the weekly level and include year/month-fixed and sponsor-fixed effects. We focus on the case in which the
Fed target rate is below 1%. Standard errors are clustered at the week level. ∗∗∗ , ∗∗ , ∗ represent 1%, 5%, and 10%
significance, respectively.
Exit Spread Holdings risk Maturity Concentration Subsidy
Longevity 0.0012 29.937 ∗∗∗ 0.0090 ∗∗∗ −0.193 0.0 030 0 ∗∗∗ 0.030 ∗∗∗
(0.0 0 08) (7.046) (0.0017) (0.193) (0.00120) (0.006)
Controls Yes Yes Yes Yes Yes Yes
Sponsor F.E. Yes Yes Yes Yes Yes Yes
Year F.E. Yes Yes Yes Yes Yes Yes
Observations 48,458 45,322 46,286 46,054 46,065 48,298
sponsor-fixed effects, as well as month-fixed effects. While
we again find little effect of interest rate changes on exit
strategies in the high-rate regime (column 3), we find that
changes in interest rates from 1% towards zero have impor-
tant implications for the number of funds and fund exit, as
demonstrated in column 4. In particular, following the re-
duction in Fed target rate from 1% to 0%, the probability
of an exit from the fund industry increases by 7.2%. These
effects are highly significant both statistically and econom-
ically.
We next turn to results on risk taking. We estimate the
regression model in which the dependent variables are var-
ious risk measures and the main independent variable is
Fed rate . All regressions include year/month-fixed effects
and sponsor-fixed effects, and standard errors are clustered
at the week level. We report the results in Panel B. We
find a statistically significant effect of reducing Fed rate on
the increase in risk for all risk measures during periods of
low rates. In terms of economic values, a reduction in the
Fed rate from 1% to 0% increases Spread by almost 57 ba-
sis points, Holdings risk by 5.9%, Maturity risk by 1.7 days,
and Concentration by 2.8%. These are sizable effects, espe-
cially for MMFs with returns close to zero. Such effects are
absent in periods of high interest rates.
Finally, we evaluate the conditional effect of interest
rates on fund expense policy. Charged expenses, Incurred ex-
penses , and Subsidy are our dependent variables. All other
controls are the same as before. In contrast to previous re-
gressions, we cluster standard errors at the sponsor level
since fund expenses are persistent over time and thus
this dimension of dependence produces more conservative
standard errors. Panel C reports the results.
The results, in columns 1, 3, and 5 indicate an over-
all negative effect of interest rates on fund expenses, both
charged and incurred, and a positive effect on fund subsi-
dies. The opposite is true when interest rates approach the
zero bound: Lower rates coincide with a reduction of ex-
penses charged by funds. As Fed rate goes down from 1%
to 0%, funds charge 8 basis points less for their service, as
presented in column 2. This reduction occurs despite the
fact that incurred expenses are generally unaffected by the
interest rate change, as demonstrated in column 4. The im-
plication of these two facts is an increase in fund subsi-
dies. As presented in column 6, a decrease in Fed rate from
1% to 0% increases fund subsidy by an economically large
7.9 basis points. This effect is statistically and economically
highly significant. Overall, the asymmetric response of ex-
penses suggests a strategic fund behavior in terms of their
pricing policy.
We also analyze the asymmetric behavior in the cross-
section of funds. In particular, we compare exit, risk-taking,
and pricing strategies for funds with different sponsor type
across different interest rate regimes. The results from
these tests confirm our prior findings in Table 6 on the dif-
ferential response of funds with different sponsors.
5.3.3. Longevity risk
In this section, we show that MMFs’ reaction to the
low interest regime becomes even more significant as the
funds expect this regime to last longer. Intuitively, the
longer the funds expect the low interest rate regime to
last, the greater incentives the funds should have to pur-
sue other strategies that would keep them afloat. We de-
fine the threshold level for low interest rates as 1%. Sub-
sequently, we back out the date the market expects the
Fed target rate to exceed 1% from the Fed funds rates fu-
tures data. Specifically, we define a new variable, Longevity ,
as the natural logarithm of 1 + the number of days that it
would take for the 30-day interest rates to exceed 1%. The
values are interpolated off the futures yield curve.
We estimate this regression model using both the un-
conditional sample (in the Online Appendix) and the sam-
ple for which the interest rate is below 1% ( Table 8 ).
Whereas we do not find a significant effect for the fund
exit, we do find that higher values of Longevity predict a
significantly higher Spread, Holdings risk, Concentration , and
Subsidy . Thus, when fund managers expect a longer time
for the interest rate to increase, they are more likely to in-
crease the riskiness of their portfolios. They are also more
likely to receive subsidies from their fund families. Our re-
sults are broadly consistent across unconditional and con-
ditional samples, but we find a stronger economic signifi-
cance for the sample from the low interest rate regime.
5.3.4. Monetary policy surprises
In the previous sections, we utilized changes in short-
term interest rates near the zero-lower bound and the
forward-guidance announcements as proxies for monetary
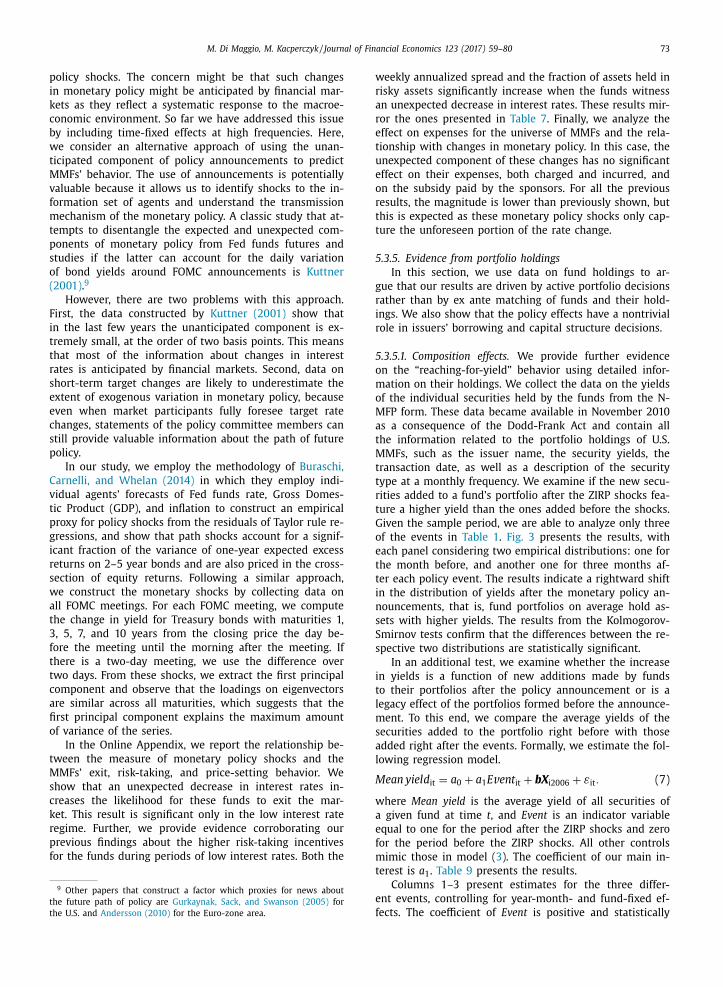
M. Di Maggio, M. Kacperczyk / Journal of Financial Economics 123 (2017) 59–80 73
policy shocks. The concern might be that such changes
in monetary policy might be anticipated by financial mar-
kets as they reflect a systematic response to the macroe-
conomic environment. So far we have addressed this issue
by including time-fixed effects at high frequencies. Here,
we consider an alternative approach of using the unan-
ticipated component of policy announcements to predict
MMFs’ behavior. The use of announcements is potentially
valuable because it allows us to identify shocks to the in-
formation set of agents and understand the transmission
mechanism of the monetary policy. A classic study that at-
tempts to disentangle the expected and unexpected com-
ponents of monetary policy from Fed funds futures and
studies if the latter can account for the daily variation
of bond yields around FOMC announcements is Kuttner
(2001) . 9
However, there are two problems with this approach.
First, the data constructed by Kuttner (2001) show that
in the last few years the unanticipated component is ex-
tremely small, at the order of two basis points. This means
that most of the information about changes in interest
rates is anticipated by financial markets. Second, data on
short-term target changes are likely to underestimate the
extent of exogenous variation in monetary policy, because
even when market participants fully foresee target rate
changes, statements of the policy committee members can
still provide valuable information about the path of future
policy.
In our study, we employ the methodology of Buraschi,
Carnelli, and Whelan (2014) in which they employ indi-
vidual agents’ forecasts of Fed funds rate, Gross Domes-
tic Product (GDP), and inflation to construct an empirical
proxy for policy shocks from the residuals of Taylor rule re-
gressions, and show that path shocks account for a signif-
icant fraction of the variance of one-year expected excess
returns on 2–5 year bonds and are also priced in the cross-
section of equity returns. Following a similar approach,
we construct the monetary shocks by collecting data on
all FOMC meetings. For each FOMC meeting, we compute
the change in yield for Treasury bonds with maturities 1,
3, 5, 7, and 10 years from the closing price the day be-
fore the meeting until the morning after the meeting. If
there is a two-day meeting, we use the difference over
two days. From these shocks, we extract the first principal
component and observe that the loadings on eigenvectors
are similar across all maturities, which suggests that the
first principal component explains the maximum amount
of variance of the series.
In the Online Appendix, we report the relationship be-
tween the measure of monetary policy shocks and the
MMFs’ exit, risk-taking, and price-setting behavior. We
show that an unexpected decrease in interest rates in-
creases the likelihood for these funds to exit the mar-
ket. This result is significant only in the low interest rate
regime. Further, we provide evidence corroborating our
previous findings about the higher risk-taking incentives
for the funds during periods of low interest rates. Both the
9 Other papers that construct a factor which proxies for news about
the future path of policy are Gurkaynak, Sack, and Swanson (2005) for
the U.S. and Andersson (2010) for the Euro-zone area.
weekly annualized spread and the fraction of assets held in
risky assets significantly increase when the funds witness
an unexpected decrease in interest rates. These results mir-
ror the ones presented in Table 7 . Finally, we analyze the
effect on expenses for the universe of MMFs and the rela-
tionship with changes in monetary policy. In this case, the
unexpected component of these changes has no significant
effect on their expenses, both charged and incurred, and
on the subsidy paid by the sponsors. For all the previous
results, the magnitude is lower than previously shown, but
this is expected as these monetary policy shocks only cap-
ture the unforeseen portion of the rate change.
5.3.5. Evidence from portfolio holdings
In this section, we use data on fund holdings to ar-
gue that our results are driven by active portfolio decisions
rather than by ex ante matching of funds and their hold-
ings. We also show that the policy effects have a nontrivial
role in issuers’ borrowing and capital structure decisions.
5.3.5.1. Composition effects. We provide further evidence
on the “reaching-for-yield” behavior using detailed infor-
mation on their holdings. We collect the data on the yields
of the individual securities held by the funds from the N-
MFP form. These data became available in November 2010
as a consequence of the Dodd-Frank Act and contain all
the information related to the portfolio holdings of U.S.
MMFs, such as the issuer name, the security yields, the
transaction date, as well as a description of the security
type at a monthly frequency. We examine if the new secu-
rities added to a fund’s portfolio after the ZIRP shocks fea-
ture a higher yield than the ones added before the shocks.
Given the sample period, we are able to analyze only three
of the events in Table 1 . Fig. 3 presents the results, with
each panel considering two empirical distributions: one for
the month before, and another one for three months af-
ter each policy event. The results indicate a rightward shift
in the distribution of yields after the monetary policy an-
nouncements, that is, fund portfolios on average hold as-
sets with higher yields. The results from the Kolmogorov-
Smirnov tests confirm that the differences between the re-
spective two distributions are statistically significant.
In an additional test, we examine whether the increase
in yields is a function of new additions made by funds
to their portfolios after the policy announcement or is a
legacy effect of the portfolios formed before the announce-
ment. To this end, we compare the average yields of the
securities added to the portfolio right before with those
added right after the events. Formally, we estimate the fol-
lowing regression model.
Mean yiel d it = a 0 + a 1 Ev en t it + b X i2006 + ε it . (7)
where Mean yield is the average yield of all securities of
a given fund at time t , and Event is an indicator variable
equal to one for the period after the ZIRP shocks and zero
for the period before the ZIRP shocks. All other controls
mimic those in model ( 3 ). The coefficient of our main in-
terest is a 1 . Table 9 presents the results.
Columns 1–3 present estimates for the three differ-
ent events, controlling for year-month- and fund-fixed ef-
fects. The coefficient of Event is positive and statistically
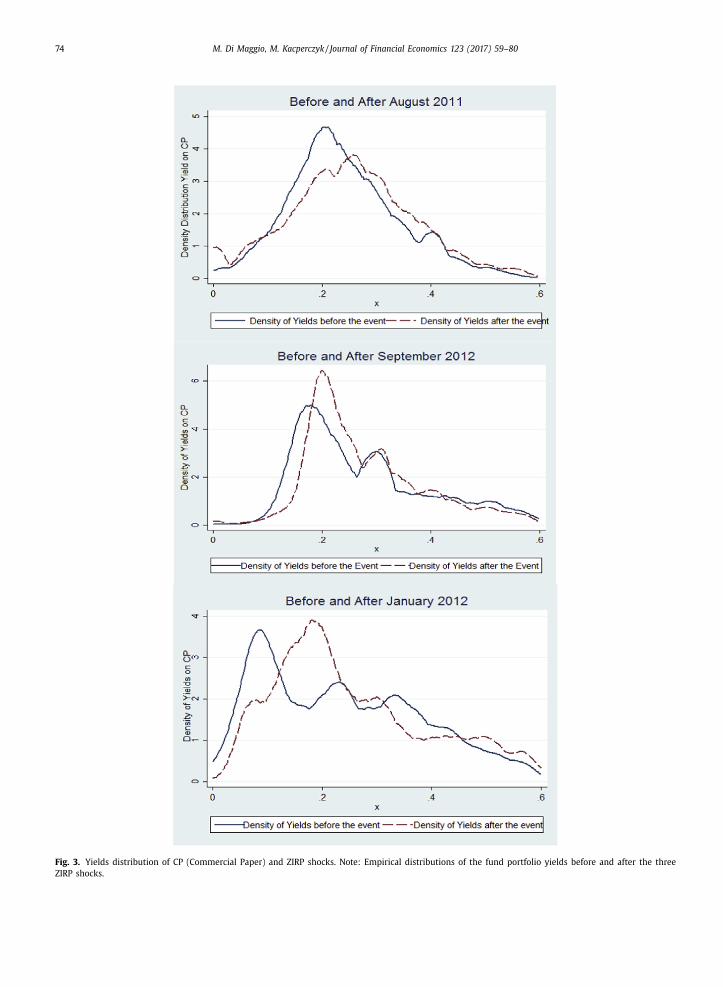
74 M. Di Maggio, M. Kacperczyk / Journal of Financial Economics 123 (2017) 59–80
Fig. 3. Yields distribution of CP (Commercial Paper) and ZIRP shocks. Note: Empirical distributions of the fund portfolio yields before and after the three
ZIRP shocks.

M. Di Maggio, M. Kacperczyk / Journal of Financial Economics 123 (2017) 59–80 75
Table 9
Evidence from portfolio holdings.
The sample is all U.S. prime MMFs. The dependent variable is the mean of the yields of the new securities added to the fund
portfolio. The estimation window includes one month before and three months after the last three event dates defined in Table
1 . Event is an indicator variable equal to one for the period after the event date and zero for the period before the event date.
Columns 4 and 5 repeat the analysis by considering a randomly drawn date that does not coincide with any of the ZIRP shocks
dates. All regressions are at the monthly level and include year/month-fixed and fund-fixed effects. Standard errors are clustered
at the monthly level. ∗∗∗ , ∗∗ , ∗ represent 1%, 5%, and 10% significance, respectively.
Panel A
(1) (2) (3) (4) (5)
Mean yield
Placebos
Event: August 2011 Event: January 2012 Event: September 2012 March 2011 January 2013
Event 0.0388 ∗∗∗ 0.0439 ∗∗∗ 0.0420 ∗∗∗ −0.0302 ∗∗∗ −0.0107 ∗∗∗
(0.0 0 0701) (0.0 0 0971) (0.0 0 0371) (0.0 0 0438) (0.0 0 0287)
Controls Yes Yes Yes Yes Yes
Year/month-fixed effects Yes Yes Yes Yes Yes
Fund-fixed effects Yes Yes Yes Yes Yes
Observations 49,242 39,690 59,716 31,988 24,129
Panel B
Number of borrowers per fund (1) (2)
Event −0.423 ∗∗ −0.378 ∗∗
(0.209) (0.182)
Fund-fixed effects Yes Yes
Time trend No Yes
Observations 1,288 1,288
R -squared 0.902 0.902
Panel C
(1) (2)
Outstanding debt
Post fund closure −0.419 ∗∗∗ −0.153 ∗∗
(0.0686) (0.0665)
Issuer-fixed effects Yes Yes
Month-fixed effects No Yes
Observations 52,682 52,682
R -squared 0.492 0.524
Panel D
(1) (2) (3) (4)
Leverage 6-month window Leverage 6-month window Avg. leverage 6-month window Leverage 1-year window
Post ×Closure −0.006 ∗∗ −0.006 ∗ −0.020 ∗ −0.004
(0.003) (0.003) (0.011) (0.008)
Post 0.001 −0.0 0 0 0.007 0.002
(0.002) (0.001) (0.004) (0.007)
Closure 0.004 0.013 ∗∗ 0.016 ∗ 0.003
(0.012) (0.005) (0.008) (0.004)
Time-fixed effects Yes Yes Yes Yes
Issuer-fixed effects No Yes Yes Yes
Observations 895 895 448 1,784
R -squared 0.005 0.918 0.929 0.909
macro trend.
significant for all three events, which means that the
new securities feature significantly higher yields in the
post-period relative to the pre-period. We further assess
whether these results are due to monetary policy effects or
are a reflection of general macro trends in the data. To this
end, we design a placebo test in which we estimate a sim-
ilar regression model for two random event windows, one
(January 2011) picked for the period before the first event
and one (March 2013) picked for the period after the last
event. The results, in columns 4 and 5, indicate that the
average yields on the new securities, if anything, decrease
over time when considering these different dates. Hence, it
is unlikely that our results are a consequence of a general
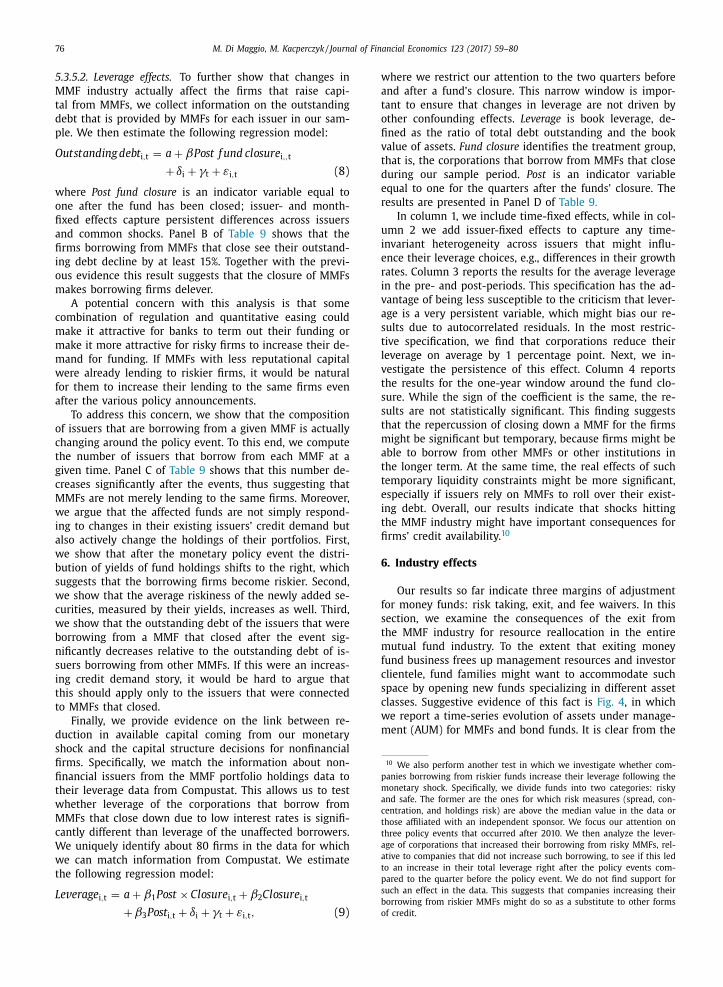
76 M. Di Maggio, M. Kacperczyk / Journal of Financial Economics 123 (2017) 59–80
10 We also perform another test in which we investigate whether com-
panies borrowing from riskier funds increase their leverage following the
monetary shock. Specifically, we divide funds into two categories: risky
and safe. The former are the ones for which risk measures (spread, con-
centration, and holdings risk) are above the median value in the data or
those affiliated with an independent sponsor. We focus our attention on
three policy events that occurred after 2010. We then analyze the lever-
age of corporations that increased their borrowing from risky MMFs, rel-
ative to companies that did not increase such borrowing, to see if this led
to an increase in their total leverage right after the policy events com-
pared to the quarter before the policy event. We do not find support for
such an effect in the data. This suggests that companies increasing their
borrowing from riskier MMFs might do so as a substitute to other forms
of credit.
5.3.5.2. Leverage effects. To further show that changes in
MMF industry actually affect the firms that raise capi-
tal from MMFs, we collect information on the outstanding
debt that is provided by MMFs for each issuer in our sam-
ple. We then estimate the following regression model:
Outstand ing d eb t i , t = a + βP ost f und closur e i ,, t
+ δi + γt + ε i , t (8)
where Post fund closure is an indicator variable equal to
one after the fund has been closed; issuer- and month-
fixed effects capture persistent differences across issuers
and common shocks. Panel B of Table 9 shows that the
firms borrowing from MMFs that close see their outstand-
ing debt decline by at least 15%. Together with the previ-
ous evidence this result suggests that the closure of MMFs
makes borrowing firms delever.
A potential concern with this analysis is that some
combination of regulation and quantitative easing could
make it attractive for banks to term out their funding or
make it more attractive for risky firms to increase their de-
mand for funding. If MMFs with less reputational capital
were already lending to riskier firms, it would be natural
for them to increase their lending to the same firms even
after the various policy announcements.
To address this concern, we show that the composition
of issuers that are borrowing from a given MMF is actually
changing around the policy event. To this end, we compute
the number of issuers that borrow from each MMF at a
given time. Panel C of Table 9 shows that this number de-
creases significantly after the events, thus suggesting that
MMFs are not merely lending to the same firms. Moreover,
we argue that the affected funds are not simply respond-
ing to changes in their existing issuers’ credit demand but
also actively change the holdings of their portfolios. First,
we show that after the monetary policy event the distri-
bution of yields of fund holdings shifts to the right, which
suggests that the borrowing firms become riskier. Second,
we show that the average riskiness of the newly added se-
curities, measured by their yields, increases as well. Third,
we show that the outstanding debt of the issuers that were
borrowing from a MMF that closed after the event sig-
nificantly decreases relative to the outstanding debt of is-
suers borrowing from other MMFs. If this were an increas-
ing credit demand story, it would be hard to argue that
this should apply only to the issuers that were connected
to MMFs that closed.
Finally, we provide evidence on the link between re-
duction in available capital coming from our monetary
shock and the capital structure decisions for nonfinancial
firms. Specifically, we match the information about non-
financial issuers from the MMF portfolio holdings data to
their leverage data from Compustat. This allows us to test
whether leverage of the corporations that borrow from
MMFs that close down due to low interest rates is signifi-
cantly different than leverage of the unaffected borrowers.
We uniquely identify about 80 firms in the data for which
we can match information from Compustat. We estimate
the following regression model:
Le v erag e i , t = a + β1 P ost × Closur e i , t + β2 Closur e i , t
+ β3 P os t i , t + δi + γt + ε i , t , (9)
where we restrict our attention to the two quarters before
and after a fund’s closure. This narrow window is impor-
tant to ensure that changes in leverage are not driven by
other confounding effects. Leverage is book leverage, de-
fined as the ratio of total debt outstanding and the book
value of assets. Fund closure identifies the treatment group,
that is, the corporations that borrow from MMFs that close
during our sample period. Post is an indicator variable
equal to one for the quarters after the funds’ closure. The
results are presented in Panel D of Table 9.
In column 1, we include time-fixed effects, while in col-
umn 2 we add issuer-fixed effects to capture any time-
invariant heterogeneity across issuers that might influ-
ence their leverage choices, e.g., differences in their growth
rates. Column 3 reports the results for the average leverage
in the pre- and post-periods. This specification has the ad-
vantage of being less susceptible to the criticism that lever-
age is a very persistent variable, which might bias our re-
sults due to autocorrelated residuals. In the most restric-
tive specification, we find that corporations reduce their
leverage on average by 1 percentage point. Next, we in-
vestigate the persistence of this effect. Column 4 reports
the results for the one-year window around the fund clo-
sure. While the sign of the coefficient is the same, the re-
sults are not statistically significant. This finding suggests
that the repercussion of closing down a MMF for the firms
might be significant but temporary, because firms might be
able to borrow from other MMFs or other institutions in
the longer term. At the same time, the real effects of such
temporary liquidity constraints might be more significant,
especially if issuers rely on MMFs to roll over their exist-
ing debt. Overall, our results indicate that shocks hitting
the MMF industry might have important consequences for
firms’ credit availability. 10
6. Industry effects
Our results so far indicate three margins of adjustment
for money funds: risk taking, exit, and fee waivers. In this
section, we examine the consequences of the exit from
the MMF industry for resource reallocation in the entire
mutual fund industry. To the extent that exiting money
fund business frees up management resources and investor
clientele, fund families might want to accommodate such
space by opening new funds specializing in different asset
classes. Suggestive evidence of this fact is Fig. 4 , in which
we report a time-series evolution of assets under manage-
ment (AUM) for MMFs and bond funds. It is clear from the
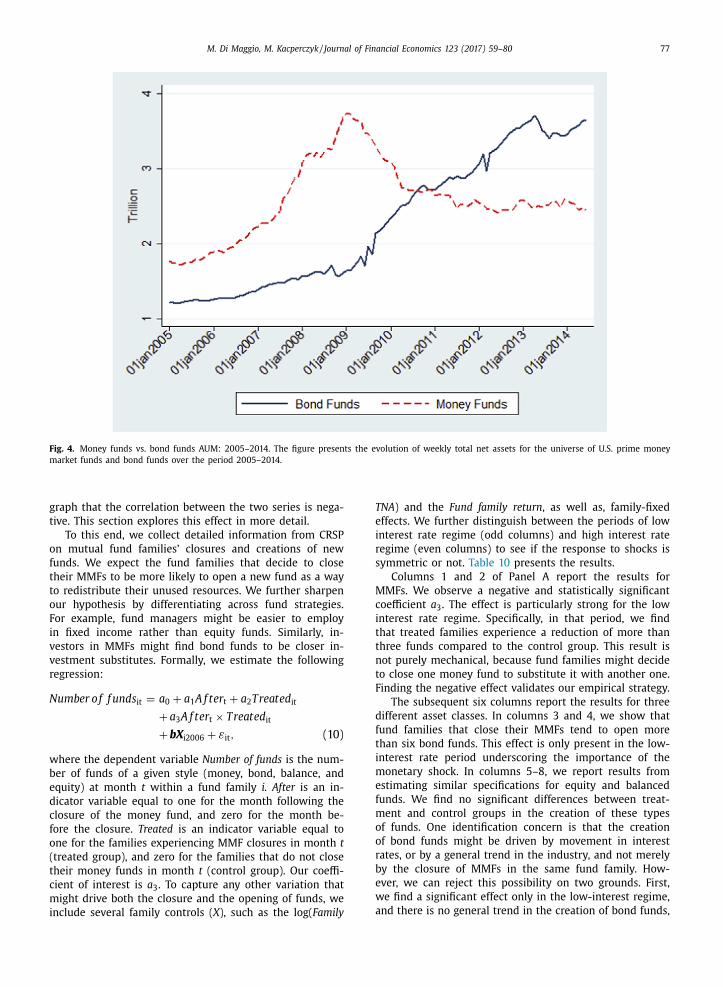
M. Di Maggio, M. Kacperczyk / Journal of Financial Economics 123 (2017) 59–80 77
Fig. 4. Money funds vs. bond funds AUM: 2005–2014. The figure presents the evolution of weekly total net assets for the universe of U.S. prime money
market funds and bond funds over the period 2005–2014.
graph that the correlation between the two series is nega-
tive. This section explores this effect in more detail.
To this end, we collect detailed information from CRSP
on mutual fund families’ closures and creations of new
funds. We expect the fund families that decide to close
their MMFs to be more likely to open a new fund as a way
to redistribute their unused resources. We further sharpen
our hypothesis by differentiating across fund strategies.
For example, fund managers might be easier to employ
in fixed income rather than equity funds. Similarly, in-
vestors in MMFs might find bond funds to be closer in-
vestment substitutes. Formally, we estimate the following
regression:
Number of f und s it = a 0 + a 1 A f te r t + a 2 T reate d it
+ a 3 A f t e r t × T reat e d it
+ b X i2006 + ε it , (10)
where the dependent variable Number of funds is the num-
ber of funds of a given style (money, bond, balance, and
equity) at month t within a fund family i. After is an in-
dicator variable equal to one for the month following the
closure of the money fund, and zero for the month be-
fore the closure. Treated is an indicator variable equal to
one for the families experiencing MMF closures in month t
(treated group), and zero for the families that do not close
their money funds in month t (control group). Our coeffi-
cient of interest is a 3 . To capture any other variation that
might drive both the closure and the opening of funds, we
include several family controls ( X ), such as the log( Family
TNA ) and the Fund family return , as well as, family-fixed
effects. We further distinguish between the periods of low
interest rate regime (odd columns) and high interest rate
regime (even columns) to see if the response to shocks is
symmetric or not. Table 10 presents the results.
Columns 1 and 2 of Panel A report the results for
MMFs. We observe a negative and statistically significant
coefficient a 3 . The effect is particularly strong for the low
interest rate regime. Specifically, in that period, we find
that treated families experience a reduction of more than
three funds compared to the control group. This result is
not purely mechanical, because fund families might decide
to close one money fund to substitute it with another one.
Finding the negative effect validates our empirical strategy.
The subsequent six columns report the results for three
different asset classes. In columns 3 and 4, we show that
fund families that close their MMFs tend to open more
than six bond funds. This effect is only present in the low-
interest rate period underscoring the importance of the
monetary shock. In columns 5–8, we report results from
estimating similar specifications for equity and balanced
funds. We find no significant differences between treat-
ment and control groups in the creation of these types
of funds. One identification concern is that the creation
of bond funds might be driven by movement in interest
rates, or by a general trend in the industry, and not merely
by the closure of MMFs in the same fund family. How-
ever, we can reject this possibility on two grounds. First,
we find a significant effect only in the low-interest regime,
and there is no general trend in the creation of bond funds,
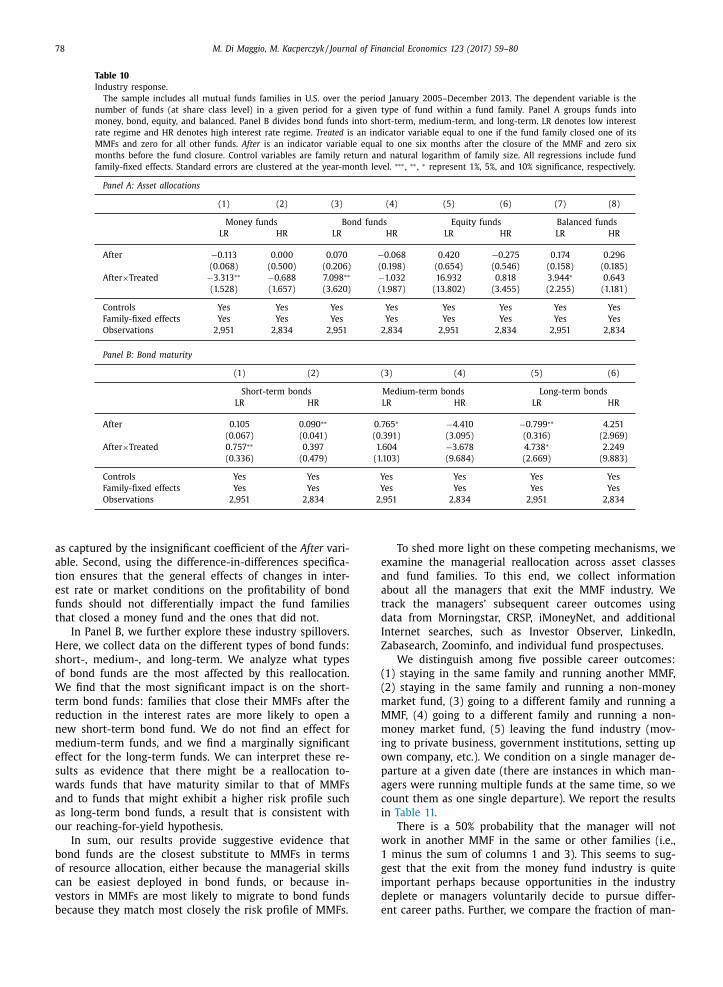
78 M. Di Maggio, M. Kacperczyk / Journal of Financial Economics 123 (2017) 59–80
Table 10
Industry response.
The sample includes all mutual funds families in U.S. over the period January 2005–December 2013. The dependent variable is the
number of funds (at share class level) in a given period for a given type of fund within a fund family . Panel A groups funds into
money, bond, equity, and balanced. Panel B divides bond funds into short-term, medium-term, and long-term. LR denotes low interest
rate regime and HR denotes high interest rate regime. Treated is an indicator variable equal to one if the fund family closed one of its
MMFs and zero for all other funds. After is an indicator variable equal to one six months after the closure of the MMF and zero six
months before the fund closure. Control variables are family return and natural logarithm of family size. All regressions include fund
family-fixed effects. Standard errors are clustered at the year-month level. ∗∗∗ , ∗∗ , ∗ represent 1%, 5%, and 10% significance, respectively.
Panel A: Asset allocations
(1) (2) (3) (4) (5) (6) (7) (8)
Money funds Bond funds Equity funds Balanced funds
LR HR LR HR LR HR LR HR
After −0.113 0.0 0 0 0.070 −0.068 0.420 −0.275 0.174 0.296
(0.068) (0.500) (0.206) (0.198) (0.654) (0.546) (0.158) (0.185)
After ×Treated −3.313 ∗∗ −0.688 7.098 ∗∗ −1.032 16.932 0.818 3.944 ∗ 0.643
(1.528) (1.657) (3.620) (1.987) (13.802) (3.455) (2.255) (1.181)
Controls Yes Yes Yes Yes Yes Yes Yes Yes
Family-fixed effects Yes Yes Yes Yes Yes Yes Yes Yes
Observations 2,951 2,834 2,951 2,834 2,951 2,834 2,951 2,834
Panel B: Bond maturity
(1) (2) (3) (4) (5) (6)
Short-term bonds Medium-term bonds Long-term bonds
LR HR LR HR LR HR
After 0.105 0.090 ∗∗ 0.765 ∗ −4.410 −0.799 ∗∗ 4.251
(0.067) (0.041) (0.391) (3.095) (0.316) (2.969)
After ×Treated 0.757 ∗∗ 0.397 1.604 −3.678 4.738 ∗ 2.249
(0.336) (0.479) (1.103) (9.684) (2.669) (9.883)
Controls Yes Yes Yes Yes Yes Yes
Family-fixed effects Yes Yes Yes Yes Yes Yes
Observations 2,951 2,834 2,951 2,834 2,951 2,834
as captured by the insignificant coefficient of the After vari-
able. Second, using the difference-in-differences specifica-
tion ensures that the general effects of changes in inter-
est rate or market conditions on the profitability of bond
funds should not differentially im pact the fund families
that closed a money fund and the ones that did not.
In Panel B, we further explore these industry spillovers.
Here, we collect data on the different types of bond funds:
short-, medium-, and long-term. We analyze what types
of bond funds are the most affected by this reallocation.
We find that the most significant impact is on the short-
term bond funds: families that close their MMFs after the
reduction in the interest rates are more likely to open a
new short-term bond fund. We do not find an effect for
medium-term funds, and we find a marginally significant
effect for the long-term funds. We can interpret these re-
sults as evidence that there might be a reallocation to-
wards funds that have maturity similar to that of MMFs
and to funds that might exhibit a higher risk profile such
as long-term bond funds, a result that is consistent with
our reaching-for-yield hypothesis.
In sum, our results provide suggestive evidence that
bond funds are the closest substitute to MMFs in terms
of resource allocation, either because the managerial skills
can be easiest deployed in bond funds, or because in-
vestors in MMFs are most likely to migrate to bond funds
because they match most closely the risk profile of MMFs.
To shed more light on these competing mechanisms, we
examine the managerial reallocation across asset classes
and fund families. To this end, we collect information
about all the managers that exit the MMF industry. We
track the managers’ subsequent career outcomes using
data from Morningstar, CRSP, iMoneyNet, and additional
Internet searches, such as Investor Observer, LinkedIn,
Zabasearch, Zoominfo, and individual fund prospectuses.
We distinguish among five possible career outcomes:
(1) staying in the same family and running another MMF,
(2) staying in the same family and running a non-money
market fund, (3) going to a different family and running a
MMF, (4) going to a different family and running a non-
money market fund, (5) leaving the fund industry (mov-
ing to private business, government institutions, setting up
own company, etc.). We condition on a single manager de-
parture at a given date (there are instances in which man-
agers were running multiple funds at the same time, so we
count them as one single departure). We report the results
in Table 11.
There is a 50% probability that the manager will not
work in another MMF in the same or other families (i.e.,
1 minus the sum of columns 1 and 3). This seems to sug-
gest that the exit from the money fund industry is quite
important perhaps because opportunities in the industry
deplete or managers voluntarily decide to pursue differ-
ent career paths. Further, we compare the fraction of man-
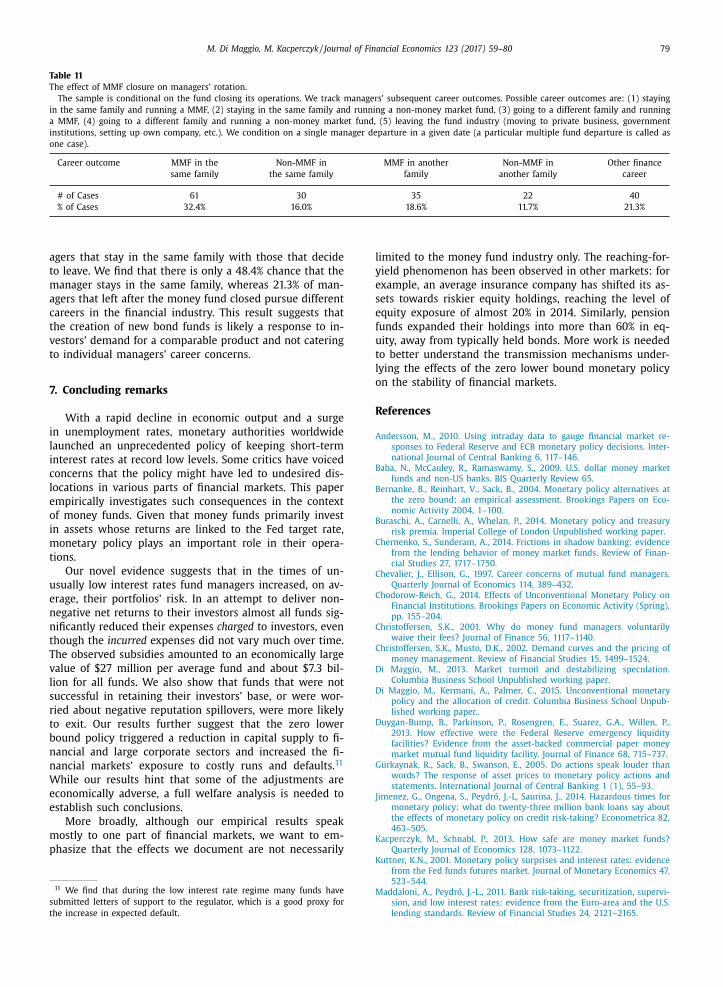
M. Di Maggio, M. Kacperczyk / Journal of Financial Economics 123 (2017) 59–80 79
Table 11
The effect of MMF closure on managers’ rotation.
The sample is conditional on the fund closing its operations. We track managers’ subsequent career outcomes. Possible career outcomes are: (1) staying
in the same family and running a MMF, (2) staying in the same family and running a non-money market fund, (3) going to a different family and running
a MMF, (4) going to a different family and running a non-money market fund, (5) leaving the fund industry (moving to private business, government
institutions, setting up own company, etc.). We condition on a single manager departure in a given date (a particular multiple fund departure is called as
one case).
Career outcome MMF in the Non-MMF in MMF in another Non-MMF in Other finance
same family the same family family another family career
# of Cases 61 30 35 22 40
% of Cases 32.4% 16.0% 18.6% 11.7% 21.3%
agers that stay in the same family with those that decide
to leave. We find that there is only a 48.4% chance that the
manager stays in the same family, whereas 21.3% of man-
agers that left after the money fund closed pursue different
careers in the financial industry. This result suggests that
the creation of new bond funds is likely a response to in-
vestors’ demand for a comparable product and not catering
to individual managers’ career concerns.
7. Concluding remarks
With a rapid decline in economic output and a surge
in unemployment rates, monetary authorities worldwide
launched an unprecedented policy of keeping short-term
interest rates at record low levels. Some critics have voiced
concerns that the policy might have led to undesired dis-
locations in various parts of financial markets. This paper
empirically investigates such consequences in the context
of money funds. Given that money funds primarily invest
in assets whose returns are linked to the Fed target rate,
monetary policy plays an important role in their opera-
tions.
Our novel evidence suggests that in the times of un-
usually low interest rates fund managers increased, on av-
erage, their portfolios’ risk. In an attempt to deliver non-
negative net returns to their investors almost all funds sig-
nificantly reduced their expenses charged to investors, even
though the incurred expenses did not vary much over time.
The observed subsidies amounted to an economically large
value of $27 million per average fund and about $7.3 bil-
lion for all funds. We also show that funds that were not
successful in retaining their investors’ base, or were wor-
ried about negative reputation spillovers, were more likely
to exit. Our results further suggest that the zero lower
bound policy triggered a reduction in capital supply to fi-
nancial and large corporate sectors and increased the fi-
nancial markets’ exposure to costly runs and defaults. 11
While our results hint that some of the adjustments are
economically adverse, a full welfare analysis is needed to
establish such conclusions.
More broadly, although our empirical results speak
mostly to one part of financial markets, we want to em-
phasize that the effects we document are not necessarily
11 We find that during the low interest rate regime many funds have
submitted letters of support to the regulator, which is a good proxy for
the increase in expected default.
limited to the money fund industry only. The reaching-for-
yield phenomenon has been observed in other markets: for
example, an average insurance company has shifted its as-
sets towards riskier equity holdings, reaching the level of
equity exposure of almost 20% in 2014. Similarly, pension
funds expanded their holdings into more than 60% in eq-
uity, away from typically held bonds. More work is needed
to better understand the transmission mechanisms under-
lying the effects of the zero lower bound monetary policy
on the stability of financial markets.
References
Andersson, M. , 2010. Using intraday data to gauge financial market re-sponses to Federal Reserve and ECB monetary policy decisions. Inter-
national Journal of Central Banking 6, 117–146 .
Baba, N. , McCauley, R. , Ramaswamy, S. , 2009. U.S. dollar money marketfunds and non-US banks. BIS Quarterly Review 65 .
Bernanke, B. , Reinhart, V. , Sack, B. , 2004. Monetary policy alternatives atthe zero bound: an empirical assessment. Brookings Papers on Eco-
nomic Activity 2004, 1–100 . Buraschi, A. , Carnelli, A. , Whelan, P. , 2014. Monetary policy and treasury
risk premia. Imperial College of London Unpublished working paper . Chernenko, S. , Sunderam, A. , 2014. Frictions in shadow banking: evidence
from the lending behavior of money market funds. Review of Finan-
cial Studies 27, 1717–1750 . Chevalier, J. , Ellison, G. , 1997. Career concerns of mutual fund managers.
Quarterly Journal of Economics 114, 389–432 . Chodorow-Reich, G. , 2014. Effects of Unconventional Monetary Policy on
Financial Institutions. Brookings Papers on Economic Activity (Spring),pp. 155–204 .
Christoffersen, S.K. , 2001. Why do money fund managers voluntarily
waive their fees? Journal of Finance 56, 1117–1140 . Christoffersen, S.K. , Musto, D.K. , 2002. Demand curves and the pricing of
money management. Review of Financial Studies 15, 1499–1524 . Di Maggio, M. , 2013. Market turmoil and destabilizing speculation.
Columbia Business School Unpublished working paper . Di Maggio, M. , Kermani, A. , Palmer, C. , 2015. Unconventional monetary
policy and the allocation of credit. Columbia Business School Unpub-
lished working paper. . Duygan-Bump, B. , Parkinson, P. , Rosengren, E. , Suarez, G.A. , Willen, P. ,
2013. How effective were the Federal Reserve emergency liquidityfacilities? Evidence from the asset-backed commercial paper money
market mutual fund liquidity facility. Journal of Finance 68, 715–737 . Gürkaynak, R. , Sack, B. , Swanson, E. , 2005. Do actions speak louder than
words? The response of asset prices to monetary policy actions and
statements. International Journal of Central Banking 1 (1), 55–93 . Jimenez, G. , Ongena, S. , Peydró, J.-L , Saurina, J. , 2014. Hazardous times for
monetary policy: what do twenty-three million bank loans say aboutthe effects of monetary policy on credit risk-taking? Econometrica 82,
463–505 . Kacperczyk, M. , Schnabl, P. , 2013. How safe are money market funds?
Quarterly Journal of Economics 128, 1073–1122 .
Kuttner, K.N. , 2001. Monetary policy surprises and interest rates: evidencefrom the Fed funds futures market. Journal of Monetary Economics 47,
523–544 . Maddaloni, A. , Peydró, J.-L. , 2011. Bank risk-taking, securitization, supervi-
sion, and low interest rates: evidence from the Euro-area and the U.S.lending standards. Review of Financial Studies 24, 2121–2165 .

80 M. Di Maggio, M. Kacperczyk / Journal of Financial Economics 123 (2017) 59–80
McCabe, P. , 2010. The cross section of money market fund risks and finan- cial crises. Federal Reserve Bank of New York Unpublished working
paper. . Rajan, R. , 2010. Fault Lines. Princeton University Press, Princeton, NJ .
Stein, J.C. , 2013. Overheating in credit markets: origins, measurement, and policy responses. In: Remarks delivered at Restoring Household Fi-
nancial Stability after the Great Recession: Why Household Balance
Sheets Matter, a Symposium Sponsored by the Federal Reserve Bank of St. Louis. St. Louis .
Strahan, P. , Tanyeri, B. , 2015. Once burned, twice shy: money market fund responses to a systemic liquidity shock. Journal of Financial and
Quantitative Analysis 50, 119–144 . Woodford, M. , 2003. Interest Rates and Prices: Foundations of a Theory of
Monetary Policy. Princeton University Press, Princeton, NJ . Yellen, J. , 2011. Remarks at the International Conference: Real and Finan-
cial Linkage and Monetary Policy. Bank of Japan .