Development of an Efficiency Platform Based on MQTT ... - MDPI
Upload
khangminh22Category
view
1download
0
energies
Article
Unintended Effects of Energy Efficiency Policy: LessonsLearned in the Residential Sector
Andra Blumberga 1,* , Gatis Bazbauers 1, Selina Vancane 1, Ivars Ijabs 2, Jurijs Nikisins 2
and Dagnija Blumberga 1
�����������������
Citation: Blumberga, A.; Bazbauers,
G.; Vancane, S.; Ijabs, I.; Nikisins, J.;
Blumberga, D. Unintended Effects of
Energy Efficiency Policy: Lessons
Learned in the Residential Sector.
Energies 2021, 14, 7792. https://
doi.org/10.3390/en14227792
Academic Editor: Paulo Santos
Received: 13 October 2021
Accepted: 15 November 2021
Published: 21 November 2021
Publisher’s Note: MDPI stays neutral
with regard to jurisdictional claims in
published maps and institutional affil-
iations.
Copyright: © 2021 by the authors.
Licensee MDPI, Basel, Switzerland.
This article is an open access article
distributed under the terms and
conditions of the Creative Commons
Attribution (CC BY) license (https://
creativecommons.org/licenses/by/
4.0/).
1 Institute of Energy Systems and Environment, Riga Technical University, LV-1048 Riga, Latvia;[email protected] (G.B.); [email protected] (S.V.); [email protected] (D.B.)
2 Advanced Social and Political Research Institute, University of Latvia, LV-1019 Riga, Latvia;[email protected] (I.I.); [email protected] (J.N.)
* Correspondence: [email protected]
Abstract: The European Union has set an ambitious goal to tackle climate change, and energyefficiency in the residential sector is among the measures required to close the gap between targetedand actual greenhouse gas emissions. While different policy tools have been applied, the diffusionrate of these measures remains low. A system dynamics simulation model of the residential sectorwas developed to assess the advantages and drawbacks of energy efficiency policy in the multi-familybuilding sector based on experience accumulated over the last twelve years in Latvia. The modelwas validated in expert group model building sessions and with historical trends. Simulating themodel, a hypothesis was tested that supported the idea that seemingly positive policy tools set thestage for a series of unintended adverse effects due to the complex interactions between differentsystem components. The common assumption that information and financial support should resultin significant energy efficiency diffusion proved to be wrong. It instead results in unintended long-term consequences that hamper national energy efficiency goals. The model carried out an analysisand brought insights for improving the effectiveness of government energy efficiency policy. It isconcluded that models that broadly describe complex systems are needed to identify effective policiesand foresee unintended side effects.
Keywords: energy efficiency; residential buildings; policy tools
1. Introduction
The European Union set ambitious goals to tackle climate change in the EuropeanGreen Deal [1]. One of the energy demand side sectors is the residential sector, accountingfor 27% of the total final energy consumption [2], with space heating accounting for 62%of that.
Although energy efficiency can benefit the economy, society, and environment, thediffusion rate in the residential sector remains low [3]. The weighted annual buildingrenovation rate in the EU is only 1% and it will take centuries to decarbonize the sector [4].Various barriers deter energy users from the implementation of energy efficiency [4].Research shows that the most critical factors during decision making are attitude andbehavior [5–9]. Attitude does not always result in behavior, especially when externalbarriers influence the actual behavior of an energy consumer [6,10]. Studies [11–13] showthat the more expensive an energy efficiency measure is, the lower the correlation betweenattitudes and values and actual behavior.
Policy tools have to address all barriers to reduce the efforts of decision making [14–16].Although most of the barriers studied relate to market failures, economic and regulatoryinstruments alone cannot reduce the barriers related to individual behavior [3]. Otherpolicy tools can be applied, such as regulatory, information, technical, financial, coop-erative, voluntary, and obligation schemes [8,17–20]. An adequate targeting of policy is
Energies 2021, 14, 7792. https://doi.org/10.3390/en14227792 https://www.mdpi.com/journal/energies

Energies 2021, 14, 7792 2 of 31
challenging because the accurate identification of the target audience and action to reach itis essential. The policy development process is context-dependent and complex as it in-volves the interests of various stakeholders [21]. For policymakers, justification of financialinvestments in policy has to be based on both short-term and long-term budget planning.Thus, policymakers view different policy instruments from a cost–benefit perspective [22].
The implementation of a single policy tool cannot achieve the desired result [23,24].However, most current research mainly focuses on analyzing individual policy instruments,with less emphasis on the evaluation of policy instrument combinations [25]. It is essentialto identify and assess the factors reinforcing or hindering the effectiveness of the interactionbetween various policy tools [7,26,27]. Wiese et al. [7] have summarized research onthe interaction of different energy efficiency policy tools. They have found reinforcingeffects between energy tax and energy efficiency obligation schemes/white certificates,financial incentives, regulatory environment, voluntary agreements, energy efficiencylabeling schemes, information measures, and other policy tools. Those that simultaneouslyreinforce and mitigate include energy efficiency obligation schemes/white certificates andfinancial incentives, energy tax, and subsidies. An energy tax weakens energy efficiencystandards while energy efficiency obligation schemes/white certificates mitigate voluntaryagreements, financial incentives counteract energy efficiency standards, and subsidiesweaken access to capital.
The EU Directive on Energy Performance of Buildings 2010/31/EU has helped toshare experience among EU member states, increase cross-border investments in buildings,stimulate innovation, and increase competitiveness. However, the renovation rate remainsvery low, the existing legislative framework is insufficient to reach the goals of the GreenDeal, and the renovation rate of buildings needs to be increased [4]. Therefore, the GreenDeal is translated into the European Renovation Wave and contains an action plan withconcrete regulatory, financing, and enabling measures to double the annual energy reno-vation rate of buildings by 2030. The Energy Performance of Buildings Directive will beimproved accordingly [28].
Multi-family buildings are a significant consumer in the residential sector in many EUcountries [1]. If individual owners own apartments, it can lead to a specific problem—thecollective decision-making process required when building envelope and common spaceneed to be improved. In countries wherein single owners own apartments in multi-familybuildings, the decision on implementing collective energy efficiency measures, such as thethermal renovation of the building envelope, should be taken collectively by the majority(51%) of apartment owners. Therefore, the multi-family building sector is complex, deeplyembedded in societal structures, and involves many stakeholders interacting in differentfeedback structures with nonlinear relations. Stakeholders include apartment owners,municipalities, housing maintenance companies, construction companies, municipal au-thorities, materials suppliers, energy service companies, etc. The problems observed inthis kind of societal structure are challenging to manage and require addressing systemicfailures [29]. An understanding of the underlying structures that drive the behavior oftransitions is needed [30].
Social systems are multi-loop, nonlinear feedback systems. Many policy programscause the reverse effect of desired results because people make the wrong decisions whenfaced with complex and highly interactive systems. This is due to how the human mindis not adapted to interpreting how social systems behave. In this case, policies only solveproblems in the short-term because a self-regulating system is at work. Often, people blameoutside forces for creating problems; however, a dynamic analysis shows that problemsare caused by internal policies [31]. The impact of reinforcing feedback loops, such asthe accumulation of knowledge [32], network effects [33], economies of scale [34], andadaptive expectations [35], has been observed prior to societal lock-ins of unsustainablebehaviors [36]. The undesirable effects of policies can increase the frustration of societyagainst actors that attempt to manage societal systems. However, there are no modes ofbehavior that are free of pressures and stresses. Many modes of behavior are possible,

Energies 2021, 14, 7792 3 of 31
some more desirable than others, and a good understanding of the dynamic behavior ofsystems is crucial to finding sustainable behaviors in social systems [31,37,38]
The national energy efficiency goal for multi-family buildings in Latvia from 2008 to 2020was set in cumulative savings and had to reach 2950 GWh by 2020 (Figure 1). It sumsupwards from the national goal of 2008–2016 (2701 GWh) [39,40] and the goal of 2016–2020(250 GWh) [41]. Since 2008, Latvia’s government has only relied on two energy efficiencypolicy tools in the sector, these being the financial support of 50% from EU funds andinformation activities (mainly grassroots activities via seminars in different municipalities).The data from energy efficiency authorities show that actual cumulative energy savings aremuch lower than expected and have reached only 15% of the goal (see Figure 1) [42].
Energies 2021, 14, 7792 3 of 32
against actors that attempt to manage societal systems. However, there are no modes of behavior that are free of pressures and stresses. Many modes of behavior are possible, some more desirable than others, and a good understanding of the dynamic behavior of systems is crucial to finding sustainable behaviors in social systems [31,37,38]
The national energy efficiency goal for multi-family buildings in Latvia from 2008 to 2020 was set in cumulative savings and had to reach 2950 GWh by 2020 (Figure 1). It sums upwards from the national goal of 2008–2016 (2701 GWh) [39,40] and the goal of 2016–2020 (250 GWh) [41]. Since 2008, Latvia’s government has only relied on two energy effi-ciency policy tools in the sector, these being the financial support of 50% from EU funds and information activities (mainly grassroots activities via seminars in different munici-palities). The data from energy efficiency authorities show that actual cumulative energy savings are much lower than expected and have reached only 15% of the goal (see Figure 1) [42].
Figure 1. Actual and planned cumulative energy savings for multi-family buildings in Latvia.
Our study hypothesized that seemingly positive policy tools set the stage for a series of unintended adverse effects due to complex interactions between different system com-ponents, and that the common assumption that information and financial support should result in significant energy efficiency diffusion results hampers national energy efficiency goals.
The main goal of this study was to assess energy efficiency policy carried out in the multi-family building sector during twelve years of policy implementation, identify how different variables interact and respond to each other, and generate feedback mechanisms that ultimately give rise to unpredictable behavior, and, finally, to provide suggestions for further policies.
In the scope of the study, energy efficiency projects in multi-family buildings were defined as the renovation of collectively owned building elements by increasing the ther-mal resistance of the building envelope according to national energy performance stand-ards, including insulation of external walls, roofs, basements, and main pipes, and chang-ing windows.
The paper begins with an introduction, followed by a description of the methodol-ogy, a presentation of results, and our conclusions.
2. Methodology The system under study is highly complex, and its different cause-and-effect rela-
tions, feedback mechanisms, and nonlinear relations control individual parameters. Therefore, system dynamics modelling was applied. System dynamics is a mathematical
0
500
1000
1500
2000
2500
3000
3500
2009 2010 2011 2012 2013 2014 2015 2016 2017 2018 2019 2020
Cum
ulat
ive
ener
gy s
avin
gs, G
Wh
Goal 2008-2020 Actual savings
Figure 1. Actual and planned cumulative energy savings for multi-family buildings in Latvia.
Our study hypothesized that seemingly positive policy tools set the stage for a se-ries of unintended adverse effects due to complex interactions between different systemcomponents, and that the common assumption that information and financial supportshould result in significant energy efficiency diffusion results hampers national energyefficiency goals.
The main goal of this study was to assess energy efficiency policy carried out in themulti-family building sector during twelve years of policy implementation, identify howdifferent variables interact and respond to each other, and generate feedback mechanismsthat ultimately give rise to unpredictable behavior, and, finally, to provide suggestions forfurther policies.
In the scope of the study, energy efficiency projects in multi-family buildings were definedas the renovation of collectively owned building elements by increasing the thermal resistanceof the building envelope according to national energy performance standards, includinginsulation of external walls, roofs, basements, and main pipes, and changing windows.
The paper begins with an introduction, followed by a description of the methodology,a presentation of results, and our conclusions.
2. Methodology
The system under study is highly complex, and its different cause-and-effect relations,feedback mechanisms, and nonlinear relations control individual parameters. Therefore,system dynamics modelling was applied. System dynamics is a mathematical modellingapproach pioneered by Jay Forrester [43] that accepts the multiple-feedback-loop andnonlinear nature of real systems. These models are not obtained statistically from time-series data but expose underlying system structures and the policies that guide decisions.
Energies 2021, 14, 7792 4 of 31
System dynamics models do not depend on a shortage of information and data, whichis one of the major drawbacks of other approaches, because available information aboutsystem structure and decision-making policies is sufficient [31].
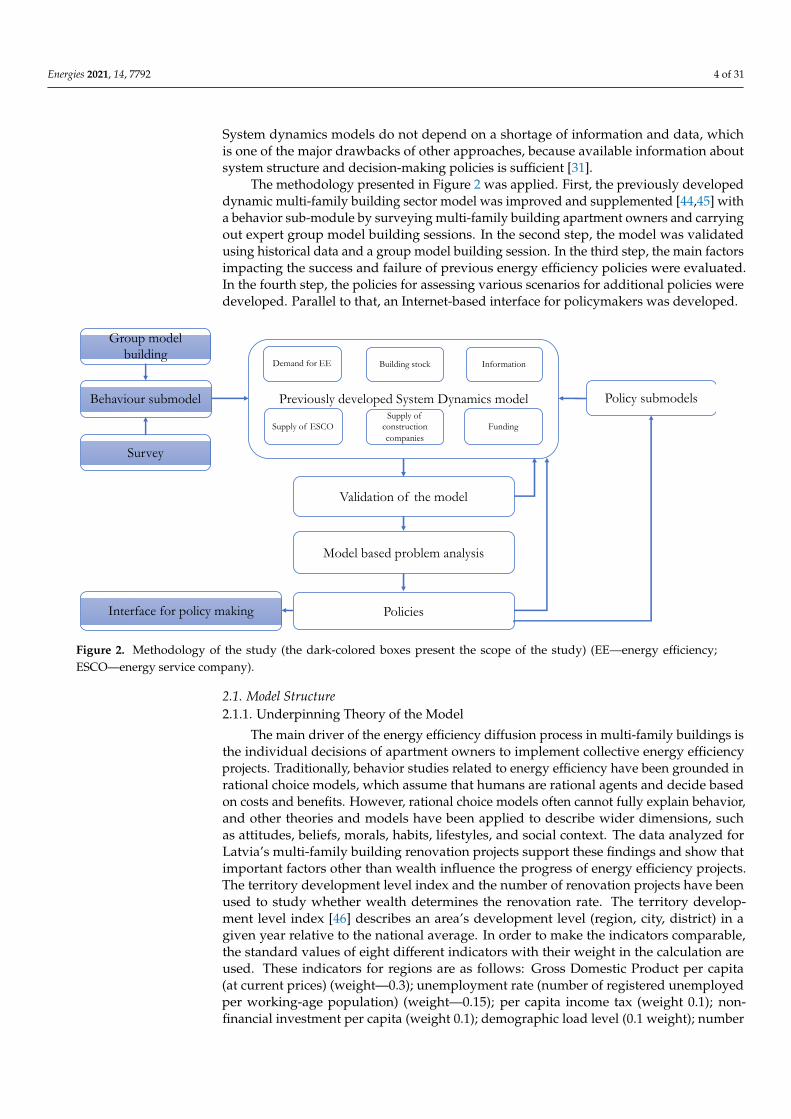
The methodology presented in Figure 2 was applied. First, the previously developeddynamic multi-family building sector model was improved and supplemented [44,45] witha behavior sub-module by surveying multi-family building apartment owners and carryingout expert group model building sessions. In the second step, the model was validatedusing historical data and a group model building session. In the third step, the main factorsimpacting the success and failure of previous energy efficiency policies were evaluated.In the fourth step, the policies for assessing various scenarios for additional policies weredeveloped. Parallel to that, an Internet-based interface for policymakers was developed.
Energies 2021, 14, 7792 4 of 32
modelling approach pioneered by Jay Forrester [43] that accepts the multiple-feedback-loop and nonlinear nature of real systems. These models are not obtained statistically from time-series data but expose underlying system structures and the policies that guide de-cisions. System dynamics models do not depend on a shortage of information and data, which is one of the major drawbacks of other approaches, because available information about system structure and decision-making policies is sufficient [31].
The methodology presented in Figure 2 was applied. First, the previously developed dynamic multi-family building sector model was improved and supplemented [44,45] with a behavior sub-module by surveying multi-family building apartment owners and carrying out expert group model building sessions. In the second step, the model was validated using historical data and a group model building session. In the third step, the main factors impacting the success and failure of previous energy efficiency policies were evaluated. In the fourth step, the policies for assessing various scenarios for additional policies were developed. Parallel to that, an Internet-based interface for policymakers was developed.
Figure 2. Methodology of the study (the dark-colored boxes present the scope of the study) (EE—energy efficiency; ESCO—energy service company).
2.1. Model Structure 2.1.1. Underpinning Theory of the Model
The main driver of the energy efficiency diffusion process in multi-family buildings is the individual decisions of apartment owners to implement collective energy efficiency projects. Traditionally, behavior studies related to energy efficiency have been grounded in rational choice models, which assume that humans are rational agents and decide based on costs and benefits. However, rational choice models often cannot fully explain behav-ior, and other theories and models have been applied to describe wider dimensions, such as attitudes, beliefs, morals, habits, lifestyles, and social context. The data analyzed for Latvia’s multi-family building renovation projects support these findings and show that important factors other than wealth influence the progress of energy efficiency projects. The territory development level index and the number of renovation projects have been used to study whether wealth determines the renovation rate. The territory development level index [46] describes an area’s development level (region, city, district) in a given year relative to the national average. In order to make the indicators comparable, the standard values of eight different indicators with their weight in the calculation are used. These indicators for regions are as follows: Gross Domestic Product per capita (at current prices) (weight—0.3); unemployment rate (number of registered unemployed per working-age population) (weight—0.15); per capita income tax (weight 0.1); non-financial investment
Previously developed System Dynamics modelBehaviour submodel
Survey
Validation of the model
Interface for policy making Policies
Supply of ESCO
Information
Supply of construction companies
Demand for EE Building stock
Model based problem analysis
Funding
Group model building
Policy submodels
Figure 2. Methodology of the study (the dark-colored boxes present the scope of the study) (EE—energy efficiency;ESCO—energy service company).
2.1. Model Structure2.1.1. Underpinning Theory of the Model
The main driver of the energy efficiency diffusion process in multi-family buildings isthe individual decisions of apartment owners to implement collective energy efficiencyprojects. Traditionally, behavior studies related to energy efficiency have been grounded inrational choice models, which assume that humans are rational agents and decide basedon costs and benefits. However, rational choice models often cannot fully explain behavior,and other theories and models have been applied to describe wider dimensions, suchas attitudes, beliefs, morals, habits, lifestyles, and social context. The data analyzed forLatvia’s multi-family building renovation projects support these findings and show thatimportant factors other than wealth influence the progress of energy efficiency projects.The territory development level index and the number of renovation projects have beenused to study whether wealth determines the renovation rate. The territory develop-ment level index [46] describes an area’s development level (region, city, district) in agiven year relative to the national average. In order to make the indicators comparable,the standard values of eight different indicators with their weight in the calculation areused. These indicators for regions are as follows: Gross Domestic Product per capita(at current prices) (weight—0.3); unemployment rate (number of registered unemployedper working-age population) (weight—0.15); per capita income tax (weight 0.1); non-financial investment per capita (weight 0.1); demographic load level (0.1 weight); number

Energies 2021, 14, 7792 5 of 31
of individual merchants and commercial companies per 1000 inhabitants (weight—0.1);density of population (weight—0.05); and changes in the population over the last fiveyears (weight—0.1). Figure 3 illustrates that the territory development level index of theregion/city did not correlate with the number of building renovation projects for theperiod 2008–2013. The region with the lowest score (Latgale) had as few projects as therichest city (capital city, Riga). On the other hand, three other regions (Kurzeme, Vidzeme,and Zemgale) had almost the same territory development level index, but the number ofimplemented projects differed 2.5 times between the highest (Kurzeme) and the lowest(Zemgale) numbers. The Riga region had a lower number of projects than Kurzeme buthad a 1.5 times higher index. The same tendency for 2014–2020 was observed.
Energies 2021, 14, x FOR PEER REVIEW 5 of 32
population) (weight—0.15); per capita income tax (weight 0.1); non-financial investment per capita (weight 0.1); demographic load level (0.1 weight); number of individual mer-chants and commercial companies per 1000 inhabitants (weight—0.1); density of popula-tion (weight—0.05); and changes in the population over the last five years (weight—0.1). Figure 3 illustrates that the territory development level index of the region/city did not correlate with the number of building renovation projects for the period 2008–2013. The region with the lowest score (Latgale) had as few projects as the richest city (capital city, Riga). On the other hand, three other regions (Kurzeme, Vidzeme, and Zemgale) had al-most the same territory development level index, but the number of implemented projects differed 2.5 times between the highest (Kurzeme) and the lowest (Zemgale) numbers. The Riga region had a lower number of projects than Kurzeme but had a 1.5 times higher in-dex. The same tendency for 2014–2020 was observed.
Figure 3. The territory development level index of regions/cities and number of reno-vated projects in different regions from 2008 to 2013.
This study was based on the attitude–behavior–context model developed by Stern and Oskamp [47], accounting for motivations, attitudes and values, contextual or situa-tional factors, social influences, personal capabilities, and habits. It is capable of describing and predicting pro-environmental consumer behavior and is rooted in Kurt Lewin’s “field theory” [48], which examines patterns of interaction between an individual and the total field or environment. Lewin’s “field theory” states that behavior is a function of a person and the environment. This approach suggests that a sophisticated policy approach is needed and should include different incentive structures; facilitation of conditions and situational factors; institutional, social, and cultural context; business practices and their impact; helping communities to help themselves; and its own environmental and social performance.
Energy efficiency projects are based on making decisions on various measures. The individual decision-maker must be able to move from attitude to action. The more barriers exist in a person’s path to action, the less likely it is that attitudes will turn into action. There are many different internal and external barriers to the implementation of energy efficiency measures. The causal model of behavior for energy efficiency measures in the residential sector [47] shows (see Figure 4) seven levels of causality that represent different groups of barriers: internal barriers (inner five circles) and external barriers ( outer two circles). The influence of levels changes from the external to the internal. The central circle contains resource-consuming or energy-saving behavior influenced by a long chain of causal relationships that run through the outer circles. Any outer circle affects the circles inside of it. For example, whether a person owns or rents a building (external incentives
Figure 3. The territory development level index of regions/cities and number of renovated projectsin different regions from 2008 to 2013.
This study was based on the attitude–behavior–context model developed by Stern andOskamp [47], accounting for motivations, attitudes and values, contextual or situationalfactors, social influences, personal capabilities, and habits. It is capable of describing andpredicting pro-environmental consumer behavior and is rooted in Kurt Lewin’s “field the-ory” [48], which examines patterns of interaction between an individual and the total fieldor environment. Lewin’s “field theory” states that behavior is a function of a person and theenvironment. This approach suggests that a sophisticated policy approach is needed andshould include different incentive structures; facilitation of conditions and situational fac-tors; institutional, social, and cultural context; business practices and their impact; helpingcommunities to help themselves; and its own environmental and social performance.
Energy efficiency projects are based on making decisions on various measures. Theindividual decision-maker must be able to move from attitude to action. The more barriersexist in a person’s path to action, the less likely it is that attitudes will turn into action.There are many different internal and external barriers to the implementation of energyefficiency measures. The causal model of behavior for energy efficiency measures in theresidential sector [47] shows (see Figure 4) seven levels of causality that represent differentgroups of barriers: internal barriers (inner five circles) and external barriers ( outer twocircles). The influence of levels changes from the external to the internal. The central circlecontains resource-consuming or energy-saving behavior influenced by a long chain ofcausal relationships that run through the outer circles. Any outer circle affects the circlesinside of it. For example, whether a person owns or rents a building (external incentivesand restrictions) influences his or her attitude towards energy efficiency measures (attitudeand confidence)—the building owner not only reduces the heating costs by insulatingthe building envelope, but also takes care of the visual appearance of the building. Thiscould be why building owners know much more about energy efficiency technologies

Energies 2021, 14, 7792 6 of 31
and materials than building tenants (knowledge) and are more interested in improvingthe building (attention and commitment). A circle rupture can create a situation whereina person, convinced that building renovation will benefit the environment (attitude andconfidence) does not implement energy efficiency measures (action) because of a lackof knowledge (knowledge) or commitment (attention and commitment). The barriersare low when a simple and inexpensive solution is available. If the barriers are high,education in the short term offers little to nothing except for overcoming the internalbarriers (especially indifference and lack of information). The assumption that one can tellmotivated people what to do and this will turn into action is wrong because there are manyother significant barriers.
Energies 2021, 14, 7792 6 of 32
This could be why building owners know much more about energy efficiency technolo-gies and materials than building tenants (knowledge) and are more interested in improv-ing the building (attention and commitment). A circle rupture can create a situation wherein a person, convinced that building renovation will benefit the environment (atti-tude and confidence) does not implement energy efficiency measures (action) because of a lack of knowledge (knowledge) or commitment (attention and commitment). The barri-ers are low when a simple and inexpensive solution is available. If the barriers are high, education in the short term offers little to nothing except for overcoming the internal bar-riers (especially indifference and lack of information). The assumption that one can tell motivated people what to do and this will turn into action is wrong because there are many other significant barriers.
Figure 4. Attitude–behavior–context model for energy efficiency implementation in the residential sector (adjusted from (Stern and Oskamp, 1987)).
2.1.2. Previously Developed System Dynamics Model In system dynamics, a stock and flow structure is used to simulate the behavior of
the studied system and causal mapping is employed to study the causes of dynamics of a complex system with feedbacks and nonlinearities. In this study, the previously built structure of the multi-family building energy efficiency model was adopted [44,45]. Orig-inally, this was developed based on mental models of experts, knowledge gained from literature reviews, and experience from projects implemented in the previous decade. Simulations of the model were used to assess the impact of different energy efficiency policy tools. The stock and flow structure of the model contained 173 variables and was transformed into a causal loop diagram. Figure 5 illustrates the system’s main feedback structure and helps capture the causes of dynamics, including the main variables and 12 causal loops (6 reinforcing and 6 balancing), dictating the dynamics of the residential building energy efficiency improvement process.
Characteristics of household
External stimulus and constraints
Values
Attitude and beliefs
Knowledge
Attention and commitment
Action
Figure 4. Attitude–behavior–context model for energy efficiency implementation in the residentialsector (adjusted from (Stern and Oskamp, 1987)).
2.1.2. Previously Developed System Dynamics Model
In system dynamics, a stock and flow structure is used to simulate the behavior ofthe studied system and causal mapping is employed to study the causes of dynamicsof a complex system with feedbacks and nonlinearities. In this study, the previouslybuilt structure of the multi-family building energy efficiency model was adopted [44,45].Originally, this was developed based on mental models of experts, knowledge gainedfrom literature reviews, and experience from projects implemented in the previous decade.Simulations of the model were used to assess the impact of different energy efficiencypolicy tools. The stock and flow structure of the model contained 173 variables and wastransformed into a causal loop diagram. Figure 5 illustrates the system’s main feedbackstructure and helps capture the causes of dynamics, including the main variables and12 causal loops (6 reinforcing and 6 balancing), dictating the dynamics of the residentialbuilding energy efficiency improvement process.

Energies 2021, 14, 7792 7 of 31Energies 2021, 14, 7792 7 of 32
Figure 5. Broad causal loop diagram for the residential energy efficiency improvement process. Reinforcing loops are shown with symbols “R” and balancing loops are shown with symbols “B”.
The main sectors included in this model are the demand and supply sides of the building renovation market. Non-renovated building stock represents the demand side, while the capacity and supply abilities of traditional construction companies and the en-ergy service companies (ESCOs) represent the supply side. A balance between demand and supply is very significant for the overall system because it dictates the building reno-vation rate. Non-renovated buildings with high energy consumption and renovated buildings with reduced energy consumption are the main stocks. The renovation flow increases the number of renovated buildings at a certain rate, which depends on aware-ness, net benefits, and uncertainty costs. The net benefits are calculated as the financial benefit from renovation, i.e., saved energy costs minus investment costs. However, the renovation is slow even if the financial benefits are obvious. This is due to the barriers that discourage energy efficiency measures; for example, agreement with neighbors, efforts to overcome administrative barriers, attract funding, etc. Uncertainty costs represent these barriers in monetary terms. People are made aware of the importance of renovation in the recruitment process (reinforcing loop R1). This process can be encouraged with infor-mation campaigns such as for non-renovated buildings where uninformed people live and successfully renovated buildings govern. The latter gives rise to a word-of-mouth effect. When people are “recruited for renovation”, this increases potential projects and further increases demand. Increased demand leads to increased capacity, stimulating the conversion of buildings from non-renovated to renovated and further recruitment for ren-ovation. The potential projects create demand and have an impact on perceived net bene-fits. The more renovated buildings, the higher the net benefits due to increased energy savings from the renovation process (reinforcing loop R2) and renovation costs (reinforc-ing loop R3). The costs are lowered due to the economies of scale, accumulation of expe-rience, and the entrance of new companies into the market if other factors remain the
+
+
+
+
+
-
+
-
-
+
-
-
-
-
-
-
+
--
-
++
+
+
+
+
-
++
+
+
+
+
-
--
+
+
Renovation rate ESCOs
Renovation rate byconstruction companies
Available financing
Renovatedbuildings ESCOs
Energysavings ESCOs
Profit ESCOsCapacity ESCOs
Improvement of qualityof energy audits
Energyperformance
standards
Investmentin R&D
CO2 tax
Improvement of supervisionof construction works
SubsidiesChampion
effect
Insulation costs
Energy tariff
One-stop shop
Improvement of supervisionof construction works
Standard procurementdocumentation and contracts
Improvement of qualityof energy audits
Perceivednet benefit
Net benefit
Energysavings
Renovated buildings byconstruction companies
Perceiveduncertainty costs
Uncertainty costs
Perceivedsuccessful
projects
Successful projects
Capacity inexperiencedconstruction companies
Non-renovatedbuildings
Potentialprojects
Awareness
Recruitmentrate
Capacity construction companies
R2
R3
R4
R5
R6B1
B3
B2
B4
R1
B5
B6
Figure 5. Broad causal loop diagram for the residential energy efficiency improvement process. Reinforcing loops areshown with symbols “R” and balancing loops are shown with symbols “B”.
The main sectors included in this model are the demand and supply sides of thebuilding renovation market. Non-renovated building stock represents the demand side,while the capacity and supply abilities of traditional construction companies and the energyservice companies (ESCOs) represent the supply side. A balance between demand andsupply is very significant for the overall system because it dictates the building renovationrate. Non-renovated buildings with high energy consumption and renovated buildingswith reduced energy consumption are the main stocks. The renovation flow increasesthe number of renovated buildings at a certain rate, which depends on awareness, netbenefits, and uncertainty costs. The net benefits are calculated as the financial benefit fromrenovation, i.e., saved energy costs minus investment costs. However, the renovation isslow even if the financial benefits are obvious. This is due to the barriers that discourageenergy efficiency measures; for example, agreement with neighbors, efforts to overcomeadministrative barriers, attract funding, etc. Uncertainty costs represent these barriers inmonetary terms. People are made aware of the importance of renovation in the recruitmentprocess (reinforcing loop R1). This process can be encouraged with information campaignssuch as for non-renovated buildings where uninformed people live and successfully reno-vated buildings govern. The latter gives rise to a word-of-mouth effect. When people are“recruited for renovation”, this increases potential projects and further increases demand.Increased demand leads to increased capacity, stimulating the conversion of buildingsfrom non-renovated to renovated and further recruitment for renovation. The potentialprojects create demand and have an impact on perceived net benefits. The more renovatedbuildings, the higher the net benefits due to increased energy savings from the renovationprocess (reinforcing loop R2) and renovation costs (reinforcing loop R3). The costs arelowered due to the economies of scale, accumulation of experience, and the entrance of newcompanies into the market if other factors remain the same. A distortion of market forces,

Energies 2021, 14, 7792 8 of 31
e.g., high entry barriers for new suppliers, may increase renovation costs. The model alsoconsiders the time required for construction services and materials suppliers to build upcapacity, and spiking demand increases costs in the short term due to lack of supply. If therenovation costs are high due to external factors, market distortion, or insufficient supply,the net benefits decrease, and thus the rate of renovation decreases. When the renovationcosts decrease, demand for renovation projects increases, reducing renovation costs further.Since the time between the event and the moment when it is perceived is often relativelylong, an information delay is included in the link between the actual and the perceivednet benefits. This delay can last for many years. Some people can completely ignore thisinformation, and therefore the renovation process might progress very slowly. Demand forenergy efficiency projects determines the supply of ESCOs and construction companies.Their capacity limits the supply of construction companies, and demand for their servicesdepends on what is known about them, the net benefits, and uncertainty costs. The supplyof ESCOs depends on company capacity, profitability, and available financing, but demandis related to the construction companies’ market share.
The introduction of a CO2 tax, the funding of research and development, the strength-ening of standards, subsidies, and EU funding can increase net benefits (reinforcing loopR2). Balancing loop B1 shows the impact of the success of renovated projects. Informationabout unsuccessful and successful projects is received in the market by non-renovatedbuildings. This information impacts the value of the uncertainty costs; the more unsuc-cessful projects, the higher the uncertainty costs. The success rate of projects is perceivedwith a delay. The uncertainty costs decrease with the increased number of renovatedbuildings (reinforcing loop R4), which is perceived with a delay. The uncertainty costscan be reduced by the “champion effect” (a trustworthy apartment owner in a buildingwho can lead the renovation project), introducing a “one-stop-shop” and the availability ofthe standard procurement documentation. Information on unsuccessful projects ends upwith quality control bodies, which in turn act to improve the operations of constructioncompanies, thereby indirectly increasing the net benefits and reducing the uncertaintycosts. Reinforcing loop R6 illustrates that the supply of ESCOs is reinforced by profit,which depends on the energy savings achieved by the ESCO and the renovation costs.Growth generated by the R6 loop is balanced by loops B4 (the available financing), B5(renovation costs), B6 (the depletion of the project source), and loop R5 (the market share ofthe construction companies). The ESCO reinvestment fund managed by the public agencycan increase available financing. Demand for the services of construction companies isdriven by reinforcing loops R1 to R4 that are balanced by three negative feedback loops,B1, B2, and B3. The B1 loop kicks in early because capacity grows at a very high rate.The number of inexperienced companies grows fast following the growth rate of demand,thus leading to an increasing number of unsuccessful projects. The fraction of successfulprojects of ESCOs is related to the learning effect on the completed projects. In the caseof construction companies, the success fraction also depends on the ratio between theexperienced and inexperienced companies. The reinforcing process of an awareness-raisingcampaign is balanced out by the B2 loop created by the impact of the unsuccessful projectsgenerated by inexperienced companies. The B3 loop balances the diffusion process bydepleting the stock of potential projects. Construction capacity adapts to demand with adelay, and a notable gap occurs between demand and supply; this has an impact on therenovation costs. As a result, a negative feedback loop weakens the demand.
2.1.3. Supplementary Sub-Model
In the original model, the decision of apartment owners was expressed with a singleparameter named “uncertainty costs”. The higher the value, the higher the barriers toenergy efficiency actions. Our study replaced this parameter with the stock and flowstructure built on the attitude–behavior–context model [47]:

Energies 2021, 14, 7792 9 of 31
1. A group model building session for experts was carried out.2. A survey was developed and carried out to establish motivations, attitudes and
values, contextual or situational factors, social influences, personal capabilities, andhabits that can describe and predict energy-efficient behavior.
3. A stock and flow structure was built.
Group Model Building Session
The system dynamics modeling process can take place in two ways—modelingprojects and group model building. In modeling projects, one or more modelers de-velop the model by themselves and obtain the knowledge and necessary data from varioussources, often from experts in the modeled system. In the second type of approach, systemexperts are not the only source of information because the process involves both experts insystem dynamics and stakeholders whose knowledge of the system is essential for modeldevelopment. This approach increases the relevance and usefulness of the model [49].In addition, group model building sessions help develop a comprehensive understandingof the system’s scope and guide the actions taken while providing benefits at the individ-ual and collective levels. At the individual level, it improves the mental patterns of theparticipants. At the collective level, it makes it possible to harmonize mental models, reacha consensus on decisions, and involve the group in those decisions. [50].
Two group model building sessions were carried out with experts to elicit knowledgefrom the stakeholders and experts. The first session with ten energy efficiency expertswas held on 20 March 2019 to list the barriers to implementing energy efficiency measuresand the policy instruments to overcome these identified barriers. This working groupaimed to prepare for the second model building working group, and experts were asked tofreely name barriers to energy efficiency without prior preparation. On 3 April 2019, thesecond group model building session took place. Twelve participants were asked to definea dynamic problem in the housing energy efficiency sector, identify factors affecting thissystem, and define causal relationships, feedback links, and delays.
Survey
A survey was carried out to establish the statistical relationship between differentfactors and the readiness to invest in energy efficiency in multi-family buildings. In orderto be representative, the survey was conducted as part of an omnibus survey of all Latvianinhabitants. One thousand and fourteen respondents were interviewed by the pollsterSKDS in February 2020. Only respondents’ responses from the target group (people whoor whose family members own an apartment in a non-renovated pre-1991 multi-familybuilding) were collected. The other respondents were not interviewed further, e.g., peoplewho lived in single-family homes or apartment buildings built after 1991 that are muchmore energy-efficient or people who rented their flats, presuming that they would havemuch less interest in energy efficiency or renovation of their homes. Finally, 379 targetgroup respondents were interviewed in more depth.
The survey included a wide range of factors that could affect the readiness of individ-uals to engage in improving the energy efficiency of their homes. The main goal was toidentify factors that could significantly impact a person’s readiness to improve the energyefficiency of his/her property. The first group included demographic factors such as age,sex, profession, or education. The second group focused on economic factors such asincome level and willingness to pay for the renovation expressed as a possible increasein the currently paid energy bills by a certain sum dependent on the apartment size. Thethird group included attitudinal and value factors, as well as factors of social capital. Theseincluded questions on whether the respondent was satisfied with the housing maintenanceservices (since the housing maintenance company is often assigned to be responsible for or-ganizing the renovation works); whether the person considered his/her flat as a long-terminvestment; and his/her awareness of climate change. An important issue here was theability of owners to co-operate among themselves because, due to the fragmented house

Energies 2021, 14, 7792 10 of 31
ownership structures, its absence is often an obstacle to renovation. The survey also askedquestions about the trust among flat owners of the respondent’s house, the assessment ofthe readiness of others to participate in the renovation, the presence or absence of a natural“champion”, i.e., a person with leadership qualities among the flat owners who might beendowed with organizational responsibilities.
The obtained data were analyzed with linear regression analysis. Different demo-graphic indicators (sex, income, regional affiliation), different scales (Likert scale, monetaryvalues), and ranges were used; the beta coefficients for each particular question werecalculated. The question on owners’ readiness to support the initiative of implementing en-ergy efficiency measures (in the interviews, this was termed as “insulation”, which meansa reduction in heat transfer through the building envelope) of the apartment buildingexpressed as an agreement with the statement “I am ready to support the initiative of myneighbours, not to initiate it myself” was used as a dependent variable. On the scale from1 to 10, with 1 meaning “totally agree” and 10 meaning “totally disagree”, the values weredistributed relatively evenly (see Figure 6). This means that, on average, there was stillno consensus among Latvia’s inhabitants on whether it was worth participating in theinsulation of their homes.
Energies 2021, 14, 7792 10 of 32
fragmented house ownership structures, its absence is often an obstacle to renovation. The survey also asked questions about the trust among flat owners of the respondent’s house, the assessment of the readiness of others to participate in the renovation, the presence or absence of a natural “champion”, i.e., a person with leadership qualities among the flat owners who might be endowed with organizational responsibilities.
The obtained data were analyzed with linear regression analysis. Different demo-graphic indicators (sex, income, regional affiliation), different scales (Likert scale, mone-tary values), and ranges were used; the beta coefficients for each particular question were calculated. The question on owners’ readiness to support the initiative of implementing energy efficiency measures (in the interviews, this was termed as “insulation”, which means a reduction in heat transfer through the building envelope) of the apartment build-ing expressed as an agreement with the statement “I am ready to support the initiative of my neighbours, not to initiate it myself” was used as a dependent variable. On the scale from 1 to 10, with 1 meaning “totally agree” and 10 meaning “totally disagree”, the values were distributed relatively evenly (see Figure 6). This means that, on average, there was still no consensus among Latvia’s inhabitants on whether it was worth participating in the insulation of their homes.
Figure 6. Survey responses on whether it is worth participating in the insulation of respondents’ homes (“I am ready to support the initiative of my neighbours, not to initiate it myself”).
After performing linear regressions of this question to other factors, beta coefficients were calculated. This was performed by evaluating, one-by-one, the influence of different factors on the dependent variable. These regressions show to what extent the readiness to participate in home insulation increases with a change in a particular value—in this case, demographic indicators, the willingness to pay, values and attitudes, and social capital. According to the regression results, the highest and statistically most significant beta co-efficients were associated with the factors presented in Table 1.
Table 1. Results of regression analysis.
Factor Question, Text, or Statement Beta
Coefficient
1 The insulation of the building where my apartment is located would be useful to prevent the heat loss 0.294596
2 In general, people benefit when their houses are insulated 0.289907 3 The profession of the respondent: specialist, civil servant 0.28926
4 The housing management company of my building supports the insulation
0.27466
0
2
4
6
8
10
12
14
16
1 (totallyagree)
2 3 4 5 6 7 8 9 10 (totallydisagree)
N/A
Shar
e of
res
pons
es, %
Figure 6. Survey responses on whether it is worth participating in the insulation of respondents’homes (“I am ready to support the initiative of my neighbours, not to initiate it myself”).
After performing linear regressions of this question to other factors, beta coefficientswere calculated. This was performed by evaluating, one-by-one, the influence of differentfactors on the dependent variable. These regressions show to what extent the readinessto participate in home insulation increases with a change in a particular value—in thiscase, demographic indicators, the willingness to pay, values and attitudes, and socialcapital. According to the regression results, the highest and statistically most significantbeta coefficients were associated with the factors presented in Table 1.
The factors with the highest beta coefficients were divided into four groups. First,there was a group of factors (1, 2, and 5) that indicated the respondents’ awareness of thebenefits of insulation, its necessity from the point of view of energy efficiency, the fact thatpeople can benefit from it, as well as how it is a reasonable investment in the long term.These factors suggest a positive cognitive attitude towards house insulation and awarenessof its benefits.
The second group of factors (4, 8) dealt with the relationship with the housing man-agement company, which, at least in the Latvian context, is often seen as an institution “inauthority” and responsible for all improvements in the house. If the housing managementcompany supports the insulation project, the respondent is more inclined to support it.This means that strengthening the role of the housing management company could alsoimprove the insulation rates. According to Question 8, the willingness to delegate the

Energies 2021, 14, 7792 11 of 31
management of insulation works to the housing management company was positivelyrelated to the willingness to support it.
Table 1. Results of regression analysis.
Factor Question, Text, or Statement Beta Coefficient
1 The insulation of the building where my apartment is locatedwould be useful to prevent the heat loss 0.294596
2 In general, people benefit when their houses are insulated 0.289907
3 The profession of the respondent: specialist, civil servant 0.28926
4 The housing management company of my building supportsthe insulation 0.27466
5 I expect that I will be able to live in my home long-term or sell itfor a reasonable price, so I am ready to invest in it 0.219648
6Among the inhabitants of my house, there is a trusted“champion” who could manage the insulation works
(e.g., to take care of the paperwork, etc.)0.218237
7 The majority of inhabitants of my building support the insulation 0.198879
8 The insulation must be organized by the housing managementcompany of the building and paid for by the inhabitants 0.175085
9 I think that the apartment owners in my house would be capableof agreeing on a project such as insulation 0.17447
10How much would you agree to pay per month during one year ifsomebody agreed to take over the responsibility for organizing
the insulation? (average)0.1740372
11How much would you agree to pay per month during one year ifsomebody agreed to take over the responsibility for organizing
the insulation? (maximum)0.1732232
12 How much would you agree to pay per month along with yourhouse caretaker bill? (maximum) 0.1645948
13 How much would you agree to pay per month along with yourhousing management company bill? (maximum) 0.1633131
The third group of factors (6, 7, and 9) related to “horizontal” factors of interpersonalrelations among flat owners: social capital, peer pressure, and mutual trust. As indicatedin previous research [44], a natural “champion” among the inhabitants strongly motivatesthe insulation support. If the majority opinion supports insulation, the respondent is morelikely to support it, and the confidence in the capacity to act together is a significant factor.
The fourth group of factors (10, 11, 12, 13) was related to the willingness to pay for thebuilding’s insulation and organizational expenses.
System Dynamics Model
In the previously developed model, apartment owners’ decision making was basedon taking energy efficiency measures on net benefits and inconvenience costs. In our study,a decision-making module replaced the costs of inconvenience. This module models theimpact of various factors influencing the decision-making process unrelated to costs inmore detail. The module’s structure was based on the survey and the results of the groupmodel building sessions. Figure 7 illustrates the generic stock and flow structure of thissub-module. The structure was filled in with the factors obtained from the survey.

Energies 2021, 14, 7792 12 of 31Energies 2021, 14, 7792 12 of 32
Figure 7. Generic stock and flow structure for decision making in multi-family building sector sub-module.
The actual value of any factor is the value of each factor that is currently in the real system; it can be determined by either experts or surveys. The reference value of any factor is the value at which the probability of investing in energy efficiency is 1. It takes time to perceive information, and this is presented in the model as the time to perceive changes in a factor. The perceived relative value of a factor is calculated as delay function to expo-nentially smoothen the input over an averaging time (SMTH function): PR = SMTH( 𝐹𝑅𝐹 ; tperc) (1)
where PR—perceived relative value of a factor; F—actual value of a factor; RF—reference value of a factor; tperc—time to perceive changes in a factor (years). The effect of perceived relative change in a factor on the indicated probability of in-
vesting in energy efficiency is nonlinear. It can have different shapes depending on the relationship found in the real system (see Figure 8). Figure 8 illustrates the effect of the indicated probability of investing in energy efficiency on (a) additional payment for en-ergy efficiency measures added to the monthly housing management fee, (b) other factors.
Figure 7. Generic stock and flow structure for decision making in multi-family building sectorsub-module.
The actual value of any factor is the value of each factor that is currently in the realsystem; it can be determined by either experts or surveys. The reference value of anyfactor is the value at which the probability of investing in energy efficiency is 1. It takestime to perceive information, and this is presented in the model as the time to perceivechanges in a factor. The perceived relative value of a factor is calculated as delay functionto exponentially smoothen the input over an averaging time (SMTH function):
PR = SMTH(
FRF
; tperc
)(1)
wherePR—perceived relative value of a factor;F—actual value of a factor;RF—reference value of a factor;tperc—time to perceive changes in a factor (years).
The effect of perceived relative change in a factor on the indicated probability ofinvesting in energy efficiency is nonlinear. It can have different shapes depending on therelationship found in the real system (see Figure 8). Figure 8 illustrates the effect of theindicated probability of investing in energy efficiency on (a) additional payment for energyefficiency measures added to the monthly housing management fee, (b) other factors.

Energies 2021, 14, 7792 13 of 31Energies 2021, 14, 7792 13 of 32
(a) (b)
Figure 8. Effect of perceived relative change in a factor (the values on x-axis) on the indicated prob-ability of investing in energy efficiency (the values on y-axis): (a) additional payment for energy efficiency measures added to the monthly housing management fee, (b) other factors. The graphs were taken as print-screens from STELLA ARCHITECT to present an approach for how the effects of relative changes in the factors are represented as changes in the probabilities to invest in energy efficiency.
The shapes of the effects (see Figure 8) are assumptions regarding what a response to the factors or actual behavior could be. To our knowledge, there are no data available for a more detailed quantitative characterization of the shapes, and this remains as future work to be performed. The indicated probability of investing depends on the effect of perceived relative change in a factor on the indicated probability and the base value of a factor. Base value (from 0 to 1) shows the probability that an investment will be made in energy efficiency measures even if the relative change perceived by the factor is minimal, i.e., there will always be individuals who will take action, even if the probability is very low. Indicated probability to invest is calculated as: IP = E × BV, (2)
where
IP—indicated probability to invest in energy efficiency measures; E—effect of perceived relative change in a factor on the indicated probability of in-
vesting in energy efficiency; BV—the base value of a factor. An increase in probability to invest is an inflow and is determined as: InP = if IP P then IP − Pt else 0 (3)
where InP—increase in probability to invest in energy efficiency measures; t—time to increase probability (years); IP—indicated probability to invest in energy efficiency measures; P—the probability of investing from a factor. A decrease in probability to invest in energy efficiency measures is determined as:
DeP = if IP P then IP − Pt else 0 (4)
where DeP—decrease in probability to invest in energy efficiency measures; t—time to decrease probability (years); IP—indicated probability to invest in energy efficiency measures; P—probability to invest from a factor.
Figure 8. Effect of perceived relative change in a factor (the values on x-axis) on the indicatedprobability of investing in energy efficiency (the values on y-axis): (a) additional payment forenergy efficiency measures added to the monthly housing management fee, (b) other factors. Thegraphs were taken as print-screens from STELLA ARCHITECT to present an approach for how theeffects of relative changes in the factors are represented as changes in the probabilities to invest inenergy efficiency.
The shapes of the effects (see Figure 8) are assumptions regarding what a responseto the factors or actual behavior could be. To our knowledge, there are no data availablefor a more detailed quantitative characterization of the shapes, and this remains as futurework to be performed. The indicated probability of investing depends on the effect ofperceived relative change in a factor on the indicated probability and the base value of afactor. Base value (from 0 to 1) shows the probability that an investment will be made inenergy efficiency measures even if the relative change perceived by the factor is minimal,i.e., there will always be individuals who will take action, even if the probability is verylow. Indicated probability to invest is calculated as:
IP = E × BV, (2)
whereIP—indicated probability to invest in energy efficiency measures;E—effect of perceived relative change in a factor on the indicated probability of
investing in energy efficiency;BV—the base value of a factor.An increase in probability to invest is an inflow and is determined as:
InP = if IP > P thenIP − P
telse 0 (3)
whereInP—increase in probability to invest in energy efficiency measures;t—time to increase probability (years);IP—indicated probability to invest in energy efficiency measures;P—the probability of investing from a factor.A decrease in probability to invest in energy efficiency measures is determined as:
DeP = if IP < P thenIP − P
telse 0 (4)
whereDeP—decrease in probability to invest in energy efficiency measures;t—time to decrease probability (years);IP—indicated probability to invest in energy efficiency measures;P—probability to invest from a factor.

Energies 2021, 14, 7792 14 of 31
The probability of investing from a factor is the calculated accumulation at everytime step (t) determined by the initial value of the stock at a time (to) and the inflow ofan increase in probability and the outflow of a decrease in probability. For example, if thevalue of a factor remains constant over time (e.g., housing maintenance company supportdoes not change and remains as low as at the beginning of the simulation), the probabilityof investing also does not change and increases as soon as the inflow kicks in:
P =∫ t
t0
InP(t)dt − DeP(t)dt + P(t0) (5)
Total probability (Ptot) of investment is a multiplication of all probabilities fromdifferent factors:
Ptot = P1 × P2 × . . . × Pn (6)
The generic stock and flow structure module was applied to all factors determinedduring the survey, including seeing long-term benefits, support from the housing man-agement company, the presence of “a champion” in the house, positive attitudes towardsenergy efficiency, knowing someone who lives in a renovated building, additional paymentfor energy efficiency to the monthly housing maintenance fee, assurance of benefits, andtrust in neighbors.
The structure of the previously built system dynamics model calculated the additionalpayment for energy efficiency to the monthly housing maintenance fee where supply anddemand determine costs of energy efficiency measures. The reference value for this factorchanged in the range from 0 to 2 EUR/m2/year. For other factors, the reference valuechanged from 1 to 10. The actual values of other factors were determined by experts duringgroup model building sessions or from the survey, except for the actual value of the factor“knowing someone who lives in renovated building”, which was determined by a feedbacklink from the share of renovated buildings from the previously built model structure. Thetime to perceive and change probability was three years.
2.2. Validation of the Model
System dynamics models are causal-descriptive or theory-like models (“white-box”)for which causality in a structure matters. These differ from correlational or data-drivenmodels (“black-box”), for which an aggregate output behavior of the model matters. Forthe white-box model, the validity of the internal structure of the model is crucial, whileaccurate output behavior is not sufficient for the validity. Furthermore, the validation ofthe structure of a system is the central issue if causes of behavior have to be explained andchanges in behavior are needed. The main goal of validation is to build confidence that themodel can generate the “right output behavior for the right reasons” [51]. Validation testsare based on comparing models with empirical reality [43].
First, structural and behavior tests were carried out to validate the model accordingto [51]. After that, the new sub-model of decision making was validated by an expertgroup model building session with 15 participants performed online on 7 December 2020.Participants were asked to provide feedback on the structure of the model (parameters,feedback links, delays, effect of perceived relative change in a factor on the indicatedprobability of investing in energy efficiency (Figure 8)). Participants were asked to runsimulation rounds of the model interface available on the Internet and created for the needsof the group model building session, and provide feedback on the system’s behavior andhow it coincides with their perception of the real system. Then, participants were askedto provide feedback on whether the structure of the model corresponded to reality and ifbehavior corresponded to reality, whether all energy efficiency barriers were addressed bythe model, whether feedback corresponded to reality, the time needed to perceive changesin any factor, and the time delay between perceiving information about changes in factorsand real action. The experts were positive about the model’s structure and behavior and

Energies 2021, 14, 7792 15 of 31
confirmed that it performed as they expected. Finally, all comments provided by theexperts were carefully analyzed in order to make improvements to the model.
Finally, validation of the model was performed with the historic data for a cumula-tive number of renovated multi-family buildings [42] compared with simulation results.Figure 9 shows that the model generated similar behavior to real observed behavior.
Energies 2021, 14, 7792 15 of 32
in factors and real action. The experts were positive about the model’s structure and be-havior and confirmed that it performed as they expected. Finally, all comments provided by the experts were carefully analyzed in order to make improvements to the model.
Finally, validation of the model was performed with the historic data for a cumula-tive number of renovated multi-family buildings [42] compared with simulation results. Figure 9 shows that the model generated similar behavior to real observed behavior.
The national goal set for 2008–2020 (see Figure 9) regarding the cumulative number of renovation projects was 1830 buildings. By the end of 2020, 51% of the national goal was reached. However, due to a delay in the project finishing, additional projects are be-ing implemented between 2020 and 2023, thus reaching 71% of the goal. The cause of the difference observed between cumulative savings (Figure 1) and the cumulative number of projects (Figure 9) may have been caused by overestimating savings per building when the policy was planned.
Figure 9. Validation of simulation results with actual data for cumulative number of energy effi-ciency projects in multi-family buildings and national energy efficiency goal for the multi-family building sector.
2.3. Policy Interventions The government only applied two policy interventions between 2008 and 2020: the
co-financing from EU funds and the information distribution through a grassroots ap-proach. Both policy tools were included in the original system dynamics model structure. A stock of EU funding increases with an inflow from EU funds and decreases with the number of financed projects. Information measures change the flow between uninformed building owners and informed building owners, and further reduce uncertainty costs. The original model included other policy tools (described in the section, Previously Developed System Dynamics Model).
In this study, policy tools were adjusted to the new structure. Changes in the values of factors increase the probability of investments in energy efficiency measures: well-tar-geted information measures increase the value of seeing long-term benefits, assurance of benefits, support from the housing management company, and trust in neighbors. A sup-port program for “the champions” increases the presence of “a champion” in the house. Financial support reduces the additional payment for energy efficiency to the monthly housing maintenance fee. Feedback from the stock of insulated buildings increases the value of the factor “knowing someone who lives in a renovated building,” and feedback
0
200
400
600
800
1000
1200
1400
1600
1800
2000
2008 2009 2010 2011 2012 2013 2014 2015 2016 2017 2018 2019 2020
Ren
ovat
ed b
uild
ings
Simulated Actual Goal
Figure 9. Validation of simulation results with actual data for cumulative number of energy effi-ciency projects in multi-family buildings and national energy efficiency goal for the multi-familybuilding sector.
The national goal set for 2008–2020 (see Figure 9) regarding the cumulative numberof renovation projects was 1830 buildings. By the end of 2020, 51% of the national goalwas reached. However, due to a delay in the project finishing, additional projects are beingimplemented between 2020 and 2023, thus reaching 71% of the goal. The cause of thedifference observed between cumulative savings (Figure 1) and the cumulative number ofprojects (Figure 9) may have been caused by overestimating savings per building when thepolicy was planned.
2.3. Policy Interventions
The government only applied two policy interventions between 2008 and 2020: the co-financing from EU funds and the information distribution through a grassroots approach.Both policy tools were included in the original system dynamics model structure. A stockof EU funding increases with an inflow from EU funds and decreases with the number offinanced projects. Information measures change the flow between uninformed buildingowners and informed building owners, and further reduce uncertainty costs. The originalmodel included other policy tools (described in the section, Previously Developed SystemDynamics Model).
In this study, policy tools were adjusted to the new structure. Changes in the valuesof factors increase the probability of investments in energy efficiency measures: well-targeted information measures increase the value of seeing long-term benefits, assuranceof benefits, support from the housing management company, and trust in neighbors.A support program for “the champions” increases the presence of “a champion” in thehouse. Financial support reduces the additional payment for energy efficiency to themonthly housing maintenance fee. Feedback from the stock of insulated buildings increasesthe value of the factor “knowing someone who lives in a renovated building,” and feedback

Energies 2021, 14, 7792 16 of 31
from the share of successful insulated buildings increases the value of the factor “positiveattitudes towards energy efficiency”.
Two new policy tools were added to the structure. First, a reinvestment fund forenergy service companies was added to support the diffusion of this business sector inmulti-family building energy efficiency projects. The stock of reinvestment funding wasincreased from the ESCO savings and spent on energy efficiency projects. Second, a penalty–reward scheme supplemented the currently used EU funding scheme. A penalty–rewardscheme as a sustainable support scheme was added to reduce the negative impact ofoscillating EU funding schemes. It was based on real estate tax and the ratio of the actualenergy consumption of a building to the value based on the current building standards(see Figure 10). The applicable real estate tax rate was estimated using willingness to payvalues obtained by the housing management companies. Apartment owners were ready topay more for energy efficiency projects on average up to 1 EUR/m2/month. The first yeartax is lower and increases every year. If the ratio between the current building standardsand the actual energy consumption is one, then the tax rate is zero and increases as theratio falls below one. The apartment owners can decide whether to pay more significanttaxes or implement an energy efficiency project.
Energies 2021, 14, 7792 16 of 32
from the share of successful insulated buildings increases the value of the factor “positive attitudes towards energy efficiency”.
Two new policy tools were added to the structure. First, a reinvestment fund for en-ergy service companies was added to support the diffusion of this business sector in multi-family building energy efficiency projects. The stock of reinvestment funding was in-creased from the ESCO savings and spent on energy efficiency projects. Second, a penalty–reward scheme supplemented the currently used EU funding scheme. A penalty–reward scheme as a sustainable support scheme was added to reduce the negative impact of os-cillating EU funding schemes. It was based on real estate tax and the ratio of the actual energy consumption of a building to the value based on the current building standards (see Figure 10). The applicable real estate tax rate was estimated using willingness to pay values obtained by the housing management companies. Apartment owners were ready to pay more for energy efficiency projects on average up to 1 EUR/m2/month. The first year tax is lower and increases every year. If the ratio between the current building stand-ards and the actual energy consumption is one, then the tax rate is zero and increases as the ratio falls below one. The apartment owners can decide whether to pay more signifi-cant taxes or implement an energy efficiency project.
Figure 10. Penalty–reward scheme based on real estate tax and ratio of the actual energy consumption of building to the value based on the current building standards.
2.4. Interface for Policy Makers After validation, a user-friendly, Internet-based interface for policymakers and any
other interested stakeholders was developed. The model stock and flow structure and the interface were solely developed and created by the research team of this study with Stella Architect software. This software enables the creation and web-based deployment of sys-tem dynamics model interfaces. The interface development process differs from the stock and flow structure development process as it emphasizes packaging rather than develop-ing model-based insights. On the other hand, there is an overlap with many of the same components, such as graphs and tables, shared between model and interface develop-ment. Our study developed an interface for the final version of the model, including an animated data visualization. The interface provides three layers to carry out an analysis of the system. All layers include different policy tools that can be applied to change the system’s behavior illustrated in graphs on the right-hand side of the page. The first layer, illustrated in Figure 11, provides eight groups of policy tools, including EU funding, a penalty–reward scheme, ESCO, information, support to “champions”, and support to the
0.00
0.50
1.00
1.50
2.00
2.50
0.00 0.20 0.40 0.60 0.80 1.00 1.20
Rea
l est
ate
tax,
EU
R/m
2/ye
ar
Energy consumption set by the building code vs actual energy consumption
1st year tax rate, EUR/m2year 3rd year tax rate, EUR/m2year 10th year tax rate, EUR/m2year
Figure 10. Penalty–reward scheme based on real estate tax and ratio of the actual energy consumption of building to thevalue based on the current building standards.
2.4. Interface for Policy Makers
After validation, a user-friendly, Internet-based interface for policymakers and anyother interested stakeholders was developed. The model stock and flow structure andthe interface were solely developed and created by the research team of this study withStella Architect software. This software enables the creation and web-based deploymentof system dynamics model interfaces. The interface development process differs fromthe stock and flow structure development process as it emphasizes packaging rather thandeveloping model-based insights. On the other hand, there is an overlap with many ofthe same components, such as graphs and tables, shared between model and interfacedevelopment. Our study developed an interface for the final version of the model, includingan animated data visualization. The interface provides three layers to carry out an analysisof the system. All layers include different policy tools that can be applied to change thesystem’s behavior illustrated in graphs on the right-hand side of the page. The first layer,illustrated in Figure 11, provides eight groups of policy tools, including EU funding, apenalty–reward scheme, ESCO, information, support to “champions”, and support to theresearch, development, and improvement in energy efficiency standards. Each policy toolhas several parameters that can be adjusted to reach the national cumulative savings goal

Energies 2021, 14, 7792 17 of 31
displayed in the graph. The second graph shows the annual and cumulative costs of anycombination of the policy tools.
Energies 2021, 14, 7792 17 of 32
research, development, and improvement in energy efficiency standards. Each policy tool has several parameters that can be adjusted to reach the national cumulative savings goal displayed in the graph. The second graph shows the annual and cumulative costs of any combination of the policy tools.
Figure 11. The first layer of Internet-based model interface for selection of policy tools.
The second page of the model interface (see Figure 12) provides more details on the supply and demand of construction companies and their impact on the total diffusion process of energy efficiency measures in the multi-family building sector. The user can apply different start time and periods of funding and see their impact on the system’s behavior.
Figure 11. The first layer of Internet-based model interface for selection of policy tools.
The second page of the model interface (see Figure 12) provides more details on thesupply and demand of construction companies and their impact on the total diffusion pro-cess of energy efficiency measures in the multi-family building sector. The user can applydifferent start time and periods of funding and see their impact on the system’s behavior.
Energies 2021, 14, 7792 18 of 32
Figure 12. Interface for more in-depth policy analysis of supply and demand of construction companies.
Figure 13 illustrates the third layer of the model interface that provides insights into apartment owner decision-making dynamics. First, the user can set the start values of all the factors influencing decision making. Then, the user can apply different policy tools and determine their impact on the values of these factors.
Figure 13. Interface for more in-depth analysis of apartment owner decision-making dynamics.
3. Results
Figure 12. Interface for more in-depth policy analysis of supply and demand of construction companies.

Energies 2021, 14, 7792 18 of 31
Figure 13 illustrates the third layer of the model interface that provides insights intoapartment owner decision-making dynamics. First, the user can set the start values of allthe factors influencing decision making. Then, the user can apply different policy tools anddetermine their impact on the values of these factors.
Energies 2021, 14, 7792 18 of 32
Figure 12. Interface for more in-depth policy analysis of supply and demand of construction companies.
Figure 13 illustrates the third layer of the model interface that provides insights into apartment owner decision-making dynamics. First, the user can set the start values of all the factors influencing decision making. Then, the user can apply different policy tools and determine their impact on the values of these factors.
Figure 13. Interface for more in-depth analysis of apartment owner decision-making dynamics.
3. Results
Figure 13. Interface for more in-depth analysis of apartment owner decision-making dynamics.
3. Results
The model was simulated to gain insights into the causes of system behavior forprevious policies (2008–2020) and provide analysis-based suggestions to improve thesepolicies for 2021–2030. The different aspects were analyzed using the model and comparedto the findings from the real system.
3.1. Model-Based Policy Analysis 2008–20203.1.1. Funding Discontinuity
The funding available from the EU was 86 million EUR during 2009–2013 and 156 mil-lion EUR during 2016–2020. It was used as 50% support towards to multi-family buildingenergy efficiency projects. The first funding period was finished at the end of 2013, and thesubsequent funding only started in 2016. Thus, no EU funds were available in 2014 or 2015.This oscillating funding caused undesired side effects, i.e., misbalance of demand andconstruction capacity consequently leading to changes in construction price and quality.The demand for energy efficiency projects increased at a higher rate than the capacity build-up of construction companies, leading to price increase and a reduction in quality. Thevolatility of available funding caused problems for the construction sector as such. Whenthe first funding period was over, demand fell to zero and the construction companies wereleft with high construction capacity and no demand. For the two years without funding,most construction companies lost their employees (they emigrated to other countries ormoved to other sectors). When the second funding period started in 2016, the market facedthe same problems as faced during the first funding period. However, it was even moremisbalanced as the government opened a funding program for public building energyefficiency projects at the same time. That program had much more attractive conditions forconstruction companies, so the multi-family buildings sector was left with a high demand,a low capacity of construction companies, increased prices, and low quality construction.

Energies 2021, 14, 7792 19 of 31
The data from funding agencies show that the average total renovation costs for the projectswere 35 EUR/m2 in 2010, 65 EUR/m2 for 2008–2013, and 170 EUR/m2 for 2018–2020. Theescalating price has made the payback time much longer and [42] thus less attractive tobuilding owners. A discussion of stakeholders arranged by the funding agency in 2017highlighted that the implementation costs of projects increased due to: (1) long-term down-turn in the availability of EU funds that has led to an avalanche-like process of applicationof projects; (2) reduction in construction quality; (3) increased costs of architects, which areexplained by increased requirements from the financing institution. [52].
Dependency on a single funding source is the central problem for the energy effi-ciency program. Although international financial institutions have offered various supporttowards energy efficiency, Latvia has not used them to the fullest extent. Internationalbanks support large-scale projects, and the government should foster the acquisition ofthese programs. Latvia has cooperated with the European Investment Bank (EIB); however,funds from the European Bank for Reconstruction and Development and the SustainableEnergy Initiative of Nordic Investment Bank remain untapped. Latvia needs to consider theuse of other financial instruments such as JESSICA, which has been used in Lithuanian [53].In addition, both government and apartment owners have gotten used to the familiar short-term solution of EU funding and have become addicted to this policy measure. As a result,they are not searching for other less comfortable and less familiar long-term solutions.Figure 14 shows the simulation results of the system dynamics model of supply, demand,and prices of construction works for multi-family buildings and public sectors when theexisting policy tools are in place. The simulation shows how demand increases after EUfunds are introduced in 2008, and the supply of the construction companies follows witha lower rate as the initial capacity is not sufficient and can only be built up with a delay.The price increases while demand is higher than supply and falls when supply takesover demand. The same behavior of this system can be seen during the second fundingperiod from 2016. The price increases at a higher rate when the government opens an EUfunding program for energy efficiency projects in public buildings in 2017. The real systemencountered multi-family buildings queuing for the construction companies and ready topay for overpriced services of low quality.
Energies 2021, 14, 7792 20 of 32
the second funding period from 2016. The price increases at a higher rate when the gov-ernment opens an EU funding program for energy efficiency projects in public buildings in 2017. The real system encountered multi-family buildings queuing for the construction companies and ready to pay for overpriced services of low quality.
Figure 14. Simulated supply, demand, and prices of construction works for multi-family buildings and the public sector with the existing policy tools in force.
To improve the system’s behavior, the supply, demand, and construction costs for multi-family buildings and public sectors with a combined penalty–reward scheme and EU funding were simulated. Figure 15 illustrates the results. The penalty–reward scheme provides sustainable funding, which evens out the oscillations caused by the waves of EU funding. The price increases during the beginning of the first funding period while con-struction companies build up their capacity, after that, the price evens out and stabilizes. The peak in 2017 is caused by a funding program for public building energy efficiency.
Figure 15. Simulated supply, demand, and construction costs of multi-family buildings and public sectors with combined penalty–reward scheme and EU funding.
Figure 14. Simulated supply, demand, and prices of construction works for multi-family buildings and the public sectorwith the existing policy tools in force.
To improve the system’s behavior, the supply, demand, and construction costs formulti-family buildings and public sectors with a combined penalty–reward scheme andEU funding were simulated. Figure 15 illustrates the results. The penalty–reward schemeprovides sustainable funding, which evens out the oscillations caused by the waves of

Energies 2021, 14, 7792 20 of 31
EU funding. The price increases during the beginning of the first funding period whileconstruction companies build up their capacity, after that, the price evens out and stabilizes.The peak in 2017 is caused by a funding program for public building energy efficiency.
Energies 2021, 14, 7792 20 of 32
the second funding period from 2016. The price increases at a higher rate when the gov-ernment opens an EU funding program for energy efficiency projects in public buildings in 2017. The real system encountered multi-family buildings queuing for the construction companies and ready to pay for overpriced services of low quality.
Figure 14. Simulated supply, demand, and prices of construction works for multi-family buildings and the public sector with the existing policy tools in force.
To improve the system’s behavior, the supply, demand, and construction costs for multi-family buildings and public sectors with a combined penalty–reward scheme and EU funding were simulated. Figure 15 illustrates the results. The penalty–reward scheme provides sustainable funding, which evens out the oscillations caused by the waves of EU funding. The price increases during the beginning of the first funding period while con-struction companies build up their capacity, after that, the price evens out and stabilizes. The peak in 2017 is caused by a funding program for public building energy efficiency.
Figure 15. Simulated supply, demand, and construction costs of multi-family buildings and public sectors with combined penalty–reward scheme and EU funding.
Figure 15. Simulated supply, demand, and construction costs of multi-family buildings and public sectors with combinedpenalty–reward scheme and EU funding.
3.1.2. Energy Service Companies
ESCOs are an alternative to construction companies and provide a long-term contractwith guaranteed energy savings. Actual data from the market on ESCO development ratescorrespond to the simulation results [54,55]. The number of ESCO projects increases until2016 (see Figure 16), and then reaches an equilibrium because the limit of ESCOs’ financialcapacity is reached and a lack of financial resources limits further growth.
Energies 2021, 14, 7792 21 of 32
3.1.2. Energy Service Companies ESCOs are an alternative to construction companies and provide a long-term contract
with guaranteed energy savings. Actual data from the market on ESCO development rates correspond to the simulation results [54,55]. The number of ESCO projects increases until 2016 (see Figure 16), and then reaches an equilibrium because the limit of ESCOs’ financial capacity is reached and a lack of financial resources limits further growth.
Figure 16. Simulated number of ESCO-renovated buildings with actual policy tools in place if no reinvestment fund is available.
To increase the ESCO project implementation rate, a reinvestment fund available for ESCOs is needed [55]. However, the Ministry of Economy has been reluctant to set this up so far. If a reinvestment fund was used, ESCOs’ capacity, expressed as the number of ren-ovated buildings, would continue to increase beyond 2016 (see Figure 17).
Figure 17. Simulated number of ESCO-renovated buildings with actual policy tools in place and with and without reinvestment fund.
3.1.3. Delays and Construction Quality Actual data on the implementation of energy efficiency projects show (see Figure 4)
that there are delays between the submission, approval, contract signing, and finishing of a project. The experts involved in energy efficiency projects in multi-family buildings dis-cussed delays and concluded that the implementation time of projects increased mainly due to bureaucratic barriers and the low quality of project management [52]. Simulation
Figure 16. Simulated number of ESCO-renovated buildings with actual policy tools in place if no reinvestment fundis available.
To increase the ESCO project implementation rate, a reinvestment fund available forESCOs is needed [55]. However, the Ministry of Economy has been reluctant to set thisup so far. If a reinvestment fund was used, ESCOs’ capacity, expressed as the number ofrenovated buildings, would continue to increase beyond 2016 (see Figure 17).

Energies 2021, 14, 7792 21 of 31
Energies 2021, 14, 7792 21 of 32
3.1.2. Energy Service Companies ESCOs are an alternative to construction companies and provide a long-term contract
with guaranteed energy savings. Actual data from the market on ESCO development rates correspond to the simulation results [54,55]. The number of ESCO projects increases until 2016 (see Figure 16), and then reaches an equilibrium because the limit of ESCOs’ financial capacity is reached and a lack of financial resources limits further growth.
Figure 16. Simulated number of ESCO-renovated buildings with actual policy tools in place if no reinvestment fund is available.
To increase the ESCO project implementation rate, a reinvestment fund available for ESCOs is needed [55]. However, the Ministry of Economy has been reluctant to set this up so far. If a reinvestment fund was used, ESCOs’ capacity, expressed as the number of ren-ovated buildings, would continue to increase beyond 2016 (see Figure 17).
Figure 17. Simulated number of ESCO-renovated buildings with actual policy tools in place and with and without reinvestment fund.
3.1.3. Delays and Construction Quality Actual data on the implementation of energy efficiency projects show (see Figure 4)
that there are delays between the submission, approval, contract signing, and finishing of a project. The experts involved in energy efficiency projects in multi-family buildings dis-cussed delays and concluded that the implementation time of projects increased mainly due to bureaucratic barriers and the low quality of project management [52]. Simulation
Figure 17. Simulated number of ESCO-renovated buildings with actual policy tools in place andwith and without reinvestment fund.
3.1.3. Delays and Construction Quality
Actual data on the implementation of energy efficiency projects show (see Figure 4)that there are delays between the submission, approval, contract signing, and finishingof a project. The experts involved in energy efficiency projects in multi-family buildingsdiscussed delays and concluded that the implementation time of projects increased mainlydue to bureaucratic barriers and the low quality of project management [52]. Simulationresults in Figure 18 illustrate similar delays in the system if existing policy tools are applied.
Energies 2021, 14, 7792 22 of 32
results in Figure 18 illustrate similar delays in the system if existing policy tools are ap-plied.
Figure 18. Simulated number of renovated buildings when actual policy tools are applied.
If a penalty–reward scheme and EU funding are used in combination, the same de-lays are observed, but the total accumulated number of projects would be much higher in 2020 (see Figure 19).
Figure 19. Simulated number of renovated multi-family buildings with combined penalty–reward scheme and EU fund-ing.
The instability of EU funding has a significant impact on the demand and supply of construction capacity. The Ministry of Economics has defined the low quality of construc-tion works as a problem. It has suggested that the selection of the constructor companies should be based on criteria of social responsibility, values, and reputation, instead of price offers [56]. Around 20% of public building renovation projects financed by Climate Change Financial Instrument have not reached expected savings, the main reasons being the low quality of energy audits (25%), technical specifications (20%), construction works (20%), and operation of buildings (35%) [57]. Building up capacity takes time, and this impacts the quality of construction works because quality is lower for inexperienced com-panies than for experienced companies (see Figure 20). This impacts the fraction of suc-cessfully completed projects, and it takes time for an apartment owner to perceive this fraction, which in turn has an impact on demand.
Figure 18. Simulated number of renovated buildings when actual policy tools are applied.
If a penalty–reward scheme and EU funding are used in combination, the same delaysare observed, but the total accumulated number of projects would be much higher in 2020(see Figure 19).
The instability of EU funding has a significant impact on the demand and supply ofconstruction capacity. The Ministry of Economics has defined the low quality of construc-tion works as a problem. It has suggested that the selection of the constructor companiesshould be based on criteria of social responsibility, values, and reputation, instead of priceoffers [56]. Around 20% of public building renovation projects financed by Climate ChangeFinancial Instrument have not reached expected savings, the main reasons being the lowquality of energy audits (25%), technical specifications (20%), construction works (20%),and operation of buildings (35%) [57]. Building up capacity takes time, and this impactsthe quality of construction works because quality is lower for inexperienced companiesthan for experienced companies (see Figure 20). This impacts the fraction of successfully

Energies 2021, 14, 7792 22 of 31
completed projects, and it takes time for an apartment owner to perceive this fraction,which in turn has an impact on demand.
Energies 2021, 14, 7792 22 of 32
results in Figure 18 illustrate similar delays in the system if existing policy tools are ap-plied.
Figure 18. Simulated number of renovated buildings when actual policy tools are applied.
If a penalty–reward scheme and EU funding are used in combination, the same de-lays are observed, but the total accumulated number of projects would be much higher in 2020 (see Figure 19).
Figure 19. Simulated number of renovated multi-family buildings with combined penalty–reward scheme and EU fund-ing.
The instability of EU funding has a significant impact on the demand and supply of construction capacity. The Ministry of Economics has defined the low quality of construc-tion works as a problem. It has suggested that the selection of the constructor companies should be based on criteria of social responsibility, values, and reputation, instead of price offers [56]. Around 20% of public building renovation projects financed by Climate Change Financial Instrument have not reached expected savings, the main reasons being the low quality of energy audits (25%), technical specifications (20%), construction works (20%), and operation of buildings (35%) [57]. Building up capacity takes time, and this impacts the quality of construction works because quality is lower for inexperienced com-panies than for experienced companies (see Figure 20). This impacts the fraction of suc-cessfully completed projects, and it takes time for an apartment owner to perceive this fraction, which in turn has an impact on demand.
Figure 19. Simulated number of renovated multi-family buildings with combined penalty–rewardscheme and EU funding.
Energies 2021, 14, 7792 23 of 32
Figure 20. Simulated fraction of successfully completed projects and capacity of experienced and inexperienced construc-tion companies with existing policy tools applied.
The stability of financing leads to an increased number of experienced construction companies (see Figure 21), an increased quality of works, and an increased fraction of successfully completed projects and demand.
Figure 21. Simulated fraction of successfully completed projects and capacity of experienced and unexperienced construc-tion companies with sustainable EU funding and penalty–reward scheme used.
Lower construction quality leads to a bad reputation of renovation works in general, causing a misperception in society, e.g., windows will blur, the renovation will cause molding, and there will be no fresh air in the room. Such bias comes from the low-quality works and experience in early 2000, and these myths still exist despite improvements in quality standards since then.
3.1.4. Social Context, Social Interactions, and Social Behavior This study presents social context, social interactions, and social behavior as the
word-of-mouth effect and social trust in strangers (outsiders) and neighbors (insiders). The word-of-mouth effect can either reinforce or mitigate the diffusion rate of renovation
0
0.1
0.2
0.3
0.4
0.5
0.6
0.7
0.8
0.9
1
0
100
200
300
400
500
600
700
800
2008 2010 2012 2014 2016 2018 2020
Fra
ctio
n of
suc
cess
fuly
fini
shed
proj
ects
Cap
acity
, tho
us.m
2/ye
ar
Capacity of unexperienced construction companies Capacity of experienced construction companiesFraction of succesful recently finished projects Perceived fraction of successfuly finished projects
0
0.1
0.2
0.3
0.4
0.5
0.6
0.7
0.8
0
200
400
600
800
1000
1200
1400
1600
2008 2010 2012 2014 2016 2018 2020
Fra
ctio
n of
suc
cess
fuly
fin
ishe
d pr
ojec
ts
Cap
acity
, tho
us.m
2/ye
ar
Capacity of unexperienced construction companies Capacity of experienced construction companies
Fraction of succesful recently finished projects Perceived fraction of successfuly finished projects
Figure 20. Simulated fraction of successfully completed projects and capacity of experienced and inexperienced constructioncompanies with existing policy tools applied.
The stability of financing leads to an increased number of experienced constructioncompanies (see Figure 21), an increased quality of works, and an increased fraction ofsuccessfully completed projects and demand.
Lower construction quality leads to a bad reputation of renovation works in general,causing a misperception in society, e.g., windows will blur, the renovation will causemolding, and there will be no fresh air in the room. Such bias comes from the low-qualityworks and experience in early 2000, and these myths still exist despite improvements inquality standards since then.
3.1.4. Social Context, Social Interactions, and Social Behavior
This study presents social context, social interactions, and social behavior as theword-of-mouth effect and social trust in strangers (outsiders) and neighbors (insiders).The word-of-mouth effect can either reinforce or mitigate the diffusion rate of renovationprojects, and an increase in the share of successful projects reinforces diffusion whilea reduction mitigates it. The dynamics of the word-of-mouth effect and its impact are

Energies 2021, 14, 7792 23 of 31
mentioned by different stakeholders, e.g., in the city of Jelgava, “Buildings come anddemand energy efficiency projects” [58], “In 2010, the owners of Mungidciems’ first houseSaulıtes agreed on the renovation. After completion of the project, its results and benefitswere evaluated by neighbors; the difference in payments for heat was a reason to encourageothers to follow the lead. There was a positive ‘backyard effect’” [59], etc.
Energies 2021, 14, 7792 23 of 32
Figure 20. Simulated fraction of successfully completed projects and capacity of experienced and inexperienced construc-tion companies with existing policy tools applied.
The stability of financing leads to an increased number of experienced construction companies (see Figure 21), an increased quality of works, and an increased fraction of successfully completed projects and demand.
Figure 21. Simulated fraction of successfully completed projects and capacity of experienced and unexperienced construc-tion companies with sustainable EU funding and penalty–reward scheme used.
Lower construction quality leads to a bad reputation of renovation works in general, causing a misperception in society, e.g., windows will blur, the renovation will cause molding, and there will be no fresh air in the room. Such bias comes from the low-quality works and experience in early 2000, and these myths still exist despite improvements in quality standards since then.
3.1.4. Social Context, Social Interactions, and Social Behavior This study presents social context, social interactions, and social behavior as the
word-of-mouth effect and social trust in strangers (outsiders) and neighbors (insiders). The word-of-mouth effect can either reinforce or mitigate the diffusion rate of renovation
0
0.1
0.2
0.3
0.4
0.5
0.6
0.7
0.8
0.9
1
0
100
200
300
400
500
600
700
800
2008 2010 2012 2014 2016 2018 2020
Fra
ctio
n of
suc
cess
fuly
fini
shed
proj
ects
Cap
acity
, tho
us.m
2/ye
ar
Capacity of unexperienced construction companies Capacity of experienced construction companiesFraction of succesful recently finished projects Perceived fraction of successfuly finished projects
0
0.1
0.2
0.3
0.4
0.5
0.6
0.7
0.8
0
200
400
600
800
1000
1200
1400
1600
2008 2010 2012 2014 2016 2018 2020
Fra
ctio
n of
suc
cess
fuly
fin
ishe
d pr
ojec
ts
Cap
acity
, tho
us.m
2/ye
ar
Capacity of unexperienced construction companies Capacity of experienced construction companies
Fraction of succesful recently finished projects Perceived fraction of successfuly finished projects
Figure 21. Simulated fraction of successfully completed projects and capacity of experienced and unexperienced constructioncompanies with sustainable EU funding and penalty–reward scheme used.
On the other hand, the low quality of construction works causes a negative word-of-mouth effect. If the expected savings are not achieved, the payback time increases,creating problems for the building owners to pay back loans and receive planned benefits.That in turn gives rise to a negative word-of-mouth effect and a reduction in diffusionrate. Information spreads like an infection with a lower rate at the beginning (measuredas living area renovated in m2 per year) and increasing as more buildings get renovated(see Figure 22). The word-of-mouth effect is higher for a sustainable funding schemebecause more buildings are renovated.
Energies 2021, 14, 7792 24 of 32
projects, and an increase in the share of successful projects reinforces diffusion while a reduction mitigates it. The dynamics of the word-of-mouth effect and its impact are men-tioned by different stakeholders, e.g., in the city of Jelgava, “Buildings come and demand energy efficiency projects” [58], “In 2010, the owners of Mungidciems’ first house Saulītes agreed on the renovation. After completion of the project, its results and benefits were evaluated by neighbors; the difference in payments for heat was a reason to encourage others to follow the lead. There was a positive ‘backyard effect’” [59], etc.
On the other hand, the low quality of construction works causes a negative word-of-mouth effect. If the expected savings are not achieved, the payback time increases, creat-ing problems for the building owners to pay back loans and receive planned benefits. That in turn gives rise to a negative word-of-mouth effect and a reduction in diffusion rate. Information spreads like an infection with a lower rate at the beginning (measured as liv-ing area renovated in m2 per year) and increasing as more buildings get renovated (see Figure 22). The word-of-mouth effect is higher for a sustainable funding scheme because more buildings are renovated.
Figure 22. Simulated word-of-mouth effect with actual policy tools and with sustainable EU funding scheme and penalty–reward scheme in force.
Many project implementers value the aesthetical aspects and comfort gained with renovation projects. In small cities or villages, inhabitants of non-renovated buildings ex-perience social pressure from neighbors due to the word-of-mouth effect for the degrada-tion of the common landscape. As 12 years of project implementation experience shows, the most critical factor for the diffusion of renovation projects in multi-family buildings is social trust in “strangers”, e.g., public bodies and institutions and neighbors. The social trust of apartment owners determines the strength of cooperation with the municipality, housing maintenance company, and other “strangers”. The presence and activity of an insider (trustworthy apartment owner living in the building) who can champion and lead the project indicate the strength of social trust among neighbors. Many cases support this, e.g., “…multi-family building renovation in Latvia differs among different administrative territories and cities. Local factors and the cooperation of stakeholders are the key to start-ing a project. Public authorities manage energy efficiency programs, so the role of munic-ipalities is individual…” [59], and “…how to get apartment owners to support renovation projects? The most important thing is the insider (apartment owner) from the building—how active he will be because, undeniably, he will be trusted the most. At best, 30% of all apartment owners come to the apartment owners’ collective meetings”, says T. Cīrulis. Furthermore, “The insider from the building talks to other apartment owners as much as
Figure 22. Simulated word-of-mouth effect with actual policy tools and with sustainable EU fundingscheme and penalty–reward scheme in force.

Energies 2021, 14, 7792 24 of 31
Many project implementers value the aesthetical aspects and comfort gained withrenovation projects. In small cities or villages, inhabitants of non-renovated buildings expe-rience social pressure from neighbors due to the word-of-mouth effect for the degradationof the common landscape. As 12 years of project implementation experience shows, themost critical factor for the diffusion of renovation projects in multi-family buildings issocial trust in “strangers”, e.g., public bodies and institutions and neighbors. The socialtrust of apartment owners determines the strength of cooperation with the municipality,housing maintenance company, and other “strangers”. The presence and activity of aninsider (trustworthy apartment owner living in the building) who can champion and leadthe project indicate the strength of social trust among neighbors. Many cases support this,e.g., “ . . . multi-family building renovation in Latvia differs among different administrativeterritories and cities. Local factors and the cooperation of stakeholders are the key tostarting a project. Public authorities manage energy efficiency programs, so the role ofmunicipalities is individual . . . ” [59], and “ . . . how to get apartment owners to supportrenovation projects? The most important thing is the insider (apartment owner) from thebuilding—how active he will be because, undeniably, he will be trusted the most. At best,30% of all apartment owners come to the apartment owners’ collective meetings”, saysT. Cırulis. Furthermore, “The insider from the building talks to other apartment ownersas much as possible, but the rest we contact and try to convince by ourselves . . . .” [60].A degradation of social trust in state institutions and banks has been observed since theeconomic crisis in 2008, bringing uncertainty and bias regarding banks and loans in general.In addition, there is a prejudice towards intermediates, with ESCO companies often seenas such.
3.1.5. Information Dissemination
In combination with other policy tools, information activities can increase the insula-tion rate in both the short and long term. However, information activities must resonatewith people’s central values [61], next to the content of the information program and howthe information is presented [3]. In response to low awareness and interest in renovationprojects, the ministry responsible for the program ran the information campaign “Let’slive warmer” from 2010 to 2020 (mainly grassroots activities such as seminars in munic-ipalities). Four hundred and twenty-six events were organized, and 46,430 participantsattended the information events, i.e., 7% of the target audience were reached during aten-year period or 200 thousand m2 per year, assuming that all informed persons were notinformed before [62]. The results of simulations (see Figure 23) show that the informationcampaign carried out is just a little stronger than no information campaign, and a morerobust campaign is needed to increase the rate of informed buildings.
3.2. Future Scenarios
In this section, a series of scenarios that answer “what if” questions regarding theimplementation of different policies displayed in the model interface are explored:
• Scenario 1, or baseline scenario, is based on the current ongoing policy in Latviaaccording to the National Energy and Climate Plan 2030. In 2022, the total availableEU funding is 200 million EUR (140 million EUR from the EU Multiannual financeframework and 140 million EUR from the EU Resilience Fund). The support intensityfor multi-apartment buildings is 30%. The information is provided by the grassrootsinformation activities via the campaign Let’s live warmer. In addition to that, energyefficiency obligation scheme is used for electricity providers with an annual savingsgoal of 1.50%.
• Scenario 2 has the same set of policy tools as Scenario 1, but funding is increased threetimes and is 600 million EUR.
• Scenario 3 has the same amount of EU funding as Scenario 1 and the same supportintensity and is combined with other policy tools provided by the interface.

Energies 2021, 14, 7792 25 of 31
• Scenario 4 has the same amount of EU funding as Scenario 2 and the same supportintensity and is combined with other policy tools provided by the interface.
• Scenario 5 has the same set of policy tools as Scenario 4, but funding is increased to1000 million EUR.
Energies 2021, 14, 7792 25 of 32
possible, but the rest we contact and try to convince by ourselves….” [60]. A degradation of social trust in state institutions and banks has been observed since the economic crisis in 2008, bringing uncertainty and bias regarding banks and loans in general. In addition, there is a prejudice towards intermediates, with ESCO companies often seen as such.
3.1.5. Information Dissemination In combination with other policy tools, information activities can increase the insula-
tion rate in both the short and long term. However, information activities must resonate with people’s central values [61], next to the content of the information program and how the information is presented [3]. In response to low awareness and interest in renovation projects, the ministry responsible for the program ran the information campaign “Let’s live warmer” from 2010 to 2020 (mainly grassroots activities such as seminars in munici-palities). Four hundred and twenty-six events were organized, and 46,430 participants attended the information events, i.e., 7% of the target audience were reached during a ten-year period or 200 thousand m2 per year, assuming that all informed persons were not informed before [62]. The results of simulations (see Figure 23) show that the information campaign carried out is just a little stronger than no information campaign, and a more robust campaign is needed to increase the rate of informed buildings.
Figure 23. Simulated impact of different types of information campaigns measured as building area represented by the informed inhabitants (not being informed before), in m2 per year.
3.2. Future Scenarios In this section, a series of scenarios that answer “what if” questions regarding the
implementation of different policies displayed in the model interface are explored: • Scenario 1, or baseline scenario, is based on the current ongoing policy in Latvia ac-
cording to the National Energy and Climate Plan 2030. In 2022, the total available EU funding is 200 million EUR (140 million EUR from the EU Multiannual finance frame-work and 140 million EUR from the EU Resilience Fund). The support intensity for multi-apartment buildings is 30%. The information is provided by the grassroots in-formation activities via the campaign Let’s live warmer. In addition to that, energy efficiency obligation scheme is used for electricity providers with an annual savings goal of 1.50%.
• Scenario 2 has the same set of policy tools as Scenario 1, but funding is increased three times and is 600 million EUR.
Figure 23. Simulated impact of different types of information campaigns measured as building area represented by theinformed inhabitants (not being informed before), in m2 per year.
More detailed information about each policy scenario is provided in Table 2.
Table 2. Input data for policy tools for each policy scenario.
Policy Tools Scenario 1 Scenario 2 Scenario 3 Scenario 4 Scenario 5
EU funding, million EUR 200 600 200 600 1000
EU funding support intensity, % 30 30 30 30 30
Start year of EU funding 2022 2022 2022 2022 2022
Penalty–reward scheme Off Off On On On
ESCO reinvestment fund Off Off On On On
EEOS electricity On On On On On
EEOS heat Off Off On On On
EEOS savings goal, %/year 1.50 1.50 1.50 1.50 1.50
Impact of information dissemination 0.20 0.20 1 1 1
R&D support, million EUR/year Off Off 1 M 10 M 10 M
Support program for “champions”, thous. EUR/year Off Off 0.3 M 0.5 M 0.5 M
Building standards and norms (startingyear/strengthening frequency (years)/energy
consumption reduction (kWh/m2/year))Off Off 5/3 5/10 5/10
Figure 24 illustrates the results of cumulative energy savings for all four scenarios,and Figure 25 shows results for annual costs for each scenario.

Energies 2021, 14, 7792 26 of 31Energies 2021, 14, 7792 27 of 32
Figure 24. Simulation results of cumulative energy savings for all four scenarios.
Figure 25. Simulation results for annual costs for each scenario.
4. Discussions Our first version of the system dynamics model was built to study the diffusion of
energy efficiency measures in multi-family building stock at the dusk of policies in this sector and based solely on the literature and expert views. Simulation of human behavior was limited to a single parameter, “uncertainty costs”. In this study, the attitude–behav-ior–context model was used to supplement the model with a behavior sub-module. Knowledge was elicited about the real system from scientific literature, the experts, and the stakeholders, and was validated with the data from experience and the group model building sessions. However, the model can be improved further by applying other social theories, such as the network theory.
The system dynamics model’s structure was built for aggregated parameters, which limits the application of this modeling approach to study social dynamics evolving from individual behavior as it can be achieved with other simulation methods, e.g., agent-based modeling. This should be considered in further studies because “…all social phenomena, and especially the function of all social institutions, should always be understood as re-sulting from the decisions, actions, attitudes, etc. of human individuals, and … we should never be satisfied by an explanation in terms of so-called ‘collectives’….” [63].
Years
Cum
ulat
ive
ener
gy s
avin
gs, G
Wh
0
1k
2k
3k
4k
5k
6k
7k
8k
2020 2021 2022 2023 2024 2026 2027 2028 2029 2030
Scenario 1 Scenario 2 Scenario 3 Scenario 4 Scenario 5
Years
Annu
al in
vest
men
ts, E
UR
/yea
r
0
350M
700M
2020 2021 2022 2023 2024 2026 2027 2028 2029 2030
Scenario 1 Scenario 2 Scenario 3 Scenario 4 Scenario 5
Figure 24. Simulation results of cumulative energy savings for all four scenarios.
Energies 2021, 14, 7792 27 of 32
Figure 24. Simulation results of cumulative energy savings for all four scenarios.
Figure 25. Simulation results for annual costs for each scenario.
4. Discussions Our first version of the system dynamics model was built to study the diffusion of
energy efficiency measures in multi-family building stock at the dusk of policies in this sector and based solely on the literature and expert views. Simulation of human behavior was limited to a single parameter, “uncertainty costs”. In this study, the attitude–behav-ior–context model was used to supplement the model with a behavior sub-module. Knowledge was elicited about the real system from scientific literature, the experts, and the stakeholders, and was validated with the data from experience and the group model building sessions. However, the model can be improved further by applying other social theories, such as the network theory.
The system dynamics model’s structure was built for aggregated parameters, which limits the application of this modeling approach to study social dynamics evolving from individual behavior as it can be achieved with other simulation methods, e.g., agent-based modeling. This should be considered in further studies because “…all social phenomena, and especially the function of all social institutions, should always be understood as re-sulting from the decisions, actions, attitudes, etc. of human individuals, and … we should never be satisfied by an explanation in terms of so-called ‘collectives’….” [63].
Years
Cum
ulat
ive
ener
gy s
avin
gs, G
Wh
0
1k
2k
3k
4k
5k
6k
7k
8k
2020 2021 2022 2023 2024 2026 2027 2028 2029 2030
Scenario 1 Scenario 2 Scenario 3 Scenario 4 Scenario 5
Years
Annu
al in
vest
men
ts, E
UR
/yea
r
0
350M
700M
2020 2021 2022 2023 2024 2026 2027 2028 2029 2030
Scenario 1 Scenario 2 Scenario 3 Scenario 4 Scenario 5
Figure 25. Simulation results for annual costs for each scenario.
Scenario 1 results show that, by the current policy mechanisms, the actual cumulativesavings in the housing sector will be 570 GWh by 2030, and the total cumulative costswill be 1.15 million EUR. The same results are reached in Scenario 2 and show that theresult will not change even when multiplying the investment but not changing the policytools. Scenario 3 shows that even by having the same amount of investments as in Scenario1 and combining it with the targeted policy tools, the improvement could be reached.The cumulative savings will increase to 3600 GWh, the total cumulative costs will be715 million EUR, and the annual investment rate will gradually increase over the years.Scenario 4 shows that cumulative savings will reach 7400 GWh, which is slightly lower thanin Scenario 5. The total cumulative costs in Scenario 4 will reach 1285 million EUR, whilein Scenario 5 it will be 1715 million EUR. The difference between both scenarios can beobserved in Figure 19, wherein the annual investment rate differs from 2028. In Scenario 4,the available EU funding will be spent by 2028, and the penalty–reward scheme willprovide co-financing for projects but not enough to co-finance all projects (up and down

Energies 2021, 14, 7792 27 of 31
behavior shows that all income from the scheme will be immediately spent on projects).In Scenario 5, the amount from EU funding will still be available, and the implementationof projects will continue until 2030.
4. Discussions
Our first version of the system dynamics model was built to study the diffusionof energy efficiency measures in multi-family building stock at the dusk of policies inthis sector and based solely on the literature and expert views. Simulation of humanbehavior was limited to a single parameter, “uncertainty costs”. In this study, the attitude–behavior–context model was used to supplement the model with a behavior sub-module.Knowledge was elicited about the real system from scientific literature, the experts, andthe stakeholders, and was validated with the data from experience and the group modelbuilding sessions. However, the model can be improved further by applying other socialtheories, such as the network theory.
The system dynamics model’s structure was built for aggregated parameters, whichlimits the application of this modeling approach to study social dynamics evolving fromindividual behavior as it can be achieved with other simulation methods, e.g., agent-basedmodeling. This should be considered in further studies because “ . . . all social phenomena,and especially the function of all social institutions, should always be understood asresulting from the decisions, actions, attitudes, etc. of human individuals, and . . . weshould never be satisfied by an explanation in terms of so-called ‘collectives’ . . . .” [63].
Another significant limitation of the study was the size of the model. One of theessential aspects of modeling is to keep models as simple as possible by making themcomplex enough to explain the behavior generated by the system’s structure. Traditionally,most of the research undertaken on energy efficiency has focused on a specific factor, suchas cost-effectiveness, or policy initiative, such as financial support, while if the total effectis considered at all, it is assumed to be the sum of the parts. However, a lack of focus on thebigger picture can miss the interactions between factors at different levels and the holisticnature of this issue. On the other hand, considering every possible factor and every causallink between them may be as imprecise as the research on single factors. This limitationwas addressed by building the model with the focus on balance between simplicity andcomplexity by setting the boundaries of the system and defining factors, policy initiatives,and limiting causal and feedback links.
5. Conclusions
Our study shows how seemingly positive policy tools set the stage for a series ofunintended adverse effects due to the complex interactions between different systemcomponents and how the common assumption that information and financial supportshould result in significant energy efficiency diffusion results is impeding national energyefficiency goals. The system of the multi-family building sector is far more complex thanwhat is intuitively assumed because there are several major reinforcing and balancingmechanisms in the system that can counter the effects of energy efficiency policy tools usedby the government.
Similar to other studies [64,65], this study shows that rapid and substantial changesin available funding can destabilize a system due to multiple feedback loops and delays.For steep and short-term growth in complex system, these effects are not intuitive [31].A lack of long-term policy planning caused two waves of funding from 2008 to 2020and resulted in a wide array of adverse effects for energy efficiency policy such as themisbalance between supply and demand of construction services causing an oscillationin price, pay-back time, net benefits, and quality of construction works, an addiction tofinancial support based on EU funding, and a negative word-of-mouth effect. The resultsshow that the capacity of construction companies adjusted slowly to the demand, and asignificant gap arose between the demand and the capacity supply. This in turn affectedthe renovation costs, thus dampening the demand via a negative feedback loop to catch

Energies 2021, 14, 7792 28 of 31
up with demand. If the renovation costs are high, net benefits decrease and the rate ofbuilding renovation decreases. Two other negative feedback loops balanced the demandfor the services of construction companies. The first loop was aroused at the early stageswhen capacity grew very fast, i.e., as demand rises, more inexperienced companies enterthe market, leading to an increase in unsuccessful projects. The second loop balancedout the reinforcing process of an information campaign due to the impact of unsuccessfulprojects delivered by inexperienced companies. The negative loop of availability of thereinvestment sources dampened ESCOs supply. The reinforcing effect of the informationcampaign was weak, while the word-of-mouth effect reinforced renovation processes,especially outside the capital city.
The implementation of energy efficiency policy between 2008 and 2020 revealed othervital drivers for the diffusion of energy efficiency projects in multi-family buildings, suchas social trust and strength of cooperation between the municipality, housing maintenancecompany, and the insider (trustworthy apartment owner living in the building) who canchampion and lead the project. These drivers increase the probability of investing in energyefficiency, which in turn increases the rate of renovation. These findings coincide witha similar study carried out in the multi-family building sector in Slovenia [66]. Otherstudies [67,68] also underline the importance of the role of a trustworthy neighbor; theysuggest that the information provided by block leaders (persons belonging to the samesocial network and using face-to-face interactions) is a very effective intervention. Peopleconform to social norms because it is a mental shortcut to address complexity in deci-sion making, and it is essential because social norms can effectively induce behavioralchange [69]. The word-of-mouth effect reinforces and mitigates the diffusion of renovationprojects because they bring forth social comparison and increase social norms in favor ofenergy efficiency.
Sustained, smooth, and predictable funding levels set the conditions for the necessarystability in the system. Penalty–reward schemes can be used as one of the alternatives forstabilizing the system. Combined with other policy tools, such as excessive informationcampaign and investment in R&D, as well as an increase in building sector standards,diffusion of energy efficiency measures in multi-family buildings can be enhanced. Assimulation results show, a combination of different policy tools provides a reinforcing effectwhile not increasing the total costs.
Author Contributions: This research is the joint efforts of all authors. Conceptualization and method-ology, A.B., D.B. and G.B.; software and validation, A.B. and G.B.; for-mal analysis and investigation,I.I., J.N. and D.B.; resources and data curation, S.V., I.I. and J.N.; writing—original draft preparation,A.B.; writing—review and editing, S.V., D.B. and G.B.; visualization, S.V.; supervision, project admin-istration and funding acquisition, G.B. All authors have read and agreed to the published version ofthe manuscript.
Funding: This research was funded by Ministry of Economics of Latvia in terms of the NationalResearch Program Energy project VPP-EM-EE-2018/1- 0004, assessment and analysis of energyefficiency policies.
Institutional Review Board Statement: Not applicable.
Informed Consent Statement: Not applicable.
Data Availability Statement: Not applicable.
Acknowledgments: This paper is developed in the scope of the National Research Program Energyproject VPP-EM-EE-2018/1-0004, assessment and analysis of energy efficiency policies.
Conflicts of Interest: The authors declare no conflict of interest.
References1. European Commission. The European Green Deal; Communication from the Commission to the European Parliament; The
European Council; The Council, The European Economic and Social Committee and the Committee of the Regions: Brussels,Belgium, 2019; 640p.

Energies 2021, 14, 7792 29 of 31
2. Eurostat. Energy Consumption and Use by Households. 2019. Available online: https://ec.europa.eu/eurostat/web/products-eurostat-news/-/DDN-20190620-1 (accessed on 8 May 2021).
3. Cattaneo, C. Internal and external barriers to energy efficiency: Which role for policy interventions? Energy Effic. 2019,12, 1293–1311. [CrossRef]
4. European Commission. Revision of the Energy Performance of Buildings Directive 2010/31/EU, Inception Impact Assessment; Ref.Ares1397833; European Comission: Brussels, Belgium, 2021.
5. Labanca, N.; Bertoldi, P. Beyond energy efficiency and individual behaviours—Policy insights from social practice theories.Energy Policy 2018, 115, 494–502. [CrossRef]
6. Gardner, G.T.; Stern, P.C. Environmental Problems and Human Behavior; Pearson Custom Publishing: Boston, MA, USA, 2002.7. Wiese, C.; Larsen, A.; Pade, L.-L. Energy Efficiency Policy: A Review of Instruments and Potential Interaction Effects. In Proceed-
ings of the 40th Annual IAEE International Conference, Singapore, 18–21 June 2017.8. Casado, F.; Hidalgo Carmen, M.; Garcia-Leiva, P. Energy efficiency in households—The effectiveness of different types of
messages in advertising campaigns. J. Environ. Psychol. 2017, 53, 198–205. [CrossRef]9. Ebrahimigharehbaghi, S.; Qian, K.Q.; Meijer, M.F.; Visscher, J.H. Unravelling Dutch homeowners’ behaviour towards energy
efficiency renovations—What drives and hinders their decision-making. Energy Policy 2019, 129, 546–561. [CrossRef]10. Wilson, C.; Crane, L.; Chryssochoidis, G. Why do homeowners renovate energy efficiently? Contrasting perspectives and
implications for policy. Energy Res. Soc. Sci. 2015, 7, 12–22. [CrossRef]11. Caird, S.; Roy, R.; Herring, H. Improving the energy performance of UK households: Results from surveys of consumer adoption
and use of low- and zero carbon technologies. Energy Effic. 2008, 1, 149–166. [CrossRef]12. Ramos, A.; Labandeira, X.; Löschel, A. Pro-environmental households and energy efficiency in Spain. Environ. Resour. Econ. 2015,
63, 367–393. [CrossRef]13. Trotta, G. The determinants of energy efficient retrofit investments in the English residential sector. Energy Policy 2018, 120, 175–182.
[CrossRef]14. Heinzle, S.L. Disclosure of energy operating cost information: A silver bullet for overcoming the energy-efficiency gap? J. Consum.
Policy 2012, 35, 43–64. [CrossRef]15. Camilleri, A.R.; Larrick, R.P. Metric and scale design as choice architecture tools. J. Public Policy Mark. 2014, 33, 108–125. [CrossRef]16. Ungemach, C.; Camilleri, A.R.; Johnson, E.J.; Larrick, R.P.; Weber, E.U. Translated attributes as choice architecture: Aligning
objectives and choices through decision signposts. Manag. Sci. 2017, 64, 1975–2471. [CrossRef]17. Tsagarakis, P.; Karyotakis, K.; Zografakis, N. Implementation conditions for energy saving technologies and practices in office
buildings—Part 2. Double glazing windows, heating and air-conditioning. Renew. Sustain. Energy Rev. 2012, 16, 3986–3998.[CrossRef]
18. Girod, B.; Stucki, T.; Woerter, M. How do policies for efficient energy use in the household sector induce energy-efficiencyinnovation. An evaluation of European countries. Energy Policy 2017, 103, 223–237. [CrossRef]
19. Kivimaa, P.; Kern, F. Creative destruction or mere niche support. Innovation policy mixes for sustainability transitions. Res. Policy2016, 45, 205–217. [CrossRef]
20. Fresner, J.; Morea, F.; Krenn, C.; Uson, J.A.; Tomasi, F. Energy efficiency in small and medium enterprises—Lessons learned from280 energy audits across Europe. J. Clean. Prod. 2017, 142, 1650–1660. [CrossRef]
21. Rosenow, J.; Kern, F.; Rogge, K. The need for comprehensive and well targeted instrument mixes to stimulate energy transitions—The case of energy efficiency policy. Energy Res. Soc. Sci. 2017, 33, 95–104. [CrossRef]
22. Kamal, A.; Al-Ghamdi, S.G.; Koc, M. Revaluing the costs and benefits of energy efficiency—A systematic review. Energy Res. Soc.Sci. 2019, 45, 68–84. [CrossRef]
23. Blumberga, A.; Žogla, G.; Laicane, I. Planning and Evaluation Tools for Energy Efficiency Policy in the Housing Sector in Latvia.In Proceedings of the International Energy Program Evaluation Conference, Rome, Italy, 12–14 June 2012.
24. Pikasa, E.; Kurnitski, J.; Liias, R.; Thalfeldt, M. Quantification of economic benefits of renovation of apartment buildings as a basisfor cost optimal 2030 energy efficiency strategies. Energy Build. 2015, 86, 151–160. [CrossRef]
25. Kern, F.; Kivimaa, P.; Martiskainen, M. Policy packaging or policy patching. The development of complex energy efficiency policymixes. Energy Res. Soc. Sci. 2017, 23, 11–25. [CrossRef]
26. Cunningham, P.; Edler, J.; Flanagan, K.; Laredo, P. Innovation Policy Mix and Instrument Interaction: A Review. Available online:https://media.nesta.org.uk/documents/innovation_policy_mix_and_instrument_interaction.pdf (accessed on 30 August 2021).
27. Rosenow, J.; Fawcett, T.; Eyre, N.; Oikonomou, V. Energy Saving Policies and Energy Efficiency Obligation Schemes. D5.1Combining of Energy Efficiency Obligations and Alternative Policies. Available online: https://enspol.eu/sites/default/files/results/D5.1Combining%20of%20Energy%20Efficiency%20Obligations%20and%20alternative%20policies.pdf (accessed on30 August 2021).
28. European Commission. A Renovation Wave for Europe—Greening Our Buildings, Creating Jobs, Improving Lives; Communicationfrom the Commission to the European Parliament; The European Council; The Council, The European Economic and SocialCommittee and The Committee Of The Regions: Brussels, Belgium, 2019; 662p.
29. Geels, F.W. Technological transitions as evolutionary reconfiguration processes: A multi-level perspective and a case-study. Res.Policy 2002, 31, 1257–1274. [CrossRef]

Energies 2021, 14, 7792 30 of 31
30. Ripple, W.J.; Wolf, C.; Newsome, T.M.; Galetti, M.; Alamgir, M.; Crist, E.; Mahmoud, M.I.; Laurance, W.F. World Scientists’Warning to Humanity: A Second Notice. BioScience 2017, 67, 1026–1028. [CrossRef]
31. Forrester, J.W. Counterintuitive behavior of social systems. Technol. Forecast. Soc. Chang. 1971, 3, 1–22. [CrossRef]32. Moxnes, E. Misperceptions of basic dynamics: The case of renewable resource management. Syst. Dyn. Rev. 2004, 20, 139–162.
[CrossRef]33. Rahmandad, H.; Sterman, J.D. Heterogeneity and Network Structure in the Dynamics of Diffusion: Comparing Agent-Based and
Differential Equation Models. Manag. Sci. 2008, 54, 998–1014. [CrossRef]34. Arthur, W.B. Positive Feedbacks in the Economy. Sci. Am. 1990, 262, 92–99. [CrossRef]35. Sterman, J. Business Dynamics: Systems Thinking and Modeling for a Complex World; McGraw-Hill: New York, NY, USA, 2000.36. Foxon, T.J.; Hammond, G.P.; Pearson, P.J.G. Developing transition pathways for a low carbon electricity system in the UK. Technol.
Forecast. Soc. Chang. 2010, 77, 1203–1213. [CrossRef]37. Rotmans, J.; Loorbach, D. Complexity and transition management. J. Ind. Ecol. 2009, 13, 184–196. [CrossRef]38. De Gooyert, V.; Rouwette, E.; van Kranenburg, H.; Freeman, E.; van Breen, H. Sustainability transition dynamics; Towards
overcoming policy resistance. Technol. Forecast. Soc. Chang. 2016, 111, 135–145. [CrossRef]39. Cabinet of Ministers of Latvia. Ministru Kabineta Rıkojums Nr.266, Par Latvijas Republikas Pirmo Energoefektivitates Rıcıbas Planu
2008–2010.Gadam. (Latvia First Energy Efficiency Action Plan 2008–2010) 20 May 2008; Cabinet of Ministers of Latvia: Riga,Latvia, 2008.
40. Cabinet of Ministers of Latvia. Ministru Kabineta Rıkojums Nr.460. Par Latvijas Republikas Otro Energoefektivitates Rıcıbas Planu2011–2013.Gadam. (Latvia Second Energy Efficiency Action Plan 2011–2013) 16 September 2011; Cabinet of Ministers of Latvia: Riga,Latvia, 2011.
41. Cabinet of Ministers of Latvia. Ministru Kabineta Rıkojums Nr. 257. Par Energoefektivitates Politikas Alternatıvo Pasakumu PlanuEner ‘gijas Galapaterin, a Ietaupıjuma Merk, a 2014–2020. Gadam Sasniegšanai. (On the Energy Efficiency Policy Alternative Action Plan toAchieve the 2014–2020 Energy End-Use Savings Target) 24 May 2017; Cabinet of Ministers of Latvia: Riga, Latvia, 2017.
42. Ministry of Economics of Latvia. Renoveto eku Statistika. (Statistics of Renovated Buildings). 2021. Available online: https://www.em.gov.lv/lv/renoveto-eku-statistika (accessed on 30 August 2021).
43. Forrester, J.; Senge, P. Tests for building confidence in system dynamics models. TIMS Stud. Manag. Sci. 1980, 14, 209–228.44. Blumberga, A.; Zogla, G.; Moxnes, E.; Davidsen, P. Residential Energy Efficiency Policy in Latvia: A System Dynamics Approach.
In Proceedings of the 29th International Conference of the System Dynamics Society, Washington, DC, USA, 24–28 July 2011;pp. 373–396.
45. Blumberga, A.; Blumberga, D.; Bažbauers, G.; Žogla, G.; Laicane, I. Sustainable Development Modelling for the Energy Sector. J.Clean. Prod. 2014, 63, 134–142. [CrossRef]
46. Cabinet of Ministers of Latvia. Re ‘gionalas Attıstıbas Uzraudzıbas un Novertešanas Kartıba. (Regulation on Regional DevelopmentAssessment and Monitoring) 1 July 2014; Ministru Kabineta Noteikumu Nr. 367; Cabinet of Ministers of Latvia: Riga, Latvia, 2014.
47. Stern, P.C.; Oskamp, S. Handbook of Environmental Psychology; Wiley: New York, NY, USA, 1987.48. Lewin, K. Field theory and experiment in social psychology: Concepts and methods. Am. J. Sociol. 1939, 44, 868–896. [CrossRef]49. Vennix, J.A.M. Group Model Building: Facilitating Team Learning Using System Dynamics; John Wiley & Sons: Hoboken, NJ,
USA, 1996.50. Andersen, D.F.; Richardson, G.P.; Vennix, J.A.M. Group model building: Adding more science to the craft. Syst. Dyn. Rev. 1997,
13, 187–201. [CrossRef]51. Barlas, Y. Formal aspects of model validity and validation in system dynamics. Syst. Dyn. Rev. 1996, 12, 183–210. [CrossRef]52. Rimma, A. Namu Parvaldnieka un Ekspertu Sadarbıba Energoefektivitates Projektos. Problemas un Ieteikumi. (Cooperation of
Building Manager and Experts in Energy Efficiency Project. Problems and Suggestions) Diskusija Energoefektivitates Projekti unto Kvalitates Uzlabošanas Iespejas. Rıga. 20 March 2017. Available online: https://www.youtube.com/watch?v=l9-WmijAueU&list=PLKEejtELkPcs89J9Z28SQjA50wf6LC-9k (accessed on 30 August 2021).
53. Kazlauskaite, A. Financial Instruments for Energy Efficiency in the Programming Period 2014–2020. 2019. Available online: https://www.fi-compass.eu/sites/default/files/publications/presentation_20161020_vienne_agne_kazlauskaite_1.pdf (accessed on10 August 2021).
54. Levionoka, O. SIA “RenESCO” Rezultati un Pieredze no Esošajiem Projektiem Latvija (RenESCO Results and Experience fromRenovation Projects in Latvia). 2020. Available online: https://50001seaps.eu/fileadmin/user_upload/3_RENESCO_Pieredze_rezultati_eku_renovacija.pdf (accessed on 10 August 2021).
55. Ministry of Economics of Latvia. Energoservisa Pakalpojumu Uzn, emumu Finanšu Pieejamıbas Ex-ante Izvertejums. (Ex-anteEvaluation of Financial Availability of Energy Service Companies). 2017. Available online: https://www.fi-compass.eu/content/ex-ante-assessment-summary-latvia-financial-accessibility-energy-efficiency-improvement (accessed on 10 August 2021).
56. Valantis, E. Pasakumi Buvniecıbas Kvalitates Celšanai, t.sk. Buvspecialistu un Setificejošas Iestades Atbildıba. (Measures toImprove the Quality of Construction, Incl. the Responsibility of the Construction Specialist and the Certifying Authority).27 March 2017. Available online: https://www.youtube.com/watch?v=ae5jPrHQPHM&list=PLKEejtELkPcs89J9Z28SQjA50wf6LC-9k&index=6&t=0s (accessed on 5 August 2021).

Energies 2021, 14, 7792 31 of 31
57. Liepkalns, V. Energoefektivitates Radıtajs—Svarıgs Kriterijs eku Atjaunošanas Projektos (Energy Efficiency Indicator—ImportantCriteria in Renovation Projects, Workshop) Energoefektivitates Garantija—Viens no Risinajumiem Kvalitatıvai eku Atjaunošanai,29 September 2020, Riga. Available online: https://sharex.lv/wp-content/uploads/VLiepkalns_LVIF.pdf (accessed on8 May 2021).
58. Kukuts, O. Daudzdzıvokl,u Dzıvojamo Maju Energoefektivitates Paaugstinašana—Dzıvokl,u Ipašnieku Ilgtspejıgs Lemums.(Improving the Energy Efficiency of Apartment Buildings—A Sustainable Decision for Apartment Owners) Workshop “Energoe-fektivitate Ilgtspejıgai Nakotnei”. 5 July 2019. Available online: https://www.slideshare.net/siltinam/ku-energoefektivitte-133417947 (accessed on 10 August 2021).
59. Petersone, K. Pirmais Jaunas Energoefektivitates Programmas Objekts—Nu Visas Ciema Daudzdzıvokl,u Ekas Nosiltinatas (TheFirst Object of the New Energy Efficiency Program Is Now All the Apartment Buildings in the Village have been Renovated).2017. Available online: http://www.zalabriviba.lv/jaunumi/pirmais-jaunas-energoefektivitates-programmas-objekts-nu-visas-ciema-daudzdzivoklu-ekas-nosiltinatas/ (accessed on 11 August 2021).
60. Helmane, I. Daudzdzıvokl,u Maju Siltinašanas Pieredze. (Experience of Multi-Family Building Renovation Projects). 2018. Avail-able online: https://lvportals.lv/norises/292875-daudzdzivoklu-maju-siltinasanas-pieredze-2018 (accessed on 13 August 2021).
61. Steg, L.; Perlaviciute, G.; van der Werff, E. Understanding the human dimensions of a sustainable energy transition. Front. Psychol.2015, 6, 805. [CrossRef] [PubMed]
62. Ministry of Economics of Latvia. Information about Communication Campaign. 2020. Available online: https://www.slideshare.net/siltinam/dzvo-siltk-10 (accessed on 5 August 2021).
63. Popper, K. The Open Society and Its Enemies; Routledge: Oxfordshire, UK, 1945.64. Rosenow, J.; Eyre, N. A post mortem of the Green Deal: Austerity, energy efficiency, and failure in British energy policy. Energy
Res. Soc. Sci. 2016, 21, 141–144. [CrossRef]65. Gomez, M.; Ghaffarzadegan, N.; Larson, R.C. Unintended effects of changes in NIH appropriations: Challenges for biomedical
research workforce development. In Proceedings of the 30th International Conference of the System Dynamics Society, St. Gallen,Switzerland, 22–26 July 2012.
66. Cerinsek, G.; Bancic, D.; Podjed, D.; D’Oca, S.; Vetrsek, J.; Dolinsek, S.; Op’t Veld, P. Boosting affordability, acceptability andattractiveness of deep energy renovations of residential buildings—A people-centred ethnographic approach. In Proceedings ofthe CLIMA 2019, Bucharest, Romania, 26–29 May 2019.
67. Allcott, H. Social norms and energy conservation. J. Public Econ. Spec. Issue Role Firms Tax Syst. 2011, 95, 1082–1095. [CrossRef]68. Abrahamse, W.; Steg, L. Social influence approaches to encourage resource conservation: A meta-analysis. Glob. Environ. Chang.
2013, 23, 1773–1785. [CrossRef]69. Schultz, P.W.; Nolan, J.M.; Cialdini, R.B.; Goldstein, N.J.; Griskevicius, V. The constructive, destructive, and reconstructive power
of social norms. Psychol. Sci. 2007, 18, 429–434. [CrossRef] [PubMed]
Copyright © 2022 FDOKUMEN