Unintended pregnancy in the United States: incidence and disparities, 2006
23
1 Original Research Article in Contraception – Author Version Unintended pregnancy in the United States: incidence and disparities, 2006 Lawrence B. Finer,* Mia R. Zolna Guttmacher Institute, New York, NY 10038, USA Volume 84, Issue 5, Pages 478-485, November 2011 Received 22 July 2011; accepted 28 July 2011; published online 25 August 2011 doi: 10.1016/j.contraception.2011.07.013 *Corresponding author Lawrence B. Finer Guttmacher Institute 125 Maiden Lane, 7 th Floor New York, NY 10038 E-mail: [email protected]
-
Upload
independent -
Category
Documents
-
view
0 -
download
0
Transcript of Unintended pregnancy in the United States: incidence and disparities, 2006

1
Original Research Article in Contraception – Author Version
Unintended pregnancy in the United States:
incidence and disparities, 2006
Lawrence B. Finer,* Mia R. Zolna
Guttmacher Institute, New York, NY 10038, USA
Volume 84, Issue 5, Pages 478-485, November 2011
Received 22 July 2011; accepted 28 July 2011; published online 25 August 2011
doi: 10.1016/j.contraception.2011.07.013
*Corresponding author Lawrence B. Finer Guttmacher Institute 125 Maiden Lane, 7th Floor New York, NY 10038 E-mail: [email protected]
Acknowledgment
Suggested citation: Finer LB and Zolna MR, Unintended pregnancy in the United States: incidence and disparities, 2006, Contraception, November 2011, 84(5): 478–485.

2
Abstract Background: The incidence of unintended pregnancy is among the most essential health status indicators in the field of reproductive health. One ongoing goal of the US Department of Health and Human Services is to reduce unintended pregnancy, but the national rate has not been estimated since 2001. Study Design: We combined data on women's pregnancy intentions from the 2006–2008 and 2002 National Survey of Family Growth with a 2008 national survey of abortion patients and data on births from the National Center for Health Statistics, induced abortions from a national abortion provider census, miscarriages estimated from the National Survey of Family Growth and population data from the US Census Bureau. Results: Nearly half (49%) of pregnancies were unintended in 2006, up slightly from 2001 (48%). The unintended pregnancy rate increased to 52 per 1000 aged 15–44 years in 2006 from 50 in 2001. Disparities in unintended pregnancy rates among subgroups persisted and in some cases increased, and women who were 18–24 years old, poor or cohabiting had rates two to three times the national rate. The unintended pregnancy rate declined notably for teens 15–17 years old. The proportion of unintended pregnancies ending in abortion decreased from 47% in 2001 to 43% in 2006, and the unintended birth rate increased from 23 to 25 per 1000 women 15–44 years old. Conclusions: Since 2001, the United States has not made progress in reducing unintended pregnancy. Rates increased for nearly all groups and remain high overall. Efforts to help women and couples plan their pregnancies, such as increasing access to effective contraceptives, should focus on groups at greatest risk for unintended pregnancy, particularly poor and cohabiting women.
3
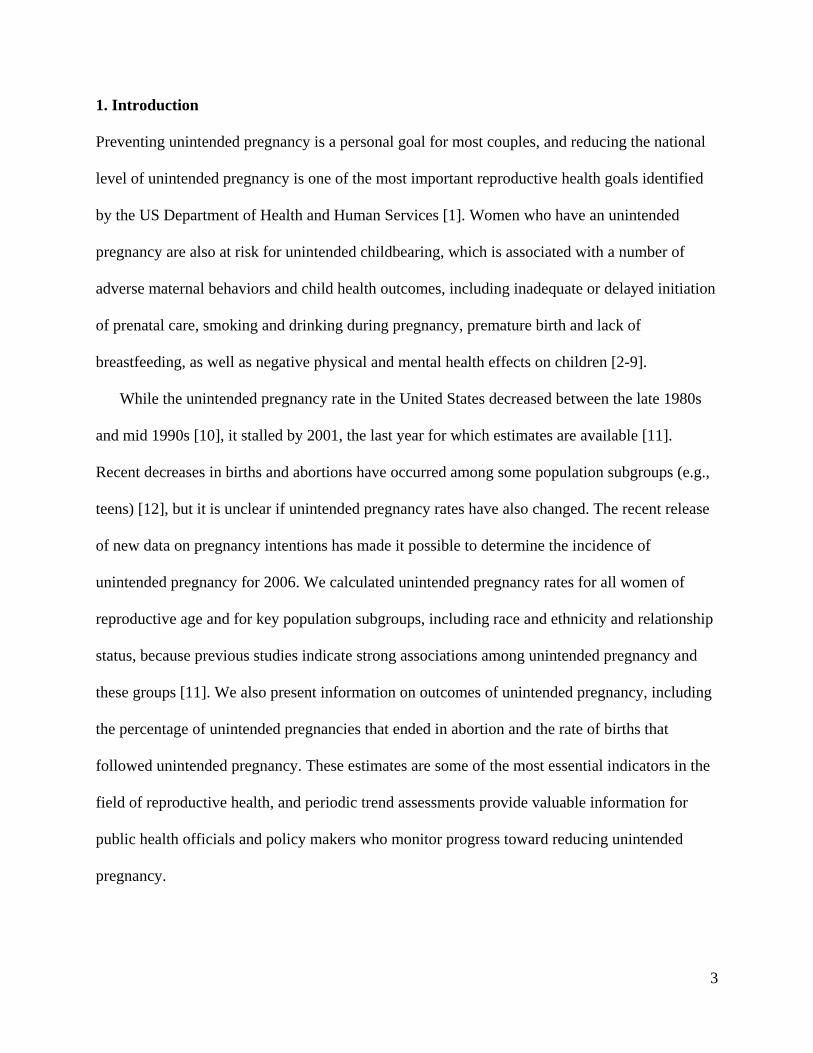
1. Introduction
Preventing unintended pregnancy is a personal goal for most couples, and reducing the national
level of unintended pregnancy is one of the most important reproductive health goals identified
by the US Department of Health and Human Services [1]. Women who have an unintended
pregnancy are also at risk for unintended childbearing, which is associated with a number of
adverse maternal behaviors and child health outcomes, including inadequate or delayed initiation
of prenatal care, smoking and drinking during pregnancy, premature birth and lack of
breastfeeding, as well as negative physical and mental health effects on children [2-9].
While the unintended pregnancy rate in the United States decreased between the late 1980s
and mid 1990s [10], it stalled by 2001, the last year for which estimates are available [11].
Recent decreases in births and abortions have occurred among some population subgroups (e.g.,
teens) [12], but it is unclear if unintended pregnancy rates have also changed. The recent release
of new data on pregnancy intentions has made it possible to determine the incidence of
unintended pregnancy for 2006. We calculated unintended pregnancy rates for all women of
reproductive age and for key population subgroups, including race and ethnicity and relationship
status, because previous studies indicate strong associations among unintended pregnancy and
these groups [11]. We also present information on outcomes of unintended pregnancy, including
the percentage of unintended pregnancies that ended in abortion and the rate of births that
followed unintended pregnancy. These estimates are some of the most essential indicators in the
field of reproductive health, and periodic trend assessments provide valuable information for
public health officials and policy makers who monitor progress toward reducing unintended
pregnancy.

4
2. Materials and methods
Overview For all US women and by key population subgroups (age, educational attainment, race and
ethnicity, income, relationship status, parity and religious affiliation), we determined the number
of pregnancies that ended in birth, induced abortion and miscarriage1
Counts and intendedness of pregnancies by outcome
; calculated the proportion
of each of these outcomes that were unintended; and then divided the total number of unintended
pregnancies by the population of women aged 15–44 years to obtain an unintended pregnancy
rate per 1000 women.
Births
We relied on data from the National Center for Health Statistics (NCHS) [13-15] to obtain the
number of US births that occurred in 2001 and 2006 overall and by the mother’s age, educational
attainment, race and ethnicity, relationship status (not including cohabitation), and parity (2006
only). We distributed births by other subgroups (including cohabiting status) using the National
Survey of Family Growth (NSFG), a nationally representative survey of US women aged 15–44
years conducted by the NCHS.
Women’s pregnancy intentions were obtained from the NSFG, which asked women a series
of retrospective questions to determine whether each of the pregnancies they had had were
intended or unintended at the time it occurred. Intended pregnancies were those that occurred to
women who wanted a baby at the time they became pregnant or sooner or were indifferent about
conceiving; unintended pregnancies were conceptions that were mistimed (i.e., the woman
wanted to become pregnant at some point in the future, but not when she conceived) or unwanted
1 Miscarriage refers to spontaneous fetal loss or stillbirth.

5
(i.e., she did not want to become pregnant at the time of conception nor in the future). We
focused on the births in the 5 years preceding the 2006–2008 (n=2044) and 2002 (n=2618)
interviews.
Abortions
The total number of surgical and medication abortions performed in 2001 and 2006 came from a
census of US abortion providers [16] conducted by the Guttmacher Institute. Counts by age came
from the Centers for Disease Control and Prevention’s 2001 and 2006 abortion surveillance
reports [17,18], and estimates for all other subgroups were based on interpolations of
distributions from two nationally representative Abortion Patient Surveys (APS) conducted by
the Guttmacher Institute in 2000 (n=10,683) [19] and 2008 (n=9493) [20].
Abortions are underreported in the NSFG. Therefore, pregnancy intentions among women
obtaining abortions for both 2006 and 2001 were based on distributions from the 2008 APS,
which, for the first time, asked women the same set of questions that were used in the NSFG.
Use of these data enabled us to identify the proportion of abortions that followed intended
pregnancies, rather than assuming that all abortions followed unintended pregnancies, an
approach used in previous analyses.2
Miscarriages
There is no “gold standard” count of miscarriages. Official statistics are limited to fetal deaths at
20 weeks of gestation or later [21], and, hence, miss those that occur earlier in pregnancy. We
estimated the number of miscarriages for 2006 by calculating the ratio of miscarriages to births
[22] overall and by subgroup that occurred in the 7 years preceding the last two NSFG rounds
(2002 and 2006–2008) and multiplying that ratio by the total number of US births in 2006
2 This change resulted in lower unintended pregnancy estimates for 2001 than were previously reported [11].

6
overall and by subgroup. Women in their teens and those 40 years or older had relatively fewer
pregnancies, so we increased the sample size by including data from a third round of the NSFG
(1995) to improve the validity of the estimate.3
Information on the intendedness of pregnancies ending in miscarriage came from
miscarriages in the 5 years preceding the 2006–2008 (n=560) and 2002 (n=729) NSFG
interviews. In previous analyses, we relied directly on women’s reports of intendedness, but
subgroup sample sizes for 2006 were inadequate. Because miscarriages are pregnancies that
would otherwise end in either birth or abortion, we would expect that the proportion of
miscarriages that were intended would fall between the proportion of births that were intended
and the proportion of abortions that were intended. For the entire NSFG sample, this assumption
was accurate.
To estimate the number of miscarriages for 2001,
we applied the same ratio calculated from all three NSFG surveys combined to the 2001 birth
counts.
4 Therefore, for subgroups, we calculated the proportion of miscarriages that were
intended by constraining it to fall between the proportion of births and abortions intended.5
Population denominators and calculations
Denominators for pregnancy, birth and abortion rates for all women aged 15–44 years and by age
and race and ethnicity were obtained from population estimates published by the US Census
Bureau [23]. Population distributions by educational attainment, poverty and relationship status
came from the Annual Social and Economic Supplements of the Current Population Survey. The
population distributions for women by cohabitation status, religious affiliation and parity were
3 The ratio of miscarriages to births has not changed much between 1995 and 2006, so use of earlier 1995 data should not be problematic. 4 In 2006, 57% of miscarriages followed intended pregnancies, compared with 64% of births and 5% of abortions. 5 For example, in 2006, the proportion of miscarriages that were intended within each subgroup was calculated as A + (0.884 × [B – A]), where A is the proportion of abortions in that subgroup that were intended, B is the proportion of births in that subgroup that were intended, and 0.884 is (57% – 5%)/(64% – 5%), based on the overall proportions for the sample population mentioned in the previous footnote.

7
based on interpolations of the 1995, 2002 and 2006–2008 NSFGs. Distributions by education
were limited to the population of women 20 years and older, who were likely to have completed
or mostly completed schooling.
When calculating the percentage of unintended pregnancies that ended in abortion, we
excluded miscarriages from the denominator in order to better represent pregnancies with
outcomes decided by the woman.
3. Results
Proportion of unintended pregnancies and unintended pregnancy rates
There were 6.7 million pregnancies in the United States in 2006 (Table 1), up from 6.4 million in
2001 (data not shown). Some 3.2 million pregnancies were unintended in 2006, compared with
3.1 million in 2001 (data not shown). The percentage of pregnancies that were unintended
increased slightly between 2001 (48%) and 2006 (49%), and the unintended pregnancy rate also
increased during this time period: In 2006, there were 52 unintended pregnancies for every 1000
women aged 15–44 years, compared with 50 in 2001. In other words, about 5% of women of
reproductive age had an unintended pregnancy in 2006. When looking at unintended pregnancy
by timing, 29% of all pregnancies were mistimed and 19% were unwanted (data not shown). The
intended pregnancy rate stayed nearly the same, and the overall pregnancy rate increased.
Age. The proportion of pregnancies that were unintended generally decreased with age, with
more than four out of five pregnancies unintended among women 19 years and younger.
Between 2001 and 2006, this percentage decreased for women 15–17 years and increased or
stayed nearly the same for all other women. The unintended pregnancy rate was the highest for
women 20–24 years old due to an increase between 2001 and 2006.

8
Educational attainment. Women with the fewest years of education had the highest
unintended pregnancy rate, and rates decreased as years of education attained increased.
Unintended pregnancy rates increased the most among women with no college experience.
Race and ethnicity. Black women had the highest unintended pregnancy rate among all racial
and ethnic subgroups, more than double that of non-Hispanic white women. Rates changed little
between 2001 and 2006.
Income. Poor and low-income women’s unintended pregnancy rates increased substantially,
while the rate for higher-income women decreased. The rate for poor women was more than five
times the rate for women in the highest income level. While there was little difference by
education among women in the highest income bracket (Fig. 1A), minorities had the highest
unintended pregnancy rates regardless of income level (Fig. 1B).
Relationship status. Unintended pregnancy rates increased among cohabitors and formerly
married women. Cohabiting women exhibited both the highest rate and the greatest increase
among all individual subgroups measured in this analysis. Rates were even higher among
cohabiting women who were under 25 years old (Fig. 2A) or poor or low-income (Fig. 2B).
Parity. Women with one previous birth had an unintended pregnancy rate that was roughly
twice as high as the rate for women who had never given birth and women with two or more
previous births.
Religious affiliation. Women with no religious affiliation reported the highest unintended
pregnancy rate, followed by Catholics, Protestants, and women with other affiliations.

9
Outcomes of unintended pregnancies
Forty-three percent of unintended pregnancies ended in abortion6 in 2006, a decline from 47% in
2001 (Table 2). In 2006, the unintended birth rate7
Age. Between 2001 and 2006, the proportion of unintended pregnancies ending in abortion
increased for women aged 15–17 years and declined or stayed the same for all other women. The
greatest declines were exhibited among women aged 18–24 years. As a result, the unintended
birth rate decreased for women 15–17 years and increased the most for women aged 18–24
years. Rates for women aged 18–24 years were more than twice the national rate.
was 25 per 1000 women aged 15–44 years, up
from 23 in 2001.
Educational attainment. Women with some college but no degree were most likely to end an
unintended pregnancy by abortion; these women were also more likely to still be enrolled in
school. Those without a high school diploma were most likely to continue an unintended
pregnancy, and had an unintended birth rate that was almost twice the national rate and nearly
four times the rate for college graduates.
Race and ethnicity. The proportion of unintended pregnancies ending in abortion decreased
across all racial and ethnic subgroups, with black women most likely to end an unintended
pregnancy by abortion. Hispanic women had the highest unintended birth rate, and minority
women had rates that were more than twice that of white women.
Income. Compared with higher-income women, poor and low-income women were less
likely to end an unintended pregnancy by abortion. Consequently, poor women had a relatively
high unintended birth rate. While lower-income women experienced an increase in the
6 As described above, this calculation excludes miscarriages. 7 The phrase “unintended birth rate” is shorthand for the rate of births that followed unintended pregnancies.

10
unintended birth rate, this rate remained relatively stable for women in the highest income
category.
Relationship status. Married and cohabiting women were much less likely than other women
to end an unintended pregnancy by abortion. The rate of unintended births among cohabiting
women increased sharply and was more than three times the rate for other women.
Parity. Women with exactly one previous birth were least likely to end an unintended
pregnancy by abortion, and their unintended birth rate was more than twice that of the other
groups.
Religious affiliation. Women with no religious affiliation were most likely to end an
unintended pregnancy by abortion; they also had the highest unintended birth rate, followed
closely by Catholics and Protestants. Evangelicals were least likely to terminate an unintended
pregnancy.
4. Discussion
The US unintended pregnancy rate increased slightly between 2001 and 2006, a worrisome
trend, and remains significantly higher than the rate in many other developed countries [24].
Population shifts — for example, increases in groups with high rates, such as poor and minority
women — may have contributed to the overall increase. In addition, the overall increase could
have occurred if the trend toward later childbearing [25] has led to a longer period before
childbearing when relatively less-effective methods are used [26] and a shorter period post-
childbearing when use of highly effective long-term methods is more common.

11
During the same period, the overall proportion of women ending an unintended pregnancy by
abortion decreased. These changes may have been due to decreased access to abortion in some
areas, increased stigmatization of abortion or both.
Among all the subgroups for which we present data, only women aged 15–17 years saw
notable improvements since 2001; both their unintended pregnancy rate and unintended birth rate
declined by roughly one quarter.
Many disparities among subgroups, already large, grew. In particular, cohabiting women
exhibited very high and increasing unintended pregnancy and unintended birth rates. Like
married women, cohabiting women are regularly sexually active but are less likely than married
women to desire pregnancy and, thus, are at a very high risk for unintended pregnancy. They are,
however, more likely to carry a pregnancy — including an unintended pregnancy — to term than
unmarried noncohabiting women, perhaps because they have more partner support. In addition,
the decline in the proportion of unintended pregnancies ending in abortion may have been related
to increased normalization of childbearing among these couples. These findings represent
consequences of broad demographic trends — specifically, fewer married women and a greater
proportion of childbearing to unmarried women — and also help to explain those trends by
showing that cohabiting couples, regardless of marital status, have high pregnancy rates and that
a large proportion of those pregnancies are unintended.
Poor and low-income women also experienced some of the greatest increases and highest
rates of unintended pregnancy. This finding is consistent with numerous studies that document
the association between disadvantage and higher risk for unintended pregnancy [27-29]. While
reasons behind this relationship are not fully understood, they are related to the significant life
challenges facing many of these women [30,31]. The upward trend in their unintended

12
pregnancy rate has continued for over a decade [10]. During this time, publicly funded family
planning clinics — which have been shown to help low income women achieve their
childbearing goals [32] — were only able to meet about 40% of the need for publicly subsidized
care [33]. This gap in services, along with rising unintended pregnancy rates, underscores the
need to expand programs that could enable low income women and couples to be more
consistent and effective contraceptive users.
The disparities by parity are probably explained by the desire for families with two children.
In other words, the high intended and unintended rates for women with one birth compared with
childless women or those with two or more births may be due to the fact that women reporting
only one birth may be more likely to have a second birth but are less likely to progress to a third
birth [34]. At the same time, their high unintended pregnancy rate suggests that mothers have
difficulties timing births, and their high unintended birth rate suggests less concern about
continuing an unintended pregnancy compared with other women.
This is an aggregate-level analysis incorporating data from multiple data sets, which makes
statistical testing difficult. One test that can be performed is a comparison based on a subset of
our data: the proportion of pregnancies ending in birth (i.e., excluding abortions, which are
underreported, and miscarriages) that were unintended in 2006 and 2001. The overall percentage
increase, from 35% to 36%, was not significant, although the increase among women aged 20–
24 years, from 45% to 53%, was significant at the p<.10 level. Nonetheless, we do see
substantively significant changes in unintended pregnancy rates in several subgroups. This
argues that the limited tests on a subset of our key statistic do not capture the whole picture, and
their results should not be considered conclusive.

13
In conclusion, the United States did not make progress toward its goal of reducing
unintended pregnancy between 2001 and 2006. To better understand what drove these rates up,
we are currently conducting a demographic analysis of changes in population composition and
reproductive health behaviors that have historically affected them. However, given the nation’s
increasingly high unintended pregnancy rate and the fact that 11% of the population at risk does
not use birth control [26], reducing the unintended pregnancy rate requires that we focus on
increasing and improving contraceptive use among women and couples who want to avoid
pregnancy. Increased use of long-acting and cost-effective contraceptive methods such as the
intrauterine device (IUD) could play an important role in such an effort. In particular, the age at
which childbearing begins has increased [25], and the length of time from first intercourse to first
birth is, on average, 8 years; this is a period of potential risk for women and couples and should
be seen as an appropriate time to use long-acting methods. The American Congress of
Obstetricians and Gynecologists has indicated that such methods should be “first-line” choices
for young women, and coupling IUDs with condoms for additional protection may have the
potential to reduce unintended pregnancy even further [35,36]. Although these methods are
highly cost-effective over time, even women with health insurance may have difficulty paying
for these methods because some plans do not cover the high upfront costs or other charges
women often incur to use them [37]. Research indicates that when financial barriers are
completely removed and comprehensive information is provided on all methods, women choose
long-acting, highly effective methods in large numbers [38].

14
Acknowledgments
The authors would like to thank Stanley Henshaw, Rachel Jones and Megan Kavanaugh for reviewing the manuscript, as well as Jacqueline Darroch and Susheela Singh for providing guidance on study methodology. This study was supported by award R01HD059896 from the Eunice Kennedy Shriver National Institute of Child Health and Human Development (NICHD). The content is solely the responsibility of the authors and does not necessarily represent the official views of NICHD or the National Institutes of Health.

15
References
[1] U.S. Department of Health and Human Services. Healthy People 2020 topics & objectives. HealthyPeople.gov.http://www.healthypeople.gov/2020/topicsobjectives2020/ objectiveslist. aspx?. Published December 2, 2010. Accessed March 7, 2011.
[2] Axinn WG, Barber JS, Thornton A. The long-term impact of parents' childbearing decisions on children's self-esteem. Demography 1998;35:435-43.
[3] Barber JS, Axinn WG, Thornton A. Unwanted childbearing, health, and mother-child relationships. J Health Soc Behav 1999;40:231-57.
[4] Dott M, Rasmussen SA, Hogue CJ, Reefhuis J. Association between pregnancy intention and reproductive-health related behaviors before and after pregnancy recognition, National Birth Defects Prevention Study, 1997-2002. Matern Child Health J 2010;14:373-81.
[5] Dye TD, Wojtowycz MA, Aubry RH, Quade J, Kilburn H. Unintended pregnancy and breast-feeding behavior. Am J Public Health 1997;87:1709-11.
[6] Hellerstedt WL, Pirie PL, Lando HA, et al. Differences in preconceptional and prenatal behaviors in women with intended and unintended pregnancies. Am J Public Health 1998;88:663–6.
[7] Mayer JP. Unintended childbearing, maternal beliefs, and delay of prenatal care. Birth 1997;24:247–52.
[8] Orr ST, Miller CA, James SA, Babones S. Unintended pregnancy and preterm birth. Paediatr Perinat Epidemiol 2000;14:309–13.
[9] Taylor JS, Cabral HJ. Are women with an unintended pregnancy less likely to breastfeed? J Fam Pract 2002;51:431–6.
[10] Henshaw SK. Unintended pregnancy in the United States. Fam Plann Perspect 1998;30:24–9 & 46.
[11] Finer LB, Henshaw SK. Disparities in rates of unintended pregnancy in the United States, 1994 and 2001. Perspect Sex Reprod Health 2006;38:90–6.
[12] Kost K, Henshaw S, Carlin L. U.S. teenage pregnancies, births and abortions: national and state trends and trends by race and ethnicity, 2010. New York: Guttmacher Institute; 2010.
[13] Centers for Disease Control and Prevention. Natality information: live births. CDC WONDER online database. http://wonder.cdc.gov/natality.html. Updated 2009. Accessed April 9, 2010.
[14] Martin JA, Hamilton BE, Ventura SJ, et al. Births: final data for 2001. Natl Vital Stat Rep 2002;51(2).
[15] Martin JA, Hamilton BE, Sutton PD, et al. Births: final data for 2006. Natl Vital Stat Rep 2009;57(7).
[16] Jones RK, Zolna MR, Henshaw SK, Finer LB. Abortion in the United States: incidence and access to services, 2005. Perspect Sex Reprod Health 2008;40:6–16.

16
[17] Pazol K, Gamble SB, Parker WY, Cook DA, Zane SB, Hamdan S. Abortion surveillance — United States, 2006. MMWR Surveill Summ 2009;58:1–35.
[18] Strauss LT, Herndon J, Chang J, Parker WY, Levy DA, Bowens SB, et al. Abortion surveillance — United States, 2001. MMWR Surveill Summ 2004;53:1–32.
[19] Jones RK, Darroch JE, Henshaw SK. Patterns in the socioeconomic characteristics of women obtaining abortions 2000-2001. Perspect Sex Reprod Health 2002;34:226–35.
[20] Jones RK, Finer LB, Singh S. Characteristics of U.S. abortion patients, 2008. New York: Guttmacher Institute; 2010.
[21] MacDorman M, Kirmeyer S. Fetal and perinatal mortality, United States, 2005. Natl Vital Stat Rep 2009;57:1–19.
[22] Ventura SJ, Abma JC, Mosher WD, Henshaw SK. Estimated pregnancy rates by outcome for the United States, 1990–2004. Natl Vital Stat Rep 2008;56:1-28.
[23] Centers for Disease Control and Prevention. Bridged-Race Population Estimates. CDC WONDER online database. http://wonder.cdc.gov/bridged-race-population.html. Updated 2011. Accessed January 10, 2011.
[24] Singh S, Sedgh G, Hussain R. Unintended pregnancy: worldwide levels, trends, and outcomes. Stud Fam Plann 2010;41:241-50.
[25] Mathews TJ, Hamilton B. Delayed childbearing: more women are having their first child later in life. NCHS Data Brief 2009;21:1–8.
[26] Mosher WD, Jones J. Use of contraception in the United States: 1982–2008. National Center for Health Statistics; 2010. Report No.: 23.
[27] Forrest JD, Frost JJ. The family planning attitudes and experiences of low-income women. Fam Plann Perspect 1996;28:246–55, 277.
[28] Frost JJ, Singh S, Finer LB. Factors associated with contraceptive use and nonuse, United States, 2004. Perspect Sex Reprod Health 2007;39:90–9.
[29] Frost JJ, Darroch JE. Factors associated with contraceptive choice and inconsistent method use, United States, 2004. Perspect Sex Reprod Health 2008;40:94–104.
[30] Centers for Disease Control and Prevention. CDC Health Disparities and Inequalities Report — United States, 2011. MMRW 2011;60 (Suppl):1–116.
[31] McLanahan S, Percheski C. Family structure and the reproduction of inequalities. Ann Rev Sociol 2008;34:257–76.
[32] Frost JJ, Finer LB, Tapales A. The impact of publicly funded family planning clinic services on unintended pregnancies and government cost savings. J Health Care Poor Underserved. 2008;19:778–96.
[33] Guttmacher Institute. Contraceptive needs and services, 2006, 2009. http://www.guttmacher.org/pubs/win/allstates2006.pdf. Accessed July 1, 2011.
[34] Frejka T, Sardon JP. Cohort birth order, parity progression ratio and parity distribution trends in developed countries. Demogr Res 2007;16: 315–74.

17
[35] Pazol K, Kramer MR, Hogue CJ. Condoms for dual protection: patterns of use with highly effective contraceptive methods. Public Health Rep 2010;125:208–17.
[36] ACOG Committee on Practice Bulletins. Clinical management guidelines for obstetrician-gynecologists: intrauterine device. Obstet Gynecol 2005;105:223–32.
[37] Sonfield A, Gold RB, Frost JJ, Darroch JE. U.S. insurance coverage of contraceptives and the impact of contraceptive coverage mandates, 2002. Perspect Sex Reprod Health 2004;36:72–9.
[38] Secura GM, Allsworth JE,Madden T,Mullersman JL, Peirpert JF. The Contraceptive CHOICE Project: reducing barriers to long-acting reversible contraception. Am J Obstet Gyn 2011;203:115.e1–7.

18
Table 1. Number of Pregnancies, Percentage of Pregnancies Unintended and Pregnancy Rate by Intention for All Women and by Demographic Characteristics
Characteristics
No. of Pregnancies (000), 2006
Percentage of Pregnancies Unintended
Total Pregnancy
Ratea
Intended Pregnancy
Ratea
Unintended Pregnancy
Ratea Total Unintended 2001 2006 2001 2006 2001 2006 2001 2006
All women 6,658 3,240 48 49 104 108 54 55 50 52 Age (years)b
<15 21 21 98 98 3 2 0 0 2 2 15–19 769 629 82 82 82 74 14 13 67 60
15–17 263 209 89 79 47 42 5 9 42 33 18–19 505 420 79 83 133 124 28 21 105 103
20–24 1,716 1,094 59 64 172 168 72 61 101 107 25–29 1,751 715 40 41 171 174 102 103 69 71 30–34 1,334 440 33 33 131 139 88 93 43 46 35–39 832 230 28 28 68 80 49 58 19 22 ≥40 235 112 49 48 18 21 9 11 9 10
Educational attainmentc
Not HS graduate 853 445 49 52 146 154 74 74 72 80 HS graduate/equivalent 1,709 826 47 48 113 122 60 63 53 59 Some college/assoc. degree 1,565 813 52 52 90 94 43 45 47 49 College graduate 1,742 459 24 26 105 113 80 84 26 30
Race and ethnicityd
White non-Hispanic 3,471 1,392 40 40 87 89 52 53 34 36 Black non-Hispanic 1,193 805 67 67 138 136 45 44 93 91 Hispanic 1,551 824 54 53 147 155 67 72 80 82
Income as a percentage of poverty <100% 1,970 1,221 61 62 196 214 77 82 120 132
100–199% 1,786 1,026 54 57 146 157 66 67 79 90 ≥200% 2,902 993 37 34 74 70 46 46 28 24
19
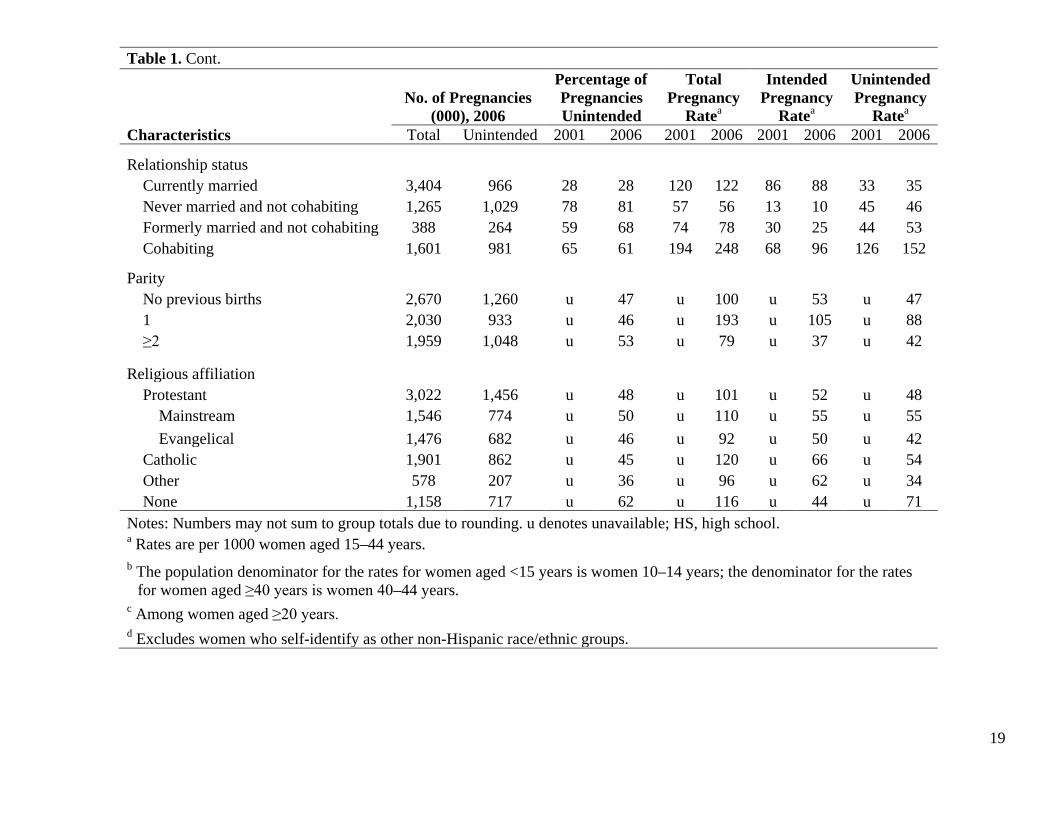
Table 1. Cont.
Characteristics
No. of Pregnancies (000), 2006
Percentage of Pregnancies Unintended
Total Pregnancy
Ratea
Intended Pregnancy
Ratea
Unintended Pregnancy
Ratea Total Unintended 2001 2006 2001 2006 2001 2006 2001 2006
Relationship status Currently married 3,404 966 28 28 120 122 86 88 33 35
Never married and not cohabiting 1,265 1,029 78 81 57 56 13 10 45 46 Formerly married and not cohabiting 388 264 59 68 74 78 30 25 44 53 Cohabiting 1,601 981 65 61 194 248 68 96 126 152
Parity No previous births 2,670 1,260 u 47 u 100 u 53 u 47
1 2,030 933 u 46 u 193 u 105 u 88 ≥2 1,959 1,048 u 53 u 79 u 37 u 42
Religious affiliation Protestant 3,022 1,456 u 48 u 101 u 52 u 48
Mainstream 1,546 774 u 50 u 110 u 55 u 55 Evangelical 1,476 682 u 46 u 92 u 50 u 42
Catholic 1,901 862 u 45 u 120 u 66 u 54 Other 578 207 u 36 u 96 u 62 u 34 None 1,158 717 u 62 u 116 u 44 u 71
Notes: Numbers may not sum to group totals due to rounding. u denotes unavailable; HS, high school. a Rates are per 1000 women aged 15–44 years.
b The population denominator for the rates for women aged <15 years is women 10–14 years; the denominator for the rates for women aged ≥40 years is women 40–44 years.
c Among women aged ≥20 years. d Excludes women who self-identify as other non-Hispanic race/ethnic groups.

20
Table 2. Percentage of Unintended Pregnancies Ending in Abortion and Unintended Birth Rate for All Women and by Demographic Characteristics
Characteristics
Percentage of Unintended Pregnancies
Ending in Abortiona Unintended Birth Rateb
2001 2006 2001 2006
All women 47 43 23 25 Age (years)c
<15 50 49 1 1 15–19 39 37 35 32
15–17 37 41 21 16 18–19 40 35 54 57
20–24 47 41 47 56 25–29 49 46 31 33 30–34 47 45 20 22 35–39 56 56 7 7 ≥40 47 46 3 4
Educational attainmentd
Not HS graduate 34 32 41 46 HS graduate/equivalent 43 40 26 30 Some college/assoc. degree 59 56 17 19 College graduate 54 49 10 12
Race and ethnicitye White non-Hispanic 42 39 17 18
Black non-Hispanic 57 52 35 37 Hispanic 40 38 42 45
Income as a percentage of poverty <100% 40 43 63 66
100–199% 48 38 36 46 ≥200% 51 49 11 10

21
Table 2. Cont.
Percentage of
Unintended Pregnancies Ending in Abortiona
Unintended Birth Rateb
Characteristics 2001 2006 2001 2006
Relationship status Currently married 24 22 21 23
Never married and not cohabiting 59 61 16 15 Formerly married and not cohabiting 66 60 12 17 Cohabiting 53 39 53 79
Parity No previous births u 44 u 22
1 u 40 u 45 ≥2 u 46 u 19
Religious affiliation Protestant u 38 u 25
Mainstream u 44 u 26 Evangelical u 32 u 24
Catholic u 44 u 26 Other u 47 u 15 None u 51 u 30
Notes: u denotes unavailable; HS, high school. a Pregnancies exclude spontaneous fetal losses and stillbirths.
b Rates are per 1000 women aged 15–44 years. c The population denominator for the rates for women aged <15 years is women 10–14 years;
the denominator for the rates for women aged ≥40 years is women 40–44 years. d Among women aged ≥20 years.
e Excludes women who self-identify as other non-Hispanic race/ethnic groups.

22
Fig. 1. (A) Unintended pregnancy rates for poor women were inversely related to educational attainment, but rates among women in the highest income bracket varied little across education levels. (a) Rates for educational attainment are among women aged 20–44 years. (b) Rates for college graduates at <100% and 100%–199% of poverty are combined to account for small sample sizes. (B) Among poor women, Hispanics had the highest unintended pregnancy rate, and among the low- and higher-income groups, black women had the highest rate. Note: This figure excludes women who self-identify as other non-Hispanic race/ethnic groups.

23
Fig. 2. (A) Teens had relatively high unintended pregnancy rates among married and cohabiting women, but noncohabiting teens had a low unintended pregnancy rate. (a) The rate for married women aged 15–19 years is not available. (B) Women in lower-income groups had relatively high unintended pregnancy rates regardless of relationship status. Cohabiting women had the highest rates across all income levels, and among them, poor or low-income women had very high rates. Notes: Unmarried women include never-married and formerly married women. Cohabiting women were not married.