Breast cancer incidence and mortality in a Caribbean population: comparisons with African-Americans
Upload
khangminh22Category
view
0download
0
Cancer Incidence and Mortality in Delaware
Prepared by Delaware’s Division of Public Health
May 2010

This report is made possible with funding from the Delaware Health Fund, with strategic leadership and guidance provided by the Delaware Cancer Consortium.

i
Delaware Cancer Incidence and Mortality, 2002-06 Executive Summary
From 1992-96 to 2002-06, Delaware’s cancer incidence rate decreased 3.8 percent, compared to 5.1 percent nationally. The decline was greater for Delaware males (7.9 percent) than females (1.8 percent) and for African Americans (12.4 percent) compared to Caucasians (2.3 percent).
Declines in cancer mortality have been more significant. During this same time, Delaware’s cancer death rate decreased 18.9 percent, compared to 11.5 percent nationally. The decline was greater for Delaware males (22.9 percent) than females (16.7 percent) and for African Americans (30.8 percent) compared to Caucasians (16.8 percent). Mortality rates decreased for all of the types of cancer included in this report.
Many factors contribute to the progress that Delaware has made in reducing the cancer burden in our state. Here are some examples.
• From 1992-96 to 2002-06, Delaware’s decline in female breast cancer incidence was 71.2 percent greater than the decline at the national level. Furthermore, Delaware’s 2002-06 breast cancer incidence rate for Caucasian women (122.1 per 100,000) was significantly lower than the U.S. rate (127.8 per 100,000). Increases in early detection may be responsible for some of this progress. In 2008, Delaware ranked 5th highest in the nation for breast cancer screening among women age 40 and older.
• From 1992-96 to 2002-06, Delaware’s colorectal cancer incidence rate declined 15.4 percent
while the comparable U.S. rate declined 12.0 percent. During the same time, Delaware’s colorectal cancer mortality rate declined 24.2 percent while the comparable U.S. rate declined 20.5 percent. The decline in colorectal cancer mortality rates has been especially pronounced among African American females. Again, increases in early detection may be responsible for some of this improvement. In 2008, Delaware led the nation in colorectal cancer screening. Over 74 percent of Delawareans age 50 and older reported ever having had a sigmoidoscopy or colonoscopy, compared to 62 percent nationally. In recent years, colorectal cancer screening prevalence has increased dramatically among African American Delawareans. In 2008, Delaware’s colorectal cancer screening rate for African Americans was 25.4 percent greater than the comparable U.S. rate.
• An estimated 87 percent of all lung cancer cases are caused by tobacco use. Delaware is
now reaping the benefits of reductions in tobacco use that started to occur decades ago. Delaware’s current adult smoking prevalence rate (17.8 percent) is the lowest in state history.
• The proportion of prostate cancer cases in Delaware that are detected in the local stage has
dramatically increased over the past 30 years. For 2002-06, 86.7 percent of prostate cancer cases diagnosed in Delaware were detected in the local stage compared to just 49.6 percent of cases diagnosed in 1980-84.
Despite Delaware’s progress in reducing the state’s overall cancer burden, Delaware’s 2002-06 cancer incidence rate (507.0 per 100,000) was 9.5% higher than that of the U.S. (462.9 per 100,000). Delaware’s 2002-06 cancer mortality rate (194.3 per 100,000) was 4.0% higher than that of the nation (186.9 per 100,000). There is still much work to be done:

ii
• Lung cancer continues to play an enormous role in Delaware’s overall cancer burden. For
2002-06, lung cancer accounted for 16.0 percent of all new cancer cases and 31.1 percent of all cancer deaths in the state. Unfortunately, the ability to detect lung cancer early, and effective treatment options, are not nearly as good as for some other cancers.
• For 2002-06, 57.5 percent of all colorectal cancer cases diagnosed in Delaware were
detected in the regional or distant stages, after the cancer had spread from its original location. Although this reflects a small improvement since 1992-96, when 61.8 percent of cases were diagnosed in the regional or distant stages, most colorectal cancers are still diagnosed in the advanced stages.
• The prostate cancer burden among men continues to disproportionately affect African
Americans. The 2002-06 prostate cancer incidence rate for African American males in Delaware was 1.7 times greater than the rate for Delawarean Caucasian males. Similarly, the 2002-06 prostate cancer mortality rate for African American males in Delaware was 2.1 times greater than the rate for Delawarean Caucasian males.
This report includes data for overall cancer as well as 13 site-specific cancers (female breast, cervical, colorectal, Hodgkin lymphoma (HL), leukemia, lung, myeloma, non-Hodgkin lymphoma (NHL), prostate, stomach, thyroid, urinary bladder and uterine cancers). Tables A and B provide a brief summary of Delaware’s 2002-06 incidence and mortality rates compared to the U.S rates. In addition, as required by Title 16, Chapter 292 of the Delaware Code (Appendix F), this report includes cancer rates for each of Delaware’s census tracts. Data used are the 2002-2006 average annual age-adjusted rates. Of 22,760 cancer cases, 97.4 percent were successfully geocoded (the residential census tract of the individual was identified). In 45 of Delaware’s 197 census tracts, the overall cancer incidence rates were significantly higher than Delaware’s average incidence rate (507.0 per 100,000), while rates were significantly lower in 22 census tracts. Rates for the remaining 129 census tracts were not significantly different from the state’s average rate. Cancer rates may differ between census tracts for a variety of reasons: • Clustering of lifestyle behaviors (e.g. smoking); • Environmental or occupational exposure to chemicals, or lack thereof; • Access to health care (e.g. more or less cancer screening); • Chance, or random variation.

iii
Table A: 2002-06 Average Annual Age-Adjusted Cancer Incidence Rates, Delaware vs. U.S.
Delaware Rate 2002-06
U.S. Rate 2002-06
Delaware % Change: 1992-96 vs. 2002-06
U.S % Change: 1992-96 vs. 2002-06
All Site 507.0 (500.4, 513.6)* 462.9 (462.2, 463.6) ↓ 3.8% ↓ 5.1% Female Breast 122.6 (118.2, 127.0) 123.8 (123.3, 124.3) ↓ 10.1% ↓ 5.9% Cervical 8.2 (7.0, 9.4) 8.2 (8.1, 8.3) ↓ 27.4% ↓ 13.7% Colorectal 51.7 (49.6, 53.8)* 49.1 (48.9, 49.3) ↓ 15.4% ↓ 12.0% HL 3.5 (3.0, 4.1)* 2.8 (2.7, 2.9) ↑ 12.9% No change Leukemia 10.5 (9.6, 11.5)* 12.2 (12.1, 12.3) ↓ 6.2% ↓ 6.9% Lung 80.5 (77.9, 83.1)* 63.1 (62.8, 63.4) ↓ 8.0% ↓ 6.5% Myeloma 5.3 (4.6, 5.9) 5.6 (5.5, 5.7) ↑ 8.2% ↓ 3.4% NHL 19.2 (17.9, 20.5) 19.5 (19.4, 19.6) ↑ 45.5% ↑ 1.0% Prostate 178.0 (172.2, 208.5)* 159.3 (158.7, 159.9) ↓ 15.7% ↓ 17.0% Stomach 7.1 (6.3, 7.9) 7.9 (7.8, 8.0) (not available) ↓ 9.1% Thyroid 10.8 (9.8, 11.8)* 9.6 (9.5, 9.7) ↑ 111.8% ↑ 57.4% Urinary bladder 24.5 (23.1, 26.0)* 21.0 (20.9, 21.1) ↑ 8.9% ↑ 1.0% Uterine 28.2 (26.1, 30.3)* 23.3 (23.1, 23.5) ↑ 20.0% ↑ 8.4% All rates are per 100,000. Numbers in parentheses represent 95 percent confidence intervals. HL=Hodgkin lymphoma; NHL=non-Hodgkin lymphoma Stomach cancer incidence rates have not previously been calculated at the state level; therefore, historical trend data for are not available for Delaware. Beginning with reporting year 2002-06, U.S. incidence rates were based on SEER 17 areas whereas earlier rates were based on SEER 9. As a result, rate comparisons over time may be not always be comparable. See Appendix B for more information. Methodology for the assignment of Hodgkin lymphoma and non-Hodgkin lymphoma was modified beginning in reporting period 2001-2005 to include consideration of histology as well as primary site. Incidence rates for these two types of cancer increased because of this change. * = Statistically significant compared to the U.S. rate at the 95% confidence level. Table B: 2002-06 Average Annual Age-Adjusted Cancer Mortality Rates, Delaware vs. U.S.
Delaware Rate 2002-06
U.S. Rate 2002-06
Delaware % Change: 1992-96 vs. 2002-06
U.S % Change: 1992-96 vs. 2002-06
All Site 194.3 (190.2, 198.4)* 186.9 (186.7, 187.1) ↓ 18.9% ↓ 11.5% Female Breast 23.5 (21.6, 25.4) 24.5 (24.4, 24.6) ↓ 30.1% ↓ 20.5% Cervical 2.5 (1.9, 3.2) 2.5 (2.4, 2.5) ↓ 43.2% ↓ 24.2% Colorectal 18.5 (17.3, 19.8) 18.2 (18.1, 18.3) ↓ 24.2% ↓ 20.5% HL --- 0.4 (0.4, 0.5) --- ↓ 33.3% Leukemia 7.4 (6.6, 8.2) 7.3 (7.3, 7.3) ↓ 9.8% ↓ 7.6% Lung 59.9 (57.7, 62.2)* 53.4 (53.3, 53.5) ↓ 14.9% ↓ 8.9% Myeloma 3.2 (2.7, 3.8) 3.6 (3.6, 3.6) ↓ 22.0% ↓ 7.7% NHL 6.8 (6.0, 7.5) 7.1 (7.1, 7.1) ↓ 18.1% ↓ 16.5% Prostate 26.8 (24.3, 29.2) 25.6 (25.5, 25.8) ↓ 40.4% ↓ 32.8% Stomach 3.8 (3.2, 4.3) 4.0 (3.9, 4.0) (not available) ↓ 25.9% Thyroid --- 0.5 (0.5, 0.5) --- ↑ 25.0% Urinary bladder 5.8 (5.1, 6.5)* 4.3 (4.3, 4.4) ↓ 1.7% ↓ 2.3% Uterine 4.7 (3.9, 5.6) 4.1 (4.1, 4.2) ↓ 2.1% ↓ 2.4% All rates are per 100,000. Numbers in parentheses represent 95 percent confidence intervals. ‘---‘ = data suppressed due to low numbers. HL=Hodgkin lymphoma; NHL=non-Hodgkin lymphoma; Stomach cancer mortality rates have not previously been calculated at the state-level; therefore, historical trend data for stomach cancer mortality are not available for Delaware. * = Statistically significant compared to the U.S. rate at the 95% confidence level.

CONTENTS EXECUTIVE SUMMARY………………………………………………………………………………… i 1. INTRODUCTION………………………………………………………………………...................... 1
Delaware Cancer Registry Reporting Facilities Data Confidentiality Data Quality NAACCR Certification and NPCR Standard Status Data Uses Organization of this Report
2. GUIDELINES FOR THE INTERPRETATION OF INCIDENCE AND MORTALITY RATES….. 33. ALL CANCER SITES (ALL SITE CANCER)……………………………………………………….. 4
Data Highlights All Site Cancer Incidence All Site Cancer Mortality
4. FEMALE BREAST CANCER………………………………………………………………………… 12Risk Factors and Early Detection Data Highlights Female Breast Cancer Incidence Female Breast Cancer by Stage at Diagnosis Female Breast Cancer Mortality
5. CERVICAL CANCER…………………………………………………………………………………. 22Risk Factors and Early Detection Data Highlights Cervical Cancer Incidence Cervical Cancer by Stage at Diagnosis Cervical Cancer Mortality
6. COLORECTAL CANCER…………………………………………………………………………….. 30Risk Factors and Early Detection Data Highlights Colorectal Cancer Incidence Colorectal Cancer by Stage at Diagnosis Colorectal Cancer Mortality
7. HODGKIN LYMPHOMA……………………………………………………………………………… 41Risk Factors and Early Detection Data Highlights Hodgkin Lymphoma Incidence Hodgkin Lymphoma by Stage at Diagnosis Hodgkin Lymphoma Mortality
8. LEUKEMIA……………………………………………………………………………………………... 48Risk Factors and Early Detection Data Highlights Leukemia Incidence Leukemia by Stage at Diagnosis Leukemia Mortality
9. LUNG AND BRONCHIAL CANCER………………………………………………………………… 56Risk Factors and Early Detection Data Highlights Lung and Bronchial Cancer Incidence Lung and Bronchial Cancer by Stage at Diagnosis Lung and Bronchial Cancer Mortality
10. MYELOMA……………………………………………………………………………………………. 67Risk Factors and Early Detection Data Highlights Myeloma Incidence

Myeloma by Stage at Diagnosis Myeloma Mortality
11. NON-HODGKIN LYMPHOMA (NHL)……………………………………………………………… 75Risk Factors and Early Detection Data Highlights Non-Hodgkin Lymphoma Incidence Non-Hodgkin Lymphoma by Stage at Diagnosis Non-Hodgkin Lymphoma Mortality
12. PROSTATE CANCER………………………………………………………………………………. 84Risk Factors and Early Detection Data Highlights Prostate Cancer Incidence Prostate Cancer by Stage at Diagnosis Prostate Cancer Mortality
13. STOMACH CANCER………………………………………………………………………………... 93Risk Factors and Early Detection Data Highlights Stomach Cancer Incidence Stomach Cancer by Stage at Diagnosis Stomach Cancer Mortality
14. THYROID CANCER…………………………………………………………………………………. 100Risk Factors and Early Detection Data Highlights Thyroid Cancer Incidence Thyroid Cancer by Stage at Diagnosis Thyroid Cancer Mortality
15. URINARY BLADDER CANCER……………………………………………………………………. 106Risk Factors and Early Detection Data Highlights Urinary Bladder Cancer Incidence Urinary Bladder Cancer by Stage at Diagnosis Urinary Bladder Cancer Mortality
16. UTERINE CANCER…………………………………………………………………………………. 116Risk Factors and Early Detection Data Highlights Uterine Cancer Incidence Uterine Cancer by Stage at Diagnosis Uterine Cancer Mortality
17. CANCER INCIDENCE BY CENSUS TRACT……………………………………………………. 124Background Methods Results
REFERENCES……………………………………………………………………………………..…….... 126APPENDIX A: HISPANIC CANCER RATES………………………………………………….……….. 127APPENDIX B: CANCER INCIDENCE AND MORTALITY METHODOLOGY……………………... 129APPENDIX C: PRIMARY CANCER SITE DEFINITIONS…………………………….…….………… 133APPENDIX D: DELAWARE POPULATION ESTIMATES, 1980-2006…………………….……….. 134APPENDIX E: BEHAVIORAL RISK FACTORS………………………………………………………. 143APPENDIX F: TITLE 16 CHAPTER 292 OF THE DELAWARE CODE......................................... 145APPENDIX G: CANCER INCIDENCE BY CENSUS TRACT METHODOLOGY……….…………. 147APPENDIX H: INTERPRETING CANCER RATES BY CENSUS TRACT.…………………...……. 152APPENDIX I: TABLE OF CANCER INCIDENCE RATES BY CENSUS TRACT …………………. 155APPENDIX J: QUINTILE MAPS OF 2002-2006 CANCER RATES…………………………………. 160APPENDIX K: SIGNIFICANTLY HIGH/LOW MAPS OF 2002-2006 CANCER RATES…….……. 170

1
1. INTRODUCTION Delaware Cancer Registry The Delaware Cancer Registry (DCR) is managed by the Delaware Division of Public Health (DPH) and serves as the state’s central cancer information center. The DCR was founded in 1972 and legally established in 1980 under the Delaware Cancer Control Act. The act stipulated that all hospitals, clinical laboratories and cancer treatment centers in the state report all new cancer cases to the DCR. In 1996, the Delaware Cancer Control Act was amended to require any health care practitioner who diagnoses or provides treatment to report cancer cases to the DCR. Further enhancements of the Delaware Cancer Control Act took effect in 2002 with the passage of Senate Bill 372. Senate Bill 372 required physicians to provide additional information to the DCR, including patients’ duration of residence in Delaware and their occupational history. Senate Bill 372 also extended the reporting deadline to 180 days from initial diagnosis or treatment. Today, Delaware is one of 45 states whose central cancer registry is supported by the National Program of Cancer Registries (NPCR) of the Centers for Disease Control and Prevention. The DCR ensures accurate, timely and routine surveillance of cancer trends among Delawareans. Reporting Facilities A total of 33 facilities submit data to the DCR; these facilities include seven hospitals, 10 diagnostic laboratories, 15 free-standing ambulatory surgery centers, and hundreds of physician offices. Additionally, the DCR has established reciprocal data exchange agreements with Alaska, Florida, Maryland, New Jersey, Pennsylvania, South Carolina, Texas, Washington, Wyoming and the District of Columbia. Interstate data exchange agreements assist in the identification of Delawareans whose cancers were diagnosed and/or treated in other states. Data Confidentiality The DCR maintains patient confidentiality using a combination of techniques. Cancer data are submitted from reporting facilities using computerized data encryption techniques. Published reports and data releases are limited to aggregate data. DCR datasets are released only after the removal of all personal identifiers. Researchers who use DCR data must comply with the regulations stated in DPH data use agreements or obtain clearance from Delaware’s Human Subjects Review Board. Data Quality Internal quality control procedures are implemented at the DCR to verify the consistency of cancer data. Data consistency standards are set by the North American Association of Central Cancer Registries (NAACCR). The DCR also conducts record consolidation using a computerized matching program to identify multiple reports on the same individual. This scenario often arises when a patient is diagnosed and treated in separate hospitals, and each hospital submits a cancer case abstract to the DCR. NAACCR Certification and NPCR Standard Status NAACCR certifies DCR data on an annual basis. Gold or Silver Standard certifications are awarded following an evaluation of data quality, completeness, and timeliness of reporting. The DCR has received Gold Standard certification for data from diagnosis years 1997, 1998, 1999, 2002, 2003, 2004, 2005 and 2006.

2
Additionally, NPCR provides an annual Standard Status Report to state cancer registries supported by the CDC. Delaware’s data submission for diagnosis years 1997–2006 met the standard levels for quality, completeness and timeliness. Data Uses DPH uses DCR data to support various programs and initiatives including the Screening for Life Program and the Delaware Cancer Treatment Program. DPH also uses DCR data to investigate citizen inquiries and provide up-to-date cancer statistics to federal agencies, research institutions and academic institutions. The Delaware Cancer Consortium and other advisory committees rely heavily on DCR data to monitor cancer trends across the state. Organization of This Report This report focuses on all site cancer, as well as 13 other cancer types (female breast, cervical, colorectal, Hodgkin lymphoma, leukemia, lung, myeloma, non-Hodgkin lymphoma, prostate, stomach, thyroid, urinary bladder and uterine cancers). Delaware’s cancer incidence and mortality statistics are broken down by sex, race and county. Race-specific data are limited to Caucasians and African Americans; cancer rates for other racial groups (e.g., Hispanics) are not presented due to small sample size issues and the need to protect patient confidentiality. Relevant behavioral risk factor data and stage at diagnosis are also presented throughout the report. Appendices A-K contain supplemental methodological information related to the report. Appendix E summarizes behavioral risk factor data specific to Delawareans.

3
2. GUIDELINES FOR THE INTERPRETATION OF INCIDENCE AND MORTALITY RATES
Rates are expressed per 100,000 individuals (i.e., cancer rates for Delaware are expressed per 100,000 Delawareans; cancer rates for the U.S. are expressed per 100,000 U.S. residents). Ninety-five percent (95%) confidence intervals were computed for each cancer rate. Confidence intervals represent the range of values in which the cancer rate could reasonably fall.
Confidence intervals were used to determine if the amount by which two cancer rates differ was statistically significant. If the confidence interval for one rate did not overlap with the confidence interval for another rate, the two rates were significantly different. When one rate is significantly different from another rate, the difference between the rates is larger than would be expected by chance alone. If the confidence interval for one rate overlapped with the confidence interval for another rate, the two rates were not significantly different. When rates are not significantly different from one another, it is commonly interpreted as “no meaningful difference” between rates.

4
3. All Cancer Sites (All Site)
Data Highlights New All Site Cancer Cases and Deaths (Tables 3.1 and 3.4)
A total of 22,760 cases of cancer were diagnosed in Delaware between 2002 and 2006: 12,078 cases (53.1 percent) were diagnosed among males and 10,682 cases (46.9 percent) were diagnosed among females.
Between 2002 and 2006, 8,712 Delawareans died from cancer: 4,603 decedents (52.8 percent) were male and 4,109 decedents (47.2 percent) were female.
All Site Cancer Incidence and Mortality Rates (Tables 3.2 and 3.5)
Delaware’s 2002-06 all site cancer incidence rate of 507.0 per 100,000 was significantly higher than the U.S. rate of 462.9 per 100,000.
The 2002-06 Delaware all site cancer incidence rate among males (603.5 per 100,000) was significantly higher than the rate among females (436.8 per 100,000); this difference persisted in all race and county groups.
Delaware’s 2002-06 all site cancer incidence rate for African Americans (538.3 per 100,000) was significantly higher than the rate for Caucasians (501.7 per 100,000).
Incidence rates were significantly higher for African American males than for Caucasian males at the all geographic levels with the exception of Kent County.
At both the national level and Kent County, incidence rates for African American women were significantly lower than among Caucasian women. In contrast, incidence rates for African American and Caucasian females did not differ significantly for Delaware as a whole or for New Castle and Sussex Counties.
Delaware’s 2002-06 overall cancer mortality rate of 194.3 per 100,000 was significantly higher than the U.S. rate of 186.9 per 100,000.
In Delaware, the 2002-06 all site cancer mortality rate for males (242.4 per 100,000) was significantly higher than that for females (162.0 per 100,000). This significant difference was observed among all race and county groups. At the national level, the all site cancer mortality rate for males was also significantly greater than that for females (229.9 per 100,000 vs. 157.8 per 100,000, respectively).
In the U.S., Delaware, and Sussex County, 2002-06 all site cancer mortality rates for African Americans of either sex were significantly higher than mortality rates for their Caucasian counterparts.
The Kent County mortality rates for African Americans of either sex were not significantly different from rates for their Caucasian counterparts.
The New Castle County mortality rate for African American males was significantly higher than the rate for Caucasian males; mortality rates for African American and Caucasian females in New Castle County were not significantly different.
Trends in All Site Cancer Incidence and Mortality Rates (Figures 3.1–3.2 and 3.4–3.5)
Delaware’s all site cancer incidence rate decreased 3.8 percent from 1992-96 to 2002-06. During the same ten-year period, the U.S. all site cancer incidence rate decreased 5.1 percent.
In Delaware, the percentage decrease in all site cancer incidence rates was larger for African Americans compared to Caucasians (12.4 percent vs. 2.3 percent, respectively) and for males compared to females (7.9 percent vs. 1.8 percent, respectively).
Delaware’s all site cancer incidence rate for African American males has seen the greatest ten-year reduction, falling 20.9 percent from 1992-96 to 2002-06.

5
During the same 10-year period, all site cancer incidence rates fell among Caucasian males, Caucasian females, and African American females by 5.9 percent, 0.9 percent and 4.5 percent, respectively.
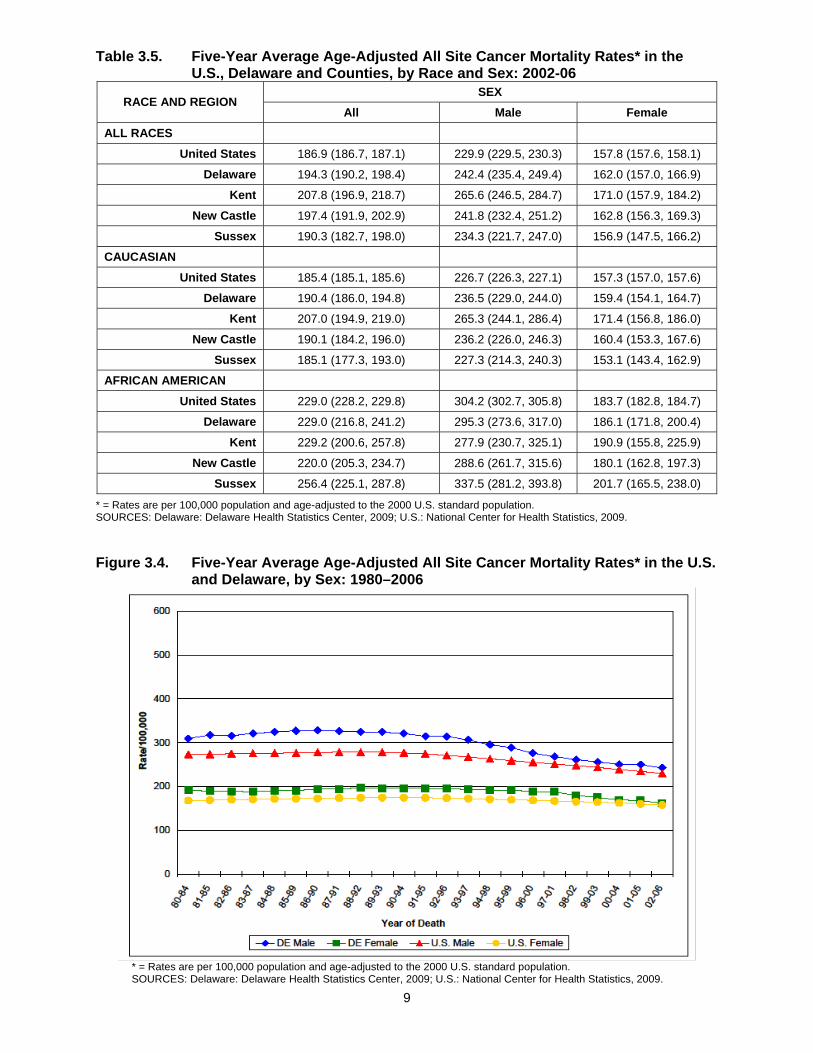
Historically, the all site cancer mortality rate for Delaware has been higher than that for the U.S.
In Delaware, between 1992-96 and 2002-06, the all site cancer mortality rate for males and females decreased 22.9 percent and 16.7 percent, respectively.
In the U.S., during the same period, the all site cancer mortality rate for males and females decreased 15.3 percent and 9.0 percent, respectively.
For 2002-06, African American males in Delaware had the highest all site cancer mortality rate. However, they are also the group with the largest percentage decrease in cancer mortality; over the last 10 years (from 1992-96 to 2002-06), the all site cancer mortality rate for African American males in Delaware decreased 37.7 percent.
From 1992-96 to 2002-06, Delaware’s all site cancer mortality rates decreased for Caucasian males, Caucasian females and African American females by 20.2 percent, 15.3 percent and 24.9 percent, respectively.
Age-Specific Incidence and Mortality (Tables 3.3 and 3.6, Figures 3.3 and 3.6)
For all sex and race groups, the risk of developing cancer increased with age, from birth through ages 75-84. Cancer risk then decreased slightly among those ages 85 and older.
For all sex and race groups, all site cancer mortality rates increased with age. The highest cancer mortality rate occurred among those ages 85 and older.
All Site Cancer Incidence Table 3.1. Total Number of Cancer Cases in Delaware and Counties, by Race and Sex:
2002-06 All Races Caucasian African American
REGION All Male Female All Male Female All Male Female
Delaware 22,760 12,078 10,682 18,838 9,960 8,878 3,470 1,876 1,594
Kent 3,637 1,943 1,694 2,955 1,555 1,400 589 340 249
New Castle 13,062 6,793 6,272 10,526 5,435 5,091 2,291 1,226 1,065
Sussex 6,058 3,342 2,716 5,357 2,970 2,387 590 310 280
SOURCE: Delaware Cancer Registry, Delaware’s Division of Public Health, 2009.

6
Table 3.2. Five-Year Average Age-Adjusted All Site Cancer Incidence Rates* in the U.S., Delaware and Counties, by Race and Sex: 2002-06
SEX RACE AND REGION
All Male Female ALL RACES
United States 462.9 (462.2, 463.6) 541.9 (540.8, 543.0) 408.5 (407.6, 409.4)
Delaware 507.0 (500.4, 513.6) 603.5 (592.8, 614.3) 436.8 (428.5, 445.1)
Kent 530.3 (513.1, 547.6) 640.0 (611.5, 668.4) 450.6 (429.1, 472.1)
New Castle 516.4 (507.5, 525.2) 606.0 (591.6, 620.4) 438.7 (427.9, 449.6)
Sussex 495.7 (483.2, 508.2) 582.0 (562.3, 601.7) 427.6 (411.5, 443.7)
CAUCASIAN
United States 470.6 (469.8, 471.4) 544.3 (543.0, 545.6) 420.5 (419.5, 421.5)
Delaware 501.7 (494.6, 508.9) 588.1 (576.5, 599.6) 439.7 (430.5, 448.8)
Kent 536.7 (517.3, 556.0) 633.7 (602.2, 665.2) 469.4 (444.8, 493.9)
New Castle 503.3 (493.7, 512.9) 591.1 (575.4, 606.8) 443.8 (431.6, 456.0)
Sussex 482.6 (469.7, 495.5) 565.1 (544.8, 585.4) 416.6 (399.9, 433.3)
AFRICAN AMERICAN
United States 493.6 (491.1, 496.1) 633.7 (629.6, 637.8) 398.9 (396.0, 401.8)
Delaware 538.3 (520.4, 556.2) 695.4 (663.9. 726.9) 427.2 (406.3, 448.2)
Kent 509.0 (467.9, 550.2) 656.6 (586.8, 726.3) 387.1 (339.0, 435.2)
New Castle 534.0 (512.1, 555.9) 691.8 (653.1, 730.5) 426.6 (401.0, 452.3)
Sussex 571.2 (525.1, 617.3) 732.5 (651.0, 814.1) 465.9 (411.3, 520.5)
* = Rates are per 100,000 population and age-adjusted to the 2000 U.S. standard population. SOURCES: Delaware: Delaware Cancer Registry, Delaware’s Division of Public Health, 2009; U.S.: Surveillance, Epidemiology, and End Results Program, National Cancer Institute, 2009.

7
Figure 3.1. Five-Year Average Age-Adjusted All Site Cancer Incidence Rates* in the
U.S. and Delaware, by Sex: 1980–2006
* = Rates are per 100,000 population and age-adjusted to the 2000 U.S. standard population. SOURCES: Delaware: Delaware Cancer Registry, Delaware’s Division of Public Health, 2009; U.S.: Surveillance, Epidemiology, and End Results Program, National Cancer Institute, 2009.
Figure 3.2. Five-Year Average Age-Adjusted All Site Cancer Incidence Rates* in
Delaware, by Race and Sex: 1980–2006
* = Rates are per 100,000 population and age-adjusted to the 2000 U.S. standard population. SOURCES: Delaware: Delaware Cancer Registry, Delaware’s Division of Public Health, 2009; U.S.: Surveillance, Epidemiology, and End Results Program, National Cancer Institute, 2009.

8
Table 3.3. Age-Specific All Site Cancer Incidence Rates* in Delaware, by Race and Sex: 2002-06
All Races Caucasian African American Age Group All Male Female All Male Female All Male Female
0–39 50.5 40.5 60.6 54.0 43.8 64.3 39.9 31.0 48.5 40–64 661.1 697.7 626.9 659.0 681.1 637.9 702.2 817.2 605.7 65–74 2,087.8 2,717.0 1,546.9 2,060.0 2,632.9 1,560.3 2,262.6 3,259.6 1,484.575–84 2,538.8 3,342.6 1,980.1 2,528.8 3,293.1 1,988.7 2,485.3 3,520.9 1,863.785+ 2,192.8 3,117.7 1,800.7 2,198.2 3,140.4 1,794.4 2,024.0 2,852.5 1,719.7
* = Rates are per 100,000 population. SOURCE: Delaware Cancer Registry, Delaware’s Division of Public Health, 2009.
Figure 3.3. Age-Specific All Site Cancer Incidence Rates in Delaware, by Race: 2002-06
SOURCE: Delaware Cancer Registry, Delaware’s Division of Public Health, 2009.
All Site Cancer Mortality Table 3.4. Total Number of Cancer Deaths in Delaware and Counties, by Race and
Sex: 2002-06 All Races Caucasian African American
REGION All Male Female All Male Female All Male Female
Delaware 8,712 4,603 4,109 7,283 3,858 3,425 1,363 712 651
Kent 1,391 742 649 1,130 603 527 247 133 114
New Castle 4,929 2,544 2,385 4,029 2,081 1,948 859 441 418
Sussex 2,392 1,317 1,075 2,124 1,174 950 257 138 119
SOURCE: Delaware Health Statistics Center, 2009.
9
Table 3.5. Five-Year Average Age-Adjusted All Site Cancer Mortality Rates* in the U.S., Delaware and Counties, by Race and Sex: 2002-06
SEX RACE AND REGION
All Male Female ALL RACES
United States 186.9 (186.7, 187.1) 229.9 (229.5, 230.3) 157.8 (157.6, 158.1)
Delaware 194.3 (190.2, 198.4) 242.4 (235.4, 249.4) 162.0 (157.0, 166.9)
Kent 207.8 (196.9, 218.7) 265.6 (246.5, 284.7) 171.0 (157.9, 184.2)
New Castle 197.4 (191.9, 202.9) 241.8 (232.4, 251.2) 162.8 (156.3, 169.3)
Sussex 190.3 (182.7, 198.0) 234.3 (221.7, 247.0) 156.9 (147.5, 166.2)
CAUCASIAN
United States 185.4 (185.1, 185.6) 226.7 (226.3, 227.1) 157.3 (157.0, 157.6)
Delaware 190.4 (186.0, 194.8) 236.5 (229.0, 244.0) 159.4 (154.1, 164.7)
Kent 207.0 (194.9, 219.0) 265.3 (244.1, 286.4) 171.4 (156.8, 186.0)
New Castle 190.1 (184.2, 196.0) 236.2 (226.0, 246.3) 160.4 (153.3, 167.6)
Sussex 185.1 (177.3, 193.0) 227.3 (214.3, 240.3) 153.1 (143.4, 162.9)
AFRICAN AMERICAN
United States 229.0 (228.2, 229.8) 304.2 (302.7, 305.8) 183.7 (182.8, 184.7)
Delaware 229.0 (216.8, 241.2) 295.3 (273.6, 317.0) 186.1 (171.8, 200.4)
Kent 229.2 (200.6, 257.8) 277.9 (230.7, 325.1) 190.9 (155.8, 225.9)
New Castle 220.0 (205.3, 234.7) 288.6 (261.7, 315.6) 180.1 (162.8, 197.3)
Sussex 256.4 (225.1, 287.8) 337.5 (281.2, 393.8) 201.7 (165.5, 238.0)
* = Rates are per 100,000 population and age-adjusted to the 2000 U.S. standard population. SOURCES: Delaware: Delaware Health Statistics Center, 2009; U.S.: National Center for Health Statistics, 2009. Figure 3.4. Five-Year Average Age-Adjusted All Site Cancer Mortality Rates* in the U.S.
and Delaware, by Sex: 1980–2006
* = Rates are per 100,000 population and age-adjusted to the 2000 U.S. standard population. SOURCES: Delaware: Delaware Health Statistics Center, 2009; U.S.: National Center for Health Statistics, 2009.

10
Figure 3.5. Five-Year Average Age-Adjusted All Site Cancer Mortality Rates* in
Delaware, by Race and Sex: 1980–2006
* = Rates are per 100,000 population and age-adjusted to the 2000 U.S. standard population. SOURCE: Delaware Health Statistics Center, 2009.
Table 3.6. Age-Specific All Site Cancer Mortality Rates* in Delaware, by Race and
Sex: 2002-06 All Races Caucasian African American Age
Group All Male Female All Male Female All Male Female
0–39 7.3 6.4 8.2 7.6 6.2 9.0 7.7 8.1 7.2 40–64 180.8 193.8 168.6 177.3 188.0 167.0 214.6 246.1 188.0 65–74 788.6 968.9 633.7 766.9 937.8 617.8 977.9 1,250.0 765.6 75–84 1,351.0 1,782.2 1,051.3 1,343.1 1,760.2 1,048.4 1,500.9 2,091.7 1,146.385+ 1,646.5 2,478.8 1,293.6 1,662.8 2,516.9 1,296.8 1,575.8 2,260.5 1,324.4
* = Rates are per 100,000 population. SOURCE: Delaware Health Statistics Center, 2009.

11
Figure 3.6. Age-Specific All Site Cancer Mortality Rates in Delaware, by Race: 2002-06
SOURCE: Delaware Health Statistics Center, 2009.

12
4. Female Breast Cancer
Risk Factors and Early Detection Risk Factors for Female Breast Cancer
Increasing age
Mother, daughter and/or sister diagnosed with breast cancer
Women with a father or brother diagnosed with breast cancer also have an increased risk
Inherited mutation in BRCA1 or BRCA2 genes, found most often in Jewish women of Eastern European origin
Personal history of breast cancer, ovarian cancer, or benign breast disease
Previous abnormal breast biopsy
Race
Caucasian females are slightly more likely to develop breast cancer than African American females. However, African American females are more likely to be younger when diagnosed with breast cancer and to die from the disease.
High-dose radiation therapy to the chest
Early age at menarche and/or late age at menopause
Shorter or longer than average menstrual cycles
Obesity
First childbirth after age 35
Never giving birth
Current or recent use of estrogen and progesterone hormone replacement therapy
Heavy alcohol use (level of risk rises with the amount of alcohol consumed)
Breast tissue that appears dense on a mammogram Possible Risk Factors for Female Breast Cancer
Having taken diethylstilbestrol (DES) during pregnancy, or having a mother who took DES during pregnancy
Mutations in the ATM, CHEK2, p53 or PTEN genes
High-fat diets that are low in fruits and vegetables
Pesticide and other environmental estrogen exposures
Cigarette smoking or exposure to secondhand smoke
Night-shift work Protective Factors
Engaging in physical activity for 4 or more hours per week
Multiple pregnancies
Becoming pregnant at an early age
Breastfeeding for at least several years

13
Early Detection of Female Breast Cancer
Females at increased risk for breast cancer should talk with their doctors about the benefits and limitations of beginning mammograms when they are younger, having additional tests, or having more frequent exams. Regular clinical breast exams and mammograms can detect female breast cancer at an earlier stage, resulting in improved chances for survival. Age-specific breast cancer screening recommendations from the American Cancer Society (ACS) are as follows:
Type of Exam Recommended Frequency Ages 20–39 Ages 40 and Older
Clinical breast exam Every three years Annual Mammogram Baseline by age 40 Annual
Recent data (2008) from the Behavioral Risk Factor Surveillance System (BRFSS) provide information on the pattern of breast cancer screening among Delawarean women:
In 2008, 82.3 percent of Delaware women age 40 and older reported having a mammogram within the previous two years compared to 76.0 percent of U.S. women age 40 and older.
In Delaware, the percentage of Caucasian and African American women age 40 and older who reported having a mammogram in the past two years were not significantly different (81.2 percent vs. 86.2 percent, respectively).
Delaware women (age 40 and older) earning over $50,000 per year were significantly more likely to report having had a mammogram in the past two years compared to those earning less than $50,000 per year (87.3 percent vs. 77.5 percent, respectively).
Delaware females (age 40 and older) attending some college or with a college degree were just as likely to report having had a mammogram within the past two years as were females with a high school diploma or less (83.4 percent vs. 80.5 percent, respectively).
The percentage of women ages 40-64 who report having had a mammogram in the past two years was not significantly different from the percentage of women ages 65 and older who report doing the same (82.9 percent vs. 80.8 percent, respectively).
Data Highlights New Female Breast Cancer Cases and Deaths (Tables 4.1 and 4.6)
Excluding skin cancers, breast cancer was the most frequently diagnosed cancer among females in Delaware and the U.S. From 2002-06, 2,961 new cases of breast cancer were diagnosed in Delaware, accounting for 27.7 percent of all new cancer cases diagnosed among females.
For 2002-06, breast cancer was the second leading cause of cancer death among females. During this time, breast cancer accounted for 14.2 percent of cancer deaths among Delaware females.
Female Breast Cancer Incidence and Mortality Rates (Tables 4.2 and 4.7)
Overall, the 2002-06 female breast cancer incidence rate for Delaware (122.6 per 100,000) was not significantly different from the U.S. rate (123.8 per 100,000).
Delaware’s 2002-06 breast cancer incidence rate for Caucasian females (122.1 per 100,000) was significantly lower than the U.S. rate (127.8 per 100,000).
The 2002-06 breast cancer incidence rate for African American women in Delaware (124.0 per 100,000) was not significantly different from the U.S. rate (117.7 per 100,000).
At the national level, the 2002-06 breast cancer incidence rate for African American women was significantly lower than the rate for Caucasian women. However, no significant differences were

14
observed at the state- and county-levels when breast cancer incidence rates were examined by race.
Delaware’s 2002-06 female breast cancer mortality rate (23.5 per 100,000) was not significantly different from the U.S. rate (24.5 per 100,000).
In the U.S., the 2002-06 breast cancer mortality rate for African American women was significantly higher than for Caucasian women; this pattern was not observed at the state or county levels.
Trends in Female Breast Cancer Incidence and Mortality Rates (Figures 4.1–4.2 and 4.6–4.7)
Delaware’s female breast cancer incidence rate decreased 10.1 percent from 1992-96 to 2002-06. During this same period, the U.S. breast cancer incidence rate decreased 5.9 percent.
From 1992-96 to 2002-06, Delaware’s female breast cancer incidence rate decreased 12.1 percent among Caucasians but increased 3.2 percent among African Americans.
Historically, female breast cancer mortality rates have been higher for Delaware than the U.S., but rates for the two areas no longer differ significantly. From 1992-96 to 2002-06, Delaware’s female breast cancer mortality rate decreased 30.1 percent, while the U.S. rate fell 20.5 percent. If this trend continues, Delaware’s mortality rate may soon be significantly lower than the national rate.
From 1992-96 to 2002-06, Delaware’s breast cancer mortality rate decreased 31.0 percent among Caucasian women and 24.8 percent among African American women.
Age-Specific Incidence and Mortality Rates (Tables 4.3 and 4.8, Figures 4.3 and 4.8)
Among Caucasian women in Delaware, the 2002-06 incidence of female breast cancer increased with age, from birth through ages 75-84. Breast cancer incidence rates then declined among Caucasian women age 85 and older.
Among African American women in Delaware, the 2002-06 incidence of breast cancer increased with age, peaking among those ages 65-74. Breast cancer incidence rates then declined among African American women age 75 and older.
Among Caucasian and African American women in Delaware, the 2002-06 female breast cancer mortality rates increased with age, with the oldest age group (women age 85 and older) having the highest mortality rates.
Stage at Diagnosis of Female Breast Cancer (Tables 4.4–4.5, Figures 4.4–4.5)
For 2002-06, 64.4 percent, 29.8 percent and 3.7 percent of female breast cancer cases in Delaware were diagnosed at the local, regional and distant stages, respectively. In the U.S., comparable percentages were 60.0 percent, 33.0 percent and 5.0 percent, respectively.
During 2002-06, 992 cases of female breast cancer (33.5 percent of all breast cancers diagnosed during this period) were late-stage diagnoses (i.e., either regional or distant cancer at the time of diagnosis). The percentage of late-stage breast cancer diagnoses was higher among African American females (38.0 percent) than among Caucasian females (32.7 percent).
In Delaware, since 1980-84, the proportion of breast cancers diagnosed at the local stage has increased from 42.3 percent to 64.4 percent. Accordingly, over this same time, the proportion of regional stage breast cancers decreased from 43.3 percent to 29.8 percent, and the proportion of distant stage breast cancers decreased from 6.1 percent to 3.7 percent.

15
Female Breast Cancer Incidence
Table 4.1. Number of Female Breast Cancer Cases in Delaware and Counties, by
Race: 2002-06 All
Female Caucasian
Female African American
Female Delaware 2,961 2,424 490 Kent 459 383 68 New Castle 1,751 1,388 339 Sussex 751 653 83
SOURCE: Delaware: Delaware Cancer Registry, Delaware’s Division of Public Health, 2009.
Table 4.2. Five-Year Average Age-Adjusted Female Breast Cancer Incidence Rates* in
the U.S., Delaware and Counties, by Race: 2002-06 All
Female Caucasian
Female African American
Female United States 123.8 (123.3, 124.3) 127.8 (127.2, 128.4) 117.7 (116.2, 119.2)
Delaware 122.6 (118.2, 127.0) 122.1 (117.2, 126.9) 124.0 (113.0, 134.9)
Kent 122.6 (111.4, 133.8) 129.4 (116.4, 142.3) 104.1 (80.9, 132.0)
New Castle 122.7 (116.9, 128.4) 122.3 (115.9, 128.8) 126.2 (112.7, 139.6)
Sussex 121.5 (112.8, 130.1) 115.6 (106.8, 124.5) 135.5 (108.0, 168.0)
* = Rates are per 100,000 population and age-adjusted to the 2000 U.S. standard population. SOURCES: Delaware: Delaware Cancer Registry, Delaware’s Division of Public Health, 2009; U.S.: Surveillance, Epidemiology, and End Results Program, National Cancer Institute, 2009.

16
Figure 4.1. Five-Year Average Age-Adjusted Female Breast Cancer Incidence Rates* in
the U.S. and Delaware: 1980–2006
* = Rates are per 100,000 and age-adjusted to the 2000 U.S. standard population. SOURCES: Delaware: Delaware Cancer Registry, Delaware’s Division of Public Health, 2009; U.S.: Surveillance, Epidemiology, and End Results Program, National Cancer Institute, 2009.
Figure 4.2. Five-Year Average Age-Adjusted Female Breast Cancer Incidence Rates* in Delaware, by Race: 1980–2006
* = Rates are per 100,000 population and age-adjusted to the 2000 U.S. standard population. SOURCE: Delaware Cancer Registry, Delaware’s Division of Public Health, 2009.

17
Table 4.3. Age-Specific Female Breast Cancer Incidence Rates* in Delaware, by Race:
2002-06
Age Group All Female
Caucasian Female
African American Female
0–39 13.2 12.7 15.1 40–64 223.3 222.9 236.3 65–74 378.6 387.7 340.8 75–84 413.0 426.4 319.7 85+ 348.9 350.5 ---
* = Rates are per 100,000 population. --- = Rate based on fewer than 20 cases. SOURCE: Delaware Cancer Registry, Delaware’s Division of Public Health, 2009.
Figure 4.3. Age-Specific Female Breast Cancer Incidence Rates in Delaware, by Race: 2002-06
NOTE: Rate for African American females age 85+ is not displayed because of patient confidentiality rules. SOURCE: Delaware Cancer Registry, Delaware’s Division of Public Health, 2009.
Female Breast Cancer by Stage at Diagnosis Table 4.4. Number of Female Breast Cancer Cases in Delaware, by Stage at Diagnosis
and Race: 2002-06 Stage at
Diagnosis All
Female Caucasian
Female African American
Female
Local 1,906 1,585 292 Regional 882 700 170 Distant 110 93 16 Unknown 63 46 12 Total 2,961 2,424 490
SOURCE: Delaware Cancer Registry, Delaware’s Division of Public Health, 2009.

18
Table 4.5. Percentage of Female Breast Cancer Cases in Delaware, by Stage at Diagnosis and Race: 2002-06
Stage at Diagnosis
All Female
Caucasian Female
African American Female
Local 64.4 65.4 59.6 Regional 29.8 28.9 34.7 Distant 3.7 3.8 3.3 Unknown 2.1 1.9 2.5 Total 100.0 100.0 100.0
SOURCE: Delaware Cancer Registry, Delaware’s Division of Public Health, 2009.
Figure 4.4. Percentage of Female Breast Cancer Cases in Delaware and the U.S., by
Stage at Diagnosis: 2002-06
Figure 4.4a. Delaware: 2002-06
Figure 4.4b. U.S.: 2002-06
SOURCES: Delaware: Delaware Cancer Registry, Delaware’s Division of Public Health, 2009; U.S.: Surveillance, Epidemiology, and End Results Program, National Cancer Institute, 2009.

19
Figure 4.5. Percentage of Female Breast Cancer Cases in Delaware, by Stage at Diagnosis: 1980–2006
SOURCE: Delaware Cancer Registry, Delaware’s Division of Public Health, 2009.
Female Breast Cancer Mortality Table 4.6. Number of Female Breast Cancer Deaths in Delaware and Counties, by
Race: 2002-06
Region All Female
Caucasian Female
African American Female
Delaware 585 476 106
Kent 91 76 15
New Castle 352 273 77
Sussex 142 127 14
SOURCE: Delaware Health Statistics Center, 2009. Table 4.7. Five-Year Average Age-Adjusted Female Breast Cancer Mortality Rates* in
the U.S., Delaware and Counties, by Race: 2002-06 Region All
Female Caucasian
Female African American
Female United States 24.5 (24.4, 24.6) 23.9 (23.8, 24.0) 33.0 (32.6, 33.4)
Delaware 23.5 (21.6, 25.4) 22.9 (20.9, 25.0) 27.9 (22.6, 33.2)
Kent 24.3 (19.6, 29.9) 25.6 (20.2, 32.1) ---
New Castle 23.9 (21.4, 26.4) 22.7 (20.0, 25.4) 30.1 (23.7, 37.6)
Sussex 22.3 (18.6, 25.9) 22.1 (18.2, 25.9) ---
* = Rates are per 100,000 population and age-adjusted to the 2000 U.S. standard population. --- = Rate based on fewer than 20 deaths. SOURCES: Delaware: Delaware Health Statistics Center, 2009; U.S.: National Center for Health Statistics, 2009.

20
Figure 4.6. Five-Year Average Age-Adjusted Female Breast Cancer Mortality Rates* in
the U.S. and Delaware: 1980–2006
* = Rates are per 100,000 population and age-adjusted to the 2000 U.S. standard population. SOURCES: Delaware: Delaware Health Statistics Center, 2009; U.S.: National Center for Health Statistics, 2009.
Figure 4.7. Five-Year Average Age-Adjusted Female Breast Cancer Mortality Rates* in
Delaware, by Race: 1980–2006
* = Rates are age-adjusted to the 2000 U.S. standard population. SOURCE: Delaware Health Statistics Center, 2009.

21
Table 4.8. Age-Specific Female Breast Cancer Mortality Rates* in Delaware, by Race: 2002-06
Age Group
All Female
Caucasian Female
African American Female
0–39 1.8 --- --- 40–64 34.5 32.5 46.1 65–74 70.2 68.8 --- 75–84 115.7 117.8 --- 85+ 164.7 166.7 ---
* = Rates are per 100,000 population. --- = Rate based on fewer than 20 deaths. SOURCE: Delaware Health Statistics Center, 2009.
Figure 4.8. Age-Specific Female Breast Cancer Mortality Rates in Delaware, by Race:
2002-06 NOTE: Figure is not displayed because of patient confidentiality rules; the small number of cases precludes the display of data.

22
5. Cervical Cancer
Risk Factors and Early Detection Risk Factors for Cervical Cancer
Human papillomavirus (HPV) infection
Sexual intercourse at a young age
Multiple sexual partners
Having a partner who has had many sexual partners
Sexual intercourse with uncircumcised males
Long-term use of oral contraceptives
Mother who took diethylstilbestrol (DES) during pregnancy
Cigarette smoking
Low socioeconomic status
Many full-term pregnancies
Family history of cervical cancer
Being overweight
Having a weakened immune system (e.g., through HIV, AIDS, or receiving drugs to suppress the immune system)
Possible Risk Factors for Cervical Cancer
History of sexually transmitted disease(s), such as Chlamydia
Diets low in fruits and vegetables
Exposure to secondhand smoke Protective Factors
Gardasil® vaccine to protect against HPV
The Federal Advisory Committee on Immunization Practices (ACIP) has approved vaccine use for girls and women ages 11-26
Condoms provide some protection against HPV infection, a known cervical cancer risk factor Early Detection of Cervical Cancer
Routine Pap tests can detect cervical cancer at an earlier stage, resulting in greatly improved chances for survival Current recommendations for cervical cancer screening are as follows:
All females should begin having annual Pap test about three years after they start having sex, but no later than age 21
Beginning at age 30, females who have had three normal Pap tests in a row may get the Pap test every two to three years. Alternatively, females over age 30 may be tested every three years with the Pap test, plus the HPV DNA test.
Females age 70 and older who have had three normal test results in a row and no abnormal results in the last 10 years may choose to stop cervical cancer testing unless they have a history of cervical cancer, DES exposure before birth, HIV infection, or a weakened immune system. Females who have had a total hysterectomy may also choose to stop cervical cancer testing unless the surgery was a treatment for cervical cancer or precancerous cells.

23
Recent data (2008) from the Behavioral Risk Factor Surveillance System (BRFSS) provide information on the pattern of cervical cancer screening among Delawarean women:
In 2008, 84.5 percent of Delaware females age 18 and older reported that they had had a Pap test within the previous three years. By comparison, 82.9 percent of U.S. females age 18 and older reported having had a Pap test within the previous three years.
In Delaware, significantly more African American females reported having had a Pap test within the last three years compared to Caucasian females (92.6 percent vs. 82.8 percent, respectively).
In 2008, significantly fewer Delaware females age 55 and older reported having had a Pap test in the last three years compared to women ages 18-54 (24.7 percent vs. 10.7 percent, respectively).
Data Highlights New Cervical Cancer Cases and Deaths (Tables 5.1 and 5.6)
For 2002-06, 181 women in Delaware were diagnosed with cervical cancer. Cervical cancer accounted for 1.7 percent of all cancer diagnosed among women during this time.
For 2002-06, 58 Delaware females died from cervical cancer. Cervical cancer accounted for 1.4 percent of all cancer deaths among Delaware women during this time.
Cervical Cancer Incidence and Mortality Rates (Tables 5.2 and 5.7)
The 2002-06 cervical cancer incidence rate was the same for Delaware and the U.S. (8.2 per 100,000).
The U.S. cervical cancer incidence rate for African American women was significantly higher than the rate for Caucasian women (10.4 per 100,000 vs. 8.1 per 100,000). However, Delaware’s 2002-06 cervical cancer incidence rates did not differ significantly between African American and Caucasian women (11.5 per 100,000 vs. 7.7 per 100,000, respectively).
The 2002-06 cervical cancer mortality rate was the same for Delaware and the U.S. (2.5 per 100,000).
While the 2002-06 cervical mortality rate for Caucasian women (2.2 per 100,000) was significantly lower than for African American women (4.6 per 100,000) at the national level, no significant differences existed between races at the state or county levels.
Trends in Cervical Cancer Incidence and Mortality (Figures 5.1–5.2 and 5.6–5.7)
Historically, cervical cancer incidence rates have been higher in Delaware than in the U.S. However, from 1992-96 to 2002-06, Delaware’s cervical cancer incidence rate decreased 27.4 percent while the U.S. rate decreased 13.7 percent; rates for the two areas are now equivalent.
From 1992-96 to 2002-06, Delaware’s cervical cancer incidence rate declined 43.3 percent among African American women. In contrast, Delaware’s rate for Caucasian females fell 20.6 percent over the same time.
From 1992-96 to 2002-06, Delaware’s cervical cancer mortality rate decreased 43.2 percent while the U.S. rate decreased 24.2 percent. If this trend continues, Delaware’s cervical cancer mortality rate may soon be significantly lower than the national rate.
From 1992-96 to 2002-06, Delaware’s cervical cancer mortality rate declined 64.9 percent among African American women. In contrast, Delaware’s rate for Caucasian females fell 35.1 percent over the same time.
Age-Specific Incidence and Mortality Rates (Tables 5.3 and 5.8)
The 2002-06 age-specific incidence rate for cervical cancer was highest among females age 40–64.
Mortality data were too sparse to examine rates by race group.

24
Stage at Diagnosis of Cervical Cancer (Tables 5.4–5.5, Figures 5.4–5.5)
In Delaware, from 2002-06, 55.8 percent, 28.2 percent and 11.1 percent of cervical cancers were diagnosed at the local, regional and distant stages, respectively. At the national level, comparison percentages were 50.0 percent, 35.0 percent and 11.0 percent, respectively.
In Delaware, from 2002-06, 71 cervical cancer cases (39.2 percent) were diagnosed in the late stages (i.e., regional or distant stage).
Among those diagnosed with cervical cancer, African American females were more likely than Caucasian females to have their cervical cancer diagnosed at the local stage (62.5 percent vs. 53.1 percent, respectively).
In Delaware, the percentage of cervical cancer cases diagnosed at the local stage increased from 32.4 percent in 1980-84 to 55.8 percent in 2002-06. Accordingly, there was a decline in the percentage of regional stage cases during the same period (from 48.9 percent to 28.2 percent). There was minimal change in the percentage of distant stage cases diagnosed during the same time.
Cervical Cancer Incidence
Table 5.1. Number of Cervical Cancer Cases in Delaware and Counties, by Race: 2002-06
All Female
Caucasian Female
African American Female
Delaware 181 128 48
Kent 41 32 8
New Castle 105 72 30
Sussex 35 24 10
SOURCE: Delaware Cancer Registry, Delaware’s Division of Public Health, 2009. Table 5.2. Five-Year Average Age-Adjusted Cervical Cancer Incidence Rates* in the
U.S., Delaware and Counties, by Race: 2002-06 All
Female Caucasian
Female African American
Female
United States 8.2 (8.1, 8.3) 8.1 (8.0, 8.2) 10.4 (10.0, 10.8)
Delaware 8.2 (7.0, 9.4) 7.7 (6.3, 9.0) 11.5 (8.5, 15.2)
Kent 11.3 (8.1, 15.3) 11.8 (8.1, 16.7) ---
New Castle 7.6 (6.2, 9.1) 7.1 (5.5, 9.1) 10.4 (7.0, 14.8)
Sussex 7.8 (5.5, 10.9) 6.6 (4.2, 9.7) ---
* = Rates are per 100,000 population and age-adjusted to the 2000 U.S. standard population. --- = Rate based on fewer than 20 cases. SOURCES: Delaware: Delaware Cancer Registry, Delaware’s Division of Public Health, 2009; U.S.: Surveillance, Epidemiology, and End Results Program, National Cancer Institute, 2009.

25
Figure 5.1. Five-Year Average Age-Adjusted Cervical Cancer Incidence Rates* in the U.S. and Delaware: 1980–2006
* = Rates are per 100,000 population and age-adjusted to the 2000 U.S. standard population. SOURCES: Delaware: Delaware Cancer Registry, Delaware’s Division of Public Health, 2009 U.S.: Surveillance, Epidemiology, and End Results Program, National Cancer Institute, 2009
Figure 5.2. Five-Year Average Age-Adjusted Cervical Cancer Incidence Rates* in
Delaware, by Race: 1980–2006
* = Rates are per 100,000 population and age-adjusted to the 2000 U.S. standard population. SOURCE: Delaware Cancer Registry, Delaware’s Division of Public Health, 2009

26
Table 5.3. Age-Specific Cervical Cancer Incidence Rates* in Delaware, by Race: 2002-06
Age Group
All Female
Caucasian Female
African American Female
0–39 4.2 4.5 --- 40–64 15.0 14.3 18.6 65+ 8.7 7.5 ---
* = Rates are per 100,000 population. --- = Rate based on fewer than 20 cases. SOURCE: Delaware Cancer Registry, Delaware’s Division of Public Health, 2009.
Figure 5.3. Age-Specific Cervical Cancer Incidence Rates in Delaware, by Race: 2002-06
NOTE: Figure is not displayed because of patient confidentiality rules; the small number of cases precludes the display of data.
Cervical Cancer by Stage at Diagnosis
Table 5.4. Number of Cervical Cancer Cases in Delaware, by Stage at Diagnosis and Race: 2002-06
Stage at Diagnosis
All Female
Caucasian Female
African American Female
Local 101 68 30 Regional 51 41 10 Distant 20 13 --- Unknown 9 6 --- Total 181 128 48
--- = Cell counts are suppressed for patient confidentiality. SOURCE: Delaware Cancer Registry, Delaware’s Division of Public Health, 2009.
Table 5.5. Percentage of Cervical Cancer Cases in Delaware, by Stage at Diagnosis and Race: 2002-06
Stage at Diagnosis
All Female
Caucasian Female
African American Female
Local 55.8 53.1 62.5
Regional 28.2 32.0 20.8
Distant 11.1 10.2 --- Unknown 5.0 4.7 --- Total 100.0 100.0 100.0
--- = Percentages are suppressed for patient confidentiality. SOURCE: Delaware Cancer Registry, Delaware’s Division of Public Health, 2009.

27
Figure 5.4. Percentage of Cervical Cancer Cases in Delaware and the U.S., by Stage at Diagnosis: 2002-06
Figure 5.4a. Delaware: 2002-06
Figure 5.4b. U.S.: 2002-06
SOURCES: Delaware: Delaware Cancer Registry, Delaware’s Division of Public Health, 2009; U.S.: Surveillance, Epidemiology, and End Results Program, National Cancer Institute, 2009. Figure 5.5. Percentage of Cervical Cancer Cases in Delaware, by Stage at Diagnosis:
1980–2006
SOURCE: Delaware Cancer Registry, Delaware’s Division of Public Health, 2009

28
Cervical Cancer Mortality Table 5.6. Number of Cervical Cancer Deaths in Delaware and Counties, by Race:
2002-06 All
Female Caucasian
Female African American
Female Delaware 58 44 13
Kent 13 --- ---
New Castle 32 25 6
Sussex 13 --- ---
--- = Cell counts are suppressed for patient confidentiality. SOURCE: Delaware Health Statistics Center, 2009.
Table 5.7. Five-Year Average Age-Adjusted Cervical Cancer Mortality Rates* in the
U.S., Delaware and Counties, by Race: 2002-06 All
Female Caucasian
Female African American
Female United States 2.5 (2.4, 2.5) 2.2 (2.2, 2.3) 4.6 (4.4, 4.7)
Delaware 2.5 (1.9, 3.2) 2.4 (1.8, 3.2) ---
Kent --- --- ---
New Castle 2.3 (1.6, 3.2) 2.3 (1.5, 3.4) ---
Sussex --- --- ---
* = Rates are per 100,000 population and age-adjusted to the 2000 U.S. standard population. --- = Rate based on fewer than 20 deaths. SOURCES: Delaware: Delaware Health Statistics Center, 2009; U.S.: National Center for Health Statistics, 2009.

29
Figure 5.6. Five-Year Average Age-Adjusted Cervical Cancer Mortality Rates* in the
U.S. and Delaware: 1980–2006
* = Rates are per 100,000 population and age-adjusted to the 2000 U.S. standard population. SOURCES: Delaware: Delaware Health Statistics Center, 2009; U.S.: National Center for Health Statistics, 2009.
Figure 5.7. Five-Year Average Age-Adjusted Cervical Cancer Mortality Rates* in
Delaware, by Race: 1980–2006 NOTE: Figure is not displayed because of patient confidentiality rules; the small number of cases precludes the display of data.
Table 5.8. Age-Specific Cervical Cancer Mortality Rates* in Delaware, by Race:
2002-06 NOTE: Table is not displayed because of patient confidentiality rules; the small number of cases precludes the display of data. Figure 5.8. Age-Specific Cervical Cancer Mortality Rates in Delaware, by Race:
2002-06 NOTE: Figure is not displayed because of patient confidentiality rules; the small number of cases precludes the display of data.

30
6. Colorectal Cancer
Risk Factors and Early Detection Risk Factors for Colorectal Cancer
Increasing age: the chance of developing colorectal cancer increases markedly after age 50
Personal history of colorectal adenomatous polyps or colorectal cancer
Family history of colorectal cancer or polyps
Personal history of inflammatory bowel disease, such as ulcerative colitis or Crohn’s disease
Personal history of ovarian, breast or uterine cancer
Personal history of diabetes
Race: African Americans have the highest incidence and mortality rates of all racial groups in the U.S.
Ethnicity: Jews of Eastern European descent have the highest risk of any ethnic group
Physical inactivity
Obesity
Heavy alcohol use
Cigarette smoking Possible Risk Factors for Colorectal Cancer
Diets high in red meat, processed meats and/or other high-fat foods
Diets low in fruits, vegetables, fiber and folic acid
Men who have had testicular cancer may be at greater risk for colorectal cancer
Men receiving radiation therapy for prostate cancer may have a greater risk for colorectal cancer
Night-shift work Protective Factors
Combined hormone replacement therapy, which includes both estrogen and progesterone
Removal of colorectal polyps Early Detection of Colorectal Cancer
The American Cancer Society colorectal cancer screening guidelines are as follows:
Beginning at age 50, both males and females should follow one of the five screening options below:
1. Yearly fecal occult blood test (FOBT) or immunochemical FOBT. The take-home multiple sample method should be used, with all positive tests followed up by a colonoscopy;
2. Flexible sigmoidoscopy every five years;
3. Colonoscopy every 10 years;
4. Double contrast barium enema every five years; or
5. Yearly FOBT or immunochemical FOBT, plus flexible sigmoidoscopy every five years*.
* “The ACS recommends more intensive surveillance for individuals at higher risk for colorectal cancer, including those with a history of adenomatous polyps; those with a personal history of curative-intent resection of colorectal cancer; those with a family history of either colorectal cancer or colorectal adenomas diagnosed in a first-degree relative before age 60; those with a history of inflammatory bowel disease of significant duration; or those with a family history or genetic testing indicating the presence of 1 of 2 hereditary syndromes, such as hereditary nonpolyposis colorectal cancer and familial adenomatous polyposis.”

31
Recent data (2008) from the Behavioral Risk Factor Surveillance System (BRFSS) provide information on the pattern of colorectal cancer screening among Delawareans:
In 2008, 36.5 percent of Delawareans age 50 and older reported ever having used an at-home blood stool test; while fewer African Americans than Caucasians reported ever having used an at-home blood stool test (31.7 percent vs. 37.6 percent, respectively), the difference is not significant.
Among Delawareans age 50 and older, 74.3 percent reported that they had ever had a sigmoidoscopy or a colonoscopy.
The percentage of Delawareans who had had a colonoscopy or sigmoidoscopy increased with age. Significantly more Delawareans age 65 and older reported ever having had a colonoscopy or sigmoidoscopy compared to those age 50-64 (79.4 percent vs. 70.6 percent, respectively).
In 2008, African Americans age 50 and older in Delaware were just as likely to have ever had a colonoscopy or sigmoidoscopy as Caucasians (73.5 percent vs. 74.7 percent, respectively).
Education level and income category did not significantly affect the percentage of Delawareans ever having had a colonoscopy or sigmoidoscopy.
Data Highlights
New Colorectal Cancer Cases and Deaths (Tables 6.1 and 6.6)
Colorectal cancer was the state’s third most frequently diagnosed cancer among both males and females for 2002-06. A total of 2,320 cases of colorectal cancer were diagnosed in Delaware during this time.
Colorectal cancer accounted for 10.2 percent of all cancer cases diagnosed during 2002-06 in Delaware.
Newly diagnosed cases were fairly evenly split by sex: 1,206 cases (52.0 percent) were diagnosed among males and 1,114 cases (48.0 percent) were diagnosed among females.
Colorectal cancer was the state’s third most common cause of cancer deaths among both males and females for 2002-06.
Deaths from colorectal cancer accounted for 9.5 percent of all cancer deaths in Delaware during 2002-06.
Of the 828 Delaware residents who died from colorectal cancer, 52.5 percent were male and 47.5 percent were female.
Colorectal Cancer Incidence and Mortality Rates (Tables 6.2 and 6.7)
Delaware’s 2002-06 colorectal cancer incidence rate (51.7 per 100,000) was significantly higher than the U.S. rate (49.1 per 100,000).
For 2002-06 at all geographic levels, for all races combined, the colorectal cancer incidence
rates for males were significantly higher than rates for females.
Among Caucasians, the incidence rates for males were significantly higher than for females at all geographic levels with the exception of Kent County.
Among African Americans, the incidence rates for males were significantly higher than for
females at the national and state levels but not at the county level.
For both sexes combined and males only, the U.S., Delaware and Sussex County 2002-06 colorectal cancer incidence rates for African Americans were significantly higher than for Caucasians; incidence rates did not differ significantly between African Americans and Caucasians in Kent and New Castle counties.

32
Among females, the incidence rate for African Americans was significantly higher than for Caucasians at the national level, but not at the state or county levels.
Delaware’s 2002-06 colorectal cancer mortality rate (18.5 per 100,000) was not significantly different from that of the U.S. (18.2 per 100,000).
For 2002-06, at both the state and national levels and for all races, the colorectal cancer mortality rates were significantly higher for males than for females.
Trends in Colorectal Cancer Incidence and Mortality Rates (Figures 6.1-6.2 and 6.6-6.7)
From 1992-96 to 2002-06, Delaware’s colorectal cancer incidence rate decreased 15.4 percent while the U.S. rate dropped 12.0 percent.
Delaware’s colorectal cancer incidence rates decreased 17.2 percent for Caucasians and 7.0 percent for African Americans between 1992-96 and 2002-06.
Delaware’s colorectal incidence rates decreased 18.2 percent for males and 13.9 percent for females between 1992-96 and 2002-06.
Historically, Delaware’s colorectal cancer mortality rate has been higher than the U.S. rate. However, Delaware’s 2002-06 colorectal cancer mortality rate was not significantly different from the U.S. rate.
Between 1992-96 and 2002-06, Delaware’s colorectal cancer mortality rate dropped 24.2 percent while the U.S. rate dropped 20.5 percent.
The state’s colorectal mortality rates decreased by 24.2 percent among Caucasians and by 32.4 percent among African Americans between 1992-96 and 2002-06.
Delaware’s largest rate decline occurred among African American females, with a ten-year (1992-96 to 2002-06) decrease of 36.8 percent.
Over this same time, rates decreased among African American males, Caucasian males and Caucasian females by 14.1 percent, 27.2 percent and 21.7 percent, respectively.
Age-Specific Incidence and Mortality Rates (Tables 6.3 and 6.8, Figures 6.3 and 6.8)
The 2002-06 colorectal cancer incidence rate increased with age; Delawareans ages 85 and older had the highest age-specific incidence rate.
For all races and age groups, the state’s 2002-06 colorectal cancer incidence rates were higher for males than for females.
For all races combined, the 2002-06 age specific mortality rates increased with age; Delawareans ages 85 and older had the highest age-specific mortality rate.
The 2002-06 data were too sparse to analyze by sex and race. Stage at Diagnosis of Colorectal Cancer (Tables 6.4–6.5, Figures 6.4–6.5)
For 2002-06, 36.6 percent, 40.9 percent and 16.6 percent of colorectal cancers diagnosed in Delaware were detected at the local, regional and distant stages, respectively. Comparable percentages for the U.S. were 39.0 percent, 37.0 percent and 19.0 percent, respectively.
In Delaware, for 2002-06, 1,334 colorectal cancer cases (57.5 percent) were diagnosed in the late stages (i.e., regional or distant stage).
Among those diagnosed with colorectal cancer, African Americans were just as likely to have their cancer diagnosed in the local stage as Caucasians (36.4 percent vs. 36.6 percent, respectively).
In Delaware, the percentage of colorectal cancer cases diagnosed in the local stage increased from 31.7 percent in 1980-84 to 36.6 percent in 2002-06. Accordingly, there was a decrease in cases diagnosed in the distant stage, from 20.0 percent in 1980-84 to 16.6 percent in 2002-06. There was minimal change in the percentage of regional stage cases diagnosed during the same time.

33
Colorectal Cancer Incidence
Table 6.1. Number of Colorectal Cancer Cases in Delaware and Counties, by Race and Sex: 2002-06
All Races Caucasian African American
All Male Female All Male Female All Male Female
Delaware 2,320 1,206 1,114 1,899 989 910 363 184 179
Kent 393 209 184 313 161 152 68 40 28
New Castle 1,304 658 646 1,043 532 511 226 107 119
Sussex 623 339 284 543 296 247 69 37 32
SOURCE: Delaware Cancer Registry, Delaware’s Division of Public Health, 2009. Table 6.2. Five-Year Average Age-Adjusted Colorectal Cancer Incidence Rates* in the
U.S., Delaware and Counties, by Race and Sex: 2002-06 SEX
RACE AND REGION All Male Female
ALL RACES
United States 49.1 (48.9, 49.3) 57.3 (56.9, 57.7) 42.8 (42.5, 43.1)
Delaware 51.7 (49.6, 53.8) 61.5 (58.1, 65.0) 44.0 (41.4, 46.6)
Kent 57.9 (52.2, 63.7) 69.5 (60.1, 78.9) 48.6 (41.6, 55.7)
New Castle 52.1 (49.3, 54.9) 60.1 (55.5, 64.7) 44.3 (40.9, 47.7)
Sussex 50.2 (46.3, 54.2) 60.5 (54.0, 66.9) 41.7 (36.9, 46.6)
CAUCASIAN
United States 48.6 (48.4, 48.8) 56.9 (56.5, 57.3) 42.1 (41.8, 42.4)
Delaware 50.0 (47.8, 52.3) 59.3 (55.6, 63.0) 42.4 (39.6, 45.1)
Kent 57.0 (50.7, 63.4) 66.1 (55.9, 76.3) 49.6 (41.7, 57.5)
New Castle 49.5 (46.5, 52.5) 58.7 (53.7, 63.6) 42.2 (38.6, 45.9)
Sussex 48.1 (44.0, 52.1) 57.8 (51.2, 64.4) 39.7 (34.7, 44.6)
AFRICAN AMERICAN
United States 59.9 (59.0, 60.8) 69.3 (67.8, 70.8) 53.5 (52.4, 54.6)
Delaware 59.9 (53.7, 66.0) 74.5 (63.8, 85.3) 51.2 (43.7, 58.7)
Kent 61.2 (47.5, 77.6) 79.6 (56.9, 108.4) 46.7 (31.0, 67.4)
New Castle 57.1 (49.7, 64.5) 67.8 (54.9, 80.6) 51.7 (42.4, 61.0)
Sussex 68.7 (53.4, 86.9) 92.3 (65.0, 127.2) 54.1 (37.0, 76.4)
* = Rates are per 100,000 population and age-adjusted to the 2000 U.S. standard population. SOURCES: Delaware: Delaware Cancer Registry, Delaware’s Division of Public Health, 2009; U.S.: Surveillance, Epidemiology, and End Results Program, National Cancer Institute, 2009.

34
Figure 6.1. Five-Year Average Age-Adjusted Colorectal Cancer Incidence Rates* in the U.S. and Delaware, by Sex: 1980–2006
* = Rates are per 100,000 population and age-adjusted to the 2000 U.S. standard population. SOURCES: Delaware: Delaware Cancer Registry, Delaware’s Division of Public Health 2009; U.S.: Surveillance, Epidemiology, and End Results Program, National Cancer Institute 2009.
Figure 6.2. Five-Year Average Age-Adjusted Colorectal Cancer Incidence Rates* in
Delaware, by Race and Sex: 1980–2006
* = Rates are per 100,000 population and age-adjusted to the 2000 U.S. standard population. SOURCE: Delaware Cancer Registry, Delaware’s Division of Public Health, 2009.

35
Table 6.3. Age-Specific Colorectal Cancer Incidence Rates* in Delaware, by Race and Sex: 2002-06
All Races Caucasian African American Age Group All Male Female All Male Female All Male Female
0–39 2.2 2.8 --- 2.5 3.2 --- --- --- --- 40–64 55.8 68.9 43.6 53.7 68.0 40.0 64.2 73.5 56.5 65–74 212.7 254.4 176.8 203.5 243.4 168.7 267.4 323.0 224.1 75–84 314.4 336.5 299.0 308.6 325.0 296.9 321.6 363.8 296.3 85+ 394.1 516.2 342.4 391.2 486.2 350.5 404.8 --- ---
* = Rates are per 100,000 population. --- = Rate based on fewer than 20 cases. SOURCE: Delaware Cancer Registry, Delaware’s Division of Public Health, 2009.
Figure 6.3. Age-Specific Colorectal Cancer Incidence Rates in Delaware, by Race: 2002-06
NOTE: Rate for African Americans age 0–39 is not displayed due to patient confidentiality rules. SOURCE: Delaware Cancer Registry, Delaware’s Division of Public Health, 2009.
Colorectal Cancer by Stage at Diagnosis Table 6.4. Number of Colorectal Cancer Cases in Delaware, by Stage at Diagnosis,
Race and Sex: 2002-06 All Races Caucasian African American Stage at
Diagnosis All Male Female All Male Female All Male Female Local 849 450 399 694 365 329 132 74 58 Regional 949 484 465 798 410 388 137 65 72 Distant 385 209 176 304 171 133 76 34 42 Unknown 137 63 74 103 43 60 18 11 7 Total 2,320 1,206 1,114 1,899 989 910 363 184 179
SOURCE: Delaware Cancer Registry, Delaware’s Division of Public Health, 2009.

36
Table 6.5. Percentage of Colorectal Cancer Cases in Delaware, by Stage at Diagnosis,
Race and Sex: 2002-06 All Races Caucasian African American Stage at
Diagnosis All Male Female All Male Female All Male Female Local 36.6 37.3 35.8 36.6 36.9 36.2 36.4 40.2 32.4 Regional 40.9 40.1 41.7 42.0 41.5 42.6 37.7 35.3 40.2 Distant 16.6 17.3 15.8 16.0 17.3 14.6 20.9 18.5 23.5 Unknown 5.9 5.2 6.6 5.4 4.4 6.6 5.0 6.0 3.9 Total 100.0 100.0 100.0 100.0 100.0 100.0 100.0 100.0 100.0
SOURCE: Delaware Cancer Registry, Delaware’s Division of Public Health, 2009. Figure 6.4. Percentage of Colorectal Cancer Cases in Delaware and the U.S., by Stage
at Diagnosis: 2002-06
Figure 6.4a. Delaware: 2002-06
Figure 6.4b. U.S.: 2002-06
SOURCES: Delaware: Delaware Cancer Registry, Delaware’s Division of Public Health, 2009; U.S.: Surveillance, Epidemiology, and End Results Program, National Cancer Institute, 2009.

37
Figure 6.5. Percentage of Colorectal Cancer Cases in Delaware, by Stage at Diagnosis: 1980–2006
SOURCE: Delaware Cancer Registry, Delaware’s Division of Public Health, 2009.
Colorectal Cancer Mortality Table 6.6. Number of Colorectal Cancer Deaths in Delaware and Counties, by Race
and Sex: 2002-06 All Races Caucasian African American
All Male Female All Male Female All Male Female
Delaware 828 435 393 686 357 329 136 74 62 Kent 134 72 62 107 58 49 25 12 13 New Castle 449 232 217 363 187 176 82 43 39 Sussex 245 131 114 216 112 104 29 19 10
SOURCE: Delaware Health Statistics Center, 2009.

38
Table 6.7. Five-Year Average Age-Adjusted Colorectal Cancer Mortality Rates* in the U.S., Delaware and Counties, by Race and Sex: 2002-06
SEX RACE AND REGION
All Male Female ALL RACES
United States 18.2 (18.1, 18.3) 21.9 (21.8, 22.1) 15.4 (15.3, 15.5)
Delaware 18.5 (17.3, 19.8) 22.9 (20.8, 25.1) 15.2 (13.7, 16.7)
Kent 20.1 (16.7, 23.5) 25.5 (19.9, 32.1) 16.4 (12.6, 21.0)
New Castle 18.0 (16.4, 19.7) 22.1 (19.2, 24.9) 14.3 (12.4, 16.2)
Sussex 19.9 (17.4, 22.4) 23.5 (19.5, 27.6) 16.6 (13.5, 19.6)
CAUCASIAN
United States 17.7 (17.6, 17.7) 21.4 (21.2, 21.5) 14.9 (14.8, 15.0)
Delaware 17.9 (16.6, 19.3) 21.9 (19.7, 24.2) 14.8 (13.2, 16.4)
Kent 19.7 (16.0, 23.4) 24.5 (18.6, 31.7) 16.1 (11.9, 21.2)
New Castle 16.9 (15.2, 18.7) 21.3 (18.3, 24.4) 13.7 (11.7, 15.7)
Sussex 19.3 (16.7, 21.8) 22.0 (17.9, 26.0) 16.8 (13.6, 20.0)
AFRICAN AMERICAN
United States 25.4 (25.1, 25.7) 31.4 (30.9, 31.9) 21.6 (21.3, 21.9)
Delaware 23.6 (19.6, 27.5) 31.0 (24.4, 38.9) 18.2 (13.9, 23.3)
Kent 24.1 (15.6, 35.5) --- ---
New Castle 21.3 (17.0, 26.5) 26.7 (19.3, 36.0) 17.1 (12.2, 23.4)
Sussex 29.2 (19.6, 42.0) --- ---
* = Rates are per 100,000 population and age-adjusted to the 2000 U.S. standard population. --- = Rate based on fewer than 20 deaths. SOURCES: Delaware: Delaware Health Statistics Center, 2009; U.S.: National Center for Health Statistics, 2009.

39
Figure 6.6. Five-Year Average Age-Adjusted Colorectal Cancer Mortality Rates* in the U.S. and Delaware, by Sex: 1980–2006
* = Rates are per 100,000 population and age-adjusted to the 2000 U.S. standard population. SOURCES: Delaware: Delaware Health Statistics Center, 2009; U.S.: National Center for Health Statistics, 2009.
Figure 6.7. Five-Year Average Age-Adjusted Colorectal Cancer Mortality Rates* in Delaware, by Race and Sex: 1980–2006
* = Rates are per 100,000 population and age-adjusted to the 2000 U.S. standard population. SOURCE: Delaware Health Statistics Center, 2009.

40
Table 6.8. Age-Specific Colorectal Cancer Mortality Rates* in Delaware, by Race and
Sex: 2002-06 All Races Caucasian African American Age
Group All Male Female All Male Female All Male Female 0–39 --- --- --- --- --- --- --- --- --- 40–64 15.5 18.8 12.4 14.8 17.9 11.9 20.2 25.7 15.6 65–74 68.1 90.4 48.9 66.0 88.2 46.6 83.9 --- --- 75–84 129.9 165.2 105.4 123.8 151.5 104.2 185.2 285.8 --- 85+ 225.2 245.3 216.7 231.7 257.4 220.6 --- ---- ----
* = Rates are per 100,000 population. --- = Rate based on fewer than 20 deaths. SOURCE: Delaware Health Statistics Center, 2009.
Figure 6.8. Age-Specific Colorectal Cancer Mortality Rates* in Delaware, by Race: 2002-06
NOTE: Rates for either race age 0–39 and African Americans age 85+ are not displayed due to patient confidentiality rules. SOURCE: Delaware Cancer Registry, Delaware’s Division of Public Health, 2009.

41
7. Hodgkin Lymphoma
Risk Factors and Early Detection Risk Factors for Hodgkin Lymphoma (HL)
Family history of the disease, particularly having a sibling with HL Sex: Males have a slightly higher occurrence of HL than do females Past infection with Epstein-Barr virus Age: HL incidence peaks in early adulthood (ages 15-40) and in late adulthood (ages 55 and older) People in higher socioeconomic groups are at increased risk for HL; the reasons for this are not
established Geographic area: HL is most common in North America and Europe and least common in Asia Compromised immune system Exposure to solvents (especially TCE), pesticides (especially acid herbicides, DDT and
chlorophenols) and benzene Possible Risk Factors for HL
Workers in the dry cleaning, woodworking and rubber- and/or plastic-making industries may be at an increased risk for HL
Tobacco use Early Detection of HL
There is currently no recommended screening test for Hodgkin lymphoma. The best method of early detection is for individuals to know their risks and report any symptoms to their doctors.
Data Highlights New Hodgkin Lymphoma Cases and Deaths (Tables 7.1 and 7.6)
Hodgkin lymphoma was one of the lesser-diagnosed cancers from 2002-06. A total of 145 cases of HL were diagnosed in Delaware during this time.
HL accounted for 0.6 percent of all cancer cases diagnosed during 2002-06 in Delaware.
Newly diagnosed cases affected more males than females: 80 cases (55.2 percent) were diagnosed among males and 65 cases (44.8 percent) were diagnosed among females.
Hodgkin lymphoma was the one of the least common causes of cancer deaths among both males and females for 2002-06, accounting for only 0.2 percent of the state’s cancer deaths.
Of the 17 Delaware residents who died from HL, 58.8 percent were male and 41.2 percent were female.
Hodgkin Lymphoma Incidence and Mortality Rates (Tables 7.2 and 7.7)
Delaware’s 2002-06 Hodgkin lymphoma incidence rate (3.5 per 100,000) was significantly higher than the U.S. rate (2.8 per 100,000).
At the national level, the 2002-06 HL incidence rates among males were significantly elevated compared to females; no significant differences were observed between sexes at the state level.
The 2002-06 HL incidence data were too sparse to analyze by race and sex at the county level.
Due to the low number of deaths in Delaware attributable to Hodgkin lymphoma and the unreliability of rates based on small numbers, the 2002-06 mortality rate is not published.

42
Trends in Hodgkin Lymphoma Incidence and Mortality Rates (Figures 7.1–7.2 and 7.6–7.7) Note: Methodology for the assignment of Hodgkin lymphoma and non-Hodgkin lymphoma was modified beginning in reporting period 2001-2005 to include consideration of histology as well as primary site. Incidence rates for these two types of cancer increased as a result of this change.
From 1992-96 to 2002-06, Delaware’s Hodgkin lymphoma incidence rate increased 12.9 percent while the U.S. rate remained stable.
Between 1992-96 and 2002-06, Delaware’s HL incidence rates increased 27.6 percent for Caucasians while the rate fell 19.5 percent for African Americans.
Delaware’s HL incidence rates increased 2.6 percent for males and 29.2 percent for females between 1992-96 and 2002-06.
From 1992-96 to 2002-06, Delaware’s rates dropped among African American males and females by 18.8 percent and 17.1 percent, respectively.
Over the same ten-year period, Delaware’s rates increased among Caucasian males and females by 16.7 and 40.9 percent, respectively.
Trends in Delaware’s HL mortality rate cannot be evaluated due to the low number of deaths attributed to HL.
Age-Specific Incidence and Mortality Rates (Tables 7.3 and 7.8, Figures 7.3 and 7.8)
The 2002-06 Hodgkin lymphoma incidence rate for Delaware followed the bimodal trend seen at the national level, with highest rates occurring in the 0-39 and 75-84 age groups.
In Delaware, the 2002-06 HL incidence rates were higher for males than for females in the 0-74 age groups while they were higher for females than for males in the 75-older age groups.
Stage at Diagnosis of Hodgkin Lymphoma (Figure 7.4)
For 2002-06, 22.8 percent, 37.2 percent and 36.6 percent of HL cases diagnosed in Delaware were detected at the local, regional and distant stages, respectively. Comparable percentages for the U.S. were 19.0 percent, 40.0 percent and 35.0 percent, respectively.
Hodgkin Lymphoma Incidence Table 7.1. Number of Hodgkin Lymphoma Cases in Delaware and Counties, by Race
and Sex: 2002-06
All Races Caucasian African American
All Male Female All Male Female All Male Female Delaware 145 80 65 113 63 50 29 15 14 Kent 19 10 9 16 9 7 --- --- --- New Castle 94 53 41 68 40 28 25 13 12 Sussex 32 17 15 29 14 15 --- --- ---
--- = Cell counts are suppressed for patient confidentiality. SOURCE: Delaware Cancer Registry, Delaware’s Division of Public Health, 2009.

43
Table 7.2. Five-Year Average Age-Adjusted Hodgkin Lymphoma Incidence Rates* in the United States, Delaware and Counties, by Race and Sex: 2002-06
SEX
RACE AND REGION All Male Female
ALL RACES
United States 2.8 (2.7, 2.9) 3.1 (3.0, 3.2) 2.5 (2.4, 2.6)
Delaware 3.5 (3.0, 4.1) 4.0 (3.2, 5.0) 3.1 (2.4, 3.9)
Kent --- --- ---
New Castle 3.6 (2.9, 4.4) 4.2 (3.1, 5.5) 3.1 (2.2, 4.2)
Sussex 3.8 (2.6, 5.3) --- ---
CAUCASIAN
United States 3.0 (2.9, 3.1) 3.3 (3.2, 3.4) 2.7 (2.6, 2.8)
Delaware 3.7 (3.0, 4.3) 4.2 (3.2, 5.3) 3.1 (2.3, 4.1)
Kent --- --- ---
New Castle 3.6 (2.8, 4.5) 4.3 (3.1, 5.8) 2.9 (2.0, 4.2)
Sussex 4.0 (2.7, 5.8) --- ---
AFRICAN AMERICAN
United States 2.6 (2.4, 2.8) 2.9 (2.7, 3.1) 2.3 (2.1, 2.5)
Delaware 3.3 (2.2 , 4.8) --- ---
Kent --- --- ---
New Castle 4.3 (2.8, 6.3) --- ---
Sussex --- --- --- * = Rates are per 100,000 population and age-adjusted to the 2000 U.S. standard population. --- = Rate based on fewer than 20 cases. SOURCES: Delaware: Delaware Cancer Registry, Delaware’s Division of Public Health, 2009; U.S.: Surveillance, Epidemiology, and End Results Program, National Cancer Institute, 2009.

44
Figure 7.1. Five-Year Average Age-Adjusted Hodgkin Lymphoma Incidence Rates* in the United States and Delaware, by Sex: 1980–2006
* = Rates are per 100,000 population and are age-adjusted to the 2000 U.S. standard population. SOURCES: Delaware: Delaware Cancer Registry, Delaware’s Division of Public Health 2009; U.S.: Surveillance, Epidemiology, and End Results Program, National Cancer Institute, 2009. Methodology for the assignment of Hodgkin lymphoma and non-Hodgkin lymphoma was modified beginning in reporting period 2001-2005 to include consideration of histology as well as primary site. Incidence rates for these two types of cancer increased as a result of this change.
Figure 7.2. Five-Year Average Age-Adjusted Hodgkin Lymphoma Incidence Rates* in Delaware, by Race and Sex: 1980–2006
* = Rates are per 100,000 population and are age-adjusted to the 2000 U.S. standard population. SOURCE: Delaware Cancer Registry, Delaware’s Division of Public Health, 2009.

45
Table 7.3. Age-Specific Hodgkin Lymphoma Incidence Rates* in Delaware, by Race and Sex: 2002–06
NOTE: Table is not displayed because of patient confidentiality rules; the small number of cases precludes the display of data.
Figure 7.3. Age-Specific Hodgkin Lymphoma Incidence Rates in Delaware, by Race: 2002-06
NOTE: Figure is not displayed because of patient confidentiality rules; the small number of cases precludes the display of data.
Hodgkin Lymphoma by Stage at Diagnosis
NOTE: Tables showing number of cases and percentage of cases of HL by stage at Diagnosis by race and sex were not compiled due to the small number of incident cases from 2002-06. Figure 7.4. Percentage of Hodgkin Lymphoma Cases in Delaware and the U.S., by
Stage at Diagnosis: 2002-06
Figure 7.4a. Delaware: 2002-06
Figure 7.4b. U.S.: 2002-06
SOURCES: Delaware: Delaware Cancer Registry, Delaware’s Division of Public Health, 2009; U.S.: Surveillance, Epidemiology, and End Results Program, National Cancer Institute, 2009.

46
Hodgkin Lymphoma Mortality Table 7.4. Number of Hodgkin Lymphoma Deaths in Delaware and Counties, by Race
and Sex: 2002-06
All Races Caucasian African American
All Male Female All Male Female All Male Female Delaware 17 10 7 16 9 7 --- --- ---
Kent --- --- --- --- --- --- --- --- ---
New Castle --- --- --- --- --- --- --- --- ---
Sussex 8 --- --- 7 --- --- --- --- --- --- = Cell counts are suppressed for patient confidentiality. SOURCE: Delaware Health Statistics Center, 2009. Table 7.5 Five-Year Average Age-Adjusted Hodgkin Lymphoma Mortality Rates* in
the United States, Delaware and Counties, by Race and Sex: 2002-06 SEX
RACE AND REGION All Male Female
ALL RACES
United States 0.4 (0.4, 0.5) 0.5 (0.5, 0.6) 0.4 (0.3, 0.4)
Delaware --- --- ----
Kent --- --- ---
New Castle --- --- ---
Sussex --- --- ---
CAUCASIAN
United States 0.5 (0.4, 0.5) 0.6 (0.5, 0.5) 0.4 (0.4, 0.4)
Delaware --- --- ---
Kent --- --- ---
New Castle --- --- ---
Sussex --- --- ---
AFRICAN AMERICAN
United States 0.4 (0.4, 0.4) 0.5 (0.5, 0.6) 0.3 (0.3, 0.3)
Delaware --- --- ---
Kent --- --- ---
New Castle --- --- ---
Sussex --- --- --- * = Rates are per 100,000 population and age-adjusted to the 2000 U.S. standard population. --- = Rate based on fewer than 20 deaths. SOURCES: Delaware: Delaware Health Statistics Center, 2009; U.S.: National Center for Health Statistics, 2009. Figure 7.5. Five-Year Average Age-Adjusted Hodgkin Lymphoma Mortality Rates* in
the United States and Delaware, by Sex: 1980-2006
NOTE: Figure is not displayed because of patient confidentiality rules; the small number of cases precludes the display of data.
Figure 7.6. Five-Year Average Age-Adjusted Hodgkin Lymphoma Mortality Rates* in Delaware, by Race and Sex: 1980–2006
NOTE: Figure is not displayed because of patient confidentiality rules; the small number of cases precludes the display of data.

47
Table 7.6. Age-Specific Hodgkin Lymphoma Mortality Rates* in Delaware, by Race and Sex: 2002-06
NOTE: Table is not displayed because of patient confidentiality rules; the small number of cases precludes the display of data. Figure 7.8. Age-Specific Hodgkin Lymphoma Mortality Rates in Delaware, by Race:
2002–06
NOTE: Figure is not displayed because of patient confidentiality rules; the small number of cases precludes the display of data.

48
8. Leukemia
Risk Factors and Early Detection Risk Factors for Leukemia (Note: In this publication, “Leukemia” is an umbrella term that includes five general types of blood cancers: Acute Lymphocytic Leukemia or ALL, Acute Myeloid Leukemia or AML, Chronic Lymphocytic Leukemia or CLL, Chronic Myelogenous Leukemia or CML, and Childhood Leukemia. The risk factors below do not pertain to every type of leukemia, but are known risk factors for at least one, if not more than one, type.)
Exposure to ionizing radiation Exposure to certain chemicals including some chemotherapy drugs and benzene Sex: males are at a greater risk of developing leukemias than are females Certain genetic conditions, such as Down syndrome Family history of leukemia Personal history of myelodysplastic syndrome and certain other blood disorders Certain viral infections Tobacco use
Under Investigation as Risk Factors for Leukemia
Exposure to electromagnetic fields (e.g., from power lines) Exposure to certain pesticides/herbicides
Early Detection of Leukemia
There is currently no recommended screening test for leukemia. The best method of early detection is for individuals to know their risks and report any symptoms to their doctors.
Data Highlights New Leukemia Cases and Deaths (Tables 8.1 and 8.4)
Leukemia was the 13th most frequently diagnosed cancer in Delaware from 2002-06. A total of 462 cases of leukemia were diagnosed in the state during this time.
Leukemia accounted for 2.0 percent of all cancer cases diagnosed during 2002-06 in Delaware.
Newly diagnosed cases affected more males than females: 268 cases (58.0 percent) were diagnosed among males and 194 cases (42.0 percent) were diagnosed among females.
Leukemia was the state’s sixth most common cause of cancer deaths among both males and females for 2002-06.
Deaths from leukemia accounted for 3.8 percent of all cancer deaths in Delaware during 2002-06.
Of the 327 Delaware residents who died from leukemia in this five-year period, 54.1 percent were male and 45.9 percent were female.
Leukemia Incidence and Mortality Rates (Tables 8.2 and 8.5)
Delaware’s 2002-06 leukemia incidence rate (10.5 per 100,000) was significantly lower than the U.S. rate (12.1 per 100,000).
For 2002-06 at all geographic levels except Kent County, for all races combined, the
leukemia incidence rates for males were significantly higher than rates for females.
Among Caucasians, the incidence rates for males were significantly higher than for females at all geographic levels with the exception of Kent County.

49
At the national level, 2002-06 incidence rates for African Americans were significantly lower than for Caucasians; no significant differences were observed by race at the state level.
Delaware’s 2002-06 leukemia mortality rate (7.4 per 100,000) was not significantly different from that of the U.S. (7.3 per 100,000).
For 2002-06, for all races combined, the leukemia mortality rates were significantly higher for males than for females at the national, state and New Castle county levels.
No significant differences in the state’s 2002-06 leukemia mortality rates by race and sex were observed by county of residence.
Trends in Leukemia Incidence and Mortality Rates (Figures 8.1–8.2 and 8.4–8.5)
From 1992-96 to 2002-06, Delaware’s leukemia incidence rate decreased 6.2 percent while the U.S. rate fell 6.9 percent.
Delaware’s leukemia incidence rates decreased 7.0 percent for Caucasians and 4.8 percent for African Americans between 1992-96 and 2002-06.
Delaware’s leukemia rates decreased 4.7 percent for males and 12.1 percent for females between 1992-96 and 2002-06.
Historically, Delaware’s leukemia mortality rate has been slightly higher than the U.S. rate. However, Delaware’s 2002-06 leukemia mortality rate was not significantly different from the U.S. rate.
Between 1992-96 and 2002-06, Delaware’s leukemia mortality rate dropped 9.8 percent while the U.S. rate dropped 7.6 percent.
Delaware’s mortality rate for males decreased 17.9 percent from 1992-96 to 2002-06 while the rate for females fell 7.8 percent.
Age-Specific Incidence and Mortality Rates (Tables 8.3 and 8.6, Figures 8.3 and 8.6)
The 2002-06 leukemia incidence rate increased with age; Delawareans age 85 and older had the highest age-specific incidence rate with the exception of African American women (highest in the 74-85 age group).
For all races and age groups, the leukemia incidence rates were higher for males than for females.
The 2002-06 leukemia mortality rate increased with age; Delawareans age 85 and older had the highest age-specific incidence rate with the exception of African American women (highest in the 74-85 age group).
For all races, the leukemia mortality rates were higher for males than for females in age groups 65 and up while mortality rates were higher among women than men in age groups 0 - 64.
Stage at Diagnosis of Leukemia
Leukemia was not staged for this report.

50
Leukemia Incidence Table 8.1. Number of Leukemia Cases in Delaware and Counties, by Race and Sex:
2002-06
All Races Caucasian African American
All Male Female All Male Female All Male Female Delaware 462 268 194 387 228 159 66 34 32 Kent 75 39 36 65 35 30 10 --- --- New Castle 250 140 110 208 120 88 36 17 19 Sussex 137 89 48 114 73 41 20 --- ---
--- = Cell counts are suppressed for patient confidentiality. SOURCE: Delaware Cancer Registry, Delaware’s Division of Public Health, 2009.
Table 8.2. Five-Year Average Age-Adjusted Leukemia Incidence Rates* in the United
States, Delaware and Counties, by Race and Sex: 2002-06
SEX RACE AND REGION
All Male Female ALL RACES
United States 12.2 (12.1, 12.3) 15.8 (15.6, 16.0) 9.5 (9.4, 9.6)
Delaware 10.5 (9.6, 11.5) 14.0 (12.3, 15.7) 8.0 (6.9, 9.1)
Kent 11.1 (8.7, 13.9) 13.7 (9.8, 18.8) 9.7 (6.8, 13.4)
New Castle 9.9 (8.7, 11.2) 12.9 (10.8, 15.0) 7.7 (6.3, 9.1)
Sussex 11.8 (9.8, 13.8) 16.9 (13.5, 20.7) 7.5 (5.5, 9.9)
CAUCASIAN
United States 12.8 (12.7, 12.9) 16.5 (16.3, 16.7) 9.9 (9.7, 10.1)
Delaware 10.6 (9.6, 11.7) 14.2 (12.3, 16.0) 8.0 (6.8, 9.2)
Kent 12.1 (9.3, 15.4) 14.8 (10.3, 20.5) 10.3 (6.9, 14.7)
New Castle 10.1 (8.7, 11.4) 13.6 (11.1, 16.0) 7.6 (6.1, 9.4)
Sussex 10.8 (8.8, 12.7) 14.9 (11.7, 18.7) 7.3 (5.2, 9.9)
AFRICAN AMERICAN
United States 9.8 (9.5, 10.1) 12.7 (12.1, 13.3) 7.8 (7.4, 8.2)
Delaware 9.9 (7.7, 12.6) 12.8 (8.9, 17.9) 8.4 (5.8, 11.9)
Kent --- --- ---
New Castle 8.0 (5.6, 11.1) --- ---
Sussex 18.8 (11.5, 29.1) --- --- * = Rates are per 100,000 population and age-adjusted to the 2000 U.S. standard population. --- = Rate based on fewer than 20 cases. SOURCES: Delaware: Delaware Cancer Registry, Delaware’s Division of Public Health, 2009; U.S.: Surveillance, Epidemiology, and End Results Program, National Cancer Institute, 2009.

51
Figure 8.1. Five-Year Average Age-Adjusted Leukemia Incidence Rates* in the United States and Delaware, by Sex: 1980–2006
* = Rates are per 100,000 population and are age-adjusted to the 2000 U.S. standard population. SOURCES: Delaware: Delaware Cancer Registry, Delaware’s Division of Public Health 2009; U.S.: Surveillance, Epidemiology, and End Results Program, National Cancer Institute, 2009.
Figure 8.2. Five-Year Average Age-Adjusted Leukemia Incidence Rates* in Delaware, by Race and Sex: 1980–2006
* = Rates are per 100,000 population and are age-adjusted to the 2000 U.S. standard population. SOURCE: Delaware Cancer Registry, Delaware’s Division of Public Health, 2009.

52
Table 8.3. Age-Specific Leukemia Incidence Rates* in Delaware, by Race and Sex: 2002-06
All Races Caucasian African American Age
Group All Male Female All Male Female All Male Female 0–39 3.1 3.8 2.4 3.3 4.0 2.6 --- --- --- 40–64 9.7 11.0 8.4 9.4 10.7 8.2 11.3 --- --- 65–74 36.7 51.0 24.4 38.3 54.3 24.4 --- --- --- 75–84 52.6 74.0 37.7 52.5 75.8 36.0 --- --- --- 85+ 74.6 122.7 54.2 77.2 120.1 58.8 --- --- ---
* = Rates are per 100,000 population. --- = Rate based on fewer than 20 cases. SOURCE: Delaware Cancer Registry, Delaware’s Division of Public Health, 2009.
Figure 8.3. Age-Specific Leukemia Incidence Rates in Delaware, by Race: 2002-06 NOTE: Figure is not displayed because of patient confidentiality rules; the small number of cases precludes the display of data.
Leukemia Mortality Table 8.4. Number of Leukemia Deaths in Delaware and Counties, by Race and Sex:
2002-06
All Races Caucasian African American
All Male Female All Male Female All Male Female Delaware 327 177 150 290 157 133 35 18 17
Kent 51 21 30 39 16 23 11 --- ---
New Castle 196 111 85 178 99 79 17 11 6
Sussex 80 45 35 73 42 31 7 --- --- --- = Cell counts are suppressed for patient confidentiality. SOURCE: Delaware Health Statistics Center, 2009.

53
Table 8.5. Five-Year Average Age-Adjusted Leukemia Mortality Rates* in the United
States, Delaware and Counties, by Race and Sex: 2002-06
SEX RACE AND REGION
All Male Female ALL RACES
United States 7.3 (7.3, 7.3) 9.8 (9.7, 9.9) 5.5 (5.5, 5.6)
Delaware 7.4 (6.6. 8.2) 9.6 (8.2, 11.0) 5.9 (5.0, 6.9)
Kent 7.8 (5.8, 10.3) 8.2 (5.1, 12.6) 7.9 (5.3, 11.2)
New Castle 7.9 (6.8, 9.0) 10.9 (8.8, 12.9) 5.8 (4.7, 7.2)
Sussex 6.3 (5.0, 7.9) 8.1 (5.9, 10.8) 4.8 (3.4, 6.7)
CAUCASIAN
United States 7.5 (7.5, 7.6) 10.1 (10.0, 10.2) 5.7 (5.6, 5.7)
Delaware 7.6 (6.8, 8.5) 9.9 (8.3, 11.4) 6.2 (5.2, 7.3)
Kent 7.3 (5.2, 10.0) --- 7.3 (4.6, 10.9)
New Castle 8.5 (7.2, 9.7) 11.5 (9.4, 14.0) 6.7 (5.3, 8.3)
Sussex 6.3 (4.9, 7.9) 8.1 (5.8, 10.9) 4.7 (3.2, 6.7)
AFRICAN AMERICAN
United States 6.4 (6.3, 6.6) 8.5 (8.3, 8.8) 5.1 (4.9, 5.2)
Delaware 5.6 (3.9, 7.8) --- ---
Kent --- --- ---
New Castle --- --- ---
Sussex --- --- ---
* = Rates are per 100,000 population and age-adjusted to the 2000 U.S. standard population. --- = Rate based on fewer than 20 deaths. SOURCES: Delaware: Delaware Health Statistics Center, 2009; U.S.: National Center for Health Statistics, 200-.

54
Figure 8.4. Five-Year Average Age-Adjusted Leukemia Mortality Rates* in the United States and Delaware, by Sex: 1980–2006
* = Rates are per 100,000 population and are age-adjusted to the 2000 U.S. standard population. SOURCES: Delaware: Delaware Health Statistics Center, 2009; U.S.: National Center for Health Statistics, 2009.
Figure 8.5. Five-Year Average Age-Adjusted Leukemia Mortality Rates* in Delaware,
by Race: 1980–2006
* = Rates are per 100,000 population and are age-adjusted to the 2000 U.S. standard population. SOURCE: Delaware Health Statistics Center, 2009.

55
Table 8.6. Age-Specific Leukemia Mortality Rates* in Delaware, by Race and Sex: 2002-06
All Races Caucasian African American Age
Group All Male Female All Male Female All Male Female 0–39 0.9 --- --- --- --- --- --- --- --- 40–64 5.2 5.0 5.4 5.3 5.2 5.5 --- --- --- 65–74 24.6 34.3 16.3 26.1 35.6 17.8 --- --- --- 75–84 54.6 77.7 38.6 58.2 82.6 40.9 --- --- --- 85+ 82.2 122.7 65.0 87.5 125.8 71.1 --- --- ---
* = Rates are per 100,000 population. --- = Rate based on fewer than 20 deaths. SOURCE: Delaware Health Statistics Center, 2009.
Figure 8.6. Age-Specific Leukemia Mortality Rates in Delaware, by Race: 2002-06 NOTE: Figure is not displayed because of patient confidentiality rules; the small number of cases precludes the display of data.

56
9. Lung and Bronchial Cancer
Risk Factors and Early Detection Risk Factors for Lung Cancer
Tobacco use: cigarette, cigar and pipe smoking
An estimated 87 percent of lung cancers are caused by smoking cigarettes, cigars or pipes
The longer a person has smoked and the more packs smoked per day, the greater the risk
Occupational exposures to known lung carcinogens, including asbestos, mustard gas, radioactive ores and heavy metals
Exposure to secondhand smoke
Exposure to radon gas
Radiation therapy to the chest, especially for people who smoke
Personal history of lung cancer
Family history of lung cancer
Diseases such as silicosis, berylliosis and chronic obstructive pulmonary disease Possible Risk Factors for Lung Cancer
Diets low in fruits and vegetables
High levels of arsenic in drinking water
Heavy alcohol use
Smoking marijuana
Exposure to air pollution Protective Factors
Never smoking
Stopping smoking at any age
Diets rich in fruits and vegetables
Engaging in recommended levels of physical activity Early Detection of Lung Cancer
There is currently no effective screening test for lung cancer. The American Cancer Society recommends that people at higher risk for lung cancer be aware of their risk and discuss it with their doctor. In addition to lung cancer, cigarette smoking is recognized as a risk factor in the development of numerous other cancers, including cervical, esophageal, kidney, laryngeal, oral, pharyngeal, pancreatic and urinary bladder cancers. Current Trends in Smoking in Delaware and the U.S. Based on 2008 Behavioral Risk Factor Surveillance Study (BRFSS) Data Current smoking trends may be predictive of cancer rates in the 2030s. In the 1980s (i.e., the time period relevant to current lung and bronchial cancer rates), Delaware’s smoking prevalence rates were among the highest in the country. Historical BRFSS data show that in 1982, 30 percent of adult Delawareans smoked cigarettes. By the 1990s, Delaware’s smoking rate among those over the age of 18 had declined to approximately 25 percent. Currently, just fewer than 18 percent of adult Delawareans smoke cigarettes.

57
In 2008, the prevalence of cigarette smoking in Delaware was comparable to prevalence in the U.S. (17.8 percent vs. 18.4 percent, respectively).
In Delaware, there were no significant differences among current smokers with regard to sex or race. On the other hand, at the national level, males were significantly more likely to be current smokers than women and African Americans were significantly more likely to be current smokers than Caucasians.
The prevalence of cigarette smoking was significantly higher for Delawareans between the ages of 18 and 64 compared to those 65 and older (19.9 percent vs. 8.3 percent, respectively).
Delaware college graduates were significantly less likely to be current smokers than Delawareans with less than a college degree (6.8 percent vs. 20.8 percent, respectively).
Delawareans earning less than $25,000 per year were significantly more likely to be current smokers than Delawareans earning more than $25,000 per year (30.4 percent vs. 16.3 percent, respectively).
Data Highlights New Lung/Bronchus Cancer Cases and Deaths (Tables 9.1 and 9.6)
From 2002-06, 3,648 lung cancer cases were diagnosed in Delaware. Lung cancer accounted for 16.0 percent of all new cancer cases diagnosed in the state during this time.
Of the 3,648 lung cancer cases diagnosed from 2002-06, 1,915 cases (52.5 percent) were male. The remaining 1,733 cases (47.5 percent) were female.
From 2002-06, lung cancer was the second most commonly diagnosed cancer among both males and females in Delaware.
Lung cancer was the leading cause of cancer deaths among Delaware males and females during 2002-06, accounting for 31.1 percent of all cancer deaths.
From 2002-06, 2,705 Delaware residents died of lung cancer; 1,505 deaths (55.6 percent) occurred among males and 1,200 (44.4 percent) among females.
Lung/Bronchus Cancer Incidence and Mortality Rates (Tables 9.2 and 9.7)
Delaware’s 2002-06 lung cancer incidence rate (80.5 per 100,000) was significantly higher than the U.S. rate (63.1 per 100,000).
The 2002-06 lung cancer incidence rates for males were significantly higher than for females across all geographic levels and race groups.
At the national level, the 2002-06 lung cancer incidence rates for African Americans were significantly higher than for Caucasians, regardless of sex. However, rates did not differ significantly by race at the state or county levels.
Delaware’s 2002-06 lung cancer mortality rate (59.9 per 100,000) was significantly higher than the U.S. rate (53.4 per 100,000).
Regardless of race, the 2002-06 lung cancer mortality rates for males were significantly higher than for females at both the state and national level.
Trends in Lung/Bronchus Cancer Incidence and Mortality (Figures 9.1–9.2 and 9.6–9.7)
Since the 1980s, in both Delaware and the U.S., lung cancer incidence rates have decreased among males. For females, rates among African American women have begun to decrease, but continue to increase among Caucasian females.
From 1992-96 to 2002-06, Delaware’s male lung cancer incidence rate decreased 19.1 percent while the comparable U.S. rate fell 15.5 percent. During the same time, Delaware’s female lung cancer incidence rate increased 6.5 percent while the comparable U.S. rate increased 4.3 percent.
In Delaware, from 1992-96 to 2002-06, the African American male lung cancer incidence rate fell 36.6 percent, the African American female rate fell 5.5 percent and the Caucasian male lung

58
cancer incidence rate fell 15.8 percent. During this same time, Delaware’s lung cancer incidence rate for Caucasian females increased 9.6 percent.
Delaware’s male and female lung cancer mortality rates have historically been higher than comparable U.S. rates. Among Delaware males, however, this disparity has decreased over time. When Delaware’s lung cancer mortality rate peaked among men (the five-year period 1987-91), the state rate was 21 percent greater than the national rate. For 2002-06, however, Delaware’s male lung cancer mortality rate was only 9.5 percent greater than the national rate.
Lung cancer mortality rates among Delawarean women peaked in 1992-96 at 50.2 per 100,000; since then, the lung cancer mortality rate for females in the state has experienced a minimal decrease.
No significant differences in the 2002-06 lung cancer mortality rates were observed between African Americans and Caucasians of either sex at the state level.
Age-Specific Incidence and Mortality Rates (Tables 9.3 and 9.8, Figures 9.3 and 9.8)
In Delaware, for 2002-06, lung cancer incidence increased with age, with a peak incidence observed among Delawareans age 75-84. In this age group, the male lung cancer incidence rate was approximately 1.6 times higher than the female rate.
Delaware’s 2002-06 lung cancer mortality peaked among those aged 75-84. Stage at Diagnosis of Lung/Bronchus Cancer (Tables 9.4–9.5, Figures 9.4–9.5)
In Delaware, for 2002-06, 18.4 percent, 27.1 percent and 47.3 percent of lung and bronchial cancers were diagnosed at the local, regional and distant stage, respectively. In the U.S., for 2002-06, comparable percentages were 15.0 percent, 22.0 percent and 55.0 percent, respectively.
Among Delawareans diagnosed with lung cancer, the proportion of those diagnosed with advanced disease did not differ by race. Among African Americans diagnosed with the disease, 74.9 percent of cases were diagnosed in the regional or distant stages. Among Caucasians, 74.4 percent of cases were diagnosed in the regional or distant stages.

59
Lung and Bronchial Cancer Incidence Table 9.1. Number of Lung and Bronchial Cancer Cases in Delaware and Counties, by
Race and Sex: 2002-06 All Races Caucasian African American
All Male Female All Male Female All Male Female
Delaware 3,648 1,915 1,733 3,097 1,617 1,480 514 276 238
Kent 601 331 270 497 271 226 95 56 39
New Castle 1,964 977 987 1,621 802 819 325 164 161
Sussex 1,083 607 476 979 544 435 94 56 38
SOURCE: Delaware Cancer Registry, Delaware’s Division of Public Health, 2009. Table 9.2. Five-Year Average Age-Adjusted Lung and Bronchial Cancer Incidence
Rates* in the U.S., Delaware and Counties, by Race and Sex: 2002-06 SEX
RACE AND REGION All Male Female
ALL RACES
United States 63.1 (62.8, 63.4) 77.7 (77.3, 78.1) 52.5 (52.2, 52.8)
Delaware 80.5 (77.9, 83.1) 96.7 (92.3, 101.0) 69.1 (65.8, 72.3)
Kent 88.1 (81.1, 95.2) 112.1 (100.0, 124.2) 71.0 (62.5, 79.4)
New Castle 78.4 (74.9, 81.9) 89.3 (83.7, 94.9) 68.9 (64.6, 73.2)
Sussex 84.5 (79.5, 89.5) 103.9 (95.6, 112.2) 69.5 (63.2, 75.7)
CAUCASIAN
United States 64.4 (64.1, 64.7) 77.6 (77.1, 78.1) 54.8 (54.4, 55.2)
Delaware 80.5 (77.6, 83.3) 95.3 (90.6, 99.9) 69.9 (66.4, 73.5)
Kent 89.5 (81.6, 97.3) 112.1 (98.7, 125.4) 73.2 (63.7, 82.8)
New Castle 76.9 (73.1, 80.6) 88.0 (82.0, 94.1) 69.6 (64.8, 74.3)
Sussex 84.0 (78.7, 89.2) 101.3 (92.8, 109.9) 70.6 (64.0, 77.3)
AFRICAN AMERICAN
United States 74.7 (73.7, 75.7) 104.3 (102.5, 106.1) 54.7 (53.6, 55.8)
Delaware 84.6 (77.3, 91.9) 109.6 (96.6, 122.5) 68.1 (59.5, 76.8)
Kent 88.4 (71.5, 108.0) 120.2 (90.8, 155.7) 65.1 (46.3, 89.1)
New Castle 80.5 (71.7, 89.2) 98.1 (83.0, 113.1) 69.4 (58.7, 80.1)
Sussex 93.5 (75.5, 114.4) 134.1 (101.3, 174.1) 65.7 (46.5, 90.1)
* = Rates are per 100,000 population and age-adjusted to the 2000 U.S. standard population. SOURCES: Delaware: Delaware Cancer Registry, Delaware’s Division of Public Health, 2009; U.S.: Surveillance, Epidemiology, and End Results Program, National Cancer Institute, 2009.

60
Figure 9.1. Five-Year Average Age-Adjusted Lung and Bronchial Cancer Incidence Rates* in the U.S. and Delaware, by Sex: 1980–2006
* = Rates are per 100,000 population and age-adjusted to the 2000 U.S. standard population. SOURCES: Delaware: Delaware Cancer Registry, Delaware’s Division of Public Health, 2009; U.S.: Surveillance, Epidemiology, and End Results Program, National Cancer Institute, 2009.
Figure 9.2. Five-Year Average Age-Adjusted Lung and Bronchial Cancer Incidence
Rates* in Delaware, by Race and Sex: 1980–2006
* = Rates are per 100,000 population and age-adjusted to the 2000 U.S. standard population. SOURCE: Delaware Cancer Registry, Delaware’s Division of Public Health, 2009.

61
Table 9.3. Age-Specific Lung and Bronchial Cancer Incidence Rates* in Delaware, by Race and Sex: 2002-06
All Races Caucasian African American Age Group All Male Female All Male Female All Male Female
0–39 1.1 --- --- 1.3 --- --- --- --- --- 40–64 91.6 97.0 86.5 94.5 97.9 91.2 89.3 105.4 75.8 65–74 391.3 462.9 329.7 384.0 451.1 325.5 445.7 538.3 373.5 75–84 508.0 647.1 411.3 512.2 643.2 419.6 497.1 714.6 366.5 85+ 325.6 536.7 236.2 334.6 543.4 245.1 --- --- ---
* = Rates are per 100,000 population. --- = Rate based on fewer than 20 cases. SOURCE: Delaware Cancer Registry, Delaware’s Division of Public Health, 2009.
Figure 9.3. Age-Specific Lung and Bronchial Cancer Incidence Rates in Delaware, by
Race: 2002-06
NOTE: Rates for either race age 0–39 and African Americans age 85+ are not displayed due to patient confidentiality rules. SOURCE: Delaware Cancer Registry, Delaware’s Division of Public Health, 2009.
Lung and Bronchial Cancer by Stage at Diagnosis
Table 9.4. Number of Lung and Bronchial Cancer Cases in Delaware, by Stage at Diagnosis, Race and Sex: 2002-06
All Races Caucasian African American Stage at Diagnosis All Male Female All Male Female All Male Female
Local 670 306 364 562 254 308 101 48 53 Regional 989 510 479 835 422 413 143 82 61 Distant 1,727 963 764 1,469 826 643 242 127 115 Unknown 262 136 126 231 115 116 28 19 9 Total 3,648 1,915 1,733 3,097 1,617 1,480 514 276 238
SOURCE: Delaware Cancer Registry, Delaware’s Division of Public Health, 2009.

62
Table 9.5. Percentage of Lung and Bronchial Cancer Cases in Delaware, by Stage at
Diagnosis, Race and Sex: 2002-06 All Races Caucasian African American Stage at
Diagnosis All Male Female All Male Female All Male Female Local 18.4 16.0 21.0 18.2 15.7 20.8 19.7 17.4 22.3 Regional 27.1 26.6 27.6 27.0 26.1 27.9 27.8 29.7 25.6 Distant 47.3 50.3 44.1 47.4 51.1 43.5 47.1 46.0 48.3 Unknown 7.2 7.1 7.3 7.5 7.1 7.8 5.5 6.9 3.4 Total 100.0 100.0 100.0 100.0 100.0 100.0 100.0 100.0 100.0
SOURCE: Delaware Cancer Registry, Delaware’s Division of Public Health, 2009. Figure 9.4. Percentage of Lung and Bronchial Cancer Cases in Delaware and the U.S.,
by Stage at Diagnosis: 2002-06
Figure 9.4a. Delaware: 2002-06
Figure 9.4b. U.S.: 2002-06
SOURCES: Delaware: Delaware Cancer Registry, Delaware’s Division of Public Health, 2009; U.S.: Surveillance, Epidemiology, and End Results Program, National Cancer Institute, 2009.

63
Figure 9.5. Percentage of Lung and Bronchial Cancer Cases in Delaware, by Stage at Diagnosis: 1980–2006
SOURCE: Delaware Cancer Registry, Delaware’s Division of Public Health, 2009.
Lung and Bronchial Cancer Mortality Table 9.6. Number of Lung and Bronchial Cancer Deaths in Delaware and Counties,
by Race and Sex: 2002-06 All Races Caucasian African American
All Male Female All Male Female All Male Female
Delaware 2,705 1,505 1,200 2,288 1,272 1,016 393 222 171
Kent 445 268 177 366 219 147 74 47 27
New Castle 1,450 776 674 1,201 642 559 235 127 108
Sussex 810 461 349 721 411 310 84 48 36
SOURCE: Delaware Health Statistics Center, 2009.

64
Table 9.7. Five-Year Average Age-Adjusted Lung and Bronchial Cancer Mortality Rates* in the U.S., Delaware and Counties, by Race and Sex: 2002-06
RACE AND REGION SEX All Male Female
ALL RACES
United States 53.4 (53.3, 53.5) 70.5 (70.3, 70.7) 40.9 (40.7, 41.0)
Delaware 59.9 (57.7, 62.2) 77.2 (73.3, 81.1) 47.3 (44.6, 49.9)
Kent 65.9 (59.8, 72.0) 92.8 (81.7, 103.9) 46.6 (39.8, 53.5)
New Castle 58.2 (55.2, 61.2) 72.1 (67.0, 77.1) 46.6 (43.0, 50.1)
Sussex 62.7 (58.3, 67.0) 79.4 (72.1, 86.7) 49.8 (44.5, 55.0)
CAUCASIAN
United States 53.8 (53.6, 53.9) 69.9 (69.7, 70.2) 41.9 (41.7, 42.0)
Delaware 59.3 (56.9, 61.7) 75.9 (71.7, 80.1) 47.0 (44.1, 49.9)
Kent 66.3 (59.5, 73.1) 92.4 (80.2, 104.6) 47.5 (39.8, 55.1)
New Castle 56.8 (53.6, 60.0) 71.4 (65.8, 76.9) 46.4 (42.5, 50.2)
Sussex 61.1 (56.6, 65.5) 76.9 (69.5, 84.3) 48.9 (43.5, 54.4)
AFRICAN AMERICAN
United States 59.9 (59.4, 60.3) 90.1 (89.3, 91.0) 40.0 (39.5, 40.4)
Delaware 66.5 (59.9, 73.1) 90.0 (78.1, 101.8) 50.5 (42.9, 58.0)
Kent 69.7 (54.7, 87.5) 101.1 (74.3, 134.5) 46.9 (30.9, 68.2)
New Castle 59.8 (52.1, 67.4) 77.7 (64.2, 91.2) 47.8 (38.8, 56.8)
Sussex 85.0 (67.8, 105.2) 117.7 (86.8, 156.0) 62.1 (43.5, 86.0)
* = Rates are per 100,000 population and age-adjusted to the 2000 U.S. standard population. SOURCES: Delaware: Delaware Health Statistics Center, 2009; U.S.: National Center for Health Statistics, 2009.
Figure 9.6. Five-Year Average Age-Adjusted Lung and Bronchial Cancer Mortality
Rates* in the U.S. and Delaware, by Sex: 1980–2006
* = Rates are per 100,000 population and age-adjusted to the 2000 U.S. standard population. SOURCES: Delaware: Delaware Health Statistics Center, 2009; U.S.: National Center for Health Statistics, 2009.

65
Figure 9.7. Five-Year Average Age-Adjusted Lung and Bronchial Cancer Mortality Rates* in Delaware, by Race and Sex: 1980–2006
* = Rates are per 100,000 population and age-adjusted to the 2000 U.S. standard population. SOURCE: Delaware Health Statistics Center, 2009.
Table 9.8. Age-Specific Lung and Bronchial Cancer Mortality Rates* in Delaware, by Race and Sex: 2002-06
All Races Caucasian African American Age Group All Male Female All Male Female All Male Female
0–39 --- --- --- --- --- --- --- --- --- 40–64 57.1 66.9 47.9 57.5 65.7 49.7 60.6 81.5 43.1 65–74 291.9 357.9 235.0 284.5 349.4 227.9 351.3 430.6 289.4 75–84 420.0 574.4 312.7 423.8 575.7 316.4 424.0 623.6 304.1 85+ 337.8 526.4 257.9 343.2 532.0 262.3 303.6 --- ---
* = Rates are per 100,000 population. --- = Rate based on fewer than 20 deaths. SOURCE: Delaware Health Statistics Center, 2009.

66
Figure 9.8. Age-Specific Lung and Bronchial Cancer Mortality Rates in Delaware, by Race: 2002-06
NOTE: Rates for either race age 0-39 and African Americans age 85+ are not displayed due to patient confidentiality rules. SOURCE: Delaware Health Statistics Center, 2009.

67
10. Myeloma
Risk Factors and Early Detection Risk Factors for Myeloma
Increasing age: most myeloma cases are diagnosed among those age 65 or greater Sex: males have a slightly higher risk of developing myeloma than do females Race: myeloma is almost twice as prevalent among African Americans than among Caucasians Family history of myeloma; someone with a sibling or parent with myeloma is four times more likely to
develop the disease Personal history of solitary plasmacytoma or MGUS (monoclonal gammopathy of uncertain
significance) Being overweight or obese
Possible Risk Factors for Myeloma
Exposure to radiation Workers in certain petroleum-related industries may have an increased risk of developing myeloma
Early Detection of Myeloma
There is currently no recommended screening test for myeloma. The best method of early detection is for individuals to know their risks and report any symptoms to their doctors.
Data Highlights New Myeloma Cases and Deaths (Tables 10.1 and 10.4)
For 2002-06, 240 myeloma cases were diagnosed in Delaware, accounting for 1.1 percent of all new cancer cases diagnosed during this time.
Of the 240 myeloma cases diagnosed from 2002-06, 136 cases (57.7 percent) were male. The remaining 104 cases (43.3 percent) were female.
Myeloma was the 15th leading cause of cancer deaths among Delaware males and females during 2002-06, accounting for 1.7 percent of all cancer deaths.
In 2002-06, 145 Delaware residents died from myeloma; 76 deaths (56.0 percent) occurred among males and 69 (44.0 percent) among females.
Myeloma Incidence and Mortality Rates (Tables 10.2 and 10.5)
Delaware’s 2002-06 myeloma incidence rate (5.3 per 100,000) was comparable to the U.S. rate (5.6 per 100,000).
The 2002-06 myeloma incidence rates for males were significantly higher than for females at the state and national levels for both races combined and Caucasians only.
At the national level, the 2002-06 myeloma incidence rate for African American males was significantly higher than for females; no significant differences between sexes were observed at the state level.
At the national and state levels, the 2002-06 myeloma incidence rates for African Americans were significantly higher than for Caucasians, regardless of sex.
The 2002-06 incidence data were too sparse for analyses by race at the county-level.
Delaware’s 2002-06 myeloma mortality rate (3.2 per 100,000) did not differ significantly from the U.S. rate (3.6 per 100,000).
While the 2002-06 myeloma mortality rates for males of either race were significantly greater than their female counterparts at the national level, no significant differences were observed by sex and race on the state level.

68
Delaware’s 2002-06 myeloma mortality rate for African Americans (5.6 per 100,000) was significantly greater than the rate for Caucasians (2.9 per 100,000).
Trends in Myeloma Incidence and Mortality (Figures 10.1–10.2 and 10.4–1.5)
From 1992-96 to 2002-06, Delaware’s myeloma incidence rate increased 8.2 percent while the U.S. rate decreased 3.4 percent.
From 1992-96 to 2002-06, Delaware’s myeloma incidence rate among males decreased 2.9 while the female myeloma incidence rate increased 20.6.
Over the same ten-year period, the state’s incidence rate among African Americans fell 13.5 percent while the rate among Caucasians increased 12.5 percent.
Delaware’s myeloma incidence rate for Caucasian males and females and African American females increased by 3.4 percent, 22.2 percent and 22.5 percent, respectively.
Conversely, the incidence rate among African American males decreased by 30.5 percent over the same ten-year period.
Age-Specific Incidence and Mortality Rates (Tables 10.3 and 10.6, Figures 10.3 and 10.6)
In Delaware, for 2002-06, myeloma incidence increased with age, with a peak incidence observed among Delawareans age 75-84.
Delaware’s 2002-06 myeloma incidence data were too sparse for meaningful analyses by sex and race.
Delaware’s 2002-06 myeloma mortality peaked in the 75 and older age group; no deaths occurred in the 0-39 age group.
Stage at Diagnosis of Myeloma
Myeloma was not staged for this report.
Myeloma Incidence Table 10.1. Number of Myeloma Cases in Delaware and Counties, by Race and Sex:
2002-06
All Races Caucasian African American
All Male Female All Male Female All Male Female Delaware 240 136 104 174 102 72 58 30 28 Kent 39 22 17 33 20 13 --- --- --- New Castle 140 78 62 99 56 43 36 19 17 Sussex 61 36 25 42 26 16 --- --- ---
--- = Cell counts are suppressed for patient confidentiality. SOURCE: Delaware Cancer Registry, Delaware’s Division of Public Health, 2009.

69
Table 10.2. Five-Year Average Age-Adjusted Myeloma Incidence Rates* in the United States, Delaware and Counties, by Race and Sex: 2002-06
SEX
RACE AND REGION All Male Female
ALL RACES
United States 5.6 (5.5, 5.7) 7.1 (7.0, 7.2) 4.6 (4.5, 4.7)
Delaware 5.3 (4.6, 5.9) 6.8 (5.6, 7.9) 4.1 (3.3, 4.9)
Kent 5.7 (4.1, 7.8) 7.6 (4.8, 11.5) ---
New Castle 5.5 (4.6, 6.4) 6.8 (5.4, 8.5) 4.2 (3.2, 5.4)
Sussex 4.9 (3.7, 6.3) 6.5 (4.5, 9.0) 3.6 (2.3, 5.3)
CAUCASIAN
United States 5.2 (5.1, 5.3) 6.6 (6.5, 6.7) 4.1 (4.0, 4.2)
Delaware 4.5 (3.8, 5.2) 6.0 (4.8, 7.1) 3.3 (2.6, 4.3)
Kent 6.0 (4.1, 8.4) 8.5 (5.2, 13.2) ---
New Castle 4.6 (3.8, 5.6) 6.0 (4.5, 7.8) 3.5 (2.6, 4.8)
Sussex 3.7 (2.7, 5.0) 5.2 (3.4, 7.7) ---
AFRICAN AMERICAN
United States 11.7 (11.3, 12.1) 14.3 (13.6, 15.0) 10.0 (9.5, 10.5)
Delaware 9.6 (7.3, 12.4) 11.6 (7.8, 16.5) 8.1 (5.4, 11.7)
Kent --- --- ---
New Castle 9.5 (6.6, 13.1) --- ---
Sussex --- --- --- * = Rates are per 100,000 population and age-adjusted to the 2000 U.S. standard population. --- = Rate based on fewer than 20 cases. SOURCES: Delaware: Delaware Cancer Registry, Delaware’s Division of Public Health, 2009; U.S.: Surveillance, Epidemiology, and End Results Program, National Cancer Institute, 2009.

70
Figure 10.1. Five-Year Average Age-Adjusted Myeloma Incidence Rates* in the United States and Delaware, by Sex: 1980–2006
* = Rates are per 100,000 population and are age-adjusted to the 2000 U.S. standard population. SOURCES: Delaware: Delaware Cancer Registry, Delaware’s Division of Public Health 2009; U.S.: Surveillance, Epidemiology, and End Results Program, National Cancer Institute, 2009.
Figure 10.2. Five-Year Average Age-Adjusted Myeloma Incidence Rates* in Delaware, by Race and Sex: 1980–2006
* = Rates are per 100,000 population and are age-adjusted to the 2000 U.S. standard population. SOURCE: Delaware Cancer Registry, Delaware’s Division of Public Health, 2009.

71
Table 10.3. Age-Specific Myeloma Incidence Rates* in Delaware, by Race and Sex: 2002-06
All Races Caucasian African American Age
Group All Male Female All Male Female All Male Female 0–39 --- --- --- --- --- --- --- --- --- 40–64 7.1 8.7 5.6 6.2 7.8 4.6 10.9 --- --- 65–74 19.2 21.1 17.6 15.4 17.0 --- --- --- --- 75–84 34.9 54.2 21.4 31.4 51.0 --- --- --- --- 85+ --- --- --- --- --- --- --- --- ---
* = Rates are per 100,000 population. --- = Rate based on fewer than 20 cases. SOURCE: Delaware Cancer Registry, Delaware’s Division of Public Health, 2009.
Figure 10.3. Age-Specific Myeloma Incidence Rates in Delaware, by Race: 2002-06 NOTE: Figure is not displayed because of patient confidentiality rules; the small number of cases precludes the display of data.
Myeloma Mortality Table 10.4. Number of Myeloma Deaths in Delaware and Counties, by Race and Sex:
2002-06
All Races Caucasian African American
All Male Female All Male Female All Male Female Delaware 145 76 69 114 62 52 30 13 17
Kent 20 11 9 18 9 9 --- --- ---
New Castle 77 34 43 57 27 30 19 6 13
Sussex 48 31 17 39 26 13 --- --- --- --- = Cell counts are suppressed for patient confidentiality. SOURCE: Delaware Health Statistics Center, 2009.

72
Table 10.5. Five-Year Average Age-Adjusted Myeloma Mortality Rates* in the United States, Delaware and Counties, by Race and Sex: 2002-06
SEX
RACE AND REGION All Male Female
ALL RACES
United States 3.6 (3.6, 3.6) 4.5 (4.5, 4.6) 3.0 (2.9, 3.0)
Delaware 3.2 (2.7, 3.8) 4.1 (3.2, 5.1) 2.7 (2.1, 3.4)
Kent 3.0 (1.8, 4.7) --- ---
New Castle 3.1 (2.5, 3.9) 3.3 (2.3, 4.6) 2.9 (2.1, 3.9)
Sussex 3.6 (2.7, 4.8) 5.5 (3.7, 7.7) ---
CAUCASIAN
United States 3.4 (3.3, 3.4) 4.3 (4.2, 4.3) 2.7 (2.7, 2.8)
Delaware 2.9 (2.4, 3.5) 3.8 (2.9, 4.9) 2.3 (1.8, 3.1)
Kent --- --- ---
New Castle 2.7 (2.0, 3.5) 3.1 (2.1, 4.6) 2.4 (1.6, 3.4)
Sussex 3.2 (2.3, 4.3) 4.9 (3.2, 7.2) ---
AFRICAN AMERICAN
United States 6.8 (6.6, 6.9) 8.2 (8.0, 8.5) 5.8 (5.7, 6.0)
Delaware 5.6 (3.8, 8.0) --- ---
Kent --- --- ---
New Castle --- --- ---
Sussex --- --- --- * = Rates are per 100,000 population and age-adjusted to the 2000 U.S. standard population. --- = Rate based on fewer than 20 deaths. SOURCES: Delaware: Delaware Health Statistics Center, 2009; U.S.: National Center for Health Statistics, 2009.

73
Figure 10.4. Five-Year Average Age-Adjusted Myeloma Mortality Rates* in the United States and Delaware, by Sex: 1980–2006
* = Rates are per 100,000 population and are age-adjusted to the 2000 U.S. standard population. SOURCES: Delaware: Delaware Health Statistics Center, 2009; U.S.: National Center for Health Statistics, 2009.
Figure 10.5. Five-Year Average Age-Adjusted Myeloma Mortality Rates* in Delaware,
by Race: 1980–2006
* = Rates are per 100,000 population and are age-adjusted to the 2000 U.S. standard population. SOURCE: Delaware Health Statistics Center, 2009.

74
Table 10.6. Age-Specific Myeloma Mortality Rates* in Delaware, by Race and Sex: 2002-06
All Races Caucasian African American Age
Group All Male Female All Male Female All Male Female 0–39 --- --- --- --- --- --- --- --- --- 40–64 1.8 --- --- --- --- --- --- --- --- 65–74 15.2 17.5 13.2 13.0 --- --- --- --- --- 75+ 28.5 36.7 23.3 26.5 36.6 20.2 --- --- ---
* = Rates are per 100,000 population. --- = Rate based on fewer than 20 deaths. SOURCE: Delaware Health Statistics Center, 2009.
Figure 10.6. Age-Specific Myeloma Mortality Rates in Delaware, by Race: 2002-06 NOTE: Figure is not displayed because of patient confidentiality rules; the small number of cases precludes the display of data.

75
11. Non-Hodgkin Lymphoma (NHL)
Risk Factors and Early Detection Risk Factors for non-Hodgkin Lymphoma
Increasing age: most cases are diagnosed among those age 60 and older Abnormalities of the immune system (either congenital or from therapeutic immunosuppression and
the use of certain drugs) and certain autoimmune diseases (systemic lupus, rheumatoid arthritis) Infection with HIV, Epstein-Barr virus, helicobacter pylori, human-T-cell leukemia/lymphoma virus or
hepatitis C virus Overall, NHL is more common among men than women although some types are more common
among women Race: Caucasians are more likely to develop NHL than are other ethnic groups in the U.S. Exposure to radiation
Possible risk factors for non-Hodgkin Lymphoma
Exposure to chemotherapy and other chemicals including certain herbicides, benzene and hair dyes Being extremely overweight/obese
Early Detection of non-Hodgkin Lymphoma
There is currently no recommended screening test for NHL. The best method of early detection is for individuals to know their risks and report any symptoms to their doctors.
Data Highlights New non-Hodgkin Lymphoma Cases and Deaths (Tables 11.1 and 11.6)
For 2002-06, 853 non-Hodgkin lymphoma cases were diagnosed in Delaware. NHL was the seventh most frequently diagnosed cancer type over these five years, accounting for 3.7 percent of all new cancer cases diagnosed during this time.
Of the 853 NHL cases diagnosed from 2002-06, 465 cases (54.5 percent) were among males. The remaining 388 cases (47.5 percent) were among females.
Non-Hodgkin lymphoma was the 7th leading cause of cancer deaths among Delaware males and females during 2002-06, accounting for 3.5 percent of all cancer deaths in the state.
In 2002-06, 301 Delaware residents died from NHL; 168 deaths (55.8 percent) occurred among males and 133 (44.2 percent) among females.
Non-Hodgkin Lymphoma Incidence and Mortality Rates (Tables 11.2 and 11.7)
Delaware’s 2002-06 non-Hodgkin lymphoma incidence rate (19.2 per 100,000) was comparable to the U.S. rate (19.5 per 100,000).
For both races combined and Caucasians only, the 2002-06 NHL incidence rates for males were significantly higher than for females at both the state and national levels.
At the national level, the 2002-06 NHL incidence rate for African American males was significantly higher than for their female counterparts whereas no significant differences between sexes were observed at the state level.
At the national level, the 2002-06 NHL incidence rates for African Americans were significantly higher than for Caucasians, regardless of sex. No significant differences were observed by sex and race at the state level.
Delaware’s 2002-06 non-Hodgkin lymphoma mortality rate (6.8 per 100,000) was comparable to the U.S. rate (7.1 per 100,000).
The 2002-06 NHL mortality rates for males were significantly higher than for females at both the state and national levels.

76
At the national level, the 2002-06 NHL mortality rates for African Americans were significantly lower than for their Caucasian counterparts whereas no significant differences by race were observed at the state level.
Trends in non-Hodgkin Lymphoma Incidence and Mortality (Figures 11.1–11.2 and 11.5–11.6) Note: Methodology for the assignment of Hodgkin lymphoma and non-Hodgkin lymphoma was modified beginning in reporting period 2001-2005 to include consideration of histology as well as primary site. Incidence rates for these two types of cancer increased as a result of this change.
Non-Hodgkin lymphoma rates have steadily increased at the state level; from 1992-96 to 2002-06, Delaware’s NHL incidence rate increased 45.5 percent. Meanwhile, the comparable U.S. rate remained relatively stable, with only a 1.0 percent increase over the same time.
The rates of increase in NHL incidence were similar for Delaware males and females. From 1992-96 to 2002-06, the state’s NHL incidence rate for males increased 41.0 percent while the rate for females increased 50.0 percent.
Among Delaware males, the increase in NHL incidence rates was more pronounced among Caucasians. From 1992-96 to 2002-06, Delaware’s NHL incidence rate for Caucasian males increased 47.0 percent while the state rate for African American males increased 7.4 percent.
Among Delaware females, the increase in NHL incidence rates was more pronounced among African Americans. From 1992-96 to 2002-06, Delaware’s NHL incidence rate for African American females increased 103.6 percent while the rate for Caucasian females increased 47.8 percent.
In general, non-Hodgkin lymphoma mortality rates for Delaware and the U.S. peaked in the mid-to-late 1990s and have since begun to decline.
Delaware’s NHL mortality rate peaked in 1993-97. Since that time, Delaware’s NHL mortality rate has declined 20.9 percent.
The U.S. NHL mortality rate peaked in 1995-99 and has since declined 18.4 percent. Age-Specific Incidence and Mortality Rates (Tables 11.3 and 11.8, Figures 11.3 and 11.7)
In Delaware, for 2002-06, non-Hodgkin lymphoma incidence increased with age, with a peak incidence observed among Delawareans age 75-84. When analyzed by sex, however, the incidence rate was highest for males over age 85 and highest for females age 75-84.
Delaware’s 2002-06 non-Hodgkin lymphoma mortality rates increased with age, with the highest mortality among those age 75 and older.
Stage at Diagnosis of non-Hodgkin Lymphoma (Tables 11.4-11.5, Figure 11.4)
For 2002-06, 29.8 percent, 17.7 percent and 44.8 percent of non-Hodgkin lymphoma cases diagnosed in Delaware were detected at the local, regional and distant stages, respectively. Comparable percentages for the U.S. were 30.0 percent, 15.0 percent and 47.0 percent, respectively.

77
Non-Hodgkin Lymphoma Incidence
Table 11.1. Number of non-Hodgkin Lymphoma Cases in Delaware and Counties, by Race and Sex: 2002-06
All Races Caucasian African American
All Male Female All Male Female All Male Female
Delaware 853 465 388 740 402 338 99 55 44
Kent 118 74 44 107 65 42 9 --- ---
New Castle 524 256 268 438 211 227 78 41 37
Sussex 211 135 76 195 126 69 12 --- --- --- = Cell counts are suppressed for patient confidentiality.
SOURCE: Delaware Cancer Registry, Delaware’s Division of Public Health, 2009. Table 11.2. Five-Year Average Age-Adjusted non-Hodgkin Lymphoma Incidence Rates*
in the U.S., Delaware and Counties, by Race and Sex: 2002-06
SEX RACE AND REGION
All Male Female ALL RACES
United States 19.5 (19.4, 19.6) 23.5 (23.3, 23.7) 16.4 (16.2, 16.6)
Delaware 19.2 (17.9, 20.5) 23.4 (21.2, 25.5) 15.9 (14.3, 17.5)
Kent 17.2 (14.1, 20.3) 24.2 (19.0, 30.3) 11.6 (8.5, 15.6)
New Castle 20.8 (19.0, 22.5) 22.6 (19.9, 25.4) 18.8 (16.6, 21.1)
Sussex 17.3 (15.0, 19.7) 23.8 (19.8, 27.8) 11.7 (9.2, 14.6)
CAUCASIAN
United States 20.4 (20.2, 20.6) 24.4 (24.1, 24.7) 17.2 (17.0, 17.4)
Delaware 20.0 (18.5, 21.4) 24.1 (21.7, 26.4) 16.7 (14.9, 18.4)
Kent 19.7 (16.0, 23.4) 27.0 (20.8, 34.4) 13.9 (10.0, 18.7)
New Castle 21.1 (19.1, 23.1) 23.0 (19.9, 26.1) 19.8 (17.2, 22.4)
Sussex 17.7 (15.2, 20.2) 24.3 (20.0, 28.5) 11.9 (9.2, 15.0)
AFRICAN AMERICAN
United States 14.8 (14.4, 15.2) 18.3 (17.6, 19.0) 12.2 (11.7, 12.7)
Delaware 14.6 (11.8, 17.7) 18.8 (14.2, 24.5) 11.4 (8.3, 15.3)
Kent --- --- ---
New Castle 17.4 (13.8, 21.7) 21.9 (15.7, 29.8) 14.3 (10.1, 19.7)
Sussex --- --- --- * = Rates are per 100,000 population and age-adjusted to the 2000 U.S. standard population. --- = Rate based on fewer than 20 cases. SOURCES: Delaware: Delaware Cancer Registry, Delaware’s Division of Public Health, 2009; U.S.: Surveillance, Epidemiology, and End Results Program, National Cancer Institute, 2009.

78
Figure 11.1. Five-Year Average Age-Adjusted non-Hodgkin Lymphoma Incidence Rates*
in United States and Delaware, by Sex: 1980–2006
* = Rates are per 100,000 population and are age-adjusted to the 2000 U.S. standard population. SOURCES: Delaware: Delaware Cancer Registry, Delaware’s Division of Public Health 2009; U.S.: Surveillance, Epidemiology, and End Results Program, National Cancer Institute, 2009. Methodology for the assignment of Hodgkin lymphoma and non-Hodgkin lymphoma was modified beginning in reporting period 2001-2005 to include consideration of histology as well as primary site. Incidence rates for these two types of cancer increased as a result of this change.

79
Figure 11.2. Five-Year Average Age-Adjusted non-Hodgkin Lymphoma Incidence Rates* in Delaware, by Race and Sex: 1980–2006
* = Rates are per 100,000 population and are age-adjusted to the 2000 U.S. standard population. SOURCE: Delaware Cancer Registry, Delaware’s Division of Public Health, 2009. Methodology for the assignment of Hodgkin lymphoma and non-Hodgkin lymphoma was modified beginning in reporting period 2001-2005 to include consideration of histology as well as primary site. Incidence rates for these two types of cancer increased as a result of this change.
Table 11.3. Age-Specific non-Hodgkin Lymphoma Incidence Rates* in Delaware, by Race and Sex: 2002-06
All Races Caucasian African American Age
Group All Male Female All Male Female All Male Female 0–39 3.2 3.7 2.7 3.4 4.0 2.7 --- --- --- 40–64 23.1 27.6 18.8 23.8 28.3 19.6 20.6 25.7 16.4 65–74 75.2 94.8 58.3 82.6 102.6 65.1 --- --- --- 75–84 94.5 109.7 84.0 96.4 107.4 88.6 --- --- --- 85+ 89.8 122.7 75.8 92.7 131.6 76.0 --- --- ---
* = Rates are per 100,000 population. --- = Rate based on fewer than 20 cases. SOURCE: Delaware Cancer Registry, Delaware’s Division of Public Health, 2009.
Figure 11.3. Age-Specific non-Hodgkin Lymphoma Incidence Rates in Delaware, by Race: 2002-06
NOTE: Figure is not displayed because of patient confidentiality rules; the small number of cases precludes the display of data.

80
Non-Hodgkin Lymphoma by Stage at Diagnosis
Table 11.4. Number of non-Hodgkin Lymphoma Cases in Delaware, by Stage at Diagnosis, Race and Sex: 2002-06
All Races Caucasian African American Stage at Diagnosis All Male Female All Male Female All Male Female
Local 254 112 142 223 100 123 27 9 18 Regional 151 86 65 132 75 57 16 9 7 Distant 382 234 148 326 199 127 51 33 18 Unknown 66 33 33 59 28 31 5 4 1 Total 853 465 388 740 402 338 99 55 44
SOURCE: Delaware Cancer Registry, Delaware’s Division of Public Health, 2009. Table 11.5. Percentage of non-Hodgkin Lymphoma Cases in Delaware, by Stage at
Diagnosis, Race and Sex: 2002-06 All Races Caucasian African American Stage at
Diagnosis All Male Female All Male Female All Male Female Local 29.8 24.1 36.6 30.1 24.9 36.4 27.3 16.4 40.9 Regional 17.7 18.5 16.8 17.8 18.7 16.9 16.2 16.4 15.9 Distant 44.8 50.3 38.1 44.1 49.5 37.6 51.5 60.0 40.9 Unknown 7.7 7.1 8.5 8.0 7.0 9.2 5.1 7.3 2.3 Total 100.0 100.0 100.0 100.0 100.0 100.0 100.0 100.0 100.0
SOURCE: Delaware Cancer Registry, Delaware’s Division of Public Health, 2009.
Figure 11.4. Percentage of non-Hodgkin Lymphoma Cases in Delaware and the U.S., by Stage at Diagnosis: 2002-06
Figure 11.4a. Delaware: 2002-06
Figure 11.4b. U.S.: 2002-06
SOURCES: Delaware: Delaware Cancer Registry, Delaware’s Division of Public Health, 2009; U.S.: Surveillance, Epidemiology, and End Results Program, National Cancer Institute, 2009.

81
Non-Hodgkin Lymphoma Mortality
Table 11.6. Number of non-Hodgkin Lymphoma Deaths in Delaware and Counties, by Race and Sex: 2002-006
All Races Caucasian African American All Male Female All Male Female All Male Female
Delaware 301 168 133 265 152 113 36 16 20
Kent 48 31 17 43 27 16 --- --- ---
New Castle 180 91 89 150 79 71 30 12 18
Sussex 73 46 27 72 46 26 --- --- --- --- = Cell counts are suppressed for patient confidentiality. SOURCE: Delaware Health Statistics Center, 2009.
Table 11.7. Five-Year Average Age-Adjusted non-Hodgkin Lymphoma Mortality Rates*
in the U.S., Delaware and Counties, by Race and Sex: 2002-06
SEX RACE AND REGION
All Male Female ALL RACES
United States 7.1 (7.1, 7.1) 9.0 (8.9, 9.1) 5.7 (5.7, 5.8)
Delaware 6.8 (6.0, 7.5) 9.1 (7.7, 10.5) 5.2 (4.3, 6.0)
Kent 7.5 (5.5, 9.9) 12.0 (8.1, 17.0) ---
New Castle 7.3 (6.2, 8.4) 8.9 (7.2, 10.9) 6.0 (4.8, 7.4)
Sussex 5.8 (4.5, 7.2) 8.4 (6.1, 11.1) 3.9 (2.5, 5.6)
CAUCASIAN
United States 7.4 (7.3, 7.4) 9.3 (9.3, 9.4) 5.9 (5.9, 6.0)
Delaware 6.9 (6.1, 7.8) 9.5 (8.0, 11.0) 5.1 (4.2, 6.1)
Kent 8.1 (5.9, 11.0) 13.0 (8.6, 19.0) ---
New Castle 7.1 (6.0, 8.3) 9.2 (7.2, 11.4) 5.7 (4.5, 7.2)
Sussex 6.2 (4.9, 7.9) 9.1 (6.7, 12.1) 4.1 (2.7, 6.0)
AFRICAN AMERICAN
United States 5.0 (4.9, 5.1) 6.3 (6.0, 6.5) 4.1 (3.9, 4.2)
Delaware 5.9 (4.2, 8.2) --- 5.7 (3.5, 8.7)
Kent --- --- ---
New Castle 7.8 (5.3, 11.1) --- ---
Sussex --- --- --- * = Rates are per 100,000 population and age-adjusted to the 2000 U.S. standard population. --- = Rate based on fewer than 20 deaths. SOURCES: Delaware: Delaware Health Statistics Center, 2009; U.S.: National Center for Health Statistics, 2009.

82
Figure 11.5. Five-Year Average Age-Adjusted non-Hodgkin Lymphoma Mortality Rates* in the United States and Delaware, by Sex: 1980-2006
* = Rates are per 100,000 population and are age-adjusted to the 2000 U.S. standard population. SOURCES: Delaware: Delaware Health Statistics Center, 2009; U.S.: National Center for Health Statistics, 2009.
Figure 11.6. Five-Year Average Age-Adjusted non-Hodgkin Lymphoma Mortality Rates*
in Delaware, by Race: 1980–2006
* = Rates are per 100,000 population and are age-adjusted to the 2000 U.S. standard population. SOURCE: Delaware Health Statistics Center, 2009.

83
Table 11.8. Age-Specific non-Hodgkin Lymphoma Mortality Rates* in Delaware, by Race and Sex: 2002-06
All Races Caucasian African American Age
Group All Male Female All Male Female All Male Female 0–39 --- --- --- --- --- --- --- --- --- 40–64 5.0 6.9 3.3 4.7 7.1 --- --- --- --- 65–74 23.9 29.9 18.8 26.1 32.2 20.7 --- --- --- 75+ 59.2 77.5 47.9 61.6 82.1 48.8 --- --- ---
* = Rates are per 100,000 population. --- = Rate based on fewer than 20 deaths. SOURCE: Delaware Health Statistics Center, 2009.
Figure 11.7 Age-Specific non-Hodgkin Lymphoma Mortality Rates in Delaware, by
Race: 2002-06 NOTE: Figure is not displayed because of patient confidentiality rules; the small number of cases precludes the display of data.

84
12. Prostate Cancer
Risk Factors and Early Detection Risk Factors for Prostate Cancer
Increasing age: the risk of prostate cancer rises rapidly after age 50
Family history of prostate cancer
African American race
Nationality: prostate cancer is most commonly diagnosed cancer among men in North America, northwestern Europe, Australia and the Caribbean
Certain genes, such as the BRCA1 and BRCA 2 genes, may increase prostate cancer risk Possible Risk Factors for Prostate Cancer
Diets high in red meat and other high-fat foods (especially animal fats) and low in fruits and vegetables
Diets high in calcium
Heavy alcohol use
Inflammation of the prostate gland
Working in certain industries, for example welders, battery manufacturers, rubber workers, and workers exposed to cadmium
Obesity Protective Factors
High levels of physical activity, particularly in older men, may lower the risk of advanced prostate cancer
Early Detection of Prostate Cancer
Digital rectal exam
Prostate-specific antigen (PSA) blood test The American Cancer Society (ACS) does not support routine testing for prostate cancer for all men at this time but does encourage men to discuss their situation and risk with their doctor. However, the ACS does recommend that the digital rectal exam and PSA blood test be offered yearly, beginning at age 50 to men at an average risk of prostate cancer and with at least a 10 year life expectancy.
Recent data (2008) from the Behavioral Risk Factor Surveillance System (BRFSS) provide information on the pattern of prostate cancer screening among Delawarean men:
In 2008, 57.1 percent of Delaware males ages 40 and older reported having had a PSA blood test in the past two years, compared to 54.8 percent at the national level. This difference did not reach a level of statistical significance.
Men ages 40-64 were significantly less likely to have had a PSA test in the past two years (49.1 percent) than were men ages 65 and older (79.3 percent).
The percentage of Delawarean men who reported having had a PSA blood test in the past two years did not significantly differ by race, education, or income level.

85
Data Highlights New Prostate Cancer Cases and Deaths (Tables 12.1 and 12.6)
With the exception of skin cancers, prostate cancer was the most frequently diagnosed cancer among Delaware males. For 2002-06, it accounted for 3,644 (30.2 percent) of newly diagnosed cancer cases among males in the state.
Prostate cancer was the second leading cause of cancer deaths among males in Delaware for 2002-06; the 452 prostate cancer deaths accounted for 9.8 percent of all cancer deaths among Delaware males in this five-year period.
Prostate Cancer Incidence and Mortality Rates (Tables 12.2 and 12.7)
Delaware’s 2002-06 prostate cancer incidence rate (178.0 per 100,000) was significantly higher than the U.S. rate (159.3 per 100,000).
The 2002-06 prostate cancer incidence rates for African American males were significantly higher than the rates for their Caucasian counterparts at all geographic levels.
The 2002-06 Sussex County prostate cancer incidence rates for all males and Caucasian males were significantly lower than the other county, state and national rates.
Delaware’s 2002-06 prostate cancer mortality rate (26.8 per 100,000) was comparable to the U.S. rate (25.6 per 100,000).
The 2002-06 prostate cancer mortality rates for African American males were significantly higher than the rates for their Caucasian counterparts at all geographic levels.
No significant differences in prostate cancer mortality rates were observed by county.
Trends in Prostate Cancer Incidence and Mortality (Figures 12.1–12.2 and 12.6–12.7)
From 1992-96 to 2002-06, Delaware’s prostate cancer incidence rate fell 15.7 percent. During the same period, the national prostate cancer incidence rate decreased 17.0 percent.
From 1992-96 to 2002-06, the prostate incidence rate for Caucasian males in Delaware decreased by 15.9 percent while the rate for African American males in the state dropped 20.9 percent. Corresponding rates fell 17.2 percent for Caucasian males and 22.0 percent for African American males at the national level.
In Delaware, the difference in prostate cancer incidence rates between African Americans and Caucasians has remained stable over the last ten years. For 1992-96, the African American prostate cancer mortality rate was 1.8 times the rate for Caucasians. For 2002-06, the African American rate was 1.7 times greater than the Caucasian rate.
From 1992-96 to 2002-06, Delaware’s prostate cancer mortality rate fell 40.4 percent. During the same period, the national prostate cancer mortality rate decreased 32.8 percent.
In Delaware, the difference in prostate cancer mortality rates between African Americans and Caucasians has decreased slightly over the last ten years. For 1992-96, the African American prostate cancer mortality rate was 2.8 times the rate for Caucasians. By 2002-06, the African American rate was 2.1 times greater than the Caucasian rate.
Age-Specific Incidence and Mortality Rates (Tables 12.3 and 12.8, Figures 12.3 and 12.8)
For 2002-06, prostate cancer incidence rates in Delaware peaked among males age 65-74 then decreased somewhat among the older age groups.
During the same time, the state’s prostate cancer mortality rates increased with age, with the 85 and older age group having the highest rate.
Stage at Diagnosis of Prostate Cancer (Tables 12.4–12.5, Figures 12.4–12.5)
In Delaware, for 2002-06, 86.7 percent, 7.3 percent and 2.8 percent of prostate cancers were diagnosed at the local, regional and distant stage respectively. At the national level, from 2002-06, comparable percentages were 80.0 percent, 12.0 percent and 4.0 percent, respectively.

86
In Delaware, for 2002-06, 369 cases (10.1 percent of all prostate cancers) were diagnosed in the late (i.e., regional or distant) stages. The proportion of late stage diagnoses did not differ substantially by race.
The proportion of local stage prostate cancers increased from 1980-84 to 2002-06 (from 49.6 percent to 86.7 percent, respectively). During the same time, the proportion of distant stage prostate cancer diagnoses decreased from 27.3 percent to 2.8 percent.
Prostate Cancer Incidence Table 12.1. Number of Prostate Cancer Cases in Delaware and Counties, by Race:
2002-06 All
Male Caucasian
Male African American
Male Delaware 3,644 2,810 750 Kent 602 447 131 New Castle 2,190 1,629 524 Sussex 852 734 95
SOURCE: Delaware Cancer Registry, Delaware’s Division of Public Health, 2009.
Table 12.2. Five-Year Average Age-Adjusted Prostate Cancer Incidence Rates* in the
U.S., Delaware and Counties, by Race: 2002-06 All
Male Caucasian
Male African American
Male United States 159.3 (158.7, 159.9) 153.0 (152.3, 153.7) 239.8 (237.1, 242.5) Delaware 178.0 (172.2, 183.8) 161.0 (155.1, 167.0) 276.6 (256.8, 296.4) Kent 193.1 (177.7, 208.5) 175.2 (159.0, 191.4) 254.0 (210.5, 297.5) New Castle 193.9 (185.8, 202.0) 175.8 (167.2, 184.3) 295.3 (270.0, 320.6) Sussex 139.7 (130.3, 149.1) 129.4 (120.0, 138.7) 225.7 (182.6, 275.8)
* = Rates are per 100,000 population and age-adjusted to the 2000 U.S. standard population. SOURCES: Delaware: Delaware Cancer Registry, Delaware’s Division of Public Health, 2009; U.S.: Surveillance, Epidemiology, and End Results Program, National Cancer Institute, 2009.

87
Figure 12.1. Five-Year Average Age-Adjusted Prostate Cancer Incidence Rates* in the U.S. and Delaware: 1980–2006
* = Rates are per 100,000 population and age-adjusted to the 2000 U.S. standard population. SOURCES: Delaware: Delaware Cancer Registry, Delaware’s Division of Public Health, 2009; U.S.: Surveillance, Epidemiology, and End Results Program, National Cancer Institute, 2009.
Figure 12.2. Five-Year Average Age-Adjusted Prostate Cancer Incidence Rates* in
Delaware, by Race: 1980–2006
* = Rates are per 100,000 population and age-adjusted to the 2000 U.S. standard population. SOURCE: Delaware Cancer Registry, Delaware’s Division of Public Health, 2009.

88
Table 12.3. Age-Specific Prostate Cancer Incidence Rates* in Delaware, by Race: 2002-06
Age Group
All Male
Caucasian Male
African American Male
0–39 --- --- --- 40–64 218.6 192.8 349.7 65–74 990.7 924.3 1,447.4 75–84 878.8 822.2 1,234.3 85+ 684.9 646.4 ---
* = Rates are per 100,000 population. --- = Rate based on fewer than 20 cases. SOURCE: Delaware Cancer Registry, Delaware’s Division of Public Health, 2009.
Figure 12.3. Age-Specific Prostate Cancer Incidence Rates in Delaware, by Race: 2002-06
NOTE: Rates for either race age 0–39 and African Americans age 85+ are not displayed due to patient confidentiality rules. SOURCE: Delaware Cancer Registry, Delaware’s Division of Public Health, 2009.

89
Prostate Cancer by Stage at Diagnosis
Table 12.4. Number of Prostate Cancer Cases in Delaware, by Stage at Diagnosis and Race: 2002-06
Stage at Diagnosis
All Male
Caucasian Male
African American Male
Local 3,161 2,440 649 Regional 266 214 48 Distant 103 75 27 Unknown 114 81 26 Total 3,644 2,810 750
SOURCE: Delaware Cancer Registry, Delaware’s Division of Public Health, 2009.
Table 12.5. Percentage of Prostate Cancer Cases in Delaware, by Stage at Diagnosis and Race: 2002-06
Stage at Diagnosis
All Male
Caucasian Male
African American Male
Local 86.7 86.8 86.5 Regional 7.3 7.6 6.4 Distant 2.8 2.7 3.6 Unknown 3.1 2.9 3.5 Total 100.0 100.0 100.0
SOURCE: Delaware Cancer Registry, Delaware’s Division of Public Health, 2009. Figure 12.4. Percentage of Prostate Cancer Cases in Delaware and the U.S., by Stage at
Diagnosis: 2002-06
Figure 12.4a. Delaware: 2002-06
Figure 12.4b. U.S.: 2002-06
SOURCES: Delaware: Delaware Cancer Registry, Delaware’s Division of Public Health, 2009; U.S.: Surveillance, Epidemiology, and End Results Program, National Cancer Institute, 2009.

90
Figure 12.5. Percentage of Prostate Cancer Cases in Delaware, by Stage at Diagnosis: 1980–2006
SOURCE: Delaware Cancer Registry, Delaware’s Division of Public Health, 2009.
Prostate Cancer Mortality Table 12.6. Number of Prostate Cancer Deaths in Delaware and Counties, by Race:
2002-06
All Male
Caucasian Male
African American Male
Delaware 452 350 96
Kent 63 45 18
New Castle 258 196 59
Sussex 131 109 19
SOURCE: Delaware Health Statistics Center, 2009.
Table 12.7. Five-Year Average Age-Adjusted Prostate Cancer Mortality Rates* in the
U.S., Delaware and Counties, by Race: 2002-06 All
Male Caucasian
Male African American
Male United States 25.6 (25.5, 25.8) 23.6 (23.5, 23.8) 56.3 (55.6, 57.1)
Delaware 26.8 (24.3, 29.2) 23.9 (21.4, 26.4) 50.8 (41.2, 62.1)
Kent 25.3 (19.4, 32.3) 22.6 (16.5, 30.2) ---
New Castle 27.9 (24.5, 31.3) 24.6 (21.2, 28.0) 55.5 (42.3, 71.6)
Sussex 25.6 (21.2, 30.0) 23.4 (19.0, 27.8) ---
* = Rates are per 100,000 population and age-adjusted to the 2000 U.S. standard population. --- = Rate based on fewer than 20 deaths. SOURCES: Delaware: Delaware Health Statistics Center, 2009; U.S.: National Center for Health Statistics, 2009.

91
Figure 12.6. Five-Year Average Age-Adjusted Prostate Cancer Mortality Rates* in the U.S. and Delaware: 1980–2006
* = Rates are per 100,000 population and age-adjusted to the 2000 U.S. standard population. SOURCES: Delaware: Delaware Health Statistics Center, 2009; U.S.: National Center for Health Statistics, 2009.
Figure 12.7. Five-Year Average Age-Adjusted Prostate Cancer Mortality Rates* in Delaware, by Race: 1980–2006
* = Rates are per 100,000 population and age-adjusted to the 2000 U.S. standard population. SOURCE: Delaware Health Statistics Center, 2009.

92
Table 12.8. Age-Specific Prostate Cancer Mortality Rates* in Delaware, by Race: 2002-06
Age Group
All Male
Caucasian Male
African American Male
0–39 --- --- --- 40–64 6.0 4.2 --- 65–74 69.3 58.5 149.5 75–84 242.8 210.7 545.7 85+ 613.3 600.6 ---
* = Rates are per 100,000 population. --- = Rate based on fewer than 20 deaths. SOURCE: Delaware Health Statistics Center, 2009.
Figure 12.8. Age-Specific Prostate Cancer Mortality Rates in Delaware, by Race: 2002-06
NOTE: Rates for either race age 0-39 and for African Americans ages 40-64 and 85+ are not displayed due to patient confidentiality rules. SOURCE: Delaware Health Statistics Center, 2009.

93
13. Stomach Cancer
Risk Factors and Early Detection Risk Factors for Stomach Cancer
Infection with Helicobacter pylori (H. pylori)
Sex: stomach cancer occurs more frequently among males than females
Increasing age: most stomach cancers are diagnosed among those age 50 and older
Race: stomach cancer is more common among Hispanics and African Americans than Caucasians in the U.S.
Geography: stomach cancer is more common in Japan, China, Southern and Eastern Europe and
South and Central America than in North America, South Central Asia and North or West Africa
Diets high in smoked, salted fish and meat
Tobacco use
Previous stomach surgery in which part of the stomach was removed for non-cancerous diseases such as ulcers
Personal history of pernicious anemia, stomach lymphoma or Menetrier disease
Type A blood
Family history of stomach cancer
Possible Risk Factors for Stomach Cancer
Workers in the coal, metal and rubber industries may have an increased risk for stomach cancer
Infection with the Epstein-Barr virus
Personal history of adenomatous stomach polyps
Several inherited conditions may increase the risk of stomach cancer: Hereditary diffuse gastric cancer, hereditary non-polyposis colorectal cancer (Lynch syndrome), BRCA1 and BRCA2 genes
Obesity
Early Detection of Stomach Cancer
There are currently no recommended screening guidelines for stomach cancer. People at an increased risk should discuss screening options with their doctors.
Data Highlights New Stomach Cancer Cases and Deaths (Tables 13.1 and 13.6)
During 2002-06, 318 stomach cancer cases were diagnosed in Delaware, accounting for 1.4 percent of the state’s new cancer cases. Stomach cancer was the state’s 16th most frequently diagnosed cancer type over these five years.
Of the 318 stomach cancer cases diagnosed from 2002-06, 195 cases (61.3 percent) were male. The remaining 123 cases (38.7 percent) were female.
Stomach cancer was the 13th leading cause of cancer deaths among Delaware males and females during 2002-06, accounting for 1.9 percent of the state’s cancer deaths.

94
In 2002-06, 168 Delaware residents died from stomach cancer; 100 deaths (59.5 percent) occurred among males and 68 (40.5 percent) among females.
Stomach Cancer Incidence and Mortality Rates (Tables 13.2 and 13.7)
Delaware’s 2002-06 stomach cancer incidence rate (7.1 per 100,000) was comparable to the U.S. rate (7.9 per 100,000).
At the state and national levels, the 2002-06 stomach cancer incidence rates for African Americans were significantly higher than for Caucasians, regardless of sex.
The 2002-06 stomach cancer incidence rates for Caucasian women were significantly lower than for Caucasian men at both the state and national level.
The 2002-06 stomach cancer incidence rate for African American females was significantly lower than for African American males at the U.S. level but did not differ significantly at the state level.
Delaware’s 2002-06 stomach cancer mortality rate (3.8 per 100,000) did not differ significantly from the U.S. rate (4.0 per 100,000).
The 2002-06 stomach cancer mortality rates for Caucasians were significantly lower than for their African American counterparts at both the state and national levels.
At the national level, the 2002-06 stomach cancer mortality rates for males were significantly greater than for females regardless of race.
In Delaware, the 2002-06 mortality rate for Caucasian males was significantly greater than for Caucasian females. No significant differences were observed by sex among African Americans.
Trends in Stomach Cancer Incidence and Mortality
Five-year average stomach cancer incidence and mortality rates have not been previously calculated for the state, therefore historical trends are not available.
Age-Specific Incidence and Mortality Rates (Tables 13.3 and 13.8, Figures 13.3 and 13.8)
In Delaware, for 2002-06, stomach cancer incidence increased with age, with a peak incidence observed among Delawareans ages 75-84 and 85 and older.
The state 2002-06 stomach cancer mortality rate increased with age; those in the 75 and older group experienced the highest mortality.
Stage at Diagnosis of Stomach Cancer (Tables 13.4 and 13.5, Figure 13.4)
For 2002-06, 23.9 percent, 31.1 percent and 31.1 percent of stomach cancer cases diagnosed in Delaware were detected at the local, regional and distant stages, respectively. Comparable percentages for the U.S. were 23.0 percent, 32.0 percent and 33.0 percent, respectively.
Stomach Cancer Incidence Table 13.1. Number of Stomach Cancer Cases in Delaware and Counties, by Race and
Sex: 2002-06
All Races Caucasian African American
All Male Female All Male Female All Male Female Delaware 318 195 123 223 151 72 81 41 40 Kent 48 26 22 34 21 13 11 --- --- New Castle 201 123 78 136 92 44 56 28 28 Sussex 69 46 23 53 38 15 14 --- ---
--- = Cell counts are suppressed for patient confidentiality. SOURCE: Delaware Cancer Registry, Delaware’s Division of Public Health, 2009.

95
Table 13.2. Five-Year Average Age-Adjusted Stomach Cancer Incidence Rates* in the
United States, Delaware and Counties, by Race and Sex: 2002-06
SEX RACE AND REGION
All Male Female ALL RACES
United States 7.9 (7.8, 8.0) 11.0 (10.8, 11.2) 5.5 (5.4, 5.6)
Delaware 7.1 (6.3, 7.9) 10.0 (8.6, 11.4) 4.9 (4.0, 5.7)
Kent 7.1 (5.2, 9.4) 8.8 (5.8, 12.9) 5.8 (3.6, 8.7)
New Castle 8.0 (6.9, 9.1) 11.1 (9.2, 13.1) 5.4 (4.2, 6.7)
Sussex 5.6 (4.3, 7.1) 8.4 (6.2, 11.3) 3.3 (2.1, 5.0)
CAUCASIAN
United States 6.9 (6.8, 7.0) 9.8 (9.6, 10.0) 4.7 (4.6, 4.8)
Delaware 5.9 (5.1, 6.7) 9.2 (7.7, 10.6) 3.3 (2.6, 4.3)
Kent 6.3 (4.3, 8.8) 9.0 (5.6, 13.7) ---
New Castle 6.4 (5.4, 7.5) 10.0 (8.1, 12.3) 3.6 (2.6, 4.9)
Sussex 4.6 (3.5, 6.1) 7.7 (5.5, 10.6) ---
AFRICAN AMERICAN
United States 12.1 (11.7, 12.5) 16.8 (16.1, 17.5) 9.0 (8.6, 9.4)
Delaware 13.7 (10.9, 17.1) 16.6 (11.9, 22.5) 11.6 (8.3, 15.8)
Kent --- --- ---
New Castle 14.4 (10.9, 18.7) 18.1 (12.0, 26.1) 12.3 (8.2, 17.8)
Sussex --- --- --- * = Rates are per 100,000 population and age-adjusted to the 2000 U.S. standard population. --- = Rate based on fewer than 20 cases. SOURCES: Delaware: Delaware Cancer Registry, Delaware’s Division of Public Health, 2009; U.S.: Surveillance, Epidemiology, and End Results Program, National Cancer Institute, 2009.
Figure 13.1. Five-Year Average Age-Adjusted Stomach Cancer Incidence Rates* in the
United States (Estimates) and Delaware, by Sex: 1980-2006 Five-year average stomach cancer incidence and mortality rates have not been previously calculated for the state, therefore no historical trends are available for comparison at this time.
Figure 13.2. Five-Year Average Age-Adjusted Stomach Cancer Incidence Rates* in Delaware, by Race and Sex: 1980-2006
Five-year average stomach cancer incidence and mortality rates have not been previously calculated for the state, therefore no historical trends are available for comparison at this time.

96
Table 13.3. Age-Specific Stomach Cancer Incidence Rates* in Delaware, by Race and Sex: 2002-06
All Races Caucasian African American Age
Group All Male Female All Male Female All Male Female 0–39 --- --- --- --- --- --- --- --- --- 40–64 7.7 10.5 5.0 6.4 9.9 --- 11.7 --- --- 65–74 28.0 38.6 18.8 21.7 32.2 --- 65.5 --- --- 75–84 46.0 65.3 32.6 40.5 60.6 26.3 --- --- --- 85+ 45.7 ---- --- 37.8 --- --- --- --- ---
* = Rates are per 100,000 population. --- = Rate based on fewer than 20 cases. SOURCE: Delaware Cancer Registry, Delaware’s Division of Public Health, 2009.
Figure 13.3. Age-Specific Stomach Cancer Incidence Rates in Delaware, by Race: 2000-06
NOTE: Figure is not displayed because of patient confidentiality rules; the small number of cases precludes the display of data.
Stomach Cancer by Stage at Diagnosis
Table 13.4. Number of Stomach Cancer Cases in Delaware, by Stage at Diagnosis and Race: 2002-06
All Races Caucasian African American Stage at Diagnosis All Male Female All Male Female All Male Female
Local 76 40 36 46 27 19 28 13 15 Regional 99 66 33 71 53 18 23 11 12 Distant 99 67 32 73 53 20 23 13 10 Unknown 44 22 22 33 18 15 7 4 3 Total 318 195 123 223 151 72 81 41 40
SOURCE: Delaware Cancer Registry, Delaware’s Division of Public Health, 2009. Table 13.5. Percentage of Stomach Cancer Cases in Delaware, by Stage at Diagnosis,
Race and Sex: 2002-06 All Races Caucasian African American Stage at
Diagnosis All Male Female All Male Female All Male Female Local 23.9 20.5 29.3 20.6 17.9 26.4 34.6 31.7 37.5 Regional 31.1 33.9 26.8 31.8 35.1 25.0 28.4 26.8 30.0 Distant 31.1 34.4 26.0 32.7 35.1 27.8 28.4 31.7 25.0 Unknown 13.8 11.3 17.9 14.8 11.9 20.8 8.6 9.8 7.5 Total 100.0 100.0 100.0 100.0 100.0 100.0 100.0 100.0 100.0
SOURCE: Delaware Cancer Registry, Delaware’s Division of Public Health, 2009.

97
Figure 13.4. Percentage of Stomach Cancer Cases in Delaware and the U.S., by Stage at Diagnosis: 2002-06
Figure 13.4a. Delaware: 2002-06
Figure 13.4b. U.S.: 2002-06
SOURCES: Delaware: Delaware Cancer Registry, Delaware’s Division of Public Health, 2009; U.S.: Surveillance, Epidemiology, and End Results Program, National Cancer Institute, 2009.
Stomach Cancer Mortality Table 13.6. Number of Stomach Cancer Deaths in Delaware and Counties, by Race and
Sex: 2002-06
All Races Caucasian African American
All Male Female All Male Female All Male Female Delaware 168 100 68 111 69 42 53 30 23
Kent 29 17 12 20 13 7 8 --- ---
New Castle 104 64 40 66 42 24 35 21 14
Sussex 35 19 16 25 14 11 10 --- --- --- = Cell counts are suppressed for patient confidentiality. SOURCE: Delaware Health Statistics Center, 2009.

98
Table 13.7. Five-Year Average Age-Adjusted Stomach Cancer Mortality Rates* in the United States, Delaware and Counties, by Race and Sex: 2002-06
SEX
RACE AND REGION All Male Female
ALL RACES
United States 4.0 (3.9, 4.0) 5.5 (5.4, 5.5) 2.8 (2.8, 2.9)
Delaware 3.8 (3.2, 4.3) 5.3 (4.2, 6.3) 2.7 (2.1, 3.4)
Kent 4.4 (2.9, 6.3) --- ---
New Castle 4.2 (3.4, 4.9) 6.0 (4.6, 7.7) 2.7 (2.0, 3.7)
Sussex 2.8 (1.9, 3.9) --- ---
CAUCASIAN
United States 3.5 (3.4, 3.5) 4.8 (4.8, 4.9) 2.4 (2.4, 2.5)
Delaware 2.9 (2.4, 3.5) 4.3 (3.4, 5.5) 1.9 (1.4, 2.6)
Kent 3.7 (2.3, 5.7) --- ---
New Castle 3.1 (2.4, 3.9) 4.8 (3.5, 6.5) 1.9 (1.3, 2.9)
Sussex 2.2 (1.4, 3.2) --- ---
AFRICAN AMERICAN
United States 7.6 (7.4, 7.7) 11.0 (10.7, 11.3) 5.3 (5.1, 5.5)
Delaware 9.0 (6.7, 11.7) 11.7 (7.9, 16.8) 6.9 (4.4, 10.4)
Kent --- --- ---
New Castle 9.2 (6.4, 12.8) 12.1 (7.5, 18.5) ---
Sussex --- --- --- * = Rates are per 100,000 population and age-adjusted to the 2000 U.S. standard population. --- = Rate based on fewer than 20 deaths. SOURCES: Delaware: Delaware Health Statistics Center, 2009; U.S.: National Center for Health Statistics, 2009. Figure 13.5. Five-Year Average Age-Adjusted Stomach Cancer Mortality Rates* in the
United States and Delaware, by Sex: 1980-2006 NOTE: Figure is not displayed because of lack of trend data. Figure 13.6. Five-Year Average Age-Adjusted Stomach Cancer Mortality Rates* in
Delaware, by Race and Sex: 1980-2006 NOTE: Figure is not displayed because of lack of trend data.

99
Table 13.8. Age-Specific Stomach Cancer Mortality Rates* in Delaware, by Race and Sex: 2002-06
All Races Caucasian African American Age
Group All Male Female All Male Female All Male Female 0–39 --- --- --- --- --- --- --- --- --- 40–64 3.1 4.1 --- 2.1 --- --- --- --- --- 65–74 12.8 19.0 --- 8.7 --- --- --- --- --- 75+ 31.1 41.7 24.6 27.0 40.0 18.8 --- --- ---
* = Rates are per 100,000 population. --- = Rate based on fewer than 20 deaths. SOURCE: Delaware Health Statistics Center, 2009.
Figure 13.7. Age-Specific Stomach Cancer Mortality Rates in Delaware, by Race: 2002-06
NOTE: Figure is not displayed because of patient confidentiality rules; the small number of cases precludes the display of data.

100
14. Thyroid Cancer
Risk Factors and Early Detection Risk Factors for Thyroid Cancer
Sex: females are two to three times more likely to develop thyroid cancer than are males
Age: adults age 20-60 are at greatest risk for thyroid cancer
Race: Caucasians are more likely to develop thyroid cancer than are African-Americans
Low dietary intake of iodine
Exposure to radiation, especially when radiation exposure occurs in childhood and/or targets the head and neck regions
Personal or family history of goiter, a noncancerous enlargement of the thyroid gland
Several inherited conditions increase the risk of thyroid cancer: approximately 20% of all medullary
thyroid cancers arise from inheriting an abnormal gene. Other genetic conditions such as Gardner syndrome and familial adenomatous polyposis (FAP) increase one’s risk of developing thyroid cancer
Early Detection of Thyroid Cancer
There are currently no recommended screening guidelines for thyroid cancer. People at an increased risk should discuss screening options with their doctors.
Data Highlights New Thyroid Cancer Cases and Deaths (Table 14.1)
During 2002-06, 466 thyroid cancer cases were diagnosed in Delaware. Thyroid cancer was the 12th most frequently diagnosed cancer type over these five years, accounting for 2.0 percent of all new cancer cases.
Of the 466 thyroid cancer cases diagnosed from 2002-06, 111 cases (23.8 percent) were male. The remaining 355 cases (76.2 percent) were female.
Due to the infrequency of thyroid cancer deaths among Delawareans and patient confidentiality rules, 2002-06 thyroid cancer rates were not reported at the state or county levels.
Thyroid Cancer Incidence Rates (Table 14.2)
Delaware’s 2002-06 thyroid cancer incidence rate (10.8 per 100,000) was significantly higher than the U.S. rate (9.6 per 100,000).
Delaware’s 2002-06 thyroid cancer incidence rate for females was three times higher than for males. This same trend is seen at the national level; the 2002-06 U.S. incidence rate for females was 2.9 times higher than for males.
At the national level, the 2002-06 thyroid cancer incidence rate for African Americans was significantly higher than for Caucasians. However, at the state level, the incidence rate for African Americans was not significantly higher than for Caucasians.
Trends in Thyroid Cancer Incidence (Figures 14.1, 14.2)
From 1992-96 to 2002-06, Delaware’s thyroid cancer incidence rate increased 111.8 percent. Over the same time, the national rate increased 57.4 percent.
From 1992-96 to 2002-06, the largest increase in the state’s thyroid cancer rates occurred among African American males (400.0 percent).

101
Rates also increased among African American females, Caucasian females and Caucasian males (136.5 percent, 117.7 percent and 132.0 percent, respectively) over these ten years.
Age-Specific Incidence Rates (Table 14.3)
In Delaware, for 2002-06, thyroid cancer incidence increased with age, with a peak incidence observed among Delawareans ages 65-74. Incidence rates then decreased among Delawareans ages 75 and older.
Stage at Diagnosis of Thyroid Cancer (Tables 14.4 and 14.5, Figure 14.4)
For 2002-06, 77.9 percent, 18.7 percent and 2.8 percent of thyroid cancer cases diagnosed in Delaware were detected at the local, regional and distant stages, respectively. Comparable percentages for the U.S. were 68.0 percent and 24.0 percent and 6.0, respectively.
Thyroid Cancer Incidence Table 14.1. Number of Thyroid Cancer Cases in Delaware and Counties, by Race and
Sex: 2002-06
All Races Caucasian African American
All Male Female All Male Female All Male Female Delaware 466 111 355 392 98 294 65 13 52 Kent 69 13 56 59 11 48 --- --- --- New Castle 317 76 241 260 66 194 50 10 40 Sussex 80 22 58 73 21 52 --- --- ---
--- = Cell counts are suppressed for patient confidentiality. SOURCE: Delaware Cancer Registry, Delaware’s Division of Public Health, 2009.

102
Table 14.2. Five-Year Average Age-Adjusted Thyroid Cancer Incidence Rates* in the
United States, Delaware and Counties, by Race and Sex: 2002-06
SEX RACE AND REGION
All Male Female ALL RACES
United States 9.6 (9.5, 9.7) 4.9 (4.8, 5.0) 14.2 (14.0, 14.4)
Delaware 10.8 (9.8, 11.8) 5.4 (4.4, 6.4) 16.0 (14.3, 17.6)
Kent 10.1 (7.9, 12.8) --- 15.6 (11.8, 20.2)
New Castle 12.2 (10.8, 13.5) 6.2 (0.5, 7.8) 17.5 (15.3, 19.7)
Sussex 8.1 (6.4, 10.1) 4.1 (2.6, 6.2) 12.1 (9.2, 15.6)
CAUCASIAN
United States 10.1 (10.0, 10.2) 5.2 (5.1, 5.3) 15.0 (14.8, 15.2)
Delaware 11.5 (10.4, 12.7) 5.8 (4.7, 7.1) 17.2 (15.2, 19.1)
Kent 11.3 (8.6, 14.6) --- 17.7 (13.0, 23.5)
New Castle 12.8 (11.3, 14.4) 6.8 (5.2, 8.6) 18.8 (16.2, 21.5)
Sussex 8.7 (6.8, 10.9) 4.4 (2.8, 6.8) 13.0 (9.7, 17.1)
AFRICAN AMERICAN
United States 5.8 (5.6, 6.0) 2.7 (2.4, 3.0) 8.4 (8.0, 8.8)
Delaware 8.6 (6.6, 10.9) --- 12.3 (9.2, 16.2)
Kent --- --- ---
New Castle 9.6 (7.1, 12.6) --- 13.7 (9.8, 18.7)
Sussex --- --- --- * = Rates are per 100,000 population and age-adjusted to the 2000 U.S. standard population. --- = Rate based on fewer than 20 cases. SOURCES: Delaware: Delaware Cancer Registry, Delaware’s Division of Public Health, 2006; U.S.: Surveillance, Epidemiology, and End Results Program, National Cancer Institute, 2009.

103
Figure 14.1. Five-Year Average Age-Adjusted Thyroid Cancer Incidence Rates* in the United States and Delaware, by Sex: 1980–2006
* = Rates are per 100,000 population and age-adjusted to the 2000 U.S. standard population. SOURCES: Delaware: Delaware Cancer Registry, Delaware’s Division of Public Health, 2009; U.S.: Surveillance, Epidemiology, and End Results Program, National Cancer Institute, 2009.
Figure 14.2. Five-Year Average Age-Adjusted Thyroid Cancer Incidence Rates* in Delaware, by Race and Sex: 1980–2006
* = Rates are per 100,000 population and age-adjusted to the 2000 U.S. standard population. SOURCE: Delaware Cancer Registry, Delaware’s Division of Public Health, 2009.

104
Table 14.3. Age-Specific Thyroid Cancer Incidence Rates* in Delaware, by Race and Sex: 2002-06
All Races Caucasian African American Age
Group All Male Female All Male Female All Male Female 0–39 5.5 --- 9.5 6.0 --- 10.6 4.0 --- --- 40–64 17.6 9.0 25.7 19.1 10.5 27.2 13.3 --- 21.6 65–74 24.6 15.3 32.6 25.7 --- 34.8 --- --- --- 75–84 13.1 --- --- 13.7 --- --- --- --- 0.0 85+ --- --- --- --- --- --- --- 0.0 ---
* = Rates are per 100,000 population. --- = Rate based on fewer than 20 cases. SOURCE: Delaware Cancer Registry, Delaware’s Division of Public Health, 2009.
Figure 14.3. Age-Specific Thyroid Cancer Incidence Rates in Delaware, by Race: 2002-06
NOTE: Figure is not displayed because of patient confidentiality rules; the small number of cases precludes the display of data.
Thyroid Cancer by Stage at Diagnosis
Table 14.4. Number of Thyroid Cancer Cases in Delaware, by Stage at Diagnosis and Race: 2002-06
All Races Caucasian African American Stage at Diagnosis All Male Female All Male Female All Male Female
Local 363 76 287 307 67 240 52 9 43 Regional 87 31 56 73 28 45 11 3 8 Distant 13 4 9 10 3 7 1 1 0 Unknown 3 0 3 2 0 2 1 0 1 Total 466 111 355 392 98 294 65 13 52
SOURCE: Delaware Cancer Registry, Delaware’s Division of Public Health, 2009. Table 14.5. Percentage of Thyroid Cancer Cases in Delaware, by Stage at Diagnosis,
Race and Sex: 2002-06 All Races Caucasian African American Stage at
Diagnosis All Male Female All Male Female All Male Female Local 77.9 68.5 80.9 78.3 68.4 81.6 80.0 69.2 82.7 Regional 18.7 27.9 15.8 18.6 28.6 15.3 16.9 23.1 15.4 Distant 2.8 3.6 2.5 2.6 3.1 2.4 1.5 7.7 0.0 Unknown 0.6 0.0 0.9 0.5 0.0 0.7 1.5 0.0 1.9 Total 100.0 100.0 100.0 100.0 100.0 100.0 100.0 100.0 100.0
SOURCE: Delaware Cancer Registry, Delaware’s Division of Public Health, 2009.

105
Figure 14.4. Percentage of Thyroid Cancer Cases in Delaware and the U.S., by Stage at Diagnosis: 2002-06
Figure 14.4a. Delaware: 2002-06
Figure 14.4b. U.S.: 2002-06
SOURCES: Delaware: Delaware Cancer Registry, Delaware’s Division of Public Health, 2009; U.S.: Surveillance, Epidemiology, and End Results Program, National Cancer Institute, 2009.
Thyroid Cancer Mortality NOTE: Due to the infrequency of thyroid cancer deaths among Delawareans and patient confidentiality rules, thyroid cancer mortality rates are not published.

106
15. Urinary Bladder Cancer
Risk Factors and Early Detection Risk Factors for Urinary Bladder Cancer
Tobacco use: smokers are more than twice as likely than nonsmokers to develop bladder cancer
Increasing age: the majority of bladder cancer cases are diagnosed among those ages 65 and older
Race: Caucasians have the highest bladder cancer incidence while Asians have the lowest bladder cancer incidence
Sex: bladder cancer incidence among men is four times greater than among women
Personal history of bladder cancer
Family history of bladder cancer
Chemotherapy drugs ifosfamide or cyclophosphamide (Ifex, Cytoxan)
Radiation therapy to the pelvic region
Low fluid consumption
Bladder birth defects
Urinary schistosomiasis (Schistosoma haematobium) that affects the urinary tract; while this parasitic infection is rare in the U.S., it is common in many developing countries
Chronic ingestion of arsenic in drinking water Possible Risk Factors for Urinary Bladder Cancer
History of chronic bladder inflammation (e.g., history of urinary infections, kidney or bladder stones)
Working in industries with high exposure to aromatic amines; industries with the highest risks include dye, rubber, leather, textiles and paint manufacturing as well as printing companies and truck drivers.
Early Detection of Urinary Bladder Cancer
Routine screening for bladder cancer is not recommended by any professional organization. However, doctors may perform routine screenings for individuals at very high risk for bladder cancer. Reasons for regular bladder cancer screenings may include having a personal history of bladder cancer, certain birth defects of the bladder, or working in certain high-risk professions. The best advice is to know your risk factors and discuss any concerns or symptoms with your doctor.
Bladder cancer screening tests include the following:
Checking for the presence of blood in the urine (i.e., hematuria). Hematuria may be an early bladder cancer symptom.
Examining urine for the presence of cancer cells (i.e., urine cytology). While urine cytology may detect some bladder cancer cases, it is generally not considered reliable enough to be used as a general screening tool.
Various imaging methods (e.g., cystoscopy, MRI, CT-scan, and radiographs) may detect bladder tumors; however, these techniques are more commonly used as diagnostic procedures as opposed to screening methods.
Newer screening methods (e.g., nuclear matrix protein 22 (NMP22) and telomerase testing) are currently under development to explore their utility as widespread bladder cancer screening tools.

107
Data Highlights New Urinary Bladder Cancer Cases and Deaths (Tables 15.1 and 15.6)
In 2002-06, 1,104 urinary bladder cancer cases were diagnosed in Delaware. Bladder cancer was the state’s 5th most frequently diagnosed cancer type during this time, accounting for 4.9 percent of all new cancer cases.
Of the 1,104 bladder cancer cases diagnosed from 2002-06, 822 cases (74.5 percent) were diagnosed among males. The remaining 282 cases (25.5 percent) were diagnosed among females.
During 2002-06, 256 Delawareans died from urinary bladder cancer. Bladder cancer was the state’s 8th most common cause of cancer mortality, accounting for 2.9 percent of all cancer deaths.
Of the state’s 256 bladder cancer decedents, 181 (70.7 percent) were male and 75 (29.3 percent) were female.
Bladder Cancer Incidence and Mortality Rates (Tables 15.2 and 15.7)
Delaware’s 2002-06 urinary bladder cancer incidence rate (24.5 per 100,000) was significantly elevated compared to the U.S. rate (21.0 per 100,000).
Regardless of race, the 2002-06 male bladder cancer incidence rates were significantly higher than female rates at the national, state, and county levels.
Regardless of sex, the 2002-06 bladder cancer incidence rates for African Americans were significantly lower than for their Caucasian counterparts at the national and state levels.
Delaware’s 2002-06 urinary bladder cancer mortality rate (5.8 per 100,000) was significantly higher than the U.S. rate (4.3 per 100,000).
Regardless of race, the 2002-06 bladder cancer mortality rates among males were significantly higher than among females at both the state and national levels.
At the national level, the 2002-06 bladder cancer mortality rate for African American males was significantly lower than for Caucasian males. However, in Delaware, no significant difference in bladder cancer mortality rates was observed between African American and Caucasian males.
At the national level, the 2002-06 bladder cancer mortality rate for African American females was significantly higher than for Caucasian females. However, in Delaware, no significant difference in bladder cancer mortality rates was observed between African American and Caucasian females.
Trends in Urinary Bladder Cancer Incidence and Mortality Rates (Figures 15.1–15.2 and 15.6–15.7)
From 1992-96 to 2002-06, Delaware’s urinary bladder cancer incidence rate increased 8.9 percent while the U.S. rate increased 1.0 percent.
During this period, Delaware’s bladder cancer incidence rate increased by 9.6 percent among males but decreased by 3.5 percent among females.
From 1992-96 to 2002-06, Delaware’s bladder cancer incidence rate for Caucasians increased 10.5 percent while the rate for African Americans increased only 0.7 percent.
Historically, Delaware’s bladder mortality rate has been higher than that of the U.S. While rates have trended downward in all areas, the decline has occurred slightly faster at the national level.
From 1992-96 to 2002-06, Delaware’s bladder cancer mortality rate decreased 1.7 percent while the U.S. rate fell 2.3 percent.
Between 1992-96 and 2002-06, the bladder cancer mortality rates among Delaware Caucasian males and females decreased by 8.1 percent and 12.1 percent, respectively.
During the same period, the bladder cancer mortality rate decreased 26.5 percent for African American females in Delaware, but increased 13.2 percent for African American males in the state.

108
Age-Specific Incidence and Mortality Rates (Tables 15.3 and 15.8)
In Delaware and the U.S., the 2002-06 overall incidence of bladder cancer among males increased with age, from birth through ages 75-84. Bladder cancer incidence rates then decreased somewhat among males ages 85 and older.
Among females, the highest bladder cancer incidence rates occurred in the 85 and older age group.
For 2002-06, Delaware’s bladder cancer mortality rate increased with age, with those ages 85 and older having the highest rate. At the U.S. level, however, the highest bladder cancer mortality occurred in those ages 74-85.
Stage at Diagnosis of Urinary Bladder Cancer (Tables 15.4–15.5, Figure 15.4)
For 2002-06, 54.4 percent, 32.1 percent, 6.5 percent and 3.6 percent of bladder cancer cases were diagnosed at the in situ, local, regional and distant stages, respectively. In the U.S., comparable percentages were 50.0 percent, 36.0 percent and 8.0 percent and 4.0 percent, respectively.
No substantial differences in staging of bladder cancer at time of diagnosis were detected during 2002-06 between sexes or races in Delaware.
Urinary Bladder Cancer Incidence Table 15.1. Number of Urinary Bladder Cancer Cases in Delaware and Counties, by
Race and Sex: 2002-06
All Races Caucasian African American
All Male Female All Male Female All Male Female Delaware 1,104 822 282 1,009 751 258 81 61 20 Kent 183 135 48 165 120 45 16 --- --- New Castle 576 418 158 527 383 144 43 30 13 Sussex 345 269 76 317 248 69 22 --- ---
--- = Cell counts are suppressed for patient confidentiality. SOURCE: Delaware Cancer Registry, Delaware’s Division of Public Health, 2009.

109
Table 15.2. Five-Year Average Age-Adjusted Urinary Bladder Cancer Incidence Rates* in the United States, Delaware and Counties, by Race and Sex: 2002-06
SEX
RACE AND REGION All Male Female
ALL RACES
United States 21.0 (20.9, 21.1) 37.1 (36.8, 37.4) 9.3 (9.2, 9.4)
Delaware 24.5 (23.1, 26.0) 42.3 (39.4, 45.2) 11.0 (9.7, 12.3)
Kent 27.0 (23.1, 30.9) 46.7 (38.8, 54.6) 12.6 (8.9, 17.2)
New Castle 23.2 (21.3, 25.1) 39.4 (35.6, 43.2) 10.7 (9.0, 12.4)
Sussex 26.8 (24.0, 29.6) 45.9 (40.4, 51.4) 11.0 (8.7, 13.7)
CAUCASIAN
United States 22.8 (22.6, 23.0) 40.3 (40.0, 40.6) 9.9 (9.8, 10.0)
Delaware 26.2 (24.6, 27.9) 44.9 (41.6, 48.1) 11.9 (10.5, 13.4)
Kent 29.9 (25.3, 34.5) 51.1 (41.9, 60.2) 14.6 (10.7, 19.6)
New Castle 25.0 (22.8, 27.1) 42.9 (38.6, 47.1) 11.7 (9.8, 13.7)
Sussex 26.9 (23.9, 29.8) 46.1 (40.4, 51.8) 10.8 (8.4, 13.6)
AFRICAN AMERICAN
United States 12.8 (12.4, 13.2) 20.0 (19.2, 20.8) 7.9 (7.5, 8.3)
Delaware 14.1 (11.2, 17.6) 25.3 (19.4, 32.5) 6.0 (3.7, 9.3)
Kent --- --- ---
New Castle 11.6 (8.4, 15.7) 19.3 (13.0, 27.6) ---
Sussex 22.4 (14.1, 34.0) --- --- * = Rates are per 100,000 population and age-adjusted to the 2000 U.S. standard population. --- = Rate based on fewer than 20 cases. SOURCES: Delaware: Delaware Cancer Registry, Delaware’s Division of Public Health, 2009; U.S.: Surveillance, Epidemiology, and End Results Program, National Cancer Institute, 2009.

110
Figure 15.1. Five-Year Average Age-Adjusted Urinary Bladder Cancer Incidence Rates* in the United States and Delaware, by Sex: 1980–2006
* = Rates are per 100,000 population and are age-adjusted to the 2000 U.S. standard population. SOURCES: Delaware: Delaware Cancer Registry, Delaware’s Division of Public Health 2009; U.S.: Surveillance, Epidemiology, and End Results Program, National Cancer Institute, 2009.
Figure 15.2. Five-Year Average Age-Adjusted Urinary Bladder Cancer Incidence Rates* in Delaware, by Race and Sex: 1980–2006
* = Rates are per 100,000 population and are age-adjusted to the 2000 U.S. standard population. SOURCE: Delaware Cancer Registry, Delaware’s Division of Public Health, 2009.

111
Table 15.3. Age-Specific Urinary Bladder Cancer Incidence Rates* in Delaware, by Race and Sex: 2002-06
All Races Caucasian African American Age
Group All Male Female All Male Female All Male Female 0–39 --- --- --- --- --- --- --- --- --- 40–64 22.0 34.8 10.1 25.2 39.1 11.9 10.5 17.7 --- 65–74 114.3 196.8 43.3 121.3 206.1 47.4 68.2 131.6 --- 75–84 178.9 321.7 79.7 185.9 333.3 81.8 117.0 --- --- 85+ 155.2 291.3 97.5 168.2 320.3 103.0 --- --- ---
* = Rates are per 100,000 population. --- = Rate based on fewer than 20 cases. SOURCE: Delaware Cancer Registry, Delaware’s Division of Public Health, 2009.
Figure 15.3. Age-Specific Urinary Bladder Cancer Incidence Rates in Delaware, by Race: 2002–2006
NOTE: Figure is not displayed because of patient confidentiality rules; the small number of cases precludes the display of data.
Urinary Bladder Cancer by Stage at Diagnosis
Table 15.4. Number of Urinary Bladder Cancer Cases in Delaware, by Stage at Diagnosis and Race: 2002-06
All Races Caucasian African American Stage at Diagnosis All Male Female All Male Female All Male Female
In situ 600 444 156 556 413 143 39 28 11 Local 354 280 74 324 257 67 28 22 6 Regional 72 50 22 65 44 21 5 4 1 Distant 40 24 16 38 22 16 2 2 0 Unknown 38 24 14 26 15 11 7 5 2 Total 1,104 822 282 1,009 751 258 81 61 20
SOURCE: Delaware Cancer Registry, Delaware’s Division of Public Health, 2009. Table 15.5. Percentage of Urinary Bladder Cancer Cases in Delaware, by Stage at
Diagnosis, Race and Sex: 2002-06 All Races Caucasian African American Stage at
Diagnosis All Male Female All Male Female All Male Female In situ 54.4 54.0 55.3 55.1 55.0 55.4 48.2 45.9 55.0 Local 32.1 34.1 26.2 32.1 34.2 26.0 34.6 36.1 30.0 Regional 6.5 6.1 7.8 6.4 5.9 8.1 6.2 6.6 5.0 Distant 3.6 2.9 5.7 3.8 2.9 6.2 2.5 3.3 0.0 Unknown 3.4 2.9 5.0 2.6 2.0 4.3 8.6 8.2 10.0 Total 100.0 100.0 100.0 100.0 100.0 100.0 100.0 100.0 100.0
SOURCE: Delaware Cancer Registry, Delaware’s Division of Public Health, 2009.

112
Figure 15.4. Percentage of Urinary Bladder Cancer Cases in Delaware and the U.S., by Stage at Diagnosis: 2002-06
Figure 15.4a. Delaware: 2002-06
Figure 15.4b. U.S.: 2002-06
SOURCES: Delaware: Delaware Cancer Registry, Delaware’s Division of Public Health, 2009; U.S.: Surveillance, Epidemiology, and End Results Program, National Cancer Institute, 2009.
Urinary Bladder Cancer Mortality Table 15.6. Number of Urinary Bladder Cancer Deaths in Delaware and Counties, by
Race and Sex: 2002-06
All Races Caucasian African American
All Male Female All Male Female All Male Female Delaware 256 181 75 229 162 67 26 18 8
Kent 36 25 11 31 22 9 --- --- ---
New Castle 147 101 46 131 89 42 15 --- ---
Sussex 73 55 18 67 51 16 --- --- --- --- = Cell counts are suppressed for patient confidentiality. SOURCE: Delaware Health Statistics Center, 2009.

113
Table 15.7. Five-Year Average Age-Adjusted Urinary Bladder Cancer Mortality Rates* in
the United States, Delaware and Counties, by Race and Sex: 2002-06
SEX RACE AND REGION
All Male Female ALL RACES
United States 4.3 (4.3, 4.4) 7.5 (7.5, 7.6) 2.2 (2.2, 2.3)
Delaware 5.8 (5.1, 6.5) 10.0 (8.5, 11.4) 2.8 (2.2, 3.5)
Kent 5.6 (3.9, 7.7) 9.6 (6.2, 14.2) ---
New Castle 6.0 (5.0, 7.0) 10.3 (8.3, 12.3) 3.0 (2.2, 3.9)
Sussex 5.8 (4.5, 7.3) 9.8 (7.4, 12.7) ---
CAUCASIAN
United States 4.5 (4.5, 4.5) 7.9 (7.8, 8.0) 2.2 (2.2, 2.3)
Delaware 5.9 (5.2, 6.7) 10.2 (8.6, 11.8) 2.9 (2.2, 3.7)
Kent 5.8 (3.9, 8.2) 10.0 (6.3, 15.2) ---
New Castle 6.1 (5.1, 7.2) 10.6 (8.5, 13.0) 3.1 (2.3, 4.2)
Sussex 5.7 (4.5, 7.3) 9.8 (7.3, 12.9) ---
AFRICAN AMERICAN
United States 3.7 (3.6, 3.9) 5.5 (5.2, 5.7) 2.8 (2.6, 2.9)
Delaware 4.9 (3.2, 7.2) --- ---
Kent --- --- ---
New Castle --- --- ---
Sussex --- --- --- * = Rates are per 100,000 population and age-adjusted to the 2000 U.S. standard population. --- = Rate based on fewer than 20 deaths. SOURCES: Delaware: Delaware Health Statistics Center, 2009; U.S.: National Center for Health Statistics, 2009.

114
Figure 15.5. Five-Year Average Age-Adjusted Urinary Bladder Cancer Mortality Rates* in the United States and Delaware, by Sex: 1980–2006
* = Rates are per 100,000 population and age-adjusted to the 2000 U.S. standard population. SOURCES: Delaware: Delaware Health Statistics Center, 2009; U.S.: National Center for Health Statistics, 2009.
Figure 15.6. Five-Year Average Age-Adjusted Urinary Bladder Cancer Mortality Rates* in
Delaware, by Race: 1980–2006
* = Rates are per 100,000 population and age-adjusted to the 2000 U.S. standard population. SOURCE: Delaware Health Statistics Center, 2009.

115
Table 15.8. Age-Specific Urinary Bladder Cancer Mortality Rates* in Delaware, by Race and Sex: 2002-06
All Races Caucasian African American Age
Group All Male Female All Male Female All Male Female 0–39 --- --- --- --- --- --- --- --- --- 40–64 2.7 4.3 --- 2.7 4.2 --- --- --- --- 65–74 21.2 37.9 --- 23.3 42.4 --- --- --- --- 75-84 51.1 90.0 24.0 52.5 89.5 26.3 --- --- --- 85+ 82.2 138.0 58.5 82.4 143.0 56.4 --- --- ---
* = Rates are per 100,000 population. --- = Rate based on fewer than 20 deaths. SOURCE: Delaware Health Statistics Center, 2009.
Figure 15.7. Age-Specific Urinary Bladder Cancer Mortality Rates in Delaware, by Race: 2002–06
NOTE: Figure is not displayed because of patient confidentiality rules; the small number of cases precludes the display of data.

116
16. Uterine Cancer
Risk Factors and Early Detection Risk Factors for Uterine Cancer
Increasing age
Obesity
Diet high in animal fat
Personal history of any of the following: diabetes, breast or ovarian cancer, granulosa-theca cell ovarian tumors, polycystic ovarian syndrome (PCOS), atypical endometrial hyperplasia
Family history of endometrial and colorectal cancers (Lynch syndrome, or HNPCC)
High levels of estrogen, via natural occurrence or hormone therapy
Having a higher number of menstrual cycles throughout a woman’s life
Never having children, especially if due to infertility issues
Treatment with the drug tamoxifen
Possible Risk Factors for Uterine Cancer
Prior radiation therapy to the pelvic region Protective Factors against Uterine Cancer
Multiple pregnancies
Use of oral contraceptives
Use of an intrauterine device that does not contain hormones
Use of combination hormone therapy (addition of progesterone)
Women who have had a complete hysterectomy will not develop uterine cancer Early Detection of Uterine Cancer
There is currently no recommended screening test for uterine cancer. The best method of early detection is for individuals to know their risks and report any symptoms to their doctors.
Data Highlights New Uterine Cancer Cases and Deaths (Tables 16.1 and 16.6)
During 2002-06, 693 women in Delaware were diagnosed with uterine cancer. Uterine cancer was the 4th most frequently diagnosed cancer among females over this time, accounting for 6.5 percent of all cancer diagnosed among women in the state.
During 2002-06, 120 Delaware females died from uterine cancer. Uterine cancer was the 8th leading cause of cancer deaths among women over this time, accounting for 2.9 percent of all cancer deaths among females in the state.

117
Uterine Cancer Incidence and Mortality Rates (Tables 16.2 and 16.7)
Delaware’s 2002-06 uterine cancer incidence rate (28.2 per 100,000) was significantly higher than the U.S. rate (23.3 per 100,000).
Delaware’s 2002-06 uterine cancer incidence rates did not differ significantly between African American and Caucasian women. At the U.S. level, however, the incidence rate for African American women was significantly lower than that for Caucasian women.
Delaware’s 2002-06 uterine cancer mortality rate (4.7 per 100,000) did not differ significantly from the U.S. rate (4.1 per 100,000).
At both the state and national levels, uterine cancer mortality rates among African American females were significantly greater than among Caucasian females.
Trends in Uterine Cancer Incidence and Mortality (Figures 16.1-16.2 and 16.6-16.7)
Historically, Delaware’s uterine cancer incidence rates have been similar to those of the U.S. However, from 1992-96 to 2002-06, Delaware’s uterine cancer incidence rate increased 20.0 percent while the U.S. rate increased 8.4 percent. As a result, Delaware’s 2002-06 uterine cancer incidence rate was significantly higher than the U.S. rate.
Delaware’s uterine cancer incidence rate for African American females increased 62.8 percent from 1992-96 to 2002-06. In contrast, Delaware’s uterine cancer incidence rate for Caucasian females increased 17.6 percent over the same time.
Historically, uterine cancer mortality rates have been comparable for Delaware and the U.S. From 1992-96 to 2002-06, Delaware’s uterine cancer mortality rate decreased 2.1 percent while the U.S. rate decreased 2.4 percent.
In Delaware, the uterine cancer mortality rate for African American women increased by 5.5 percent from 1992-96 to 2002-06. Conversely, the comparable rate for Delawarean Caucasian women fell by 2.4 percent.
Age-Specific Incidence and Mortality Rates (Tables 16.3 and 16.8)
The 2002-06 age-specific incidence rate for uterine cancer was highest among Delaware females age 65-84.
Among Delawarean Caucasian women, uterine cancer incidence rates peaked in the 65-74 year age group then declined somewhat in the 75 and older age groups. Among African American women in Delaware, the greatest incidence occurred in the 75-84 age group.
The 2002-06 age-specific uterine cancer mortality rate increased with age, peaking among Delaware females age 75 and older. State data were too sparse for meaningful analyses by race.
Stage at Diagnosis of Uterine Cancer (Tables 16.4–16.5, Figures 16.4–16.5)
In Delaware, from 2002-06, 69.1 percent, 18.2 percent and 8.7 percent of uterine cancers were diagnosed at the local, regional and distant stages, respectively. At the national level, comparable percentages were 69.0 percent, 19.0 percent and 8.0 percent, respectively.
In Delaware, from 2002-06, 186 uterine cancer cases (26.8 percent) were diagnosed in the late stages (i.e., regional or distant stage).
Delawarean African American females were less likely than their Caucasian counterparts to have their cancer diagnosed at the local stage (59.4 percent v. 71.2 percent, respectively).

118
Uterine Cancer Incidence
Table 16.1. Number of Uterine Cancer Cases in Delaware and Counties, by Race: 2002-06
All Female
Caucasian Female
African American Female
Delaware 693 579 101
Kent 118 95 20
New Castle 391 326 59
Sussex 184 158 22
SOURCE: Delaware Cancer Registry, Delaware’s Division of Public Health, 2009. Table 16.2. Five-Year Average Age-Adjusted Uterine Cancer Incidence Rates* in the
U.S., Delaware and Counties, by Race: 2002-06 All
Female Caucasian
Female African American
Female United States 23.3 (23.1, 23.5) 24.2 (24.0, 24.4) 20.3 (19.6, 21.0)
Delaware 28.2 (26.1, 30.3) 28.7 (26.4, 31.0) 28.0 (22.6, 33.5)
Kent 31.0 (25.4, 36.5) 31.5 (25.5, 38.5) 30.3 (18.5, 46.8)
New Castle 27.5 (24.8, 30.2) 28.8 (25.7, 31.9) 24.9 (19.0, 32.1)
Sussex 28.9 (24.7, 33.1) 28.0 (23.6, 32.3) 37.5 (23.5, 56.8)
* = Rates are per 100,000 population and age-adjusted to the 2000 U.S. standard population. --- = Rate based on fewer than 20 cases. SOURCES: Delaware: Delaware Cancer Registry, Delaware’s Division of Public Health, 2009; U.S.: Surveillance, Epidemiology, and End Results Program, National Cancer Institute, 2009.

119
Figure 16.1. Five-Year Average Age-Adjusted Uterine Cancer Incidence Rates* in the U.S. and Delaware: 1980–2006
* = Rates are per 100,000 population and age-adjusted to the 2000 U.S. standard population. SOURCES: Delaware: Delaware Cancer Registry, Delaware’s Division of Public Health, 2009; U.S.: Surveillance, Epidemiology, and End Results Program, National Cancer Institute, 2009.
Figure 16.2. Five-Year Average Age-Adjusted Uterine Cancer Incidence Rates* in
Delaware, by Race: 1980–2006
* = Rates are per 100,000 population and age-adjusted to the 2000 U.S. standard population. SOURCE: Delaware Cancer Registry, Delaware’s Division of Public Health, 2009.

120
Table 16.3. Age-Specific Uterine Cancer Incidence Rates* in Delaware, by Race: 2002-06
Age Group
All Female
Caucasian Female
African American Female
0–39 1.9 --- --- 40–64 51.5 55.7 36.4 65-74 103.4 102.8 112.0 75+ 89.7 85.0 117.4
* = Rates are per 100,000 population. --- = Rate based on fewer than 20 cases. SOURCE: Delaware Cancer Registry, Delaware’s Division of Public Health, 2009.
Figure 16.3. Age-Specific Uterine Cancer Incidence Rates in Delaware, by Race: 2002-06
NOTE: Rates for either race age 0-39 are not displayed due to patient confidentiality rules. SOURCE: Delaware Health Statistics Center, 2009.
Uterine Cancer by Stage at Diagnosis
Table 16.4. Number of Uterine Cancer Cases in Delaware, by Stage at Diagnosis and Race: 2002-06
Stage at Diagnosis
All Female
Caucasian Female
African American Female
Local 479 412 60 Regional 126 110 16 Distant 60 42 18 Unknown 28 15 7 Total 693 579 101
SOURCE: Delaware Cancer Registry, Delaware’s Division of Public Health, 2009.

121
Table 16.5. Percentage of Uterine Cancer Cases in Delaware, by Stage at Diagnosis and Race: 2002-06
Stage at Diagnosis
All Female
Caucasian Female
African American Female
Local 69.1 71.2 59.4
Regional 18.2 19.0 15.8
Distant 8.7 7.3 17.8 Unknown 4.0 2.6 6.9 Total 100.0 100.0 100.0
SOURCE: Delaware Cancer Registry, Delaware’s Division of Public Health, 2009.
Figure 16.4. Percentage of Uterine Cancer Cases in Delaware and the U.S., by Stage at Diagnosis: 2002-06
Figure 16.4a. Delaware: 2002-06
Figure 16.4b. U.S.: 2002-06
SOURCES: Delaware: Delaware Cancer Registry, Delaware’s Division of Public Health, 2009; U.S.: Surveillance, Epidemiology, and End Results Program, National Cancer Institute, 2009.
Uterine Cancer Mortality Table 16.6. Number of Uterine Cancer Deaths in Delaware and Counties, by Race:
2002-06 All
Female Caucasian
Female African American
Female Delaware 120 87 32
Kent 12 7 ---
New Castle 71 52 19
Sussex 37 28 ---
--- = Cell counts are suppressed for patient confidentiality. SOURCE: Delaware Health Statistics Center, 2009.

122
Table 16.7. Five-Year Average Age-Adjusted Uterine Cancer Mortality Rates* in the U.S., Delaware and Counties, by Race: 2002-06
All Female
Caucasian Female
African American Female
United States 4.1 (4.1, 4.2) 3.9 (3.8, 3.9) 7.2 (7.0, 7.4)
Delaware 4.7 (3.9, 5.6) 4.0 (3.2, 4.9) 9.6 (6.6, 13.6)
Kent --- --- ---
New Castle 4.9 (3.8, 6.2) 4.3 (3.2, 5.6) ---
Sussex 5.3 (3.7, 7.3) 4.5 (3.0, 6.5) ---
* = Rates are per 100,000 population and age-adjusted to the 2000 U.S. standard population. --- = Rate based on fewer than 20 deaths. SOURCES: Delaware: Delaware Health Statistics Center, 2009; U.S.: National Center for Health Statistics, 2009.
Figure 16.5. Five-Year Average Age-Adjusted Uterine Cancer Mortality Rates* in the U.S.
and Delaware: 1980–2006
* = Rates are per 100,000 population and age-adjusted to the 2000 U.S. standard population. SOURCES: Delaware: Delaware Health Statistics Center, 2009; U.S.: National Center for Health Statistics, 2009.

123
Figure 16.6. Five-Year Average Age-Adjusted Uterine Cancer Mortality Rates* in Delaware, by Race: 1980–2006
* = Rates are per 100,000 population and age-adjusted to the 2000 U.S. standard population. SOURCE: Delaware Health Statistics Center, 2009.
Table 16.8. Age-Specific Uterine Cancer Mortality Rates* in Delaware, by Race:
2002-06 Age
Group All
Female Caucasian
Female African American
Female
0–39 --- --- ---
40–64 4.9 4.4 ---
65–74 21.9 14.8 --- 75+ 31.3 30.0 ---
* = Rates are per 100,000 population. --- = Rate based on fewer than 20 deaths. SOURCE: Delaware Health Statistics Center, 2009.
Figure 16.7. Age-Specific Uterine Cancer Mortality Rates in Delaware, by Race:
2002-06 NOTE: Figure is not displayed because of patient confidentiality rules; the small number of cases precludes the display of data.

124
17. Cancer Incidence by Census Tract
Background As required by Title 16, Chapter 292 of the Delaware Code (Appendix F), the Delaware Division of Public Health (DPH) publishes cancer rates by census tract annually. Specifically:
“The agency [DPH] shall create a detailed map of each county in Delaware that graphically illustrates the overall incidence of cancer in each census tract. The census tracts will be identified on the maps and shall be color-coded to designate the degree of cancer incidence in each track. These maps shall be created within 90 days of the agency receiving the cancer incidence data. The agency shall post the maps created … on their website in a format that can be easily accessed and read by the public.”
Methods Complete methods are found in Appendix G. Highlights are described below. Cancer Cases • 97.4% of 22,760 cancer cases were successfully geocoded to a census tract based on
residence at the time of diagnosis. • 599 cases were eliminated from the census tract-level analysis because they could not
accurately be assigned to the census tract in which they were diagnosed. • This final analysis is of 22,161 cases diagnosed between 2002 and 2006. Census Tracts • Delaware is divided into 197 census tracts, of which 196 are populated. • The least populated census tract (10.00) had an average annual number of 626 residents
between 2002 and 2006. The most populous census tract (148.06) had 13,027 residents. The average number of residents per census tract for 2002-2006 was 4,224.
Rate calculations • Census tract populations were calculated using estimates from the Delaware Population
Consortium (DPC) and the 2000 Census. • DPH staff used 2000 Census data to calculate the proportion that each 5-year age group
contributed to the overall census tract population. This was necessary to age-adjust the rates. • All rates are presented as five-year annual age-adjusted rates per 100,000. Since some
census tracts will have an older population than others, and because the risk of cancer increases with age, age-adjustment allows comparison of the rates in census tracts without the influence of age.
• Confidence intervals were calculated for each rate. See Appendix H (“How to Interpret Cancer Rates by Census Tract”) for more information about confidence intervals.
Results
Appendix I lists the cancer incidence rates by census tract along with their confidence intervals. Census tracts having rates that are significantly higher or lower than the state average are noted in yellow and blue shading, respectively. For 2002-06:

125
• 45 of the census tracts have statistically significant higher cancer incidence rates compared with the state’s average rate of 507.0 per 100,000;
• 22 of the census tracts have significantly lower cancer incidence rates compared to the state’s average rate;
• 129 of the census tracts were not significantly different from the state’s average rate. Maps showing the cancer incidence rates by census tract grouped by quintile, and whether the rates are statistically significantly higher or lower than the state average rate, are provided in Appendixes J and K, respectively. The table below provides more information about the census tracts that had significantly higher cancer incidence rates than the state average. Table 17.1. Cancer Types that were Statistically Significantly Higher than the State Average, in the 45 Elevated Census Tracts (CTs), Delaware 2002-2006
Cancer Type
Number of Census Tracts
in Which Statistically
Elevated
Average Number of Cases in
these CTs Major Known Risk Factors
Prostate 16 31 Family history, African American race, diet, obesity Lung 11 30 Tobacco, radon, asbestos, workplace exposures
Colorectal 9 18 History of bowel disease, family history, diet, smoking, alcohol, diabetes
Breast 8 26 Genetics, family history, early menarche, recent use of birth control pills, hormone therapy
Other 6 13
Ovarian 5 6 Obesity, tubal ligation (protective factor), fertility drugs, hormone therapy
Oral 4 7 Tobacco, alcohol, UV light, HPV, nutrition NHL* 3 8 Radiation, weakened immune system, certain infections
Bladder 2 11 Smoking, workplace exposures Esophagus 3 5 Tobacco, alcohol, overweight, diet, dry cleaning chemicals
Larynx 4 4 Tobacco, alcohol, diet, HPV, genetics, workplace exposure
Leukemia 3 6 Genetics, diet, alcohol, tobacco, sun, radiation, chemical exposure
Pancreas 2 6 Tobacco, obesity, diabetes, hepatitis, alcohol, workplace exposures, family history
Melanoma 4 14 UV light, moles, fair skin, family history
Kidney 1 8 Smoking, overweight, workplace exposures, family history, hypertension, medications
Myeloma 3 5 Family history, overweight, radiation, workplace exposuresThyroid 2 7 Lack of iodine, radiation, genetic conditions Brain 1 5 Radiation therapy, certain genetic conditions
Stomach 1 4 Certain infections, diet, tobacco, obesity, family history
Liver 1 4 Hepatitis, alcohol, genetics, workplace exposures, steroids, arsenic in drinking water
Uterine 1 8 Radiation, diabetes, diet, obesity, estrogen therapy * non-Hodgkin Lymphoma

126
REFERENCES
Anderson, R. N. & Rosenberg, H. M. (1998). Age Standardization of Death Rates: Implementation of the Year 2000 Standard. (Rep. No. 47(3)). Hyattsville, Maryland: National Center for Health Statistics.
Coughlin, S. S., Clutter, G. G., & Hutton, M. (1999). Ethics in Cancer Registries. Journal of Cancer Registry Management, 26, 5-10.
Goodman, M. T. & Wilkens, L. R. (1994). Calculation and assessment of incidence rates. In H.R. Menck & C. R. Smart (Eds.), Central Cancer Registries: Design, Management, and Use. (pp. 193-229). Langhorne, PA: Gordon and Breasch.
Klein, R. J. & Schoenborn, C. A. (2001). Age-adjustment using the 2000 projected U.S. population (Rep. No. 20). Hyattsville, Maryland: National Center for Health Statistics.
McLaughlin, C. C. (2002). Confidentiality protection in publicly released central registry data. Journal of Cancer Registry Management, 29, 84-88.

127
APPENDIX A
HISPANIC CANCER RATES Hispanic cancer rates were not calculated for this report because several methodological issues prevent Hispanic rates from being fairly compared with cancer rates for Caucasians and African Americans. Cancer rates are calculated by dividing the number of cancer cases (numerator) by a population (denominator); therefore, cancer rates are heavily influenced by changes or uncertainties in the number of cancer cases and the size of the population. Specific issues that suggest that Hispanic cancer rates would be subject to misinterpretation are presented below: • Uncertain estimate of Delaware’s Hispanic population—estimates of Delaware’s
population are derived from a census performed every 10 years by the U.S. Census Bureau. The Delaware Population Consortium (DPC) uses Census data to estimate the Delaware population between Census years. In 1997, the DPC began releasing studies on special topics of interest, including Hispanic population estimates. Because the estimates are calculated from mortality, fertility, labor force and migration statistics, and because these statistics are based on a small population of Hispanics, the DPC urged that the Hispanic population estimates presented in its studies be used with caution (Delaware Population Consortium. Delawareans of Hispanic Origin, 1991–1998. Population Study Series. PS-00-01, April 2000). For these reasons, Hispanic population estimates are not included in the DPC’s annual Delaware population projections. In less-populated areas, such as small states, and especially in subsets of the population (for example, for one sex or one county), even a small inaccuracy can result in substantial errors in Hispanic cancer rates.
• Inaccurate recording of Hispanic ethnicity on death certificates—race and Hispanic
origin are treated as distinct concepts and reported separately on death certificates and to the Delaware Cancer Registry, in accordance with guidelines from the federal Office of Management and Budget. To assess the completeness of the reporting of Hispanic ethnicity, expected numbers of cancer cases and deaths in the Hispanic population were calculated and compared with the actual (observed) reports. Because the Hispanic population is younger than the overall Delaware population, and because cancer rates increase with age, the expected values were age-adjusted to ensure comparability. There were 97 deaths from cancer reported on death certificates between 2002 and 2006, but 283 deaths were expected. Similarly, 423 incident cancer cases were reported to the registry, but 1,054 cases were expected. Although this analysis is a cursory attempt to estimate the degree of underreporting of Hispanic ethnicity, it demonstrates the possibility of significantly inaccurate Hispanic cancer rates.
• Small number of cases or deaths and small population sizes—an incidence or mortality
rate is an estimate, and the reliability of estimates can be measured by calculating a confidence interval. A narrow confidence interval suggests that the rate is a good estimate; a wide confidence interval suggests that the rate should be interpreted with caution. If the confidence intervals of two rates do not overlap, the rates are considered to be statistically different. Both the size of the numerator (the number of cases or deaths) and denominator (the population) determine the width of the confidence interval. Typically, researchers report 95% confidence intervals; when constructed properly, a 95% confidence interval includes the true cancer rate 95% of the time.
To illustrate the impact of these statistical concepts on the calculation of Hispanic cancer rates, five-year average annual age-adjusted cancer rates were compared for three racial/ethnic groups, along with their 95-percent confidence intervals.

128
As shown in the tables below, the small numerators and denominators for the Hispanic population produced wider confidence intervals than those for Caucasian and African American populations.
Table A1. Cancer Cases, Population and Age-Adjusted Cancer Incidence Rates in
Delaware: 2002-06 95% Confidence Interval
Race/Ethnicity Total Cases (2002-06)
Total Population (2002-06)
Age-Adjusted Incidence Rate
per 100,000 Lower Upper
Hispanic 423 250,453 421.6 381.4 461.7 Caucasian 18,838 3,132,579 501.7 494.6 508.9 African American 3,470 862,434 538.3 520.4 556.2
SOURCE: Delaware Cancer Registry, Delaware’s Division of Public Health, 2009.
Table A2. Cancer Deaths, Population and Age-Adjusted Cancer Mortality Rates in Delaware: 2002-06
95% Confidence Interval Race/Ethnicity Total Deaths
(2002-06) Total Population
(2002-06) Age-Adjusted
Mortality Rate per 100,000 Lower Upper
Hispanic 97 250,453 113.3 91.8 138.2 Caucasian 7,283 3,132,579 190.4 186.0 194.8 African American 1,363 862,434 229.0 216.8 241.2
SOURCE: Delaware Health Statistics Center, 2009.

129
APPENDIX B
INCIDENCE AND MORTALITY METHODOLOGY
Appendix B describes the materials, data sources and statistical methods that were used to generate the counts and age-adjusted and age-specific incidence and mortality rates included in this report. DATA SOURCES Incidence Data: Delaware Cancer Registry This report includes incident cancer cases that were diagnosed among Delawareans between January 1, 2002, and December 31, 2006, and reported to the Delaware Cancer Registry (DCR) by November 2009. Incidence trends were based on cancer diagnoses from January 1, 1980 to December 31, 2006, reported to DCR by November 2009. In total, 22,760 cases of malignant cancer were diagnosed among Delawareans from 2002-06. This number includes individuals with cancers diagnosed at more than one site, also known as multiple primaries. The DCR adheres to reporting procedures consistent with those adopted by the American Cancer Society (ACS) and the National Cancer Institute’s (NCI) Surveillance, Epidemiology, and End Results (SEER) Program. Currently, rate calculation procedures exclude all cases of benign brain cancers and in situ cancer, except in situ bladder cancer. In situ bladder cancer cases were included in rate analyses because of the difficulty in distinguishing between the two cancer categories based on the language used by pathologists. The International Classification of Diseases for Oncology, Second Edition (ICD-O-2) was used to describe the topography (primary anatomic site) and morphology (histology) for cancers reported between 1988 and 2000. Cancers diagnosed between 2001 and 2006 were coded using the International Classification of Diseases for Oncology, Third Edition (ICD-O-3). The topography code defines both the site of the tumor and the cancer type. Five-digit morphology codes were used to describe tumor histology and behavior. The first four digits of the morphology codes define the histology of the cancer, and the fifth digit indicates whether the cancer was malignant, benign, in situ or uncertain. Consistent with the publication of the Centers for Disease Control and Prevention’s (CDC) U.S. Cancer Statistics, Kaposi’s sarcoma and mesothelioma were considered separate sites, based on histology codes. SEER Program SEER data were used to compare Delaware’s incidence and mortality rates with U.S. rates. Established in 1971, SEER collects, analyzes and disseminates data for cancer control, diagnosis and treatment. SEER uses several population-based registries that are representative of the different regions in the U.S. to produce cancer incidence statistics. Historically, Delaware’s cancer incidence rates have been compared to SEER 9 U.S. cancer incidence rates. SEER 9 incidence rates are calculated using data from the nine registries that have provided data to SEER since 1974–75. These registries include Atlanta, Connecticut, Detroit, Hawaii, Iowa, New Mexico, San Francisco-Oakland, Seattle-Puget Sound and Utah. In 2009, the Delaware Division of Public Health (DPH) and the Delaware Cancer Consortium elected to begin comparing Delaware’s cancer incidence rates to SEER 17 U.S. cancer incidence rates. SEER 17 rates are calculated using data from all 17 population-based registries that currently submit data to SEER (Atlanta, Connecticut, Detroit, Hawaii, Iowa, New Mexico,

130
San Francisco-Oakland, Los Angeles, San Jose-Monterey, Greater California, Seattle-Puget Sound, Utah, rural Georgia, Alaska, Kentucky, Louisiana, and New Jersey). The primary benefit of using SEER 17 U.S. comparison rates is that these rates are calculated from a more representative subsample of the U.S. population. Additionally, SEER 17 U.S. cancer incidence rates are referenced in an increasing number of cancer surveillance reports. By including SEER 17 U.S. cancer incidence rates in this and all future editions of “Cancer Incidence and Mortality in Delaware”, DPH will publish cancer surveillance statistics that are more consistent with other national-level publications. Therefore, please note that all U.S. cancer incidence rates from 1980-2005 appearing in this report represent SEER 9 incidence rates. U.S. cancer incidence rates for 2002-06 represent SEER 17 incidence rates. Mortality Data:
Delaware Health Statistics Center
Cancer mortality data were provided by the Delaware Health Statistics Center. The data file was compiled from all death certificates filed in Delaware between 1980 and 2006. Five-year average annual age-adjusted mortality rates were based on deaths that occurred between 2002 and 2006. Trends in cancer mortality were presented for deaths that occurred between 1980 and 2006. Underlying cause-of-death codes were based on the International Classification of Diseases, Ninth Edition (ICD-9) for deaths that occurred between 1980 and 1998. The International Classification of Diseases, Tenth Edition (ICD-10) was used to code deaths that occurred between 1999 and 2006. To determine the underlying cause of death, the sequence of events leading to the individual’s death and recorded on the death certificate are run through the Automated Classification of Medical Entities (ACME) software used by the National Center for Health Statistics. This program uses a series of rules and hierarchies of events to select the most appropriate underlying cause of death. National Center for Health Statistics U.S. mortality data were obtained from the National Center for Health Statistics and used to make comparisons between cancer mortality rates at the sate and national levels. U.S. death data were compiled from all death certificates filed in the 50 states and the District of Columbia between 1980 and 2006. Cancer deaths were coded in accordance with World Health Organization regulations, which stipulate that cancer deaths be coded using the most current revision of the International Classification of Diseases. Accordingly, deaths that occurred prior to 1999 were coded using ICD-9. Beginning with 1999, deaths were coded using ICD-10. Population Data:
Standard Population The year 2000 standard U.S. population was used for age-adjustment of incidence and mortality rates. Age-adjustment of incidence and mortality rates enable comparisons among populations that have different age structures (e.g., Delaware vs. the U.S.).
Population Estimates, 2002-06 Cancer incidence and mortality rates for the U.S. are calculated using SEER population estimates and are based on the numbers estimated by the census. Delaware rates were based on population estimates provided by the Delaware Population Consortium. Population data for Delaware are presented in appendix D.

131
RISK FACTORS AND EARLY DETECTION Cancer risk factor and prevention information are included at the beginning of each chapter of this report. The following three web sites were used as primary resources for cancer risk factor and prevention data: (1) The American Cancer Society (www.cancer.org); (2) The National Cancer Institute (www.cancer.gov); and (3) WebMD (www.webmd.com). Behavioral Risk Factor Surveillance System (BRFSS) Behavioral Risk Factor Surveillance System data provide estimates of risk factor prevalence across Delaware and the nation. The most recently available risk factor data from BRFSS are from 2008. Risk factor data are included in appropriate chapters for site-specific cancers; supplemental data on obesity, physical inactivity and diet are presented in appendix E. STATISTICAL METHODOLOGY AND TECHNICAL TERMS
Direct Standardization and Age-Adjusted Incidence and Mortality Rates The age distribution of a population is an important determinant of the burden of cancer. Because cancer incidence and mortality increase with age, crude rates cannot be used for comparisons of cancer statistics between sexes, racial or ethnic groups, or geographic entities across different time spans. To enable comparisons that were independent of the age distribution of the population of Delaware, age-adjusted rates were calculated (Anderson & Rosenberg, 1998; Klein & Schoenborn, 2001; Goodman & Wilkens, 1994). Age-adjusted rates represent the theoretical cancer rate in a population with an age distribution identical to the reference or standard population. Age-adjusted incidence and mortality rates for Delaware were computed using an external reference population with a fixed standard age distribution (i.e., the year 2000 standard U.S. population). This process involved calculating the age-specific incidence or mortality rates for the residents of Delaware and then applying (or multiplying) these rates to the proportion of individuals in the same age group in the reference population. The individual age-specific rates were then summed to obtain the overall age-adjusted rate. The formula for an age-adjusted rate can be presented as follows:
Age-Adjusted Rate = sum (wi x ((ci/ni) x 100,000))
Where ci is the number of new cases or deaths in the i age group, ni is the population estimate for the i age group and wi is the proportion of the standard population in the i age group. All rates were expressed per 100,000 of the population. Age-Specific Incidence and Mortality Rates Age-related differences in the risk of cancer incidence and mortality were assessed using age-specific rates. Age-specific rates were calculated by dividing the number of cancer cases or deaths that occurred during a specific time period among five age groups (0–39, 40–64, 65–74, 75–84, and 85 and older). The total number of cases or deaths for each of the five age groups was then divided by the total population of the age group in Delaware during the same time period. Rates were expressed per 100,000 of the population. Race- and Sex-Specific Incidence and Mortality Rates Race- and sex-specific incidence and mortality rates were calculated to assess how cancer patterns differed across subgroups within the state. These rates were calculated by dividing the number of cases or deaths that occurred in each race and/or sex group by the total population

132
in the corresponding race and/or sex group over the same time period. These rates were adjusted to the U.S. standard population and expressed per 100,000 of the population. Confidence Intervals Age-adjusted incidence and mortality rates are subject to chance variation, particularly when they are based on a small number of cancer cases or deaths occurring over a limited time period or in a limited geographic area. Aggregating several years of data provides more reliable estimates of incidence and mortality in these situations. The level of uncertainty associated with incidence and mortality statistics can be estimated by the standard error used to calculate the 95-percent confidence interval. Confidence intervals were calculated using SEER*Stat, using the method developed by Tiwari, et al. 2006. Stage at Diagnosis The stage at diagnosis describes the extent to which cancers had spread from the site of origin by the time of diagnosis. SEER summary staging was used to define the stage at diagnosis for all incident cancer cases. Cancer cases diagnosed between 1980 and 2000 were coded according to Summary Stage 1977; cases diagnosed between 2001 and 2003 were coded using the codes for Summary Stage 2000. Beginning in 2004, SEER Summary Stage 2000 was derived using the Collaborative Staging Algorithm. Three categories were used to code the stage for any particular cancer site: • Local: tumor is invasive but confined to the organ of origin. • Regional: tumor has extended beyond the limits of the organ of origin, but there is no
evidence of distant metastasis. • Distant: cancer cells have detached from the tumor at the primary site and begun
growing at a new site in the body. OTHER TECHNICAL INFORMATION Suppression of Data For this report, cancer frequencies and rates were suppressed according to the Division of Public Health Policy Memorandum 49 (Data and Data Release Standards). Incidence and mortality frequencies of fewer than six cases were suppressed. Additionally, age-adjusted incidence and mortality rates based on fewer than 25 cases or deaths were suppressed. Suppressing incidence and mortality statistics based on a small number of new cancer cases or deaths helps protect patient privacy and confidentiality (Coughlin et al., 1999; McLaughlin, 2002). Furthermore, cancer rates based on a very small number of cases are inherently unstable and cannot be reliably interpreted. Definition of Race Race-specific statistics in this report were limited to Caucasian and African American cancer counts and rates. Race groupings did not take into account residents’ ethnicity. For incidence and mortality rates, the total population included people of Hispanic ethnicity and those of unknown race.

133
APPENDIX C PRIMARY CANCER SITE DEFINITIONS
Cancer Site ICD-O-3 Site ICD-O-3 Histology
All malignant cancers C000–C809*
Breast C500-C509 Excluding 9590-9989
Cervical C530-C539 Excluding 9590-9989
Colon and rectum C180-C189, C260 Excluding 9590-9989
Hodgkin Lymphoma ** C000-C809 9650-9667
Leukemia
C420-C421, C424 9823, 9827
C000-C809
9826, 9835-9837, 9820, 9832-9834, 9940, 9840, 9861, 9866, 9867, 9871-9874, 9895-9897, 9910, 9920, 9891, 9863, 9875, 9876, 9945, 9946, 9860, 9930, 9801, 9805, 9931, 9733, 9742, 9800, 9831, 9870, 9948, 9933, 9964
Lung and bronchus C340-C349 Excluding 9590-9989
Myeloma C000-C809 9731-9732, 9734 Non-Hodgkin Lymphoma (NHL) **
NHL: Nodal
C024, C098-C099, C111, C142, C379, C422, C770-C779
9590-9596, 9670-9671, 9673, 9675, 9678-9680, 9684, 9687, 9689-9691, 9695, 9698-9702, 9705, 9708-9709, 9714-9719, 9729-9729, 9823, 9827
NHL: Extranodal
All sites except C024, C098-C099, C111, C142, C379, C422, C770-C779
9590-9596, 9670-9671, 9673, 9675, 9678-9680, 9684, 9687, 9689-9691, 9695, 9698-9702, 9705, 9708-9709, 9714-9719, 9729-9729
Prostate C619 Excluding 9590-9989
Stomach C160-C169 Excluding 9590-9989
Thyroid C739 Excluding 9590-9989
Urinary Bladder C670-C679 Excluding 9590-9989
Uterine C540-C549, C559 Excluding 9590-9989
* The category “All malignant cancers” included in situ bladder cancers. ** Methodology for the assignment of Hodgkin lymphoma and non-Hodgkin lymphoma was modified beginning in reporting period 2001-
2005 to include consideration of histology as well as primary site. Incidence rates for these two types of cancer increased as a result of this change.

134
APPENDIX D DELAWARE POPULATION ESTIMATES: 1980–2005
TOTAL POPULATION
Years 0–4 5–9 10–14 15–19 20–24 25–29 30–34 35–39 40–44 45–49 50–54 55–59 60–64 65–69 70–74 75–79 80–84 85+ Total 1980–84 214,207 215,224 238,510 284,928 287,504 257,448 240,373 198,978 169,336 160,852 159,719 157,164 137,314 112,545 82,140 56,216 35,859 27,646 3,035,963 1981–85 218,519 217,674 235,624 278,183 285,957 262,204 247,217 205,957 176,370 163,939 158,955 156,135 138,915 115,869 84,762 58,120 36,884 28,312 3,069,596 1982–86 222,918 220,151 232,773 271,597 284,419 267,048 254,255 213,182 183,696 167,085 158,194 155,112 140,534 119,290 87,468 60,088 37,938 28,995 3,104,743 1983–87 227,406 222,657 229,956 265,167 282,889 271,982 261,493 220,660 191,326 170,291 157,437 154,097 142,173 122,813 90,260 62,123 39,023 29,694 3,141,447 1984–88 231,983 225,191 227,174 258,889 281,367 277,007 268,938 228,400 199,273 173,559 156,684 153,088 143,831 126,440 93,141 64,227 40,139 30,410 3,179,741 1985–89 236,653 227,754 224,425 252,761 279,854 282,125 276,595 236,411 207,551 176,889 155,935 152,086 145,508 130,174 96,115 66,402 41,286 31,143 3,219,667 1986–90 241,417 230,346 221,710 246,778 278,349 287,338 284,469 244,704 216,172 180,283 155,189 151,090 147,204 134,018 99,184 68,651 42,467 31,894 3,261,263 1987–91 247,002 233,344 221,422 239,937 277,915 290,859 292,199 253,305 226,107 183,991 155,843 150,234 148,777 137,280 102,762 70,853 43,848 33,044 3,308,722 1988–92 252,939 237,039 222,907 234,247 276,897 292,805 298,751 262,638 234,402 190,346 158,034 149,705 149,883 139,752 106,802 73,121 45,335 34,445 3,360,048 1989–93 258,679 241,198 226,409 230,132 275,530 292,343 303,805 272,267 241,848 198,345 162,375 149,809 150,596 141,613 110,952 75,571 46,885 36,158 3,414,515 1990–94 263,575 245,976 231,812 228,278 273,079 289,734 307,523 281,967 248,810 207,578 168,638 150,931 150,828 142,664 115,253 78,238 48,501 38,109 3,471,495 1991–95 267,276 251,644 238,648 229,237 269,266 285,672 309,672 291,351 255,795 218,395 176,552 152,922 150,922 142,984 119,406 81,230 50,469 40,220 3,531,662 1992–96 268,230 257,884 244,332 234,502 262,602 282,623 309,916 300,043 261,684 230,929 184,172 156,088 150,842 143,580 122,749 84,821 52,337 42,224 3,589,559 1993–97 267,318 264,096 249,956 241,269 256,251 279,379 309,039 307,035 269,684 240,209 193,595 160,553 150,922 144,422 125,162 88,785 54,357 44,091 3,646,121 1994–98 265,318 270,063 255,087 249,306 251,098 276,614 306,836 312,437 278,979 247,970 203,452 166,464 151,575 145,375 127,290 92,731 56,609 45,874 3,703,078 1995–99 263,097 275,155 259,963 257,829 248,402 273,725 303,060 316,753 288,783 254,999 213,433 173,368 153,324 146,388 128,811 96,676 59,072 47,686 3,760,523 1996–2000 260,887 278,384 265,330 265,682 248,998 269,598 298,611 319,891 298,156 261,724 224,182 181,016 155,416 147,743 130,117 100,350 61,687 49,464 3,817,237 1997–2001 260,222 279,236 271,171 270,361 254,617 262,938 294,526 321,205 306,718 267,541 236,586 188,557 158,410 148,605 131,729 103,494 64,856 51,192 3,871,965 1998–2002 261,182 278,111 276,995 273,420 262,695 255,987 290,542 320,747 314,036 275,407 246,059 197,923 162,941 149,202 133,595 106,149 68,385 53,284 3,926,663 1999–2003 263,147 275,728 282,716 276,063 270,531 250,646 286,717 318,458 319,534 284,720 253,936 208,082 168,894 150,079 135,437 108,913 72,185 55,811 3,981,596 2000–2004 264,703 270,578 285,718 277,493 277,587 245,714 280,543 313,374 325,255 296,648 262,791 219,919 176,929 152,903 138,167 112,027 76,375 58,800 4,035,524 2001-2005 269,887 268,661 288,360 279,988 283,773 248,988 276,405 308,047 328,334 306,127 269,536 230,755 184,250 154,074 138,993 113,367 79,463 61,847 4,090,855 2002-2006 273,561 266,320 287,414 281,487 285,131 255,158 267,835 301,717 329,046 314,723 275,669 243,574 191,992 156,630 139,720 115,194 82,202 65,434 4,132,807
SOURCE: Delaware Population Consortium, October 2009.

135
TOTAL MALE POPULATION
Years 0–4 5–9 10–14 15–19 20–24 25–29 30–34 35–39 40–44 45–49 50–54 55–59 60–64 65–69 70–74 75–79 80–84 85+ Total 1980–84 109,306 109,805 121,585 141,190 140,621 126,224 117,528 96,927 82,646 78,388 77,061 74,473 65,132 50,443 33,955 21,202 11,611 7,269 1,465,366 1981–85 111,544 111,121 120,157 137,931 140,086 128,782 121,035 100,443 86,114 79,862 76,725 74,084 65,854 51,973 35,246 22,030 11,988 7,332 1,482,307 1982–86 113,828 112,453 118,745 134,748 139,553 131,392 124,646 104,086 89,727 81,364 76,391 73,698 66,584 53,549 36,586 22,890 12,378 7,395 1,500,013 1983–87 116,159 113,801 117,350 131,638 139,021 134,054 128,365 107,861 93,492 82,895 76,058 73,314 67,322 55,173 37,976 23,784 12,780 7,458 1,518,501 1984–88 118,537 115,165 115,971 128,600 138,491 136,771 132,195 111,773 97,415 84,454 75,727 72,931 68,068 56,846 39,420 24,712 13,196 7,522 1,537,794 1985–89 120,964 116,546 114,608 125,632 137,964 139,543 136,139 115,827 101,503 86,043 75,397 72,551 68,823 58,570 40,919 25,677 13,625 7,587 1,557,918 1986–90 123,441 117,943 113,261 122,733 137,438 142,371 140,201 120,028 105,762 87,662 75,069 72,173 69,585 60,346 42,474 26,679 14,068 7,652 1,578,887 1987–91 126,361 119,575 113,147 119,415 137,266 144,393 144,160 124,332 110,654 89,453 75,440 71,791 70,326 61,932 44,245 27,669 14,586 7,935 1,602,682 1988–92 129,420 121,562 113,881 116,683 136,734 145,559 147,517 129,015 114,657 92,613 76,507 71,522 70,884 63,213 46,211 28,723 15,182 8,316 1,628,201 1989–93 132,392 123,724 115,770 114,714 136,060 145,319 150,055 133,884 118,210 96,587 78,550 71,575 71,327 64,282 48,108 29,921 15,851 8,786 1,655,113 1990–94 134,893 126,195 118,659 113,863 134,793 143,882 151,941 138,762 121,554 101,108 81,480 72,141 71,505 65,105 49,980 31,199 16,567 9,376 1,683,004 1991–95 136,777 129,054 122,259 114,510 132,759 141,725 152,970 143,435 124,882 106,389 85,222 73,078 71,636 65,589 51,812 32,650 17,462 10,031 1,712,240 1992–96 137,127 132,227 125,389 117,153 129,509 139,932 153,216 147,705 127,627 112,514 88,790 74,649 71,602 66,183 53,329 34,376 18,327 10,620 1,740,276 1993–97 136,560 135,384 128,537 120,476 126,511 138,066 152,850 151,106 131,610 116,796 93,387 76,842 71,604 66,898 54,471 36,193 19,279 11,215 1,767,785 1994–98 135,513 138,493 131,217 124,569 124,021 136,681 151,765 153,614 136,352 120,327 98,249 79,630 71,829 67,657 55,678 37,857 20,366 11,836 1,795,655 1995–99 134,370 141,136 133,699 128,994 122,710 135,375 149,777 155,661 141,353 123,570 103,159 82,833 72,633 68,311 56,850 39,503 21,522 12,507 1,823,964 1996–2000 133,161 142,939 136,383 132,978 123,174 133,430 147,574 157,118 146,142 126,696 108,399 86,446 73,549 69,158 57,860 41,098 22,776 13,252 1,852,133 1997–2001 132,716 143,337 139,243 135,903 125,672 130,319 145,374 157,968 150,411 129,323 114,470 90,033 74,975 69,650 59,001 42,519 24,294 13,961 1,879,169 1998–2002 133,022 142,634 142,083 138,230 129,134 127,095 143,248 157,865 153,944 133,336 118,785 94,643 77,147 69,924 60,295 43,821 25,892 14,804 1,905,901 1999–2003 133,607 141,297 144,922 139,954 132,619 124,625 141,349 156,805 156,439 138,155 122,341 99,690 79,962 70,284 61,539 45,363 27,474 15,850 1,932,275 2000–2004 133,866 138,540 146,752 141,377 136,179 121,992 138,334 154,139 159,016 144,235 126,427 105,497 83,734 71,511 62,883 47,165 29,106 16,901 1,957,654 2001-2005 135,892 137,371 148,268 142,997 139,739 123,643 136,421 151,602 160,384 149,058 129,508 110,787 87,274 71,935 63,444 48,149 30,422 18,095 1,984,989 2002-2006 137,265 135,917 147,704 144,139 141,449 126,110 132,225 148,261 160,868 153,322 132,263 117,033 91,054 73,119 63,851 49,302 31,590 19,437 2,004,909
SOURCE: Delaware Population Consortium, October 2009.

136
TOTAL FEMALE POPULATION
Years 0–4 5–9 10–14 15–19 20–24 25–29 30–34 35–39 40–44 45–49 50–54 55–59 60–64 65–69 70–74 75–79 80–84 85+ Total 1980–84 104,902 105,418 116,924 143,736 146,881 131,220 122,842 102,049 86,690 82,462 82,657 82,688 72,182 62,100 48,170 35,008 24,246 20,361 1,570,536 1981–85 106,976 106,551 115,467 140,250 145,868 133,416 126,178 105,512 90,256 84,074 82,228 82,047 73,061 63,894 49,496 36,082 24,893 20,959 1,587,208 1982–86 109,091 107,697 114,028 136,848 144,862 135,649 129,604 109,093 93,968 85,718 81,802 81,411 73,950 65,739 50,858 37,188 25,557 21,574 1,604,637 1983–87 111,248 108,855 112,607 133,529 143,863 137,919 133,123 112,795 97,833 87,394 81,378 80,780 74,851 67,638 52,258 38,328 26,239 22,208 1,622,846 1984–88 113,447 110,025 111,203 130,290 142,871 140,227 136,738 116,623 101,857 89,102 80,956 80,154 75,763 69,592 53,696 39,503 26,940 22,861 1,641,848 1985–89 115,689 111,208 109,817 127,130 141,885 142,574 140,451 120,581 106,047 90,844 80,536 79,533 76,686 71,602 55,174 40,714 27,659 23,533 1,661,663 1986–90 117,976 112,404 108,448 124,046 140,906 144,961 144,264 124,673 110,409 92,620 80,119 78,917 77,620 73,670 56,692 41,962 28,398 24,224 1,682,310 1987–91 120,640 113,769 108,274 120,523 140,646 146,461 148,036 128,971 115,454 94,537 80,402 78,442 78,453 75,346 58,505 43,178 29,261 25,098 1,705,994 1988–92 123,518 115,476 109,025 117,564 140,161 147,244 151,232 133,623 119,745 97,732 81,525 78,181 79,000 76,537 60,585 44,395 30,153 26,123 1,731,819 1989–93 126,286 117,475 110,640 115,418 139,469 147,023 153,749 138,383 123,639 101,757 83,825 78,235 79,270 77,330 62,842 45,649 31,034 27,370 1,759,392 1990–94 128,683 119,782 113,153 114,415 138,286 145,852 155,582 143,205 127,256 106,470 87,157 78,790 79,324 77,559 65,273 47,039 31,934 28,733 1,788,491 1991–95 130,498 122,590 116,390 114,727 136,507 143,947 156,702 147,916 130,913 112,005 91,330 79,843 79,287 77,395 67,594 48,581 33,007 30,190 1,819,422 1992–96 131,103 125,658 118,943 117,349 133,093 142,691 156,700 152,338 134,056 118,415 95,382 81,439 79,241 77,397 69,420 50,445 34,010 31,604 1,849,283 1993–97 130,758 128,712 121,419 120,793 129,740 141,313 156,188 155,930 138,074 123,412 100,207 83,711 79,318 77,523 70,691 52,591 35,079 32,877 1,878,336 1994–98 129,805 131,570 123,871 124,736 127,077 139,933 155,071 158,823 142,627 127,643 105,203 86,834 79,746 77,718 71,612 54,874 36,243 34,037 1,907,423 1995–99 128,726 134,019 126,264 128,834 125,692 138,350 153,282 161,092 147,431 131,428 110,275 90,535 80,691 78,077 71,961 57,173 37,550 35,178 1,936,559 1996–2000 127,727 135,445 128,948 132,704 125,824 136,169 151,037 162,773 152,014 135,028 115,783 94,570 81,867 78,585 72,257 59,252 38,911 36,212 1,965,104 1997–2001 127,506 135,899 131,928 134,457 128,945 132,619 149,152 163,237 156,307 138,218 122,117 98,525 83,436 78,955 72,728 60,976 40,562 37,231 1,992,796 1998–2002 128,161 135,478 134,912 135,190 133,561 128,892 147,294 162,882 160,092 142,071 127,274 103,281 85,794 79,278 73,300 62,328 42,493 38,481 2,020,762 1999–2003 129,539 134,430 137,794 136,109 137,912 126,022 145,368 161,653 163,095 146,566 131,594 108,392 88,931 79,795 73,898 63,550 44,712 39,962 2,049,321 2000–2004 130,837 132,038 138,966 136,116 141,408 123,722 142,209 159,235 166,239 152,413 136,364 114,422 93,195 81,392 75,284 64,862 47,269 41,899 2,077,870 2001-2005 133,995 131,290 140,092 136,991 144,034 125,345 139,984 156,445 167,950 157,069 140,028 119,968 96,976 82,139 75,549 65,218 49,041 43,752 2,105,866 2002-2006 136,296 130,403 139,710 137,348 143,682 129,048 135,610 153,456 168,178 161,401 143,406 126,541 100,938 83,511 75,869 65,892 50,612 45,997 2,127,898
SOURCE: Delaware Population Consortium, October 2009.

137
TOTAL CAUCASIAN POPULATION
Years 0–4 5–9 10–14 15–19 20–24 25–29 30–34 35–39 40–44 45–49 50–54 55–59 60–64 65–69 70–74 75–79 80–84 85+ Total 1980–84 161,578 164,018 181,424 224,599 233,283 209,496 197,457 164,950 140,805 135,974 137,745 137,055 121,128 98,211 72,417 49,295 32,140 24,892 2,486,467 1981–85 165,108 165,832 179,045 218,700 231,353 213,038 202,745 170,315 146,500 138,347 136,602 135,821 122,426 101,259 74,803 51,006 33,035 25,460 2,511,395 1982–86 168,715 167,666 176,697 212,956 229,439 216,640 208,175 175,855 152,425 140,762 135,468 134,598 123,738 104,402 77,268 52,776 33,955 26,041 2,537,576 1983–87 172,401 169,520 174,380 207,363 227,541 220,304 213,750 181,575 158,590 143,218 134,344 133,386 125,064 107,642 79,814 54,607 34,901 26,635 2,565,035 1984–88 176,168 171,395 172,093 201,917 225,659 224,029 219,474 187,481 165,005 145,717 133,229 132,185 126,404 110,983 82,444 56,502 35,873 27,244 2,593,802 1985–89 180,017 173,291 169,836 196,614 223,792 227,817 225,351 193,578 171,679 148,260 132,123 130,995 127,758 114,428 85,161 58,463 36,872 27,866 2,623,901 1986–90 183,950 175,207 167,609 191,451 221,941 231,670 231,386 199,873 178,624 150,847 131,026 129,816 129,127 117,980 87,967 60,492 37,899 28,503 2,655,366 1987–91 187,894 177,153 166,863 185,435 220,429 233,668 236,950 206,300 186,376 153,654 131,079 128,661 130,340 120,965 91,201 62,536 39,077 29,527 2,688,106 1988–92 191,482 179,322 167,125 180,133 217,986 233,865 241,209 213,099 192,430 158,654 132,454 127,698 131,049 123,163 94,871 64,638 40,365 30,776 2,720,317 1989–93 194,527 181,518 168,606 175,680 215,064 231,556 243,878 219,891 197,450 164,885 135,647 127,228 131,291 124,781 98,560 66,965 41,688 32,322 2,751,535 1990–94 196,541 183,858 171,241 172,627 211,065 227,003 245,006 226,480 201,837 171,857 140,503 127,525 130,982 125,640 102,304 69,478 43,072 34,075 2,781,094 1991–95 197,412 186,426 174,732 171,429 205,735 220,756 244,418 232,502 205,982 179,838 146,738 128,525 130,397 125,760 105,836 72,293 44,756 35,969 2,809,504 1992–96 196,651 189,133 177,569 173,360 198,474 215,370 242,035 237,686 209,264 188,958 152,691 130,589 129,548 126,041 108,655 75,544 46,418 37,738 2,835,726 1993–97 194,914 191,522 180,524 176,197 191,712 209,970 238,546 241,328 214,237 194,942 160,089 133,824 128,769 126,460 110,586 79,153 48,220 39,380 2,860,373 1994–98 192,142 193,572 183,087 180,113 185,796 205,241 233,844 243,436 220,158 199,443 167,649 138,299 128,457 126,835 112,312 82,600 50,327 40,896 2,884,205 1995–99 188,932 194,765 185,366 184,555 181,700 200,659 227,822 244,375 226,303 203,325 174,928 143,676 129,091 127,140 113,534 85,979 52,617 42,427 2,907,193 1996–2000 184,527 194,549 187,688 188,692 180,124 195,312 221,186 244,155 231,860 206,909 182,487 149,683 130,063 127,584 114,588 89,037 55,043 43,903 2,927,389 1997–2001 181,606 192,937 190,124 190,745 182,626 188,335 215,368 242,431 236,668 209,906 191,266 155,510 131,973 127,505 115,785 91,683 57,891 45,339 2,947,698 1998–2002 180,206 190,281 192,184 191,812 187,218 181,454 210,062 239,373 240,546 214,723 197,260 162,833 135,299 127,174 117,089 93,824 61,061 47,125 2,969,523 1999–2003 180,280 186,740 193,974 192,646 191,680 176,071 205,224 235,036 242,929 220,703 201,862 170,609 139,929 127,053 118,258 96,126 64,358 49,368 2,992,844 2000–2004 186,835 187,987 200,127 198,216 200,774 177,758 205,887 234,912 250,735 233,093 210,952 182,185 148,499 130,262 121,191 99,448 68,324 52,255 3,089,440 2001-2005 190,276 184,030 199,279 197,701 202,464 177,487 199,949 227,159 250,088 238,326 214,137 189,424 153,961 130,197 120,959 100,382 70,818 54,891 3,101,528 2002-2006 195,026 183,540 198,829 198,403 203,751 183,106 194,303 222,343 250,207 244,876 218,648 199,551 160,632 132,348 121,164 101,960 73,201 58,065 3,139,953
SOURCE: Delaware Population Consortium, October 2009.

138
CAUCASIAN MALE POPULATION
Years 0–4 5–9 10–14 15–19 20–24 25–29 30–34 35–39 40–44 45–49 50–54 55–59 60–64 65–69 70–74 75–79 80–84 85+ Total 1980–84 82,959 83,837 93,237 111,461 115,453 104,632 98,145 81,339 69,237 66,809 66,667 65,197 57,578 44,196 29,758 18,440 10,352 6,397 1,205,694 1981–85 84,785 84,833 92,019 108,599 114,559 106,506 100,888 84,155 72,123 67,961 66,144 64,724 58,206 45,589 30,962 19,201 10,689 6,443 1,218,386 1982–86 86,651 85,841 90,817 105,811 113,673 108,413 103,707 87,068 75,129 69,132 65,625 642,55 58,841 47,026 32,215 19,993 11,037 6,490 1,23,1724 1983–87 88,558 86,861 89,631 103,095 112,793 110,354 106,606 90,082 78,261 70,324 65,110 63,789 59,484 48,508 33,519 20,818 11,396 6,537 1,245,726 1984–88 90,507 87,893 88,459 100,448 111,919 112,330 109,586 93,200 81,523 71,537 64,600 63,327 60,133 50,037 34,875 21,677 11,766 6,584 1,260,401 1985–89 92,499 88,937 87,303 97,869 111,053 114,341 112,649 96,427 84,921 72,771 64,094 62,868 60,789 51,615 36,286 22,572 12,149 6,632 1,275,775 1986–90 94,536 89,993 86,162 95,356 110,193 116,388 115,797 99,764 88,461 74,025 63,592 62,412 61,453 53,243 37,755 23,503 12,544 6,680 1,291,859 1987–91 96,603 91,084 85,801 92,401 109,365 117,553 118,677 103,103 92,377 75,404 63,670 61,899 62,058 54,702 39,395 24,463 12,993 6,954 1,308,504 1988–92 98,415 92,299 85,916 89,772 108,060 117,753 120,867 106,617 95,377 77,933 64,379 61,412 62,459 55,871 41,201 25,486 13,518 7,317 1,324,653 1989–93 99,976 93,496 86,759 87,553 106,568 116,515 122,185 110,104 97,882 81,089 65,921 61,169 62,693 56,848 42,907 26,655 14,105 7,762 1,340,188 1990–94 100,944 94,755 88,204 86,059 104,476 114,058 122,732 113,431 100,104 84,572 68,261 61,295 62,616 57,611 44,554 27,878 14,727 8,326 1,354,604 1991–95 101,316 96,062 90,063 85,584 101,649 110,756 122,359 116,385 102,202 88,543 71,293 61,697 62,429 58,057 46,110 29,235 15,517 8,943 1,368,200 1992–96 100,728 97,455 91,652 86,573 98,014 107,767 121,224 118,867 103,867 93,072 74,142 62,694 62,034 58,543 47,411 30,791 16,313 9,468 1,380,616 1993–97 99,722 98,630 93,312 87,994 94,667 104,786 119,500 120,558 106,495 95,906 77,803 64,290 61,582 59,097 48,364 32,446 17,187 10,003 1,392,341 1994–98 98,201 99,623 94,637 90,036 91,660 102,343 117,163 121,394 109,608 98,028 81,613 66,398 61,292 59,607 49,390 33,899 18,212 10,551 1,403,657 1995–99 96,518 100,126 95,789 92,340 89,600 100,026 114,113 121,704 112,789 99,912 85,260 68,933 61,495 59,930 50,431 35,331 19,290 11,134 1,414,720 1996–2000 94,269 99,975 96,920 94,357 88,932 97,325 110,832 121,464 115,584 101,719 88,998 71,844 61,777 60,338 51,357 36,685 20,435 11,787 1,424,600 1997–2001 92,809 98,925 98,067 95,791 89,892 93,851 107,793 120,723 117,874 103,230 93,364 74,654 62,618 60,355 52,324 37,907 21,789 12,415 1,434,381 1998–2002 92,038 97,369 99,020 96,917 91,678 90,456 104,973 119,239 119,639 105,824 96,193 78,306 64,200 60,112 53,379 38,978 23,227 13,155 1,444,703 1999–2003 91,842 95,475 99,777 97,689 93,503 87,784 102,418 117,163 120,526 109,002 98,354 82,255 66,392 59,923 54,320 40,294 24,611 14,094 1,455,422 2000–2004 94,820 96,174 102,959 101,051 98,245 88,770 102,796 117,238 124,250 115,365 102,790 88,032 70,507 61,313 55,810 42,205 26,227 15,137 1,503,689 2001-2005 96,066 94,122 102,499 101,109 99,283 88,512 99,695 113,475 123,768 118,023 104,439 91,687 73,275 61,092 55,900 43,050 27,313 16,179 1,509,487 2002-2006 98,037 93,887 102,045 101,834 100,707 90,788 96,761 110,967 123,980 121,196 106,721 96,727 76,598 62,044 56,031 44,115 28,364 17,388 1,528,190
SOURCE: Delaware Population Consortium, October 2009.

139
CAUCASIAN FEMALE POPULATION
Years 0–4 5–9 10–14 15–19 20–24 25–29 30–34 35–39 40–44 45–49 50–54 55–59 60–64 65–69 70–74 75–79 80–84 85+ Total 1980–84 78,619 80,179 88,187 113,136 117,829 104,864 99,309 83,606 71,566 69,165 71,077 71,854 63,550 54,015 42,639 30,847 21,787 18,481 1,280,710 1981–85 80,323 80,997 87,026 110,099 116,793 106,532 101,853 86,153 74,375 70,386 70,456 71,092 64,219 55,670 43,813 31,793 22,344 18,998 1,292,922 1982–86 82,064 81,824 85,880 107,144 115,766 108,227 104,463 88,778 77,294 71,629 69,840 70,338 64,895 57,376 45,020 32,769 22,915 19,529 1,305,751 1983–87 83,842 82,659 84,750 104,269 114,748 109,948 107,139 91,483 80,327 72,893 69,230 69,592 65,578 59,134 46,259 33,774 23,501 20,076 1,319,202 1984–88 85,660 83,502 83,634 101,470 113,739 111,697 109,883 94,271 83,479 74,180 68,626 68,854 66,269 60,945 47,533 34,810 24,102 20,637 1,3332,91 1985–89 87,517 84,354 82,533 98,746 112,739 113,474 112,698 97,143 86,755 75,490 68,027 68,124 66,967 62,812 48,842 35,878 24,719 21,214 1,348,032 1986–90 89,414 85,214 81,446 96,096 111,747 115,279 115,585 100,103 90,159 76,823 67,433 67,401 67,673 64,736 50,187 36,979 25,352 21,808 1,363,437 1987–91 91,290 86,069 81,061 93,036 111,064 116,114 118,271 103,194 93,997 78,251 67,409 66,761 68,282 66,261 51,788 38,067 26,082 22,563 1,379,558 1988–92 93,067 87,022 81,208 90,361 109,925 116,111 120,341 106,481 97,052 80,722 68,076 66,286 68,590 67,291 53,660 39,149 26,846 23,453 1,395,640 1989–93 94,551 88,022 81,847 88,126 108,496 115,042 121,693 109,787 99,568 83,796 69,726 66,059 68,598 67,933 55,649 40,309 27,583 24,557 1,411,340 1990–94 95,596 89,103 83,037 86,568 106,589 11,2945 122,275 113,048 101,733 87,285 72,242 66,230 68,366 68,029 57,749 41,600 28,345 25,750 1,426,490 1991–95 96,096 90,364 84,668 85,845 104,086 110,000 122,059 116,117 103,780 91,295 75,446 66,828 67,968 67,703 59,727 43,058 29,238 27,026 1,441,304 1992–96 95,923 91,678 85,917 86,788 100,461 107,603 120,811 118,818 105,397 95,886 78,549 67,895 67,515 67,498 61,244 44,753 30,105 28,269 1,455,110 1993–97 95,192 92,892 87,211 88,204 97,046 105,184 119,046 120,770 107,742 99,036 82,286 69,534 67187 67,363 62,222 46,707 31,033 29,377 1,468,032 1994–98 93,941 93,950 88,449 90,077 94,136 102,898 116,682 122,041 110,550 101,414 86,036 71,901 67,164 67,227 62,921 48,701 32,115 30,345 1,480,548 1995–99 92,414 94,638 89,577 92,216 92,100 100,633 113,708 122,671 113,514 103,413 89,668 74,743 67,596 67,210 63,103 50,648 33,328 31,293 1,492,473 1996–2000 90,257 94,574 90,768 94,336 91,192 97,987 110,354 122,691 116,276 105,190 93,489 77,839 68,286 67,246 63,230 52,351 34,608 32,116 1,502,789 1997–2001 88,797 94,011 92,057 94,954 92,734 94,483 107,575 121,708 118,795 106,677 97,902 80,856 69,354 67,150 63,461 53,776 36,102 32,924 1,513,316 1998–2002 88,168 92,912 93,163 94,895 95,540 90,998 105,089 120,134 120,907 108,899 101,067 84,527 71,099 67,061 63,710 54,846 37,834 33,970 1,524,819 1999–2003 88,438 91,266 94,197 94,957 98,177 88,286 102,806 117,873 122,403 111,701 103,508 88,353 73,537 67,130 63,938 55,832 39,748 35,274 1,537,423 2000–2004 92,015 91,813 97,168 97,165 102,529 88,988 103,091 117,674 126,485 117,728 108,162 94,153 77,992 68,949 65,381 57,243 42,097 37,118 1,585,751 2001-2005 94,210 89,908 96,780 96,592 103,181 88,975 100,254 113,684 126,320 120,303 109,698 97,737 80,686 69,105 65,059 57,332 43,505 38,712 1,592,041 2002-2006 96,989 89,653 96,784 96,569 103,044 92,318 97,542 111,376 126,227 123,680 111,927 102,824 84,034 70,304 65,133 57,845 44,837 40,677 1,611,763
SOURCE: Delaware Population Consortium, October 2009.

140
TOTAL AFRICAN AMERICAN POPULATION
Years 0–4 5–9 10–14 15–19 20–24 25–29 30–34 35–39 40–44 45–49 50–54 55–59 60–64 65–69 70–74 75–79 80–84 85+ Total 1980–84 46,897 45,434 51,959 55,157 49,134 42,910 37,844 29,625 24,715 22,107 19,988 18,744 15,266 13,530 9,147 6,527 3,534 2,579 495,097 1981–85 47,798 46,196 51,582 54,338 49,512 44,071 39,300 31,127 25,939 22,701 20,217 18,846 15,518 13,785 9,379 6,711 3,653 2,675 503,348 1982–86 48,717 46,971 51,208 53,532 49,893 45,264 40,812 32,705 27,223 23,311 20,448 18,949 15,774 14,045 9,617 6,900 3,776 2,774 511,919 1983–87 49,653 47,759 50,837 52,737 50,277 46,489 42,383 34,362 28,572 23,938 20,682 19,052 16,035 14,310 9,861 7,095 3,903 2,878 520,823 1984–88 50,607 48,560 50,468 51,954 50,664 47,747 44,014 36,104 29,987 24,581 20,919 19,156 16,300 14,579 10,111 7,295 4,034 2,986 530,066 1985–89 51,579 49,374 50,102 51,183 51,054 49,040 45,708 37934 31,472 25,241 21,159 19,260 16,569 14,853 10,367 7,500 4,170 3,097 539,662 1986–90 52,570 50,202 49,738 50,423 51,446 50,367 47,468 39,856 33,031 25,919 21,402 19,366 16,843 15,132 10,630 7,711 4,310 3,212 549,627 1987–91 54,172 51,175 50,053 49,380 52,258 51,673 49,437 41,844 34,988 26,674 21,825 19,558 17,117 15,379 10,960 7,860 4,499 3,339 562,191 1988–92 56,275 52,448 50,874 48,472 53,098 53,002 51,406 44,030 36,959 27,792 22,436 19,828 17,401 15,598 11,303 8,018 4,680 3,490 577,111 1989–93 58,557 53,977 52,253 48,037 53,735 54,200 53,281 46,384 39,055 29,223 23,336 20,179 17,717 15,768 11,715 8,128 4,887 3,653 594,086 1990–94 60,844 55,778 54,147 48,271 54,031 55,213 55,154 48,880 41,207 31,038 24,457 20,707 18,070 15,855 12,203 8,261 5,096 3,840 613,053 1991–95 62,920 57,989 56,443 49,280 53,969 56,174 56,918 51,458 43,509 33,330 25,785 21,344 18,506 15,917 12,721 8,409 5,361 4,035 634,069 1992–96 63,895 60,622 58,351 51,544 53,045 57,127 58,446 54,115 45,547 36,102 27,134 22,050 19,002 16,076 13,133 8,703 5,540 4,245 654,678 1993–97 64,057 63,449 60,202 54,537 52,021 57,719 59,830 56,586 47,878 38,767 28,753 22,904 19,548 16,313 13,491 8,991 5,742 4,437 675,224 1994–98 64,021 66,258 62,036 57,806 51,513 57,973 61,017 58,851 50,440 41,418 30,550 23,991 20,152 16,671 13,774 9,404 5,871 4,663 696,409 1995–99 63,978 68,919 63,926 61,065 51,864 57,878 61,835 61,040 53,223 43,955 32,627 25,196 20,862 17,138 13,925 9,881 6,005 4,905 718,221 1996–2000 64,374 71,027 66,136 64,067 53,217 57,262 62,534 63,030 56,076 46,437 35,125 26,486 21,569 17,779 14,029 10,386 6,143 5,175 740,853 1997–2001 65,054 72,187 68,668 66,184 55,750 56,044 62,816 64,727 58,871 48,620 38,016 27,870 22,250 18,402 14,284 10,768 6,400 5,421 762,333 1998–2002 66,052 72,427 71,468 67,799 58,888 54,819 62,668 66,024 61,387 50,999 40,812 29,515 23,093 19,006 14,657 11,168 6,678 5,686 783,147 1999–2003 66,965 72,306 74,289 69,286 62,010 54,087 62,215 66,882 63,510 53,597 43,489 31,386 24,127 19,632 15,102 11,524 7,083 5,923 803,414 2000–2004 68,151 71,914 76,162 70,577 66,593 55,493 62,171 67,673 65,877 56,687 46,259 33,577 25,318 20,323 15,571 11,724 7,570 6,208 827,848 2001-2005 68,509 71,176 77,157 71,577 69,120 56,766 60,849 67,403 67,128 59,057 48,388 35,892 26,367 20,800 16,146 11,841 7,995 6,499 842,670 2002-2006 69,591 71,008 77,931 73,693 71,130 59,730 59,684 67,291 68,730 61,944 50,735 38,948 27,850 21,474 16,807 12,189 8,383 6,937 864,055
SOURCE: Delaware Population Consortium, October 2009.

141
AFRICAN AMERICAN MALE POPULATION
Years 0–4 5–9 10–14 15–19 20–24 25–29 30–34 35–39 40–44 45–49 50–54 55–59 60–64 65–69 70–74 75–79 80–84 85+ Total 1980–84 23,413 22,932 25,771 27,047 22,479 19,198 17,162 13,572 11,436 10,281 9,361 8,588 7,120 5,899 3,946 2,611 1,200 808 232,824 1981–85 23,891 23,338 25,628 26,664 22,826 19,852 17,861 14,215 11,990 10,553 9,467 8,635 7,190 6,021 4,026 2,670 1,235 825 236,887 1982–86 24,379 23,752 25,485 26,286 23,179 20,528 18,588 14,888 12,570 10,832 9,574 8,683 7,261 6,146 4,108 2,731 1,271 842 241,103 1983–87 24,876 24,173 25,343 25,914 23,537 21,227 19,345 15,593 13,179 11,118 9,682 8,730 7,333 6,274 4,191 2,793 1,308 859 245,475 1984–88 25,384 24,602 25,202 25,547 23,901 21,949 20,133 16,332 13,817 11,412 9,792 8,778 7,405 6,404 4,276 2,856 1,346 877 250,013 1985–89 25,902 25,038 25,062 25,185 24,270 22,696 20,952 17,106 14,487 11,714 9,903 8,826 7,478 6,536 4,363 2,921 1,386 896 254,721 1986–90 26,431 25,482 24,922 24,828 24,646 23,468 21,805 17,916 15,189 12,024 10,016 8,874 7,552 6,671 4,451 2,988 1,427 914 259,606 1987–91 27,285 25,995 25,079 24,352 25,172 24,218 22,764 18,777 16,088 12,375 10,225 8,954 7,649 6,779 4,574 3,013 1,490 925 265,715 1988–92 28,423 26,651 25,469 23,967 25,637 24,958 23,744 19,765 16,981 12,890 10,507 9,083 7,758 6,867 4,719 3,041 1,549 946 272,956 1989–93 29,636 27,393 26,167 23,794 25,968 25,603 24,686 20,891 17,881 13,544 10,917 9,253 7,899 6,933 4,882 3,067 1,618 969 281,102 1990–94 30,855 28,277 27,146 23,910 26,118 26,116 25,636 22,121 18,792 14,367 11,411 9,519 8,077 6,950 5,074 3,113 1,699 992 290,173 1991–95 31,970 29,365 283,38 24,385 26,063 26,594 26,507 23,431 19,740 15,413 11,998 9,853 8,291 6,933 5,303 3,192 1,792 1,021 300,191 1992–96 32,488 30,680 29,423 25,424 25,618 27,040 27,287 24,768 20,517 16,699 12,595 10,229 8,522 6,981 5,470 3,339 1,848 1,074 310,000 1993–97 32,547 32,134 30,512 26,801 25,168 27,304 27,979 26,010 21,491 17,863 13,334 10,665 8,813 7,062 5,612 3,469 1,919 1,118 319,801 1994–98 32,560 33,663 31,509 28,385 24,975 27,411 28,532 2,7136 22,672 18,977 14,152 11,193 9,144 7,209 5,755 3,633 1,978 1,172 330,057 1995–99 32,552 35,111 32,505 30,077 25,127 27,411 28,852 28,229 24,010 20,038 15,112 11,746 9,515 7,440 5,829 3,802 2,041 1,242 340,637 1996–2000 32,685 36,310 33,646 31,728 25,735 27,143 29,164 29,185 25,459 21,032 16,268 12,317 9,918 7,763 5,853 3,995 2,125 1,313 351,639 1997–2001 32,932 37,013 34,893 33,052 26,898 26,607 29,251 30,042 269,02 21,814 17,623 12,941 10,315 8,083 5,963 4,143 2,259 1,370 362,099 1998–2002 33,346 37,160 36,259 34,125 28,367 26,072 29,153 30,712 28,173 22,838 18,820 13,682 10,760 8,434 6,114 4,330 2,382 1,451 372,179 1999–2003 33,649 37,065 37,728 34,977 29,887 25,801 28,952 31,108 29,249 24,061 19,928 14,541 11,254 8,799 6,307 4,524 2,530 1,535 381,895 2000–2004 34,094 36,791 38,896 35,893 32,393 26,525 29,075 31,372 30,367 25,505 21,024 15,503 11,760 9,106 6,464 4,604 2,668 1,620 393,660 2001-2005 34,188 36,266 39,520 36,444 33,924 27,149 28,578 31,249 30,938 26,711 21,811 16,539 12,189 9,379 6,730 4,627 2,824 1,717 400,783 2002-2006 34,696 35,967 40,002 37,505 35,342 28,600 28,149 31,151 31,696 28,158 22,591 17,922 12,814 9,730 7,046 4,757 2,958 1,869 410,973
SOURCE: Delaware Population Consortium, October 2009.

142
AFRICAN AMERICAN FEMALE POPULATION
Years 0–4 5–9 10–14 15–19 20–24 25–29 30–34 35–39 40–44 45–49 50–54 55–59 60–64 65–69 70–74 75–79 80–84 85+ Total 1980–84 23,486 22,500 26,187 28,110 26,638 23,700 20,681 16,052 13,279 11,827 10,628 10,155 8,143 7,631 5,200 3,915 2,336 1,769 262,237 1981–85 23,909 22,856 25,953 27,674 26,662 24,203 21,438 16,910 13,949 12,149 10,751 10,210 8,323 7,764 5,352 4,039 2,419 1,847 266,408 1982–86 24,339 23,217 25,721 27,245 26,686 24,717 22,223 17,814 14,653 12,480 10,875 10,266 8,508 7,899 5,508 4,167 2,505 1,929 270,752 1983–87 24,777 23,584 25,491 26,822 26,709 25,242 23,036 18,766 15,393 12,819 11,001 10,322 8,696 8,036 5,669 4,300 2,594 2,015 275,272 1984–88 25,223 23,957 25,263 26,407 26,733 25,778 23,879 19,769 16,170 13,168 11,128 10,379 8,888 8,176 5,835 4,437 2,687 2,104 279,981 1985–89 25,677 24,336 25,037 25,997 26,757 26,326 24,753 20,826 16,985 13,526 11,256 10,436 9,084 8,318 6,005 4,578 2,783 2,197 284,877 1986–90 26,139 24,720 24,813 25,594 26,781 26,885 25,660 21,939 17,842 13,894 11,386 10,494 9,285 8,462 6,180 4,723 2,883 2,295 289,975 1987–91 26,887 25,179 24,972 25,028 27,073 27,446 26,670 23,068 18,900 14,298 11,601 10,605 9,463 8,600 6,388 4,848 3,009 2,411 296,445 1988–92 27,852 25,797 25,404 24,506 27,453 28040 27,660 24,264 19,978 14,902 11,929 10,746 9,640 8,732 6,585 4,978 3,131 2,544 304,139 1989–93 28,921 26,584 26,086 24,242 27,764 28,595 28,594 25,493 21,174 15,679 12,419 10,926 9,817 8,835 6,834 5,063 3,269 2,684 312,978 1990–94 29,989 27,501 27,002 24,361 27,913 29,097 29,518 26,760 22,415 16,671 13,045 11,188 9,992 8,905 7,129 5,148 3,397 2,848 322,880 1991–95 30,951 28,624 28,105 24,896 27,906 29,580 30,411 28,027 23,768 17,917 13,787 11,492 10,215 8,984 7,418 5,217 3,568 3,014 333,879 1992–96 31,407 29,943 28,928 26,120 27,427 30,087 31,159 29,347 25,031 19,403 14,540 11,821 10,480 9,095 7,663 5,364 3,692 3,171 344,678 1993–97 31,511 31,314 29,690 27,737 26,853 30,415 31,852 30,577 26,387 20,904 15,419 12,239 10,735 9,251 7,878 5,521 3,823 3,319 355,424 1994–98 31,461 32,595 30,528 29,420 26,538 30,562 32,485 31,715 27,768 22,441 16,398 12,798 11,008 9,462 8,019 5,771 3,893 3,490 366,352 1995–99 31,426 33,808 31,421 30,987 26,737 30,467 32,983 32,811 29,213 23,917 17,516 13,449 11,348 9,698 8,096 6,080 3,965 3,663 377,584 1996–2000 31,689 34,717 32,490 32,339 27,482 30,120 33,370 33,845 30,617 25,405 18,857 14,169 11,650 10,016 8,177 6,391 4,018 3,862 306,470 1997–2001 32,122 35,174 33,775 33,132 28,852 29,438 33,564 34,685 31,970 26,806 20,393 14,929 11,936 10,319 8,322 6,625 4,141 4,051 233,242 1998–2002 32,707 35,267 35,209 33,674 30,521 28,747 33,515 35,311 33,214 28,161 21,992 15,833 12,333 10,571 8,544 6,838 4,296 4,235 410,968 1999–2003 33,316 35,241 36,561 34,310 32,123 28,287 33,263 35,775 34,262 29,535 23,562 16,845 12,872 10,833 8,795 7,000 4,552 4,388 421,519 2000–2004 34,057 35,123 37,266 34,684 34,200 28,968 33,096 36,301 35,510 31,182 25,235 18,074 13,558 11,217 9,107 7,120 4,902 4,588 434,188 2001-2005 34,321 34,910 37,637 35,133 35,196 29,617 32,271 36,154 36,190 32,346 26,577 19,353 14,178 11,421 9,416 7,214 5,171 4,782 441,887 2002-2006 34,895 35,041 37,909 36,188 35,788 31,130 31,535 36,140 37,034 33,786 28,144 21,026 15,036 11,744 9,761 7,432 5,425 5,068 453,082
SOURCE: Delaware Population Consortium, October 2009.

143
APPENDIX E BEHAVIORAL RISK FACTORS
The Behavioral Risk Factor Surveillance System (BRFSS) survey was developed to monitor the statewide prevalence of behavioral risk factors among adults that relate to premature morbidity and mortality. The BRFSS survey includes a core set of questions developed by the Centers for Disease Control and Prevention (CDC) and is administered annually to adults ages 18 and older as a random-digit-dial telephone survey. BRFSS survey questions target lifestyle behaviors (including tobacco use, fruit and vegetable consumption, exercise and weight control), cancer screening practices, health status and health care access and use. Data related to specific cancers are included in those sections of this report (e.g., smoking prevalence is in the lung cancer section, mammogram prevalence is in the breast cancer section). In Delaware, BRFSS is a collaborative effort between Delaware’s Division of Public Health (DPH) and the CDC. The data provided below relate specifically to risk factor prevalence and cancer screening practices among Delawareans. More information about Delaware’s BRFSS is available at the state website: http://www.dhss.delaware.gov /dph/dpc/brfsurveys.html. General information on the national BRFSS is available at http://www.cdc.gov/brfss/.
Overweight/Obesity Being overweight or obese is a risk factor for several cancers, including female breast (in postmenopausal females), colorectal, kidney and uterine cancers. In addition, being overweight or obese is a major risk factor for other chronic diseases, including coronary heart disease, type 2 diabetes and stroke. The CDC defines “overweight” as a body mass index (BMI) between 25 and 30 and “obese” as a BMI equal to or greater than 30. BMI is calculated using an individual’s height and weight. The following data are specific to the 2008 BRFSS:
In Delaware, 63.8 percent of adults ages 18 and over were overweight or obese. At the national level, 63.2 percent of adults were overweight or obese. This difference was not statistically significant.
The prevalence of overweight/obese people in Delaware differed significantly by sex: 70.4 percent of males and 57.4 percent of females were overweight or obese.
Significantly more Delawarean African Americans were overweight/obese than Caucasians (75.1 percent vs. 63.0 percent, respectively).
The state’s prevalence of overweight/obese was highest among adults ages 30 to 79 years (68.7 percent). This number was significantly higher than the percent of overweight/obese adults ages 18-29 (49.7 percent) and those age 80 and older (48.0 percent).
In Kent, New Castle and Sussex counties, 68.0 percent, 60.8 percent and 68.5 percent of adults, respectively, were overweight/obese.
No significant differences in overweight/obese prevalence were observed by education level or income level.

144
Physical Activity Lack of physical activity is a substantiated risk factor for colorectal cancer and a suspected risk factor for other cancers (e.g., prostate cancer). The benefits of regular sustained physical activity also include reduction in risk for other chronic diseases including coronary heart disease, type 2 diabetes, and stroke, as well as improved overall well-being. BRFSS questions examine the intensity, duration and frequency of activity reported by respondents. Respondents are considered “physically active” if they engage in 30 or more minutes of moderate activity at least five days per week or 20 or more minutes of vigorous activity at least three days per week. Physical activity questions are included in the BRFSS survey on an alternating-year basis; therefore, no physical activity data are available for 2008.
Dietary Fruits and Vegetables
A diet high in fruits and vegetables is a protective factor against numerous cancers, including breast, cervical, colorectal, uterine, esophageal, oral cavity, ovarian, pancreatic, prostate and stomach cancers. Dietary behavior questions are included in the BRFSS survey on an alternating-year basis; therefore, dietary behavior data are not available for 2008. According to 2007 data, however, only 21.4 percent of Delawareans reported eating five or more servings of fruits and vegetables on a daily basis.
APPENDIX F TITLE 16 CHAPTER 292 OF THE DELAWARE CODE

145
CHAPTER 292
FORMERLY
SENATE BILL NO. 235
AS AMENDED BY
SENATE AMENDMENT NO. 2
AND
HOUSE AMENDMENT NO. 1
AN ACT TO AMEND TITLE 16 OF THE DELAWARE CODE RELATING TO UNIFORM HEALTH DATA REPORTING.
BE IT ENACTED BY THE GENERAL ASSEMBLY OF THE STATE OF DELAWARE :
WHEREAS, the State of Delaware traditionally has one of the highest rates of cancer incidence and mortality in the United States;
WHEREAS, identification of clusters of certain types of cancers in specific locations can help public health agencies develop intervention strategies leading to early detection when cancer is more easily cured;
WHEREAS, providing such data to medical researchers outside state government may assist in the process of both identifying cancer clusters and developing intervention strategies;
WHEREAS, the public good is served by allowing citizens to know of potential hazards in their communities so they can take actions to preserve their health;
WHEREAS, it is equally important to preserve the privacy and dignity of people afflicted with cancer, and
WHEREAS, the Department of Health and Social Services, Division of Public Health has opted to err on the side of cancer patient privacy by withholding even generic data on cancer clusters from other researchers and the public;
NOW THEREFORE:
BE IT ENACTED BY THE GENERAL ASSEMBLY OF THE STATE OF DELAWARE:
Section 1. Amend Chapter 20, Title 16 of the Delaware Code by renumbering §2005 through 2008 as §2006 through 2009, respectively.
Section 2. Amend Chapter 20, Title 16 of the Delaware Code by inserting a new §2005 to read as follows:
Ҥ2005(a). Cancer incidence data.

146
Notwithstanding any provisions in this Title to the contrary, the agency shall make available as public records cancer incidence by census tract and by type of cancer. Such released data shall be assigned consensus tract geography from the most recent decennial census. If release of such information by census tract will explicitly or implicitly identify any individual, the agency may combine data among contiguous census tracts, but only insofar as is necessary to protect patient confidentiality.
(b) The agency shall create a detailed map of each county in Delaware that graphically illustrates the overall incidence of cancer in each census track. The census tracks will be identified on the maps and shall be color-coded to designate the degree of cancer incidence in each track. These maps shall be created within 90 days of the agency receiving the cancer incidence data.
(c) The agency shall post the maps created under the subsection above on their website in a format that can be easily accessed and read by the public.”
Section 3. Amend §1232(d) Title 16 of the Delaware Code by deleting the word “or” at the end of paragraph (6) and by inserting the word “or” at the end of paragraph 7 and by adding a new paragraph “(8)” to read as follows:
“(8) Pursuant to Title 16 §2005.”
Section 4. Amend Subchapter III of Chapter 12 of Title 16 of the Delaware Code by inserting a new section §1233 to read as follows:
Ҥ1233. Regulations.
The Department of Health and Social Services shall enforce this subchapter and shall from time to time promulgate any additional forms and regulations that are necessary for this purpose.”
Approved July 3, 2008
APPENDIX G CANCER BY CENSUS TRACT METHODOLOGY
Geocoding Validation Process When a cancer case is submitted to the Delaware Cancer Registry (DCR), geocoding software assigns the case to a census tract based on patient address at time of diagnosis. The accuracy of census tract assignment is entirely dependent on the accuracy and quality of patient address data. Several street address issues increase the likelihood of incorrect census tract assignment. For example, incorrectly spelled street names, multiple streets with

147
the same name, incorrect or missing directional street information (e.g., North vs. South), and recently created streets that are not yet embedded within the geocoding software may result in inaccurate census tract assignment. Cancer cases with non-physical addresses (e.g., rural route and P.O. Boxes) are also difficult to accurately assign to census tracts. Accurate census tract assignment is necessary for valid rate calculation at the census tract level. Therefore, prior to incidence rate calculation, the Delaware Division of Public Health (DPH) and the DCR conducted a multi-phase data validation process designed to verify that cancer cases had been accurately assigned to the census tract in which they were diagnosed. The geocoding validation process included all cancer cases diagnosed in Delaware in 2002-2006. The first phase involved a case-level quality review of street address data. DCR staff began by correcting obvious street misspellings. Next, using Accurint®, a Lexis Nexis® service, DCR staff assigned a valid physical street address to P.O. Box addresses where possible. DCR staff also used Accurint to assign a valid physical street address to rural addresses where possible. Next, DCR submitted a data file containing the remaining rural address cases to BCC Data Services. BCC Data Services utilized LACSLink software, which supports the conversion of rural addresses to street addresses. Using LACSLink, BCC Data Services successfully assigned valid physical street address data to an additional 66 cases with rural address data. The second phase of the validation process focused on improving the accuracy of existing census tract data. Although the majority of DCR records had previously been assigned to a census tract when they were originally submitted to the DCR, the original census tract variable was associated with a fair degree of unreliability. To facilitate review of census tract data, the DCR contracted with Tele Atlas, a provider of digital map services. Tele Atlas performed a thorough check of the entire 2000-2006 cancer data file. Census tract data were corrected for N=3,950 cases that had previously been assigned to an incorrect census tract. Following receipt of the appended data file from Tele Atlas, the DCR conducted a final quality review of the file and updated their files accordingly. Preliminary Analyses Preliminary analyses were performed on one raw data file created for DPH by the DCR; the file included all cancer cases diagnosed in Delaware between January 1, 2002 and December 31, 2006 (N=24,854). Per reporting guidelines mandated by the Surveillance, Epidemiology, and End Results (SEER) Program of the National Cancer Institute, cancer incidence rates exclude benign tumors, non-urinary bladder in situ tumors, and basal and squamous cell cancers. However, state cancer registries may still collect data on these tumors for tracking purposes. Therefore, the raw data file was analyzed to identify cases belonging to one of these categories. A total of 2,094 cases of benign tumors, non-urinary bladder in situ tumors, and basal and squamous cell cancers were eliminated from the file. Cases involving malignant tumors, as well as cases involving tumors with an unknown behavior code, were retained for further analyses. The remaining 22,760 records were sorted by the variable “census tract certainty” (CTC). CTC codes are assigned using the following scale:
1 = Census tract assignment was based on complete and valid physical street address 2 = Census tract assignment was based on residence ZIP + 4 3 = Census tract assignment was based on residence ZIP + 2 4 = Census tract assignment was based on residence ZIP code only
Because they were assigned to a census tract based on complete street address data, cases with CTC=1 were considered to have the most accurate census tract data. Alternately, cases with a CTC > 1 were assigned to a census tract using the best available address data. If a physical street address was not available, the case was assigned to a census tract using a variation of the 5-digit ZIP code data. Cases with CTC=2 were considered to have the second-most accurate census tract data because census tract assignment was based on the extended ZIP + 4 code; this code provided a more precise geographic location than did the 5-digit ZIP code alone. Correspondingly, cases with CTC=3 or 4 were considered to have comparatively less accurate census tract data as census tract assignment was based on less specific variations of ZIP code data (ZIP+2 and ZIP code only, respectively).

148
A total of 707 cases had a CTC value > 1; these cases were pulled for individual review by DPH epidemiologists. Using publicly-available online map tools (e.g., Google Maps, MapQuest, and American Fact Finder (a service of the United States Census Bureau)), DPH epidemiologists re-assigned 55 of the 707 cases to a valid census tract; the CTC codes for these 55 cases were changed to 1 in the master data file. For another 53 cases, DPH epidemiologists confirmed the initial census tract assignment as accurate; the CTC codes for these cases were also changed to “1” in the master data file. The remaining 599 records with CTC > 1 had incomplete or ambiguous address data, including P.O. Boxes, rural addresses, or unmappable street addresses. These 599 cases could not be accurately assigned to the census tract in which they were diagnosed; therefore, these cases were excluded from rate calculations at the census tract level. However, these 599 cases were retained for rate calculation at the state level. Table 1, below, shows the distribution of excluded cancer cases, by county of diagnosis. Table 1: Excluded Cancer Cases, by County of Diagnosis County Number of Cases
Excluded New Castle 71 Kent 57 Sussex 471
Total 599 Note that Sussex County was disproportionately represented in the 599 cases excluded from census tract analyses. As a result, 2002-2006 incidence rates for Sussex County census tracts are suppressed to a greater extent than are incidence rates for census tracts in New Castle and Kent Counties. In the future, fewer cases will be excluded from rate calculations due to unmappable street addresses. The DCR has developed new protocol to ensure that when cases with P.O. Box and rural addresses are first reported to the registry, they are immediately flagged for additional follow-up and supplementation with physical address data. Calculating Five-Year Population Estimates, by Census Tract Delaware is subdivided into 197 census tracts. Note that census tracts do not follow a consecutive numbering scheme. New Castle County includes tracts 1.00 through 169.02. Kent County is comprised of tracts 401.00 through 431.00, and Sussex County includes tracts 501.01 through 519.00.
Census tract populations were calculated using estimates from the Delaware Population Consortium (DPC) and the 2000 Census. DPC census tract population estimates were available for all years 2002 through 2006. DPH staff used 2000 Census data to calculate the proportion that each 5-year age group contributed to the overall census tract population. These proportions were applied to DPC-based census tract estimates to yield annual population estimates by census tract, broken down by 5-year age groups. DPH staff repeated this process for male and female populations to obtain gender-specific 2002-2006 population estimates by 5-year age groups for each census tract.
Denominators for years 2002 through 2006 were summed to obtain the 2002-2006 population for each census tract. Five-year (2002-2006) population estimates ranged in size from 3,132 for Census Tract 10 to 65,136 for Census Tract 148.06. Both of these census tracts are located in New Castle County. Calculating Age-Adjusted Incidence Rates, by Census Tract
Census tract-level incidence rates were calculated from a modified dataset including N=22,161 cases diagnosed between 2002 and 20061. Within the cancer data file, cross-tabulations (age group x census tract) were performed to determine the number of cancer cases diagnosed by census tract and the age groups in which they were diagnosed. These frequencies were used to calculate crude and age-adjusted incidence rates at the census tract level. Crude incidence rates represent the total number of new cancer diagnoses divided by the total population at risk, without consideration of any demographic characteristics of the population. Age-adjusted incidence rates take
1 The modified sample size reflected the N=599 cases that were eliminated from census tract-level analyses because they could not accurately be assigned to the census tract in which they were diagnosed.

149
into account the age distribution of the population at risk; age-adjusted incidence rates are useful for comparing rates between two populations that differ in age composition.
To calculate crude incidence rates, the number of cancer cases diagnosed in a particular age group in a particular census tract was divided by the population size for that specific cohort; these values were then multiplied by 100,000 (see Equation 1). To determine the 2002-2002 crude incidence rate for an entire census tract, the number of cancer cases diagnosed in a census tract over the 5-year period was divided by the total population of the census tract for the same 5-year period, and this value was multiplied by 100,000.
Equation 1: 2002-2002 Crude All Site Incidence Rate, 40-44 year olds, Census Tract 425.00
( )( )
( )( ) 100,000per167.3100,0001195
200.425TCinoldsyear4440,population20062002
00.425TCinoldsyear4440among2006)(2002casescancerNo.=×=
−−−−
To calculate age-adjusted incidence rates, crude incidence rates for each age group were multiplied by the appropriate 2000 U.S. Standard Million Population weight2. Table 2 displays the U.S. Standard Million population weights, by age group. Age-adjusted incidence rates for each of the 18 age groups were summed to yield the age-adjusted incidence rate for an entire census tract. Table 2: U.S. Standard Million Population Weights, by Age Group Age Group U.S. Standard Million
Population Weight 0-4 yrs 0.0691 5-9 yrs 0.0725 10-14 yrs 0.0730 15-19 yrs 0.0722 20-24 yrs 0.0665 25-29 yrs 0.0645 30-34 yrs 0.0710 35-39 yrs 0.0808 40-44 yrs 0.0819 45-49 yrs 0.0721 50-54 yrs 0.0627 55-59 yrs 0.0485 60-64 yrs 0.0388 65-69 yrs 0.0343 70-74 yrs 0.0318 75-79 yrs 0.0270 80-84 yrs 0.0178 85+ yrs 0.0155 Source: Centers for Disease Control and Prevention, National Center for Health Statistics Calculating the Age-Adjusted Incidence Rate for the State of Delaware
The average annual age-adjusted cancer incidence rate for the state of Delaware was calculated from the full dataset including N=22,161 cases diagnosed between 2002 and 2006. Cross-tabulations (age group x census tract) were performed to determine the number of cancer cases diagnosed in the state and the age groups in which they were diagnosed. Using the process described above, frequencies were used to calculate crude and age-adjusted incidence rates at the state level. Calculating 95% Confidence Intervals Confidence intervals represent the range of values in which the cancer rate could reasonably fall. Our best estimate of the cancer rate in a particular census tract is the incidence rate, itself. However, the rate could reasonably lie anywhere between the lower confidence limit (LCL) and the upper confidence limit (UCL). Because 2 Published by the Centers of Disease Control and Prevention and the National Center for Health Statistics.

150
of this, a confidence interval is sometimes called the “margin of error.” Confidence intervals were calculated for all census tract-level incidence rates, as well as for the state incidence rate. When incidence rates were based on more than 100 cases, 95% confidence intervals were calculated using the following formulas:
( )⎟⎟
⎠
⎞
⎜⎜
⎝
⎛−=
Cases#RateAA1.96RateAALimitConfidenceLower
( )⎟⎟
⎠
⎞
⎜⎜
⎝
⎛+=
Cases#RateAA1.96RateAALimitConfidenceUpper ,
where AA Rate = the age-adjusted incidence rate for a particular census tract. When incidence rates were based on fewer than 100 cases, 95% confidence intervals were calculated using the following formulas:
LxRateAAimitLConfidenceLower =
UxRateAAimitLConfidenceUpper = , where AA Rate = the age-adjusted incidence rate for a particular census tract, and L and U = values published by the National Center for Health Statistics for the specific purpose of calculating 95% confidence intervals for rates computed from fewer than 100 cases3. Comparing Census Tract Rates to the State Rate The level of uncertainty associated with an incidence rate is reflected in the width of its confidence interval. Very wide confidence intervals mean that the incidence rate is estimated with a large degree of uncertainty. The width of a confidence interval is influenced by two factors: (a) the number of cancer cases in the population under consideration and (b) the size of the population under consideration. When a cancer rate is calculated for a small population in which only a handful of cases were diagnosed, we would expect the confidence interval for the rate will be very wide. On the other hand, when a cancer rate is calculated for a very large population in which many cases were diagnosed, we would expect the confidence interval for the rate will be very narrow. The width of a confidence interval is important because it is used to determine if the amount by which two incidence rates differ is statistically significant. If the confidence interval for the incidence rate in one area overlaps with the confidence interval for an incidence rate in another area, the rates are not significantly different from one another. Researchers interpret a non-significant difference as “no meaningful difference” between rates. Even though the two rates may look very different, if the cancer rate for one area is NOT significantly different from the cancer rate for another area, researchers cannot say that one rate is truly different from the other rate. On the other hand, if the confidence interval for the incidence rate in one area does NOT overlap with the confidence interval for an incidence rate in another area, the two rates are significantly different. When the rate for one area is significantly different from the rate for another area, the difference between the rates is larger than would be expected by chance alone. DPH compared the all-site incidence rate for each census tract to the all-site incidence rate for the state of Delaware. This allowed DPH to identify any census tracts with incidence rates that are higher or lower than the incidence rate for Delaware as a whole. If the confidence interval for a census tract incidence rate overlapped with the confidence interval for the state incidence rate, the census tract rate was not significantly different from the state rate. If the confidence interval for a census tract rate did not overlap with the confidence interval for the state
3 Martin JA, Hamilton BE, Ventura SJ, Menacker F, Park MM, Sutton PD. Births: Final data for 2001. National vital statistics reports; vol 51 no. 2. Hyattsville, Maryland: National Center for Health Statistics. 2002.

151
rate, the census tract rate was significantly different from the state rate. Census tracts with significantly higher or lower cancer rates compared to the state are denoted in the rate table and all color-coded maps. Supplemental Information Incidence rates for nine census tracts were based on fewer than 25 cases. When incidence rates are computed for an entire geographic area based on a very small number of cases, rates are estimated with a larger degree of uncertainty. This uncertainty is represented by a very wide confidence interval. When confidence intervals are wide, they are more likely to overlap with the confidence intervals of incidence rates from other areas; this means that it is more difficult to establish a significant difference between incidence rates. For this reason, rates based on fewer than 25 cases should especially be interpreted with caution. To assist interpretation, incidence rates calculated from fewer than 25 cases are denoted in both the rate table and color-coded maps.
APPENDIX H INTERPRETING CANCER RATES BY CENSUS TRACT
In brief: • Cancer rates in census tracts will change year to year because of the small population in those census tracts.
For this reason, the rates are uncertain, subject to fluctuation and difficult to interpret. • To help understand how much confidence we should have in a cancer rate for a census tract we calculated a
confidence interval. This is a standard statistical method. • Only if the confidence intervals of the cancer rate in a census tract and the state as a whole do not overlap, can
we say that there is enough confidence to call the rate in the census tract significantly different from the state. • We have provided a table that shows the confidence interval for the cancer rate in each census tract and for the
state as a whole. You should look at that table to determine if the rate in a particular census tract is significantly different from the state.

152
Analysis of disease rates for small areas, such as census tracts, is difficult to interpret and can be misleading if not considered carefully. The following information is presented to help interpret the information on “Cancer Rates by Census Tract.” To understand cancer in Delaware, researchers need to track the number of all newly diagnosed cancer cases each year. Researchers use different types of information to calculate cancer rates. This information includes estimates of the number of people living in Delaware and data on the cancer cases diagnosed in our state. Even though researchers calculate cancer rates using the best possible information, cancer rates still have some amount of uncertainty. The rate of any disease in a population provides a snapshot of the impact of that disease for a specific time period. Because Delaware is a small state, we have a special problem when we try to interpret this snapshot. In a small group, such as a census tract, the snapshot changes a lot from year to year. If one case of cancer is diagnosed in a census tract one year, and three cases of cancer are diagnosed in the same census tract the next year, the cancer rate for that census tract will change dramatically from one year to the next. These big fluctuations do not typically occur in larger populations. If we compare the cancer rate for a census tract to the cancer rate for the whole state of Delaware for a given year, it would not be unusual to find the comparison different (perhaps even reversed) the following year. In Delaware, we publish 5-year cancer rates (for example, 2001-2005) to allow for better understanding of cancer patterns among small populations. Cancer rates for 5-year time periods are less vulnerable to the yearly fluctuations of cancer cases diagnosed in small populations. We can tell how much uncertainty there is in cancer rate by looking at its confidence interval. A confidence interval is a range of values that shows where the cancer rate could reasonably be. This means that the cancer rate could be anywhere between the lower confidence limit and the upper confidence limit. If the difference between the upper confidence limit and lower confidence limit is big, there is a lot of uncertainty in the cancer rate. If the difference between the upper confidence limit and lower confidence limit is very small, there is not much uncertainty in the cancer rate at all. The width of a confidence interval depends on two things: (a) the number of people living in that area and (b) the number of cancer cases diagnosed in that area. When a cancer rate is calculated for a small area (like a census tract or a neighborhood block), usually a small number of people live in that area. An even smaller number of people in that area will have been diagnosed with cancer. When a cancer rate is calculated for a small area, the cancer rate has a lot of uncertainty because researchers do not have very much information to work with. Cancer rates for small areas will probably have very wide confidence intervals. On the other hand, when a cancer rate is calculated for a very large area (like a state or a country), many people live in that area. The odds are that in such a large area, more people will have been diagnosed with cancer compared to a smaller area. When a cancer rate is calculated for a large area, researchers are more certain of the level of cancer in that area. This means that cancer rates for large areas will usually have very narrow confidence intervals. Confidence intervals are important for another reason, too. They help researchers figure out if differences in cancer rates for two different areas are statistically significant. If the confidence interval for the incidence rate in one area does NOT overlap with the confidence interval for an incidence rate in another area, the two rates are significantly different. The figure below shows what non-overlapping confidence intervals look like. If “Rate 1” is significantly higher than “Rate 2,” the lower confidence limit for “Rate 1” is greater than the upper confidence limit for “Rate 2”. When one rate is significantly different from another rate, the difference between the two rates is larger than we would expect by chance alone.

153
On the other hand, if the confidence interval for the incidence rate in one area overlaps with the confidence interval for an incidence rate in another area, the two rates are NOT significantly different. The figure below shows how the confidence intervals look when the cancer rates for two areas are NOT significantly different from one another.
If “Rate 1” is NOT significantly greater than “Rate 2”, the lower confidence limit for “Rate 1” is less than the upper confidence limit for “Rate 2”. Even though the numbers may look very different, if the cancer rate for one area is not significantly different from the cancer rate for another area, researchers cannot say that one rate is truly different from the other rate. DPH compared cancer rates for census tracts to the cancer rate for the state of Delaware. This means that we were able to tell if any census tracts had a higher-than-expected or lower-than-expected overall cancer rate compared to the whole state. To help you interpret the cancer rates for any census tract, we are providing maps, plus a table that lists the actual rate and the confidence intervals for both the state as a whole and for each census tract. When you look at the cancer rate for your census tract, it is important to look at the confidence interval. If a cancer rate has a very wide confidence interval, the cancer rate has a lot of uncertainty. When cancer rates have a lot of uncertainty, you should draw conclusions cautiously, keeping in mind that even our best guess may over-estimate or under-estimate the actual rate of cancer in a census tract.

154
APPENDIX I 2002-2006 CANCER INCIDENCE RATES BY CENSUS TRACT
Yellow = Incidence rate is significantly higher than the state rate. Blue = Incidence rate is significantly lower than the state rate. ∗ = Incidence rate is based on fewer than 25 cases.
Delaware 2002 – 2006 Average Annual Age-Adjusted
All Site Cancer Incidence Rates, by Census Tract Census Tract 2002-2006 Average Annual Age-
Adjusted All-Site Incidence Rate Lower Confidence Limit Upper Confidence Limit
1.00* 542.3 331.3 837.5 2.00 552.6 461.1 644.2 3.00 503.2 386.7 643.8 4.00 611.0 498.8 723.1 5.00 564.1 441.3 730.6 6.01 566.3 434.1 725.9 6.02 725.4 595.6 855.2 7.00* 656.5 358.9 1101.5 8.00* 267.0 138.0 466.4 9.00 617.6 448.7 829.0 10.00* 505.0 268.9 863.5 11.00 268.3 222.0 314.6 12.00 317.8 224.9 436.2 13.00 368.9 305.0 432.8 14.00 437.9 345.6 547.3 15.00 504.4 396.1 633.2 16.00 515.5 378.8 685.5 17.00 527.7 423.2 632.2 19.00 574.4 387.5 819.9 20.00* 538.6 294.4 903.7 21.00 592.7 442.6 777.2 22.00 571.2 415.0 766.8 23.00 619.0 471.2 798.4 24.00 455.7 373.8 537.6 25.00 599.0 485.2 731.5 26.00 581.0 466.0 715.8 27.00 515.3 352.5 727.5 101.01 476.4 383.0 569.7 101.02 507.0 405.0 626.9 102.00 671.6 513.7 862.7 103.00 602.8 489.9 733.9 104.00 534.9 439.6 630.2 105.00 499.1 423.6 574.6 107.00 580.5 480.7 680.3 108.00 444.8 374.0 515.5 109.00 435.2 347.1 538.8 110.00 591.5 486.6 696.5 111.00 503.4 406.2 600.7

155
112.01 619.2 474.8 793.8 112.02 706.8 579.8 833.8 112.03 622.3 515.4 729.3 112.04 529.3 432.2 626.5 112.05 755.2 597.9 941.2 112.06 589.6 499.7 679.6 113.00 453.3 365.0 556.6 114.00 481.8 399.6 564.0 115.00 524.9 423.2 643.8 116.00 515.4 423.6 607.2 117.00 509.3 432.9 585.6 118.00 387.9 325.2 450.6 119.00 385.4 319.4 451.4 120.00 604.0 508.9 699.1 121.00 486.2 388.3 601.1 122.00 670.4 556.9 783.9 123.00 485.5 369.6 626.2 124.00 529.9 433.9 626.0 125.00 594.3 503.6 685.0 126.00 481.9 384.9 595.9 127.00 651.0 557.9 744.0 129.00 560.1 460.3 659.9 130.00 608.0 472.1 770.8 131.00 703.7 565.8 864.9 132.00 525.8 407.5 667.7 133.00 579.2 457.8 722.9 134.00 481.3 380.5 600.7 135.01 445.2 391.7 498.6 135.03 662.0 569.8 754.2 135.04 740.4 633.4 847.4 136.04 566.3 461.4 671.2 136.07 496.1 419.5 572.7 136.08 604.6 450.2 795.0 136.09 453.6 392.6 514.7 136.10 553.3 456.3 650.3 136.11 461.4 376.0 546.9 136.12 584.1 484.5 683.8 136.13 615.9 517.3 714.4 137.00 611.7 493.7 749.4 138.00 436.2 357.1 515.2 139.01 673.8 541.1 829.2 139.02 846.0 724.1 967.9 140.00 738.3 608.4 868.3

156
141.00 610.7 500.5 720.9 142.00 440.7 321.4 589.7 143.00 455.0 377.6 532.3 144.02 429.2 338.2 537.3 144.03 432.0 338.6 543.2 144.04 491.2 393.9 605.1 145.01 421.5 284.4 601.7 145.02* 305.8 174.8 496.7 147.02 585.3 438.4 765.6 147.03 451.5 371.7 531.3 147.05 600.1 501.7 698.5 147.06 668.4 465.6 929.6 148.03 534.5 438.8 630.1 148.05 652.6 538.7 766.6 148.06 776.7 683.0 870.4 148.07 701.7 575.1 828.3 148.08 480.6 386.4 574.7 149.02 749.6 633.1 866.1 149.03 857.6 691.3 1051.8 149.04 545.6 442.2 649.0 149.05 540.3 454.2 626.5 150.00 604.3 496.6 711.9 151.00 565.3 468.5 662.1 152.00 634.4 535.8 733.0 154.00 614.7 498.5 749.9 155.00 577.8 452.9 726.5 156.00 674.9 537.5 836.6 158.00 669.5 510.9 861.8 159.00 687.6 559.7 815.5 160.00 864.4 700.9 1054.5 161.00 429.0 332.5 544.8 162.00 590.2 466.6 736.6 163.01 661.6 540.7 782.5 163.02 642.6 521.4 763.8 163.03 526.5 439.2 613.7 164.01 618.7 498.7 758.8 164.02 642.9 514.9 793.0 166.01 638.8 546.0 731.6 166.02 456.9 369.5 544.3 166.03 599.6 482.7 736.1 166.04 793.6 665.3 921.9 168.01 314.6 247.9 393.8 168.02 600.4 478.9 743.3

157
169.01 648.4 512.6 809.3 169.02 759.2 597.2 951.7 401.00 647.3 546.0 748.5 402.01 603.1 486.1 720.2 402.02 520.0 452.2 587.8 402.03 466.1 370.7 578.5 404.00 343.6 222.4 507.3 405.00 655.0 561.4 748.6 406.00* 171.0 103.0 267.1 407.00 522.9 430.5 615.3 408.00 439.8 359.4 520.2 409.00 300.3 240.2 370.9 410.00 515.6 424.9 606.4 411.00* 126.6 50.9 260.9 412.00 659.5 530.4 810.7 413.00 363.5 262.0 491.4 414.00 378.4 291.4 483.2 415.00 578.1 478.3 677.8 416.00 510.5 406.0 633.6 417.01 749.7 628.9 870.5 417.02 801.6 650.4 952.7 418.01 608.5 524.1 692.8 418.02 817.5 647.2 1018.9 419.00 621.3 512.4 730.2 420.00 581.4 452.3 735.7 421.00 504.4 405.1 620.7 422.01 691.7 574.6 808.8 422.02 593.3 498.3 688.2 424.00 510.2 407.0 631.7 425.00 420.6 327.9 531.4 426.00 435.4 337.4 553.0 427.00* 267.0 163.1 412.4 428.00 680.9 582.0 779.9 429.00 688.5 567.8 809.2 430.00 538.9 447.3 630.5 431.00 576.1 450.0 726.7 501.01 478.9 388.8 583.6 501.02 514.1 449.8 578.3 501.03 495.6 399.0 592.3 502.00 582.4 454.9 734.6 503.01 463.0 390.6 535.4 503.02 655.4 534.5 776.2 504.01 465.3 366.0 583.3

158
504.02 500.4 444.5 556.3 504.03 676.7 541.3 835.8 504.04 511.3 439.6 583.1 505.01 380.1 303.6 470.0 505.02 410.9 352.0 469.8 506.01 536.0 429.3 661.1 506.02 540.0 455.6 624.5 507.01 492.2 397.7 602.3 507.02 500.9 456.8 545.0 508.01 462.4 366.7 575.6 508.02 606.1 499.4 712.8 508.03 539.8 467.8 611.8 509.00 463.7 407.4 519.9 510.01 717.3 638.1 796.6 510.02 584.6 516.0 653.2 510.03 725.5 607.0 844.0 511.00 259.2 212.0 306.4 512.00 312.5 268.4 356.6 513.01 447.9 380.7 515.0 513.02 303.4 226.6 397.9 513.03 491.2 410.7 571.7 513.04 449.9 386.6 513.2 514.00 362.4 270.7 475.3 515.00 387.0 309.9 477.3 517.01 725.7 594.8 856.7 517.02 523.5 432.8 614.2 518.01 572.5 473.3 671.6 518.02 567.3 464.9 669.6 519.00 472.6 385.1 560.2 State of 507.0 500.4 513.6

159
APPENDIX J
MAPS OF 2002-2006 CANCER RATES BY CENSUS TRACT, COLOR CODED BY INCIDENCE RATE QUINTILES

160

161

162

163

164

165

166

167

168

169
APPENDIX K
MAPS OF 2002-2006 CANCER RATES BY CENSUS TRACT, COLOR CODED BY SIGNIFICANTLY HIGHER AND LOWER RATES COMPARED
TO STATE AVERAGE RATE

170

171

172

173

174

175

176

177

178
For questions or comments related to this report, please contact the Division of Public Health at the following address:
Delaware Health and Social Services Division of Public Health 540 S. DuPont Highway Dover, DE 19901 Phone: 302-744-1040 Fax: 302-739-2545 http://www.dhss.delaware.gov/dhss/dph/index.html
Copyright © 2022 FDOKUMEN