Limited Lay Administration of Medications (LLAM) - Delaware ...
Upload
khangminh22Category
view
1download
0
Agricultural Energy Management Plan
John Doe Any Farm
1234 Any Road, Anytown, DE
XXXXX Any County
XXX-XXX-XXXX UTM Coords.: XXS XXXXXX.XXXXXXXXXXX.XX
Enterprise: Poultry
Acres: 36 Site Visit: Friday, June 5, 2020
Data Collector: Getda Info Plan Delivered: Friday, July 24, 2020
Report Prepared by: Chantal L. Beliveau, P.E. Senior Engineer EnSave, Inc. 65 Millett St. Suite 105 Richmond, VT 05477 Direct: 802-434-1838 Email: [email protected]
Technical Service Provider TSP-B-09-845
65 Millet Street, Suite 105, Richmond, VT 05477 (800) 732-1399
I, Chantal L. Beliveau, P.E. TSP #17-21940, as the Certified Technical Service Provider employed under TSP Business EnSave, Inc., TSP# B-09-845, have reviewed this Plan and certify that it meets all applicable requirements according to NRCS Standards and Specifications.
I confirm that this Plan correctly lists the farm identifying information, addresses the primary farm enterprise under my control, adequately represents the baseline conditions of the farm enterprise, adequately represents the concerns and objectives, and that I have received a final copy of the Plan.
I have administratively reviewed this Agricultural Energy Management Plan, and the Plan meets all criteria of Conservation Activity Plan 128.
Reviewed by: NRCS Acceptance: (John Doe/ date) ([NRCS REP]/ date)
Field Code Changed

Thursday, July 23, 2020
John Doe Any Farm 1234 Any Road, Anytown, DE XXXXX
Dear Mr. Doe,
Enclosed is your completed Agricultural Energy Management Plan (plan). This plan has been developed in accordance with Conservation Activity Plan Code 128 (CAP 128) of the U.S. Department of Agriculture's Natural Resources Conservation Service (USDA NRCS).
This plan is organized into several sections. The first section summarizes the overall energy savings recommendations. The second section provides background and site information. The third section contains an overview of the current energy use based on 12 months of usage. The fourth section provides a description of the current equipment evaluated and recommendations for energy efficiency.
CAP 128 requires a discussion of all energy-using equipment at the facility, even if no cost-effective recommendations are found, therefore, your plan may contain details about systems analyzed that did not result in energy savings opportunities. Finally, this plan includes information sheets with more detail about calculations, equipment, and recommended technologies, as well as links to various internet resources about funding sources.
This plan will help you determine the best way for you to increase your facility’s energy efficiency and reduce your energy costs. Even if you are not able to implement all the recommendations immediately, this plan will serve as a guide for future decisions and improvements. Before moving forward with any recommendations, we encourage you to contact us regarding eligibility for various state, federal, and utility funding opportunities. More information about these opportunities is included in the Quick Start Guide to Saving Money on your Energy Projects flyer included with this audit.
To determine eligibility for funding available through the NRCS Environmental Quality Incentives Program (EQIP), you may contact your local USDA NRCS office (Georgetown Service Center at 302-856-3990).
On behalf of all of us at EnSave we want to thank you for the opportunity to help you evaluate your facility’s energy use and energy saving opportunities. We will be calling you in a few weeks to discuss the plan with you. In the meantime, please feel free to contact me if you have any questions.
Sincerely,
Chantal L. Beliveau, P.E. Senior Engineer EnSave Direct: (802) 434-1838 Email: [email protected]
65 Millet Street, Suite 105 • Richmond, Vermont 05477 • Phone 800 . 732 . 1399 • Fax 802 . 434 . 7011 • www. ensave. com

i
TABLE OF CONTENTS 1 Summary Report of Energy Practices ................................................................................................ 1 1.1 Summary of Recommendations .............................................................................................................. 1 2 Background and Site Information ..................................................................................................... 4 2.1 Facility Description .................................................................................................................................. 4 2.2 Facility Location ...................................................................................................................................... 5 3 Baseline Energy Use ........................................................................................................................ 6 3.1 Electricity Use .......................................................................................................................................... 6 3.2 Propane Use ............................................................................................................................................ 8 3.3 On-Site Energy Generation ..................................................................................................................... 9 4 Current Equipment and Recommended Energy Improvements ....................................................... 10 4.1 Lighting .................................................................................................................................................. 10 4.1.1 Poultry House Lighting ....................................................................................................................... 10 4.1.2 General Lighting ................................................................................................................................. 11 4.2 Ventilation ............................................................................................................................................. 13 4.3 Refrigeration ......................................................................................................................................... 14 4.4 Controllers............................................................................................................................................. 14 4.5 Other Motors and Pumps ...................................................................................................................... 15 4.6 Water Heating ....................................................................................................................................... 16 4.7 Air Heating and Building Environment .................................................................................................. 16 4.7.1 Animal Housing .................................................................................................................................. 16 4.7.2 House Wall Insulation ........................................................................................................................ 17 4.7.3 House Ceiling Insulation ..................................................................................................................... 17 4.7.4 Insulated Tunnel Doors ...................................................................................................................... 17 4.7.5 Insulated Fan Covers .......................................................................................................................... 18 4.7.6 Insulated End Wall Doors ................................................................................................................... 18 4.7.7 Insulated Brood Curtains ................................................................................................................... 18 4.7.8 Seal Air Leaks ...................................................................................................................................... 18 4.7.9 Heaters ............................................................................................................................................... 19 4.7.10 Ceiling Stir Fans ................................................................................................................................ 19 4.7.11 Actuated Attic Inlets......................................................................................................................... 19 4.7.12 Vent Box Doors ................................................................................................................................ 20 4.7.13 Air Heating and Building Environment Summary ............................................................................ 20 4.8 Drying .................................................................................................................................................... 21 4.9 Waste Handling ..................................................................................................................................... 21 4.10 Air Cooling ........................................................................................................................................... 21 4.11 Crop/Feed Storage .............................................................................................................................. 21 4.12 Water Management ............................................................................................................................ 21 4.13 Material Handling ............................................................................................................................... 22 5 Energy Pyramid ............................................................................................................................. 23 6 Statements and Disclaimers ........................................................................................................... 24 6.1 Liability .................................................................................................................................................. 24 6.2 Vendor Neutrality ................................................................................................................................. 24 7 Appendix A: Resources .................................................................................................................. 25 7.1 Funding Sources .................................................................................................................................... 25 7.2 Energy Information ............................................................................................................................... 25 7.3 Equipment and Productivity Attachments ............................................................................................ 27

ii
7.4 Equipment Product Data Sheets for Recommended Measures-Attachments ..................................... 27 8 Appendix B: Minimum Standard Recommendations ....................................................................... 28 9 Appendix C: Calculations ............................................................................................................... 29 9.1 Basics ..................................................................................................................................................... 29 9.1.1 Annual Run Hours .............................................................................................................................. 29 9.1.2 Btu Conversion Factors ...................................................................................................................... 29 9.1.3 Area Calculations ............................................................................................................................... 29 9.1.4 R-Value Calculations .......................................................................................................................... 31 9.2 Lighting Calculations ............................................................................................................................. 31 9.3 Ventilation Calculations ........................................................................................................................ 32 9.4 Controller Calculations .......................................................................................................................... 33 9.5 Other Motors and Pumps Calculations ................................................................................................. 34 9.6 Air Heating and Building Environment Calculations ............................................................................. 35 9.6.1 Attic Inlets .......................................................................................................................................... 36 9.6.2 Stir Fans .............................................................................................................................................. 37 9.6.3 Sealing Air Leaks ................................................................................................................................. 38 9.6.4 Walls, Ceilings, Doors, Brood Curtains, etc. ....................................................................................... 38 9.6.5 Heaters ............................................................................................................................................... 41 10 Appendix D: Details ..................................................................................................................... 43 10.1 Lighting Details .................................................................................................................................... 43 10.2 Ventilation Details ............................................................................................................................... 45 10.3 Building Environment R-Value Details ................................................................................................ 46 11 Appendix E: Estimated Annual Energy Efficiency Improvements ................................................... 47
LIST OF TABLES Table 1. Summary of Energy Efficiency Improvements ................................................................................. 1 Table BS.1. Total Days Animals in House / Group ......................................................................................... 4 Table EGEN.1. Current Generator Inventory ................................................................................................ 9 Table PL.1. Current Poultry House Lighting Inventory ................................................................................ 11 Table PL.2. Current Poultry House Lighting Adequacy Review ................................................................... 11 Table GL.1. Current General Lighting Inventory ......................................................................................... 12 Table GL.2. Current General Lighting Adequacy Review ............................................................................ 12 Table GL.3. General Lighting: Recommended Energy Saving Measures ..................................................... 12 Table GL.4. General Lighting: Evaluated Measures Not Recommended .................................................... 13 Table V.1. Current Exhaust Fan Inventory .................................................................................................. 13 Table V.2. Current Poultry Ventilation Adequacy Review ........................................................................... 13 Table V.3. Poultry Ventilation: Evaluated Measures Not Recommended .................................................. 14 Table OM.1. Current Other Motors and Pumps Inventory ......................................................................... 15 Table H.1. Heater Inventory ........................................................................................................................ 16 Table H.3. Other Equipment Table .............................................................................................................. 17 Table HS.1. Air Heating and Building Environment: Recommended Energy Saving Measures .................. 20 Table HS.2. Air Heating and Building Environment: Evaluated Measures Not Recommended .................. 21 Table LD.1. Poultry House Lighting Schedule .............................................................................................. 43 Table LD.2. Existing Poultry House Lighting Adequacy and Coefficients .................................................... 43 Table LD.3. Existing General Lighting Adequacy and Coefficients .............................................................. 43 Table LD.4 Evaluated General Lighting Adequacy and Coefficients ............................................................ 44 Table VD.1. Ventilation Adequacy .............................................................................................................. 45

iii
Table A.1. Detail Listing of Recommended Annual Energy Efficiency Improvements ................................ 47
LIST OF FIGURES Figure BS.2. Overall Site Map ........................................................................................................................ 5 Figure BS.3. Location and Recommendation View ....................................................................................... 5 Figure EU.1. Twelve Month Electricity Use ................................................................................................... 6 Figure EU.2. Electricity Use Breakdown ........................................................................................................ 7 Figure EU.3. Comparison of Annual Current and Projected Electricity Use .................................................. 7 Figure PU.1. Twelve Month Propane Deliveries ........................................................................................... 8 Figure PU.2. Comparison of Annual Current and Projected Propane Use .................................................... 9 Figure EP.1. Energy Pyramid ....................................................................................................................... 23

1
1 Summary Report of Energy Practices
1.1 Summary of Recommendations This plan prioritizes the opportunities for Any Farm to improve its energy efficiency. Energy systems supporting the major activities at the facility were evaluated for adequacy relative to the Appendix of Minimum Standard Recommendations and operational needs. If the existing systems are deemed adequate, the energy and cost savings calculations are based on a "one-for-one" replacement. If the existing systems are below minimum standard recommendations the energy and cost savings calculations compare the existing system to a replacement system that would meet minimum standard recommendations and operational needs.
Integrator requirements specific to this farm are not included in this analysis unless specifically requested. Integrator standards that are widespread in use and are considered industry standards are included in this plan as a check for adequacy. If we used integrator preferences, it is noted in the specific section.
During our conversations, you expressed an interest in ceiling insulation and tunnel fan covers (bonnets or doors), and we included these measures in our evaluations for cost effective opportunities to improve energy efficiency. Efficiency measures were reviewed and those found to be cost effective can be found in Table 1. The recommendations identified are for ceiling insulation, light emitting diode (LED) bulbs, sealing air leaks, insulated brood curtains, insulated tunnel doors, and insulated exhaust fan covers. The total annual energy cost savings of the recommended energy efficient measures is approximately $13,657 and represents approximately 24% savings of the baseline annual energy costs of $56,592.
Tables 1 and 2 summarize the benefits for all recommended measures. See the appendices for a detailed listing of Resources, Minimum Standard Recommendations, Calculations, Details, and Estimated Annual Energy Efficiency Improvements.
Table 1. Summary of Energy Efficiency Improvements
Estimated Annual Reduction in Energy Use Estimated Costs, Savings, Payback, and Prioritization for Implementation
Map ID
Recommended Measure
Electric Savings (kWh)
Propane Savings (gal)
Energy Savings (MMBtu)
Installed Cost [a], $
Energy Cost Savings [b], $/yr.
Payback in Years [a / b],
yr.
Est. Life in Years
A Office Area Lights 68 0 0.23 $4 $8 0.5 10.0 B Houses 1-4 Security Lights 4,495 0 15.34 $938 $505 1.9 10.0 C Control Rooms 1-2 Lights 37 0 0.13 $8 $4 2.0 10.0 D Houses 1-4: Seal Air Leaks 0 2,136 195.08 $9,920 $2,910 3.4 10.0 E House 2 Security Light 166 0 0.57 $80 $19 4.2 10.0 F Generator Area Lights 27 0 0.09 $16 $3 5.3 10.0 G Houses 1-4: Brood Curtains 0 722 65.92 $9,538 $983 9.7 10.0 H Houses 1-4: Tunnel Intakes 0 2,369 216.39 $32,211 $3,228 10.0 20.0
I Houses 1-4: Ceiling Insulation 0 3,608 329.53 $67,061 $4,916 13.6 20.0
J
Houses 1-4: Exhaust Ventilation Fan Covers
(doors/bonnets)
0
817/635.6
74.63/58.05
$15,960/$1,680
$1,113/$866
14.3/1.9
20.0/5.0
Totals 4,793 9,652 897.91 $135,735 $13,690 9.9 N/A *Values for exhaust fan doors are used in the totals

2
Table 2. Estimated Annual Reduction of Emissions Environmental Benefits*
Greenhouse Gases Air Pollutant Co-Benefits Map
ID Recommended Measure Energy Savings (MMBtu)
Estimated CO2
(lbs) Estimated N2O (lbs)
Estimated CH4 (lbs)
Estimated SO2 (lbs)
Estimated NOx (lbs)
A Office Area Lights 0.23 58.37 <0.01 0.01 0.13 0.06 B Houses 1-4 Security Lights 15.34 3,833.49 0.05 0.34 8.75 3.80 C Control Rooms 1-2 Lights 0.13 31.43 <0.01 <0.01 0.07 0.03 D Houses 1-4: Seal Air Leaks 195.08 26,698.93 1.92 0.43 0.21 27.77 E House 2 Security Light 0.57 141.57 <0.01 0.01 0.32 0.14 F Generator Area Lights 0.09 22.71 <0.01 <0.01 0.05 0.02 G Houses 1-4: Brood Curtains 65.92 9,021.47 0.65 0.14 0.07 9.38 H Houses 1-4: Tunnel Intakes 216.39 29,615.69 2.13 0.47 0.24 30.80 I Houses 1-4: Ceiling Insulation 329.53 45,100.52 3.25 0.72 0.36 46.90
J **Houses 1-4: Exhaust Ventilation Fan Covers (doors/bonnets) 74.63/58.05 10,214.52/7,945 0.74/0.57 0.16/0.13 0.08/0.06 10.62/8.26
Totals 897.91 124,738.70 8.74 2.29 10.29 129.53 *Emissions information is based on the EIA E-Grid 2015 values
** Values for exhaust fan doors are used in the totals
The measures recommended are based on energy savings analyses, related energy cost savings, and the estimated cost to implement. Estimated costs to implement energy saving measures are based on market research and include labor, materials, and equipment, and are identified in each specific section. Market research includes averages of material costs sourced from research, averages of material and labor costs from estimates and invoices from installed efficiency upgrades, and discussions with contractors and equipment suppliers. Routine operation and maintenance of all equipment is necessary to ensure that efficiencies and adequacies are maintained over time.
Specifications of existing equipment are sourced from name plate information stamped or printed on the equipment or records of installation available at the location. We make reasonable efforts to obtain manufacturer and model names of current equipment; however, in certain cases this is not possible. If specifications are not available on the equipment due to age or wear and no other records are available, EnSave estimates the size and efficiency of the existing equipment based on accumulated knowledge and records from previous energy audits and from market research.
Information on operational schedules and run times is based on either information you provided or is estimated based on typical uses of similar facilities and equipment. Note that savings calculations are based on conditions at the time of the site visit. Changes to equipment or operations that may have occurred following the site visit are not reflected.
Recommended measures are listed in priority order based on the estimated payback period in years. The estimated payback period is equal to the estimated cost to install ($) divided by the estimated energy cost savings ($/year) and is expressed in years. When the payback period is less than or equal to the expected useful life (EUL) of the measure in years, the measure is recommended. This method does not account for more complex financial considerations such as loan interest and fees, tax rates, depreciation, or any other potential cost impacts.
The installation of some measures can affect the savings achievable by other measures. For instance, an increase in thermal insulation can decrease the savings achievable by installing more efficient heating

3
equipment and vice versa. Consequently, it is important to re-evaluate your overall savings potential once you have identified which measures you plan to install.
We were unable to obtain any information on any known health and safety, fire, or building code violations on your farm. A limited visual inspection for fire and safety code violations (only what can be seen) was performed during our site visit and none were identified. We recommend that you consult with a licensed electrician or code enforcement officer to properly evaluate your facility.
There may be other factors to consider when making decisions to implement recommended measures. These may include aspects such as equipment operational performance, equipment operation and maintenance costs, productivity, installation costs, and permitting, etc.
Any recommended equipment should be properly reviewed for site-specific needs, concerns, and applicability.

4
2 Background and Site Information
2.1 Facility Description EnSave conducted a site visit at Any Farm on Friday, June 5, 2020. This plan covers the major activities identified for your location and provides recommendations to increase your facility's energy efficiency.
Any Farm has opportunities for energy efficiency improvements. Existing energy efficient equipment at your facility includes radiant heaters, solid side walls, and LED lighting.
Poultry (Broilers) is the only enterprise at your location. Any Farm is approximately 12 years old and raises approximately 630,000 birds a year in 4 buildings on 36 acres. For a more in-depth description of the equipment and associated schedules for your facility, refer to Table BS.1 and the relevant sections throughout this report and appendices. Refer to Figures BS.2 and BS.3 for the orientation and the location of your facility in relation to nearby roads, towns, streams, etc.
Flocks of young birds are delivered to your poultry houses by the integrator. Lighting, feeding, and heating schedules are used to encourage growth and bird health. Ventilation is used to control temperature and air quality. The building envelope enables climate control within your facility. The lighting, ventilation, and heating systems work together using building automation controls to provide an optimum climate for bird growth.
You expressed an interest in ceiling insulation and exhaust fan covers during our conversations. Adding ceiling insulation and fan covers are evaluated in the Air Heating and Building Environment section of this report. Both measures have been recommended.
Table BS.1 provides general construction and schedule information for the facility.
Table BS.1. Total Days Animals in House / Group
House Group
# Houses
Length (ft)
Width (ft)
Year Built
Sidewall Type
Ceiling Type
Tunnel Ventilated
# Groups / Year
Target Animal
Weight (lb)
# Animals / Group / House
Total Days Animals in House
/ Group Houses
1-4 4 560 60 2008 Solid Dropped Yes 4.5 7 35,000 59

5
2.2 Facility Location Figure BS.2 provides an overall site location map and Figure BS.3 provides a labeled view of the location with map identifiers related to the recommendations from Tables 1 and 2.
Figure BS.2. Overall Site Map - [ REDACTED ]
Figure BS.3. Location and Recommendation View - [ REDACTED ]
* Approximate location ** No Energy use *** Not Evaluated as part of this plan.

6
3 Baseline Energy Use
An average electricity cost of $0.11 per kilowatt-hour (kWh) and an average cost of $1.36 per gallon (gal) of propane, were used in this analysis based on energy use records provided for the twelve-month period ending February 2020. If Any Farm’s actual costs are different from these documented values, the energy cost savings will vary accordingly.
All existing equipment specific information, including the amount of energy used for this analysis, determination of adequacy, the evaluated replacement equipment, and the recommendations are inventoried in the individual major activity sections.
3.1 Electricity Use During the twelve-month period evaluated, Any Farm used approximately 175,018 kWh of electricity. The total cost of electricity was $19,446. Any Farm is serviced by a single-phase power source.
The peak months typically coincide with hot weather and are the result of increased ventilation loads. Differences between electricity usage month-to-month can also be impacted by the downtime between flocks of birds.
Figure EU.1 summarizes electricity use from March 2019 through February 2020.
Figure EU.1. Twelve Month Electricity Use

7
The electricity use by measure is depicted in Figure EU.2.
Figure EU.2. Electricity Use Breakdown
The Miscellaneous electric use represents shop tools, electronics, and other miscellaneous consumption. A detailed listing of equipment associated with each category can be found in the relevant sections of this plan.
Figure EU.3 provides a comparison of the estimated current and projected energy use of all recommended measures.
Figure EU.3. Comparison of Annual Current and Projected Electricity Use

8
Your facility may also have opportunities to implement a demand management strategy by re-evaluating the schedule of operations of your facility and the time-of-use of your larger energy-using systems. Electricity service is often provided under electric tariffs that include charges for the peak electrical demand and/or that differentiate electricity prices based on time of use, or peak and off-peak hours during the billing period. If you are interested in exploring how to avoid additional utility charges please contact us for more information about both peak usage times, as well as energy demand, and any related charges.
3.2 Propane Use During the twelve-month period evaluated, Any Farm purchased approximately 27,260 gal of propane. The total cost of propane was $37,146. Monthly propane deliveries may not reflect actual monthly propane usage.
Propane is only used for Air Heating and Building Environment at this location. Therefore, the amount delivered for the year was allocated to the heating system of the houses.
Figure PU.1 summarizes propane delivered from March 2019 through February 2020.
Figure PU.1. Twelve Month Propane Deliveries

9
Figure PU.2 provides a comparison of the estimated current and potential energy use after the installation of all recommended measures.
Figure PU.2. Comparison of Annual Current and Projected Propane Use
3.3 On-Site Energy Generation Any Farm currently operates a diesel generator for back up and emergency purposes, which is only run otherwise for testing, upkeep, and maintenance. The generator serves as an emergency power supply and was not in operation for a significant time during the twelve-month period evaluated. The generator was not evaluated for energy saving opportunities due to low run-time. Energy generated by the on-site generator during the testing and upkeep and minimal power outage uses is not included in the overall electricity used in this analysis. Energy saving measures are calculated based on the purchased electricity cost only.
No concerns were identified in our conversations relating to the adequacy of the generator for Any Farm, and we typically assess for 20-25 kWh per poultry house for meeting the minimum adequacy. We encourage you to use proper O&M practices including periodic and scheduled maintenance to prevent unnecessary problems during power outages.
Table EGEN.1 contains the existing generator details.
Table EGEN.1. Current Generator Inventory
Description Manufacturer / Model Year Installed # Generators Resource Type Output (kW) Annual Run Time (Hours) Generator State line 2008 1 Diesel 200 52

10
4 Current Equipment and Recommended Energy Improvements
4.1 Lighting We evaluate replacing lighting systems with LED bulbs because they are significantly more efficient than other types of lighting and have been demonstrated effective in agricultural operations. Price decreases in recent years have made LEDs cost-effective replacements for most applications.
Fluorescent lights are regulated under the Resource Conservation and Recovery Act. It is illegal to dispose of these lights in the trash. Please contact your local waste district regarding the proper disposal of fluorescent lamps. Additional information is provided in the Appendix of Resources.
A lighting schedule was not available at your facility, therefore, savings calculations are based on a typical poultry lighting schedule for similar facilities in your area to determine the number of annual run hours for each light and existing versus recommended light wattages. The lighting schedule used can be found in the Appendix of Details.
When evaluating for light level adequacy in lux, the calculations include reductions for the lamp lumen depreciation (LLD), ballast factor (BF), luminaire dirt depreciation (LDD), and room surface dirt depreciation (RSDD) factors. The value also considers the coefficient of utilization (CU) which is determined by room void ratios and wall, floor, and ceiling reflectance factors. The initial light levels when installing brand new bulbs may be adequate but over time this will diminish.
The lumen output of existing bulbs is determined by the stamped ratings on the bulb or specifications sourced from the manufacturer. If neither source is available, they are determined by using typical lumen outputs for the given type and wattage of bulb using online research and research based on information gathered from previous EnSave energy audits and data collections. The details for adequacy determination can be found in the Appendix of Minimum Standard Recommendations.
In the sections and tables below, lm stands for lumens, CFL stands for compact fluorescent, HPS stands for high pressure sodium, INC stands for incandescent, and W stands for watts.
4.1.1 Poultry House Lighting When purchasing LED bulbs, it is recommended that you select models that have been designed for the poultry industry. Some considerations include selecting bulbs that have a color temperature in the range of 3,500-6,400 Kelvin and have been tested by an independent third party to perform well in poultry houses. We also recommend selecting bulbs that are fully dimmable, protect against the intrusion of dust and moisture, and come with a warranty (a three-year warranty is typical).

11
Table PL.1 provides the equipment inventory. Table PL.2 summarizes a review of the adequacy relative to applicable standards.
Table PL.1. Current Poultry House Lighting Inventory
Description
Manufacturer / Model
Total # Fixtures
All Locations
Fixture Type
# Bulbs / Fixture
Bulb Wattage
(W)
Lumens per Bulb
(lm)
Annual Run Time
(Hours)
Total Fixture
Wattage (W)
Est. Annual
Use (kWh)
Schedule
Houses 1-4 Brood Area Lights Overdrive/L10WA19Dlm/50k 120 LED 1 10 1,000 2,463 10 2,956 Brood
Houses 1-4 Brood Area Lights Overdrive/L10WA19Dlm/50k 60 LED 1 10 1,000 2,463 10 1,478 Brood
Houses 1-4 Non- Brood Area 1 Lights LED Lamp/YGA03A00 22 LED 1 10 900 1,635 10 360 Grow
Out 1 Houses 1-4 Non-
Brood Area 2 Lights LED Lamp/YGA03A00 22 LED 1 10 900 825 10 182 Grow Out 2
Houses 1-4 Non- Brood Area 1 Lights Overdrive/L10WA19Dlm/50k 19 LED 1 10 1,000 1,635 10 311 Grow
Out 1 Houses 1-4 Non-
Brood Area 2 Lights Overdrive/L10WA19Dlm/50k 19 LED 1 10 1,000 825 10 157 Grow Out 2
Houses 1-4 Non- Brood Area 1 Lights LED Lamp/YGA03A00 46 LED 1 10 900 1,635 10 752 Grow
Out 1 Houses 1-4 Non-
Brood Area 2 Lights LED Lamp/YGA03A00 46 LED 1 10 900 825 10 380 Grow Out 2
Houses 1-4 Non- Brood Area 1 Lights Overdrive/L10WA19Dlm/50k 38 LED 1 10 1,000 1,635 10 621 Grow
Out 1 Houses 1-4 Non-
Brood Area 2 Lights Overdrive/L10WA19Dlm/50k 38 LED 1 10 1,000 825 10 314 Grow Out 2
Table PL.2. Current Poultry House Lighting Adequacy Review
Description Min. Rec. Light Level (lux) Calculated Light Level (lux) Light Level Adequate? Houses 1-4 Brood Area Lights 30 13 No
Houses 1-4 Non-Brood Area 1 Lights 5 12 Yes Houses 1-4 Non-Brood Area 2 Lights 5 14 Yes
The existing LED lights listed in Table PL.1 are considered energy efficient and were not evaluated for replacement. The houses are equipped with Pro-Tech Inc. 2K Green Rimmir Dimmers which are considered efficient and were not evaluated for replacement.
Based on available information, the calculated illuminance of the existing lights does not meet the recommended minimum light level in the Brood areas of houses 1-4. These areas require either an increase in bulb count and/or bulbs with a higher wattage, which will increase electricity use. Thus, there are no energy efficiency recommendations. We suggest you discuss the minimum illuminance requirements with your integrator before making any changes.
4.1.2 General Lighting For exterior and linear fluorescent light evaluations, we include replacement of the entire fixture. This will ensure that the light will not fail prematurely due to degraded existing fixture components or compatibility issues.

12
The existing LED lights listed in Table GL.1 are considered energy efficient and were not evaluated for replacement. Table GL.1 provides the equipment inventory.
Table GL.1. Current General Lighting Inventory
Description
Manufacturer / Model
Total # Fixtures All Locations
Fixture
Type
# Bulbs /
Fixture
Bulb Wattage
(W)
Lumens per Bulb
(lm)
Annual Run Time (Hours)
Total Fixture
Wattage (W)
Est. Annual
Use (kWh)
Houses 1-4 Security Lights Not Available 7 HPS 1 150 15,000 4,368 188 5,748 House 2 Security Light Not Available 1 CFL 1 65 550 4,368 65 284
Manure Shed Light Not Available 1 HPS 1 150 15,000 210 188 39 Control Rooms 3-4 Lights Overdrive/L10WA19Dlm 4 LED 1 10 1,000 392 10 16 Control Rooms 1-2 Lights GE/Proline 2 INC 1 57 760 392 57 45 Control Rooms 1-2 Lights LED Lamp/YGA03A00 2 LED 1 10 900 392 10 8
Office Area Lights LED Lamp/YGA03A00 1 LED 1 10 900 1,456 10 15 Office Area Lights GE/Proline 1 INC 1 57 760 1,456 57 83
Generator Area Lights Harmony lighting/SSS42-30 4 CFL 1 42 2,650 208 42 35
Table GL.2 summarizes a review of the adequacy relative to applicable standards.
Table GL.2. Current General Lighting Adequacy Review
Description Min. Rec. Light Level (lux) Calculated Light Level (lux) Light Level Adequate? Houses 1-4 Security Lights 2 352 Yes
House 2 Security Light 2 15 Yes Manure Shed Light 50 85 Yes
Control Rooms 3-4 Lights 100 152 Yes Control Rooms 1-2 Lights 100 126 Yes
Office Area Lights 100 118 Yes Generator Area Lights 50 148 Yes
Table GL.3 provides an analysis of energy savings associated with the recommendations and Table GL.4 summarizes equipment that was evaluated but not recommended. We analyzed the energy and cost saving benefits for replacing the existing lights listed in Table GL.3 with LED lights. We recommend these energy saving measures.
Table GL.3. General Lighting: Recommended Energy Saving Measures
Description Current
Equipment
Recommended Equipment
Est. Annual Electricity Savings
(kWh)
Est. Annual Cost Savings ($)
Est. Cost to Install ($)
Est. Payback (Years)
EUL (Years)
Office Area Lights (1) 57W INC light
(1) 10W, 1,100 lumen LED light 68 $8 $4 0.5 10.0
Houses 1-4 Security Lights
(7) 150W HPS lights
(7) 41W Dusk-Dawn 4,700 lumen LED lights 4,495 $505 $938 1.9 10.0
Control Rooms 1- 2 Lights
(2) 57W INC lights
(2) 10W, 1,100 lumen LED lights 37 $4 $8 2.0 10.0
House 2 Security Light
(1) 65W CFL light
(1) 27W Dusk-Dawn 2,247 lumen LED light 166 $19 $80 4.2 10.0
Generator Area Lights
(4) 42W CFL lights
(4) 10W 1,100 lumen LED lights 27 $3 $16 5.3 10.0
Totals 4,793 $539 $1,046 1.9 N/A

13
We analyzed the energy and cost saving benefits for replacing the light listed in Table GL.4 with an LED light. We do not recommend this measure because of the long payback period. Although not recommended for early replacement, consider choosing LEDs for your existing general lighting bulbs when replacing them at the end of their useful life.
Table GL.4. General Lighting: Evaluated Measures Not Recommended
Description Current Equipment Evaluated Measure Est. Annual Electricity
Savings (kWh) Est. Annual Cost
Savings ($) Est. Cost to Install ($)
Est. Payback (Years)
EUL (Years)
Manure Shed Light
(1) 150W HPS light
(1) 41W Dusk-Dawn 4,700 lumen LED lights 31 $3 $134 44.7 10.0
4.2 Ventilation There are two ratings to consider when replacing exhaust fans. A ventilation efficiency ratio (VER) in cfm/watt, which is the cubic feet per minute of air moved per watt of power rating at a specific static pressure, and an air flow ratio, which gives an indication of the fan's ability to provide a constant air flow as wind speed and static pressure varies. Fans with higher VERs will use electricity more efficiently and fans with a higher air flow ratio are better performing fans as conditions vary.
For adequacy review, the 'maximum' required ventilation capacity for the houses is calculated to ensure that during hot weather, the air exchange is sufficient to keep the inside temperature only slightly warmer than the outside temperature. The design temperature used in this review is the summer dry bulb 2 ½% value for the city closest to your location as provided in ‘U.S. Climatic Data’ of the ANSI/ASHRAE/IESNA Standard 90.1 ‘ASHRAE Standard Energy Standard for Buildings Except Low-Rise Residential Buildings/Appendix D1’. Refer to the Air-Cooling section for further information on cooling incoming ventilation air. The facility has a minimum ventilation schedule used during cold weather that cycles existing exhaust fans on and off to manage moisture and air quality in the houses. The facility has the capacity to meet minimum ventilation requirements.
Table V.1 provides an inventory of the existing ventilation fans and estimated run times at the facility. Table V.2 summarizes a review of the adequacy relative to applicable standards. The calculated existing cfm per house can be found in the Appendix of Details.
Table V.1. Current Exhaust Fan Inventory
Description
Fan Manufacturer
/ Model
Year Installed
Total # Fans
Diameter (in)
Location
Staging
Annual Run Time
(Hours)
Airflow (cfm)
VER (cfm / Watt)
Est. Annual Use (kWh)
Exhaust Tunnel Fans 1-4 Hired Hand 2008 20 50 - 53 Sidewall/Tunnel Stage I 2,370 27,700 20.0 65,649
Exhaust Tunnel Fans 1-4 Hired Hand 2008 20 50 - 53 Sidewall/Tunnel Stage II 1,422 27,700 20.0 39,389
Exhaust Tunnel Fans 1-4 Hired Hand 2008 16 50 - 53 Sidewall/Tunnel Stage III 474 27,700 20.0 10,504
Minimum Vent Fans 1-4 Hired Hand 2008 8 48 - 49 End wall Stage II 1,594 23,100 18.7 15,756
Minimum Vent Fans 1-4 Hired Hand 2008 8 36 End wall Stage II 3,394 10,270 17.7 15,756
Table V.2. Current Poultry Ventilation Adequacy Review
Description Existing Airflow Capacity / House (cfm) Max. Rec. Airflow Capacity / House (cfm) Airflow Adequate? Houses 1-4 Ventilation 387,800 280,714 Yes

14
We do not recommend replacing any of the ventilation fans because of the long payback periods.
Table V.3 summarizes equipment that was evaluated but not recommended.
Table V.3. Poultry Ventilation: Evaluated Measures Not Recommended
Description
Current Equipment
Evaluated Measure Est. Annual Electricity
Savings (kWh)
Est. Annual Cost
Savings ($)
Est. Cost to Install
($)
Est. Payback (Years)
EUL (Years)
Exhaust Tunnel
Fans 1-4
(20) exhaust fans (50 - 53" diameter, 27,700 cfm airflow,
20.0 VER), running 2,370 hours / year
(20) exhaust fans (50 - 53" diameter, 27,800 cfm airflow,
25.5 VER), running 2,370 hours / year
13,974
$1,569
$30,000
19.1
15.0
Exhaust Tunnel
Fans 1-4
(20) exhaust fans (50 - 53" diameter, 27,700 cfm airflow,
20.0 VER), running 1,422 hours / year
(20) exhaust fans (50 - 53" diameter, 27,800 cfm airflow,
25.5 VER), running 1,422 hours / year
8,384
$942
$30,000
31.8
15.0
Minimum Vent
Fans 1-4
(8) exhaust fans (36" diameter, 10,270 cfm airflow,
17.7 VER), running 3,394 hours / year
(8) exhaust fans (36" diameter, 10,500 cfm airflow,
20.2 VER), running 3,394 hours / year
1,641
$184
$7,200
39.1
15.0
Exhaust Tunnel
Fans 1-4
(16) exhaust fans (50 - 53" diameter, 27,700 cfm airflow, 20.0 VER), running 474 hours
/ year
(16) exhaust fans (50 - 53" diameter, 27,800 cfm airflow, 25.5 VER), running 474 hours
/ year
2,236
$251
$24,000
95.6
15.0
Minimum Vent
Fans 1-4
(8) exhaust fans (48 - 49" diameter, 23,100 cfm airflow,
18.7 VER), running 1,594 hours / year
(8) exhaust fans (48 - 49" diameter, 23,300 cfm airflow,
19.7 VER), running 1,594 hours / year
670
$75
$9,600
128
15.0
Regular maintenance and cleaning of ventilation fans is an important part of reducing energy costs. Poor maintenance can reduce a fan's efficiency significantly. We recommend you establish a periodic fan cleaning schedule of every one-to-three months which includes inspecting and replacing worn belts and pulleys. Also, straighten bent cones and repair shutters that are not closing properly. It is important to de-energize the fan motor using lockout and tagout procedures prior to performing any maintenance on a ventilation fan.
4.3 Refrigeration There are no activities or equipment at your facility applicable to this section.
4.4 Controllers Poultry houses have multiple environmental systems such as lighting, heating, and ventilation, that all interact. Electronic controls can be set so that the lights, fans, and cooling systems are turned on and off automatically based on pre-determined settings. Electronic controls will help increase productivity by minimizing the chance of human error. These systems create a more stable, controlled environment for the birds to grow.
Dimmers are used to control lighting levels. Dimmers were evaluated in the Poultry House Lighting section.
Thermostats are used so that ventilation fans, attic inlets, stir fans, heaters, refrigeration units, etc. can be turned on or off automatically based on pre-set temperatures and other settings. The calibration of

15
all thermostats should be checked every three months. The controllers are set to automatically control the ventilation system to manage air temperature, animal temperature and air quality. Thermostats are used by the controllers to call for fans to be turned on in a staged manner to control the temperature of the houses. Air quality is managed by the controllers calling for the fans to be run at minimum intervals of time automatically.
Timers are used to set equipment with an on/off schedule and motion sensors can reduce unnecessary energy use.
The facility is equipped with controllers and all existing automated controls have manual overrides. We recommend scheduled maintenance for all controls.
4.5 Other Motors and Pumps We evaluate for replacing the existing motors with National Electrical Manufacturers Association (NEMA) Premium® efficiency motors.
Savings calculations are based on estimated annual run times, and the difference of the calculated electricity usage using the existing equipment specifications and efficient replacement equipment. When existing motor efficiencies are not available, they are estimated based on market research of motor ratings using the existing motors size and application.
Table OM.1 provides the equipment inventory. In the tables below, TEFC stands for totally enclosed fan cooled, TENV stands for Totally Enclosed Non-Ventilated, and VFD stands for variable frequency drive.
Table OM.1. Current Other Motors and Pumps Inventory
Description
Manufacturer /
Model
Year
Installed
#
Motors
Motor
HP
RPM
Rating
Casing Type
VFD?
Submersible
?
Annual Run Time
(Hours)
Efficiency Rating (%)
Estimated Annual
Use (kWh)
Houses 1-4 Feedline Motors
Grower Select/C63BXHLT-
1421
Not Available
24
0.5 1500 -
2700
TEFC
No
No
532
76.20
5,310
Houses 1-4 Auger Motors
Grower Select/C63BXJH-1236
Not Available 8 0.75 1500 -
2700 TEFC No No 532 81.80 2,473
Houses 1-4 Vent Motors Hired Hand Not
Available 2 0.33 1500 - 2700 TEFC No No 133 72.40 77
Houses 1-4 Vent Motors
Bluffton Motor Works/4511007401 2008 2 0.33 1500 -
2700 TEFC No No 133 72.40 77
Houses 1-4 Feed Line Winch Motors Powertrek Not
Available 4 0.25 1500 - 2700 TEFC No No 133 68.50 123
Houses 1-4 Curtain Motors
Bluffton Motor Works/4511007401 2008 4 0.33 1500 -
2700 TEFC No No 67 72.40 77
Well Pump Motors Not Available Not Available 4 1 1500 -
2700 TENV No Yes 532 82.50 1,635
Houses 1-4 Fogger Pumps Sta-right Not
Available 4 0.75 2700 + TEFC No No 67 76.20 166
Houses 1-4 Cool Pad Pumps Flotec Not
Available 4 0.75 2700 + TENV No Yes 67 76.20 166
Houses 1-4 Cool Pad Pump Pentair Not
Available 12 0.75 2700 + TENV No Yes 67 76.20 498
Fuel Pump GPI/CC110496 2012 1 0.25 0 - 1500 TEFC No No 312 62.20 79

16
NEMA currently does not have recommendations for submersible motors or motors less than 1 horsepower (hp), so no evaluation is made for replacing these motors.
No concerns were identified during our conversations about the adequacy of the motors and pumps at Any Farm.
4.6 Water Heating There are no activities or equipment at this site applicable to this section.
4.7 Air Heating and Building Environment An effective thermal boundary is continuous and unbroken at the perimeter of a heated “conditioned” space. Insulation resistance to heat transmission is given as an R-value. The effectiveness of insulation depends on the choice of material, its density, and installation quality. Effective installations are absent of voids, completely fill any cavities, are installed at the correct densities, and are protected from air movement. A well-insulated and air-tight environment will prevent moisture and heating or cooling losses within a conditioned space. A vapor barrier is a necessary part of moisture management. Vapor barriers should be installed on the interior side of insulation, and as continuously as possible with seams, joints and penetrations sealed.
Savings explanations are outlined in each of the individual measure sections below.
4.7.1 Animal Housing The existing heating equipment and adequacy review is described in Table H.1. Table H.2 summarizes existing and evaluated R-values and provides a review of the adequacy. Table H.3 provides information on other equipment in each house.
Table H.1. Heater Inventory
House Group
Description
Manufacturer /
Model
Year
Installed
# Heaters
(All Houses)
Heater Type
Ignition
Type
Input Rating (Btu/hr.)
Output Rating (Btu/hr.)
Chamber Length
(ft)
Existing Output (Btu/hr. /sq. ft.)
Min. Rec.
(Btu/hr. /sq. ft.)
Adequate?
Houses 1-4
Brood Heaters
LB White/Oval 80/AR80D2PD12
161S
2018
48
Radiant
Electronic
80,000
80,000
224
71
56
Yes
Houses 1-4
Non-Brood Heaters
Warnock Hersey/Comfort
Zone-Easy Radiant/EZB-100
2008
16
Radiant
Electronic
100,000
100,000
336
45
34
Yes Warnock
Hersey/Comfort Zone-Easy
Radiant/EZB-125
2007
16
Radiant
Electronic
125,000
125,000
Table H.2. R-Values Inventory and Adequacy Review
House Identifier Area Existing R-Value Evaluated R-Value Min. Rec. R-Value Adequate? Houses 1-4 Sidewall 13.53 18.37 7 Yes Houses 1-4 Exposed Foundation Wall 1.33 1.33 N/A - Houses 1-4 End Wall 13.53 18.37 7 Yes Houses 1-4 End Wall Doors 2.25 12 N/A - Houses 1-4 Ceiling 14.4 33.4 9 Yes Houses 1-4 Brood Curtains 1 3 N/A -

17
House Identifier Area Existing R-Value Evaluated R-Value Min. Rec. R-Value Adequate? Houses 1-4 Tunnel Intakes 1 7 N/A - Houses 1-4 Vent Boxes 1 1 N/A - Houses 1-4 Minimum Vent Fan Area 1 1 N/A - Houses 1-4 Exhaust Ventilation Fan Area 1 7/3 N/A -
Table H.3. Other Equipment Table House Identifier # Attic Inlets / House # Stir Fans / House # Vent Boxes / House
Houses 1-4 0 0 71
4.7.2 House Wall Insulation Savings calculations for adding insulation to the walls are based on installing new wall insulation above the curtain, below the curtain, in the end walls, and in other miscellaneous side wall areas with interior vapor barrier and interior plywood sheathing (either 1/2" fire-retardant treated plywood or 5/8" exterior type plywood). Though the evaluated insulation value is above the adequacy level of R-7 for walls, we evaluate for this R-value due to the size of the wall cavity and insulation material.
The exposed concrete foundation walls are uninsulated. Producers often use the concrete foundation as a guide when cleaning out the litter in the houses, and if insulation were to be installed, it would likely become damaged and ineffective from clean out processes, therefore, we do not evaluate for installing insulation on this surface.
We do not recommend installing new insulation to the side walls and end walls in Houses 1-4 because of the long payback period.
4.7.3 House Ceiling Insulation Dropped ceilings are typically insulated with batt or blown insulation. The most common types of blown insulation are cellulose and fiberglass. Before adding additional insulation, the interior sheathing material should be patched of any holes and any loose strapping should be securely fixed to the trusses. The sheathing material should be an industry standard material type such as Tri-Ply, or similar. A wind barrier should also be installed in the eaves to prevent wind washing of insulation.
Savings calculations for adding insulation to the ceiling assume increasing the approximate R-value of the ceiling insulation by R-19. Though the evaluated insulation value is above the adequacy level of R-9 for ceilings, we evaluate for this R-value for increased energy savings.
We note that this was something you were interested in. We recommend this energy saving measure in Houses 1-4.
4.7.4 Insulated Tunnel Doors Tunnel curtains can be a major source of heat loss in broiler houses. Insulated and gasketed tunnel inlet doors reduce conduction and infiltration losses and provide a more controlled environment. Tunnel doors also better direct the incoming cooled air upwards.
Savings calculations are based on reduced air infiltration and new doors with a minimum insulation value of R-7.

18
Houses 1-4 currently use curtains to cover the tunnel inlet. We recommend installing insulated tunnel doors in Houses 1-4.
4.7.5 Insulated Fan Covers We noted that you were interested in the possibility of fan covers.
Exhaust fans, that are generally only used in the summer for the high heat and high humidity, can be a major source of heat loss in broiler houses in the colder months. Insulated exhaust fan covers, such as fan bonnets, or insulated and gasketed individual fan doors (similar to tunnel doors) can reduce heat losses when the fans are not in use.
We evaluate for installing either insulated fan doors R-value (R-7), or fan bonnets (R-3). If the fan doors meet the minimum payback criteria and are recommended, we use that information for the table totals.
Savings are based on both the increased R-value for the areas of the fan openings and eliminating the air leakage through the fan baffles. The estimated cost for insulated fan doors is $285 each, which is based on a quote provided for a recent project in Delaware. The estimated cost for fan bonnets is $30 each, which is based on a web search of available products.
Due to your interest in this measure we verified that both the fan doors and the fan bonnets meet the pay back criteria. The savings information for the exhaust fan doors are used in the table totals, however the insulated bonnets information is also provided.
We recommend installing insulated exhaust fan covers in Houses 1-4.
4.7.6 Insulated End Wall Doors Insulated end wall doors reduce conduction and infiltration losses and provide a more controlled environment. Maintenance of the door tracks and seals, keeping them free of debris and clean, is important to the continued energy efficiency benefits.
Savings calculations for installing insulated end wall doors are based on reducing air infiltration and installing a manufactured insulated door with an insulation value of R-12.
We do not recommend installing insulated end wall doors on Houses 1-4 because of the long payback period.
4.7.7 Insulated Brood Curtains We evaluate installing insulated brood curtains to reduce heat loss and air infiltration through the curtains during brooding periods.
Savings calculations for replacing the existing curtain are based on installing an insulated brood curtain with a value of R-3. Brood curtain dimensions are based on the cross-sectional area of the house.
We recommend replacing the existing brood curtains in Houses 1-4 with insulated brood curtains.
4.7.8 Seal Air Leaks All broiler houses, even brand-new houses, should be checked for air leaks. Some common air leakage areas in poultry houses are wall sill plates, the ridgeline of open-ceiling construction, around fans, doors,
19
windows, and damaged areas of walls and ceilings. A tighter house provides a more controllable environment. Savings calculations for sealing air leaks are based on reducing excessive and uncontrolled air leakage estimated as linear footage. The savings calculations use minimum ventilation requirements, existing fan information, estimated natural air changes, existing building conditions, and site-specific conditions.
Sealing the air leaks with an appropriate sealant material in Houses 1-4 is recommended.
4.7.9 Heaters Rather than heating the air with forced hot air heaters (FHA), radiant heaters use radiant energy to heat the objects in a room. Radiant heaters also do a better job of heating the animals by providing concentric zones of temperature, with the hottest area in the center. This better enables them to find their own comfort zones.
When the existing heating system has adequate capacity, we evaluate for replacing the existing heating system total Btu/hr./sq. ft. with an electronic ignition radiant system with the same Btu/hr./sq. ft.
Savings calculations for replacing FHA heaters with electronic ignition radiant heaters are based on reduced heat losses during ventilation periods and the ability to provide thermal comfort at the defined temperatures in a more location-focused manner. Cost estimates are based on installing 125,000 Btu/hr. radiant tube heaters.
The Houses 1-4 currently have electronic ignition radiant heaters, which are considered energy efficient, therefore there are no efficiency recommendations for heaters.
4.7.10 Ceiling Stir Fans During heating periods, the stack effect causes temperature stratifications within the house. Less dense hot air naturally rises towards the ceiling. Stir fans help circulate the heated air resulting in less heat loss through the ceiling, less temperature fluctuations and lower relative humidity.
Savings calculations are based on a reduced heat loss through the ceiling and account for an increased annual electricity usage. We evaluate for installing 1/15 HP 18" diameter cage fans rated at 3,500 cfm to attain 2 cfm per square foot.
We do not recommend installing stir fans in Houses 1-4 because adding stir fans would result in a net energy and cost increase.
4.7.11 Actuated Attic Inlets Attic inlets enable warm attic air to be drawn into the house by utilizing the heat trapped above a dropped ceiling. When the attic temperature is at least 10 degrees higher than the desired temperature of the house, this can significantly reduce the heating fuel needed, especially during the first few weeks of a flock. Attic inlets are most effective in solid side wall houses that have been well sealed and that utilize tunnel ventilation.
Savings calculations are based on a reduction of fuel use by accounting for a warmer 'exterior' air being used for the first two weeks of the flocks. For our calculation purposes a 1.5 cfm/sq. ft. minimum standard using attic inlet of 2,000 cfm is considered in each house.

20
We do not recommend installing attic inlets in Houses 1-4 because of the long payback period.
4.7.12 Vent Box Doors The vent box doors do not currently seal properly when closed and there is potential for energy savings associated with replacing with new units. Savings calculations are based on reducing excessive and uncontrolled air leakage associated with vent box doors that don't seal properly and is estimated as linear footage. The savings calculations use minimum ventilation requirements, existing fan information, estimated natural air changes, existing building conditions, and site-specific conditions.
We do not recommend replacing the existing vent box doors in Houses 1-4 with new units.
4.7.13 Air Heating and Building Environment Summary Table HS.1 provides an analysis of energy savings associated with the Air Heating and Building Environment recommendations and Table HS.2 summarizes equipment that was evaluated but not recommended.
Table HS.1. Air Heating and Building Environment: Recommended Energy Saving Measures
Description
Current Equipment
Recommended
Equipment
Est. Annual Electricity
Savings (kWh)
Est. Annual
Propane Savings
(gal)
Est. Annual
Cost Savings ($)
Est. Cost to Install ($)
Est.
Payback (Years)
EUL
(Years)
Houses 1-4: Seal
Air Leaks
4 houses with
moderate air sealing
Seal approximately 2,480 linear ft. per house in 4 houses to eliminate air leaks.
0
2,136
$2,910
$9,920
3.4
10.0
Houses 1-4: Brood Curtains
4 houses with (4)
uninsulated brood curtains
Install (4) insulated brood curtains
(approximately 1,987 ft² per house) in 4
houses.
0
722
$983
$9,538
9.7
10.0
Houses 1-4: Tunnel
Intakes
4 houses with (2)
uninsulated tunnel curtains
Install (2) insulated tunnel intake doors (approximately 894 ft² per house) in 4
houses.
0
2,369
$3,228
$32,211
10.0
20.0
Houses 1-4: Ceiling
Insulation
4 houses with 33,531 ft² per house of blown fiberglass
Install 33,531 ft² per house of ceiling insulation in 4
houses.
0
3,608
$4,916
$67,061
13.6
20.0
Houses 1-4: Exhaust
Ventilation Fan Covers
4 houses with 350 ft² per house of exhaust
ventilation fans
Install (56) Insulated Fan Covers
(Doors/Bonnets).
0
817/606
$1,113/$866
$15,960/$1,680
14.3/1.9
20.0/5.0
Totals 0 9,652 $13,150 $134,690 10.2 N/A *Values for exhaust fan doors are used in the totals
21
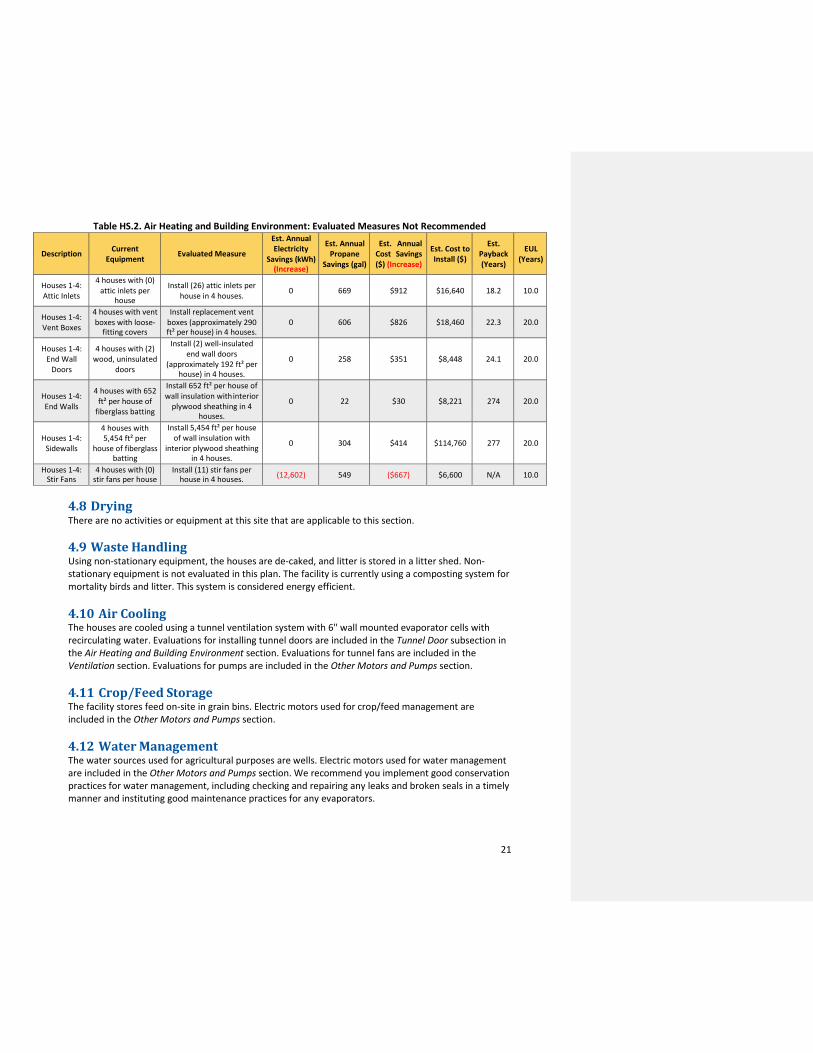
Table HS.2. Air Heating and Building Environment: Evaluated Measures Not Recommended
Description
Current
Equipment
Evaluated Measure
Est. Annual Electricity
Savings (kWh) (Increase)
Est. Annual Propane
Savings (gal)
Est. Annual Cost Savings ($) (Increase)
Est. Cost to Install ($)
Est. Payback (Years)
EUL
(Years)
Houses 1-4: Attic Inlets
4 houses with (0) attic inlets per
house
Install (26) attic inlets per house in 4 houses.
0
669
$912
$16,640
18.2
10.0
Houses 1-4: Vent Boxes
4 houses with vent boxes with loose-
fitting covers
Install replacement vent boxes (approximately 290 ft² per house) in 4 houses.
0
606
$826
$18,460
22.3
20.0
Houses 1-4: End Wall
Doors
4 houses with (2) wood, uninsulated
doors
Install (2) well-insulated end wall doors
(approximately 192 ft² per house) in 4 houses.
0
258
$351
$8,448
24.1
20.0
Houses 1-4: End Walls
4 houses with 652 ft² per house of
fiberglass batting
Install 652 ft² per house of wall insulation with interior
plywood sheathing in 4 houses.
0
22
$30
$8,221
274
20.0
Houses 1-4:
Sidewalls
4 houses with 5,454 ft² per
house of fiberglass batting
Install 5,454 ft² per house of wall insulation with
interior plywood sheathing in 4 houses.
0
304
$414
$114,760
277
20.0
Houses 1-4: Stir Fans
4 houses with (0) stir fans per house
Install (11) stir fans per house in 4 houses. (12,602) 549 ($667) $6,600 N/A 10.0
4.8 Drying There are no activities or equipment at this site that are applicable to this section.
4.9 Waste Handling Using non-stationary equipment, the houses are de-caked, and litter is stored in a litter shed. Non- stationary equipment is not evaluated in this plan. The facility is currently using a composting system for mortality birds and litter. This system is considered energy efficient.
4.10 Air Cooling The houses are cooled using a tunnel ventilation system with 6" wall mounted evaporator cells with recirculating water. Evaluations for installing tunnel doors are included in the Tunnel Door subsection in the Air Heating and Building Environment section. Evaluations for tunnel fans are included in the Ventilation section. Evaluations for pumps are included in the Other Motors and Pumps section.
4.11 Crop/Feed Storage The facility stores feed on-site in grain bins. Electric motors used for crop/feed management are included in the Other Motors and Pumps section.
4.12 Water Management The water sources used for agricultural purposes are wells. Electric motors used for water management are included in the Other Motors and Pumps section. We recommend you implement good conservation practices for water management, including checking and repairing any leaks and broken seals in a timely manner and instituting good maintenance practices for any evaporators.

22
The facility conserves water by recirculating the water used on the evaporator cells when cooling the flock.
You did not identify any adequacy concerns during our conversations regarding your farm’s current source of water.
4.13 Material Handling Stationary equipment used for material handling is included in other sections throughout this plan. Non- stationary equipment is not evaluated as part of this plan. There may be some opportunities to convert some or all of your non-stationary equipment to electric power, in order to save on the cost of fuel, however these are not evaluated as a part of this plan. We also recommend proper and continued maintenance to extend the expected useful life of the equipment.

23
5 Energy Pyramid
The energy pyramid describes a cost-effective approach to minimizing energy costs and achieving greater energy independence. In some cases, too much emphasis is placed on renewable energy to address energy concerns. Rather than being the first course of action, renewable energy should typically be considered only after addressing energy analysis, energy conservation, energy efficiency, and time of use management. This approach will minimize design and implementation costs associated with renewable energy technologies. The energy pyramid illustrates this approach to energy management, starting with building an understanding of opportunities through energy analysis and then pursuing the simplest and least expensive steps before progressing to the most complex and costly. Figure EP.1 shows the energy pyramid.
Figure EP.1. Energy Pyramid
The energy pyramid is a guide that serves as a road map to help facilities improve their efficiency and reduce their dependence on purchased energy.
The next step would be to review the recommended energy efficiency measures with your operation's needs and investigate funding resources.

24
6 Statements and Disclaimers
6.1 Liability The intent of this energy evaluation is to estimate energy savings associated with recommended energy conservation measures. This plan is not intended to serve as a detailed engineering design document. Detailed design efforts may be required to implement several of the improvements evaluated.
Energy savings and equipment costs presented in this document are estimates and are based on information gathered during the process of developing this energy plan. Actual savings and costs may vary from estimates due to a variety of factors including changes in energy usage and energy costs, equipment costs, product availability, and geographic location.
EnSave is not liable if projected energy or cost savings are not actually achieved. All savings and cost estimates are for informational purposes and are not to be construed as a design document or as guarantees. The producer shall independently evaluate any advice or direction provided. EnSave is not liable for any failure to achieve a specified amount of energy savings, the operation of the customer’s facilities, or any incidental or consequential damages of any kind in connection with this plan or the installation of recommended measures.
6.2 Vendor Neutrality The goal of EnSave is to help our clients save energy and conserve natural resources. EnSave does not represent any equipment manufacturer or dealer. Any quotes or manufacturer literature included are intended as illustrations only.
The presence or absence of trade or company names should not be interpreted as a reflection on the quality of a company or its products.
This report was developed by EnSave using FEAT™ software, a product of EnSave. All content is copyright EnSave.
25
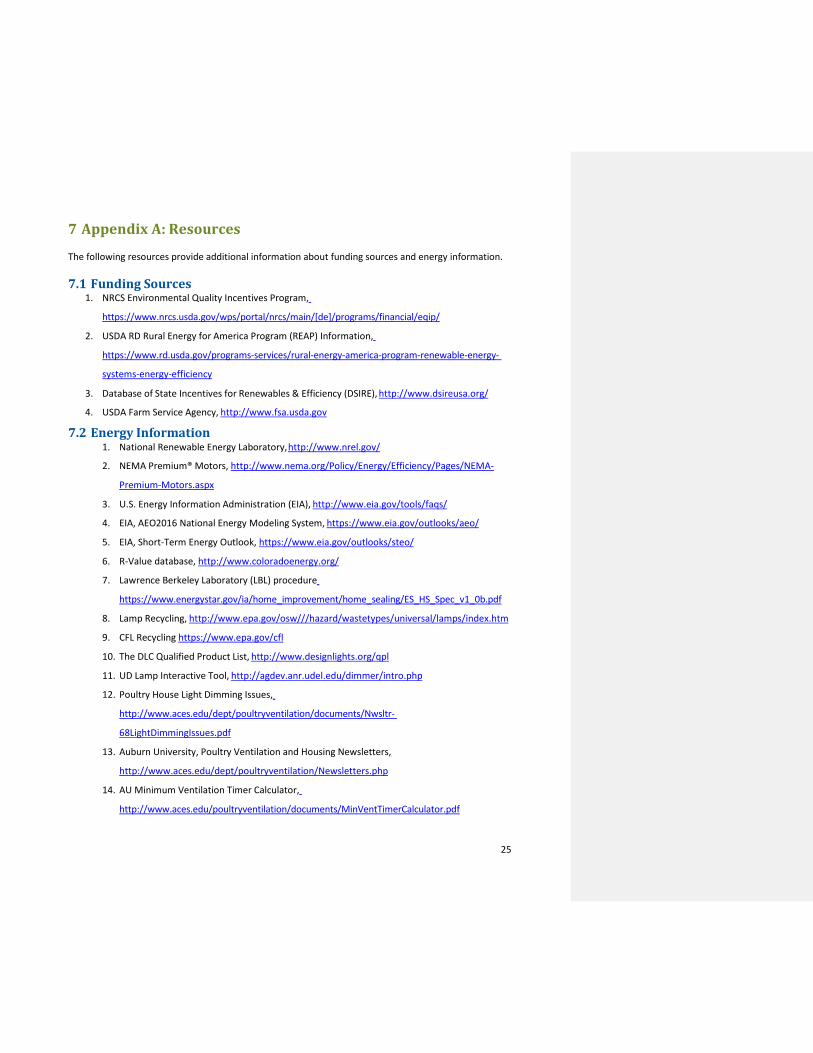
7 Appendix A: Resources
The following resources provide additional information about funding sources and energy information.
7.1 Funding Sources 1. NRCS Environmental Quality Incentives Program,
https://www.nrcs.usda.gov/wps/portal/nrcs/main/[de]/programs/financial/eqip/
2. USDA RD Rural Energy for America Program (REAP) Information,
https://www.rd.usda.gov/programs-services/rural-energy-america-program-renewable-energy-
systems-energy-efficiency
3. Database of State Incentives for Renewables & Efficiency (DSIRE), http://www.dsireusa.org/
4. USDA Farm Service Agency, http://www.fsa.usda.gov
7.2 Energy Information 1. National Renewable Energy Laboratory, http://www.nrel.gov/
2. NEMA Premium® Motors, http://www.nema.org/Policy/Energy/Efficiency/Pages/NEMA-
Premium-Motors.aspx
3. U.S. Energy Information Administration (EIA), http://www.eia.gov/tools/faqs/
4. EIA, AEO2016 National Energy Modeling System, https://www.eia.gov/outlooks/aeo/
5. EIA, Short-Term Energy Outlook, https://www.eia.gov/outlooks/steo/
6. R-Value database, http://www.coloradoenergy.org/
7. Lawrence Berkeley Laboratory (LBL) procedure
https://www.energystar.gov/ia/home_improvement/home_sealing/ES_HS_Spec_v1_0b.pdf
8. Lamp Recycling, http://www.epa.gov/osw///hazard/wastetypes/universal/lamps/index.htm
9. CFL Recycling https://www.epa.gov/cfl
10. The DLC Qualified Product List, http://www.designlights.org/qpl
11. UD Lamp Interactive Tool, http://agdev.anr.udel.edu/dimmer/intro.php
12. Poultry House Light Dimming Issues,
http://www.aces.edu/dept/poultryventilation/documents/Nwsltr-
68LightDimmingIssues.pdf
13. Auburn University, Poultry Ventilation and Housing Newsletters,
http://www.aces.edu/dept/poultryventilation/Newsletters.php
14. AU Minimum Ventilation Timer Calculator,
http://www.aces.edu/poultryventilation/documents/MinVentTimerCalculator.pdf

26
15. University of Illinois at Urbana-Champaign's Bioenvironmental and Structural Systems
Laboratory, uiuc.edu
16. Selecting Rated Ventilation Fans, https://extension.psu.edu/selecting-rated-ventilation-fans
17. UGA Tunnel House Heat Gain Analysis, https://www.poultryventilation.com/node/4074
18. AU Wintertime Broiler House Ventilation,
http://www.aces.edu/dept/poultryventilation/documents/Nwsltr-15.pdf
19. AU Big Birds, Hot Weather and Maximum Comfort, Performance and Profit,
http://www.aces.edu/poultryventilation/documents/Nwsltr-42_BigBirds_Hot_Weather.pdf
20. University of Georgia Poultry Housing Tips, https://www.poultryventilation.com/housing-
tips
21. Six Top Tips for Best Tunnel Cooling,
http://www.aces.edu/dept/poultryventilation/documents/Nwsltr-72TipsonTunnel.pdf
22. Improving Gas Heat System Efficiency,
http://www.aces.edu/dept/poultryventilation/documents/Nwsltr-
69ImprovingGasHeatSystemEfficiency.pdf
23. Keys to Top Evaporative Cooling
Performance, http://www.aces.edu/dept/poultryventilation/documents/Nwsltr-
41EvapCooling.pdf
24. Stir fan options,
http://www.envirofan.com/Documents/Auburn%20Univ%20Stir%20Fan%20Report.pdf
25. Reduce Energy Costs in Poultry Houses,
http://www.poultry.msstate.edu/pdf/extension/energy_costs.pdf
26. Insulation, https://www1.eere.energy.gov/library/pdfs/insulation_fact_sheet.pdf

27
7.3 Equipment and Productivity Attachments The following resources describe the equipment and productivity benefits. They include explanations of how each piece of equipment saves energy and how each process improvement helps increase production and are attached separately. 1. Best Practices Guide Energy Savings for Poultry, published by EnSave, Inc.
2. Brooding Curtains, published by EnSave, Inc.
3. Exterior LED Lighting, published by EnSave, Inc.
4. Efficient LED General Lighting, published by EnSave, Inc.
5. Insulated Tunnel Doors, published by EnSave, Inc.
6. Tunnel Ventilation Fans, published by EnSave, Inc.
7.4 Equipment Product Data Sheets for Recommended Measures- Attachments
The following product data sheets are for the specific equipment used in this evaluation. This information is intended for your planning needs, to allow for an understanding and evaluation of the recommended measures, and to help guide you to implement the recommended measures. This includes information on the product specifications, output, and various energy efficiency-related factors. Estimated cost information is included in the Tables of Recommended Measures throughout this report.
1. Blown Fiberglass - Owns Corning L77 fiberglass brochure; https://www2.owenscorning.com/literature/pdfs/L77.pdf
2. Brochure-Gaco-183M-w; https://41z32e1503dj3gyqe3151089-wpengine.netdna-ssl.com/wp- content/uploads/Brochure-Gaco-183M-w.pdf
3. Brood Curtain; https://www.teksupply.com/contractor/supplies/cat1;ts_barn_curtain_accessories- ts_barn_curtain_2;ts_vinyltek_7layer_insulated_curtain_1.html
4. Lithonia-41-watt-4700lm-security light; https://s1.img- b.com/build.com/mediabase/specifications/lithonia_lighting/1433419/lithonia-lighting-tdd2-led- 120-per-m4-specification-sheet.pdf
5. Overdrive-10-Watt-1000 lumen-LED; http://www.overdrive- lighting.com/pdf/lamps/Datasheet/Item-712.pdf
6. Dusk to Dawn 27 Watt-LED Outdoor Flood Light;https://www.lampsplus.com/products/white-10- and-three-quarter-inchh-dusk-to-dawn-led-outdoor-flood-light 3y658.html
7. Tunnel Doors/Exhaust Fan Doors Brochure – Cumberland; https://www.cumberlandpoultry.com/content/dam/Brands/Cumberland%20Poultry/Brochures/C- 83_O%20Outside%20Tunnel%20Door.pdf/_jcr_content/renditions/original
8. Tunnel Fan Bonnets; https://www.qcsupply.com/fan-cone-cover.html

28
8 Appendix B: Minimum Standard Recommendations
Lighting: ASABE 344.4, IES Handbook, NRCS-CPS-Lighting System Improvements-Code 670
Ventilation: ASAE EP566.2, NRCS-CPS-Farmstead Energy Improvements-Code 374
Controllers: ASAE EP566.2, The Institute of Electrical and Electronics Engineers, Inc. (IEEE) Recommended Practice and Requirements for Harmonic Control in Electric Power Systems - 519
Other Motors and Pumps: National Electrical Manufacturers Association (NEMA) MG 1-2009
Air Heating and Building Environment: NRCS CPS Building Envelope Improvement Code 672, ASABE ANSI/ASAE S401.2 Guidelines for Use of Thermal Insulation in Agricultural Buildings, National Instructions Title 210 “Engineering Part 301" Use of Spray Polyurethane Foam Insulation and Vapor Retarders for Building Envelope Improvement
Heaters: Industry Standards; An average Btu/Hr./Sq. Ft. minimum standard requirement as derived from several major integrators was used for the adequacy evaluation of the existing heaters.
Waste Handling: NRCS CPS Animal Mortality Facility Code 316, NRCS CPS Waste Storage Facility 313

29
9 Appendix C: Calculations
9.1 Basics 9.1.1 Annual Run Hours Annual Run Hours = [Hours per Day in Operation] * [Days per Week in Operation] * [Weeks per Year in Operation]
9.1.2 Btu Conversion Factors EnSave uses the BTU factors as sourced from the U.S. EIA, last updated in 2015. These factors are as follows:
Electricity 1 kWh = 3,412 BTU Propane 1 Gal = 91,333 BTU
It should be noted that the EIA just released (6/2020) new 2020 BTU values for these fuels, as follows:
Electricity 1 kWh = 3,412 BTU Propane 1 Gal = 91,452 BTU
9.1.3 Area Calculations Plane Area The plane area of the building is used in many different parts of EnSave’s calculations, including air infiltration and stir fans. Plane Area = [Length of Building] * [Width of Building]
Cross Section Area Cross Section Area is used in a few calculations. It assumes the ceiling portion is an equilateral triangle if open, and if dropped then the cross section is simply the width multiplied by the dropped ceiling height.
Cross Section Area = ([Width of Building] * [Sidewall Height]) + (([Width of Building] * ([Ceiling Height] – [Sidewall Height])) / 2)
Curtain Wall Opening Area Curtain Wall Opening Area = [Curtain Opening Length] * [Curtain Opening Height] * [# Curtain
Openings]
Above Curtain Wall Opening Area The area above a curtain wall opening is considered a discrete component of a building:
Area Above Curtain = [Curtain Opening Length] * [Above Curtain Opening Height] * [# Curtain Openings per building]
Below Curtain Wall Opening Area The area below a curtain wall opening is considered a discrete component of a building:
Area below Curtain = [Curtain Opening Length] * [Below Curtain Opening Height] * [# Curtain Openings per building]

30
Exposed Foundation Wall Area Exposed Foundation Wall Area = (([Length of Building] + [Width of Building]) * [Exposed Foundation Wall Height] * 2)
Tunnel Intake Areas Sidewall Tunnel Intake Area = ([SW-Tunnel Intake Height] * [SW-Tunnel Intake Length]) * [# SW-Tunnel Intakes]
End wall Tunnel Intake Area = ([EW-Tunnel Intake Height] * [EW-Tunnel Intake Length]) * [# EW-Tunnel Intakes]
Exhaust Fan Areas Sidewall Exhaust Fan Area = ([# exhaust fans in sidewall] * Area of Exhaust Fans
End Wall Exhaust Fan Area = ([# exhaust fans in end wall] * Area of Exhaust Fans
Minimum Ventilation (min vent) Fan Area Sidewall Min Vent Fan Area = ([# min vent. fans in sidewall] * Area of Min. Vent. Fans
End wall Min Vent Fan Area = ([# min vent. fans in end walls] * Area of Min. Vent. Fans
Vent Box Area Vent Box Area = (([Vent Box Height(in)] * [Vent Box Length(in)]) /144) * [# Vent Boxes]
Total End Wall Door Area End Wall Door Area = ([End Wall Door Height] * [End Wall Door Width]) * [# End Wall Doors]
End Wall Area End Wall Area = ((([Width of Building] * [Sidewall Height]) + ((0.5 * [Width of Building]) * ([Ceiling Height] – [Sidewall Height]))) * [# End Walls]) - ((([End Wall Door Area] +(End wall Tunnel Intake Area) + (End wall Min Vent Fan Area)+(End wall Exhaust Fan Area) + ([Width of Building] * [Exposed Foundation Wall Height] * [# End Walls]))
Solid Sidewall Area The area of solid sidewalls is the area of sidewalls not covered by any other component, such as curtain openings, tunnel intakes, vent boxes, etc.
Area of Solid Sidewall = ([Length of Building] * [Sidewall Height] * 2) - (([Curtain Wall Opening Area] + (Above Curtain Opening Area) + (Below Curtain Opening Area) + ([Length of Building] * [Exposed Foundation Wall Height] * 2) + (Sidewall Tunnel Intake Area) + (Sidewall Min Vent Fan Area) + (Sidewall Exhaust Fan Area) + (((Vent Box In Wall Factor)*[Vent Box Height] * [Vent Box Length]) * [# Vent Boxes]))

31
Ceiling Two Area “Ceiling Two” is a generic name for an area of the ceiling with a different insulation than the rest of the ceiling.
Ceiling Two Area= [Length of Building] * [Ceiling Two Width]
Ceiling One Area Any ceiling area not part of Ceiling Two is designated the primary ceiling area, or “Ceiling One”.
Ceiling One Area = Sqrt (([Ceiling Height] − [Sidewall Height]) ^ 2 + ([Width of Building] / 2) ^ 2) * [Length of Building] * 2 – (Ceiling Two Area)- (((Vent Box In Ceiling Factor)*[Vent Box Height] * [Vent Box Length]) * [# Vent Boxes]))
Building Volume Building Volume = (([Width of Building] * [Sidewall Height]) + (([Width of Building] * ([Ceiling Height] – [Sidewall Height])) / 2)) * [Length of Building]
9.1.4 R-Value Calculations R-Value is a standard measurement of heat flow resistance. EnSave’s uses the American R-Value, which is in (ft2·°F·h/Btu). R-Values are an integral component to the heat loss calculations.
R-Value Database EnSave keeps a database of R-Values of common building and insulation components, drawing from the work of an energy professional in Colorado who has posted the research online at http://www.coloradoenergy.org/. The component types accounted for are Air Film, Siding, Sheathing, Studs, and Insulation.
R-Value Equation for Walls R-Value for most components is the stated R-Value for the component as found in the database. Existing R-values are sometimes reduced by the analyst to account for degradation from age, moisture, and pest damage etc. Walls are a combination of components.
The R-Value for walls = 1 / ((([Stud %] * (1 / ([Outside Air Film R-Value] + [Siding R-Value] + [Outside Sheathing R-Value] + [Stud R-Value] + [Inside Sheathing R-Value]+ [Inside Air Film R-Value]))) + ((1 – [Stud %]) * (1 / ([Outside Air Film R-Value] + [Siding R-Value] + [Outside Sheathing R-Value] + [Insulation R-Value] + [Inside Sheathing R-Value] + [Inside Air Film R-Value])))))
9.2 Lighting Calculations Estimated Annual Current Use (kWh) = ([Fixture Total Power Consumption] * [# Bulbs/Fixture] * [# Fixtures]) * (percent dimming) * [Annual Run Hours]) / 1,000
Estimated Annual Recommendation Use (kWh) = [Recommended Total Power Consumption]) * [Recommended Fixture Ratio] * [# Bulbs/Fixture] * [# Fixtures] * (percent dimming) * [Annual Run Hours]) / 1,000
Energy Savings = Estimated Annual Current Use (kWh) - Estimated Annual Recommendation Use (kWh)

32
Cost Savings = Energy Savings * cost per kWh
Implementation Costs = (# of bulbs * cost per bulb) + (# new fixtures * cost per fixture) + estimated installation fee.
[Payback] = [Implementation Cost] / [Cost Savings]
Variables • Fixture Total Power Consumption –bulb watts multiplied by any ballast factor, if applicable. • Recommended Total Power Consumption –the bulb watts multiplied by any ballast factor, if
applicable. • Recommended Fixture Ratio – the ratio of recommended fixtures to current fixtures, for
scenarios where we replace one fixture with two smaller fixtures. • # Bulbs/Fixture – The number of bulbs per fixture. • # Fixtures – The number of fixtures. • Annual Run Hours – The annual run hours associated with the fixture. • Percent dimming – The reduced draw based on dimming the lights as a percentage.
9.3 Ventilation Calculations Exhaust fans are separated into two categories – “Low Volume High Speed” (LVHS) and “High Volume Low Speed” (HVLS). Specifications for fans are derived from BESS Labs. When the make and/or model # of existing fans are not available, EnSave uses the average specification of fans of similar size and age.
Estimated annual current ventilation use is determined by the remaining electricity available after all other facility uses have been accounted for:
Estimated Current Ventilation Use = [Reported Electricity Use] - ([Estimated Electricity Use from Other Measures] + ([Reported Electricity Use] * 0.02))
Fan run-hours are based on staged run times which divides up the available electricity by ratio and then weighted average to get estimated fan run hours.
Total Run Frequency Units = [# Fans-Stage 1] * [Run Frequency Units Stage 1] + [# Fans- Stage 2] * [Run Frequency Units Stage 2] + [# Fans- Stage 3] * [Run Frequency Units Stage 3]
Electricity Per Run Frequency Unit = [Electricity Available for Ventilation] / [Total Run Frequency Units]
Estimated Annual Current Use Per Stage = [Electricity per Run Frequency Unit] * ([Run Frequency Units] * [# Fans])
Estimated Annual Current Run Hours for Exhaust fans (by stage) (hrs.) = ([Estimated Annual Electricity Use (by stage)] * 1,000) / (([# Fans] * [Airflow]) / [VER])
Estimated Annual Current Run Hours for Circulation (by stage) (hrs.) = [Estimated Annual Electricity Use (by stage)] / ([# Fans] * [Power])

33
Estimated Annual Recommendation Use for exhaust Fans (kWh) = Estimated Annual Run Hours * (([# fans] * [Recommended Airflow]) / [Recommended VER])/1000
Estimated Annual Recommendation Use for circulation Fans (kWh) = Estimated Annual Run Hours * ([# fans] * [Recommended Power]) / 1000
Energy Savings = Estimated Annual Current Use (kWh) - Estimated Annual Recommendation Use(kWh)
Cost Savings = Energy Savings * cost per kWh
Implementation Costs = (number of fans * price per fan) + estimated installation cost.
[Payback] = [Implementation Cost] / [Cost Savings]
Variables • Reported Electricity Use – The annual electricity use as reported by the utility. • Estimated Electricity Use from Other Measures - any electricity already attributed to lighting,
electric motors, and other equipment is removed from the available pool of electricity. • 0.02 – EnSave assumes poultry and swine operations have a 2% miscellaneous electricity use. • # Fans– The number of identical fans being evaluated. • Run Frequency Units – A way of parceling out electricity use based on staging:
o Stage I fans get 5 units. o Stage II fans get 3 units. o Stage III fans get 1 unit.
• Electricity Available for Ventilation – The total amount of electricity available to allocate to ventilation.
• Total Run Frequency Units – The total number of run frequency units from all fans. • Annual Run Hours = Derived from overall existing annual ventilation use and staged run times. • 1,000 – conversion of kilowatts to watts. • Airflow – The rated airflow (cfm) of the specific fan model or an average of the best matches as
available on Bess Labs Archive data. • VER (cfm/watt) – The ventilation efficiency rating of the specific fan model or an average of the
best matches as available on Bess Labs Archive data. • Estimated Annual Electricity Use – The estimated annual electricity use, as calculated above. • Power (Wh)– The power of the fan. • Recommended Airflow (cfm)= Airflow for specific fan model recommended from Bess Labs
Current data. • Recommended VER (cfm/watt) = VER for specific fan model recommended from BessLabs
Current data. • Recommended Power (Wh) – The power of the fan model recommended
9.4 Controller Calculations Electronic Controls Current Use = [Are Electronic Controls Present?] * ((0.05* [Total Heat Loss Attributed to Building Components]) / [Total Heat Loss Attributed to Building Components]) * ([Current Heating Fuel Use] – [Fuel Use Attributed to Air Infiltration])
Electronic Controls Recommended Use = [0]

34
Energy Savings = Estimated Annual Current Use (btu) - Estimated Annual Recommendation Use (btu)
Cost Savings = Energy Savings * btu to Fuel conversion * cost per [fuel unit]
Implementation Costs = Electronic controls have an estimated cost of $4,634 per building.
Variables: • Are Electronic Controls Present? – 0 if present, 1 if not present. • 0.05 – EnSave assumes that buildings without electronic controls produce 5% more heat loss
than buildings with controls. • Total Heat Loss Attributed to Building Components – The total heat loss attributed to the
components of the building, such as ceilings, walls, doors, tunnel intakes, etc. Essentially, everything not otherwise attributed to air infiltration.
• Current Heating Fuel Use – the amount of heating fuel allocated to the building. • Fuel Use Attributed to Air Infiltration – The amount of heating fuel already allocated to air
infiltration.
9.5 Other Motors and Pumps Calculations Evaluations of electric motors are based off of information published by NEMA regarding motor efficiencies.
EnSave keeps a database of electric motor specifications. This database is based on information from NEMA and is comprised of a series of tables of motors and their associated expected efficiency values. Motors marked as “Submersible” do not currently have any recommendations. All other motors are evaluated against the “Recommended Motor Efficiency Value” in the motor database matching the motor’s query values. Motors are assumed to be 1:1 replacement with equivalent horsepower and will run the same number of annual run hours.
Estimated Annual Current Use = (([Motor Horsepower] * [# Motors] * [Motor Load Factor] * 0.7457) / ([Existing Motor Efficiency Value] / 100)) * [Annual Run Hours]
Estimated Annual Recommended Use = (([Motor Horsepower] * [# Motors] * [Motor Load Factor] * 0.7457) / ([Recommended Motor Efficiency Value] / 100)) * [Annual Run Hours]
Energy Savings (kWh) = Estimated Annual Current Use (kWh) - Estimated Annual Recommendation Use (kWh)
Cost Savings = Energy Savings * cost per kWh
Implementation Costs = The cost associated with the recommended motor replacement is estimated based on the HP and type of pump and includes materials and labor.
Variables:
• Motor Horsepower– The rated horsepower of the recommended motor. It is assumed to be the same horsepower of the original motor.

35
• # Motors – the number of identical motors being evaluated. It is assumed a motor replacement will be a 1:1 swap.
• Motor Load Factor– Motor load factor is assumed to be 85% without a VFD and 50% with a VFD. • 0.7457 – conversion factor of HP to kWh. • Motor Efficiency Value – The motor efficiency value associated with the motor. This is
expressed as a percent on nameplates, so it is converted to its decimal equivalent. • Recommended Motor Efficiency Value – The efficiency rating associated with the recommended
motor. Typically, this is the efficiency associated with a NEMA Premium motor of equivalent specification.
• 100 – conversion factor for percentage. • Annual Run Hours – the number of run hours associated with the motor.
9.6 Air Heating and Building Environment Calculations EnSave’s calculations look at two principal sources of air infiltration, mechanical exhaust ventilation heat loss and heat loss from natural air exchanges. Mechanical exhaust ventilation heat loss is heat loss that occurs from the use of exhaust ventilation fans. Heat loss from natural air exchanges is heat loss that takes place due to wind and stack effect. EnSave’s calculations for this heat loss uses the Lawrence Berkeley Laboratory (LBL) procedure for estimating this value which incorporates building location based on zones, the number of stories of the building, the building surrounding and building tightness factors.
For these calculations, EnSave determines the ACH50 and Ventilation Loss Rate values for each house group using a factor of how tightly sealed the houses are, based on ASABE paper number 1009236, presented at the 2010 ASABE annual International Meeting.
For this project, the Ex-ACH50 = 5.0 and the Ex-Ventilation Loss Rate (cfm/ft2) = 0.60865, the New- ACH50 = 3.7 and the New-Ventilation Loss Rate (cfm/ft2) = 0.5043
For the purposes of this evaluation to calculate the natural air exchanges in the buildings, an LBL factor of 18.5 was used based on the climate region, the number of stories of the building, and the analyst selected sheltering from wind category based on the current view of the facility on Google Maps. This factor is used to convert to estimated air changes by natural means, without fans.
An average annual exterior temperature of 57°F based on the average annual temperature in your State as obtained from National Oceanic and Atmospheric Administration’s (NOAA) National Centers For Environmental Information (NCEI) An average interior temperature of 85°F was used, based on a combination of house size, house construction, the number of birds in the houses, the number of flocks per year, the number and capacity of the minimum vent fans, and the provided fuel use.
The sum of hours the fans are on and off during heating is calculated based on the minimum ventilation recommendations per bird based on age (CFM/Bird), the same average exterior temperature as noted above, the existing number of “minimum ventilation” fans and their CFM, the number of birds per house, and the number of flocks per year.
For the purposes of this evaluation, the number of hours the minimum ventilation fans are on while the heat was on was determined to be 334, and the number of hours the minimum ventilation fans are off while the heat was on was determined to be 2,150.

36
Air Infiltration Exhaust Ventilation Heat Loss (fuel units) = (([Ex-Ventilation Loss Rate] * 1.08 * [Δ Temperature]) * [Annual Heated Hours Exhaust Fans On] * [Plane Area of Building] * [# Identical Buildings]) / [Btu Conversion Factor]
Air Infiltration Natural Air Exchanges (fuel units) = (((((([Ex-ACH50 Factor] / [LBL Factor]) * 0.018) * [Building Volume]) * [Δ Temperature]) * [Annual Heated Hours Exhaust Fans Off]) * [# Identical Buildings]) / [Btu Conversion Factor]
9.6.1 Attic Inlets Attic Inlets are a heat recovery device that uses the trapped warmer attic air to warm the building air. EnSave only assesses for attic inlets if the building has dropped ceilings. EnSave’s calculations assume that the attic inlets would be open while running the exhaust fans and closed otherwise.
If buildings have attic inlets: Estimated Annual Current Use (fuel units)= - (([EX-Ventilation Loss Rate] * 1.08 * 2.5) * [Annual Heated Hours Exhaust Fans On] * [Plane Area of Building] * [# Identical Buildings] * ([# of Attic Inlets] / ([Plane Area of Building] * 0.000747))) / [Btu Conversion Factor]
Estimated Annual Recommended Use (fuel units)= - ([New-Ventilation Loss Rate] * 1.08 * 2.5) * [Annual Heated Hours Exhaust Fans On] * [Plane Area of Building] * [# Identical Buildings] * (1 - ([# of Attic Inlets] / ([Plane Area of Building] * 0.000747)))) / [Btu Conversion Factor]
If Attic inlets are recommended: Energy Savings = Estimated Annual Current Use + Estimated Annual Recommended Use
Cost Savings = Energy Savings (fuel units) * Cost per fuel unit
Implementation Costs: Attic inlets are currently set to an implementation cost of $160 per attic inlet.
Variables: • Ventilation Loss Rate – The average ventilation loss rate for the building, in cfm based on a
factor relating to building tightness. • 1.08 - Conversion factor that turns (cfm · degrees F) to Btus. • 2.5 – EnSave’s calculations assume that the air in the attic is 2.5 degrees Fahrenheit more than
the average indoor temperature of the building. • Annual Heated Hours Exhaust Fans On – The number of hours in a year the exhaust fans were
actively pushing air out of the building while the building was being heated. Attic inlets are assumed to only be open while the exhaust fans are on.
• Plane Area of Building – The area of the footprint of the building being evaluated. • # Identical Buildings – The number of identical buildings being evaluated. • # of Attic Inlets – The current number of attic inlets in the building. • 0.000747 – Constant representing the expected number of attic inlets a building should have for
maximum effectiveness. • Btu Conversion Factor – The number of Btus in a standard unit of fuel. See the section “Btu
Conversion Factors” for more detail.

37
• 1 – In instances where attic inlets are present but not in sufficient volumes the equation only considers installing the difference between the current number of inlets and the expected number of attic inlets for full benefits.
• # of Attic Inlets – The current number of attic inlets in the building.
9.6.2 Stir Fans EnSave’s calculations assume that hot air rises to the ceiling at the same rate of conduction heat loss through the ceiling materials. This produces a heat difference between the ceiling and the floor, and the area of this heat difference is equivalent to the plane area of the building. Using these values, EnSave calculates the amount of heat available that is trapped in the ceiling space that, when the stir fans are on, can be mixed into the air recovering the trapped heat. There is an inverse relationship between stir fan effectiveness and ceiling R-value. Stir fans consume electricity but produce heating fuel savings so the fuel savings is offset by the electricity cost to run the fans in the savings calculation.
EnSave only recommends stir fans if the existing number of stir fans is less than half of the would be recommended number of stir fans. If the building already has stir fans, then EnSave adds stir fans of the exact same type that is already present. If no stir fans are present, then EnSave recommends 18” basket fans with 1/15 hp motors for dropped ceilings and 48” paddle fans for open ceilings.
If buildings have stir fans Annual Estimated Current Use (kWh)= (([# Fans] * [Power] * [# Groups / Year] * (Hours Heaters are On with Fans Off)) / 1,000) * [# Buildings]
For recommended fans Annual Estimated Recommended Use (kWh) = ((((0.0003 * [Plane Area of Building]) – [# Fans]) * [# Buildings] * (([Stir Fan HP] * 746) / 0.7) * [Hours Heaters are On with Fans Off]) / 1,000);
Fuel Savings (Fuel Units) = (([Degree Difference in Ceiling] / [R-value of Ceiling]) / [Btu Value of Fuel]) * [Plane Area of Building] * [Hours Heaters are On with Fans Off]) *0.5* (1-([# Fans] / (0.0003 * [Plane Area of Buildings]))) * [# Buildings]
Cost Savings = (Energy Savings (fuel units) * Cost per fuel unit) – (Annual Estimated Recommended use * cost per kWh)
Variables:
• # Fans – The number of identical fans being evaluated. • Power (Wh) – The amount of electricity the fans consume during an hour of runtime, inwatts
hours. • Hours Heaters are On with Fans Off – EnSave’s calculations assume the stir fans are running only
half the time that the heaters are on and the exhaust fans are off. • # Groups / Year – The number of animal groups that are raised in the building during a calendar
year. • 1,000 – conversion of watts to kilowatts. • # Buildings – The number of identical buildings in the building group. • 0.0003 – Factor for the recommended number of fans in a building per square foot of plane
area.

38
• Plane Area of Building • Stir Fan HP – The horsepower of the fan. • 746 – Conversion factor of horsepower to watts. • 0.7 –Efficiency factor on the fan. • Degree Difference in Ceiling – Open ceilings are assumed to be 8 degrees warmer than the floor,
while dropped ceilings are assumed to be 5 degrees warmer than the floor • Area of Ceiling – The area of the ceiling. • Heat Loss of Ceiling – The heat loss associated with the entire ceiling. If the ceiling has different
R-values in different sections than the average heat loss is used. • Btu Value of Fuel – The Btu value of the heating fuel used by the building.
Implementation costs = (cost per fan * # of fans recommended) + installation costs.
9.6.3 Sealing Air Leaks Savings from Air Infiltration is allocated to individual components for sealing relative to the linear feet of the perimeter of the component where applicable. Solid side wall conversion receives a full 50% of the available savings from air infiltration sealing. Components that are allocated savings from perimeter sealing in their evaluation include vent boxes, tunnel intakes, end wall doors and curtain walls. The remaining portion of savings is allocated to sealing the perimeter of the buildings at the bottom and top sill plates.
Component Savings from Air Infiltration Allocation (fuel units) = (([EX-Air Infiltration Heat Loss from Exhaust Ventilation] + [Ex-Air Infiltration Heat Loss from Natural Air Exchanges]) – (NEW-Air Infiltration Heat Loss from Exhaust Ventilation] + [NEW-Air Infiltration Heat Loss from Natural Air Exchanges]))- [Attic Inlets Savings]) / [Btu Conversion Factor]) * ([Linear Length of Component Perimeter] / [Linear Length of All Recommendations that Reduce Air Infiltration]) * [Building Has Curtain Walls Factor]
Our calculations assume that the buildings, end wall doors, tunnel Inlets, and vent boxes are all quadrilateral and symmetric.
Implementation Costs: Sealing perimeter air leaks is estimated at $1 per linear foot.
9.6.4 Walls, Ceilings, Doors, Brood Curtains, etc. After the air infiltration and stir fan components have been calculated, the remaining fuel allocation is parceled out proportionally to the remaining building components. For these components, EnSave assumes the buildings are comprised of materials that lose heat through conduction at different rates based on their area and R-Value relative to the other components. Areas of minimum ventilation fans are not evaluated for savings since they cannot be covered for safety purposes.
The fuel is allocated to each building relative to the building size and the efficiency of the building components.
Walls/Ceilings/Doors/Brood Curtains/etc. Fuel Loss (fuel units) = (([Fuel from Fuel Use History] - [Fuel Use Allocated to Air Infiltration + Fuel Use Allocated to Stir Fans]) * ([Building Total Heat Loss] / [Total Heat Loss from All Buildings])) + [Building Fuel Use Allocated to Air Infiltration and Stir Fans]

39
Estimated Annual Current Component Heat Loss (btu/h °F) = (([Area of Component] / [Existing R-Value of Component]) * [Grow Out Only Factor]) * [# Buildings]
Current Annual Building Total Heat Loss (btu/h °F) = Sum of (Estimated Annual Current Component Heat Losses.)
Estimated Annual Current Component Use (fuel units) = ((((([Area of Component] / [R-Value of Component]) * [Grow Out Only Factor]) * [# Buildings]) / [Building Total Heat Loss]) * ([Building Fuel Use] – [Building Fuel Use Allocated to Air Infiltration and Stir Fans]]))
Estimated Annual Recommended Component Heat Loss (btu/h °F) = (([Area of Component] / [Recommended R-Value of Component]) * [Grow Out Only Factor]) * [# Buildings]
Recommended Annual Building Total Heat Loss (btu/h °F) = Sum of (Estimated Annual Recommended Component Heat Losses.)
Estimated annual savings per component (fuel units) = ((Estimated Annual Current Component Heat loss- Estimated Annual Recommended Component Heat loss) * ([Building Fuel Use] – [Fuel Use Allocated to Air Infiltration + Fuel Use Allocated to Stir Fans])) + [Savings Allocation from Air Infiltration]) + Component Savings Allocation from Air Infiltration)
Cost Savings = Energy Savings (fuel units) * Cost per fuel unit
Implementation Costs: • Walls:
o The standard recommendation for upgrading walls is to remove the inner sheathing and any existing insulation, and replace it with fiberglass batting, an interior vapor barrier and re-sheath with ½-inch fire retardant plywood. The insulation depth is equivalent to the available stud depth.
o Implementation costs are estimated at $3 / ft2 for 4-inch cavities and $4 / ft2 for 6-inch cavities, plus $1/ ft2 to remove any existing inside sheathing.
• Converting to Sidewall o EnSave evaluates for converting sidewalls to curtain walls by framing out the curtain
opening with the same stud size, type, and depth, adding aluminum, steel, or vinyl siding, and adding fiberglass batting, an interior vapor barrier and sheath with ½- plywood.
o Implementation costs are estimated at $3 / ft2 for 4-inch cavities and $4 / ft2 for 6-inch cavities, plus $1/ ft2 to remove any existing inside sheathing.
• Insulated Curtain: o If the facility would prefer insulated sidewall curtains to a solid sidewall conversion,the
current curtains are evaluated for replacement with R-3 insulated curtains, o Installing insulated curtains is estimated at $1.50 / ft2.
• Foundation Walls: o Currently EnSave has no recommendations for exposed foundation walls. Historically,
EnSave recommended a high-density foam for exposed foundation walls but stopped doing so due to damage from animals and farm equipment.
• Dropped Ceilings:

40
o EnSave evaluates for installing R-19 blown cellulose ceiling insulation and only if the existing R-Value is below 19.
o Installing Blown cellulose is estimated at $0.50/sf • Open Ceiling:
o EnSave evaluates to spray R-7 polyurethane foam to the existing construction if existing R-Value is below 5
o Installing polyurethane foam is estimated at $1.50 / ft2. • End Wall Doors
o Ensave evaluates to install an R-12 end wall door. o End wall door recommendations also receive air infiltration savings relative to their
perimeter. o Installing end wall doors are estimated at $11 / ft2.
• Tunnel Intakes: o Ensave evaluates to install R-7 tunnel intake doors. o Tunnel intake recommendations also receive air infiltration savings relative to their
perimeter. o Installing tunnel doors is estimated at $9.25 / ft2.
• Exhaust Fan Covers: o Ensave evaluates to install R-7 exhaust fan doors, or R-3 exhaust fan bonnets. o Installing exhaust fan doors is estimated to cost $285 / fan door. Installing exhaust fan
bonnets is estimated to cost $30 / fan bonnet. • Brood Curtains
o Although they are an internal component EnSave evaluates brood curtain replacements as other building components and uses a similar heat loss equation but multiplied by 0.2 to account for the brood curtain only being in use for the first week or so of the flock.
o EnSave evaluates to install R-3 brood curtains at a 1:1 replacement (Double curtains are not recommended for single curtains.)
o Installing brood curtains is estimated at $1.20 / ft2. • Vent Boxes
o EnSave evaluates for a 1:1 vent box replacement with an R-value of 1. o Installing vent boxes is estimated at $65 per vent box.
Variables • Ventilation Loss Rate – The average ventilation loss rate, in cfm from ASABE research and based
on building tightness. • 1.08 – Conversion factor that turns (cfm · degrees F) to Btus. • Δ Temperature – The difference between the average outdoor temperature and the average
indoor temperature of the building, in degrees Fahrenheit. • Annual Heated Hours Exhaust Fans On – The number of hours in a year the exhaust fans were
actively pushing air out of the building while the building was being heated. • Annual Heated Hours Exhaust Fans Off – The number of hours in a year the exhaust fans were
off while the building was being heated. • Plane Area of Building – The area of the footprint of the building being evaluated. • # Identical Buildings – The number of identical buildings being evaluated. • Btu Conversion Factor – The number of Btus in a standard unit of fuel. See the section “Btu
Conversion Factors” for more detail. • Fuel from Fuel Use History – The fuel use recorded from utility and fuel delivery records.

41
• Total Fuel Use Allocated to Air Infiltration and Stir Fans – The total fuel use allocated to air infiltration and stir fans across all buildings.
• Total Heat Loss from All Buildings – The total heat loss from all buildings, in Btu / (h⋅°F). • Area of Component – The area of the component being evaluated. • R-Value of Component – The R-Value of the component being evaluated • Grow Out Only Factor- The grow out only factor is used only for the scenario in turkey facilities
where turkeys are brooded in one building but grown in a separate building, with the “grow out” building requiring less heat. The factor is used to better allocate the fuel use. The grow out only buildings have 25% the heat loss of the brood buildings at the same facility. Otherwise this is factor set to 1.
• # buildings – The number of identical buildings. • Building Total Heat Loss – The sum of the heat loss values from all components of the building. • Building Fuel Use – The estimated annual fuel use allocation to the building.
9.6.5 Heaters Estimated Annual Current Use (fuel units) = ([# Heaters] * ([Input Rating] * ((1 - [Radiant Heater Efficiency Bonus]) / [Btu Conversion Factor])) * [Annual Run Hours]) + ([Do Heaters have Pilot Lights?] * ([# Heaters] * ([Btu of Pilot Lights] / [Btu Conversion Factor]) * ([Heating Season in Weeks] * [Hours Per Week Pilot Lights are On]))
Estimated Annual Recommended Use (fuel units) = (([# Heaters] * ([Input Rating] * ((1 - [Radiant Heater Efficiency Bonus]) / [Btu Conversion Factor])) * [Annual Run Hours]) + ([Do Heaters have Pilot Lights?] * ([# Heaters] * ([Btu of Pilot Lights] / [Btu Conversion Factor]) * ([Heating Season in Weeks] * [Hours Per Week Pilot Lights are On])))
Energy Savings (fuel units) = Estimated Annual Current Use – Estimated Annual Recommended Use
Cost Savings = Energy Savings (fuel units) * Cost per fuel unit
Implementation Costs: • The quantity of recommended radiant tube heaters is the amount to equal the current output
Btu/hr. of the building divided by 125,000 btu/hr. per heater. • Tube heaters are estimated to have an implementation cost of $1,100 each. • The quantity of recommended radiant brooders is the amount to equal the current output
Btu/hr. of the building divided by 40,000 btu/hr. • Radiant brooders are estimated to have an implementation cost of $275 each.
Variables:
• # Heaters – the number of identical heaters being evaluated. • Input Rating – The input rating of the heater, in BTU. • Radiant Heater Efficiency Bonus – If the heater is a “Radiant Heater” the efficiency bonus is 0.15,
otherwise this value is 0. (estimating that radiant heaters use 15% less fuel to maintain their input rating than a non-radiant heater.)
• Btu Conversion Factor – The number of BTUs in a standard unit of fuel. See the section “Btu Conversion Factors” for more detail.

42
• Annual Run Hours – the number of run hours associated with the heater. (Either the standard hours/days/weeks equation or EnSave estimates a value based on existing fuel use.
• Do Heaters have Pilot Lights? – 0 if the heaters have electronic ignition, 1 if the heaters have pilot lights.
• Btu of Pilot Lights – Pilot lights are assumed to consume 2,000 Btu/hour during the heating season.
• Heating Season in Weeks – The length of the heating season in weeks • Hours Per Week Pilot Lights are On – Pilot lights are assumed to be on constantly throughout
the heating season.

43
10 Appendix D: Details
10.1 Lighting Details In the following tables, LLD stands for lamp lumen depreciation, LDD stands for lamp dirt depreciation, RSDD stands for room surface dirt depreciation, CU stands for coefficient of utilization, and LLF stands for the Light Loss Factor.
Table LD.1. Poultry House Lighting Schedule
Location Lighting Period # Houses Start Day # End Day # Hours / Day On Light Intensity (%) Est. Annual Run Time (Hours) Brood Brood 4 1 8 23 100 828 Brood Brood 4 9 18 18 100 810
Grow Out 1 Brood 4 9 18 18 100 810 Brood Brood 4 19 28 16 50 360 Brood Brood 4 29 56 16 20 403 Brood Brood 4 57 59 23 20 62
Grow Out 1 Brood 4 19 28 16 50 360 Grow Out 1 Brood 4 29 56 16 20 403 Grow Out 1 Brood 4 57 59 23 20 62 Grow Out 2 Brood 4 19 28 16 50 360 Grow Out 2 Brood 4 29 56 16 20 403 Grow Out 2 Brood 4 57 59 23 20 62
Table LD.2. Existing Poultry House Lighting Adequacy and Coefficients
Description
Area (ft²)
Description
LLD
LDD
RSDD
CU
Weighted
Avg. Lumens per Fixture
LLF
Calculated Light Level
(fc)
Min. Rec. Light Level (fc)
Calculated Light Level
(lux)
Min. Rec. Light Level (lux)
Houses 1-4 Brood Area
Lights
13,440 10W LED lights, 10W
LED lights
0.85
0.95
0.87
0.52
1,000
0.7
1
2.8
13
30
Houses 1-4 Non-Brood
Area 1 Lights
10,080
10W LED lights, 10W LED lights., 10W LED
lights., 10W LED lights
0.85
0.95
0.87
0.58
945
0.7
1
0.5
12
5
Houses 1-4 Non-Brood
Area 2 Lights
10,080
10W LED lights, 10W LED lights, 10W LED
lights, 10W LED lights
0.85
0.95
0.87
0.58
945
0.7
1
0.5
14
5
Table LD.3. Existing General Lighting Adequacy and Coefficients
Description Area
(ft²)
Description
LLD
LDD
RSDD
CU
Weighted Avg. Lumens per
Fixture
LLF
Calculated Light Level
(fc)
Min. Rec. Light
Level (fc)
Calculated Light Level
(lux)
Min. Rec. Light
Level (lux) Houses 1-4
Security Lights 196 150W HPS lights 0.91 0.7 0.87 0.93 15,000 0.46 33 0.2 352 2
Houses 2 Security Light 196 65W CFL lights 0.85 0.7 0.87 0.93 550 0.52 1 0.2 15 2
Manure Shed Light 735 150W HPS lights 0.91 0.8 0.87 0.74 15,000 0.53 8 4.6 85 50
Control Room 3-4 Lights 84 10W LED lights 0.85 0.9 0.87 0.89 1,000 0.67 14 9.3 152 100
Control Room 1-2 Lights 84 57W INC lights,
10W LED lights 0.85 0.9 0.87 0.89 830 0.67 12 9.3 126 100
Office Lights 480 10W LED lights, 57W INC lights 0.85 0.9 0.87 0.89 830 0.67 11 9.3 118 100

44
Description Area
(ft²)
Description
LLD
LDD
RSDD
CU
Weighted Avg. Lumens per
Fixture
LLF
Calculated Light Level
(fc)
Min. Rec. Light
Level (fc)
Calculated Light Level
(lux)
Min. Rec. Light
Level (lux) Generator
Room Lights 150 42W CFL lights 0.85 0.8 0.87 0.82 2,650 0.59 14 4.6 148 50
Table LD.4 Evaluated General Lighting Adequacy and Coefficients
Description Area (ft²)
Description
LLD
Weighted Avg. Lumens per
Fixture
LLF Calculated
Light Level (fc)
Min. Rec. Light Level
(fc)
Calculated Light Level (lux)
Min. Rec. Light Level
(lux) Houses 1-4
Security Lights 196 (7) 41W Dusk-Dawn 4,700 lumen LED lights 0.85 4,700 0.52 12 0.2 124 2
Houses 2 Security Light 196 (1) 27W Dusk-Dawn
2,247 lumen LED lights 0.85 2,247 0.52 6 0.2 59 2
Manure Shed Light 735 (1) 41W Dusk-Dawn
4,700 lumen LED lights 0.85 4,700 0.59 3 4.6 30 50
Control Rooms 1-2 Lights
84
(2) 10W, 1,000 lumen LED light, 10W LED
lights
0.85
950
0.67
13
9.3
144
100
Office Area Lights
90
10W LED lights, (1) 10W, 1,000 lumen LED
light
0.85
950
0.67
13
9.3
135
100
Generator Area Lights 375 (4) 10W 1,000 lumen
LED lights 0.85 1,000 0.59 5 4.6 56 50

45
10.2 Ventilation Details
Table VD.1. Ventilation Adequacy Houses 1 and 2: Exhaust Ventilation Adequacy Design conditions
Inside Goal Temperature (°F) from Fans Only 91 Design Summer Outside Temperature (°F) * 89
Basic house information House Length (ft) 560
House Width (ft) 60 Total Side Wall Height (ft) 6.58
Peak Ceiling Height (ft) 10
Open or Dropped Ceiling (o/d) d
Bird information Number of Birds 35,000
Bird Weight (lbs) 7 Heat Production per Pound (Btu/hr/lbs) 5.8
Side wall construction
Curtain Height (ft) 0 Side Wall Height (excluding foundation) 6
Stem/foundation wall height 0.58
House surface insulation values (ft2*°F*hr/BTU) Ceiling R-Value 14.40 End Wall R-Value 13.5 Side Wall R-Value 13.5
Foundation R-Value 1.33
Total Poultry House Heat Load = 1,501,819 Btu's/hr Existing Ventilation Capacity (CFM)= 387,800 cfm Recommended 'Max' Ventilation Capacity Needed = 280,714 cfm Approximate needed number of tunnel fans @ 22,000 CFM = 12.8 Average Existing air speed = 780 ft/min Existing CFM per square foot of floor space = 11.5 Existing CFM per bird = 11.1 *Some Calculations sourced from UGA Calculator * ASHRAE Summer dry bulb 2 1/2% temperature for the given location was used for the outside temperature.

46
10.3 Building Environment R-Value Details

47
11 Appendix E: Estimated Annual Energy Efficiency Improvements
Table A.1 provides a detailed listing of all recommended measures.
Table A.1. Detail Listing of Recommended Annual Energy Efficiency Improvements Estimated Annual Reduction in Energy Use Estimated Costs, Savings, Payback,
and Prioritization for Implementation Greenhouse Gases Air Pollutant Co- Benefits
Map ID
Recommended Measure
Current Item
Recommended Item
# to Install
Electric Savings (kWh)
Propane Savings
(gal)
Energy
Savings (MMBtu)
Installed Cost [a],
$
Energy Cost
Savings [b],
$/yr.
Payback in Years [a / b],
yr.
Est. Life in
Years
Estimated CO2 (lbs)
Estimated N2O (lbs)
Estimated CH4 (lbs)
Estimated SO2 (lbs)
Estimated NOx (lbs)
A Office Area Lights
(1) 57W INC light
(1) 10W, 1,000 lumen LED light 1 68 0 0.23 $4 $8 0.5 10.0 58.37 <0.01 0.01 0.13 0.06
B Houses 1-4
Security Lights (7) 150W HPS
lights
(7) 41W Dusk-Dawn 4,700 lumen LED
lights
7
4,495
0
15.34
$938
$505
1.9
10.0
3,833.49
0.05
0.34
8.75
3.80
C Control Rooms 1-2 Lights
(2) 57W INC lights
(2) 10W, 1,000 lumen LED light 2 37 0 0.13 $8 $4 2.0 10.0 31.43 <0.01 <0.01 0.07 0.03
D
Houses 1-4: Seal Air Leaks
4 houses with moderate air
sealing
Seal approximately 2,480 linear ft. per house in 4 houses
to eliminate air leaks.
N/A
0
2,136
195.08
$9,920
$2,910
3.4
10.0
26,698.93
1.92
0.43
0.21
27.77
E House 2
Security Light (1) 65W CFL
light
(1) 27W Dusk-Dawn 2,247 lumen LED
lights
1
166
0
0.57
$80
$19
4.2
10.0
141.57
<0.01
0.01
0.32
0.14
F Generator Area Lights
(4) 42W CFL lights
(4) 10W 1,000 lumen LED lights 4 27 0 0.09 $16 $3 5.3 10.0 22.71 <0.01 <0.01 0.05 0.02
G
Houses 1-4: Brood Curtains
4 houses with (4)
uninsulated brood
curtains
Install (4) insulated brood curtains (approximately
1,987 ft² per house) in 4 houses.
16
0
722
65.92
$9,538
$983
9.7
10.0
9,021.47
0.65
0.14
0.07
9.38
H
Houses 1-4: Tunnel Intakes
4 houses with (2)
uninsulated tunnel
curtains
Install (2) insulated tunnel intake doors (approximately 894 ft² per house) in 4
houses.
16
0
2,369
216.39
$32,211
$3,228
10.0
20.0
29,615.69
2.13
0.47
0.24
30.80

48
Estimated Annual Reduction in Energy Use Estimated Costs, Savings, Payback, and Prioritization for Implementation Greenhouse Gases Air Pollutant Co-
Benefits
Map
ID
Recommended
Measure
Current Item
Recommended
Item
# to
Install
Electric Savings (kWh)
Propane Savings
(gal)
Energy
Savings (MMBtu)
Installed Cost [a],
$
Energy Cost
Savings [b],
$/yr.
Payback in Years [a / b],
yr.
Est. Life in
Years
Estimated CO2 (lbs)
Estimated N2O (lbs)
Estimated CH4 (lbs)
Estimated SO2 (lbs)
Estimated NOx (lbs)
I
Houses 1-4:
Ceiling Insulation
4 houses with 33,531 ft² per
house of blown
fiberglass
Install 33,531 ft² per house of ceiling insulation in 4
houses.
N/A
0
3,608
329.53
$67,061
$4,916
13.6
20.0
45,100.52
3.25
0.72
0.36
46.90
J
Houses 1-4:
Exhaust Ventilation Fan
Covers
4 houses with 350 ft² per house of exhaust
ventilation fans
*Install Insulated Fan Covers
(doors/bonnets)
56
0
817/ 635.6
74.63/ 58.05
$15,960/ $1,680
$1,113/ $866
14.3/ 1.9
20.0/
5.0
10,214.52/ 7,945
0.74/ 0.57
0.16/ 0.13
0.08/ 0.06
10.62/ 8.26
Totals 4,793 9,652 898 $135,735 $13,690 9.9 N/A 124,738.70 8.74 2.29 10.29 129.53 *Values for exhaust fan doors are used in the totals

Best Practices Guide Energy Savings Opportunities for Poultry
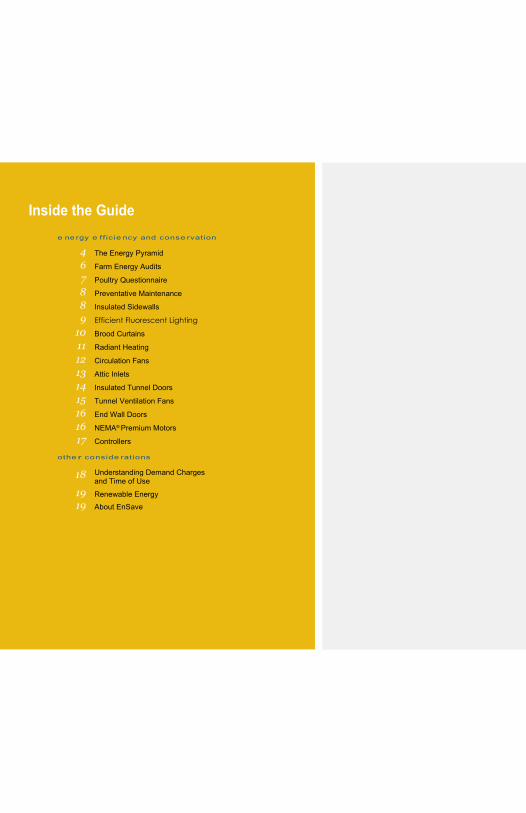
best practices guide | 2 2 | best practices guide
Inside the Guide
e ne rgy e ff icie ncy and conse rvation
4 The Energy Pyramid 6 Farm Energy Audits 7 Poultry Questionnaire 8 Preventative Maintenance 8 Insulated Sidewalls 9 Efficient Fluorescent Lighting
10 Brood Curtains 11 Radiant Heating 12 Circulation Fans 13 Attic Inlets 14 Insulated Tunnel Doors 15 Tunnel Ventilation Fans 16 End Wall Doors 16 NEMA® Premium Motors 17 Controllers
othe r conside rat ions
18 Understanding Demand Charges and Time of Use
19 Renewable Energy 19 About EnSave

best practices guide | 3
“I was amazed by how much I could save by implementing the lighting recommendations
in EnSave’s energy audit report.” — farmer
Welcome to EnSave’s Best Practices Guide.
We have prepared this guide to help poultry producers begin the path toward energy independence.
This guide is intended primarily for broilers, although many measures apply to other types of poultry.

The Energy Pyramid The energy pyramid is a useful concept designed to help people understand the process of using energy efficiently. In some cases too much emphasis is put on renewable energy to solve the nation’s energy needs. Rather than being the first course of action, renewable energy should be considered only after a farm has considered all other steps of the pyramid.
The energy pyramid illustrates the steps in the process of becoming more energy independent, from the simplest and least expensive technique to the most complex.
EnSave, Inc. © 2011
Using Energy Efficiently

RENEWABLE ENERGY The last step on the energy pyramid is renewable energy, which is generating your own energy from naturally replenished sources for use on the farm. Examples include solar power, wind power, methane digesters, and hydroelectricity.
TIME OF USE MANAGEMENT Electricity costs can vary over the course of the day. Running equipment during peak hours can be costly. By running equipment during off-peak hours, money and energy can be saved.
ENERGY EFFICIENCY The third level on the energy pyramid is energy efficiency, which is performing the same services while using less energy. Work smarter and save money with more energy efficient equipment.
ENERGY CONSERVATION The easiest way to conserve energy is to change current behavior: turn off lights if no one is using them, unplug unused equipment, and turn the thermostat lower in the winter and higher in the summer.
ENERGY ANALYSIS This is the very first level towards reducing energy usage. By having an audit or assessment done (or doing an assessment on your own), opportunities to reduce energy use and costs can be identified.
Throughout this brochure, you will find helpful ideas that address each step of the pyramid, from bottom to top.
Get in Touch
Energy
Energy Efficiency
Energy Analysis

Farm Energy Audits EnSave provides farm energy audits for producers across the United States. An energy audit analyzes current energy use and provides recommendations for energy conservation and energy efficiency. There is a tremendous opportunity on the farm to save energy and money by developing a cost- effective plan to upgrade or add energy efficient equipment.
We conduct an initial interview with the farmer to gather information about the operation and explain the audit process.
A local data collector visits the farm to verify and collect information about energy use
Our energy engineers complete a thorough data analysis
We deliver an audit report with energy analysis and recommendations
We follow up with the farmer to answer questions, review the plan’s recommendations, and discuss opportunities for implementation.
We provide several types of energy audits in order to best serve each farmer, and to meet specifications required by various government cost-share programs. EnSave provides farm energy audits for all types of agriculture, including dairy, poultry, swine, greenhouses, and others. We can review electric energy savings as well as propane, natural gas, and diesel. Our farm energy audits serve as a decision-making tool farmers can begin using immediately in order to take control of their energy costs.
6 | best practices guide
1
2
3
4
5

Can Your Farm Benefit from an Energy Audit? For broiler and turkey growers with two or more houses.
Complete the 12-question survey below. If your score is greater than 2, you may benefit from an energy audit. For more details or questions, call an energy expert at EnSave for a free consultation.
Yes = 0 No = 1
1. Do you have an insulated brood curtain?
2. Do you have attic inlets in your house(s)?
3. Do you have ceiling stir fans (used for heating)?
4. Do you have insulated tunnel inlet doors?
5. Do you have electronic controls in the houses?
Yes = 0 No = 2
6. Do you have at least six inches of insulation in/on your ceilings?
7. Is the framed portion of your sidewalls insulated?
8. Has the house(s) been recently sealed from air leaks?
9. Do you use radiant heaters in your house?
Yes = 2 No = 0
10. Are you interested in converting from curtain wall to solid insulated sidewalls?
11. Do you use incandescent lights?
Yes = 1 No = 0
12. Are your tunnel ventilation fans older than 10 years?
Total Score From Both Columns

Installation Tips
Choose lights specifically designed for poultry applications
Choose lights that come with a 3 year warranty or better
Choose lights that have a color temperature between 3,500-6,400 Kelvin
Check with you integrator to make sure LEDs are permitted
If the time is not right for an upgrade, some simple preventative maintenance can often help reduce bills in the short term, and help extend the life of the equipment. Here are some ideas that can be implemented today.
8 | best practices guide
LED Lighting Light-Emitting Diodes (LEDs) are an energy efficient lighting option for poultry housing. They use about 15% of the energy that an equivalent incandescent light uses. LEDs last much longer than any other lighting option, with a useful life range of 40,000- 50,000 hours. LEDs have been proven to stimulate the birds to eat and drink as well as incandescent lights and CFLs. They may cost more initially than other lights, but they last longer and cost less to operate. LED lighting has superior dimming qualities to other lighting options and are capable of dimming to 0% with no flicker.
Before installing LEDs, check with your integrator and your electrician to ensure adequate lighting levels are met and that LEDs are permitted within your growing contract. The American Society of Agricultural and Biological Engineers publishes “Lighting Systems for Agricultural Facilities,” a standard that specifies the minimum lighting level recommended for different types and ages of poultry. It is also important to have a dimmer that is compatible with LEDs. These steps will help facilitate a successful retrofit.
Preventative Maintenance keep equipment clean Remove dust, soot, and debris from equipment including fans, heaters, and lights, to keep the equipment as efficient as possible. Make sure that water and feed lines are clean and not restricted. This extends the life of the equipment, reduces energy use, and keeps the farm running smoothly. inspect regularly Check equipment regularly and replace parts that are showing excessive wear, before they break and cause irreparable damage. fix leaks Air leaks in a poultry house increase heating and cooling loads, making the house less efficient and difficult to control. Seal cracks in the walls and ceiling to prevent any air leaks. Regular inspection helps identify leaks, keeping your poultry houses running efficiently and providing the farmer with more control over the house environment.

Efficient Fluorescent Lighting Compact fluorescent (CFL) and cold cathode fluorescent (CCFL) lighting are more energy efficient than incandescent lights, and poultry houses can be easily retrofitted with these energy efficient lights. CFLs deliver the same amount of light as incandescent lights, but use approximately 25% of the electricity. CFLs may cost more initially, but they cost much less to operate and last up to 10 times as long as incandescent lights.
CCFLs can last up to 25 times longer than incandescent lights and have similar efficiencies to CFLs. Dimmable CFLs have been improved over the years, and CCFLs are very good at dimming. It is important to use a dimmer that is compatible with the type of lights used. Both types of lighting will successfully stimulate birds to eat and drink. For shop lighting or other lighting outside the poultry house, T-8 and T-5 lights with electronic ballasts replace the older T-12s and have several benefits. The T-8s and T-5s use about 25% less energy, generate less noise, more light per watt, better color rendering, minimal flickering, cooler operation, and save on electric costs.
Insulated Solid Sidewalls Curtain walls are a major source of heat loss on a poultry farm. They have low insulation value (R- 1.0), and they allow a large amount of air leakage. Converting curtain walls to solid sidewalls saves a significant amount of energy and gives the farmer more control over the environment of the house.
Insulation works by reducing heat transfer from one area to another. In winter, insulation reduces the transfer of heat from inside the poultry house to the outside air, helping the house stay at warmer temperatures. In summer, insulation reduces the transfer of heat from outside the house to within the house, helping the house stay at cooler temperatures. Insulation helps regulate the temperature within a poultry house, reducing the need of supplemental heating and cooling.
Low-Cost Tips
Choose a dimmer that is compatible with the bulbs.
Use nickel-plated brass keyless sockets.
Choose good quality bulbs.
Clean lights after every flock.
Light work areas, not entire building.
Turn off lights when not in use.
Use sensors or timers where appropriate.
Installation Tips Make sure curtain opening is well sealed.
Make sure insulation fits tight and covers the entire area.
best practices guide | 9

Low-Cost Tips
Check brooding curtain for holes or tears and patch them
Install a steel pipe in the bottom of the brood curtain to create a tight seal with the floor of the house.
Position bird boards a foot or so toward the
Brood Curtains Heating an entire poultry house during the brood period requires a lot of fuel. Most farmers close half of the house off with a brood curtain, only using half of the house for the brood period, significantly reducing fuel consumption.
An insulated brood curtain is a cost effective way to further reduce fuel usage during the brooding period.
non-brooding end of the house for a tighter seal between the curtain and the walls.
For a brood curtain to be effective, it needs to create a tight seal against the walls, floor, and ceiling of the house. Any loose seals or tears in the curtain will allow cold air to leak into the brood chamber, increasing the amount of fuel used to keep the house at the required temperature.
Regular brood curtains have little insulation value (R-1). Insulated brood curtains have more insulation (R-2.5). An insulated brood curtain is a cost effective way to further reduce fuel usage during the brooding period. They are more expensive than uninsulated brood curtains, but the reduction in fuel usage will more than pay for the insulated curtain over the life of the brood curtain. Typical paybacks for an insulated brood curtain are about two years.
10 | best practices guide

Radiant Heating Radiant heaters are the most efficient means of heating a poultry house. Radiant heaters directly heat the objects in a house, allowing the air temperature in a house to be lower than the temperature of the objects. Traditional forced hot air heaters and pancake brooders heat the air in a house. The heat in the air is lost when the air is changed in the house. Radiant heaters use between 15% to 30% less fuel than forced hot air heaters and pancake brooders when installed and managed properly.
In addition to being a more efficient heat source, radiant heaters have other distinct advantages compared to traditional poultry house heaters. Radiant heaters transfer heat directly to the litter pack, removing moisture and heating the litter so that the birds do not lose heat through their feet. Radiant heaters can also be mounted higher in the house, eliminating the need to raise and lower the heaters. Radiant heaters also take less time to preheat a house.
Maintenance and Safety Tips
Clean reflectors and heating elements between every flock.
Check gas lines for leaks between every flock.
Operate heaters at the specified gas pressure.
best practices guide | 11

Benefits from recirculating the air in a poultry house include reduced fuel use, less wear and tear on the heating equipment, and decreased litter moisture.
Circulation (Stir) Fans Circulation fans have been found to be effective at mixing the air in a poultry house to create more uniform temperatures. Circulation fans are used to recirculate warm air from the ceiling to floor level where the birds need it.
Hot air rises to the ceiling of a poultry house, trapping itself out of reach of the birds. A properly designed and installed circulation fan system will move the warm air from the ceiling to the floor without creating enough air flow to chill the birds.
Fans for air recirculation do not need to be large or powerful, and there are several types of fans that will work. Some common types used are 18” basket fans and 48” paddle fans. Benefits from recirculating the air in a poultry house include reduced fuel use, less wear and tear on the heating equipment, and decreased
Low-Cost Tips
Clean circulation fans with a brush or leaf blower after every flock.
litter moisture. Both open and closed ceiling houses can benefit from adding circulation fans to more evenly mix the heat in the house.

Attic Inlets Attic inlets can reduce heating fuel use in a dropped-ceiling poultry house by introducing “pre-heated” air from the attic into the house. Attic inlets work with the ventilation fans to provide clean, heated air from the attic. Daytime temperatures in attics can be as high as 25º F above the outside temperature. The warm attic air reduces the run time of the heating system, which reduces the amount of fuel used as well as reducing wear on the heating system. Attic inlets have also been found to reduce litter moisture by introducing warm, dry air from the attic.
Attic inlets should not be the first step in reducing energy usage in a poultry house. Sealing air leaks and adding insulation are steps to be done before installing attic inlets and will maximize the effectiveness of the attic inlets. There are two main types of attic inlets: gravity and actuated. Gravity attic inlets use the static pressure of the house to open the inlets. Actuated inlets are connected to controllers and can be set to open and close at various times and conditions. Both types are effective tools to reduce energy use in a poultry house if installed and managed correctly.
Low-Cost Tips
Clean inlets between flocks to ensure maximum performance.
Establish proper operating guidelines so that inlets are used during safe and effective periods.
Make sure houses are well-sealed to maximize the effectiveness of the attic inlets.
Check that attic inlet controls are working properly.
best practices guide | 13

Installation Tips
Make sure the tunnel inlet is square and plumb.
Use high quality mounting equipment and hinges.
Make sure winching equipment allows for a full seal of the door.
Make sure the door is properly sized to the inlet.
Tunnel doors have shown a decrease in heating fuel use and a decrease in litter
Insulated Tunnel Doors Tunnel inlets are a significant area for heat loss in a tunnel ventilated poultry house. Traditional tunnel curtains have a low insulation value and can be loose fitting. Insulated tunnel doors were designed to provide more insulation and a better seal for tunnel inlets.
Heaters at the inlet end of the house can run up to 30% more than the heaters in the center of the house when using an ordinary tunnel curtain to seal off the tunnel inlet. Tunnel doors have shown a decrease in heating fuel use and a decrease in litter moisture in many poultry houses.
There are some issues with insulated tunnel doors that need to be addressed to ensure the equipment works in the intended manner. The framing on the tunnel inlet wall needs to be square and plumb to provide a good seal with the door. The winching equipment needs to be properly installed so that the door seals fully against the wall. The door also needs to be properly sized with the tunnel inlet to create a good seal. Metal hinges and mounting equipment have been found to work much better than plastic hardware. Insulated tunnel doors can be a very cost effective investment on the farm when installed correctly.
moisture in many poultry houses.

Tunnel Ventilation Fans Tunnel ventilation fans are exhaust fans located at one end of the poultry house. Two large air inlets are installed at the opposite end of the house. The fans draw outside air through the openings and down the length of the house, producing a wind tunnel effect. This is an efficient method of cooling down the birds during the warmer months and can be combined with evaporative cooling for increased temperature control.
An energy efficient fan may cost more up front, but the lower operating cost will justify this cost over the life of the fan.
Low-Cost Tips
Keep fans clean and well maintained. Dirty shutters can decrease airflow up to 40%.
Check and maintain belt tension on fan motors.
Use cog-type fan belts, as they are typically 2% more efficient than v-belts.
The easiest way to select fans is to choose fans that have been run through standardized tests, such as the ones done by the Bioenvironmental and Structural Systems (BESS) Laboratory at the University of Illinois. BESS Labs tests fans with accessories such as shutters, guards, and cones to determine the efficiency of each fan. An energy efficient fan may cost more up front, but the lower operating cost will justify this cost over the life of the fan.
best practices guide | 15

Benefits of Good End Wall Doors
Seal air leaks, leading to less heating fuel use.
Higher insulation value, leading to less heating fuel use.
Less litter moisture.
Low-Cost Tips
Select the right size motor for the job
Inspect all motors on a regular basis
Clean motors regularly
Replace V-type belts with notched belts
End Wall Doors End wall doors can be a significant area for heat loss if the doors are not in good condition. Warped, poor-sealing doors can allow air leaks, which negatively effect the temperature environment within the poultry house. This can lead to higher heating costs, litter caking, lower feed intake, lower feed conversion efficiencies, and smaller birds.
A good door should be strong enough to withstand the elements, have a good seal to eliminate leaks, withstand the pressurization requirements of the poultry house, and have good insulating properties. Although end doors are only used twice per flock, good doors will save energy all year by reducing air infiltration and heat loss. A door that is durable, insulated, and seals well is an excellent investment and will help save energy on the farm.used to power multiple loads.
NEMA Premium® Motors When installing a new motor or replacing an old motor, consider using a NEMA Premium®
motor. While they may cost more initially, they are often cheaper to operate in the long run.
When purchasing a new motor, take into account the length of time the motor will run, how high electric bills currently are, and the right sized motor for the job. If the motor is only running sporadically, a retrofit to a NEMA Premium® motor may not make sense. However, the longer the motor runs, the greater the potential for savings. In new installations, NEMA Premium® motors are the standard.
Premium efficiency motors are usually made to higher manufacturing standards, and stricter quality controls. For more information, visit: www.nema. org/gov/energy/efficiency/premium/
16 | best practices guide

Controllers Today’s poultry houses require constant monitoring of temperature to maximize bird growth. Traditional controls use thermostats to control the heating and cooling systems in a house. Thermostats can often drift out of calibration, allowing for overheating and over-cooling. Water, feed, and air quality also need to be constantly monitored. These can be overwhelming tasks for a poultry grower without the help of an electronic controller.
Controllers can coordinate heating, cooling, ventilation, and lighting systems so they work in an integrated fashion. The house can then remain in the optimum growing conditions, maximizing the growth rate and feed conversion efficiency of the birds. Energy can also be saved by reducing heating and cooling due to overheating or over-cooling.
Controllers are PC compatible, so regular reports on temperature, feed and water conditions, and even bird weights can be sent directly to the office computer. The data can then be analyzed for trends and trouble areas. Alarms can be set on the controllers to alert a farmer when undesired conditions occur in the poultry house.
Controllers can coordinate heating, cooling, ventilation, and lighting systems so they work in an integrated fashion.
Benefits of a Controller
Controllers can make immediate adjustments to house conditions.
Money, energy, and time saved.

While an energy audit explains where your energy is being used, if demand charges are
a more detailed analysis. To learn about how time of use management can help your farm save money, call EnSave at (800) 732-1399.
To reduce your electric demand, consider:
Moving certain operations to off-peak periods
Avoiding having all equipment running at the same time
Making sure your equipment is properly sized for the need
Implementing electronic controls
Understanding Demand Charges and Time of Use Electric demand is the rate at which electricity is being used by a consumer at any given time, and is measured in kilowatts (kW). The electric utility is concerned about the peak demand because it must maintain power quality with appropriate equipment and capacity to meet this peak. The consumer’s peak demand during the month is based on a moving 15-minute average for that month.
To pay for the generation and transmission capacity to meet peak demand, utilities charge their larger energy users a demand charge based on the single highest 15-minute demand period measured in a month or a specified time period.
Some utilities have different demand rates based on the time of day when the peak occurs. The higher demand rates are for periods of the day when the utility sees higher demand. Since this demand is based on when the energy is used, there may be opportunities to reduce demand charges by better managing the time period in which equipment is used. This is what EnSave refers to as “time-of-use management.”
Reducing demand not only saves you money, but also helps the environment. When utilities do not need to generate as much power, they avoid needing to increase capacity through building new power plants or purchasing more energy from other suppliers.
OTHER CONSIDERATIONS

Renewable Energy It is recommended that, before pursuing a renewable technology, current operations be as energy efficient as possible.
However, once a farm has implemented all cost effective energy efficient equipment, renewable energy projects may make sense.
EnSave offers services to help you decide what your next steps should be regarding renewable energy.
For resource information on wind energy, photovoltaic, geothermal, and other renewable energy technology, call EnSave at 800-732-1399.
About EnSave EnSave is the leading agricultural energy efficiency consulting firm in the United States. We help our clients achieve their energy efficiency goals while also helping farmers save energy and reduce their environmental impact. The inspiration for our work is the hard working men and women on the farm, and we strive to provide solutions that strengthen the farm and provide long- term viability.
Our passion is helping American agriculture become more sustainable and profitable through energy efficiency and resource conservation.
EnSave does not represent or recommend any equipment manufacturer or dealer. Our goal is to help our clients save energy and conserve resources. Please consult a licensed professional before installing any new equipment on your farm.
For more information on how EnSave can work with you, please contact us at (800) 732-1399.
Copyright © EnSave, Inc. 2011. This material may not be reproduced, distributed, transmitted, displayed, or published without the prior written consent of EnSave, Inc. Cover photo of chicks courtesy of USDA.

EnSave, Inc. | 65 Millet Street, Suite 105 | Richmond, VT 05477 1 (800) 732-1399 | www.ensave.com

© ENSAVE, INC. 2011
Check brooding curtain for holes or tears, and patch them.
Install a steel pipe in the bottom of the brood curtain to create a tight seal with the floor of the house.
Make sure the houses are well-sealed and insulated, especially in the brood chamber.
Position bird boards a foot or so toward the non- brooding end of the house for a tighter seal between the curtain and the walls.
Brooding Curtains
It is very important to maintain a high temperature in the poultry house when chicks first enter the house. Chicks like a temperature of approximately 95° F for the first 8-14 days in the house. This time period is critical to developing the skeletal structure, white meat, vascular system, digestive system, and immune system of the birds. If a house is under-heated, the birds will use all of the energy from their feed for body heat instead of using the energy for structural development, inhibiting the growth of the birds.
Heating an entire poultry house to 95° F requires a lot of fuel. Most farmers close half of the house off with a brood curtain, only using half of the house for the first 8-14 days. This greatly reduces fuel consumption in the brooding period. For a brood curtain to be effective, it needs to create a tight seal against the walls, floor, and ceiling of the house. Any loose seals or tears in the curtain will allow cold air to leak into the brood chamber, increasing the amount of fuel used to keep the house at the required temperature.
Comparing Regular Brood Curtains with Insulated Curtains Regular brood curtains have little insulative value (R-1). Insulated brood curtains have more insulation (R-2.5). An insulated brood curtain is a cost effective way to further reduce fuel usage during the brooding period. They are more expensive than uninsulated brood curtains, but the reduction in fuel usage will more than pay for the insulated curtain over the life of the brood curtain. Typical paybacks for an inuslated brood curtain are about two years.
PHOTO COURTESY NARCD
For more information, call EnSave at (800) 732-1399. 65 Millet Street, Suite 105 | Richmond, Vermont 05477 | www.ensave.com
Low-Cost Tips

© ENSAVE, INC. 2015
Exterior LED Lighting
Other Considerations Exterior LED fixtures can be purchased with the housing/ assembly included, or as a retrofit kit. Retrofitting an existing assembly instead of purchasing the lamp and the housing/assembly can reduce installation costs considerably. EnSave recommends referring to the Qualified Products List by the DLC when selecting an LED retrofit kit.
Over the lifetime of one LED fixture, an equivalent standard metal halide bulb would need to be replaced approximately 5 times at an average cost of $12 per lamp. As a result of reducing the number of replacement lamps, the LED provides an additional $60 in savings over the life of the bulb.
HID ballasts have a rated life of about 40,000 hours, which is less than the rated life of an LED. By switching to an LED fixture, additional saving can be found from eliminating the need to replace the ballast of the original fixture, which would occur within the LED’s lifespan.
Exterior Lighting Replacements Light emitting diode (LED) replacements are available for all standard wattages of exterior lighting fixtures. LED fixtures have numerous benefits when compared with standard exterior lighting technologies such as incandescent, mercury vapor, metal halide, halogen, and high pressure sodium. Benefits include lower power consumption to produce the same amount of light, longer fixture life, lower maintenance costs, and no mercury contained in the lamp. When selecting an exterior LED, EnSave recommends referring to the Qualified Products List provided by the Design Lights Consortium (DLC): www.designlights.org/qpl.
Average Fixture Life LED lamps have an average rated life of 50,000 hours, which could result in between 5 and 50 years of life on the farm depending on the use. In contrast, the lifespan of standard exterior lighting technologies ranges from approximately 1,500 to 24,000 hours. Thus, an LED fixture has at least twice the useful life of a standard exterior lighting fixture. Increasing the life span reduces maintenance costs on the farm by minimizing the labor and materials to replace lamps more frequently, adding additional savings beyond the simple payback period.
Cost Savings Example LED fixtures typically consume 50 to 75% less electricity than comparable standard lighting technologies. The table below provides an example of annual energy cost savings achieved by replacing a standard metal halide fixture with an LED fixture. Savings are based on an electric rate of $0.10 per kilowatt-hour and 12 hours per day of use; your actual savings will vary based on electricity rates and daily use.
Lamp Lamp Wattage
Total Fixture
Wattage
Electricity Cost
($/kWh)
Daily Use
(hours) Daily Cost
Yearly Use
(hours) Yearly Cost
% Savings
Standard Metal Halide 175 209 0.10
12
$0.25 4,380
$91.54 62%
LED 80 80 $0.10 $35.04
Savings $0.15 $56.50
LED LAMPS STANDARD METAL HALIDE LAMPS (50,000 hour lifespan) (10,000 hour lifespan)
24hr/day use = 5.7 year effective useful life 24hr/day use = 1.1 year effective useful life 3hr/day use = 45 year effective useful life 3hr/day use = 9.1 year effective useful life
To contact EnSave: (800) 732-1399 | 65 Millet Street, Suite 105 | Richmond, VT 05477 | ensave.com

Efficient LED Lighting
Saving Energy for America’s Farms
Efficient LED Lighting Lighting often represents one of the best opportunities to reduce electricity use on the farm, and lighting retrofits typically have shorter paybacks than other energy efficiency upgrades. Optimizing lighting levels on the farm can reduce energy usage while ensuring a safe and visually attractive work environment. Important factors to consider when optimizing your farm’s lighting system include light quality (color temperature and color rendering index), optimal lighting level for the task or area, and the efficiency and longevity of the light fixtures you are installing. Lighting with a correlated color temperature of 4,000-8,000 Kelvin can improve working conditions and safety.
About LEDs Light-emitting diodes (LEDs) have advanced significantly in recent years. Over the past decade, LED lighting technology has rapidly advanced while prices have decreased by approximately 90%. LED lighting is quickly making other lighting types obsolete due to the sharp increase in efficiency and decrease in cost. According to the United States Department of Energy, LED lighting is projected to achieve a market share of 84% of lighting sales by 2080.
The main advantages of LEDs are their efficiency (measures in lumens per Watt) and their long useful life, which reduces labor and material costs to maintain fixtures. LEDs last much longer than any other lighting option, with a useful life range of 40,000-50,000 hours, and they use about 15% of the energy of an incandescent light. LEDs also have superior dimming qualities compared to other lighting options and are able to dim to 0% with no flicker. However, you may need to purchase a dimmer that is compatible with LEDs.
Important Considerations If you have requirements for certain lighting levels on your farm, check with an electrician to ensure adequate lighting levels are met. The American Society of Agricultural and Biological Engineers (ASABE) publishes a lighting standard with recommended illumination levels in Agricultural Facilities—ASAE EP344.3 “Lighting Systems for Agricultural Facilities.”
Leverage our expertise and experience to answer these questions:
Lighting considerations:
• Choose lights designed for
agricultural applications if possible
• Choose lights that come with a three-year warranty or better
• Consult third-party listings, like the
Design Lights Consortium, to evaluate LED options (www.designlights.org)
• Consider installing timers or
photocells to outdoor lighting
• Consider the use of motion/ occupancy sensors where appropriate
• Keep reflector shields and lenses
clean
To speak with one of our lighting experts, call us at 800-732-1399

For more information, call EnSave at (800) 732-1399. 65 Millet Street, Suite 105 | Richmond, Vermont 05477 | www.ensave.com
© ENSAVE, INC. 2011
Insulated Tunnel Doors
✓ Make sure the tunnel inlet
is square and plumb before installing the door.
✓ Use high quality mounting
equipment and hinges. ✓ Make sure winching
equipment allows for a full seal of the door.
✓ Make sure the door is
properly sized to the inlet.
Insulated tunnel doors can be a very cost effective investment on the farm when installed correctly.
Tunnel inlets are a significant area for heat loss in a tunnel ventilated poultry house. Traditional tunnel curtains have a low insulative value and can be loose fitting. Insulated tunnel doors were designed to provide more insulation and a better seal for tunnel inlets. Heaters at the inlet end of the house can run up to 30% more than the heaters in the center of the house when using an ordinary tunnel curtain to seal off the tunnel inlet. Tunnel doors have shown a decrease in heating fuel use and a decrease in litter moisture in many poultry houses.
Tunnel doors are built into the wall of the house and use winching systems to open and close. The doors open to a 45º angle, directing the air upward and towards the center of the house. This design helps eliminate dead air spots in tunnel ventilated houses, reducing temperature variations in the house as well as reducing litter moisture.
Installing Tunnel Doors for Maximum Energy Efficiency
There are some issues with insulated tunnel doors that need to be addressed to ensure the equipment works in the intended manner. Installation of the doors is the most important issue. A poorly installed tunnel door may perform worse than a tunnel curtain. The framing on the tunnel inlet wall needs to be square and plumb to provide a good seal with the door. The winching equipment needs to be properly installed so that the door seals fully against the wall. The door also needs to be properly sized with the tunnel inlet to create a good seal.
Mounting equipment for the tunnel doors is another important issue to address. Some of the first tunnel door models used plastic hinges and mounting equipment, and many of these components failed prematurely. Metal hinges and mounting equipment have been found to work much better. It is important that quality materials are used on the installation of the doors. If the tunnel door becomes misaligned it will not perform as intended and may do more harm than good.
Insulated tunnel doors can be a very cost effective investment on the farm when installed correctly. The increased R-value and sealing properties of a properly installed tunnel door will provide direct energy savings to the farmer. Be a wise consumer when purchasing tunnel doors for the farm. Make sure the hardware used for mounting is of good quality, and choose an installer who has experience with installing tunnel doors. A properly installed tunnel door system will provide energy savings and reduce litter moisture.
Installation Tips

For more information, call EnSave at (800) 732-1399. 65 Millet Street, Suite 105 | Richmond, Vermont 05477 | www.ensave.com
© ENSAVE, INC. 2011
Tunnel Ventilation Fans ✓ Keep fans clean and well
maintained. Dirty shutters can decrease airflow up to 40%. Clean the shutters once every two months.
✓ Check and maintain belt
tension on fan motors when cleaning the fan shutters, and plan on replacing tunnel fan belts annually. Belt slippage will reduce airflow and increase belt wear.
✓ Use cog-type fan belts, as
they are typically 2% more efficient than v-belts.
Tunnel ventilation fans are exhaust fans located at one end of the poultry house. Two large air inlets are installed at the opposite end of the house. The fans draw outside air through the openings and down the length of the house, producing a wind tunnel effect. This is an efficient method of cooling down the birds during the warmer months and can be combined with evaporative cooling for increased temperature control.
Several factors affect tunnel ventilation fan performance. Airflow is the amount of air that a fan can move and is typically measured in cubic feet per minute (CFM). Efficiency of a fan is typically measured in CFM / watt. Fan performance is dependent on static pressure, and the common pressure used to compare fan performance for broiler houses is 0.10-inches water static pressure. Fan airflow ratio measures a fan’s resistance to performance change at different static pressures. An airflow ratio will be between zero and one, and a high airflow ratio means the fan is more resistant to a change in performance as the static pressure changes. Houses with cool cells require tunnel fans with a high airflow ratio to pull air through the cool cell.
Choosing the Best Ventilation Fans for Your Poultry House
The easiest way to select fans is to choose fans that have been run through standardized tests, such as the ones done by the Bioenvironmental and Structural Systems (BESS) Laboratory at the University of Illinois. BESS Labs tests fans with accessories such as shutters, guards, and cones to determine the efficiency of each fan. An energy efficient fan may cost more up front, but the lower operating cost will justify this cost over the life of the fan.
Fan performance test information from the BESS Labs tests can be found on their website, www.bess.uiuc.edu, along with other useful
information such as fan manufacturer contact information.
Low-Cost Tips

MULTI-USE APPLICATION PERFECT FOR WALLS, ATTICS,
CATHEDRAL CEILINGS AND FLOORS
PROPINK L77 LOOSEFILL INSULATION
INSULATION THAT WORKS AS HARD AS YOU DO THE HIGHEST COVERAGE IN THE INDUSTRY THROUGH YIELD IMPROVEMENT
18% YIELD IMPROVEMENT
HIGHEST COVERAGE IN THE INDUSTRY
I N T R O D U C I N G

Leave it to Owens Corning, the pioneer of fiberglass, to create a new fiber, loosefill product and manufacturing process that is so efficient and versatile, it is revolutionizing the industry. No other loosefill insulation measures up to its coverage, performance and energy-efficiency. PROPINK® L77 LooseFill Insulation leads the industry in thermal performance and yield.
HIGH PERFORMANCE FIBERIZING TECHNOLOGY Owens Corning developed a new fiber which when blown creates a effectively distributed network of thermal reservoirs to resist heat transfer.This High Performance Fiberizing Technology produces a fiber construction that achieves a higher thermal performance in blown applications.
OLDER FIBERS NEW HIGH PERFORMANCE FIBERIZING TECHNOLOGY
A new High Performance Fiberizing Technology boasts effectively distributed thermal reservoirs (see above) to achieve and maintain industry-standard
thermal requirements with less glass material (see below).
PROPRIETARY MANUFACTURING PROCESS To produce PROPINK® L77 LooseFill Insulation, Owens Corning developed a proprietary manufacturing process specifically for loosefill products. This new process resulted in a yield improvement of 18% in terms of product performance.
VERSATILE MULTI-USE APPLICATION PROPINK® L77 LooseFill Insulation has been designed for use in walls, attics, cathedral ceilings and floors.
AIR INFILTRATION IN WALLS PROPINK® L77 LooseFill Insulation also offers exceptional performance for air-infiltration control and thermal protection.
• Easily installed in walls and improved nesting for compaction
• Can now be “dense packed” into walls at an installed density of up to 2.50 pounds per cubic foot*
• Achieves an airflow reduction equal to cellulose, while providing R-Value greater than cellulose**
49% 49% 16
INCHES OF INSULATION TO ACHIEVE R-30
12
Source: Comparative Study on Air Infiltration by NAHB Research Center, 10/09
11
10
9
PROPINK L77
PROPINK RED BAG
JETSTREAM 73.31
INSUL-SAFE SP
CLIMATE PRO
ATTIC GUARD
PROPINK® L77 LooseFill Insulation exhibits unsurpassed versatility—for installation, flexibility, performance, and productivity.
PROPINK L77
2.5 pct
CELLULOSE
3.7 pct
PROPINK L77 12.6
2.5 pct
CELLULOSE
3.7pct
AIR FLOW REDUCTION (%)
INSTALLED R-VALUE (2X4 WALL CAVITY)


I N T R O D U C I N G
PROPINK®
L77 LOOSEFILL INSULATION
MULTI-USE APPLICATION PERFECT FOR WALLS, ATTICS,
CATHEDRAL CEILINGS AND FLOORS
INNOVATION IN VERSATILITY
Owens Corning has been the leader in producing high-quality building materials for over 70 years. Almost
every major technological innovation in glass fiber technology has been the result of our meeting the needs
of our customers.That’s why our insulating products are rated Number One in Builder Magazine Brand Use
Study* for the last 16 years.
Our partnership with professional installers across the country has resulted in a new loosefill formulation
that’s so versatile, it’s changing the way installers work, reducing the amount of time on each job. With
products—like PROPINK® L77 LooseFill Insulation—you increase your productivity on each and every job
because of enhanced coverage, thermal performance and more consistent quality. PROPINK® L77 Insulation
will make your crews more productive, while supplying an exceptional product to your customers. After all,
only Owens Corning could perfect insulation so that it works as hard as you do.
* Hanley Wood, 2010
18% YIELD IMPROVEMENT
HIGHEST COVERAGE IN THE INDUSTRY

PERFORMANCE . PRODUC
PERFORMANCE PROPINK® L77 LooseFill Insulation provides the highest yield of any loosefill insulation currently on the market.
Use less insulation for each job with increased thermal performance.
BETTER COVERAGE • A single 33-pound bag provides 77 square feet of
coverage at R-30 in attic applications.
• That’s a coverage increase of nearly 18% over PROPINK® Unbonded LooseFill Insulation(red bag).
PRODUCTIVITY PROPINK® L77 LooseFill Insulation is certified for use in multiple applications, including walls, attics, cathedral ceilings and floors in new construction and retrofit applications.
Recognize better productivity in your warehouse and on your blow trucks—use PROPINK® L77 LooseFill Insulation across multiple applications.
WAREHOUSE PRODUCTIVITY • With the coverage increase you’ll use less—reducing
space allocation in your warehouse for inventory. • Multiple applications mean the inventory you
carry turns faster.
BAGS OF LOOSEFILL INVENTORY REQUIRED FOR 100,000 SQ/FT OF ATTIC COVERAGE AT R-30
3000
2500
2000
1500
1000
BAGS PROPINK
L77 PROPINK RED BAG
JETSTREAM 73.31
INSUL-SAFE SP
CLIMATE PRO
CELLULOSE
Complete energy performance for the life of the home.
• Non-combustible and non-corrosive
• Non-conducive to moisture retention
• Material design integrity that doesn’t settle, preserving its thermal properties
• Formaldehyde Free
• Resistant to fungus and mold growth
• Third party certified 50% recycled
content—the highest percentage
BLOW TRUCK PRODUCTIVITY
• When a blow truck leaves the shop with PROPINK® L77 Insulation, it provides 18% more coverage—saving fuel costs and improving labor productivity.
BLOW TRUCK CAPACITY (Assuming 150 bags on blowing truck. Insulation value at R-30.)
12000
10000
8000
6000
4000
in the industry. SQUARE PROPINK PROPINK JETSTREAM INSUL-SAFE CLIMATE ATTIC CELLULOSE
FEET L77 RED BAG 73.31 SP PRO GUARD

FOR INSULA TION THA T W ORKS AS HARD AS YOU DO , CHECK OUT PR OPINK ® L77 LOOSEFILL INSULA TION . W ANT T O KNO W MORE

TIVIT Y. PROFI TABILIT Y.
PROFITABILITY PROPINK® L77 LooseFill Insulation saves you time on every job because you need 15% less product to insulate the same area (compared to red bag).
Improve crew productivity with increased thermal performance and consistent quality.
PUT PROPINK® L77 LOOSEFILL INSULATION TO WORK FOR YOU PROPINK® L77 LooseFill Insulation isn’t just a better product, it’s a better product whose performance directly impacts your productivity and profitability. PROPINK® L77 LOOSEFILL INSULATION DOES MORE THAN WORK—IT WORKS FOR YOU!
BLOW TIME
• Blowing time is reduced by 15% depending on blow rates used for each product to insulate the same area (compared to red bag).
ADVANTAGES • Highest coverage—use less product to
achieve the same R-Value
• Save space in your warehouse
• Save space on your truck
• Improve labor productivity—unload trucks faster, spend less time managing
PROPINK L-77 LOOSEFILL INSULATION
MACHINE SETTING
UNBONDED LOOSEFILL INSULATION
(RED BAG) inventory
• Use one product for many applications
• Optimize inventory on hand–improving your inventory turns
• Owens Corning provides recommended machine settings specific to PROPINK® L77 LooseFill Insulation to ensure quick and easy installation.
• The product’s consistent quality requires only minor blowing machine changes during installation, as opposed to complete recalibration.
For appropriate machine settings, call 1-800-GET-PINK for more information.
• Save time during installation & help eliminate builder call backs
• Maximize one of your most valued assets—your blow truck
HIGHER PRODUCTIVITY AND BETTER PROFITABILITY FOR YOU,YOUR CREW AND YOUR BUSINESS.
? C ALL YOUR SALES REP OR VISIT WWW.O WENSCORNING .COM.

WHY PINK IS GREEN™
By delivering solutions that conserve energy and protect the environment, Owens Corning is helping make the world a better place, one community at a time. We manufacture building materials that save energy, reduce reliance on fossil fuels and decrease greenhouse gas emissions around the world.
PROPINK® L77 Loosefill Insulation carries the GREENGUARD® Certification, an industry independent, third-party testing program for low emitting products and materials. In fact, Owens Corning was the first insulation manufacturer to qualify for the stringent GREENGUARD® Product Emission Standard for Children and Schools.
Owens Corning is the first insulation and masonry veneer manufacturer to receive NAHB Research Center GREEN certification which helps builders and designers select products that meet specific green practices and can earn points towards the National Green Building Standard.
Owens Corning glass fiber and foam products made in North America are certified for their recycled content by Scientific Certification Systems (SCS). Our glass fiber products use an average of 50% recycled glass content, and our rigid foam insulation uses an average of 20% recycled content, with all foam scrap recycled back into the process instead of going to landfills
Owens Corning is an ENERGY STAR Partner. ENER- GY STAR is a joint program of the U.S. Environmental Protection Agency and the U.S. Department of Energy helping us all save money and protect the environ- ment through energy efficient products and practices.
MBDC Cradle-to-Cradle CertifiedCM PROPINK® L77 Loosefill Insulation at the Silver level.This certification means a product meets criteria in a number of areas which include: safe and healthy materials; design for reutilization (e.g. recycling); energy efficiency; efficient water consumption and the deployment of socially responsible strategies..
PROPINK® L77 INSULATION APPLICATION CHARTS (information applies to new construction and retrofit applications.) (NOMINAL BAG WEIGHT 33 LBS) ATTICS
R-VALUE BAGS PER 1000 SQ. FT.
MAX NET COVERAGE
MIN WT/SQ. FT.
MINIMUM THICKNESS
(IN)
MINIMUM SETTLED
THICKNESS (IN)
R-13 5.5 182.9 0.180 4.75 4.75 R-19 8.1 124.2 0.266 6.75 6.75 R-22 9.4 106.3 0.311 7.75 7.75 R-26 11.2 89.6 0.368 9.00 9.00
R-30 13.0 77.0 0.428 10.25 10.25 R-38 16.8 59.5 0.555 12.75 12.75 R-44 20.1 49.8 0.662 14.75 14.75
R-49 22.6 44.2 0.747 16.25 16.25 R-60 28.5 35.1 0.940 19.50 19.50
WALLS
R-VALUE MINIMUM THICKNESS
INSTALLED DENSITY LBS. PER CU. FT.
MAXIMUM COVERAGE
PER BAG
BAGS PER 1000 SQ. FT.
MINIMUM WEIGHT LBS.
PER SQ. FT.
R-13 3.5 (2X4) 1.3 87.0 11.5 0.379
R-15 3.5 (2X4) 1.5 75.4 13.3 0.438
R-21 5.5 (2X6) 1.3 55.4 18.1 0.596
R-24 5.5 (2X6) 1.8 40.0 25.0 0.825
This product shows virtually no settling.This information applies to new con- struction and retro applications. Unisol Volu-Matic III machine was used to deter- mine the coverage information above.The machine was set up in 3rd gear, with a 75% open gate and a 3” hose, blowing the wool out in a 10 ft. arc.
FLOORS
R-VALUE MINIMUM THICKNESS
INSTALLED DENSITY LBS. PER CU. FT.
MAXIMUM COVERAGE
PER BAG
BAGS PER 1000 SQ. FT.
MINIMUM WEIGHT LBS.
PER SQ. FT.
R-31 2X8 1.4 39.0 25.6 0.846
R-39 2X10 1.4 30.6 32.7 1.079
R-48 2X12 1.5 23.5 42.6 1.406
OWENS CORNING INSULATING SYSTEMS, LLC ONE OWENS CORNING PARKWAY TOLEDO, OHIO, USA 43659
1-800-GET-PINK®
www.owenscorning.com
CATHEDRAL CEILINGS
R-VALUE MINIMUM THICKNESS
INSTALLED DENSITY LBS. PER CU. FT.
MAXIMUM COVERAGE
PER BAG
BAGS PER 1000 SQ. FT.
MINIMUM WEIGHT LBS.
PER SQ. FT.
R-28 2X8 1.3 42.0 23.8 0.785
R-36 2X10 1.3 32.9 30.4 1.002
R-44 2X12 1.3 27.1 36.9 1.219
Pub. No. 44426-G. Printed in U.S.A. March 2010. THE PINK PANTHER & © 1964–2010 Metro-Goldwyn-Mayer Studios Inc. All Rights Reserved. The color PINK is a registered trademark of Owens Corning. ©2010 Owens Corning.

Energy Star and the Energy Star logo are registered trademarks of the Environmental Protection Agency. The GREENGUARD INDOOR AIR QUALITY CERTIFIED Mark is a registered certification mark used under license through GREENGUARD Environmental Institute. Patents Pending

CONTRACTOR / APPLICATOR BENEFITS
EXCEPTIONAL SPRAYABILITY. Superior formulation provides consistent, forgiving, user friendly foam with predictable yields and less gun clogging.
WINTER AND SUMMER FORMULATIONS. Sprays in any climate; expands your spray window in colder temperatures.
LESS VISCOUS. Reduces wear and tear on equipment.
LOWER ODOR. Improves work environment.
EXCELLENT ADHESION. Ideal for use on all types of substrates.
OWNER / SPECIFIER BENEFITS
ENERGY EFFICIENT. Higher aged R-values than conventional insulation and a seamless air barrier reduce uncontrolled air leakage resulting in lower energy costs. ABAA Evaluated and approved for use in air barrier systems.
DESIGN FLEXIBILITY AND STRENGTH. Adheres to the substrate, allowing for easy monolithic installation for greater structural strength and stability, and enhances resistance to water damage; expands to fill even irregularly shaped and hard to reach areas.
SUSTAINABLE AND HEALTHY. GREENGUARD Gold Certified as safe and healthy for indoor environments; reduces condensation, moisture and mold, provides a sound barrier to help block airborne noise, contains no ozone-depleting chemicals and may contribute up to 20 LEED credits.
LOWER CONSTRUCTION COSTS/VALUE ENGINEERING. Achieve insulation, air barrier, vapor retarder and thermal break all in one for reduced material costs; energy efficiency results in smaller HVAC system requirements.
LONG TERM VALUE. Customers today are concerned about their building’s integrity; spray foam helps a building withstand the tests of the elements and time.
Insulation. Air Barrier. Vapor Retarder. Thermal Break. Gaco 183M Closed Cell Foam provides it all…and more.
ENERGY-EFFICIENT. STRONG. HEALTHY. RESPONSIBLE. QUIET.
Gaco 183M CLOSED CELL FOAM

As building codes continue to become more stringent, and states and localities continue to adopt codes requiring increased energy efficiency and low emissions, Gaco 183M provides a multifunctional solution to the rising cost of building materials required to meet today’s demand for high-performance buildings.
Not only does Gaco 183M offer the exceptional all-around performance that spray foam applicators demand, architects and specifiers will appreciate its design flexibility and sustainable contribution to healthy building interiors, along with the energy efficiency and occupant comfort that owners desire.
USE IN, ON AND AROUND: RECOMMENDED FOR USE IN:
• Walls • Ceilings • Floors • Attics • Crawlspaces • Foundations • Concrete Slabs • Residential Ducts • Plenums • Piping
• Commercial and Industrial Buildings • Metal Buildings • Military Construction and Renovation • Agricultural Buildings • Cold Storage and Freezers • Storage Tanks • Other Industrial Applications and More

Gaco 183M is a two component HFC-blown (zero ozone-depleting) liquid spray system that cures to a medium-density rigid cellular polyurethane insulation material. Gaco 183M contains polyols derived from naturally renewable oils, post-consumer recycled plastics, and pre-consumer recycled materials. This closed cell foam is designed to provide: excellent thermal performance; air impermeable insulation; and, an integral part of an air barrier assembly. Gaco 183M is a Class A (Class 1) fire rated foam that meets the requirements of ICC-ES AC377 Acceptance Criteria for Foam Plastic Insulation. Gaco 183M meets the requirements of AC377 Appendix X for use in attic and crawl spaces without an additional ignition barrier. See Intertek Research Report IRR-1002 for code compliant application information.
PROPERTY* ASTM TEST VALUE UNIT
Core Density: D1622 2.0 ± 10% lbs/ft3
Aged R-Value**: C518 R 6.4 at 1”, R 23.3 at 3.5” (R 6.67 per inch at > 3.5” h · ft2 · °F/Btu Compressive Strength (Parallel to Rise): D1621 32 psi Tensile Strength: D1623 64 psi Water Absorption (96 hours, 2” head, 70-74°F (21-23°C)): D2842 0.71 % by volume Water Vapor Permeance: E96 - Method A 1.12 perm-in Dimensional Stability (7 Days): D2126 L=6%, W=5%, T=3% % linear change Open Cell Content: D2856 2.6 % Air Permeance @ 75 Pa (Infiltration/Exfiltration): E283 0.00 L/s/m2
E2178 0.0013 L/s/m2
Air Barrier Assembly Testing: E2357 0.0027 L/s/m2
Crack Bridging: C1305 Pass @ -15°F (-26°C) Pass Pull Adhesion
Concrete Masonry Unit:
237
kPa Gypsum Sheating (Dens Glass): 162 kPa Oriented Strand Board (OSB): 210 kPa
Fungi Resistance: C1338 Pass no growth
*These items are provided for general information. **Federal Trade Commission regulations published in the Federal Register 16 CFR Part 460 require that R value testing of polyurethane foam insulation must be conducted on aged samples at a 75°F mean test
temperature. Failure to comply can result in substantial fines by the FTC.
SYSTEM THICKNESS FLAME SPREAD INDEX SMOKE DEVELOPED INDEX
Gaco 183M 4” (10.2 cm) 10 400
TEST PERFORMANCE LOCATION FOAM THICKNESS / COATING
AC377, Appendix X Ignition Barrier Attic and crawlspace walls Attic and crawlspace ceiling
Up to 7.5” (19.05 cm) / no coating required Up to 9.5” (24.13 cm) / no coating required
NFPA 286 Thermal Barrier Vertical surfaces Horizontal or sloped surfaces
Up to 5.5” (13.97 cm) / DC315 - 20 mil wet Up to 7.5” (19.05 cm) / DC315 - 20 mil wet
NFPA 286 Thermal Barrier Vertical surfaces Horizontal or sloped surfaces
Up to 5.5” (13.97 cm) / DC315 - 6 mil wet primer & 22 mil wet Up to 9.5” (24.13 cm) / DC315 - 6 mil wet primer & 22 mil wet
Gaco 183M meets or exceeds the IBC requirements for exterior walls in type I, II, III, IV and V construction. This includes NFPA 285 and NFPA 259 testing with Intertek Listings (GWL/FIP 30-02, GWL/FIP 30-01) and one-hour fire resistance rating per ANSI/UL 263 (UL Design W426) which is equivalent to ASTM E119.

VAPOR RETARDER Gaco 183M meets the requirement for a Class II vapor retarder per the International Code Council and ASHRAE when installed at 1.12 inches in depth. AIR BARRIER PERFORMANCE Gaco 183M is an air impermeable insulation (ASTM E283, ASTM E2178); it has passed air barrier assembly testing (ASTM E2357) and has been evaluated by the Air Barrier Association of America in accordance with ABAA D-115-010. INDOOR AIR QUALITY Gaco 183M is a low VOC emitting material and is GREENGUARD Gold Certified (29167-410, 29167-420) (formerly known as GREENGUARD Children & Schools Certification) by UL Environment. This program demands strict certification criteria and considers safety factors to account for sensitive individuals (such as children and the elderly), and ensures that a product is acceptable for use in environments such as schools and healthcare facilities. It is referenced by both the Collaborative for High Performance Schools (CHPS) and the Leadership in Energy and Environmental Design (LEED) Building Rating System. LEED INFORMATION Gaco 183M has a minimum of 8.6% recycled content based on weight, including 6.6% pre-consumer material and 2.0% post-consumer material. Gaco 183M raw materials are blended in Waukesha, WI. Actual polyurethane foam end product production is done on-site by the applicator.
PROPERTY TEST TEMPERATURE ASTM TEST VALUE UNIT
Viscosity – “A” Component Viscosity – “B” Component
77°F (25°C) ASTM D2196 200 ± 50 750 ± 50
cps
Lbs/gal and S.G. – “A” Component Lbs/gal and S.G. – “B” Component
77°F (25°C) ASTM D1638 10.34 / 1.24 10 / 1.20
lbs/gal and S.G.
Mixing Ratio – “A” & “B” Component 77°F (25°C) 1:1 By volume Stability When Stored at 50°F to 70°F (10°C to 21°C)
“A” Component: 12 months “B” Component: 6 months
Months
MATERIAL SUBSTRATE TEMPERATURE
Gaco 183M 40°F to 120°F (4°C to 49°C) Gaco 183MW 30°F to 100°F (-1°C to 38°C)
EQUIPMENT SETTINGS VALUE PRODUCT CHARACTERISTICS VALUE
Pre-Heat: Iso (A) 105°F - 135°F (41°C - 57°C) Cream Time 1 sec Pre-Heat: Poly (B) 105°F - 135°F (41°C - 57°C) Rise Time 3 - 6 sec Hose Heat 105°F - 135°F (41°C - 57°C) Tack Free Time 4 - 8 sec Recommended Spray Pressure 1,000 - 1,200 psi (dynamic) Cure Time 4 hours
Contact us today for solutions to your building project needs. Made in the USA | gaco.com | 877 699 4226
The information herein is believed to be reliable but unknown risks may be present. ALL WARRANTIES OF ANY KIND, EXPRESSED OR IMPLIED, INCLUDING WARRANTIES OF FITNESS FOR A PARTICULAR PURPOSE AND THAT GOODS ARE OF MERCHANTABLE QUALITY, ARE SPECIFICALLY DISCLAIMED. See Gaco Western for information concerning its limited warranty and its availability. For specific Safety and Health information please refer to Material Safety Data Sheet.
MKWF1008 0916

VinylTek 7 Layer Insulated Curtain Ideal for extremely cold climates and the north side of buildings. Helps to reduce your heating costs! Our ClearView models, with a 12" clear PVC strip, allows light in while your curtain is closed. This feature reduces lighting costs while keeping the cold out.
7-Layer Curtain Construction:
2 Outer layers: • One layer 13.5 oz. White vinyl outside. • One layer 5.2 oz. polyethylene vapor barrier inside
5 Interior layers: • Four layers of high tech non- woven insulating materials. One layer 5.2 oz. polyethylene vapor barrier. • Estimated R value of 3. • All 7 curtain layers will not absorb moisture, eliminating the problem of rot and mildew. • Approximately 1/10" thick (when compressed). • Priced per running foot.

- "".
TDD2 LED LED Area Luminaire
Specifications
Width: 9-1/2" (24 .0 cm)
Height: 9-1/8 " (23.0 cm)
Depth: 11 -3/8" (29.0 cm)
Weight: 4.8 lbs. (2.17 kg)
Backplate
Width: 2-3/4" (7cm)
Height: 2-1/ 4" (5.6cm)
Opening: 1-3/4" (4.5cm)
OMA Mounting Arm
(Optional)
Introduction
The popular TDD2 LED luminaire is now available with long-lasting, energy-efficient LED technology . Featuring a classic dayform, the TDD2 LED offers a fresh update to a traditional appearance and is powered by advanced LEDs.
The TDD2 LED luminaire is powerful yet energy efficient, capable of replacing a 175W mercury vapor luminaire while saving 82% in energy costs. The TDD2 LED eliminates frequent lamp and ballast replacements associated with traditional technologie s. Can be wall or post mounted with integral bracket or onto 1-5/8" mast arm .
TDD2 LED
Series Light Engine Color Temperature Voltage Controls Finish Option
TDD2 LED Pl 4,700 lumens SOK 5000K 120 120volts PER Tw ist-lock photocell included
DNA Grey M4
Accessories Ordered and shippe d separately
OMA Mounting Arm
FEATURES & SPECIFICATIONS INTENDED USE The energy savings, long life and easy-t o-install design of the TDD2 LED make it the smart choice for building-and post-mo unted doorway, pathway and yard ill um inat io n for nearly any facility.
CONSTRUCTION Die-cast aluminum housing has an impa ct-resis t ant, polycarbonate lens which protects the LEDs. The fixture is sealed against moisture and environmental contaminants.
FINISH Exteri or parts are p rotected by a therm oset p o wder-coat finish that provides superi or resistan ce to corrosion and weathering. A tightly controlled multi-stage process ensures a minimum 2 mils thickness for a finish that can withstand extreme climate changes witho ut cracking or pee ling.
OPTICS Prote ctive polycarb onate lens covers LEDs. Rem o vable lo wer diffuser provides some up-light for a traditi onal appearance. DesignLights Consortium® (DLC) qualif ied with or without diffuser. Light engine is 5000K (80 min. CRI).
ELECTRICAL Light engine consists of high-p owered LEDs mo unted to the o uter edge of the integral aluminum heat sink to maximize heat dissipation and pr omote long LED life {L87/100,000 ho urs at 25° C). 6kV surge pr otecti on. Elect ronic driver operates at 120V. Twist -lock rep laceable ph otocell is standard.
INSTALLATION Easily mounts to a woo den post or p o le using 2" lag screws, included. Compatible with OMA-1-5/8" mounting arm, so ld separately.
LISTINGS UL Listed to U.S. and Canad ian safety standa rds for wet locati ons.
WARRANTY Five-year limite d warranty. Complete warranty terms located at:
Note: Actual per forman ce may differ as a result of end-user environment and appli cati o n. All values are design or typical values, measured under labo rat o ry conditi ons at 25 °C. Sp ecifications sub ject to chang e with o ut noti ce.
# LITHONIA LIGHTING
TDD2 LED
Rev. 03/22/17
EXAMPLE: TDD2 LED P1 SOK 120 PER DNA M4
Cataloq Num b r
Hit r, r; I- y

1
-
Lumen Output Lumen values are from photometric tests performed in accordance with IESNA LM-7 9-08. Data is consideredto be representative of the configuratoi ns shown, within the tolerances allowed by Lighting Facts.
Perfomr ance Package
CCT
Systme Watts
SOK (SOOOK, 70 CRI)
Pl
5000K
41W
4,700
115
Electrical Load Current (A)
1 20V
0.20
LEGEND
■ 0.2 le ■ 0.5 le ■ 1.0 le
2.0 le
TDD2 LED Pl SOK 120 PER - Mo un ti ng height - 20'
•w C m
C
u
fil
'j >::;
zci
I .L.ITHON.IA ,. J .L.IGHT.ING
TDD2 LED
Rev. 03/22/17
To see complete pho t ometr ic re ports or download .ies file s for t his product, visit the Lit honia Light i ng Out doo r TDD LED ho mepa ge. Tes ted and

ITEM # 712 L10WA19DIM50K.xlsTab
1OW LED A Bulb Dimmable - SOOOK Wet Location
Item # 712
L1OWA19DIM/SOK 1 LAMP SPECIFICATION
1-1 Lamp Type LED A Bulb Dimmable
1-2 Dimmable (Y/N) YES
1-3 Base E26 (Medium Base)
1-4 Lamp Finish/Type A19 Shape
1-5 Lamp Wattage 10W
1-6 Wattage Comparison (FC on Floor) 60W Incand
1-7 Rated Average Life (hours) L70 25,000
1-8 Reliable Operating Temperature -4F to 113
1-9 Wet Location Rated YES
1-10 Enclosed Fixture Rated YES
2 Photometric Characteristics
2-1 Initial Lumens 1000
2-2 Centre Beam Candle Power (Cd) see LM-79 report
2-3 Beam Angle (50% I Max) in Degree 120
2-4 Beam Angle (10% I Max) in Degree 205
2-5 Initial Lumens per Watt 100
2-6 Color Temperature 5000K
2.7 Color Rendering Index (CRI) 80
3 Electrical Characteristics
3-1 Input Line Voltage/Frequency 120V 60 Hz 3-2 Power Factor 0.92
3-3 Lamp rated Wattage 10W 3-4 Input Line Current 95mA
3-5 Total Harmonic Distortion 35% 3-6 Dimming Range in % Full
4 Dimensional Characteristics
4-1 Nominal Length (Inches/mm) 4.25" / 108 mm 4-2 Diameter 2.36" / 60 mm
S Product Information
5-1 Description 10W LED A Bulb Dimmable -5000K, Medium Base - Wet Location
5-2 Primary Application Household Use, Office, Agriculture & Commercial
5-3 Warranty 5 Years from date of purchase
5-4 TCLP Compliant YES 5-6 RoHS Compliant YES
5-5 Energy Star or LM79 (Y/N) LM79 5-8 UL / FCC YES
6 PACKING DETAILS
6-1 Color Box Size (Inches) 1x1 2.44 x 2.44 x 4.72 6-2 Inner Carton Size (cm) 1x12 10.35 x 7.72 x 5.12
6-3 Master Carton Size (Inches) 1x48 16.50 x 11.14 x 11.81 6-4 Gross Weight / Net Weight ( lbs ) 12.50 / 7.94
11/2017© Overdrive For more information visit www.overdrive-lighting.com
Note: This data sheet is not controlled copy & is subject to change without notice. Standard Tolerances apply on data given above.

White 10 3/4"H Dusk to Dawn LED Outdoor Flood Light $59.99 ADD TO CART
FREE SHIPPING on Most Orders* OPEN BOX SIGN IN STORES CHAT 800-782-1967
INSPIRATION SAVED CART 0
/ Outdoor Lighting / Dusk To Dawn / White 10 3/4"H Dusk To Dawn LED Outdoor Flood Light - Style # 3Y658
White 10 3/4"H Dusk to Dawn LED Outdoor Flood Light
11 Reviews | 10 Questions, 13 Answers
$59.99
FREE SHIPPING & FREE RETURNS* | Low Price Guarantee
IN STOCK – Ships in 1 to 2 Days
ADD TO CART SAVE
MORE OPTIONS
VIEW IN YOUR ROOM
PRODUCT DETAILS
Light your outdoor spaces with this LED flood light finished in white with a convenient dusk to dawn sensor.
Additional Info: Add a sense of safety to your home with this outdoor flood light. Featuring a classic white finish and an energy efficient LED option for long lasting illumination. This design has a dusk to dawn sensor, for cost effective savings. Add it to your wall for maximum security. Rubber lens covers are included for deactivating the dusk to dawn sensor if desired.
• 10 3/4" high x 6 1/4" wide x extends 5 3/4" from the
wall.
• Built-in LED module uses 27 watts.
• 4000K, 2240 lumens, comparable to a 100 watt incandescent bulb.
Search
CHAT
1

VENTILATION SYSTEMS
INSIDE TUNNEL DOOR
Low Maintenance, Energy Efficient Tunnel doors help eliminate dead zone areas created by curtain sidewalls and curtain pockets. Cumberland’s Inside Tunnel Door system comes fully assembled and is constructed using a rigid, ultra lightweight, laminate foam panel for easy installation. Choose white or black door panels in 2’, 3’, 4’, 5’, and 6’ heights.
Ratchet bracket option Tension bar option T-Bracing at panel connec-
tion points adds rigidity
Copyright © 2020 by AGCO Corporation C-83_O 01/20

SOUTHWESTERN SALES
Fan Cone Cover Review this product QC Part # 10692 MFR # FANCVR IN STOCK
SIZE 60
$29.79
Protect your fan shutters during cold and windy conditions with a Fan Cover from Southwestern Sales. The 6 oz black/white material helps reduce heat loss in fans.1/4" shock-cord drawstring for securing to fan cone
Description
Copyright © 2022 FDOKUMEN