Energize the Base of the Pyramid (BOP)! - Zenodo
254
-
Upload
khangminh22 -
Category
Documents
-
view
0 -
download
0
Transcript of Energize the Base of the Pyramid (BOP)! - Zenodo


Energize the Base of the Pyramid (BOP)! Contributions to scale-up energy access in Nigeria and Senegal Mart Verhoog, Robert Holländer (Eds.) Studien zu Infrastruktur und Ressourcenmanagement Herausgegeben von Thomas Bruckner, Erik Gawel, Robert Holländer, Daniela Thrän Band 9
Sudien zu Infrastruktur und Ressourcenmanagement Studies in Infrastructure and Resources Management
Herausgegeben von Thomas Bruckner, Erik Gawel, Robert Holländer, Daniela Thrän Universität Leipzig Wirtschaftswissenschaftliche Fakultät Institut für Infrastruktur und Ressourcenmanagement Grimmaische Strasse 12 04109 Leipzig Tel.: +49(0)341 / 9733 870 Fax: +49(0)341 / 9733 879 E-Mail: [email protected] http://www.wifa.uni-leipzig.de/iirm/
Bild Titelseite/Picture Cover: iStockphoto.com/Diversity Studio
Bibliografische Information der Deutschen Nationalbibliothek
Die Deutsche Nationalbibliothek verzeichnet diese Publikation in der Deut-schen Nationalbibliografie; detaillierte bibliografische Daten sind im Internet über http://dnb.d-nb.de abrufbar.
© Copyright Logos Verlag Berlin GmbH 2019 Alle Rechte vorbehalten.
ISBN 978-3-8325-4903-9 ISSN 2191-9623
Logos Verlag GmbH Comeniushof, Gubener Str. 47, 10243 Berlin Tel.: +49(0)30 / 42 85 10 90 Fax: +49(0)30 / 42 85 10 92 http://www.logos-verlag.d

Dieses Buch wurde möglich gemacht durch die freundliche Unterstützung des
This book was made possible with the kind financial support of
Joint International Master in Sustainable Development


Preface In many countries of the Global South, energy infrastructure is holey, unreliable or simply not existent. This leads to different kinds of severe problems. Just to name a few: Family members, mostly women, spend hours every day to collect firewood for cooking. In many cases, they suffer under pulmonary diseases, be-cause they have no access to clean cooking facilities. And companies are less productive without access to electricity. This present edition of Studies in Infra-structure and Resources Management looks at two different energy access scale-up projects in the sub-Saharan countries Nigeria and Senegal.
It is key that people can build their existence on energy access, as this positively impacts so many aspects of life. It is for this reason that the United Nations have stated “Ensure access to affordable, reliable, sustainable and modern energy for all” as a central Sustainable Development Goal in the year 2015.
Students of the Joint International Master on Sustainable Development worked on this topic and on different energy access scale-up projects during their third semester at Leipzig University. In this semester, students are requested to work on an “integration project”: integrating various aspects of sustainable develop-ment in a particular case study. The class of 2017 approached energy access from the interdisciplinary perspective of sustainable development, anchored however in the field of Economics and Management Science to ensure feasibility of their work. We are pleased to present some of their work on off grid energy systems and biogas technology implementation.
Yvonne Ayaribil, Daria Bykova, Georgi Kazandzhiev and Fernandina Celine Setiawan analysed different off-grid renewable electricity generation systems and assessed different technical options. With the help of the energy system simulation software HOMER and multi criteria decision analysis, they very systematically work out pros and cons of different technical setups for a rural community in Nigeria.
Furthermore, Julia Kostin, Marie Strauss and Nika Tavčar analysed different past biogas implementation projects and discussed this topic with different specialists in the field. Based on this, they are able to deviate different Key Success Factors for biogas implementation projects. The result of their work is a detailed and tailor made biogas implementation plan for a rural community in Senegal.
Justified by the significant level of detail and corresponding depth in the work of the authors, we highly recommend practitioners and scientists in the field of en-ergy access scale-up to read these contributions.
Dr. Mart Verhoog Prof. Dr. Robert Holländer
February 2019, Leipzig


Contents of this book The analysis of off-grid renewable electricity generation systems for a community in Sokoto State, Nigeria ................................................................... 1
by Yvonne Ayaribil, Daria Bykova, Georgi Kazandzhiev and Fernandina Celine Setiawan ......................................................................................................... 1
Implementing sustainable domestic biogas projects in rural Tambacounda, Senegal ............................................................................................................ 135
by Julia Kostin, Marie Strauss and Nika Tavčar .............................................. 135


1
The analysis of off-grid renewable electricity generation systems for a community in Sokoto State, Nigeria
by Yvonne Ayaribil, Daria Bykova, Georgi Kazandzhiev and Fernandina Celine Setiawan


3
Table of Contents List of Figures ..................................................................................................... 5
List of Tables ....................................................................................................... 7
List of Abbreviations ........................................................................................... 9
Abstract .............................................................................................................. 13
1 Introduction ............................................................................................... 15
2 Literature Review ...................................................................................... 21
2.1 Background of Nigeria .............................................................................. 21 2.1.1 Geographical and demographical overview ........................................................ 21 2.1.2 Political background ........................................................................................... 24 2.1.3 Economy ............................................................................................................. 25 2.1.4 Policy and Regulatory Framework ..................................................................... 27 2.1.5 Nigeria’s current electricity scene ...................................................................... 29
2.2 Background of the State of Sokoto ........................................................... 30
2.3 Technical overview of renewable energy generation systems ................ 31
2.4 Off-grid renewable energy projects ......................................................... 34 2.4.1 Successful Projects ............................................................................................. 34 2.4.2 Failed projects ..................................................................................................... 35
2.5 Process and barriers to new technology adaptation ............................... 36 2.5.1 Technology diffusion .......................................................................................... 36 2.5.2 Barriers to the implementation of renewable energy (RE) projects in Nigeria ... 37
2.6 Criteria in renewable energy projects decision-making......................... 39 2.6.1 Financial criteria ................................................................................................. 39 2.6.2 Sociopolitical criteria .......................................................................................... 40 2.6.3 Environmental criteria ........................................................................................ 41
2.7 HOMER Pro Software .............................................................................. 43
3 Methodology .............................................................................................. 45
3.1 Village modelling and load assessment .................................................... 45
3.2 HOMER Pro simulations .......................................................................... 45
3.3 Multi-Criteria Decision Analysis (MCDA) .............................................. 52 3.3.1 Scoring method ................................................................................................... 55 3.3.2 Financial Criteria ................................................................................................ 55 3.3.3 Social criteria ...................................................................................................... 56

4
3.3.4 Environmental Criteria ....................................................................................... 57
4 Results ........................................................................................................ 59
4.1 Village profile and load ............................................................................. 59 4.1.1 Village profile ..................................................................................................... 59 4.1.2 Village electricity load profile ............................................................................ 60
4.2 HOMER Pro results .................................................................................. 62 4.2.1 Wind with lead acid batteries .............................................................................. 62 4.2.2 Wind with Lithium-Ion batteries ........................................................................ 62 4.2.3 Diesel system ...................................................................................................... 63 4.2.4 PV and Lead Acid Battery system ...................................................................... 65 4.2.5 PV and Lithium-ion Battery system ................................................................... 68 4.2.6 PV-Diesel hybrid and lead acid batteries ............................................................ 70 4.2.7 PV-Diesel hybrid with Lithium Ion batteries ...................................................... 75
4.3 AHP and scoring results ............................................................................ 79 4.3.1 Main criteria weighting ....................................................................................... 80 4.3.2 Subcriteria weighting and resulting system performance ................................... 81 4.3.3 Social criterion .................................................................................................... 85 4.3.4 Environmental criteria ........................................................................................ 90 4.3.5 System performance in main criteria .................................................................. 96
5 Discussion .................................................................................................. 99
5.1 Comparison of PV-Diesel/Li-ion with other systems .............................. 99
5.2 Other aspects of this electrification project ........................................... 101 5.2.1 Next steps ......................................................................................................... 101 5.2.2 Training system ................................................................................................ 101 5.2.3 Prepaid system .................................................................................................. 102 5.2.4 Financials .......................................................................................................... 102 5.2.5 Exclusion of wind system ................................................................................. 104
6 Limitations and shortcomings ................................................................ 105
7 Conclusion ............................................................................................... 107
List of References ............................................................................................ 109
Appendix .......................................................................................................... 131

5
List of Figures Figure 1: Nigeria Population Pyramid [NIG2016] .................................................................. 22 Figure 2: AHP criteria hierarchization scheme ....................................................................... 54 Figure 3: Scheme of wind turbine with lead acid batteries system........................................... 62 Figure 4: Scheme of wind turbine with Li-ion batteries system ............................................... 62 Figure 5: Scheme of diesel generator system ........................................................................... 63 Figure 6: Scheme of PV/LAB system ........................................................................................ 65 Figure 7: Scheme of PV/Li-ion system ..................................................................................... 68 Figure 8: Scheme of PV/Li-ion system. .................................................................................... 71 Figure 9: Scheme of PV-Diesel/Li-ion system .......................................................................... 75 Figure 10: The criteria’s weight................................................................................................. 80 Figure 11: Diesel system comprehensive non-weighted performance ....................................... 97 Figure 12: PV/LAB system comprehensive non-weighted performance ..................................... 97 Figure 13: PV/Li-ion system comprehensive non-weighted performance .................................. 97 Figure 14: PV-Diesel/LAB system comprehensive non-weighted performance ......................... 97 Figure 15: PV-Diesel/Li-ion system comprehensive non-weighted performance ...................... 97 Figure 16: Weighted performance of 5 systems in all subcriteria ............................................ 100


7
List of Tables Table 1: Population in African countries with and without electricity access [WOR2016] ..... 17 Table 2: Summary of designed systems and its components ..................................................... 46 Table 3: Input parameters for HOMER Pro simulation ........................................................... 47 Table 4: Saaty's fundamental 9-point scale of absolute numbers [SAA2008a] ........................ 54 Table 5: Demographic overview of the modeled village .......................................................... 59 Table 6: Calculation and breakdown of household and village electricity load profile ........... 61 Table 7: Cost summary of diesel system ................................................................................... 64 Table 8: Diesel fuel prices with 15 % increment and resulting costs ....................................... 64 Table 9: Total diesel system electricity generation in kWh per year ........................................ 65 Table 10: Diesel system's emission breakdown .......................................................................... 64 Table 11: Cost summary of PV/LAB ........................................................................................... 65 Table 12: Breakdown of PV/LAB components cost .................................................................... 66 Table 13: Breakdown of PV/LAB components performance ...................................................... 67 Table 14: Cost summary of PV/Li-ion system ............................................................................ 68 Table 15: Breakdown of PV/Li-ion components cost ................................................................. 69 Table 16: Breakdown of PV/Li-ion system components performance ........................................ 70 Table 17: Cost summary of PV-Diesel/LAB system .................................................................... 71 Table 18: Breakdown of PV-Diesel/LAB system components cost ............................................. 72 Table 19: Breakdown of PV-Diesel/LAB system electricity generation ..................................... 73 Table 20: Breakdown of PV-Diesel/LAB system components performance ............................... 73 Table 21: Breakdown of PV-Diesel/LAB system emissions ........................................................ 75 Table 22: Cost summary of PV-Diesel/Li-ion system ................................................................. 76 Table 23: Breakdown of PV-Diesel/Li-ion system components cost .......................................... 77 Table 24: Breakdown of PV-Diesel/Li-ion system electricity generation ................................... 77 Table 25: Breakdown of PV-Diesel/Li-ion system components performance ............................. 78 Table 26: Breakdown of PV-Diesel/Li-ion system emissions ..................................................... 79 Table 27: Pairwise comparison results of the main criteria ...................................................... 80 Table 28: Pairwise comparison of economic subcriteria ........................................................... 81 Table 29: Weights of economic subcriteria ................................................................................ 82 Table 30: Each system's economic subcriteria performance ...................................................... 82 Table 31: Diesel system economic subcriteria scores and weighted results .............................. 83 Table 32: PV/LAB system economic subcriteria scores and weighted results ........................... 83 Table 33: PV/Li-ion Diesel economic subcriteria scores and weighted results ......................... 84 Table 34: PV-Diesel/LAB system economic subcriteria scores and weighted results ................ 84 Table 35: PV-Diesel/Li-ion system economic subcriteria scores and weighted results ............. 85 Table 36: Pairwise comparison of social subcriteria ................................................................. 85 Table 37: Weight of social subcriteria ....................................................................................... 86 Table 38: Assessment of main components' social subcriteria performance .............................. 87 Table 39: Diesel system social subcriteria scores and weighted results .................................... 88 Table 40: PV/LAB system social subcriteria scores and weighted results ................................. 88

8
Table 41: PV/Li-ion system social subcriteria scores and weighted results............................... 89 Table 42: Diesel/LAB system social subcriteria scores and weighted results ............................ 90 Table 43: PV-Diesel/Li-ion system social subcriteria scores and weighted results ................... 90 Table 44: Pairwise comparison of environmental subcriteria ................................................... 91 Table 45: Weights of environmental subcrtieria ........................................................................ 91 Table 46: Assessment of main components' environmental subcriteria performance ................ 92 Table 47: Diesel system environmental subcriteria scores and weighted results ....................... 93 Table 48: PV/LAB system environmental subcriteria scores and weighted results .................... 94 Table 49: PV/Li-ion system environmental subcriteria scores and weighted results ................. 94 Table 50: PV-Diesel/LAB system environmental subcriteria scores and weighted results ........ 95 Table 51: PV-Diesel/Li-ion system environmental subcriteria scores and weighted results ...... 95 Table 52: All systems’ weighted results of the main criteria ...................................................... 96

9
List of Abbreviations AHP Analytic Hierarchy Process
BOP Bottom of Pyramid
CDM Clean Development Mechanism
CER Certified Emission Reduction
CIA Central Intelligence Agency
CO carbon monoxide
CO2 carbon dioxide
COE Cost of Electricity
ECN Energy Commission of Nigeria
EIA Energy Information Administration
EIA Environmental Impact Assessment
EIU Economist Intelligence Unit
EoL End-of-Life
EPSR Electric Power Sector Reform
EU European Union
FDI Foreign Direct Investment
GDP Gross Domestic Product
GEDAP Ghana Energy Development and Access Project
GHGs Greenhouse Gases
GIZ Deutsche Gesellschaft für Internationale Zusammenarbeit
GW gigawatt
GWP Global Warming Potential
HOMER Hybrid Optimization of Multiple Energy Resources
IMF International Monetary Fund
IRENA International Renewable Energy Agency
ISO International Organization for Standardization
JAEF Jigawa Alternative Energy Fund
kWh kilowatt per hour

10
LCA Life Cycle Assessment
LGA Local Government Area
Li-Ion Lithium-Ion
m/s meter/second
MAUT Multi-Attribute Utility Theory
MCDA Multi-Criteria Decision Analysis
MJ megajoule
MLP Multi-Level Perspective
NASA National Aeronautics and Space Administration
NBS National Bureau of Statistics
NEEDS National Economic Empowerment and Development Strategy
NEPA National Electric Power Authority
NERC Nigerian Electricity Regulatory Commission
NESP Nigerian Energy Support Programme
NGO Non-governmental Organization
NIPP National Integrated Power Projects
NPC Net Present Cost
NREDA National Renewable Energy Development Agency
NREEEP National Renewable Energy and Energy Efficiency Policy
NREL National Renewable Energy Laboratory
O&M Operation and Maintenance
OPEC Organization of the Petroleum Exporting Countries
PHCN Power Holding Company of Nigeria
PM particulate matter
PV photovoltaic
PV/LAB Photovoltaic with Lead Acid Battery
PV/Li-Ion Photovoltaic with Lithium-Ion Battery
PV-Diesel/LAB Photovoltaic and Diesel generator with Lead Acid Battery

11
PV-Diesel/Li-Ion Photovoltaic and Diesel generator with Lithium-Ion Battery
R&D Research and Development
REA Rural Electrification Agency
REF Rural Electrification Fund
REMP Renewable Energy Master Plan
SELF Solar Electric Light Fund
UNDP-WHO United Nations Development Programme – World Health Organization
UNEP United Nations Environment Programme
UNICEF The United Nations Children's Emergency Fund
US DOE United States Department of Energy
US EPA United States Environmental Protection Agency
USAID United States Agency for International Development


13
Abstract Up to this time, the majority of the Nigerian population inhabits the rural areas and do not have access to electricity. The aim of this paper is to recommend an off-grid renewable electricity generation system that is economically, socially and environmentally appropriate for the rural population of the State of Sokoto, using HOMER Pro software and Analytic Hierarchy Process (AHP).


15
1 Introduction Throughout the last decades, the different paces of socio-economic development engendered the North-South divide. Universally, low-income population has be-come an unattractive and neglected market category. The negligence is due to the significant role of money, in a society where financial well-being was the engine of progress and solution to all problems. This led to the non-perceived importance of the portion of the population that did not possess “enough” financial wealth. In the eyes of profit-seeking companies, customers from developed countries are the target group generating financial gains, leaving the economic development of countries of the South even further behind and dependent on the acts of benevo-lent NGOs.
In the era of globalization, the situation has drastically changed specifically for the poorest of the poor who have become an enticing target market. Prior to the beginning of the new millennium, researches and business players completely disregarded the economic potentials of the bottom of pyramid (BOP). Prahalad, an Indian economist, was the first one to focus on studying the BOP. He analyzed new tendencies in global markets and emphasized underestimated role of people living in the bottom, as potential consumers. Prahalad concluded that poor people represent vast and promising segment for companies willing to expand into new markets [PRA2002].
Even though Prahalad concentrated his research mostly on market strategies and new ways of running a business, his theory was widely disseminated throughout different disciplines. Prahalad and Hart [2002] pointed out the importance of peo-ple living in the bottom of the pyramid and the role they can play in solving global problems because of its sheer volume, the BOP market has a massive potential. Investments in those markets would potentially bridge rich and poor and narrow the gap between developed and developing countries. This allegation is based on the idea that exploration of low income markets leads to the generation of profit for the companies and the economic growth of the poor population, or in short, a win-win situation for both sides. Undoubtedly, further and deeper studies on the BOP are needed, however, Prahalad’s concept revealed the potentials low strata and provided a different angle to the BOP issue [CON2007].
The Financial Times [2014] gave the general definition to BOP:
The Bottom of the Pyramid (BOP) is a socio-economic concept that allows us to group that vast segment - in excess of about four billion - of the world’s poorest citizens constituting an invisible and un-served market blocked by challenging barriers that prevent them

Ayaribil, Bykova, Kazandzhiev, Setiawan
16
from realizing their human potential for their own benefit, those of their families, and that of society's at large (para 1).
According to the statistics provided by Confederation of Danish Industries, 4 bil-lion people around the globe live on less than US$ 2 per day. The low-income market constitutes the majority of the consumers in the countries from Sub-Sa-haran Africa and Asia, and covers parts of Latin America, Eastern Europe and the Caribbean region. Despite the fact that 2.86 billion or 83 % of the Asian pop-ulation lives under the poverty line, this fraction stays relatively low in respect to the proportion in Sub-Saharan Africa where 95 %, i.e. 486 million of the people, live in poverty [HAM2007]. Sub‐Saharan Africa was the only region among all other developing regions that showed negative performance trend. This down-ward trend is indicated by the dramatically increasing number of poor people in the last three decades, from 205 million in 1981 to 414 million [WOR2010].
One of the ways to break people out of the poverty box is electrification, an es-sential phase of any modern civilization. Despite the large number of people without access to electricity, many see it as one of the basic human rights. For this reason, electrification of poor regions can be assumed as the first step towards poverty eradication. The proportion of poor people is concurrent with the lack of electricity access and in Africa this is remarkably high. More than 600 million people, most of whom live in Sub-Saharan regions have no access to electricity. All this information shows that Sub-Saharan Africa is the region that deserves the most attention. That is the reason why the main objective of this paper, is to sustainably provide electricity to the region.
It is, however, unrealistic to cover the entire region of Sub-Saharan Africa in the scope of a single study. Therefore, a preliminary research was conducted in order to narrow down the selection to one country. All 48 Sub‐Saharan African coun-tries were analyzed. A table of relevant information i.e. population size, percent-age of population with and without access to electricity and market size was cre-ated. The first elimination criterion was market size that represents the absolute number of inhabitants in the country who do not have access to electricity. Sub-sequently, four countries with the biggest market sizes i.e. Tanzania, Nigeria, Ethiopia and Democratic Republic of Congo were selected for a more profound analysis. Table 1 provides a detailed overview on countries’ parameters.

Off-grid renewable electricity systems in Nigeria
17
Table 1: Population in African countries with and without electricity access [WOR2016]
No Country Population (million)
Access to elec-tricity (% of population)
Without access to electricity (% of
population)
Market size electricity (million)
1 Angola 28.813 32.0 % 68.0 % 19.593
2 Benin 10.872 34.1 % 65.9 % 7.165
3 Botswana 2.25 56.5 % 43.5 % 0.979
4 Burkina Faso 18.646 19.2 % 80.8 % 15.066
5 Burundi 10.524 7.0 % 93.0 % 9.787
6 Cabo Verde 0.54 90.2 % 9.8 % 0.053
7 Cameroon 23.439 56.8 % 43.2 % 10.126
8 Central African Republic 4.595 12.3 % 87.7 % 4.028
9 Chad 14.453 8.0 % 92.0 % 13.294
10 Comoros 0.796 73.8 % 26.2 % 0.209
11 Congo, Dem. Rep. 78.736 13.5 % 86.5 % 68.107
12 Congo, Rep. 5.126 43.2 % 56.8 % 2.914
13 Cote d'Ivoire 23.696 61.9 % 38.1 % 9.028
14 Equatorial Guinea 1.222 67.6 % 32.4 % 0.396
15 Eritrea 4.475 45.8 % 54.2 % 2.424
16 Ethiopia 102.403 27.2 % 72.8 % 74.549
17 Gabon 1.98 89.5 % 10.5 % 0.208
18 Gambia 2.038 47.2 % 52.8 % 1.076
19 Ghana 28.207 78.3 % 21.7 % 6.121
20 Guinea 12.396 27.6 % 72.4 % 8.970
21 Guinea-Bissau 1.816 17.2 % 82.8 % 1.504
22 Kenya 48.462 36.0 % 64.0 % 31.016
23 Lesotho 2.204 27.8 % 72.2 % 1.591
24 Liberia 4.614 9.1 % 90.9 % 4.192
25 Madagascar 24.896 16.8 % 83.2 % 20.708
26 Malawi 18.092 11.9 % 88.1 % 15.939

Ayaribil, Bykova, Kazandzhiev, Setiawan
18
(Continuation of Table 1) 27 Mali 17.995 273 % 72.7 % 13.084
28 Mauritania 4.301 38.8 % 61.2 % 2.632
29 Mauritius 1.263 99.2 % 0.8 % 0.010
30 Mozambique 28.829 21.2 % 78.8 % 22.711
31 Namibia 2.48 49.6 % 50.4 % 1.251
32 Niger 20.673 14.3 % 85.7 % 17.715
33 Nigeria 185.99 57.7 % 42.4 % 78.767
34 Rwanda 11.918 19.8 % 80.2 % 9.558
35 Sao Tome and Principe 0.2 68.6 % 31.4 % 0.063
36 Senegal 15.412 61.0 % 39.0 % 6.011
37 Seychelles 0.095 99.5 % 0.5 % 0.000
38 Sierra Leone 7.396 13.1 % 86.9 % 6.427
39 Somalia 14.318 19.1 % 80.9 % 11.589
40 South Africa 55.909 86.0 % 14.0 % 7.827
41 South Sudan 12.231 4.5 % 95.5 % 11.677
42 Sudan 39.579 44.9 % 55.1 % 21.808
43 Swaziland 1.343 65.0 % 35.0 % 0.470
44 Tanzania 55.572 15.5 % 84.5 % 46.958
45 Togo 7.607 45.7 % 54.3 % 4.131
46 Uganda 41.488 20.4 % 79.6 % 33.024
47 Zambia 16.591 27.9 % 72.1 % 11.962
48 Zimbabwe 16.15 32.3 % 67.7 % 10.934
Among the four countries with the worst electrification rates in comparison to the population and electricity market size, as displayed in the Table 1, Nigeria was the most compelling choice. First, Nigeria’s market size, consisting of people without electricity access proves to be the highest number in comparison with other states, more than 78 %. However, it is worth pointing out, that half of Ni-gerian population with access to electricity suffer from power outages and inef-

Off-grid renewable electricity systems in Nigeria
19
ficient use of existing on-grid and off-grid lines [ISM2012]. The discrepancy be-tween the claimed electricity generation capacity and the actual generated and distributed electricity is one of the drivers for selecting Nigeria as this paper’s focus country over the other three countries.
Analysis from the World Bank [2017] shows that the average annual per capita electricity consumption of Nigeria (147 kWh) is one fifth of that of an average low middle-income country consumption (736 kWh) and one twentieth of the global average consumption (3,298 kWh). The bank also states that in order to achieve universal access to electricity by 2030, Nigeria would need to connect between 500,000 to 800,000 households per year and add around 25 GW to its actual operating capacity. The majority of the unserved people live in rural areas and do not have access to electricity. Therefore, both grid and off-grid extensions are needed to provide quality services to the unserved and underserved house-holds and businesses in a timely manner.
Another reason why this contribution focuses on Nigeria is because of its infa-mous resource curse phenomenon. This country is vastly endowed with natural resources, i.e. oil and gas and yet it is still one of the poorest nations in the world [MOB2014].
Nigeria is a diverse nation in terms of urbanization and development level and the distinction is palpable. According to the statistics [GIZ2015], the South of Nigeria, and especially the State of Lagos, is characterized by a high rate of ur-banization. Since the main purpose of this contribution is to electrify BOP rural areas, remoteness from cities and on-grid lines was one of the selection criteria. Consequently, only the Northern part of the country was further analyzed. To make the case of renewable energy project stronger, this part of the country is marked by high solar radiation potential (25.2 MJ/m2/day, while it is 12 MJ/m2/day in the South) and relatively high wind velocity [GIZ2015].
However, the terrorist attacks and present activities by Boko Haram on the North-Eastern Nigeria render that region too hostile for any projects. Thus, this contri-bution focuses primarily on the Northwestern region. As a result, Sokoto State in north Nigeria, the most populous and most corrupt state, was selected for this research. Because of all the aforementioned reasons, the aim of this research is to identify the most appropriate renewable technology for providing electricity to the people from the bottom of the pyramid in rural area of Sokoto state. This work, therefore, addresses the following research question:
Considering the renewable energy potentials, which of the following:
1. Diesel generator energy system
2. Solar PV module with Lead Acid battery storage (PV/LAB)

Ayaribil, Bykova, Kazandzhiev, Setiawan
20
3. Solar PV module with Lithium-ion battery storage (PV/Li-ion)
4. Hybrid Solar PV module-Diesel generator with Lead acid battery storage (PV-Diesel/LAB)
5. Hybrid Solar PV module-Diesel generator with Lithium-ion battery sto-rage (PV-Diesel/Li-ion)
6. Wind turbine with Lead Acid battery storage (Wind/LAB)
7. Wind turbine with Lithium-ion battery storage (Wind/Li-ion)
would be the most suitable system for the electrification of a model village in Sokoto state, Nigeria?
In order to answer the research questions, this work applies the following scien-tific methods:
x Literature review
x Village modelling
x HOMER Pro calculation
x AHP analysis
Section 2 of this contribution consists of a literature review, which provides an overview on current geographical, political, economic and social situation in Ni-geria and Sokoto state. Section 3 defines the methodology and its details. Village profile and load, as well as the results from HOMER Pro calculation and AHP analysis can be found in Section 4. The results of the scores and a few other elements will be discussed in Section 5. This contribution will end with some limitations and shortcomings of our findings.

Off-grid renewable electricity systems in Nigeria
21
2 Literature Review To review the most promising literature for the topic of this contribution, the following literature approach was used. An initial literature research was con-ducted to obtain literature on the political and socio-economic background of Ni-geria and the State of Sokoto, as well as the off-grid energy systems and their financial, social and environmental parameters. With this, keywords were de-fined and used to search databases (e.g. Elsevier) systematically.1 To gain access to secondary data, a more explorative literature review was conducted. This data collection process considered literature found on the Internet, which included case studies, project assessments and other publications in the fields of research.
2.1 Background of Nigeria
2.1.1 Geographical and demographical overview
Nigeria is well known as the largest African oil producer. The following para-graphs will give an insight on the geographical and demographical characteris-tics, on the energy potentials, and the current political and economic situation in the country.
Geographical aspects
Nigeria is the 14th largest country in Africa with a total area of 917,434 km2. This area is divided into plains and highlands by two main rivers i.e. the Niger and the Benue. Most of the country’s territory is 600 meters above sea level. The climate is mostly tropical with annual average temperatures above 25 °C. How-ever, there are climatic differences within the country. For instance, northern part is dry and hot with limited precipitation and high annual temperatures, whereas the southeastern part and the coastal territory are typically wet [GIZ2015].
Nature has endowed Nigeria with large deposits of mineral resources, such as non-ferrous ores and rare metal ores reserves, especially oil [MOB2014]. Ac-cording to the data from OPEC [2016], Nigeria crude oil reserves stand at about 37 million barrels and proven natural gas reserves are at about 5.5 billion m3. Mining activities are mainly concentrated within the Gulf of Guinea oil and gas basin.
1 Keywords included Nigeria, Sokoto State, off-grid electrification, battery storage, hybrid sys-
tems, etc. As the investigated technologies are rather new and rapidly evolving, the search range was limited to the past decade (2007 - 2017). Additionally, the search on Nigerian background, climatic conditions and AHP methodology was expanded to years prior to 2007.

Ayaribil, Bykova, Kazandzhiev, Setiawan
22
Demography
Nigeria, like many other countries in Sub-Saharan Africa where fertility rate re-mains high, currently faces a population explosion. Since 1960 there has been a stable population growth of around 2.6 % annually. As a result, Nigeria is the seventh most populous country in the world with 190.9 million people in total in total [WOR2015]. According to the last United Nations Report [2017], the pro-jected population number of Nigeria will overtake that of the United States and would become the third largest country in the world by 2050 with more than 400 million. The population density is approximately 200 per km2, the exact amount varies in different sources. However, population distribution throughout the country is highly uneven. In urban coastal areas, where business activities take place, the number of inhabitants is very high. For instance, the population in La-gos is more than 17 million people, whereas most of cities on the north are only half the size [GIZ2015].
As Nigeria’s age pyramid is expansive, it is worth noting that the dependency ratio is high. Children younger than 14 years of age, constitute more than 43 % of the total population. In terms of sex distribution, there is an almost equal num-ber of men and women in population structure. However, their life expectancy is low - 53 for men and 55 years for women [UNI2017].
Figure 1: Nigeria Population Pyramid [NIG2016]
The majority of people inhabiting the northern and the southwestern part of Ni-geria adhere to Islam while the people in other states practice either Christianity or traditional beliefs. However, the latest research from the Pew Research Center

Off-grid renewable electricity systems in Nigeria
23
[2017] in 2010 has shown a significant increase in the Christian share among Nigerians - more than 50 % are Christians now.
Renewable Energy Potential aspects
Renewable energy is the energy which is produced using natural resources that are constantly replaced and never run out (RENn.d.-b]. This could be solar irra-diance, hydropower, geothermal heat, wind, waves or tides. In the present time, more countries apply to renewable energy in the light of natural resources deple-tion. According to Oyewo, Aghahosseini & Breyer, scientists from the Finnish Lappeenranta University [2017], the energy sector in Nigeria could shift to 100 % renewable energy by 2050. The assessment shows there has been a stable growth in total renewable energy generation projects, rising to 2062MW in 2016.
x Hydropower utilizes generated energy between water level differences. Nigeria has a high potential for this form of energy which however re-mains unexploited. Undoubtedly, hydropower capacity varies from year to year and depends on precipitation level. The main river in the country i.e. Niger is abundant in rapids and waterfalls. Thus, the river is appropri-ate for constructing dams e.g. Kainji dam [BRI2017]. Hydropower poten-tial of other small rivers, such as Gaha, Sokoto and others can be further utilized [OHU2011].
x Wind creates energy from the movement of air, which can be used to turn the blades of wind turbines, that subsequently drives electrical generators to produce electricity [UDO2017]. Preliminary studies reveal that wind potential in Nigeria varies from north to south. On the coastal area, it is relatively low in comparison with northern states. In Sokoto state, the av-erage wind speed can reach up to 5 m/s while in Lagos, it could be as low as 2 m/s [SHA2014].
x Biomass is organic material that comes from plants and animals. There are different types of biomass e.g. crops, garbage, wood and others. In order to produce energy, biomass goes through combustion process and releases heat [EIA2017]. Based on the availability of cattle and livestock, and crop residue, Nigeria’s potential is promising. According to Garba and Bashir [2002], the country has approximately 800 MJ biomass re-sources.
x Solar power is a renewable resource that utilizes solar radiation to pro-duce energy. Due to the uneven distribution of radiation on the Earth, solar power plants are only economically viable in places with a suf-fucient number of sunny days. The amount of solar radiation depends on the angle of incidence of sunlight and transparency of atmosphere. Con-sequently, there is a zonal character of solar radiation distribution, that

Ayaribil, Bykova, Kazandzhiev, Setiawan
24
depends on the distance from the equatorial line. Nigeria is located in the equatorial region and receives around 5.08 x 10¹² kWh annually [IRE2017]. The number fluctuates from the northern states where it is high to the southern states. On average, the length of the daylight is ap-proximately 6.25 hours [MUH2012].
2.1.2 Political background
The origin of the Nigerian state dates back to 1900 when the British government took over the administration of the Niger Coast Protectorate that was previously under chartered company rule and formed the protectorates of Northern and Southern Nigeria. In 1914, the British government amalgamated both protec-torates to formally establish the colonial state of Nigeria. The state attained inde-pendence from Great Britain in October 1960. The following decades were marked by increasing ethnic and regional tensions, resulting in armed conflicts, army interventions, coups and military-led governments [IBH2008]. Further-more, the presence of more than 300 ethnic groups and more than 400 different languages and dialects reinforce cultural frictions within the country [AGB2001]. The national elections of 1999 and the adoption of the current constitution gave a start to the transition from military to civilian rule [PIE2016]. Under the coun-try’s organic law, Nigeria is a federal republic comprising of 36 states (Nigeria Const. Art. I, § 3). The legal system of the country is based on customary law, Islamic law in the northern part, and English common law [INT1999].
The forming process of a single Nigerian nation was fraught with many chal-lenges most significant of which were the cultural and religious differences be-tween the predominantly Muslim North and the Christian South. Throughout the years, the north-south gap has further widened with the South concentrating the sources of natural resources and the other means of production and becoming a center of socioeconomic development [KHA2015]. In contrast, the North saw the rise of radical Islam culminating in the emergence of Boko Haram. The organi-zation’s overriding goal is to overthrow the Nigerian government and to create an Islamic state under the supreme law of Sharia. The violent activities of the Islamic group have imperiled socioeconomic and political development and eq-uitable distribution of democracy in the northern states [AGB2014].
The relationship between democracy, good governance and the access to electricity
In contrast to the improvement, since the beginning of the 21st century and to the country’s actual wealth, poverty is still widespread and inequality between rich and poor is extreme. Due to weak state institutions and high levels of corruption, governments are unable to deliver prosperity to their citizens. As of 2016, Nigeria

Off-grid renewable electricity systems in Nigeria
25
ranks poorly in the EIU’s Democracy Index report [2016] and is moreover per-ceived as one of the most corrupt countries according to the Transparency Inter-national’s annual survey [2016]. Michael Ross, a professor of political science from the University of California, states that “Nigeria offers an archetypal exam-ple of the “paradox of oil” by which vast oil wealth begets extravagant corrup-tion, deep poverty, polarized income distributions, and poor economic perfor-mance” [LUB2007, p. 2]. The economy depends heavily on the oil and gas sec-tors, accounting for over 85 % of the Nation's gross domestic product (GDP), over 95 % of the Federal budget, and over 80 % of the national wealth [EBE2013].
Despite the large oil and gas deposits, 43 % or nearly 79 million of people in Nigeria’s population lack access to electricity [WOB2014]. Agbiboa [2011], Ahl-borg, Boraeng, Jagers and Soederhorm [2015] and Trotter [2016] research the positive correlation between state of democracy and rural electrification in Nige-ria and other Sub-Saharan countries. Democratization processes and good gov-ernance tend to significantly contribute to rural electrification development. It is observed that the presence of democratic institutions – through which country’s leaders are held accountable to the citizens – create a strong incentive among leaders to prioritize actions on those public goods where their executive effort can be clearly connected to actual benefits on the ground. On the contrary, by autocratic regimes, where the government executes tight control over the popu-lation, and in countries with poor governance - characterized by corruption, pat-ronage and clientelistic practices, the incentive among leaders to accelerate rural electrification development decreases.
2.1.3 Economy
In the economic context, the use of GDP growth rate is highly applicable to meas-ure the well-being and growth of a nation. Unlike its Sub-Saharan counterparts, Nigeria has been showing a fluctuating GDP growth rate in the past five decades, reaching -17.55 % at its lowest in 1967 and 30.36 % at its peak in 2004 [WORn.d.-b]. In the last two years, the downward trend continues with a national real GDP growth rate of -1.58 % in 2016 [NAT2017a]. The galloping annual inflation rate, with the most recent being 15.91 % [REU2017] exacerbates further the impacts of negative growth. As a result, households react by decreasing their consumption by 5.71 % in real terms from 2014 to 2015 [NBS2016].
In spite of the unfavorable economic trends, Nigeria remains the biggest econ-omy in the African continent in terms of GDP, followed by Egypt and South Africa [ROB2017]. This situation is attributable to the crude oil production that started in 1956 when Nigeria’s oil reserves were first discovered [WAL2009].

Ayaribil, Bykova, Kazandzhiev, Setiawan
26
The discovery marked Nigeria’s over-dependence on crude oil production iden-tified by many as a case of Dutch Disease. In 2016, Nigeria produces 1.43 million barrels of crude oil per day [FAN2017], most of which are going towards expor-tation, accounting 77 % of the total export figures [MIT2017]. However, the downward spiral of crude oil production due to recurring pipeline vandalism and plummeting world oil price are urging the government to support the develop-ment of other sectors [IMF2015].
In addition to the resource curse crisis, the high GDP also comes with a caveat in terms of the population’s actual financial welfare. In the last 23 years, Nigeria has registered 35 million more people living under the extreme poverty line i.e. US$ 1.90 per day [KAZ2017]. A report by Legatum Institute [2016] explores the gap between national wealth and people’s prosperity and it assesses Nigeria’s situation and classifies it as “under-delivering”. Its latest GDP per capita (Octo-ber 2017) amounts to US$ 2,090, a relatively derisory number compared to world’s developing countries average of US$ 4,960 [IMF2017]. Further, there is the usual issue of income distribution among households, illustrated by Gini in-dex. Nigeria scores 48.8 % out of 100 %, where 100 % signifies a perfect ine-quality. As a comparison, Sweden and South Africa have an index score of 21.5 % and 62.5 %, respectively [CIA2017].
The sheer complexity of all mentioned issues is perpetuatingly the poverty trap. Education system and unemployment are among the trap factors. According to National Bureau of Statistics [2017b], in late 2016, there are approximately 81.15 million people in the labor force population i.e. 15-64 years old. Among them, 11.55 million find themselves in unemployment, nearly a 7 million increase within two years.
In order to get away from the deteriorating trend, the Nigerian Government holds the total discretion. There are multiple studies that demonstrate the relatedness of elements, such as the inflation rate and unemployment. While the traditional Phil-lips curve cannot explain Nigerian condition, a study by Idenyi, Favour, Johnson and Thomas [2017] suggests that a Government increasing its expenditure would drive the employment rate up. However, this must be done while maintaining an inflation rate lower than 10 %. Another obvious correlation is the one between human capital quality and unemployment. Riddell and Song [2011] find that ed-ucation has positive impacts on one’s chances to get re-employed in the US. A study on EU countries labor markets yields a similar conclusion, regardless of each country’s specificities [SNI2015]. Nigeria’s overall education scene is con-cerning, even for the most basic level i.e. primary school that is a part of nine-year compulsory education. UNICEF [2013] statistical data from 2008-2012 in-dicates that the net enrolment ratio in primary schools is 60.1 % and 54.8 % for

Off-grid renewable electricity systems in Nigeria
27
boys and girls, respectively. Further, the problem not only lies in the quantity, but also in the quality of educational institutions.
Investment climate
In the era of globalized and open market, the macroeconomic health of a nation depends on external actors as much as it depends on how the internal actors fare. The degree of openness of a market through the enactments of foreign and do-mestic investment policies has direct consequences on the economy. The Nige-rian Government initiated its efforts with firstly the Structural Adjustment Pro-gramme of 1986, followed by the 1993 Privatization and Commercialization Act and 1999 Public Enterprises Promotion and Commercialization Act. This en-deavor was carried out through the National Economic Empowerment and De-velopment Strategy (NEEDS) in 2003 and the recent Nigeria Vision 20:2020 where Nigeria strives to alleviate its dependence on oil sector. As a result of these chains of investment encouragements, foreign direct investments (FDI) flow grew from USD 2 billion in 2002 to USD 5 billion in 2004. FDI net inflows reached its highest point in 2011 at USD 8.8 billion and went down thereafter to USD 4.4 billion in 2016 [WORn.d.-a].
The renewable energy sector benefited tremendously from the liberalization movement with the creation of Renewable Energy Programme under the Ministry of Environment. Alongside Nigeria Investment Promotion Commission, it pro-vides investment incentives to boost investment inflows. The incentives include the 30 % companies’ income tax, the tax deductibility of Research and Develop-ment (R&D) expenses incurred in Nigeria, capital allowances and two percent tax concession for in-plant training facilities. A 100 % tax holiday for seven years is also granted for a project situated in economically disadvantaged Local Gov-ernment Area (LGA). Further, projects that absorb a lot of workforce are entitled to tax concessions. This list of incentives is not exhaustive; however, it suffices to show the proactivity of Nigeria in creating investment-friendly conditions [RENn.d.-a]. Despite of the convincing incentives, World Bank survey indicates that conducting business in Nigeria is challenging as it is ranked 169 in 2016. The indicators of this survey are construction permits, electricity access, and reg-istration of property, taxes and cross border trades, among others [FOR2017].
2.1.4 Policy and Regulatory Framework
Energy production, supply and demand have been through a challenging past in Nigeria. The national power utility has not been able to produce sufficient power for Nigerians and the supply–demand imbalance has tilted in a way that favors and promotes self-production through the use of fossil fuels and traditional bio-mass. Citizens in the rural areas have been worst hit. They mostly depend on

Ayaribil, Bykova, Kazandzhiev, Setiawan
28
fuelwood for energy and this encourages deforestation. Most rural communities are not connected to the national grid and the rural access to electricity is reported to be 26 % in 2008. The current statistics show half of the population still has no access to electricity, 70 % of the rural areas remain unconnected to the national grid. Those connected suffer from constant blackouts up to 10 hours per day [GIZ2015].
Stern [2010], states that energy is critical for well-being and economic develop-ment and there is great value in having access to energy. One of the very im-portant element, if not the most important to access to energy is policy. Policy provides the framework and strategies as to how energy is to be generated, man-aged, distributed and supplied to households and businesses. It is the govern-ment’s responsibility to develop policy through main ministry or agency respon-sible for that sector. A robust energy policy that addresses recent developments in the energy sector of the world, improving access to energy for all (UN sustain-able development goal 7) and doing so in a sustainable way. Florini and Sovacool [2009] state that the role of governments in the development of the energy sector cannot be overemphasized and this is possible through the development of legal and regulatory frameworks and control in the energy sector. Hassan & Majum-der-Russel [2010] describes energy legislation as setting out regulatory frame-works for the governance of the energy industry and the energy market.
Nigeria energy policy document came to effect in 2003 to serve as a road map to a better national energy future. Based on this policy statement, the Renewable Energy Master Plan (REMP) was developed in 2005 (Energy Commission of Ni-geria and United Nations Development Programme [ENE2012]). REMP docu-ment is the product of the efforts of a group of consultants organized by the En-ergy Commission of Nigeria (ECN) in collaboration with the United Nation De-velopment Programme (UNDP). The mandate was to look into the (country’s energy situation) and proffer solutions that will enhance the energy policy.
Following this master plan is the development of the National Renewable Energy and Energy Efficiency Policy (NREEEP) in 2015 with the purpose of setting out a framework of action to address Nigeria’s challenge of inclusive access to mod-ern and clean energy resources, improved energy security and climate objectives. It is also to recognize the national significance of renewable electricity generation activities by providing for the development, operation and maintenance, and up-grading of new and existing renewable electricity generation activities and to de-clare energy efficiency as a large, low cost, and under-utilized energy resource, offering savings on energy bills and opportunities for more jobs, improved in-dustrial competitiveness, and lower air pollution.

Off-grid renewable electricity systems in Nigeria
29
This policy direction is important because the Roadmap for Power Sector Re-forms, which was launched in 2012 only seeks to focus more on providing energy to urban dwellers through the development of grid based electricity, which un-fortunately would not benefit most rural areas except those who are close to urban areas. Rural areas that are remote and have a low demand density will have to depend on off-grid energy solutions as the economies of on-grid deployment do not favor rural electrification and will have to depend on alternative solutions. This implication has necessitated the development of a strategy for renewable energy [NRE2015].
2.1.5 Nigeria’s current electricity scene
At first, all matters pertaining to electricity in Nigeria was in the hands of gov-ernmental company, the National Electric Power Authority (NEPA) that had two hydro and four thermal power plants for the entire country. NEPA’s electricity supply was strewn with power cuts and outages, hence the initiative to revolu-tionize it through the Electric Power Sector Reform (EPSR) that came into effect in 2005. As a result, Nigerian Electricity Regulatory Commission (NERC) and Power Holding Company of Nigeria (PHCN). The latter consists of 18 companies with a specific mission of generation, transmission or distribution of electricity [NER2017]. Privatization of a sector has long been connected with an improved and more efficient performance. This is not always true in the case of NEPA. According to a research by Adedeji [2017], the outcome of this particular privat-ization in Nigeria is highly contingent on the form and nature of the government. The Nigerian government, however, does not do what is required in order to set off the privatization to a success journey. The regulatory framework is simply weak and unsupportive, indicating the unclear intentions of the reform.
The low quantity of electricity generation is the quintessence of the reform’s fail-ure. Considering the raw potentials of both renewable and nonrenewable energy sources, the electricity landscape in Nigeria is underwhelming. In 2014, there are ten National Integrated Power Projects (NIPP) with a total generation capacity of 10,000 MW. The actual electricity generated deviates from this figure, with the combined capacity that amounts to 5,455 MW [AKU2017]. The vandalization of NIPPs infrastructure is the major cause of the low generation tally. The Nigerian Police Department has registered 89 vandalism cases in 2016 and 233 in the first three quarters of 2017. The financial losses of 2017 vandalism acts amount to estimate N500 million [IND2017].
The unstable electricity generation worsens further the already low capacity. A study performed by Oluwatoyin, Odunola and Alabo [2015] investigates the rea-sons behind the frequent power outages. They find that fickle and insufficient gas

Ayaribil, Bykova, Kazandzhiev, Setiawan
30
supply (due to vandalized pipelines), overloaded power transformers, lack of plants and equipment rehabilitation are causing the unstable power, among other incremental causes.
The implications of power generation issue on Nigeria’s economy
The electricity consumption and economic performance of a country are inter-twining elements with causal relationship. Akinwale, Jesuleye and Siyanbola [2013] attempt to figure out the direction of the causal relation between them, using stationary test, co-integration, Granger causality test and Error Correction Model. They conclude that there is a unidirectional causal relationship from real GDP to electricity consumption, without feedback effect. This means that the income of a person determines how much electricity they use. However, a study with similar objective presents a conflicting result. Ogundipe and Apata [2013] use the Johansen and Juselius co-integration based on Cobb-Douglas model, cou-pled with the Vector Error Correction and Pairwise Granger Causality test to an-alyze the causality. Their findings suggest that there is a causality flowing from electricity consumption to economic growth, as well as a bidirectional causality. Regardless of the direction of the causation, there is one fact that can be observed. The shortage of power supply is mainly problematic for small and medium-sized enterprises’ as they have to rely on costly diesel generators to carry out their lu-crative operations. However, the cost of diesel generators is suspected to hurt companies’ profitability [USAn.d.]. The difficulties that these companies are det-rimental to the overall Nigerian economy.
2.2 Background of the State of Sokoto
As was previously mentioned, Nigeria is comprised of 36 states. The study is concentrated on one of them - Sokoto state. The area is located in the northwest-ern part of Nigeria and covers a territory of 25.9 km2. The state lies in the dry Sahel with annual average temperature of around 28.3 °C. Agriculture is the pre-dominant occupation for inhabitants in Sokoto. However, due to a lack of precip-itation, crops are grown mainly in the floodplains of Sokoto-Rima River. The rest of the land is used for millet, rice and other cereals [FEDn.d.]
For a long period of time Sokoto has been an Islamic state. Two centuries ago there was a powerful Islamic Caliphate. After the collapse, it was put under the Northern Nigeria Protectorate, while the regional elite was able to keep its influ-ence and position. At the present time, Muslim is the predominant religion in the state with a small number of Christians [SOKn.d.].
Due to the lack of access or limited access to electricity in rural communities, local inhabitants usually rely on traditional human or animal power for everyday

Off-grid renewable electricity systems in Nigeria
31
and agricultural needs. Machines are used only in the industrial sector. Lighting is one the basic needs and carried out with kerosene lamps [UDU2013]. Addi-tionally, according to Chikaire, Nnadi and Anyoha [2011], almost each house-hold has a TV or radio and a refrigerator for convenience purposes.
Sokoto state is a subject of interest for this research paper due to its high renew-able energy potentials, remoteness from the closest on-grid electricity connection and high number of poor people. For instance, based on the data from GIZ [2015], the site has a viable potential for wind-generated electricity because of maximum wind speed - 6 m/s, as well as good potential for solar power plants with annual irradiation above 2,200 kWh/m2. It should be noted that Sokoto continues to be the poorest state in Nigeria, with more than 70 % of the inhabitants in Sokoto live in poverty, 30 % are living in extremely poor conditions [SHA2013]. In fact, growing population makes the situation even worse. Since the foundation of So-koto state in 1960, the number of people has increased six times and now counts 5.4 million inhabitants. This high population growth is a challenge to employ-ment level, education and health facilities availability. Besides, the majority of population structure are children under the age of 15 [HEA2017].
2.3 Technical overview of renewable energy generation systems
The off-grid technology
Within the conventional electrical grid networks, before reaching the end con-sumers, electricity passes through three stages – generation, transmission and dis-tribution. Generated in large amount, electric power is not directly supplied to end users, but rather first wheeled to electrical substations from which electricity is distributed to private consumers [ELU2014]. On the contrary, off-grid energy systems are decentralized systems, objectively focused on manufacturing a re-quired electrical power for immediate consumption. Such systems are composed by autonomous units where conversion and transmission have no interaction with other units. Another distinctive characteristic of the off-grid systems is that they are locally-based and need-oriented, as they are designed to cover specific local energy demand and often rely on local energy sources [MAN2016]. Over the past decade, introducing off-grid energy systems that use renewable energy resources has become a common option to electrify remote rural areas where grid connec-tion is neither available nor feasible in the foreseeable future [ROH2014].
For the purpose of the current research, the following off-grid energy systems have been considered.
x Diesel energy system
x PV module and lead-acid battery storage energy system (PV/LAB)

Ayaribil, Bykova, Kazandzhiev, Setiawan
32
x PV module and lithium-ion battery storage energy system (PV/Li-ion)
x PV module and diesel generator hybrid with lead-acid battery storage en-ergy system (PV-Diesel/LAB) Photovoltaic-diesel energy system with li-on battery
x PV module and diesel generator hybrid with lithium-ion battery storage energy system (PV-Diesel/Li-ion)
x Wind Turbines with lead-acid battery storage energy system, and
x Wind Turbines with lithium-ion battery storage energy system
With the exception of the energy source, all four scenarios share three main ele-ments – (1) charge controller, (2) battery bank and (3) off-grid inverter. The fol-lowing paragraphs will briefly describe the basic function of each of those com-ponents.
The charge controller manages the power going from the energy source into the battery bank and controls the source, which is to be active or inactive. Further-more, it simultaneously charges the battery and distributes the power to the load. The controller has overcharge protection, short circuit protection, pole confusion protection and diversion load function [ING2015].
The energy inverter is needed to convert DC power into AC power. The inverter size is determined by the peak load or the maximum wattage of the whole energy system [ING2015].
The uneven distribution of renewable energy sources, especially solar and wind, makes the battery a necessary component for the off-grid generation systems. Batteries are the most common storage device in rural areas and in some cases, they are also considered as the main electricity carrier [MAN2016]. They are also used as a backup in the system and to maintain a constant voltage during peak loads or a shortfall in generation capacity [MAL2014]. The capacity of the bat-tery bank is to be calculated by finding the following data:
x Total daily use in watt-hour (Wh)
x Total autonomous time of the battery
For the purpose of the current contribution, two different types of battery storage systems will be considered - lead acid and lithium-ion. The lead acid batteries have been on the market for more than a century and have an established reputa-tion of a dominant and commonly accepted technology for energy storage. The large availability makes them very attractive in terms of initial costs [LITn.d.-a]. However, recent studies report that within an off-grid system they tend to degrade

Off-grid renewable electricity systems in Nigeria
33
quickly and require frequent maintenance and replacement, resulting in high sys-tem lifetime expenses. Furthermore, due to the large lead content they perform poorly in terms of size and weight [KRI2013]. As to its disposal, because of the highly toxic lead and corrosive sulphuric acid, a proper treatment is needed at the end-of-life phase. However, leakages and ruptures occur rarely and at the same time the recycling rate exceeds 95 % [LITn.d.-a].
Lithium-ion batteries represent the most widespread storage technology in port-able electronics and electric vehicles. Within the last decade, because of rapid technology development, they became cost-competitive in stationary storage ap-plications and gradually made their way into off-grid energy systems. Lithium-ion batteries are usually rated for much higher charge and discharge powers and occupy much less installation space. Furthermore, they seldom require any maintenance and replacement services [KRI2013]. However, this recent technol-ogy needs much more future development and research in order to reach the same impressive rate of recycling of lead acid batteries [LITn.d.-b].
Photovoltaic-Wind & Photovoltaic-Diesel hybrid energy systems
The hybrid energy generation system is a term used to describe any energy sys-tem that combines two or more different sources of energy, such as wind-diesel, PV-diesel, wind-PV, etc. [SHA2008]. The most common design of a hybrid en-ergy system combines conventional diesel-powered generator and a renewable source of energy e.g. wind and solar. Over the last decade, several studies have been carried out in different parts of the world and have proven the reliability and the efficiency of the combination of diesel and solar or wind [REH2012]. In the long run, hybrid systems are able to mitigate the impact of oil price volatilities and minimize the environmental damage caused by the burning of fossil fuels. Furthermore, renewables and diesel tend to have complementary characteristics. On the one hand, the capital cost of renewables is higher as compared to diesel, on the other hand, operating costs and maintenance requirements of renewables are lower relative to diesel. Diesel energy is available all the time whereas avail-ability of renewables is highly dependent on the climatic characteristics of the respective region [SHA2009].
In the case of a hybrid diesel generator-renewable source energy system, the ma-jor drawback comes from the fact that diesel runs continuously to cover the dif-ference between the energy generated from the renewable source and the load demand. Due to low efficiency of the diesel generator at low load, the fuel saving potential in these systems is limited, as diesel generator efficiency drops tremen-dously when it operates at less than 40 % of full load. Fuel economy considera-tions indicate that the diesel should be stopped when the average power of the renewable, relative to the load, is high. This intermittent operation results in high

Ayaribil, Bykova, Kazandzhiev, Setiawan
34
start-stop cycling frequency which accelerates wear of the diesel system and thus increases the demand for maintenance [ALB2014].
2.4 Off-grid renewable energy projects
2.4.1 Successful Projects
Every project starts from an idea and through project development, the idea is gradually turning into some tangible matters such as timelines and blueprints. Eventually, the idea is realized during the construction phase. Some projects soar and reach their goals but some end up falling flat, despite careful design, planning and development. Energy projects are not exempt of failures, but experts and academics have tried to analyze completed projects in order to figure out critical success factors in order to improve the success rate.
During its lifetime, a project has to tackle country, political, regime and legal framework, foreign exchange and technical risks, among others. Thus, a success-ful renewable energy project is the result of a highly reliable risk management, where the actors are capable of minimizing the impacts of existing risks [ALI2008]. In addition, light should be shed on the importance of including key stakeholders and the local community throughout project lifetime. An observa-tion indicates that successful projects have a few common elements, which are the engagement of stakeholder in the entirety of project, creation of community awareness and community education programs [NAM2014]. Even though re-newable energy projects seem to be all figured out, projects that aim to provide electricity in rural and remote area present a different set of issues.
The World Bank provides a booklet that breaks down what needs to be ques-tioned and answered in putting together a sustainable off-grid rural electrification project. In short, they put forward the necessity of least cost design, practical technology choices, appropriate delivery mechanisms, community awareness, and maximization of opportunities, international co-financing and consistency with rural electrification [WOR2008]. A PricewaterhouseCoopers report entitled “Electricity beyond the grid” [2016] points out the fundamental nature of an in-tegrated energy access plan and map development, creation of acceptance of off-grid initiatives, reliable payment solution, a dedicated fund and dependable team of people. A comparable series of information can also be found in a Sustainable Business Institute’s publication on how to scale up micro-utilities for rural elec-trification [PET2013].
In regard to success factors, there is definitely not a lack of comprehensive ana-lytical literature that somehow leads to a consolidated guideline for electrification projects. The myriads of success stories act as a solid evidence. ACOB Lighting

Off-grid renewable electricity systems in Nigeria
35
is a company specialized in rural electrification in Nigeria and one of its projects is located in Kaduna state. The project provides 16 kW worth of power from a solar mini grid system [ACO2017]. JOFOS is another firm that carries out activ-ities related to rural development, such as water pump systems and solar power engineering services. It completed a solar power installation to power a borehole in 1991 in Kano state [JOF2017]. Another great example of projects comes from Solar Electric Light Fund (SELF), an NGO, whose activities involve the design and implementation of solar power solutions for the bottom of the pyramid. It initiated a solar power project in 2001 with Jigawa Alternative Energy Fund (JAEF) and financial support from the US Government. As a result, some com-munities in Jigawa state now live with clean water, proper health centers, illumi-nated classrooms and streets [SELn.d.].
2.4.2 Failed projects
Project management is a well-developed and widely used tool in many sectors and industries. Despite the extensive studies and examples on success factors, project failures still occur. There is preliminary research in this field revealing typical reasons of failures. Some scientists define three, ten or even more main factors that cause project to be unsuccessful. However, the majority of them, ac-cording to Dorsey [2005] are based on the same ground and include
x Lack of support (both financial and management)
x Lack of planning and resources and
x Insufficient interaction among involved parties
Wiggins [2016] mentions project schedule as one of the most important factors. Indeed, both overrun and underrun in terms of project proceeding can lead to undesired consequences.
In the case of Nigeria, 60 % of the projects in renewable energy have been re-ported to fail [NNA2015]. This review takes a look at a few examples and the reasons why they failed. Omisore [2011] indicates poor maintenance, technical problems, misunderstanding of local needs and communication challenges as the main reasons of failure. A solar electrification project in Bishop Kodji, Lagos State is a good illustrative example of those reasons. The project was intended to provide electricity to the local community and to power the fish driers, as fishing was a predominant occupation for inhabitants. The project’s primary objective was to have direct impacts on people's living conditions and yet it stopped work-ing three months after its launch because the company did not carry out any maintenance services after completing the system construction.

Ayaribil, Bykova, Kazandzhiev, Setiawan
36
Locals were trained to operate the new system. Nonetheless, they could not make the transition from familiar sources of energy, such as diesel generator, wood pellets and kerosene to solar technology e.g. local women preferred cooking as they used to. Moreover, inhabitants tended to overcharge the batteries, which led to shorter project life-span. This is likely due to people’s mentality and advanced knowledge gap. Additionally, it is worth noting that envy was an unforeseen fac-tor that reinforced the collapse. The inhabitants of nearby villages sabotaged Bishop Kodji project after its successful setup. The combination and interaction of these factors condemned this project to fail [ADE2013].
A solar PV system in Oke-Agunla, Nigeria, provides insights on additional fail-ure factors such as operational inefficiency. The construction of village electrifi-cation system was successfully done but the project was not able to meet house-hold needs. The study revealed that only 14.5 % of the total 4.5 kW installed solar PV was utilized. Total inefficiency of the project can be attributed to poor mainte-nance, malfunctioning and lack of motivation from the performing company side. Local inhabitants in this case were also improperly trained [ISM2012].
Regarding governmental projects, Ogunmola [2015], a project management pro-fessional, names governmental inadequacy as one of the main triggering factors. In case of Nigerian Government, it single-handedly chooses the projects to invest in, which leads to frequent failures due to the lack of appropriate project man-agement support.
2.5 Process and barriers to new technology adaptation
2.5.1 Technology diffusion
Switching from a non-sustainable socio-technological system to a sustainable one is one of the greatest challenges for sustainable development. Changing societal function is hard to describe and measure as uncountable variables influence the process. To describe the transition of socio-technological systems, Geels [2002] introduces a multi-level perspective (MLP) on transition. Firstly, one can find technological niches that offer a protected realm for learning and development. Secondly, the socio-technical regime offers stability by creating sets of rules and coordinating with existing socio-technical systems. Some of these stabilizing el-ements might be contracts, lifestyles, and subsidies. Thirdly, the socio-technical landscape is the highest level in the MLP. It is constituted by a wider exogenous environment and, thus, cannot directly be shaped by the actions of actors. Geels [2005] offered further insights into the interdependent process of transition that occur in four phases:

Off-grid renewable electricity systems in Nigeria
37
1. Firstly, scattered and unconnected radical innovations are developed in niches. Due to lack of rules and connectedness the existing regime is not yet threatened.
2. Secondly, the radical innovations start to gain importance in certain market niches and form rules which eventually start to stabilize. The new technology might become a source for specialization and gains support from various ac-tors in the second phase.
3. Thirdly, in the next phase, the new technology becomes competitive and poses a threat to the existing regime. This happens not only due to the influ-ence of internal forces, such as better prices and a community of support, but also relies on so-called “windows of opportunity” that open when there are tensions within the existing regime.
Lastly, in the final phase, the technology and innovation compete with existing technologies on the same level and a replacement process is triggered. This sub-stitution process often happens gradually as vast perception changes within the socio-technological system might need to happen as well. Geels’ MLP [2005] showed that actors, technologies, and rules constantly affect each other to transi-tion into new socio-technological systems.
This contribution outlines the adoption of off-grid renewable energy systems and compares them with the status quo of technological solutions. Therefore, one might take a narrower view on the diffusion and adoption processes of particular technologies. Jacobsson and Johnson [2000] discussed the diffusion of renewable energy technologies and focused their work on the perspective of the technolog-ical system, which consists of actors, institutions, and networks that play an im-portant role in determining how easily a new renewable technology is diffused. They claim that certain failure sets exist that might hinder diffusion, such as the threat of existing substitutes, a long period of adoption during the early phases and/or customer needs that cannot be articulated during the early phases. The authors conclude that the diffusion of new technologies could not be considered as a linear gradual process but rather as one of ups and downs dispersed over a long period of time.
2.5.2 Barriers to the implementation of renewable energy (RE) projects in Nigeria
Renewable energy technologies such as wind and solar photovoltaics are tech-nologies that can still be considered as growing in developing countries espe-cially in most Sub Saharan Africa countries. Therefore, the deployment of such technologies is bound to face obstacles and barriers which will curtail efforts to provide energy from renewable resources. It is therefore imperative to identify

Ayaribil, Bykova, Kazandzhiev, Setiawan
38
potential barriers and obstacles and develop strategies to deal with them in the project planning phase so as to ensure they do not hinder the success and sustain-ability of projects in the sector.
The sector has great potentials to provide cheap and clean energy in the long-term, although the investment capital is comparatively higher to people outside the reach of national grid systems, most of whom live in rural communities and also a majority of whom can be classified in the bottom of the pyramid economic group. Some potential barriers identified in the literature, mostly peer-reviewed research articles can be summarized under the following categories: lack of awareness and reluctance in accepting new technologies, capital investment, se-curity, legislation and regulation, politics, policy and strategy, technology and innovation, and environmental support programs.
Social challenge and reluctance in accepting new technologies
Dada [2014] identified the lack of awareness and reluctance in accepting new technologies as a barrier that could pose as a threat to renewable energy solutions. He states that most consumers do not know how electricity is produced and de-livered to their homes. On the part of both public and private investors, there is also a lack of awareness of the great business opportunities in investing in the renewable sector. Therefore customers, regulators and investors need to under-stand and be convinced of the benefits of renewable energy. Governments need to identify and analyze stakeholders and the roles they can play in enhancing the growth of the sector. Governments can start the process by partnering with uni-versities, research institutions, development organizations to organize work-shops, symposia, seminars, conferences and town hall meetings to disseminate relevant information to the particular stakeholder group [EFU2013].The draft of the Renewable Energy Master Plan of Nigeria proposes the setting-up of a Na-tional Renewable Energy Development Agency (NREDA), which can assist in increasing public awareness and providing information and assistance to inter-ested stakeholders [ENE2012].
Security
Security of investments in any sector is an important requirement for businesses to thrive. Moreover, no investor would be willing to invest his capital when the security of his investment is not assured, like sabotage of projects from other communities, who are envious that such projects were not implemented in their communities [IKE2017]. Nigeria is grabbling with security challenges in the en-ergy sector, there have incidents of vandalism of oil pipelines, kidnappings, bombings, armed robberies and lately activities of Boko Haram in the country [DAD2014].

Off-grid renewable electricity systems in Nigeria
39
Legislation and regulation
The creation of appropriate policy framework of legal, fiscal and regulatory strat-egies is essential to the promotion of renewable energy development and attract the needed investment in the sector. In the Nigerian energy sector, it has been observed by Emodi and Ebele [2016] that various gaps exist in the energy poli-cies, while some policies are long overdue for revision. Moreover, the follow-ups of all the Nigerian energy policies, strategies and targets are lacking, as well as commitment from the state and local government in renewable energy devel-opment. Some overlaps and duplication also exist in some activities of some min-istries and government agencies in the country. Alignment is therefore required in the Nigerian energy policies, including the harmonization of National renew-able energy, energy efficiency and rural electrification policy objectives, coordi-nation of government agencies and effectiveness in the fulfilment of the mandate to coordinate policy issues.
Technology and innovation
Although renewable energy projects exist in several developing countries includ-ing Nigeria, there is very limited research and development in the sector. Most of these technologies are imported from advanced countries. In order to promote the increase in use of renewable energy resources, the development of capacities locally is important. The aforementioned MLP of technology transition could be encouraged and accelerated with the support of Governments, with the invest-ments in research and development of an appropriate curriculum in the various educational institutions to train the needed human resource for the sector. Also, governments can encourage innovation by instituting award schemes. There are several international opportunities available that governments can take advantage of, to develop technologies and also draw investment into the country.
2.6 Criteria in renewable energy projects decision-making
2.6.1 Financial criteria
Investments in new power generating capacities represent an important long-term decision, that locks down investors’ capitals and creates environmental impacts for decades. The fact that investment and operating decisions are, first and fore-most, market driven, highlights the importance of the economic parameters of any project. To a large extent, this comes to explain the low rate of commercial deployment of renewable energy technologies in the low-income countries. Due to their technological nature, renewable energy projects are generally character-ized by relatively high up-front capital costs and lower ongoing operating costs.

Ayaribil, Bykova, Kazandzhiev, Setiawan
40
In Sub-Saharan countries, Nigeria inclusive, there are no financial portfolios de-veloped by banks and other financial institutions to support the renewable energy sector [WOR2013]. Since there are other sectors also competing for the same limited financial resources, renewable energy cannot compete due to the inade-quate knowledge on sector thereby increasing the risk and uncertainties profile of such investment, which makes banks reluctant to advance loans for projects in the sector. Because of that, investment decisions are being often biased toward conventional technologies that concentrate lower financial risk and secured re-turn on the investment [AHL2014].
Hussain [2013] reports that, as the share of capital costs in their total cost is much greater, many renewable energy projects might find it difficult to ensure long-term funding. This is particularly relevant in the context of low income states, where due to regulatory or other restrictions on bank loans, long-term financing is often difficult. Moreover, the lack of experience and familiarity with renewable energy technologies can make potential investors unable to assess the financial risk involved in the project and may further bias them towards investing in con-ventional energy systems.
Hamilton [2010] further states that on the one hand, an important issue that cre-ates significant problems in obtaining private financing is the generally small scale of renewable energy systems. Economies of scale in due diligence are sig-nificant and many larger financial institutions and potential investors might be unwilling to support small projects. But on the other hand, off-grid small-scale applications benefit from avoiding the cost of new transmission network or dis-tribution infrastructure.
Hussain [2013] also showcases that investments in renewable energy projects can become more attractive, if energy prices are able to properly internalize the ex-ternalities and take into account the wider global and local environmental im-pacts. However, up to date they fail to reflect the benefits renewable technologies have to offer - in particular, they could contribute to reducing the price volatility and increase the energy security of the state. Furthermore, in the long run, to diversify the supply mix and to reduce the reliance on fossil fuels which may be a subject to large price changes.
2.6.2 Sociopolitical criteria
Social criteria are important for the assessment of energy alternative sources be-cause it will further guide the selection of the most suitable energy source for the model community that takes into consideration all the sociopolitical factors of the community and Nigeria. Research from the literature further gives credence

Off-grid renewable electricity systems in Nigeria
41
to this criterion. Tasri and Susilawati [2014] evaluated this criterion with govern-ment policy, social acceptance and labor impact as subcriteria in a study aimed at finding a renewable energy source that is best to generate electricity commer-cially based on a fuzzy analytical hierarchy process in Indonesia. Also, Tsoutsos, Drandaki, Frantzeskaki, Iosifidis and Kiosses. [2009] used this criterion in their research to provide regional authorities of the Island of Crete with an exploratory comprehensive analysis of renewable energy mix that have the potential to deal with increasing energy demands.
Previous sections discussed that biomass is the predominant energy source and widely accepted among the population. Fossil-fuel-based energy is the next im-portant source of energy for Nigeria, however it is only about 40 % of the popu-lation that has access to energy from the national grid, which is also very unreli-able thus compelling people to supply their own electric energy through diesel generator sets. Renewable energy sources are gaining prominence in the country but rather at a slow pace. Reasons for this development have already been dis-cussed in previous sections.
Quality of Life
Energy is recognized as being the principal means for providing access to basic needs such as food and water, while offering opportunities to improve the quality of life of people. The UN sustainable development goal seven states that all citi-zens of the world should have access to clean, affordable, reliable, sustainable and modern energy. Also, explicit linkage between access to energy and poverty alleviation has been established and the type of energy has a direct impact on the quality of life of the local populations. Furthermore, it has also been established there is a high correlation between energy and economic development and other indicators of modern lifestyle, [VOEn.d.], [GHA2004].
2.6.3 Environmental criteria
Nowadays, the evaluation of environmental impacts of a product or an activity has become a norm. Consumers are becoming more aware of the repercussions of their consumption behavior, hence their heightened expectation for the pro-ducers. International environmental agreements are urging the participating na-tions to comply with a set of agreed-upon behaviors and objectives. The involved parties, from manufacturers to distributors fulfill these demands in order to keep their competitive value.
The weight of environmental aspect is well captured by the creation of ISO 14000 family of environmental management standards for all sizes of organizations. Life-cycle assessment (LCA) under ISO 14040 is particularly gaining popularity,

Ayaribil, Bykova, Kazandzhiev, Setiawan
42
as it considers the entirety of a product’s environmental impacts. LCA accounts for “a product's life cycle from raw material acquisition through production, use, end-of-life treatment, recycling and final disposal” [ISO2006]. For most prod-ucts, the use or operational phase represents the highest energy-consuming prop-erty. However, the disposal and end-of-life value of a product poses environmen-tal issues, as the obsolete goods and old technologies and components are piled in landfills such as the one that is known as the world’s largest electronic landfill in Accra, Ghana [SHI2015]. At its end of life, an item’s composite elements can be recycled, reused in the manufacture of other products or thrown straight to landfills. Naturally, the higher the proportion of the recyclable and reusable com-ponents of a product, the better it would be. The ever-increasing amount of used products are a burden for the environment, making EoL value an important fac-tor, even as early as in the design and conception stages of a product. This ap-proach is referred to as a design-for-recycling [PNU1997].
Unlike a product’s life cycle, the impacts of a process or a project is distinct and more complicated as it includes different LCAs, transportation, location, re-sources and many other factors. The common instrument for a project is Envi-ronmental Impact Assessment (EIA). According to EU’s EIA Directive 2014/52/EU, an EIA is a way to analyze projects that are very likely to have substantial effects on the environment. This directive lists the critical elements that need to be assessed i.e. climate change adaptation and mitigation, risks of major accidents and disasters, biodiversity and use of natural resources [EUR2017]. Aside from the EU Directive, there are other approaches of EIA pro-vided by international and national institutions such as the US EPA and the Asian Development Bank.
In a 40 MW solar-powered electricity generation project in Dhursar, Rajasthan, the environmental impacts are divided based on the project phases i.e. planning and design, construction, operation and decommissioning [DAH2011]. Moses and Ng’Eny [2015] use a similar style for a 40 MW solar project in Kilifi County, Kenya. Meanwhile, an EIA prepared by the US Department of Energy (DOE) for a PV project in Colorado enlists the air quality and GHGs, visual resources, wild-life, vegetation and cultural resources [DOE2011]. Even if the renewable energy resource differs, the principal EIA framework remains similar, as illustrated by an EIA of a wind power generation in Sri Lanka. The EIA goes through the im-pact that the location and design choice, project phases and mitigation would have inflicted on the environment [CEY2017].
As for their nonrenewable counterparts, the EIA naturally calls for a broader cov-erage. In Kekaha, Hawaii, a diesel generator power plant project prepares an as-sessment report that covers the hazardous material and waste, in addition to the

Off-grid renewable electricity systems in Nigeria
43
usual environmental resources [TEC2010]. It is clear that EIA content varies from one project to another. However, they all have a number of elements in common, such as the impacts of the project on natural resources (air, water, soil), be it quantitative or qualitative. The single most reliable and quantifiable envi-ronmental impact parameter, aside from the total energy used is the emissions of greenhouse gases (GHGs). GHGs emissions have been studied and analyzed many times over as the main cause of global climate change. Since then, they have become the focus for experts, environmentalists and regular people alike. For example, today’s public is familiar with the concept of carbon footprint. Fur-ther, with the creation of carbon trade mechanism, the stakeholders are even more incentivized to analyze and report their carbon mitigation projects. Therefore, these elements of any EIA will be the foundation of environmental criterion in the technology AHP of this work, along with the end-of-life value of the presum-ably environmentally taxing components, i.e. solar panels, generators and batter-ies.
2.7 HOMER Pro Software
Hybrid Optimization of Multiple Energy Resources (HOMER) is a computer model developed by the National Renewable Energy Laboratory (NREL) in 1992. The software compares different methods of energy production and designs off-grid and grid-connected systems. HOMER Pro simulates behavior of energy systems and calculates its costs for all operational period, including installation and maintenance costs. The program allows to compare many different options for the design of energy system (from totally renewable to completely non-re-newable or hybrid ones) and to determine its technical and economical merits, as well as risks. The software provides various combinations of energy resources with a wide range of solutions for future project. For example, it is possible to choose between wind generator and PV panel, diesel generator or thermal and hydrogen loads, micro hydropower and biogas, different types of batteries and fuel-cell sources [NAT2004].
The program structure contains three main modules, simulation, optimization and sensitivity analysis. HOMER Pro allocates feasible results of simulation based on life-cycle costs. By changing input parameters such as inflation or discount rate, the designer can examine the impact of sensitivity variables [NAT2004].
The simulation phase aims to define feasibility and life-cycle costs of a designed system. HOMER Pro can simulate different types of system configuration and components, how they behave in a long-run within an operating strategy. Fur-thermore, HOMER Pro configures the system by doing an hourly time series

Ayaribil, Bykova, Kazandzhiev, Setiawan
44
simulation of its operation over the period of one year. Then, the program as-sesses available renewable power, compares it to the electric load and makes a decision how to deal with an excess, or a deficit, of electricity. HOMER Pro also provides detailed information on the performance of each component of a given power system [LAM2005].
The optimization phase aims to define the best or optimal configuration for the designed system. HOMER Pro then sorts all possible solutions in descending or-der of net present cost (NPC) which is the representation of all the costs and revenues during the project lifetime, including discounted cash flows. The best solution with lowest NPC is located on the top of a final table and has to satisfy user requirements. Hence, the user has the possibility to choose among different options, e.g. the size of a PV array or generator, the number of wind turbines, batteries and others [LAM2005].
The sensitivity analysis deals with uncertainty of the project. It provides a mod-eler the possibility to evaluate the output of designed system by changing input parameters. These input variables, for example, can include fuel price, interest rate or grid power price [LAM2005].
The software presents the results in the form of tables and graphs, which visualize all processes and configurations and facilitates the final decision-making. There-fore, HOMER is able to take into account future uncertainties and to generate the results based on desired assumptions.

Off-grid renewable electricity systems in Nigeria
45
3 Methodology
3.1 Village modelling and load assessment
We created a statistical model of a typical village in Sokoto State, Nigeria. As the name suggests, it was constructed with the most recent available statistical data of Sokoto, such as demographic and geographic data. When relevant Sokoto data was not available, we recoursed to Nigerian statistical data. Due to incom-pleteness of available secondary data, we had to use our knowledge and judge-ment to determine some conditions.
As for the village load assessment, we calculated the amount of energy demand that would arise from the established village model. We created the household conditions based on several other comparable scientific papers. Moreover, we used a combination of our judgment and internet sources to construct the energy needs for public and commercial infrastructures.
3.2 HOMER Pro simulations
As was previously mentioned, HOMER Pro is a widely-used software for energy system modelling. For this reason, HOMER Pro was assumed to be suitable for this particular type of research. The process of model simulation using HOMER Pro comprised of several steps that varied, depending on preferred configuration and input parameters. The process started from the design tab, where basic infor-mation about future project was inserted. This information included project’s name, its authors and remarks (if necessary). Then, project location had to be chosen - in our case it was Sokoto state in Nigeria. Information regarding the climatic conditions of the region was automatically downloaded from a NASA databank. Additionally, discount rate and inflation rate were set at 14 % and 16 %, respectively. The data was based on the available information from Na-tional Bureau of Statistics [NAT2017a] and Trading Economics [2017], as of December 2017. Project’s lifetime has been estimated at 25 years.
The next step consisted of Electric Load set up, where project profile could be selected, and peak months were specified. In our example, community profile without any peak months was chosen. We assumed that the modeled village would consume electricity evenly throughout the year because there is no distinct dry or rainy season in Sokoto. Additionally, we input scaled annual average load of 1511.32 kWh/d.
After electric power load was set, the system components had to be added. It included a wide range of either renewable or non-renewable resources (see Table 2). In the case of our project, we choose 1kw PV Generic flat plate collectors,

Ayaribil, Bykova, Kazandzhiev, Setiawan
46
Generic wind turbines and Auto-sized genset. Generic types were offered by HOMER Pro software without any specifications. Due to scarce past experience and data availability regarding technical details of the off-grid solutions, generic types for each designed system were chosen. Moreover, there was a need to add battery and converter to the given system. As highlighted before, further scenar-ios would be based on battery differences in terms of PV plant and hybrid PV-diesel. For this reason, either lead-acid battery or Lithium-ion had to be chosen. However, for diesel scenario fuel price had to be added in this step and as of December 2017, the price was € 0.48 per liter.
Table 2: Summary of designed systems and its components
System Components
Diesel Auto-sized Genset
PV/LAB 1 kW Generic flat plate PV
Generic 1 kWh Lead acid batteries
PV/Li-ion 1 kW Generic flat plate PV
Generic 1 kWh Li-Ion
Hybrid PV-Diesel/LAB 1 kW Generic flat plate PV
Generic 1 kW Lead acid batteries
Auto - size genset
Hybrid PV-Diesel/Li-ion 1 kW Generic flat plate PV;
Generic 1 kW Lithium-ion batteries;
Auto - size genset;
Wind Turbines with lead-acid battery 3 kW Generic wind turbine;
Generic 1 kWh Lead acid batteries
Wind Turbines with lithium-ion battery 3 kW Generic wind turbine
Generic 1 kWh Li-Ion
In the end, HOMER simulated the results in the form of graphs and tables and presented feasible solutions based on above mentioned input parameters. Table 3 summarizes the constant variables for all designed systems.
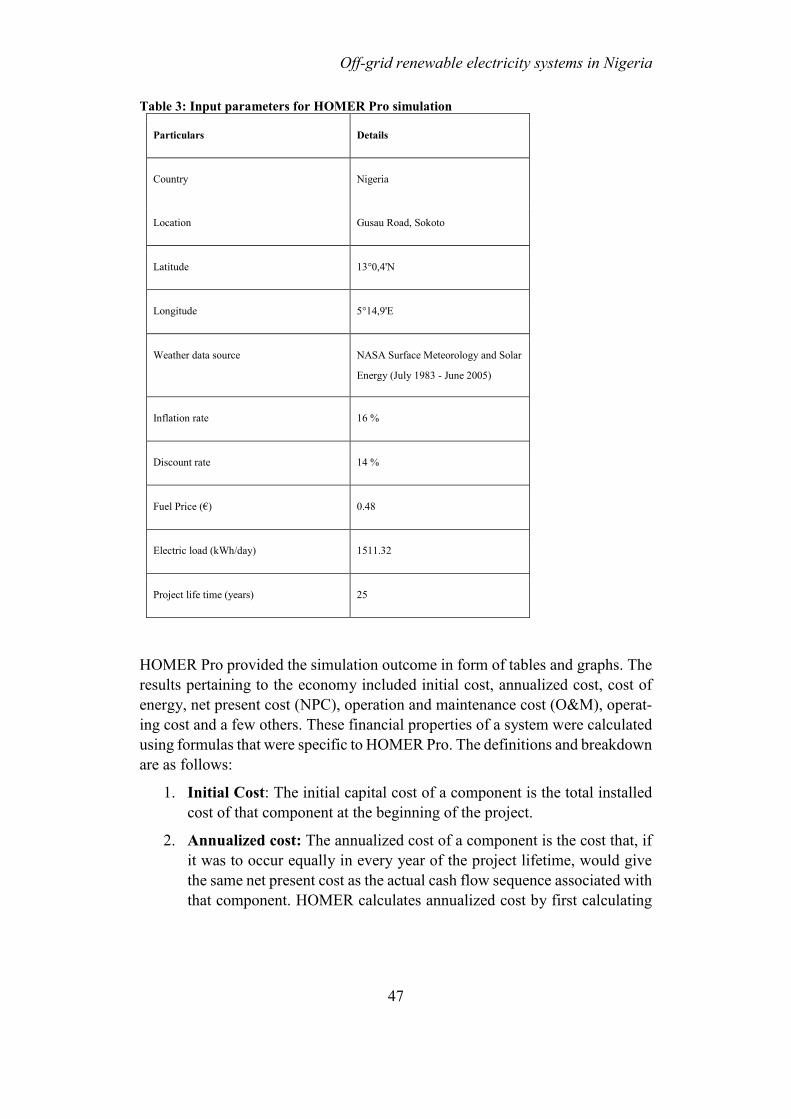
Off-grid renewable electricity systems in Nigeria
47
Table 3: Input parameters for HOMER Pro simulation
Particulars Details
Country Nigeria
Location Gusau Road, Sokoto
Latitude 13°0,4'N
Longitude 5°14,9'E
Weather data source NASA Surface Meteorology and Solar
Energy (July 1983 - June 2005)
Inflation rate 16 %
Discount rate 14 %
Fuel Price (€) 0.48
Electric load (kWh/day) 1511.32
Project life time (years) 25
HOMER Pro provided the simulation outcome in form of tables and graphs. The results pertaining to the economy included initial cost, annualized cost, cost of energy, net present cost (NPC), operation and maintenance cost (O&M), operat-ing cost and a few others. These financial properties of a system were calculated using formulas that were specific to HOMER Pro. The definitions and breakdown are as follows:
1. Initial Cost: The initial capital cost of a component is the total installed cost of that component at the beginning of the project.
2. Annualized cost: The annualized cost of a component is the cost that, if it was to occur equally in every year of the project lifetime, would give the same net present cost as the actual cash flow sequence associated with that component. HOMER calculates annualized cost by first calculating

Ayaribil, Bykova, Kazandzhiev, Setiawan
48
the net present cost, then multiplying it by the capital recovery factor, as in equation (1).
𝐶𝑎𝑛𝑛 = 𝐶𝑅𝐹 (𝐼, 𝑅𝑝𝑟𝑜𝑗) × 𝐶𝑁𝑃𝐶 (1)
where:
CNPC = the net present cost ($)
i = the annual real discount rate (%)
Rproj = the project lifetime (year) CRF() = a function returning the capital recovery factor
3. Cost of Energy (COE): HOMER defines the levelized cost of energy
(COE) as the average cost per kWh of useful electrical energy produced by the system. To calculate the COE, HOMER divides the annualized cost of producing electricity (the total annualized cost minus the cost of serving the thermal load) by the total electric load served, using equation (2):
𝐶𝑂𝐸 = 𝐶𝑎𝑛𝑛, 𝑡𝑜𝑡 − 𝑐𝑏𝑜𝑖𝑙𝑒𝑟𝐻𝑠𝑒𝑟𝑣𝑒𝑑𝐸𝑠𝑒𝑟𝑣𝑒𝑑
(2)
where:
Cann, tot = total annualized cost of the system (€/year) cboiler = boiler marginal cost (€/kWh)
Hserved = total thermal load served (kWh/year)
Eserved = total electrical load served (kWh/year)
The second term in the numerator is the portion of the annualized cost that results from serving the thermal load. In systems, such as wind or PV, that do not serve a thermal load (Hthermal = 0), this term is zero.
4. Net Present Cost (NPC): The net present cost (or life-cycle cost) of a
Component is the present value of all the costs of installing and operating the Component over the project lifetime, minus the present value of all the revenues that it earns over the project lifetime. HOMER calculates the

Off-grid renewable electricity systems in Nigeria
49
net present cost of each Component in the system, and of the system as a whole.
5. Operations and Maintenance Cost (O&M): The Operation and Mainte-
nance (O&M) cost of a Component is the cost associated with operating and maintaining that Component. The total O&M cost of the system is the sum of the O&M costs of each system Component. For most Compo-nents, you enter the O&M cost as an annual amount. For a generator, you enter the O&M cost as an hourly value, and HOMER multiplies that by the operating hours per year to calculate the annual O&M cost.
6. Operating cost: The operating cost is the annualized value of all costs
and revenues other than initial capital costs. HOMER uses equation (3) to calculate the operating cost:
𝐶𝑜𝑝𝑒𝑟𝑎𝑡𝑖𝑛𝑔 = 𝐶𝑎𝑛𝑛, 𝑡𝑜𝑡 + 𝐶𝑎𝑛𝑛, 𝑐𝑎𝑝 (3)
where:
Cann, tot = the total annualized cost (€/year)
Cann, cap = the total annualized capital cost (€/year)
7. Replacement cost: The replacement cost is the cost of replacing a Com-
ponent at the end of its lifetime, as specified by Lifetime parameter in the Component model. This cost can be different than the initial capital cost for several reasons:
8. Salvage Value: Salvage value is the value remaining in a component of
the power system at the end of the project lifetime. HOMER assumes lin-ear depreciation of components, meaning that the salvage value of a com-ponent is directly proportional to its remaining life. It also assumes that the salvage value depends on the replacement cost rather than the initial capital cost. HOMER calculates salvage value using equation (4):
𝑆 = 𝐶𝑟𝑒𝑝 × 𝑅𝑟𝑒𝑚𝑅𝑐𝑜𝑚𝑝
(4)
Rrem, the remaining life of the component at the end of the project lifetime, is given by equation (5):
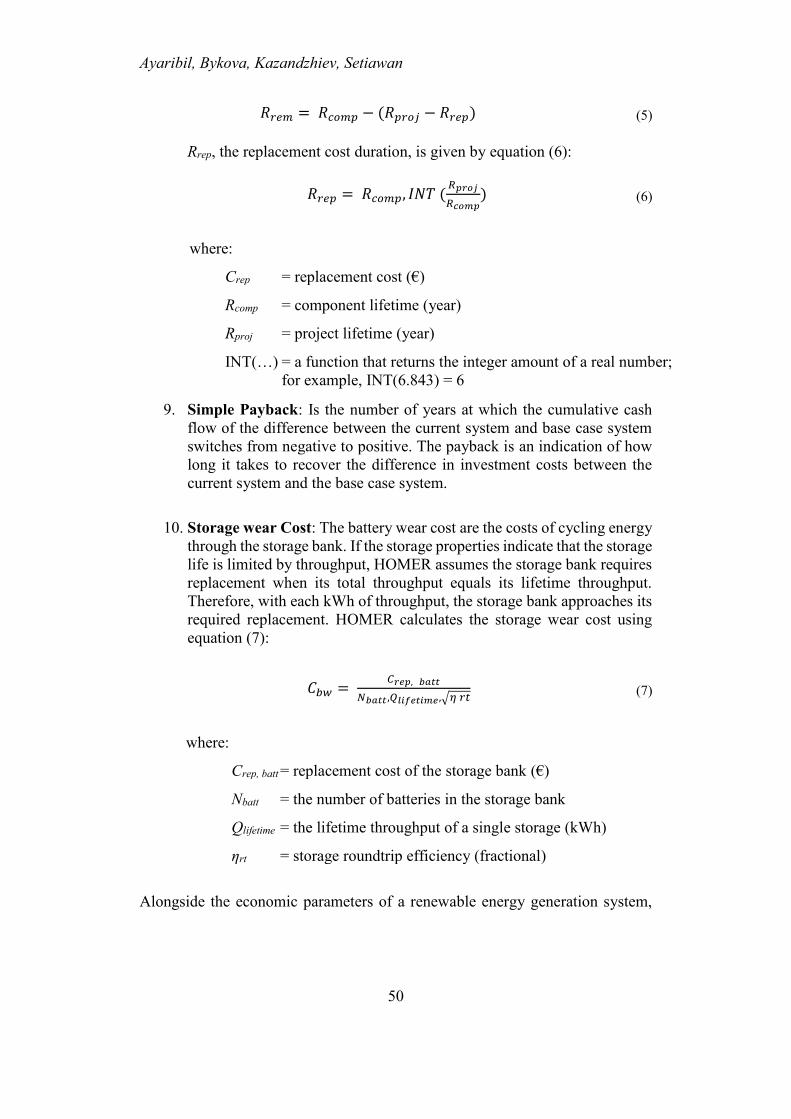
Ayaribil, Bykova, Kazandzhiev, Setiawan
50
𝑅𝑟𝑒𝑚 = 𝑅𝑐𝑜𝑚𝑝 − (𝑅𝑝𝑟𝑜𝑗 − 𝑅𝑟𝑒𝑝) (5)
Rrep, the replacement cost duration, is given by equation (6):
𝑅𝑟𝑒𝑝 = 𝑅𝑐𝑜𝑚𝑝, 𝐼𝑁𝑇 ( 𝑅𝑝𝑟𝑜𝑗
𝑅𝑐𝑜𝑚𝑝) (6)
where:
Crep = replacement cost (€)
Rcomp = component lifetime (year)
Rproj = project lifetime (year)
INT(…)
= a function that returns the integer amount of a real number; for example, INT(6.843) = 6
9. Simple Payback: Is the number of years at which the cumulative cash flow of the difference between the current system and base case system switches from negative to positive. The payback is an indication of how long it takes to recover the difference in investment costs between the current system and the base case system.
10. Storage wear Cost: The battery wear cost are the costs of cycling energy
through the storage bank. If the storage properties indicate that the storage life is limited by throughput, HOMER assumes the storage bank requires replacement when its total throughput equals its lifetime throughput. Therefore, with each kWh of throughput, the storage bank approaches its required replacement. HOMER calculates the storage wear cost using equation (7):
𝐶𝑏𝑤 = 𝐶𝑟𝑒𝑝, 𝑏𝑎𝑡𝑡
𝑁𝑏𝑎𝑡𝑡,𝑄𝑙𝑖𝑓𝑒𝑡𝑖𝑚𝑒,√𝜂 𝑟𝑡 (7)
where:
Crep, batt = replacement cost of the storage bank (€)
Nbatt = the number of batteries in the storage bank
Qlifetime = the lifetime throughput of a single storage (kWh)
ηrt = storage roundtrip efficiency (fractional)
Alongside the economic parameters of a renewable energy generation system,

Off-grid renewable electricity systems in Nigeria
51
HOMER Pro provides technical performance of each component and the system as a whole. The definition and formulas of these parameters are as follows:
1. Rated Capacity: The nominal capacity (or rated capacity) of a Storage Component is the amount of energy that can be withdrawn from it at a particular constant current, starting from a fully charged state. The current used to rate batteries varies from one manufacturer to another, but it is typically either the 10-hour, 20-hour, or 100-hour rate. The 10-hour rate (C10) drains the Storage Component after 10 hours.
2. Mean Output: The average power amount of the generating system over
the year, in kW.
3. Capacity Factor: The average power output of the generating system di-vided by the total generating systems capacity, in percentage (%).
4. State-of-Charge (SOC): The relative state of charge is the ratio of the
current absolute state of charge to the maximum capacity of the storage bank. When the batteries are fully charged, the relative state of charge is 100 %. Wherever HOMER reports the amount of energy stored in the storage bank, it reports the relative state of charge.
5. Lifetime throughput: If the storage properties indicate that the storage
life is limited by throughput, HOMER assumes that the Storage Compo-nent requires replacement after a fixed amount of energy cycles through the storage, regardless of the depth of the individual charge-discharge cy-cles. HOMER uses this lifetime storage throughput to calculate the life of the storage bank and the storage wear cost.
6. Renewable fraction: The renewable fraction is the fraction of the energy
delivered to the load that originated from renewable power sources. HOMER calculates the renewable fraction using equation (8):
𝑓𝑟𝑒𝑛 = 1 − 𝐸𝑛𝑜𝑛𝑟𝑒𝑛+ 𝐻𝑛𝑜𝑛𝑟𝑒𝑛
𝐸𝑠𝑒𝑟𝑣𝑒𝑑+ 𝐻𝑠𝑒𝑟𝑣𝑒𝑑 (8)
where:
Enonren = nonrenewable electrical production (kWh/year)
Egrid, sales = energy sold to the grid (kWh/year) (included in Eserved)
Hnonren = nonrenewable thermal production (kWh/year)
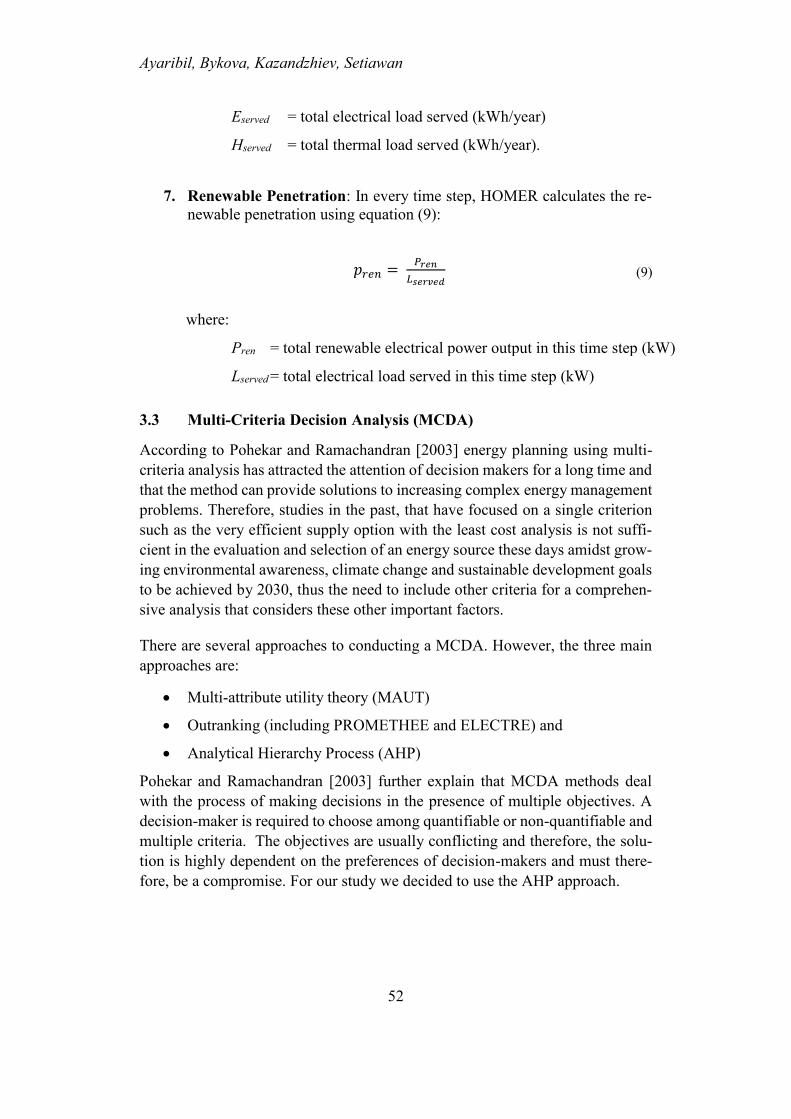
Ayaribil, Bykova, Kazandzhiev, Setiawan
52
Eserved = total electrical load served (kWh/year)
Hserved = total thermal load served (kWh/year). 7. Renewable Penetration: In every time step, HOMER calculates the re-
newable penetration using equation (9):
𝑝𝑟𝑒𝑛 = 𝑃𝑟𝑒𝑛𝐿𝑠𝑒𝑟𝑣𝑒𝑑
(9)
where:
Pren = total renewable electrical power output in this time step (kW)
Lserved = total electrical load served in this time step (kW)
3.3 Multi-Criteria Decision Analysis (MCDA)
According to Pohekar and Ramachandran [2003] energy planning using multi-criteria analysis has attracted the attention of decision makers for a long time and that the method can provide solutions to increasing complex energy management problems. Therefore, studies in the past, that have focused on a single criterion such as the very efficient supply option with the least cost analysis is not suffi-cient in the evaluation and selection of an energy source these days amidst grow-ing environmental awareness, climate change and sustainable development goals to be achieved by 2030, thus the need to include other criteria for a comprehen-sive analysis that considers these other important factors.
There are several approaches to conducting a MCDA. However, the three main approaches are:
x Multi-attribute utility theory (MAUT)
x Outranking (including PROMETHEE and ELECTRE) and
x Analytical Hierarchy Process (AHP)
Pohekar and Ramachandran [2003] further explain that MCDA methods deal with the process of making decisions in the presence of multiple objectives. A decision-maker is required to choose among quantifiable or non-quantifiable and multiple criteria. The objectives are usually conflicting and therefore, the solu-tion is highly dependent on the preferences of decision-makers and must there-fore, be a compromise. For our study we decided to use the AHP approach.

Off-grid renewable electricity systems in Nigeria
53
Analytical Hierarchy Process
Decisions on investments in energy supply systems are highly complex. The de-cisions are contingent on not only the investor’s financial situation, but also qual-itative criteria. The Analytic Hierarchy Process (AHP) is a well-established method that is used to support decision-making for multi-criteria decision prob-lems. It is a psychophysical theory of measurements made through pairwise com-parisons and is based on the judgments of experts as well as on hard empirical facts. The final aim is to derive a priority hierarchy that could support the deci-sion-making process [SAA2008a]. This very property of AHP was what drove us to choose it over the other MCDA methods. Comparisons of different criteria are made based on a scale of absolute judgments that represent the degree to which one criterion dominates another with respect to a given attribute [ZOO2010].
We molded this method according to the purposes of this work and the first step was to identify criteria that would be emblematic for technology investment de-cisions in the energy sector. In a second step, the criteria were weighed individ-ually according to the AHP method. To obtain reliable results in weighting the chosen criteria, the AHP analysis was performed by projecting the viewpoint of a potential investor, as well as the one of the beneficiaries of the project. These roles were assumed to be influential decision-making parties for adoption deci-sions in the energy sector.
To weigh the criteria, pairwise comparisons between each criterion were con-ducted. The weighting was done based on a 9-point scale [SAA2008a]. For ex-ample, a ratio of 9:1 means that one of the criteria was extremely more important in comparison to another and vice versa.
At the same time, a ratio of 1:1 means that both criteria are of equal importance. The process then looked as follows: first, we individually weighted the criteria. After that, a group weighting session was held to find a consensus and to meet the method’s consistency requirements. To check the consistency of the weights, the consistency ratio has to be calculated [SAA2008b]. This measure allows to indicate whether the participants in the evaluation made consistent judgments. Saaty [2008b] suggested that this ratio should not exceed 10 % and, if it does, the pairwise comparison must be repeated.

Ayaribil, Bykova, Kazandzhiev, Setiawan
54
Table 4: Saaty's fundamental 9-point scale of absolute numbers [SAA2008a]
Intensity of Importance Definition
1 Equal importance
2 Weak or slight
3 Moderate importance
4 Moderate plus
5 Strong importance
6 Strong plus
7 Very strong or demonstrated importance
8 Very, very strong
9 Extreme importance
The final evaluation was performed based on the obtained weights as well as on the comparison between the alternative solutions. For the AHP, the previously obtained results of the investment appraisal as well as the environmental assess-ment were considered.
Figure 2: AHP criteria hierarchization scheme

Off-grid renewable electricity systems in Nigeria
55
3.3.1 Scoring method
The weights of subcriteria and main criteria would not mean anything without assessing each of the technology according to their objective performance in the mentioned criteria. Thus, we sought to obtain the relative performance score of each energy generation system by creating a grading scale of 0 to 10 with the following steps.
1. We find the lowest and highest value within the range of the quantifiable economic and environment subcriteria.
2. Subsequently, we find the difference between the two extremes and di-vide it by 10 to acquire the units for scoring scale. For economic subcrite-rion, the relative zero would be given the highest value, as the higher the cost is, the less favorable it is for the project. Concerning the environmen-tal subcriterion: the GHGs emissions scale was created in the same way as the economic counterpart. However, the scale for the EoL value ex-pressed in recyclability and/or reusability rate was the reverse, as the higher the rate was, the better the score would be. The calculation is shown in equation (10):
𝑉𝑎𝑙𝑢𝑒𝑚𝑎𝑥−𝑉𝑎𝑙𝑢𝑒𝑚𝑖𝑛10 (10)
With the help of the formula, all intervals of score points could be calcu-lated.
3. We evaluate the performance of each system based on the scale and rate it from 0 to 10.
With regards to social subcriterion, as there was not any quantitative point of reference, we utilized the same logic of scoring. However, instead of an interval of numbers, we used available information and data, our assumptions and knowledge, expertise and judgment to give appropriate relative scores. All cal-culated subcriteria scoring scales can be found in the Appendix of this contribu-tion.
3.3.2 Financial Criteria
Based on the findings of the literature review and the results from the HOMER Pro simulation results, we derived the four economic criteria. The first one - “cap-ital cost”, the total cost of the energy generation plant, which included the cost of all equipment and all installation costs at the beginning of the project. Capital cost is the most used economic criterion to evaluate energy systems and often

Ayaribil, Bykova, Kazandzhiev, Setiawan
56
recognized by the literature as a main barrier to introducing off-grid renewable energy systems in low income states [AHL2014]; [HUS2013].
The second criterion “Operating cost” is the cost associated with operating and maintaining each component of the energy system throughout the entire life-cy-cle of the project. On the one hand, the operation costs include the funds spent for the energy, services, insurance, wages etc. for the energy system operation. On the other hand, maintenance costs are associated with the cost that aims to prolong the life of the energy system and avoid failures that may lead to its oper-ation suspension e.g. replacement costs.
The third criterion is associated with the cost of energy (COE). The HOMER Pro software defines the cost of energy as the average cost per kWh of useful electri-cal energy produced by the system. To calculate the COE, Homer Pro divides the annualized cost of producing electricity by the total electric load served.
Governments, investors, producers and consumers have different expectation on the cost of energy. Therefore, it is necessary to evaluate the electric cost of dif-ferent energy systems.
The fourth chosen criterion is “Payback period”. The payback period of an energy project refers to the number of years it takes for the cumulative income to equal the value of the initial investment. From the viewpoint of an investor, shorter payback periods are preferable to longer payback periods. In order to calculate the payback period of one alternative the Homer Pro software compares it to an-other alternative or to the base case scenario, in the current case to the “Diesel-only energy system”.
3.3.3 Social criteria
A community’s acceptance of generating system refers to the specific acceptance of siting decisions by local stakeholders, particularly residents and local authori-ties. [WUE2007]. Therefore, social acceptability is adopted as one of the social subcriteria.
Employment directly relates to the contribution of the project to local develop-ment. This criterion estimates the global social and economic effects that may be felt in the areas affected by the initiatives. The potential effects are: the creation of new jobs, new supply chain businesses, emerging energy sector businesses and industrial districts.
Quality of life as a third subcriteria can be evaluated based on the impacts the provision of energy from various generating systems on quality of life indicators,

Off-grid renewable electricity systems in Nigeria
57
especially poverty and shared prosperity, which represent indicators that measure progress toward the World Bank Group’s twin goals of ending extreme poverty by 2030 and promoting shared prosperity in every country.
x People, which showcase indicators covering education, health, jobs, social protection, and genderequality and provides a portrait of societal progress across the world.
x Environment, which presents indicators on the use of natural resources, such as water and energy, and various measures of environmental degradation, in-cluding pollution, deforestation, and loss of habitat, all of which must be con-sidered in shaping development strategies.
x Economy, which provides a window on the global economy through indica-tors that describe the economic activity of the more than 200 countries and territories that produce, trade, and consume the world’s output.
x States and markets, which encompasses indicators on private investment and performance, financial system development, quality and availability of infra-structure, and the role of the public sector in nurturing investment and growth.
x Global links, which presents indicators on the size and direction of the flows and links that enable economies to grow, including measures of trade, remit-tances, equity, and debt, as well as tourism and migration.
3.3.4 Environmental Criteria
In order to evaluate the environmental performance of an off-grid system, we decided to have three criteria. The first one was the CO2 and CO emissions ex-pressed in Global Warming Potential (GWP). This criterion has been selected as it is generally acknowledged that the most taxing phase of a project is its operat-ing stage. The relevant data that has been provided via system simulation on HOMER.
The second environmental criterion was the end-of-life performance value of the main components of a system. Following literature research of each component’s LCA, we came to conclusion that existing researches results vary substantially, depending on the factors that the writers chose. Therefore, the proportion of com-ponents’ parts that is recyclable and reusable, expressed in percentage, was se-lected as the most reliable and uniform environmental impact indicator.
The third environmental criterion was the impact of the installation of the system in terms of land use. We chose this criterion as it represents the most quantifiable criterion pertaining resource utilization. We calculated the approximate surface area that each system would take.


Off-grid renewable electricity systems in Nigeria
59
4 Results
4.1 Village profile and load
4.1.1 Village profile
The construction of a model village in Sokoto was mostly based on the latest statistical data available, with the reference to existing papers with similar ap-proaches. When there was no data available, we resorted to educated assump-tions. Through the combination of them, we created the following profile (see Table 5).
Table 5: Demographic overview of the modeled village Particulars Details
Number of households 200
Average household size [FAO2016] 7
Total population 1,400
System 110,000.00
The modeled village has an area of 7.28 km2 and it is inhabited by population whose age composition was assumed to be the same as the one of Sokoto state. The population is young, as 19.1 % of it is under 5 years old and 33.4 % is be-tween 5 and 17 years old [FAO2016].
Public facilities and infrastructure
In 2014, there were 673,960 children enrolled in 1,990 public primary schools or in other words, 339 students attended one primary school [NBS2016]. In the modeled village there are 468 young people, who are in the age of primary and secondary school, so there is a need for one primary school.
Due to the absence of data on the number of hospitals or medical centers in So-koto state, we referred to the national data. According to the latest World Bank [n.d.-c] data from 2004, there was 0.5 hospital bed for 1,000 people in Nigeria, or 1 hospital bed for 2,000 people. Therefore, in a village of 1,400 inhabitants, it is assumed, that there would not be any hospital or medical center.
Located in a state where Islam is by far the most popular religion, and a caliphate for that matter, mosques are essential for the population, as accurately depicted

Ayaribil, Bykova, Kazandzhiev, Setiawan
60
by the construction of 189 mosques in the past year alone [AUW2017]. The ac-tual number of mosques in Sokoto or Nigeria has not been documented, which led us to make an educated estimation. We computed that 3 small-sized mosques would be sufficient for the village.
The village would also have a small commercial center where people could pur-chase their necessities. The center would consist of a general store and a small market or grocery store.
4.1.2 Village electricity load profile
For the purpose of this study, an estimation of electricity demand of the remote rural village with no access to grid electricity was performed. It was carefully estimated considering existing statistical data for this part of Nigeria, and by an-alyzing previous reports and studies on the consumption habits of local dwellers. The final load assessment was conducted in an Excel worksheet.
The typical energy profile of such small-scale communities looks like this: The electricity demand increases steadily throughout the day, starting from 06:00 in the morning, and reaching its peak between 18:00 and 21:00. Moreover, in such a remote rural community, an insignificant difference between the daily electric-ity demand patterns for weekdays and weekends and for the different times of the year, can be observed.
In comparison to urban areas, the demand for electricity in remote rural villages is not high. Table 6 gives an overview of the entire load profile of the modeled community. The daily average energy consumption was estimated to be around 1511.32 kWh/d, for which an off-grid energy system with generation capacity of slightly less than 63 kW would be required. Almost the entire electrical energy generated (nearly 98 %) would be demanded for domestic use i.e. for appliances like televisions, radios, refrigerator, lighting, fans, etc. Around two-thirds of this share, would be consumed by old and energy inefficient refrigerators.
Slightly above 1 % of the total energy demand would be supplied to two small commercial buildings, where again the refrigerators would be the main electricity consumer. The final 1 %, would be distributed among the primary school and the public spaces, where lighting would account for most of the consumption.
The calculated load of 62.97 kW or 1511.32 kWh per day, along with other pa-rameters (see Table 6) were input for each system simulation on HOMER Pro. The results will be described and analyzed in the following section.

Off-grid renewable electricity systems in Nigeria
61
Table 6: Calculation and breakdown of household and village electricity load profile
Item Number of Units Wattage Duration of
use/day
Daily con-sumption
(Wh)
Monthly consump-tion (Wh)
Monthly con-sumption (kWh)
Household
Lights 4 15 6 360 10,800 10.8
CRT TV 21” 1 80 10 800 24,000 24
Phone charging 1 5 0 0 0
Fan 1 50 5 250 7500 7.5
Refrigerator 1 750 8 6,000 180,000 180
Sub-total 8 900 29 7,410 222,300 222.3
Total 200 1,482,000 44,460
Public infrastructure & Primary School
Streetlights 7 60 12 5,040 151,200 151.2
Mosques (3) 3 60 12 2,160 64,800 64.8
Lights 12 40 3 1,440 43,200 43.2
Fans 9 50 5 2,250 67,500 67.5
Computer 1 300 5 1,500 45,000 45
CRT TV 21” 1 80 5 400 12,000 12
Total 590 42 5,590 383,700 383.7
Commercials
Refrigerator 2 900 8 14,400 432,000 432
Freezer 2 108 8 1,728 51,840 51.84
Lights 2 40 5 400 12,000 12
Total 16,528 495.84
Grand Total 45,339.54
Power load (kW) 62.97

Ayaribil, Bykova, Kazandzhiev, Setiawan
62
4.2 HOMER Pro results
4.2.1 Wind with lead acid batteries
The system is comprised of 3 kW Generic wind turbine and Generic 1 kWh Lead acid batteries (see Figure 3).
Figure 3: Scheme of wind turbine with lead acid batteries system
HOMER simulation results
The HOMER Pro calculation process did not provide any feasible solution for this system configuration. It suggested the addition of autosize generator or gen-eration capacity.
4.2.2 Wind with Lithium-Ion batteries
The system is comprised of 3 kW Generic wind turbine and Generic 1 kWh Li-Ion (see Figure 4).
Figure 4: Scheme of wind turbine with Li-ion batteries system

Off-grid renewable electricity systems in Nigeria
63
HOMER simulation results
The HOMER Pro calculation process did not provide any feasible solution for this system configuration. It suggested the addition of autosize generator or gen-eration capacity.
4.2.3 Diesel system
The system is comprised of an auto-size diesel generator designed to produce 654,898 kWh per year of electrical power (see Figure 5). An electric generator is a device that converts mechanical energy obtained from an external source into electrical energy as the output. The main components of a generator are; The Engine, Alternator, Fuel System, Voltage Regulator, Cooling and Exhaust Sys-tems, Lubrication System, Battery Charger, Control Panel and the Main Assem-bly / Frame [DIEn.d.]. It is designed to use diesel as fuel.
Figure 5: Scheme of diesel generator system
HOMER simulation results
The results from the simulation with HOMER software shows that the operating cost was the most important cost component for this technology option, it has 46 % share of the total cost, and 0.097 % of the total cost would be recovered at the end of the lifespan of the components as the salvage value (see Table 7). The technology has the least capital cost compared to the other technologies evalu-ated. Although it had the least capital cost, emissions were the highest from this technology with carbon dioxide (CO2) being emitted the most. With climate change concerns and the need to deliver reductions in carbon emissions, as the electricity supply sector is responsible for around 37.5 % of total CO2 emissions. [SIM2003], other environmental impacts from other emissions are given in Table 9. Furthermore, possible fuel spillage would pose an additional risk of contami-nated soil, groundwater and possibly waterways, the above enumerated factors cast doubts about the environmental suitability of this technology [UNE2011].
We also conducted an analysis at different fuel prices in consideration of volatil-ity in market fuel prices. The analysis gave us an insight into how fuel price

Ayaribil, Bykova, Kazandzhiev, Setiawan
64
would affect the cost structure of the system. Details of the results are displayed in Table 8.
Table 7: Cost summary of diesel system
Capital (€)
Replacement (€)
O&M (€)
Fuel (€)
Salvage (€)
Total (€)
Autosize Genset 110,000.00 1,939,306.90 1,826,370.52 3,220,478.54 -67,964.34 7,028,191.62
System 110,000.00 1,939,306.90 1826,370.52 3,220,478.54 -67,964.34 7,028,191.62
Table 8: Diesel fuel prices with 15 % increment and resulting costs
Diesel fuel price (€/L)
Initial capital (€)
Operating costs (€/yr)
NPC (€ million)
COE (€)
O&M cost (€)
0.48 110,000 219,004 7.03 0.393 57,816
0.55 110,000 233,871 7.50 0.419 57,816
0.63 110,000 250,863 8.03 0.449 57,816
0.73 110,000 272,102 8.71 0.487 57,816
0.84 110,000 295,465 9.44 0.528 57,816
Table 9: Diesel system's emission breakdown
GHG Value Units
Carbon Dioxide 555,961 kg/yr
Carbon Monoxide 3,504 kg/yr
Unburned Hydrocarbons 153 kg/yr
Particulate Matter 21.2 kg/yr
Sulfur Dioxide 1,361 kg/yr
Nitrogen Oxides 3,292 kg/yr

Off-grid renewable electricity systems in Nigeria
65
Table 10: Total diesel system electricity generation in kWh per year
Production kWh/yr %
Autosize Genset 654,898 100
Total 654,898 100
4.2.4 PV and Lead Acid Battery system
The system relies solely on solar irradiation as the energy source, captivated by HOMER Pro’s Generic flat plate PV. The energy is then stored in Generic 1 kWh Lead Acid Batteries. Subsequently, the DC is converted to AC with System Con-verters (generic), to be distributed to households and commercial centers. After choosing all components, HOMER Pro calculated the results.
Figure 6: Scheme of PV/LAB system
HOMER simulation results
HOMER yielded only one feasible solution for this combination of components. The solution required an initial investment of € 3.59 million (see Table 11). The calculated COE amounted to € 0.37 and with that tariff, the project would reach its investment breakeven point in 9.1 years or at 37 % of project completion.
Table 11: Cost summary of PV/LAB
Initial capital (€)
Operating costs (€)
NPC (€)
COE (€)
Rate of return (%)
Simple pay-back (yr)
Renewable Fraction (%)
3.59 M 2.84 M 7.17 0.37 20 % 9.1 100 %

Ayaribil, Bykova, Kazandzhiev, Setiawan
66
Economic analysis
In this system scenario, € 2.4 million or 66.7 % of the initial capital was allocated to finance the PV panels purchase (see Table 12). However, due to the long life-time of panels that covered the entire project operation of 25 years, there would not be any replacement cost incurred. The apparent lower initial investment for lead acid batteries (31.4 % of total capital cost) contradicted the exorbitant re-placement costs through project lifetime, as shown by the results that indicated that about 1,500 units of batteries would be required at a time. These lead acid storage bank would have to be replaced every ten years, hence the projected fu-ture payment of € 2.94 million that constituted 97.2 % of the entire system’s re-placement cost.
In respect of the operation and maintenance cost (O&M), the batteries remain the most cost-intensive components with a total of € 1.19 million, representing 82.5 % of the system’s O&M. The remaining 17.5 % of O&M would be engaged to sustain PV panels conditions. Further, HOMER calculated salvage value, re-sulting in the residual economic value of batteries and system converters that lowered the total project cost by 11.1 %.
Overall, the storage system would be the costliest components, given that it took up 61.4 % (€ 4.4 million) of the project cost of € 7.17 million. PV panels that were expensive at the beginning ended up taking up only 37 % of the total cost and as expected, system converters representing 1.6 % of total cost, were the least financially taxing components.
Table 12: Breakdown of PV/LAB components cost
Component Capital (€)
Replacement (€)
O&M (€)
Fuel (€)
Salvage (€)
Total (€)
Generic 1kWh Lead Acid
1,129,500.00 2,941,333.27 1,189,339.46 0.00 -860,744.12 4,399,428.61
Generic flat plate PV
2,397,381.88 0.00 252,439.21 0.00 0.00 2,649,821.09
System Converter 65,211.38 84,648.74 0.00 0.00 -33,576.13 116,283.99
System 3,592,093.26 3,025,982.01 1,441,778.66 0.00 -894,320.25 7,165,533.69
Components overview
Apart from the cost breakdown, HOMER provided the details of PV panels and lead acid batteries (see Table 13). The autonomy hours of the battery bank were

Off-grid renewable electricity systems in Nigeria
67
35.9 hours, significantly higher than the length of night and twilight times of 12 hours, when solar irradiation is virtually nonexistent [TIMn.d.]. This number is good, as when there is an issue with the PV panels that cannot be resolved quickly, the village electricity needs would still be fulfilled. The most striking figures from lead acid batteries are the losses that amounted to 67,434 kWh per year, the equivalent of 4.5 % of annual panel production. The losses would rise up to 1,685,850 kWh for the project lifetime. The losses emanated from the bat-teries heat generation and the substantial decrease in capacity caused by increas-ing discharge rates, which characterized lead acid batteries in general [LITn.d.-a].
Table 13: Breakdown of PV/LAB components performance
PVs
Item Value Units
Rated Capacity 799 kW
Mean Output 170 kW
Mean Output 4 077 kWh/d
Capacity Factor 21.3 %
Total Production 1 488 272 kWh/yr
PV Penetration 100 %
Lead Acid Batteries
Item Value Units
Batteries 3 765 qty.
Autonomy 35.9 hr
Storage Wear Cost 0.419 €/kWh
Lifetime Throughput 3 012 000 kWh
Expected Life 9.97 yr
Losses 67 434 kWh/yr

Ayaribil, Bykova, Kazandzhiev, Setiawan
68
4.2.5 PV and Lithium-ion Battery system
The system depends on solar irradiation as the energy source, captivated by HOMER Pro’s Generic flat plate PV (see Figure 7). The energy is then stored in Generic 1 kWh Lithium-ion (Li-Ion) Battery. Afterwards, the DC is converted to AC with System Converters in order to distribute electricity to households, mosques and commercial centers. After choosing all components, HOMER cal-culated the results.
Figure 7: Scheme of PV/Li-ion system
HOMER Results
HOMER provided only one feasible solution for this combination of parameters. The solution requires an initial investment of € 4.04 million (see Table 14). Throughout the project lifetime, € 1.34 million would be spent on operating costs. By the end of the 25-year period, the net present cost of the project is estimated to reach € 5.76 million. By setting the price at € 0.33 per kWh, a simple payback period of the project would be achieved in around 8 years with a rate of return amounting to 22 %.
Table 14: Cost summary of PV/Li-ion system
Initial capital (€)
Operating costs (€)
NPC (€)
COE (€)
Rate of return (%)
Simple pay-back (yr)
Renewable Fraction (%)
4.04 M 1.34 M 5.76 0.33 22 % 8.1 100 %
Economic analysis
Taking into account the cost breakdown data from the Table 15, we concluded that 72.7 % of initial investment part account for PV panels purchase. However, due to the lifetime of panels that covered the entire project lifetime, there would

Off-grid renewable electricity systems in Nigeria
69
not be any replacement cost incurred. In comparison to the high upfront invest-ment, required for the installation of the PV module, the initial capital for the battery storage system is relatively low, amounting to 25.5 % of the overall cap-ital cost. On the contrary, the batteries’ replacement costs were high and repre-sented the bulk of the system’s replacement cost, accounting for 93.5 %. This resulted from the battery lifetime of 15 years that covered more than half of pro-ject lifetime and led to one-off replacement. The system converter was an essen-tial part of the given system that did not call for significant capital or replacement costs and did not cost anything in operation and maintenance.
Regarding O&M cost, the whole system would require around € 853,047. It is worth noting, that the battery storage represented a major part of it - 63.7 %, whereas PV panels constituted less, 36.3 %. Then, HOMER calculated salvage value of a designed system, which reduced total project costs by 9 %.
In overall, in spite of the high replacement and O&M costs, Li-Ion battery was the least cost-intensive component of the entire system, compared to flat plate PV. The storage accounted for 41.4 % of total project cost. Meanwhile, PV panels took up more than half costs or 56.4 %, while the remaining 2.2 % of total cost accrued to the system converter.
Table 15: Breakdown of PV/Li-ion components cost
Component Capital (€)
Replacement (€)
O&M (€)
Fuel (€)
Salvage (€)
Total (€)
Generic 1kWh Li-Ion 1,032,600.00 1,340,383.86 543,652.91 0.00 -531,666.52 2,384,970.25
Generic flat plate PV 2,938,283.00 0.00 309,394.95 0.00 0.00 3,247,677.95
System Converter 71,985.85 93,442.45 0.00 0.00 -37,064.18 128,364.13
System 4,042,868.85 1,433,826.31 853,047.85 0.00 -568,730.70 5,761,012.32
HOMER Components
In addition to the cost calculation, HOMER provided detailed information re-garding system components, such as solar panels and batteries (see Table 16). The autonomy working time of the Li-Ion battery was 21.9 hours, which would be sufficient for meeting the village needs, in case of any problems with the PVs. Battery losses, which were equal to 29,583 kWh/year, accounted for 1.6 % of the total annual energy generation.

Ayaribil, Bykova, Kazandzhiev, Setiawan
70
Table 16: Breakdown of PV/Li-ion system components performance
PVs
Item Value Units
Rated Capacity 979 kW
Mean Output 208 kW
Mean Output 4,997 kWh/d
Capacity Factor 21.3 %
Total Production 1,824,058 kWh/yr
PV Penetration 100 %
Lithium-Ion Batteries
Item Value Units
Batteries 1,721 qty.
Autonomy 21.9 hr
Storage Wear Cost 0.211 €/kWh
Lifetime Throughput 4,214,852 kWh
Expected Life 15 yr
Losses 29,583 kWh/yr
4.2.6 PV-Diesel hybrid and lead acid batteries
This scenario investigates a hybrid energy system combining the following com-ponents: PV module, diesel generator, lead-acid battery storage system and sys-tem converter. In Figure 8 the schematic diagram of the energy system in ques-tion is shown. The PV system comprises a HOMER Pro’s 1 kW Generic flat plate PVs. The generated energy is stored in Generic 1 kWh lead acid batteries attached in strings. To supplement the energy generation in times when the required elec-trical load is not met by the PV module or by the battery, an Autosize Genset is added to the off-grid system. Subsequently, a system converter maintains the flow of energy between the AC electrical load and DC components of the hybrid energy system. After choosing all components, HOMER Pro again calculated the results.

Off-grid renewable electricity systems in Nigeria
71
Figure 8: Scheme of PV/Li-ion system.
HOMER simulation results
For the given parameters, the simulation analysis provided five different energy systems, with varying sets of components. Some of the solutions excluded one energy source or the other, making them non-hybrid systems. We chose the op-timal one, as suggested by the software, where 59.8 % of the energy delivered to the load is generated by the PV module. Table 17 illustrates the overall cost pa-rameters of the optimal energy system. At a price for one liter of diesel fuel set at € 0.48, the system would require a capital investment of € 1.19 million. Throughout the project’s life cycle, € 2.59 million would be spent on operating cost. In total, the net present cost associated with the entire project’s life-cycle would reach € 4.32 million. Given that, setting the price of a kWh of consumed electricity at € 0.25, the project is estimated to have a rate of return of 10.7 % and would achieve a payback on the investment within a decade.
Table 17: Cost summary of PV-Diesel/LAB system
Initial capital (€)
Operating costs (€)
NPC (€)
COE (€)
Rate of return (%)
Simple pay-back (yr)
Renewable Fraction (%)
1.19 M 2.59 M 4.32 M 0.25 10.7 % 9.3 59.8 %
Economic analysis
Under the given parameters, using the cost breakdown data from Table 18, we calculated that the most significant part, or around 64.9 %, of the capital invest-ment of the entire system would be absorbed by the capital cost of the PV module. However, due to the fact that the estimated lifetime of the PV module would over

Ayaribil, Bykova, Kazandzhiev, Setiawan
72
the entire project life cycle of 25 years, there would be no replacement cost in-curred. Furthermore, the solar panels would account for only 9.2 % of the total O&M cost.
As to the diesel generator, it accounts for around 9.3 % of the project’s capital cost. However, over 43 % of the total cost of the hybrid system for replacement, operation and maintenance would be spent on the genset. Furthermore, through-out the life cycle of the off-grid system (25 years), more than € 1 million would be allocated to the generator for diesel fuel.
In terms of capital cost, the lead acid storage system was the second most expen-sive component, accounting for about 22.6 % of the total capital investment. The relatively short expected life of the lead-acid batteries, estimated at slightly less than 7 years, explains the major expenditure that would be required for replace-ment. In addition to that, the battery storage would account for more than the half, or 51.9 %, of the total O&M cost. As in the other scenarios, the smallest fraction of funds would be allocated toward the system converter. It would ac-count for just 3.2 % of the total capital cost. In regard to the overall operating cost, less than 1 % would be required to be spent on this component.
Table 18: Breakdown of PV-Diesel/LAB system components cost
Component Capital (€)
Replacement (€)
O&M (€)
Fuel (€)
Salvage (€)
Total (€)
Autosize Genset 110,000.00 576,899.40 515,178.26 1,072,397.12 -149,804.74 2,124,670.03
Lead Acid Batteries 269,100.00 1,033,014.50 283,356.57 0.00 -167,055.93 1,418,415.13
Generic flat plate PV 771,798.90 0.00 81,268.78 0.00 0.00 853,067.68
System Converter 37,661.99 48,887.78 0.00 0.00 -19,391.46 67,158.31
System 1,188,560.89 1,658,801.67 879,803.61 1,072,397.12 -336,252.13 4,463,311.15
Energy output from the hybrid system
The breakdown of the electricity generated by the hybrid energy system is pre-sented in Table 19. The figures show that the sum total of electricity generated (706,907 kWh/year) met the required electricity load (551,638 kWh/year) with a combination of 67.8 % PV (479,125 kWh/year) and 32.2 % by diesel generator (227,782 kWh/year) with excess electricity of 155,269 kWh/year. The excess electricity could be used to cover potential energy losses and inefficiencies and to take care of any unexpected electrical load and thus guarantee regular energy supply.

Off-grid renewable electricity systems in Nigeria
73
Table 19: Breakdown of PV-Diesel/LAB system electricity generation
Production kWh/yr %
Generic flat plate PV 479,125 67.8
Autosize Genset 227,782 32.2
Total 706,907 100
Components overview
The entire PV module of the system was comprised of 257 PV panels with a capacity of 1 kW each (see Table 20). The panels would generate a mean output of 1,313 kWh on a daily basis. In order to fulfil the total electricity generation demand, a diesel generator would be running for 6 to 7 hours per day, thus pro-ducing around 624 kWh of energy per day.
Table 20: Breakdown of PV-Diesel/LAB system components performance
PVs
Item Value Units
Rated Capacity 257 kW
Mean Output 54.7 kW
Mean Output 1,313 kWh/d
Capacity Factor 21.3 %
Total Production 479,125 kWh/yr
PV Penetration 84.6 %
Genset
Item Value Units
Hours of Operation 2,471 hrs/yr
Number of Starts 629 starts/yr
Operational Life 6.07 yr
Electrical Production 227,782 kWh/yr
Mean Electrical Output 92.2 kW

Ayaribil, Bykova, Kazandzhiev, Setiawan
74
(Continuation of Table 20)
Minimum Electrical Output 55 kW
Maximum Electrical Output 192 kW
Total fuel consumed 70,725 L
Avg fuel per day 194 L/day
Avg fuel per hour 8.07 L/hour
Lead acid battery bank
Item Value Units
Batteries 897 qty.
Autonomy 8.33 hr
Storage Wear Cost 0.419 €/kWh
Lifetime Throughput 717,600 kWh
Expected Life 6.95 yr
Losses 23,072 kWh/yr
On average, the total estimated fuel consumption per day would exceed 193 li-ters, resulting in annual fuel demand of 70,725 liters. Electricity generated would be stored in more than 250 lead acid batteries attached in strings. The genset and the battery storage system would need to be fully replaced every 15 and 7 years, respectively. Annually, the hybrid would suffer energy losses exceeding 23,000 kWh, or roughly above 3.3 % of the total energy production.
Emissions
Accounting for more than one-third of the energy generated, annually the diesel generator is estimated to emit 181,131 kg of CO2 (see Table 21). By the end of the project, the amount of CO2 would exceed 4.5 million kg. Among the other emissions, the compound with the highest reported GWP is the nitrogen oxides. Having an impact between 265 and 298 times bigger than the CO2, the NOx gases, emitted on a yearly basis, would have the equivalent of around 320,000 kg of CO2, growing to nearly 8 million kg of CO2 by the end of the 25-year period [EPA2016]. The compounds with direct negative effect on human health are the particulate matter. The exhaust gases of the genset are estimated to result in more than 7 kg of PM each year.

Off-grid renewable electricity systems in Nigeria
75
Table 21: Breakdown of PV-Diesel/LAB system emissions
GHG Value Units
Carbon Dioxide 181,131 kg/yr
Carbon Monoxide 1,167 kg/yr
Unburned Hydrocarbons 50.9 kg/yr
Particulate Matter 7.07 kg/yr
Sulfur Dioxide 453 kg/yr
Nitrogen Oxides 1,096 kg/yr
4.2.7 PV-Diesel hybrid with Lithium Ion batteries
System description
The system relies partly on solar irradiation and conventional diesel-fueled gen-erators as the energy sources (see Figure 9). The solar panels were HOMER’s 1 kW Generic flat plate PV. The energy is then stored in Generic 1 kWh Li-ion batteries. Subsequently, the DC is converted to AC with System Converters, to be distributed to households and commercial centers. After choosing all compo-nents, HOMER calculated the results.
Figure 9: Scheme of PV-Diesel/Li-ion system
HOMER simulation results
HOMER came up with 5 feasible solutions for this combination of components, with varying sets of components. Some of the solutions excluded one energy source or the other, making them non-hybrid systems. We chose the optimal one

Ayaribil, Bykova, Kazandzhiev, Setiawan
76
as suggested by HOMER, with solar as the main energy source would account for 82.7 % of the entire energy inputs (see Table 22). This project would require an initial investment of € 1.82 million.
Table 22: Cost summary of PV-Diesel/Li-ion system
Initial capital (€)
Operating costs (€)
NPC (€)
COE (€)
Rate of re-turn (%)
Simple pay-back (yr)
Renewable Fraction (%)
1.82 M 1.43 M 3.54 M 0.202 9.4 % 9.4 82.7 %
Economic analysis
The purchase of PV panels would absorb the biggest fraction of initial investment of 53.6 % (see Table 23). However, due to the long lifetime of panels that covered the entire project operation of 25 years, there would not be any replacement cost incurred. The panels’ O&M of € 102,646 would be the least costly compared to other components. The second major component i.e. diesel generator set, would represent merely 6.1 % of total capital cost. The O&M engaged for the generator would be however, almost twice as high compared to the purchasing price. The total genset O&M would account for 31 % of the system’s O&M. The positive financial impact of modest capital cost would be further offset by the diesel fuel procurement amounting to € 0.46 million or 12.6 % of the whole project cost.
The capital cost for Li-ion batteries would be the second most expensive with € 693,000, representing 38.1 % of the total initial cost. Its replacement cost of € 898,357 would take up 82.2 % of the total replacement cost. Regarding its O&M, the storage system would cost € 364,857 or 53.9 % of the system’s O&M. As in other renewable energy systems, the system converters would constitute the lowest financial burden, requiring only 2.2 % and 4.7 % of the total initial capital and replacement cost, respectively. This Li-ion storage bank would have to be replaced every 14.9 years and by the end of the project, they would have a salvage value of € 347,611, lowering the total cost by 8.6 %.
In the big picture of the project cost, the procurement, replacement and O&M costs of the Li-ion batteries would constitute the most cost-intensive component, with a total of € 1.61 million, or 44.4 % of project cost. PV panels and their O&M would therefore be the second most expensive with € 1.08 million, accounting for 29.8 % of project cost. The diesel generator followed PV panels with a total of € 864,850, most of which would be utilized to finance diesel fuel purchase. As in all other systems, system converters would be the least economically demand-ing, with a total portion of meagre 2 % of the entire project cost.

Off-grid renewable electricity systems in Nigeria
77
Table 23: Breakdown of PV-Diesel/Li-ion system components cost
Component Capital (€)
Replacement (€)
O&M (€)
Fuel (€)
Salvage (€)
Total (€)
Autosize Genset 110,000.00 142,528.66 209,949.21 457,026.80 -54,654.66 864,850.01
Generic 1kWh Li-Ion 693,000.00 898,356.94 364,857.12 0.00 -347,610.82 1,608,603.24
Generic flat plate PV 974,811.53 0.00 102,645.58 0.00 0.00 1,077,457.11
System Converter 39,781.65 51,639.25 0.00 0.00 -20,482.83 70,938.07
System 1,817,593.19 1,092,524.85 677,451.92 457,026.80 -422,748.31 3,621,848.45
Energy output of the hybrid system
The breakdown of the electricity generated by the hybrid energy system is pre-sented in Table 24. As much as 86.1 % of the power would be generated from solar source and the remaining 13.9 % from diesel genset. This system reflects a high dependence on solar power and when a transition to a 100 % solar system is considered, there would not be a drastic change.
Table 24: Breakdown of PV-Diesel/Li-ion system electricity generation
Production kWh/yr %
Generic flat plate PV 605,154 86.1
Autosize Genset 98,077 13.9
Total 703,231 100
Components overview
As each PV panel has a 1 kW capacity, it means that in this particular system, a total of 325 panels would be acquired (see Table 25). These panels generated a mean output of 1,658 kWh per day. In respect of the second power source, diesel genset, it would be operating for approximately 2 to 3 hours a day, generating as much as 269 kWh. The generator would require 82.6 liters of fuel each day, to-taling to 30,141 liters per year. After 15 years of usage, the generator would need to be replaced. The electricity that has been generated by the two sources would then be stored in roughly 700 units of Li-ion batteries. Similar to lead acid bat-teries, Li-ion batteries also suffered energy losses. In a span of a year, there would be a loss of 24,426 kWh or 3.5 % of the hybrid power generation.

Ayaribil, Bykova, Kazandzhiev, Setiawan
78
Table 25: Breakdown of PV-Diesel/Li-ion system components performance
PVs
Item Value Units
Rated Capacity 325 kW
Mean Output 69.1 kW
Mean Output 1,658 kWh/d
Capacity Factor 21.3 %
Total Production 605,154 kWh/yr
PV Penetration 100.7 %
Genset
Item Value Units
Hours of Operation 1,007 hrs/yr
Number of Starts 565 starts/yr
Operational Life 14.9 yr
Electrical Production 98,077 kWh/yr
Mean Electrical Output 97.4 kW
Minimum Electrical Output 55 kW
Maximum Electrical Output 192 kW
Total fuel consumed 30,141 L
Avg fuel per day 82.6 L/day
Avg fuel per hour 3.44 L/hour
Li-ion battery bank
Item Value Units
Batteries 1,155 qty.
Autonomy 14.3 hr
Storage Wear Cost 0.211 €/kWh
Lifetime Throughput 3,465,000 kWh
Expected Life 14.9 yr
Losses 24 426 kWh/yr

Off-grid renewable electricity systems in Nigeria
79
Emissions
The combustion of 30,141 liters of diesel fuel evidently resulted in exhaust that are a mixture of GHGs (see Table 26). Despite of its relatively small proportion in this system, the genset produced 78,898 kg of CO2 per year that might seem low when compared to other systems, would however amount to a total of 1,972,450 kg of CO2 by the end of the project. The most impactful compound would be nitrogen oxides, as it has a GWP between 265 and 298 for a 100-year timescale and a lifetime of more than a century [EPA2016]. The annual emission of nitrogen oxides of 467 kg could be translated to 131,694 kg of CO2 and at the project expiration, the number would swell up to 3,292,350 kg. Another emission that especially has an immediate repercussion on human health is particulate mat-ter (PM), or commonly known as dust. Minuscule PM is particularly lethal as the human respiratory filtration system is not able to stop them from being inhaled and it has been named as a cause of a range of pulmonary diseases.
Table 26: Breakdown of PV-Diesel/Li-ion system emissions
GHG Value Units
Carbon Dioxide 78 898 kg/yr
Carbon Monoxide 497 kg/yr
Unburned Hydrocarbons 21.7 kg/yr
Particulate Matter 3.01 kg/yr
Sulfur Dioxide 193 kg/yr
Nitrogen Oxides 467 kg/yr
4.3 AHP and scoring results
After observing and analyzing the HOMER simulations, an analytical hierarchy process was conducted in order to make a comprehensive analysis of each de-signed system in terms of its sustainability performance. For this reason, eco-nomic, social and environmental criteria were chosen for the research (see Sec-tion 3.3). In total, we conducted four AHP, the first one was completed for the main criteria i.e. economic, social and environmental criteria. We performed the other 3 weightings for each of the main criteria’s subcriteria. All of these AHP processes and results will be discussed in this section.

Ayaribil, Bykova, Kazandzhiev, Setiawan
80
4.3.1 Main criteria weighting
Upon team discussions, we agreed that economic criterion was inherently of the highest importance, as for the project to exist in the first place, a certain amount of capital investment was necessary (see Table 27). The running and livelihood of the project would depend on the availability of funds to finance the operating cost. On the one hand, the least capital and operating costs, would be reflected in a low price of energy, hence its affordability for the targeted population and their relatively low propensity to consume. On the other hand, they would create an incentive for investors to get involved in potential energy projects. In short, when there was no investment, there would be no project. For all those reasons, the pairwise comparison matrix gave the economic criterion a weight of 71.8 %.
Table 27: Pairwise comparison results of the main criteria
Economic Social Environmental
Economic 1 4 7
Social 1/4 1 3
Environmental 1/7 1/3 1
Meanwhile, we considered social criterion as the second most influential aspect (see Figure 10). Society plays a significant role not only as consumers, but also as participants during project development, maintenance and operation. There-fore, project acceptance and support by inhabitants would be the basis for its fu-ture development. For all those reasons, the pairwise comparison matrix gave social criterion a weight of 18 %.
Figure 10: The criteria’s weight
In our discussions we came to a consensus that, environmental concerns should also be considered when selecting energy generation system, due to the impacts

Off-grid renewable electricity systems in Nigeria
81
they could have on the environment and health of the inhabitants. Thus, we po-sitioned it as the least important criterion in our analysis with 10.3 % weight.
4.3.2 Subcriteria weighting and resulting system performance
The economic criterion is constituted by four composite subcriteria i.e. capital cost, operating cost, cost of energy (COE) and payback period, which will be explained in the following sections (see Table 28).
Table 28: Pairwise comparison of economic subcriteria
Capital cost
Operating cost
Cost of energy
Payback period
Capital cost 1 1/2 1 5
Operating cost 2 1 2 7
Cost of energy 1 1/2 1 5
Payback period 1/5 1/7 1/5 1
x We deemed the capital cost to be half as important as the operating cost.
Meanwhile, capital cost and the cost of energy are of the same im-portance. Regarding the payback period, we considered that capital cost was 5 times more influential than it.
x From our perspective, operating cost holds twice more value than COE, due to its direct influence on the pricing of kWh of energy consumed. We decided that 7 would be an appropriate number to describe the relative significance of operating cost in comparison to the payback period.
x Based on our viewpoint, as an NGO aiming to provide cheap and afford-able electricity prices for the population of Sokoto that are mostly situated at the bottom of the pyramid, we gave a 5:1 score ratio to the cost of energy in comparison to the payback period. Shorter payback period would mainly be an attractive factor for investors.
As a result of the pairwise comparison, we derived the following weighting (see Table 29):

Ayaribil, Bykova, Kazandzhiev, Setiawan
82
Table 29: Weights of economic subcriteria
Subcriteria Normalized weight
Capital cost 0.24
Operating cost 0.48
Cost of energy 0.24
Payback period 0.05
Furthermore, Table 30 indicates each system’s economic subcriteria perfor-mance.
Table 30: Each system's economic subcriteria performance
Off-grid System Capital cost
Operating Cost COE Payback
Period
PV-LAB € 3.59 M € 2.84 € 0.37 9.1
PV-Li-ion € 4.04 M € 1.34 M € 0.33 8.1
Diesel-only € 110 000 € 5.48 M € 0.39 n/a
PV-Diesel-LAB € 1.19 M € 2.59 M € 0.25 9.3
PV-Diesel-Li-ion € 1.82 M € 1.43 M € 0.20 9.4
Scoring of the five systems’ economic performance
The next step involved scoring of each system on the basis of a scoring scale. Then, the multiplication of the scores with the respective weight of subcriteria was done, resulting in weighted scores. Given that there are four economic sub-criteria, we have four scoring scales for each of them (see Appendix of this con-tribution).
Weighted results
Diesel
The Diesel system is the most widely used technology. It has a low capital cost, therefore receiving a score of 10 points, but rather high operating costs compared to the other systems, hence a score of 0 points (see Table 31). The COE (per kWh) is also more expensive, due to high volume of diesel fuel consumption,

Off-grid renewable electricity systems in Nigeria
83
thus receives the score 0 points too. The payback period was not provided by HOMER, for this reason it receives an average score of 5 points.
Table 31: Diesel system economic subcriteria scores and weighted results
Subcriteria Normalized Weight Score (0-10) Results
Capital cost 0.24 10 2.28
Operating cost 0.48 0 0
Cost of energy 0.24 0 0
Payback period 0.05 5 0.24
Total Score 2.62
PV and lead acid batteries
PV/LAB system’s performance in terms of the four economic subcriteria can be taken from Table 30 and the scores, weight and weighted scores are presented in Table 31. It has very low scores for capital cost, COE and payback period. How-ever, it has a moderate score in operating cost, a subcriterion that has the most decisive weight. Overall, PV/LAB collects a total point of 3.43 in economic per-formance parameter.
Table 32: PV/LAB system economic subcriteria scores and weighted results
Subcriteria Normalized Weight Score (0-10) Results
Capital cost 0.24 1 0.24
Operating cost 0.48 6 2.86
Cost of energy 0.24 1 0.24
Payback period 0.05 2 0.10
Total Score 3.43
PV and Li-ion batteries
Table 33 illustrates economic performance of PV/Li-Ion system in respect of the chosen subcriteria. Due to the fact that this technology requires the highest in-vestments among others, it gets the lowest score in terms of capital costs. How-ever, in regard to operating cost and payback period, PV/Li-Ion achieves great

Ayaribil, Bykova, Kazandzhiev, Setiawan
84
performance and therefore gets the highest score. Additionally, the technology demonstrates moderate result for cost of energy parameter. Overall, PV/Li-Ion gathers 5.95 points for economic criterion.
Table 33: PV/Li-ion Diesel economic subcriteria scores and weighted results
Subcriteria Normalized
Weight Score (0-10) Results
Capital cost 0.24 0 0
Operating cost 0.48 10 4.76
Cost of energy 0.24 3 0.71
Payback period 0.05 10 0.48
Total Score 5.95
Hybrid PV-Diesel with lead acid batteries
Table 34 provides an overview of the economic parameters of the PV-Diesel en-ergy hybrid system with lead acid storage and their evaluation in accordance to the AHP model. The relatively low investment costs required at the initial phase of the project, brings the system a good score for the subcriterion of capital cost. Moreover, due to the moderate expenses associated with the operating costs, the system scores also quite well in this subcriterion. The above-average perfor-mance of the system in the previously mentioned criterion, allows maintaining relatively low price levels, for which it is graded with another 7 points. At the other extreme, the system scores poorly in the payback period criterion. Overall, the PV-Diesel/LAB receives a good total result of 6.71 points.
Table 34: PV-Diesel/LAB system economic subcriteria scores and weighted results
Subcriteria Normalized Weight Score (0-10) Results
Capital cost 0.24 7 1.67
Operating cost 0.48 7 3.33
Cost of energy 0.24 7 1.67
Payback period 0.05 1 0.05
Total Score 6.71

Off-grid renewable electricity systems in Nigeria
85
Hybrid PV-Diesel with Li-ion batteries
Table 35 illustrates how the PV-Diesel energy hybrid system with Li-ion battery storage performs, in terms of finance and demonstrates the weighted results of the assessed economic subcriteria. The required initial capital of nearly € 2 mil-lion, justifies the moderate grade of the system for the criterion of capital cost. At the same time, the system scores excellently in the criterion with the highest priority i.e. operating cost. Another excellent grade is given due to the low COE. In the criterion of payback period, the PV-Diesel/Li-ion system finds itself at the other end of the scale, receiving the worst possible grade of 0 points. In aggregate, the hybrid system gathers an excellent result of 8.33 points.
Table 35: PV-Diesel/Li-ion system economic subcriteria scores and weighted results
Subcriteria Normalized Weight Score (0-10) Results
Capital cost 0.24 5 1.19
Operating cost 0.48 10 4.76
Cost of energy 0.24 10 2.38
Payback period 0.05 0 0
Total Score 8.33
4.3.3 Social criterion
The social criterion has three composite subcriteria i.e. social acceptability, em-ployment and life quality (see Table 36), which will be explained in the following paragraphs.
Table 36: Pairwise comparison of social subcriteria
Social Acceptability Employment Life Quality
Social Acceptability 1 4 1/3
Employment 1/4 1 1/7
Life Quality 3 7 1
x We assume that life quality is the most significant and influential aspect that
has to be taken into account in this project. It includes general well-being; the

Ayaribil, Bykova, Kazandzhiev, Setiawan
86
degree of society satisfaction as to how comfortable living conditions are. This is a far-reaching criterion, that covers almost all aspects of human life. For this reason, life quality is deemed to be 7 times more important than em-ployment opportunities and performs 3 times more than social acceptability.
x In regard to employment, we decided that social acceptability is 4 times more influential than that. All analyzed systems create a limited amount of employ-ment opportunities, depending on battery and technology requirements, whereas initial project success is highly dependent on moderately acceptance by local population in order to avoid abandonment, sabotage and other prob-lems with its maintenance.
As a result of the pairwise comparison, we reached the following weighting (see Table 37):
Table 37: Weight of social subcriteria
Subcriteria Normalized weight
Social Acceptability 0.24
Employment 0.06
Life Quality 0.71
We scored all system’s social performance based on the gathered qualitative data. In Table 38, we analyzed the social performance of all main components i.e. PV module, diesel generator, lead acid batteries and Li-ion batteries.
Scoring of the five systems’ social performance
Due to the necessity to obtain the relative social performance score of each en-ergy generation system, despite of its qualitative nature, we created a grading scale of 0 to 10 and then evaluate every designed system according to this scale. The last step involved the multiplication of the scores with the respective weight of subcriteria, resulting in weighted scores.

Off-grid renewable electricity systems in Nigeria
87
Table 38: Assessment of main components' social subcriteria performance
Compo-nent
Social Acceptability Employment Life Quality
PV module
In a community where the most realistic means to have electricity is diesel generator, solar panels might be perceived as something very foreign hence its low likeli-hood to be socially accepted.
Concerning the PV mod-ule, there would not be any need for replacement of the panels, since their lifespan exceeds the 25-year life-time of the project. The maintenance of the panels would not create a substan-tial amount of stable job opportunities for the work-force.
The installation and operation of the PV module would not obstruct the quality of life of the village population in any way.
Diesel generator
Because of the lack of alterna-tives, for a long time, diesel gen-erators have been the most popu-lar source of electricity in the ru-ral areas of Northern Nigeria. This makes them highly accepted by the society.
Due to fuel requirements and regular need for repair and maintenance, the diesel generator has the potential to create stable employ-ment opportunities for the locals.
Using diesel generators for producing electricity creates significant health threats and it contributes to air pollution. Thus, generators have deterio-rating effect on the village life quality.
Lead acid batteries
The fact that since decades, lead acid batteries have been the most common energy storage technol-ogy makes them more socially acceptable.
Lead acid batteries require frequent maintenance ser-vices and replacement every 7 years. Therefore, a decent amount of jobs might be created.
Because of the nature of the technology, any deterioration or damage of the battery sys-tem, might lead to leakage of hazardous substances.
Lithium-ion batte-ries
The relatively new technology behind the Li-ion batteries has a lower probability to be accepted by the community.
Because of their extended cycle of life, Li-ion batter-ies usually do not show signs of wear before the 15th year. Furthermore, given the little maintenance requirements, they would not generate substantial la-bor demand.
Li-ion represents the much cleaner technology and re-quires much less space to be installed. Therefore, its contri-bution to the population’s quality of life is better com-pared to the lead acid batter-ies,
Weighted results
Diesel
Table 39 illustrates performance of diesel system in terms of social subcriteria. As indicated earlier, diesel genset is a widespread technology and as a conse-quence gets an excellent score for social acceptability. There would be a high number of employment opportunities created in relation to the operation of this system hence, a very good score of 9 points. However, life quality would be ad-versely affected, mostly in the area of health, and its effects on the other aspects of wellbeing, for which it was given a poor score of 1 points.

Ayaribil, Bykova, Kazandzhiev, Setiawan
88
Table 39: Diesel system social subcriteria scores and weighted results
Subcriteria Normalized Weight Score (0-10) Results
Social Acceptability
0.24 10 2.35
Employment 0.06 9 0.53
Life Quality 0.71 1 0.71
Total Score 3.59
PV and lead acid batteries
Table 40 illustrates the performance of the PV/LAB system in terms of social subcriteria. The combination of contrasting social acceptance of PV panels and lead acid batteries resulted in a score of 5 points. We gave 3 points to the em-ployment aspect due to the lack of stable jobs generated from the installation of this system. As for the system’s impacts on life quality, it was considered as good, as PV panels are a clean power source. As a result, it has a weighted total score of 6.29 points.
Table 40: PV/LAB system social subcriteria scores and weighted results
Subcriteria Normalized Weight Score (0-10) Results
Social Accepta-bility
0.24 5 1.18
Employment 0.06 3 0.18
Life Quality 0.71 7 4.94
Total Score 6.29
PV and Li-ion batteries
Table 41 illustrates score allocation and final performance of PV/Li-Ion system in terms of social subcriteria. Due to the fact that PV panels are not a widespread technology solution for inhabitants in rural Nigeria, this system would not be highly accepted. Moreover, local people use in most cases diesel generators, for this reason PV/Li-Ion technology represents new and unfamiliar resource for en-

Off-grid renewable electricity systems in Nigeria
89
ergy generation. Regarding the employment criterion, as there is no need to re-place PV panels throughout its lifetime and only one-off replacement of battery storage would be necessary, the project would not create a significant number of job opportunities. Taking into account the abovementioned, PV/Li-Ion technol-ogy gets moderate points for social acceptance and poor score for employment parameters. As for life quality criterion, PV would contribute to more stable and emission-free energy supply for the entire village. Moreover, Li-Ion batteries are highly resilient to any damages and excessive discharging in comparison to lead acid ones. This allows us to give very good score for this type of technology. Overall, PV/Li-Ion achieves 6.71 points in respect of social performance.
Table 41: PV/Li-ion system social subcriteria scores and weighted results
Subcriteria Normalized
Weight Score (0-10) Results
Social Accepta-bility 0.24 4 0.94
Employment 0.06 2 0.12
Life Quality 0.71 8 5.65
Total Score 6.71
Hybrid PV-Diesel with lead acid batteries
Table 42 gives an overview of the performance and weighted results of the PV-Diesel/LAB energy hybrid system, in terms of the social subcriteria. A score of 2 points, for the first subcriterion, is given because combining a PV module, a diesel generator and a battery storage within one system could possibly represent a difficult learning curve for the locals, hence the low social acceptability. At the same time, for the reason that the genset and the lead-acid batteries might create stable employment opportunities for the community, the system receives a good score of 6 points for employment. Finally, due to the risk that some of the com-ponents pose a threat to human health, the system had a below-average score of 3 points within the subcriterion of life quality. Overall, the PV-Diesel/LAB hy-brid receives a poor score of 2.94 points.

Ayaribil, Bykova, Kazandzhiev, Setiawan
90
Table 42: Diesel/LAB system social subcriteria scores and weighted results
Sub-criteria Normalized Weight Score (0-10) Results
Social Accepta-bility
0.24 2 0.47
Employment 0.06 6 0.35
Life Quality 0.71 3 2.12
Total Score 2.94
Hybrid PV-Diesel with Li-Ion batteries
Table 43 shows how the PV-Diesel/Li-ion energy hybrid system performs and scores in accordance to the social subcriteria. The overall complexity of the sys-tem and the relatively unpopular energy storage technology used, posing a risk of social rejection, justify the extremely low score of only 1 point, given for the social acceptability subcriterion. Furthermore, the low need of regular mainte-nance and batteries replacement, brings the system a score of only 4 points in employment aspect. Another 4 points were given to the system in life quality, mainly because of the presence of the diesel generator. In aggregate, the PV-Diesel/Li-ion hybrid earns a total weighted score of 3.29 points.
Table 43: PV-Diesel/Li-ion system social subcriteria scores and weighted results
Sub-criteria Normalized Weight Score (0-10) Results
Social Accepta-bility
0.24 1 0.24
Employment 0.06 4 0.24
Life Quality 0.71 4 2.82
Total Score 3.29
4.3.4 Environmental criteria
For a comprehensive analysis, the environmental criterion was decomposed into three subcriteria i.e. emissions of CO2 and CO as the main greenhouse gases

Off-grid renewable electricity systems in Nigeria
91
(GHG), end-of-life impacts and then impacts on land (see Table 44). Notwith-standing the significance of environmental criterion, when it was put into pair-wise comparisons with the other two criteria, it ended up with a marginal weight of 10.3 %. This shows how less it is of importance in relation to the two other criteria, when selecting a suitable technology for the supply of energy to our tar-get population. The following section discusses how the pairwise comparison, weighting and scoring was done among the subcriteria and then the technologies.
Table 44: Pairwise comparison of environmental subcriteria
GHG Emissions End-of-life Land use
GHG Emissions 1 2 6
End-of-life ½ 1 4
Land use 1/6 1/4 1
Based on the HOMER analysis and the literature reviewed we arrived at the de-cision that GHG emissions are of slightly higher importance than end-of-life im-pacts, therefore, a relative score of 2 points is assigned in favor of GHG emis-sions. Also, between GHG emissions and land, a scale of 6 points is assigned to GHG emissions, which signifies it is clearly more important than land. Lastly, the pairwise comparison between end-of-life impacts and impacts on land shows that the former is moderately more important than the latter and was therefore scaled at 4 points. This decision was reached after an in-depth literature analysis concerning the various components of the technologies and the impacts these technologies could have on land use in the long run. The computed normalized values are displayed in Table 45 below.
Table 45: Weights of environmental subcrtieria
Subcriteria Normalized weight
GHG Emissions 0.6
End-of-life 0.3
Land use 0.1
We scored all systems’ environmental performances, based on the collected quantitative data. In Table 46, we analyzed the performance of each component.

Ayaribil, Bykova, Kazandzhiev, Setiawan
92
Table 46: Assessment of main components' environmental subcriteria performance
Component GHG Emissions End-of-life Land use
PV module The utilization of PV modules does not result in any GHG emissions.
A study conducted by Corcelli, Ripa and Ulgiati [2017] breaks down the recyclability of a panel’s composite elements. 95 % and 97 % of the silicon scraps and alumi-num, respectively, can be recycled. Further, glass, the heaviest part of a panel has a recyclability rate of 91 %. Lastly, 90 % of the copper can also be recycled. A published book by IEA-PVPS and IRENA [2017] found that the major components of crystalline panels i.e. glass, alumin-ium, and copper, can be recovered up to 85 % of cumulative yields through mechanical processes. Therefore, we considered 90 % as a representative number for panels recyclability rate.
Homer PRO does not provide any specifications about the components. However, a unit of 1 kW solar panel occupies 8m2 [THEn.d.].
Diesel generator
The GHGs emissions pro-duced by diesel genera-tors are obtained from Homer PRO simulation data. We decided to take into account CO2 and CO that has a GWP of 1.9. The total of two gases emissions is expressed in kg of CO2.
The end-of-life value of a genset varies from one manufacturer to another. Benton, Zhang and Wang [2017] came up with four scenarios of a genset EoL, where scenario 1 is the best case and scenario 4 is the worst. Scenario 2 and 3 have the same recycling configuration, which was acquired from a USEPA report. We chose scenario 2 as our genset EoL value, with 34 % recy-cling rate and 32 % remanufactur-ing rate, totaling to 66 %.
A 100 kW diesel genset is compact, its size is compara-ble to that of a pickup truck.
Lead-acid bat-teries
The utilization of lead-acid batteries does not re-sult in any GHG emis-sions.
As regards the lead acid batteries, at least 95 % of the battery can go to recycling process [ALB2012]. It is worth stating that lead acid bat-teries are the world’s most recycled product [UNE2011].
Lead-acid battery’s volume is 5.6 times higher than that of Li-ion. Therefore, instead of calculating the actual surface area, the land use of batteries will be expressed in Li-ion
units. Lithium-ion batteries
The utilization of Li-ion batteries does not result in any GHG emissions.
According to a study conducted by Georgi-Maschler [2012], the recy-cling rate is around 65 %.

Off-grid renewable electricity systems in Nigeria
93
Scoring of the five systems’ environmental performance.
To determine the relative performance of the five generation systems, we created a scale of 0-10 to score their performance following the same process as the two other criteria (see Appendix at the end of this contribution). As a result, we have the weighted score of each assessed system.
Weighted results
Diesel
Table 47 shows the performance of diesel generation system within the environ-mental criterion. It performed poorly for both GHG and-end-of-life subcriteria with a 0 point score for each. The poor performance is due to the system depend-ence on fossil fuels to generate energy and the consequent high GHG emissions of CO2 and CO, and a less satisfactory recycling and remanufacturing rate of 66 %. The systems less use of land space results in a excellent score of 10 points.
Table 47: Diesel system environmental subcriteria scores and weighted results
Subcriteria Normalized Weight Score (0-10) Results
GHG Emissions 0.6 0 0
End-of-life 0.3 0 0
Land use 0.1 10 1
Total Score 1
PV with lead acid batteries
Table 48 illustrates the performance of the PV/LAB generation system in terms of the environmental subcriteria. The GHG emissions during the operational life of the system would be 0 points, as the use of PV panels and batteries would not create any air pollution, hence it receives an excellent score of 10 points. Both PV modules and lead acid batteries have high recyclability and reusability rates of 90 % and 95 %, respectively. Therefore, PV/LAB system was given again a maximum score of 10 points. PV/LAB system requires around 2,663 panels and 1,500 battery units at once. As previously explained in Table 46, LAB takes up 5.6 times more space than Li-ion. Therefore, expressed in Li-ion units, the lead acid storage would occupy a space equivalent to 8,400 lithium-ion batteries. The determining component is the PV panels as one of them takes 8 m2 of surface area. Furthermore, lead acid batteries could pose a danger to human health, bio-diversity and land use. Improper handling might result in leakages, contaminating soil and environment. For this reason, PV/LAB is considered to be performing

Ayaribil, Bykova, Kazandzhiev, Setiawan
94
badly, receiving a score of 1 point. Overall, the system receives a total score of 9.1 points.
Table 48: PV/LAB system environmental subcriteria scores and weighted results
Subcriteria Normalized Weight Score (0-10) Results
GHG emissions 0.6 10 6
End -of- Life 0.3 10 3
Land use 0.1 1 0.1
Total Score 9.1
PV and Li-ion batteries
PV/Li-Ion system performance in terms of environmental subcriteria is shown in the Table 49. This technology has the lowest score for land use parameter because of high number of solar panels needed. It leads to significant land occupation and consequently its unavailability for agricultural needs. Regarding the end-of-life subcriterion, although Li-Ion batteries have a longer lifespan than lead acid, how-ever, it has a lower recycling rate of 81 % and an average score is given. As well as PV/Lead Acid system, PV/Li-Ion has no emissions during the whole project lifetime, which therefore leads to great performance in GHG emissions. Hence, the technology demonstrates very high result of 7.5 points in environmental pa-rameters.
Table 49: PV/Li-ion system environmental subcriteria scores and weighted results
Subcriteria Normalized
Weight Score (0-10) Results
GHG Emissions 0.6 10 6
End-of-life 0.3 5 1.5
Land use 0.1 0 0
Total Score 7.5
Hybrid PV-Diesel with lead acid batteries
Table 50 illustrates the impact that a PV-Diesel energy hybrid system with lead acid batteries storage has on the environment, and the weighted results of the assessed environmental subcriteria. The PV module accounts for most of the

Off-grid renewable electricity systems in Nigeria
95
power generation but still a significant fraction of 40 % is produced by the diesel generator. Therefore, the hybrid scores 7 points in the GHG emissions criteria. At the same time, the high recyclability rate of all components gives the system a maximum score of 10 points in terms of end-of-life. Lastly, due to the high number of solar panels and battery strings required, the system scores average in the land use criterion. Overall, the PV-Diesel/LAB hybrid gathers a good total result of 7.7 pooints.
Table 50: PV-Diesel/LAB system environmental subcriteria scores and weighted results
Subcriteria Normalized
Weight Score (0-10) Results
GHG Emissions 0.6 7 4.2
End-of-life 0.3 10 3
Land use 0.1 5 0.5
Total Score 7.7
Hybrid PV-Diesel with Li-ion batteries
Table 51 shows the environmental performance of the PV-Diesel energy hybrid system with Li-ion battery storage. On the one hand, the above-80 % fraction of energy generated by PV panels and high battery efficiency reduce the need for a diesel generator to a minimum, which explains why the system has an excellent score of 9 points in the GHG emissions subcriterion. On the other hand, due to the relatively low recycling rate of the Li-ion batteries, the hybrid system receives only 4 points. Again, due to the land size requirement to install the PV module and the battery storage, the system receives a below average score of 4 points. In total, the PV-Diesel/Li-ion hybrid system collects a good result of 7 points.
Table 51: PV-Diesel/Li-ion system environmental subcriteria scores and weighted results
Sub-criteria Normalized Weight Score (0-10) Results
GHG Emissions 0.6 9 5.4
End-of-life 0.3 4 1.2
Land use 0.1 4 0.4
Total Score 7

Ayaribil, Bykova, Kazandzhiev, Setiawan
96
The following web charts (Figure 11 until Figure 15) visualize the non-weighted 10 subcriteria scores of each system. The charts are useful for a quick glance on each system’s performance. For instance, diesel system shows very contrasting scores in operating cost and COE and capital cost and employment. PV/LAB showcases a mixture of few excellent, moderate and low scores. The best envi-ronmental score of PV/Li-ion is apparent by the grey area. PV-Diesel/LAB has considerable grey area, indicating its good overall performance. The high perfor-mance of PV-Diesel/Li-ion in economic parameters is well visualized. All of these remarks become apparent in the figures.
4.3.5 System performance in main criteria
The last step of the AHP analysis is to compute the overall score for the five off-grid energy systems and compare them. The results are presented in Table 52. This evaluation shows that the PV-Diesel/Li-ion with total score of 7.29 points, is outperforming the other alternatives with a prominent distance. Although the PV-Diesel/Li-ion trails behind in the social and the environmental criteria, scor-ing 3.29 and 7 points respectively, it stands out with its excellent economic pa-rameters, scoring 5.98 points in the criterion with the highest weight.
Table 52: All systems’ weighted results of the main criteria
Criteria Diesel PV/ LAB
PV/ Li-ion
PV-Diesel/ LAB
PV-Diesel/ Li-ion
Economic 1.88 2.46 4.27 4.82 5.98
Social 0.64 1.13 1.20 0.53 0.59
Environmental 0.10 0.93 0.77 0.79 0.72
Overall result 2.63 4.52 6.25 6.14 7.29

Off-grid renewable electricity systems in Nigeria
97
Figure 12: PV/LAB system comprehensive non-weighted performance
Figure 11: Diesel system comprehensive non-weighted performance
Figure 13: PV/Li-ion system comprehen-sive non-weighted performance
Figure 14: PV-Diesel/LAB system compre-hensive non-weighted performance
Figure 15: PV-Diesel/Li-ion system com-prehensive non-weighted performance


Off-grid renewable electricity systems in Nigeria
99
5 Discussion
5.1 Comparison of PV-Diesel/Li-ion with other systems
The final results of the AHP analysis are visualized in a bar chart (Figure 16), where the bars represents the weighted scores of each off-grid system in regard to the three main criteria, as well as their overall score. This paragraphs will briefly describe how PV-Diesel/Li-ion, as the benchmark, compares to the other four alternatives.
PV-Diesel/Li-ion vs. Diesel
Compared to the most widespread way to generate electricity in Sokoto, the PV-Diesel/Li-ion outperforms a Diesel system by far, with a total score of 7.29 points compared to 2.63 points. The difference between the two solutions is most nota-ble when it comes to the economic parameters, where the far better operating cost and cost of energy bring the PV-Diesel/Li-ion system a score of 5.98 points. In contrast, the high expenses associated to operating and maintaining the diesel system result in high energy prices for the end consumers and low score for the economic criterion. At the same time, representing the most popular source of electricity in the rural areas of Northern Nigeria, gives the diesel system a slight advantage when assessing the social criterion. Lastly, with renewable fraction of above 80 %, the PV-Diesel/Li-ion system is the legitimate winner when it comes to comparing the alternatives in environmental terms. The diesel-only system is outweighed by 0.72 to 0.1.
PV-Diesel/Li-ion vs. PV/LAB
When it comes to comparing the PV-Diesel/Li-ion system to the PV/LAB, it again heavily outrivals its competitor, with a total score of 7.29 points compared to 4.52 points. As to financial parameters, the PV-Diesel/Li-ion outperforms the other system in each of the economic subcriterion assessed, achieving a score more than double that of the PV/LAB (5.98 points compared to 2.46 points). When it comes to comparing the social and environmental performance of the two alternatives, the scores of PV/LAB are higher in both 1.13 points compared to 0.59 points and 0.93 points compared to 0.72 points respectively. However, due to the influence that the economic parameters have, this does not significantly impact the overall score.
PV-Diesel/Li-ion vs. PV-Diesel/LAB
The gap between the total scores narrows down when comparing the PV-Die-sel/Li-ion to the other hybrid system. The only variable between the alternatives, which makes a difference, is the type of the storage system. At the end, the PV-

Ayaribil, Bykova, Kazandzhiev, Setiawan
100
Diesel/Li-ion outweighs the other hybrid alternative with a score of 7.29 points compared to 6.14 points. Deploying lithium-ion batteries ensures lower operating expenses and cheaper price per kWh of energy for the end consumers. At the same time, the cleaner technology behind the lithium-ion storage system gives a slight advantage when it comes to life-quality and health safety for the locals, culminating in slightly better score in regard to the social criterion (0.59 points compared to 0.53 points). Lastly, due the higher recycling rate of the lead acid batteries, the PV-Diesel/LAB system gets a slight advantage in environmental terms, winning with 0.79 points compared to 0.72 points.
PV-Diesel/Li-ion vs. PV/Li-ion
The alternative, with a total score closest to the one of the PV-Diesel/Li-ion, is the 100 % renewable system of PV module and lithium-ion battery storage. The PV/Li-ion system lags only with a single unit behind the winner, 6.25 points compared to 7.29. As in the case of the other 100 % renewable system, the PV/Li-ion outperforms the PV-Diesel/Li-ion in social and environmental terms, but fails to compete economically. Within the social criterion, the system achieves a score twice as high as the hybrid and the best among all other solutions - 1.20 points. In respect to the impact the two systems have on the environment, the PV/Li-ion scores slightly better - 0.77 points compared to 0.72 points. As to the financial parameters of the projects, the PV/Li-ion requires the highest capital cost, which bears the risk to repel any potential investments. Combined with the relatively high cost of energy, the PV/Li-ion system loses the economic compettition with a score of 4.27 points compared to 5.98 points.
Figure 16: Weighted performance of 5 systems in all subcriteria

Off-grid renewable electricity systems in Nigeria
101
5.2 Other aspects of this electrification project
5.2.1 Next steps
We do not provide any suggestions for the electrification project as there is a series of largely uncertain factors. The project lifetime is expected to be 25 years: How the future of renewable energy generation might unfold during these years is unclear today, as is the consumption pattern of a small village in Sokoto. Tech-nological advancements are unpredictable and some of them are of considerable and irreversible impacts on the world, such as the normalization of smart phones and internet use. What is yet to come can be fundamentally unpredictable, as unforeseeable as the Black Swan events that have changed the course of human history.
In addition to the black box “future” we used a lot of assumptions in order to create the village, a process that entailed the extrapolation of data that was meant to statistically represent Nigeria as a country, to the village. We state that one of the weaknesses of creating a modeled village is the probability of it being sub-stantially different from reality. Adding more assumptions about the future, on top of the ones we had already taken, would be an unwise course of action and it might lead to incorrect information.
The future gets more complex when we factor in the future unfolding of climate change, a question that is still highly debated. Therefore, we suggest an assess-ment of the project’s and village’s status and technological advances every five years, in order to better inform investors, so that they can make decisions regard-ing the project.
5.2.2 Training system
Since the project involves regular system maintenance, we assume that locals have to be properly trained for this purpose. Training sessions would be provided by qualified members of NGO in cooperation with partner organizations not only in the classrooms but also in the field with hands-on experience. Locals have to get knowledge regarding general construction of PV module, battery charge and replacement and diesel maintenance. Additionally, the locals must learn how to deal with emergency and extraordinary situations.

Ayaribil, Bykova, Kazandzhiev, Setiawan
102
5.2.3 Prepaid system
Regarding the payment collection method, we chose prepaid system as the most appropriate solution to be installed in the remote village. The working principle is the households’ access to electricity is enabled upon receiving the payment for it. Once there is no credit on the account, electricity is not distributed to the household. This type of electricity payment was acknowledged as the most ef-fective one in Africa. Based on the statistics from Azuri technologies [n.d.], com-panies in Zimbabwe, South Africa, Kenya and South Sudan were able to increase its revenues and avoid additional costs by the use of prepaid system. Two scien-tists Jack and Smith [2016] state that prepaid system gives low income house-holds more flexibility in terms of paying their bills. Due to the fact that income in rural areas is oftentimes irregular, the household can pay only when they have money and, consequently, avoid fines for non-payment. The advantages of adopt-ing a prepaid system received another support from De Buck [2017], who enlists the following benefits:
x It assures control over the amount of consumed electricity
x There is no risk of under-charging or over-charging
x No need to move to put money into an account and
x SMS notification in regard to replenishment of balance
Instead of designing our own prepaid mechanism, we recommend IndiGo, an up-and-running prepaid system for the project. It is just one of many possible tech-nologies, offered in a prepaid systems market, which meets Lighting Global Min-imum Quality standards. IndiGo prepaid system consists of small box-shaped machine with numeric keypad and a few indicator lights. The system provides electricity after the user enters a validation code on the keyboard. This code can be obtained by sending scratch card number together with the serial number of IndiGo device to the central company office, via text message. The user will then receive a text message with validation code that the user must enter in IndiGo device. Above mentioned scratch cards can be bought either online or through Indigo representative office [AZUn.d.].
5.2.4 Financials
Analysis of firm-level data from the Nigeria World Bank Enterprise Survey shows that electricity supply is consistently the biggest constraint to doing busi-ness in Nigeria. [WOR2017b].
In a press release from April 2017, the World Bank stressed on the importance of the power sector for Nigeria’s development and for restoring macroeconomic resilience and growth. The bank also reiterated the sector’s characteristics of poor

Off-grid renewable electricity systems in Nigeria
103
service and lack of liquidity [WOR2017a]. Nigeria’s tariffs have historically been too low to cover the basic operating costs of producing the country’s electricity. Nigeria’s Presidential Task Force on Power, set up in 2001 to drive the imple-mentation of the power sector reforms noted that the revenues generated by very low electricity tariffs could not even cover the cost of producing and supplying power [INS2017].
A Marshall report by the Heinrich Böll Foundation and the Nigerian economic summit group [2017], states that off-grid solar PV systems are already cost com-petitive in Nigeria on a lifetime basis, costing an average of US$ 0.20/kWh as opposed to diesel generators US$ 0.30/kWh and gasoline over US$ 0.60/kWh. Hence, our project which seeks to provide reliable electricity by means of a hy-brid PV module and a diesel genset with lithium-ion batteries storage, for the unserved rural community in Sokoto state at a realistic price of € 0.35 would enhance rural Nigeria’s chances of achieving the goal by 2030. Although, the current on-grid tariff is set at € 0.11 [KAD2018], the supply of electricity is very unreliable, and a majority of the population remains unserved.
The exploration of financing opportunities available for off-grid projects in Ni-geria yielded promising results. The Nigerian Energy Support Programme (NESP) supports private sector with subsidies and regulatory approvals for the development of mini-grid and off-grid systems. The NESP is implementing pro-jects for the period 2016 - 2018 at various locations in the country with financial support from the European Union and Germany under the so called Rural Elec-trification Fund (REF) and it is going to be disbursed by the Nigerian Rural Elec-trification Agency (REA). So far, it is the only government-led structured fund-ing mechanism. The incentives are designated to be infrastructure based (incen-tives to reduce the installation costs) and not electricity-production based (incen-tives to reduce the consumption costs). The REF functions as a “challenge fund”, i.e. interested parties are expected to submit applications in consecutive rounds of competition, whereby projects will be selected according to a transparent set of criteria [GIZ2015].
The World Bank has for long been interested in the power sector in Nigeria and has supported the country both technically and financially in the ongoing reforms in the sector. The bank has supported other countries in the West-Africa sub region with off-grid solutions. Ghana for instance has benefitted under the World Bank-funded Ghana Energy Development and Access Project (GEDAP) where the option of mini-grids is being explored. A pilot mini-grid project is being de-veloped for four island communities situated in Lake Volta [WOR2016].
Also, USAID’s Development Credit Authority is providing $75 million in loan guarantees to fund the scaling up of off-grid energy investments in sub-Saharan

Ayaribil, Bykova, Kazandzhiev, Setiawan
104
Africa. Already, the millennium challenge corporation is providing $46 million for off-grid electrification in Benin. [SAL2015].
The United Nations Clean Development Mechanism (CDM), allows emission-reduction projects in developing countries to earn certified emission reduction (CER) credits, each equivalent to one ton of CO2. These CERs can be traded and sold and used by industrialized countries to a meet a part of their emission reduc-tion targets under the Kyoto Protocol [UNI2018]. Since our project is largely a renewable one, it qualifies to benefit from the CDM.
5.2.5 Exclusion of wind system
The HOMER Pro simulation results for the wind turbines generation system (see research question in the introduction of this contribution) were unforeseen and unexpected. Based on literature review, the wind speed in Sokoto region is much higher than in Southern part of the country and it therefore presents potentials for installation of wind power system. We had the confidence that although the wind system initial investment would be higher than the solar power system, it would yield lower COE and lower overall cost. However, with the use of NASA histor-ical wind speed data that HOMER Pro provided, the wind potential in Sokoto was far from sufficient for a micro wind power plant. Consequently, the assess-ment of wind systems ended at HOMER Pro simulations, as further analysis was impossible.

Off-grid renewable electricity systems in Nigeria
105
6 Limitations and shortcomings The creation of a modeled village in Sokoto, instead of using one particular real village, makes our research adaptable to many communities in Sokoto, or even in other communities in Nigerian states with similar profile. However, as we did not collect primary data and relied solely on imperfect and incomplete available data and our assumptions, our statistical village and its electricity load profile might differ from reality. Our tendency to overestimate the electricity needs might also derail further our model village from the actual electricity demand. For instance, we are certain that not all households own a refrigerator, an appli-ance whose electricity consumption is gargantuan in comparison with other ap-pliances. This probable inaccuracy could have led to inaccurate HOMER Pro system simulations, including the essential financial elements.
The use of HOMER Pro software and our decision to use the generic HOMER Pro components and their preset prices and costs might not reflect the actual mar-ket condition for those components. The use of other models found in the soft-ware’s catalogue was hindered by the availability of product prices on the inter-net. The prices may differ, depending on the supplier and the quantity of the pur-chase. Further, HOMER Pro does not provide detailed specifications of all the components, making it impossible for us to find comparable products in the mar-ket.
The missing information is mostly affecting environmental subcriterion, in par-ticular the EoL value of PV flat plate. HOMER Pro does not specify what kind of PV panels it uses exactly, a factor that determines its recyclability rate. Up to this day, there are monocrystalline, polycrystalline, thin-film amorphous, Cad-mium Telluride, biohybrid and a few other solar panels that are categorized into three generations [GRE2015]. These solar panels have completely different ma-terial composition and therefore, different recyclability rate.
The general electricity industry consists of generation, transmission and distribu-tion of the electricity. The use of HOMER Pro had another important shortcom-ing, as it does not cover transmission and distribution costs of power systems that it simulates, costs that are far from negligible. For a residential purpose, the trans-mission and distribution costs take up 13 % and 31 % respectively, while the remaining 57 % of total cost is engaged for the electricity generation [DAK2017]. It was unfortunately unattainable for us to calculate these costs separately as the systems that HOMER Pro designed were very specific, with a set of parameters (see Section 3.2). Had we used a stand-alone transmission and distribution cost formula, it would not have taken into account everything that had been consid-ered in the HOMER simulations, hence the irrelevance of the result.

Ayaribil, Bykova, Kazandzhiev, Setiawan
106
The last shortcoming that arises, comes from the nature of AHP as our multicrite-ria decision analysis technique. The technique involves making multiple pairwise comparisons that eventually result in weights of each subcriterion, a process that is subjective, even when researchers strive to reach objectivity. Furthermore, the 9-point scale system makes the process more time-consuming and complicated, as occasionally it is hard to distinguish between a 7 points and an 8 points score clearly, even with the scale definition [KASn.d.].

Off-grid renewable electricity systems in Nigeria
107
7 Conclusion This contribution posed a question that required the exploration of different re-newable electricity generation systems and their prospects to provide the BOP population access to electricity in Sokoto, Nigeria. In the process, an evaluation of Sokoto renewable energy potentials and modeling of a typical village of 200 households was performed. With the use of HOMER Pro software, this work provides a detailed analysis of seven off-grid technologies as potential solutions for the modeled village electrification, e.g. diesel generator energy system; solar PV module with Lead Acid battery storage (PV/LAB); solar PV module with Lithium-ion battery storage (PV/Li-ion); hybrid Solar PV module-Diesel gener-ator with Lead acid battery storage (PV-Diesel/LAB); hybrid Solar PV module-Diesel generator with Lithium-ion battery storage (PV-Diesel/Li-ion); wind tur-bine with Lead Acid battery storage (Wind/LAB) and wind turbine with Lithium-ion battery storage (Wind/Li-ion).
The HOMER Pro simulation results indicated the non-feasibility of the two wind systems, given the unsufficient wind speed in Sokoto, thereby they were excluded from further research. In order to make a comprehensive assessment of the re-maining five systems, a Multicriteria Decision Analysis, specifically Analytical Hierarchy Process method was conducted for this purpose. Three main criteria i.e. economic, social and environmental and a total of 10 composite subcriteria enabled the objective evaluation of each of the 5 remaining systems.
As a result, the research revealed that hybrid Solar PV module-Diesel generator with Lithium-ion battery storage (PV-Diesel/Li-ion) was the most appropriate energy system for remote village electrification. Although it does not have the highest performance in social and environmental criteria, it showcases the best performance in economic aspect, a criterion that holds the decisive weight.
Although our research contributes to the rural development through village elec-trification in Sokoto, Nigeria, it has its shortcomings due to the methods and sec-ondary data used. Therefore, we encourage further researches to collect primary field data, experiment with other methods and software or even explore the po-tentials of other off-grid renewable power solutions.


Off-grid renewable electricity systems in Nigeria
109
List of References
[ACO2017] ACOB LIGHTING TECHNOLOGY LIMITED. Kaduna State 16kW Solar Mini Grid Electrification Project. Re-trieved February 12, 2018, from http://acoblight-ing.com/2017/07/19/kaduna-state-16kw-solar-mini-grid-elec-trification-project/
[ADE2017] ADEDEJI, A. O.: Privatization and Performance of Electric-ity Distribution Companies in Nigeria. Journal of Public Ad-ministration and Governance, 7(3), p. 190–203. Retrieved November 17, 2017, from http://www.macrothink.org/jour-nal/index.php/jpag/article/view/11168/pdf
[ADE2013] ADEYEMO, H.: Challenges facing solar energy projects in Nigeria: a case study of Lagos state. Bachelor’s Thesis, HAMK University of Applied Sciences, Hämeenlinna, Fin-land. Retrieved November 18, 2017, from http://www.the-seus.fi/bitstream/handle/10024/60453/Ha-keemAdeyemo+Case+studying+Lagos+state+Nigeria.pdf?se-quence=1
[AGB2001] AGBESE, P. O.: Managing Ethnic Relations in a Heteroge-neous Society: The case of Nigeria. In: J. M. Mbaku., P. O. Agbese & M. S. Kimenyi (Eds.), Revival: Ethnicity and Gov-ernance in the Third World (pp. 196-249). New York, NY, US: Routledge.
[AGB2011] AGBIBOA, D.E.: Between Corruption and Development: The Political Economy of State Robbery in Nigeria. Journal of Business Ethics, 108(3), 325-345. doi: 10.1007/s10551-011-1093-5
[AGB2014] AGBIBOA, D.E.: Peace at Daggers Drawn? Boko Haram and the State of Emergency in Nigeria. Studies in Conflict & Terrorism, 37(1), p. 41-67. https://doi.org/10.1080/1057610X.2014.853602
[AHL2015] AHLBORG, H.; BORAENG, F.; JAGERS, S. C.; SOEDER-HORM, P.: Provision of electricity to African households: The importance of democracy and institutional quality. Energy Policy, 87, p. 125-135. https://doi.org/10.1016/j.en-pol.2015.09.002

Ayaribil, Bykova, Kazandzhiev, Setiawan
110
[AHL2014] AHLBORG, H.; HAMMAR, L.: Drivers and barriers to ru-ral electrification in Tanzania and Mozambique – Grid-ex-tension, off-grid, and renewable energy technologies. Renew-able Energy, 61(C), p. 117-124. https://doi.org/10.1016/j.renene.2012.09.057
[AKI2013] AKINWALE, Y.; JESULEYE, O.; SIYANBOLA, W.: Em-pirical Analysis of the Causal Relationship Between Electric-ity Consumption and Economic Growth in Nigeria. British Journal of Economics, Management & Trade, 3(3), p. 277–295. doi:10.9734/BJEMT/2013/4423
[AKU2017] AKURU, U. B.; ONUKWUBE, I. E.; OKORO, O. I.; OBE, E. S.: Towards 100 % renewable energy in Nigeria. Renewa-ble and Sustainable Energy Reviews, 71, p. 943–953. https://doi.org/10.1016/j.rser.2016.12.123
[ALB2011] AL-BADI, A. H.; BOURDOUCEN, H.: Study and design of hybrid diesel-wind standalone system for remote area in Oman. International Journal of Sustainable Energy, 31(2), p. 85-94. https://doi.org/10.1080/1478646X.2011.554608
[ALB2012] ALBRIGHT, G.; EDIE, J.; AL-HALLAJ, S.: A comparison of lead acid to lithium-ion in stationary storage applications ", White Paper AllCell Technologies LLC, Chicago. Re-trieved January 16, 2018 from www.altener-gymag.com/emagazine/2012/04/a-comparison-of-lead-acid-to-lithium-ion-in-stationary-storage-applications/1884
[ALI2008] ALI, B.; KAMARUZZAMAN, S.; YEN, C. H.; MAT, S.; ZAHARI, A.: Key Success Factors, In: Implementing Re-newable Energy Programme in Malaysia. WSEAS TRANS-ACTIONS on ENVIRONMENT and DEVELOPMENT, 12(4). Retrieved January 12, 2018, from http://citese-erx.ist.psu.edu/viewdoc/down-load?doi=10.1.1.500.2601&rep=rep1&type=pdf
[AUW2017] AUWAL, A.: Sokoto to complete building of 189 mosques at N566m. Retrieved December 1, 2017, from https://www.dai-lytrust.com.ng/news/general/sokoto-to-complete-building-of-189-mosques-at-n566m/200058.html

Off-grid renewable electricity systems in Nigeria
111
[AZUn.d.] AZURI TECHNOLOGIES. Pay-as-you-go solar power for homes. Retrieved February 16, 2018, from https://www.ashden.org/winners/azuri-technologies
[BEN2017] BENTON, K.; YANG, X.; WANG, Z.: Life cycle energy as-sessment of a standby diesel generator set. Journal of Cleaner Production, 149, p. 265-274. Doi:10.1016/j.jclepro.2017.02.082
[BRI2017] BRITANNICA. Niger dams project. Retrieved October 27, 2017, from https://www.britannica.com/topic/Niger-Dams-Project
[CEY2017] CEYLON ELECTRICITY BOARD. SRI: Wind Power Gen-eration Project Main Report. Retrieved October 30, 2017, from https://www.adb.org/sites/default/files/project-docu-ments/49345/49345-002-eia-en.pdf
[CHI2011] CHIKAIRE, J.; NNADI, F. N.; ANYOHA, N. O.: Access to Sustainable Energy: A Panacea to Rural Household Poverty in Nigeria. Continental Journal Renewable Energy 2(1), p. 7-18. Retrieved January 9, 2017, from https://www.re-searchgate.net/publication/215900945_ACCESS_TO_SUS-TAINABLE _ENERGY_A_PANACEA_TO_RU-RAL_HOUSEHOLD_POVERTY_IN_NIGERIA
[CIA2017] CENTRAL INTELLIGENCE AGENCY. The World Factbook: Country Comparison: Distribution of Family In-come - Gini Index. Retrieved December 11, 2017, from https://www.cia.gov/library/publications/the-world-factbook/rankorder/2172rank.html
[CON2007] CONFEDERATION OF DANISH INDUSTRIES. Working with the bottom of the pyramid. Success in low-income mar-kets. Retrieved February 13, 2018, from http://di.dk/sitecol-lectionDocuments/shop/workingwiththe.pdf
[COR2017] CORCELLI, F.; RIPA, M.; ULGIATI S.: End-of-life treat-ment of crystalline silicon photovoltaic panels. An energy-based case study. Journal of cleaner production, (161), p. 1129-1142

Ayaribil, Bykova, Kazandzhiev, Setiawan
112
[DAD2014] DADA, J., O.: Towards understanding the benefits and chal-lenges of Smart/Micro-Grid for electricity supply system in Nigeria. Renewable and Sustainable Energy Reviews, (38), p. 1003-1014. doi: 10.1016/j.rser.2014.07.077
[DAH2011] DAHANU SOLAR POWER PRIVATE LIMITED. Environ-ment and Social Impact Assessment Study Report For Da-hanu 40 MW Photovoltaic (PV) Solar Power Project: At Dhursar Village, Pokharan Tehsil, Jaisalmer District, Raja-sthan. Retrieved February 10, 2018, from https://www.adb.org/sites/default/files/project-docu-ment/60698/45915-01-ind-esia.pdf
[DAK2017] DAKOTA ELECTRIC. How the Generation, Transmission and Distribution System Works. Retrieved January 9, 2018, from https://www.dakotaelectric.com/wp-content/up-loads/2017/02/EnvDisclosure.pdf
[DEB2017] DE BUCK, X.: Prepaid Meters. In: South Africa: How Do They Work? Retrieved February 16, 2018, from http://luxury-homesjohannesburg.com/real-estate-blog/prepaid-meters-in-south-africa-how-do-they-work/
[DIEn.d.] DIESEL SERVICE AND SUPPLY SHOP. Retrieved 15 Jan-uary, 2018 from http://www.dieselserviceandsup-ply.com/Shop_Profile.aspx
[DOE2011] DOE. Department of Energy US. Environmental Assessment Photovoltaic Solar Project at the Durango, Colorado, Dis-posal Site. Washington, D.C. Retrieved January 20, 2018, from https://www.lm.doe.gov/Du-rango/S06350_DUD_EA.pdf
[DOR2005] DORSEY, P.: Top 10 Reasons Why Systems Projects Fail. Retrieved November 29, 2017, from http://www.hks.har-vard.edu/m-rcbg/ethiopia//Publications/ Top% 2010 % 20Reasons%20Why%20Systems%20Projects%20Failil.pdf
[EBE2013] EBEGBULEM, J. C.; EKPE, D.; ADEJUMO, T. O.: Oil Ex-ploration and Poverty in the Niger Delta Region of Nigeria: A Critical Analysis. International Journal of Business and So-cial Science, 4(3), p. 279-287. Retrieved November 19, 2017,
http://luxuryhomesjohannesburg.com/real-estate-blog/prepaid-meters-in-south-africa-how-do-they-work/
http://luxuryhomesjohannesburg.com/real-estate-blog/prepaid-meters-in-south-africa-how-do-they-work/

Off-grid renewable electricity systems in Nigeria
113
from http://www.ijbssnet.com/jour-nals/Vol_4_No_3_March_2013/30.pdf
[EFU2013] EFURUMIBE, E. L.: Barriers to the development of renewa-ble energy in Nigeria. Scholarly Journal of Biotechnology, 2(1), p. 11-13. Retrieved December 14, 2017, from http://www.scholarly-journals.com/sjb/ar-chive/2013/jan/pdf/Efurumibe.pdf
[EIA2017] EIA, Energy Information Administration of the United States. Retrieved November 14, 2017, from https://www.eia.gov/en-ergyexplained/?page=biomass_home
[EIU2016] EIU. Economist Intelligence Unit. Democracy Index 2016. Retrieved November 19, 2017, from https://www.eiu.com/topic/democracy-index
[ELU2014] ELUSAKIN, J. E.; AJIDE, O. O.; DIJI, J. C.: Challenges of sustaining off-grid power generation in Nigeria rural com-munities. African Journal of Engineering Research, 2(2), p. 51-57. Retrieved November 26, 2017, from http://www.net-journals.org/pdf/AJER/2014/3/14-020.pdf
[EMO2016] EMODI, N. V.; EBELE, E. N.: Policies Enhancing Renewa-ble Energy Development and Implications for Nigeria. Sustainable Energy, 4(1), p. 7-16. Doi: 10.12691/rse-4-1-2
[ENE2012] ENERGY COMMISSION OF NIGERIA & UNITED NA-TIONS DEVELOPMENT PROGRAMME. Renewable En-ergy Master Plan (REMP). Retrieved December 19, 2017, from http://www.energy.gov.ng/index.php?op-tion=com_docman&task=cat_view&gid=39& Itemid=49
[EPA2016] EPA, Environmental Protection Agency of the United States. Overview of greenhouse gases. Retrieved January 8, 2018 from https://www.epa.gov/ghgemissions/overview-green-house-gases
[EUR2017] EUROPEAN UNION. Environmental: Environmental As-sessment. Retrieved January 20, 2018, from http://ec.eu-ropa.eu/environment/eia/index_en.htm

Ayaribil, Bykova, Kazandzhiev, Setiawan
114
[FAN2017] FANTINI, A.-M.; QUINN, M.: OPEC Annual Statistics Bul-letin. Retrieved January 8, 2018, from http://www.opec.org/opec_web/statiic_filesproject/me-dia/downloads/ publications/ ASB2017_13062017.pdf
[FAO2016] FAO. Nigeria Food security and Vulnerability Survey 2016. Retrieved February 5, 2018, from http://fscluster.org/sites/de-fault/files/documents/food_security_livelihoods _and_vulner-ability_assessment-final_draft_report_of_2016 _fsvs_fao nbs_ dec_1 .pdf
[FEDn.d.] FEDERAL REPUBLIC OF NIGERIA. Sokoto State. Re-trieved November 6, 2017, from http://www.nige-ria.gov.ng/index.php/2016-04-06-08-39-54/north-west/so-koto-state
[FLO2009] FLORINI, A.; SOVACOOL, B. K.: Who governs energy? The challenges facing global energy governance. Energy Po-licy, 37(12), 5239-5248. http://dx.doi.org/10.1016/j.en-pol.2009.07.039
[FOR2017] FORTUNE OF AFRICA. Investment climate of Nigeria. Re-trieved October 30, 2017, from http://fortuneofafrica.com/ni-geria/investment-climate-of-nigeria/
[GAR2002] GARBA, B.; BASHIR, A. M.: Managing Energy Resources in Nigeria: Studies on Energy Consumption Pattern in Se-lected Rural Areas in Sokoto State. Nigerian Journal of Rene-wable Energy, 10(1&2), p. 97-107.
[GEE2002] GEELS, F.: Technological transitions as evolutionary recon-figuration processes: a multi-level perspective and a case-study. Research Policy, 31, p. 1257-1274. https://doi.org/10.1016/S0048-7333(02)00062-8
[GEE2005] GEELS, F.: The dynamics of transitions in socio-technical systems: A multi-level analysis of the transition pathway from horse-drawn carriages to automobiles (1860–1930). Techno-logy Analysis & Strategic Management, 17(4), p. 445-476. doi:10.1080/09537320500357319

Off-grid renewable electricity systems in Nigeria
115
[GEO2012] GEORGI-MASCHLER, T.; FRIEDRICH, B.; REINER, W.; HEEGN, H.; RUTZ, M.: Development of a Recycling Pro-cess for Li-Ion Batteries. Journal of Power Sources, 207, p. 173–182. Doi: 10.1016/j.jpowsour.2012.01.152
[GHA2004] GHALI, K.H. & EL-SAKKA: Energy Consumption and Out-put Growth in Canada: A Multivariate Co-Integration Analy-sis. Energy Economics, 26, p. 225-238. https://doi.org/10.1016/S0140-9883(03)00056-2
[GIZ2015] GIZ - Deutsche Gesellschaft für Internationale Zusammenar-beit. An Overview with a Special Emphasis on Renewable Energy, Efficiency and Rural Electrification 2nd Edition, June 2015. Retrieved November 17, 2017, from https://www.giz.de/en/downloads/giz2015-en-nigerian-en-ergy-sector.pdf
[GRE2015] GREENMATCH. 7 Different Types of Solar Panels Ex-plained. Retrieved December 18, 2017, from https://www.greenmatch.co.uk/blog/2015/09/types-of-solar-panels
[HAM2010] HAMILTON, K.: Scaling up Renewable Energy in Develop-ing Countries: Finance and Investment Perspectives. Pro-gramme Paper. Retrieved November 16, 2017, from https://www.chathamhouse.org/sites/files/chathamhouse/pub-lic/Research/Energy%2C%20Environment%20and%20De-velopment/0410pp_hamilton.pdf
[HAM2007] HAMMOND, A.; KRAMER, W. J.; TRA, J. N.; KATZ, R.; WALKER, C.: The next 4 billion, market size and business strategy at the base of the pyramid. World Resources Insti-tute. Retrieved 14 February, 2018, http://www.wri.org/publi-cation/next-4-billion
[HAS2010] HASSAN, M.; MAJUMBER-RUSSEL, D.: Legislation in the UK Energy Industry. Retrieved November 15, 2017, from https://uk.practicallaw.thomsonreuters.com/1-523-9996?tran-sitionType=Default&contextData=(sc.Default)
[HEA2017] HEALTH POLICY PLUS (HP+). Nigeria population and de-velopment, Sokoto state. Retrieved November 6, 2017, from

Ayaribil, Bykova, Kazandzhiev, Setiawan
116
http://www.healthpolicyplus.com/ns/pubs/7149-7285_Soko-toRAPIDFactSheet.pdf
[HUS2013] HUSSAIN, M.Z.: Financing renewable energy options for developing financing instruments using public funds. Work-ing paper. Retrieved November 16, 2017 from http://docu-ments.worldbank.org/curated/en/196071468331818432/Fi-nancing-renewable-energy-options-for-developing-financing-instruments-using-public-funds
[IBH2008] IBHAWOH, B.: Nigeria. In G. H. Herb & D. H. Kaplan (Eds.). Nations and Nationalism. A Global Historical Over-view p. 1177-1189. Santa Barbara, CA, US: ABC-CLIO. Ide-nyi, O. S.
[IDE2017] IDENYI, FAVOUR, E.-O.; JOHNSON, O. N.; THOMAS, O. O.: Understanding the Relationship between Unemployment and Inflation in Nigeria. Advances in Researches, 9(2), p. 1-12. doi: 10.9734/AIR/2017/32218
[IKE2017] IKEJEMBA, C. X. E.; MPUAN, B. P.; SCHUUR, C. P.; HILLEGERSBERG, V. J.: The empirical reality & sustaina-ble management failures of renewable energy projects in Sub-Saharan Africa. Renewable Energy, 102(A), p. 234-240. https://doi.org/10.1016/j.renene.2016.10.037
[IMF2015] IMF. Nigeria: Selected Issue Paper (IMF Country Report No. 15/85). Washington, D.C. Retrieved November 21, 2017, from http://www.elibrary.imf.org/doc/IMF002/22455-9781484307151/22455-9781484307151/Other_for-mats/Source_PDF/22455-9781484308387.pdf
[IMF2017] IMF. GDP per capita, current prices. Retrieved November 21, 2017, from http://www.imf.org/exter-nal/datamapper/NGDPDPC@WEO/OEMDC/ADVEC/WE-OWORLD/NGA
[IND2017] INDEPENDENT ENERGY WATCH INITIATIVE. Re-trieved January 15, 2018, from http://iwin.org.ng/in-dex.php/news/item/7995-over-n500m-lost-to-electricity-van-dalism-police

Off-grid renewable electricity systems in Nigeria
117
[ING2015] INGOLE, A. S.; RAKHONDE, B. S.: Hybrid Power Genera-tion System Using Wind Energy and Solar Energy. Interna-tional Journal of Scientific and Research Publications, 5(3), p. 1-4. Retrieved November 26, 2017, from http://www.ijsrp.org/research-paper-0315.php?rp=P393854
[INS2017] INSTANT ENERGY. Are Electricity Tariffs in Nigeria Re-ally the Lowest in Africa? Retrieved February 18, 2018, from https://instantenergy.com.ng/are-electricity-tariffs-in-nigeria-really-the-lowest-in-africa/
[INT1999] INTERNATIONAL CENTRE FOR NIGERIAN LAW. Con-stitution of the Federal Republic of Nigeria 1999. Retrieved November 19, 2017 http://www.nigeria-law.org/Constituti-onOfTheFederalRepublicOfNigeria.htm
[IRE2017] IRENA - the International Renewable Energy Agency. Re-newable Energy Statistics 2017. Retrieved January 16, 2018, from http://www.irena.org/Document Downloads/ Publica-tions/IRENA_Renewable_Energy_Statistics_2017.pdf
[ISM2012] ISMAIL, O.S.; AJIDE, O.O.; AKINGBESOTE F.: Perfor-mance assessment of installed solar PV system: a case study of Oke-Agunla in Nigeria. Engineering, 4(8), p. 453-458. doi:10.4236/eng.2012.48059
[ISO2006]. ISO, International Standardization Organization. Environ-mental management - Life cycle assessment - Principles and framework. (14040). Retrieved December 13, 2017, from https://www.iso.org/obp/ui/#iso:std:iso:14040:ed-2:v1:en
[JAC2016] JACK, K.; SMITH, G.: Charging Ahead: Prepaid Electricity Metering in South Africa. NBER Working Paper. Retrieved February 16, 2018, from https://www.povertyac-tionlab.org/evaluation/impact-prepaid-electricity-meters-low-income-households-south-africa
[JAC2000] JACOBSSON, S.; JOHNSON, A.: The diffusion of renewable energy technology: an analytical framework and key issues for research. Energy Policy, 28, p. 625-640. https://doi.org/10.1016/S0301-4215(00)00041-0

Ayaribil, Bykova, Kazandzhiev, Setiawan
118
[JOF2017] JOFOS INDUSTRIES LIMITED. Solar Power Engineering. Retrieved January 21, 2018, from http://jofosindus-tries.com/solar.html
[KAD2018] KADUNA DISTRIBUTION COMPANY. Residential Elec-tricity Tariff. Retrieved February 21, 2018, from https://kadu-naelectric.com/about-us-2/
[KASn.d.] KASPERCZYK, N.; KNICKEL, K.: Analytic hierarchy pro-cess (AHP). Retrieved January 9, 2018, from http://www.ivm.vu.nl/en/Images/MCA3_tcm234-161529.pdf
[KAZ2017] KAZEEM, Y.: Some of the world’s biggest countries have managed to reduce extreme poverty - except Nigeria. Re-trieved January 23, 2018, from https://qz.com/963465/some-of-the-worlds-biggest-countries-have-managed-to-wrangle-extreme-poverty-except-nigeria/
[KHA2015] KHAN, A.; HAMIDU, I.: Boko Haram and Turmoil in Northern Nigeria. Jadavpur Journal of International Relati-ons, 19(1), p. 22-42. doi: 10.1177/0973598415599884
[KRI2013] KRIEGER, E. M.; CANNARELLA, J.; ARNOLD, C. B.: A comparison of lead-acid and lithium-based battery behavior and capacity fade in off-grid renewable charging applica-tions. Energy, 60, p. 492-500. https://doi.org/10.1016/j.energy.2013.08.029
[LAM2005] LAMBERT T.; GILMAN, P.; LILIENTHAL, P.: Microp-ower system modeling with HOMER. In: Farret, F. A., & Simões, M. G. (Eds.), Integration of Alternative Sources of Energy. Indianapolis, US: John Wiley & Sons.
[LEG2016] LEGATUM INSTITUTE. The Africa Prosperity Report 2016. Retrieved November 27, 2017, from https://lif.blob.core.windows.net/lif/docs/default-source/pub-lications/2016-africa-prosperity-report-pdf.pdf?sfvrsn=2
[LITn.d.-a] LITHIUM ION BATTERY TEST CENTRE. Lead Acid. Re-trieved January 24, 2018, from https://batterytestcen-tre.com.au/project/lead-acid/

Off-grid renewable electricity systems in Nigeria
119
[LITn.d.-b] LITHIUM ION BATTERY TEST CENTRE. Lithium ion. Retrieved January 24, 2018, from https://batterytestcen-tre.com.au/project/lithium-ion/
[LUB2007] LUBECK, P. M.; WATTS, J. M.; LIPSCHUTZ, R.: Conver-gent Interests: U.S. Energy Security and the “Securing” of Nigerian Democracy. Washington, DC, US: Center for Inter-national Policy
[MAL2014] MALEKI, A.; ASKARZADEH, A.: Optimal sizing of a PV/wind/diesel system with battery storage for electrification to an off-grid remote region: A case study of Rafsanjan, Iran. Sustainable Energy Technologies and Assessments, 7, p. 147-153. https://doi.org/10.1016/j.seta.2014.04.005
[MAN2016] MANDELLI, S.; BARBIERI, J.; MEREU, R.; COLOMBO, E.: Off-grid systems for rural electrification in developing countries: Definitions, classification and a comprehensive lit-erature review. Renewable and Sustainable Energy Reviews, 58, p. 1621–1646. https://doi.org/10.1016/j.rser.2015.12.338
[MAN2011] MANZUR, A.: Does increasing energy or electricity con-sumption improve quality of life in industrial nations? Energy Policy, 39(5), p. 2568 -2572. https://doi.org/10.1016/j.en-pol.2011.02.024
[MAR2017] MARSHALL PLAN FOR NIGERIA STIMULATING RAPID ECONOMIC GROWTH. Retrieved January 18, 2018 from https://ng.boell.org/2017/06/15/marshall-plan-nigeria-nesg-report
[MIT2017] MIT. Media Lab. The Observatory of Economic Complexity - Nigeria. Retrieved November 27, 2017, from https://atlas.me-dia.mit.edu/en/profile/country/nga/
[MOB2014] MOBBS, P. M.: The Mineral Industry of Nigeria. US Geo-logical survey minerals yearbook - 2012, p. 341-346. Re-trieved February 10, 2018, from https://miner-als.usgs.gov/minerals/pubs/country/2012/myb3-2012-ni.pdf
[MOS2015] MOSES, F.; NG'ENY, K. B.: Environmental Impact Assess-ment Study Report For the Proposed Malindi Solar Power Plant (40MW) Project in Weru Group Ranch No.19 in Lango

Ayaribil, Bykova, Kazandzhiev, Setiawan
120
Baya Location, Malindi District in Kilifi County. Nairobi, Kenya. Retrieved February 2, 2018, from https://www.nema.go.ke/images/Docs/EIA-1240-1249/EIA-1244_%20Malindi%20solar%20power%20study%20re-port.pdf
[MUH2012] Muhammad, U.: Rural Solar Electrification in Nigeria: Re-newable Energy Potentials And Distribution For Rural De-velopment. Gusau, Nigeria: Centre for Energy and Environ-ment. Retrieved December 16, 2017, from https://ases.confer-ence-services.net/resources/252/2859/pdf/SO-LAR2012_0232_full%20paper.pdf
[NAM2014] NAMAVIRA, V.: Implementing renewable energy - secrets of success. Retrieved December 2, 2017, from https://blogs.dnvgl.com/energy/implementing-renewable-en-ergy-secrets-of-success
[NAT2017a] NATIONAL BUREAU OF STATISTICS. Nigerian Gross Domestic Product Report (Expenditure and income ap-proach) - Q3, Q4 2016. Abuja, Nigeria
[NAT2017b] NATIONAL BUREAU OF STATISTICS. Unemployment / Under-Employment Report (Q4 2016). Abuja, Nigeria.
[NAT2004] NATIONAL RENEWABLE ENERGY LABORATORY. In-novation for our Energy Future. Retrieved 7 January, 2018, from https://www.nrel.gov/docs/fy04osti/35406.pdf
[NBS2016] NBS, National Bureau of Statistics. Social Statistics Report 2016. Abuja, Nigeria.
[NIG2016] NIGERIA DATA PORTAL. Nigeria population by age and sex. Retrieved February 2, 2018 from http://nigeria.opendata-forafrica.org/htmbyze/nigeria-population-by-age-and-sex
[NER2017] NERC, Nigerian Electricity Regulatory Commission. His-tory. Retrieved November 20, 2017, from http://www.nercng.org/index.php/home/nesi/401-history
[NNA2015] NNABUGWU, F.: 60 % of projects fail in Nigeria - UNIDO. Retrieved December 1, 2017, from https://www.vanguard-ngr.com/2015/08/60-of-projects-fail-in-nigeria-unido/

Off-grid renewable electricity systems in Nigeria
121
[NRE2015] NREEEP. National Renewable Energy and Energy Efficiency Policy. Ministry of Power. Federal Republic of Nigeria. Re-trieved November 20, 2017, from http://www.power.gov.ng/download/NREEE%20POL-ICY%202015-%20FEC%20APPROVED%20COPY.pdf
[OGU2013] OGUNDIPE, A. A.; APATA, A.: Electricity Consumption and Economic Growth in Nigeria. Journal of Business Man-agement and Applied Economics, 2(4), p. 1-14. Retrieved November 19, 2017, from covenantuniversity.edu.ng/con-tent/download/19617/126416/file/Electricity%2Bconsump-tion.pdf
[OGU2015] OGUNMOLA, E.: Why do projects fail? The Nigerian gov-ernment insensitivity to project failure. PM World Journal, 4(4), p. 1-4. Retrieved December 2, 2017, from http://pmworldjournal.net/wp-content/up-loads/2015/04/pmwj33-Apr2015-Ogunmola-why-projects-fail-nigeria-Commentary.pdf
[OHU2011] OHUNAKIN, O. S.; OJOLO, S. J.; AJAYI, O. O.: Small hy-dropower (SHP) development in Nigeria: An assessment. Re-newable and Sustainable Energy Reviews, 15(4), 2006–2013. https://doi.org/10.1016/j.rser.2011.01.003
[OLU2015] OLUWATOYIN, K. K.; ODUNOLA, A. M.; ALABO A. O.: Ways of Achieving Stable and Uninterrupted Power Supply of Electricity in Nigeria. British Journal of Applied Science & Technology, 10(5), p. 1-15. Retrieved January 10, 2018, http://www.journalrepository.org/media/jour-nals/BJAST_5/2015/Jul/Odunola1052015BJAST17043.pdf
[OMI2011] OMISORE, B.: Nigeria’s Solar Projects yield both failure and success. The National Geographic. Retrieved November 29, 2017, from https://news.nationalgeographic.com/news/en-ergy/2011/11/111102-solar-power-in-nigeria/
[OPE2016] OPEC. Nigeria facts and figures. Retrieved October 27, 2017, from http://www.opec.org/opec_web/en/about_us/167.htm
[OYE2017] OYEWO, A.; AGHAHOSSEINI, A.; BREYER, C.: Assess-ment of energy storage technologies in transition to a 100 %

Ayaribil, Bykova, Kazandzhiev, Setiawan
122
renewable energy system for Nigeria. Paper presented at 11th IRES Conference, Düsseldorf, Germany.
[PET2013] PETERSCHMIDT, N.; NEUMANN, C.: Scaling up Success-ful Micro-Utilities for Rural Electrification. Oestrich-Winkel. Sustainable Business Institute. Retrieved January 10, 2018, from http://www.inensus.de/download/2013-SBI-INENSUS-Studie.pdf
[PEW2017] PEW RESEARCH CENTER. The Changing Global Reli-gious Landscape. Washington, DC, US. Retrieved February 5, 2018, from http://assets.pewresearch.org/wp-content/up-loads/sites/11/2017/04/07092755/FULL-REPORT-WITH-APPENDIXES-A-AND-B-APRIL-3.pdf
[PIE2016] PIERCE, S.: Moral Economies of Corruption, London, UK: Duke University Press.
[PNU1997] PNUELI, Y.; ZUSSMAN, E.: Evaluating the end-of-life value of a product and improving it by redesign. Interna-tional Journal of Production Research, 35, p. 921–942. https://doi.org/10.1080/002075497195452
[POH2003] POHEKAR, S. D.; RAMACHANDRAN, M.: Application of multi-criteria decision making to sustainable energy planning - A review. Renewable and Sustainable Energy Reviews 8(4), p. 365–381. https://doi.org/10.1016/j.rser.2003.12.007
[PRA2002] PRAHALAD, C. K.; HART. S. L.: The Fortune at the Bot-tom of the Pyramid. Strategy+business Magazine, 26, p. 1-14. Retrieved February 17, 2018, from https://peo-ple.eecs.berkeley.edu/~brewer/ict4b/Fortune-BoP.pdf
[PWC2016] ELECTRICITY BEYOND THE GRID. Accelerating access to sustainable power for all. Retrieved January 21, 2018, from https://www.pwc.com/gx/en/energy-utilities-min-ing/pdf/electricity-beyond-grid.pdf
[REH2012] REHMAN, S.; ALAM, M. M.; MEYER, J., P.; AL-HA-DHRAMI, L. M.: Feasibility study of a wind-pv-diesel hybrid power system for a village. Renewable Energy, 38, p. 258-268. https://doi.org/10.1016/j.renene.2011.06.028

Off-grid renewable electricity systems in Nigeria
123
[RENn.d.-a] RENEWABLE ENERGY PROGRAMME. Investment Incen-tives. Retrieved December 17, 2017, from http://renewableen-ergy.gov.ng/invest/investment-incentives/
[RENn.d.-b] RENEWABLE ENERGY. In Oxford Dictionary of English. Retrieved November 20, 2017, from https://en.oxforddiction-aries.com/definition/renewable_energy
[REU2017] REUTERS. UPDATE 1-Nigerian annual inflation slows for ninth month, to 15.91 pct. Retrieved December 6, 2017, from http://www.reuters.com/article/nigeria-inflation/update-1-ni-gerian-annual-inflation-slows-for-ninth-month-to-15-91-pct-idUSL8N1NL21E
[RID2011] RIDDELL, W. C.; SONG, X.: The Impact of Education on Unemployment Incidence and Re-employment Success: Evi-dence from the U.S. Labour Market. IZA Discussion Paper Series. (5572). Retrieved January 7, 2018, from http://ftp.iza.org/dp5572.pdf
[ROB2017] ROBERTSON, C.: Africa’s Economies Ranked By GDP, Which Is Really The Largest? Retrieved November 10, 2017, from https://www.cnbcafrica.com/videos/east-africa-vid-eos/2017/10/21/africas-economies-ranked-gdp-really-largest/
[ROH2014] ROHIT, S.; SUBHES, C. B.: Off-grid electricity generation with renewable energy technologies in India: An application of HOMER. Renewable Energy, 62, p. 388-398. https://doi.org/10.1016/j.renene.2013.07.028
[SAA2008a] SAATY, T.: Relative Measurement and Its Generalization in Decision Making Why Pairwise Comparisons are Central in Mathematics for the Measurement of Intangible Factors The Analytic Hierarchy/Network Process. RACSAM, 102(2), p. 251–318. Retrieved December 3, 2017, from https://link.springer.com/article/10.1007/BF03191825
[SAA2008b] SAATY, T. L.: Decision making with the analysis process. International Journal of Services Sciences, 1(1), p. 83–98. https://doi.org/10.1504/IJSSci.2008.01759
[SAL2015] SALDINGER, A. (2015). Off-grid solar power is gathering steam in Africa, what's next? Retrieved February 19, 2018,

Ayaribil, Bykova, Kazandzhiev, Setiawan
124
from https://www.devex.com/news/off-grid-solar-power-is-gathering-steam-in-africa-what-s-next-87149
[SELn.d.] Solar Electric Light Fund. (n.d.). Nigeria: History. Retrieved October 24, 2017, from https://self.org/archive-nigeria/
[SHA2014] Shaaban, M., & Petinrin, J. O. (2014). Renewable energy po-tentials in Nigeria: Meeting rural energy needs. Renewable and Sustainable Energy Reviews, 29, 72–84. http://dx.doi.org/10.1016/j.rser.2013.08.078
[SHA2009] SHAAHID, S.M.; EL-AMIN, I.: Techno-economic evalua-tion of off-grid hybrid photovoltaic–diesel–battery power sys-tems for rural electrification in Saudi Arabia—Away forward for sustainable development. Renewable and Sustainable En-ergy Reviews 13(3) p. 625-633. https://doi.org/10.1016/j.rser.2007.11.017
[SHA2008] SHAAHID, S. M.; ELHADIDY, M. A.: Economic analysis of hybrid photovoltaic-diesel-battery power systems for resi-dential loads in hot regions – a step to clean future. Renewa-ble and Sustainable Energy Reviews, 12(2), p. 488-503. https://doi.org/10.1016/j.rser.2006.07.013
[SHA2013] Shamaki, M. A., Rostam, K., & Adamu, Y. M. (2013). Tar-geting poverty to improve maternal health in Sokoto State, Nigeria. Malaysian Journal of Society and Space, 9(3), 38-46. Retrieved January 11, 2018, from http://www.ukm.my/geografia/images/upload/4.geografia-july%202013-muazu-edam.pdf
[SHI2015] SHIBATA, M.: Inside the World's Biggest E-Waste Dump. Retrieved, December 15, 2017, from https://mother-board.vice.com/en_us/article/4x3emg/inside-the-worlds-big-gest-e-waste-dump
[SHI2010] SHIELDS, M.: PV Systems: Low Levels of Glare and Reflec-tance vs. Surrounding Environment. Retrieved January 11, 2018, from https://us.sunpower.com/sites/sunpower/files/me-dia-library/white-papers/wp-pv-systems-low-levels-glare-re-flectance-vs-surrounding-environment.pdf

Off-grid renewable electricity systems in Nigeria
125
[SIM2003] SIMS, E. H. R.; ROGNER, H.-H.; GREGORY, K.: Carbon emission and mitigation cost comparisons between fossil fuel, nuclear and renewable energy resources for electricity gen-eration. Energy Policy 31, p. 1315–1326. https://doi.org/10.1016/S0301-4215(02)00192-1
[SNI2015] SNIESKA, V.; VALODKIENE, G.; DAUNORIENE, A.; DRAKSAITE, A.: Education and unemployment in Euro-pean Union economic cycles. Procedia - Social and Behav-ioral Sciences, 213, p. 211–216. https://doi.org/10.1016/j.sbspro.2015.11.428
[SOKn.d.] SOKOTO CALIPHATE. Sokoto Caliphate. In Oxford Dic-tionary of Islam. Retrieved November 22, 2017, from http://www.oxfordislamicstudies.com/article/opr/t125/e2239
[STE2010] STERN, D. I.: The Role of Energy in Economic Growth. Re-trieved November 21, 2017, from https://agecon-search.umn.edu/bitstream/249380/2/CCEP-3-10.pdf
[TAS2014] TASRI, A.; SUSILAWATI, A.: Selection among renewable energy alternatives based on a fuzzy analytic hierarchy pro-cess in Indonesia. Sustainable Energy Technologies and As-sessments 7, p. 34–44. https://doi.org/10.1016/j.seta.2014.02.008
[TEC2010] TEC INC. Environmental Assessment for Diesel Generator Installation in Kekaha, Kauai, Hawaii. Retrieved February 2, 2018, from http://oeqc.doh.hawaii.gov/Shared%20Docu-ments/EA_and_EIS_Online_Library/Kauai/2010s/2010-02-23-KA-DEA-Diesel-Generator-Kekaha.pdf
[THEn.d.] THE ECO EXPERTS. Retrieved January 14, 2018 from https://www.theecoexperts.co.uk/solar-panels/what-size-do-i-need
[THE2014] THE FINANCIAL TIMES. Lexicon: Definition of bottom of the pyramid (BOP). Retrieved January 15, 2018 from http://lexicon.ft.com/Term?term=bottom-of-thepyramid-(BOP)

Ayaribil, Bykova, Kazandzhiev, Setiawan
126
[TIMn.d.] TIME AND DATE. Sokoto, Nigeria — Sunrise, Sunset, and Daylength, February 2018. Retrieved February 8, 2018, from https://www.timeanddate.com/sun/nigeria/sokoto
[TRA2017] TRADING ECONOMICS. Nigeria interest rate. Retrieved December 1, 2017, from https://tradingeconomics.com/nige-ria/interest-rate
[TRA2016] TRANSPARENCY INTERNATIONAL. Corruption Percep-tion Index 2016. Retrieved November 19, 2017, from https://www.transparency.org/news/feature/corruption_per-ceptions_index_2016
[TRO2016] TROTTER, P. A.: Rural electrification, electrification ine-quality and democratic institutions in sub-Saharan Africa. Energy for Sustainable Development, 34, p. 111-129. https://doi.org/10.1016/j.esd.2016.07.008
[TSO2009] TSOUTSOS, T.; DRANDAKI, M.; FRANTZESKAKI, N.; IOSIFIDIS, E.; KIOSSES, I.: Sustainable energy planning by using multi-criteria analysis application in the island of Crete. Energy Policy 37(5), 1587–1600. https://doi.org/10.1016/j.enpol.2008.12.011
[UDO2017] UDOCHUKWU, B.A.; IFEANYICHUKWU E.O.; OG-BONNAYA I.O.; EMEKA S.O.: Towards 100 % renewable energy in Nigeria. Renewable and Sustainable Energy Re-views, 71, p. 943-953. https://doi.org/10.1016/j.rser.2016.12.123
[UDU2013] UDUAK, S. A.; SALISU, R. I.: Electricity Access in Nigeria: Viability of Off-Grid Photovoltaic System. Paper presented at the IEEE African Conference 2013. doi:10.1109/AFR-CON.2013.6757778
[UNE2011] UNEP (2011): Environmental Assessment of Ogoniland, ISBN:978-92-807-3130-9, 1 – 25
[UNI2013] UNICEF. At a glance: Nigeria: Statistics. Retrieved January 14, 2018, from https://www.unicef.org/infobycountry/nige-ria_statistics.html

Off-grid renewable electricity systems in Nigeria
127
[UNI2017] UNITED NATIONS. World Population Prospects 2017. Re-trieved January 8, 2018, from https://esa.un.org/unpd/wpp/Download/Standard/Population/
[UNIn.d.] UNITED NATIONS. Climate Neutral Now. Retrieved Janu-ary 10, 2018, from https://unfccc.int/climate-action/climate-neutral-now
[USAn.d.] USAID. Nigeria Power Africa Fact Sheet. Retrieved January 15, 2018, from https://www.usaid.gov/powerafrica/nigeria
[VLA2010] VLAHINIC-DIZDAREVIC, N.; ZIKOVIC, S.: The role of energy in economic growth: the case of Croatia. Proceedings of Rijeka School of Economics, 28(1), p. 35-60. UDC 621.311:330.34/(497.5)
[VOEn.d.] VOELLER, C.; KLAUSS-VORREITER, A.; HANKO, J.: Clean energy towards a better quality of life; the ENERGY FOR LIFE project. Retrieved 17 February, 2018, from http://ecodes.org/docs/e2.pdf
[WAL2009] WALKER, A.: The day oil was discovered in Nigeria. Re-trieved, November 15, 2017, from http://news.bbc.co.uk/2/hi/africa/7840310.stm
[WIG2016] WIGGINS, D.: Top 10 reasons for project portfolio manage-ment (PPM) failure. PM World Journal, 5(4), p. 1-9. Re-trieved December 2, 2017, from http://pmworldjour-nal.net/wp-content/uploads/2016/04/pmwj45-Apr2016-Wig-gins-top-ten-reasons-for-ppm-failure-advisory.pdf
[WOR2008] WORLD BANK. Designing Sustainable Off-Grid Rural Electrification Projects: Principles and Practices (Opera-tional Guidance for World Bank Group Staff). Retrieved from
http://siteresources.worldbank.org/EXTENERGY2/Re-sources/OffgridGuidelines.pdf
[WOR2010] WORLD BANK. The State of the Poor: Where are the Poor and where are the Poorest? Retrieved February 14, 2018, from https://www.worldbank.org/con-tent/dam/Worldbank/document/State_of_the_poor_pa-per_April17.pdf

Ayaribil, Bykova, Kazandzhiev, Setiawan
128
[WOR2013] WORLD BANK. Financing renewable energy Options for Developing Financing Instruments using Public Funds. Re-trieved November 16, 2017, from http://docu-ments.worldbank.org/cu-rated/en/196071468331818432/pdf/765560WP0Fi-nan00Box374373B00PUBLIC0.pdf
[WOR2015] WORLD BANK. Population Dynamics by Country and Group. Retrieved October 27, 2017, from http://datatop-ics.worldbank.org/health/population
[WOR2016] WORLD BANK. Access to electricity (% of population) in Nigeria. Retrieved November 19, 2017, from https://data.worldbank.org/indicator/EG.ELC.ACCS.ZS
[WOR2017a] WORLD BANK. Program for Results Information Docu-ment. Concept Stage. Report Number: PIDC0122348. Re-trieved February 19, 2018, http://docu-ments.worldbank.org/cu-rated/en/266341497992825758/pdf/Nigeria-Power-Sector-Recovery-P4R-Concept-Stage-PID-8-3-2017.pdf
[WOR2017b] WORLD BANK. World Bank Group Support for Nigeria’s Power Sector Recovery Program. Retrieved February 19, 2018, from http://www.worldbank.org/en/news/press-re-lease/2017/04/22/world-bank-group-support-for-nigerias-power-sector-recovery-program
[WORn.d.-a] WORLD BANK. Foreign direct investment, net inflows (BoP, current US$). Retrieved November 19, 2017, from https://data.worldbank.org/indica-tor/BX.KLT.DINV.CD.WD?locations=NG
[WORn.d.-b] WORLD BANK. GDP growth (annual %). Retrieved No-vember 19, 2017, from https://data.worldbank.org/indica-tor/NY.GDP.MKTP.KD.ZG?locations=NG
[WORn.d.-c] WORLD BANK. Hospital beds (per 1,000 people). Re-trieved November 19, 2017, from https://data.worldbank.org/indicator/SH.MED.BEDS.ZS

Off-grid renewable electricity systems in Nigeria
129
[WUE2007] WUESTENHAGEN, R.; MAARTEN, W. M.; BUERER, M. J.: Social acceptance of renewable energy innovation: An in-troduction to the concept. Energy policy, 35(5), p. 2683-2691. https://doi.org/10.1016/j.enpol.2006.12.001
[ZOO2010] ZOPOUNIDIS, C.; PARDALOS, P. (Eds.): Handbook of Multicriteria Analysis. Berlin: Springer


Off-grid renewable electricity systems in Nigeria
131
Appendix
Relative scoring scale
The calculation of different scoring scales for multi-criteria decision making (as discussed in section 2.3.1) is represented by the following equation:
𝑉𝑎𝑙𝑢𝑒𝑚𝑎𝑥−𝑉𝑎𝑙𝑢𝑒𝑚𝑖𝑛10
1. Capital cost
= (4,040,000 – 110,000) / 10 = 393,000
With an interval of 393,000, the scale is as follows:
0 1 2 3 4 5
4,040,000 3,647,000 3,254,000 2,861,000 2,468,000 2,075,000
6 7 8 9 10
1,682,000 1,289,000 896,000 503,000 110,000
2. Operating cost
= (219,004 – 164,614) / 10 = 16,461.4
With an interval of 16,461.4, the scale is as follows:
0 1 2 3 4 5
219,004 202,543 186,081 169,620 153,158 136,697
6 7 8 9 10
120,236 103,774 87,313 70,851 54,390
3. Cost of energy
= (0.393 – 0.202) / 10 = 0.019

Ayaribil, Bykova, Kazandzhiev, Setiawan
132
With an interval of 0.019, the scale is as follows:
0 1 2 3 4 5
0.393 0.3739 0.3548 0.3357 0.3166 0.2975
6 7 8 9 10
0.2784 0.2593 0.2402 0.2211 0.202
4. Payback period
= (9.4 – 8.1) / 10 = 0.13
With an interval of 0.13, the scale is as follows:
0 1 2 3 4 5
9.4 9.27 9.14 9.01 8.88 8.75
6 7 8 9 10
8.62 8.49 8.36 8.23 8.1
5. GHG emission
= (562,218.6 – 0) / 10 = 56,218.86
With an interval of 56,218.86, the scale is as follows:
0 1 2 3 4 5
562,619 506,357 450,095 393,833 337,571 281,309
6 7 8 9 10
225,047 168,786 112,524 56,262 0

Off-grid renewable electricity systems in Nigeria
133
6. End-of-life value
= (0.98 – 0.66) / 10 = 0.0287
With an interval of 0.0287, the scale is as follows:
0 1 2 3 4 5
0.66 0.69 0.72 0.75 0.77 0.80
6 7 8 9 10
0.83 0.86 0.89 0.92 0.95


135
Implementing sustainable domestic biogas projects in ru-ral Tambacounda, Senegal
by Julia Kostin, Marie Strauss and Nika Tavčar

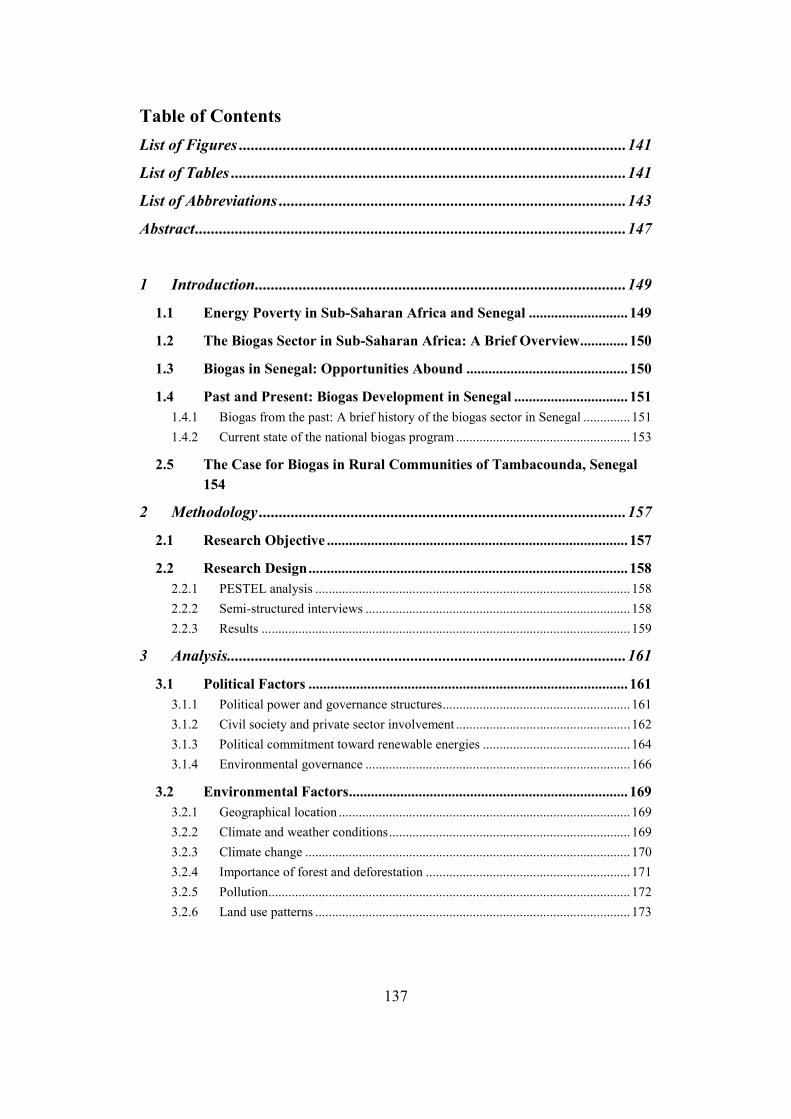
137
Table of Contents List of Figures ................................................................................................. 141
List of Tables ................................................................................................... 141
List of Abbreviations ....................................................................................... 143
Abstract ............................................................................................................ 147
1 Introduction ............................................................................................. 149
1.1 Energy Poverty in Sub-Saharan Africa and Senegal ........................... 149
1.2 The Biogas Sector in Sub-Saharan Africa: A Brief Overview ............. 150
1.3 Biogas in Senegal: Opportunities Abound ............................................ 150
1.4 Past and Present: Biogas Development in Senegal ............................... 151 1.4.1 Biogas from the past: A brief history of the biogas sector in Senegal .............. 151 1.4.2 Current state of the national biogas program .................................................... 153
2.5 The Case for Biogas in Rural Communities of Tambacounda, Senegal 154
2 Methodology ............................................................................................ 157
2.1 Research Objective .................................................................................. 157
2.2 Research Design ....................................................................................... 158 2.2.1 PESTEL analysis .............................................................................................. 158 2.2.2 Semi-structured interviews ............................................................................... 158 2.2.3 Results .............................................................................................................. 159
3 Analysis .................................................................................................... 161
3.1 Political Factors ....................................................................................... 161 3.1.1 Political power and governance structures........................................................ 161 3.1.2 Civil society and private sector involvement .................................................... 162 3.1.3 Political commitment toward renewable energies ............................................ 164 3.1.4 Environmental governance ............................................................................... 166
3.2 Environmental Factors ............................................................................ 169 3.2.1 Geographical location ....................................................................................... 169 3.2.2 Climate and weather conditions ........................................................................ 169 3.2.3 Climate change ................................................................................................. 170 3.2.4 Importance of forest and deforestation ............................................................. 171 3.2.5 Pollution............................................................................................................ 172 3.2.6 Land use patterns .............................................................................................. 173

138
3.3 Social Factors ........................................................................................... 174 3.3.1 Social groups and their agricultural practices ................................................... 174 3.3.2 Households ....................................................................................................... 176 3.3.3 Education .......................................................................................................... 176 3.3.4 Household buying decisions ............................................................................. 177 3.3.5 Health and social issues related to the use of traditional fuels .......................... 177 3.3.6 Awareness and acceptance of biogas technology ............................................. 179
3.4 Technical Factors ..................................................................................... 181 3.4.1 Domestic biodigesters ....................................................................................... 181 3.4.2 Substrates .......................................................................................................... 183 3.4.3 Co-digestion ...................................................................................................... 184 3.4.4 Grazing systems ................................................................................................ 185 3.4.5 Water usage ...................................................................................................... 187 3.4.6 Materials, installation, and maintenance ........................................................... 187 3.4.7 Operability ........................................................................................................ 190 3.4.8 Technical capacity ............................................................................................ 192
3.5 Economic Factors .................................................................................... 193 3.5.1 Economic development of the region ............................................................... 193 3.5.2 Sufficient active demand .................................................................................. 193 3.5.3 Willingness to pay (WTP) ................................................................................ 194 3.5.4 The market for existing domestic cooking fuels ............................................... 194 3.5.5 Financing .......................................................................................................... 195 3.5.6 Potential to use bio-slurry ................................................................................. 196
3.6 Legal Factors ............................................................................................ 198 3.6.1 Land tenure, decentralized jurisdiction and customary law .............................. 198 3.6.2 Emergency and disaster preparedness legislation ............................................. 200 3.6.3 Dairy industry legislation.................................................................................. 200 3.6.4 Participation in international agreements on climate change ............................ 201 3.6.5 Labor and employment legislation for NGOs ................................................... 202 3.6.6 Anti-corruption legislation ................................................................................ 204
4 Results ...................................................................................................... 207
4.1 Critical Success Factors .......................................................................... 207
4.2 Promotion and Communication ............................................................. 209
4.3 Financing Scheme .................................................................................... 211
4.4 Household Selection and Installation Requirements ............................ 214
139
4.5 Technical Training and Employment .................................................... 217 4.5.1 Training of trainers ........................................................................................... 218 4.5.2 General Training Sessions ................................................................................ 218 4.5.3 Long-term Monitoring and Employment .......................................................... 219
4.6 Community Development ....................................................................... 220
5 Conclusion ............................................................................................... 223
6 Discussion ................................................................................................ 227
List of References ............................................................................................ 229
Appendix .......................................................................................................... 243


141
List of Figures Figure 1: Design of different digester types [adapted from ALS2008] ................................... 182
List of Tables Table 1: Summary of interviewees and relevant information ................................................. 159
Table 2: Projected temperature change [adapted from CSC2016] .......................................... 171
Table 3: Biological methane potential (BMP) [adapted from LUO2011] .............................. 184
Table 4: Characteristics of substrates [adapted from RAJ2012] ............................................. 186
Table 5a: Average costs of fixed-dome biodigesters [HEG2007] ............................................ 189
Table 5b: Cost of a 6 m3 fixed-dome biodigester [adapted from HUB2007] ........................... 190
Table 6: Resource use and energy provision [adapted from RAK2013; SNV2006] .............. 191
Table 7: Critical success factors ............................................................................................. 207
Table 8: Digester size, resources and energy provision .......................................................... 217
Table 9: Contents of four general training sessions ................................................................ 219


143
List of Abbreviations ABPP African Biogas Partnership Programme
ACCES Africa Clean Cooking Energy Solutions
AGIR Global Alliance for Resilience Initiative
ARAFAT Réseau des Associations Aliniha Autogérées des Femmes de Tambacounda
ARC African Risk Capacity Insurance Company
ASER Agence Sénégalaise d’Electrification Rurale (Senegalese Rural Electrification Agency)
AVSF Agronomes et Vétérinaires Sans Frontières (Agronomists and Veterinarians without Borders)
BMP Biological Methane Potential
C/N Ratio Carbon to Nitrogen Ratio
COCC Code des Obligations Civiles et Commerciales (Civil and Commercial Obligations Code)
CERER Centre d’Études et de Recherches sur les Énergies Renouvelables (Centre for Study and Research in Renewable Energy)
CFAA Country Financial Accountability Assessment
CFA Franc Franc de la Communauté Financière d'Afrique (Financial Community of Africa Franc)
CGQA Centre de Gestion de la Qualité de l'Air (Air Quality Management Center)
Ci-Dev Carbon Initiative for Development
CIER Comité Interministériel sur les Energies Renouvelables (Interministerial Committee on Renewable Energy)
CIRAD Centre de coopération internationale en recherché agronomique pour le développement (Agricultural Re-search Centre for Development)
CIVD Comité intervillageois de développement (Intervillage Council for Development)

144
CNRA Centre National de Recherche Agronomique (National Center for Agronomic Research)
CNTS Confédération Nationale des Travailleurs du Sénégal (National Confederation of Senegalese Workers)
COMNACC Comité National sur les Changements Climatiques (National Committee on Climate Change)
CPAR Country Procurement Assessment Report
CUIMES Comité Intersectoriel de Mise en œuvre des Synergies entre le Secteur de l’Energie et les autres Secteurs Straté-giques pour la Réduction de la Pauvreté (Inter-sectorial Committee for the Implementation of Synergies between Energy and other Strategic Sectors)
CVD Comités Villageois de Développement (Village Council for Development)
DAGAT Direction des Affaires Générales et de l'Administration du Territoire (Directorate of General Affairs of the Terri-torial Administration)
DGIS Directorate General for International Cooperation
DHCD Direction des Hydrocarbures et des Combustibles Domestiques (Directorate of Hydrocarbons and Domes-tic Fuels)
ENDA-TM Environment Development Action Tiers Monde (Environment Development Action in the Third World)
ENSUT École Nationale Supérieure Universitaire de Technologie
ERPA Emissions Reduction Purchase Agreement
ETHEC Entreprise des Travaux Hydrauliques et de Construction
FMP Community Forest Management Plan
FONSTAB Fonds d’appui à la stabulation (Support fund for animal sheds)
GHG Greenhouse gas
HIVOS Humanistisch Instituut voor Ontwikkelingssamenwerking (Humanist Institute for Cooperation with Developing Countries)

145
HRT Hydraulic Retention Time
IEA International Energy Agency
INDC Intended Nationally Determined Contribution
IRENA International Renewable Energy Agency
ISRA Institut Sénégalais de Recherches Agricoles (Senegalese Agricultural Research Institute)
LOASP Loi d'Orientation Agro-Sylvo-Pastorale (Framework Law on Agroforestry and Pastoralism)
LPDSE Lettre de Politique de Développement du Secteur de l’Energie (Energy sector development policy letter)
LPG Liquefied petroleum gas
LPSSCD Lettre du Politique du Sous-Secteur des Combustibles Domestiques (Domestic fuels sub-sector policy letter)
NAMA Nationally Appropriate Mitigation Action
NGGP National Good Governance Programme
NISDEL Nouvelle Initiative Sectorielle pour le Développement de l'Elevage (New Sectoral Initiative for Livestock Manage-ment)
OFMSW Organic Fractions of Municipal Solid Waste
PERACOD Programme pour la Promotion des Energies Renouvela-bles, de l’Electrification Rurale et de l’Approvisionnement Durable en Combustibles Domestiques (Programme for the Promotion of Renewable Energy, Energy Efficiency and Access to Energy Services)
PNA Plan National d'Adaptation (National Adaptation Plan)
PNAE Plan National d’Action pour l'Environnement (National Action Plan for the Environment)
PNB-SN Programme National de Biogaz Domestique (National Biogas Programme of Senegal)
PNDE Programme National de Développement de l'Elevage (National Programme for Livestock Development)
146
PRACAS Programme d'Accélération de la Cadence de l'Agriculture Sénégalaise (Acceleration Programme for Senegalese Ag-riculture)
PROGEDE Programme pour la Gestion Durable et Participative des Energies Traditionnelles et de Substitution (Sustainable and Participatory Energy Management Project)
PSE Plan Sénégal Émergent (Emerging Senegal Plan)
RC Communauté Rurale (Rural Community)
SIE Système d’Information Energétique du Sénégal (Energy Information System of Senegal)
SNV Stichting Nederlandse Vrijwilligers (Netherlands Development Organisation)
SPNAB Stratégie et le Plan National d'Action sur la Biodiversité (National Plan on Biodiversity)
UFZ Umweltforschungzentrum Leipzig-Halle (Centre for Environmental Research Leipzig-Halle)
UNFCCC United Nations Framework Convention on Climate Change
USFS United States Forest Service
UNSAS L'Union Nationale des Syndicats Autonomes du Sénégal (National Association of Senegalese Union Workers)
USAID United States Agency for International Development
VFA Volatile fatty acids
WTP Willingness to pay

147
Abstract Access to clean cooking fuels is a basic prerequisite for poverty alleviation and an area of great global inequity. In Sub-Saharan Africa alone, 850,000 million people still rely on traditional cooking fuels, leading to detrimental effects on the environment, economic productivity, human health, education and gender equal-ity [IEA2017; GAY2007]. Tambacounda, Senegal is one of the rural regions particularly affected. The development of domestic biogas technology in the last few decades presents an opportunity to improve rural livelihoods while generat-ing an affordable and sustainable source of clean cooking fuel and lighting. In this work, an analysis was undertaken to describe the best approach for installing equitable, environmentally sustainable, and independently manageable domestic biodigester programs in rural Tambacounda. Critical success factors were iden-tified through a PESTEL analysis and four semi-structured interviews, in order to identify the most relevant features of the region in the context of biogas tech-nology. These success factors were then used to create an adapted protocol for implementing a biogas program. The recommendations outlined in this work can contribute to the success of future biogas programs and benefit rural communities in the long-term, while promoting the development of a much-needed clean en-ergy sector in Senegal.


149
1 Introduction
1.1 Energy Poverty in Sub-Saharan Africa and Senegal
According to the United Nations, energy poverty can be defined as “the inability to cook with modern cooking fuels and the lack of a bare minimum of electric lighting to read or for other household and productive activities at sunset” [GAY2007]. By this definition, 1.1 billion people around the world who lack access to electricity, as well as 2.8 billion people who rely on biomass, coal, and kerosene for cooking, can be classified as energy poor [ibid; IEA2017].
Energy poverty is widespread in developing countries, particularly those of Sub-Saharan Africa, where roughly 600 million people remain without access to elec-tricity and 850 million rely on traditional cooking fuels [IEA2017], leading to detrimental effects on economic productivity, health, education, communication, gender equality and the environment [GAY2007]. Until recently, this issue has been given limited attention in scientific literature [SOV2014], despite the fact that ensuring “access to affordable, reliable, sustainable and modern energy for all” (UN Sustainable Development Goal Nr. 7) is an utmost prerequisite for alle-viating poverty and improving living conditions for the world’s poor [BRE2014].
The Republic of Senegal in West Africa, bordering Mauritania, Mali, Guinea, Guinea-Bissau as well as Gambia, is one of the countries especially affected by energy poverty [SEC2007]. The country spans the area of 196,712 km2 and is geographically and politically divided into 14 regions [ANS2017] that are inhab-ited by 15,411,614 people, with 56 % living in rural areas [WB2016]. The na-tion’s economy relies heavily on agriculture, while other important industries in-clude tourism, phosphate mining, fertilizer production, commercial fishing for exports and craftwork [BLO2014; WIS2015]. Senegal has experienced steady economic growth for the last 10 years due to increasing exports and competitive-ness as well as structural reforms, making it one the best-performing economies of Sub-Saharan Africa, expected to achieve an economic growth rate of 6.9 % by 2018 [WB2017].
Despite the economic upturn, Senegal continues to experience high levels of mul-tidimensional poverty and low levels of human development [UND2016]. Access to basic needs such as electricity is severely limited, especially in rural areas [WB2014]. Additionally, roughly 90 % of Senegal’s rural population rely on tra-ditional solid fuels such as charcoal and firewood for cooking [BLO2014]. The lack of access to energy and clean cooking fuels particularly affects women and children, who are largely responsible for the collection of firewood and prepara-tion of meals, exposing them to particulate matter emissions at a notably higher

Kostin, Strauss and Tavčar
150
rate than men, and resulting in high levels of illness and premature death due to indoor air pollution [SEC2007; PUT2015; BLA2006].
These challenges require multi-level approaches on various scales. While poli-cies and international agreements can provide the framework for improvements, they do not always reach impoverished rural areas [SUB2011]. Bottom-up solu-tions that are sensitive to local conditions must also be developed and imple-mented [WU2015].
1.2 The Biogas Sector in Sub-Saharan Africa: A Brief Overview
Biogas energy is a renewable form of energy that presents a tremendous oppor-tunity for sustainable development and decentralized energy production for rural and agricultural communities. A key benefit of biogas production is its ability to regenerate waste outputs into valuable inputs in our energy system, thus creating a closed-loop cycle. Furthermore, this renewable energy enables substantial re-ductions in GHG emissions, produces a byproduct that can be used as nutrient-rich organic fertilizer, and offers a new avenue for creating sustainable waste management systems. Depending on the type of installation and number of end-users, biogas energy can be used for electricity, space heating, cooling, and cook-ing. It can be installed in larger commercial and industrial systems (including combined heat and power plants, combustion engines and generators which con-vert biogas energy into electricity), while the simplest household systems can provide energy directly for lighting and cooking, without needing to convert the biogas to mechanical energy [AMI2012]. Currently, household digester systems are the most widely used type of biogas system in Sub-Saharan Africa, with ani-mal waste being the primary raw material [ibid]. Furthermore, warm tempera-tures in the sub-Saharan African climate permit ideal temperature conditions for domestic biogas digesters. By recycling widely available agricultural materials or animal waste into clean energy for cooking and lighting, domestic systems continue to empower communities in lower socio-economic sectors (where en-ergy grid systems and access to electricity are otherwise absent) to manage, uti-lize and distribute their own local sources of clean energy.
1.3 Biogas in Senegal: Opportunities Abound
Senegal has the opportunity to develop a thriving biogas sector. Thus far, many independent reports have confirmed that there is high potential and feasibility for domestic biogas in the country [HEG2007; SNV2013]. The first assessment of domestic biogas potentials in Senegal was conducted by Heegde and Sonder [HEG2007], who estimated the potential for 439,000 installations nationwide, based on calculations of the total sum of cattle per household and access to water. More recent feasibility studies that followed determined the nationwide potential

Implementing sustainable domestic biogas projects in Senegal
151
to be between 175,000 to 400,000 installations [HEG2007]. Furthermore, based on the shear amount of cow manure produced in the country alone (producing upwards of 1,691,135 tones of dry matter per year), households in Senegal would have a consistent supply of raw material to support such decentralized biogas units [BA2017]. A report by SNV [SNV2013] estimated that there is a potential market for biogas units in 350,000 households that collect more than 30 kg of cow manure per day.
However, although many rural households in Senegal fulfill the requirements needed for a domestic biogas installation (primarily consisting of access to water and sufficient amounts of cow manure), few successful developments have been implemented [HEG2007]. With fewer than 600 biodigesters installed in the coun-try at the end of 2013, progress in sustaining domestic biogas programs within the country has been underwhelming [BLO2014; SNV2013; FAL-N.D.; MPE2015].
1.4 Past and Present: Biogas Development in Senegal
1.4.1 Biogas from the past: A brief history of the biogas sector in Senegal
Biogas technology in Senegal can be traced back to 1977, when two floating bi-ogas digesters were installed by the Caritas Senegal NGO in Ndiouk Fissel, fol-lowed by the installation of seven fixed dome plants in 1989 [HEG2007]. Both projects were installed for demonstration purposes only, and the majority of do-mestic installations from this time are no longer operational [ibid]. Other biogas installations that existed at this point were either used for industrial applications or R&D [ibid]. Biogas units during this time were installed by organizations in-cluding Environment Development Action in the Third World (ENDA-TM), École Nationale Supérieure Universitaire de Technologie (ENSUT), Centre Na-tional de Recherche Agronomique (CNRA), the Centre for Study and Research in Renewable Energy (CERER), Agricultural Research for Development (CI-RAD) and Senegalese Agricultural Research Institute (ISRA) [HRU2011]. Sub-sequent attempts to realize the domestic biogas potential in Senegal at this time were predominantly unsuccessful.
Large scale domestic biogas programs were nearly nonexistent in the country up until 2007 [HEG2007]. To promote the biogas sector, the government of Senegal launched the National Biogas Programme in Senegal (Le programme national de biogaz domestique du Sénégal, or PNB-SN) in 2010, with its pilot phase lasting until 2013 [HRU2011]. Most of the installations from this point onwards were supported by international partnerships between PNB-SN and organizations such as SNV, AVSF, and ETHEC [BLO2014; SNV2013; FAL-N.D.; MPE2015]. The

Kostin, Strauss and Tavčar
152
focus area of the national program was to develop domestic biogas in the Ground-nut Basin, more specifically surroundings of Fatick, Kaolack, Kaffrine and peri-urban zone of Dakar, targeting villages on the household level instead of indus-trial applications [HRU2011].
The program was started in the rural region of Kaolack, where locals were trained as construction workers to help with the installation of the biodigesters used for cooking and lighting [KER2011]. The initial goal was to install 350 biodigesters by the end of 2010, reaching 8,000 installations by 2013 [ibid]. The model that was being installed during the program was the fixed dome digester, which had already been proven to be successful in Burkina Faso, Rwanda, and several Latin American countries [ibid]. The size of the biodigester varied from 4 to 12 m3, depending on the size of the household [ibid]. However, only 587 biodigesters out of 8,000 planned units were installed in the four-year period between 2010 and 2013 [WIL2015]. By 2015, this number amounted to 1,000 biodigesters [ibid]. According to Matar Sylla, coordinator of the National Biogas Program, the reasons for the poor success could be attributed to financial and technical issues, with the lack of capital being the main obstacle [WIL2015; KER2011]. The high initial installation costs of the biogas plants were also seen as a major barrier preventing the distribution of biogas installations in the rural areas of Sen-egal both before and throughout the duration of this phase [HRU2011; ADI2011].
When the program was initiated, the government announced that the subsidies would cover 50 % of the price of the first 100 pilot biodigesters, followed by a 25 % contribution for the remaining 7,900 biogas plants [PNB2010]. In 2011, the financial aid of the state covered between 35-50 % of the set-up costs [KER2011; ADI2011], which still required households to provide around 300,000 CFA francs1 [KER2011]. On the other hand, according to Sylla in 2015, the cost of two different types of biodigesters that were being installed ranged from 449,773 CFA francs to 728,300 CFA francs, with the government financing up to 35 % and the beneficiaries of the program having to cover the remaining 65 % [WIL2015].
Although the expenditures were cut down with the introduction of smaller bricks during the construction of the digesters, the financial burden still remained one of the main barriers [KER2011]. Studies have shown that rural households with an income of 150,000 CFA francs could not afford to invest into the installation of the biodigester for their own needs [WIL2015]. They could have taken a loan from the bank, however, the interests rates would have ranged from 12 to 24 %, still making it unaffordable for the targeted households to invest in the installa-
1 € 1 EUR = CFA 655,96 XOF (January 2019)

Implementing sustainable domestic biogas projects in Senegal
153
tion [ibid]. Furthermore, due to insufficient government resources to support pea-nut agriculture in 2010-2011, a large portion of harvests went unsold, resulting in a decrease in buying power of agricultural households [SNV2013]. The ab-sence of biogas credit associations further deepened the financial constraints and limited the implementation success of the program [ibid]. Several technical con-straints also led to the failure of the program, including water shortages, incom-patible livestock management practices, and lack of appropriate training [WIL2015]. Furthermore, household owners did not handle the equipment for the energy production and fertilization appropriately [ibid]. Customers did receive the introductory training by the members of the program, however, no guidance on how to maintain the biodigesters in the long-term was given [KER2011]. Pos-sible concerns regarding technical aspects were already discussed by Heegde et al. [HEG2007]. They identified insufficient masonry competences among the in-habitants.
Moreover, PNB-SN was initially part of the African Biogas Partnership Pro-gramme (ABPP) that was implemented in six countries [SNV2013]. The African Biogas Partnership Programme allowed PNB-SN to receive financial support from the Netherlands Ministry of Foreign Affairs (DGIS), while technical sup-port was provided by SNV, and project management was allocated to the Inter-national Humanist Institute for Cooperation with Developing Countries (Hivos) [ibid]. However, Hivos, SNV and DGIS all decided to stop supporting the pro-gram in Senegal in June 2012 as the costs proved to be too high compared to the actual results obtained [ibid]. Although the expenses were minimized by 30 % during the initial installation of the biodigesters, the main problem proved to be the slow rate of the progress with only fourteen biogas plants being installed in the first year of the program [ibid]. The excessive delays in the project imple-mentation were caused by the government’s decision to change the initial imple-menting organization of the program from the Agence Sénégalaise d’Electrifica-tion Rurale (ASER) to the Ministry of Energy [ibid]. The decision to terminate the ABPP in Senegal was also caused by many institutional failures reported within the Ministry of Energy, which led to a lack of support for the program-implementing associates, and consequently, little progress in the real sector [ibid].
1.4.2 Current state of the national biogas program
In light of this history, the government of Senegal is now on its way to developing stronger support and financial infrastructure to accelerate biogas development in the country. The second phase of the PNB-SN was initiated on the 11th of April 2015 in the village of Koutal, and aims to install 10,000 domestic biodigesters in rural homes by 2019 (2 % of all agricultural households), with a primary focus on bringing clean cooking and lighting access to rural communities [WIL2015;

Kostin, Strauss and Tavčar
154
BA2017; MPE2015]. These initiatives were planned to be financed in partnership with the government of Senegal, the European Union and other partners [WIL2015]. For the second phase, the government has committed to subsidizing up to 80 % of the installation costs [ibid]. As outlined in the program, at least 500 biodigesters are planned to be installed in households, schools and daaras (Ko-ranic schools) in the region of Tambacounda, which could lead to the production of 26,000 tons of fertilizer per year [‘500 BIO-DIGESTEURS’2016]. Although the government-run program did not achieve its goals in the first phase of the program, its ambitious new targets indicate that the country is strongly in favour of pursuing biogas for sustainable energy production and clean cooking fuels. Ultimately, the present circumstances in the country offer encouragement and an incentive for international NGOs and biogas developers to implement rural do-mestic biogas programs in the country. Furthermore, new biogas programs in the country would be poised to have a positive influence on the success and long-term sustainability of the biogas sector and the country’s sustainable develop-ment targets.
2.5 The Case for Biogas in Rural Communities of Tambacounda, Senegal
Tambacounda is the largest geographic region in Senegal, covering an area of 42,706 km2 [ANS2015]. It is home to 783,777 inhabitants and has a population density of 18 per km2 [ANS2013]. About 84 % of Tambacounda’s land area is rural [HEG2007]. The economy is thus primarily based on agriculture, which employs about 75 % of the workforce [BLO2014]. The region is home to many communities skilled in livestock management, as it has wide pasture ranges [ibid]. Tambacounda is subdivided into fifty local authorities, four departments and forty-six communities [ANS2015], and remains to this day one of the poorest and least developed regions in the country [ANS2013]. The most recent research by the National Agency of Statistics and Demography revealed that 62.5 % of Tambacounda’s population live below the poverty line [ibid]. Rural communities in Tambacounda are thus particularly vulnerable to the effects of polluting cook-ing fuels, with 95 % of rural households reporting health problems related to in-door air pollution [BLO2014]. As the primary region is involved in firewood and charcoal production, substantial economic pressure to promote domestic con-sumption drives environmental degradation [WIS2015]. A report by Practical Action Consulting for the Africa Clean Cooking Energy Solutions (ACCES) rec-ommends a greater focus on implementing biogas use in the region of Tamba-counda, while additional surveys demonstrate that villagers in this region have expressed an explicit demand for biogas [BLO2014]. The rural community (RC) of Koulor has been chosen as a representative region in Tambacounda that could greatly benefit from a domestic biogas program, if carried out correctly. The RC
Implementing sustainable domestic biogas projects in Senegal
155
of Koulor is located in the greater Koulor district, within the Goudiry Department of southeastern Tambacounda. As of 2015, there were 12,920 inhabitants in the rural community clustered into forty-five smaller villages [SEM2011]. Due to the large land area and number of cattle, the population is primarily involved in ag-riculture and livestock production [ibid]. Despite significant demand, the RC of Koulor has no access to clean cooking fuels, suffers from poor sanitation, and does not have access to grid electricity [ibid].
Achieving further access to clean cooking fuels and lighting with a domestic bi-ogas program in Tambacounda is an important way to alleviate poverty and im-prove the living conditions for all, especially women and children. The aim of this contribution is therefore to provide a strategy that is specifically tailored to implementing a sustainable domestic biogas program in villages of Tambacounda such as the RC of Koulor. With this bottom-up approach, we highlight the im-portance of understanding the political, economic, social, technical, environmen-tal and legal considerations at the utmost local level to create the best possible outcomes for the community. Given the poor development in this sector and the region’s high suitability, considerable attention is paid to understanding how fail-ures and limitations from previous biogas programs can be circumvented, and to incorporating these lessons into a strategy that prioritizes long-term success, tech-nical knowledge transfer, and equitable community development.


Implementing sustainable domestic biogas projects in Senegal
157
2 Methodology
2.1 Research Objective
The research objective of this work is to provide a holistic and integrative strategy for developing domestic biogas projects in rural villages of Tambacounda, Sen-egal. Furthermore, this paper aims to emphasize the development of technical skills and an understanding of the technology by the local communities, so as to promote the growth of the private sector in the region. With these objectives, we aim to address and answer the following research question:
What strategies can be used to implement an equitable, environmentally sustain-able, and independently manageable domestic biogas program in rural Tamba-counda, Senegal?
To answer this question, a strategy consisting of major recommendations was devised. These recommendations have been developed through the analysis of primary and secondary research. It is an important objective to characterize the local and regional factors in order to develop meaningful results. Our recommen-dations are therefore specifically adapted for biogas projects in small communi-ties in Tambacounda, with the RC of Koulor being a particularly suitable region. An analysis of this RC provides valuable data and detailed documentation of livestock and local living conditions from many small settlements, thus giving valuable insight and a broader understanding of life in rural Tambacounda. Thus, the recommendations outlined in the results would be appropriate for stakehold-ers interested in developing a biogas project within Koulor, however, they can be applied on a wider scale for other projects in rural Tambacounda.
This work is intended for members of organizations, governments or businesses involved in renewable energy and rural development projects who have prelimi-nary experience in implementing domestic biogas projects in rural regions of Sub-Saharan Africa. The strategy outlined in this work is not exhaustive, but aims to provide relevant guidance that will complement other technical installation guidelines, business strategies, operations and implementation manuals. Ulti-mately, it serves as an important tool for understanding local and context-specific factors that should be considered when designing and executing a sustainable domestic biogas development project in the selected region.

Kostin, Strauss and Tavčar
158
2.2 Research Design
In order to determine the most important considerations when implementing a domestic biogas project in rural Tambacounda, two research methods were ap-plied. First, a PESTEL analysis was conducted through the literature research to establish a comprehensive framework assessing the state of political, environ-mental, social, technological, legal and economic conditions in the region. Sub-sequently, in order to collect additional information that could not be obtained during the literature review, four semi-structured interviews were conducted. Fi-nally, a recommendation strategy was developed based on the results of primary and secondary research. The holistic strategy provides critical advice for increas-ing the long-term independence and sustainability of biogas projects in rural Tambacounda, and contains recommendations which address the most important, region-specific factors.
2.2.1 PESTEL analysis
A PESTEL analysis is an analytical framework which main purpose is to assess the potential effects and most crucial factors of the external environment on a given research activity or undertaking, and vise versa [ALL2001; BAS2004]. It categorizes the key aspects into political (P), environmental (E), social (S), tech-nological (T), economic (E), and legal (L) conditions [BAS2004]. In this research work, the chosen PESTEL criteria are focused on relevant issues that should be taken into account when developing an effective strategy for the implementation of a sustainable domestic biogas program in the villages of Tambacounda.
2.2.2 Semi-structured interviews
In order to confirm the findings from the literature research and to get a deeper insight into the relevant topics, four semi-structured interviews with a diverse group of experts were conducted. The interviewees were chosen based on their area of expertise, and represent a diverse group from both academic and non-academic fields. The interviewees were contacted via phone or Skype, and asked about several aspects concerning domestic biogas implementation in Tamba-counda. All the interviews were recorded, transcribed, translated if necessary, and implemented as required. The main details of the interview have been sum-marized in Table 1.

Implementing sustainable domestic biogas projects in Senegal
159
Table 1: Summary of interviewees and relevant information
Interviewee Occupation Date of Interview Additional Details
Stefano Mason [Ma-sonAVSF, 2017]
AVSF Employee Dec. 5, 2017 Involved in domestic biogas project in the region of Ferlo, Senegal
Karl Wurster [Wurs-ter, 2017]
USAID Employee Dec. 15, 2017 Completed dissertation on charcoal production in Tambacounda
Daniela Thrän [Thrän, 2017]
Researcher at UFZ and Leipzig University
Dec. 15, 2017 Working in the field of bio-energy systems
Lamine Ndiaye [Ndiaye, 2017]
Thecogas Director Dec. 18, 2017 Involved in rural biogas projects and electrification in Tambacounda
2.2.3 Results
In order to formulate the final results, a list of critical success factors were iden-tified from the PESTEL analysis and interviews. The critical success factors de-scribe important features about our area of interest and provide context-specific information relevant to implementing a biogas program. Critical success factors were selected from the analysis so long as they met one of the following three conditions in order to meet the described research objective:
x The factor conveys key information about local conditions in the RC of Koulor or Tambacounda, and enables a specific recommendation to be justified.
x The factor was revealed through information obtained during the inter-view process, and enables a specific recommendation to be justified.
x The factor identifies a potential area of weakness based on the analysis of previous domestic and international biogas projects, whereby alternative steps could be justified to improve future outcomes.
Finally, a recommendation strategy with multiple categories was formed on the basis of the critical success factors, aiming to provide a comprehensive overview of the key steps that should be taken to address these factors while implementing a sustainable long-term biogas project. It should be noted that although the data presented in this study is primarily specific to the RC of Koulor, it can generally be applied to any rural village of Tambacounda. However, since local conditions may vary from village to village, further analysis of local factors is recommended when assessing the feasibility of biogas in other villages.


Implementing sustainable domestic biogas projects in Senegal
161
3 Analysis
3.1 Political Factors
3.1.1 Political power and governance structures
Senegal is one of few existing democratic states in Sub Saharan Africa [FHR2017]. It is home to a multi-party system and has, unlike many other Sub-Saharan countries, never experienced a coup d’etat [HEG2007].
Corruption and a lack of transparency in public affairs and governmental con-tracts are nonetheless widespread in Senegal [USA2007] and continue to face little backlash or accountability from the public and government representatives alike [ibid]. This affects public spending, private foreign- and domestic invest-ments in the energy sector, as well as regulations regarding resource use [ibid]. While citizens are widely satisfied with the democratic rights given to them, the high concentration of power in the executive branch and the abuse of said power remains a serious problem [ibid]. Executive decisions, government expenditures and operations are insufficiently monitored and lack transparency. This has re-peatedly led to malfunctioning and weaknesses in Senegal’s present governance system [IMF2013].
The Senegalese parliament has restricted decision-making capacities, making it difficult to monitor budgeting, spending, as well as policy outcomes [ibid]. The legal and public administration systems are characterized by several inefficien-cies and have had few significant reforms [ibid]. Some of these include difficul-ties in coordination and communication between different actors of the private and public sphere, the weak enforcement of rules and regulations, slow proce-dures, and limited access to information and public services for the general public [ibid]. Some of the political power has been decentralized to regional authorities, which has not been without difficulties [ibid]. Insufficient operationalization of policies, laws, and plans, specifically regarding land use, as well as a lack of consultancy with local communities when carrying out development projects and plans have posed barriers to establishing successful governance on a local level [ibid].
Local-level institutions have been selected and acknowledged by higher-level in-stitutions through the transfer of power, assistance in projects and involvement in establishing agreements. These rural councils were recently established through the decentralization processes in the late 1990s with the goal of giving local communities more autonomy from central powers [JUS2015; FAY2006]. They have been delegated certain rights, such as managing access to natural re-

Kostin, Strauss and Tavčar
162
sources [POS2003]. This is particularly important for regions such as Tamba-counda, where the population relies heavily on charcoal production, and other income-generating work opportunities are rather scarce [JUS2015].
The decentralized political authorities are arranged in hierarchical order, begin-ning with the governor of a region, followed by the prefect of a department, the sub-prefect at the district-level and the village chief at the village-level [FAY2006]. In institutional terms, two organs exist: the rural council and the president of the rural council. The council is elected by vote, half by majority, half by proportional vote. After the council has been appointed, it is in charge of electing a president and two vice-presidents [ibid].
The first rural councils in Tambacounda were established in 1984 [POS2003]. The sub-prefects are responsible for providing assistance to rural communities, especially in regard to developmental activities [ibid]. They are delegated by the president of the rural council, whereupon they represent all ministries and are in charge of approving decisions of the rural council [ibid].
The statutes and functions of the village chiefs, traditionally male, are specified by decrees, which have been adapted over time. Their political powers are essen-tially reduced to collecting the rural tax and any other communal revenues. Ad-ditionally, they are in charge of resolving conflicts as well as of ensuring the application and compliance with laws and regulations [FAY2006]. The village chief does not normally hold a seat in the rural council [POS2003]. However, both village chiefs and rural councils may take on additional tasks and responsi-bilities as defined by customary law. Customary practices and informal law guide the everyday life of the villagers and are considered to have equal or sometimes even higher importance than national law and state institutions [USA2010].
The decentralization process was intended to reduce the concentration of power by setting up state representatives in administrative and territorial constituencies. However, these reforms were not democratic, and the power and financial re-sources transferred to locally elected governments were often insufficient [JUS2015]. Another issue was that local political entities such as rural councils were poorly equipped to handle their new responsibilities, with high levels of illiteracy presenting a major barrier, resulting in increased reliance on external aid coming from international donors and development agencies [POS2003; USA2008].
3.1.2 Civil society and private sector involvement
Civil society and private sector involvement in energy and other development projects has been hindered by a lack of access to and transparency of information on public finance, projects and programs as well as the non-existence of an intact
Implementing sustainable domestic biogas projects in Senegal
163
consultation scheme [IMF2013]. This has been validated by interviewee Ma-sonAVSF [2017]:
“The lack of engagement and actual funding pushed some NGOs like SNV to stop their programs and withdraw because none of the promises were fulfilled. But still with the official information saying that the program is up and running, one can wonder where the funding is actually going”.
The inefficiency and lack of transparency of local power structures pose signifi-cant barriers to realizing development projects in rural areas [JUS2015]. When international donors and agencies are involved, access to resources and aid is therefore often restricted by numerous conditions. Ensuring the integrity of ben-eficiaries and employing accountability mechanisms can contribute to the success of developmental projects and increase trust in institutional support [ibid]. Inter-viewee MasonAVSF [2017] explained:
“[…] it had to be families that we can trust, that can bring us guaranties that they will use the device properly, families known and recognized in the community who we have information about since it’s been a long time that we have started working there (…). We did ask them to sign a contract binding them to the association as a mark of guaranty [...]“
Since development projects have become more participatory, donor agencies align their projects with local governing bodies. This change has increased the potential for citizens to participate and voice their opinions, provided they are informed on a regular basis [JUS2015].
A system of village committees for development (CVD) was created in the late 1990s, consisting of village chiefs and representatives of local interest groups and organizations [POS2003]. They cover four to five villages and collect concerns and questions of CVDs through the inter-village committee for development (CIVD), which are then reported to the rural councils, potentially leading to the social mobilization of the community for active participation in local develop-ment [ibid].
Community organizations also exist in the vicinity of the RC of Koulor. One example is the Arafat association, a partner of the Malian organization Aliniha, which aims to integrate women in the process of economic, social and cultural and environmental development to improve their living conditions. Within Ara-fat, six self-managed sub-groups carry out project activities ranging markets and gardens to producing soaps and recycling plastic. The association is also part-nered with the micro-finance institution Jekabara, which provides financial sup-port to local initiatives [PF2018]. Village committees for development and com-munity organizations such as Arafat can play a significant role in spreading

Kostin, Strauss and Tavčar
164
awareness and acceptance of renewables, specifically biogas, in and beyond rural communities like Koulor.
3.1.3 Political commitment toward renewable energies
Senegal has actively constructed a multi-layered energy policy framework, un-derlining its commitment to promoting renewable energies [IRE2013]. The gov-ernment signed the Statute of the International Renewable Energy Agency in 2009 [ibid]. Additionally, improving access to electricity and energy for clean cooking was one of the main objectives of Senegal’s poverty reduction strategy [ibid]. Finally, the Senegalese government remains committed to implementing the Sustainable Development Goals and has ratified several international conven-tions concerning environmental conservation, human rights, labor matters and transparency initiatives [NEA2017].
The major stakeholders in energy policy and projects aiming to provide clean energy for cooking are the council of ministers (responsible for major decisions regarding energy and grid electricity), the inter-ministerial committee on renew-able energy (CIER), the Ministry of Energy, the Ministry of Renewable Energy, the inter-sectorial committee for the implementation of synergies between energy and other strategic sectors (CUIMES) as well as other research and financing institutions [IRE2013].
The National Biogas Programme is a two-phased program by the Senegalese gov-ernment aimed at promoting renewable energy development [IEA2017]. It was launched on December 30th, 2009, by the Ministry of Energy and Directorate of Hydrocarbons and Domestic Fuels (DHCD) as a multi-sectoral policy framework to improve the self-sufficiency of rural households, increase energy diversifica-tion, and reduce poverty [ibid]. Under Article 2 of the Ministerial Order No. 12100, the objective of the program’s first phase was to promote the development of the biogas sector in domestic applications, and to install 8,000 biodigesters from the period of 2009-2013 in the Groundnut Basin and peri-urban region of Dakar [PNB2010]. Article 3 delegates the executive activities of the program to the National Coordination Office, which is comprised of a national coordinator, financial officer and assistant, engineers and technical specialists, marketing and communication staff, and support staff [ibid]. Article 4 and 5 delegate the roles and responsibilities of the National Steering Committee, which is responsible for overseeing the annual budget, creating an implementation strategy, and ensuring consistency and continuity with other existing policies [ibid]. Article 6 and 7 state that the management and financing of the program will require close coordination between the program leaders and international funding partners, SNV and Hivos [ibid]. The second phase of the program spans from 2015 to 2019 and has been

Implementing sustainable domestic biogas projects in Senegal
165
led by the aim of installing 10,000 biodigesters throughout the country [MPE2015].
The targets initially set in the program’s first phase were not met due to issues previously discussed. Based on the governance framework, there are few policy instruments laid out for maintaining operability, monitoring, and enhancing the technical capacity necessary to grow the biogas sector in the country. In this re-gard, the lack of an established framework for maintaining long-term biogas in-stallations raises serious concerns as to whether the National Biogas Program can be effectively implemented in the long run. From the perspective of international biogas implementation partners, the National Biogas Program has maintained a poor reputation for reliability and capacity to handle such high installation targets outlined in its framework [MasonAVSF, 2017]. Nonetheless, there have been ef-forts for Nationally Appropriate Mitigation Action (NAMA) related to domestic biogas, supported by UNEP and the Ministry of Environment, which will again support ambitious targets related to the installation of domestic digesters [MAR2016]. However, this strategy has yet to be formally approved on a national and international level [ibid].
The government has also created programs supporting agricultural activities and biofuels such as the Return to Agriculture Programme and the Specific Biofuel Programme. Finally, PERACOD, the program for the promotion of renewable energies, rural electrification and sustainable supply in domestic fuel is a coop-eration between the Senegalese government and European development partners [IEA2017]. It is currently managed by the Ministry of Energy and supports the development of rural energy access through improving policies, strengthening institutions and investing in rural electrification projects [ibid]. Additionally, the Senegalese government has established an investment code, providing tax bene-fits and favorable investment conditions to those creating new businesses, pro-vided they offer employment opportunities and are located in an underdeveloped area of the country [IRE2013]. This investment code could therefore incentivise the development of a private biogas sector.
Clean cooking initiatives are mostly carried out by the government with the fi-nancial support of international institutions, such as the World Bank, the African Development Bank and the government of the Netherlands, while private sector engagement is rather scarce [BLO2014]. Two main policy instruments are related to the biogas sector. The Lettre de Politique de Développement du Secteur de l’Energie 2012 (LPDSE) is an energy policy created to increase household access to modern energy services. The Lettre du Politique du Sous-Secteur des Com-bustibles Domestiques 2010 (LPSSCD) is a policy aiming to improve long-term supply of household cooking energy, with specific objectives to reduce forest exploitation and improve forest management [ibid].
Kostin, Strauss and Tavčar
166
The political commitment and institutional framework provided by the Senega-lese government and its regulatory bodies appear to provide favorable conditions for implementing biogas projects, as suggested by interviewee Ndiaye [2017]:
“Since biogas is a renewable energy governed by a regulatory framework in Senegal and given the existence of the PNB, there have been no difficulties or constraints (in setting up biogas pro-jects). The diffusion is more difficult, that’s something else. Be-cause the state is more sensitive to solar than to biogas.”
However, as previously mentioned, barriers have been observed, such as the in-ability to acquire sufficient government funds or public investments in the energy sector [IRE2013].
3.1.4 Environmental governance
Senegal’s environmental policy framework consists of several action plans and initiatives. The National Action Plan for the Environment (PNAE) is a strategic framework for environmental planning, which is run by the Senegalese govern-ment. The Sectoral Policy Letter for the Environment (La lettre de politique sec-torielle de l’environnement) reviews the conditions of environment and natural resource use in order to align national policy with sustainable development tar-gets. Additionally, policies on production and consumption patterns as well as water and sanitation have been established [SEN2009]. The management of rural forests, specifically important to the livelihood of the Tambacoundan population, is regulated through the 1998 forestry code, which has transferred some forest management rights and the harvesting of timber to local authorities [JUS2015]. Important actors in this area are the World Bank, USAID and their implementing agencies, as well as the Government of Senegal’s Ministries of Energy, Finance and Environment [ibid].
In order to ensure that the forest is used in a sustainable way, USAID collaborates with the United States Forest Service (USFS), the government of Senegal, and rural communities, including the RC of Koulor, to set up the management plans for the community forests (FMPs) [USA2008]. Although initially some locals were reluctant to accept FMPs, fearing that too much grazing area would be lost, they later agreed to the ecological benefits of the plans and accepted their imple-mentation [ibid].
Despite the fact that decentralization has shifted local power balance from tradi-tional towards modern institutions, dynamics in extraction practices have not un-dergone any significant changes [POS2003]. Patrons involved in cutting down trees for charcoal production still need to obtain permission from the rural council president and traditional leaders [ibid]. The national government’s forestry ser-

Implementing sustainable domestic biogas projects in Senegal
167
vice plays another important role, as it still holds control over the issuing of li-censes and permits for cutting down trees and producing charcoal [POS2003; WUR2010].
The health of local forest ecosystems is still largely vulnerable to the extensive illegal cutting of the trees and charcoal production, which are usually ignored by the council representatives, since they partake in and financially benefit from these practices [POS2003]. One of the first approaches to promote more sustain-able management of forests in the 1970s included the introduction of fixed char-coal quotas and a limitation of the charcoal production period to a few months during the dry season, which was intended to lead to a change in farmers’ prac-tices [USA2008; POS2003]. In general, the traditional methods of charcoal pro-duction have become more efficient, however, the overall situation has not im-proved significantly [USA2008]. For example, in the community forest of Kou-lor, charcoal production remains an environmental problem, characterized by large energy losses, which further exacerbates deforestation in the area [ibid]. In these types of rural communities there is often no guidance or incentive which would encourage operators to use more sustainable practices when producing charcoal, especially because reforestation is not seen as an obligatory action for the operators but rather as an extra source of income for those who have set up the plantations [ibid].
Overall, customary law and autonomous jurisdiction of rural communities have also led to increased awareness for sustainable land management [USA2008]. Measures are being taken by community-level organizations and youth groups to put an end to transhumance or pastoralism within their lands, a practice that con-tributes to loss of vegetation and deforestation [ibid]. Grassroots support for more sustainable livestock management is a key factor of success in a biogas program, as manure collection from livestock requires more sedentary (i.e. use of animal shelters) or intensified management systems [ibid]. The New Sectoral Initiative for Livestock Development (NISDEL) action plan implemented in 2004 supports livestock assets, sustainable production systems, and intensified production [SEC2016]. They have established a funding program, known as FONSTAB, to support the building of animal sheds in rural areas [ibid]. Other programs set in place include the National Program for Livestock Development (PNDE), estab-lished in 2013, which aims to support health, food availability, infrastructure and management of livestock through involvement of all stakeholders (farmers, live-stock experts, private companies, and other institutions) [SEC2016]. Despite the existence of these laws, soil degradation and forest clearance have continued to damage the environment [USA2008].
Another strategy for preserving natural resources and preventing the over-exploi-tation of forests, bushfires and consequent deforestation in Tambacounda has been the promotion of renewable energy sources, with biogas representing an

Kostin, Strauss and Tavčar
168
important alternative [ibid]. According to the Colonel Papa Assane Ndiour, the regional inspector for Water and Forestry, the PNB-SN program is of high im-portance in the region of Tambacounda since the initiative leads to the protection of forests while allowing the region to continue its production [‘500 BIO-DI-GESTEURS’2016].
Corruption is an issue that is rampant in the charcoal sector. According to Jusrut [JUS2015] “informal transactions of influence, gifts, money, and illegally ma-nipulating administrative procedures” involve members of forest management, rural councils as well as charcoal producers. Interviewee Wurster [2017] con-firmed:
“There’s always conflict with the forest departments. Forest de-partments [...] are known for being corrupt, and just taking ad-vantage of the situations. And in Senegal [...], in the charcoal industry, that’s where the forest department makes a ton of money under the table. And that’s where the most amount of conflict is, [...] there’s an actual mafia ring in Senegal that con-trols the entire thing, but they’re very much in cahoots with the government. Because there’s a cap on the amount of charcoal that can be produced each year as a quota, and that quota typi-cally doesn’t change much, even though demand has increased substantially. So, the black market is huge on it, and the forest department and the mafia profit from it, where the people pro-ducing it at the local level don’t at all.“
Therefore, non-state actors play an important role in environmental governance in terms of participation, control, support, advice or resistance [SEN2009].
In Tambacounda, power asymmetries and conflicts between villagers and char-coal merchants are common [WUR2010]. This is why Wula Nafaa, a USAID-funded resource management program, has assisted in creating local conventions for resource and land use, supported by state and donor agencies [FAY2017]. However, these conventions have been criticized as being created on the grounds of inequality between government, NGOs and villagers, ignoring local interests and norms [ibid]. As a result, local resistance to regulations and rules is common-place. Sometimes, only rules matching local norms and habits are applied. Reg-ulations that disadvantage locals in accessing resources, or that are not in accord-ance with local resource management techniques are rejected [ibid].
The fact that the Senegalese government is showing increasing concern for envi-ronmental issues and a commitment to improving environmental governance pro-vides a favorable outlook for renewable energy and clean cooking projects, such as those involving domestic biogas technology.

Implementing sustainable domestic biogas projects in Senegal
169
3.2 Environmental Factors
3.2.1 Geographical location
Tambacounda is the largest region in the country, situated in the most eastern part of Senegal on the Sahelian plain [BLO2014; POS2003]. The terrain of the region is mostly flat with some hills in the department of Bakel [ANS2015]. Its landscape is characterized by many water bodies, with most of them being only temporary [ANS2015]. Tambacounda has a very important hydrographic net-work consisting of three main rivers (Senegal River, Falémé River and Gambia River) and their converging tributaries, with an annual river flow of around thirty billion m3 [ibid]. Specifically, in the RC of Koulor, intermittent rivers flow into the Sandougou ponds and into the Gambia River, forming a rainwater network that allows cattle to drink for a period of six to seven months [SEM2011]. Tem-porary water bodies make up the largest percentage of surface waters in the RC and are widely used by the inhabitants, since the existing water infrastructure to provide water for the livestock is insufficient [ibid]. However, their existence is restricted to a short period of time and they usually dry out by December [ibid]. As a consequence, groundwater resources represent an important asset, especially during the dry season, when the surface waters become scarce [ibid]. The ground-water is dependent upon rainfall and is exploited to provide water through the use of wells [ibid].
Geographical location and environment play a major role when deciding on the design of the biodigester to be installed [GUP2014]. However, according to Ami-gun and Blottnitz [AMI2010], the expenses associated with biogas plants do not depend necessarily on their geographical location, since a prevailing number of small and medium size biodigesters are constructed using regionally available building materials.
3.2.2 Climate and weather conditions
The region of Tambacounda has a tropical climate defined by a rainy and a dry season, which are caused by the northeast winds in the winter and the southwest winds in the summer [HEG2007]. The humid season lasts from June to October with the rainiest months being August and September, and the dry months lasting from November to May [BLO2014; ANS2015]. Tambacounda receives some of the highest levels of annual rainfall in all of Senegal [ANS2015]. The number of rainy days and the quantity of rainwater decreases going from South to North [ibid].
The average temperature in the region is approximately 29°C [CSC2016], mak-ing it suitable for biogas production. The period with the lowest temperature lasts from July to February, with a minimum average of 25-28°C and the coldest

Kostin, Strauss and Tavčar
170
months being December and January [SEN2009]. The period with the highest temperature is between March and June, when the maximum average temperature reaches around 29-33°C [ibid].
Water shortages, frequently encountered in the villages [Ndiaye, 2017], are one of the main limitations for optimal operation of a biodigester plant [AMI2010]. Although the availability of water may not be an issue during the rainy season, water shortages can become problematic during the dry season, especially if the water supply is far away [ORS2014]. In general, Senegal has been facing an on-going problem of reduced precipitation and water scarcity over the years [HEG2007].
3.2.3 Climate change
In the past ten years, the region of Tambacounda has been greatly affected by unpredictable weather conditions with irregular rainfall, recurrent droughts and changes in the rainy season [FAL2015]. Over the last thirty years, average yearly temperatures in Senegal have increased at a rate of +0.28°C per decade [CSC2016]. The level of precipitation in the region has lowered over the same period, contributing to changes in vegetation, which in turn is further exacerbat-ing the low rainfall [WUR2010].
Consequently, a large proportion of the forested lands in the department of Gou-diry has been transformed into savannas, with the most significant change ob-served along the border between Goudiry and Bakel [MIL2014]. Senegal has been repeatedly affected by floods (2010, 2012, 2013) and droughts, although the latter occur on less regular basis [CSC2016]. Nonetheless, droughts have a more disastrous effect on the population (i.e. a drought in 2011 affected almost 1.3 million inhabitants in Senegal and Gambia) [ibid].
Projections for Senegal forecast an even further increase in the annual mean tem-perature levels by 2085, with a very likely temperature change ranging from +1.0 to +5.3 °C (see Table 2) [CSC2016]. Heat waves are expected to become longer lasting and could range from +8 to +88 days in the most likely scenario, with the duration of cold spells’ reduced significantly [ibid]. Most global climate model projections also predict longer durations of dry spells and a higher intensity of heavy rainfall events [ibid]. A decrease in annual precipitation levels is expected with a significant relative change in the duration of the dry season; the most likely scope of projected change ranging from -41 to +33 % [ibid].

Implementing sustainable domestic biogas projects in Senegal
171
Table 2: Projected temperature change [adapted from CSC2016] Scenario Measure Maximum Temperature Minimum Temperature
All Likely
Very likely
+1.3 to +3.9
+1.1 to +4.8
+1.3 to +4.8
+1.0 to +5.4
Low Median
Likely
Very likely
+1.2
+1.0 to +1.6
+1.0 to +1.8
+1.3
+1.0 to +1.7
+0.8 to +2.0
Medium Median
Likely
Very likely
+2.3
+1.8 to +2.7
+1.7 to +3.3
+2.3
+2.1 to +2.8
+1.8 to +3.3
High Median
Likely
Very likely
+3.8
+3.4 to +4.8
+3.3 to +4.8
+4.8
+4.1 to +5.3
+3.9 to +5.9
Warming tresholds Below 2°C +1.0 to +1.8 +0.8 to +2.4
Above 2°C +3.4 to +4.8 +4.2 to +5.8
The negative effects of the ongoing exploitation of ecosystems and climate change can already be seen in the process of soil degradation, which is resulting in a decline of productivity and a sharp reduction in national crop yields [ANS2015]. The latter is expected to lead to higher prices of food, which will predominantly affect poor people, making them the most vulnerable to climate change [GOL2014]. A decrease in food supply might lead to problems of malnu-trition, with possible conflicts arising between livestock owners and farmers be-cause of water and agricultural land scarcities [ibid].
3.2.4 Importance of forest and deforestation
Due to the high level of precipitation, 45 % of Tambacounda is covered with forests [ANS2015; MIL2014; USA2010]. The use of forest in the department of Goudiry includes firewood exploitation, woodworking, production of charcoal, and harvesting of non-timber forest products [ANS2015]. The production of charcoal has slightly decreased between 2013 and 2014, while the collection of deadwood for cooking has seen a dramatic increase of almost 159 % in the de-partment (change expressed in m3 of wood collected) [ANS2015].
Although it is illegal to harvest timber for sale or for charcoal production in a prevailing number of government managed forests, it is still carried out, most of the times by the people who are not coming from the surrounding villages [WUR2010]. There are as of yet no reliable figures on the annual consumption of charcoal in Senegal, however, according to the numbers by SIE (Système d’In-formation Energétique du Sénégal), it accounted for 490,000 tons in 2007 [as cited by HRU2011]. In general, the amount of charcoal being produced in the

Kostin, Strauss and Tavčar
172
country has increased, and since the government stopped subsidizing LPG, households have once again returned to using charcoal for cooking, threatening the diminishing natural resources [USA2008].
Deforestation in Tambacounda is occurring at an annual rate of 0.5 %, and has already led to the extinction of local varieties of fruit trees, thus making the har-vest of non-timber products impossible in some parts of the region [USA2010; WUR2010]. Interviewee Wurster [2017] pointed out that there are very few, if any, big trees of timber value left in the area, as all of mahogany and ironwood were already depleted 10 years ago. Research carried out by Subedi et al. [SUB2014] found that the use of biogas could lead to a decrease in energy de-mand from woodfuel, followed by a significant decline in total deforestation rates.
3.2.5 Pollution
Senegal’s greenhouse gas (GHG) emissions amounted to 31.65 Mt CO2 in 2011, which represented 0.07 % of global GHG emissions at the time [USA2016]. Sen-egal’s total GHG emissions increased by 1.5 % on average per year in the period between 1990 and 2011 [ibid]. The biggest contribution in 2011 came from agri-culture (36 %), followed by the energy sector (27 %), land-use change and for-estry emissions (22 %), waste (9 %) and industrial processes (7 %) [ibid]. A sig-nificant proportion of GHG emissions in the agricultural sector can be attributed to manure storage, which leads to high methane emissions, making it one of the largest sources of pollution in the sector [Thrän, 2017]. In the energy sector, the largest share of GHG emissions (62 %) is represented by other fuel combustion and transportation emissions [USA2016]. The sector has also seen the largest average annual increase in emissions (4.6 %) [ibid]. This makes biogas an im-portant alternative, since it can offset pollution caused by some of the other in-dustries, and directly decrease the emissions from the combustion of other fuels, such as wood or charcoal.
The region of Tambacounda has been greatly affected by pollution and other dis-turbances, which are affecting both the environment and the population [ANS2015]. So far, no reliable indicators and appropriate measurements to de-termine the levels of pollution in the region have been utilized [ibid]. However, the results of empirical observations have shown significant levels of contamina-tion [ibid]. For example, the practice of dumping trash straight into the river Sen-egal has led to a visible problem of river pollution [SEN2009].
Contamination of the region has also been observed in farming areas, where there is almost no control over the use of pesticides and artificial fertilizers, leading to the misuse of chemicals by farmers when cultivating their lands [ANS2015]. The increasing use of chemical fertilizer is a possible reason for soil fertility losses

Implementing sustainable domestic biogas projects in Senegal
173
[HEG2007]. The use of chemicals in combination with decreasing precipitation is leading to a decline in food production, raising concerns for food security in Senegal [ibid].
The absence of a working waste management system is a major environmental problem and a large source of greenhouse gas emissions [ANS2015]. There is only one provisional landfill in the region, which means that the majority of households either dispose of their waste in nature or they simply burn it [ibid]. There is no collective sewage treatment system in Tambacounda, thus the dis-posal of wastewater is done using individual networks of latrines or septic tanks [ibid]. Most households discharge their wastewater and excrement in small pits on the street, which is negatively affecting the environment and quality of life [ibid]. Additionally, in the RC of Koulor, a survey among seventy-eight plots (involving 183 households) concluded that only fifteen (19 % of all the plots in-terviewed) were equipped with latrines [SEM2011]. Consequently, in 81 % of the cases, inhabitants had no access to their own sanitation facilities and were bound to practice open defecation, or use neighbouring latrines [ibid].
The use of biogas has various environmental benefits [RAK2013]. If biodigesters are operated in a proper manner, they could reduce the negative impacts of global warming [BRU2014]. Biogas technology also diverts greenhouse gas emissions from being released into the atmosphere and offsets the emissions caused by the release of methane from cow manure [ibid]. At the same time, poor installation or the misuse of biodigesters can also result in certain adverse environmental outcomes with the unwanted releases of GHG [ibid].
Another possible environmental nuisance is related to the production foul odor from manure and slurry [BIA2014]. These unpleasant smells could appear if the biogas plant is not equipped with an anti-odor system or if there are leaks in the biogas plant because of poor maintenance [ibid].
Bio-slurry could also cause environmental problems if not properly discharged. In general, farmers do not dispose of manure into surface water, however, with the production of biogas this might change [HEG2007]. When bio-slurry is not needed as a fertilizer, a higher risk of improper disposal in the sewage system might arise, which would increase water contamination, especially in more pop-ulated areas [ibid].
3.2.6 Land use patterns
The households in the department of Goudiry are engaged in agro-sylvopastoral practices, however, in comparison to the inhabitants living in the northern parts of the country, they also depend on the forest and its products [MIL2014]. Sene-gal is, like many developing countries, experiencing a rapid population growth

Kostin, Strauss and Tavčar
174
[WOO2004]. Although a lot of citizens are moving from rural to urban areas, it is expected that the demand for cultivable areas will further increase [ibid]. One of the main factors influencing land use patterns and consequent alterations in land cover is the growth of the agricultural sector [ibid]. According to Wood et al. [ibid], the amount of land used for agricultural purposes is increasing, with more people focusing on active farming or following a short-term fallow system. The transformation from natural vegetation areas into cultivated lands is taking place all around the department, with more grasslands appearing in the northern part and around the city of Goudiry [ibid]. Agricultural expansion is leading to deforestation and consequent releases of carbon, which is especially troubling in the vast forest-covered regions of the southern Senegal [ibid]. Taking all dis-cussed environmental factors into account, it becomes obvious that there is a clear need for renewable energy solutions, with biogas representing one of the most fitting options.
3.3 Social Factors
3.3.1 Social groups and their agricultural practices
Senegal is home to a variety of ethnicities. The largest ethnic groups are Wolof, Fulani, Tukolor, Serer and Mandinka [BLO2014]. Some other communities ex-ist, but are comparatively small in size [ibid]. In Tambacounda, Fulani, Wolof and Mandinka make up the three largest ethnic groups [WUR2010]. However, the population of the RC of Koulor consists mainly of Fulani peoples, followed by Bambara (who are a sub-group of the Mandinka) and Soninké [SEM2011].
French has been Senegal’s official language since the colonial times, however, it is only spoken by a literate minority [HEG2007]. In Tambacounda, dominant language communities are Pulaar (spoken by the Fulani), Mandinka (spoken by the Mandinka), and Wolof (spoken by the Wolof) [DIA2010].
While larger villages tend to contain a diverse group of people, villages with fewer than several hundred inhabitants usually consist of only one ethnic group [WUR2010; Wurster, 2017]. The RC of Koulor is made up mainly of villages with less than five hundred inhabitants [SEM2011]. Therefore, it is likely that a dominant ethnic group prevails in most villages, as suggested by interviewee Wurster [2017]. However, even in larger villages, the majority of the population is usually made up of a single ethnic group [ibid].
These ethnic groups equally rely on agriculture as their main source of income, yet their agricultural practices differ, especially in regard to land use [ibid]. Fu-lani communities are more likely to be active in pasturage, as they are by tradition a nomadic, pastoral community [ibid; HEG2007]. Different sub-groups of Fulani

Implementing sustainable domestic biogas projects in Senegal
175
exist in Tambacounda; most of them herd cattle, goats and sheep, and are to some extent involved in farming activities [WUR2010].
Wolof, Mandinka, Bambara as well as Soninké are typically involved in tradi-tional agriculture [ibid; CHA1992]. Many households also own livestock such as goats, sheep or poultry [WUR2010]. Since a large majority of the Senegalese population is Muslim, the rearing of pigs is not common [USD2016]. Farming and pastoral activities are carried out to fulfill household nutritional needs and small quantities may be sold at local markets [WUR2010]. Additionally, Tamba-counda is a large producer and exporter of grains such as corn, millet and sor-ghum, as well as peanuts [ANS2015].
The forest and bush outside of the villages is very important for the local inhab-itants and represents an essential part of their daily lives [WUR2010]. It is pre-dominantly used for cattle grazing, hunting and collecting forest products [ibid]. Craftwork represents another important source of income for the Tamabcoundan population [WIS2015]. Most importantly, local populations use wood as a cook-ing fuel. The dependency on wood as the sole form of cooking energy can be explained by the fact that it is free and accessible, despite villagers expressing the wish not to have to return to the forest for wood collection on a daily basis [WUR2010]. The considerable reliance on rainfed and subsistence agriculture puts many households in a vulnerable economic position [SEC2007]. The irreg-ularities of income due to varying agricultural yields is threatening food security and forcing villagers into charcoal production [WUR2010].
Local communities often have strong objections to the harvesting of wood for charcoal production [ibid]. This is due to the fact that the charcoal industry not only leads to severe deforestation and reduces the carbon sequestration capacity and biodiversity of the local ecosystems, but also worsens the quality of soils and leaves rural areas degraded and impoverished [ibid; WB2007]. Locals have no-ticed a loss in forest cover, as the distance travelled between forest and village in order to collect firewood has increased [FAY2017]. They identified forest fires, clearance for agriculture and the cutting down of trees for charcoal by migrant workers employed by urban Senegalese merchants as the main factors contrib-uting to forest loss [ibid].
Villagers in the region of Tambacounda understand the significance of the forest for regulating the climate and have observed how it affects the levels of precipi-tation and the weather conditions [WUR2010]. They are aware that the forests play a role in mitigating climate change and storing carbon [‘TAMBA-COUNDA’2016]. Nonetheless, villagers depend on charcoal production as a source of income when agricultural yields are low [WUR2010].

Kostin, Strauss and Tavčar
176
3.3.2 Households
The average household size in Senegal varies significantly between rural areas and cities. While the average urban household consists of seven members, rural households usually consist of ten members or more [ANS2014]. In the RC of Koulor, this average rises to 12.7 people per household [SEM2011]. In some cases, families can consist of up to seventy people [MasonAVSF, 2017]. Approx-imately half of all Senegalese women live in polygamous marriages, where the husband is permitted to have up to four wives [USA2010]. Wives are generally expected to live with their husband and the husband is considered to be the head of the household [ibid].
Typically, village housing is made up of compounds containing small houses, which are constructed from clay bricks [WUR2010]. It is typical to have one cluster of houses where family and extended family live [Wurster, 2017]. Often, a community garden maintained by the women of the village is used to grow cassava, potatoes and other vegetables [WUR2010].
Women are responsible for nearly all household activities [BLO2014]. They are the primary wood collectors, spending up to 3.1 hours per day collecting dead-wood from nearby forests and the bush, while covering an average distance of 2.3 km [ibid]. They often carry more than 20 kg of wood during one trip [SEC2007]. Additionally, women are in charge of preparing all family meals [BLA2006]. Cooking is one of the most time-consuming activities carried out by women [ibid]. This is especially true for the preparation of lunch and dinner, as breakfast usually does not consist of a cooked meal [ibid]. All in all, meal prep-aration can take up to seven hours per day [HEG2007]. Biogas has the potential to cut cooking time in half, freeing up a significant amount of time for women to participate in income-generating activities outside the home or leisure activities alike [BIA2014]. However, according to interviewee MasonAVSF [2017], the tasks of feeding and maintaining a biodigester would also be assigned to women and children.
3.3.3 Education
There is no widespread access to education in Tambacounda, resulting in an il-literacy rate of 73.5 %, specifically 79.8 % for women and 67 % for men [ANS2014; ANS2015]. The RC of Koulor has fourteen elementary schools in the villages of Dambamba, Koulor, Diamaguène, Inalamoustahina, Madina Touate, Rabia, Sinthiou Diaobe, Sinthiou Hamath Ali and Waly Babacar, as well as one middle school [SEM2011]. Access to education in the community is therefore strongly scattered and characterized by the isolation of certain villages from school sites [ibid]. In the entire Tambacounda region, eleven professional and

Implementing sustainable domestic biogas projects in Senegal
177
technical training facilities exist [ibid]. However, none of these facilities are lo-cated in the RC of Koulor, or within the Department of Goudiry [ANS2015]. It can thus be assumed that knowledge about renewable technologies and their con-struction is very limited in the community.
As emphasized by interviewee Wurster [2017], more educated people often move to the cities of Tambacounda, Dakar, Kaolack or Ketagu, where more opportuni-ties to attend secondary schools or universities exist. Some end up leaving Sene-gal to go to France, sending money back to the villages [ibid]. This enables locals to invest in their properties: “[...] if it’s a really nice cement house, you know they (the villagers) have a relative, probably an immediate relative who’s outside the village [...], probably outside the country” [ibid].
While formal education facilities are scarce, non-formal education as well as tra-ditional knowledge have accumulated through experimentation and observation and have been passed down through generations [KRE1990]. Both formal and informal education can contribute to awareness about environmental, social and economic issues, thus serving as a driver for development [ibid]. Additionally, community members with non-formal education are likely to participate and take on leadership positions in community organizations and activities, and can in this way become agents of change [KUE2005].
3.3.4 Household buying decisions
The traditionally male head of the household is often in charge of family expend-itures [HEG2007]. As the male head of household may decide on significant in-vestments such as clean cooking fuels, despite the fact that women and children would in fact be the main beneficiaries of these technologies, a principal-agent problem might occur when trying to promote a biogas program [ibid]. Recently, a biogas feasibility assessment in a rural region of Western Senegal revealed that women and men are increasingly making household buying decisions together, potentially alleviating, if not resolving, this problem [BLO2014]. Interviewee Wurster [2017] confirmed that decision-making in the household is a joint un-dertaking. While men are usually in charge of bigger household purchases, women are responsible for managing daily expenditures such as produce bought at markets [ibid].
3.3.5 Health and social issues related to the use of traditional fuels
All rural Tambacoundan households surveyed by Bloomfield et al. [BLO2014], voiced discontent with their current cooking fuel. One of the biggest issues men-tioned were the time taken up by meal preparation, as well as exposure to smoke.

Kostin, Strauss and Tavčar
178
Additionally, high fuel consumption was one of the reasons mentioned for dis-satisfaction. Cost seemed to be of minor impact, which can be explained by the fact that fuel is mostly collected and not purchased [ibid].
According to Bloomfield et al. [ibid], 80 % of rural households expressed a wish to use an alternative type of cooking fuel, specifically biogas, and named time saving, both in terms of cooking and collecting fuel, as a primary incentive for switching. Additionally, cleanliness and smoke reduction were among the main reasons for choosing alternative cooking fuels [ibid]. Although of lesser impact when deciding for an alternative cooking fuel, indoor air pollution should not be underestimated, as it poses one of the greatest threats to public health, particularly to women and children [UND2005].
Interviewee MasonAVSF [2017] confirmed the main incentives for switching fuels:
“The economical aspect was for sure one of the main goals […], maybe as well the reduction of the workload for women and kids who are the ones who need to gather wood every day, which takes them several hours during which they could be doing something else. Also, suppression of wood or charcoal smoke in the kitchen is a big advantage, being able to enter the kitchen and not start coughing immediately or smell of smoke later was one of the things that women were complaining a lot about be-fore.”
Several researchers have emphasized the severe impacts of energy poverty on the education and economic opportunities of women and girls [SEC2007]. The divi-sion of labor disadvantages women and girls to a point where fewer girls are able to attend school, as they are involved in time-and labor-intensive tasks such as wood and manure collection as well as food preparation [ibid]. The extent of time taken up by these household activities depends on the number of family members involved and also on the season and availability of resources [ibid]. It can be assumed that by adopting the use of clean cooking fuels, girls would be provided with better opportunities to receive education, while women would be able to increasingly participate in economic activities outside the home [BLA2006]. Currently, the RC of Koulor is not connected to an electric grid [SEM2011]. This constrains the activities that can be carried out at evening or nighttime, such as studying [SEC2007]. Biogas could provide lighting as an additional benefit for households without access to electricity.
Increased inequality between households who use biogas digesters and those re-lying on traditional fuels could cause tensions in social dynamics, especially in rural villages that are rather close-knit [HUB2007]. However, interviewee

Implementing sustainable domestic biogas projects in Senegal
179
Wurster [2017] highlighted that there is a strong sense of solidarity between vil-lagers, as people tend to know each other well due to the size of most villages. Interviewee MasonAVSF [2017] confirmed this observation by pointing out that wealthier families would commonly provide food for the less fortunate, such as street kids. Regardless, socio-economic differences within rural communities seem rather insignificant [Wurster, 2017]. Interviewee Wurster [2017] also added that when conflicts do arise, village chiefs are usually the ones to resolve the dispute, as they have decision-making authority and the right to control the allo-cation of land. Significant conflicts or violence are rarely observed, as confirmed by interviewee MasonAVSF [2017]:
“(…) no social tensions have been noticed, even more: neigh-bors would come over to see how the work is done and were congratulating us for acting against excess wood harvesting and bringing new technologies to their village. They were also say-ing that they would like to try and do the same thing at their place.”
Nonetheless, minor conflicts can arise, especially when multiple connections to a biogas digester or communal digesters are established. These can create major technical, social and operational challenges, and should therefore only be at-tempted in villages that have had previous success and experience with biogas [STO2010]. Furthermore, interviewee MasonAVSF [2017] highlighted:
“Installing biodigesters for groups of families could lead to ten-sions between families since a certain family has more cattle than the other which leads to questions on who feeds the biodigester more, who can use more gas and ends up in abandoning the use of the biodigester or even worse-issues between the families.”
Interviewee MasonAVSF [2017] also explained that community-based biogas projects that have been installed in schools and communal centers were only vi-able because “these structures are working on a relatively strict hierarchy system with established rules, which prevents any further conflicts about the feeding and the use of the biodigester and its maintenance.”
3.3.6 Awareness and acceptance of biogas technology
Although biogas is not entirely new, neither to Senegal nor to Tambacounda [Ndiaye, 2017], many communities have never heard of the technology [Ma-sonAVSF, 2017]. How they perceive the technology will therefore depend on the individual household and the benefits biogas can provide [Ndiaye, 2017]. Inter-viewee MasonAVSF [2017] explained:
“Locals had no idea about this technology but were very inter-ested and enthusiastic when possible benefits were explained,

Kostin, Strauss and Tavčar
180
especially when they learnt that the association would cover a big part of the costs”.
This statement highlights the importance of a well-adapted financing scheme, as socio-economic characteristics have a strong impact on the adoption of biogas technology [NIS2016].
As reported by interviewee Ndiaye [2017], technologies that allow access to do-mestic energy are well perceived by villagers. There is a sense of openness to-wards development projects, especially if they are funded and provide benefi-ciaries with economic benefits [Wurster, 2017]. However, interviewee Wurster [2017] emphasized that changing behaviors and lifestyles takes a long time, which villagers acknowledge. Since only a few NGOs, whether local or foreign, operate in the area, those who do usually become well known and appreciated by communities [MasonAVSF, 2017].
The question of whether or not households would be accepting towards the use of human waste matter as an input fuel has not sufficiently been answered in research relating to Senegal [HEG2007]. As pointed out by interviewee Ndiaye [2017], psychological barriers exist. However, connecting latrines to biogas di-gesters could provide significant economic, environmental and social benefits through sanitation and wastewater treatment, as open defecation remains a seri-ous threat to public health in the RC of Koulor [HEG2007; SEM2011]. Success-ful examples from other regions have shown that a special emphasis needs to be placed on sensitivity towards the local population and the environment these pro-jects are undertaken in [KHA2013]. Certainly, a central step in promoting ac-ceptance of pit latrines would be communicating the mentioned benefits [ibid].
It has been made clear that there has been both a greater awareness for and usage of animal manure as an input fuel for biogas digesters and as a fertilizer [HUB2007]. This can be explained by the fact that most households own live-stock and are thus accustomed to handling manure [HEG2007]. Nonetheless, many farmers prefer industrial fertilizer [ibid]. Since bio-slurry is highly effi-cient, it could potentially serve as a replacement, thus providing an additional incentive for using a biodigester [ibid].
The locale-specific factors identified in this section should be taken into account when implementing a biogas project in any rural area. Inhabitants of Tamba-counda are not widely aware of biogas technology, which may represent a major barrier. However, the strong sense of solidarity among villagers, along with the many potential benefits that could be provided by biogas, may enable socially-acceptable biogas projects to be implemented in the region.

Implementing sustainable domestic biogas projects in Senegal
181
3.4 Technical Factors
3.4.1 Domestic biodigesters
Some of the largest barriers to long-term success of biogas programs in sub-Sa-haran Africa have included a lack of coordination in technical support, poor in-stallation and maintenance, and outdated digester designs [AMI2012]. In order to increase the use of clean cooking with biogas, it will be necessary to under-stand how the technical feasibility, installation, operation and long-term perfor-mance of biodigesters can be suited to the needs and expectations of the owners.
As of 2007, Tambacounda had a total of 414,074 cattle with an average of 13.7 cattle per agricultural household, and a total number of 20,548 households eligi-ble for a domestic biogas digester [HEG2007]. Currently, the most common household biogas systems used in developing regions are the fixed dome and floating dome biodigesters, with livestock manure being the primary source of feedstock [AMI2012]. These systems permit the use of local resources for energy input and bio feedstock, and are otherwise cheap, easily manageable systems, requiring no mechanical instruments or temperature controls [ALS2008].
Fixed dome biogas plants require daily additions of feedstock and daily removal of digestate [ALS2008]. Sediments such as sand and minerals that accumulate in the waste must be manually cleaned out from the tank two to three times per year [ibid]. These digesters contain a gas chamber, fermentation chamber, inlet and effluent pipes (see Figure 1 above) [KUM2015]. Biogas accumulates in an upper gas chamber while waste accumulates in the fermentation chamber [ibid]. As the gas expands, air pressure increases and digestate is forced into the effluent cham-ber, which can then be collected and used as an organic fertilizer [ibid]. These digesters can be made of cement, reinforced concrete, stones, clay and bricks [HEG2007].
The floating dome digester is also built underground, however, digestate is col-lected from the bottom of the chamber, while the gas collection unit is a vertical floating tank (see Figure 1) [ALS2008]. Gas pressure causes the floating unit to rise and fall accordingly, while slurry is collected through an outlet pipe [ibid]. It can be made of brick or reinforced concrete, while the upper floating drum is typically made from steel or plastic [KUM2015].

Kostin, Strauss and Tavčar
182
Figure 1: Design of different digester types [adapted from Als2008]
In both systems, gas is collected from the top of the dome, and a separate unit consisting of pipes, a gas pump, gas meter, pressure regulator, and condensate drain permits the biogas to be removed and processed so that only methane is left, which is then used for cooking and lighting applications [KUM2015]. Fixed dome biogas digesters can be made according to a variety of different models, materials, and improvements on past designs, however, they share the same basic features as previously described. This type of digester is highly popular in biogas programs in Africa and other developing countries; successful projects have in-cluded the installation of over 2,700 fixed-dome units in Rwanda, 3,300 in Tan-zania, 4,900 in Kenya, as well as over 250,000 units installed in Nepal [RAK2013; SNV2006]. The fixed dome model provides many well-documented benefits that make it suitable for Tambacounda’s rural communities, such as its long lifespan of up to twenty years, the opportunity to create local employment

Implementing sustainable domestic biogas projects in Senegal
183
through the use of unskilled labor, negligible operation costs, and the stabilized environment due to its underground construction [NIS2016; SNV2006].
Although floating drum digesters provide additional benefits such as constant gas-pressure output and easier visibility of gas production, they are substantially more expensive than fixed-dome digesters, prone to shorter lifespans due to cor-rosion of the steel drum, and are rarely used in modern-day installations [RAK2013]. Thus, the remainder of this technical assessment will assume that the biodigester of interest to the implementing organization is a fixed-dome model.
3.4.2 Substrates
As previously discussed, the natural process of biodegradation exploited by bio-gas technology enables a large variety of organic matter to serve as a suitable feedstock. Inputs such as crops, agricultural residues, and sewage sludge are known as lignocellulosic feedstock, and contain a complex and tightly intercon-nected network of cellulose, hemi-cellulose and lignin [MAT2003]. Due to their complex structural arrangement, lignocellulosic feedstock often requires pre-treatment or co-digestion in order to promote degradation and increase the biogas yield [ibid]. In contrast, feedstock with a high content of proteins, fats, and car-bohydrates are much easier to digest [ibid]. Manures, which are typically used in domestic rural installations or livestock facilities, are an ideal raw material source for biogas production, as they contain all basic nutrients needed by bacteria, and have a high buffering capacity due to the presence of ammonia [LUO2011; ESP2012]. Lastly, municipal and industrial raw materials can include a wide va-riety of by-products such as wastewater and organic fractions of municipal solid waste (OFMSW); however, their quality is dependent on the waste treatment, time of year, method and site of collection [LUO2011].
Ultimately, cow manure is considered the ideal substrate for calculating the po-tential of biogas production compared to other livestock [CHÁ2016]. Cows pro-duce a large quantity of daily manure in comparison to other livestock, and have the largest overall global biogas, methane, energy potential and nutrient recovery potential [ibid]. Due to the large number of livestock and agricultural production within the RC of Koulor, the technical potential of manure-based biogas digesters in this region is high. As of 2010, the agro-centric rural community consisted of 1,017 households distributed throughout forty-five smaller villages, with an esti-mated 16,063 cows, 15,499 goats, 13,108 sheep and 1,026 horses [SEM2011]. Assuming that a 4m3 household digester would require either two cows or twenty goats, there is a theoretical potential for 774 biogas digesters to be supplied by goat manure and more than 8,000 to be supplied by cow manure.

Kostin, Strauss and Tavčar
184
The production of biogas from different forms of feedstock is highly dependent on the fraction of organic content in dry matter, the carbon to nitrogen (C/N) ratio, rate of decomposition, and bioavailability for microorganisms [MAT2016]. Although manure has the lowest biogas yield when compared with agricultural residues and industrial waste, it is an ideal substrate for domestic applications, as it is continuously available from livestock, and does not require pre-treatments or expensive mechanical controls that are required for high-lignocellulosic sub-strates in commercial applications (see Table 3) [ibid].
Table 3: Biological methane potential (BMP) [adapted from LUO2011] Manure TS (%) VS (% of TS) Ntot (% of TS) BMP (m3/tVS
added) BMP (m3/tFM added)
Cow, liquid 5-14 75-85 3-6 120-300 10-20
Cow, solid 17-25 68-85 1.1-3.4 126-250 24-55
Pig, liquid 4-10 75-86 6-18 180-490 12-24
Pig, solid 20-34 75-81 2.4-5.2 162-270 33-39
Poultry, liquid 32-65 63-80 3.1-5.4 150-300 42-156
TS= total solids, VS= volatile solids, Ntot= total nitrogen, tFM= total fecal matter
Additionally, manure is a suitable raw material input in rural domestic systems, because it contains vast quantities of microorganisms and enzymes that facilitate the process of decomposition [ESP2012]. Although solid cow manure has low biological methane per volume potential in comparison to other livestock, it is the most widely available in the RC of Koulor [LUO2011]. Households could also use human manure and manure from other livestock, however, a significant amount of time would be required to collect a sufficient amount of feedstock. Furthermore, other substrates used in biogas digesters, such as agro-food wastes and agricultural residues, are typically only suitable for commercial biogas plants that are supplied directly from industrial agricultural sites or large-scale waste-collection systems, both of which are not currently feasible in the RC of Koulor [MAT2016].
3.4.3 Co-digestion
Combinations of different manures, as well as organic wastes from agricultural residues, would enable the usage of more diverse substrates from the community, thus helping reduce waste and increase the level of community involvement in biogas production. The use of high-lignocellulosic plant matter alone is not pos-sible in domestic level biodigesters, as they are too structurally complex to be broken down by microorganisms in such biodigesters without pretreatment or co-digestion [NES2017]. Most forms of co-digestion require pretreatment with NaOH, or require advanced biogas digester technology with mechanical stirring

Implementing sustainable domestic biogas projects in Senegal
185
capacity, both of which would be economically prohibitive in the case of house-hold-sized installations in Senegal [ibid]. However, some co-digestion mixtures for the fixed-dome biodigesters could be explored. It is important to note that the optimization of co-digestion mixtures is an active area of research with highly variable results depending on digester conditions, and should therefore only be implemented with caution and on a per-household basis. Ultimately, the use of co-digestion between substrates with different compositions could help provide an optimal carbon to nitrogen ratio, which can in turn increase biogas production [ibid].
Crop residues, which have a high energy potential, can be co-digested with ma-nure to increase methane yields [LUO2011]. Furthermore, manures have a very low C/N ratio, and thus mixing with plant-residues, which have a comparatively large ratio, can improve output [NES2017]. Some studies have found that co-digestion of goat manure with corn stalks, rice straw, cotton stalk and sorghum stem can improve biogas production, while others have seen improved biogas yields from mixing one part sheep manure with three parts cow manure [ZHA2013; NES2017; KAN1992]. Studies have generally found that mixing 30-40 % crop residues or organic waste with manure can improve the C/N ratio and biogas production [NES2017]. Thus, multiple substrate inputs and co-digestion of feedstock could be a future possibility in rural biogas installations in the RC of Koulor or elsewhere in Tambacounda, enabling more households to get in-volved and more waste to be diverted towards clean energy production. Table 4 provides a detailed breakdown for the substrate possibilities that would be suita-ble for co-digestion in a rural domestic biodigester.
3.4.4 Grazing systems
Assuming that cattle manure is the primary feedstock for the digester, it is critical to understand the grazing patterns of the region of interest when determining the feasibility, location and accessibility of the biogas digester. Livestock manage-ment systems such as pastoralism would be unsuited to biogas technology, as continual movement of livestock to new pastures would make manure collection and maintenance of a biogas digester impossible. Agricultural regions in the southernmost regions of Senegal, specifically the southern part of Tambacounda, practice agropastoral semi-intensive grazing [SEC2016]. Semi-intensive systems are especially common in villages with large mixed-use agricultural cultivation, such as the RC of Koulor [ibid]. Dairy production from cattle is the primary source of income from livestock in this region, and the most common cattle breed among livestock owners is the N’Dama taurine, which predominates due to its tolerance against trypanosomal infections [SEC2016]. Cattle in this area are fed with crop residues such as peanut vines, straw, cotton seeds and sesame cake [ibid]. The main ethnic group in Tambacounda, the Fulani, have traditionally

Kostin, Strauss and Tavčar
186
been nomadic pastoralists skilled in the grazing and management of livestock, however, they now mostly live in villages [WUR2010]. In general, most dairy-producing households in the southern parts of the country keep their livestock in pens close to the household at night, although some households may still hold their cattle in pens outside of the village, which would make manure collection and transportation inconvenient [HEG2007].
Table 4: Characteristics of substrates [adapted from RAJ2012] Main substrate Substrate classifi-
cation Dry matter (%)
Ash (%)
Total digestible nutrients (%)
Biogas yield
Manure Cow Pig Buffalo Poultry Horse
38 20-25 14 89 28
14 NA NA 33 NA
92 NA NA 38 NA
0.6-0.8 m3/kg TS 0.27-0.45 m3/kg TS NA 0.3-0.8 m3/kg TS 0.4-0.6 m3/kg TS
Fecal matter Human excreta 20 NA NA NA Agricultural residues
Rice straw Wheat straw Maize straw Grass Mango leaves Foliage of parthe-nium Coffee pulp Corn stalk Cassava peels (resi-dues)
91 91 86 88 NA NA 28 80 NA
13 8 NA 6 NA NA 8 7 NA
40 43 NA 58 NA NA NA 54 NA
0.55-0.62 m3/kg TS 0.188 m3/kg VS 0.4-1.0 m3/kg TS 0.28-0.55 m3/kg VS 0.6 m3/kg TS NA 0.300-0.450 m3/kg VS 0.350-0.480 m3/kg VS 0.661 m3/kg VS
Food wastes Whey Vegetable waste Fruit wastes (apple) Kitchen/restaurant waste Leftover food Egg waste Cereals
94 5-20 17 27/13 14-18 25 85-90
10 NA 2 13/8 NA NA NA
82 NA 70 NA NA NA NA
NA 0.4 m3/kg TS NA 0.506/0.650 m3 CH4/kg VS 0.2-0.5 m3/kg TS 0.97-0.98 m3/kg TS 0.4-0.9 m3/kg TS
Aquatic plants or sea weeds
Algae Water hyacinth Giant kelp Caboma Salvinia
NA 7 NA NA NA
NA NA NA NA NA
NA NA NA NA NA
0.38-0.55 m3/kg VS 0.2-0.3 m3/kg VS NA 0.221 m3/kg VS 0.155 m3/kg TS
The design and layout of villages within the rural communities are also important aspects to consider when deciding where, relative to the domestic household, to install the digester. Typically, villages in Tambacounda have a 1-km radius of land devoted to farming of peanuts, cotton, and millet, while the remaining out-side land is used for the grazing of livestock [WUR2010]. Furthermore, the con-struction of animal stalls in close proximity to the household is highly supported by government programs in order to promote the dairy industry2 [SEC2016]. Thus, the collection and supply of manure from cattle in this region can be inte-grated into the semi-intensive agriculture system of the villages.
2 The New Sectoral Initiavite for Livestock Development (NISDEL) in 2004 has led to the in-
stallation and funding of 230,000 animal stalls [SEC2016].

Implementing sustainable domestic biogas projects in Senegal
187
3.4.5 Water usage
Livestock manure needs to be diluted with approximately twenty to forty liters of water or cow urine per day in a 4 m3 fixed dome digester [RAK2013]. Water resources in Koulor are highly limited: only 36 % of the population of the RC have access to safe drinking water, with the majority of the water supply coming from traditional wells [SEM2011]. Furthermore, there is an insufficient number of drinking troughs to supply water to the livestock in the community [ibid]. Meanwhile, water resources become especially strained during the drought sea-son [ibid]. The use of cow urine would be a feasible alternative, as urine actually improves biogas production and would thus alleviate concerns over water con-sumption during drought or in water-scarce communities in the region [SEM2011; RAK2013]. Dairy cows typically produce upwards of 25 liters of urine per day, at least some of which could be collected to reduce the amount of water that is needed [DAI2012]. Simple urine traps could be made from a collec-tion pit lined with plastic, as well with a container, bucket, or polypropylene tubes; these materials could be purchased from local suppliers and assembled non-invasively in order to collect cow urine [LAS2010].
3.4.6 Materials, installation, and maintenance
Fixed dome biodigesters take approximately sixteen days to build, depending on the level of skill and experience of the laborers, and access to materials [RAK2013]. Ideally, local construction materials such as stones, stabilized clay blocks, sand, water and cement can be gathered from within the village as well as nearby hardware stores and will reduce the overall costs of construction, while other materials, such as burnt bricks, are much more expensive in rural areas [HEG2007]. Usage of materials such as sand requires that it is clean and free of impurities; granular sand is often mixed in with concrete, while fine sand is typ-ically used for plastering [HUB2007]. On discussing the material sourcing for the biogas program in the region of Ferlo, interviewee MasonAVSF [2017] pointed out that “there are many types of sand but not all can be used for concrete making: the best one is river sand but sadly the Ferlo region is known to have only few rivers and the ones going through are heavily harvested already”. Thus, the identification and location of the correct type of sand is important, especially if households in rural Tambacounda are relying on the availability of local mate-rials. Stabilized clay blocks are the best quality material to work with, while ce-ment blocks are easily available, but are of much poorer quality [HEG2007]. All other construction materials for the digester can be purchased with relative ease from local hardware shops in the region, however, since there are very few exist-ing biogas companies operating in Tambacounda, it may be difficult to source some of the required building materials and appliances from local retailers [ibid]. Some materials may need to be sourced from distributors in other regions and

Kostin, Strauss and Tavčar
188
countries, or manufactured in local workshops by engineers or construction firms [ibid]. However, as the awareness and popularity of biogas in Senegal increases, the availability of construction materials and appliances may become more lo-cally accessible than previously thought. As interviewee Ndiaye [2017] pointed out, “PNB offers cooking equipment made from local materials. There is no im-port necessary for domestic biogas digesters.”
Compost pits, that are used for collecting slurry that comes from the digester, need to be cleaned out and managed regularly, while bioslurry can be stored away for a longer period [Thrän, 2017]. In addition, to improve fertilizer quality, the collection pits near the outlet pipe are often filled with other organic organic wastes such as plant residue [SNV2006].
Another important consideration is the need for cooking stoves and potential cookware itself that are appropriate for biogas digesters (i.e. burners) [Ma-sonAVSF, 2017]. These additional purchases or costs would need to be included in any household selection process or cost estimation when making decisions about where to install the biodigester. Interviewee MasonAVSF [2017] discussed this issue:
“Regular butane/propane burners don’t fit for the methane that is produced by the biodigester. The cooking pots had to be mod-ified as well since the women only had pots that were used over the fireplace and had feet fitted on them to stand above the coal. For gas heating however they needed to be right above the burner so the feet had to be removed or other pots needed to be purchased.”
Furthermore, when installing a biogas system, transportation and logistics for getting materials to the worksite can be a challenge. Since many of the materials are large and heavy, trucks and other vehicles would be necessary for transporting to and from the worksite, as confirmed by interviewee MasonAVSF [2017]:
“One of the main issues was bringing the material to the worksite. The locations were quite remote and the access was only possible by rough dirt roads with lots of potholes. These conditions made it difficult to bring over the cement and the very heavy and large steel molds that were necessary to build the digesters.”

Implementing sustainable domestic biogas projects in Senegal
189
Table 5a: Average costs of fixed-dome biodigesters [HEG2007]
10m
3
Stab
ilize
d cl
ay b
lock
108,
651
318,
918
57,0
00
95,1
29
12,0
00
591,
698
903
Cem
ent
bric
k
108,
651
348,
918
57,0
00
102,
629
12,0
00
629,
198
961
Bur
ned
bric
k
108,
651
558,
918
57,0
00
155,
129
12,0
00
891,
698
1,36
1
8m3
Stab
ilize
d cl
ay b
lock
92,0
45
289,
018
57,0
00
87,6
54
12,0
00
537,
717
821
Cem
ent
bric
k
92,0
45
319,
018
57,0
00
95,1
54
12,0
00
575,
217
878
Bur
ned
bric
k
92,0
45
514,
018
57,0
00
143,
904
12,0
00
818,
967
1,25
0
6m3
Stab
ilize
d cl
ay b
lock
78,0
39
233,
938
48,0
00
72,0
84
12,0
00
444,
061
678
Cem
ent
bric
k
78,0
39
256,
438
48,0
00
77,7
09
12,0
00
472,
186
721
Bur
ned
bric
k
78,0
39
426,
438
48,0
00
120,
209
12,0
00
684,
686
1,04
5
4m3
Stab
ilize
d cl
ay b
lock
64,0
33
214,
838
48,0
00
67,3
09
12,0
00
406,
181
620
Cem
ent
bric
k
64,0
33
234,
838
48,0
00
72,3
08
12,0
00
431,
181
658
Bur
ned
bric
k
64,0
33
379,
838
48,0
00
108,
559
12,0
00
612,
431
935
Con
tribu
tion
far-
mer
in k
ind
Supp
lied
mat
eria
ls
Tech
nica
l ser
vice
s
Com
pany
fee
Prog
ram
fee
Tota
l in
vest
men
t (C
FA fr
ancs
)
Tota
l (Eu
ro)

Kostin, Strauss and Tavčar
190
The overall cost structure of a biogas system is divided into construction, mainte-nance and operation costs, with the latter two comprising about 3-5 % of the total construction cost on an annual basis [SNV2006]. Therefore, decisions about the materials used to build the biodigester will be the biggest determinant of the ini-tial investment. The cost breakdown for the hypothetical construction of a fixed-dome biodigester in Senegal can be seen in Table 5a (see p. 189), and is based on a GGC 2047 fixed-dome model previously used in Nepal, which incorporates elements of the Lesotho “TED” and Morocco design, using cattle as the standard for feedstock production [HEG2007]. The construction costs for a 6 m3 “TED” model fixed-dome digester in Burkina Faso are also depicted in Table 5b [HUB2007], including transportation, lighting and cooking appliances, labor, and materials.
It can be seen that the costs are quite similar, although there is some variability due to differences in market price of materials, design, as well as the inclusion of company and program fees in the GGC 2047 cost calculation.
Table 5b: Cost of a 6 m3 fixed-dome biodigester [adapted from HUB2007]
3.4.7 Operability
Once the biogas unit is installed, an inoculant is needed to jump-start the process of anaerobic digestion and build up methane production [HUB2007]. Ideally, small daily additions of manure would be suitable enough, due to the diverse micro flora that naturally exists [ibid]. However, the vast availability of goats in the RC of Koulor would also enable goat owners to earn an additional source of income by providing goat rumen, which is a highly efficient inoculant for biodi-gester startup and requires a much smaller volume for startup [NAG1999]. The standard 4 m3 fixed dome model would require a total of approximately 1500 kg of dung to be added before the plant can become active, meaning there is a win-dow of time where the plant would not be operational and a large amount of dung
Item % Total CFA francs
Cost of materials 46.2 % 208,100.00 CFAf
Cost of in/outlet pipes 8.2 % 36,755.00 CFAf
Cost of personnel 19.1 % 86,000 CFAf
Cost of gas pipes 6.3 % 28,300.00 CFAf
Cost of gas appliances 12.4 % 56,000.00 CFAf
Cost of transport 4.2 % 18,750.00 CFAf
Miscellaneous costs 3.6 % 16,095.00 CFAf
TOTAL 100.0 % 450000.00 CFAf

Implementing sustainable domestic biogas projects in Senegal
191
must be collected [SNV2006]. After the initial feeding, the length of time until biogas is produced, known as the hydraulic retention time (HRT), will depend on the temperature of the region [ibid]. With an average daily temperature exceeding 25°C in Tambacounda, the initial period before significant biogas production can be expected to last anywhere from a few days up to fifty days [CDM2012]. Re-quirements for daily fresh dung, water, number of cattle and plant size, along with their corresponding length of cooking and lighting time for a fixed-dome model, can be compared in Table 6. It is important to note that biogas systems need not be solely dependent on the existence of cattle livestock [RAK2013]. According to Rakotojaona [RAK2013], at least two cows, four pigs, or twenty goats would be sufficient to produce the minimum amount of dung needed to meet the cooking needs of a household. Furthermore, co-digestion with other ma-nures from horse and sheep as well as agricultural residues would be possible. Lastly, temperature is a key factor in determining the production and quality of biogas [LUO2011]. In large commercial systems, temperatures need to be con-trolled within a narrow temperature range (30-44°C and 45-60°C) to optimize yield, and require pre-treatment, digestion, cleaning and conditioning, before the biogas can be used [AMI2012]. In a fixed-dome domestic biodigester, biogas production occurs naturally at temperatures below 70°C and above 10°C (with the ideal temperature being around 35°C), and will thus be facilitated by the am-bient climate [ibid; SNV2006].
Table 6: Resource use and energy provision [adapted from RAK2013; SNV2006] Biodi-gester size (m3)
Initial feeding (cattle dung or pig manure) (kg)
Daily dung feeding (kg)
Daily water (L)
Use of biogas stove (hr)
Use of biogas lamp (hr)
Head of cat-tle
4 1500 20-40 20-40 3.5-4 8-10 2-3
6 2300 40-60 40-60 5.5-6 12-15 4-5
8 3000 60-80 60-80 7.5-8 16-20 6-8
10 3800 80-100 80-100 9.5-10 21-25 8-10
Calculations based on the “Rwanda design” fixed-dome model.
Assuming an average of 20-40 kg of fresh cow dung per day, along with 20-40 liters water (or urine), a 4 m3 digester could theoretically provide up to a maxi-mum of 6.30 hours of cooking time per day, however, lower estimates, such as findings from the Rwanda biogas program, have shown that functioning units receiving 35 kg daily cow dung provide closer to 2.6 hours per day [RAK2013; NIS2016]. In order to account for any inefficiencies or losses due to leakage or

Kostin, Strauss and Tavčar
192
fluctuations in manure quality, a more modest estimate than the values shown in Table 6 are taken.
A single cow produces about 10 kilograms of dung each day [SNV2006]. Each kilogram, in turn, can produce 40 L of biogas; therefore, one cow can produce up to 400 L biogas per day [SNV2006]. Laboratory experiments have also shown that a single goat produces approximately 0.7 kg dung daily, which in turn pro-duces up to 400 L biogas per day [HAN2017]. A typical biogas digester con-sumes 350-400 L of biogas per hour of cooking, and 150-175 L of biogas per hour of lighting [ibid]. Based on these data, and confirmed by the observed biogas cooking time seen in the Rwanda biogas program, one cow will produce enough biogas for one hour of cooking and nearly two hours of lighting [SNV2006]. One goat would also produce the same amount of cooking and lighting time; however, at least twenty goats would be needed to provide the required daily mass of ma-nure that is needed in the digester [HAN2017]. The biggest technical limitations to biogas production in an operational biogas digester would be the availability of dung and water (both of which are vulnerable to drought and food insecurity), animal illness and death, and financial capacity of the household to buy new live-stock or water (if urine cannot be collected). Installing collection channels for cow urine, as well as holding emergency livestock food supplies should therefore be considered to mitigate these vulnerabilities.
3.4.8 Technical capacity
Construction and long-term maintenance of digesters, such as cleaning out indi-gestible particulate in the biogas digester, as well as sealing any cracks and open-ings in the tank depend on the widespread dissemination of knowledge, training, and technology transfer that is essential to ensure the longevity and usability of the biogas plants [Thrän, 2017]. Interviewee Thrän [2017] noted the necessity of quality standards during the construction phase: “it is important to define a cer-tain technical standard or level, to make sure that you also get the benefit for the climate”. To be sure, without measures to ensure quality in building and con-struction, a well-meaning renewable energy project can quickly backfire. In pro-jects that rely on unskilled labor or informal assistance for the building process, quality measures can be significantly lacking. Specialized training programs for local skilled persons such as masons, construction workers, and engineers can ensure long-term technical capability in biogas programs [Thrän, 2017]. In the training program, the technical aspects of the selected fixed-dome biogas digester should be of primary focus, as well as general training in biogas technology, op-erations and maintenance, in order to increase the long-term functionality of the digesters for rural households [SNV2006].

Implementing sustainable domestic biogas projects in Senegal
193
Thus, a biodigester program must take into consideration the various technical factors required for a high-quality biodigester, including installation require-ments, material costs, operation, maintenance, and productive capacity of fixed-dome technology.
3.5 Economic Factors
3.5.1 Economic development of the region
The region of Tambacounda is economically less developed than other parts of the country, which could negatively affect the adoption of new technologies, such as biogas [ANS2013]. High initial investment costs, among other economic fac-tors, should be well-understood and planned for before attempting to implement a biogas project in the region.
Pastures in Tambacounda represent approximately 16 % of the national area, which shows a big potential for further development of livestock production [ANS2015]. Two main sources of income for the inhabitants of the region are raising cattle and practicing agriculture [POS2003]. The main employment sec-tors, as were previously mentioned, are agriculture and agro-forestry [ANS2015]. The area lacks any significant industrial activity, and the few other formal sectors where people are commonly employed include construction and public works, with most people working as builders or on road infrastructure [ibid]. According to the report by Miller et al. [MIL2014], about 8 % of all families in the depart-ments of Goudiry and Bakel make their living partially based on the exploitation of natural resources. For approximately 4 % of the households, the income gen-erated from forest-related resource use contributes to over 75 % of their earnings [ibid]. It proves to be especially needed when there is a shortened rainy season, as it then represents the main source of income for rural inhabitants [WUR2010; FAL2015].
3.5.2 Sufficient active demand
According to research conducted in 2014 by the World Bank, none of the sur-veyed rural households in Tambacounda were, at the time, satisfied with the fuel they used for cooking, predominantly firewood [BLO2014]. Since people live in close proximity to domestic cooking fuel resources, the main reason for their dis-satisfaction is not the cost but the negative impacts on health and time lost when cooking [ibid]. Following the research, 80 % of the rural households in the region have expressed a willingness to use different cooking fuels, with a prevailing 78 % expressing an interest in domestic biogas [ibid].

Kostin, Strauss and Tavčar
194
3.5.3 Willingness to pay (WTP)
In rural households of Tambacounda, energy costs represent only 1.5 % of total household spending (compared to 12 % in urban areas), which is below the aver-age fuel expenses of families in other Senegalese regions [BLO2014]. The monthly energy spending of rural households, which amount to 625 CFA francs, is significantly lower than the 6,632 CFA francs spent by urban households [ibid]. Most villagers collect their cooking fuels by themselves and consequently, do not view them as an expense [ibid].
The research carried out by Bloomfield et al. [BLO2014] concluded that the pre-vailing number of urban and rural households in the region are not willing to pay more than 10,000 CFA francs monthly for either an alternative cooking fuel or cooking stoves. Approximately 16 % of the households in the rural areas ex-pressed an interest in paying between 10,000 and 15,000 CFA francs, with only 2 % willing to spend up to 25,000 CFA francs for an alternative cooking fuel [ibid]. The final conclusion of the survey established a benchmark of 5,000 CFA francs per month to cover households’ energy expenses [ibid].
3.5.4 The market for existing domestic cooking fuels
In general, the households in rural parts of Tambacounda region rely mostly on firewood for cooking, with charcoal being primarily used only in the urban areas [ibid]. Since all the wood resources around urban zones have been exhausted, urban inhabitants today depend on the reserves coming from far away areas, es-pecially from the eastern part of the country [POS2003].
LPG is used by 3 % of the rural population in the region [BLO2014]. There has been relatively low diffusion of this alternative fuel in rural areas due to the easy access to charcoal and firewood resources [ibid]. Furthermore, in 2009, LPG sub-sidies were terminated, further discouraging its use [ibid]. Although LPG is of-fered on the market and can be found in shops, another problem is the reliability of supply, as rural residents must travel long distances to buy and refill the gas cylinders [ibid]. Apart from this, LPG has proven to be too expensive and not as long-lasting as charcoal [WUR2010; BLO2014]. When comparing costs of all available cooking fuels in the region, charcoal and firewood are the cheapest so-lutions (over three times cheaper than LPG), followed by briquettes [BLO2014]. According to the survey by the World Bank, biogas seems to be the most feasible solution in rural areas of Tambacounda, since it is more suitable and more likely to be accepted than other cooking fuels [ibid].

Implementing sustainable domestic biogas projects in Senegal
195
3.5.5 Financing
The installation of a biodigester requires a fairly large financial contribution, since beyond the initial investment, the purchase of auxiliary kitchen equipment, new devices for cooking or lighting and water collection equipment may be nec-essary [ORS2014]. Thus, affordability is the main issue when trying to imple-ment domestic biogas projects in Tambacounda [Wurster, 2017]. Furthermore, according to interviewee Wurster [2017], “the startup costs and maintenance- those are the two things that will cause a project to fail, because a lot of times, there’s not a significant investment or buy-in from the community”. As inter-viewee Ndiaye [2017] also pointed out, there are three main ways to finance do-mestic biogas installations: either with the PNB-SN subsidy, financial support from NGOs, or through different microfinancing schemes.
Only a small number of rural households in the region have savings; on average, they have to borrow funds from formal or informal financial associations in order to cover their expenses [BLO2014]. In fact, 28 % of agricultural households are part of cooperative financial institutions, which offer loans or different forms of saving options [ibid]. On average, annual credit is 77,250 CFA francs per house-hold, which represents over 18 % of their income [ibid]. In general, most credits are used to fund agricultural and livestock-associated expenses, with only a small amount accounting for other items such as cooking equipment [ibid]. By contrast, in urban areas only 29 % of credit is devoted to supporting livestock [ibid]. Ac-cording to interviewee Wurster [2017], microfinancing is likely to be well devel-oped in Tambacounda as it can be facilitated by “electronic money transfers” and “cell-phone credit as currency”.
Credit obtained from community funds offer another method of getting financial support for the installation of a biodigester [ORS2014; Wurster, 2017]. Such credit requires no initial expenditure by a beneficiary, and is paid back periodi-cally through savings on cooking fuel and fertilizers [ORS2014]. Community-driven funds are usually started by the community members themselves, in which each member contributes smaller deposits, with contributions also coming from local donors [ibid]. As mentioned, a fairly large number of households in the area depend on agriculture as their primary source of income, thus one of the possible ways to cover for biogas expenses could be a seasonal payment system, which would make up for the irregular income from crop production [BLO2014].
Another method that can be used to cover households’ expenses is the World Bank’s Carbon Initiative for Development (Ci-Dev), which has already been suc-cessfully implemented in some Sub-Saharan African countries [SEP2016]. The main idea of the initiative is to lower greenhouse gas emissions by employing results-based payments for carbon emissions reduction, which could lead to cleaner and more affordable energy solutions among local communities [ibid].

Kostin, Strauss and Tavčar
196
In Senegal, a carbon finance scheme was designed in December 2016 when Ci-Dev and the Rural Electrification Agency of Senegal (ASER) signed an Emis-sions Reduction Purchase Agreement (ERPA), with the aim of lowering the amount of greenhouse gas emissions and making electricity more accessible to rural communities in the country [SAH2016]. However, this project focuses on rural electrification, leaving out the development of cleaner cooking techniques.
On the other hand, Ci-Dev has already signed ERPAs with several organizations in other Sub-Saharan countries with the main aim to promote large-scale imple-mentation of biogas digesters [CID-n.d.]. In Kenya, the pilot project was started in 2016 through the signing of an agreement between Ci-Dev and SimGas, a Dutch manufacturing company [ibid]. The main aim was to provide biogas stoves and biodigesters for up to 75,000 Kenyan families [ibid]. Emission reduction units, achieved by the use of cleaner cooking technologies, are then purchased by Ci-Dev, making the project profitable and further lowering the prices of biodi-gesters, leading to possible scale up of the initiative [SEP2016]. A similar exam-ple comes from Burkina Faso, where Ci-Dev has been collaborating with the SNV, focusing on the installation of biogas digesters and improving the living situation for around 35,000 households [CID-n.d.].
In order to facilitate the adoption of biodigesters, the government of Senegal has been partially subsidizing the initial investment costs for all digesters that have been installed as a part of PNB-SN [PNB2010]. At the time of the program initi-ation, the government declared that their subsidies would cover between 25 to 50 % of the initial price of biodigesters, with the highest subsidy (50 %) given to the beneficiaries of the first 100 pilot biodigesters, and the 25 % contribution given to those installing the following 7900 biogas plants [ibid]. However, ac-cording to the information collected, reporting on the subsidy value has been highly variable and inconsistent, with data ranging from 30 to 50 % during the first phase of the PNB-SN, up to 80 % in the second phase of the program, which began in 2015 [KER2011; ADI2011; FAL2014; WIL2015]. The amount of the current subsidy was confirmed by interviewee Ndiaye [2017], who also pointed out that 80 % of the contribution can be “financial or in terms of work and mate-rials for the construction supplied”.
3.5.6 Potential to use bio-slurry
Animal dung serves different purposes in Senegalese households; 39 % partially reuse it as a fuel for their cooking, 19 % sell it on to neighbouring crop farmers for a small cost and 42 % do not make use of it [HEG2007]. Untreated manure is frequently used as a fertilizer in countries of Sub-Saharan Africa, since the higher levels of ammonia in the dung boost the initial plant growth [SMI2014]. Further-more, in Senegal, 57 % of interviewed households who own fields close to the

Implementing sustainable domestic biogas projects in Senegal
197
stables, use animal dung to fertilize their lands [HEG2007]. According to inter-viewee Wurster [2017], some rural households in Tambacounda are already us-ing manure in some way, frequently mixing it with soil to make manure tea for fertilizer or using it for building purposes.
One incentive for the use of biogas technology is the ability to financially benefit from the byproducts of the biogas making process. The combination of waste and slurry, which is produced together with biogas, can be used as a fertilizer to in-crease land fertility and improve crop yields [AMI2012; HEG2007; FAL2014]. Bio-slurry can be applied directly to the soil or used indirectly in the compost to accelerate the composting process [HEG2007]. As an organic fertilizer, bio-slurry can increase the yield of crops by 20 to 40 % [ibid]. Interviewee Thrän [2017] confirmed that another advantage of bio-slurry is that it can be stored for longer periods. According to interviewee MasonAVSF [2017] the creation of fer-tilizer has proven to be very successful. For example, one of the beneficiary fam-ilies, which was part of the AVSF Biogas Project, reported much higher crop production during the rainy season than usual, which led to an additional income of 441,000 CFA francs from the sale of the products [BIA2014; MasonAVSF, 2017].
Using bio-slurry instead of untreated animal manure can lead to considerable im-provements in the amount of nutrients available to plants, which makes the land more fertile [SMI2014; HEG2007]. However, it needs to be applied several times in smaller doses, thus demanding more involvement from the farmers’ side, es-pecially when compared to manure, which is applied only once at the beginning of each season [SMI2014]. Another option is mixing slurry and carbon-rich ma-terial to make compost, which can be used in the same way as untreated animal manure, but retains higher nutrient levels [ibid].
Using bio-slurry instead of chemical fertilizers has the potential to reduce farm-ers’ expenses and create financial payoffs, since there is no need to buy additional organic substances to help with crop growth [HEG2007]. In Tambacounda, this is of relevance for the farmers who use chemical fertilizers and pesticides in their orchards, which is not only costly but also leads to soil pollution [ANS2015; Wurster, 2017]. Furthermore, it is possible to make money from selling bio-slurry itself [Ndiaye, 2017].
The economic factors, discussed in the preceding analysis, should be among the main considerations when creating domestic biogas programs. High initial in-vestment costs and low WTP of the households in the region may lead to low diffusion of the biogas technology. At the same time, a variety of options on how to finance initial biodigester expenses exists on the market, representing an op-portunity for upcoming biogas projects.

Kostin, Strauss and Tavčar
198
3.6 Legal Factors
3.6.1 Land tenure, decentralized jurisdiction and customary law
As fixed dome biogas digesters require a permanent underground installation, they should only be installed on properties where land tenure can be secured and where national and regional legislation supports developments in renewable en-ergy projects [NIS2016].
The discrepancies that arise between both formal and informal law have given rise to many unresolved issues over local control of land tenure rights [USA2010]. Currently, formal state law in Senegal recognizes three tenure types: ownership (applies only to private land), leasehold (applies to state and private land), and occupancy rights (applies to urban and peri-urban land) [ibid]. Since the second half of the 20th century, Senegal has increasingly enforced a decen-tralized approach to land administration among many other sectors of governance [USA2008]. State Law no. 96-07 legally enacted this process in 1996 by reallo-cating nine state-controlled sectors (Environment and Management of Natural Resources, Health, Population and Social Action, Youth, Planning, Territory Management, Sports and Leisure, Education, and Urbanism and Habitat) to the authority of local communities [ibid].
The Senegalese government passed the National Domain Law in 1964, dividing the country into urban, classified, territorial, and pioneer zones, and further clas-sifying 3 % of land in the country to be privately owned and 97 % to be state-owned [USA2010]. Furthermore, the National Domain Law stipulates that state-owned land cannot be sold, while rural councils are permitted to exercise author-ity over territorial lands, including agricultural land [PIE2016]. The Rural Com-munity Law of 1972 enabled decisions regarding allocation of land-use rights and productive use of land in rural communities to fall under the local authority of counseils ruraux [USA2010]. Furthermore, long-term land use rights can be granted when the land has been occupied for more than three years [USA2010]. Final decisions regarding land-use rights are made by the local council, and are based on the requirement that the land is used productively, and that the occupant is a resident of the community [PIE2016]. Although the exact definition of “pro-ductive” land use is as of yet undefined and remains subject to interpretation by rural councils, the use of cleared land and intensive cultivation is highly valued and thus more likely to be recognized under customary law [USA2010]. At pre-sent, the ongoing veto power being exercised by the state has contradicted the decentralization approach, and allows for re-allocation of land for development purposes without local consultation [ibid]. Furthermore, the lack of oversight on

Implementing sustainable domestic biogas projects in Senegal
199
state legislation, along with the prevalence of customary law in rural communi-ties, has led to widespread corruption and decision-making based on the interests of local council members [ibid].
Legal implications of the decentralization process on ownership of resources should also be considered. Tambacounda is one of only two regions in the coun-try that is legally allowed to produce charcoal, and is thus responsible for pro-ducing a large proportion of the country’s supply [WUR2010]. The cutting down of live trees is illegal, and charcoal production requires the granting of a permit by the authorities involved in managing this activity, namely the Forest Service [ibid]. Traditionally, village chiefs are responsible for enforcing customary law and resolving legal disputes between villagers, while forestry chiefs are in charge of managing village forests [ibid]. To deal with the issues arising from the de-centralization process, measures have been taken to increase the number of courts, magistrates and court registrars in the countryside, speed up decision-making in court matters, and modify legislation to better reflect the necessary socio-cultural and economic context [ADB2006].
Under customary law in rural areas, land is often communally owned and inher-ited through generations of male-heirs, although loaning, leasing, and independ-ent ownership is becoming increasingly common [USA2010]. Decisions regard-ing land use and conflict resolution fall under the jurisdiction of a village leader [PIE2016]. As interviewee Wurster [2017] pointed out, “sometimes the chief isn’t from the most affluent family, but, they have the decision-making authority, and they also control the allocation of land.” Although land-use rights are for-mally non-transferable, the prescription of customary and religious laws often mean that the rural council or village chief will approve the request for land to be passed on to sons who continue to use it “productively” [PIE2016]. The existence of both formal and customary law in land-rights allocation is a matter of legal pluralism, whereby the recognition of authority varies depending on acceptance by the local community, however, in areas with commercial agriculture or devel-oped irrigation systems, formal law predominates [USA2010].
The legal recognition of gender equality is also an important aspect of determin-ing land ownership rights. Formal legislation, including the Family Code of 1973, upholds the Muslim law of succession, which stipulates that women receive half of the property inherited by their husbands, and women in polygamous marriages must divide this inheritance among all the wives [ibid]. According to the 2001 constitution, gender equality is a right for all citizens, and land policies also sup-port equal access to land [ibid]. However, formalized laws are not acknowledged at the local level, where customary and Islamic law predominates, and thus women remain dependent on land access through their husbands [ibid]. This would lead to high instability and loss of land rights in the event of a separation

Kostin, Strauss and Tavčar
200
or divorce [ibid]. In general, women tend to be allocated smaller and less produc-tive portions of land, and are more likely to be evicted or displaced with little prior notice, especially in the case of the husband’s death or divorce [ibid].
3.6.2 Emergency and disaster preparedness legislation
Other relevant legal considerations for a biogas project include national risk as-sessment and emergency preparedness programs. In the event of such an emer-gency, programs would need to ensure that emergency food, water, and other essential services are distributed to the population to maintain livelihoods and food security for households and livestock. Senegal is a member of the African Risk Capacity Insurance Company (ARC), the Global Alliance for Resilience Initiative (AGIR), and has established the Emerging Senegal Plan (PSE), to im-plement resilience measures for food security and climate change [ARC2015]. These initiatives have recently enabled it to distribute and subsidize 14,839 tons of cattle feed to reduce the food insecurity of livestock farmers, while the state also obtained 36.4 billion CFA francs through the Integrating Climate Change Adaptation project to promote sustainable development and environmental pro-tection [ibid]. In addition, drought and food insecurity emergency plans have been drafted for Tambacounda, among other regions of Senegal [ibid]. This is particularly important for Tambacounda, because it is a region that regularly ex-periences food shortages and has one of the highest rates of poverty in the country [ibid]. These programs show that support structures have been developed to deal with potential emergencies or natural disasters that could seriously impact the biogas project, thus giving the project a greater chance of long-term success and sustainability in a changing climate.
3.6.3 Dairy industry legislation
As dairy production has become a major source of income for villagers, national legislation such as the Framework Law on Agroforestry and Pastoralism (LOASP), enacted in 2004, has been implemented to create a long-term plan for improving livestock development and increasing milk production [SEC2016]. Specifically, the law aims to promote the transition towards intensified and sus-tainable agriculture, improve the living conditions and soil fertility in rural com-munities, and manage natural resources and the environment [USA2008]. These laws will further incentivize rural dwellers to move away from nomadic pasto-ralism practices and towards the use of concentrated grazing areas, which would in turn create more appropriate conditions for domestic biogas use.

Implementing sustainable domestic biogas projects in Senegal
201
3.6.4 Participation in international agreements on climate change
Finally, legislation set out by national energy policies and international agree-ments will determine the boundaries and limitations for developing and imple-menting domestic biogas programs in Senegal. The Senegalese government out-lined emissions reductions commitments within their Intended Nationally Deter-mined Contribution (INDC), a non-binding publication of climate action targets and initiatives set forth voluntarily by each nation as a part of the Paris Agree-ment for the United Nations Framework Convention on Climate Change (UN-FCCC) [MED2015]. Senegal’s INDC, published by the Ministry of the Environ-ment and Sustainable Development on September 26, 2015, includes an uncon-ditional3 national target to reduce greenhouse gas emissions by 5 % below the business-as-usual scenario by the year 2030, and a conditional target of 21 % for the same year [ibid]. Conditional targets include commitments to install 49,000 domestic biodigesters by 2030, reducing deforestation by 25 % by the year 2023, and the reforestation of up to 204,000 hectares beginning in 2017 [MED2015; CLI2017]. In addition, Section 2.5.1 of the country’s INDC states that the miti-gation measures laid out in the emission reduction commitments will have exten-sive socio-economic benefits, including the creation of over 40,000 jobs, im-provement in energy security for rural communities, and the development of the biogas sector through local business and small-scale domestic operations [MED2015]. Thus, there is a favorable environment and strong willingness under existing multilateral commitments to work with international partners in achiev-ing the domestic biogas digester targets. According to the latest updates, the country is set to achieve its renewable energy and GHG reduction targets [CLI2017]4. Monitoring of the country’s progress, according to the actions out-lined in the INDC, will be documented in bi-annual reports and coordinated by the National Committee on Climate Change (COMNACC), the National Adap-tation Plan (PNA), and the Air Quality Management Center (CGQA) [ibid].
While renewable energy targets set by the country have not been made legally binding, the implementation of national legislation and policy has demonstrated the government’s commitment to renewable energy, and the International Re-newable Energy Agency (IRENA) has recognized its excellent track record [ibid]. Several renewable energy policies are currently in force in Senegal, in-cluding the Renewable Energy Orientation Law (2010), the National Biogas Pro-gram (2009), the Special Programme for Biofuels (2007), and the program for the promotion of renewable energies, rural electrification and sustainable supply
3 Conditional targets require external support from international partners, unconditional targets
are to be achieved regardless of external financial support [MED2015]. 4 The INDC is supported by policies such as the Renewable Energy program, the Acceleration
Program for Senegalese Agriculture (PRACAS), and the National Plan on Biodiversity (SPNAB) [CLI2017].

Kostin, Strauss and Tavčar
202
of domestic fuel (2004) [IEA2017]. The Renewable Energy Orientation Law5 is a multi-sectoral regulatory instrument that primarily creates a framework for sus-tainable renewable energy installations and projects, reducing fossil fuel con-sumption, diversifying the energy mix, promoting domestic production, promot-ing technical capacity and equipment for renewable energy installations, and re-ducing greenhouse gas emissions [ibid]. Furthermore, the law provides defini-tions of the recognized forms of renewable energy, and defines energy from bio-degradable fractions of animal and plant products as a viable renewable energy source [REO2011]. Specifically, the law institutes a complete tax exemption from the purchasing of materials and equipment for domestic renewable energy installations, and tax relief in the purchasing of such equipment in non-domestic renewable energy applications [IEA2017]. The tax exemption policy is an advan-tageous aspect of developing the domestic biogas program within the country, and provides further incentive to source materials, equipment, and all other fi-nancial aspects of the program at a local level.
3.6.5 Labor and employment legislation for NGOs
Labor laws and laws governing NGOs are an important consideration for any project implementation team to ensure smooth operability and legal presence within the country. There are no explicit limitations on the formation of NGOs within the country; however, they must maintain public order, and operate in ac-cordance with penal law and international conventions on human rights and free-doms [ICN2017]. The 1968 Civil and Commercial Obligations Code (COCC) sets out regulations that oversee non-governmental organizations, foundations, basic community organizations, professional trade unions, and other associations [ibid]. In order to get special status recognition as an NGO by Article 825 within the COCC, NGOs operating in the country must first register with the Directorate of General Affairs of the Territorial Administration (DAGAT) in the Ministry of the Interior, followed by registration and acquisition of a national identification number by the Directorate of Statistics [ibid]. Before the NGO can be recognized, it must first undergo a two-year probation period as an association, where it should perform and document its main activities. It should be noted that many associations at this level operate as unregistered entities within the country, and that there are no specific requirements to register as an association for this period [ibid]. As a part of the final NGO registration process, it must provide a govern-ing statute and main address, proof of certification from the original country, de-tails of membership organization, a memorandum of the official request, and de-
5 The Renewable Energy Orientation Law provides the legal foundation for the country’s INDC
(submitted to the United Nations in 2015) [CLI2017].

Implementing sustainable domestic biogas projects in Senegal
203
tails of financial resources for the intended activities [ibid]. An investment pro-gram must also be submitted to and approved by the Ministry of Finance [ibid]. Finally, the organization must continue to operate for two years after receiving NGO status, after which an assessment is carried out [ibid]. Officially recognized NGOs will then be exempt from duties on all equipment and material costs, and are permitted to use imported and local vehicles for the NGO activities [ibid]. Although NGOs are unrestricted in their procurement and access to both domes-tic and international funding, Decree No. 2015-145 states that they must report their financial activities to the Ministry of Finance and Planning, which maintains the right to verify funding sources [ibid].
The Labor Code of 1997 states that workers and professionals are free to form trade unions to protect their rights interests [ibid]. The major labor unions in the country include the National Confederation of Senegalese Workers (CNTS) and the National Association of Senegalese Union Workers (UNSAS) [USD2013]. The installation of biogas digesters in rural villagers may require work contracts to be formally drafted between the NGO and the local workforce, therefore, strict observance of labor code provisions at every stage is a must. According to Article 33 and 34 of the Labor Code of 1997:
“Work contracts that include ‘the establishment of the worker outside of his/her place of habitual residence’ are to be approved by the General Direction of Labor and Social Security within the Ministry of Public Service, Labor, Social Dialogue and Pro-fessional Organizations” [DEV2015].
Since biogas digester installations may necessitate travel to a rural community outside of the worker’s residence, such approval processes under a work contract would be mandatory. Furthermore, the duration of the initial installation and con-struction phase of the project must be specified in fixed-term contracts that can-not exceed two years [MUL2007]. Trial periods can also be conducted before the enforcement of the work contract begins, though they need to be declared in writ-ing, and cannot exceed a period of six months [ibid]. As of yet, there is currently no legislation which forbids the employment of foreigners to sustain employment of the local workforce, however, the organizers should be aware that over reli-ance on foreign workers would seriously undermine the long-term sustainability of the biogas project [DEV2015].
Forced labor and child labor is illegal in the country, however, over 15 % of chil-dren between the age of four and fifteen were still forced to work in 2005, and national legislative bodies responsible for preventing child labor receive inade-quate funding [USD2013]. In general, labor legislation is known to be highly complicated and a major disadvantage for foreign investors and companies, es-pecially concerning the long bureaucratic process for terminating employment contracts, even with legitimate reasons [ibid]. Grounds for termination outside

Kostin, Strauss and Tavčar
204
the will of the employer are justified based on mutual consent, inability of the worker to perform duties due to unforeseeable events (force majeure), or death of the worker [MUL2007]. Without a contract, workers can give a 15-day notice for termination of employment without reason, while technicians must give two months notice [ibid]. Contracts of specified duration (fixed-term contracts) can only be terminated before the end of the contract upon the written mutual consent of both parties or in the event of force majeure, otherwise, they are considered wrongful [ibid]. Justified dismissals by the employer are appropriate given “acts of indiscipline or insolence; unjustified absence; violation of professional obli-gations, civil or criminal offences; and negligence or recklessness” [ibid]. Fur-thermore, dismissal is also permitted when it is deemed necessary for the interests of the employer, or when there is proof of “misunderstanding or lack of cooper-ation between the worker and the employer” [ibid]. It should be cautiously noted, however, that the employer would be required to provide evidence and receive approval in these circumstances, which may be extremely difficult or prone to subjective interpretation by authorities.
In the case of unspecified duration contracts, the employer can fire the employee without the consent of the worker, but would be required to give advance written notice and reason [ibid]. Dismissal without a just cause is considered wrongful dismissal, and is subject to legal action. Based on this analysis, termination pro-ceedings within a fixed-term contract are highly restrictive, and therefore enter-ing into a contract of specified duration requires trust and long-term cooperation between the employer and worker. Furthermore, NGOs or other biogas imple-menting organizations that consider using formal work contracts would need to pay special attention to decide when and if an employment contract is appropriate (i.e. in the case of unskilled vs. skilled labor).
3.6.6 Anti-corruption legislation
The development of a successful domestic biogas program and a strong national biogas industry requires a reliable and consistent legal framework. Thus, it is important to consider and evaluate the existence and effectiveness of national policies targeting anti-corruption and money laundering. Awareness of these leg-islative frameworks combating corruption would be necessary to mitigate long-term financial vulnerabilities in biogas programs, and provide insight into the long-term viability of the biogas program. The Government of Senegal has insti-tuted a number of legal measures to prevent corruption into the Country Financial Accountability Assessment (CFAA) and Country Procurement Assessment Re-port (CPAR) action plans, as well as the National Good Governance Programme (NGGP) [ADB2006]. In 2003, Law No. 2003-35 enabled the establishment of a National Commission against Non-transparency, Corruption and Misappropria-

Implementing sustainable domestic biogas projects in Senegal
205
tion, which became responsible for managing and investigating cases of corrup-tion reported by citizens [ibid]. It has been well acknowledged that this commis-sion lacks sufficient financial resources and legislative authority to carry out its responsibilities, including a limited ability to conduct investigations [ibid]. Fur-thermore, there are no existing legal protections for civilians who report cases of corruption, thus creating a major disincentive for engaging with anti-corruption authorities [USA2007]. Additional laws, such as the 2007 Code de Passation des Marchés Publiques, have been recently implemented to reduce corruption in pub-lic procurement [ibid]. As of yet, however, many of these reforms have had min-imal impact, and corruption still plays a major role in the political-legal-eco-nomic landscape [ibid].
The opportunities and barriers posed by the legal environment, such as the regu-lation of resource use and agriculture, employment and enforcement of property rights in rural areas, and emergency and disaster planning can be used to make informed decisions and to better understand the risks involved in such projects. The decentralized legal system has a large influence on local resource use, deter-mination of property rights, conflict resolution and the implementation of state laws [ibid]. With the correct level of planning and awareness, biogas projects can be suitably implemented while respecting and adhering to both national legisla-tion and customary practices.


Implementing sustainable domestic biogas projects in Senegal
207
4 Results
4.1 Critical Success Factors
The list of critical success factors was identified and characterized from the PES-TEL analysis and interviews (see Table 7). In general, they identify specific con-cerns, risks, characteristics, and variabilities which necessitate certain decisions or technical adjustments to the implementation process. The critical success fac-tors were then aggregated so that each of them could be addressed as a part of the comprehensive recommendation strategy for future biogas development projects. In total, five categories of major recommendations were formulated to help suc-cessfully manage and optimize the overall outcome of biogas projects undertaken in rural Tambacounda:
x Promotion and Communication
x Financing Scheme
x Household Selection and Installation Requirements
x Technical Training and Employment
x Community Development
Table 7: Critical success factors PESTEL Category
Critical Success Factor
Explanation
Economic Willingness to pay The average willingness to pay for household energy expenses is low (about 5,000 CFA francs per month).
Financing The initial investment for a digester is very high, while only a small number of rural households have financial savings.
Existing market for cooking fuels
The majority of rural households use firewood as a cooking fuel, followed by charcoal and LPG. Charcoal is primarily used in urban areas.
Econo-mic/Social
Household buying decisions
Due to the fact that men make household buying decisions, a cost-benefit mismatch may occur when promoting biogas.
Environmental Water availability Tambacounda is drought-prone and dry; water access can be limited due to poor infrastructure. Climate change exacerbates extreme weather and unpredictability.
Deforestation The annual rate of deforestation is 0.5 %, due to ongoing and uncontrolled firewood collection and charcoal production.
Soil degradation Climate change and increased use of chemical fertilizers is re-ducing soil quality and adversely affecting food security.

Kostin, Strauss and Tavčar
208
(Continuation of Table 7)
Legal Land ownership Some landowners are vulnerable to land expropriation or have insecure land rights.
Legal/Economic Employment Highly bureaucratic employment regulations and termination policies.
Political Transparency and accountability
Corruption and lack of transparency in public spending/pro-jects disrupt local development and lead to mistrust in public institutions.
Political support State and local institutions can influence acceptance and fund-ing of project.
Social Education and knowledge
Education levels and technical skills are limited, and illiteracy is widespread.
Gender equality Women and girls are responsible for nearly all household activ-ities, preventing them from attending school or participating in economic activities outside the home.
Acceptance of for-eign initiatives
There is a sense of openness towards foreign initiatives, pro-vided that benefits for the household can be achieved.
Awareness of biogas technology
Biogas programs have not been widely implemented in Tamba-counda, therefore limiting awareness of the technology.
Local participation Many development projects are prone to failure because local communities are not adequately included and informed about the process.
Social cohesion There is a strong sense of solidarity between villagers; how-ever, new development projects may create unforeseen social tensions.
Technical Cattle management System
Practices vary substantially among villages and depend on eth-nicity; livestock management is becoming more intensive.
Material transport Transport to remote regions is difficult due to poorly maintained roads.
Technical/ Environmental
Construction specifi-cations
Choice of size, materials are important determinants of invest-ment cost, quality and output of digester. Digester function is vulnerable to weather conditions and climate in Tambacounda.
Environmental risk Faulty construction and poor maintenance of biodigester can lead to adverse environmental outcomes. Improper manage-ment of bio-slurry can pose additional environmental hazards.
Techni-cal/Social
Long-term mainte-nance of biodigester
Many biogas programs fail because households do not know how to conduct basic maintenance, or due to lack of proper training.

Implementing sustainable domestic biogas projects in Senegal
209
4.2 Promotion and Communication
Assessments have shown that people would be accepting of biogas technology if benefits were communicated properly6. Therefore, a communication strategy highlighting the main benefits and opportunities presented by biogas is crucial. Thus, it is necessary to consider the different languages of Tambacounda’s ethnic groups, and to not solely rely on written forms of communication, as a large per-centage of the population is illiterate7. The ultimate objectives of a promotion and communication strategy are:
x to raise awareness about economic, environmental, social and health- related issues related to the use traditional cooking fuels
x to raise awareness about biogas as an alternative technology with multiple benefits
x to educate villagers on proper installation and maintenance
x to establish the acceptance of biogas by the community
x to spread awareness beyond village borders
x to maximize political support
In order to achieve these objectives, a communication strategy should contain several steps, as confirmed by interviewee Ndiaye [2017]:
„[…] we must not impose this technology but make it accepted by the community. And that can go through negotiations. Train-ing sessions and information on the ins and outs of this new technology should be put in place. People need to know what you want to do. Then, show precisely the benefits of biogas with video feedbacks filmed in other regions. And exchanges be-tween current and future users would be a good idea.“
Thus, the first step should be to provide general information about biogas tech-nology and its benefits to the community where the biogas project is supposed to be implemented. This could happen through a community forum, where the tech-nology is introduced and benefits are communicated. The use of visual media is encouraged. Pictures or videos from other regions, where successful biogas pro-jects have been realized can facilitate understanding. It is recommended to invite existing users of domestic digesters to join the dialogue and answer questions by the community. A special emphasis should be put on communicating the different benefits of biogas technology to the various community members, men and women alike. Interviewee Ndiaye [2017] highlighted:
6 See Section 3.3.6 Awareness and acceptance of biogas technology. 7 See Section 3.3.3 Education.

Kostin, Strauss and Tavčar
210
„the interest between women and men is not at all the same. Often men are interested in the digestate, that can be used as a good fertilizer. While women are interested in using the gas for cooking. So it is one installation but two interests [...]. One is for agriculture, the man, and one is for the energy and the cook-ing, the woman. So this needs to be taken into account. “
Households need to be informed about the possibility of making an extra income by either using bio-slurry as a fertilizer or by selling it on. It should be highlighted that the use of bio-slurry can increase crop yields significantly, thus more produce can be sold on markets8. Moreover, money spent on chemical fertilizers could be reduced or eliminated, leading to household savings (see Section 4.3 Financing Scheme). Households should also be informed about the significant time savings that can be achieved by biogas, potentially permitting women to participate in economic or leisure activities outside the home9. Lighting provided by biogas can enable children to study at evening time and further incentivise the investment. Finally, the environmental benefits of reducing deforestation and improving soil quality could be experienced by the entire community10. Considering and com-municating these different benefits would be an important step in establishing acceptance and developing greater interest in biogas technology.
After awareness and initial acceptance of biogas technology has been established within the community, further education opportunities should be available for any interested community member. In order to educate villagers on the installa-tion and maintenance of biodigesters, technical training programs should be car-ried out (see Section 4.5 Technical Training and Employment). Prior to finalizing the initial agreement about a domestic biogas installation, different financing op-tions should be thoroughly discussed and chosen with the households (see step 7 of Section 4.4 Household Selection and Installation Requirements), emphasizing their responsibilities in the process. Every household receiving a digester should also receive a manual containing pictures, as well as guidelines in different lan-guages (depending on the village i.e in Pulaar, Mandika or Wolof11). All house-hold members should be informed on the standards of maintenance expected. The division of labor required for running the biodigester should be promoted. This could be achieved by including both men and women in video feedbacks and pictures shown to the community, as well as in training initiatives (see Sec-tion 4.5 Technical Training and Employment). Feedback from the households who invested in a digester should be requested on a regular basis, in order to
8 See Section 3.5.6 Potential to use bio-slurry. 9 See Section 3.3.5 Health and social issues related to the use of traditional fuels. 10 See Section 3.2.4 Importance of forest and deforestation and Section 3.2.5 Pollution. 11 See Section 3.3.1 Social groups and their agricultural practices.

Implementing sustainable domestic biogas projects in Senegal
211
improve future communication. Households should be informed about ways to get additional information and support, in case problems with the digester arise.
Collaborations with local and regional interest groups, inter-village councils and community organizations could contribute to increased awareness and knowledge about biogas technology in and beyond village borders and increase local support12. This option should therefore be considered. Finally, a successful biogas project should gain local and national political support. This support could be established by enabling continuous dialogue with traditional and “modern” political leaders (village chiefs and rural councils) in the community13. Political leaders should be consulted and updated on a regular basis before, during and after the project.
The NGO or project organization should be seen as a reliable and trustworthy source of information and support. A sustainable biogas initiative should thus aim for transparency on all levels: sources of funding, household selection and project outcomes14. A publicly accessible project website should be created to facilitate this process. Additionally, local media could be regularly informed on project status and successes.
4.3 Financing Scheme
One of the main problems with the implementation of biogas technology is its affordability15. Thus, a special emphasis should be put on designing an appropri-ate and locally acceptable financing scheme. It is recommended that prior to start-ing promotional activities (see Section 4.2 Promotion and Communication), a detailed research on the locally accessible financing institutions is conducted. The results should be used to develop different financing schemes, present vari-ous financing options and consequent scenarios, and involve households in the selection process (see Section 4.4 Household Selection and Installation Require-ments). It should be made clear that the beneficiaries of the program need to con-tribute, either in money or in material contribution and work. Sufficient funds should be raised by the project implementing organization to cover operational costs for future repairs and any routine check-ups.
Financing options explored in the following text are based on the model commu-nity of the RC of Koulor, thus further research might be needed, depending on the time and place of the biogas implementation. A simple formula can be used
12 See Section 3.1.2 Civil society and private sector involvement. 13 See Section 3.1.1 Political power and governance structures. 14 See Section 3.1.2 Civil society and private sector involvement. 15 See Section 3.5.5 Financing.

Kostin, Strauss and Tavčar
212
to assess the amount of money that needs to be provided by the selected house-hold in order to finance the initial investment costs, see equation (11)16
𝑋 = 𝑆 ∗ 𝑋 + 𝑌 → 𝑋 ∗ (1 − 𝑆) = 𝑌 (11)X
where: X = initial costs
S = subsidy Y = money provided by the beneficiary
As of January 2018, the national subsidy for domestic biogas implementation projects was 80 % of the total investment for biodigester, including the costs as-sociated with its installation, and “can be financial or in terms of work and mate-rial for the construction supplied” [Ndiaye, 2017]. The household needs to meet all the necessary requirements in order to be eligible for a subsidy17. The remain-ing 20 % as in Y, see Equation (11), depends on the cost of labor and material, costs associated with purchase of modified kitchen equipment etc.
From equation (11), Y must be obtained at the beginning of the process and should be paid by the selected household (if they have enough savings). If the amount of savings is not sufficient, an external credit needs to be acquired. In this situation, different financing options18 should be presented to the beneficiaries of the program, see equation (12):
𝑌 = 𝑁𝐺𝑂 𝑓𝑖𝑛𝑎𝑛𝑐𝑖𝑛𝑔 + 𝐶𝑜𝑚𝑚𝑢𝑛𝑖𝑡𝑦 𝑓𝑢𝑛𝑑 + 𝑀𝑖𝑐𝑟𝑜𝑓𝑖𝑛𝑎𝑛𝑐𝑖𝑛𝑔 + 𝐶𝑎𝑟𝑏𝑜𝑛 𝑐𝑟𝑒𝑑𝑖𝑡 𝑓𝑖𝑛𝑎𝑛𝑐𝑖𝑛𝑔
(12)
At least one of the mentioned options needs to be employed in order to cover the remaining 20 % of the costs (as of January 2018). In case a household is not eligible for a subsidy, the total amount X, see Equation (11) needs to be covered by one (or several) of the above mentioned options.
First, costs can be covered by a domestic or a foreign NGO interested in domestic biogas projects in the region. In this case, households would not need to borrow any additional funds. It is recommended that an agreement between the selected household and the donor NGO is signed to ensure that the implementation pro-cess is transparent and that there are no misunderstandings. Secondly, credit can
16 See Section 3.5.5 Financing. 17 See Section 3.5.5 Financing. 18 See Section 3.5.5 Financing.

Implementing sustainable domestic biogas projects in Senegal
213
be obtained from community funds and paid back by the household periodically through savings on cooking fuel and fertilizers. If this is not possible, it is recom-mended to assist with establishing such funds in the local community to cover future financial needs. The most common way of acquiring necessary credit is by exploring local microfinance institutions. It is recommended to conduct extensive research on the available microfinance institutions in the region in order to ensure that all the viable solutions have been accounted for. In Tambacounda, Caurie-MicroFinance and Jekabara are operating at the moment.
At present, carbon credit financing is only available for rural electrification pro-jects in Senegal. However, examples from Kenya and Burkina Faso show that carbon credit financing is increasingly utilized for domestic biogas projects. Thus, it is recommended to explore the availability of this option at the time of developing a project.
Since the operational costs of a biodigester are negligible19, the main burden for the households is to pay off the credit. This can be done in different ways20, as illustrated by Equation (13):
𝐶𝑟𝑒𝑑𝑖𝑡 = 𝑆𝑒𝑎𝑠𝑜𝑛𝑎𝑙 𝑝𝑎𝑦𝑚𝑒𝑛𝑡 𝑠𝑦𝑠𝑡𝑒𝑚 + 𝑀𝑜𝑛𝑡ℎ𝑙𝑦 𝑖𝑛𝑠𝑡𝑎𝑙𝑙𝑚𝑒𝑛𝑡𝑠+ 𝐼𝑛𝑐𝑜𝑚𝑒 𝑓𝑟𝑜𝑚 𝑏𝑖𝑜𝑠𝑙𝑢𝑟𝑟𝑦 (13)
A seasonal payment system is the first option to pay off a loan, which can be received from a microfinance institution or community fund. It is an appropriate solution in the area, since a fairly large number of households depend on agricul-ture as their primary source of income21, thus the problem of irregular income from crop production would be eliminated.
Based on the WTP of households22, credit can be paid back through monthly installments. Taking into account 450,000 CFA francs for a 6 m3 biodigester and an established benchmark of 5,000 CFA francs per month (to cover households’ energy expenses in Tambacounda), a representative household in Tambacounda would need 18 months23 in order to pay off their credit.
19 See Section 3.4.6 Materials, installation, and maintenance. 20 See Section 3.5.5 Financing. 21 See Section 3.5.1 Economic development of the region. 22 See Section 3.5.3 Willingness to pay (WTP). 23 Based on previously developed equation (11), assuming the price of biodigester to be
450,000 CFAf (see Section 3.4.6 Materials, installation and maintenance) and a subsidy of 80 %: Y = 450,000 × 0,2 = 90,000, and, Assuming WTP to be 5,000 CFAf per month (see Section 3.5.3 Willingness to pay WTP): 90,000 ÷ 5,000 = 18 months.

Kostin, Strauss and Tavčar
214
The last option to pay off credit is by making use of bio-slurry24. It can be sold as a fertilizer to other farmers or it can replace the need to purchase chemical fertilizers. Thus, it is recommended to explore the market and see where the big-gest demand for the fertilizer is at the moment. The NGO/biogas program coor-dinator should establish connections with potential customers or business part-ners who would be interested in buying fertilizer. Another way of making extra income to help pay off loans is by encouraging selected households to use bio-slurry as a fertilizer on their own land. This could lead to higher crop yields, thus the excess produce could be sold on the local markets and become a source of extra income.
4.4 Household Selection and Installation Requirements
When determining households and individuals eligible for a biogas digester, it is recommended to connect a single biodigester to the corresponding household, and not to make multiple connections. However, in the household selection pro-cess, collaboration should be encouraged (see Section 4.6 Community Develop-ment). Since cow manure has proven to be the most widely available and acces-sible form of feedstock, it should be used as the main source of feedstock25. Goat manure can provide supplemental feedstock for co-digestion or be used in the smallest sized digester, if desired by the household. Further research on the use of alternative feedstock should only be considered once the biogas project has been well established and accepted.
According to the results of the analysis, the following process is recommended when selecting households for installing a biodigester:
1. Survey and select rural villages that visibly practice intensive cattle man-agement (i.e. look for animal sheds, cow grazing patterns).
2. Conduct a small group meeting/information session for interested com-munity members that have already been informed about the project (see Section 4.2 Promotion and Communication). Provide a concise overview of the installation process, net investment cost that the household would have to finance (20 % of total investment cost as of January 2018), po-tential additional expenses, and an overview of financing options (see Section 4.3 Financing Scheme). Discuss and present, with visual aids, three simplified scenarios for one digester size26: a. Price of high quality digester and appropriate financing options b. Price of middle quality digester and appropriate financing options c. Price of low quality digester and appropriate financing options
24 See Section 3.5.6 Potential to use bio-slurry. 25 See Section 3.4.2 Substrates. 26 See Table 5a and Table 5b in Section 3.4.6 Materials, installation and maintenance.

Implementing sustainable domestic biogas projects in Senegal
215
3. Establish and communicate the basic technical requirements that house-holds need in order to qualify for a biogas digester27. Note that for specific installation and construction details, a technical installment manual for the fixed-dome model of choice should be consulted. a. 2-10 cattle, depending on size, or 20 goats (only for a maximum size
of 4m3)28. b. Cattle/goats must be held in animal pens at night or gated for part of
the day; holding area/animal pens must adjacent to the main residence where the biodigester will be connected.
c. The biodigester should be located no more than 20 m away from both the animal shed and the kitchen or wherever the light and stove will be installed [SNV2006]. Ensuring proximity to both the feedstock source and the kitchen source will make operating and maintaining the digester more convenient.
d. As a means of controlling and mitigating erosion, the digester should be covered with a compact layer of earth that does not erode over time, while the earth used to cover the underground installation should not be too sandy or dry.
e. The digester should not be installed in a crowded area (i.e. with many permanent walls, gates or shrubs), as this could limit accessibility to the tank during maintenance or repair operations. Alternatively, it can be installed near a wall or tree that provides partial shade during the hottest hours of the day, in order to maintain a year-round ambient temperature of approximately 35°C. The bio-slurry collection pit should be located in a shaded space and away from any potential groundwater source or food storage areas; covering the pile with a cloth or a simple structure can provide shade.
f. Gravitational pipes should be used to facilitate easy movement of sub-strate and bio-slurry in and out of the digester in order to prevent pipe blockages or malfunctions. If socially acceptable, an additional col-lection tube can be connected to the latrine to cycle human waste into the tank, thus improving the state of sanitation and providing much-needed waste management for the rural community [SEM2011].29
g. Each digester size must receive required daily amount of water/ma-nure. Manure must be mixed in a 1:1 ratio with water or cow/goat urine (i.e. 10 kg daily manure from one cow must be mixed with 10
27 See Table 6 in Section 3.4.7 Operability. 28 Although goats produce higher amounts of biogas per kg of manure in comparison to cattle
[HAN2017], at least 20 kg of manure would need to be added to the digester daily, thus making the collection and loading of feedstock extremely time-consuming. Households are encouraged not to exceed the 4 m3 size digester if only using goat manure.
29 However, latrine connections should only be considered as an additional project to pursue once the main digester is up and running, as the households and communities would likely need time to get acquainted with biogas technology and bio-slurry usage before accepting the idea of hu-man waste as a feedstock.

Kostin, Strauss and Tavčar
216
L water or urine); animal boreholes or wells must be located within comfortable walking distance or urine collection needs to be other-wise possible.
h. Households must have well-established or clear land occupancy rights; installation of the biodigester is permanent and cannot be moved30.
4. After explaining the critical technical requirements, identify households, families or individuals who are interested in owning/operating a biodi-gester, receiving training, helping maintain or collect urine/manure, use of cooking stove/bio-slurry, or providing unskilled labor for construction process. Allow time for negotiating between individuals to determine who and how each individual can contribute, and what they can receive in return (i.e. providing unskilled labor in exchange for food, phone credit, reciprocal volunteering assistance). Furthermore, individuals who want to own a digester should ensure that the daily operational and maintenance tasks could be delegated fairly.
5. A site check should be conducted to approve households who want a bi-odigester, and ensure that they meet all conditions set out in step 3. All adult members of the household must consent to and undergo a pre-con-struction household training (see step 2 of Technical Training and Em-ployment). Two members of the household must agree to attend in-depth household training during installation (see step 5 of Technical Training and Employment).
6. Determine daily cooking and lighting requirements, appropriate digester size and materials for each household. A simplified formula, see equation (14) can determine how many cows are needed and the appropriate di-gester size needed to meet expected cooking and lighting time (see Ta-ble 6):
400c = 400x + 175y (14)
Where: c = number of cows x = total cooking hours y = total lighting hours [SNV2006]31
30 See Section 3.6.1 Land tenure, decentralized jurisdiction and customary law. 31 Calculated using estimates from SNV Lao PDR [SNV2006]. In this model, worst-case esti-
mates are taken from known values to produce a low-risk formula, which factors in any poten-tial energy loss due to illness, technical malfunction, or low quality feedstock. According to SNV Lao PDR [SNV2006], one cow produces 10-14 kg per day, one cook stove consumes 350-400 L biogas per hour, one lamp consumes 150-175 L biogas per hour, and 1 kg cow manure produces 40 L biogas. Thus, the formula assumes that one cow produces 10 kg daily manure (equivalent to 400 L biogas), one biogas stove consumes 400 L per hour, and one biogas lamp consumes 175 L per hour.

Implementing sustainable domestic biogas projects in Senegal
217
Table 8: Digester size, resources and energy provision Size Recommended number of
cows Maximum cooking time (assume no lighting)
4 m3 digester 2-4 2-4 hour 6 m3 digester 5-6 5-6 hour 8 m3 digester 7-8 7-8 hour 10 m3 digester 9-10 9-10 hour
7. Ensure that interested households are aware of and consent to both mon-
etary and non-monetary requirements, as well as maintenance and opera-tion (i.e. bio-slurry collection, manure and water collection, occasional emptying of digester, initial start-up time). Review the chosen financing scheme for covering the remaining 20 %, record audio to keep a record of conversation, and have them sign a written contract (as suggested by interviewee MasonAVSF [2017]). Review timeline and details of con-struction process.
4.5 Technical Training and Employment
The training process should aim to maximize involvement, long-term commit-ment and understanding of biogas technology by the local community32. First and foremost, every effort should be made to bring in professionals and workers from the local surroundings, such as from within the household, village, nearby city, or from regional firms or construction agencies within Tambacounda. During the very first biogas installation, the NGO/biogas program coordinator should con-duct a “Train the trainers” program, in order to foster the transfer of technical capacity from the very beginning. Those who successfully complete this program will become authorized trainers, and will be largely responsible for the imple-mentation of the digester and the other training sessions. This will enable the NGO/program coordinator to take on a more supportive role, maintaining respon-sibility only for household selection, provision of financial support for material purchases, and logistical support. In total, there are five major training phases which should be conducted: the “train the trainers” will be the most important step for catalyzing the local technical and training capacity, while the last four will be led by the trained local professionals. To obtain a detailed assessment and overview of funding strategies for the training and implementation program, con-sultation with financial management experts, local and international grant organ-izations, as well as financial implementation protocols from relevant NGO pro-grams are recommended.
32 See Section 3.4.8 Technical capacity.

Kostin, Strauss and Tavčar
218
4.5.1 Train the trainers
A group of technical experts, engineers and/or skilled construction workers who speak the local dialect should be trained to become responsible for supervision of installation, materials purchasing, quality control and all subsequent training of unskilled workers. This phase will develop technical capacity among skilled persons and promote entrepreneurial capacity in the long-term. The NGO/pro-gram coordinator is responsible for planning and executing this training. Theo-retical sessions should be taught before the first digester is installed; practical sessions should be conducted throughout the installation of the first digester. From the second installation onwards, authorized trainers can take on increasing responsibility and independence for leading the project. Beyond the scope of the project, authorized trainers will be equipped to educate and train others in biogas technology, and to pursue further involvement in the biogas sector. The basic structure of the “train the trainers” program should be as follows:
● Scope and nature of the biogas project: 1. Financing, progress and activities 2. Institutional support, local laws and regulations
● Biogas technology: technical requirements, environmental impact ● Fixed-Dome Biogas construction, design, sizing, materials:
1. Digging of pit, base, digester and dome construction 2. Plastering, outlet, inlet, pipeline and appliance installation 3. Slurry pit construction and bio-slurry usage 4. Materials purchasing, invoicing and financial transparency
● Operation and maintenance: roles and responsibilities ● Quality management, supervision and monitoring:
1. Devising a quality control protocol: conducting pre- and post- con-struction quality checks, documentation and submitting reports/forms to NGO/program coordinator
2. Developing a long-term monitoring protocol and communication strategy with NGO/program coordinator
● Developing training programs: 1. Project management, leadership 2. Effective training and teaching strategies 3. Communication 4. Gender equality, shared responsibility
● Conclusion of training with documentation of events, group discussions and reflection, training feedback, assignment and scheduling of author-ized trainers.
4.5.2 General Training Sessions
After the completion of the program, the local authorized trainers should be re-sponsible for developing and conducting the general training sessions for the re-mainder of the digester implementation, which are briefly summarized below in

Implementing sustainable domestic biogas projects in Senegal
219
Table 9. The general training sessions should each have their own specific pur-pose and scheduling, and should be developed to target the appropriate audience.
Table 9: Contents of four general training sessions Training Program Targeted Audience Duration and Ti-
meline Content
Pre-construction Household Training, single day
Households approved to receive a biodi-gester.
-single day, after household ap-proval and before digester installation
-discuss prior knowledge, expec-tations, responsibilities -operation, maintenance -use of bio-slurry, appliances, re-pairs and troubleshooting
In-depth Household Training
Two members of household (one male and one female), equal gender representation is key at this point.
-3-5 days, during construction process
-deeper technical training for households, ability to shadow construction process throughout installation
Technical training Unskilled workers, mason, and volun-teers.
-14-16 days, diges-ter construction pe-riod
-technical and environmental as-pects of construction process -quality construction and tech-nical standards -installation guidance (masonry, plastering, digging)
Post-construction Household Training
Households who have received a newly in-stalled digester.
single day, after in-stallation
-review, discussion, addressing follow-up concerns or questions
4.5.3 Long-term Monitoring and Employment
Furthermore, a long-term monitoring and quality control program should be well defined, and incorporate regular contact and collaboration between the NGO/pro-gram and the authorized trainer33. In order to establish this, it is advised to issue a two-year fixed-term contract to the technicians who completed the training of trainers course, such that financial compensation as per the fixed-term contract is provided only once the repair or checkup has been completed. Households are responsible to contact the NGO/biogas program organization if the technician did not complete the required duties. For long-term monitoring and repairs after the two-year fixed contract, a standardized process should be arranged to ensure that any necessary technical repairs are conducted and compensated professionally. For example, in the case of a technical repair, households should first contact the NGO/program coordinator and lodge a request. The program coordinator should
33 See Section 3.6.5 Labor and employment legislation for NGOs.

Kostin, Strauss and Tavčar
220
review and approve the request, and then, with the approval of the household, contract a local authorized trainer/technician to visit the household and complete necessary repairs. After completion, the household should confirm and report whether the task was completed in a timely and professional manner, while the technician must also submit a technical report including images of the repair pro-cess (before and after). Upon approval, compensation can then be provided.
4.6 Community Development
To create a biogas initiative that is sustainable on an economic, environmental and social level, it is imperative to ensure that biogas does not remain a luxury for the few that can afford it, but rather an option that all members of the local community can benefit from in one way or another. In order to achieve this ob-jective, the project needs to be tailored to the specific cultural environment of the community34. A successful strategy should include goals agreed upon by the local population and encourage their involvement, thus making biogas a village initia-tive.
In order to sustain knowledge on biogas technology in a village, is important that not only select villagers receive education on the functioning and maintenance of the digesters. Community forums, informative materials (see Section 4.2 Promo-tion and Communication) and the technical training of peers can achieve this ob-jective (see Section 4.5 Technical Training and Employment).
In order to diminish inequalities between and within households35, several op-tions exist. First of all, partnerships between households should be promoted. In this way, households who do not own enough livestock can collaborate with oth-ers in collecting the sufficient amount of manure, either voluntarily or as part of a contractual agreement, thus potentially creating job opportunities. For example, the collection of cow urine and manure are tasks that could be taken on by house-holds that have insufficient resources, yet want to benefit from a digester.
It should be noted that household roles36 of men, women and children have been established over time and will likely not change throughout a short-term project. However, households should be assisted in establishing a sense of shared respon-sibility in maintaining and feeding the digester. This could be achieved by in-volving different household members in training (see Section 4.5 Technical Training and Employment) and by communicating how different household members can benefit from the digester in accordance with their household re-sponsibilities (see Section 4.2 Promotion and Communication). Collaborations
34 See Section 3.3.6 Awareness and acceptance of biogas technology. 35 See Section 3.3.5 Health and social issues related to the use of traditional fuels. 36 See Section 3.3.2 Households.

Implementing sustainable domestic biogas projects in Senegal
221
with local interest groups, initiatives as well as community organizations can en-able and facilitate villager participation in biogas projects and should thus be es-tablished. For the RC of Koulor, one of the existing organizations with whom a collaboration would be possible is the Arafat association, which aims to improve the living conditions of women in the region.


Implementing sustainable domestic biogas projects in Senegal
223
5 Conclusion The intended aim of this work was to provide a recommendation strategy for the implementation of a sustainable biogas program in rural Tambacounda, Senegal. The impoverished region has been experiencing ongoing environmental degra-dation due to the heavy reliance on traditional cooking fuels. Additionally, indoor air pollution adversely affects the health and quality of life of Tambacounda’s inhabitants. After the suitability of the region and the clear demand for biogas technology in the region were confirmed, the rural community of Koulor was chosen as a representative area for implementing a biogas initiative. Conse-quently, the ultimate objective of this research was to improve the livelihoods for those at the bottom of the pyramid37 by answering the following research ques-tion:
What strategies can be used to implement an equitable, environ-mentally sustainable, and independently manageable domestic biogas program in rural Tambacounda, Senegal?
Several political, economic, socio-cultural, technical, environmental and legal factors, relevant for the implementation of biogas, were identified through exten-sive literature research and four semi-structured expert interviews. Out of all of these factors, those critical for the success of a biogas initiative were selected based on specific criteria. A recommendation strategy was then formulated to address these factors, and was categorized into Promotion and Communication, Financing Scheme, Household Selection and Installation Requirements, Tech-nical Training and Employment, and Community Development.
In all promotion and communication activities, openness, inclusivity, and trans-parency about the biogas project were recommended to ensure that all members of the community have equal access to information and equal opportunity to get involved. By providing educational opportunities to all, community development and equal participation are fostered. Furthermore, communicating the benefits of biogas technology to community members promotes awareness and acceptance of the technology. Another important aspect of this category was to ensure con-tinuous political support by consulting and informing local authorities, such as the village chief and rural council, throughout the implementation process.
The financing scheme enables underprivileged households to benefit from bio-gas, despite the high investment costs. Through providing a variety of alternative
37 Bottom of the pyramid (BOP), also called base of the pyramid, refers to to the poorest two-
thirds of the economic pyramid, a group of more than four billion people living on less than $ 2 per day [WIN2014; PRA2006].

Kostin, Strauss and Tavčar
224
credit options and the use of the national subsidy program, the upfront costs of the digester can be minimized in the short-term, and a manageable payment plan can enable households to pay off the costs in a reasonable timeframe. Finally, the financing scheme provides households with information about opportunities to benefit from biogas technology in the long-run, for example, by establishing monetary savings.
The household selection strategy should be equitable, and enable all community members to get involved in training, learning and construction, even if they them-selves cannot obtain a digester. Through this process, the project can promote team-building and a sense of communal benefit. Installation requirements focus on implementing technical standards in the context of the local environment and climate of Tambacounda. In this way, appropriate measures can be taken to en-sure smooth functioning of the digester, reduce technical malfunctions that would cause leakages or other environmental hazards, and promote a healthy and clean environment. Furthermore, the substitution of biogas for cooking fuel in place of firewood will lead to drastic improvements in indoor air quality and deforesta-tion, thus leading to many tangible environmental benefits.
The technical training process is intended to be inclusive, exhaustive, and multi-faceted. The training of local technicians promotes long-term development of the biogas sector in the region, as these technicians can independently supervise and oversee the installment digesters in future entrepreneurial endeavours. Maximiz-ing the technical capacity of the local workforce is a key element of ensuring the biogas project can be independently sustained by the communities themselves, and is a primary indicator of success for viability. Meanwhile, community mem-bers and households can be trained so that they are self-sufficient and confident in understanding how the technology works, and how to troubleshoot in the event of malfunction. In addition, a well-developed training program should dissemi-nate knowledge about environmental issues and benefits of the technology, so that villagers become more aware of the effects of climate change and how to preserve a healthy environment.
The strategy for fostering community development promotes a communal ap-proach and an atmosphere of solidarity throughout the installation process. With this approach, households are able to negotiate among themselves and form stra-tegic partnerships with other individuals to exchange services such as construc-tion labor, digester maintenance, or manure collection in exchange for cooking time, bio-slurry use, or other resources. In addition, establishing collaborations with community organizations or initiatives ensures the long-term sustainability of the project, inclusion of locals as well as the promotion of biogas beyond vil-lage borders.

Implementing sustainable domestic biogas projects in Senegal
225
Communal digesters are an option that could be explored in further research or within already well-established biogas programs. However, there are greater technical barriers due to the increased complexity of piping installations, thus, it is necessary that households are located in close proximity to one another. Fur-thermore, this option could be suitable for households whose land rights are un-certain, as the village chief or rural council could allocate communal land for a shared digester. Whether or not households would accept using human waste as an input for a biodigester is a question that has not been sufficiently answered in research specifically relating to Senegal. However, latrine connections may be promising, due to their ability to contribute to communal hygiene and health, and should thus be considered in further research. A rural electrification project in Tambacounda involving the co-digestion of human waste and cow dung (cur-rently being planned by interviewee Ndiaye [2017]) could provide valuable in-sights into the acceptability of this feedstock in the near future.
In general, the co-digestion of other primary manures, such as goat manure and horse manure, should be explored. Goat manure is ideal for smaller digesters, but becomes problematic during manure collection for larger sizes, due to the rela-tively small volume and scattered distribution of manure. However, co-digestion of different manures, along with agricultural and organic wastes, could help to alleviate the limited access to biogas for households who do not own cattle. More experimentation with co-digestion should be carried out at demonstration sites or with the willing involvement of local residents, as uncertain levels of biogas pro-duction may not be able to satisfy household cooking requirements.
Although this work does not present a full scope of all potential considerations related to implementing domestic biogas programs, the analysis culminated into a cohesive strategy that was able to address the research question with consider-able depth. In addition to this work, an in-depth overview of the financial re-sources required for implementation, maintenance and training should be carried out by the organization prior to the commencement of the project. In accordance with the presented findings, the creation of sustainable, equitable and inde-pendently manageable biogas projects could lead to significant improvements in clean energy access, socio-economic conditions, and the environment of local communities in rural Tambacounda.


Implementing sustainable domestic biogas projects in Senegal
227
6 Discussion There are certain limitations related to the chosen methodology and the scope of the research topic which should be noted. One such limitation includes the fact that some of the findings from the analyses were based on ambiguous or uncertain data, especially with respect to environmental and political circumstances. For example, it is unknown exactly how climate change may affect the microenvi-ronment of local villages. This in turn may have an impact on the functionality of biodigesters. Furthermore, it is uncertain how susceptible local communities will be to migration and urbanization, both of which can be influenced by climate change, economic incentives or social unrest. Other data, such as information about subsidy programs and government programs supporting clean energy, are vulnerable to sudden changes due to limited resource capacity, weak political enforcement, and corruption. Ultimately, this may impede the applicability of the given recommendations when implementing biogas technology in the selected region.
Furthermore, in regard to the PESTEL analysis itself, overlapping information between the pre-defined categories could lead to redundancies. Additionally, some data might be highly relevant for multiple categories, however, the desire to avoid repetition could mean that it is only discussed in one section, potentially leading to an under-representation of certain data. Ultimately, the tendency to represent all six sectors of the PESTEL analysis as equally relevant could lead to a biased interpretation of the results.
Collecting data from secondary sources can provide a well-rounded understand-ing of a given subject. However, a better grasp of local conditions and other im-portant considerations could be achieved by considering empirical data through on-site field research and additional interviews conducted with stakeholders in the respective region. Although the data from the RC of Koulor was used to characterize the local conditions for biogas technology within the rural commu-nity as well as throughout other rural areas of Tambacounda, the 45 villages of the RC are themselves subject to variations in ethnicity, livestock management practices and water access. This brings light to the inherent variability and di-versity that exists throughout Tambacounda, which can in turn lead to drasti-cally different scenarios for biogas suitability. In general, the recommendations outlined in this work are designed to be as specific and accurate as possible, however, in some cases, the data will not necessarily reflect the conditions in all rural communities, especially in areas bordering different ethnic and socio-eco-nomic zones as well as regional/national borders. Ultimately, a concrete on-site analysis of the area of interest is always recommended before deciding on a lo-cation for implementing biogas.


Implementing sustainable domestic biogas projects in Senegal
229
List of References
[‘500 bio-di-gesteurs’ 2016]
500 BIO-DIGESTEURS PRÉVUS DANS LA RÉGION DE TAMBACOUNDA. (2016, July 22). Retrieved November 29, 2017, from http://www.tamba-counda.info/2016/07/22/500-bio-digesteurs-prevus-region-de-tambacounda/
[ADI2011] ADIGBLI, K. E. (2011, Sept 19). West Africa: Households Turning to Cow Dung for Energy. Retrieved December 15, 2017, from http://www.ipsnews.net/2011/09/west-africa-households-turning-to-cow-dung-for-energy/
[ADB2006] AFRICAN DEVELOPMENT BANK GROUP. Republic of Senegal. Country Governance Profile Report. ADBG, Sene-gal, March 2006.
[ARC2015] AFRICAN RISK CAPACITY. Republic of Senegal, Opera-tions Plan. ARC, Senegal, November 2015.
[ANS2015] AGENCE NATIONALE DE LA STATISTIQUE ET DE LA DEMOGRAPHIE (ANSD). Situation Economique et Sociale de la Région de Tambacounda, édition 2014. ANSD, Dakar, March 2015.
[ANS2015] AGENCE NATIONALE DE LA STATISTIQUE ET DE LA DEMOGRAPHIE (ANSD). Chapitre 3 Agriculture. In: Situ-ation Economique et Sociale de la Région de Tambacounda, édition 2013. ANSD, Dakar, April 2015.
[ANS2015] AGENCE NATIONALE DE LA STATISTIQUE ET DE LA DEMOGRAPHIE (Ansd). Chapitre 1 Demographie. In: Situ-ation Economique et Sociale de la Région de Tambacounda, édition 2013. ANSD, Dakar, April 2015.
[ANS2013] AGENCE NATIONALE DE LA STATISTIQUE ET DE LA DÉMOGRAPHIE (ANSD). Rapport définitif de la deuxième Enquête de Suivi de la Pauvreté au Sénégal (ESPS II). ANSD, Dakar, May 2013.
[ANS2014] AGENCE NATIONALE DE LA STATISTIQUE ET DE LA DEMOGRAPHIE (ANSD). Chapitre III: ALPHABETISA-TION, SCOLARISATION, NIVEAU D’INSTRUCTION ET

Kostin, Strauss and Tavčar
230
FORMATION PROFESSIONNELLE. In: Rapport Definitif: Recensement Général de la Population et de l’Habitat, de l’Ag-riculture et de l’Elevage 2013. ANSD, Dakar, September 2014.
[ANS2014] AGENCE NATIONALE DE LA STATISTIQUE ET DE LA DEMOGRAPHIE (ANSD). Chapitre II: MENAGE. In: Rapport Definitif: Recensement Général de la Population et de l’Habitat, de l’Agriculture et de l’Elevage 2013. ANSD, Dakar, September 2014.
[ANS2017] AGENCE NATIONALE DE LA STATISTIQUE ET DE LA DÉMOGRAPHIE (ANSD). (2017). Indicateurs. Retrieved November 17, 2017, from http://www.ansd.sn/ index.php?op-tion=com_regions&view=region&id=3&Itemid=1223
[ANS2017] AGENCE NATIONALE DE LA STATISTIQUE ET DE LA DÉMOGRAPHIE (ANSD). (2017). Incidence de pauvreté (en %). Retrieved November 17, 2017, from http://www.ansd.sn/ index.php?option=com_regions&view=regions&Itemid=213
[ALS2008] AL SEADI, T.; RUTZ, D.; PRASSL, H.; KÖTTNER, M.; FINSTERWALDER, T.; VOLK, S.; JANSSEN, R.: Biogas Handbook. Esbjerg, Denmark: University of Southern Den-mark Esbjerg.
[ALL2001] ALLEN, M.: The Organisation and the Macro-environment. In: Analysing the Organisational Environment. UK: Select Knowledge Limited.
[AMI2010] AMIGUN, B.; BLOTTNITZ, H.: Capacity-cost and location-cost analyses for biogas plants in Africa. In: Resources, Con-servation and Recycling, 55, p. 63–73.
[AMI2012] AMIGUN, B.; PARAWIRA, W.; MUSANGO, J. K.; ABOYADE, A. O.; BADMOS, A. S.: Anaerobic Biogas Gen-eration for Rural Area Energy Provision in Africa. In: Kumar, S. (Hrsg.): Biogas. Rijeka, Croatia: InTech.
Implementing sustainable domestic biogas projects in Senegal
231
[BA2017] BA, M.; MÉDOC, J. M.: WABEF Support to Renewable En-ergy Development in Senegal. In: Urban Agriculture Maga-zine, 32, p. 24-25.
[BAS2004] BASU, R.: Tools for analysis - PESTEL analysis. In: Imple-menting quality: A Practical Guide to Tools and Techniques. London, UK: Thomson Learning.
[BIA2014] BIAGUI, E. P., NIANG, M.: Rapport d’activites 2014 Projet Ferlo. In: Internal AVSF (Agronome et Vétérinaires Sans Frontières) report, unpublished.
[BLA2006] BLACKDEN, C. M., WODON, Q. (Hrsg.): Gender, time use, and poverty in sub-Saharan Africa (World Bank Working Pa-per No. 73). Washington, D.C., USA.
[BLO2014] BLOOMFIELD, E.; NDOUR, A.; SARRA, S.; GUEYE, Y. D.; KHENNAS, S.; LAKEW, H.: Baseline and feasibility as-sessment for alternative cooking fuels in Senegal. The World Bank, Washington, D.C., May 2014.
[BRE2014] BREW-HAMMOND, A.; MENSAH, G. S.; AMPONSAH, O.: Energy Poverty in Sub-Saharan Africa: Poverty Amidst Abundance. In: HALFF, A.; SOVACOOL, B. K.; ROZHON, J. (Hrsg.): Energy poverty: global challenges and local solu-tions. Oxford, UK: Oxford University Press.
[BRU2014] BRUUN, S.; STOUMANN JENSEN, L.; KHANH VU, V. T.: SOMMER, S.: Small-scale household biogas digesters: An op-tion for global warming mitigation or a potential climate bomb? In: Renewable and Sustainable Energy Reviews, 33, p. 736-741.
[CHA1992] CHASTANET, M.: Survival Strategies of a Sahelian Society: The Case of the Soninke in Senegal from the Middle of the Nineteenth century to the Present. In: Food and Foodways, 5(2), S. 127-149.
[CHÁ2016] CHÁVES-FUENTES, J.; CAPOBIANCO, A.; CZÖLDE-ROVÁ, M.; HUTNAN, M.: Manure from our agricultural an-imals: A quantitative and qualitative analysis focused on bio-gas production. Bratislava, Slovakia and Naples, Italy.
Kostin, Strauss and Tavčar
232
[CID-N.D.] CARBON INITIATIVE FOR DEVELOPMENT (CI-DEV). (n.d.). West Africa Biodigesters. Retrieved December 16, 2017, from http://www.ci-dev.org
[CID-N.D.] CARBON INITIATIVE FOR DEVELOPMENT (CI-DEV). (N.D.). Kenya: SimGas Biodigesters. Retrieved December 15, 2017, from http://www.ci-dev.org/SimGas
[CID-N.D.] CARBON INITIATIVE FOR DEVELOPMENT (CI-DEV). (N.D.). Projects. Retrieved December 15, 2017 from https://www.ci-dev.org/Projects
[CID-N.D.] CARBON INITIATIVE FOR DEVELOPMENT (CI-DEV). (N.D.). Senegal: Rural Electrification. Retrieved December 15, 2017, from https://www.ci-dev.org/SenegalRE
[CDM2012] CLEAN DEVELOPMENT MECHANISM SMALL-SCALE WORKING GROUP (CDM- SSC WG). (2012). Top-down de-velopment of standardized approaches for rural energy supply (biogas). Retrieved November 20, 2017, from https://cdm.un-fccc.int/Panels/ssc_wg/meetings/036/ssc_036_an10.pdf
[CSC2016] CLIMATE SERVICE CENTER GERMANY (GERICS). Cli-mate-Fact-Sheet; Senegal - The Gambia (Fact sheet). Ham-burg, Germany.
[CLI2017] CLIMATESCOPE 2017. (2017). Senegal 2030 Emissions Re-duction Target. Retrieved from http://global-cli-matescope.org/en/policies/#/policy/5044
[CLI2017] CLIMATESCOPE 2017. (2017). Senegal Renewable Energy Target. Retrieved from http://global-climatescope.org/en/pol-icies/#/policy/3857
[DAI2012] DAIRY NZ. (2012). Standing dairy cows off pasture – a po-tential mitigation strategy to reduce nitrate leaching (7-25). Retrieved December 5, 2017, https://www. dairynz.co.nz/me-dia/255954/7-25_Standing_cows_off_pasture_2012.pdf
[DEV2015] DEVILLARD, A.; BACCHI, A.; NOACK, M.: Country Chap-ters - Senegal. In: A Survey on Migration Policies in West Af-rica. Vienna, Austria and Dakar, Senegal: International Centre

Implementing sustainable domestic biogas projects in Senegal
233
for Migration Policy Development and International Organi-zation for Migration.
[DIA2010] DIALLO, I.: The politics of national languages in postcolonial Senegal. Amherst, NY: Cambria Press.
[ESP2012] ESPOSITO, G.; FRUNZO, L.; LIOTTA, F.; PANICO, A.; PI-ROZZI, F.: Bio-Methane Potential Tests to Measure the Bio-gas Production from the Digestion and Co-Digestion of Com-plex Organic Substrates. In: The Open Environmental Engine-ering Journal, 5, p. 1-8.
[FAL2014] FALL, S. (2014, August 8). Scaling up the use of biogas tech-nology in rural Senegal. Retrieved December 10, 2017 from http://africanclimate.net/en/cases/scaling-use-biogas-technol-ogy-rural-senegal
[FAL2015] FALL, P. (2015, January 28). Senegal: Building Resilience for Rural Communities. Retrieved January 10, 2018 from https://www.wfp.org/stories/senegal-building-resiliance-ru-ral-communities
[FAY2006] FAYE, P. (2006). Decentralisation, pluralisme institutionnel et democratie locale: Etude de cas de la gestion du massif fo-restier Missirah/Kothiary (region de Tambacounda, Senegal). Conseil pour le développement de la recherche en sciences sociales en Afrique (CODESRIA), Dakar, May 2006.
[FAY2017] Faye, P., Haller, T., Ribot, J.: Shaping Rules and Practice for More Justice. Local Conventions and Local Resistance in Eastern Senegal. In: Human Ecology, p. 1-11.
[FAL-N.D.] FONDATION AIR LIQUIDE. (N. D.). Development of biogas in Senegal with Agronomes et Vétérinaires Sans Frontières (AVSF) association. Retrieved December 15, 2017 from https://www.fondationairliquide.com/en/development-biogas-senegal-0
[FHR2017] FREEDOM HOUSE RANKINGS. (2017). Senegal. Retrieved January 11, 2018 from https://freedomhouse.org/report/free-dom-world/2017/senegal
[GAY2007] GAYE, A. (2007). Access to energy and human development (UNDP Human development report, 2007/2008). Retrieved February 7, 2018 from http://purocihle.rrojasdata-bank.info/gaye_amie.pdf

Kostin, Strauss and Tavčar
234
[GOL2014] GOLDENBERG, S. (2014, March 31). Climate change: the poor will suffer most. Retrieved January 15, 2018 from https://www.theguardian.com/environment/2014/mar/31/cli-mate-change-poor-suffer-most-un-report
[GUP2014] GUPTA, V. K., TUOHY, M. G., KUBICEK, C. P., SAD-DLER, J., XU, F. (Hrsg.): Bioenergy Research: Advances and Applications. Oxford, UK: Elsevier.
[HAN2017] HANAFIAH, M. M., MOHAMED ALI, M. Y., ABDUL AZIZ, N. I. H., ASHRAF, M. A., HALIM, A. A., LEE, K. E., IDRIS, M.: Biogas production from goat and chicken manure in Malaysia. In: Applied Ecology and Environmental Rese-arch, 15(3), p. 529-535.
[HEG2007] HEEGDE, F., DIOP, L., UKKERMAN, R. Report on the fea-sibility study on a national programme for domestic biogas in Senegal. Agence Senegalais d’Electification Rurale (ASER) and SNV-Netherlands Development Organization – West Af-rica (SNV-WA), The Hague, September 2007.
[HEG2007] HEEGDE, F., SONDER, K. (2007). Domestic biogas in Af-rica; a first assessment of the potential and need (Draft / Dis-cussion Paper). Retrieved December 12, 2017 from https://bibalex.org/baifa/Attachment/Documents/172329.pdf
[HRU2011] HRUBESCH, C.: Les énergies renouvelables: les bases, la technologie et le potentiel au Sénégal. Dakar, Senegal: GIZ - PERACOD.
[HUB2007] HUBA, E. M., FALL, P. A., SANOGO, O., KABORE, G., BRACKEN, P. Feasibility Study for a National Domestic Bi-ogas Programme in Burkina Faso. GTZ, Eschborn, July 2007.
[ICN2017] THE INTERNATIONAL CENTER FOR NOT-FOR-PROFIT LAW (ICNL). (2017). Civic Freedom Monitor: Senegal. Re-trieved December 11, 2017 from http://www.icnl.org/re-search/monitor/Senegal.html
[IEA2017] INTERNATIONAL ENERGY AGENCY (IEA). (2017). Re-newable Energy Law. Retrieved December 5, 2017 from https://www.iea.org/policiesandmeasures/renewableen-ergy/?country=Senegal

Implementing sustainable domestic biogas projects in Senegal
235
[IEA2017] INTERNATIONAL ENERGY AGENCY (IEA). (2017). Sen-egalese National Biogas Programme Phase I. Retrieved De-cember 5, 2017 from https://www.iea.org/policiesandmeas-ures/renewableenergy/?country=Senegal
[IEA2017] INTERNATIONAL ENERGY AGENCY (IEA). (2017). 2007-2012 Special Programme for Biofuels. Retrieved De-cember 5, 2017 from https://www.iea.org/policiesandmeas-ures/renewableenergy/?country=Senegal
[IEA2017] INTERNATIONAL ENERGY AGENCY (IEA). (2017). Pro-gram for the promotion of renewable energies, rural electrifi-cation and sustainable supply in domestic fuel (PERACOD). Retrieved December 5, 2017 from https://www.iea.org/poli-ciesandmeasures/renewableenergy/?country=Senegal
[IEA2017] INTERNATIONAL ENERGY AGENCY (IEA). (2017). World Energy Outlook. Retrieved December 9, 2017 from https://www.iea.org/weo2017/
[IEA2017] INTERNATIONAL ENERGY AGENCY (IEA). (2017). En-ergy Access Outlook 2017. Retrieved February 7, 2018 from https://www.iea.org/access2017/
[IEA2017] INTERNATIONAL ENERGY AGENCY (IEA). (2017). Pol-icies and Measures Renewable Energy Senegal. Retrieved De-cember 5, 2017 from https://www.iea.org/policiesandmeas-ures/renewableenergy/?country=Senegal
[IMF2013] INTERNATIONAL MONETARY FUND (IMF). Senegal: Poverty Reduction Strategy Paper (IMF Country Report No. 13/194). IMF, Washington, D.C., July 2013
[IRE2013] INTERNATIONAL RENEWABLE ENERGY AGENCY (IRENA). Senegal Renewable Readiness Assessment 2012. IRENA, Abu Dhabi, 2012.
[JUS2015] JUSRUT, P. The process of institutional choice and recogni-tion for decentralized forest management in charcoal-produc-ing zones of Tambacounda, Senegal (RFGI Working Paper No. 32). Conseil pour le développement de la richer- che en sciences sociales en Afrique (CODESRIA), Dakar, 2015.

Kostin, Strauss and Tavčar
236
[KAN1992] KANWAR, S.; KALIA, A.: Anaerobic fermentation of sheep droppings for biogas production. In: World Journal of Micro-biology and Biotechnology, 9(2), p. 174-175.
[KER2011] KERNAN, A. (2011, December). Senegal Program Converts Animal Waste to Fuel and Fertilizer. Retrieved November 29, 2017, from https://cleanenergysolutions.org/news/blog/sene-gal-program-converts-animal-waste-fuel-and-fertilizer
[KHA2013] KHATAVKAR, A.; MATTHEWS, S.: Bio-Latrines. United Kingdom: Practical Action.
[KRE1990] KREIKE, E.: Report to the Senegal agricultural sector analy-sis: Local communities, renewable natural resources manage-ment, and sustainable agriculture in Senegal. Washington, D.C.: United States Agency for International Development.
[KUE2005] KUENZI, M.: Non-formal education and community develop-ment in Senegal. In: Community Development Journal, 41(2), p. 210-222.
[KUM2015] KUMAR, A.; MANDAL, B.; SHARMA, A.: Advancement in Biogas Digester. In: SHARMA, A.; KAR, S. K. (Hrsg.): En-ergy Sustainability Through Green Energy. New Delhi, India: Springer India.
[LAS2010] LASCANO, G.; ZANTON, G.; HEINRICHS, A.; WEISS, W.: Technical note: A noninvasive urine collection device for fe-male cattle: modification of the urine cup collection method. In: Journal of Dairy Science, 93(6), p. 2691-2694.
[LUO2011] LUOSTARINEN, S.; NORMAK, A.; EDSTRÖM, M.: Baltic Forum for Innovative Technologies for Sustainable Manure Management. Overview of Biogas Technology. Retrieved No-vember 18, 2017 from http://balticmanure.odeum.com/down-load/Reports/baltic_manure_biogas_final_total.pdf
[MAR2016] MARREE, F. (2016). Report of the Africa Biogas and Clean Cooking Conference, 5-7 April 2016. Addis Abeba, Ethiopia. Retrieved February 9, 2018 from https://de.slideshare.net/FredMarree/report-of-the-africa-bio-gas-and-clean-cooking-conference-57-april-2016-62612480
[MAT2003] MATA-ALVAREZ, J. (Hrsg.): Biomethanization of the Or-ganic Fraction of Municipal Solid Waste. London, United Kingdom.
https://cleanenergysolutions.org/news/blog/senegal-program-converts-animal-waste-fuel-and-fertilizer

Implementing sustainable domestic biogas projects in Senegal
237
[MAT2016] MATUSZEWSKA, A.; OWCZUK, M.; ZAMOJSKA-JAROSZEWICZ, A.; JAKUBIAK-LASOCKA, J.; LASOCKI, J.; ORLIŃSKI, P.: Evaluation of the biological methane potential of various feedstock for the production of biogas to supply agricultural tractors. In: Energy Conversion and Management, 125, p. 1-11.
[MCC2015] MILLENIUM CHALLENGE CORPORATION. UNLOCK-ING. TRANSFORMING. SECURING: 2015 SENEGAL COM-PACT: Vitalizing the Future of Senegal through Road Reha-bilitation, Irrigation & Water Resources Management and Land Tenure Security. MILLENIUM CHALLENGE AC-COUNT - MCA SENEGAL, Dakar, 2015.
[MIL2014] MILLER, D.; WASSON, M.; TRAZSKA, S.; COXON, S.-K.; DINSHAW, A.; MCGRAY, H.; BAPTISTA, S.; RIO, A.; BROTTEM, L.; FINAN, T.; BARO, M.; LO, H. M.; DIALLO, M.; DIEYE, A. M.; SALL, A. D. S. D. G. F. A.; SALL, B.; DIOP, M.; LEYE, M.; NDOUR, Y.; NGOME, Y.; TOURE, K.; SALL, M.: Senegal Climate Change Vulnerability Assess-ment and Options Analysis. Washington, DC, USA.
[MED2015] MINISTÉRE DE L’ENVIRONNEMENT ET DU DEVEL-OPPEMENT DURABLE (MEDD). Contribution Prevue De-terminee au Niveau National (CPDN). MEDD, Dakar, Sep-tember 2015.
[MPE2015] MINISTÉRE DU PÉTROLE ET DES ENERGIES. (2015). PNB-SN: Programme National De Biogaz Domestique. Re-trieved January 10, 2017 from http://www.ener-gie.gouv.sn/content/pnb-sn
[MUL2007] MULLER, A. (2007). Termination of employment legislation digest. Retrieved December 1, 2017 from http://www.ilo.org/dyn/ eplex/docs/38/Senegal.pdf
[NAG1999] NAGAMANI, B.; RAMASAMY, K.: Biogas production tech-nology: An Indian perspective. In: Current Science, 77(1), p. 44-55.
[NES2017] NESHAT, S.; MOHAMMADI, M.; NAJAFPOUR, G.; LAHI-JANI, P.: Anaerobic co-digestion of animal manures and lig-nocellulosic residues as a potent approach for sustainable bi-ogas production. In: Renewable and Sustainable Energy Re-views, 79, p. 308-322.

Kostin, Strauss and Tavčar
238
[NEA2017] NETHERLANDS ENTERPRISE AGENCY (NEA). Energy sector analysis Senegal. Petroleum & Gas. NEA, The Hague, August 2017.
[NIS2016] NISHIMWE, H.; IMANANTIREGANYA, I.; MBONYI, M.: Impact and effectiveness of Rwanda’s National Domestic Bio-gas Programme. In: International Journal of Environmental Studies, 73(3), p. 402-421.
[ORS2014] ORSKOV, B.; YONGABI, K.; SUBEDIA, M.; SMITH, J.: Overview of Holistic Application of Biogas for Small Scale Farmers in Sub-Saharan Africa. Aberdeen, UK and Bamenda Cameroon PRF, Cameroon.
[OWE2008] OWEKISA, D. Financing Domestic Biogas in Rwanda. SNV-Rwanda, Kigali, October 2008.
[PF2018] PHILLIPSON FOUNDATION. (2018). Inter-Associations Aliniha Autogérées de la région de Tambacounda (Sénégal). Retrieved January 17, 2017 from http://www.philippsonfoun-dation.org/index.php?id=111
[PIE2016] PIETERS, H.; VAN DEN BROECK, G.; MAERTENS, M.; SWINNEN, J.: Large-scale agricultural investments by pri-vate exports companies: evidence from Senegal, presented at the Annual World Bank Conference on Land and Poverty. Washington, D.C., March 14-18.
[PNB2010] PNB-SN: Programme National de Biogaz domestique du Sé-négal Phase 1, Arrete Ministeriel No. 12100, J. O. No. 6519 (2010). Retrieved October 28, 2017 from http://www.jo.gouv.sn/spip.php?article7948
[POS2003] POST, J.; SNEL, M.: The impact of decentralised forest man-agement on charcoal production practices in Eastern Senegal. In: Geoforum, 34, p. 85–98.
[PRA2006] PRAHALAD, C.K.: The Fortune at the Bottom of the Pyra-mid: Eradicating Poverty through Profits. Upper Saddle River, New Jersey, USA.
[PUT2015] PUTTI, V.R.; TSAN, M.; MEHTA, S.; KAMMILA, S. The State of the Global Clean and Improved Cooking Sector (Tech-nical Report 007/15). The International Bank for Reconstruc-tion and Development / THE WORLD BANK GROUP, Washington, D.C., May 2015.

Implementing sustainable domestic biogas projects in Senegal
239
[RAJ2012] RAJENDRAN, K.; ASLANZADEH, S.; TAHERZADEH, M.: Household Biogas Digester- A Review. In: Energies, 5, p. 2911-2942.
[RAK2013] RAKOTOJAONA, L.: Domestic Biogas Development in De-veloping Countries. ENEA Consulting, Paris, July 2013.
[REO2011] RENEWABLE ENERGY ORIENTATION LAW OF 2010, Law No. 2010-21, J. O. No. 6581 (2011). Retrieved December 2, 2017, from http://www.jo.gouv.sn/spip.php?article8906
[SAH2016] SAHOO, K. C. (2016, December 20). Senegal pilots carbon finance to connect people to power. Retrieved December 15, 2017, from http://blogs.worldbank.org/climatechange/sene-gal-pilots-carbon-finance-connect-people-power
[SEC2016] SECK, M.; MARSHALL, K.; FADIGA, M.: Policy Frame-work for dairy development in Senegal. International Live-stock Research Institute (ILRI), Nairobi, Kenya.
[SEC2007] SECK, P. (2007). The Rural Energy Challenge in Senegal: A Mission Report (Report prepared for the Human Development Report 2007/2008, Occasional Paper No. 60). Retrieved No-vember 13, 2017 fromhttp://hdr.undp.org/en/re-ports/global/hdr2007-2008/papers/Seck_Papa_SENE-GAL.pdf
[SEM2011] SEMIS. Direction de l’Hydraulique Rurale PEPAM. Sous-programme PEPAM IDA. PLHA: Communauté Rurale de Koulor. SEMIS, Dakar, December 2011.
[SEN2009] SENE, A. A.: Sous-Programme IDA: régions de Saint-Louis, Matam et Tambacounda: cadre de Gestion Environmentale et Sociale (Report No. E2201). World Bank, Dakar, June 2009.
[SEP2016] SEPPALA, J. (2016, January 29). Bringing better biodigesters and clean energy to Africa. Retrieved December 16, 2017, from https://blogs.worldbank.org/climatechange/bringing-bet-ter-biodigesters-and-clean-energy-africa
[SOV2014] SOVACOOL, B.K.: Defining, Measuring, and Tackling En-ergy Poverty. In: Halff, A.; Sovacool, B. K.; Rozhon, J. (Hrsg.): Energy poverty: global challenges and local solutions. Oxford, UK.
[SMI2014] SMITH, J.; ABEGAZ, A.; MATTHEWS, R.; SUBEDI, M.; ORSKOV, B.; TUMWESIGE, V.; SMITH, P.: What is the po-tential for biogas digesters to improve soil fertility and crop

Kostin, Strauss and Tavčar
240
production in Sub-Saharan Africa? Retrieved January 5, 2018, from http://aura.abdn.ac.uk/bitstream/han-dle/2164/4013/6._Smith_et_al_2014.pdf?sequence=1
[SNV2006] SNV LAO PDR. (2006). Trainee’s Manual for Training of Trainers for Construction and Supervision of Biogas. Re-trieved December 10, 2017 from http://www.bibalex.org/Search4Dev/files/338827/172327.pdf
[SNV2013] SNV NETHERLANDS DEVELOPMENT ORGANIZA-TION: Milestone of 500,000 biodigesters reached. In: Dome-stic Biogas Newsletter, 8, p. 1-7.
[STO2010] STODDARD, I.: Communal Polyethylene Biogas Systems: Experiences from on-farm research in rural West Java. Up-psala, Sweden: Uppsala University.
[SUB2011] SUBBARAO, S.; LLOYD, B.: Can the Clean Development Mechanism (CDM) Deliver? In: Energy Policy, 39(3), p. 1600-1611.
[SUB2014] SUBEDI, M.; MATTHEWS, R. B.; POGSON, M.; ABEGAZ, A.; BALANA, B. B.; OYESIKU-BLAKEMORE, J.; SMITH, J.: Can biogas digesters help to reduce deforestation in Af-rica? In: Biomass and Bioenergy, 70, p. 87-98.
[‘TAMBA-COUNDA’2016]
TAMBACOUNDA: UN COMBAT SYNERGIQUE CON-TRE LE TRAFIC ILLICITE DU BOIS. (2016, April 28). Re-trieved November 20, 2017 from https://actuprime.com/tam-bacounda-combat-synergique-contre-trafic-illicite-bois/
[UND2005] UNITED NATION DEVELOPMENT PROGRAMME (UNDP). (2005). Energy Services for the Millennium Devel-opment Goals. Retrieved February 7, 2018, from http://www.undp.org/content/undp/en/home/librarypage/envi-ronment-energy/sustainable_energy/energy_ser-vices_forthemillenniumdevelopmentgoals.html
[UND2016] UNITED NATIONS DEVELOPMENT PROGRAMME (UNDP). (2016). Human Development for Everyone (Briefing note for countries on the 2016 Human Development Report: Senegal). Retrieved November 12, 2017 from http://hdr.undp.org/sites/all/themes/hdr_theme/country-notes/SEN.pdf

Implementing sustainable domestic biogas projects in Senegal
241
[USA2007] UNITED STATES AGENCY FOR INTERNATIONAL DE-VELOPMENT (USAID). Corruption Assessment: Senegal. USAID, Dakar, August 2007.
[USA2008] UNITED STATES AGENCY FOR INTERNATIONAL DE-VELOPMENT (USAID). Agriculture – Natural Resource Management Project - Wula Nafaa (Final Report, Feb 2003 - May 2008). USAID, Dakar, May 2008.
[USA2008] UNITED STATES AGENCY FOR INTERNATIONAL DE-VELOPMENT (USAID). Senegal Biodiversity and Tropical Forests Assessment: Prosperity, Livelihoods and Conserving Ecosystems (PLACE) IQC Task Order #1. USAID, Dakar, March 2008.
[USA2010] UNITED STATES AGENCY FOR INTERNATIONAL DE-VELOPMENT (USAID). Senegal—Property Rights and Re-source Governance Profile. USAID, Dakar, 2010.
[USA2016] UNITED STATES AGENCY FOR INTERNATIONAL DE-VELOPMENT (USAID). Greenhouse Gas Emissions in Sen-egal (Fact sheet). Dakar, Senegal.
[USD2013] UNITED STATES DEPARTMENT OF STATE. (2013). 2013 Investment Climate Statement- Senegal. Retrieved December 10, 2017 from https://www.state.gov/e/eb/rls/othr/ics/2013/ 204727.htm
[USD2016] UNITED STATES DEPARTMENT OF STATE. SENEGAL 2016 INTERNATIONAL RELIGIOUS FREEDOM REPORT. In: 2016 International Religious Freedom Report. United States Department of State, Washington, D.C., August 2017.
[WIL2015] WILLANE, B. (2015, April 9). PROGRAMME NATIONAL DE BIOGAZ: Bilan décevant, perspectives prometteuses. Ret-rieved November 29, 2017, fromhttp://www.enquete-plus.com/content/ programme-national-de-biogaz-bilan-d%C3%A9cevant-per-spectives-prometteuses
[WIN2014] WINN, M.I.; KIRCHGEORG, M. (2014). Bottom of the Pyr-amid. Retrieved February 11, 2018, from https://www.britan-nica.com/topic/Bottom-of-the-Pyramid
[WIS2015] WISNER, B.; PELLING, M.; MASCARENHAS, A.; HOL-LOWAY, A.; NDONG, B.; FAYE, P.; RIBOT, J.; SIMON, D.: Small Cities and Towns in Africa: Insights into Adaptation

Kostin, Strauss and Tavčar
242
Challenges and Potentials. In: PAULEIT, S.; COLY, A.; FOHLMEISTER, S.; GASPARINI, P.; JØRGENSEN, G.; KABISCH, S.; KOMBE W.J.; LINDLEY, S.; SIMONIS, I.; YESHITELA, K. (Hrsg.): Urban vulnerability and climate change in Africa: a multidisciplinary approach. Cham, Switzerland.
[WOO2004] WOOD, E. C.; TAPPAN, G. G.; HADJ, A.: Understanding the drivers of agricultural land use change in south-central Sene-gal. In: Journal of Arid Environments, 59, p. 565–582.
[WB2007] WORLD BANK. Sustainable wood fuel improves rural liveli-hoods in Senegal. IDA, Washington, D.C., April 2007.
[WB2013] WORLD BANK. State of the Clean and Improved Cooking Sector in Sub-Saharan Africa. Washington, D.C.: World Bank.
[WB2014] WORLD BANK. (2014). Access to electricity, rural (in % of rural population). Retrieved November 25, 2017 fromhttps://data.worldbank.org/indica-tor/EG.ELC.ACCS.RU.ZS?locations=SN
[WB2016] WORLD BANK. (2016). Rural Population (% of total). Re-trieved November 17, 2017, from https://data.worldbank.org/indica-tor/SP.RUR.TOTL.ZS?end=2016&locations=SN&start=2016
[WB2016] WORLD BANK. (2016). Population, total. Retrieved Novem-ber 17, 2017, from https://data.worldbank.org/indicator/ SP.POP.TOTL?end=2016&locations=SN&start=2016
[WB2017] WORLD BANK. (2017). Overview. Retrieved November 17, 2017, from http://www.worldbank.org/en/country/senegal/ overview
[WU2015] WU, J.: Goal 7—Ensure Access to Affordable, Reliable, Sus-tainable and Modern Energy for All. In: The Magazine of the United Nations, LI(4).
[WUR2010] WURSTER, K.: Management Matter? Effects of Charcoal Production Management on Woodland Regeneration in Sene-gal. Ph.D. Thesis, University of Maryland, College Park, USA.
[ZHA2013] ZHANG, T.; LIU, L.; SONG, Z.; REN, G.; FENG, Y.; HAN, X.; YANG, G.: Biogas Production by Co-Digestion of Goat Manure with Three Crop Residues. In: PLoS ONE, 8(6), p. 1-7.

Implementing sustainable domestic biogas projects in Senegal
243
Appendix
The Biochemistry of Biogas Biogas technology relies on a natural process known as anaerobic digestion, which is a process of biodegradation performed by a diverse population of mi-crobial organisms in the absence of oxygen. This processing of living matter cre-ates two products: biogas and bio-slurry (digestate). There are vast numbers of microorganisms involved in this process, each of which produces specialized en-zymes that degrade specific components of the organic matter. The major bio-degradation processes of anaerobic digestion include hydrolysis, acidogenesis, acetogenesis, and methanogenesis [MAT2003]. In the first step of biodegrada-tion, certain types of bacteria break down large and complex polymers, including carbohydrates, proteins and lipids into simple compounds such as sugars, amino acids and long-chain fatty acids [ibid]. In the next step, fermenting bacteria con-vert the simple compounds into volatile fatty acids (VFAs), carbon dioxide, py-ruvate, formate, ethanol and other intermediates [ibid]. These intermediates are then converted into acetate, hydrogen and carbon dioxide in a process known as acetogenesis [ibid]. Lastly, the methanogenesis phase involves the conversion of carbon dioxide and hydrogen into methane gas by methanogenic bacteria [ibid]. Biogas contains about 40-75 % methane, 15-60 % carbon dioxide, and trace amounts of hydrogen, hydrogen sulphide, ammonia, oxygen, nitrogen, carbon monoxide, and other gases [MAT2016]. Digestate, otherwise known as bio-slurry, comprises the solid leftover waste matter containing high amounts of sol-uble nitrogen and a lower content of organic matter, making it an ideal fertilizer [LUO2011]. The amount of time it takes to produce gas from the dung within the digester tank is known as the Hydraulic Retention Time (HRT), which is depend-ent on the volume of the digester tank and the temperature of the feedstock [SNV2006]. Furthermore, the quality of biogas produced will be dependent on the composition of the feedstock, namely the carbon/nitrogen ratio, pH, and nu-trient/mineral concentrations [MAT2003]. Biogas feedstock can come from a va-riety of different resources including animal waste or slurry, sewage sludge, solid municipal waste, agricultural waste, all of which contain a different ratio of fats, cellulose, hemicellulose, carbohydrates, and proteins [ibid].