understanding the burden of illness pyramid to improve Swiss ...
428
Foodborne diseases in Switzerland: understanding the burden of illness pyramid to improve Swiss infectious disease surveillance Inauguraldissertation zur Erlangung der Würde eines Doktors der Philosophie vorgelegt der Philosophisch-Naturwissenschaftlichen Fakultät der Universität Basel von Claudia Schmutz aus Eptingen BL, Schweiz Basel, 2018 Originaldokument gespeichert auf dem Dokumentenserver der Universität Basel edoc.unibas.ch Dieses Werk ist lizenziert unter einer Creative Commons Namensnennung - Nicht kommerziell - Keine Bearbeitungen 4.0 International Lizenz.
-
Upload
khangminh22 -
Category
Documents
-
view
0 -
download
0
Transcript of understanding the burden of illness pyramid to improve Swiss ...

Foodborne diseases inSwitzerland: understanding the
burden of illness pyramid toimprove Swiss infectious disease
surveillance
Inauguraldissertationzur
Erlangung der Würde eines Doktors der Philosophievorgelegt der
Philosophisch-Naturwissenschaftlichen Fakultätder Universität Basel
vonClaudia Schmutz
aus Eptingen BL, Schweiz
Basel, 2018
Originaldokument gespeichert auf dem Dokumentenserver derUniversität Baseledoc.unibas.ch
Dieses Werk ist lizenziert unter einer Creative CommonsNamensnennung - Nicht kommerziell - Keine Bearbeitungen 4.0
International Lizenz.

Genehmigt von der Philosophisch-Naturwissenschaftlichen Fakultätauf Antrag von
Prof. Dr. Jürg Utzinger, PD Dr. Daniel Mäusezahl, Prof. Dr. med.François Chappuis
Basel, den 18. September 2018
Prof. Dr. Martin SpiessDekan der Philosophisch-Naturwissenschaftlichen Fakultät

Contents
i Acknowledgements xvii
ii Executive summary xix
iii Zusammenfassung xxv
iv Abbreviations xxxi
v Glossary xxxv
vi Preamble xxxix
Part I INTRODUCTION, OBJECTIVES ANDMETHODOLOGY 1
1 Introduction 31.1 Surveillance of infectious diseases – the ‘burden of ill-
ness pyramid’ . . . . . . . . . . . . . . . . . . . . . . . . 31.2 History of infectious disease surveillance in Switzerland 61.3 Infectious disease surveillance systems in Switzerland . . 9
1.3.1 The National Notification System for InfectiousDiseases . . . . . . . . . . . . . . . . . . . . . . . 10
1.3.2 The Swiss Sentinel Surveillance Network . . . . . 121.4 Foodborne diseases and acute gastroenteritis . . . . . . 13
1.4.1 The difference between foodborne disease andacute gastroenteritis . . . . . . . . . . . . . . . . 13
1.4.2 The burden of foodborne diseases . . . . . . . . . 141.4.3 The burden of acute gastroenteritis . . . . . . . . 171.4.4 Foodborne disease or acute gastroenteritis:
what is and what should be measured . . . . . . 18
iii

Contents
1.5 Foodborne disease surveillance in Switzerland . . . . . . 191.6 The epidemiology of selected foodborne pathogens in
Switzerland and in the European Union . . . . . . . . . 23
2 Rationale, aim and objectives 272.1 Rationale to study the ‘burden of illness pyramid’ . . . 272.2 Aim and objectives . . . . . . . . . . . . . . . . . . . . . 28
3 Research concept and methodological overview 293.1 Overview of research approaches and study designs . . . 29
3.1.1 Analysing notification data on Campylobacter ,Salmonella, and hepatitis A . . . . . . . . . . . . 29
3.1.2 Studying trends in laboratory positivity rates ofCampylobacter , Salmonella, and EHEC . . . . . 31
3.1.3 Understanding laboratory practices and its in-fluence on notification data: the example ofEHEC . . . . . . . . . . . . . . . . . . . . . . . . 32
3.1.4 Understanding physicians’ approaches towardsacute gastroenteritis case management – a qual-itative approach . . . . . . . . . . . . . . . . . . 32
3.1.5 Understanding physicians’ approaches towardsacute gastroenteritis case management – aquantitative study . . . . . . . . . . . . . . . . . 33
3.1.6 Studying healthcare costs of acute gastroenter-itis and campylobacteriosis . . . . . . . . . . . . 33
3.1.7 Studying the incidence, burden of disease, so-cio-economic impact and aetiology of acute gast-roenteritis . . . . . . . . . . . . . . . . . . . . . . 34
3.2 Ethical considerations . . . . . . . . . . . . . . . . . . . 353.3 Collaborations . . . . . . . . . . . . . . . . . . . . . . . 36
Part II THE BURDEN OF ILLNESS PYRAMIDOF FOODBORNE INFECTIONS: UN-DERSTANDING THE TIP OF THE ICE-BERG 39
4 Inverse trends of Campylobacter and Salmonella in Swisssurveillance data, 1988–2013Claudia Schmutz, Daniel Mäusezahl et al., 2016, Euro Surveill 41
iv

Contents
5 Hepatitis A in Switzerland: An analysis of 29 years ofsurveillance data and contemporary challengesClaudia Schmutz, Daniel Mäusezahl, et al., 2018, Travel Med Infect Dis 65
6 Time trends of positivity rates from foodborne pathogentesting in Switzerland, 2003 to 2012Philipp Justus Bless, Claudia Schmutz, et al., 2017, Swiss Med Wkly 107
7 Enterohaemorrhagic E. coli in Switzerland: epidemic pat-tern due to changing laboratory methods?! 1357.1 Introduction . . . . . . . . . . . . . . . . . . . . . . . . . 1357.2 Methods . . . . . . . . . . . . . . . . . . . . . . . . . . . 1397.3 Results . . . . . . . . . . . . . . . . . . . . . . . . . . . . 140
7.3.1 Use and characteristics of multiplex PCR panels 1407.3.2 Diagnostic algorithm in case of diarrhoea . . . . 142
7.4 Discussion . . . . . . . . . . . . . . . . . . . . . . . . . . 1437.4.1 “Seek and you shall find (EHEC)” . . . . . . . . 1437.4.2 Implications of laboratory practices for surveil-
lance and outbreak detection . . . . . . . . . . . 1447.4.3 Importance of good relations among national
surveillance actors . . . . . . . . . . . . . . . . . 1467.5 Conclusions . . . . . . . . . . . . . . . . . . . . . . . . . 147
8 Do changes in EHEC diagnostics mislead interpretation ofdisease surveillance data in Switzerland? Time trends inpositivity from 2007 to 2016Fabienne Fischer, Apolline Saucy et al., submitted 149
9 Infectious disease surveillance: What can we concludefrom analysing positivity rates of diagnostic testing? 1779.1 Summary . . . . . . . . . . . . . . . . . . . . . . . . . . 1799.2 Introduction . . . . . . . . . . . . . . . . . . . . . . . . . 1799.3 Methods . . . . . . . . . . . . . . . . . . . . . . . . . . . 1819.4 Results and discussion . . . . . . . . . . . . . . . . . . . 181
9.4.1 Multiple tests and reports per disease episode . . 1839.4.2 Data validity and positivity rates . . . . . . . . . 1849.4.3 Swiss “laboratory landscape”: Complex and dy-
namic . . . . . . . . . . . . . . . . . . . . . . . . 1869.4.4 Comparable positivity rates from other studies . 1889.4.5 Positivity rates do not suffice . . . . . . . . . . . 191
9.5 Conclusions: Pros and cons of collecting information ontest numbers . . . . . . . . . . . . . . . . . . . . . . . . 192
v

Contents
Part III ACUTE GASTROENTERITIS: PHYSI-CIANS’ CASE MANAGEMENT AND PA-TIENTS’ HEALTH SEEKING AND ITSINFLUENCE ON SURVEILLANCE DATA 193
10 General practitioners’ viewpoint on acute gastroenteritis,campylobacteriosis and Swiss primary care 19510.1 Summary of “Acute Gastroenteritis and campylobacte-
riosis in Swiss primary care: the viewpoint of generalpractitioners”Philipp J. Bless, Joan Muela Ribera, et al., 2016, PLoS One . . . . 196
10.2 Additional analysis & results: The general practition-ers’ role in the Swiss health system . . . . . . . . . . . . 20110.2.1 GPs’ knowledge on campylobacteriosis . . . . . . 20110.2.2 GPs’ perspective on stool testing . . . . . . . . . 20410.2.3 The GPs’ perception of their role . . . . . . . . . 20710.2.4 The GPs’ view of the Federal Office of Public
Health . . . . . . . . . . . . . . . . . . . . . . . . 21010.2.5 GPs and the FOPH: Lack of mutual
understanding . . . . . . . . . . . . . . . . . . . 212
11 Acute gastroenteritis in primary care: a longitudinal studyin the Swiss Sentinel Surveillance Network, SentinellaClaudia Schmutz, Philipp Justus Bless et al., 2017, Infection 213
Part IV THE SOCIAL AND FINANCIAL BUR-DEN OF GASTROINTESTINAL DIS-EASES ACROSS THE BURDEN OF ILL-NESS PYRAMID 243
12 Estimating healthcare costs of acute gastroenteritis andhuman campylobacteriosis in SwitzerlandClaudia Schmutz, Daniel Mäusezahl, et al., 2017, Epidemiol Infect 245
13 The burden of gastroenteritis in Switzerland (BUGS)study: a research proposal for a one-year, prospective co-hort studyClaudia Schmutz and Daniel Mäusezahl, BMC Res Notes, accepted 277
vi

Contents
Part V DISCUSSION AND CONCLUSIONS 297
14 Discussion 29914.1 Reconstructing the burden of illness pyramid . . . . . . 301
14.1.1 From infection to disease notification . . . . . . . 30114.1.2 Before primary care: The “invisible” part of the
burden of illness pyramid . . . . . . . . . . . . . 30214.1.3 At primary care: physicians’ case management
is patient-oriented . . . . . . . . . . . . . . . . . 30414.1.4 After primary care: beyond sensitivity and spe-
cificity of diagnostic methods . . . . . . . . . . . 30614.1.5 At the tip of the iceberg: the notification system
is not static . . . . . . . . . . . . . . . . . . . . . 30714.1.6 From disease notification back to infection . . . . 309
14.2 The National Notification System for Infectious Dis-eases: a critical reflection . . . . . . . . . . . . . . . . . 31114.2.1 Does the NNSID fulfil its purpose? . . . . . . . . 31114.2.2 Does the purpose of the NNSID match our ex-
pectations? . . . . . . . . . . . . . . . . . . . . . 32214.2.3 How could the NNSID be improved? . . . . . . . 323
14.3 The ideal case management for acute gastroenteritisfrom different perspectives . . . . . . . . . . . . . . . . . 32814.3.1 The patients’ perspective: reducing illness dur-
ation and social impact . . . . . . . . . . . . . . 32814.3.2 The physicians’ perspective: reducing suffering
and caring for the vulnerable . . . . . . . . . . . 32914.3.3 The public health or epidemiologists’ perspect-
ive: identifying sources and outbreaks and pre-venting spread of disease . . . . . . . . . . . . . . 331
15 Conclusions 33515.1 Recommendations . . . . . . . . . . . . . . . . . . . . . 336
16 Bibliography 339
Part VI APPENDICES I
A List of notifiable observations in Switzerland, as per Janu-ary 2018 III
vii

Contents
B Process of compulsory disease notification in Switzerland IX
C The influence of changes in diagnostic approaches on dis-ease surveillance data: Time trend in positivity of EHECtesting in Switzerland, 2007–2016: Supplementary material XI
D Notification form: Statistic of reports on laboratory find-ings 2017 XIII
E The burden of gastroenteritis in Switzerland (BUGS)study: a research proposal for a one-year, prospective co-hort study: Additional file 1 XVII
F Selected media articles XXVF.1 Media reactions on studies presented in this thesis . . . XXVF.2 Selected media reactions on surveillance data . . . . . .XXVIII
viii

List of Figures
1.1 The burden of illness pyramid for foodborne pathogens . 5
3.1 Overview of PhD research framework to better under-stand the burden of illness pyramid for foodborne in-fections in Switzerland . . . . . . . . . . . . . . . . . . . 30
4.1 Number of Campylobacter and Salmonella case notific-ations and notification rates registered at the FederalOffice of Public Health, Switzerland, 1988–2013 . . . . . 46
4.2 Monthly number of notified campylobacteriosis and sal-monellosis cases, Switzerland, 1988–2013 . . . . . . . . . 47
4.3 Weekly number of notified campylobacteriosis and sal-monellosis cases, Switzerland, 2009–2013 . . . . . . . . . 48
4.4 Trends in Campylobacter notification rates between agegroups and sexes, Switzerland, 1988–2013 . . . . . . . . 49
4.5 Trends in Salmonella notification rates between agegroups and sexes, Switzerland 1988–2013 . . . . . . . . . 51
5.1 Trend in number of reported hepatitis A cases and noti-fication rate from 1988–2016 with major “events” (e.g.concerning vaccination) labelled, Switzerland. . . . . . . 80
5.2 Male and female hepatitis A notification rate by agegroup and year, 1988–2016, Switzerland. . . . . . . . . . 81
5.3 (a) Proportion of hospitalised hepatitis A cases accord-ing to notification data and number of notified cases,and (b) hospitalisations due to hepatitis A accordingto notification forms and hospital statistics, 1988–2016,Switzerland. . . . . . . . . . . . . . . . . . . . . . . . . . 89
6.1 Number of stool tests for Campylobacter (a) and Sal-monella (b) by sex in five diagnostic laboratories,Switzerland, 2003–2012. . . . . . . . . . . . . . . . . . . 117
ix

List of Figures
6.2 National Notification System for Infectious Diseases no-tification rates and positivity rates (standardised for ageand sex) of Campylobacter and Salmonella, Switzer-land, 2003–2012 . . . . . . . . . . . . . . . . . . . . . . . 118
6.3 Annual positivity rates of Campylobacter (a) and Sal-monella (b) by age group and sex, Switzerland,2003–2012 . . . . . . . . . . . . . . . . . . . . . . . . . . 120
6.4 Seasonality of Campylobacter tests and positivity rates(pooled over study period) per month and calendarweek, Switzerland, 2003–2012. . . . . . . . . . . . . . . . 121
6.5 Seasonality of Salmonella tests and positivity rates(pooled over study period) per month and calendarweek, Switzerland, 2003–2012. . . . . . . . . . . . . . . . 122
7.1 Annual number of probable and confirmed enterohaem-orrhagic Escherichia coli cases reported to the FederalOffice of Public Health between 1999 and 2016 . . . . . 136
7.2 Number of enterohaemorrhagic Escherichia coli notific-ations registered at the Federal Office of Public Health(FOPH) per year between 2006 and 2016 and time pointof introduction of multiplex PCR panels, among labor-atories visited by the FOPH and the Swiss Tropical andPublic Health Institute in June/July 2016 . . . . . . . . 141
7.3 Number of hospitalisations due to enterohaemorrhagicEscherichia coli (ICD-10 code A04.3) and haemolytic-uraemic syndrome (ICD-10 code D59.3) according toSwiss hospital statistics, 1999–2016 . . . . . . . . . . . . 145
8.1 Number of enterohaemorrhagic Escherichia coli(EHEC) notifications of 11 Swiss diagnostic laborator-ies as reported in the National Notification System forInfectious Diseases (NNSID), the number of positivetests of the laboratories in their own datasets, and thetotal number of EHEC notifications reported in theNNSID per year, 2007–2016, Switzerland . . . . . . . . . 155
8.2 Total number of enterohaemorrhagic Escherichia colitests performed by test method and number of positivetests for the entire study period (2007–2016) . . . . . . 156
8.3 Age- and sex-standardised positivity of enterohaemor-rhagic E. coli testing, Switzerland, 2007–2016 . . . . . . 159
x

List of Figures
8.4 Enterohaemorrhagic E. coli positivity by Swiss labor-atory for the entire study period (2007–2016) . . . . . . 161
8.5 Predicted probability for a positive test outcome ofan enterohaemorrhagic E. coli infection for the fullmultivariable model and a model without adjustmentfor methods across 10 years (in months) of the studyperiod, 2007–2016, Switzerland . . . . . . . . . . . . . . 166
9.1 Positivity rate and total number of tests per year by testmethod for Campylobacter spp., according to reports onlaboratory statistics, 2016–2017, Switzerland . . . . . . 185
11.1 Study profile of notified cases and reporting physicians.Acute gastroenteritis study, Swiss Sentinel SurveillanceNetwork, 2014. . . . . . . . . . . . . . . . . . . . . . . . 222
11.2 Age distribution by sex among acute gastroenter-itis cases reported by Sentinella-physicians on weeklyand/or supplementary questionnaires. Swiss SentinelSurveillance Network, 2014 . . . . . . . . . . . . . . . . 223
11.3 Acute gastroenteritis cases reported by physicians fromthe Swiss Sentinel Surveillance Network in 2014: weeklycase numbers and number of initial AG consultationsper 1’000 physician-patient contacts per week . . . . . . 225
11.4 Calculated incidence of first consultations due to acutegastroenteritis at primary care level in Switzerlandby Sentinella-region, based on standard extrapolation.Swiss Sentinel Surveillance Network, 2014 . . . . . . . . 226
12.1 Overview of data sources used for (a) extrapolation oftreatment costs and (b) for cost estimation for acutegastroenteritis and campylobacteriosis patients. . . . . . 259
12.2 Number of hospitalizations due to ICD-10 code A04.5‘Campylobacter enteritis’ in Switzerland from 2004 to2012, number of hospitalizations extrapolated fromresults of a case-control study in Switzerland assum-ing hospitalization of 14.5% of cases registered in theNational Notification System for Infectious Diseases(NNSID) and number of case notifications from theNNSID . . . . . . . . . . . . . . . . . . . . . . . . . . . . 262
13.1 Operational flowchart of cohort recruitment for the bur-den of gastroenteritis in Switzerland (BUGS) study . . . 282
xi

List of Figures
13.2 Flowchart of cohort observation period for the burdenof gastroenteritis in Switzerland (BUGS) study . . . . . 285
13.3 Timeline from occurrence of symptoms until sending ofillness questionnaire for the burden of gastroenteritis inSwitzerland (BUGS) study . . . . . . . . . . . . . . . . 286
14.1 Estimation of case numbers at different levels of theburden of illness pyramid for foodborne infections . . . . 310
B.1 Process map of disease notification of "report on labor-atory findings" in Switzerland . . . . . . . . . . . . . . . IX
B.2 Process map of disease notification of "report on clinicalfindings" in Switzerland . . . . . . . . . . . . . . . . . . X
C.1 Predicted probability per calendar month for a positivetest outcome of an enterohaemorrhagic Escherichia coliinfection for the univariable model using sine and cosinefunctions, 2007–2016, Switzerland . . . . . . . . . . . . . XII
F.1 Newspaper article in response to publication on health-care costs of acute gastroenteritis and campylobacteri-osis . . . . . . . . . . . . . . . . . . . . . . . . . . . . . . XXV
F.2 Newspaper article in response to publication on acutegastroenteritis in Swiss primary care, Sentinella . . . . . XXVI
F.3 Newspaper article in response to publication on acutegastroenteritis in Swiss primary care, Sentinella . . . . . XXVI
F.4 Newspaper article in response to publication on acutegastroenteritis in Swiss primary care, Sentinella . . . . .XXVII
F.5 Newspaper article in response to interview airedon Swiss TV, based on weekly situation report oninfluenza-like illnesses in the “BAG Bulletin” . . . . . .XXVIII
F.6 Newspaper article in response to weekly situation reporton tick-borne diseases in the “BAG Bulletin” . . . . . .XXVIII
xii

List of Tables
1.1 Predominant disease manifestation and estimated pro-portion of foodborne transmission for the “EUR A” re-gion (including Switzerland) of 31 hazards commonlyassociated with foodborne illness . . . . . . . . . . . . . 15
1.2 Notifiable pathogens and diseases commonly transmit-ted through food in Switzerland: notification criteria,process and time frame as per January 2018 . . . . . . . 20
1.3 Case numbers and notification rates of notifiable patho-gens commonly transmitted through food in Switzer-land, 2017 . . . . . . . . . . . . . . . . . . . . . . . . . . 22
4.1 Comparison of notification rates for Campylobacter andSalmonella among different age groups, Switzerland,1988 and 2013 . . . . . . . . . . . . . . . . . . . . . . . . 50
5.1 World Health Organization, European Centre for Dis-ease Prevention and Control and Federal Office of Pub-lic Health case definitions for hepatitis A surveillance . . 69
5.2 Overview of Swiss recommendations for vaccinationagainst hepatitis A virus . . . . . . . . . . . . . . . . . . 74
5.3 Characteristics of notified hepatitis A cases, 1988–2016,Switzerland . . . . . . . . . . . . . . . . . . . . . . . . . 82
6.1 Comparison of campylobacteriosis cases from laborat-ory data with cases registered in the National Noti-fication System for Infectious Diseases by test year,Switzerland, 2003–2012 . . . . . . . . . . . . . . . . . . 114
6.2 Comparison of salmonellosis cases from laboratory datawith cases registered in the National Notification Sys-tem for Infectious Diseases by test year, Switzerland,2003–2012 . . . . . . . . . . . . . . . . . . . . . . . . . . 115
xiii
List of Tables
7.1 Overview of pathogens included in four commerciallyavailable multiplex PCR panels for gastrointestinalpathogens . . . . . . . . . . . . . . . . . . . . . . . . . . 137
8.1 Odds ratios for a positive test result for enterohaem-orrhagic Escherichia coli of the uni- and multivariablelogistic regression models, 2007–2016, Switzerland . . . 162
9.1 Number of positive tests for Campylobacter spp. ac-cording to individual “reports on laboratory findings”and according to “statistic of reports on laboratory find-ings” and total number of tests performed for Cam-pylobacter spp. according to “statistic of reports onlaboratory findings” as reported to the Federal Officeof Public Health, 2016–2017, Switzerland . . . . . . . . 182
9.2 Selected records of “statistic of reports on laboratoryfindings” on Campylobacter spp. to illustrate difficultyin evaluating plausibility of data comparing the num-ber of positive results with the total number of testsreported from laboratory statistics and with the num-ber of cases reported by the corresponding laboratory inthe framework of individual case reporting, 2016–2017,Switzerland . . . . . . . . . . . . . . . . . . . . . . . . . 187
9.3 Selected records of “statistic of reports on laboratoryfindings” on Campylobacter spp. to illustrate difficultyin merging records with case-based “reports on labor-atory findings” by laboratory, 2016–2017, Switzerland . 189
11.1 Basic characteristics of acute gastroenteritis cases re-ported on the weekly and supplementary questionnairesby physicians from the Swiss Sentinel Surveillance Net-work in 2014 . . . . . . . . . . . . . . . . . . . . . . . . 221
11.2 Characteristics of cases with acute gastroenteritis atfirst consultation and number of consultations as repor-ted by primary care physicians from the Swiss SentinelSurveillance Network, 2014 . . . . . . . . . . . . . . . . 228
11.3 Frequency of and reasons for prescription of stool dia-gnostics among acute gastroenteritis patients consultingprimary care physicians from the Swiss Sentinel Surveil-lance Network, 2014 . . . . . . . . . . . . . . . . . . . . 229
xiv

List of Tables
11.4 Frequency of prescription of antibiotic and symptomatictreatment, and reasons for prescription of antibiotictherapy among acute gastroenteritis patients consultingprimary care physicians from the Swiss Sentinel Surveil-lance Network, 2014 . . . . . . . . . . . . . . . . . . . . 230
11.5 Time point of prescription of stool testing and antibiotictreatment among acute gastroenteritis patients consult-ing primary care physicians, Swiss Sentinel SurveillanceNetwork, 2014 . . . . . . . . . . . . . . . . . . . . . . . . 232
12.1 Overview of selected studies estimating the cost of ill-ness of gastrointestinal or foodborne illnesses . . . . . . 250
12.2 Overview of selected studies estimating the cost of ill-ness of campylobacteriosis . . . . . . . . . . . . . . . . . 254
12.3 Healthcare costs associated with the management ofacute gastroenteritis and campylobacteriosis for fourpatient management models with two scenarios each . . 263
12.4 Estimated healthcare costs for the treatment of acutegastroenteritis and campylobacteriosis in Switzerland . . 267
13.1 Overview and content of different questionnaires usedand other data collection for the burden of gastroenter-itis in Switzerland (BUGS) study . . . . . . . . . . . . . 283
A.1 List of notifiable observations for physicians and labor-atories with time frame for notification in Switzerland . IV
E.1 Sample size calculation for the burden of gastroenteritisin Switzerland (BUGS) study for a comparison of themean number of events per person and year betweentwo distinct groups (exposed and unexposed) based ondifferent parameter assumptions . . . . . . . . . . . . . . XIX
E.2 Sample size and power calculation for the burden ofgastroenteritis in Switzerland (BUGS) study for a com-parison of the mean number of events per person andyear between two distinct periods (high and low riskperiod) based on different parameter assumptions . . . .XXIII
xv


i Acknowledgements
This PhD thesis was carried out in the framework of several projectsmandated and/or supported by the Federal Office of Public Health(FOPH) and the Federal Food Safety and Veterinary Office (FSVO).I am grateful for the various supports provided by those institutionsduring the implementation of the research work and for the excellentcollaboration throughout the years.I am indebted to my thesis supervisor and long-standing mentor, DanielMäusezahl, for his unequivocal support, his coaching, his challengingquestions, his honest feedback and his confidence in me and my workat all times. I thank Jürg Utzinger and François Chappuis for acting asfaculty representative and co-referee in my PhD committee, for monitor-ing the progress during my PhD and for encouraging its continuation. Ithank Mirjam Mäusezahl-Feuz from the Federal Office of Public Health(FOPH) for agreeing to join my PhD committee as external expert, andfor always supporting me, my thesis and the projects related to my thesis.I thank Jakob Zinsstag and Kaspar Wyss for reviewing my initial PhDproposal and providing important feedback.Philipp, with whom I conducted several studies presented in this thesis,deserves special thanks; I would not like to miss our many challengingand stimulating discussions. I very much appreciate his support andfeedback. Also Fabienne deserves a big “thank you” for collaborating insome of my projects, for challenging me by asking questions, for provid-ing feedback to parts of my thesis, and for her friendship with an everopen ear. I also much appreciate Apolline’s contribution to the EHECproject. I thank Aliya for her feedbacks and for her help in finding ap-propriate words in English. Stella, I really enjoyed the time we spenttogether when you were in Basel! I hope we keep in touch. Jennyfer,your encouraging words during early phases of my PhD were very im-portant to me.I thank all current and former members of the Household Economics andHealth Systems Research and the Infectious Disease Modelling units, es-pecially the Household Health Systems research group and the “Mission21 PhD students” for the good time we spent together.I gratefully acknowledge the statistical advice to various projects of JanHattendorf and Christian Schindler, and the technical advice of Nicolas
xvii

i Acknowledgements
Maire and Aurelio di Pasquale. Nadja Cereghetti, Monika Zumbrunn,Eliane Kobel, Dagmar Batra, Christine Mensch, Daniel Thommen, AnjaSchreier and many other people at Swiss TPH deserve a word of thanksfor dealing with administrative issues related to our projects and/or myPhD. I am grateful to Christian Burri and his team for crucial advice onethical issues and for introducing me to good practices of data protectionand server structure.I am indepted to Marianne Jost from the FOPH for her excellent collab-oration, continuous support, and friendship during many years. DanielKoch’s support of our various projects related to this thesis is grate-fully acknowledged. I further appreciate the trustful collaboration andfriendship of Sabine Basler, Nicole Gysin and the entire “Epidemiolo-gical Monitoring and Assessment” section at the FOPH. I acknowledgethe support of the “Notification Systems” section (FOPH), especially ofAndreas Birrer, Raphael Rytz and Diana Guido.Furthermore, I thank Andreas Baumgartner, Soeren Becker, ChristophHatz, Joan Muela, Matthias Schwenkglenks, Roger Stephan, DamianoUrbinello and Andreas Zeller for contributing to projects which are partof this thesis.I have no words to express my deep gratitude to my parents for uncon-ditionally supporting me. I could not have completed my PhD withoutyou, your moral support, your encouragement, and your efforts to everproviding a conducive and productive environment for me to achieve thisbig milestone. Joëlle, I am glad to have met you at the beginning of mystudies and to have had you as a friend during this long journey. I willalways remember our cheerful (but far too rare) lunches and eveningstogether with Nadja and Bigna.Finally, I appreciate the support and contribution of all persons involvedin the works which are part of this thesis but were not explicitly men-tioned.Last but not least, I acknowledge the FOPH and the FSVO for fund-ing several projects of this thesis, the PhD Program Health Sciences(PPHS) for awarding me a Start Stipend and the “Dissertationenfonds”of the University of Basel for supporting the printing of this thesis.
xviii

ii Executive summary
Background Infectious diseases cause a considerable burden to pop-ulation health worldwide. Different types of surveillance systems havebeen implemented to assess changes in disease frequency, to identify out-breaks, and to detect newly emerging diseases aiming at early detectionof epidemics, disease control and prevention. Passive surveillance sys-tems are mostly used, measuring the ‘incidence of notified cases’ ratherthan the incidence (frequency) of disease at population level. Foodbornepathogens, for example, do not always cause disease in infected indi-viduals. Sick individuals – mostly presenting with acute gastroenteritis(AG) – do not always seek healthcare. Of those approaching a physician,aetiology of disease is investigated only in a fraction of patients. Finally,not all cases with a positive laboratory finding for a notifiable pathogenmight be reported to the surveillance system. This “loss” of cases alongthe so-called burden of illness pyramid – from infection to actual noti-fication in the surveillance system –, or the factor of underestimation,depends on the pathogen and the local health (care) system.Two surveillance systems are implemented in Switzerland which are im-portant for infectious disease surveillance and early detection: the Na-tional Notification System for Infectious Diseases (NNSID) and the SwissSentinel Surveillance Network (Sentinella). The NNSID is based onthe Epidemics Act and is the only mandatory surveillance system inSwitzerland covering the entire nation and involving all physicians anddiagnostic laboratories. The Epidemics Act defines which observationshave to be reported to the NNSID and stipulates the time frame forreporting. Sentinella is a network where information from a subset ofvoluntarily participating physicians is collected to study diseases andhealth issues at the primary care level.It was estimated that 31 foodborne hazards caused 33 million DisabilityAdjusted Life Years (DALYs) and 600 million cases of illness worldwidein 2010. In European countries, the incidence of AG was estimated at0.3–1.5 disease episodes per person-year. Campylobacter spp. is the mostfrequent, notifiable, bacterial foodborne disease, both in the EuropeanUnion (EU) and in Switzerland and showed increasing trends in thepast decade. In contrast, Salmonella spp. notifications were decreasingin the EU and in Switzerland while enterohaemorrhagic Escherichia coli
xix

ii Executive summary
(EHEC) notifications were increasing in Switzerland but remained stablein the EU.In Switzerland, information on foodborne diseases is mostly restrictedto data obtained through the NNSID. Many factors contribute to un-derestimation and hence, it is unclear how well notification rates reflectdisease incidence.
Objectives This work aimed at contributing to a better understand-ing of the burden of illness pyramid for foodborne infections in Switzer-land and, thus, contributing to improve infectious disease surveillanceand control. It sought to investigate the frequency of cases of food-borne disease or AG at different levels of the burden of illness pyramid.Further, it should describe trends and understand factors leading to caseregistration. Finally, a better understanding of disease epidemiology willlead to improvements in early disease detection and control.
Methods This research work consisted of several projects character-ising different levels of the burden of illness pyramid from its tip to thewide (population) base. In a first step, notification data of Campylobac-ter , Salmonella and hepatitis A were analysed to describe trends since1988. Considering that the number of tests conducted can (strongly)influence the number of cases detected, we studied the trend in the pro-portion of positive tests out of all tests performed – the positivity rate– for Campylobacter , Salmonella and EHEC over a 10-year period. Per-sonnel of diagnostic laboratories was consulted to assess current labor-atory practices, focussing on the diagnosis of EHEC infections. Fur-thermore, we conducted a qualitative study among Swiss general practi-tioners (GPs) to understand physicians’ approaches towards anamnesis(including diagnosis) and treatment of AG in general and campylobac-teriosis in particular. Subsequently, these findings were complementedby a study within Sentinella, where the number of patient consultationsdue to AG at primary care level was assessed. Physicians reported allfirst consultations due to AG including information on hospitalisation,stool diagnostics, treatment and inability to work.Findings of the aforementioned studies, expert consultations and pub-licly available data were used to explore healthcare costs for AG andcampylobacteriosis in Switzerland for the first time. Four distinct pa-tient management models were defined for which frequency and indi-vidual case management costs were estimated. Extrapolations of theseresults were used to assess total direct healthcare costs for Switzerland.Finally, bringing together all study results of the above-mentioned stud-
xx

ies, we identified the need to understand the burden of AG at the basis –at the level of the general population. Therefore, a study protocol to in-vestigate the lowest level of the burden of illness pyramid – the incidenceand aetiology of AG at population-level – was developed.
Results Campylobacter case notifications increased between 1988and 2013 while Salmonella case notifications decreased. Highest casenumbers for Campylobacter were recorded in 2012 with 8’480 cases. ForSalmonella, peak levels were observed in 1992 with 7’806 cases. Whileshowing inverse long-term trends, both pathogens follow a similar sea-sonality pattern with higher case numbers during summer months. Inwinter, a short but pronounced peak over Christmas and New Yearwas observed for Campylobacter . Positivity rates for Campylobacter in-creased from 2003 to 2012 while they decreased for Salmonella. At thesame time, the number of tests conducted increased for both pathogens.Hepatitis A case notifications decreased between 1988 and 2016 inSwitzerland, similar to Salmonella. The strongest decline was observedin the early 1990’s, starting even before active immunisation was intro-duced in 1992. At the same time, there was a shift in reported riskexposures for hepatitis A: Intravenous drug use was the most frequentlymentioned risk exposure at the beginning of reporting while, more re-cently, contaminated food and beverages were mentioned predominantlyas possible sources of infection. Notification forms and content werechanged multiple times during this 29-year period.Laboratory experts unanimously think that the increase in EHEC no-tifications which is observed in the NNSID can be explained by the in-troduction of multiplex gastrointestinal PCR panels. Those panels alsotest for EHEC while traditional culture-based stool testing mostly con-sidered Campylobacter spp., Salmonella spp. and Shigella spp. only.Nevertheless, there was also an increase in positivity rate observed forEHEC from 2007 to 2016 apart from an increase in testing frequency.Preliminary analysis of surveillance data on testing frequency, which wascollected since the implementation of the new Epidemics Act in 2016,reveals several issues regarding data quality related to the complex andheterogeneous “laboratory landscape” in Switzerland.AG case management of Swiss GPs is diverse. Nevertheless, four dis-tinct strategies could be identified. The majority of patients is managedwith a “wait & see” approach based on the knowledge that AG is usuallyself-limiting. Two of the four approaches include microbiological invest-igation (stool testing), with antibiotic treatment started either beforeor after availability of stool test results. Swiss GPs perceive AG and
xxi

ii Executive summary
campylobacteriosis as diseases of minor importance in their daily workbut acknowledge that they can be disturbing and debilitating for theindividual patient. Surveillance of AG in Sentinella revealed that 8.5%of AG patients received antibiotic therapy, for 12.3% stool testing wasinitiated and 86.3% of employees were not able to work. Extrapolationof case numbers suggested an incidence of AG at primary care level of2’146 first consultations per 100’000 inhabitants in Switzerland in 2014.Direct healthcare costs of AG and campylobacteriosis in Switzerlandwere estimated at e29–45 million in 2012. Of these, e8.3 million wereattributed to the 8’480 laboratory-confirmed campylobacteriosis patientsregistered in the NNSID. It was estimated that 233’000–629’000 patientsconsulted a physician without further stool testing resulting in health-care costs of e9.0–24.2 million in 2012. Work-loss and other non-health-care costs associated with AG and campylobacteriosis were not assessedin this study. However, this socio-economic burden will be exploredin more detail in an upcoming study on the burden of gastroenteritisin Switzerland (“BUGS study”). The BUGS study was developed toexplore the “true” incidence, burden of disease, aetiology and socio-eco-nomic impact of AG in Switzerland; to finally understand the entire bur-den of AG at population level and the level of underestimation of casesnotified to the NNSID. BUGS is a prospective cohort study weekly fol-lowing up individuals of the general population during a 52-week period.Furthermore, the presence of four pathogenic bacteria (Campylobacter ,Salmonella, Shigella and EHEC) and of bacteria harbouring selectedantibiotic resistances (fluoroquinolone, extended-spectrum β-lactamase(ESBL), carbapenemase and mobilised colistin resistance-1 (mcr-1)) isassessed in cohort participants during an asymptomatic period.
Conclusions The NNSID is a useful and stable surveillance systemand health system component which is well accepted by stakeholders.Surveillance data from the NNSID suggest increasing trends for Campy-lobacter and EHEC and decreasing trends for Salmonella and hepatitisA. Our complementary research studies come to the same conclusioneven though trends might appear more pronounced (EHEC) or atten-uated (Salmonella) in the notification system than the true incidencedue to changes in diagnostic procedures. Hence, from what we knowwe cannot fully explain the increase of Campylobacter and EHEC seenin the notification system. Therefore, an increase in disease incidenceor an outbreak must be considered from an epidemiological perspective.Furthermore, underestimation is probably substantial. Cases seen in theNNSID are more likely to be severe, have co-morbidities or present with
xxii

well-known risk factors. Assessing all factors contributing to underes-timation on a regular basis is hardly possible. Instead, complementaryresearch such as the proposed BUGS study are needed.The information on disease trends and individual cases obtained throughthe NNSID should be restricted to the minimum (with high data qual-ity) rather than expanded to keep the system as simple and responsiveas possible, providing reliable information. This enables the system tostay alert to and be prepared for a rapid response in the event of chan-ging case numbers. Maintaining systems like Sentinella and fosteringstrategic research partnerships for action is important to be able to re-act immediately once an outbreak or a change in disease epidemiology issuspected. Pathways to provide good evidence for public health policyand distribute information to stakeholders should be established.
xxiii


iii Zusammenfassung
Hintergrund Infektionskrankheiten verursachen weltweit eine be-trächtliche Krankheitsbürde. Um Änderungen in der Häufigkeit von be-kannten sowie neuen Infektionskrankheiten festzustellen und Ausbrücheeinzudämmen, werden verschiedene Überwachungssysteme eingesetzt.Passive Überwachungssysteme sind am weitesten verbreitet. Diese passi-ven Überwachungssysteme messen nicht die effektive Krankheitshäufig-keit – die Inzidenz in der Bevölkerung, sondern vielmehr die “Inzidenz dergemeldeten Fälle”. So zeigen beispielsweise Personen, die mit durch Le-bensmittel übertragenen Krankheitserregern infiziert sind, nicht immerSymptome – sie sind asymptomatische Träger. Symptomatische Perso-nen wiederum – die Erkrankung äussert sich dabei meistens in Formeiner akuten Gastroenteritis – melden sich nicht immer beim Arzt. Wirdein Arzt aufgesucht, wird die Ursache der Erkrankung zudem nur beieinem Bruchteil der Patienten mittels weiterführender Labor-Untersu-chungen abgeklärt. Und letztlich führt ein positiver Laborbefund einermeldepflichtigen Krankheit nicht immer zu einer Meldung an das Über-wachungssystem. Die Dunkelziffer, d.h. wie viele Fälle entlang diesersogenannten Krankheitspyramide – auf dem Weg von der Infektion biszur Erfassung der Krankheitsepisode im Meldesystem – verloren gehen,hängt sehr vom Pathogen und vom jeweiligen Gesundheitssystem ab.Die Schweiz betreibt zwei Systeme zur Früherkennung und Überwa-chung von Infektionskrankheiten: das obligatorische Meldesystem fürInfektionskrankheiten und das “Swiss Sentinel Surveillance Network”,kurz Sentinella. Das obligatorische Meldesystem für Infektionskrankhei-ten stützt sich auf das Epidemiengesetz und ist das einzige obligatorischeÜberwachungssystem für Infektionskrankheiten der Schweiz, welches diegesamte Bevölkerung abdeckt und das alle Ärzte und diagnostischen La-boratorien zur Meldung verpflichtet. Das Epidemiengesetz regelt, welcheBeobachtungen zu melden und welche Meldefristen dabei einzuhaltensind. Sentinella ist ein Netzwerk, in dem eine Gruppe aus freiwillig teil-nehmenden Ärztinnen und Ärzten Konsultationen zu bestimmten The-men meldet und somit eine Charakterisierung des Krankheitsgeschehensauf Ebene der Grundversorgung erlaubt.Im Jahr 2010 verursachten 31 von Lebensmitteln ausgehende Gefähr-dungen für die Gesundheit weltweit 33 Millionen sogenannte ‘Disability
xxv

iii Zusammenfassung
Adjusted Life Years (DALYs)’ und rund 600 Millionen Erkrankungen.Die Inzidenz akuter Gastroenteritis wurde in europäischen Ländern auf0.3–1.5 Krankheitsepisoden pro Person und Jahr geschätzt. Sowohl inder Europäischen Union (EU) als auch in der Schweiz ist Campylobacterspp. der häufigste, meldepflichtige, bakterielle Erreger, der durch Lebens-mittel übertragen werden kann. Die Fallzahlen nahmen dabei im letztenJahrzehnt stetig zu. Im Gegensatz dazu nahmen die Fallzahlen von Sal-monella spp. in der EU und der Schweiz ab. Die Anzahl Meldungen vonenterohämorrhagischen Escherichia coli (EHEC)-Infektionen war in derEU grösstenteils konstant, während sie in der Schweiz zunahm. Zurzeitverfügbare Informationen zu lebensmittelbedingten Infektionskrankhei-ten beschränken sich in der Schweiz mehrheitlich auf Informationen ausdem obligatorischen Meldesystem. Die Dunkelziffer der Erkrankungen,die durch zahlreiche Faktoren beeinflusst wird, ist unbekannt. Eine Aus-sage, inwiefern die Melderaten die wahre Inzidenz der Erkrankungen inder Allgemeinbevölkerung widerspiegeln, ist daher nicht möglich.
Ziele Im Rahmen dieser Dissertation soll ein besseres Verständnisder Krankheitspyramide am Beispiel von lebensmittelbedingten Infektio-nen erarbeitet werden. Die Erkenntnisse sollen dazu beitragen, die Über-wachung und Kontrolle von Infektionskrankheiten in der Schweiz zu ver-bessern. Zu diesem Zweck wird die Häufigkeit von Fällen lebensmittelbe-dingter Erkrankungen oder akuter Gastroenteritiden auf verschiedenenStufen der Krankheitspyramide untersucht. Es werden Trends beschrie-ben und Faktoren identifiziert, welche schlussendlich zur Meldung einesKrankheitsfalles führen. Die daraus gewonnenen Erkenntnisse helfen dieFrüherkennung und Kontrolle von Infektionskrankheiten zu verbessern.
Methodik Diese Forschungsarbeit besteht aus mehreren Projekten,welche sich unterschiedlichen Stufen der Krankheitspyramide, von derSpitze bis zur Basis, widmen. In einem ersten Schritt wurden Meldeda-ten zu Campylobacter , Salmonella und Hepatitis A untersucht, um derenEntwicklung seit 1988 zu beschreiben. Die Entwicklung des Anteils posi-tiver Testresultate unter allen durchgeführten Tests wurde analysiert, dadie Anzahl durchgeführter Tests einen grossen Einfluss auf die Anzahlidentifizierter Fälle haben kann. Diese sogenannte “Positivitätsrate” vonCampylobacter , Salmonella und EHEC wurde über einen Zeitraum vonjeweils 10 Jahren untersucht. Mitarbeitende aus Diagnostiklaboratori-en wurden zu ihrem Vorgehen bei der Stuhlproben-Diagnostik befragt,insbesondere im Hinblick auf die Diagnostik von EHEC. Des Weiterenwurde eine qualitative Studie durchgeführt, um das Vorgehen der Ärzte
xxvi

bei der Anamnese (und der damit verbundenen Diagnostik) und Behand-lung von akuten Gastroenteritiden (mit Fokus auf Campylobacteriose)in der Schweiz zu verstehen. Diese Erkenntnisse wurden im Anschlussdurch eine Studie im Sentinella-Meldesystem ergänzt, in der die AnzahlPatienten untersucht wurde, welche aufgrund von akuter Gastroente-ritis einen Hausarzt aufsuchen. Dazu haben Ärztinnen und Ärzte alleErstkonsultationen aufgrund einer akuten Gastroenteritis gemeldet. DieMeldungen beinhalteten Informationen zur Hospitalisierung, Stuhldia-gnostik, Behandlung und Arbeitsunfähigkeit des jeweiligen Patienten.Gesundheitskosten, die durch akute Gastroenteritis und Campylobacte-riose in der Schweiz entstehen, wurden basierend auf Resultaten aus denvorangegangenen Studien, Expertenmeinungen und öffentlich verfügba-ren Daten geschätzt und erstmals publiziert. Es wurden dafür vier Pa-tientenmodelle definiert, für welche jeweils deren Häufigkeit und die in-dividuellen Behandlungskosten geschätzt wurden. Mittels Hochrechnungwurden so die direkten Gesundheitskosten, die durch akute Gastroente-ritis und Campylobacteriose entstehen, quantifiziert. Basierend auf denErgebnissen der oben genannten Studien wurde schliesslich deutlich, wiewichtig es ist, die Basis der Krankheitspyramide für akute Gastroen-teritiden zu verstehen. Deshalb wurde ein Studienprotokoll entwickelt,um die Krankheitshäufigkeit (Inzidenz) von akuter Gastroenteritis aufPopulationsebene zu untersuchen sowie deren Ätiologie abzuklären.
Resultate Die Anzahl Fallmeldungen von Campylobacter hat zwi-schen 1988 und 2013 zugenommen während diejenige von Salmonellazurückgegangen ist. Die höchste Anzahl Campylobacter-Fälle wurde imJahr 2012 mit 8’480 Krankheitsfällen registriert. Mit 7’806 Fällen wur-den die höchsten Fallzahlen für Salmonella im Jahr 1992 beobachtet.Während diese beiden Pathogene über die Jahre hinweg gegenläufigeTrends aufweisen, zeigen sie eine ähnliche Saisonalität mit hohen Fall-zahlen während der Sommermonate. Zusätzlich wird bei Campylobacterein kurzer, aber prägnanter Anstieg jeweils um Weihnachten und Neu-jahr beobachtet. Campylobacter-Positivitätsraten nahmen zwischen 2003und 2012 zu, während sie bei Salmonella abnahmen. Die Anzahl durch-geführter Tests stieg für beide Pathogene im Verlauf der Jahre an.Hepatitis A-Fallmeldungen waren in der Schweiz zwischen 1988 und 2016rückläufig, ähnlich wie die Salmonellen-Fallzahlen. Der stärkste Rück-gang zeigte sich in den frühen 1990er-Jahren, noch bevor die aktive Im-munisierung im Jahr 1992 eingeführt wurde. Gleichzeitig verändertensich die gemeldeten Risikoexpositionen für Hepatitis A im Verlauf derZeit: zu Beginn des untersuchten Zeitraums wurde intravenöser Drogen-
xxvii

iii Zusammenfassung
konsum am häufigsten genannt während in der jüngeren Vergangenheitder Konsum von kontaminierten Speisen und Getränken als möglicheInfektionsquelle dominierte. In diesen 29 Jahren wurden die Meldefor-mulare und deren Inhalt vielfach überarbeitet.Experten aus Diagnostik-Laboratorien sind sich einig, dass der beobach-tete Anstieg von EHEC-Meldungen durch die Einführung von sogenann-ten “Multiplex PCR-Panels” für gastrointestinale Erreger begründet ist.Bei diesen Panels ist ein Test auf EHEC mit eingeschlossen, währenddie traditionelle Diagnostik mittels Stuhlkultur meist nur Campylobac-ter spp., Salmonella spp. und Shigella spp. berücksichtigte. Neben einemAnstieg der Anzahl durchgeführter Tests stieg jedoch auch die Positivi-tätsrate von EHEC zwischen 2007 und 2016.Eine vorläufige Analyse der Anzahl durchgeführter Tests, die seit derEinführung des neuen Epidemiengesetzes im Jahr 2016 gemeldet werdenmuss, zeigt diverse Probleme in Bezug auf die Datenqualität auf. DieDatenqualität steht mit der komplexen und heterogenen “Labor-Land-schaft” in der Schweiz in einem klaren Zusammenhang.Die Behandlung von Patienten mit akuter Gastroenteritis durch Schwei-zer Hausärzte ist vielfältig. Dennoch konnten vier Behandlungsstrategienidentifiziert werden. Die Mehrheit der Patienten wird mit einem “wait& see”-Ansatz behandelt (frei übersetzt: “Abwarten und Tee trinken”).Dieser Ansatz stützt sich auf das Wissen, dass eine akute Gastroenteri-tis normalerweise selbst-limitierend verläuft. Zwei der vier Behandlungs-strategien schliessen eine mikrobielle Untersuchung (Stuhltest) mit ein;mit Beginn einer antibiotischen Behandlung bevor oder nachdem dieResultate der Stuhluntersuchung vorliegen. Schweizer Hausärzte sehensowohl die akute Gastroenteritis als auch die Campylobacteriose als Er-krankungen von geringer Bedeutung im Praxisalltag. Sie räumen jedochein, dass sie für den individuellen Patienten unangenehm und beein-trächtigend sein können. Die Überwachung von akuter Gastroenteritisim Rahmen von Sentinella zeigte, dass 8.5% der Patienten mit aku-ter Gastroenteritis ein Antibiotikum verschrieben erhielten, bei 12.3%eine Stuhluntersuchung veranlasst wurde und 86.3% der Berufstätigennicht arbeiten gehen konnten. Eine Hochrechnung der Fallzahlen ergab,dass akute Gastroenteritis im Jahr 2014 zu 2’146 Erstkonsultationen pro100’000 Einwohner in der medizinischen Grundversorgung geführt hat.Im Jahr 2012 führten akute Gastroenteritis und Campylobacteriose inder Schweiz zu geschätzten direkten Gesundheitskosten in Höhe vone29–45 Millionen (36–54 Millionen Schweizer Franken). Davon fielene8.3 Millionen durch die 8’480 laborbestätigten Campylobacteriose-Fällean, die im obligatorischen Meldesystem registriert wurden. Schätzungen
xxviii

ergaben, dass 233’000–629’000 Patienten einen Arzt aufsuchten, ohnedass bei diesen eine Stuhluntersuchung durchgeführt wurde. Dies führ-te zu Gesundheitskosten von e9.0–24.2 Millionen. Arbeitsausfälle undandere Kosten, die mit akuter Gastroenteritis und Campylobacteriosein Zusammenhang stehen, wurden in dieser Studie nicht berücksichtigt.Diese sozioökonomische Bürde soll aber in einer nächsten Studie zurKrankheitslast von Gastroenteritiden in der Schweiz genauer untersuchtwerden. Diese sogenannte BUGS-Studie (“Burden of gastroenteritis inSwitzerland”) soll die “wahre” Inzidenz, die Krankheitslast, die Ätio-logie und die sozioökonomischen Auswirkungen von akuter Gastroente-ritis in der Schweiz näher erforschen, um die “volle” Krankheitsbürdeauf Populationsebene sowie die Dunkelziffer – die Krankheitsfälle, diedem Meldesystem verborgen bleiben – aufzuzeigen. Bei dieser geplantenStudie handelt es sich um eine prospektive Kohortenstudie, bei der dieStudienteilnehmerinnen und -teilnehmer aus der Allgemeinbevölkerungwährend eines Jahres wöchentlich befragt werden. Des Weiteren wird dieHäufigkeit von vier pathogenen Bakterien (Campylobacter , Salmonella,Shigella und EHEC) und von Bakterien, die gegen bestimmte Antibioti-ka resistent sind (Fluorchinolon-Resistenz, ESBL, Carbapenemase undmcr-1-Resistenz), unter den Studienteilnehmerinnen und -teilnehmernwährend einer asymptomatischen Periode erhoben.
Schlussfolgerungen Das schweizerische obligatorische Meldesystemfür Infektionskrankheiten ist ein nützliches, von den Akteuren des Ge-sundheitswesens gut akzeptiertes und stabiles Überwachungssystem. Da-ten aus dem obligatorischen Meldesystem deuten auf einen steigendenTrend von Campylobacter und EHEC und auf einen abnehmenden Trendvon Salmonella und Hepatitis A hin. Unsere ergänzende Forschungsar-beit kam zum gleichen Schluss, auch wenn die Trends im obligatorischenMeldesystem stärker (EHEC) bzw. schwächer (Salmonella) erscheinenkönnten als die “wahren” Inzidenzen – dies aufgrund von Änderungen inder Diagnostik. Die verfügbaren Erkenntnisse können den im Meldesys-tem beobachteten Anstieg nicht vollumfänglich erklären. Eine Verände-rung der Inzidenz – der Krankheitshäufigkeit in der Bevölkerung – oderauch eine Ausbruchssituation muss daher aus epidemiologischer Sicht inBetracht gezogen werden. Dies auch in Anbetracht der Tatsache, dass dieDunkelziffer beträchtlich sein dürfte. Die im obligatorischen Meldesys-tem erfassten Krankheitsfälle zeichnen sich durch einen schweren Verlaufaus, sind häufiger mit Co-Morbiditäten verbunden oder weisen bekann-te Risikofaktoren auf. Bedingt durch die Vielzahl an Faktoren, die zurDunkelziffer beitragen, ist deren routinemässige Erhebung kaum mög-
xxix

iii Zusammenfassung
lich. Deshalb ist ergänzende Forschung wie die geplante BUGS-Studienötig.Die Informationen, die im obligatorischen Meldesystem gesammelt wer-den, sollten auf das nötige Minimum und auf Daten beschränkt wer-den, die über längere Zeit verlässlich erhoben werden können; dies, umdas System so einfach und anpassungsfähig wie möglich zu halten. Einderartiges System erlaubt eine schnelle Reaktion auf sich veränderndeFallzahlen. Systeme wie Sentinella und strategische Forschungspartner-schaften aufrecht zu erhalten bzw. zu fördern ist wichtig, um sofort aufvermutete Ausbrüche und epidemiologische Veränderungen reagieren zukönnen. Es sollten Strategien erarbeitet werden, wie solide Evidenz fürdie Gesundheitspolitik generiert und wie Informationen an die relevantenAkteure weitervermittelt werden können.
xxx

iv Abbreviations
AG Acute gastroenteritis
AGI Acute gastrointestinal illness
BUGS Burden of gastroenteritis in Switzerland
CDC Centers for Disease Control and Prevention
CI Confidence interval
CJD Creutzfeldt-Jakob disease
CRP C-reactive protein
DALY Disability Adjusted Life Year
EAEC Enteroaggregative Escherichia coli
ECDC European Centre for Disease Prevention and Control
EEA European Economic Area
EHEC Enterohaemorrhagic Escherichia coli
EIEC Enteroinvasive Escherichia coli
EKNZ Ethikkommission Nordwest- und Zentralschweiz (Ethics Com-mittee northwest/central Switzerland)
EPEC Enteropathogenic Escherichia coli
ESBL Extended-spectrum β-lactamase
ETEC Enterotoxigenic Escherichia coli
EU European Union
FDHA Federal Department of Home Affairs
xxxi

Abbreviations
FERG Foodborne Disease Burden Epidemiology Reference Group
FOPH Federal Office of Public Health
FSO Federal Statistical Office
FSVO Federal Food Safety and Veterinary Office
GBS Guillain-Barré syndrome
GI Gastrointestinal
GP General practitioner
HA Hepatitis A
HAV Hepatitis A virus
HBV Hepatitis B virus
HCV Hepatitis C virus
HEV Hepatitis E virus
HIV Human immunodeficiency virus
HUS Haemolytic-uraemic syndrome
IBD Inflammatory bowel disease
IBS Irritable bowel syndrome
ICD-10 International Statistical Classification of Diseases and RelatedHealth Problems 10th Revision
IDU Injecting drug user
IHR International Health Regulations
IID Infectious intestinal disease
ILI Influenza-like illness
IQR Interquartile range
mcr-1 Mobilised colistin resistance-1
xxxii

Abbreviations
MSM Men who have sex with men
NENT National Reference Centre for Enteropathogenic Bacteria andListeria
NGS Next-generation sequencing
NNSID National Notification System for Infectious Diseases
NUTS Nomenclature of Units for Territorial Statistics
OR Odds ratio
PCR Polymerase chain reaction
PPC Physician-patient-contact
PPHS PhD Program Health Sciences
PPI Proton pump inhibitor
PPV Positive predictive value
ReA Reactive arthritis
RKI Robert Koch Institute
SARS Severe acute respiratory syndrome
Sentinella Swiss Sentinel Surveillance Network
SPSU Swiss Pediatric Surveillance Unit
StAR Strategy on Antibiotic Resistance Switzerland
STEC Shiga toxin-producing Escherichia coli
Swiss TPH Swiss Tropical and Public Health Institute
TESSy The European Surveillance System
UK United Kingdom
USA United States of America
VFR [Traveller] visiting friends and relatives
VTEC verotoxin-producing Escherichia coli
WHO World Health Organization
xxxiii


v Glossary
Acute gastrointestinal illness An illness with gastrointestinal signs andsymptoms. In contrast to “acute gastroenteritis”, an episode ofAGI does not have to fulfil a strict case definition but is ratherdefined by the individual experiencing the illness.
Acute gastroenteritis “An individual with ≥3 loose stools, or anyvomiting, in 24h, but excluding those (a) with cancer of the bowel,irritable bowel syndrome, Crohn’s disease, ulcerative colitis, cysticfibriosis, coeliac disease, or another chronic illness with symptomsof diarrhoea or vomiting, or (b) who report their symptoms weredue to drugs, alcohol, or pregnancy.” [Majowicz et al., 2008]. Note,however, that Majowicz et al. proposed this definition for “gast-roenteritis” instead of “acute gastroenteritis”.
Epidemic intelligence “All activities related to the early identificationof potential health hazards that may represent a risk to health, andtheir verification, assessment and investigation so that appropriatepublic health control measures can be recommended. The scope ofepidemic intelligence includes risk monitoring and risk assessmentand does not include risk management” [Paquet et al., 2006]
Foodborne disease “Any disease of an infectious or toxic nature causedby the consumption of food.” [World Health Organization, 2008]
Foodborne intoxication “Illness caused by ingestion of toxins producedin food by bacteria as a naturally occurring by-product of theirmetabolic processes.” [World Health Organization, 2008]. A subsetof foodborne diseases.
Illness “[. . . ] a subjective or psychological state of the person who feelsaware of not being well; the experience of a person with a disease; asocial construct fashioned out of transactions between healers andpatients in the context of their common culture.” [Porta, 2014]
xxxv

Glossary
Laboratory-based surveillance “A form of [. . . ] surveillance of casesthat have been confirmed by a laboratory test. The laborator-ies that perform the testing report the results to the surveillancesystem, as well as informing the clinicians who requested the tests.”[World Health Organization, 2017]
Notification rate The number of newly notified cases per X (usually100’000) population under surveillance in a given time period.Could be considered the “incidence rate of notified cases”.
One Health “Any added value in terms of human and animal health, fin-ancial savings or social and environmental benefits from closer co-operation of professionals in the health, animal and environmentalsectors at all levels of organisation” [Zinsstag et al., 2012]
Passive surveillance “Regular reporting of disease data by all institu-tions that see patients (or test specimens) and are part of a report-ing network [. . . ]. There is no active search for cases. It involvespassive notification by surveillance sites and reports are generatedand sent by local staff.” [World Health Organization, 2018]
Physician-patient-contact Each consultation in the practice and eachdomiciliary visit, independent of whether or not the consultation/visit takes place in the framework of the usual consultation hour oroutside consultation hour or during emergency service. This termand definition is used by the Swiss Sentinel Surveillance Network(Sentinella).
Sentinel surveillance “Surveillance based on selected populationsamples chosen to represent the relevant experience of particulargroups. [. . . ] In sentinel surveillance, standard case definitions andprotocols must be used to ensure validity of comparisons acrosstime and sites despite lack of statistically valid sampling. [. . . ] ”[Porta, 2014]
Surveillance “1. Systematic and continuous collection, analysis, andinterpretation of data, closely integrated with the timely and co-herent dissemination of the results and assessment to those whohave the right to know so that action can be taken. It is an essen-tial feature of epidemiological and public health practice. The finalphase in the surveillance chain is the application of information to
xxxvi

Glossary
health promotion and to disease prevention and control. A sur-veillance system includes a functional capacity for data collection,analysis, and dissemination linked to public health programs [. . . ];2. Continuous analysis, interpretation, and feedback of system-atically collected data, generally using methods distinguished bytheir practicality, uniformity, and rapidity rather than by accuracyor completeness. [. . . ]” [Porta, 2014]
Syndrome “A complex of signs and symptoms that tend to occur to-gether, often characterizing a disease.” [Porta, 2014]
Under-ascertainment “[. . . ] the number of infections occurring in indi-viduals that do not attend healthcare services for every case thatattends. There is a symptomatic fraction of all under-ascertainedcases that do not attend healthcare due to mild symptoms and/orthe knowledge that the illness is self-limiting or for some otherreasons, and an asymptomatic fraction that do not seek health-care as they are not aware of their infection status due to lack ofsymptoms [1].” [Gibbons et al., 2014]1. European Centre for Disease Prevention and Control (ECDC): Report:
Surveillance and Prevention of Hepatitis B and C in Europe. Stockholm,Sweden: ECDC; 2010
Under-diagnosis Refers to “[. . . ] the cases attending healthcare butwhose infection or pathogen is not diagnosed or misdiagnosed [1,2]”. [Gibbons et al., 2014]1. Hardnett FP, Hoekstra RM, Kennedy M, Charles L, Angulo FJ, for the
Emerging Infections Program FoodNet Working Group: Epidemiologic is-sues in study design and data analysis related to FoodNet activities. ClinInfect Dis 2004, 38(Supplement 3):S121–S126
2. MacDougall L, Majowicz S, Dore K, Flint J, Thomas K, Kovacs S, SockettP: Under-reporting of infectious gastrointestinal illness in British Columbia,Canada: who is counted in provincial communicable disease statistics? Epi-demiol Infect 2008, 136(02):248–256
Underestimation “[. . . ] the many ways in which surveillance systems failor are unable to reflect all infections in a given population. [. . . ] UE[underestimation] can be split into two distinct levels [. . . ]; under-ascertainment [. . . ] of infections occurring at the community-leveland underreporting [. . . ] of infections occurring at the healthcare-level.” [Gibbons et al., 2014]
Under-notification Refers to “[. . . ] the failure to report (using correctInternational Classification of Diseases (ICD) codes [1, 2]) all pos-itive diagnoses through the notification system [3, 4].” [Gibbonset al., 2014]
xxxvii

Glossary
1. Khosravi A, Rao C, Naghavi M, Taylor R, Jafari N, Lopez AD: Impactof misclassification on measures of cardiovascular disease mortality in theIslamic Republic of Iran: a cross-sectional study. Bull World Health Organ2008, 86(9):688–696
2. Crowcroft NS, Andrews N, Rooney C, Brisson M, Miller E: Deaths frompertussis are underestimated in England. Arch Dis Child 2002, 86(5):336–338
3. Martin-Ampudia M, Mariscal A, Lopez-Gigosos RM, Mora L,Fernandez-Crehuet J: Under-notification of cryptosporidiosis by routineclinical and laboratory practices among non-hospitalised children withacute diarrhoea in Southern Spain. Infection 2012, 40(2):113–119
4. Yuguero O, Serna MC, Real J, Galvan L, Riu P, Godoy P: [Using treatmentcompliance to determine the under-notification of tuberculosis in a healthregion for the years 2007–2009]. Aten Primaria 2012, 44(12):703–708
Underreporting Refers to infections “[. . . ] in individuals that do seekhealthcare, but whose health event is not captured by the surveil-lance system and not notified through the notification system [1-4].[. . . ] UR [underreporting] can be due to under-diagnosis [. . . ] andunder-notification [. . . ].” [Gibbons et al., 2014]1. Hardnett FP, Hoekstra RM, Kennedy M, Charles L, Angulo FJ, for the
Emerging Infections Program FoodNet Working Group: Epidemiologic is-sues in study design and data analysis related to FoodNet activities. ClinInfect Dis 2004, 38(Supplement 3):S121–S126
2. MacDougall L, Majowicz S, Dore K, Flint J, Thomas K, Kovacs S, SockettP: Under-reporting of infectious gastrointestinal illness in British Columbia,Canada: who is counted in provincial communicable disease statistics? Epi-demiol Infect 2008, 136(02):248–256
3. O’Brien S, Rait G, Hunter P, Gray J, Bolton F, Tompkins D, McLauchlinJ, Letley L, Adak G, Cowden J, et al.: Methods for determining diseaseburden and calibrating national surveillance data in the United Kingdom:the second study of infectious intestinal disease in the community (IID2study). BMC Med Res Methodol 2010, 10(1):39
4. Sethi D, Wheeler J, Rodrigues LC, Fox S, Roderick P: Investigation ofunder-ascertainment in epidemiological studies based in general practice.Int J Epidemiol 1999, 28(1):106–112
xxxviii

vi Preamble
Layout and formatting as well as numbering of figures and tables (incl.cross-references) of published articles were adapted. The reference listsof published articles (incl. those submitted or accepted) are provided asin the original published article at the end of the corresponding chapter,with their original numbering. References included in all unpublishedchapters (except those submitted or accepted) are summarised in a sep-arate chapter at the end of this thesis.A monograph of this thesis will be published once final versions ofthe submitted or accepted articles (chapter 8 and chapter 13) areavailable (foreseen in 2019). Please contact the author of this thesisor the Swiss Tropical and Public Health Institute (Daniel Mäusezahl;[email protected]) if you are interested in obtaining a prin-ted or electronic version.Terms defined in the glossary (chapter v) are marked with an asterisk(*) when used for the first time.
xxxix


Part I
INTRODUCTION,OBJECTIVES ANDMETHODOLOGY


1 Introduction
1.1 Surveillance of infectious diseases – the‘burden of illness pyramid’
Infectious diseases are of concern worldwide: globally, 230 million all–ageDisability Adjusted Life Years (DALYs) were caused by “diarrhoea, lowerrespiratory, and other common infectious diseases” in 2016, according tothe Global Burden of Diseases Study [GBD 2016 DALYs and HALECollaborators, 2017]. Thereof, 74.4 million DALYs (95% confidence in-terval (CI): 63.4–93.4) were attributable to “diarrhoeal diseases”, or 10.6million (95% CI: 6.0–17.3) to “intestinal infectious diseases”. Globally,“diarrhoeal diseases” are still ranked fifth in terms of leading causes oftotal DALYs in 2016 even though the number of DALYs due to com-municable diseases decreased while the number of DALYs due to non-communicable diseases increased [GBD 2016 DALYs and HALE Collab-orators, 2017].Surveillance* is defined by Porta as the “1. Systematic and continuouscollection, analysis, and interpretation of data, closely integrated withthe timely and coherent dissemination of the results and assessment tothose who have the right to know so that action can be taken. It isan essential feature of epidemiological and public health practice. Thefinal phase in the surveillance chain is the application of informationto health promotion and to disease prevention and control. A surveil-lance system includes a functional capacity for data collection, analysis,and dissemination linked to public health programs [. . . ]; 2. Continuousanalysis, interpretation, and feedback of systematically collected data,generally using methods distinguished by their practicality, uniformity,and rapidity rather than by accuracy or completeness. [. . . ]” [Porta,2014]. Surveillance of infectious diseases is, therefore, key for preventionand control. The disease surveillance and notification required accord-ing to the International Health Regulations (IHR) could be consideredto constitute the most comprehensive surveillance system for infectiousdiseases worldwide considering that 196 countries (including all WorldHealth Organization (WHO) member states) are committed to these reg-ulations. However, only “events which may constitute a public health
3

1 Introduction
emergency of international concern within its [the State Party’s] ter-ritory in accordance with the decision instrument [provided in Annex2 of the IHR] [. . . ]” should be notified to WHO. Such events include,but are not limited to, a case of smallpox, poliomyelitis due to wild-type poliovirus, human influenza caused by a new subtype, severe acuterespiratory syndrome (SARS), and “any event of potential internationalpublic health concern, including those of unknown causes or sources[. . . ]”. However, at national or regional level, also other infectious dis-eases or “events” are of concern apart from those potentially representingan international emergency. Therefore, many countries have set up theirown infectious disease surveillance system(s). Such surveillance systemscan be national, regional or based on sentinel sites; include physicians,hospitals and/or laboratories; and reporting can be compulsory or vol-untary. Passive surveillance* systems have in common that they hardly‘measure’ disease incidence of the general population. Depending ontheir set-up, they are subject to different degrees of underestimation*.Therefore, the incidence estimated through surveillance systems doesnot reflect the incidence of disease (or infection) in the population. Toaccount for this, the term notification rate* is used for the remainder ofthis thesis when referring to the ‘incidence of notified cases’.The metaphor of a pyramid is frequently used to illustrate underes-timation of surveillance systems, especially in the field of foodborneor gastrointestinal (GI) diseases. The different levels of the pyramid,referred to as the “burden of illness pyramid” [Allos et al., 2004], the“disease pyramid” [Lake et al., 2010], the “morbidity surveillance pyr-amid” [Gibbons et al., 2014], the “surveillance pyramid” [Haagsma et al.,2013; O’Brien et al., 2010], the “reporting pyramid” [Lake et al., 2010;O’Brien et al., 2010; Wheeler et al., 1999], or the “under-reporting pyr-amid” [MacDougall et al., 2008], depict the various steps involved leadingto a case being notified (Figure 1.1). The lowest level of the pyramidreflects the population exposed to a pathogen or the population devel-oping symptoms, depending on the author, while the top level of thepyramid represents the notified cases.Individuals infected with a foodborne pathogen who either do not de-velop symptoms and hence, are not aware of their disease or individualsnot seeking medical attention (due to mild symptoms or because theyare aware of the self-limiting nature of their disease) are referred to asunder-ascertained cases [Gibbons et al., 2014]. Individuals not reques-ted to submit a stool sample among those consulting a physician andindividuals whose stool sample is tested for the “wrong” pathogens aresummarised as under-diagnosed cases [Gibbons et al., 2014]. Finally,
4

1.1Surveillance
ofinfectiousdiseases
–the
‘burdenofillness
pyramid’
Figure 1.1: The burden of illness pyramid for foodborne pathogens.UE: underestimation, UA: under-ascertainment, UR: underreporting, UD: under-diagnosis, UN: under-notification. Adap-ted from Allos et al. [2004]; Gibbons et al. [2014]; MacDougall et al. [2008]
5

1 Introduction
the term of under-notification* is used to refer to cases whose pathogenis identified by the laboratory but not reported to national surveillance.Under-diagnosis* and under-notification are summarised as underreport-ing*; underestimation is composed of under-ascertainment* and under-reporting.
1.2 History of infectious disease surveillance inSwitzerland
Already the first federal constitution of Switzerland from 1848 containedan article on infectious diseases:
“Art. 59. Die Bundesbehördensind befugt, bei gemeingefährli-
Art. 59. The federal authorit-ies are entitled to issue decrees for
chen Seuchen gesundheitspolizeili- the sanitary police in case of epi-che Verfügungen zu erlassen.” [Ver- demic plagues constituting a publicfassungen der Schweiz. Bundesver- danger.fassung der Schweizerischen Eid-genossenschaft vom 12. September1848, n.d.]
With the complete revision of the federal constitution, entering intoforce in 1874, the corresponding article was rephrased. However, the lawstill stipulated a reactive rather than a proactive role of the authoritiesby defining competencies only in case of epidemics (as opposed to pre-ventive measures).
“Art. 69. Dem Bunde steht Art. 69. The federal authorit-die Gesetzgebung über die gegen ies are responsible to issue decreesgemeingefährliche Epidemien und for the sanitary police against epi-Viehseuchen zu treffenden gesund- demics and epizootic diseases con-heitspolizeilichen Verfügungen zu” stituting a public danger.[Verfassungen der Schweiz. Bun-desverfassung der SchweizerischenEidgenossenschaft vom 29. Mai1874, n.d.]
On 31st January 1882, the Swiss Federal Council issued the first Epi-demics Act which was, however, overruled by the popular vote in July1882 [Bundesblatt, 1882, 1886a]. Finally, in 1886, the first Epidemics
6

1.2 History of infectious disease surveillance in Switzerland
Act was established in Switzerland and entered into force on 1st Janu-ary 1887 [Bundesblatt, 1886b]. It targeted “epidemics constituting apublic danger” (“gemeingefährliche Epidemien”), namely pox, cholera,epidemic typhus and plague [Bundesblatt, 1886b]. Already this firstversion of the Epidemics Act stipulated that each case of the afore-mentioned diseases had to be notified to the local authorities. The draftversion from 1882 allowed for an extension of the law to also include “epi-demics constituting a public danger temporarily” such as scarlet fever,diphtheria, typhoid fever, dysentery and childbed fever [Bundesblatt,1882], an earlier version (from 1879) additionally mentioned measles[Bundesblatt, 1911]. This part was, however, discussed controversiallyand, hence, was not included in the final version [Bundesblatt, 1886a].In 1887 and 1894, respectively, the Federal Council specified that no-tification should occur within 12 (cholera) or 24 hours (pox, epidemictyphus and plague), and that reports should include the name and ageof the patient, the illness onset and severity, the date of notification,and information about mode of transmission and measures implemented[Bundesblatt, 1887, 1894].Meanwhile, a division for health (“Schweizerisches Gesundheitsamt”;Swiss Health Authority) was founded in 1893 with three employees, sub-ordinate to the Federal Department of Home Affairs (FDHA) [Bundes-blatt, 1893a,b]. The main responsibilities of the Swiss Health Authority,today’s Federal Office of Public Health (FOPH), were to coordinate thefederal diplomas for physicians, veterinarians and pharmacists, and tocontrol epidemics and food safety [Bundesamt für Gesundheit, 1993].Concerns were raised that the federal authorities should contribute tothe control of diseases other than the four “epidemic diseases constitut-ing a public danger” soon after the implementation of the first EpidemicsAct [Bundesblatt, 1911]. Additionally, it was suggested to replace theterm “epidemics constituting a public danger” (“gemeingefährliche Epi-demien”) for two reasons: first, the term “constituting a public danger”is too vague and second, the federal authorities should also be entitledto intervene in case of severe endemic diseases and/or in single cases ofepidemic diseases (preventing an epidemic) and hence, the term “epi-demic” was considered inappropriate. Therefore, revision of article 69of the federal constitution from 1874 was suggested to:
“Der Bund ist befugt, gegen The federal authorities are en-übertragbare, stark verbreitete oder titled to issue decrees for the san-bösartige Krankheiten von Men- itary police against communicable,schen und Tieren auf dem Wege widespread or virulent diseases of
7

1 Introduction
der Gesetzgebung gesundheitspo- humans and animals by means oflizeiliche Verfügungen zu treffen.” legislation.[Bundesblatt, 1911]
This revision (with slightly different wording) was approved by a pop-ular vote in 1913 [Bundesblatt, 1913]. It provided a basis for revisingthe Epidemics Act from 1886. Considering that total revision of laws istime-consuming, the Federal Assembly decided on a partial revision ofthe Epidemics Act in 1921 (based on a communication from the FederalCouncil from 1920) [Bundesblatt, 1920, 1921]. Among others, Art. 1(defining the four “epidemic diseases constituting a public danger”) wascomplemented by:
“Der Bundesrat ist indessen er- The Federal Council is author-mächtigt, die Bestimmungen die- ised to apply the terms of this lawses Gesetzes auch auf andere be- also for other especially dangeroussonders gefährliche übertragbare communicable diseases.Krankheiten anzuwenden.”
The original “Federal Act concerning measures against epidemics con-stituting a public danger” from 2nd July 1886 was finally replaced bythe “Federal Act on combating communicable human diseases” from18th December 1970 (entering into force on 1st July 1974) [Bundesblatt,1970b]. Main drivers for this revision were the increasing (awareness ofthe) importance of viral infections, the change in international traffic(increasing numbers as well as rapidly decreasing duration of a journey),and the outbreak of typhoid fever in Zermatt (Valais, Switzerland) in1963 with around 400 persons infected [Bundesblatt, 1970a]. Based onthis revised Epidemics Act, the Confederation and all cantons were em-powered and obliged to implement measures for combating communic-able human diseases [Bundesblatt, 1970b]. It defined the obligation forphysicians and hospitals to report cases and suspected cases of certaindiseases, and persons shedding pathogens to the cantonal authoritieswho then had to forward the report to the Federal Health Authority.Similarly, it newly obliged diagnostic laboratories to report certain mi-crobiological or serological findings to the cantonal authorities and theFederal Health Authority. The Federal Health Authority, on the otherhand, was responsible for publishing weekly, monthly and yearly statist-ics based on the aforementioned notifications.The Epidemics Act of 1970 further defined that cantons were respons-ible for the implementation of measures to control communicable diseases
8

1.3 Infectious disease surveillance systems in Switzerland
[Bundesblatt, 1970b]. The Federal Council could, however, mandate theimplementation of measures for the whole or parts of the country in caseof extraordinary circumstances.Finally, on 1st January 2016 a newly revised Epidemics Act, the “Fed-eral Act on combating communicable human diseases (Epidemics Act)”of 28th September 2012, entered into force [Die Bundesversammlung derSchweizerischen Eidgenossenschaft, 2012a].This revised Epidemics Act includes a more refined specification of rolesand processes for preparedness and response to crisis situations and laysa basis for establishing national goals and strategies in the context ofcommunicable diseases, strengthening the leading role of the FOPH,representing the federal authorities [Bundesamt für Gesundheit, 2016].Additionally, adaptations to new, contemporary challenges such as in-creased mobility and migration, climate change and newly emerging dis-eases have been made. One of the main triggers for the revision of theEpidemics Act of 1970 was the SARS epidemic of 2003 which showedthat coordination between federal and cantonal authorities could be im-proved.In conclusion, the inception of the Epidemics Act in Switzerland as wellas the two revisions thereof seem mostly triggered by national publichealth threats in the form of major outbreaks or newly emerging dis-eases.
1.3 Infectious disease surveillance systems inSwitzerland
There are currently four systems for surveillance and early detectionin place in Switzerland: a notification system for surveillance of clinicaland laboratory findings – the National Notification System for InfectiousDiseases (NNSID); a system for surveillance of frequent, communicablediseases – the Swiss Sentinel Surveillance Network (Sentinella); a sys-tem to survey rare communicable diseases in hospitalised children – theSwiss Pediatric Surveillance Unit (SPSU); and a system for surveillanceof therapy-associated infections and resistances of pathogens. Those foursystems are all based on the Epidemics Act and its related ordinances[Der Schweizerische Bundesrat, 2015b; Die Bundesversammlung der Sch-weizerischen Eidgenossenschaft, 2012b]. The purpose and set-up of thetwo first-mentioned systems is explained in more detail in the followingsections.
9

1 Introduction
1.3.1 The National Notification System for InfectiousDiseases
The National Notification System for Infectious Diseases (NNSID) is amandatory surveillance system for infectious diseases in Switzerland. Itslegal basis is the current Epidemics Act and more specifically the “Or-dinance on the control of human communicable diseases” of 25th April2015 and the “DHA Ordinance on the reporting of observations on hu-man communicable diseases” of 1st December 2015 [Das EidgenössischeDepartement des Innern, 2015a; Der Schweizerische Bundesrat, 2015b;Die Bundesversammlung der Schweizerischen Eidgenossenschaft, 2012b].In general terms, the Epidemics Act stipulates that it is compulsory toreport observations on communicable diseases: a) which can cause epi-demics; b) which can have serious consequences; c) which are novel or un-expected; or d) whose surveillance has been internationally agreed. Theordinances explicitly list which clinical and laboratory findings have tobe reported, by whom and to whom they have to be reported, as well aswithin which time limit notification has to occur. Notifiable observationsand the content thereof are reviewed for their necessity and purpose asrequired but at least once a year by the FOPH in collaboration with thecantonal physicians. Currently (as per January 2018), the DHA Ordin-ance lists 55 notifiable observations. A list of all notifiable observationsis provided in appendix A, table A.1. As soon as the criterion for noti-fication is fulfilled, observations have to be reported within 2 hours, 24hours or 1 week.
The process of notification
Physicians, hospitals and other public or private institutions in thehealthcare sector have to report observations on communicable diseasesto the cantonal health authorities of the patient’s canton of residenceand, for selected observations, additionally to the FOPH [Das Eidgenöss-ische Departement des Innern, 2015a; Der Schweizerische Bundesrat,2015b]. If the patient’s canton of residence is not known, the cantonalauthorities of the canton in which the observation was made has to benotified. Diagnostic laboratories have to report laboratory findings oncommunicable diseases both to the cantonal health authorities and tothe FOPH. Additionally, cantonal health authorities have to report allobservations which could point towards a threat for public health to theFOPH. Similarly, commanders of vessels and airplanes have to reportobservations indicative of a threat for public health to the operators ofharbours and airports.
10

1.3 Infectious disease surveillance systems in Switzerland
Cantonal physicians have to check completeness of notifications sent tothe cantonal health authorities and request additional information ornotifications, if necessary [Der Schweizerische Bundesrat, 2015b]. Fur-thermore, cantonal physicians forward notifications to the FOPH withinthe time frame for notification of the concerning observation and informcantonal chemists, cantonal veterinarians, cantonal pharmacists and/orother cantonal authorities (including cantonal physicians of other can-tons) as needed.Finally, at the FOPH, data from notification forms is manually enteredinto an electronic database since 1988. The process of disease notific-ation for clinical and laboratory findings is illustrated in appendix B(Figures B.1 and B.2).
The processing of notifications
Cantonal physicians are obliged to conduct epidemiological invest-igations in their cantons based on notifications, as appropriate [DerSchweizerische Bundesrat, 2015b]. The cantonal authorities may obligea person who could be infected and/or infectious to undergo medicalexamination and treatment, or to isolate this person (quarantine) [DieBundesversammlung der Schweizerischen Eidgenossenschaft, 2012b].The FOPH is available for consultation and support. The FOPH co-ordinates epidemiological investigations in case several cantons and/orinternational authorities or organisations are involved. Additionally, theFOPH itself can initiate epidemiological investigations.Furthermore, the FOPH has the responsibility to analyse the no-tifications and to provide anonymised statistics and reports forthe general public regularly [Der Schweizerische Bundesrat, 2015b].Weekly reports on case numbers can be found on the webpage of theFOPH (https://www.bag.admin.ch/bag/de/home/zahlen-und-statistiken/zahlen-zu-infektionskrankheiten/meldepflichtige-infektionskrankheiten---woechentliche-fallzahlen.html1)and in the “BAG Bulletin” (also available electronically, seehttps://www.bag.admin.ch/bag/de/home/das-bag/publikationen/periodika/bag-bulletin.html1). Additionally, analyses ofsurveillance data are published regularly in the “BAG Bulletin”.
1last accessed: 24 September 2018
11

1 Introduction
1.3.2 The Swiss Sentinel Surveillance NetworkThe Swiss Sentinel Surveillance Network (Sentinella) is a voluntary sen-tinel surveillance* system established in 1986 [Bundesamt für Gesund-heit, 2018b]. It allows surveying frequent non-notifiable diseases andpathogens and other public health issues as well as researching primarycare. Its purpose is to provide important insight into the incidence ofcontemporary diseases and public health issues in the Swiss populationand to highlight the importance of primary care medicine. Sentinellais managed by a steering committee consisting of representatives of theparticipating physicians, of the division of Communicable Diseases atthe FOPH, and of academic primary care institutes (of Lausanne, Bern,Basel, Zurich and Geneva) [Sentinella, 2018a]. The network is dividedinto six regions (“Sentinella-regions”); each region having its representat-ive in the steering committee. The administration of Sentinella is at theFOPH. They are responsible for data entry apart from completing otheradministrative tasks (e.g. organising meetings of the steering committeeand managing the database of participating physicians). Finally, physi-cians working as general practitioners (GPs), internists or paediatriciansin a (single or group) private practice are constituting the network (re-ferred to as “Sentinella-physicians” in this thesis).The steering committee decides which topics are surveyed (usually forat least one year). Between 8 and 14 topics per year were subject tosurveillance [Sentinella, 2018b]. Three thereof were included since theimplementation of Sentinella in 1986: influenza-like illness (ILI), deathdue to influenza, and mumps.In contrast to the NNSID, in Sentinella also non-communicable dis-eases or observations can be surveyed. Other differences are that re-ports within Sentinella are anonymous (with respect to the patient; thephysician can be identified on the notification form) and that Sentinella-physicians are financially compensated for their work. The network isfinanced by the FOPH.In Sentinella, physicians also report the number of consultations per day(the so-called “physician-patient-contact (PPC)*” which is defined as“each consultation in the practice and each domiciliary visit, independ-ent of whether or not the consultation/visit takes place in the frameworkof the usual consultation hour or outside consultation hour or duringemergency service”). This allows calculating the incidence per 1’000consultations and the consultation frequency per 100’000 population.The standard procedure for extrapolation used by Sentinella has beendescribed by Altpeter et al. [2013].
12

1.4 Foodborne diseases and acute gastroenteritis
In conclusion, Sentinella provides a platform to investigate a broad rangeof public health issues at primary care level in Switzerland which may beimportant but do not qualify for compulsory surveillance in the frame-work of the NNSID. The topics surveyed within Sentinella are set bya steering committee and hence, do not need to fulfil the same strict“requirements” as those surveyed within the NNSID (i.e. potential tocause epidemics, have serious consequences, be novel or unexpected, orbe of international importance).
1.4 Foodborne diseases and acutegastroenteritis
1.4.1 The difference between foodborne disease andacute gastroenteritis
Foodborne diseases* are defined as “Any disease of an infectious or toxicnature caused by the consumption of food.” [World Health Organiza-tion, 2008]. Hence, foodborne diseases include bacterial diseases suchas campylobacteriosis, salmonellosis, and listeriosis; viral diseases suchas hepatitis A and norovirus; parasitic diseases such as cryptosporidi-osis, giardiasis and trichinellosis, but also foodborne intoxications* dueto enterotoxins of Bacillus cereus, aflatoxins, or toxin of Clostridiumbotulinum. Many foodborne diseases cause GI signs and symptoms;however, they can also manifest differently, for example with neurolo-gical symptoms (e.g. botulism).Illnesses* due to GI signs and symptoms (such as diarrhoea, vomiting,nausea, abdominal pain) are often called “diarrhoeal diseases”, “acutediarrhoea”, “gastroenteritis”, and “acute gastroenteritis”. Such illnessesare frequently caused by infectious agents but can also be due to non-in-fectious conditions (e.g. appendicitis, inflammatory bowel disease (IBD),adverse effects of drugs, pregnancy, cancer) [Frese et al., 2011; Manat-sathit et al., 2002; Pfeiffer et al., 2012]. Diarrhoea can further be classi-fied as “acute” (lasting ≤14 days), “persistent” (lasting >14 days, or >14and ≤29 days), or “chronic” (lasting >30 days) [DuPont, 2014; Guerrantet al., 2001; Riddle et al., 2016]; and “watery” or “bloody” (in the lat-ter case often referred to as “inflammatory diarrhoea” or “dysentery”)[Guerrant et al., 2001; Manatsathit et al., 2002].This variety of terms used – sometimes with clear definitions, sometimesused interchangeably – for syndromes* associated with GI signs andsymptoms and foodborne diseases makes it difficult to compare estim-
13

1 Introduction
ates of the disease incidence and burden from different studies. Usingthe “correct” terms is further complicated by the fact that not all food-borne diseases result in acute gastroenteritis (AG)*; and conversely, notevery person experiencing AG suffers from a foodborne disease.
1.4.2 The burden of foodborne diseasesIn 2010, 600 million cases of illness were caused by 31 foodborne hazards,according to estimates of the Foodborne Disease Burden EpidemiologyReference Group (FERG) established by WHO [Havelaar et al., 2015].An estimated 33 million DALYs were attributable to those 600 millioncases of foodborne illnesses including sequelae [Havelaar et al., 2015].For these calculations, the viral, bacterial and protozoal hazards wereclassified as “diarrhoeal disease” or “invasive disease” according to theirmain manifestation; additionally, all hazards were classified as either“entirely foodborne” or “partly foodborne” (Table 1.1; [Havelaar et al.,2015]. It is apparent that none of the pathogens classified as “diarrhoealdisease” (of viral, bacterial and protozoal origin) is entirely foodborne.In contrast, many helminths and chemicals or toxins are considered tobe exclusively transmitted through food.The burden of foodborne disease is not evenly distributed across theworld: it was estimated that the 31 foodborne hazards consideredby the FERG were causing the least DALYs per 100’000 popula-tion (35 DALYs/100’000; 95% uncertainty interval: 23–49) in the“AMR A” region2 and the most DALYs in the “AFR D” region3 (1’276DALYs/100’000; 95% uncertainty interval: 459–2’263) [Havelaar et al.,2015]. The largest burden occurs in children under 5 years of age.Other estimates of the FERG suggest that 22 diseases (viruses, bacteriaand protozoa; 4 of which are distinct manifestations of Salmonella en-terica) lead to 2 billion illnesses in 2010 worldwide of which 582 millionwere of foodborne origin [Kirk et al., 2015]. Campylobacter spp. andnorovirus were the bacterial and viral pathogens causing most illnessesof foodborne origin. Furthermore, it was estimated that the 22 diseasescaused 1.1 million deaths in 2010, 32% of which (350’686) were of food-borne origin [Kirk et al., 2015]. The highest number of foodborne deaths
2Countries included in “AMR A” region are: Canada, Cuba, United States of Amer-ica
3Countries included in “AFR D” region are: Algeria, Angola, Benin, Burkina Faso,Cameroon, Cape Verde, Chad, Comoros, Equatorial Guinea, Gabon, Gambia,Ghana, Guinea, Guinea-Bissau, Liberia, Madagascar, Mali, Mauritania, Mauri-tius, Niger, Nigeria, Sao Tome and Principe, Senegal, Seychelles, Sierra Leone,Togo
14

1.4Foodborne
diseasesand
acutegastroenteritis
Table 1.1: Predominant disease manifestation and estimated proportion of foodborne transmission for the “EUR A”regiona (including Switzerland) of 31 hazards commonly associated with foodborne illness according to Hald et al. [2016];Havelaar et al. [2015]
Predominantly causing Entirely foodborne Partly foodborne (estimated %foodborne in “EUR A” regiona)
Viruses Acute diarrhoeal disease Norovirus (26%)Invasive infectious disease Hepatitis A virus (42%)
Bacteria Acute diarrhoeal disease Campylobacter spp. (76%)Enteropathogenic E. coli (64%)Enterotoxigenic E. coli (42%)Shiga toxin-producing E. coli (60%)
Non-typhoidal Salmonella entericab (76%)Shigella spp. (7%)Vibrio cholerae (31%)
Invasive infectious disease Listeria monocytogenes Brucella spp. (66%)Mycobacterium bovis Salmonella Paratyphi A (n.a.c)
Salmonella Typhi (10%)Protozoa Acute diarrhoeal disease Cryptosporidium spp. (10%)
Entamoeba histolytica (33%)Giardia spp. (11%)
Invasive infectious disease Toxoplasma gondii (61%)
15

1IntroductionTable 1.1: (continued)
Predominantly causing Entirely foodborne Partly foodborne (estimated %foodborne in “EUR A”a region)
Helminths Clonorchis sinensis Ascaris spp. (85%)Fasciola spp. Echinococcus granulosus (21%)
Intestinal flukesd Echinococcus multilocularis (52%)Opisthorchis spp.Paragonimus spp.Taenia soliumTrichinella spp.
Chemicalsand toxins
Aflatoxin
Cassava cyanideDioxins
a “EUR A” region includes: Andorra, Austria, Belgium, Croatia, Cyprus, Czech Republic, Denmark, Finland, France,Germany, Greece, Iceland, Ireland, Israel, Italy, Luxembourg, Malta, Monaco, Netherlands, Norway, Portugal, SanMarino, Slovenia, Spain, Sweden, Switzerland, United Kingdomb Diarrhoeal and invasive diseasec n.a. = not availabled Includes selected species of the families Echinostomatidae, Fasciolidae, Gymnophallidae, Heterophyidae, Nano-phyetidae, Neodiplostomidae, and Plagiorchiidae (depending on data availability)
16

1.4 Foodborne diseases and acute gastroenteritis
was attributed to Salmonella enterica Typhi, followed by enteropatho-genic Escherichia coli (EPEC) and norovirus.In Europe, Campylobacter is the most frequently reported bacterial,foodborne pathogen since 2005 [European Food Safety Authority andEuropean Centre for Disease Prevention and Control, 2017]. The num-ber of reported confirmed cases was 246’307 in 2016, corresponding toa notification rate of 66.3/100’000 population (based on reports from27 European Union (EU) member states) [European Food Safety Au-thority and European Centre for Disease Prevention and Control, 2017].Sixteen member states also provided information on the outcome for178’726 cases. They reported a total of 62 deaths attributable to cam-pylobacteriosis corresponding to a case fatality rate of 0.03%. However,all these figures are subject to underestimation. The “true” incidence ofcampylobacteriosis in the EU was estimated at 9.2 million cases in 2009– a year in which 198’252 confirmed cases were reported [Havelaar et al.,2013].Foodborne disease can also lead to sequelae apart from causing acuteillnesses and deaths. Infection with Campylobacter can lead, for ex-ample, to reactive arthritis (ReA), Guillain-Barré syndrome (GBS), hae-molytic-uraemic syndrome (HUS), IBD, and irritable bowel syndrome(IBS) [Keithlin et al., 2014; Mahon and Patrick, 2015; O’Brien, 2017].Enterohaemorrhagic Escherichia coli (EHEC) infection has mostly beenassociated with HUS, but also thrombotic thrombocytopenic purpuraand ReA have been described [Dundas and Todd, 2000; Keithlin et al.,2014]. The best described complications of enteric Salmonella infectionsare ReA and IBS [Keithlin et al., 2015].
1.4.3 The burden of acute gastroenteritisThe Global Burden of Disease Study provided estimates for “diarrhoealdiseases” but not for “acute gastroenteritis” [GBD Diarrhoeal DiseasesCollaborators, 2017]. In 2015, “diarrhoeal diseases” were estimated toresult in a global burden of 71.6 million DALYs (74.4 million in 2016[GBD 2016 DALYs and HALE Collaborators, 2017]) and 1.3 milliondeaths (corresponding to 17.8 deaths per 100’000 population) due to2.4 billion episodes. The burden of diarrhoeal diseases was estimated at80’000 episodes, 1’787 DALYs, and 135 deaths (1.6/100’000) for Switzer-land [GBD Diarrhoeal Diseases Collaborators, 2017]. Population-basedstudies investigating the incidence or burden of disease of AG are lackingfor Switzerland. However, results of several studies conducted in high-income countries indicate that AG is more frequent than suggested by
17

1 Introduction
the aforementioned Global Burden of Disease Study. For example, amodelling study revealed that, in Australia, there were 16 million casesof “all-cause infectious AG” in 2010, corresponding to around 0.76 epis-odes per person-year [Gibney et al., 2014]. Around 0.33 cases of AG perperson-year were found in a retrospective cross-sectional telephone sur-vey in France in 2009/2010 [Van Cauteren et al., 2012]. A retrospectivetelephone survey on “intestinal infectious disease” in the UK found 0.53and 1.53 cases per person-year, depending on the recall period [Vivianiet al., 2016]. In the Netherlands, 0.96 episodes of “infectious intestinaldisease” were reported per person-year [Doorduyn et al., 2012]. Sim-ilarly, the incidence of “acute gastrointestinal illness” was estimated at0.95 episodes per person-year in Germany [Wilking et al., 2013]. Assum-ing similar incidence rates for Switzerland of 0.3–1.5 disease episodes perperson-year (with a population size of 8.4 million [Bundesamt für Stat-istik, 2017a]) would result in around 2.5–12.6 million episodes annually.As mentioned above, differences in reported disease incidence cannotonly be due to actual differences between countries but could also resultfrom different case definitions and study designs used. To overcome thislimitation, Majowicz et al. [2008] proposed a standard case definition forAG which is generally used in this thesis: “An individual with ≥3 loosestools, or any vomiting, in 24h, but excluding those (a) with cancer ofthe bowel, irritable bowel syndrome, Crohn’s disease, ulcerative colitis,cystic fibriosis, coeliac disease, or another chronic illness with symptomsof diarrhoea or vomiting, or (b) who report their symptoms were due todrugs, alcohol, or pregnancy.” [Majowicz et al., 2008]. Note, however,that Majowicz et al. proposed this definition for “gastroenteritis” insteadof “acute gastroenteritis”. Still, it has to be noted that this standard casedefinition is not universally applied and hence, might not always havebeen used, especially when referring to other literature.Generally, AG is self-limiting. Therapy should focus on fluid replace-ment; however in patients with febrile or dysenteric diarrhoea, patientswith co-morbidities, and/or in laboratory-confirmed cases of bacterial in-fection antimicrobial therapy should be considered [DuPont, 2014; Guer-rant et al., 2001; Schweiger et al., 2005b].
1.4.4 Foodborne disease or acute gastroenteritis: whatis and what should be measured
Laboratory-based surveillance* systems measure the (laboratory-con-firmed) incidence of selected pathogens. This incidence will neither re-flect the incidence of foodborne disease nor the incidence of AG due to
18

1.5 Foodborne disease surveillance in Switzerland
this pathogen except if the pathogen is entirely foodborne and/or itsonly manifestation is AG.Surveillance systems focussing on clinical features of a disease ratherthan laboratory results could more precisely measure AG. However, thisapproach would also include cases which are not caused by infectiousagents and hence, which require a different approach to control and pre-vention.Finally, whether or not a certain pathogen was transmitted via food orthrough another route of transmission can hardly be determined withoutdetailed investigation. Such detailed investigation could involve identi-fication and molecular characterisation of the pathogen both, in foodstuffand in human samples.What should be measured largely depends on the purpose of the investig-ation or the perspective to look at. For characterising the burden of dis-ease in a population, looking at signs and symptoms (hence, AG) ratherthan the aetiology seems appropriate. However, usefulness of these datais probably limited for defining interventions. Hence, if targeted inter-ventions are the ultimate goal, investigating transmission routes and thefrequency of foodborne disease is probably more appropriate.In summary, most studies and surveillance systems investigate or meas-ure a part or a combination of foodborne disease and AG. Surveillancesystems such as the NNSID could be best described as measuring the“incidence of laboratory-confirmed infections caused by pathogens com-monly transmitted through food” (apart from many other diseases andpathogens neither associated with foodborne disease nor AG).
1.5 Foodborne disease surveillance inSwitzerland
In Switzerland, the following diseases commonly transmitted throughfood are currently notifiable (as per January 2018): Botulism, brucel-losis, campylobacteriosis, cholera, infection with EHEC, hepatitis A, hep-atitis E, listeriosis, salmonellosis, shigellosis, trichinellosis, and typhoidfever. Table 1.2 shows the notification criteria for reports on clinical find-ings (completed by physicians) and on laboratory findings (completedby laboratories) and the time frame for reporting for the aforementionedpathogens. The time frame for reporting most foodborne pathogens hasbeen shortened to 24 hours with the implementation of the new Epidem-ics Act. For campylobacteriosis, salmonellosis and shigellosis no clinicalreports are required; hence, nothing is known about disease manifesta-
19

1IntroductionTable 1.2: Notifiable pathogens and diseases commonly transmitted through food in Switzerland: notification criteria,process and time frame as per January 2018 [Das Eidgenössische Departement des Innern, 2015a]
Physician LaboratoryDisease/pathogen Notification criterion Time
frameTo whom Notification criterion Time frame
Botulism /Clostridiumbotulinum
Clinical suspicionAND administrationof antitoxin (not tonotify: wound andinfant botulism)
2 hours,by phone
CPa andFOPH
Positive findingNegative finding (notto notify: wound andinfant botulism)
2 hours, byphone
Brucellosis / Brucellaspp.
Positive laboratoryfinding
1 week CPa Positive finding 1 week
Campylobacteriosis /Campylobacter spp.
Positive findingNegative findingb
Pos: 24 hoursNeg: 1 week
Cholera / Vibriocholerae
Positive laboratoryfinding
24 hours CPa Positive finding 24 hours
Infection withEHEC / EHEC
Positive laboratoryfinding
24 hours CPa Positive findingNegative findingb
Pos: 24 hoursNeg: 1 week
Hepatitis A /Hepatitis A virus
Positive laboratoryfinding
24 hours CPa Positive finding (notto notify:investigation ofimmune status)Negative findingb
Pos: 24 hoursNeg: 1 week
20

1.5Foodborne
diseasesurveillance
inSw
itzerland
Table 1.2: (continued)
Physician LaboratoryDisease/pathogen Notification criterion Time
frameTo whom Notification criterion Time frame
Hepatitis Ec /Hepatitis E virusc
Positive laboratoryfinding (PCR)
24 hours CPa Positive finding (PCRonly)Negative findingb
Pos: 24 hoursNeg: 1 week
Listeriosis / Listeriamonocytogenes
Positive laboratoryfinding
24 hours CPa Positive findingNegative findingb
Pos: 24 hoursNeg: 1 week
Salmonellosis /Salmonella spp.
Positive findingNegative findingb
Pos: 24 hoursNeg: 1 week
Shigellosis / Shigellaspp.
Positive findingNegative findingb
Pos: 24 hoursNeg: 1 week
Trichinellosis /Trichinella spiralis
Positive laboratoryfinding
1 week CPa Positive finding 1 week
Typhoidfever / SalmonellaTyphi/Paratyphi
Positive laboratoryfinding
24 hours CPa Positive findingNegative findingb
Pos: 24 hoursNeg: 1 week
a CP = cantonal physicianb Only upon request of the FOPH for epidemiological investigations; since 2018c Notifiable since 2018
21

1 Introduction
Table 1.3: Case numbers and notification rates of notifiable pathogens com-monly transmitted through food in Switzerland, 2017.Source: [Bundesamt für Gesundheit, 2018c]
Pathogen Casenumbers
Notificationrate (cases/100’000 pop-ulation)
Botulism / Clostridium botulinum 2 0.02Brucellosis / Brucella spp. 10 0.12Campylobacteriosis / Campylobacterspp.
6’828 80.73
Cholera / Vibrio cholerae 0 0Infection with EHEC / EHEC 698 8.25Hepatitis A / Hepatitis A virus 114 1.35Listeriosis / Listeria monocytogenes 45 0.53Salmonellosis / Salmonella spp. 1’832 21.66Shigellosis / Shigella spp. 142 1.68Trichinellosis / Trichinella spiralis 1 0.01Typhoid fever / SalmonellaTyphi/Paratyphi
22 0.26
tion from surveillance data.Additionally, in 2016, it was introduced that for Campylobacter and Sal-monella (and selected other non-foodborne pathogens) the total numberof tests conducted by month and test method and, thereof, the num-ber of positive results has to be reported once a year. Before this date,no information on the testing volume was available for foodborne infec-tions. Testing volume was only notifiable for human immunodeficiencyvirus (HIV), influenza and Legionella [Das Eidgenössische Departementdes Innern, 1999]. Since 2018, the ordinance furthermore stipulates thatfor selected pathogens (among them are almost all foodborne patho-gens) negative findings are notifiable for epidemiological investigationsupon request of the FOPH [Das Eidgenössische Departement des Innern,2015a].Reports on clinical findings usually include the patient’s name and ad-dress or the patient’s initials and place of residence, date of birth, sex,profession, diagnosis and disease manifestation, information on exposureand risk factors.Reports on laboratory findings include also the name and address or theinitials and place of residence, date of birth and sex of the patient; and
22

1.6 Epidemiology of foodborne pathogens: Switzerland and EU
the test result with its interpretation, the sample material, and the dia-gnostic method used. Additionally, the species, subspecies, serotype ortype of toxin (if applicable) have to be reported by laboratories.Campylobacter spp. is the most frequently reported foodborne pathogenin Switzerland, followed by Salmonella spp. and EHEC (Table 1.3). Thisis in line with surveillance data from the EU [European Food Safety Au-thority and European Centre for Disease Prevention and Control, 2017].However, in the EU, EHEC is relegated to the fourth place by yersiniosis,the latter not being notifiable in Switzerland.
1.6 The epidemiology of selected foodbornepathogens in Switzerland and in theEuropean Union
Campylobacter notifications have been increasing between 2005 and 2012by about 50% in Switzerland and stabilised at high levels since then[Baumgartner et al., 2012; Bundesamt für Lebensmittelsicherheit undVeterinärwesen and Bundesamt für Gesundheit, 2017]. EHEC case num-bers are increasing considerably since 2014 [Bundesamt für Lebensmit-telsicherheit und Veterinärwesen and Bundesamt für Gesundheit, 2017].With almost 700 cases, case numbers in 2017 were the highest ever re-gistered since the beginning of EHEC-reporting in 1999 [Bundesamt fürGesundheit, 2018c; Bundesamt für Lebensmittelsicherheit und Veter-inärwesen and Bundesamt für Gesundheit, 2017]. In contrast, Salmon-ella notifications were highest in 1992 with around 7’900 cases and de-creased continuously thereafter [Schmid and Baumgartner, 2013]. Since2009, case numbers stabilised at 1’000–1’500 cases per year [Bundesamtfür Lebensmittelsicherheit und Veterinärwesen and Bundesamt für Ge-sundheit, 2017].Similarly, in the EU, Campylobacter and Salmonella showed an increas-ing and decreasing trend between 2008 and 2016, respectively, whichwas, however, not statistically significant for the period between 2012and 2016 [European Food Safety Authority and European Centre forDisease Prevention and Control, 2017]. Reasons for the increase in cam-pylobacteriosis cases in the EU are manifold: apart from changes indisease epidemiology, some countries have improved their reporting sys-tem or changed diagnostic methods leading to an increase in notifiedcases [European Food Safety Authority and European Centre for Dis-ease Prevention and Control, 2017]. In a modelling study, Havelaar
23

1 Introduction
et al. [2013] estimated the true incidence of campylobacteriosis and sal-monellosis for all EU member states (27 at that time). They came upwith factors of underestimation4 for campylobacteriosis ranging from 0.4(Finland & Sweden) to 39’400 (Bulgaria) and for salmonellosis rangingfrom 0.4 (Finland) to 2’080 (Portugal). Additionally, they modelled alsothe numbers for Switzerland and suggested that reported cases underes-timate the true incidence by a factor of 3.3 for campylobacteriosis and7.1 for salmonellosis. However, there are no other research studies avail-able to support these modelling results for Switzerland. In France, thefactor of underestimation was found at 115 (campylobacteriosis) and 20(salmonellosis) [Van Cauteren et al., 2015a]. Two studies in England /the United Kingdom (UK) revealed multiplication factors of 7.6 and 9.3for campylobacteriosis, and 3.2 and 4.7 for salmonellosis [Tam et al.,2012; Wheeler et al., 1999].For EHEC, the epidemiological situation looks different in the EU com-pared to Switzerland: there was only a slight increase noted in the EUbetween 2015 and 2016 [European Food Safety Authority and EuropeanCentre for Disease Prevention and Control, 2017]. However, case num-bers in the 2012–2016 period are reported to be at higher levels aftera large outbreak in 2011 compared to the period before the outbreak[European Food Safety Authority and European Centre for Disease Pre-vention and Control, 2017]. The outbreak in Germany in 2011 mostlikely raised the awareness for EHEC among Swiss physicians, leadingto slightly higher case numbers also in Switzerland [Bundesamt für Ge-sundheit and Nationales Referenzzentrum für enteropathogene Bakterienund Listerien, 2015]. For EHEC, the multiplication factor was estimatedat 7.4 in the UK [Tam et al., 2012].Hepatitis A, the only viral foodborne disease in the Swiss notificationsystem, showed a decreasing trend from 1988 with a notification rate of10/100’000 population to 2002 (1.9/100’000) [Bundesamt für Gesund-heit et al., 2007]. Case numbers remained at a low level until 2016[Bundesamt für Gesundheit, 2018c]. In early 2017, an increase in caseswas noted which may be linked to a European-wide outbreak amongmen who have sex with men (MSM) [Bundesamt für Gesundheit, 2017b;European Centre for Disease Prevention and Control, 2017]. Underes-timation is also an issue in hepatitis A surveillance: in the United Statesof America (USA) it was estimated that 2 infections occur in the pop-
4Havelaar et al. [2013] refers to “underreporting”, not “underestimation”. However,what they compared is the number of reported cases and the “true incidence”which reflects underestimation according to the definition used in this thesis (seechapter v “Glossary”)
24

1.6 Epidemiology of foodborne pathogens: Switzerland and EU
ulation for every case reported to national surveillance [Klevens et al.,2014]. Furthermore, a systematic review and meta-analysis looking atunderreporting of hepatitis A in non-endemic countries revealed that 4to 97% of hepatitis A cases were reported to public health [Savage et al.,2016].In conclusion, the huge range of underestimation factors between coun-tries shows that reported case numbers should be compared across coun-tries with caution and that multiplication factors are not interchangeablebetween countries or health systems not allowing comparing nationaldisease burdens. Similarly, multiplication factors are pathogen-specific.Therefore, exploring the level of underestimation is key in order to un-derstand how surveillance data relate to the incidence in the population.Furthermore, underestimation involves many steps which can changeover time; hence, the validity of estimated multiplication factors shouldbe assessed regularly.
25


2 Rationale, aim and objectives
2.1 Rationale to study the ‘burden of illnesspyramid’
In Switzerland, notifiable foodborne diseases show both, increasing anddecreasing trends in the surveillance data of the NNSID. However, itis largely unknown how these trends observed in national surveillancerelate to trends in disease incidence. A variety of factors contributesto the underestimation of the burden of notifiable diseases which de-pend on characteristics of the pathogen and the health system, bothinfluencing patients’ health seeking, physicians’ case management andlaboratories’ testing practices. These steps leading from infection to na-tional disease registration, represented in the burden of illness pyramid,are neither fully understood nor quantified for Switzerland. Underestim-ation is highly country- and pathogen-specific. Furthermore, the level ofunderestimation can change over time. Therefore, estimates of underes-timation from other countries can only give limited insight into possiblemultiplication factors for Switzerland.Knowing the burden of disease at population level is important for pri-ority setting of interventions. However, this burden cannot be quantifiedin the absence of knowing levels of and factors contributing to under-estimation of surveillance data, or of data of population-based studies.Under the assumption that underestimation does not change over time,surveillance data could still be used to assess trends in disease incidence.However, this assumption is daring given the sheer number of factorscontributing to underestimation. Hence, decisions based on currentlyavailable surveillance data are subject to questionable assumptions.In summary, understanding the different levels of the burden of illnesspyramid and the determinants for advancing from one level to the nextis key for correctly interpreting data from the NNSID and for evidence-based decision-making.
27

2 Rationale, aim and objectives
2.2 Aim and objectivesThe aim of this PhD thesis is to contribute to a better understanding ofthe burden of illness pyramid for foodborne infections in Switzerland andto apply this knowledge to improve Swiss infectious disease surveillanceand control. This will be achieved by characterising data and diseasein the surveillance system, researching physicians’ and patients’ beha-viour, determining validity of routine health data bases and assessingthe social and economic impacts of foodborne infections. Furthermore,the proportion of individuals advancing from one level to the next in theburden of illness pyramid will be quantified.
Objective 1: To investigate the frequency of cases of foodborne infec-tions as reported to the NNSID and thus, as seen in thetop levels of the burden of illness pyramida) To describe trends in notification data of foodborne
pathogensb) To calculate positivity rates of foodborne pathogen
testing in Switzerland
Objective 2: To investigate the frequency and burden of disease ofacute gastroenteritis (AG) at the primary care level inSwitzerlanda) To assess trends in the frequency of stool testing for
foodborne pathogensb) To understand and quantitatively characterise physi-
cians’ stool testing practices for patients with AGc) To describe the physicians’ perception of AG and food-
borne diseasesd) To estimate direct healthcare costs of AG at primary
care level in Switzerland
Objective 3: To propose a concept to investigate acute gastrointestinalillness (AGI) at population level in Switzerlanda) To develop a study protocol for a population-based
study on the frequency, burden of disease, aetiologyand socio-economic impact of AGI in the Swiss popu-lation
28

3 Research concept andmethodological overview
The research presented in this PhD thesis is part of a broader researchportfolio consisting of several projects and culminating in multiple PhDtheses on Swiss health system’s research of food- and water-borne in-fectious diseases. This PhD thesis is the second in the series. The firstvolume on “Infectious disease surveillance in Switzerland” is entitled“Epidemiology of campylobacteriosis and acute gastroenteritis from ahuman and health system’s perspective in Switzerland” [Bless, 2018].The research portfolio started by exploring the epidemiology of campylo-bacteriosis in Switzerland. In this context the importance and lack ofunderstanding of the burden of illness pyramid was noted. Consequently,the scope was broadened to include foodborne diseases in general andstrengthened its focus on understanding and quantifying the differentlevels of the burden of illness pyramid. Furthermore, this research port-folio aims at understanding the validity of data from Swiss infectiousdisease surveillance and generating a basis for improving national sur-veillance.
3.1 Overview of research approaches and studydesigns
The research approach applied for each study is summarised in this sec-tion. Figure 3.1 provides an overview of each study undertaken for thisthesis studying the various levels of the burden of illness pyramid.
3.1.1 Analysing notification data on Campylobacter ,Salmonella, and hepatitis A
These studies contribute to objective 1a of this thesis.
Notification data of different foodborne pathogens have been analysed inthe framework of this thesis to understand the tip of the burden of illnesspyramid. For this, data from the NNSID were requested from the FOPH
29

3Research
conceptand
methodologicaloverview
Figure 3.1: Overview of PhD research framework to better understand the burden of illness pyramid for foodborneinfections in SwitzerlandAG: acute gastroenteritis; EHEC: enterohaemorrhagic E. coli; GP: general practitioner
30

3.1 Overview of research approaches and study designs
for Campylobacter and Salmonella (both for the years 1988–2013) andfor hepatitis A (years 1988–2016).Campylobacter and Salmonella notification data included only inform-ation from reports on laboratory findings. Trends in case numbers andcharacteristics (age, sex) were analysed and compared for the two patho-gens in the light of similar transmission patterns and different publicawareness.For hepatitis A, laboratory reports are complemented by reports on clin-ical findings providing more detailed information on patient character-istics such as risk factors and suspected exposure sources. Hepatitis Anotification data was not only analysed for trends due to changing dis-ease epidemiology and patient characteristics or interventions, but alsofor trends due to changes in the surveillance system (e.g. changes innotification forms).Detailed descriptions of the methods applied for these research compon-ents are provided in chapter 4 (Schmutz et al. [2016]) and chapter 5(Schmutz et al. [2018]).
3.1.2 Studying trends in laboratory positivity rates ofCampylobacter , Salmonella, and EHEC
These studies contribute to objective 1b and objective 2a of thisthesis.
The number of tests conducted by diagnostic laboratories is notifiablefor selected foodborne pathogens only since the introduction of the newEpidemics Act in 2016. Testing per se is a pre-requisite for isolating apathogen, and hence, the number of tests conducted is strongly influen-cing the number of case notifications. Therefore, diagnostic laboratorieswere asked to provide information on all tests conducted for Campy-lobacter spp., Salmonella spp. and EHEC over a 10-year period. Thisdata was used to calculate positivity rates, defined as the proportion ofpositive test results out of all tests conducted for a certain pathogen.Time trends in positivity rates were evaluated together with time trendsobserved in the NNSID to better understand how notification data trans-late to the incidence of the disease at population level.Laboratories reporting highest case numbers for the respective patho-gens were selected. Additional laboratories were selected, if necessary,to include all language regions of Switzerland and to represent both hos-pital and private-sector laboratories.For Campylobacter and Salmonella, 11 diagnostic laboratories were se-
31

3 Research concept and methodological overview
lected and asked to provide data for the years 2003–2012. Requestedinformation included case-based data on the patient tested (sex, age,canton of residence, personal identification number assigned by laborat-ory) and test characteristics (pathogen tested, test result, date of test,test method applied).For EHEC, the selection included 11 diagnostic laboratories as well. Thelaboratories were asked for the same information as for Campylobacterand Salmonella for the years 2007–2016.Detailed descriptions of the methods applied for these research compon-ents are provided in chapter 6 (Bless et al. [2017]) and chapter 8.
3.1.3 Understanding laboratory practices and itsinfluence on notification data: the example ofEHEC
This study contributes to objective 1a and objective 2a of this thesis.
Usually, stool samples are used for laboratory diagnostics in case of AG, iflaboratory diagnostics are considered at all. Physicians as well as labor-atory experts influence the selection of pathogens for which the stoolsample is tested. Stakeholders from diagnostic laboratories were con-sulted to understand current practice in laboratory diagnosis of EHECin Switzerland as well as recent changes therein, potentially influencingsurveillance data. Experts working at the laboratories selected for thepositivity study on EHEC (see subsection 3.1.2 and chapter 8) wereasked to participate. This sampling allowed obtaining background in-formation for interpretation of findings from the positivity study apartfrom providing important insight into current laboratory practices.A detailed description of the methods applied for this research compon-ent is provided in chapter 7.
3.1.4 Understanding physicians’ approaches towardsacute gastroenteritis case management – aqualitative approach
This study contributes to objective 2b, objective 2c and objective 2dof this thesis.
Swiss GPs in charge of treating campylobacteriosis patients of a case-control study [Bless et al., 2014] were invited to participate in this qual-itative study. GPs were interviewed to get insight into their approaches
32

3.1 Overview of research approaches and study designs
to managing patients presenting with AG in general and campylobac-teriosis in particular. Understanding case management, and the GPs’decision-making process for or against stool diagnostics in particular, isimportant for understanding the burden of illness pyramid.Interviews were additionally used to assess the GPs’ perception of theFOPH.A detailed description of the methods applied for this research com-ponent is provided in Bless et al. [2016]. A summary of this articleincluding further analyses and additional results on the GPs perceptionof their role, of the Swiss health system and of the FOPH is provided inchapter 10.
3.1.5 Understanding physicians’ approaches towardsacute gastroenteritis case management – aquantitative study
This study contributes to objective 2b, objective 2c and objective 2dof this thesis.
In 2014, a study on the frequency of consultations due to AG at the pri-mary care level in Switzerland was conducted within Sentinella. All firstconsultations due to AG were reported by Sentinella-physicians for a fullcalendar year. Date of birth, sex, hospitalisation status and whether ornot the GP requested a stool sample was recorded for all cases. For a sub-sample of patients, physicians reported additional information includingsigns and symptoms, medication, absence from work and exposure to se-lected risk factors. Results from the preceding qualitative study amongSwiss GPs (see chapter 10 and Bless et al. [2016]) were considered whendeveloping the questionnaire for this study. Apart from providing estim-ates on the frequency of consultations due to AG at the primary carelevel, this study provided quantitative insights into GPs’ approaches todiagnosis and treatment of AG in Swiss primary care.A detailed description of the methods applied for this research compon-ent is provided in chapter 11 [Schmutz et al., 2017a].
3.1.6 Studying healthcare costs of acute gastroenteritisand campylobacteriosis
This study contributes to objective 2d of this thesis.
This study aimed at estimating healthcare costs of campylobacteriosis in
33

3 Research concept and methodological overview
Switzerland. Given the difficulty to clearly separate campylobacteriosisfrom AG (without known aetiology), estimates for both conditions weremade. Different patient management models were developed based onexpert opinions and results from our previous research to account for theheterogeneity in disease presentation and patient characteristics influen-cing case management. Healthcare costs for consultations, laboratorydiagnostics, medication and hospitalisation associated with each patientmanagement model were extracted from official tariff lists. Estimates ofthe frequency of each model were used to extrapolate individual costs tooverall healthcare costs for Switzerland. Estimates were based on costsand case numbers for the year 2012 as this was the year with most avail-able information (health and cost statistics).A detailed description of the methods applied for this research compon-ent is provided in chapter 12 [Schmutz et al., 2017b].
3.1.7 Studying the incidence, burden of disease, socio-economic impact and aetiology of acutegastroenteritis
This study proposal contributes to objective 3a of this thesis.
To understand the lowest levels of the burden of illness pyramid, a pop-ulation-based study is required. Considering the various studies conduc-ted as part of volume I on “Infectious disease surveillance in Switzerland”[Bless, 2018] and our current understanding of food- and water-borne dis-ease surveillance in Switzerland, a one-year, prospective cohort study isproposed to assess the incidence, burden of disease, socio-economic im-pact and aetiology of AG in Switzerland. Given our previous researchon surveillance data, its generation and limitations, and the awareness ofthis data situation on the side of the FOPH and the Federal Food Safetyand Veterinary Office (FSVO) allowed us to propose such a cohort studyto the federal authorities.A cohort of 3’000 participants, recruited from a random sample of thegeneral population in Switzerland, is followed-up weekly during a one-year period (52 weeks). Occurrence of GI signs and symptoms as well asexposure to transient risk factors are assessed through weekly question-naires, available electronically and on paper. After reporting an episodeof acute gastrointestinal illness (AGI)*, participants receive an addi-tional questionnaire to assess the perceived illness experience, patients’help seeking behaviour and socio-economic consequences of the diseaseepisode (including inability to work). Furthermore, stool samples from a
34

3.2 Ethical considerations
subsample of symptomatic and asymptomatic participants are obtainedto investigate the aetiology of AGI (symptomatic participants) and theprevalence of bacteria harbouring selected antibiotic resistances and ofselected bacterial GI pathogens in asymptomatic participants.As part of this PhD thesis, a detailed proposal for the cohort study wasdeveloped and funding was obtained. Operational planning and execu-tion of the study will be conducted in the framework of two upcomingPhD theses.A detailed description of the proposed cohort study is provided inchapter 13.
3.2 Ethical considerationsStudies involving personal health-related data or human biological ma-terial are subject to the Federal Act on Research involving Human Be-ings (Human Research Act, HRA; SR 810.30) and require ethical clear-ance except if the data or material is fully anonymised [Die Bundesvers-ammlung der Schweizerischen Eidgenossenschaft, 2011]. Studies conduc-ted or data collected in pursuance of the Epidemics Act are exemptedfrom ethical clearance.Data from the NNSID was collected under the Epidemics Act and wasanonymised. Therefore, the analyses of notification data of Campylob-acter , Salmonella and hepatitis A (chapters 4 and 5) did not requireethical clearance. Similarly, data collection for the study in Sentinella(chapter 11) was conducted through the FOPH in pursuance of the Epi-demics Act.For the positivity studies on Campylobacter and Salmonella (chapter 6),ethical clearance was obtained from the Ethikkommission Nordwest-undZentralschweiz (EKNZ) (ethics committee northwest/central Switzer-land) to work with “already existing, health-related data without in-dividual consent and information” (reference number: EKNZ:2014–164)while the positivity study on EHEC (chapter 8) was mandated by theFOPH and conducted under the Epidemics Act (decree issued by theFOPH).The stakeholder consultation for understanding laboratory practices ofEHEC diagnostics (chapter 7) did neither involve personal health-relateddata nor biological material and hence, this research was not subject tothe Human Research Act.Similarly, the qualitative study among Swiss GPs (chapter 10) involvedtheir professional experience and opinion rather than personal health-
35

3 Research concept and methodological overview
related information. Furthermore, this project was part of an outbreakinvestigation [Bless et al., 2014] conducted under the Epidemics Act.The project estimating healthcare costs of AG and campylobacteriosis(chapter 12) relied on publicly available or aggregated data from previousresearch and official statistics. Experts were asked about their profes-sional opinion, not about personal- or patient-related information. Thispart of the project did, hence, not require ethical clearance. However,ethical approval was obtained for using pseudonymised patient invoicesto cross-validate cost estimates (reference number: EKNZ:2014–159).Finally, the cohort study on AG (chapter 13) will require ethical clear-ance. Submission to the respective ethical committee(s) will occur assoon as the detailed planning of the study is completed and all docu-ments (e.g. questionnaires) are prepared.Research presented in this thesis was conducted in agreement with theDeclaration of Helsinki [World Medical Association, 2013] as well as theEssentials of Good Epidemiological Practice [Altpeter et al., 2005].
3.3 CollaborationsThe main external partners for the research presented in this thesis werethe FOPH and the FSVO.The surveillance systems maintained by the FOPH generate data onlyat the upper level(s) of the burden of illness pyramid. However, theFOPH is well aware of this limitation and has a vested interest in (a)understanding lower parts of the pyramid and (b) generating knowledgeto potentially improve current infectious disease surveillance systems.Several projects which are part of this thesis relied on and profited fromthis openness and interest of the Swiss public health authorities. ThisPhD research is part of a longstanding research partnership with theFOPH through several mandated research works in foodborne infectiousdiseases. Specifically, the FOPH provided data for the analyses of trendsin Campylobacter , Salmonella and hepatitis A (chapters 4 and 5), facil-itated the initial contact with the diagnostic laboratories involved in thepositivity studies (chapters 6 and 8), organised joint visits of laborat-ory experts (chapter 7), and was instrumental in and funded large partsof these research endeavours. Furthermore, the administrative lead anddata management of Sentinella is with the FOPH. This enabled us to getaccess to the data generated through this system (chapter 11). Finally,the FOPH is supporting the upcoming cohort study (chapter 13) bothconceptually and financially together with the FSVO.
36

3.3 Collaborations
The FSVO is interested in our research as many GI diseases are zoonosesand/or concern food safety. The two federal offices maintain a close dia-logue within this thematic field which is fostered by our research outputs.For example, media communications in response to our research was har-monised between the FOPH and the FSVO as well as between the federaloffices and the Swiss Tropical and Public Health Institute (Swiss TPH).Several diagnostic laboratories from all over Switzerland were involved inour research by providing data for the positivity studies and importantbackground information for interpretation of surveillance and laboratorydata (chapters 6 and 8).We collaborated with medical anthropologists from Partners for AppliedSocial Sciences (PASS) Suisse and with the Centre for Primary HealthCare from the University of Basel to investigate the GPs’ managementand understanding of AG and campylobacteriosis (chapter 10). The lat-ter also supported us in developing the questionnaire for the Sentinellastudy (chapter 11).Collaboration with the Institute of Pharmaceutical Medicine of the Uni-versity of Basel and internal collaboration with the Medical Services andDiagnostics department at Swiss TPH was sought for the estimation ofhealthcare costs of AG and campylobacteriosis (chapter 12).The cohort study on AG in Switzerland (chapter 13) will involve severalpartners. Apart from the federal offices, collaboration with the NationalReference Centre for Enteropathogenic Bacteria and Listeria (NENT),the German National reference laboratory for Clostridium difficile andwith the “labormedizinisches zentrum Dr Risch” (a Swiss private-sectordiagnostic laboratory) was initiated. Future internal and external collab-orators will involve, among others, social scientists and health economiststo develop the tools for assessing the social and economic burden andmedical personnel to follow-up on patient histories and medical records.
37


Part II
THE BURDEN OF ILLNESSPYRAMID OF FOODBORNE
INFECTIONS:UNDERSTANDING THE TIP
OF THE ICEBERG


4 Inverse trends of Campylobacter andSalmonella in Swiss surveillancedata, 1988–2013
Claudia Schmutz1, 2, Daniel Mäusezahl1, 2, Marianne Jost3,Andreas Baumgartner4, Mirjam Mäusezahl-Feuz3
1 Swiss Tropical and Public Health Institute, Basel, Switzerland2 University of Basel, Basel, Switzerland3 Swiss Federal Office of Public Health, Bern, Switzerland4 Swiss Federal Food Safety and Veterinary Office, Bern, Switzerland
This article was published in:
Eurosurveillance (2016), 21(6):pii=30130.doi: 10.2807/1560-7917.ES.2016.21.6.30130This work is licensed under a Creative Commons Attribution 4.0 InternationalLicense.
41


Published article
AbstractClinical isolates of Campylobacter spp. and Salmonella spp. are notifi-able in Switzerland. In 1995, Campylobacter replaced Salmonella as themost frequently reported food-borne pathogen. We analysed notificationdata (1988–2013) for these two bacterial, gastrointestinal pathogens ofpublic health importance in Switzerland. Notification rates were cal-culated using data for the average resident population. Between 1988and 2013, notified campylobacteriosis cases doubled from 3’127 to 7’499,while Salmonella case notifications decreased, from 4’291 to 1’267. Casenotifications for both pathogens peaked during summer months. Cam-pylobacter infections showed a distinct winter peak, particularly in the2011/12, 2012/13 and 2013/14 winter seasons. Campylobacter case no-tifications showed more frequent infection in males than females in allbut 20–24 year-olds. Among reported cases, patients’ average age in-creased for campylobacteriosis but not for salmonellosis. The inversetrends observed in case notifications for the two pathogens indicate anincrease in campylobacteriosis cases. It appears unlikely that changesin patients’ health-seeking or physicians’ testing behaviour would affectCampylobacter and Salmonella case notifications differently. The im-plementation of legal microbiological criteria for foodstuff was likely aneffective means of controlling human salmonellosis. Such criteria shouldbe decreed for Campylobacter , creating incentives for producers to lowerCampylobacter prevalence in poultry.
IntroductionCampylobacter spp. and Salmonella spp. are the most frequently re-ported zoonotic infections in Switzerland. The Federal Office of PublicHealth (FOPH) monitors communicable diseases in Switzerland. TheNational Notification System for Infectious Diseases (NNSID) is an in-tegral part of ensuring compliance with this obligation and was imple-mented nationwide, in a standardised way, in 1987. The regulation oncommunicable disease notifications determines which diseases have tobe reported, by whom and in what timeframe [1]. Among food-bornepathogens, Campylobacter spp., Salmonella spp., Listeria spp., entero-haemorrhagic Escherichia coli, Salmonella spp., and hepatitis A virusare notifiable. Laboratories must report isolates of Campylobacter andSalmonella within one week of discovery. For patients with suspectedbacterial diarrhoea, basic stool culture including Campylobacter spp.,Salmonella spp. and Shigella spp. is the routine method of laboratory
43

4 Inverse trends of Campylobacter and Salmonella
diagnosis [2].In humans, campylobacteriosis is most frequently caused by Campylob-acter jejuni and C. coli [3]. Signs and symptoms include watery orbloody diarrhoea, fever, abdominal cramps, vomiting and malaise andusually occur after an incubation period of 2–5 days [4]. The diseaseusually resolves without antibiotic treatment within one week. A recentstudy on determinants of the disease in Switzerland showed that labor-atory-confirmed campylobacteriosis can lead to severe illness in patients[5]. Complications such as Guillain-Barré syndrome can follow Campy-lobacter infections, although this is rare [4, 6]. Fatal cases are possible,but the reported case fatality rate of 0.1% is small and four times lowerthan the fatality rate for salmonellosis [7].There are more than 2’600 serovars of Salmonella, of which S. enter-ica subspecies enterica serovars Enteritidis (S. Enteritidis) and Typh-imurium (S. Typhimurium) are the most frequently reported [8]. Signsand symptoms of salmonellosis are similar to those of campylobacteriosisbut the incubation period is shorter at 6–72 hours (usually 12–36 hours)[9]. In a group of volunteers, the minimal infectious dose was foundto be at least 200 times higher for Salmonella than for Campylobacter(105–109 vs. 500 organisms) [10]. However, Salmonella outbreaks havebeen reported where fewer than 100 organisms had caused disease [11].In Switzerland, Campylobacter replaced Salmonella as the most frequentfood-borne pathogen isolated from clinical specimens in 1995 [12]. InEurope, predominance of Campylobacter has been reported from 2005onwards [13]. Campylobacter notifications were stable in EuropeanUnion (EU) countries between 2009 and 2013 while Salmonella notific-ations declined. Nonetheless, reported food-borne outbreaks were moreoften caused by Salmonella spp. than by Campylobacter spp. (1’168 vs.414 in 2013).The aim of this study is to describe the epidemiological patterns andtrends of Campylobacter and Salmonella case notifications in Switzer-land and to identify factors leading to the inverse trends observed fromthe NNSID.
MethodsMedical diagnostic laboratories in Switzerland are obliged by law to re-port positive Campylobacter and Salmonella test results to the FOPHand to the cantonal chief medical officer in the patient’s canton of resid-ence within one week of discovery [1]. Reports must include information
44

Published article
on laboratory diagnosis (test result, interpretation, type of sample, de-tection method and date), patient data (sex, date of birth and place ofresidence) and physician- and diagnosing laboratory-related data (name,phone and fax number, and address). The FOPH enters the informa-tion into the NNSID database. If the patient’s canton of residence isunknown, the canton of the reporting laboratory is entered.The present study used Campylobacter and enteric Salmonella case no-tification data from the present NNSID’s first full year of data collec-tion (1988) until the end of 2013. Data on patients residing outside ofSwitzerland were excluded. If residency was not specified, the record waskept in the analysis. Notification rates, defined as the number of casesper 100’000 resident population, were calculated. The term ‘notificationrate’ was used instead of ‘incidence rate’ to be consistent with otherauthors [13] and because the numbers calculated should not be equatedwith a true population incidence. To calculate notification rates, dataon the average permanent resident population, obtained from the Fed-eral Statistical Office’s STATTAB database, were used [14]. Data wasanalysed and graphically represented using the statistical software Stata(Version 13.0).
ResultsCampylobacteriosis trendsA 2.5-fold increase in the number of reported campylobacteriosis cases,from 3’127 cases in 1988 to 7’499 cases in 2013, was observed (Figure 4.1).Case numbers increased steadily from 1988 to 2000, until they reached7’000. Thereafter, Campylobacter case notifications dropped and lev-elled off at 5’000 cases annually and then rose steadily again from 2007,exceeding the peak level reached in 2000. The highest number of casesreported to date was 8’480 cases in 2012. In each year since 1988, apeak was observed during the summer months (June–August) (Figures4.2 and 4.3).A second, much shorter peak was noted in December and January inall years. This winter peak has been especially pronounced in the pastfew years. While the highest weekly case numbers during the summerand winter peaks were comparable in 2009 and 2010, weekly case num-bers were much higher during the winter peaks of 2011/12, 2012/13 and2013/14 compared with the preceding summer peaks (Figure 4.3).The increase in Campylobacter case notification rates differed by age(Figure 4.4). Among younger age groups, the increase in notification
45

4Inverse
trendsofC
ampylobacter
andSalm
onella
Figure 4.1: Number of Campylobacter and Salmonella case notifications and notification rates registered at the FederalOffice of Public Health, Switzerland, 1988–2013
46

Published
article
Figure 4.2: Monthly number of notified campylobacteriosis and salmonellosis cases, Switzerland, 1988–2013
47

4Inverse
trendsofC
ampylobacter
andSalm
onella
Figure 4.3: Weekly number of notified campylobacteriosis and salmonellosis cases, Switzerland, 2009–2013
48

Published
article
Figure 4.4: Trends in Campylobacter notification rates between age groups and sexes, Switzerland, 1988–2013
49

4 Inverse trends of Campylobacter and Salmonella
Table 4.1: Comparison of notification rates for Campylobacter and Salmon-ella among different age groups, Switzerland, 1988 and 2013
Campylobacter SalmonellaAge Notification rate % Notification rate %group 1988 2013 increase 1988 2013 increase<5 105.3 102.3 -3% 216.1 51.5 -76%5–9 49.9 62.9 +26% 85.1 23.4 -73%10–14 29.7 58.1 +96% 59.1 15.1 -74%15–19 54.7 108.1 +98% 63.4 18.1 -71%20–24 97.4 160.7 +65% 68.1 25.3 -63%25–44 49.2 91.2 +85% 51.6 10.6 -79%45–64 24.4 78.3 +221% 41.1 10.9 -73%65–84 19.2 100.1 +421% 38.6 15.1 -61%85+ 11.7 92.2 +688% 62.7 9.3 -85%
rates over the years was less pronounced than among older age groups.In children younger than five years old, the notification rates decreasedfrom 105.3 to 102.3 cases per 100’000 population between 1988 and 2013(-3%) (Table 4.1).This decrease was statistically significant (permutation test for trend,p=0.03). There was no statistically significant (decreasing or increas-ing) trend in the 5–9 year-olds; in all older age groups, the increasingtrend was statistically significant (permutation test for trend, p=0.01for 20–24 year-olds, p<0.01 for all other age groups). Among those aged85 years and older, the notification rate increased more than seven-fold,from 11.7 to 92.2 cases per 100’000 population during the same timeperiod. The median age of campylobacteriosis patients increased from25 years (interquartile range, IQR: 17–38) in 1988 to 39 years (IQR: 23–59) in 2013. In all but the 20–24 year-old age group, notification rateswere higher for males than for females (Figure 4.4). Males accounted for53.4–57.5% of total case notifications each year.Campylobacter diagnostics identified C. jejuni or C. coli in the majorityof clinical samples (88.5–96.8% every year; data not shown). For most ofthe remaining cases, the species was not identified or not reported. Re-ported sample material came from stool (98.8%), blood or serum (0.4%),and other or unspecified materials (0.8%). The majority of cases weretested using culture-based methods directly or confirmatively after PCR(>97%).
50

Published
article
Figure 4.5: Trends in Salmonella notification rates between age groups and sexes, Switzerland 1988–2013
51

4 Inverse trends of Campylobacter and Salmonella
Salmonellosis trendsSalmonellosis cases reported to the FOPH increased from 4’291 cases in1988 to 7’806 cases in 1992 (Figure 4.1). Since 1992, Salmonella casenotifications steadily decreased until reaching 1’267 cases in 2013. Thehighest number of Salmonella case notifications each year was registeredin late summer (July–October), indicating a seasonal pattern (Figures4.2 and 4.3).Time trends did not differ between sex and age groups (Table 4.1, figure4.5).Each year, 49.6–56.2% of reported cases occurred in males. The me-dian age of salmonellosis patients increased from 25 years (IQR: 7–44)in 1988 to 29 years (IQR: 11–56) in 2013. In terms of notification rates,the highest absolute reduction occurred in the youngest age group (un-der five years, figure 4.5). The reduction was, however, similar for all agegroups when looking at percentage decrease (Table 4.1). The decreasingtrend for all age groups from 1988 to 2013 was statistically significant(permutation test for trend, p<0.01 for all age groups).The two most frequently reported serovars were S. Enteritidis (54.0%)and S. Typhimurium (13.7%). Other reported S. enterica serovars in-cluded Virchow, Infantis and the monophasic Typhimurium 4,12:i:- (onlydifferentiated in the notification system since 2010).
DiscussionIn Switzerland, there has been a marked increase in Campylobacter casenotifications since 1988, when surveillance began, while case numbershave decreased for salmonellosis. The number of Campylobacter infec-tions nowadays is similar to levels of Salmonella 20 years ago. Salmonel-losis has reduced considerably since then, due to control programmestargeting poultry production. Campylobacteriosis has also increasedthroughout the EU, though the numbers seem to have stabilised between2009 and 2013; for salmonellosis, a decreasing trend continues [13]. Timetrends for Campylobacter in Switzerland differ between age groups, evenwhen looking at age-group-specific notification rates and adjusting fordemographic changes in the population.
True increase in campylobacteriosis frequencyOne study from the Netherlands showed that stool-testing frequencyincreased between 1998 and 2008, which might help to explain the in-
52

Published article
crease in campylobacteriosis cases [15]. Along these lines, the decreasein salmonellosis cases would be even larger in the absence of intensifiedtesting.It is difficult to interpret the changes in the number of positive test res-ults without knowing more about changes in the number of individualsseeking medical consultations, in the proportion of patients being pre-scribed stool testing and in the total number of tests performed (positiveand negative) in Switzerland. Different factors can influence notificationdata such as changes in risk factors, in patients’ health-seeking beha-viour, in physician testing practices, in human susceptibility, or in thevirulence or pathogenicity of Campylobacter spp. and Salmonella spp.When a patient presents with acute gastroenteritis necessitating furtherlaboratory testing, Swiss physicians most commonly request basic stoolbacteriology, which includes testing for Campylobacter , Salmonella andShigella (data not shown). Therefore, a change in testing frequencywithout a change in disease epidemiology would most likely lead to asimilar change in both Campylobacter and Salmonella case notifications.Some improvements in stool culture methodology have been made inthe past 25 years; however, changes cannot explain the inverse trendsobserved (personal communication, Roger Stephan, 30 July 2015). Fur-thermore, negative test results are not notifiable and, hence, the totalnumber of tests (denominator) is unknown. Knowing the denominatorwould help to confirm or reject the hypothesis that a change in testingfrequency does not explain the increase in Campylobacter case notifica-tions and would allow for a better interpretation of the trends observedin the NNSID. Though stool culture methods did not change signific-antly, the physicians’ awareness towards campylobacteriosis is likely tohave increased. It is not known to what extent this might have influ-enced notification data. Changes in patients’ health-seeking behaviourare unlikely to influence Campylobacter and Salmonella case notifica-tions in different ways. Consequently, we assume that the decrease inSalmonella case notifications and the increase in Campylobacter case no-tifications represent real epidemiological trends.The revised Swiss Epidemics Act effective since January 2016, and itsallocated ordinances obligates diagnostic laboratories to report annuallythe total number of positive and negative Campylobacter and Salmonellatests performed [16]. This innovation will allow basic routine analysis oftrends in testing frequency and positivity rates in the future.
53

4 Inverse trends of Campylobacter and Salmonella
The influence of sex and age on food-borne diseasenotificationsSalmonella case notifications do not differ between sexes, even whenstratified by age groups. In contrast, Campylobacter case notificationsreveal higher notification rates among males in all age groups, exceptfor those in the 20–24 year-old group. Interestingly, studies from Ger-many and England and Wales also show that females in their twentiesare more frequently affected by campylobacteriosis than males, whilemale cases dominate in all other age groups [17, 18]. Schielke et al. [17]suggested that women in this age group are more frequently involvedin childcare activities, which might lead to increased human-to-humantransmission. They also suggest that women in this age group are moreoften exposed to potentially contaminated chicken because they prepareand eat chicken more frequently than men of the same age. They mayalso be in closer contact with pets, which often harbour the same strainsas their owners [19]. Different help-seeking behaviour of patients in thisage group or different testing practices of physicians could also explainvariations. Moreover, it seems likely that genetic or hormonal factorslead to differences by sex, as notification rates in males and females dif-fer already in the youngest age group (under five years) (Figure 4.4) [20].We assume that in the youngest age group, health-seeking behaviour andeating habits are not yet dependent on sex and are rather driven by par-ents or other persons engaged in childcare.Available information from England and Wales also shows that adults,including the elderly, increasingly test positive for Campylobacter [18].It has been suggested that the increasing use of proton pump inhibitors(PPIs) might explain a part of this phenomenon, especially among theelderly. Several studies have found that the use of PPIs is a risk factorfor infection with Campylobacter and other enteric pathogens [21]. How-ever, one study revealed that patients prescribed PPIs were already atincreased risk of gastrointestinal infection, even before prescription ofthese drugs [22]. In any case, conditions leading to PPI use or prescrip-tion are likely associated with acute infectious gastroenteritis. Why theaforementioned risk factor would only influence the frequency of Cam-pylobacter but not Salmonella case notifications remains unknown. Onepossible explanation is that the infective dose of Campylobacter is gen-erally lower than that of enteric Salmonellae. A recent study of poultryconsumers’ behaviour, risk perception and knowledge related to cam-pylobacteriosis and domestic food safety showed that unsafe cooks weremore likely to be male and of younger age [23]. Even though this finding
54
Published article
is consistent with high Campylobacter notification rates observed amongyoung adults, it does not explain the increasing rates among the elderly.
Food safety regulationsCampylobacter and Salmonella infections are assumed to be mainly food-borne. Genotyping and epidemiological studies in Switzerland haveshown that chicken meat is the most likely source of infection in themajority of human campylobacteriosis cases [5, 24-26]. In concert withthese findings, a recent time-series analysis showed a significant associ-ation between Campylobacter prevalence in broiler chickens and humanillness [27]. In Switzerland, poultry consumption has increased in thepast 25 years. While the average per capita consumption was 7.8kg in1988, it was 11.4kg in 2013 [28, 29].Eggs and egg-containing products were shown to be risk factors for sal-monellosis in Switzerland in 1993 [30]. The legislating authorities ad-dressed the risk of these food-borne pathogens by setting and enforcingmicrobiological criteria.As early as 1969, an official method to detect enteritic Salmonella infoods was published in the Swiss Food Manual [31]. Also, guidancelevels for Salmonella in different food categories were given.In 1981, legal microbiological criteria for foods were decreed for the firsttime in a Federal Ordinance [32]. Criteria for Salmonella were as follows.For baby foods and diet products: not detectable (nd) in 50g; drinkingwater: nd in 5l; other products: nd in 20g. For ‘other products’, au-thorities could refrain from measures if the product in question had toundergo treatment (e.g. cooking) prior to consumption. In 1995, after arevision of the ordinance, criteria for Salmonella were set at as follows.For baby foods: nd in 50g; drinking water: nd in 5l; ready-to-eat foods:nd in 25 g; and spices: nd in 25g [33]. In 2005, Swiss food legislationadopted the European Union’s microbiological criteria for Salmonella infood [34].Salmonella limits for some categories of raw meat were issued as thenational law adapted to EU hygiene regulations in 2006 [35]. To combatthe epidemic with S. Enteritidis in eggs, mandatory screening of layerhens and measures to eradicate positive flocks were decreed by the Or-dinance for the Control and Eradication of Epizoonotic Diseases as earlyas 1993 [36]. Apart from a ban on battery-caged chicken rearing (ineffect since 1992 [37]), no further measures (such as vaccinations of layerhens against S. Enteritidis) are implemented in Switzerland.As early as 1987, a limit for Campylobacter was decreed in the Ordinance
55

4 Inverse trends of Campylobacter and Salmonella
on Hygiene, which was ‘not detectable in 10g of ready-to-eat foods’ (later,not detectable in 25g) after enrichment. This microbiological criterionwas abrogated in 2006. To address the risk of Campylobacter in con-nection with poultry liver, since 2014 the Ordinance has stipulated thatpoultry liver must be sold frozen if it cannot be shown that the productcomes from a Campylobacter-free flock [35]. Furthermore, a process hy-giene criterion to minimise Campylobacter in poultry slaughterhousesis underway and should enter into force in 2016. However, criteria forCampylobacter on raw poultry meat are not currently being considered.
Relevant epidemiological studies in SwitzerlandIn 2013, 37.7% (169/448) of broiler flocks and 65% (226/348) of rectum-anal swab samples taken from pigs at slaughter tested positive for Cam-pylobacter [38]. In the same year, only 1% of 3’636 samples of freshpoultry meat, poultry meat preparations and poultry meat products atdifferent stages of processing tested positive for Salmonella. Twenty-three years prior, Salmonella contamination levels in Switzerland weremuch higher. In a 1990 study, 19.2% of chicken neck skin lobs and47.7% of broiler flocks were found to be Salmonella-positive [39]. As aconsequence, Salmonella control measures as described above were im-plemented in the 1990s and led to a significant reduction in the numberof human cases reported.In Switzerland, salmonellosis and campylobacteriosis case curves crossedin 1995; in Austria, it was in 2006 [40]. The reason for this striking differ-ence might be that Switzerland addressed the epidemic of S. Enteritidisin eggs at a very early stage.The reduction of domestic salmonellosis cases resulted in a higher prom-inence of travel-associated transmission risks in relative terms, which wasshown by Schmid and Baumgartner: the (relative) proportion of travel-associated S. Enteritidis cases increased substantially from 20% in 1993to 45% in 2011/12 [41]. Two case-control studies on campylobacterio-sis [5, 26] and a case-control study on salmonellosis [30] conducted inSwitzerland identified travel abroad as a risk factor for the diseases.However, this finding has to be interpreted with care, as patients withtravel history are more likely to be tested (data not shown) and all stud-ies recruited laboratory-confirmed cases.The observed winter peak in Campylobacter infections can be attributedpartly to the traditional consumption of meat fondue over Christmasand New Year [5]. However, it is not known why this winter peak hasbeen more pronounced in the past few years. Given the increasing per
56

Published article
capita consumption of poultry meat [28, 29], one could hypothesise thatpoultry has become more popular in meat fondues.Outbreaks due to Campylobacter or Salmonella also occurred in Switzer-land. However, the number of foodborne outbreaks decreased signific-antly between 1993 and 2010, mainly due to the reduction of salmonel-losis [12]. The number of registered Salmonella outbreaks dropped from27 in 1993 to one in 2010 while the number of Campylobacter outbreaksvaried between none and five throughout this time period. In relation tothe number of cases, Salmonella is causing more outbreaks than Cam-pylobacter both in Europe and in Switzerland.
Public awareness and knowledge about the diseasesPublic awareness and people’s knowledge of Campylobacter and Salmon-ella in Switzerland are as different as the trends observed in the twopathogens in the NNSID. In 2011, a consumer survey showed that 76%of participants were ‘very concerned’ or ‘somewhat concerned’ about Sal-monella in foods [42]. Only 1% of respondents stated that they had notheard of the Salmonella bacterium. In contrast, only 33% were ‘very con-cerned’ or ‘somewhat concerned’ about Campylobacter and more thanhalf (52%) had not heard of the pathogen. Unpublished data from arecent case-control study in Switzerland [5] confirm those figures: 55%of people infected with campylobacteriosis (cases) and 68% of healthypeople (population-based controls) had never heard of Campylobacter ,while only 2% of cases and 3% of controls had never heard of Salmonella.The lack of knowledge about safe food handling and avoidance of cross-contamination, and low personal risk perception are the main reasonsfor unsafe food handling [23, 43]. The high prevalence of Campylobac-ter in chicken products, the low infective dose of Campylobacter andthe increasing consumption of chicken meat combined with the appar-ent lack of knowledge about the Campylobacter-pathogen are all factorsfacilitating infection.
ConclusionsCampylobacter spp. infections are a serious and increasing public healthconcern in Switzerland. For Salmonella spp. infections, an epidemiolo-gical turnaround has been achieved through concerted efforts and legalregulations of the poultry- and food-production industries, but little hasbeen done to date to prevent Campylobacter infections on a large scale.Food safety interventions before the sale of poultry meat are urgently
57

4 Inverse trends of Campylobacter and Salmonella
required to reduce Campylobacter contamination frequencies. Since thenumber of control options is limited, the hygienic treatment of chickencarcasses with chemicals, for example peracetic acid, should not be ex-cluded from discussion [44]. However, the population’s limited awarenessof Campylobacter must also be addressed. It seems reasonable to believethat the same type of behaviour changes that reduced Salmonella in-fections can be applied to prevent Campylobacter infections and thatcaution can be extended from eggs to raw poultry meat, cutting boardsand knives.
AcknowledgementsWe thank all Swiss diagnostic laboratories for their valuable routinework in reporting to the national health information system. We thankthe Notification Systems staff at the Federal Office of Public Health formaintaining the NNSID data base and for their continued assistancein accessing the data. The authors gratefully acknowledge the criticalreview of and inputs to the manuscript of Philipp Bless and ChristophHatz, the statistical support of Jan Hattendorf and the language editingof Amena Briët, all Swiss Tropical and Public Health Institute. Nofunding was received for this study. We used public data from the FederalOffice of Public Health and from the Federal Statistical Office only.
Conflict of interestsThe authors declare that they have no conflict of interest.
Authors’ contributionsDM and MM conceived the idea of and designed the study with CS; MJprovided the data; CS and DM analysed the data and CS wrote the firstdraft; MJ, AB, MM and DM contributed to the interpretation of thedata, writing and reviewing of the manuscript.
References1. Schweizerischer Bundesrat [Swiss Federal Council]. Verordnung über
die Meldung übertragbarer Krankheiten des Menschen (Melde-Verord-nung) vom 13. Januar 1999 (Stand am 1. Januar 2014); SR 818.141.1.
58

Published article
[Ordinance on disease notification of humans from 13 January 1999 (ver-sion from 1 January 2014)]. Bern: The Swiss Federal Council; 2014.German. Available from http://www.admin.ch/ch/d/sr/8/818.141.1.de.pdf
2. Schweiger A, Markwalder K, Vogt M. Infektiöse Diarrhoe: Epidemiolo-gie, Klinik und Diagnostik. [Infectious diarrhoea: epidemiology, symp-toms and diagnostic.]. Schweiz Med Forum. 2005;5:714–23. German.
3. Man SM. The clinical importance of emerging Campylobacter species.Nat Rev Gastroenterol Hepatol. 2011;8(12):669–85. Available from:DOI: 10.1038/nrgastro.2011.191 PMID:22025030
4. Braam HP. Campylobacter Enteritis. In: Heymann DL, editor. Con-trol of Communicable Diseases Manual. 18th ed. Washington, DC:American Public Health Association; 2004. p. 81–84.
5. Bless PJ, Schmutz C, Suter K, Jost M, Hattendorf J, Mäusezahl-Feuz M,et al. A tradition and an epidemic: determinants of the campylobacte-riosis winter peak in Switzerland. Eur J Epidemiol. 2014;29(7):527–37.Available from: DOI: 10.1007/s10654-014-9917-0 PMID: 24990236
6. Poropatich KO, Walker CL, Black RE. Quantifying the associationbetween Campylobacter infection and Guillain-Barré syndrome: a sys-tematic review. J Health Popul Nutr. 2010;28(6):545–52. Availablefrom: DOI: 10.3329/jhpn.v28i6.6602 PMID: 21261199
7. Barton Behravesh C, Jones TF, Vugia DJ, Long C, Marcus R, Smithet al. FoodNet Working Group. Deaths associated with bacterialpathogens transmitted commonly through food: foodborne diseasesactive surveillance network (FoodNet), 1996–2005. J Infect Dis.2011;204(2):263–7. Available from: DOI: 10.1093/infdis/jir263 PMID:21673037
8. Christenson JC. Salmonella infections. Pediatr Rev. 2013;34(9):375–83.Available from: DOI: 10.1542/pir.34-9-375 PMID: 24000341
9. Braam P. Salmonellosis. In: Heymann DL, editor. Control of Commu-nicable Diseases Manual. 18th ed. Washington, DC: American PublicHealth Association; 2004. p. 469–73.
10. Kothary MH, Babu US. Infective dose of foodborne pathogens in volun-teers: A review. J Food Saf. 2001;21(1):49–68. Available from: DOI:10.1111/j.1745-4565.2001.tb00307.x
11. Teunis PF, Kasuga F, Fazil A, Ogden ID, Rotariu O, StrachanNJ. Dose-response modeling of Salmonella using outbreak data.Int J Food Microbiol. 2010;144(2):243–9. Available from: DOI:10.1016/j.ijfoodmicro.2010.09.026 PMID: 21036411
12. Schmid H, Baumgartner A. Foodborne outbreaks in Switzerland – Cur-rent statistics, future developments, practical guidelines for the invest-igation of outbreaks and a historical review. Bern: The Federal Officeof Public Health; 2012.
59

4 Inverse trends of Campylobacter and Salmonella
13. European Food Safety Authority (EFSA), European Centre for DiseasePrevention and Control (ECDC),. The European Union summary re-port on trends and sources of zoonoses, zoonotic agents and food-borneoutbreaks in 2013. EFSA Journal. 2015;13(1):3991.
14. Bundesamt für Statistik (BFS). STAT-TAB: Die interaktive Statistik-datenbank. Neuchâtel: Federal Statistical Office; 2014 [Accessed 26 Nov2014]. German. Available from: http://www.pxweb.bfs.admin.ch
15. Janiec J, Evans MR, Thomas DR, Davies GH, Lewis H. Laboratory-based surveillance of Campylobacter and Salmonella infection and theimportance of denominator data. Epidemiol Infect. 2012;140(11):2045–52. Available from: DOI: 10.1017/S0950268811002822 PMID: 22217369
16. Das Eidgenössische Departement des Innern. Verordnung des EDIüber die Meldung von Beobachtungen übertragbarer Krankheiten desMenschen vom 1. Dezember 2015 (Stand am 1. Januar 2016); SR818.101.126. [Ordinance of the FDHA on the notification of observa-tions on human communicable diseases from 1. December 2015 (versionfrom 1 January 2016)]. Bern: Federal Department of Home Affairs;2016. German. Available from: https://www.admin.ch/opc/de/classified-compilation/20151622/index.html
17. Schielke A, Rosner BM, Stark K. Epidemiology of campylobacteriosisin Germany – insights from 10 years of surveillance. BMC Infect Dis.2014;14(1):30. Available from: DOI: 10.1186/1471-2334-14-30 PMID:24422983
18. Nichols GL, Richardson JF, Sheppard SK, Lane C, Sarran C. Campylob-acter epidemiology: a descriptive study reviewing 1 million cases in Eng-land and Wales between 1989 and 2011. BMJ Open. 2012;2(4):e001179.Available from: DOI: 10.1136/bmjopen-2012-001179 PMID: 22798256
19. Mughini Gras L, Smid JH, Wagenaar JA, Koene MG, Havelaar AH,Friesema IH, et al. Increased risk for Campylobacter jejuni and C.coli infection of pet origin in dog owners and evidence for geneticassociation between strains causing infection in humans and theirpets. Epidemiol Infect. 2013;141(12):2526–35. Available from: DOI:10.1017/S0950268813000356 PMID: 23445833
20. Gillespie IA, O’Brien SJ, Penman C, Tompkins D, Cowden J, HumphreyTJ. Demographic determinants for Campylobacter infection in Eng-land and Wales: implications for future epidemiological studies.Epidemiol Infect. 2008;136(12):1717–25. Available from: DOI:10.1017/S0950268808000319 PMID: 19000328
21. Bavishi C, Dupont HL. Systematic review: the use of proton pumpinhibitors and increased susceptibility to enteric infection. AlimentPharmacol Ther. 2011;34(11–12):1269–81. Available from: DOI:10.1111/j.1365-2036.2011.04874.x PMID: 21999643
22. Brophy S, Jones KH, Rahman MA, Zhou SM, John A, Atkinson MD, et
60

Published article
al. Incidence of Campylobacter and Salmonella infections following firstprescription for PPI: a cohort study using routine data. Am J Gastroen-terol. 2013;108(7):1094–100. Available from: DOI: 10.1038/ajg.2013.30PMID: 23588238
23. Bearth A, Cousin ME, Siegrist M. Poultry consumers’ behaviour, riskperception and knowledge related to campylobacteriosis and domesticfood safety. Food Contr. 2014;44:166–76. Available from: DOI:10.1016/j. foodcont.2014.03.055
24. Kittl S, Heckel G, Korczak BM, Kuhnert P. Source attribution of hu-man Campylobacter isolates by MLST and fla-typing and associationof genotypes with quinolone resistance. PLoS One. 2013;8(11):e81796.Available from: DOI: 10.1371/journal.pone.0081796 PMID: 24244747
25. Kittl S, Kuhnert P, Hächler H, Korczak BM. Comparison of geno-types and antibiotic resistance of Campylobacter jejuni isolated fromhumans and slaughtered chickens in Switzerland. J Appl Micro-biol. 2011;110(2):513–20. Available from: DOI: 10.1111/j.1365-2672.2010.04906.x PMID: 21143711
26. Schorr D, Schmid H, Rieder HL, Baumgartner A, Vorkauf H, BurnensA. Risk factors for Campylobacter enteritis in Switzerland. ZentralblHyg Umweltmed. 1994;196(4):327–37. PMID: 7748438
27. Wei W, Schüpbach G, Held L. Time-series analysis of Campylobacterincidence in Switzerland. Epidemiol Infect. 2015;143(9):1982–9. Avail-able from: DOI: 10.1017/S0950268814002738 PMID: 25400006
28. Proviande – Die Branchenorganisation der Schweizer Fleischwirt-schaft. Der Fleischmarkt im Überblick: Jährlicher Konsum 2013.[The meat market at a glance: Annual consumption 2013.] Bern:Proviande; 2014 [Accessed 19 Jan 2015]. German. Availablefrom http://www.schweizerfleisch.ch/dienstleistungen/statistik/publikationen/fleischkonsum/
29. Proviande, Landwirtschaftlicher Informationsdienst, Wanner B. Info-grafik: Fleischkonsum in der Schweiz stagniert. [Info graphic: Meat con-sumption in Switzerland stagnates.] Bern: Landwirtschaftlicher Inform-ationsdienst (LID); 2010 [Accessed 19 Jan 2015]. German. Availablefrom: http://www.lid.ch/de/medien/mediendienst/archyear/2086/
30. Schmid H, Burnens AP, Baumgartner A, Oberreich J. Risk factors forsporadic salmonellosis in Switzerland. Eur J Clin Microbiol Infect Dis.1996;15(9):725–32. Available from: DOI: 10.1007/BF01691959 PMID:8922572
31. Schweizer Lebensmittelbuch (SLMB) [Swiss Food Manual]. Kapitel 56“Mikrobiologie und Hygiene” [ chapter 56 “Microbiology and Hygiene”].Bern: Federal Office of Public Health, 1969
32. Das Eidgenössische Departement des Innern [Federal Department ofHome Affairs]. Verordnung über die hygienisch-mikrobiologischen An-
61

4 Inverse trends of Campylobacter and Salmonella
forderungen an Lebensmittel, Gebrauchs- und Verbrauchsgegenständevom 14. September 1981; SR 817.024. [Ordinance on the hygienic andmicrobiological requirements for foodstuff, utility- and consumable art-icles from 14 September 1981]. Bern: Federal Department of HomeAffairs; 1981. German.
33. Das Eidgenössische Departement des Innern [Federal Department ofHome Affairs]. Verordnung über die hygienisch-mikrobiologischen An-forderungen an Lebensmittel, Gebrauchsgegenstände, Räume, Einrich-tungen und Personal vom 26. Juni 1995 (Stand am 1. Januar 1996);SR 817.051. [Ordinance on the hygienic and microbiological require-ments for foodstuff, utilities, rooms, facilities and personnel from 26June 1995 (version from 1 January 1996)]. Bern: Federal Departmentof Home Affairs; 1996. German.
34. Das Eidgenössische Departement des Innern [Federal Department ofHome Affairs]. Hygieneverordnung des EDI (HyV) vom 23. November2005 (Stand am 12. Dezember 2006); SR 817.024.1. [Ordinance onfood hygiene from 23 November 2005 (version from 12 December 2006)].Bern: Federal Department of Home Affairs; 2006. German. Availablefrom http://www.admin.ch/opc/de/classified-compilation/20050160/200701010000/817.024.1
35. Das Eidgenössische Departement des Innern [Federal Department ofHome Affairs]. Hygieneverordnung des EDI (HyV) vom 23. November2005 (Stand am 1. Januar 2014); SR 817.024.1. [Ordinance on foodhygiene from 23 November 2005 (version from 1 January 2014)]. Bern:Federal Department of Home Affairs; 2014. German. Available from:http://www.admin.ch/ch/d/sr/8/817.024.1.de.pdf
36. Schmid H, Baumgartner A. Salmonella enterica serovar Enteritidis inSwitzerland: recognition, development, and control of the epidemic. In:Saeed AM, Gast RK, Potter ME, Wall PG, editors. Salmonella entericaserovar Enteritidis in humans and animals – Epidemiology, pathogen-esis, and control. Ames: Iowa State University Press; 1999.
37. Kaufmann-Bart M, Hoop RK. Diseases in chicks and laying hens duringthe first 12 years after battery cages were banned in Switzerland. VetRec. 2009;164(7):203–7. Available from: DOI: 10.1136/vr.164.7.203PMID: 19218590
38. Bundesamt für Lebensmittelsicherheit und Veterinärwesen BLV[Federal Food Safety and Veterinary Office, FSVO]. Switzerland –Trends and sources of zoonoses and zoonotic agents in humans, food-stuffs, animals and feedingstuffs – in 2013. Report to the EuropeanCommission. Bern: FSVO; 2014. Available from: http://www.blv.admin.ch/dokumentation/00327/04538/04815/index.html?lang=de
39. Baumgartner A, Heimann P, Schmid H, Liniger M, Simmen A. Salmon-ella contamination of poultry carcasses and human salmonellosis. Arch
62

Published article
Lebensm Hyg. 1992;43:123–4.40. Much P, Rendi-Wagner P, Herzog U. Bericht über Zoonosen und
ihre Erreger in Österreich im Jahr 2013. [Report on zoonosesand zoonotic pathogens in Austria in 2013.] Vienna: Bundesminis-terium für Gesundheit, AGES – Österreichische Agentur für Gesund-heit- und Ernährungssicherheit GmbH; 2014. German. Availablefrom: http://www.ages.at/fileadmin/AGES2015/Themen/Krankheitserreger_Dateien/Zoonosen/Zoonosenbericht_2013.pdf
41. Schmid H, Baumgartner A. Epidemiology of infections with entericsalmonellae in Switzerland with particular consideration of travellingactivities. Swiss Med Wkly. 2013;143:w13842. PMID: 23986302
42. Coop, Schweizerische Gesellschaft für Ernährung. Ess-Trends im Fokus6 – “Essen? Aber sicher!” [Dining trends in focus 6: ‘Hungry? Eat, butsafely!’] Basel: Coop; 2011. German. Available from: http://www.coop.ch/pb/site/common2/node/79912766/Lde/index.html
43. Bearth A, Cousin ME, Siegrist M. Uninvited guests at the table –a consumer intervention for safe poultry preparation. J Food Saf.2013;33(4):394–404. Available from: DOI: 10.1111/jfs.12063
44. Nagel GM, Bauermeister LJ, Bratcher CL, Singh M, McKee SR. Sal-monella and Campylobacter reduction and quality characteristics ofpoultry carcasses treated with various antimicrobials in a post-chill im-mersion tank. Int J Food Microbiol. 2013;165(3):281–6. Available from:DOI: 10.1016/j.ijfoodmicro.2013.05.016 PMID: 23800739
63


5 Hepatitis A in Switzerland: Ananalysis of 29 years of surveillancedata and contemporary challenges
Claudia Schmutz1, 2, Daniel Mäusezahl1, 2, Marianne Jost3
1 Swiss Tropical and Public Health Institute, Basel, Switzerland2 University of Basel, Basel, Switzerland3 Federal Office of Public Health, Bern, Switzerland
This article was published in:
Travel Medicine and Infectious Disease (2018), in press.doi: 10.1016/j.tmaid.2018.07.012This is an open access article under the CC BY-NC-ND license (http://creativecommons.org/licenses/BY-NC-ND/4.0/).
65


Published article
AbstractBackground: Hepatitis A (HA) incidence declined in most Europeancountries in the past decades. We analysed HA notification data forSwitzerland of 29 years looking for disease- and notification system-re-lated factors possibly contributing to observed trends.Method: Notification data were descriptively analysed using five time in-tervals (1988–1993, 1994–1999, 2000–2005, 2006–2011, 2012–2016); andnotification rates were calculated.Results: From 1988 to 2016, the HA notification rate decreased from9.5 to 0.5 per 100’000 population in Switzerland. Median age and theproportion of hospitalised cases increased over time. In the 1988–1993-time period, intravenous drug use was the most frequently mentionedrisk exposure while consumption of contaminated food/beverages wasmost frequently mentioned in the 2012–2016-time period.Conclusions: Notification data does not allow reliably identifying currentrisk groups (e.g. travellers) due to low case numbers, limited availabil-ity and reliability of information. It is important to document changesin the surveillance system for later analyses and interpretation of long-term trends. Population susceptibility likely increases underlining theimportance of continued and continuous surveillance and prevention ef-forts despite decreasing case numbers. Operational research is recom-mended to further investigate observed trends of HA and to enhance theabilities for decision making from Swiss HA surveillance data.
IntroductionIn most European countries, incidence and endemicity of hepatitis Avirus (HAV) infection are classified as low or very low1 [2-5]. However,this does not mean that the disease can be ignored. It rather impliesthat the characteristics of HAV infections differ from those countrieswith high or intermediate HAV endemicity features.HAV infection is usually asymptomatic or mild in young children [6].HAV infection is more often symptomatic with increasing age, and maypresent with fever, malaise, anorexia, nausea, abdominal discomfort,diarrhoea, vomiting, fatigue and jaundice after an incubation periodof 15–50 days [1,6]. Signs and symptoms of acute hepatitis A (HA)
1Levels of endemicity have been defined by WHO on the basis of seroprevalenceas follows: “high (≥90% by age 10 years); intermediate (≥50% by age 15 years,with<90% by age 10 years); low (≥50% by age 30 years, with<50% by age 15);and very low (<50% by age 30 years)” [1].
67

5 Hepatitis A: 29 years of surveillance and contemporary challenges
are indistinguishable from acute hepatitis B (HBV) and C virus (HCV)infections [6]. However, in contrast to HBV and HCV, HAV does notlead to chronic infection even though relapse of symptoms and fulminanthepatitis can occur [6].Safe and effective vaccines against HAV exist. HAV vaccination ratherthan passive immunisation is recommended for pre- and post-exposureprophylaxis and can be considered to contain outbreaks [1]. In areasof high endemicity, most people get infected at very young age. Hence,asymptomatic infection is likely and the burden of disease of HA is lowin these countries. With decreasing level of endemicity, average age atinfection and disease severity increase. Therefore, it is assumed thatcountries with intermediate endemicity levels benefit the most from uni-versal vaccination against HAV [1]. The World Health Organization(WHO) recommends large-scale vaccination in areas with intermediateHAV endemicity and targeted vaccination of people at high risk in areasof low and very low endemicity [1].HAV is transmitted via the faecal-oral route from person-to-person orthrough contaminated food and water [6]. Young children are an import-ant reservoir and source of transmission considering that the majority ofyoung children infected with HAV are asymptomatic [6,7]. Infectivity ofHA is highest during the second half of the incubation period up until afew days after onset of jaundice [6]. Most people are no longer infectiousone week after onset of jaundice [6]. High-risk groups for HAV infectioninclude unimmunised travellers to areas of high endemicity, men whohave sex with men (MSM), and injecting drug users (IDUs) [1].Case fatality of HA ranges from 0.1 to 0.3%, but increases strongly withage with rates of sometimes >10% observed in hospitalised adults ≥40year old or older age groups [6,8,9]. Globally, 14’900 deaths were attrib-utable to HAV infection in 2013 compared to 22’600 in 1990 [10].In 2016, WHO published a guide for viral hepatitis surveillance [11]. Oneof the three mentioned purposes of viral hepatitis surveillance is relevantfor HA: “detect outbreaks, monitor trends in incidence and identify riskfactors for new, incident infections”. Syndromic surveillance is recom-mended to detect outbreaks while enhanced case reporting is recommen-ded to “describe trends in type-specific acute hepatitis and identify riskfactors”. Case definitions suggested by WHO and case definitions usedby the European Centre for Disease Prevention and Control (ECDC)and by the Federal Office of Public Health (FOPH) for Switzerland arepresented in table 5.1. In Switzerland, there is currently no syndromicsurveillance for hepatitis but reporting of laboratory-confirmed cases ofhepatitis A (and B and C; and hepatitis E as per 01.01.2018) is mandat-
68

Published
article
Table 5.1: World Health Organization (WHO), European Centre for Disease Prevention and Control (ECDC) and FederalOffice of Public Health (FOPH) case definitions for hepatitis A surveillance
Acute hepatitis / hepatitis A case definition according to WHO [11]
Presumptivecase / casedefinition forsyndromicsurveillance (“acutehepatitis”):
Any person meeting the• Clinical criteria
Confirmed case(type-specificsurveillance;hepatitis A):
Any person meeting the• Clinical criteria AND• biomarker or epidemiological criteria
Clinicalcriteria:
“Discrete onset of an acute illness with signs/symptoms of (i) acute viralillness (e.g. fever, malaise, fatigue) and (ii) liver damage, which can beclinical (e.g. anorexia, nausea, jaundice, dark urine, right upper quadranttenderness), and/or biochemical (alanine aminotransferase [ALT] levels morethan 10 times the upper limit of normal.a” [11]a Ten times the upper limit of normal (400 IU/L) is the threshold used bythe State and Territorial Epidemiologists (CSTE). Countries may also selectlower thresholds that could be more sensitive or higher thresholds that couldbe more specific
Biomarkercriteria:
IgM anti-HAV positive
69

5Hepatitis
A:29
yearsofsurveillance
andcontem
porarychallenges
Table 5.1: (continued)
Epidemiologicalcriteria:
Epidemiological linkb with a confirmed case [11]
b Contact with a confirmed case-patient during the referent exposure periodor context of an etiologically confirmed outbreak
Hepatitis A case definition according to ECDC [70]
Confirmed case Any person meeting the• Clinical criteria AND• Laboratory criteria
Probable case Any person meeting the• Clinical criteria AND• Epidemiological criteria
Clinicalcriteria:
“Any person with a discrete onset of symptoms (e.g. fatigue, abdominalpain, loss of appetite, intermittent nausea and vomiting) AND at least oneof the following three: fever, jaundice, elevated serum aminotransferaselevels” [70]
Laboratorycriteria:
“At least one of the following three: detection of hepatitis A virus nucleicacid in serum or stool, hepatitis A virus specific antibody response,detection of hepatitis A virus antigen in stool” [70]
Epidemiologicalcriteria:
“At least one of the following four: human to human transmission, exposureto a common source, exposure to contaminated food/drinking water,environmental exposure” [70]
70

Published
article
Table 5.1: (continued)
Hepatitis A case definition according to FOPHConfirmed case Any person meeting the
• Laboratory criteria AND• Clinical criteria or epidemiological linkIn absence of information on laboratory criteria:• Both clinical criteria (icterus and increased transaminase) present AND contact withlaboratory-confirmed case
Probable case Any person meeting the• Clinical criteria but without any information on laboratory criteria (with indication
of name of laboratory and/or reason for testing on clinical notification form)
Possible case Any person meeting the• Laboratory criteria but without any information on clinical and epidemiologicalcriteria OR
• Clinical criteria but without any information on laboratory criteria (without indica-tion of name of laboratory and/or reason for testing on clinical notification form)
No case• Neither laboratory nor clinical criteria met OR• Laboratory criteria met, but neither clinical criteria met nor epidemiological link
present (but information from clinical notification form is available)• Neither laboratory criteria met nor epidemiological link present (independent of pres-
ence or absence of clinical criteria)
71

5Hepatitis
A:29
yearsofsurveillance
andcontem
porarychallenges
Table 5.1: (continued)
Laboratorycriteria:
anti-HAV IgM positive
Clinicalcriteria:
Icterus and/or increased transaminase
Epidemiologicallink:
Stay in an endemic region (high or moderate risk according to WHO, p. 95[71]) or contact to a laboratory-confirmed case
72

Published article
ory [12].HAV seroprevalence and incidence vary substantially across countriesof the European Union (EU) and the European Economic Area (EEA),but decreased in all countries between 1975 and 2014 [2,5]. However, thenotification rate of HAV, 3.0 cases per 100’000 population in 2014, hasbeen slightly increasing again since 2011 [13]. There is a high variabilityacross EU/EEA countries also in terms of notification rates: Iceland re-ported zero cases per 100’000 population, while Romania reported 33.3cases per 100’000 population in 2014. In Switzerland, the notificationrate decreased from 10/100’000 population in 1988 to 2.6/100’000 pop-ulation in 2004 [14].Most EU/EEA countries recommend vaccination against HAV for se-lected risk groups while only few recommend universal vaccination (in-cluded in national immunisation programme: Greece; universal child-hood vaccination for parts of the country: Italy, Spain; recommended,but not included in national immunisation schedule: Bulgaria, Cyprus,Czech Republic, Estonia) [2]. In Switzerland, the first HAV vaccine wasavailable in 1992 [15]. Before, only passive immunisation was availablefor travellers at risk [15]. Risk groups, for which vaccination againstHAV is recommended, are presented in table 5.2. The costs of HAV vac-cination have been covered by the compulsory health insurance for riskgroups since 2008 except for travel-related and occupational indications[17]. For the latter, the employer usually covers the costs for vaccina-tion.This study describes the notification data of HA for Switzerland. Itidentifies factors potentially contributing to observed trends, includingchanges in the notification system. We investigated the epidemiology ofHA in Switzerland in relation to the current Swiss vaccination recom-mendations and trends observed in other European countries.
Material and methodsThe National Notification System for Infectious DiseasesHA has been a notifiable disease in Switzerland since 1984 [14]. Man-datory notification of HA includes a “report on laboratory findings” anda “report on clinical findings”. Current reporting forms can be accessedat www.bag.admin.ch/infreporting (available in German, French andItalian).Reports on laboratory findings are completed by those responsible at thediagnosing laboratory, upon confirmation of a HAV infection. Reports
73

5Hepatitis
A:29
yearsofsurveillance
andcontem
porarychallenges
Table 5.2: Overview of Swiss recommendations for vaccination against hepatitis A virus (HAV)
1992 2005 2007 Summary of current (2007)vaccinationrecommendations aspublished in yearlyvaccination schedule (2017)
Source: [15] Source: [16] Source: [14] Source: [17]
Primary prevention
Non-immune travellers tocountries with high risk ofHAV infection (mainly “thirdworld countries” and selectedcountries in Eastern Europe)
[travellers]a Travellers to countries withmedium or high endemicity(according to www.who.int/ithor www.safetravel.ch).In case of adoption of a childfrom a country of highendemicity, all family members(not only those travelling)should be vaccinated.
Travellers to countries withmedium and high endemicity
Illegal drug users Drug users People injecting drugs People injecting drugsPartly recommended: Children>12 months of age visitingrelatives in “third worldcountries” or in EasternEurope and attending day carein Switzerland
Children from countries ofmedium and high endemicityliving in Switzerland andtemporarily returning to theircountry of origin
Children from countries ofmedium and high endemicityliving in Switzerland andtemporarily returning to theircountry of origin
74

Published
article
Table 5.2: (continued)
1992 2005 2007 Summary of current (2007)vaccinationrecommendations aspublished in yearlyvaccination schedule (2017)
Partly recommended: Selectedstaff of day care facilities andchildren hospitalsPartly recommended: Personsin close occupational contactwith refugees, asylum seekersor drug users
Persons in close occupationalcontact to people injectingdrugs (including prison staff);and to persons from countriesof medium and high endemicity(asylum seekers, refugees)
Persons in close occupationalcontact to drug users; and topersons from countries of highendemicity
Persons withchronichepatopathies
Persons with chronic liverdisease (Hepatitis B, C orother chronic hepatopathies,especially candidates of livertransplantation
Persons with chronic liverdisease
Persons in closecontact topeople withHAV infection
75

5Hepatitis
A:29
yearsofsurveillance
andcontem
porarychallenges
Table 5.2: (continued)
1992 2005 2007 Summary of current (2007)vaccinationrecommendations aspublished in yearlyvaccination schedule (2017)
Staff ofmicrobiologicallaboratories
Laboratory personnel workingwith HAV or with primatesinfected with HAV, orinvestigating stool samples
Laboratory personnel workingwith HAV
Men who havesex with men(MSM)
Men who have sex with men(MSM) (outside of stablerelationship)
Men who have sex with men(MSM)
Drainers and employees ofsewage plants
Drainers and employees ofsewage plants
Secondary preventionAfter close contact with aperson with acute hepatitis A,or after exposure to a potentialsource within 7 days afterexposure (or after developmentof symptoms of the primarycase)
Within 7 days after exposure
76

Published
article
Table 5.2: (continued)
1992 2005 2007 Summary of current (2007)vaccinationrecommendations aspublished in yearlyvaccination schedule (2017)
Staff and persons ininstitutions, in which there wasa case of HAV (e.g. day-carecentres, home for persons withdisabilities, retirement homes,casern), and their families, ifappropriateIn case of an epidemic (socialenvironment of cases)
a Travel-related vaccination recommendations / indications were not considered in this document
77

5 Hepatitis A: 29 years of surveillance and contemporary challenges
are sent within 24 h to the FOPH and to the cantonal physician of thepatient’s canton of residence. The current laboratory notification formincludes date of diagnosis, type of sample, laboratory method, patient’sname, address, date of birth, and sex.Physicians are to complete the “report on clinical findings” upon receiptof a positive laboratory result for HAV, and send it to the cantonalphysician of the patient’s canton of residence, within 24 h. The cantonalphysician forwards this information to the FOPH and takes appropriatedisease control and prevention measures, if indicated. The FOPH takeson and/or coordinates prevention and control measures if several can-tons and/or other countries are involved, or if requested by the cantonalphysician. The notification form on clinical findings contains informationon the patient (name, date of birth, sex, address, nationality), and thecourse of disease (date of disease onset and diagnosis, signs and symp-toms, reason for laboratory testing, hospitalisation, sequelae, death).The patient’s vaccination status and exposure within 2 months beforedisease onset are also recorded. Information from both notification forms(laboratory and clinical findings) is then entered into an electronic data-base at the FOPH. Reports on the same patient are linked, wheneverpossible.
Data sources and analysisSurveillance data on HA was extracted from the National NotificationSystem for Infectious Diseases’ (NNSID) database for the years 1988–2016 (data as of 12 April 2017). Data before 1988 were not available.Cases residing outside Switzerland and the Principality of Liechtenstein,and cases finally classified as “no case” (see table 5.1 for case classifica-tion) were excluded.Data were analysed descriptively in terms of case numbers and casecharacteristics (incl. possible transmission routes). For description ofcase characteristics, notification years were grouped into four 6-year andone 5-year-period. Notification rates, defined as the number of notifiedcases per 100’000 resident population, were calculated using populationstatistics from the Federal Statistical Office (FSO). Population statisticswere not yet available for 2016 at the time of data extraction; there-fore, we used 2015 population statistics to calculate notification ratesfor 2016. We compared the number of hospitalised cases and deaths asreported on notification forms with the number of hospitalisations anddeaths due to the International Statistical Classification of Diseases andRelated Health Problems 10th Revision (ICD-10) codes B15.0 (“hepatitis
78

Published article
A with hepatic coma”) or B15.9 (“hepatitis A without hepatic coma”)according to official hospital and mortality statistics (data obtained fromthe FSO). Main and secondary diagnoses/deaths were considered for ex-traction of hospitalisations/deaths due to ICD-10 codes B15.0 and B15.9from hospital and mortality statistics, respectively. Data were analysedusing the statistical software Stata (Version 13.1 [18]).Notification data were collected under the Swiss Epidemics Act andhence, no ethical approval was required.
ResultsTrends in hepatitis A case numbers and demographiccharacteristicsThe notification rate of HA decreased from 9.5/100’000 population (628cases) in 1988 to 0.5/100’000 population (43 cases) in 2016 in Switzer-land (Figure 5.1). The highest notification rate was observed in 1990(14.2/100’000).Median age of cases increased from 25 years (1988–1993) to 43 years(2012–2016). In the most recent years, no age group predominated whilein the early 1990s there was a clear predominance of young adults forboth sexes (highest notification rate in 15–24 year age group, followedby 25–44 year age group; figure 5.2). In the two youngest and in theoldest age groups (0–4, 5–14 and 65+ age groups) there was no clearsex-pattern observed. In the 15–24, 25–44 and 45–65 year age groups,males had a higher notification rate. However, this male predominancedecreased over the years. In 2015 and 2016, the overall female notifica-tion rate was even slightly higher than the male notification rate.The proportion of cases of Swiss or Liechtensteiner nationality decreasedduring the observation period: 83.9% were Swiss/Liechtensteiner (ex-cluding those with nationality not specified) during the 1988–1993-period, while in the 2012–2016-period 70.1% were reported to be Swiss/Liechtensteiner (Table 5.3). A similar trend was observed in the propor-tion of Swiss among the permanent resident population of Switzerland:in the 1988–1993-period, between 81.7 and 84.6% were of Swiss national-ity while in the 2012–2015-period (2016 data not yet available) between75.6 and 77.0% were Swiss [19].In all notification periods, between 2.4 and 4.9% of cases were reported tobe vaccinated against HAV. For 45 of 285 cases with reported vaccinationprior to HA infection, at least the year of the first and/or last vaccinationwas reported. Of those, 3 were reported to be vaccinated before 1992,
79

5Hepatitis
A:29
yearsofsurveillance
andcontem
porarychallenges
Figure 5.1: Trend in number of reported hepatitis A cases and notification rate from 1988–2016 with major “events” (e.g.concerning vaccination) labelled, Switzerland.
80

Published article
Figure 5.2: Male and female hepatitis A notification rate by age group andyear, 1988–2016, Switzerland.
81

5Hepatitis
A:29
yearsofsurveillance
andcontem
porarychallenges
Table 5.3: Characteristics of notified hepatitis A cases, 1988–2016, Switzerland
All cases1988–1993 1994–1999 2000–2005 2006–2011 2012–2016 1988–2016% (N) % (N) % (N) % (N) % (N) % (N)
Total cases (4’328) (2’334) (1’105) (626) (262) (8’655)Possible case - (0) - (0) - (0) 7.0 (44) 8.4 (22) 0.8 (66)Probable case 0.3 (14) 1.1 (25) 0.2 (2) 4.5 (28) 4.2 (11) 0.9 (80)Confirmed case 0.6 (27) 11.0 (256) 89.8 (992) 78.4 (491) 87.4 (229) 23.1 (1’995)Case not classified 99.1 (4’287) 88.0 (2’053) 10.0 (111) 10.1 (63) - (0) 75.3 (6’514)
SexMale 64.2 (2’779) 60.5 (1’412) 60.1 (664) 56.1 (351) 51.7 (136) 61.7 (5’342)Female 34.5 (1’494) 38.9 (908) 39.4 (435) 43.6 (273) 48.3 (126) 37.4 (3’237)Not specified 1.3 (55) 0.6 (14) 0.5 (6) 0.3 (2) - (0) 0.9 (77)
Age group, years<5 2.4 (103) 5.1 (120) 5.6 (62) 3.2 (20) 1.5 (4) 3.6 (309)5–14 7.6 (330) 19.8 (462) 23.1 (255) 12.8 (80) 9.2 (24) 13.3 (1’151)15–24 35.1 (1’517) 16.4 (382) 12.3 (136) 11.2 (70) 15.6 (41) 24.8 (2’146)25–44 40.4 (1’750) 39.1 (912) 33.6 (371) 32.9 (206) 25.6 (67) 38.2 (3’306)45–64 10.2 (441) 15.2 (355) 18.8 (208) 28.4 (178) 30.9 (81) 14.6 (1’263)>64 2.7 (116) 4.2 (99) 6.6 (73) 11.5 (72) 17.2 (45) 4.7 (405)Not specified 1.6 (71) 0.2 (4) - (0) - (0) - (0) 0.9 (75)
82

Published
article
Table 5.3: (continued)
All cases1988–1993 1994–1999 2000–2005 2006–2011 2012–2016 1988–2016% (N) % (N) % (N) % (N) % (N) % (N)
Total cases withnotification onclinical findings
80.9 (3’503) 89.5 (2’088) 93.0 (1’028) 91.4 (572) 93.9 (246) 85.9 (7’437)
NationalitySwiss/Liechtensteiner
70.2 (2’458) 62.2 (1’299) 63.4 (652) 62.6 (358) 60.2 (148) 66.1 (4’915)
Foreign 13.5 (472) 21.1 (441) 22.4 (230) 21.2 (121) 25.6 (63) 17.8 (1’327)Not specified 16.4 (573) 16.7 (348) 14.2 (146) 16.3 (93) 14.2 (35) 16.1 (1’195)
Reported locationof exposureSwitzerland <0.1 (1) 3.2 (66) 33.4 (343) 27.3 (156) 25.6 (63) 8.5 (629)Switzerland andabroad
- (0) <0.1 (1) 1.7 (17) 4.7 (27) 2.4 (6) 0.7 (51)
Abroada 39.3 (1’375) 46.5 (971) 42.2 (434) 51.9 (297) 55.7 (137) 43.2 (3’214)Europeb 38.3 (527) 49.0 (476) 38.6 (174) 34.9 (113) 25.2 (36) 40.6 (1’326)
Africab 24.0 (330) 17.6 (171) 22.0 (99) 34.0 (110) 37.1 (53) 23.4 (763)
Americab 18.0 (247) 17.4 (169) 18.8 (85) 11.1 (36) 17.5 (25) 17.2 (562)
Asiab 17.3 (238) 12.7 (123) 14.4 (65) 16.0 (52) 19.6 (28) 15.5 (506)
Australiab 0.4 (6) 1.2 (12) 0.7 (3) 0.3 (1) 1.4 (2) 0.7 (24)
Not specifiedb 3.6 (49) 3.3 (32) 6.4 (29) 4.9 (16) 0.7 (1) 3.9 (127)
83

5Hepatitis
A:29
yearsofsurveillance
andcontem
porarychallenges
Table 5.3: (continued)
All cases1988–1993 1994–1999 2000–2005 2006–2011 2012–2016 1988–2016% (N) % (N) % (N) % (N) % (N) % (N)
Unknown or notspecified
60.7 (2’127) 50.3 (1’050) 22.8 (234) 16.1 (92) 16.3 (40) 47.6 (3’543)
Reportedexposure riska
Food/beverages 2.2 (76) 8.7 (181) 22.0 (226) 25.3 (145) 28.5 (70) 9.4 (698)Contact withinfected person
18.2 (639) 21.6 (451) 17.6 (181) 11.2 (64) 12.6 (31) 18.4 (1’366)
Sexual contactwith infectedperson
3.5 (124) 5.5 (115) 2.9 (30) 4.0 (23) 4.1 (10) 4.1 (302)
Intravenous druguser
33.4 (1’171) 10.0 (208) 1.7 (17) 0.3 (2) - (0) 18.8 (1’398)
Other 3.3 (117) 5.0 (105) 2.8 (29) 3.7 (21) 3.7 (9) 3.8 (281)Unknown or notspecified
50.5 (1’768) 57.3 (1’197) 56.0 (576) 58.9 (337) 58.9 (145) 54.1 (4’023)
ImmunisationstatusVaccinatedc 4.5 (158) 3.1 (64) 2.4 (25) 4.5 (26) 4.9 (12) 3.8 (285)
Vaccinated with 1dosed
0.6 (1) 6.3 (4) 48.0 (12) 57.7 (15) 66.7 (8) 14.0 (40)
Vaccinated with≥2 dosesd
- (0) - (0) 16.0 (4) 30.8 (8) 8.3 (1) 4.6 (13)
84

Published
article
Table 5.3: (continued)
All cases1988–1993 1994–1999 2000–2005 2006–2011 2012–2016 1988–2016% (N) % (N) % (N) % (N) % (N) % (N)
Not specifiedd 99.4 (157) 93.8 (60) 36.0 (9) 11.5 (3) 25.0 (3) 81.4 (232)
Not vaccinated ornot specified
95.5 (3’345) 96.9 (2’024) 97.6 (1’003) 95.5 (546) 95.1 (234) 96.2 (7’152)
Manifestationa
Jaundice 74.1 (2’596) 75.9 (1’585) 76.7 (788) 70.1 (401) 65.0 (160) 74.4 (5’530)Transaminaseincreased ≥2.5fold
70.1 (2’457) 57.1 (1’192) 76.8 (790) 83.4 (477) 86.6 (213) 69.0 (5’129)
Other - (0) 0.4 (10) 4.7 (52) 19.2 (120) 39.3 (103) 3.8 (285)None 1.2 (41) 1.6 (33) 3.0 (31) 1.6 (9) 1.2 (3) 1.6 (117)Unknown or notspecified
12.9 (451) 9.5 (199) 5.3 (54) 2.8 (16) 2.8 (7) 9.8 (727)
HospitalisationYes 21.4 (750) 20.0 (418) 24.8 (255) 30.6 (175) 44.7 (110) 23.0 (1’708)
Due to hepatitisAe
- (0) - (0) 0.4 (1) 56.6 (99) 63.6 (70) 10.0 (170)
Other reasone - (0) - (0) - (0) 21.1 (37) 18.2 (20) 3.3 (57)Due to hepatitis Aand other reasone
- (0) - (0) - (0) - (0) 0.9 (1) 0.1 (1)
Unknown or notspecifiede
100 (750) 100 (418) 99.6 (254) 22.3 (39) 17.3 (19) 86.7 (1’480)
No or not specified 78.6 (2’753) 80.0 (1’670) 75.2 (773) 69.4 (397) 55.3 (136) 77.0 (5’729)
85

5Hepatitis
A:29
yearsofsurveillance
andcontem
porarychallenges
Table 5.3: (continued)
All cases1988–1993 1994–1999 2000–2005 2006–2011 2012–2016 1988–2016% (N) % (N) % (N) % (N) % (N) % (N)
ComplicationsYes - (0) - (0) - (0) 3.7 (21) 4.5 (11) 0.4 (32)No or not specified 100 (3’503) 100 (2’088) 100 (1’028) 96.3 (551) 95.5 (235) 99.6 (7’405)
DeathYes 0.5 (19) 0.4 (8) 0.1 (1) 0.9 (5) 1.2 (3) 0.5 (36)
Due to hepatitis Af 15.8 (3) 12.5 (1) - (0) - (0) - (0) 11.1 (4)
Other reasonf 10.5 (2) 50.0 (4) 100 (1) 100 (5) 100 (3) 41.7 (15)Unknown or notspecifiedf
73.7 (14) 37.5 (3) - (0) - (0) - (0) 47.2 (17)
No or not specified 99.5 (3’484) 99.6 (2’080) 99.9 (1’027) 99.1 (567) 98.8 (243) 99.5 (7’401)a Multiple answers possibleb % among cases with exposure “Switzerland and abroad” or “abroad”c Occasionally reported for cases already before 1992 when hepatitis A virus (HAV) vaccination was introduced. Itcannot be determined whether these cases received passive immunisation against HAV (which was available alreadybefore 1992) or whether the information on the notification form was incorrect. It is suspected that physicians may notbe able to easily differentiate active from passive immunisation based on information from vaccination cards and – inthe absence of vaccination cards – patients may confuse HAV and hepatitis B virus vaccinationd % among all vaccinated casese % among hospitalised casesf % among deceased cases
86

Published article
13 received vaccination ≤14 days before disease onset and 7 receivedvaccination between 14 and 28 days before disease onset. For one case,the date of last vaccination was after disease onset. However, it wasreported that this case received 3 doses of HA vaccine, the first one inthe year prior to disease onset in mid-January. For the remaining 21cases, disease onset was reported between 31 days and 14 years aftertheir last (or only) vaccination.
Clinical characteristicsJaundice was reported for 65.0–76.7% and increased transaminases for57.1–86.6% of cases over all notification periods (Table 5.3). Other re-ported signs and symptoms included fever, gastrointestinal symptoms(nausea, vomiting, abdominal pain, diarrhoea), reduced general state,weakness, myalgia, arthralgia, dark urine and pale stools. Fever, listedon the notification form since 2015, was specified for 39.3% of cases since2015 but only for 2.9% of cases between 1999 and 2014 (no option to list“other symptoms” before 1999).The proportion of hospitalised cases increased from 21.4% in 1988–1993to 44.7% in 2012–2016 (Table 5.3, figure 5.3a). The number of caseswith hospitalisation indicated as “yes” on the report on clinical findingsis much lower than the number of hospitalisations due to ICD-10 codesB15.0 and B15.9 according to Swiss hospital statistics from 1998 to 2015(the years for which hospital statistics were available; figure 5.3b). How-ever, when considering only main diagnoses (as opposed to main andsecondary diagnoses), numbers from the two statistics are comparable.The reason for hospitalisation (due to HA and/or for other reason) hasbeen included in the reporting form since 2006. In three quarters ofcases (171/228) with this information available, HA was indicated asthe reason for hospitalisation (including one case hospitalised due to HAand another reason).Complications, recorded since 2006, were reported for 3.9% (32/818)of cases and included coagulopathy, acute or imminent liver failure,cholecystitis, and general malaise.Official mortality statistics, coded according to ICD-10, were availablefor 1995–2014. During this time period, 46 HA-related deaths were re-corded (ICD-10 codes B15.0 and B15.9 as main or secondary cause).In the notification data, only 14 deaths among HA cases were capturedduring this time period (36 deaths from 1988–2016).
87

5 Hepatitis A: 29 years of surveillance and contemporary challenges
Reported location of exposure and exposure risksExposure abroad (or both, in Switzerland and abroad) increased from39.3% in 1988–1993 to 58.1% in 2012–2016 while the proportion of “un-known or not specified” location of exposure decreased (Table 5.3).European followed by African countries were most frequently mentionedas countries of exposure in the past. In the most recent years, exposurein African countries was more frequently reported (Table 5.3). The pro-portion of cases exposed in the Americas, Asia and Australia remainedstable over the entire time period. Italy, Turkey and Germany werethe three most frequently mentioned European countries between 2012and 2016 while from 1988–1993 Italy, Spain and former Yugoslavia werelead exposure countries. Morocco, Tunisia, Egypt and Kenya were mostfrequently mentioned African countries from 1988–1993 and Morocco,Egypt, Togo, Ethiopia and Cap Verde from 2012–2016.For the majority of cases (50.5%–58.9% for all notification periods), thesource of exposure was reported to be unknown or was not specified.Intravenous drug use was the most frequently reported exposure risk inthe 1988–1993 notification period while this exposure risk was not men-tioned in the 2012–2016 period (Table 5.3). In contrast, the proportionof cases for which contaminated food or beverages was indicated as ex-posure risk increased over the years (2.2% of cases in 1988–1993; 28.5%of cases in 2012–2016). The mentioning of “contact with an infectedperson” as exposure risk decreased over the observation period (18.2%in 1988–1993; 12.6% in 2012–2016) while “sexual contact with an infec-ted person” remained stable at around 4%. Exposure risks mentioned inthe “other” category included occupational exposures, exposure to bloodor blood products (including transfusions), or (previous and/or current)residency abroad.
DiscussionOur analysis of Swiss hepatitis A notification data from 1988–2016 re-vealed temporal trends in case numbers and case characteristics whichmay be caused by changes in disease epidemiology but also are likely toreflect changes in disease reporting and notification.
88

Published article
Figure 5.3: (a) Proportion of hospitalised hepatitis A cases according tonotification data (bars, left axis) and number of notified cases (line, rightaxis), and (b) hospitalisations due to hepatitis A according to notificationforms (solid black line) and hospital statistics (bars; data for 1998–2015 only),1988–2016, Switzerland.Source of hospital statistics: Federal Statistical Office, Neuchâtel, Switzerland.
89

5 Hepatitis A: 29 years of surveillance and contemporary challenges
No unexpected risk group for HAV infection according toSwiss notification dataRecently published analyses of HA notification data in Switzerland in-cluded data until 2004 apart from a recent article of the FOPH reportingon an increase in case numbers in early 2017 [14,20,21]. All analyses ex-cept of the latter documented decreasing trends regarding HA notifica-tion rates that continue into contemporary times. Today, the notificationrate in Switzerland is comparable for all age groups and for males andfemales, though fluctuating quite substantially in the setting of low casenumbers. In contrast, the notification rate of 2014 in 30 EU/EEA coun-tries was still highest for the 5–14 year age group, followed by the 0–4and the 15–24 year age groups, and slightly higher in males comparedto females [13].The strongest decline in HAV notifications started in 1990, even beforethe introduction of HAV vaccination in Switzerland (Figure 5.1). How-ever, passive immunisation was already available since the early 1980ies[22]. Additionally, campaigns among IDUs could have contributed tothe observed decline: The most frequently mentioned risk exposure inthe early 1990s, intravenous/injecting drug use, has infrequently beenreported in the last 10 years. It has been hypothesised that transmis-sion of HA among IDUs could occur through sharing equipment or dueto contaminated drugs or generally poor hygienic conditions [23,24]. De-creasing case numbers were also observed for hepatitis B together witha strong decline in IDU as reported risk exposure [25]. The decreasingcase numbers were attributed to preventive measures introduced to con-trol human immunodeficiency virus (HIV). The HIV/AIDS epidemic inthe late 1980s and peak levels of drug consumption in the early 1990sresulted in the establishment of needle exchange facilities providing a“safe” environment for drug consumption [26]. A study among personsentering heroin-assisted treatment found that the proportion of HAV-infected persons decreased from 2003 to 2013 while the proportion ofpeople vaccinated against HAV increased [27]. Nevertheless, the preval-ence of HA is still higher in persons entering heroin-assisted treatmentin Switzerland than among the general population [27]. Reports on IDUas a risk exposure among notified cases of HA from other countries arescarce. In Eastern Sydney, Australia, one third of notified cases wasassociated with IDU between September 1994 and June 1995 while thisproportion dropped to 9% between July 1995 and December 1996 [28].In New South Wales, Australia, recreational drug use decreased amongreported HA cases between 2000 and 2009 [29]. In contrast, in Italy,
90

Published article
the frequency of IDUs among cases of viral hepatitis (slightly more thanhalf of which were HA cases) remained at constant but low levels (<5%)between 1991 and 2006 [30]. Similarly, IDU was a reported risk factorfor 2% of HA cases in 1994–1995 as well as in 2006–2007 in Arizona,United States [31].HA vaccination failure and clinical cases of HA among vaccinated in-dividuals reported in the literature are very rare [32-42]. Nevertheless,3.8% of notified cases (285/7437) were reported to be vaccinated againstHAV in Switzerland between 1988 and 2016. There are several explan-ations for this notably high proportion: (i) “vaccinated” cases might in-clude persons having received passive immunisation (see also footnote intable 5.2) which has only a short-term protective effect [1,43]; (ii) vaccin-ation may have occurred only shortly before travel or in the framework ofpost-exposure prophylaxis – potentially too late to prevent disease onset(even though the notification form asked for vaccination status prior toinfection); and (iii) HAV vaccination may be confused with other vac-cinations, e.g. HBV vaccination, especially if information provided byphysicians is obtained from patients rather than from vaccination cards(as it has been shown that travellers could frequently not recall theirvaccination history [44]). Nevertheless, vaccination failure cannot beruled out, especially in immunocompromised patients. A recent studyamong Swedish travellers under immunosuppressive medication due toreactive arthritis has shown that similar protection after two months canbe achieved by administering a 3-dose regimen (1 + 1 + 1 or 2 + 1) at0, (1) and 6 months compared to a 2-dose regimen at 0 and 6 monthsamong healthy individuals [45].The decline in the HA incidence led to an increase in the populationsusceptible to HAV in the EU/EEA which was not compensated by in-creased vaccination rates, as highlighted by Gossner et al. [3]. This isassumed to be the case also in Switzerland in the absence of universalvaccination recommendation. However, data on population susceptibil-ity are not available. Vaccination coverage was assessed in Switzerlandfor 2-, 8- and 16-year old children and adolescents and was 4% [95% con-fidence interval (CI): 3.2–4.6], 11% [95% CI: 9.5–11.7], and 28% [95% CI:24.8–30.6] for two doses, and slightly higher for one dose, in 2014–16 [46].Between 2002 and 2012, 53.1% of travellers seeking pre-travel health ad-vice in one Swiss travel clinic received HAV vaccination (in part com-bined with HBV vaccination) [47]. On the other hand, a survey amongtravellers to tropical and subtropical countries at a Swiss airport in 2002revealed that only 26% of travellers were protected against HAV and anadditional 12% were potentially protected [48]. It has to be considered
91

5 Hepatitis A: 29 years of surveillance and contemporary challenges
that surveys conducted at the airport might be biased (over-representingfrequent travellers, and considering only one mode of transport) as high-lighted by Pedersini et al. (2016) [44]. They showed that the frequencyof international travel and endemicity at destination are both associatedwith HA vaccination among travellers in five European countries. In2014, 62.6% of MSM reported to be vaccinated against HAV in a Swissonline survey among MSM [49]. Further insights into vaccination ratesand knowledge about HA among Swiss MSM are expected once the datafrom the European MSM Internet Survey (EMIS-2017) becomes avail-able [50].Recently, HAV outbreaks among MSM have been reported in severalEuropean countries [51] including England [52], the Netherlands [53] andGermany [54]. Our analysis did not suggest any similar outbreak amongMSM in Switzerland: in 2016 sexual contact with an infected personwas specified as a risk exposure only for one case and the male-to-femaleratio did not change compared to 2015. However, case notifications forHAV more than doubled in the first 22 weeks of 2017 compared to thesame time period in 2016 (41 vs. 17 cases) [21]. A link to the Europeanoutbreaks among MSM seems likely considering that the increase in casenumbers mainly affects males.“Exposure abroad” was indicated for more than half of recently notifiedcases, suggesting that travelling is still a main risk factor for acquir-ing HA. Previous analyses of Swiss HAV notification data identified riskgroups or different exposure patterns among subgroups of notified cases(e.g. among cases below 20 years of age, those with Swiss nationalitytended to be exposed in Switzerland while those with foreign nationalitytended to be exposed abroad [14]). We did not conduct such subgroupanalyses considering the low case numbers in recent years.
Relative increase in hospitalisationsData on hospitalisations revealed two interesting trends: (i) the propor-tion of hospitalised patients increased among reported cases, and (ii)hospital statistics suggest substantial underreporting of hospitalisationsdue to HA in the NNSID. An increasing proportion of hospitalisationshas also been reported in the United States [55]. Ly and Klevens hypo-thesised that this observation is explained by a shift of the susceptiblepopulation towards older adults together with the fact that HA leadsto more severe disease with increasing patient age. This is likely alsothe case for Switzerland: while the median age of reported cases was 26and 25 years in non-hospitalised (incl. hospitalisation status not spe-
92

Published article
cified) and hospitalised patients, respectively, in 1988–1993, median agefor those two groups increased to 36.5 and 47 years in 2012–2016. An al-ternative explanation links the decreasing frequency of HAV infection inSwitzerland (or at least the decreasing notification rate) to physicians’decreasing awareness for the disease, especially in patients with mildmanifestations.The number of hospitalisations according to hospital statistics is com-parable with the number of hospitalised cases according to notificationdata when considering the main diagnosis in hospital statistics. Whenalso considering secondary diagnoses, hospital statistics suggest morethan double the number of HA cases compared to notification data (Fig-ure 5.3b). It should be considered that re-admission of the same patientis counted as a new case in Swiss hospital statistics except if readmissionoccurs within 18 days and in the same hospital (personal communication,FSO, 11 July 2017). Still, we believe that the striking difference betweenhospital statistics and notification data is not fully explained by re-ad-missions alone. We also speculate that the observed difference, apartfrom under-notification, could arrive from GPs completing notificationforms before the patient is hospitalised. If the hospital physician thendoes not complete another notification form (assuming or knowing thatthe case was already reported by the GP), the patient’s hospitalisationis not captured by the NNSID. The same probably applies to mortalitydata.
System changes influence trends in notification dataThe notification form is provided by and submitted to the FOPH. Thenotification form was changed several times between 1988 and 2016, aswere case definitions, classifications and data entry procedures. All thesechanges are difficult to document post-hoc for the purpose of this studyand to separate from each other; they make interpretation of long-termtrends difficult. In the following we discuss such issues using examplesfrom Swiss HA notification given that these experiences likely also applyfor other diseases and surveillance systems.Introducing a new variable on the notification form is a change whichis relatively easy to track as it leads to a rather abrupt change in thedata. The location of exposure to HAV could be recorded as “abroad”before 1999 and as “abroad” and/or “in Switzerland” thereafter. In thenotification data, this is reflected in a sudden increase in the proportionof cases exposed in Switzerland and a parallel drop in the “unknown ornot specified” category.
93

5 Hepatitis A: 29 years of surveillance and contemporary challenges
Similarly, the “reason for hospitalisation” and “complications” were in-cluded on the form probably only since 2006 (notification forms for 2002–2005 were not available to check). Such changes can potentially be no-ticed even if old notification forms are not available, but their impact isdifficult to quantify. In contrast, more subtle changes, e.g. in wordingcan also influence answers given, but might not be easily recognisablein the absence of actual notification forms or stringent documentationof changes on the reporting forms. For example, main features of HA(increased transaminases and jaundice), were recorded from 1988 until2016. Nevertheless, changes occurred repeatedly: from 1988–1990, theywere listed under the heading “clinic”. From 1991–1998, they were lis-ted under the heading “reason for laboratory test” while since 1999 theyare part of the section on “manifestation”. Also, in 1999 the wordingchanged from “increased transaminases” to “transaminase(s) ≥2.5× ↑”.While asking for symptoms under the headings “clinic” and “manifest-ation” are likely to result in the same responses, the heading “reasonfor laboratory test” might not: a symptom might be present but not beconsidered the reason for laboratory testing and hence, not checked onthe form.Another, potentially important, change: up until 1998, all cases of viralhepatitis were captured using the same notification form entitled “Viralhepatitis”. Only since 1999, separate notification forms exist for hep-atitis A, B, and C (other types of viral hepatitis are not reportable asper 2017). At the same time, the notification form was revised substan-tially. Revisions of notification forms are complex processes involving anumber of people and perspectives; we exemplify the Swiss experience:the expert analysing the notification data for a given disease tries to getthe most relevant information needed for appropriate interpretation ofthe epidemiology. Managers of the overall notification system (includingdata entry and management), and hence, with a view on all notifiablediseases, try to avoid long notification forms, frequent changes and het-erogeneous forms – e.g. once asking for nationality, once for country oforigin, and once for country of birth. Furthermore, information shouldnot be too difficult to obtain/know by laboratory personnel or physi-cians (those requested to complete the forms), otherwise compliance willbe low. Finally, the legal department will critically review the formsaiming at reducing the personal information obtained to the essentialsfor fulfilling the mandate of the FOPH for early detection, monitoring,prevention and containment of communicable diseases.In summary, changes in notification forms and procedures may be neededat times, but should be kept to a minimum in order to allow analysis
94

Published article
and interpretation of long-term trends. This in turn is only possible ifchanges made are meticulously documented.
System-inherent limitationsPatients’ information is provided by physicians in charge of HA patients.However, it is not known how complete and systematically they assesse.g. exposure history. Assessing exposure risks in a systematic fashionis likely not a priority of physicians given that the source of infectiondoes not matter for treatment. This is reflected in the high proportionof cases (>50%) for which exposure risk is indicated as “unknown” ornot specified at all. We hypothesise that “traditional” (well-known) riskfactors are often overestimated compared to less known risk exposuresin surveillance systems. This could also be a reason for the observed in-crease in “contaminated food and/or water” mentioned as risk exposure:in the absence of “specific” risk factors such as IDU and travel, phys-icians may be choice-biased being tempted to indicate “contaminatedfood and/or water” instead of ticking “unknown” or not indicating anyrisk factor(s).Probably almost every person has consumed a food item which couldhave been contaminated with HAV during the relevant time window of15–50 days before symptom onset. At the same time, reports of food-borne outbreaks of HA – recently frequently associated with fresh andfrozen berries and fruits [56-61] – could also have increased awarenessthat HAV can be transmitted through contaminated food. The ratherlong incubation period, together with a wide range, and more or lessnon-specific or ubiquitous risk exposures could also explain the highproportion of unknown or unspecified exposure risks. Suspected sourcesof infection are usually not followed-up, unless there is evidence of anoutbreak. Therefore, location of exposure remains speculative as long asno mandated research studies are conducted.Furthermore, the surveillance system is likely to capture mainly severeand/or “typical” cases as these are most likely to undergo laboratorytesting. Gastroenteritis patients reporting recent travel were found tohave a 3.6 times increased odds for stool testing compared to patientsnot reporting travel in the 7 days preceding symptom onset [62]. Simil-arly, we suspect that travel-related HA cases (or patients with a historyof recent travel) are more likely to be captured by the NNSID. This maynot compromise validity of the surveillance system, but should be bornin mind when interpreting surveillance data.In contrast, we have anecdotal evidence from notification forms that
95

5 Hepatitis A: 29 years of surveillance and contemporary challenges
physicians suspect transmission from a (symptomatic or asymptomatic)contact person who had been travelling recently, but the patient him" /herself (the suspected secondary case) stayed in Switzerland. These HAcases would no longer be considered an imported/travel-related case asthe reported patient did not travel and was indeed exposed in Switzer-land. Hence, the distinction between imported and autochthonous casesmight be flawed.Similarly, the importance of migrants and travellers visiting friends andrelatives (VFR) is difficult to evaluate: on the one hand, those born inhigh-endemicity countries could already be immune and hence, increasepopulation seroprevalence in Switzerland. On the other hand, youngchildren having visited their home country (or the home country of theirparents) could be asymptomatically infected and spread the disease onceback in Switzerland. Generally it is known that VFR are at increasedrisk of infectious diseases during travel [63-65], they are less likely toseek pre-travel health advice [65-67] and are less adherent to pre-travelhealth advice [68,69].Furthermore, it is not known how often contact persons of HA cases aretested and how this may influence notification data. Testing may beconsidered unnecessary for both, secondary cases showing clear and typ-ical signs and symptoms, and (potential) secondary cases not showingany signs and symptoms of HAV infection.
ConclusionsHepatitis A incidence is declining globally including in Switzerland, apartfrom outbreaks (such as the recent European outbreak among MSM).Case numbers have been low in recent years. However, considering thatthe population is becoming increasingly susceptible to HAV infectionand hence, the probability of outbreaks is increasing, it is important tostrengthen surveillance and prevention efforts as shown by the recentoutbreak among MSM in Europe.Current Swiss notification data on HAV do not allow reliably identifyingexisting (IDU, MSM, travellers) and potential new risk groups as in-formation on exposure to HAV available to and provided by physiciansis limited and case numbers are low. Patient information on exposure isoften poorly filled in on the notification forms. Thus, changes in NNSIDdata or outbreaks need to be followed up with indepth investigations tounderstand contemporary transmission patterns.Thorough understanding of physicians’ approaches to diagnose a patientwith HAV infection, changes in notification forms, case definition, case
96

Published article
classification, and data entry is required for correct interpretation of no-tification data. Additionally, research studies are needed to complementinformation from routine surveillance to answer specific questions such asestimating levels of under-ascertainment, under-diagnosis and under-no-tification, or evaluating best practices to collect data on exposure. Suchcomplementary information is especially important for interpretation oflong-term trends of hepatitis A in particular and of highly dynamic dis-eases and surveillance systems in general.
Authors’ contributionsDM, CS and MJ conceptualised the study. MJ extracted the data. CSdeveloped and carried out the statistical analysis. CS, DM and MJinterpreted the results. CS wrote the first draft of the manuscript. DMand MJ contributed to the writing and revision of the manuscript. Allauthors approved the final version.
FundingThis study was funded by the Federal Office of Public Health, Bern,Switzerland (contract no. 16.015253).
Conflict of interestMJ is working at the Federal Office of Public Health and contributedto this project/article in her capacity as public health specialist and herfunction as scientific collaborator within the organisation.
AcknowledgmentsThe authors gratefully acknowledge the background information andinputs provided to an earlier version of this manuscript of ChristianSchätti Zundel and Mirjam Mäusezahl-Feuz (both Federal Office of Pub-lic Health), Philip Tarr (Cantonal Hospital Baselland) and AndreasNeumayr (Swiss Tropical and Public Health Institute). Furthermore,we thank Christoph Junker and Stéphanie Riat-Schaffner (both FederalStatistical Office) for providing data and information on Swiss hospitaland mortality statistics.
97

5 Hepatitis A: 29 years of surveillance and contemporary challenges
References1. WHO position paper on hepatitis A vaccines – June 2012. Wkly Epi-
demiol Rec 2012;28/29:261–276.2. European Centre for Disease Prevention and Control. Hepatitis A
virus in the EU/EEA, 1975–2014. Stockholm: ECDC; 2016 Avail-able from: http://ecdc.europa.eu/en/publications/Publications/hepatitis-a-virus-EU-EEA-1975-2014.pdf, Accessed date: 21 April2017.
3. Gossner CM, Severi E, Danielsson N, Hutin Y, Coulombier D. Changinghepatitis A epidemiology in the European Union: new challenges andopportunities. Euro Surveill 2015;16. https://doi.org/10.2807/1560-7917.ES2015.20.16.21101. pii=21101.
4. Jacobsen KH, Wiersma ST. Hepatitis A virus seroprevalence by ageand world region, 1990 and 2005. Vaccine 2010;41:6653–6657. https://doi.org/10.1016/j.vaccine.2010.08.037.
5. Carrillo-Santisteve P, Tavoschi L, Severi E, Bonfigli S, Edelstein M,Bystrom E, et al. Seroprevalence and susceptibility to hepatitis A inthe European union and European Economic area: a systematic review.Lancet Infect Dis 2017;10:e306–e319. https://doi.org/10.1016/S1473-3099(17)30392-4.
6. Spradling PR. Viral hepatitis. In: Heymann DL, editor. Control of com-municable diseases manual. Washington, DC, USA: American PublicHealth Association; 2015. p. 252–274.
7. Craig AS, Schaffner W. Prevention of hepatitis A with the hepatitis Avaccine. N Engl J Med 2004;5:476–481. https://doi.org/10.1056/NEJMcp031540.
8. Chen CM, Chen SC, Yang HY, Yang ST, Wang CM. Hospitalizationand mortality due to hepatitis A in Taiwan: a 15-year nationwide cohortstudy. J Viral Hepat 2016;11:940–945. https://doi.org/10.1111/jvh.12564.
9. Canuel M, De Serres G, Duval B, Gilca R, De Wals P, Gilca V. Trends ofhepatitis A hospitalization and risk factors in Quebec, Canada, between1990 and 2003. BMC Infect Dis 2007:31. https://doi.org/10.1186/1471-2334-7-31.
10. Global Burden of Disease Study 2013 Mortality and Causes of DeathCollaborators. Global, regional, and national age-sex specific all-causeand cause-specific mortality for 240 causes of death, 1990–2013: a sys-tematic analysis for the Global Burden of Disease Study 2013. Lan-cet 2015;9963:117–171. https://doi.org/10.1016/S0140-6736(14)61682-2.
11. World Health Organization. Technical considerations and casedefinitions to improve surveillance for viral hepatitis. Tech-
98

Published article
nical Report, Geneva: World Health Organization; 2016 Availablefrom: http://appswho.int/iris/bitstream/10665/204501/1/9789241549547_eng.pdf?ua=1, Accessed date: 15 February 2018.
12. Verordnung des EDI vom 01. Dezember 2015 über die Meldungvon Beobachtungen übertragbarer Krankheiten des Menschen (SR818.101.126). Stand am 1. Januar 2018. DHA Ordinance of 1 December2015 on the reporting of observations on human communicable diseases.Status as of 1 January 2018; in German, French and Italian; availablefrom: https://www.admin.ch/opc/de/classified-compilation/20151622/index.html, Accessed date: 5 January 2018.
13. European Centre for Disease Prevention and Control. Annual epidemi-ological report 2016 – Hepatitis A. ECDC: Stockholm; 2016. Availablefrom: https://ecdc.europa.eu/en/publications-data/hepatitis-annualepidemiological-report-2016-2014-data.
14. Bundesamt für Gesundheit, Schweizerische Expertengruppe für viraleHepatitis, Schweizerische Arbeitsgruppe für reisemedizinische Bera-tung, Eidgenössische Kommission für Impffragen. Empfehlungen zurHepatitis-A-Prävention in der Schweiz. Richtlinien und Empfehlungen(ehemals Supplementum IX) [Recommendations for the prevention ofhepatitis A in Switzerland. Guidelines and recommendations (formersupplement IX)]. Bern: Bundesamt für Gesundheit; 2007 Availablefrom: https://www.bag.admin.ch/dam/bag/de/dokumente/mt/i-und-b/richtlinien-empfehlungen/empfehlungen-spezifische-erreger-krankheiten/hepatitis/empfehlungen-hepatitis-a-praevention-ch.pdf.download.pdf/empfehlungen-hepatitis-a-praevention-d.pdf, Accessed date: 7 April 2017.
15. Schweizerische Arbeitsgruppe für virale Hepatitis. SchweizerischeArbeitsgruppe für reisemedizinische Beratung, Bundesamt für Gesund-heitswesen. Empfehlungen zur Hepatitis-A-Prävention. SupplementumIX [Recommendations for the prevention of hepatitis A. SupplementIX]. 1992. Available from: upon request from Swiss [email protected].
16. Bundesamt für Gesundheit. Eidgenössische Kommission für Impffragen.Schweizerischer Impfplan 2005. Supplementum VIII: Ordner “Infekti-onskrankheiten – Diagnose und Bekämpfung” [Swiss vaccination sched-ule 2005. Supplement VIII: folder “Infectious diseases – diagnosis andcontrol”]. 2005. Available from: upon request from Swiss [email protected].
17. Bundesamt für Gesundheit. Eidgenössische Kommission für Impffra-gen. Schweizerischer Impfplan 2017. Richtlinien und Empfehlungen[Swiss vaccination schedule 2017. Guidelines and recommendations].Bern: Bundesamt für Gesundheit; 2017 Available from: https://www.bag.admin.ch/dam/bag/de/dokumente/mt/i-und-b/richtlinien-empfehlungen/allgemeine-empfehlungen/schweizerischer-
99

5 Hepatitis A: 29 years of surveillance and contemporary challenges
impfplan.pdf.download.pdf/schweizerischer-impfplan-de.pdf,Accessed date: 7 April 2017.
18. StataCorp. Stata statistical software: release 13. College Station, TX:StataCorp LP; 2013.
19. Bundesamt für Statistik. STAT-TAB: die interaktive Statistikdaten-bank (BFS-Nummer px-x-0102020000_201) [STAT-TAB: the interact-ive statistical database]. 2016 http://www.pxweb.bfs.admin.ch, Ac-cessed date: 24 August 2017.
20. Mütsch M, Masserey Spicher V, Gut C, Steffen R. Hepatitis A virusinfections in travelers, 1988–2004. Clin Infect Dis 2006;4:490–497. https://doi.org/10.1086/499816.
21. Bundesamt für Gesundheit. Häufung von Hepatitis-A-Fällen in derSchweiz, Stand 29. Mai 2017 [Cluster of hepatitis A cases in Switzer-land, status as per 29 May 2017]. BAG Bulletin 2017:9–10. Availablefrom: https://www.bag.admin.ch/dam/bag/de/dokumente/cc/Kampagnen/Bulletin/2017/BU_27_17.pdf.download.pdf/BU_27_17_DE.pdf[accessed: 18 June 2018].
22. Steffen R, Rickenbach M, Wilhelm U, Helminger A, Schär M. Healthproblems after travel to developing countries. J Infect Dis 1987;1:84–91.
23. Centers for Disease Control. Hepatitis A among drug abusers. MMWRMorb Mortal Wkly Rep 1988;19(5):297–300.
24. Sundkvist T, Smith A, Mahgoub H, Kirkby A, Kent R, Wreghitt T, etal. Outbreak of hepatitis A infection among intravenous drug users inSuffolk and suspected risk factors. Comm Dis Publ Health 2003;2:101–105.
25. Richard JL, Schaetti C, Basler S, Masserey Spicher V. Reduction ofacute hepatitis B through vaccination of adolescents with no decreasein chronic hepatitis B due to immigration in a low endemicity country.Swiss Med Wkly 2017. https://doi.org/10.4414/smw.2017.14409.w14409.
26. Dubois-Arber F, Balthasar H, Huissoud T, Zobel F, Arnaud S, SamitcaS, et al. Trends in drug consumption and risk of transmission of HIV andhepatitis C virus among injecting drug users in Switzerland, 1993–2006.Euro Surveill 2008;21. https://doi.org/10.2807/ese.13.21.18881-en. pii=18881.
27. Dickson-Spillmann M, Haug S, Uchtenhagen A, Bruggmann P, SchaubMP. Rates of HIV and hepatitis infections in clients entering heroin-assisted treatment between 2003 and 2013 and risk factors for hepatitisC infection. Eur Addiction Res 2016;4:181–191. https://doi.org/10.1159/000441973.
28. Ferson MJ, Young LC, Stokes ML. Changing epidemiology of hepatitisA in the 1990s in Sydney, Australia. Epidemiol Infect 1998;3:631–636.
100

Published article
29. Freeman E, Torvaldsen S, Tobin S, Lawrence G, MacIntyre CR. Trendsand risk factors for hepatitis A in NSW, 2000–2009: the trouble withtravel. NSW Public Health Bull 2012;7–8:153–157. https://doi.org/10.1071/NB11036.
30. Tosti ME, Spada E, Romano L, Zanetti A, Mele A, on behalf of theSEIEVA collaborating group. Acute hepatitis A in Italy: incidence,risk factors and preventive measures. J Viral Hepat 2008:26–32. https://doi.org/10.1111/j.1365-2893.2008.01025.x.
31. Erhart LM, Ernst KC. The changing epidemiology of hepatitis A inArizona following intensive immunization programs (1988–2007). Vac-cine 2012;42:6103–6110. https://doi.org/10.1016/j.vaccine.2012.07.029.
32. Elliott JH, Kunze M, Torresi J. Hepatitis A vaccine failure. Lancet2002;9321:1948–1949. https://doi.org/10.1016/S0140-6736(02)08764-0.
33. Kurup A, San LM, Yew WS. Acute hepatitis A in a traveler who hadreceived pre-exposure inactivated hepatitis A virus vaccine. Clin InfectDis 1999;6:1324–1325. https://doi.org/10.1086/517784.
34. Parment PA, Emilsson H. Hepatitis A after a single dose of an inactiv-ated hepatitis A vaccine. Scand J Infect Dis 2002;8:634.
35. Junge U, Melching J, Dziuba S. Acute hepatitis A despite regular vaccin-ation against hepatitis A and B. Dtsch Med Wochenschr 2002;30:1581–1583. https://doi.org/10.1055/s-2002-32940.
36. Taliani G, Sbaragli S, Bartoloni A, Santini MG, Tozzi A, ParadisiF. Hepatitis A vaccine failure: how to treat the threat. Vaccine2003;31:4505–4506.
37. Senn N, Genton B. Acute hepatitis A in a young returning traveler fromKenya despite immunization before departure. J Trav Med 2009;1:72–73. https://doi.org/10.1111/j.1708-8305.2008.00276.x.
38. Mor Z, Lurie Y, Katchman E. A case of hepatitis A vaccination failurein an HIV-positive man who had sex with men in Israel. Int J STDAIDS 2012;7:529–530. https://doi.org/10.1258/ijsa.2010.010269.
39. Fritzsche C, Loebermann M, Reisinger EC. A case of acute hepatitisA infection in an HIV-positive patient despite complete hepatitis Avaccination. Infection 2018. https://doi.org/10.1007/s15010-018-1129-1.
40. Márquez Pérez L, García Retortillo M. Acute hepatitis A in a previouslyvaccinated patient. Gastroenterol Hepatol 2015;2:76–78. https://doi.org/10.1016/j.gastrohep.2014.05.003.
41. Bonanni P, Bechini A, Pesavento G, Guadagno R, Santini MG, BarettiS, et al. Primary Hepatitis A vaccination failure is a rare although pos-sible event: results of a retrospective study. Vaccine 2006;35–36:6053–
101

5 Hepatitis A: 29 years of surveillance and contemporary challenges
6057. https://doi.org/10.1016/j.vaccine.2006.05.020.42. Ficko C, Conan PL, Bigaillon C, Duron S, Rapp C. A French soldier
returns from the Central Africa Republic with hepatitis A: vaccinationfailure is possible!. Med Sante Trop 2015;4:363–364. https://doi.org/10.1684/mst.2015.0511.
43. Liu JP, Nikolova D, Fei Y. Immunoglobulins for preventing hepatitis A.Cochrane Database Syst Rev 2009;2:CD004181. https://doi.org/10.1002/14651858.CD004181.pub2.
44. Pedersini R, Marano C, De Moerlooze L, Chen L, Vietri J. HAV &HBV vaccination among travellers participating in the National Healthand Wellness Survey in five European countries. Trav Med Infect Dis2016;3:221–232. https://doi.org/10.1016/j.tmaid.2016.03.008.
45. Rosdahl A, Herzog C, Frösner G, Norén T, Rombo L, Askling HH.An extra priming dose of hepatitis A vaccine to adult patients withrheumatoid arthritis and drug induced immunosuppression – a prospect-ive, open-label, multi-center study. Trav Med Infect Dis 2018:43–50.https://doi.org/10.1016/j.tmaid.2017.12.004.
46. Bundesamt für Gesundheit. Durchimpfung von 2-, 8- und 16-jährigenKindern in der Schweiz, 1999–2016 [Vaccination coverage of 2, 8 and 16year old children in Switzerland, 1999–2016]. 2017. www.bag.admin.ch/durchimpfung, Accessed date: 19 December 2017.
47. Boubaker R, Meige P, Mialet C, Buffat CN, Uwanyiligira M, WidmerF, et al. Travellers’ profile, travel patterns and vaccine practices – a10-year prospective study in a Swiss Travel Clinic. J Trav Med 2016;1.https://doi.org/10.1093/jtm/tav017.
48. Gisler S, Steffen R, Mütsch M. Knowledge, attitudes and prac-tices among travellers to tropical and subtropical countries. Praxis2005;23:967–974. https://doi.org/10.1024/0369-8394.94.23.967.
49. Lociciro S, Bize R. Les comportements face au VIH/Sida des hommesqui ont des rapports sexuels aves des hommes. Enquête Gaysurvey.Lausanne: Institut universitaire de médicine sociale et préventive; 2015;2014 Available from: https://www.iumsp.ch/fr/rds/253, Accesseddate: 15 February 2018.
50. Sigma Research. EMIS-2017: European MSM Internet Survey. 2018.http://sigmaresearch.org.uk/projects/item/project76, Accesseddate: 16 February 2018.
51. European Centre for Disease Prevention and Control. Hepatitis Aoutbreaks in the EU/EEA mostly affecting men who have sex withmen. Rapid Risk Assessment. Stockholm: ECDC; 2016 Availablefrom: http://ecdc.europa.eu/en/publications/Publications/13-12-2016-RRA-Hepatitis%20A-United%20Kingdom.pdf, Accessed date:21 April 2017.
52. Beebeejaun K, Degala S, Balogun K, Simms I, Woodhall SC, Heinsbroek
102

Published article
E, et al. Outbreak of hepatitis A associated with men who have sexwith men (MSM), England, July 2016 to January 2017. Euro Surveill2017;5. https://doi.org/10.2807/1560-7917.ES.2017.22.5.30454.pii=30454.
53. Freidl GS, Sonder GJ, Bovee LP, Friesema IH, van Rijckevorsel GG,Ruijs WL, et al. Hepatitis A outbreak among men who have sex withmen (MSM) predominantly linked with the EuroPride, The Nether-lands, July 2016 to February 2017. Euro Surveill 2017;8. https://doi.org/10.2807/1560-7917.ES.2017.22.8.30468. pii=30468.
54. Werber D, Michaelis K, Hausner M, Sissolak D, Wenzel J, Bitzegeio J,et al. Ongoing outbreaks of hepatitis A among men who have sex withmen (MSM), Berlin, November 2016 to January 2017 – linked to otherGerman cities and European countries. Euro Surveill 2017;5. https://doi.org/10.2807/1560-7917.ES.2017.22.5.30457. pii=30457.
55. Ly KN, Klevens RM. Trends in disease and complications of hepatitisA virus infection in the United States, 1999–2011: a new concern foradults. J Infect Dis 2015;2:176–182. https://doi.org/10.1093/infdis/jiu834.
56. Severi E, Verhoef L, Thornton L, Guzman-Herrador BR, Faber M, Sun-dqvist L, et al. Large and prolonged food-borne multistate hepatitisA outbreak in Europe associated with consumption of frozen berries,2013 to 2014. Euro Surveill 2015;29. https://doi.org/10.2807/1560-7917.ES2015.20.29.21192. pii=21192.
57. Sane J, MacDonald E, Vold L, Gossner C, Severi E, on behalf of theInternational Outbreak Investigation Team. Multistate foodborne hep-atitis A outbreak among European tourists returning from Egypt –need for reinforced vaccination recommendations, November 2012 toApril 2013. Euro Surveill 2015;4. https://doi.org/10.2807/1560-7917.ES2015.20.4.21018. pii=21018.
58. Montaño-Remacha C, Ricotta L, Alfonsi V, Bella A, Tosti M, Ciccagli-one A, et al. Hepatitis A outbreak in Italy, 2013: a matched case-con-trol study. Euro Surveill 2014;37. https://doi.org/10.2807/1560-7917.ES2014.19.37.20906. pii=20906.
59. Collier MG, Khudyakov YE, Selvage D, Adams-Cameron M, Epson E,Cronquist A, et al. Outbreak of hepatitis A in the USA associated withfrozen pomegranate arils imported from Turkey: an epidemiological casestudy. Lancet Infect Dis 2014;10:976–981. https://doi.org/10.1016/S1473-3099(14)70883-7.
60. Fitzgerald M, Thornton L, O’Gorman J, O’Connor L, Garvey P, BolandM, et al. Outbreak of hepatitis A infection associated with the con-sumption of frozen berries, Ireland, 2013 – linked to an internationaloutbreak. Euro Surveill 2014;43. https://doi.org/10.2807/1560-7917.ES2014.19.43.20942. pii=20942.
103

5 Hepatitis A: 29 years of surveillance and contemporary challenges
61. Guzman-Herrador B, Jensvoll L, Einoder-Moreno M, Lange H, MykingS, Nygard K, et al. Ongoing hepatitis A outbreak in Europe 2013 to2014: imported berry mix cake suspected to be the source of infectionin Norway. Euro Surveill 2014;15. https://doi.org/10.2807/1560-7917.ES2014.19.15.20775. pii=20775.
62. Schmutz C, Bless PJ, Mäusezahl D, Jost M, Mäusezahl-Feuz M, SwissSentinel Surveillance Network. Acute gastroenteritis in primary care: alongitudinal study in the Swiss sentinel surveillance network, Sentinella.Infection 2017;6:811–824. https://doi.org/10.1007/s15010-017-1049-5.
63. Seale H, Kaur R, Mahimbo A, MacIntyre CR, Zwar N, Smith M, etal. Improving the uptake of pre-travel health advice amongst mi-grant Australians: exploring the attitudes of primary care providersand migrant community groups. BMC Infect Dis 2016;213. https://doi.org/10.1186/s12879-016-1479-1.
64. Heywood AE, Zwar N, Forssman BL, Seale H, Stephens N, Musto J, etal. The contribution of travellers visiting friends and relatives to noti-fied infectious diseases in Australia: state-based enhanced surveillance.Epidemiol Infect 2016;16:3554–3563. https://doi.org/10.1017/S0950268816001734.
65. Boggild AK, Castelli F, Gautret P, Torresi J, von Sonnenburg F,Barnett ED, et al. Vaccine preventable diseases in returned interna-tional travelers: results from the GeoSentinel Surveillance Network.Vaccine 2010;46:7389–7395. https://doi.org/10.1016/j.vaccine.2010.09.009.
66. Fenner L, Weber R, Steffen R, Schlagenhauf P. Imported infectious dis-ease and purpose of travel, Switzerland. Emerg Infect Dis 2007;2:217–222. https://doi.org/10.3201/eid1302.060847.
67. Warne B, Weld LH, Cramer JP, Field VK, Grobusch MP, Caumes E, etal. Travel-related infection in European travelers, EuroTravNet 2011.J Trav Med 2014;4:248–254. https://doi.org/10.1111/jtm.12120.
68. LaRocque RC, Deshpande BR, Rao SR, Brunette GW, Sotir MJ, JentesES, et al. Pre-travel health care of immigrants returning home to visitfriends and relatives. Am J Trop Med Hyg 2013;2:376–380. https://doi.org/10.4269/ajtmh.2012.12-0460.
69. Rowe K, Chaves N, Leder K. Challenges to providing pre-travel care fortravellers visiting friends and relatives: an audit of a specialist travelmedicine clinic. J Trav Med 2017;5. https://doi.org/10.1093/jtm/tax038.
70. Commission implementing decision of 8 August 2012 amendingDecision 2002/253/EC laying down case definitions for reportingcommunicable diseases to the Community network under DecisionNo 2119/98/EC of the European Parliament and of the Coun-
104

Published article
cil. Brussels: European Commission. 2012/506/EU; 2012 Availablefrom: http://eur-lex.europa.eu/legal-content/EN/TXT/PDF/?uri=CELEX:32012D0506&qid=1428573336660&from=EN#page=10, Accesseddate: 21 April 2017.
71. World Health Organization. International travel and health. Situationas on 1 January 2012. Geneva: WHO; 2012 Available from: http://who.int/ith/ITH_EN_2012_WEB_1.2.pdf?ua=1, Accessed date: 21 June2017.
105


6 Time trends of positivity rates fromfoodborne pathogen testing inSwitzerland, 2003 to 2012
Philipp Justus Bless1, 2, Claudia Schmutz1, 2, KathrinSartori1, 2, Daniel Mäusezahl1, 2
1 Swiss Tropical and Public Health Institute, Basel, Switzerland2 University of Basel, Basel, Switzerland
This article was published in:
Swiss Medical Weekly (2017), 147:w14569.doi: 10.4414/smw.2017.14569This article is published under the copyright license “Attribution – Non-Com-mercial – No Derivatives 4.0”. No commercial reuse without permission. Seehttp://emh.ch/en/services/permissions.html.
107


Published article
SummaryBACKGROUND: Campylobacteriosis and salmonellosis are importantfoodborne diseases in Europe, including in Switzerland. In 2014, noti-fication rates for Switzerland were 92.9 per 100’000 population for cam-pylobacteriosis and 15.2 per 100’000 population for salmonellosis. Thesenotification rates originate from laboratory-based surveillance wherebypositive test results are reported to the National Notification System forInfectious Diseases. Consequently, notification rates do not directly cor-respond to the disease burden among the population as the number ofpositive tests depends on patients’ healthcare-seeking behaviour, stoolsampling rates and other factors.METHODS: We assessed laboratory positivity rates (proportion of pos-itive tests among all tests performed) of diagnostic tests for Campylobac-ter and Salmonella from five private laboratories in Switzerland between2003 and 2012. We analysed demographic characteristics, temporal andspatial distribution of test numbers and positivity rates. Predictors fora positive test and disease seasonality were assessed with logistic regres-sion analyses.RESULTS: A total of 135’122 (13’095 positive) Campylobacter tests and136’997 (2’832 positive) Salmonella tests were obtained with positivetests corresponding to 20.4% and 17.2% of notified campylobacteriosisand salmonellosis cases, respectively. The number of tests conductedannually increased for both pathogens by 51% from 2003 to 2012. An-nual positivity rates of Campylobacter increased from 7.6 to 11.1% andrates of Salmonella decreased from 2.7 to 1.5%. The largest increases inannual Campylobacter positivity rates were observed for patients olderthan 85 years (+193.7%), followed by children aged 5–9 years (+131.9%).Positivity rates and test numbers for both diseases by month or calen-dar week showed a distinct seasonality, with peak rates for Salmonellaoccurring in autumn and for Campylobacter in summer and at the turnof the year. These findings were independent of patients’ age and sex.CONCLUSIONS: Both positivity rates and notification rates showed in-creasing trends for Campylobacter and decreasing trends for Salmonella,suggesting that these trends reflect changes in disease epidemiology atpopulation level. The continuous assessment of positivity rates remainsimportant to appropriately interpret changes observed in the notificationsystem especially considering the increasing use of multiplex polymerasechain reaction test panels where multiple pathogens are tested simultan-eously.
109

6 Positivity rates from foodborne pathogen testing, 2003–2012
IntroductionHuman campylobacteriosis and salmonellosis are the most frequently re-ported foodborne bacterial infections in Europe. In 2014, notificationrates in the European Union (EU) were 71.0 cases per 100’000 popula-tion (corresponding to approximately 236’900 cases) for campylobacteri-osis and 23.4 cases per 100’000 population (approximately 88’700 cases)for salmonellosis [1]. In the same year, in Switzerland, the notificationrate for Campylobacter infections was 92.9 cases per 100’000 popula-tion (approximately 7’600 cases) and 15.2 cases per 100’000 population(approximately 1’200 cases) for Salmonella infections [1]. During themid-1990s, the annual number of notified human Campylobacter infec-tions surpassed that of Salmonella infections in Switzerland [2]. This wasowing to a reduction of human salmonellosis following the introductionof control measures in the egg and poultry industry, such as mandatoryscreening of layer hens, in the early 1990s [2]. So far, similar controlmeasures for Campylobacter are lacking and campylobacteriosis is cur-rently the most frequently notified foodborne disease in Switzerland [2].In Switzerland, notifiable diseases are monitored by the Federal Officeof Public Health (FOPH) through the National Notification System forInfectious Diseases (NNSID) [3, 4]. Laboratory-based surveillance ofCampylobacter and Salmonella infections, as defined by the EpidemicsAct of 1970 and its related ordinances, captured only those cases thattested positive [5-7]. Since the implementation of the new EpidemicsAct at the beginning of 2016, the total number of tests conducted forthese two pathogens, including the number of positive results, must bereported annually as aggregated numbers, stratified by month and testmethod [4, 8]. Hence, denominator data to help draw inferences fromsurveillance data about the epidemiological situation in the communityhave not been collected so far. The number of stool tests performeddepends on the healthcare-seeking behaviour of patients with diarrhoeaand the stool sampling rate of treating physicians [9-11]. As not all in-dividuals affected by acute gastroenteritis seek medical care or have astool sample examined for enteric pathogens, there are likely to be manyundetected (at community level) and unreported (at healthcare level)campylobacteriosis and salmonellosis cases [12, 13]. Hence, changes innotification rates do not necessarily reflect an epidemiological trend, butcould be attributable to changes in healthcare-seeking behaviour or stoolsampling rates. A more informed interpretation of surveillance data ismade possible by calculating positivity rates (proportion of positive testsamong all tests performed). Because positivity rate calculations also
110

Published article
consider denominator data, they adjust for the number of tests [14, 15].We analysed laboratory data for stool tests performed for Campylobac-ter spp. and Salmonella spp. by Swiss diagnostic laboratories over a10-year period to better interpret the trends of campylobacteriosis andsalmonellosis case notifications seen in the NNSID.
Materials and methodsSelection of diagnostic laboratoriesThe study aimed to include private diagnostic laboratories from allgeographical and linguistic regions of Switzerland to reach an optimalrepresentation of the campylobacteriosis cases reported to the NNSIDbetween 2003 and 2012. Eleven private diagnostic laboratories, each re-porting more than 1’000 campylobacteriosis cases during that decade,were contacted and invited to provide data for the study. The case-based laboratory data requested comprised patients’ demographic char-acteristics (sex, age, canton of residence, personal identification codeassigned by laboratory) and test characteristics (pathogen tested, testresult, date of test, test method) on all Campylobacter and Salmonellatests performed between 2003 and 2012.
Analysis of positivity ratesDatasets from individual laboratories were transformed uniformly,merged and analysed with STATATM Version 13.1 (Stata Corporation;College Station, TX, USA). Firstly, double entries, repeated tests andtests for patients without Swiss residency were excluded. The followingrules – based on disease durations and durations of organism excretion[16] – were applied to identify and exclude repeated tests: (i) control orfollow-up tests, irrespective of result, following a positive result within42 days for both, Campylobacter and Salmonella; (ii) negative tests fol-lowing a negative result within 10 days (Campylobacter) or 21 days (Sal-monella); and (iii) negative tests followed by a positive result within 10days (Campylobacter) or 21 days (Salmonella). The patient populationwas characterised by sex, age, diagnostic laboratory, test year and res-idence by greater region (corresponding to the Nomenclature of Unitsfor Territorial Statistics (NUTS) 2 level [17]). Age groups for statist-ical analyses were predefined. Residence by greater region was basedon the patients’ canton of residence (NUTS 3 level). Descriptive ana-lysis of positivity rates – defined as positive tests divided by total tests
111

6 Positivity rates from foodborne pathogen testing, 2003–2012
performed – and exploratory logistic regression analyses of predictorsfor and seasonality of positive tests were performed. Characteristics oflaboratory-confirmed cases of campylobacteriosis and salmonellosis wereadditionally compared with national surveillance data. Time trends ofannual positivity rates were investigated using stratification and directstandardisation for age groups and sex. Thus, the population of indi-viduals tested from 2003 to 2012 was used as the reference population.The seasonality of monthly and weekly positivity rates was assessed bycalculating positivity rates from laboratory data from the whole obser-vation period pooled by month or calendar week.
Univariable and multivariable regression modelsIn a first step, univariable logistic regression analyses were performed toestimate the effect of sex, age group, laboratory, residence by greater re-gion, test week, test month and test year on the test result. Afterwards,a multivariable logistic regression model estimated the unconfounded ef-fects of sex, age groups, laboratories, residence by greater region and testyear on the test result. The effect of seasonal within-year variations ontest outcome were investigated with a second multivariable logistic re-gression model including test month and adjustments for sex, age groups,laboratories, residence by greater region and test year. For this model,the test month with a positivity rate closest to the mean positivity rateof all test months was used as a baseline and test year was introducedas a random effect. The significance of variables in the multivariablemodels was assessed by likelihood ratio tests and the category of eachvariable with the most observations (except for test month) was usedas a baseline to make the model more robust. Patients with missinginformation on the canton of residence were assigned the greater regionof their corresponding laboratory.
Ethics statementThe study was approved by the local ethical committee “Ethikkommis-sion Nordwest- und Zentralschweiz” [Ethical committee of Northwesternand Central Switzerland] (No.: EKNZ:2014–164).
112

Published article
ResultsExclusion of test results and representativenessEight laboratories agreed to participate in the study and five of themprovided complete data for Campylobacter and Salmonella tests per-formed as requested. The eight laboratories conducted a total of 196’307Campylobacter tests (17’694 positive) and 199’062 Salmonella tests(4’163 positive) between 2003 and 2012. Excluding data from the threelaboratories with incomplete data led to the exclusion of 43’530 (3’345positive) Campylobacter tests and 45’114 (640 positive) Salmonella tests.Among the remaining laboratories (A to E), removal of double entries,repeated tests and tests of non-Swiss residents led to the exclusion ofa further 17’211 (1’245 positive) Campylobacter tests and 16’499 (689positive) Salmonella tests. Additionally, we excluded 444 (9 positive)Campylobacter tests and 452 (2 positive) Salmonella tests because ofmissing information on sex and/or age. In the detailed analysis, 135’122(13’095 positive) Campylobacter tests and 136’997 (2’832 positive) Sal-monella tests were included. Culture-based test methods accounted for98.7% of all Campylobacter and Salmonella tests conducted, and poly-merase chain reaction (PCR) tests accounted for 1.3%. Positive testsincluded in the analysis corresponded to 20.4% and 17.2% of campylo-bacteriosis and salmonellosis cases, respectively, registered in the NNSIDbetween 2003 and 2012 (Tables 6.1 and 6.2).
Characteristics of the patient population and overview oftests performedThe annual number of tests performed increased by 51.1% from 2003 to2012 (11’674 to 17’641 tests) for Campylobacter and by 50.7% (11’842 to17’842 tests) for Salmonella (Figure 6.1). For both diseases, annual testnumbers decreased by at least 6% for the age groups <5 years and 5–9years, and increased by at least 31% in the older age groups. The medianage of patients tested for Campylobacter was 42 years (range: <1–108years) and 41 years (range: <1–108 years) for Salmonella. Patients’age differed significantly between laboratories and test years for bothpathogens (Kruskal-Wallis test: p<0.01 for all four tests). Slightly moretests were conducted among females than among males for Campylobac-ter (54.8%) and for Salmonella (54.3%). The sex ratio differed betweenlaboratories and test years for both pathogens (chi-square test: p<0.01for all four tests). The patients’ residence by greater region was asso-
113

6Positivity
ratesfrom
foodbornepathogen
testing,2003–2012Table 6.1: Comparison of campylobacteriosis cases from laboratory data with cases registered in the National NotificationSystem for Infectious Diseases by test year, Switzerland, 2003–2012
2003 2004 2005 2006 2007 2008 2009 2010 2011 2012Proportion of NNSID cases reportedby study laboratories in %
16.7 16.7 17.6 20.4 21.8 21.1 21.4 21.0 21.1 23.0
Proportion of NNSID cases bygreater region reported by studylaboratories in %Lake Geneva 1.5 2.5 2.0 3.5 3.0 3.0 4.0 4.0 3.5 4.0Espace Mittelland 17.0 17.0 18.5 26.0 27.0 27.0 28.5 29.0 28.0 28.5Northwestern Switzerland 26.0 22.5 23.0 25.0 27.5 26.0 27.0 25.0 27.0 33.0Zurich 24.0 27.0 28.0 29.0 29.5 29.0 23.0 28.0 25.0 26.5Eastern Switzerland 15.0 18.0 18.0 16.5 18.5 20.5 22.0 19.5 23.0 24.0Central Switzerland 8.0 7.5 8.5 6.5 7.0 6.5 6.0 7.0 6.5 8.0Ticino 45.5 47.0 44.0 63.0 69.5 54.5 60.0 52.5 57.0 58.0
Proportion of males in %Laboratories 56.6 55.4 53.5 57.7 55.2 53.7 55.8 53.0 54.6 54.9NNSID 55.4 54.8 54.8 55.0 53.5 53.5 53.6 53.8 53.7 54.0
Median age in yearsLaboratories 34 34 34 35 35 36 37 37 39 36NNSID 32 33 34 34 35 35 35 37 36 36
114

Published
article
Table 6.2: Comparison of salmonellosis cases from laboratory data with cases registered in the National NotificationSystem for Infectious Diseases by test year, Switzerland, 2003–2012
2003 2004 2005 2006 2007 2008 2009 2010 2011 2012Proportion of NNSID cases reportedby study laboratories in %
15.6 15.9 15.7 16.7 17.7 16.4 17.4 19.0 21.0 19.8
Proportion of NNSID cases bygreater region reported by studylaboratories in %Lake Geneva 0.5 2.5 2.0 3.0 4.5 4.0 2.0 1.0 3.0 1.0Espace Mittelland 14.5 18.0 14.0 19.0 19.5 19.0 18.5 20.5 28.5 21.0Northwestern Switzerland 20.0 21.0 21.0 24.0 22.5 17.5 23.0 23.0 19.0 29.5Zurich 19.0 17.5 18.0 22.0 23.5 21.5 23.0 25.0 14.0 24.5Eastern Switzerland 9.5 11.0 16.5 12.5 14.5 14.0 17.0 23.0 19.5 18.5Central Switzerland 6.0 6.5 3.5 7.5 3.5 4.5 4.5 12.0 3.0 10.5Ticino 49.5 51.0 43.5 48.5 46.0 49.5 45.0 47.0 72.5 48.5
Proportion of males in %Laboratories 53.2 53.4 56.0 58.8 57.1 55.0 57.9 52.3 49.6 52.2NNSID 52.1 49.6 53.1 56.2 54.3 51.4 53.0 52.4 51.2 52.5
Median age in yearsLaboratories 18 23 23 25 30 28 29 25 24 25NNSID 25 25 26 25 27 28 27 27 28 26
115

6 Positivity rates from foodborne pathogen testing, 2003–2012
ciated with the geographical location of the laboratory that performedthe test.
Annual positivity rates overall and by laboratoryAnnual Campylobacter positivity rates standardised for age and sex in-creased by 46.1% from 2003 (7.6%) to 2012 (11.1%) (Figure 6.2). Annualstandardised Salmonella positivity rates showed an inverse trend anddecreased by 44.4% from 2003 (2.7%) to 2012 (1.5%). Campylobacterpositivity rates stratified by laboratory (and standardised for age andsex) showed similar annual trends (Supplementary figure S1). The an-nual positivity rates of laboratory C were remarkably lower throughoutthe investigated period compared with other laboratories. Laboratory-specific Campylobacter positivity rates ranged from 3.8 to 9.4% in 2003and continuously increased to 7.0–13.2% in 2012. For Salmonella, annualpositivity rates by laboratory differed only slightly between laboratories;the highest rates were observed for laboratory C, with two distinct peaksin 2007 and 2011. Overall, a decreasing trend was observed; positivityrates dropped from 2.1–3.8% in 2003 to 1.2–2.7% in 2012.
Annual positivity rates by sex and age groupsThe annual Campylobacter positivity rates for males and females in-creased by 43.6% (from 9.4 to 13.5%) and by 45.2% (from 6.2 to 9.0%),respectively, from 2003 to 2012. In the same decade, annual Campylobac-ter positivity rates by age group increased for all age groups. The largestincrease was observed for the age group ≥85 years (193.7%) followed bythe 5–9-year-olds (131.9%). Compared with 2003, annual Campylobacterpositivity rates of sex-specific age groups were higher in 2012, except forfemales in the age group 10–14 years (Figure 6.3a). Annual Campylobac-ter positivity rates were generally higher for males than for females overthe entire observation period. For males and females in the age groups<5 years, 5–9 years and ≥85 years, similar annual Campylobacter posit-ivity rates were observed at the beginning of the decade but rates werelater slightly higher for males in the age group ≥85 years and for femalesin the age groups <5 years and 5–9 years.Annual Salmonella positivity rates decreased from 3.3% to 1.6% (-51.5%)for males and from 2.5% to 1.2% (-52.0%) for females between 2003 and2012. Annual positivity rates decreased for all age groups between 2003and 2012 except for the age group 20–24 years, for which the rate re-mained rather stable. The largest relative decrease of positivity rates
116

Published article
Figure 6.1: Number of stool tests for Campylobacter (a) and Salmonella (b)by sex in five diagnostic laboratories, Switzerland, 2003–2012.
117

6Positivity
ratesfrom
foodbornepathogen
testing,2003–2012
Figure 6.2: National Notification System for Infectious Diseases (NNSID) notification rates and positivity rates (stand-ardised for age and sex) of Campylobacter and Salmonella, Switzerland, 2003–2012. NNSID data provided by the FederalOffice of Public Health, Bern, Switzerland
118

Published article
was observed for the age groups 10–14 years and ≥85 years, where ratesdecreased from 10.5 to 3.7% (-64.8%) and from 0.8 to 0.2% (-75.0%),respectively. Sex-specific Salmonella positivity rates were similar orslightly higher for males compared to females in all age groups althoughfor some age groups, positivity rates varied strongly between years (Fig-ure 6.3b).
Seasonal trends in stool sampling and positivity ratesThe number of tests performed for Campylobacter and Salmonella star-ted to increase in spring (Figure 6.4 panels a and c, figure 6.5 panels aand c). Test numbers peaked in late August (calendar week 34) after abrief and strong temporary decline at the beginning of the month (cal-endar week 31). Afterwards, the number of tests decreased until the endof the year. Monthly test numbers were lowest in February for Cam-pylobacter and Salmonella, even though calendar week 1 was the weekwith the fewest tests performed.After a continuous increase during spring, monthly Campylobacter posit-ivity rates peaked during summer months, with the highest monthly rateoccurring in July (13.8%) (Figure 6.4 panels b and d). Likewise, monthlySalmonella positivity rates started increasing during the spring. Theypeaked twice, first in late summer (August) and then in the autumn,with the highest rate occurring in October (3.1%) (Figure 6.5 panels band d). The highest weekly positivity rate for Campylobacter (17.3%)was in calendar week 1 (January), whereas the peak of weekly Salmonellapositivity rates (3.5%) was in calendar week 43 (October). The lowestmonthly positivity rates for Campylobacter and Salmonella were in Feb-ruary (5.3%) and March (1.1%), respectively. The seasonal trends ofCampylobacter and Salmonella positivity rates were also observable forsex- and age-specific positivity rates although less pronounced in certaingroups.
Regression analysesIn the univariable regression analyses, sex, age, laboratory, residence bygreater region, test week, test month and test year all had a significanteffect on the test result for both diseases. The multivariable regressionanalysis of predictors for a positive Campylobacter test showed higherodds of a positive test for males than for females (odds ratio [OR] 1.53,95% confidence interval [CI] 1.47–1.59) (Supplementary table S1, ap-pendix 1). Patients in the age groups 15–19 years and 20–24 years had
119

6 Positivity rates from foodborne pathogen testing, 2003–2012
Figure 6.3: Annual positivity rates of Campylobacter (a) and Salmonella (b)by age group and sex, Switzerland, 2003–2012
120

Published
article
Figure 6.4: Seasonality of Campylobacter tests and positivity rates (pooled over study period) per month and calendarweek, Switzerland, 2003–2012.
121

6Positivity
ratesfrom
foodbornepathogen
testing,2003–2012
Figure 6.5: Seasonality of Salmonella tests and positivity rates (pooled over study period) per month and calendar week,Switzerland, 2003–2012.
122

Published article
higher odds for a positive test outcome compared with the age group25–44 years, whereas patients of other age groups had reduced odds.The patients’ place of residence by greater region had similar odds for apositive test, except for patients from the Ticino region (OR 0.44, 95%CI 0.38–0.52). From 2003 to 2008, the odds increased continuously anddecreased slightly between 2009 and 2011 compared with 2012.The regression model for seasonal within-year variations showed that theodds for a positive Campylobacter test was highest in July (OR 1.52,95% CI 1.40–1.65) and lowest in February (OR 0.55, 95% CI 0.49–0.61)compared with May, which had a positivity rate closest to the monthlyaverage (Supplementary table S2). Significantly higher odds were alsoobserved for June (OR 1.38, 95% CI 1.26–1.50) and August (OR 1.24,95% CI 1.14–1.35) compared with May.In the multivariable regression model for Salmonella, males had higherodds (OR 1.30, 95% CI 1.21–1.40) of a positive test than females (Sup-plementary table S3). The odds of a positive test outcome increasedthreefold for the age groups <5 years, 5–9 years and 10–14 years com-pared with the age group 25–44 years. Greater region was no longersignificantly associated with the outcome in the multivariable regressionmodel. The odds of a positive test outcome steadily decreased during thestudy period compared with 2012. In the second multivariable model forseasonality, the highest odds of a positive Salmonella test were observedin October (OR 1.61, 95% CI 1.36–1.90) and August (OR 1.44, 95%CI 1.23–1.70) compared with November (Supplementary table S4). Thelowest odds (compared with November) were observed in March (OR0.55, 95% C: 0.44–0.68) and February (OR 0.57, 95% CI 0.46–0.72).
DiscussionAnnual Campylobacter positivity rates standardised for age and sex in-creased from 2003 to 2012, whereas standardised Salmonella positivityrates decreased. During the same time period, campylobacteriosis no-tification rates increased from 72.7 to 105.5 notifications per 100’000population, whereas salmonellosis notification rates decreased from 29.8to 15.4 per 100’000 population. Campylobacter positivity rates weregenerally higher for males than females in all age groups. Monthly andweekly Campylobacter positivity rates showed a distinct seasonality, witha peak during the summer months and again at the beginning of the year,which was independent of sex and age group. Salmonella positivity ratesshowed a similar seasonality, but peaked in autumn. Annual Salmonella
123

6 Positivity rates from foodborne pathogen testing, 2003–2012
positivity rates were similar or slightly higher for males than for females,with the highest rates observed in the younger age groups, <5, 5–9 and10–14 years. The observed seasonality and annual trends of positivityrates for both pathogens are congruent with reports from other countries[14, 18].
Annual positivity rates in relation to NNSID notificationratesAnnual positivity rates of Campylobacter and Salmonella standardisedfor age and sex and annual NNSID notification rates showed similartrends. Multiple testing, data duplication or simultaneous testing ofseveral pathogens could potentially affect both numerator and denom-inator data in different ways. However, similar trends were observedfor the standardised annual positivity rates presented here and for thecrude, non-standardised positivity rates calculated from raw data fromall eight laboratories included in the study (Supplementary figure S2,appendix 1).The stool test data analysed for this study originated mainly fromculture-based test methods, which used to be the standard diagnosticmethod for detecting Campylobacter and Salmonella. Campylobacter ,Salmonella and Shigella are often tested simultaneously [19]. In termsof relative frequency, more positive Salmonella tests (18.9%) than posit-ive Campylobacter tests (8.4%) were excluded, whereas the proportion ofexcluded duplicate and repeated tests was similar for negative Campylob-acter and Salmonella tests (11.2 vs. 10.2%). The proportion of negativeSalmonella tests excluded dropped only slightly from 10.2 to 9.4% whenthe same time span used for excluding negative Campylobacter tests wasapplied. Hence, only laboratory-confirmed campylobacteriosis and sal-monellosis patients differ with regard to repeated testing. In summary,reducing the number of tests per patient and disease episode to one testresult is crucial for an accurate calculation of positivity rates whereasthe temporal trend of positivity rates is not considerably affected.The relative increase in standardised annual Campylobacter positivityrates (+46.1%) and the relative decrease in standardised annual Sal-monella positivity rates between 2003 and 2012 (-44.4%) are close tothe increase in notification rates of Campylobacter (+45.0%) and thedecrease in notification rates of Salmonella (-48.4%). During the sametime period, the number of tests performed for Campylobacter and Sal-monella increased by around 51%. The proportion of cases diagnosedby participating laboratories among NNSID case notifications increased
124

Published article
by 37.7% for campylobacteriosis and by 26.9% for salmonellosis over thestudy period.The observed increase of test numbers in our study was partially due toa single laboratory (laboratory A), where the number of tests increased3.5 times for Campylobacter and 3.8 times for Salmonella between 2003and 2012. This laboratory was founded a few years before the studyperiod. For the remaining laboratories (B, C, D, E), a smaller increaseof 32.0% for Campylobacter tests and of 29.0% for Salmonella tests wasobserved. An increase in testing frequency has also been observed inother European countries [14, 20], except in the Netherlands, wheretesting frequency remained rather stable [21]. Testing frequencies arelargely influenced by physicians’ stool sampling behaviour and patients’healthcare-seeking behaviour [14, 22-25]. It is also possible that labor-atories in the study increased their market shares.The increase of Campylobacter notification rates is probably due to acombination of increasing test numbers and an upward epidemiologicaltrend in the population, as suggested by the increase in positivity rates.The decrease of Salmonella notification rates presumably reflects an epi-demiological trend in the population, as the notification rate decreasedat the same time that testing frequency increased. The increase of cam-pylobacteriosis cases in the population, together with the co-testing ofSalmonella and Campylobacter , is probably responsible for the increaseof Salmonella test numbers.In summary, notification rates are influenced by both epidemiologicaltrends in the population and test numbers. More infections in the pop-ulation will lead to higher notification rates and fewer infections willlead to lower notification rates. On the other hand, increasing test num-bers can lead to the detection of more cases in the population, i.e., highernotification rates without necessarily reflecting an increase in disease fre-quency. Consequently, an observed increase in notification rates does notnecessarily represent an actual increase of disease frequency in the popu-lation. A change in test numbers can be due to a number of factors suchas changes in the prevalence of risk factors leading to testing, alteredhealthcare-seeking behaviour, and changes in physicians’ testing prac-tices, human susceptibility, and pathogenicity. Assessing the interplayof notification rates and test numbers by positivity rates provides moreinsights into the epidemiological situation in the population than one ofthese measures alone. Nevertheless, understanding underlying reasonsfor changes in one of these measures requires further investigation.
125

6 Positivity rates from foodborne pathogen testing, 2003–2012
Positivity rates in relation to age and sexA remarkable increase in Campylobacter positivity rates was observed forthe age groups 5–9 years and ≥85 years (+131.9% and +193.7%). Testnumbers for the age group 5–9 years decreased during the observationperiod (-6.1%), and they more than doubled for the age group ≥85 years(+131.5%). During the same time period, notification rates for the ≥85years age group increased by 94.9% (47.2–92.0 per 100’000 population)and for the 5–9 years age group by 30.7% (55.3–72.3 per 100’000 popu-lation) [2]. It was found that adults and the elderly suffered increasinglymore frequently from campylobacteriosis; this could be related to thefrequent use of proton pump inhibitors and comorbidities in these agegroups [2, 26, 27]. Others have also observed increasing test numbersamong the elderly and related it to changes (increases) in healthcare-seeking and physicians’ testing behaviour [14, 18, 24]. Additionally, theSwiss population aged ≥85 years increased by 29% from 2003 to 2012,which probably also contributed to the observed increase in test numbers[28].Salmonella notification rates and annual sex-specific positivity ratesshowed similar decreasing trends. The strongest decreases in age-spe-cific annual Salmonella positivity rates were observed for the age groups10–14 years and ≥85 years (-64.8% and -75.0%, respectively). At thesame time, notification rates dropped by 55.4% (39.2–17.5 per 100’000population) for the 10–14 year age group and by 55.6% (23.9–10.6 per100’000 population) for the ≥85 years group. It appears, therefore, thatthese decreases are true epidemiological trends. Age-specific Salmonellapositivity rates tended to be slightly higher for males but did not re-markably differ between sexes. Similar observations have been made forcorresponding NNSID data [2].The increasing trend in Campylobacter positivity rates was similar formales and females. Also, male and female notification rates to theNNSID likewise increased during this time [2]. Both positivity ratesand notification rates for Campylobacter were higher among males thanamong females in nearly all age groups. Higher positivity rates for maleshave also been observed by others [18]. Higher stool sampling rates havebeen reported for male patients in Canada [18] and for female patientsin Wales [14]. Sex-specific differences in healthcare seeking or in riskexposures could account for this observation.
126

Published article
Seasonality of positivity rates and notification ratesMonthly and weekly Campylobacter and Salmonella positivity ratesshowed seasonal trends corresponding to the NNSID notification rates,which peaked during the summer months and, for Campylobacter , alsoat the beginning of the year [2]. Summer peaks of Campylobacter andSalmonella positivity rates have also been described previously [18].Monthly and weekly test numbers also peak in summer. The seasonalvariation of test numbers could indicate seasonality of acute gastroen-teritis, a temporal variation in the medical care-seeking behaviour ofaffected individuals and in the proportion of patients being tested. Forinstance, returning travellers are more likely to undergo stool diagnostics[24, 25, 29], leading to increased test numbers during the public schoolholiday season in the summer. The combination of high test numbersand high positivity rates in summer and autumn generates the observedpeak in case numbers in the NNSID [2].Peaks of Campylobacter and Salmonella notification rates during sum-mer months are observed in most European countries [1, 2, 27, 30, 31].The prevalence of Campylobacter in broiler flocks and the contamin-ation of chicken meat with Campylobacter at retail are higher duringsummer months than during the rest of the year [31-34]. This probablyexplains the observed seasonality as poultry meat from broilers is themain source of Campylobacter infections in Switzerland [35-37]. How-ever, it seems that the summer peak is not caused by a single commonsource of infection and is more likely driven by multiple sources of animaland environmental exposures and climatic conditions [27, 31, 38, 39]. Anadditional reason for the summer peak in Switzerland and parts of theEU could be related to the culture of barbequing during summer, whichprovides multiple occasions for disease transmission through undercook-ing of and cross-contamination by poultry and red meat [40-43]. Travelabroad is a known risk factor for contracting campylobacteriosis [42-45]– also in Switzerland [46, 47] – and a large proportion of notified Sal-monella infections in Switzerland is travel-related [48]. Hence, travellingprobably contributes to the observed seasonality of campylobacteriosisand salmonellosis test numbers and case notifications in Switzerland.The highest weekly positivity rate for Campylobacter was found in calen-dar week 1 when test numbers were lowest. Notification rates of campylo-bacteriosis in Switzerland show a strong annual increase over Christmasand New Year (“winter peak”). A similar peak in notification data atthe beginning of January has also been observed in Germany [30] andin the Campylobacter surveillance data of The European Surveillance
127

6 Positivity rates from foodborne pathogen testing, 2003–2012
System [1]. In Switzerland, the major driver for the winter peak is fre-quent consumption of meat fondue at festive occasions around this time,especially if it includes chicken meat [47]. The low test numbers over thefestive season in December and January are probably related to a dif-ferent healthcare-seeking behaviour and restricted access to healthcareservices during the holiday period. Therefore, the winter peak in Cam-pylobacter notification rates is probably attenuated and does not revealthe full magnitude of the problem.
Strengths and limitationsIn Switzerland, private diagnostic laboratories operate on a regional ornational level and predominantly serve the practices of general practi-tioners and medical specialists. The study did not consider hospital-based laboratories as their patient profile generally differs from the pa-tient profile in private practices at the primary care level. Hospitalisedpatients are likely to be more severely affected by acute gastroenter-itis and to undergo more extensive diagnostic testing. Hence, their pre-test probability for a positive Campylobacter or Salmonella test result isdifferent from that of patients consulting at primary care practices [18].The catchment population of the participating laboratories is not known.Therefore, it was not possible to describe the catchment population, ad-just for potential changes therein or to estimate any population-basedindicators like stool sampling rates. Similarly, we could not assess howwell the data of the five participating laboratories represent the wholetested population in Switzerland, given the latter is not known. We couldonly assess the representativeness of the patient population by compar-ing “our” positively tested patients with all notified cases (and hence,supposedly, all positively tested patients in Switzerland; table 6.1 andtable 6.2). From this comparison we conclude that estimated positivityrates are likely to represent accurately the epidemiological trends andsituation in Switzerland as median age and the sex-ratio of cases iden-tified in participating laboratories and in cases from the NNSID werecomparable.
ConclusionsThe study results support the assertion that the increase in notificationrates of campylobacteriosis and the decrease in notification rates of sal-monellosis are epidemiological trends in the population. These trendscannot be solely explained by changing test numbers. Still, we believe
128

Published article
it is important to continuously assess test numbers or positivity rates tonote changes in stool testing frequency that could lead to changes in casenumbers seen in the notification system. This becomes especially im-portant in the light of the increasing use of multiplex PCR panels wheremultiple pathogens are tested simultaneously and, hence, test numberscan change substantially [49]. The annual collection of test numbers ofselected notifiable diseases as stipulated under the newly enforced SwissEpidemics Act will allow for continuous assessment of positivity rates inthe future.
Supplementary dataFor supplementary data accompanying this paper visit https://doi.org/10.4414/smw.2017.14569.
AcknowledgementsWe are grateful to the diagnostic laboratories for providing data forthe study, among others ADMED Microbiologie, La Chaux-de-Fonds;Medizinisches Labor Bioanalytica, Luzern and Viollier AG, Basel. Thesupport of the Federal Office of Public Health, Division of CommunicableDiseases, Bern, Switzerland during data acquisition is appreciated. Theauthors thank Jan Hattendorf from the Swiss Tropical and Public HealthInstitute (Swiss TPH), Basel, Switzerland for statistical support duringdata analysis and Amena Briët (Swiss TPH) for the critical languageediting.
Financial disclosureFinancial support to conduct the study from the following institutions isgratefully acknowledged: the Federal Office of Public Health, Division ofCommunicable Diseases, Bern, Switzerland and the Rudolf Geigy Found-ation, Basel, Switzerland
Competing interestsThe authors declare that they have no conflicts of interest.
129

6 Positivity rates from foodborne pathogen testing, 2003–2012
References1. European Food Safety Authority (EFSA) and European Centre for
Disease Prevention and Control (ECDC). The European Union sum-mary report on trends and sources of zoonoses, zoonotic agents andfood-borne outbreaks in 2014. EFSA J. 2015;13(12):4329. doi: http://dx.doi.org/10.2903/j.efsa.2015.4329.
2. Schmutz C, Mäusezahl D, Jost M, Baumgartner A, Mäusezahl-Feuz M.Inverse trends of Campylobacter and Salmonella in Swiss surveillancedata, 1988–2013. Euro Surveill. 2016;21(6):pii=30130. doi: http://dx.doi.org/10.2807/1560-7917.ES.2016.21.6.30130.
3. Verordnung über die Bekämpfung übertragbarer Krankheiten des Men-schen, Stand am 1. Januar 2016, SR 818.101.1 (29. April 2015). German.
4. Verordnung des EDI über die Meldung von Beobachtungen übertragba-rer Krankheiten des Menschen, Stand am 5. März 2016, SR 818.101.126(1. Dezember 2015). German.
5. Verordnung des EDI über Arzt- und Labormeldungen, Stand am 1.Januar 2014, SR 818.141.11 (13. Januar 1999). German.
6. Verordnung über die Meldung übertragbarer Krankheiten des Men-schen, Stand am 1. Januar 2014, SR 818.141.1 (13. Januar 1999). Ger-man.
7. Bundesgesetz über die Bekämpfung übertragbarer Krankheiten desMenschen, Stand am 1. Januar 2013, SR 818.101 (18. Dezember 1970).German.
8. Bundesgesetz über die Bekämpfung übertragbarer Krankheiten desMenschen, Stand am 1. Januar 2016, SR 818.101 (28. September 2012).German.
9. Scallan E, Hoekstra RM, Angulo FJ, Tauxe RV, Widdowson MA, RoySL, et al. Foodborne illness acquired in the United States – majorpathogens. Emerg Infect Dis. 2011;17(1):7–15. doi: http://dx.doi.org/10.3201/eid1701.P11101.
10. O’Brien SJ, Rait G, Hunter PR, Gray JJ, Bolton FJ, Tompkins DS,et al. Methods for determining disease burden and calibrating na-tional surveillance data in the United Kingdom: the second study ofinfectious intestinal disease in the community (IID2 study). BMC MedRes Methodol. 2010;10(1):39. doi: http://dx.doi.org/10.1186/1471-2288-10-39.
11. Hardnett FP, Hoekstra RM, Kennedy M, Charles L, Angulo FJ; Emer-ging Infections Program FoodNet Working Group. Epidemiologic issuesin study design and data analysis related to FoodNet activities. ClinInfect Dis. 2004;38(s3, Suppl 3):S121–6. doi: http://dx.doi.org/10.1086/381602.
12. Haagsma JA, Geenen PL, Ethelberg S, Fetsch A, Hansdotter F, Jansen
130

Published article
A, et al.; Med-Vet-Net Working Group. Community incidence of patho-gen-specific gastroenteritis: reconstructing the surveillance pyramid forseven pathogens in seven European Union member states. EpidemiolInfect. 2013;141(8):1625–39. doi: http://dx.doi.org/10.1017/S0950268812002166.
13. Gibbons CL, Mangen MJJ, Plass D, Havelaar AH, Brooke RJ, KramarzP, et al.; Burden of Communicable diseases in Europe (BCoDE) con-sortium. Measuring underreporting and under-ascertainment in infec-tious disease datasets: a comparison of methods. BMC Public Health.2014;14(1):147. doi: http://dx.doi.org/10.1186/1471-2458-14-147.
14. Janiec J, Evans MR, Thomas DR, Davies GH, Lewis H. Laboratory-based surveillance of Campylobacter and Salmonella infection and theimportance of denominator data. Epidemiol Infect. 2012;140(11):2045–52. doi: http://dx.doi.org/10.1017/S0950268811002822.
15. Schmutz C, Burki D, Frei R, Mäusezahl-Feuz M, Mäusezahl D. Testingfor Chlamydia trachomatis: time trends in positivity rates in the cantonof Basel-Stadt, Switzerland. Epidemiol Infect. 2013;141(9):1953–64.doi: http://dx.doi.org/10.1017/S0950268812002567.
16. World Health Organization. Foodborne disease outbreaks: guidelinesfor investigation and control. 1st ed. Geneva: World Health Organiza-tion; 2008.
17. Eurostat. Statistical regions for the EFTA countries and the Candidatecountries 2008. Luxembourg: Office for Official Publications of theEuropean Communities; 2008.
18. Franklin K, Pollari F, Marshall BJ, Pintar KD, Nesbitt A, Young I,et al. Stool submission data to help inform population-level incidencerates of enteric disease in a Canadian community. Epidemiol Infect.2015;143(7):1368–76. doi: http://dx.doi.org/10.1017/S0950268814002027.
19. Schweiger A, Markwalder K, Vogt M. Infektiöse Diarrhoe: Epidemiolo-gie, Klinik und Diagnostik. Schweiz Med Forum. 2005;5:714–23.
20. Dingle KE, Clarke L, Bowler IC. Ciprofloxacin resistance among hu-man Campylobacter isolates 1991–2004: an update. J AntimicrobChemother. 2005;56(2):435–7. doi: http://dx.doi.org/10.1093/jac/dki192.
21. van Pelt W, de Wit MA, Wannet WJ, Ligtvoet EJ, Widdowson MA,van Duynhoven YT. Laboratory surveillance of bacterial gastroen-teric pathogens in The Netherlands, 1991–2001. Epidemiol Infect.2003;130(3):431–41. doi: http://dx.doi.org/10.1017/S0950268803008392.
22. Tam CC, Rodrigues LC, Viviani L, Dodds JP, Evans MR, Hunter PR, etal.; IID2 Study Executive Committee. Longitudinal study of infectiousintestinal disease in the UK (IID2 study): incidence in the community
131

6 Positivity rates from foodborne pathogen testing, 2003–2012
and presenting to general practice. Gut. 2012;61(1):69–77. doi: http://dx.doi.org/10.1136/gut.2011.238386.
23. Doorduyn Y, Van Pelt W, Havelaar AH. The burden of infectiousintestinal disease (IID) in the community: a survey of self-reportedIID in The Netherlands. Epidemiol Infect. 2012;140(7):1185–92. doi:http://dx.doi.org/10.1017/S0950268811001099.
24. Scallan E, Jones TF, Cronquist A, Thomas S, Frenzen P, Hoefer D, etal.; FoodNet Working Group. Factors associated with seeking med-ical care and submitting a stool sample in estimating the burdenof foodborne illness. Foodborne Pathog Dis. 2006;3(4):432–8. doi:http://dx.doi.org/10.1089/fpd.2006.3.432.
25. Bless PJ, Muela Ribera J, Schmutz C, Zeller A, Mäusezahl D. Acutegastroenteritis and campylobacteriosis in Swiss primary care: the view-point of general practitioners. PLoS One. 2016;11(9):e0161650. doi:http://dx.doi.org/10.1371/journal.pone.0161650.
26. Bavishi C, Dupont HL. Systematic review: the use of proton pump in-hibitors and increased susceptibility to enteric infection. Aliment Phar-macol Ther. 2011;34(11–12):1269–81. doi: http://dx.doi.org/10.1111/j.1365-2036.2011.04874.x.
27. Nichols GL, Richardson JF, Sheppard SK, Lane C, Sarran C. Campylob-acter epidemiology: a descriptive study reviewing 1 million cases in Eng-land and Wales between 1989 and 2011. BMJ Open. 2012;2(4):e001179.doi: http://dx.doi.org/10.1136/bmjopen-2012-001179.
28. STAT-TAB. Die interaktive Statistikdatenbank. Neuchâtel: Swiss Fed-eral Statistical Office. [cited 2016 Oct 22]. Available from: http://www.pxweb.bfs.admin.ch.
29. Scallan E, Fitzgerald M, Cormican M, Smyth B, Devine M, Daly L,et al. The investigation of acute gastroenteritis in general practice:a survey of general practitioners in Northern Ireland and Republic ofIreland. Eur J Gen Pract. 2005;11(3–4):136–8. doi: http://dx.doi.org/10.3109/13814780509178257.
30. Schielke A, Rosner BM, Stark K. Epidemiology of campylobacteriosisin Germany – insights from 10 years of surveillance. BMC Infect Dis.2014;14(1):30. doi: http://dx.doi.org/10.1186/1471-2334-14-30.
31. Jore S, Viljugrein H, Brun E, Heier BT, Borck B, Ethelberg S, etal. Trends in Campylobacter incidence in broilers and humans in sixEuropean countries, 1997–2007. Prev Vet Med. 2010;93(1):33–41. doi:http://dx.doi.org/10.1016/j.prevetmed.2009.09.015.
32. Wei W, Schüpbach G, Held L. Time-series analysis of Campylobacterincidence in Switzerland. Epidemiol Infect. 2015;143(9):1982–9. doi:http://dx.doi.org/10.1017/S0950268814002738.
33. Rosenquist H, Boysen L, Krogh AL, Jensen AN, Nauta M. Campylob-acter contamination and the relative risk of illness from organic broiler
132

Published article
meat in comparison with conventional broiler meat. Int J Food Micro-biol. 2013;162(3):226–30. doi: http://dx.doi.org/10.1016/j.ijfoodmicro.2013.01.022.
34. Baumgartner A, Felleisen R. Market surveillance for contamination withthermotolerant campylobacters on various categories of chicken meat inSwitzerland. J Food Prot. 2011;74(12):2048–54. doi: http://dx.doi.org/10.4315/0362-028X.JFP-11-228.
35. Jonas R, Kittl S, Overesch G, Kuhnert P. Genotypes and antibioticresistance of bovine Campylobacter and their contribution to humancampylobacteriosis. Epidemiol Infect. 2015;143(11):2373–80. doi: http://dx.doi.org/10.1017/S0950268814003410.
36. Kittl S, Heckel G, Korczak BM, Kuhnert P. Source attribution of hu-man Campylobacter isolates by MLST and fla-typing and associationof genotypes with quinolone resistance. PLoS One. 2013;8(11):e81796.doi: http://dx.doi.org/10.1371/journal.pone.0081796.
37. Kittl S, Korczak BM, Niederer L, Baumgartner A, Buettner S, OvereschG, et al. Comparison of genotypes and antibiotic resistances of Cam-pylobacter jejuni and Campylobacter coli on chicken retail meat and atslaughter. Appl Environ Microbiol. 2013;79(12):3875–8. doi: http://dx.doi.org/10.1128/AEM.00493-13.
38. Kovats RS, Edwards SJ, Charron D, Cowden J, D’Souza RM, Ebi KL,et al. Climate variability and campylobacter infection: an internationalstudy. Int J Biometeorol. 2005;49(4):207–14. doi: http://dx.doi.org/10.1007/s00484-004-0241-3.
39. Patrick ME, Christiansen LE, Wainø M, Ethelberg S, Madsen H, We-gener HC. Effects of climate on incidence of Campylobacter spp. inhumans and prevalence in broiler flocks in Denmark. Appl Environ Mi-crobiol. 2004;70(12):7474–80. doi: http://dx.doi.org/10.1128/AEM.70.12.7474-7480.2004.
40. Mughini Gras L, Smid JH, Wagenaar JA, de Boer AG, HavelaarAH, Friesema IHM, et al. Risk factors for campylobacteriosis ofchicken, ruminant, and environmental origin: a combined case-controland source attribution analysis. PLoS One. 2012;7(8):e42599. doi:http://dx.doi.org/10.1371/journal.pone.0042599.
41. Mossong J, Mughini-Gras L, Penny C, Devaux A, Olinger C, LoschS, et al. Human campylobacteriosis in Luxembourg, 2010–2013: acase-control study combined with multilocus sequence typing for sourceattribution and risk factor analysis. Sci Rep. 2016;6(1):20939. doi:http://dx.doi.org/10.1038/srep20939.
42. Friedman CR, Hoekstra RM, Samuel M, Marcus R, Bender J, ShiferawB, et al.; Emerging Infections Program FoodNet Working Group. Riskfactors for sporadic Campylobacter infection in the United States: Acase-control study in FoodNet sites. Clin Infect Dis. 2004;38(s3, Suppl
133

6 Positivity rates from foodborne pathogen testing, 2003–2012
3):S285–96. doi: http://dx.doi.org/10.1086/381598.43. Doorduyn Y, Van Den Brandhof WE, Van Duynhoven YT, Breukink
BJ, Wagenaar JA, Van Pelt W. Risk factors for indigenous Campy-lobacter jejuni and Campylobacter coli infections in The Netherlands:a case-control study. Epidemiol Infect. 2010;138(10):1391–404. doi:http://dx.doi.org/10.1017/S095026881000052X.
44. Neimann J, Engberg J, Mølbak K, Wegener HC. A case-control studyof risk factors for sporadic Campylobacter infections in Denmark. Epi-demiol Infect. 2003;130(3):353–66. doi: http://dx.doi.org/10.1017/S0950268803008355.
45. Gallay A, Bousquet V, Siret V, Prouzet-Mauléon V, Valk H, VaillantV, et al. Risk factors for acquiring sporadic Campylobacter infectionin France: results from a national case-control study. J Infect Dis.2008;197(10):1477–84. doi: http://dx.doi.org/10.1086/587644.
46. Schorr D, Schmid H, Rieder HL, Baumgartner A, Vorkauf H, BurnensA. Risk factors for Campylobacter enteritis in Switzerland. ZentralblHyg Umweltmed. 1994;196(4):327–37.
47. Bless PJ, Schmutz C, Suter K, Jost M, Hattendorf J, Mäusezahl-Feuz M,et al. A tradition and an epidemic: determinants of the campylobacte-riosis winter peak in Switzerland. Eur J Epidemiol. 2014;29(7):527–37.doi: http://dx.doi.org/10.1007/s10654-014-9917-0.
48. Schmid H, Baumgartner A. Epidemiology of infections with enteric sal-monellae in Switzerland with particular consideration of travelling activ-ities. Swiss Med Wkly. 2013;143:w13842. doi: http://dx.doi.org/10.4414/smw.2013.13842.
49. Marder EP, Cieslak PR, Cronquist AB, Dunn J, Lathrop S, Rabat-sky-Ehr T, et al. Incidence and trends of infections with pathogenstransmitted commonly through food and the effect of increasing use ofculture-independent diagnostic tests on surveillance – Foodborne Dis-eases Active Surveillance Network, 10 U.S. Sites, 2013–2016. MMWRMorb Mortal Wkly Rep. 2017;66(15):397–403. doi: http://dx.doi.org/10.15585/mmwr.mm6615a1.
134

7 Enterohaemorrhagic E. coli (EHEC)in Switzerland: epidemic pattern dueto changing laboratory methods?!
Parts of this chapter are extracted/adapted from an unpublished reportprepared for the FOPH:
Schmutz C, Mäusezahl D. Abklärung der steigenden EHEC-Meldezahlen bei den Laboratorien. Report of laboratory visits.27 Oct 2016; Basel: Swiss Tropical and Public Health Institute.
7.1 IntroductionThe Federal Office of Public Health (FOPH) noticed a strong increase inenterohaemorrhagic Escherichia coli (EHEC) case notifications in 2015without obvious geographical clusters (Figure 7.1) [Bundesamt für Ge-sundheit and Nationales Referenzzentrum für enteropathogene Bakterienund Listerien, 2015]. It was suspected that new laboratory techniques,namely multiplex polymerase chain reaction (PCR) panels, could havecontributed to this increase. Such panels allow testing a sample for mul-tiple pathogens in one single run. Different multiplex PCR panels forgastrointestinal (GI) pathogens are commercially available, among thosethe BD MAXTM Enteric Bacterial Panel [Becton, Dickinson and Com-pany, 2016], the xTAG R© Gastrointestinal Pathogen Panel (GPP) [Lu-minex, 2012], and the FilmArray R© Gastrointestinal (GI) Panel [BioFireDiagnostics, 2016]. An overview of pathogens included in those threepanels is provided in table 7.1.Traditionally, routine testing of stool samples for bacterial pathogensincluded only Campylobacter spp., Salmonella spp. and Shigella spp.[Schweiger et al., 2005a], using culture-based techniques. It is conceiv-able that EHEC – which is included in all three of the above-mentionedpanels – is tested more frequently if traditional stool culture is replacedby multiplex PCR. However, it was not known if this was indeed thecase. Therefore, the FOPH initiated several studies to investigate if theincrease seen in EHEC notification data is due to an underlying out-
135

7EHEC:epidem
icpattern
dueto
laboratorymethods?!
Figure 7.1: Annual number of probable and confirmed enterohaemorrhagic Escherichia coli (EHEC) cases reported to theFederal Office of Public Health between 1999 and 2016 (* Data as per 20 July 2016). Cases residing outside Switzerlandwere excluded
136

7.1Introduction
Table 7.1: Overview of pathogens included in four commercially available multiplex PCR panels for gastrointestinalpathogens
BD MAXTM EntericBacterial Panel
xTAGR© GastrointestinalPathogen Panel (GPP)
FilmArrayR© Gastrointestinal (GI)Panel
Bacteria Campylobacter spp. (jejuniand coli)
Campylobacter Campylobacter(C. jejuni/C. coli/C. upsaliensis)
Salmonella spp. Salmonella SalmonellaShigella spp./EIEC Shigella Shigella/EIECShiga toxin-producingorganisms (STEC, Shigelladysenteriae)
Shiga-like Toxin producing E.coli (STEC) stx1/stx2
Shiga-like toxin producing E. coli(STEC) stx1/stx2
Escherichia coli O157 E. coli O157Clostridium difficile toxinA/B
Clostridium difficile (toxin A/B)
ETEC LT/ST ETEC lt/st
Vibrio (V. parahaemolyticus/V. vulnificus/V. cholerae)
Vibrio cholerae Vibrio choleraeYersinia enterocolitica Yersinia enterocolitica
Plesiomonas shigelloidesEAECEPEC
137
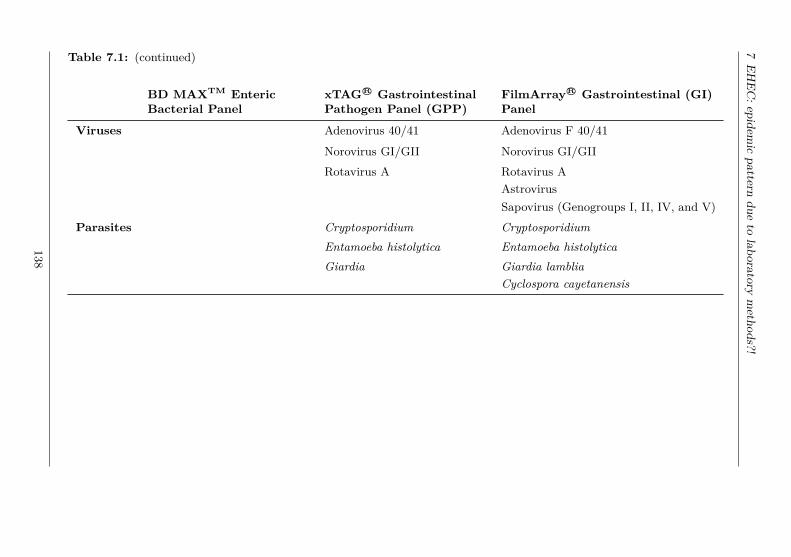
7EHEC:epidem
icpattern
dueto
laboratorymethods?!
Table 7.1: (continued)
BD MAXTM EntericBacterial Panel
xTAGR© GastrointestinalPathogen Panel (GPP)
FilmArrayR© Gastrointestinal (GI)Panel
Viruses Adenovirus 40/41 Adenovirus F 40/41
Norovirus GI/GII Norovirus GI/GIIRotavirus A Rotavirus A
AstrovirusSapovirus (Genogroups I, II, IV, and V)
Parasites Cryptosporidium CryptosporidiumEntamoeba histolytica Entamoeba histolyticaGiardia Giardia lamblia
Cyclospora cayetanensis
138

7.2 Methods
break situation or whether it reflects a change in laboratory methods.One of these studies aimed to get a better understanding of the currentdiagnostic algorithms and methods used by Swiss diagnostic laboratoriesand of their reporting procedures. Therefore, visits to Swiss diagnosticlaboratories reporting many EHEC cases were scheduled with the ob-jectives to:• assess the laboratory techniques currently used by Swiss diagnostic
laboratories to test for EHEC with special emphasis on the import-ance of multiplex PCR panels
• network to personalise the institution “FOPH” and to foster the re-lationship between the FOPH and the laboratories
• enhance the mutual understanding of the Swiss notification systemand associated challenges
• prepare for a subsequent study, a so-called “positivity study”, byexplaining its aims and objectives, its significance, and the data re-quirements, and enquiring about data availability and willingness toparticipate
7.2 MethodsThe 10 laboratories reporting most EHEC cases in 2015 were selected.Two of those 10 laboratories were closely collaborating; the same personwas responsible for EHEC testing in those two laboratories. There-fore, an additional laboratory was selected. Furthermore, the sample of10 laboratories included only one hospital laboratory. Hence, a secondhospital laboratory was selected to increase the variety of possible ap-proaches to EHEC diagnostics.The visit was kept as informal as possible in order to establish (in partsfor the first time) a personal relationship with laboratory staff. Thelaboratory staff should not feel controlled or intimidated despite beingvisited by an authority. In contrary, the visit was supposed to facilitateinteraction and enhance mutual understanding of everyday activities andchallenges. Therefore, the term “conversation” is used instead of “inter-view” for the remainder of this chapter. Nevertheless, conversations wereprepared similar to preparing interviews for a qualitative research study.A question guide with leading questions was developed jointly betweenthe Swiss Tropical and Public Health Institute (Swiss TPH) and theFOPH to help structure the conversation. The FOPH sent letters ex-plaining the current epidemic increase of EHEC in Switzerland and the
139

7 EHEC: epidemic pattern due to laboratory methods?!
need to understand underlying reasons to the selected laboratories. Af-terwards, FOPH staff contacted the laboratories by phone and fixed anappointment with the person responsible for microbiology and/or EHECdiagnostics, if they agreed to participate. One or two employees of theFOPH and one Swiss TPH staff (two in one case) attended the conver-sations. The employee of the FOPH lead the conversation; Swiss TPHstaff was responsible for note taking and for explaining the planned pos-itivity study. Conversations were not recorded as this would defy theintended informal character.
7.3 ResultsAll 11 laboratories were visited between 08 June and 13 July 2016. Fourlaboratories were in the French-speaking part of Switzerland with con-versations conducted in French while seven were in the German-speakingpart of Switzerland with conversations in German.
7.3.1 Use and characteristics of multiplex PCR panelsLaboratory experts unanimously agreed that the increasing use of mul-tiplex PCR panels is responsible for the increase in EHEC case num-bers seen in the National Notification System for Infectious Diseases(NNSID). Some spontaneously noted “Wer sucht, der findet” (“seek andyou shall find”). All except two laboratories had at least one multiplexPCR system in use for GI pathogens at the time of the visit. One of thetwo laboratories not currently using a multiplex PCR panel, however,evaluated different panels in 2013/14. The majority of laboratories vis-ited uses GI multiplex PCR panels since 2014 or 2015.The number of EHEC notifications by participating laboratory and thetime of introduction of the multiplex PCR panel is displayed in figure 7.2.In some laboratories, routine testing of stool samples has been changedfrom using traditional culture-based techniques to using the “small” mul-tiplex PCR panel (BD MAXTM Enteric Bacterial Panel). Hence, in theselaboratories, all stool samples which were previously tested for Campy-lobacter spp., Salmonella spp. and Shigella spp. are now (additionally)tested for EHEC.Laboratory experts stated that multiplex PCR panels give more fre-quently positive results than culture-based methods. Their estimates onwhat proportion of additional cases is identified with PCR compared toculture differed: for Campylobacter estimates ranged from “20% more”to “40% more” with multiplex PCR than with culture. Others stated
140

7.3 Results
Figure 7.2: Number of enterohaemorrhagic Escherichia coli (EHEC) noti-fications registered at the Federal Office of Public Health (FOPH) per yearbetween 2006 and 2016 (data as per 20 July 2016) and time point of introduc-tion of multiplex PCR panels, among laboratories visited by the FOPH andthe Swiss Tropical and Public Health Institute in June/July 2016
141

7 EHEC: epidemic pattern due to laboratory methods?!
that “5–10%” or “up to 40%” of PCR-positive results cannot be con-firmed by culture.Opinions differed also when asked if a positive PCR result for EHECis considered clinically relevant or rather an accidental finding. Eventhough most laboratory experts consider EHEC an accidental finding –physicians hardly ask specifically for EHEC testing – some seemed moreconfident in relying on multiplex PCR panel results than others. Somelaboratory experts assess the clinical relevance together with the phys-ician, on a case-by-case level. An expert mentioned that BD MAXTM
Enteric Bacterial Panel only detects vtx1 and vtx2 (cytotoxins expressedby EHEC) but that the clinical relevance also depends on other pathogencharacteristics. Similarly, it was mentioned that all serotypes (harbour-ing at least one of the cytotoxins) are detected by the test and reportedto the FOPH but one single serotype (O157) is responsible for 80% ofcases of haemolytic-uraemic syndrome (HUS).On the other hand, it is assumed that patients are sick (do show signsand symptoms) when stool samples are sent in for diagnostics. Hence, ifa pathogen is detected this is considered the likely cause. In this context,interpretation of multiple positive PCR results was discussed. Again, ex-pert opinions differed. Some stated that multiple infections are rarelyfound in patients without travel history; hence, in cases without travelhistory, the identified pathogen is considered causing the symptoms. Incontrast, in patients with travel history, multiple positive findings aremore frequent. In those cases it is difficult to evaluate which of the or-ganisms is causing disease. One respondent stated that identifying 2–3pathogens is plausible in a returning traveller depending on the traveldestination. He also referred to the manual of the testing kit stating thatresults have to be questioned or re-checked only in case of 4 or more pos-itive test results. Other experts seemed more sceptical towards multiplepositive results. It has to be noted, however, that some experts may havereferred to the “small” panel (BDMAXTM Enteric Bacterial Panel) whileothers may have thought of the “large” panel (FilmArray R© Gastrointest-inal (GI) Panel) when talking about multiple infections. Furthermore,the “large” panel might more frequently be used in returning travellersthan in persons without travel history (see also next section).
7.3.2 Diagnostic algorithm in case of diarrhoeaLaboratory experts were also asked about the diagnostic procedures thatare applied in case of receiving a stool sample from a patient withdiarrhoea. Responses to this question were heterogeneous: in some
142

7.4 Discussion
laboratories the pathogens tested for and the diagnostic methods appliedare exclusively defined by the ordering physician; others apply their owndiagnostic algorithms. For example, several experts mentioned that theywould test using BD MAXTM Enteric Bacterial Panel if “general bacteri-ology” was requested for a patient without travel history and they woulduse the FilmArray R© Gastrointestinal (GI) Panel in a patient with travelhistory. Others use a “single PCR” if only one pathogen is requestedby the physician but a multiplex PCR panel if testing for two or morepathogens is requested. Such decisions can also be based on economicreasons (cost- and time-effectiveness).Many laboratories confirmed relying on PCR in the first instance forstool diagnostics but most still conduct a culture-based confirmationtest in case a PCR-test generated a positive result. Reasons mentionedfor using culture-based diagnostics after PCR-positive results were: forknowing the antibiotic resistance profile, for obtaining the isolate, fortyping, for billing purposes, and for distinguishing species which are notdistinguished by PCR (e.g. Arcobacter spp. from Campylobacter spp.or Shigella spp. from enteroinvasive Escherichia coli (EIEC)).
7.4 Discussion7.4.1 “Seek and you shall find (EHEC)”The conversations with the laboratory experts revealed that the labor-atories in Switzerland operate independently and apply heterogeneousalgorithms for stool diagnostic testing. However, one issue was undis-puted among the experts: the increase in EHEC notifications is dueto the change from conventional stool culture to multiplex PCR pan-els. Looking at the date of implementation of the multiplex PCR panelsas reported by laboratory representatives and the number of reportedEHEC cases by laboratory supports this finding (Figure 7.2). Apartfrom confirming the switch from culture-based to multiplex PCR meth-ods, laboratory representatives also highlighted that testing specificallyfor EHEC is rarely asked for by physicians.The potentially large impact of laboratory practices was already de-scribed by a Swiss diagnostic laboratory for Aeromonas spp.: They ex-cluded Aeromonas spp. from routine testing (“basic stool culture”) dueto a change in the official tariff structure in 2006 [Tritten et al., 2014].After that change, this pathogen was rarely isolated until its reintroduc-tion in routine testing in this laboratory in 2011. This change was notnoted by the FOPH as it did not concern a notifiable disease/pathogen.
143

7 EHEC: epidemic pattern due to laboratory methods?!
However, it shows the importance of understanding laboratory practicesfor interpreting laboratory data including notifications.
7.4.2 Implications of laboratory practices for surveillanceand outbreak detection
Interestingly, the number of confirmed EHEC cases remained ratherstable in the European Union (EU) between 2012 and 2015 with a slightincrease in 2016 [European Food Safety Authority and European Centrefor Disease Prevention and Control, 2017]. In 2016, the notification ratein the EU was 1.82 confirmed cases per 100’000 population. For com-parison, the Swiss notification rate was at 5.5 per 100’000 populationwhich is the highest notification rate since 1999, the year in which EHECbecame notifiable [Bundesamt für Lebensmittelsicherheit und Veterinär-wesen and Bundesamt für Gesundheit, 2017; European Food Safety Au-thority and European Centre for Disease Prevention and Control, 2017].It has to be noted, however, that the notification rate in the EU differedquite substantially by country with two countries (Ireland and Sweden)reporting higher rates than Switzerland [European Food Safety Author-ity and European Centre for Disease Prevention and Control, 2017].Even though the “EU summary report on zoonoses, zoonotic agentsand food-borne outbreaks 2016” [European Food Safety Authority andEuropean Centre for Disease Prevention and Control, 2017] mentionsthat “diagnosis by direct detection of the toxin or toxin genes by PCRwithout strain isolation is increasing”, it also states that diagnosis is“generally performed by culture from stool samples and indirect dia-gnosis by detection of antibodies [. . . ]”. Hence, the fact that EHECnotifications are not (yet) increasing in the EU could be linked to differ-ences in laboratory techniques.In the US, testing of all stool samples from patients with acute, com-munity-acquired diarrhoea for EHEC was recommended already in 2009,before PCR methods were widely used for EHEC diagnosis and beforemultiplex PCR panels were available [Gould et al., 2009]. Nevertheless,also in the US an increase in EHEC infections was noticed in 2016 com-pared to 2013–2015 both in culture-confirmed and ‘culture-independentdiagnostic test positive-only’ cases [Marder et al., 2017].In Switzerland, the number of HUS cases among notified EHEC casesremained stable in absolute terms despite the strong increase in the num-ber of EHEC cases, hence, reflecting a relative decrease [Bundesamt fürLebensmittelsicherheit und Veterinärwesen and Bundesamt für Gesund-heit, 2017]. This observation additionally supports the hypothesis of
144

7.4Discussion
Figure 7.3: Number of hospitalisations due to enterohaemorrhagic Escherichia coli (ICD-10 code A04.3) and haemolytic-uraemic syndrome (ICD-10 code D59.3) according to Swiss hospital statistics, 1999–2016.* Data from 2015 were not available online. Source: Bundesamt für Statistik [n.d.]
145

7 EHEC: epidemic pattern due to laboratory methods?!
increased testing rather than dealing with an outbreak: with the newmethods, also patients in which there was no direct suspicion of EHECare tested. Those patients are unlikely to show severe symptoms or evenserious complications of this disease.Considering that laboratory results are available faster with PCR thanwith culture, one could argue that notification forms are completed at anearlier time point during the course of disease by physicians. This couldresult in a lower proportion of sequelae reported given that HUS usuallyoccurs 5–13 days after onset of diarrhoea [Karch et al., 2005]. However,HUS cases (whether or not caused by EHEC) are also not increasingaccording to Swiss hospital statistics (Figure 7.3).Finally, in other countries, several EHEC outbreaks have been detectedby an increase in HUS cases in the first instance [Germinario et al., 2016;Vygen-Bonnet et al., 2017; Werber et al., 2008]. In summary, there isno evidence of an EHEC outbreak in Switzerland despite increasing casenumbers.
7.4.3 Importance of good relations among nationalsurveillance actors
The visits of health authority personnel also aimed at enhancing therelationship between diagnostic laboratories and the FOPH. Differentstatements and observations suggest that this was both necessary andsuccessful to foster a sense of community. The rather formal receptionof the FOPH and Swiss TPH employees in some laboratories showedthe partly existing reserved attitude towards the FOPH. It was men-tioned repeatedly that getting into contact with the FOPH by phone oridentifying the person in charge at the FOPH for questions (e.g. con-cerning notification forms) was always difficult. It is also perceived thatthe obligation to report creates a lot of work at the laboratories withno “return” (i.e. feedback). Similarly, it was stated that “knowing thefaces behind” (from this visit) tremendously facilitates future contactsand interactions.On the web page of the German Robert Koch Institute (RKI),for example, each department and unit is presented, naming theleader and the substitute and providing contact details (e.g. Surveil-lance unit: https://www.rki.de/EN/Content/Institute/DepartmentsUnits/InfDiseaseEpidem/Div32/div32_node.html [accessed: 27July 2018]). Providing such information also on the web page of theFOPH could be appreciated by the laboratories and facilitate closer con-tact given the results of the laboratory visits. Furthermore, the RKI
146

7.5 Conclusions
publishes an annual report with data analyses of all notifiable observa-tions1. Developing something similar for Switzerland could address theperceived lack of feedback on notifications by laboratory staff. The im-portance of close collaboration and communication among stakeholdersin the framework of disease surveillance has also been stressed, especiallyin the context of outbreak investigations [Henao et al., 2015; Knoblauchet al., 2015; Schjørring et al., 2017]. Therefore, those laboratory visitsinitiated by the FOPH were important. The positive effects resultingfrom the visits should be maintained and strengthened, e.g. by repeat-ing those visits regularly, inviting laboratories for a return visit at theFOPH, or organising regular (e.g. annual) meetings between all stake-holders involved in the NNSID (laboratory experts, physicians, cantonaland national public health authorities). Furthermore, laboratory expertsmentioned that actively informing their clients (i.e. physicians) aboutnew technologies and changes in their laboratory practices is key andcan prevent fears and a negative attitude towards those changes. Thiscommon practice of actively informing clients, partners or collaboratorsabout changes in a personal manner, e.g. by letters instead of throughofficial communication channels only (e.g. BAG Bulletin) should be ad-opted by the FOPH.
7.5 ConclusionsThe example of EHEC suggests that changes in diagnostic methods mustnot only be considered for long-term trends but can also be a reason forrather rapid changes in case numbers. Such factors should be consideredbefore or in parallel to initiating outbreak investigations.Apart from being an important resource for interpretation of notifica-tion data, talking to the experts from diagnostic laboratories also provedimportant to enhance mutual trust and understanding. It is importantfor institutions such as the FOPH to “step out of anonymity”. Goodnetworks with experts “in the field” could even prevent unnecessary out-break investigations if they can provide convincing arguments for changesin case numbers which are not linked to disease incidence.
1Available online at https://www.rki.de/DE/Content/Infekt/Jahrbuch/jahrbuch_node.html (accessed: 27 July 2018)
147


8 Do changes in EHEC diagnosticsmislead interpretation of diseasesurveillance data in Switzerland?Time trends in positivity from 2007to 2016
Fabienne Fischer1, 2, Apolline Saucy1, 2, Claudia Schmutz1, 2,Daniel Mäusezahl1, 2
1 Swiss Tropical and Public Health Institute, Basel, Switzerland2 University of Basel, Basel, Switzerland
Submitted to:
Eurosurveillance (under review)
The final version of this article will be published in a monograph(foreseen in 2019):“Schmutz C. Infectious disease surveillance in Switzerland: VolumeII. Foodborne diseases in Switzerland: understanding the burden ofillness pyramid to improve Swiss infectious disease surveillance. PhDthesis. Basel, Switzerland”
149


AbstractLaboratory-confirmed cases of enterohaemorrhagic Escherichia coli(EHEC) are notifiable to the National Notification System for Infec-tious Diseases in Switzerland since 1999. Since 2015 a large increasein case numbers has been observed. Around the same time, syndromicmultiplex PCR started to replace other diagnostic methods in standardlaboratory practice for gastrointestinal pathogen testing in Swiss dia-gnostic laboratories, suggesting that the increase in notified cases is dueto a change in test practices and numbers.We analysed laboratory data from 11 laboratories across Switzerlandfrom 2007 to 2016 to calculate the positivity – i.e. the rate of the num-ber of positive test results for EHEC divided by the total number of testsperformed.The age- and sex-standardised positivity of EHEC testing increased from0.8% in 2007 to 1.7% in 2016. This increasing positivity suggests thatthe increase in case notifications cannot uniquely be attributed to anincrease in test numbers alone.Therefore, we find no evidence to exclude a real epidemiological trendfor the observed raise in EHEC-related disease frequency. The apparentepidemic seems restricted to Switzerland as notification data of otherEuropean countries do not show comparably strong increasing trends.
IntroductionEnterohaemorrhagic Escherichia coli (EHEC) is a subtype of E. colicharacterized by the potential of causing human illness, belonging to thegroup of Shiga toxin-producing Escherichia coli (STEC). EHEC infec-tion is sometimes asymptomatic and generally self-limiting but it can alsolead to severe gastroenteritis with haemorrhagic diarrhoea, and poten-tial subsequent life-threatening conditions, such as haemolytic-uraemicsyndrome (HUS) [1, 2].EHEC transmission can occur through consumption of contaminatedfood and drinks or by direct contact with infected individuals or animalshedders [1, 3-5]. EHEC is endemic in Europe and Switzerland. Casesappear sporadically or as clusters in outbreaks. A large outbreak oc-curred in 2011 in Germany and was attributed to contaminated sprouts[6]. Smaller outbreaks were reported from, e.g. Italy in 2013 due tocontaminated milk and Romania in 2016 due to fresh cheese [7].It is estimated that STEC leads to 2.8 million of illness cases annually,including over 3’800 cases of HUS [8]. However, those estimates may be
151

8 Time trend in positivity of EHEC from 2007 to 2016
conservative.In Switzerland, the Federal Office of Public Health (FOPH) refers to thisgroup of notifiable pathogens as “Escherichia coli, enterohämorrhagische(EHEC, VTEC or STEC)” [9]. The Swiss National Notification Systemfor Infectious Diseases (NNSID), managed by the FOPH, gathers all no-tifications on laboratory-confirmed EHEC infections since 1999. Casenumbers were stable until 2010, with only a few laboratories reportingEHEC in Switzerland. A slight rise in cases was observed in 2011 afterintensified testing following the outbreak in Germany and numbers ofEHEC notifications strongly increase since 2015 [10]. It is hypothesisedthat this recent increase in case notifications is due to the introductionof multiplex polymerase chain reaction (PCR) panels for the analysis ofstool samples. Gastrointestinal multiplex PCR panels are able to detectmultiple gastrointestinal pathogens in one single test [10, 11]. Tradition-ally, routine testing of stool samples for bacterial pathogens involvedonly Campylobacter spp., Salmonella spp. and Shigella spp. using cul-ture-based techniques. With multiplex PCR panels, stool samples canbe tested for up to 22 pathogens including EHEC in one single run.Previously, EHEC was rarely tested and only on demand by the physicianalerted by clinical signs. The increase in testing rate for EHEC, likelyoccurring when PCR panels are introduced, could lead to identificationand notification of cases that were simply not discovered beforehand[10].This study aims to assess the development of the EHEC positivity inthe Swiss population between 2007 and 2016 and to give more insightinto the epidemiology and notification numbers of EHEC infections inSwitzerland in recent years.
MethodsIndividual-based testing data were requested from 11 Swiss diagnosticlaboratories. Laboratories were selected based on providing most EHECnotifications in 2015, to include all regions of Switzerland and to includeboth, hospital and private diagnostic laboratories.Data collected comprised all tests performed for EHEC between January2007 and December 2016, including positive and negative test outcomes.Information requested included date of test, test result, test method, pa-tient identification number, and patients’ date of birth, sex and cantonof residence.Test records indicating patients’ residence outside Switzerland and those
152

without a (conclusive) test result were omitted. Duplicate entries,defined as identical values for all variables, and “repeated tests” wereexcluded from the analyses. Repeated tests were defined as more thanone test performed for the same patient during a single disease episode.The analysis was planned a priori and was performed using STATA 14(StataCorp., USA).We use the term positivity as the rate of number of positive tests inrelation to the total number of tests performed for EHEC [12, 13]. Thepositivity was calculated for different demographic groups, test meth-ods, spatial (based on the patients’ canton of residence) and temporal(annual and seasonal) trends. The main outcome, the annual positivity,was age- and sex-adjusted using direct standardisation with the samplepopulation (2007–2016) as reference population.Univariable logistic regression was used to test the association betweentest result and test year, season, time trend, sex, age group, laboratory,test method and greater region. Season was modelled using a sine andcosine function with an annual period. The time trend was a continuousvariable combining test month and test year. The greater regions cor-respond to the Nomenclature of Units for Territorial Statistics (NUTS)-2-level. Categories with most observations were chosen as reference cat-egories, except for the seasonality (first month of the year).A multivariable mixed effect logistic regression model was defined a pri-ori, independent of the outcome of the univariable regressions. Themodel’s explanatory variables included sex, age group, seasonality, timetrend, greater region and diagnostic test method. The model includedan interaction term for sex and age group. The variable “laboratory”was included as a random effect to account for clustering. The clusteringeffect of the same patient (same identification number) was omitted.Finally, the multivariable model was compared to a reduced modelwithout adjustment for test method in order to validate the results andensure the consistency of the time trend, independently from the dia-gnostic method.Based on multivariable regression results, predicted probabilities for apositive test result were computed and plotted for direct visualisationand comparison of categories and models.
Ethical statementThis study was funded by the Swiss FOPH. The authors declare thatthey have no conflict of interest. The study was conducted under theEpidemics Act (SR 818.101). The data, provided by laboratories, were
153

8 Time trend in positivity of EHEC from 2007 to 2016
anonymised for the analysis. Other data (e.g. notification data, popula-tion statistics) is publicly available from the FOPH or the Swiss FederalStatistical Office.
ResultsData receivedThe participating 11 laboratories provided in total 91’685 records ofEHEC tests (thereof 1’366 positives). Only five laboratories provideddata for the entire study period (2007–2016, N=61’916). Three of theremainder six laboratories did not perform EHEC tests for the entirestudy period, two laboratories could not extract all data requested dueto changes in the information technology and data storage system; onelaboratory did not specify a reason for missing years of data.Following our exclusion criteria, 1’407 records (22 positives) were ex-cluded. After initial cleaning of the dataset, further 71 observations (3positives) with either missing sex or age were excluded. Finally, 1’110duplicated entries (31 positives) and 3’054 repeated tests (96 positives)were excluded. In total, 6.2% (N=5’642) of the original dataset wereexcluded. The final dataset comprised 86’043 observations (1’149 posit-ives).Figure 8.1 shows the number of EHEC cases in the NNSID, and in ourdataset as obtained by the laboratories. Data from the NNSID showthat the laboratories selected for this study reported 61.9% of all casesregistered in the NNSID between 2007 and 2016 (range 39.4% in 2011to 73.2% in 2009).
Characteristics of the patient populationThe proportion of males to females tested remained constant between2007 and 2016 with 44.3% males and 55.7% females across all studyyears. The median age of the tested population increased from 30 yearsto 44 years old (Kruskal-Wallis test: p<0.01). Median age of patientsdiffered significantly between laboratories (median by laboratory rangingfrom 27–55, overall median: 40 years old) and greater regions (medianby greater region ranging from 37–44) (Kruskal-Wallis test: p<0.01).
154

Figure 8.1: Number of enterohaemorrhagic Escherichia coli (EHEC) notifications of 11 Swiss diagnostic laboratories asreported in the National Notification System for Infectious Diseases (NNSID), the number of positive tests of the laboratoriesin their own datasets, and the total number of EHEC notifications reported in the NNSID per year, 2007–2016, Switzerland
155

8Tim
etrend
inpositivity
ofEHEC
from2007
to2016
(a) Data of 11 Swiss diagnostic laboratories
Figure 8.2: Total number of enterohaemorrhagic Escherichia coli tests performed by test method and number of positivetests for the entire study period (2007–2016)
156

(b) By laboratory
157

8 Time trend in positivity of EHEC from 2007 to 2016
Laboratories, diagnostic methods and greater regionsThe variables “laboratory”, “greater region” and “diagnostic test used”strongly correlated (Fisher’s exact test: p<0.01 for all three tests).The diagnostic methods performed included multiplex PCR (66.5%,N=57’168), antigen test (26.3%, N=22’588), PCR (7.3%, N= 6’247)and culture-based diagnostics (<0.1%, N=24). Multiplex PCR panelsable to detect different pathogens were distinguished from PCR panelstargeting EHEC/E. coli only (thereafter referred to as “single PCR”).Multiplex PCR panels used were mainly BD MAXTM (Extended) En-teric Bacterial Panel (52%), Luminex xTAG R© Gastrointestinal Patho-gen Panel (36%), BioFire FilmArrayTM Gastrointestinal Panel (5.9%),and Seegene (not specified whether AllplexTM Gastrointestinal Panel orSeeplex R© Diarrhea ACE Detection, 4.6%).The number of tests performed using the antigen test, single PCR orculture remained stable between 2007 and 2016, while the number ofmultiplex PCR panels performed increased by 42% (Figure 8.2a). Thefive laboratories providing data for the entire study period were usingsingle PCR or antigen tests before the introduction of multiplex PCR(Figure 8.2b). Only one of these five laboratories kept using primarilyantigen tests for the entire study period.From the six laboratories that could not provide data for the entire studyperiod, three started to perform EHEC testing only between 2014 and2015, once multiplex PCR panels were available.
PositivityThe number of tests for EHEC increased sevenfold from 2007 to 2016(3’711 to 26’639) while the number of positive test results increased 13-fold in the same time period (33 to 440). The age- and sex-standardisedpositivity of EHEC testing increased from 0.8% in 2007 to 1.7% in 2016(Figure 8.3).Positivity increased for all age categories. The positivity calculated overthe entire study period is highest for children 1–4 years old (2.2%) andincreased from 1.4% in 2007 to 2.9% in 2016. The largest relative in-crease was seen in the elderly aged “80+”, from zero (no positive case in2007) to 1.8%.The overall positivity is similar for men (1.4%) and women (1.3%) andincreased from 0.7% and 1.1% to 1.7% and 1.6%, respectively.The positivity and trend in positivity differed across laboratories (Figure8.4). The overall positivity ranged from 0.6% to 5.8%. Three laborator-ies showed a large fluctuation in the annual positivity, due to the small
158

Figure 8.3: Age- and sex-standardised positivity of enterohaemorrhagic E. coli testing, Switzerland, 2007–2016
159

8 Time trend in positivity of EHEC from 2007 to 2016
number of tests performed. The largest relative increase in positivitywas 2.8-fold from 2% to 5.7%. After 2014 the positivity of most labor-atories stabilised, though at different levels.The positivity further differed by test method. The positivity of culture-based tests was not calculated due to (i) the small number of observa-tions and (ii) the exclusion process for “repeated tests”. Most culture-based tests performed were confirmation tests; therefore, they were of-ten classified as “repeated tests” and excluded. The positivity across alltest years was highest for tests using single PCR (2.4%) and lowest forthe antigen test (0.6%), positivity of multiplex PCR panels was at 1.5%.The positivity of multiplex PCR increased from 1.1% in 2014 to 1.7%in 2016. In contrast, the positivity for single PCR and antigen testsstarted to decrease in 2013 and 2014 respectively, just after peaking at4.3% (PCR; 2013) and 1.4% (antigen test; 2014).
Determinants of a positive diagnostic test resultThe univariable regressions showed a marginal but significant trend forthe time trend variable (Odds ratio [OR] 1.003, p<0.01) as shown inTable 8.1. Almost all test years, except 2013 showed decreased odds fora positive test outcome compared to the reference year 2016. All calendarmonths except July have smaller odds for a positive test outcome thanthe reference month of August.The age groups “1–4” and “5–9” years old were almost twice as likely tohave a positive test outcome (OR 1.88, p<0.01 and OR 1.80, p<0.01)than the reference category of “20–39” years old. No difference was seenbetween sexes.Compared to multiplex PCR panels, the use of the antigen test had a63% lower probability to generate a positive test outcome, while the useof single PCR showed 56% higher chance for a positive test outcome.The odds of culture-based tests could not be evaluated due to the smallsample size.The ORs and significance levels from the fully-adjusted multivariablemodel varied only marginally from the univariable models and do notalter the interpretation, therefore, they will not be detailed, but arepresented in Table 8.1.Predicted probabilities based on the multivariable model showed an in-creasing time trend for all test methods and regions.Comparison of the fully adjusted model to a model excluding the adjust-ment for test method showed increasing predicted probabilities for bothmodels, but with a lower slope for the fully adjusted model (Figure 8.5).
160

(a) Data of nine Swiss diagnostic laboratories, scale y-axis: 0–10%
(b) Data of two laboratories, using a different scale for the y-axis: 0–50%
Figure 8.4: Enterohaemorrhagic E. coli positivity by Swiss laboratory forthe entire study period (2007–2016)
161

8Tim
etrend
inpositivity
ofEHEC
from2007
to2016
Table 8.1: Odds ratios for a positive test result for enterohaemorrhagic Escherichia coli of the uni- and multivariablelogistic regression models, 2007–2016, Switzerland
N OR 95% CI aORa 95% CIAge group (year)Under 1 2’915 0.97 (0.67–1.40) 1.28 (0.72–2.28)1–4 8’855 1.88 *** (1.56–2.27) 3.38 *** (2.56–4.45)5–9 2’593 1.80 *** (1.34–2.43) 1.66 * (1.07–2.58)10–19 5’898 1.03 (0.79–1.35) 1.03 (0.71–1.49)20–39 21’971 1 140–59 19’404 1.00 (0.84–1.20) 1.03 (0.81–1.31)60–79 17’685 1.10 (0.92–1.32) 1.05 (0.82–1.34)Over 79 6’722 1.14 (0.89–1.45) 1.11 (0.81–1.52)
SexMale 38’209 1.03 (0.91–1.16) 0.93 (0.72–1.20)Female 47’834 1 1
Male, age group (year)Under 1 1’582 1.14 (0.52–2.47)1–4 4’962 0.92 (0.62–1.36)5–9 1’325 1.23 (0.67–2.27)10–19 2’827 1.14 (0.66–1.95)20–39 9’080 140–59 8’833 1.02 (0.70–1.47)60–79 7’408 1.27 (0.88–1.84)Over 79 2’192 1.17 (0.69–1.95)
Greater regionLake Geneva region 15’526 0.79 ** (0.66–0.93) 1.20 (0.89–1.60)
162

Table 8.1: (continued)
N OR 95% CI aORa 95% CI‘Espace Mittelland’ 20’000 1 1Northwestern Switzerland 15’273 0.39 *** (0.32–0.49) 0.69 ** (0.53–0.89)Zurich 14’439 0.79 ** (0.66–0.94) 0.75 * (0.58–0.98)Eastern Switzerland 6’474 0.70 ** (0.55–0.90) 0.88 (0.67–1.16)Central Switzerland 10’015 0.90 (0.74–1.09) 0.92 (0.70–1.21)Ticino 1’008 0.74 (0.43–1.30) 1.30 (0.73–2.32)
Test methodMultiplex PCR 57’168 1 1Antigentest 22’588 0.37 *** (0.31–0.45) 0.34 *** (0.26–0.44)PCR 6’247 1.56 *** (1.31–1.86) 2.31 *** (1.55–3.45)Culture 24 - -
Time trend 86’043 1.00 *** (1.00–1.01) 1.00 * (1.00–1.01)Test monthJanuary 6’040 0.50 *** (0.37–0.68)February 5’529 0.59 ** (0.44–0.80)March 6’137 0.58 *** (0.43–0.77)April 5’872 0.76 * (0.58–0.99)May 6’357 0.69 ** (0.53–0.90)June 7’084 0.77 * (0.60–0.99)July 7’321 1.08 (0.86–1.35)August 9’154 1September 8’919 0.68 ** (0.54–0.87)October 8’098 0.78 * (0.61–0.99)November 8’000 0.71 ** (0.55–0.91)
163

8Tim
etrend
inpositivity
ofEHEC
from2007
to2016
Table 8.1: (continued)
N OR 95% CI aORa 95% CIDecember 7’532 0.62 *** (0.47–0.81)
Seasonalitysin(d ∗ 2 ∗ π/T ) 0.84 *** (0.77–0.91) 0.89 *** (0.82–0.98)cos(d ∗ 2 ∗ π/T ) 0.83 *** (0.76–0.90) 0.81 * (0.75–0.89)
Test year2007 3’711 0.53 ** (0.37–0.76)2008 3’978 0.47 *** (0.32–0.67)2009 3’421 0.54 (0.38–0.79)2010 2’536 0.35 *** (0.21–0.59)2011 3’393 0.67 * (0.48–0.94)2012 4’483 0.63 ** (0.47–0.85)2013 6’152 0.82 (0.65–1.04)2014 10’246 0.74 ** (0.61–0.90)2015 21’484 0.85 * (0.74–0.99)2016 26’639 1
LaboratoryA 8’712 2.98 *** (2.44–3.64)B 8’861 3.15 *** (2.59–3.83)C 5’102 2.09 *** (1.60–2.75)D 7’181 2.13 *** (1.68–2.70)E 2’197 2.84 *** (2.02–4.00)F 2’904 4.80 *** (3.75–6.16)G 9’852 2.86 *** (2.36–3.48)H 38’796 1
164

Table 8.1: (continued)
N OR 95% CI aORa 95% CII 121 9.66 *** (4.46–20.95)J 1’438 6.14 *** (4.55–8.28)K 879 8.09 *** (5.81–11.27)
N, number of observations; OR, odds ratio; CI, confidence interval; aOR, adjusted odds ratioa Adjusted for sex, age group, method, temporal trend, seasonality (refer to supplementary material for details). Inter-action between age and sex. Random effect of laboratory* p<0.05; ** p<0.01; *** p<0.001
165

8Tim
etrend
inpositivity
ofEHEC
from2007
to2016
Figure 8.5: Predicted probability for a positive test outcome of an enterohaemorrhagic E. coli infection for the fullmultivariable model and a model without adjustment for methods across 10 years (in months) of the study period, 2007–2016, Switzerland
166

DiscussionWe investigated the apparent epidemic increase of EHEC infections asseen in the rise of case notifications in the NNSID. We calculated thepositivity as the rate of all positive diagnostic EHEC tests to the totalnumber of EHEC tests performed. The number of positive tests in oursample of 11 laboratories comprised 61.3% of all notified cases between2007 and 2016. The positivity gradually increased since 2007.
The impact of diagnostic tests on EHEC surveillanceThe increase in positivity coincides with the introduction of multiplexPCR panels as a new diagnostic method for EHEC detection in Switzer-land. The impact of changes in diagnostic approaches on public healthsurveillance has been highlighted before, especially in relation to theswitch from culture-dependent to culture-independent diagnostics forfoodborne diseases [14, 15]. Such diagnostic changes are especially im-portant for EHEC, as the case definitions for EHEC in the EuropeanUnion (EU) and in Switzerland are not limited to culture-confirmedcases, but include the detection of the Stx1 or Stx2 antigen or theirrespective genes [16]. Increases in EHEC notifications in Ireland areexplained by the shift from culture-dependent to culture-independentdiagnostic methods; the latter showing higher sensitivity and ability todetect non-O157 EHEC [17, 18].The 11 Swiss diagnostic laboratories in the study switched to culture-independent methods for EHEC detection before 2007. Our data showedthat the laboratories were using multiplex PCR panels (BD MAX,BioFire, Luminex) since 2007, but their introduction to routine dia-gnostics and subsequent replacement of other standard diagnostic meth-ods only happened between 2011 and 2015. These panels comprise thelargest proportion of all diagnostic tests performed for EHEC in Switzer-land ever since.
Implications of using multiplex PCR panels for EHECdiagnosisThe introduction of multiplex PCR panels for gastrointestinal pathogensis the next paradigm shift in diagnostics for foodborne diseases after theswitch to culture-independent tests.Our data shows that EHEC test numbers increased considerably sincethe introduction of multiplex PCR panels. The increase in test volume
167

8 Time trend in positivity of EHEC from 2007 to 2016
reflects a larger proportion of the population being screened for EHECresulting in more positives notified to the NNSID [10]. The availabilityand use of gastrointestinal multiplex PCR panels has a large impact ontesting behaviour. Previously, a test for EHEC was likely ordered by thetreating physician if the patient was a paediatric case and/or reporteda bloody stool and/or history of travel, due to higher probabilities todevelop severe complications such as HUS [19-21]. The increased andwider-spread use of multiplex PCR panels leads to a larger screeningof the population in two ways: (i) the suspicion of other gastrointest-inal pathogens, such as Campylobacter spp., now also leads to an EHECtest, if the laboratory uses such multiplex PCR panels for the standarddetection of Campylobacter ; (ii) the physician orders a gastrointestinalpanel directly when the patient presents with diarrhoea (i.e. syndromictesting). We assumed that the introduction of multiplex PCR for stooltesting, and hence, co-testing for EHEC lacking this pre-selection, wouldresult in a decreased positivity due to a lower pre-test probability for apositive test outcome. Surprisingly, this decrease is not reflected in ourdata. Instead, the increase in EHEC cases is disproportionally highercompared to the increase in test volume, resulting in the observed in-crease of positivity.Part of the increased testing could also be due to a change in physicians’testing behaviour following the raising public awareness for EHEC in-fections. However, laboratory experts reported that tests for EHEC arerarely ordered by the treating physician which suggests little changein physicians’ testing behaviour [22]. It seems, therefore, that positivetest results for EHEC tend to be largely accidental and their clinicalrelevance for the individual patient is questionable. Hence, the inter-pretation of these findings remains complex for the physicians and hasimplications on public health surveillance. Questions concerning the ap-propriate treatment (no antibiotics, no antidiarrhoeal medicines for ac-tual EHEC infections [23]) and respective reporting to the patient andthe NNSID still need to be addressed.Using multiplex PCR increases the number of cases found due to thehigher sensitivity of (multiplex) PCR compared to other conventionaldiagnostic methods, and the increased probability to detect co-infections[24-27]. A study among staff members of meat-processing companies inSwitzerland found that 3.5% were asymptomatic carriers of verotoxin-producing Escherichia coli (VTEC) [28]. Using multiplex PCR, suchcarriers could now be detected as having co-infections, whilst anothergastrointestinal pathogen is causing the symptoms. While it is clearthat changes in the diagnostic landscape can influence surveillance data
168

and trend monitoring, we believe this explains only part of the increasein EHEC case notifications in Switzerland.Indications for a real increase in EHEC incidence independent of thediagnostic test method are threefold: First, our logistic regressions andpredicted probabilities for a positive EHEC test outcome showed anincreasing trend between 2007 and 2016 even after adjusting for the dia-gnostic method applied. Second, the predicted probabilities for a positiveEHEC test show an upward trend for all methods (multiplex PCR, singlePCR, culture-based and antigen test) during the study period. Third,two of the laboratories, which introduced multiplex PCR panels late ornot at all, also showed an increase in positivity.Therefore, we cannot rule out a real epidemiological increase in incidenceof EHEC infections among the Swiss population.
Rising incidence of EHEC casesTo interpret a potential EHEC epidemic merits to also consider the epi-demiological situation of HUS in Switzerland, as EHEC infections arethe main cause to develop HUS. In Switzerland, reported HUS cases re-mained stable over the past years [10]. Thus, the increase in EHEC casenotifications observed in the NNSID might represent mainly mild casesand/or to some extent “asymptomatic” co-infections with another infec-tious agent of higher pathogenicity causing the symptoms. We have nodata on co-infections available to assess their relative contribution to theincrease in EHEC case notifications. Though, STEC patients associatedwith a recent outbreak in Finland were classified as rather mild cases[29]. Furthermore, the authors reported that testing for STEC increasedin Finland as well due to PCR screening of gastroenteritis patients.The change in disease severity could further be explained with changesin the distribution of serogroups found among cases: the proportion ofnon-O157 EHEC associated with human disease increased in Switzer-land, other European countries and the USA [30-32]. O157 EHEC casesare mostly associated with the development of severe disease (HUS) al-though the importance of non-O157 infections as a cause for HUS is be-ing increasingly recognised [33-35]. Age and sex distributions of EHECpatients in Switzerland remained stable during the observation period2007–2016. We, therefore, argue that risk groups for EHEC infectionsremained unchanged and are not the cause for an increase in incidence.In an international context, the USA also reported an increased incid-ence of STEC cases in 2017 compared to 2014–2016, though not to theextent as Switzerland [31]. The USA also noted a stable incidence of
169

8 Time trend in positivity of EHEC from 2007 to 2016
HUS in children in 2016 compared to 2013–2015, likely related to a de-crease of O157 cases.No other European country reported an increase in EHEC notificationnumbers to the extent observed in Switzerland (8-fold increase in casesbetween 2012 and 2016), except Romania, which had the highest relat-ive increase between 2012 and 2016 (1 to 29 cases), associated with anoutbreak in 2016 [32]. However, European countries’ notification ratesare as high as in Switzerland. In Finland, the increase in reported casesbetween 2012 and 2016 was 4-fold [32].
LimitationsWe selected our sample of laboratories, among other criteria, based ontheir contribution to the latest notifications. This choice favoured labor-atories which had switched to multiplex PCR and, therefore, may notrepresent the whole laboratory landscape in Switzerland.We noted that in recent years NNSID case numbers and the number ofpositive test results recorded in the laboratories’ individual datasets didnot match. Positive cases were either underreported to the NNSID, orthe NNSID excluded certain reports from their official statistics, or thenumber of positive test results in our sample was overestimated, e.g. dueto an insufficient exclusion of repeated tests.The correlation of “laboratory”, “region” and “diagnostic method”hampered the evaluation of spatial trends. Inferences on specific greaterregions in Switzerland largely depended on the laboratories chosen in oursample, e.g. the number of tests in each region per 100’000 populationeither relate to true differences in testing frequencies between regions orto under- or over-representation in our sample.
ConclusionSince 2015 the notification numbers for enterohaemorrhagic Escherichiacoli (EHEC) markedly increased in Switzerland. However, meaningfulinterpretation of such surveillance data is only possible if every aspectof the disease trajectory from changes in awareness (among physiciansand patients) and testing behaviour to the choice of diagnostic methodare taken into consideration.Due to previously infrequent, but targeted testing for EHEC and the lackof culture-based test confirmation, EHEC surveillance has been heavilyimpacted by recent changes in diagnostic methods. The switch from tar-geted EHEC testing to co-testing of virtually all stool samples submitted
170

for “basic stool bacteriology” using multiplex PCR panels has notablyincreased the test volume for EHEC. This development led to a largernumber of EHEC detection partly explaining the observed increase innotification numbers. However, the rise in EHEC cases is disproportion-ally high compared to the increase in test volume, resulting in a clearlyincreasing positivity for EHEC tests since 2007.Hence, our study findings suggest that there is a real increase and epi-demiological trend in EHEC infection incidence in Switzerland. Therecently observed changes in the frequency of different serogroups andthe stability of HUS cases suggests that the trend observed for EHEC ismostly attributable to rather mild cases.
Authors’ contributionsCS and DM designed and conceived the study. Data collection andprocessing was performed by AS, with FF and CS. FF conducted theanalysis. FF, AS, CS and DM interpreted the results. FF and AS wrotethe first draft of the mansucript. All authors contributed to the revisionsof the manuscript and approved the final version.
AcknowledgementsThe authors thank Christian Schindler (Swiss Tropical and Public HealthInstitute) for statistical advice, Adrian Egli (University Hospital Basel)for feedback on repeated testing and Angelika Fruth (Robert KochInstitute) for sharing experience on EHEC surveillance in Germany.Roger Stephan (Institute for Food Safety and Hygiene, University ofZurich) provided feedback on the manuscript. Various staff of the FOPHprovided detailed insights to the Swiss surveillance system and inform-ation on the notification data. The authors much appreciate the sup-port of the following laboratories providing data for the study: ADMedMicrobiologie / Reto Lienhard (La Chaux-de-Fonds), Analytica Med-izinische Laboratorien AG (Zurich), Bioanalytica (Lucerne), Dianalabs(Geneva), Laboratoire de bactériologie des HUG / Jacques Schrenzel(Geneva), IFIK / Sara Droz (Bern), MCL Medizinische Laboratorien(Niederwangen), Labor Synlab / André Burnens and Marcel Branden-berger (Lucerne), Viollier AG (Allschwil) and two other Swiss diagnosticlaboratories. The Federal Office of Public Health is gratefully acknow-ledged for providing the funding and the framework for this study.
171

8 Time trend in positivity of EHEC from 2007 to 2016
References1. WHO: Fact sheet E. coli [Internet]. 2018. http://www.who.int/en/n
ews-room/fact-sheets/detail/e-coli. Accessed 11 Apr 2018.2. Tarr PI, Gordon CA, Chandler WL. Shiga-toxin-producing Escherichia
coli and haemolytic uraemic syndrome. Lancet. 2005;365(9464):1073–1086. doi:10.1016/S0140-6736(05)71144-2.
3. Chart H. Are all infections with Escherichia coli O157 associatedwith cattle? Lancet. 1998;352(9133):1005. doi:10.1016/S0140-6736(05)60072-4.
4. Grif K, Orth D, Lederer I, Berghold C, Roedl S, Mache C et al. Im-portance of environmental transmission in cases of EHEC O157 caus-ing hemolytic uremic syndrome. Eur J Clin Microbiol Infect Dis.2005;24(4):268–271. doi:10.1007/s10096-005-1320-z.
5. Vernozy-Rozand C. Detection of Escherichia coli O157: H7 and otherverocytotoxin-producing E. coli (VTEC) in food. J Appl Microbiol.1997;82(5):537–551. doi:10.1111/j.1365-2672.1997.tb03584.x.
6. Buchholz U, Bernard H, Werber D, Böhmer MM, Remschmidt C,Wilking H et al. German outbreak of Escherichia coli O104:H4associated with sprouts. N Engl J Med. 2011;365(19):1763–1770.doi:10.1056/NEJMoa1106482.
7. Severi E, Vial F, Peron E, Mardh O, Niskanen T, Takkinen J. Com-munity-wide outbreaks of haemolytic uraemic syndrome associated withShiga toxin-producing Escherichia coli O26 in Italy and Romania: anew challenge for the European Union. Euro Surveill. 2016;21(49).doi:10.2807/1560-7917.ES.2016.21.49.30420.
8. Majowicz SE, Scallan E, Jones-Bitton A, Sargeant JM, Stapleton J,Angulo FJ et al. Global incidence of human shiga toxin–producingEscherichia coli infections and deaths: A systematic review andknowledge synthesis. Foodborne Pathog Dis. 2014;11(6):447–455.doi:10.1089/fpd.2013.1704.
9. Verordnung des EDI über die Meldung von Beobachtungen übertrag-barer Krankheiten des Menschen (818.101.126). Das EidgenössischeDepartement des Innern (EDI). 2015. Available from: https://www.admin.ch/opc/de/classified-compilation/20151622/. Accessed: 12Oct 2018
10. Hächler H, Stephan R. Auffälliger Anstieg der Meldezahlen entero-hämorrhagischer E. coli-Infektionen über die letzten Monate in derSchweiz: Einfluss neuer Multiplex PCR-Methoden in der Primär-Dia-gnostik? BAG Bulletin. 2015;52:988–990.
11. Binnicker MJ. Multiplex molecular panels for diagnosis of gastrointest-inal infection: Performance, result interpretation, and cost-effectiveness.J Clin Microbiol. 2015;53(12):3723–3728. doi:10.1128/JCM.02103-15
172

12. Schmutz C, Burki D, Frei R, Mäusezahl-Feuz M, Mäusezahl D. Testingfor Chlamydia trachomatis: time trends in positivity rates in the cantonof Basel-Stadt, Switzerland. Epidemiol Infect. 2013;141(9):1953–1964.doi:10.1017/S0950268812002567.
13. Bless PJ, Schmutz C, Sartori K, Mäusezahl D. Time trends of positivityrates from foodborne pathogen testing in Switzerland, 2003 to 2012.Swiss Med Wkly. 2017;174:w14569. doi:10.4414/smw.2017.14569
14. Kehl SC. Role of the laboratory in the diagnosis of enterohemorrhagicEscherichia coli infections. J Clin Microbiol. 2002;40(8):2711–2715.doi:10.1128/JCM.40.8.2711-2715.2002.
15. Cronquist AB, Mody RK, Atkinson R, Besser J, D’Angelo MT, HurdS et al. Impacts of culture-independent diagnostic practices on pub-lic health surveillance for bacterial enteric pathogens. Clin Infect Dis.2012;54(suppl 5):432–439. doi:10.1093/cid/cis267.
16. European Commission, Directorate-General for Health and Food Safety.Commission Implementing Decision (EU) 2018/945 of 22 June 2018on the communicable diseases and related special health issues to becovered by epidemiological surveillance as well as relevant case defini-tions (Text with EEA relevance.). 2018. https://eur-lex.europa.eu/eli/dec_impl/2018/945/oj. Accessed 10 August 2018.
17. Johnson RP, Clarke RC, Wilson JB, Read SC, Rahn K, Renwick SA etal. Growing concerns and recent outbreaks involving non-O157:H7 sero-types of verotoxigenic Escherichia coli. J Food Prot. 1996;59(10):1112–1122. doi:10.4315/0362-028X-59.10.1112.
18. Rice T, Quinn N, Sleator RD, Lucey B. Changing diagnostic meth-ods and increased detection of Verotoxigenic Escherichia coli, Ireland.Emerg Infect Dis. 2016;22(9):1656. doi:10.3201/eid2209.160477.
19. Clogher P, Hurd S, Hoefer D, Hadler JL, Pasutti L, Cosgrove S etal. Assessment of physician knowledge and practices concerning shigatoxin–producing Escherichia coli infection and enteric illness, 2009,Foodborne Diseases Active Surveillance Network (FoodNet). Clin InfectDis. 2012;54(Supplementary 5):S446–S552. doi:10.1093/cid/cis246.
20. Rivas M, Chinen I, Miliwebsky E, Masana M. Risk Factors for shigatoxin-producing Escherichia coli-associated human diseases. Microbio-logy Spectr. 2014;2(5). doi:10.1128/microbiolspec.EHEC-0002-2013.
21. Bless PJ, Muela Ribera J, Schmutz C, Zeller A, Mäusezahl D. Acutegastroenteritis and campylobacteriosis in Swiss primary care: Theviewpoint of general practitioners. PloS One. 2016;11(9):e0161650.doi:10.1371/journal.pone.0161650.
22. Schmutz C. Foodborne diseases in Switzerland: understanding the bur-den of illness pyramid to improve Swiss infectious disease surveillance.PhD thesis. Swiss Tropical and Public Health Institute and Universityof Basel, Basel, Switzerland; 2018. Forthcoming 2019.
173

8 Time trend in positivity of EHEC from 2007 to 2016
23. Davis TK, Van De Kar NCAJ, Tarr PI. Shiga toxin/verocytotoxin-pro-ducing Escherichia coli infections: Practical clinical perspectives. Mi-crobiol Spectr. 2014;2(4). doi:10.1128/microbiolspec.EHEC-0025-2014.
24. Khare R, Espy MJ, Cebelinski E, Boxrud D, Sloan LM, Cunningham SAet al. Comparative evaluation of two commercial multiplex panels fordetection of gastrointestinal pathogens by use of clinical stool specimens.J Clin Microbiol. 2014;52(10):3667–3673. doi:10.1128/JCM.01637-14.
25. Buss SN, Leber A, Chapin K, Fey PD, Bankowski MJ, Jones MK et al.Multicenter evaluation of the BioFire FilmArray gastrointestinal panelfor etiologic diagnosis of infectious gastroenteritis. J Clin Microbiol.2015;53(3):915–925. doi:10.1128/JCM.02674-14.
26. Stockmann C, Rogatcheva M, Harrel B, Vaughn M, Crisp R, Poritz Met al. How well does physician selection of microbiologic tests identifyClostridium difficile and other pathogens in paediatric diarrhoea? In-sights using multiplex PCR-based detection. Clin Microbiol Infect.2015;21(2):179.e9–e15. doi:10.1016/j.cmi.2014.07.011.
27. Harrington S, Buchan B, Doern C, Fader R, Ferraro M, Pillai D et al.Multicenter evaluation of the BD max enteric bacterial panel PCR assayfor rapid detection of Salmonella spp., Shigella spp., Campylobacter spp.(C. jejuni and C. coli), and Shiga toxin 1 and 2 genes. J Clin Microbiol.2015;53(5):1639–1647. doi:10.1128/JCM.03480-14.
28. Stephan R, Ragettli S, Untermann F. Prevalence and characteristicsof verotoxin-producing Escherichia coli (VTEC) in stool samples fromasymptomatic human carriers working in the meat processing industryin Switzerland. J Appl Microbiol. 2000;88(2):335-41.
29. Kinnula S, Hemminki K, Kotilainen H, Ruotsalainen E, Tarkka E, Sal-menlinna S et al.. Outbreak of multiple strains of non-O157 Shiga toxin-producing and enteropathogenic Escherichia coli associated with rocketsalad, Finland, autumn 2016. Euro Surveill. 2018;23(35):1700666.doi:10.2807/1560-7917.ES.2018.23.35.1700666
30. Fierz L, Cernela N, Hauser E, Nüesch-Inderbinen M, Stephan R. Char-acteristics of Shigatoxin-producing Escherichia coli strains isolated dur-ing 2010–2014 from human infections in Switzerland. Front Microbiol.2017;8:1471. doi:10.3389/fmicb.2017.01471.
31. Marder EP, Griffin PM, Cieslak PR, Dunn J, Hurd S, Jervis R et al.Preliminary incidence and trends of infections with pathogens transmit-ted commonly through food – Foodborne Diseases Active SurveillanceNetwork, 10 U.S. Sites, 2006–2017. MMWR Morb Mortal Wkly Rep.2018;67(11):324–328. doi:10.15585/mmwr.mm6711a3.
32. Annual Epidemiological Report for 2016: Shiga-toxin/verocytotoxin-producing Escherichia coli (STEC/VTEC) infection. European Centrefor Disease Prevention and Control ECDC, Stockholm. 2018. Availablefrom: https://ecdc.europa.eu/en/publications-data/shiga-
174

toxinverocytotoxin-producing-escherichia-coli-stecvtec-infection-annual. Accessed: 12 Oct 2018.
33. Käppeli U, Hächler H, Giezendanner N, Beutin L, Stephan R. Hu-man infections with non-O157 Shiga toxin–producing Escherichia coli,Switzerland, 2000–2009. Emerg Infect Dis. 2011;17(2):180–185.doi:10.3201/eid1702.100909.
34. Kuehne A, Bouwknegt M, Havelaar A, Gilsdorf A, Hoyer P, Stark Ket al. Estimating true incidence of O157 and non-O157 Shiga toxin-producing Escherichia coli illness in Germany based on notification dataof haemolytic uraemic syndrome. Epidemiol Infect. 2016;144(15):3305–3315. doi:10.1017/S0950268816001436.
35. Freedman SB, Xie J, Neufeld MS, Hamilton WL, Hartling L, Tarr PIet al. Shiga toxin–producing Escherichia coli infection, antibiotics, andrisk of developing Hemolytic Uremic Syndrome: A meta-analysis. ClinInfect Dis. 2016;62(10):1251–1258. doi:10.1093/cid/ciw099.
175


9 Infectious disease surveillance: Whatcan we conclude from analysingpositivity rates of diagnostic testing?
Claudia Schmutz1, 2
1 Swiss Tropical and Public Health Institute, Basel, Switzerland2 University of Basel, Basel, Switzerland
Working paper
177


9.1 Summary
9.1 SummaryInfectious disease surveillance systems are often based on reporting oflaboratory-confirmed cases. Apart from changes in actual disease incid-ence, there are various factors which can influence the number of casesreported such as changes in diagnostic methods. Reporting the numberof tests conducted and calculating the proportion of positive results isseen as a solution to overcome parts of these limitations associated withsurveillance data.Since 2016, laboratories in Switzerland are obliged to report annuallythe number of tests performed per month for selected notifiable diseasesto the Federal Office of Public Health (FOPH). Results from prelimin-ary analyses of these surveillance data are presented in this article withspecial emphasis on data usefulness and validity. Furthermore, the con-clusiveness of positivity studies in general is discussed.It is difficult to assess data validity of reports on testing frequency forseveral reasons: (i) multiple testing of the same patient during one dis-ease episode is likely to occur but cannot be quantified, (ii) positivityrates heavily depend on individual laboratories’ practices which are notknown by the FOPH, and (iii) the “laboratory landscape” in Switzerlandis highly complex and dynamic, making it difficult to compare reportsfrom case-based reporting and from aggregated reporting of test and casenumbers.Calculation of positivity rates can complement surveillance data andhelp interpreting trends. However, it does still not allow to concludeon population incidence. The current way of collecting information onthe frequency of testing in Switzerland requires individual data handlingand follow-up with the diagnostic laboratories. Therefore, better waysof collecting valid information on testing frequency should be identified.
9.2 IntroductionSurveillance systems for infectious diseases mostly rely on reports fromhealth professionals. In Switzerland, the Epidemics Act and its relatedordinances define which observations are to be reported by physiciansand by personnel of diagnostic laboratories [Das Eidgenössische De-partement des Innern, 2015a; Der Schweizerische Bundesrat, 2015b; DieBundesversammlung der Schweizerischen Eidgenossenschaft, 2012b]. Itadditionally defines the process and time limits for reporting and the in-formation to be reported. Many observations are notifiable upon labor-atory confirmation. Hence, the frequency of testing can heavily influence
179

9 What can we conclude from analysing positivity rates of diagnostic testing?
the case numbers seen in the surveillance system, as noted by others aswell [Gibney et al., 2017; Janiec et al., 2012; Kløvstad and Aavitsland,2015; Lambert et al., 2010; Van Cauteren et al., 2015b]. Negative testresults usually do not need to be reported. Making negative test resultsnotifiable and calculating test positivity rates (the proportion of positivetest results out of all tests performed) have been suggested to overcomethis limitation [Janiec et al., 2012; Kløvstad and Aavitsland, 2015; Lam-bert et al., 2010]. However, this will still not allow concluding on popula-tion incidence as several factors have an influence on the number of testsconducted. The physicians’ awareness for a disease, for example, can im-pact on testing frequency. Screening-like testing practices of physicianscan strongly increase test frequency, especially if disease episodes can bemild or even asymptomatic (e.g. Chlamydia trachomatis; [Kløvstad andAavitsland, 2015; Schmutz et al., 2013]). On the side of the laborat-ory, changing practices of co-testing of different pathogens (e.g. routineparallel testing of enterohaemorrhagic Escherichia coli (EHEC) whenCampylobacter spp., Salmonella spp. and Shigella spp. are requested)can result in changes in test numbers (chapters 7 and 8).We previously conducted different studies looking at trends in positiv-ity rates for selected notifiable diseases in Switzerland to better under-stand reporting trends observed in the National Notification System forInfectious Diseases (NNSID) (Bless et al. [2017]; Schmutz et al. [2013];chapter 8). We found increasing positivity rates for EHEC between 2007and 2016 (chapter 8), increasing positivity rates for Campylobacter spp.and decreasing positivity rates for Salmonella spp. between 2003 and2012 [Bless et al., 2017] and stable positivity rates for Chlamydia tracho-matis in one canton of Switzerland (Basel-Stadt) between 2002 and 2010[Schmutz et al., 2013]. Currently, we are investigating positivity rates forLegionella spp. All aforementioned notifiable diseases showed increasingtrends in the NNSID for the time period positivity was looked at, exceptfor Salmonella.With the implementation of the revised Epidemics Act in Switzerlandin January 2016, information on the number of tests performed has tobe reported annually for a number of notifiable diseases, additional tothe individual case reports by diagnostic laboratories. These laborat-ory statistics have to be supplied for Campylobacter , carbapenemase-producing Enterobacteriaceae, Chlamydia trachomatis, Francisella tular-ensis, hepatitis C virus (HCV) (since January 2018), hepatitis E virus(HEV) (since January 2018), human immunodeficiency virus (HIV), Le-gionella spp., Neisseria gonorrhoeae, Salmonella spp. and Zika virus(since March 2016) [Das Eidgenössische Departement des Innern, 2015a].
180

9.3 Methods
Before 2016, the number of tests performed had only to be reported forHIV, influenza and Legionella.The purpose of this article is twofold: first, a preliminary analysis of thedata from the first two years of reporting of laboratory statistics (sincethe implementation of the new Epidemics Act) is conducted with specialemphasis on the data’s usefulness and validity. Second, the relevance andsignificance of positivity studies to interpret surveillance data in generalis discussed. Hence, this chapter is a reflection on whether positivityrates and related denominator data are indeed the solution to overcomelimitations with surveillance data for interpretation of trends.
9.3 MethodsData on the “statistic of reports on laboratory findings” were sent bydiagnostic laboratories in Switzerland to the Federal Office of PublicHealth (FOPH) according to Swiss law. Data were entered into an elec-tronic database at the FOPH. Data from laboratory statistics on allnotifiable diseases were extracted for the years 2016 and 2017. For mostpathogens (all except Francisella tularensis and HIV), the number oftests, and thereof the number of positive results, stratified by diagnosticmethod and calendar month had to be reported. The official reportingform is available at www.bag.admin.ch/infreporting and in appendixD of this thesis.Data analysis was exploratory, focussing on data quality and validity.Case-based notification data for 2016 and 2017 were extracted for cer-tain diseases to compare case numbers from individual reports with thereported number of positive results from laboratory statistics.For the present article, data on Campylobacter was analysed exemplaryfor others. Data from laboratory statistics (“statistic of reports on labor-atory findings”) were extracted as of 3rd August 2018; case-based noti-fications as of 21st June 2018.
9.4 Results and discussionFor the year 2016, 52 laboratories reported a total number of tests per-formed for Campylobacter spp. of 110’971; thereof, 9’119 with a positiveresult. For the year 2017, 54 laboratories reported test numbers statingthat 105’348 tests for Campylobacter spp. were performed with a totalof 8’868 positive results. These numbers correspond to an overall crudepositivity rate of 8.2% and 8.4% in 2016 and 2017, respectively. Re-
181

9W
hatcan
weconclude
fromanalysing
positivityrates
ofdiagnostictesting?
Table 9.1: Number of positive tests for Campylobacter spp. according to individual “reports on laboratory findings”and according to “statistic of reports on laboratory findings” and total number of tests performed for Campylobacter spp.according to “statistic of reports on laboratory findings” as reported to the Federal Office of Public Health, 2016–2017,Switzerland
Year Method Number of positive tests Number of tests Positivity ratefrom casenotifica-tions
from laborat-ory statistics
from laboratorystatistics
(in %)
2016 Detection of antigen 0 3 112 2.682016 Detection of antigen (IgG) 0 6 261 2.302016 Detection of antigen (IgM) 0 4 261 1.532016 Detection of nucleic acid 719 2’299 26’459 8.692016 Culture/isolation 8’902 6’807 83’878 8.122016 Unknown/not specified 18 0 02016 Total 9’639 9’119 110’971 8.222017 Detection of antigen (IgG) 0 4 273 1.472017 Detection of antigen (IgM) 0 2 253 0.792017 Detection of nucleic acid 902 2’957 37’560 7.872017 Culture/isolation 8’211 5’905 67’262 8.782017 Microscopy 5 0 02017 Unknown/not specified 47 0 02017 Total 9’165 8’868 105’348 8.42
182

9.4 Results and discussion
ported test numbers stratified by test method are summarised in table9.1.
9.4.1 Multiple tests and reports per disease episodeAs far as possible, the FOPH merges multiple reports (on clinical orlaboratory findings) received for the same individual on one disease epis-ode into one record for analysis and reporting of surveillance data. Fur-thermore, reports from individuals living abroad and from cases not ful-filling the case definition are excluded. This procedure of data cleaningwas omitted in the present analysis given that laboratories are unlikely tofollow the same procedure when reporting the summary statistics for thenumber of tests and the number of positive tests performed during oneyear. Hence, case numbers from individual case notifications as reportedhere must not be compared with case numbers reported in previouslypublished analyses of surveillance data.There are several reasons why multiple notifications are sent to theFOPH for one disease episode: (i) Multiple samples were sent to andhave been tested by the laboratory. This can include multiple samples ofthe same type (e.g. 2–3 stool samples to increase sensitivity, recommen-ded especially for parasites; or to control disease evolution [e.g. antibodyresponse] or treatment outcome), and multiple samples of different spe-cimen types (e.g. urine and sputum to test for Legionella); (ii) Multipletests were conducted on one sample by the laboratory (either reques-ted by the physician or based on the laboratories’ routine procedures),for example to confirm a positive result (e.g. stool culture after positiveresult from polymerase chain reaction (PCR)) or to obtain additional in-formation (e.g. antibiotic resistance profile; serotyping); (iii) Additionalinformation (related to the test and/or the patient) became availableto the laboratory which was forwarded to the FOPH. The two first-mentioned reasons for multiple notifications could also be reflected inlaboratory statistics. However, how multiple tests for the same diseaseepisode are reported by the diagnostic laboratories, hence, how they arereflected in test and case numbers, is unknown to the FOPH (except ifspontaneously noted under “remarks” on the notification form) and islikely heterogeneous. Therefore, comparison of case numbers from indi-vidual notifications (report on clinical findings and/or laboratory find-ings) and reports on laboratory statistics (report on “statistic of reportson laboratory findings”) is hampered and must be interpreted with cau-tion.Similarly, laboratory practices of confirmatory testing (e.g. confirming
183

9 What can we conclude from analysing positivity rates of diagnostic testing?
every Campylobacter-positive result from multiplex PCR testing usingculture-based methods) can have a large impact on test numbers andon the number of positive findings depending on how this is reportedby laboratories – both, in individual case notifications and in reportson laboratory statistics. For example, some laboratories may report theindividual case only after culture-confirmation while others are report-ing PCR-positive findings already (potentially sending a second reportafter culture-confirmation). Remarks provided on laboratory statist-ics reporting forms indicate that some laboratories counted tests fromculture-confirmation after PCR-testing twice (in test numbers for bothdiagnostic methods) while others counted them only once (often unclearin which category).These laboratory practices of confirmatory testing (also referred to as“reflex testing”), together with the different handling of such multipletests for one disease episode by the FOPH and the laboratories mayexplain that substantially more positive tests using culture-based meth-ods were reported according to individual case notifications comparedto laboratory statistics while the contrary is the case for detection ofnucleic acid (i.e. PCR) (Table 9.1).
9.4.2 Data validity and positivity ratesOne option to evaluate validity of the data reported on “statistic of re-ports on laboratory findings” reporting forms is to compare the numberof positive tests with the number of positive tests reported according tocase-based notifications. This option and its associated challenges werealready discussed above. Another way to look at data validity is to cal-culate positivity rates, defined as the proportion of positive tests out ofall tests performed. While positivity rates are likely to differ betweendiagnostic methods applied, they are expected to be similar across labor-atories. Furthermore, variability of positivity rates should decline withincreasing test numbers for statistical reasons. Hence, when plottingpositivity rates by test numbers, observations should show the patternof a funnel. Figure 9.1 shows the positivity rates for Campylobacter bylaboratory, test method and year. Observations from PCR-diagnostics(“detection of nucleic acid”) and culture-based methods follow the ex-pected funnel pattern. Interestingly, however, some observations fromculture-based methods form a second “cloud”, characterised by low testnumbers and high positivity rates. It seems likely that these obser-vations represent laboratories applying culture-based methods only forconfirmation of PCR-positive results given the diagnostic procedures re-
184

9.4Results
anddiscussion
Figure 9.1: Positivity rate and total number of tests per year by test method for Campylobacter spp., according to reportson laboratory statistics, 2016–2017, Switzerland
185

9 What can we conclude from analysing positivity rates of diagnostic testing?
ported by laboratory experts (chapter 7) and what was discussed aboveon confirmatory “reflex” testing. This would explain the low test num-bers combined with high positivity rates.It is possible that a laboratory conducts only one culture-based test in agiven month. In this case, the positivity rate will either be 0 or 100%. Ifa laboratory reports that 7 out of 7 culture-based tests were positive in agiven month, this seems already less likely (but still possible). However,it could be suspected that the number of negative tests instead of thenumber of positive tests is reported together with the total number oftests. Hence, very high positivity rates could also point at erroneousdata. On the other hand, both, very high and very low positivity ratesare reasonable given common testing procedures (high: confirmatorytesting; low: screening) and hence, plausibility (internal validity) of val-ues reported on laboratory statistics forms can hardly be assessed. Onelaboratory (“lab B”) reported having performed 30 culture-based tests inMay 2017, thereof 29 with a positive result (Table 9.2). These numbersseem unlikely if regarded separately. However, 25 “reports on labor-atory findings” from a culture-based test were received from the samelaboratory in this month. Hence, the 29 positive test results reported assummary statistic are plausible again and suggest that this laboratoryapplies culture-based methods for confirmation of positive test resultsobtained through another diagnostic method (likely PCR). Yet, lab Breported only one test for detection of nucleic acid (and 20 tests each fordetection of IgG and IgM antibodies) in the same month.However, the 7 out of 7 positive results reported by “lab A” in August2016 are indeed explained by confirmatory testing, as indicated by a re-mark on the notification form: Lab A indicated performing PCR sinceMay 2016 and applying culture-based methods for “screening/control”.Furthermore, this laboratory reported having conducted 162 tests fordetection of nucleic acid (e.g. PCR) in August 2016 of which 14 werepositive.In summary, it seems impossible to evaluate internal validity of thedata reported on “statistic of reports on laboratory findings” notific-ation forms in the absence of detailed information from the laboratoryon diagnostic procedures.
9.4.3 Swiss “laboratory landscape”: Complex anddynamic
There are laboratories operating on a national level in Switzerland withdifferent branches throughout the country. For some companies, those
186

9.4Results
anddiscussion
Table 9.2: Selected records of “statistic of reports on laboratory findings” on Campylobacter spp. to illustrate difficultyin evaluating plausibility of data comparing the number of positive results with the total number of tests reported fromlaboratory statistics and with the number of cases reported by the corresponding laboratory in the framework of individualcase reporting, 2016–2017, Switzerland
Year Month Laboratory Method Numberof positivetests
Number oftotal tests
Positivity(in %)
Number of re-ports on labor-atory findings
2016 June lab A Detection of nucleic acid 12 172 7.0 02016 June lab A Culture/isolation 1 1 100 122016 July lab A Detection of nucleic acid 12 142 8.5 02016 July lab A Culture/isolation 3 3 100 142016 August lab A Detection of nucleic acid 14 162 8.6 22016 August lab A Culture/isolation 7 7 100 102017 April lab B Detection of nucleic acid 0 3 0 02017 April lab B Culture/isolation 19 21 90.5 192017 April lab B IgG antibody response 0 26 0 02017 April lab B IgM antibody response 0 26 0 02017 May lab B Detection of nucleic acid 1 1 100 02017 May lab B Culture/isolation 29 30 96.7 252017 May lab B IgG antibody response 0 20 0 02017 May lab B IgM antibody response 0 20 0 02017 June lab B Detection of nucleic acid 0 3 0 02017 June lab B Culture/isolation 52 55 94.5 432017 June lab B IgG antibody response 1 28 3.6 02017 June lab B IgM antibody response 0 28 0 0
187

9 What can we conclude from analysing positivity rates of diagnostic testing?
sites are autonomous and can almost be seen as separate enterpriseswhile other companies have central headquarters. Furthermore, thereare (mostly regionally operating) independent laboratories which forma corporate group. Reporting can be organised at the local sites ormanaged by headquarters. It is difficult to merge individual case re-ports (from “reports on laboratory findings”, reported on a daily basis)with summary statistics (from reports on “statistic of reports on laborat-ory findings”, reported annually) given this heterogeneity and frequentchanges in the “laboratory landscape” of Switzerland with rearrange-ments of such groups, company mergers, and discontinuation and start-up of businesses.For example, labs “C” and “D” belong to “lab group 1”. In 2016, noindividual-based “reports on laboratory findings” from “lab D” are re-gistered in the NNSID except for two cases in December while from “labC” only individual-based reports are available but no report on “statisticof reports on laboratory findings”(Table 9.3). FromMarch 2017 onwards,no reports at all from “lab C” were received. Instead, “lab D” reportedindividual-based laboratory findings but no laboratory statistics. Both,labs C and D are based in the canton of Ticino. It seems possible thatlab C discontinued its business or rather joined “lab group 1”, changedits name and moved to another place. However, this is purely speculat-ive.In conclusion, thorough understanding of the structure and operatingprocedures of the diagnostic laboratories in Switzerland is needed in or-der to correctly enter and merge notification data.
9.4.4 Comparable positivity rates from other studiesA previously conducted positivity study in Switzerland reported (age-and sex-standardised) positivity rates for Campylobacter increasing from7.6% in 2003 to 11.1% in 2012 [Bless et al., 2017]. This study collectedtest-based data from selected diagnostic laboratories directly. The find-ings from the current study suggest that the positivity rate decreasedagain. It has to be noted, however, that Bless et al. [2017] reportedslightly lower rates for crude data compared to age- and sex-adjustedrates. Additionally, Bless et al. [2017] analysed data from a sample of fivediagnostic laboratories which were selected based on the number of noti-fications received by the FOPH. This sampling procedure could have fa-voured laboratories with high positivity rates. Our preliminary analysisof summary statistics included data from all laboratories in Switzerlandcomplying with their obligation to report. Furthermore, multiplex PCR
188

9.4Results
anddiscussion
Table 9.3: Selected records of “statistic of reports on laboratory findings” on Campylobacter spp. to illustrate difficultyin merging records with case-based “reports on laboratory findings” by laboratory, 2016–2017, Switzerland
Year Month Laboratorygroup
Laboratory Method Numberof positivetests
Number oftotal tests
Number ofreports onlaboratoryfindings
2016 October lab group 1 lab C Culture/isolation 82016 October lab group 1 lab D Detection of nucleic acid 0 412016 October lab group 1 lab D Culture/isolation 8 852016 November lab group 1 lab C Culture/isolation 102016 November lab group 1 lab D Detection of nucleic acid 1 392016 November lab group 1 lab D Culture/isolation 8 632016 December lab group 1 lab C Detection of nucleic acid 12016 December lab group 1 lab C Culture/isolation 42016 December lab group 1 lab D Detection of nucleic acid 2 442016 December lab group 1 lab D Culture/isolation 3 151 22017 January lab group 1 lab C Culture/isolation 42017 January lab group 1 lab D Culture/isolation 12017 February lab group 1 lab C Culture/isolation 32017 February lab group 1 lab D Culture/isolation 32017 March lab group 1 lab D Culture/isolation 22017 April lab group 1 lab D Detection of nucleic acid 12017 April lab group 1 lab D Culture/isolation 52017 April lab group 1 lab D Unknown/not specified 1Note: There were other laboratories belonging to lab group 1 reporting Campylobacter .
189

9 What can we conclude from analysing positivity rates of diagnostic testing?
panels for routine testing of stool samples for gastrointestinal pathogenswere introduced in several diagnostic laboratories in Switzerland between2012 and 2016 and are likely to affect positivity rates (chapters 7 and8).A study conducted in Wales, United Kingdom (UK), reported a declin-ing trend in the proportion of positive stool samples for Campylobacterfrom 8.9% in 1998 to 7.5% in 2008 for samples obtained by general prac-titioners [Janiec et al., 2012]. At the same time, the stool sampling rateshave increased by 40%. The Welsh positivity rates are within the samerange as those found in Switzerland. The advantage of the Welsh systemis that they profit from a national database which is fed by all diagnosticlaboratories. Janiec et al. [2012] stated that “all laboratories in Walesfollow a standard operating procedure for investigation of stool samplesfor bacterial pathogens” and that “there was no change in testing pro-cedures throughout the study period”. This is in strong contrast to theSwiss situation where the majority of diagnostic laboratories are privatebusinesses and act independently.In Norway, mandatory case-based surveillance data for Chlamydiatrachomatis are supplemented by voluntary reporting of aggregated test-ing numbers stratified by age group and sex by diagnostic laboratories[Kløvstad and Aavitsland, 2015]. In contrast to Switzerland, Norwe-gian laboratories are requested to report “cases” rather than “laborat-ory tests”. Chlamydia cases are defined as “a person with one or morepositive laboratory tests for Chlamydia trachomatis in a urinary sampleor a sample from anus, cervix, urethra, or vagina within a period of 60days” [Kløvstad and Aavitsland, 2015]. Hence, the Norwegian systemtries to overcome the problem of repeated testing in the same individualat the reporting level rather than at the level of analysis. Collectingtesting numbers stratified by age group and sex allows identifying whichpopulation group is tested most frequently (e.g. to adapt campaigns pro-moting testing) and which population group yields the highest positivityrate, either due to most targeted testing or due to highest incidence.Lambert et al. [2010] proposed to introduce mandatory reporting oflaboratory tests with a negative result for influenza complementing re-ports on positive laboratory findings which are notifiable since 2001 inAustralia. They suggest collecting the same information for positive andnegative findings, thus, reporting of case-based data. Acknowledgingthat also positivity rates may be biased, e.g. due to co-testing of speci-mens for other pathogens, Lambert et al. [2010] argue that calculatingthe proportion of positive test results would still allow a better assess-ment of spatial and temporal trends in surveillance data.
190

9.4 Results and discussion
9.4.5 Positivity rates do not sufficeEven though denominator data such as test numbers are factors to beconsidered when interpreting surveillance data, they are not a generalsolution to overcome limitations associated with case reports of labor-atory-confirmed infections: it is still impossible to infer population in-cidence from case notifications if testing frequency is the only additionalinformation obtained. There are too many factors which affect trends intest numbers upwards or downwards – exemplified in the following for anupward trend: (a) a “true” change in disease incidence, leading to morepeople falling ill, seeking help and being tested, (b) a change in diseaseseverity (due to a change in pathogenicity or in human susceptibility),leading to more people seeking help and/or more people being tested, (c)a change in patients’ help seeking behaviour, leading to more consulta-tions and more people being tested, (d) a change in physicians’ “criteriafor testing” (e.g. based on symptoms or based on presence of selectedrisk factors) leading to a higher proportion of individuals being testedamong those consulting a physician, (e) a change in the prevalence of riskfactors “qualifying” for testing, (f) a change in laboratory diagnostics,e.g. from single pathogen testing to using a panel, hence samples arealso tested for this pathogen if another pathogen included in this panelwas requested by the physician, and (g) a change in one of the above-mentioned factors for a pathogen which is usually tested in parallel (e.g.with similar signs and symptoms and/or reasons for testing).It is unlikely that only one of the above-mentioned factors changes con-siderably while all others remain constant, and there are about the samenumber of reasons explaining a change in positive test results. Con-sequently, trends in positivity rates can arise from a number of combin-ations of changes in testing frequency and case numbers and hence, anupward, downward or stable trend in positivity cannot be stringentlyassigned to an upward, downward or stable trend in disease incidence.Still, certain combinations of increasing and decreasing test numbers andpositive results are more likely to result from an increase (or decrease)in disease incidence than others. For example, if both, the number oftests and the positivity rate increase (i.e. the number of positive resultsincreases more strongly than the number of tests performed), it is veryunlikely that the disease frequency in the population actually decreases.This situation was found for EHEC in Switzerland (chapter 8). Hence,looking at test numbers and positivity rates does provide additional in-formation and can help interpreting trends in surveillance data.Another important aspect to be considered for interpretation of posit-
191

9 What can we conclude from analysing positivity rates of diagnostic testing?
ivity rates is the pathogen and its characteristic: for instance, an in-crease in test numbers for Chlamydia trachomatis is much more likelyto result from a change in testing behaviour (e.g. screening additionalrisk groups) than an increase in test numbers for Neisseria meningitidis.For the latter, a change in the number of patients presenting with therespective symptoms seems more likely considering severity of invasivemeningococcal disease.
9.5 Conclusions: Pros and cons of collectinginformation on test numbers
An analysis of test and case numbers in parallel (hence, positivity rates)can neither confirm nor disprove what is seen in the surveillance sys-tem of positive case notifications. However, both measures can eitherlead to the same or to different conclusions. It is reassuring that trendsare interpreted correctly if conclusions drawn from looking at positivityrates are the same as those drawn from looking at notification data oflaboratory-confirmed cases alone.However, collecting information on test numbers is not straightforward.The first two years of reporting “laboratory statistics” (reporting of testnumbers and positive results thereof, reported annually as aggregatednumbers) have demonstrated that validity of data cannot be assessedeasily and that follow-ups with laboratories for collecting a lot of addi-tional information would be required to understand and clean the data.In summary, assessing test numbers (either as aggregated numbers orcase-based) in a notification system can help to identify (major) changesin testing frequency. Researching reasons for observed changes can thenbe initiated in a timely fashion. However, further research is requiredto identify appropriate ways of collecting such information on test num-bers on a routine basis given the highly dynamic sector of diagnosticlaboratories and the heterogeneity in laboratory practices observed inSwitzerland. It is questionable if the collection of denominator data inits current form is worth the effort of data acquisition and analysis.
192

Part III
ACUTE GASTROENTERITIS:PHYSICIANS’ CASEMANAGEMENT AND
PATIENTS’ HEALTH SEEKINGAND ITS INFLUENCE ONSURVEILLANCE DATA


10 General practitioners’ viewpoint onacute gastroenteritis,campylobacteriosis and Swissprimary care
The first section of this chapter (section 10.1) provides a summary (incl.excerpts) of the published article “Acute gastroenteritis and campylo-bacteriosis in Swiss primary care: the viewpoint of general practition-ers” [Bless et al., 2016]. The article discusses how general practitioners(GPs) in Switzerland perceive and manage patients consulting with acutegastroenteritis (AG)* and campylobacteriosis. Understanding this casemanagement is an important step in reconstructing the burden of illnesspyramid. Further results that were obtained during the interviews withthose GPs are presented in the second section (section 10.2). Thosefindings concern the GPs’ perception of their role in the Swiss healthsystem, their perception of the FOPH, the surveillance system, and theSwiss health system in general.
195

10 AG, campylobacteriosis and Swiss primary care
10.1 Summary of “Acute Gastroenteritis andcampylobacteriosis in Swiss primary care:the viewpoint of general practitioners”
Philipp J. Bless1, 2, Joan Muela Ribera3, Claudia Schmutz1, 2,Andreas Zeller4, Daniel Mäusezahl1, 2
1 Swiss Tropical and Public Health Institute, Basel, Switzerland2 University of Basel, Basel, Switzerland3 Partners for Applied Social Sciences (PASS) Suisse, Neuchâtel,Switzerland4 Centre for Primary Health Care, University of Basel, Basel, Switzer-land
The full text of this article was published in:
PLoS ONE (2016), 11(9):e0161650.doi: 10.1371/journal.pone.0161650This is an open access article distributed under the terms of the Creative Com-mons Attribution License, which permits unrestricted use, distribution, and re-production in any medium, provided the original author and source are credited.
196


10 AG, campylobacteriosis and Swiss primary care
IntroductionInfectious acute gastroenteritis (AG)* is caused by a wide range ofgastrointestinal pathogens. Public health is concerned particularly withfood- and waterborne pathogens which can cause disease outbreaks. Inthe Swiss National Notification System for Infectious Diseases (NNSID)a range of food- and waterborne pathogens are monitored. Notificationsof campylobacteriosis – the most frequently reported foodborne pathogenin Switzerland – increased, reaching almost 8’500 cases in 2012. Increas-ing trends of Campylobacter have also been observed in the EuropeanUnion (EU).Information in the NNSID about cases of notifiable AG is restricted tolaboratory-confirmed cases and information from diagnostic laboratoriesfor many foodborne pathogens. There is insufficient information avail-able on the burden of disease and the clinical presentation of infectiousAG at primary care and at population level.The aims of this qualitative study among Swiss general practitioners(GPs) were to investigate the case management of AG and campylobac-teriosis patients, to assess the influence of patients’ health care seekingbehaviour and of GPs’ clinical decision making on surveillance data andto collect estimates on the incidence of AG and campylobacteriosis atthe primary care level.
Materials and methodsFace-to-face interviews were conducted based on a semi-structured ques-tionnaire. The first part of the questionnaire covered GPs’ perceptionof AG and campylobacteriosis including the perceived magnitude of theburden, the public health relevance, clinical presentation, and perceivedpatients’ health care seeking behaviour, risk behaviours and risk groups.The second part of the questionnaire targeted case management focus-sing on diagnostic practices and treatment approaches and reasons for re-lated decisions. The questionnaire was re-structured and adapted basedon one key informant interview and five test interviews (four in German,one in French).Interviews were conducted by three female social scientists and onemale epidemiologist who were trained by a senior medical anthropologistin qualitative interviewing techniques. One-hundred-forty-six German-speaking and 29 French-speaking GPs who had managed campylobac-teriosis patients in a previous case-control study and six purposely re-cruited French-speaking GPs were invited for study participation withan information letter sent by postal mail. During a follow-up contact
198

10.1 Summary: “AG and campylobacteriosis in primary care”
by telephone, GPs were asked for verbal informed consent. Interviewswere conducted with consenting GPs usually in his or her own practice,lasted for 20–40 minutes and were tape recorded.Interviews were transcribed immediately after conduct and analysedwhile data collection was ongoing. The question guide was refined andemerging themes were included in subsequent interviews. Codes for dataanalysis were continuously developed and assigned to GPs’ narratives bya senior medical anthropologist using Weft-QDA software. Data ana-lysis followed the principles of inductive content analysis as required byGrounded Theory.The study was part of a project mandated by the Swiss Governmentstudying the epidemic increase of human campylobacteriosis and wasperformed under the Swiss Epidemics Act. Therefore, no ethical ap-proval was sought. The interviews focused solely on GPs’ professionalviews, not on any personal aspects or data of individual patients. Parti-cipants did not receive any financial compensation for their participation.
ResultsIn total, 51 German-speaking and 18 French-speaking GPs participatedin the study. Their median professional experience was 23 years (range:3–39 years). GPs considered AG to be of little relevance both, for thepatient and for public health in Switzerland. They stated that AG is im-portant in travel medicine but uncommon in daily practice. GPs statedthat campylobacteriosis patients occur in waves throughout the year,with peaks during summer linked to barbecuing and in winter linked tothe consumption of meat fondue. GPs acknowledged that campylobac-teriosis can be painful and disturbing even though it is a self-limitingand easy-to-treat disease. The type of work and social factors influencethe duration of absence from work even though the patient’s generalcondition is the main criterion. Sick leave lasts usually for several daysto more than one week.Perceived disease severity, past experiences, health insurance and theneed for a medical certificate influence whether the physician is consul-ted immediately (within hours) or after some time (days) after onset ofsymptoms of AG. Telephone consultations with the practice nurse and/orthe physician are common. Depending on the GP’s preference, the pa-tient is either advised to schedule a follow-up consultation by phone orat the practice, or to call again in case the symptoms do not improve.The first consultation of a patient with AG usually includes anamnesis,clinical examination and point-of-care diagnostics (e.g. C-reactive pro-
199

10 AG, campylobacteriosis and Swiss primary care
tein (CRP) level). Diagnostics based on faecal specimens depend on anumber of factors such as the patients’ symptoms, general condition,disease duration, inflammatory signs, and exposure history. It includesmainly stool cultures for Campylobacter spp., Salmonella spp. and Shi-gella spp.Symptomatic treatment with anti-motility drugs, oral (for simple cases)or intravenous (for severe cases) rehydration is very common. Antibiotictherapy is considered useful, but prescribed cautiously as AG is usuallyself-limiting and GPs are aware of the occurrence of antibiotic resistance.Reasons favouring antibiotic therapy are comparable to those for stooldiagnostics. Additionally, stool diagnostic results can influence antibi-otic therapy.Four distinct approaches to case management were apparent: “wait &see” including recommendations for diet, rehydration and symptomatictreatment, is mostly applied when the episode is recent and mild. “Treat& see” is based on the pragmatic reasoning that for antibiotic therapy(“treat”), there is no need to know the exact cause – if there is evidencefor bacterial infection (e.g. elevated CRP). The third approach startswith obtaining a stool specimen (“test”) but initiating empirical antibi-otic therapy before knowing the test result. This “treat & test” strategyallows adapting treatment once diagnostic results are available. Finally,by applying “test & see”, physicians try to avoid unnecessary antibi-otic treatment. Antibiotics are only prescribed if bacterial pathogensare identified and symptoms persist. Most physicians appeared to followvarious approaches depending on the respective situation. Hospitalisa-tion and referral to specialists are rather uncommon.
DiscussionGPs perceptions of the epidemiology of campylobacteriosis in terms ofseasonality (summer and winter peak), trends over the last 20 years (in-creasing trend; nowadays more frequent than salmonellosis) and age ofpatients affected (all age groups, but disproportionately frequent amongyoung adults) is in line with what is seen in the NNSID. GPs are awarethat their case management, apart from the patients’ healthcare seekingbehaviour, leads to underestimation of campylobacteriosis in the NNSID.The wide range of physicians’ self-estimated frequency of requesting stoolsamples is also observed among GPs within and between other countries.Financial factors (e.g. costs for diagnostics and health insurance deduct-ible) and the duration until results are available also affect the decision toperform stool diagnostics apart from factors consistent with published
200

10.2 The GPs’ role in the Swiss health system
literature on the clinical management of AG. Considering the lack ofcurative treatment for viral causes of AG, physicians make use of CRPlevels to distinguish bacterial from viral AG. An increased CRP level fa-vours bacterial AG and hence, the likelihood that the physician decidesto perform stool diagnostics. Patients with travel history and severelyaffected patients are likely over-represented in the NNSID consideringGPs’ diagnostic behaviour.Swiss GPs mainly follow the “wait & see” approach for patients con-sulting with AG. Due to the perceived long duration until culture-basedstool diagnostic results are available, GPs favour “treat & see” and “treat& test” over “test & see”. Ciprofloxacin (a fluoroquinolone) is frequentlyused for empirical antibiotic treatment of AG even though around 50%of Campylobacter spp. show resistance to fluoroquinolones.
ConclusionsTriage steps, reasons for and frequency of stool diagnostics need to beconsidered when interpreting NNSID data. Cases reported to the NNSIDare more likely to be severe or to have travelled abroad compared to un-der-ascertained cases. Current developments in laboratory methods fromculture-based stool diagnostics to multiplex polymerase chain reaction(PCR) panels could change physicians’ case management approachesand hence, the proportion and selection of cases seen in the NNSID.Knowledge of physicians’ case management and laboratory practices is,therefore, important for public health authorities to accurately interpretNNSID data.
10.2 Additional analysis & results: The generalpractitioners’ role in the Swiss healthsystem
10.2.1 GPs’ knowledge on campylobacteriosisGPs were not systematically asked about their knowledge on Campylob-acter spp. and campylobacteriosis. However, several statements duringthe interviews pointed at their perception of incubation period, riskfactors and clinical manifestation of the disease (the latter has alreadybeen discussed in the published article; section 10.1 and Bless et al.[2016]). While many facts mentioned were in agreement with published
201

10 AG, campylobacteriosis and Swiss primary care
literature, some statements pointed at uncommon, if not wrong, percep-tions of incubation period or risk exposures, or lack of knowledge.The incubation period for Campylobacter is said to be 2–5 days, some-times 1–10 days [Mahon and Patrick, 2015]. But:
“[Vermutete Fälle von Campylo-bacteriose] Der anamnestische
“[For suspected campylobacteri-osis] the anamnestic indicator is
Hinweis ist da der plötzliche Aus- the sudden onset. Approximatelybruch. Ungefähr 12 Stunden nach 12 hours after a meal. This iseiner Mahlzeit. Das ist verdäch- suspicious. Especially, if alsotig. Vor allem, wenn auch andere others show the same symptoms.”die gleichen Symptome aufwei-sen.” (MZ11)
The most common risk factors for campylobacteriosis are: internationaltravel, consumption of undercooked chicken, environmental exposureand direct contact with farm animals [Kaakoush et al., 2015]. In termsof contaminated food, poultry products (mostly chicken, but also tur-key and duck), unpasteurized milk, and water are common. Also othermeat – beef, veal and pork – can harbour Campylobacter . Even thoughchicken are frequently infected with Campylobacter , eggs are generallynot considered a risk factor for human infection [Fonseca et al., 2014;Kaakoush et al., 2015]. Apart from raw milk, other milk products werenot found to be contaminated with Campylobacter [Modi et al., 2015].
“Bei Campylobacter ist es na- “For Campylobacter it is thetürlich klassisch, dass es über classic that it is transmittedNahrungsmittel aufgenommen through food. So, the typical waywird. Also der klassische Weg ist is through eggs which are contam-über Eier, die befallen sind. Ti- inated. Tiramisù as an example.ramisù zum Beispiel. Oder Pou- Or chicken meat.”letfleisch.” (MZ04)
“Campylobacter ist oft im Pou- “Campylobacter is often foundlet, also. . . Hühnerfleisch und in poultry, so. . . chicken meatauch Eier sind häufig kontami- and also eggs are contaminatedniert. . . Das wissen die Leute frequently. . . This is often nothäufig nicht.” (PH04) known by people.”
[Über Nahrungsanamnese] [Talking about food anamnesis]“Häufig beim Campylobacter ist “Often with Campylobacter isPoulet. . . das Poulet, Glace auch chicken. . . the chicken, ice cream
202

10.2 The GPs’ role in the Swiss health system
noch relativ viel, und Softeis. . . ” quite frequently too, and soft ice(PH21) cream. . . ”
Interviewer : “Et quels sont les Interviewer: “And what arefacteurs de risque pour une in- risk factors for campylobacteri-fection au campylobacter ? Est-ce osis? Is there anything commonqu’il y a quelque chose en com- among these patients which wouldmun chez ces patients qui expli- explain this. . . ?”querait. . . ?”
Physician : “J’arrive pas à Physician: “I cannot tell. Sincedire. Comme on en voit tellement you see this so infrequently. Ipeu. Je sais pas.” (SFY09) don’t know.”
Interviewer : “Et dans leur Interviewer: “And concerning[patients avec Campylobacter] ali- their [campylobacteriosis patients]mentation, vous remarquez quelque nutrition, do you notice some-chose qui pourrait provoquer l’in- thing which could cause the in-fection ?” fection?”
Physician : “Non. C’est vrai Physician: “No. It is true thatqu’on leur demande toujours aussi one always asks if they ate some-s’ils ont mangé quelque chose de thing special which did not appearparticulier qui leur paraissait pas fresh, but this exposure is not al-frais, mais on ne trouve pas tou- ways established.”jours.”
Interviewer : “Une hypothèse Interviewer: “One hypothesisc’est que ça vienne de la viande is that it is from undercookedde poulet mal cuite.” chicken meat.”
Physician : “Le campylobac- Physician: “Campylobacter? Iter ? Moi j’avais la notion pour personally knew this for Salmon-les salmonelles mais pas pour le ella but not for Campylobacter,campylobacter, pour le poulet pas the chicken not cooked. . . ”cuit. . . ” (SFY12)
Interviewer : “Et les risque. . . Interviewer: “And the risks. . .ma question c’était plutôt, d’où my question was rather related tovient ce Campylobacter, est-ce the source of Campylobacter, isqu’il y a un comportement. . . ?” there a behaviour. . . ?”
Physician : “Oui, alors. C’est Physician: “Well, yes. It isvraiment l’ignorance totale, d’où really total ignorance from whereviennent ces bactéries. Est-ce que these bacteria originate. Doles gens consomment beaucoup people consume a lot of uncooked
203

10 AG, campylobacteriosis and Swiss primary care
de légumes pas cuits, donc des vegetables, like salads, which theysalades, qu’ils ne les lavent pas, don’t wash, that they. . . that theyqu’ils ne. . . qu’ils ne lavent pas don’t wash their fruit before eat-leurs fruits avant de les manger. ing. Sometimes, one simply doesParfois on a même pas le temps not have the time to make a hugede faire une immense enquête.” enquiry.”(SFY07)
Campylobacter is not considered to strongly proliferate in foods [Burgesset al., 2016].
“Man könnte mit einfachen “With very simple hygiene in-Hygienemassnahmen, wie [zum terventions Campylobacter couldBeispiel] das Fleisch nicht lan- be reduced, [for example] if it wasge herumliegen zu lassen, Cam- not lying around for a long time.”pylobacter deutlich reduzieren.”(MZ24)
10.2.2 GPs’ perspective on stool testingPhysicians usually order “packages” and follow laboratory recommend-ations of the laboratory they work with. GPs focus on the patient whendeciding for or against conducting stool diagnostics as expressed by onerespondent:
“Sagen wir, wir machen dieStuhlprobe und haben jetzt den
“Let’s say we do a stool cul-ture and we identify the pathogen
Erreger und es heilt ohnehin in and the illness recedes in five, six,fünf, sechs, sieben Tagen spontan seven days spontaneously any-aus. Was bringt uns das? Ausser, way. What does this help? Ex-dass man jetzt vielleicht wichtige cept that maybe we collected im-epidemiologische Daten gesam- portant epidemiological data. Butmelt hat. Aber für den Patien- this doesn’t help the patient muchten bringt das alles letztlich nicht ultimately. It is of little advant-viel. Zu wissen, welcher Erreger age to the patient to know whichim Stuhl ist oder welchen man pathogen is in the stool or whichin Ägypten aufgeschnappt hat, [pathogen] he caught in Egypt.”bringt dem Patienten ja relativwenig.” (MZ18)
204

10.2 The GPs’ role in the Swiss health system
The GPs’ approach seems pragmatic and based on experience:
Interviewer: “Welche Rolle Interviewer: “What role doesspielt die Erfahrung? Wenn ein experience play? When a patientPatient in Ihr Behandlungszim- comes to the practice, can youmer kommt, können Sie da schon already pre-assess him or her?auf den ersten Blick etwas über I refer to this famous medicalihn sagen? Ich meine diesen be- vision [visual and/or general im-rühmten medizinischen Blick, ob pression and feeling] whether orjemand krank ist oder nicht.” not someone is ill.”Arzt: “Ja. Das sieht man schon Physician: “Yes, you can no-
gut. Also, die Unterscheidung, ob tice this quite well, so the differ-jemand einen infektiösen Durch- entiation whether somebody hasfall oder eher einen Reizdarm infectious diarrhoea or rather anhat sieht man schon eher. Aber irritable colon. This you can seeman muss gewisse Sachen ein- quite well. But one must excludefach ausschliessen. Man muss si- certain conditions. One does cer-cher nicht bei jedem eine Stuhl- tainly not need to do stool bacteri-bakteriologie machen.” (MZ21) ology with every diarrhoea case.”
Factors related to the patients’ expectations and the physician’s assur-ance can also influence decisions on stool testing, apart from medicalsigns and symptoms, patients’ general condition, risk exposure, risk oftransmission, and assuring accurate treatment:
Arzt: “In der heutigen Zeit. . . Physician: “Nowadays peopledie Leute erwarten dies bis zu ei- expect it to a certain degree thatnem gewissen Grad, dass man ob- one documents it objectively withjektiv mit Laboruntersuchungen laboratory investigations.”dokumentiert, oder?”
Interviewer: “Und nicht nur Interviewer: “And not onlyaufgrund der Untersuchung und based on the examination andIhrer Erfahrung. . . ” your experience.”
Arzt: “Richtig.” (PH08) Physician: “Exactly.”
“[. . . ] pour avoir quand même “[. . . ] for still having certaintyune certitude de ce que je fais, of what I do, you see. After all,vous voyez ? Après, si ça tourne if it turns worse, one will saymal, on me dira vous n’avez fait you did not even perform an ana-aucune analyse.” (SFY07) lysis.”
Furthermore, also costs can play a role even though many physicians
205

10 AG, campylobacteriosis and Swiss primary care
stated that their decisions are not influenced by economic considerations.
Interviewer: “Oder gibt es auch Interviewer: “Or are there eco-ökonomische Faktoren, welche nomic factors as well which influ-die Testentscheidung beeinflus- ence the decision to do a test?”sen?”
Arzt: “Also die Ökonomie spielt Physician: “Well, the economyin diesem Sinne eine Rolle, in- plays a role in a sense that onedem man sagt, eine banale Durch- says that banal diarrhoea doesfallerkrankung erfordert keine not require specific diagnosis. Itspezielle Diagnostik. Es wird sym- is treated symptomatically andptomatisch behandelt und sollte should be over within 3 to 4 days,innerhalb von 3 bis 4 Tagen wie- self-limiting disease, self-purific-der vorbei sein, selbstlimitierende ation of the body.”Erkrankung, Selbstreinigung desKörpers.”
[. . . ] [. . . ]Interviewer: “Spielt auch die Interviewer: “Do considera-
Krankenkasse eine Rolle? Des tions regarding the patient’s healthPatienten?” insurance play a role, too?”
Arzt: “In diesem Falle jetzt In this case not. I reallynicht. Da habe ich mir jetzt wirk- have never thought about thislich noch nie Gedanken darüber and thought: ‘Wait, one mo-gemacht und gedacht: ‘Halt, Mo- ment, with this insurance I can-ment, bei dieser Krankenkasse not do a diagnostic test.’ Whatkann ich jetzt keine Diagnostik really counts is the clinic [clinicalbetreiben.’ Sondern da geht es ef- symptoms].”fektiv nach der Klinik.” (PH02)
“Pour la raison pour laquelle “For the reason why I do onlyje fais peu de cultures, c’est pour few cultures, it’s because of theles coûts. Ça coûte très cher une costs. Stool culture is very ex-culture de selles. Quand on a un pensive. If a patient with a highpatient qui a une franchise éle- deductible – no, let’s put it thisvée – non, disons, alors, s’il y way, when it is a low deductibleune franchise basse c’est pas juste it is not just for the insurance –pour l’assurance – mais pour un but for a patient if a diarrhoeapatient si une diarrhée par té- [is managed] by telephone it costsléphone ça lui fait 20 francs, him 20 francs, for a diarrhoeaune diarrhée au cabinet avec une in the practice with stool cultureculture de selles on est pratique- costs reach basically 200 francs! I
206

10.2 The GPs’ role in the Swiss health system
ment à 200 francs ! Je trouve que think that this represents enorm-ça représente des coûts énormes ous costs for the patient and forpour le patient et le système de the health system. And if in bothsanté. Et si dans les deux cas il cases he [the patient] is betterva mieux en 3 jours, je trouve after 3 days, I think it makes noque ça n’a pas de sens de faire sense to spend a lot of money ondes grosses dépenses de santé.” health.”(SF17)
Finally, also the (long) duration until results are available is likely to in-fluence testing behaviour, although few physicians explicitly mentionedthat it prevents them from testing:
“Und wir machen Stuhlkultu- “We do stool cultures ratherren eher sparsam. Stuhlkulturen sparingly. Stool cultures do notbringen uns überhaupt nichts. Bis come with any benefit: until wewir das Resultat haben ist der have the result the patient isPatient entweder wieder gesund either healthy again or. . . oneoder. . . man kann ja nicht war- cannot wait to give antibioticsten mit den Antibiotika, bis man until one finally has the resultendlich das Resultat hat [. . . ]” [. . . ]”(PH12)
10.2.3 The GPs’ perception of their roleSwiss GPs emphasise that their approach is patient-centred or even situ-ation-centred and they deal with “the patient in his or her individualcontext”. They also highlight the long-term relationship which is basedon mutual confidence and trust. This confidence is considered essentialand represents a key motivation and appreciation for working in primaryhealth care as opposed to working in a hospital.In line with their patient-centred approach, GPs’ decisions for or againststool testing largely depend on the expected impact of the results onsubsequent case management. Considerations on public health stay inthe background:
“Plus on en [culture de selles]fait, plus on va en trouver, mais
“The more [stool cultures] youdo, the more you will find, but
est-ce que ça va changer grand would this change a lot? The ideachose ? L’idée c’est quand même is still that it changes the atti-que ça change l’attitude, si un tude, if a test does not change
207

10 AG, campylobacteriosis and Swiss primary care
test ne change pas l’attitude, c’est the attitude, it is useless. Then,inutile. Après on dit considéra- people argue for reasons of publiction de santé publique, c’est pour health, and that GPs have to con-ça que vous êtes là, mais ça, si tribute to public health. If testingon nous prouve que c’est utile en widely/screening is proven bene-terme de santé publique de dé- ficial for public health, we can dopister toul le monde, on peut le it. Yet, it would still cost a lot.faire, mais c’est vrai que ça a un And will it change something?”coût, et est-ce que ça va changerquelque chose ?” (SFY05)
The physician working as a GP requires psychosocial skills. Further-more, he develops the “medical vision” (assessment of the patient basedon general impression and intuition) which helps to follow his or herpragmatic and experience- or intuition-based approach.
Arzt: “Ich sage immer, dass Physician: “I always say thatwir in der Hausarztpraxis keine in general practice, we do not do‘evidence-based Medizin’ machen, evidence-based medicine, but ansondern eine ‘intuition-based Me- intuition-based medicine.”dizin’ ”
[. . . ] [. . . ]Interviewer: “Sie haben vorhin Interviewer: “Before you said
etwas sehr Interessantes gesagt, something very interesting, espe-vor allem aus der sozialwissen- cially from a social science per-schaftlichen Perspektive. Sie ha- spective. You said, that there isben gesagt, dass es so ein Gefühl this special feeling when diagnos-gibt bei der Diagnose. . . Können ing. . . Can you describe this inSie dieses genauer beschreiben?” more detail?”
Arzt: “Also, Sie merken ein- Physician: “Well, you just no-fach, ob jemand krank ist oder tice whether someone is ill ornicht. . . ” not. . . ”
Interviewer: “Der medizinische Interviewer: “The medical vis-Blick?” ion?”
Arzt: “Das ist der medizinische Physician: “That is the med-Blick und das ist die Erfahrung, ical vision and that is the experi-oder? Das ist die Erfahrung! Und ence, no? That is the experience!diese muss man sich erwerben.” And this you have to acquire.”(MZ20)
“Vous savez, chaque praticien “You know, each practitionerfait son. . . son travail de façon does his. . . his work in a per-
208

10.2 The GPs’ role in the Swiss health system
personnelle,. . . en quelque sorte.” sonal fashion,. . . to a certain de-(SFY07) gree.”
Arzt: “Es ist sehr viel Soft- Physician: “There is a lot ofWissen dabei, also Soft. . . Ge- soft-knowledge involved, soft. . .fühlsentscheidungen. Manchmal in the sense of intuition. Some-weiss man selbst gar nicht, warum times we don’t even know ourselvesman so entscheidet. Durch die why we decided this way. Basedjahrelange Erfahrung, hat man on years of experience we some-manchmal die Nase dafür.” times have the flair for it.”(PH12)
“Vous savez, c’est toujours dif- “You know, it is always diffi-ficile en médicine d’être absolu- cult to be absolutely systematic inment systématique, c’est une im- medicine, it is also an impres-pression aussi.” (SFY11) sion.”
This dependence on intangible knowledge, soft skills and intuition couldexplain why some GPs feel that their discipline is neglected by colleaguesof other disciplines, and politics:
“[. . . ] dass die Hausarztmedi- “[. . . ] that primary care medi-zin, ähnlich wie in Deutschland, cine, similar to Germany, doesnicht die Wertschätzung geniesst, not get the recognition it mer-die sie eigentlich haben sollte. its. That specialists are undulyDass man einfach auch von der advantaged in terms of payment,Bezahlung, den Tax-Punkten her tax points. That is just like indie Spezialisten eigentlich über Germany. The specialist thenGebühr bevorteilt. Das ist genau earns the double or triple, butwie in Deutschland. Der Spezia- works the same time. I don’tlist verdient dann das doppelte want to deny this – also he isund dreifache und arbeitet die working a lot – but we do sogleiche Zeit. Ich will ihm das too! You cannot be surprised,auch nicht in Abrede stellen – after all, that fewer and fewerauch der arbeitet viel – wie wir people choose primary care medi-nun halt eben auch! Man darf cine. At some point this jeopard-sich dann nicht wundern, dass ises the broad health care, if wedann immer weniger Leute die [GPs] once do not exist anymore.Hausarztmedizin ergreifen. Man I don’t know if the political level isgefährdet damit irgendwann mal aware of this. Because basically itdiese breite Gesundheitsversor- is always difficult. . . A politician
209

10 AG, campylobacteriosis and Swiss primary care
gung, wenn es uns dann mal nicht closes a cantonal hospital whichmehr gibt. Ich weiss nicht, ob das is public – in Germany too, a uni-in der politischen Ebene so klar versity hospital that is closed –angekommen ist. Weil im Grunde that is less favourable for a politi-ist das natürlich immer schwieri- cian than if three, four practicesger. . . sie schliessen als Politiker are closing. This will get lost inein Kantonsspital, was staatlich the ambient noise. By way of ex-ist – auch in Deutschland, ein ample, if there are 15 or 13 orUnispital, das geschlossen wird 12 general practitioners in Vec-– das ist natürlich für sie als hta or Weinfelden. . . might notPolitiker ungünstiger, als wenn be of interest to the politician.drei, vier Arztpraxen zu machen. But if there is a hospital in thisDas geht so im Grundrauschen place or not. . . this is somethingunter. Ob es da in Vechta oder which is also noted by public me-in Weinfelden, exemplarisch ge- dia and could also go at the ex-sehen, 15 oder 13 oder 12 Hau- pense of the politician’s re-elec-särzte hat. . . interessiert ja den tion. So basically, one should getPolitiker vielleicht nicht. Aber away from this specialist-thinkingob es ein Spital hat in dem Ort and see the health care system asoder nicht. . . das ist schon wie- a pyramid which needs primaryder etwas, was dann in der Pres- health care [. . . ]”se auftaucht und vielleicht auchden Politiker die Wiederwahl kos-tet. Also im Grunde müsste maneigentlich eher von diesem Spe-zialisten-Gedanken weg kommenund das Gesundheitssystem eherwie eine Pyramide verstehen woes eine Grundversorgung braucht[. . . ]” (MZ18)
10.2.4 The GPs’ view of the Federal Office of PublicHealth
Physicians were also asked about their perception of the Federal Of-fice of Public Health (FOPH) apart from their approaches to diagnosisand treatment of AG and campylobacteriosis. This question about theFOPH was phrased very broadly, hence, not referring to a specific taskor field of responsibility or action of the FOPH such as health insurance,health policy, consumer protection or public health.
210

10.2 The GPs’ role in the Swiss health system
Opinions about the FOPH differed among GPs. Given that the questionabout the FOPH was phrased very broadly, the GPs’ perception waslargely dependent on the division or task of the FOPH the physicianwas referring to. Own past experiences with the federal authority wereinfluencing factors. Also personal preferences and expectations about in-formation sources (e.g. on guidelines) influenced the GPs’ opinion aboutthe federal office. Statements about the political aspects of the FOPH’swork (e.g. tariff structure or lack of support in strengthening familymedicine) and on personnel dealing with “administrative tasks” (e.g.permission to work as a GP in a private practice) were rather negativewhile the scientific collaborators and the parts on infectious diseases,disease surveillance and vaccination recommendations (including travelmedicine) tended to be perceived positively.Several GPs thought that the FOPH was not important or “far away” –sometimes in a negative, but often in a neutral sense. They felt that thefederal authority was too distal from primary health care implementa-tion to understand “real”, everyday issues. Furthermore, GPs have nointeraction with the FOPH during their daily work and, thus, are notaware of the tasks and responsibilities of the FOPH.Expectations on part of the GPs towards the FOPH are high during in-ternational emergencies (e.g. severe acute respiratory syndrome (SARS),H5N1 [bird flu] epidemic, H1N1 [swine flu] pandemic). In these situ-ations, physicians expect to get advice and support from the FOPH. Atthe same time, they claim that the FOPH overreacted with regard to itsresponse to epidemic and pandemic threats in the past. Consequently,they claim the population was scared and contacted the physician whothen had to deal with the anxiety of his patients.In terms of information provided by the FOPH on a regular basis, manyGPs considered the vaccination regimen as very useful, especially in thecontext of travel medicine. The weekly journal of the FOPH, the “BAGBulletin”, was appreciated very much by some physicians while othersthought it did not provide useful information. Some GPs claimed toread it every week while others were not sure if it still exists as theystopped receiving the printed version of the “blue booklet”. Physiciansfrequently mentioned Swiss medical journals (mostly sent to them forfree), continuous education and quality circles as useful sources to keepup-to-date.
211
10 AG, campylobacteriosis and Swiss primary care
10.2.5 GPs and the FOPH: Lack of mutualunderstanding
The qualitative study among Swiss GPs provided important insightsinto the case management of AG and campylobacteriosis in Switzerland.Additionally, the study allowed exploring the GPs’ perception of andexpectations towards the FOPH. Ideally, the findings of this latter partshould be complemented by looking at the perception of and expectationstowards primary care from the FOPH’s perspective. However, alreadythe unilateral point of view indicates that there is a need for improvingmutual understanding of tasks, responsibilities and challenges. Similarto laboratory experts claiming that the FOPH staff is “difficult to con-tact” (chapter 7), GPs feel that the FOPH is “distant”. This perceptionof distance could result from lack of interaction between the two actors(FOPH and GPs) of the Swiss health system but also from their differentperspectives (individual-based vs. population-based). The FOPH couldprobably improve its reputation among physicians by informing phys-icians more directly and proactively about its work and openly nameassociated challenges, e.g. showing the need to and interest in under-standing the current practice in diagnosis and treatment of infectiousdiseases. Given information sources used by Swiss GPs according to thestudy, the FOPH could use local medical journals as a communicationchannel. Medical societies, events for continuous education and localquality circles could be targeted for more personal contact platforms.
212

11 Acute gastroenteritis in primarycare: a longitudinal study in theSwiss Sentinel SurveillanceNetwork, Sentinella
Claudia Schmutz1, 2*, Philipp Justus Bless1, 2*, DanielMäusezahl1, 2, Marianne Jost3, Mirjam Mäusezahl-Feuz3, andthe Swiss Sentinel Surveillance Network
1 Swiss Tropical and Public Health Institute, Socinstrasse 57, 4002Basel, Switzerland2 University of Basel, Petersplatz 1, 4001 Basel, Switzerland3 Federal Office of Public Health, Schwarzenburgstrasse 157, 3003 Bern,Switzerland
* Claudia Schmutz and Philipp Justus Bless contributed equallyto this paper.
This article was published in:
Infection (2017), 45, 811–824.doi: 10.1007/s15010-017-1049-5This article is distributed under the terms of the Creative Commons Attribu-tion 4.0 International License (http://www.creativecommons.org/licenses/by/4.0/), which permits unrestricted use, distribution, and reproduction in any me-dium, provided you give appropriate credit to the original author(s) and thesource, provide a link to the Creative Commons license, and indicate if changeswere made.
213


Published article
AbstractPurpose Acute gastroenteritis (AG) leads to considerable burden ofdisease, health care costs and socio-economic impact worldwide. Weassessed the frequency of medical consultations and work absenteeismdue to AG at primary care level, and physicians’ case managementusing the Swiss Sentinel Surveillance Network “Sentinella”.Methods During the 1-year, longitudinal study in 2014, 172 physiciansparticipating in “Sentinella” reported consultations due to AG includinginformation on clinical presentation, stool diagnostics, treatment, andwork absenteeism.Results An incidence of 2’146 first consultations due to AG at primarycare level per 100’000 inhabitants in Switzerland was calculated for2014 based on reported 3.9 thousand cases. Physicians classifiedpatients’ general condition at first consultation with a median scoreof 7 (1=poor, 10=good). The majority (92%) of patients receiveddietary recommendations and/or medical prescriptions; antibiotics wereprescribed in 8.5%. Stool testing was initiated in 12.3% of cases; morefrequently in patients reporting recent travel. Among employees (15–64years), 86.3% were on sick leave. Median duration of sick leave was 4days.Conclusions The burden of AG in primary care is high and com-parable with that of influenza-like illness (ILI) in Switzerland. Workabsenteeism is substantial, leading to considerable socio-economicimpact. Mandatory infectious disease surveillance underestimates theburden of AG considering that stool testing is not conducted routinely.While a national strategy to reduce the burden of ILI exists, similarcomprehensive prevention efforts should be considered for AG.
BackgroundAcute gastroenteritis (AG)* is a common disease in humans worldwide.Case definition varies between studies and countries but mostly includessigns and symptoms of diarrhoea, vomiting, nausea, abdominal crampsor pain, fever, and blood or mucus in the stool [1-5]. AG can becaused by a wide variety of pathogens ranging from viruses and bac-teria to protozoa and other parasites [5]. A study in Austria identifiednorovirus, Clostridium difficile and rotavirus as the most frequent aeti-ological agents in patients consulting general practitioners (GPs) due toAG [4]. Norovirus, rotavirus, sapovirus and Campylobacter spp. were
215
11 Acute gastroenteritis in primary care, Sentinella
the most common organisms among cases of infectious intestinal disease(IID) presenting to the GP in the UK [6].Bacterial pathogens causing AG which have to be reported to the Na-tional Notification System for Infectious Diseases (NNSID) include pos-itive laboratory tests for Campylobacter spp., Salmonella spp., and Shi-gella spp. as well as clinical and laboratory reports of positively testedpatients with Listeria monocytogenes and enterohaemorrhagic Escheri-chia coli (EHEC). None of the above-mentioned viral causes of AG arenotifiable in Switzerland [7]. As a result, the NNSID underestimates thetrue burden of AG because of non-notifiable pathogens causing AG. Ad-ditionally, not every patient suffering from AG presents to a physician(under-ascertainment) and, the physician does not always initiate stooldiagnosis to investigate the aetiology of the illness (under-reporting) [8,9]. Hence, what is seen in the Swiss mandatory notification system rep-resents only an incomplete picture of the burden of disease due to AG.The determinants of under-ascertainment or under-reporting have beendescribed for several countries but not for Switzerland: In the UK, it isestimated that every case of IID reported to national surveillance repres-ents 9.5 cases presenting to a GP or 147 cases in the community [6]. Inthe Netherlands, 8% of patients with an IID visited a physician [10]. VanCauteren et al. [11] estimated that of 115 community cases of campylo-bacteriosis and 20 community cases of salmonellosis one case is reportedto the surveillance system in France. However, it has to be noted thatthe French surveillance systems are voluntary for these two pathogens.Swiss routine surveillance data suggest an increasing frequency of cam-pylobacteriosis and a decreasing frequency of salmonellosis [12]. Morethan half of campylobacteriosis patients in a case-control study ap-proached a physician within 3 days after onset of symptoms and 14.5%were hospitalised [13]. A subsequent qualitative survey among primarycare physicians described case management approaches including treat-ment strategies and stool diagnostic testing behaviours from the physi-cians’ perspective for patients with AG [8]. Four main approaches wereidentified of which only two – the “test & wait” and the “test & treat”approaches – include stool specimen testing and, hence, would result incase registration in the mandatory disease surveillance system in case ofa positive test outcome. Healthcare costs for AG in Switzerland wereestimated at e29–45 million annually [14].In Switzerland, we lack data on under-ascertainment and under-report-ing. Under-ascertainment refers to people not seeking healthcare and,hence, not being captured by the surveillance system as defined by Gib-bons et al. [9]. Under-reporting is defined as people seeking healthcare
216

Published article
but not being reported because of under-diagnosis – not diagnosing ormisdiagnosing the infection or pathogen – or under-notification – failureto report positive diagnoses [9].This study within the Swiss Sentinel Surveillance Network, Sentinella,aimed at understanding the lower levels of the burden of illness pyramidand addressing the incidence of AG in a broader context. Specifically,the study aimed at understanding determinants of under-diagnosis by(1) estimating the incidence and burden of AG seen at the primary carelevel, (2) describing the physicians’ case management (diagnostics, treat-ment) of AG patients and (3) estimating the work loss due to AG of casespresenting to a physician.
MethodsA 1-year, longitudinal study in Sentinella, during the year 2014, wasconducted asking physicians to report cases of AG on a weekly basis(later referred to as data from the “weekly questionnaire”). A question-naire about disease characteristics, stool testing, and treating strategieswas completed for a subset of cases (later referred to as “supplementaryquestionnaire”).
Study settingSentinella is a voluntary surveillance system and research network of pri-mary care physicians existing since 1986 which is operated and fundedby the Federal Office of Public Health (FOPH). Physicians are organ-ised in six geographical regions, each having its representative withinthe Sentinella steering committee. The steering committee, consistingof physicians and researchers of academic primary care institutes, meetsregularly to set the research priorities and to decide on submitted pro-jects. Our study was accepted to run in 2014.During the Sentinella-year 2014, 172 physicians (47% general practi-tioners, 37% internists and 16% paediatricians; thereafter referred to as“Sentinella-physicians”) covering entire Switzerland were active in thenetwork. In Switzerland, 6’930 physicians were practising in the ambu-latory sector with the main specialty “general internal medicine” (sum-marising general practitioners and internists) or “paediatrics” in 2014according to the Swiss medical association FMH [15]. Among these, 86%were practicing in general internal medicine and 14% in paediatrics.
217

11 Acute gastroenteritis in primary care, Sentinella
Case definitionA case of AG was defined as (a) a patient consulting a Sentinella-phys-ician for the first time during the illness episode and suffering fromdiarrhoea (at least 3 watery or pasty stools daily; for at least 24h but14 days the longest) likely due to an infectious cause or (b) a patientconsulting a Sentinella-physician for the first time during the illness epis-ode with vomiting and abdominal cramps without significant diarrhoea,likely due to an infectious cause. Patients were excluded if diarrhoeawas due to a known gastrointestinal disease (e.g. Crohn’s disease, ul-cerative colitis, coeliac disease), medication intake (e.g. antibiotics) orfood intolerance. Also patients with persistent diarrhoea (>14 days), orif vomiting was due to pregnancy, were excluded.
Data collectionSentinella-physicians reported basic data on patients suffering from AGon a weekly questionnaire, and more detailed data for a subsample ofpatients through a supplementary questionnaire which were availablein German and French. German versions of the weekly (part on AGonly) and supplementary questionnaires are available online (see elec-tronic supplementary material 1). The questionnaires were piloted with10 general practitioners.The weekly questionnaire included information on sex, date of birth,stool testing and hospitalisation of all AG patients (see case definition)seen in the corresponding week. The supplementary questionnaire con-tained additional questions on employment status, dates of symptomonset and consultation(s), signs and symptoms until first consultation,general condition, antibiotic and symptomatic treatment, stool testing,sick leave, hospitalisation, sequelae, and selected risk exposures in the 7days preceding symptom onset.Weekly questionnaires were available on paper and electronically accord-ing to the Sentinella standard procedure (method chosen by physician).More than half of the Sentinella-physicians reported electronically, allothers reported on paper. Supplementary questionnaires were availableon paper only. While weekly paper questionnaires were sent to the FOPHonce a week by postal mail according to routine procedures, Sentinella-physicians were asked to send the supplementary questionnaire as soonas they considered the corresponding case as “completed”. Weekly elec-tronic questionnaires were entered directly into the Sentinella-databaseby the Sentinella-physician.Information available on Sentinella-physicians included the physicians’
218

Published article
specialty and location of practice. Sentinella-physicians additionally re-ported the total number of daily physician-patient-contacts (PPCs) onthe weekly questionnaire. A PPC is defined as each consultation inde-pendent of place (in practice or as domiciliary visit) and time (during oroff consultation-hour or on emergency service) and serves as denominatorfor calculating disease incidence rates.
Subsample for supplementary questionnaireWe expected that each Sentinella-physician would report around twoAG cases per week based on the pilot testing and discussions with phys-icians. Assuming that 150 physicians report during 48 weeks, 14’400cases were expected during the 1-year-study period. To reduce the an-ticipated work load for Sentinella-physicians but still reaching an ap-propriate sample size allowing for estimates with acceptable precision,we decided to apply the supplementary questionnaire to a subsample ofcases. The targeted subsample size was set at 4’800 cases (one-third of allcases). A sampling scheme was defined whereby every Sentinella-physi-cian had to complete supplementary questionnaires during four consec-utive weeks four times a year (=16 weeks per physician per year). Werandomly assigned each Sentinella-physician a sampling pattern withsampling periods distributed equally over the year, hence not allowingfor two consecutive sampling periods.Case numbers in the first half of the study period were lower than ex-pected necessitating the sampling scheme to change to full sampling.Starting from week 25 (starting on 14.06.2014), supplementary ques-tionnaires had to be completed for every AG patient until the end of thestudy.
Data entry and analysisWeekly questionnaires on paper forms and all supplementary question-naires were entered into the electronic Sentinella database at the FOPH.Ten percent of supplementary questionnaires was randomly selected fordouble entry to assess data quality. Double entries of questionnaireswere compared and discrepancies were eliminated by re-checking againstthe original paper forms.Cases of Sentinella-physicians who reported PPC for less than 75% ofthe weeks during the study period, i.e. <39 of 52 weeks were excludedfrom data analysis. This rule and cutoff value for regularly reportingphysicians are standard for analyses of Sentinella data. Additionally,
219

11 Acute gastroenteritis in primary care, Sentinella
cases not fulfilling the case definition or cases where the Sentinella-phys-ician spontaneously indicated a final diagnosis not in agreement withinfectious AG were excluded from the analysis of supplementary ques-tionnaire data.Data of weekly questionnaires were analysed descriptively. We calcu-lated the average number of cases per Sentinella-physician and week andthe number of initial consultations due to AG per 1’000 PPCs per week.Additionally, we estimated the incidence and total number of first con-sultations due to AG at the primary care level for 2014 in Switzerland bythe standard extrapolation of the Sentinella system which is describedelsewhere [16].Due to the mid-study change in the sampling scheme of supplement-ary questionnaires, analyses of the supplementary questionnaire datawere weighted according to the sampling probability: information fromthe supplementary questionnaire of cases reported during the first halfof the study period was analysed using a sampling weight of 3.25 (aseach physician was required to submit a supplementary questionnairefor each case seen during 16 of 52 weeks; 1/(16/52) = 3.25) while in-formation reported during the second half had a sampling weight of 1(supplementary questionnaire required for every case). Point-estimatesincluding 95% confidence interval (CI) and interquartile ranges (IQR) formedians are reported for weighted analyses. Data from supplementaryquestionnaires were analysed descriptively and differences were assessedfor significance by weighted, univariable logistic regression. For all ana-lyses involving employment status, only patients aged 15–64 years wereconsidered. Data were analysed and represented graphically using Stata13.1 (StataCorp.). Maps were created using ArcGIS 10.2.1 for desktop(Environmental Systems Research Institute, Inc., Esri).
ResultsPhysician and patient characteristicsIn total, 3’867 cases of AG were reported on weekly questionnaires by172 participating Sentinella-physicians. After exclusion of cases repor-ted by not regularly reporting Sentinella-physicians (130 cases) and forother reasons (3 cases), 3’734 cases were used for analyses of weekly ques-tionnaires. 2’200 cases were retained for the analyses of supplementaryquestionnaires. The detailed inclusion process is described in figure 11.1.Out of 172 physicians registered in the Sentinella system in 2014, 154of the regularly reporting physicians reported at least one case of AG
220

Published article
Table 11.1: Basic characteristics of acute gastroenteritis cases reported onthe weekly and supplementary questionnaires by physicians from the SwissSentinel Surveillance Network in 2014
Weeklyform
Supplementary questionnaire
Cases included inanalysis (N )
3’734 2’200
Proportion of malecases, % (95% CI)
50.2 50.6 (48.0–53.3)
Median age, years(IQR)
21 (5–41) 22 (6.0 [95% CI 2.6–9.4]–43.0[95% CI 38.1–47.9])
Physicians’ area ofspecialisationGeneral medicine, %(95% CI)
35.3 37.5 (29.9–45.8)
Internal medicine, %(95% CI)
26.7 27.6 (21.1–35.4)
Paediatrics, % (95%CI)
38.0 34.9 (25.7–45.3)
Stool testing initiated,% (95% CI)
10.9 12.3 (10.1–14.8)
Hospitalised, % (95%CI)
2.0 2.7 (1.9–3.7)
on the weekly questionnaire. Over the whole study period, individualphysicians reported up to 400 cases (median 17, IQR 7–29). A total of144 physicians submitted at least one supplementary questionnaire of acase fulfilling the case definition (Figure 11.1). The subsample of caseswith supplementary questionnaires was comparable to cases reported onweekly forms in terms of basic patient characteristics (Table 11.1).Median age of AG cases was 21 years (IQR 5–41 years). Children, ad-olescents and young adults (age groups <1, 1–4, 5–9, 10–14, 15–19 and20–29 years) were overrepresented among AG cases consulting a physi-cian compared to the frequency of those age groups in the general Swisspopulation for both genders (Figure 11.2). In the age group of 10–14year olds, males were more frequent than females. In adults, femalecases aged 20–29 years were most frequently reported while in males the30–44 year age group predominated.
221

11 Acute gastroenteritis in primary care, Sentinella
Figure 11.1: Study profile of notified cases and reporting physicians. Acutegastroenteritis study, Swiss Sentinel Surveillance Network, 2014.AG acute gastroenteritis, PPC physician-patient contact
222

Published article
Figure 11.2: Age distribution by sex among acute gastroenteritis cases repor-ted by Sentinella-physicians on weekly and/or supplementary questionnaires.Swiss Sentinel Surveillance Network, 2014; age distribution of Swiss population(official numbers [17]) added for comparison
223

11 Acute gastroenteritis in primary care, Sentinella
Burden of AG at primary care levelEach week, 15–139 cases (median 69, IQR 54–80) were reported (Fig-ure 11.3). Case numbers were highest during the first weeks of the year(maximum in week 4) and decreased thereafter. A median rate of 5.4first consultations due to AG per 1’000 PPCs per week (IQR 4.6–6.7)was observed. The notifications correspond to 2’146 first consultationsdue to AG at primary care level per 100’000 inhabitants or 174’610 firstconsultations due to AG in Switzerland in 2014 using the standard ex-trapolation method of the FOPH for Sentinella data. Incidence (of firstconsultations) by Sentinella-region is displayed in figure 11.4.
Health care seeking and clinical presentationThe median time from symptom onset to first consultation was 2 days(95% CI 2.0–2.0, IQR 1.0 [95% CI 1.0–1.0]–3.0 [95% CI 2.4–3.6]). Themajority of patients (87.9% [95% CI 85.6–89.9]) suffered from diarrhoea(Table 11.2). Loss of appetite was reported for 63.5% (95% CI 58.4–68.4), abdominal pain or cramps for 61.1% (95% CI 57.0–65.1), nauseafor 60.4% (95% CI 56.6–64.1) and vomiting for 57.5% (95% CI 54.3–60.7) of patients. Less frequently reported signs and symptoms includedflatulence, fever, dehydration and headache.The majority of patients consulted the Sentinella-physician only once(79.6%, 95% CI 76.5–82.4) (Table 11.2). The median general conditionof cases as reported by Sentinella-physicians at the time of first con-sultation was 7 (95% CI 6.5–7.5, IQR 5.0 [95% CI 4.5–5.5]–9.0 [95% CI8.5–9.5]) on a rating scale from 1 (poor) to 10 (good). Overall, 86.3%(95% CI 83.1–89.0) of employed patients were unable to work. The oddsfor a good general condition (7 or above) was lower for employed patientscompared to unemployed patients although not significantly (odds ratio[OR] 0.76, 95% CI 0.52–1.11, p=0.159). The median duration of sickleave was 4 days (95% CI 3.8–4.2, IQR 3.0 [95% CI 3.0–3.0]–5.0 [95%CI 4.5–5.5]). For all except seven cases, the duration of sick leave wasbelow 15 days.The hospitalisation rate was 2.7% (95% CI 1.9–3.7). The highest hos-pitalisation rate was observed for the >74 year age group (11.5%, 95%CI 6.4–19.9) whereas for the remaining age groups the rates were below4%. For 2.0% (95% CI 1.4–2.9) of patients, Sentinella-physicians repor-ted sequelae, like dehydration, diverticulitis, or colitis. No deaths due toAG were reported.
224

Published article
Figure 11.3: Acute gastroenteritis cases reported by physicians from theSwiss Sentinel Surveillance Network in 2014 (28.12.2013–26.12.2014): weeklycase numbers (bars) and number of initial AG consultations per 1’000 physi-cian-patient contacts (PPCs, “consultations”) per week (line).Vertical, dashed line: date of change of sampling scheme (from subsample ofcases with supplementary questionnaires to supplementary questionnaire forevery reported case)
225

11 Acute gastroenteritis in primary care, Sentinella
Figure 11.4: Calculated incidence of first consultations due to acute gast-roenteritis at primary care level in Switzerland by Sentinella-region, based onstandard extrapolation. Swiss Sentinel Surveillance Network, 2014.Note: an outlier (one physician reporting 400 cases) was excluded from thisextrapolation by region.Source of map shapefile: Swiss Federal Office of Topography
226

Published article
Stool diagnostics and resultsSentinella-physicians reported the initiation of stool specimen testing in12.3% (95% CI 10.1–14.8); in 11.6% (95% CI 9.5–14.1) of cases they in-dicated that the sample was actually sent off (Table 11.3). The odds forstool testing did not differ between sexes ([female vs. male]: OR 1.13,95% CI 0.84–1.50, p=0.423) but differed by age group (p<0.001): Theproportion of stool testing was generally higher among older age groups.Paediatricians initiated stool testing less frequently (OR 0.32, 95% CI0.18–0.55, p<0.001) than general practitioners. The odds of initiatingstool testing did not differ significantly for internists compared to gen-eral practitioners (OR 1.13, 95% CI 0.71–1.78, p=0.610).Even though the questionnaire explicitly asked for the main reason forinitiating stool testing, multiple answers were given for 31.0% (95% CI24.9–37.8) of cases. The three most frequent reasons mentioned wereprotracted course of disease (29.4%, 95% CI 21.9–38.2), poor generalcondition (11.5%, 95% CI 6.9–18.4) and due to a specific symptom (9.5%,95% CI 4.6–18.6) when excluding those with multiple answers. Whenconsidering also multiple answers, staying abroad before symptom onsetwas the third most frequent reason (data not shown).Travelling within the 7 days preceding symptom onset was reportedfor 9.0% (95% CI 7.4–10.8) of cases. Patients with recent travel his-tory were significantly more likely to undergo stool testing than patientsnot reporting any recent travels (OR 3.60, 95% CI 2.47–5.33, p<0.001).Among patients with recent travel history, 30.0% (95% CI 22.7–38.6)were tested while for patients without travel to a foreign country in the7 days preceding the symptom onset this proportion was 10.6% (95% CI8.6–13.0). “Staying abroad” was indicated as the main reason for testingfor 40.8% (95% CI 24.4–59.6) of patients with a travel history. Protrac-ted course of disease was the second most often mentioned reason forstool testing among patients with travel history abroad (17.4%, 95% CI7.2–36.2).A positive test result was reported for more than one-third (35.9%, 95%CI 29.2–43.2) of tested patients while for the remaining 64.1% (95% CI56.8–70.8) of patients test results were negative or not specified. Themost frequently identified pathogen was Campylobacter spp. (50.8%,95% CI 39.2–62.3) followed by norovirus (10.9%, 95% CI 5.0–21.9), andBlastocystis spp. (9.6%, 95% CI 4.0–21.1) (Table 11.3). Other patho-gens identified included rotavirus, Clostridium spp., Entamoeba spp.,pathogenic E. coli, Candida spp., Salmonella spp., Giardia spp., mi-crosporidia, adenovirus, Aeromonas spp. and hepatitis E virus. Two
227

11 Acute gastroenteritis in primary care, Sentinella
Table 11.2: Characteristics of cases with acute gastroenteritis at first con-sultation and number of consultations as reported by primary care physiciansfrom the Swiss Sentinel Surveillance Network, 2014
Number ofcases [n]
Percent [%] (95%confidence interval)
Signs and symptoms until first consultationa (N=2’200)Diarrhoea 1’940 87.9 (85.6–89.9)Diarrhoea with blood and/ormucus
249 10.8 (8.5–13.7)
Loss of appetite 1’345 63.5 (58.4–68.4)Abdominal pain/cramps 1’329 61.1 (57.0–65.1)Nausea 1’296 60.4 (56.6–64.1)Vomiting 1’227 57.5 (54.3–60.7)Flatulence 896 40.6 (35.6–45.7)Fever 530 25.0 (22.3–27.9)Dehydration 183 8.5 (6.6–11.0)Headache 68 3.2 (2.1–4.8)
General condition at first consultation (according to physicians’impression) (N=2’115)Poor: 1 1 0.09 (0.01–0.6)2 28 1.1 (0.7–1.9)3 95 4.6 (3.3–6.4)4 177 8.4 (6.2–11.4)5 237 10.7 (7.9–14.4)6 228 10.1 (8.3–12.3)7 318 15.8 (13.6–18.2)8 476 23.9 (20.6–27.5)9 356 16.5 (13.5–20.1)Good: 10 199 8.7 (6.3–12.0)
Number of consultations (N=2’200)1 1’742 79.6 (76.5–82.4)2 365 16.4 (14.0–19.2)3 75 3.2 (2.4–4.2)4 18 0.8 (0.4–1.5)
a Multiple answers possible
pathogens were identified in 11.5% (95% CI 5.4–22.9) of the 98 caseswith a positive stool test result.
228

Published article
Table 11.3: Frequency of and reasons for prescription of stool diagnosticsamong acute gastroenteritis patients consulting primary care physicians fromthe Swiss Sentinel Surveillance Network, 2014
Number ofcases [n]
Percent [%] (95%confidence interval)
Stool test initiated (N=2’176) 286 12.3 (10.1–14.8)Stool test performed(N=2’176)
272 11.6 (9.5–14.1)
Main reason for stool testing (N=197)Protracted course of disease 62 29.4 (21.9–38.2)Poor general condition 23 11.5 (6.9–18.4)Specific symptom 19 9.5 (4.6–18.6)Stay abroad before symptomonset
18 7.8 (4.5–13.1)
Comorbidity 10 5.3 (2.5–10.7)Outbreak investigation 8 5.3 (1.6–16.4)Occupation 10 3.8 (1.8–8.1)Resident/patient institution 2 2.0 (0.5–8.0)Age 2 1.3 (0.3–6.2)Contact to animals 1 1.0 (0.1–6.8)Contact to ill persons 1 0.3 (0.04–2.3)Other reasons (e.g. elevatedCRP level, leucocytosis, re-cent antibiotic therapy)
20 10.5 (6.5–16.6)
Reason not specified 21 12.2 (6.4–22.2)Pathogens identifieda (N=98)Campylobacter spp. 57 50.8 (39.2–62.3)Norovirus 8 10.9 (5.0–21.9)Blastocystis spp. 6 9.6 (4.0–21.1)Rotavirus 5 8.9 (2.9–24.2)Clostridium spp. 7 7.3 (2.9–17.2)Entamoeba spp. 4 5.4 (1.7–15.8)Pathogenic E. coli 6 5.3 (2.0–13.1)Candida spp. 3 4.8 (1.4–15.6)Salmonella spp. 6 3.8 (1.7–8.2)Other (Giardia spp., adenov-irus, Aeromonas spp., hepat-itis E)
4 4.0 (1.2–12.5)
a Two pathogens were identified in 11.5% (95% CI 5.4–22.9) of the 98cases with a positive stool test result
229

11 Acute gastroenteritis in primary care, Sentinella
Table 11.4: Frequency of prescription of antibiotic and symptomatic treat-ment, and reasons for prescription of antibiotic therapy among acute gast-roenteritis patients consulting primary care physicians from the Swiss SentinelSurveillance Network, 2014
Number ofcases [n]
Percent [%] (95%confidence interval)
Antibiotic therapy prescribed(N=2’089)
195 8.5 (6.5–11.0)
Antibiotic class prescribeda (N=195)Quinolone 123 60.2 (48.5–70.9)Macrolide 30 15.0 (9.3–23.3)Metronidazole 21 12.8 (7.7–20.5)Aminopenicillin 22 11.6 (6.3–20.5)Trimethoprim/sulfamethoxazole 7 4.5 (1.5–12.7)Cephalosporin 5 3.1 (1.1–8.6)Tetracycline 1 0.3 (0.0–2.4)Not specified 5 1.6 (0.6–4.4)
Main reason for prescription of antibiotics (N=195)Bacterial gastroenteritis 64 41.1 (25.0–59.5)Duration of illness 12 9.0 (3.4–19.6)Specific symptom 10 7.2 (3.4–14.8)Expecting attitude of patient 6 4.5 (1.7–11.6)Poor general condition 6 3.6 (1.3–9.2)Immunosuppression 3 3.2 (0.9–11.0)High, prolonged fever 5 3.1 (1.0–9.3)Polymorbidity 4 2.7 (0.8–8.5)Preventively 3 2.3 (0.6–8.5)Other reasons (e.g. elevatedCRP level, leucocytosis, co-infection)
22 13.3 (7.9–21.6)
Reason not specified 14 9.9 (5.2–18.2)Recommended symptomatic treatmenta (N=1’909)Fluid replacement with tea, broth 1’089 58.3 (53.0–63.3)Probiotics 875 45.9 (39.1–52.8)Antiemetics 851 45.4 (40.5–50.4)Antidiarrhoeals 584 28.8 (23.6–34.6)Analgesics 330 16.3 (12.8–20.5)Spasmolytics 287 15.0 (11.5–19.2)Rehydration solution 201 11.4 (7.8–16.4)Intravenous rehydration 36 1.7 (1.1–2.6)
a Multiple answers possible
230

Published article
Approaches for symptomatic and antibiotic therapyIn 92.0% (95% CI 89.8–93.8) of cases, Sentinella-physicians gave dietaryrecommendations, or prescribed symptomatic and/or antibiotic treat-ment. Most commonly, patients were advised to care for fluid replace-ment by the intake of sufficient tea, broth etc. (58.3%, 95% CI 53.0–63.3)(Table 11.4). Distinct rehydration therapies such as electrolyte solution(11.4%, 95% CI 7.8–16.4) and infusion therapies (1.7%, 95% CI 1.1–2.6)were less frequently prescribed. Symptomatic treatment included probi-otics (45.9%, 95% CI 39.1–52.8), antiemetics (45.4%, 95% CI 40.5–50.4),antidiarrhoeals (28.8%, 95% CI 23.6–34.6), analgesics (16.3%, 95% CI12.8–20.5), and spasmolytics (15.0%, 95% CI 11.5–19.2). Antibioticswere prescribed in 8.5% (95% CI 6.5–11.0) of cases (Table 11.4).The Sentinella-physicians initiated stool testing and prescribed antibiot-ics at the first consultation in 33 cases (unweighted results, table 11.5).Stool diagnostics revealed the presence of a pathogen susceptible to an-tibiotics in 20 of these cases. No antibiotics were prescribed in 22 caseseven though a pathogen which is theoretically susceptible to antibioticswas identified.The majority of patients receiving antibiotics was treated with quino-lones (60.2%, 95% CI 48.5–70.9), followed by macrolides, metronidazole,aminopenicillin, trimethoprim/sulfamethoxazole, cephalosporin and tet-racycline (Table 11.4). Two or more antibiotic classes were reported tobe used for 8.5% (95% CI 4.6–15.2) of cases. No antibiotic class wasreported for 1.6% (95% CI 0.6–4.4) of cases treated with antibiotics.Main reasons for the prescription of antibiotic therapy included (suspi-cion of) bacterial gastroenteritis (41.1%, 95% CI 25.0–59.5), duration ofillness (9.0%, 95% CI 3.4–19.6), a specific symptom (7.2%, 95% CI 3.4–14.8) and others (Table 11.4). Sentinella-physicians mentioned severalreasons for 23.9% (95% CI 16.6–32.2) of the patients despite being askedto indicate only the main reason. When considering also multiple an-swers, “poor general condition” was the third most frequently mentionedreason for antibiotic therapy (data not shown).Similar to stool testing, antibiotic prescription was associated with age(p<0.001) and with the physicians’ specialty (p<0.001) but not withsex (p=0.511) (data not shown). Again, children and adolescents wereless frequently treated with antibiotics compared to adults. Among the>74-year-old age group, one-fifth of cases received antibiotics (20.0%,95% CI 12.8–29.7). Nearly three-quarter of the antibiotic therapies wereprescribed at the first consultation (71.3%, 95% CI 60.5–80.1). Thesepatients had a lower general condition according to physicians’ impres-
231

11 Acute gastroenteritis in primary care, Sentinella
Table 11.5: Time point of prescription of stool testing and antibiotic treat-ment among acute gastroenteritis patients consulting primary care physicians,Swiss Sentinel Surveillance Network, 2014
No an-tibioticsprescribed
Antibioticprescribedat first con-sultation
Antibioticprescribedat follow-upconsultation
No stool test initiated 1’713 70 11Stool test initiated at firstconsultation
68 33 7
Thereof with positive resultfor a pathogen susceptible toantibiotic therapya
12 20 5
Thereof with positive resultfor a pathogen notsusceptible to antibiotictherapya
4 1
Stool test initiated atfollow-up consultation
56 3 22
Thereof with positive resultfor a pathogen susceptible toantibiotic therapya
10 2 11
Thereof with positive resultfor a pathogen notsusceptible to antibiotictherapya
4 1
Unweighted results. Cases with missing information on (date of) antibioticprescription and/or (date of) stool test were excludeda Not considering possible antibiotic resistances and treatment recommend-ations
sion (median 5.0, 95% CI 4.0–6.0, IQR 4.0 [95% CI 3.0–5.0]–7.0 [95%CI 6.0–8.0]) than patients receiving antibiotics later on (median 7.0,95% CI 6.0–8.0, IQR 5.0 [95% CI 4.0–6.0]–8.0 [95% CI 7.0–9.0]) and alsosuffered slightly more frequently from fever (44.7%, 95% CI 34.5–55.4 vs.38.9%, 95% CI 24.0–56.2). However, both differences were not statistic-ally significant. Patients with a recent history of travel had significanthigher odds to undergo antibiotic therapy (OR 1.75, 95% CI 1.06–2.88,p=0.029).
232

Published article
DiscussionThis study underscored that acute gastroenteritis is common in Swissprimary care: extrapolated annual consultation numbers (175’000 firstconsultations) are comparable to those of influenza-like illness (ILI) dur-ing an influenza season (varying between 107’000 and 276’000 ILI casesin the last three seasons [18-20]). The majority of patients is sympto-matically treated and does not require multiple consultations. However,most episodes of AG lead to a sick leave of several days, though the phys-ician-assessed general state of the patients is considered as “fairly good”.Stool specimen testing is not systematically conducted and antibiotictherapy is applied to less than 10% of patients.
Multiple factors influence physicians’ decision makingSentinella-physicians reported more than one reason for stool testing ina third of cases despite being explicitly asked for the main reason in thequestionnaire. This suggests that a combination of factors plays a rolein decision making. The same holds true for the prescription of antibi-otic treatment where in around a quarter of cases several reasons werementioned albeit physicians were asked to indicate the main reason. Thereasons mentioned most frequently for stool testing – namely protrac-ted course of disease, poor general condition, due to a specific symptomand a history of recent travel – are in line with findings from otherstudies: three of the aforementioned four factors (all except “specificsymptom”) were also mentioned by GPs participating in a qualitativestudy in Switzerland [8] and in a study from Northern Ireland and theRepublic of Ireland [21]. The Irish study further reported that stooltesting is frequently prescribed if the illness is associated with an out-break or if the physicians suspect a link with a particular consumed fooditem or food premises (pub, restaurant, take away). Similarly, a qualit-ative study among GPs in the UK found that long duration of illness,recent travel, blood in the stool, patient being unwell and exclusion ofan infectious cause were the reasons mentioned most frequently for stooltesting [22]. Factors most strongly associated with requesting a stoolculture were bloody diarrhoea, diarrhoea lasting more than 3 days, anda diagnosis of AIDS in a postal survey among physicians in the US [23].Considering that protracted course of disease and poor general condi-tion were mentioned most frequently as main reasons for stool testingin our study, the difference in reported general condition at the time offirst consultation among tested and untested patients seems rather small
233

11 Acute gastroenteritis in primary care, Sentinella
(median 7.0, 95% CI 6.5–7.5, IQR 5.0 [95% CI 4.5–5.5]–8.0 [95% CI 7.5–8.5] vs. median 8.0, 95% CI 7.5–8.5, IQR 6.0 [95% CI 5.5–6.5]–9.0 [95%CI 8.5–9.5]). One explanation for this is that a “protracted course ofdisease” does not necessarily equate with a poor general condition butsimply reflects the lack of improvement of symptoms with an average orfairly good general condition. Most of the aforementioned studies [8, 21,22] acknowledge that decisions for testing are subjective and depend onthe physicians’ experiences and attitudes.AG, whether of viral or bacterial origin, is usually self-limiting [5]. An-tibiotics are mainly recommended for severely affected patients and aremost effective if given early [5, 24, 25]. “Bacterial gastroenteritis” wasmost frequently mentioned as main reason for antibiotic therapy in ourstudy. We cannot judge whether this reasoning was based on laboratoryresults or on physicians’ experience. However, only two cases with pos-itive stool test results for pathogens not susceptible to antibiotics wereprescribed antibiotics in our study. The second most common reasoningfor antibiotic treatment, namely duration of illness, was also reportedby Swiss GPs in an extensive qualitative assessment [8]. A study fromPoland concluded that factors associated with antibacterial drug admin-istration included the work environment of the physician (working inlarge practices and hospital wards favoured antibiotic prescription com-pared to small practices), presence of fever, or mucus or blood in stool,age of the patient and (rural/urban) residence [26]. The presence offever, or mucus or blood in stool could also be a factor leading to anti-biotic therapy in our study as the third most frequent mentioned mainreason for antibiotic prescription was suffering from a specific symptom.Some 62% of all cases with a laboratory-confirmed Campylobacter infec-tion received antibiotic treatment in our study. This finding is importantin the context of antibiotic resistance development. More than half ofthose patients received quinolones and one-third was treated with mac-rolides – a finding confirming results from an earlier qualitative studyamong Swiss GPs [8]. Given antibiotic resistance levels for fluoroquino-lones as high as 55.3% for human Campylobacter isolates in Switzerlandin 2014 [27], these studies’ findings underscore the need for changes inprescription practise in Switzerland. A similar level of resistance (60.2%)was observed in Europe in 2014 [28]. Consequently, the European FoodSafety Authority and the European Centre for Disease Prevention andControl do no longer recommend fluoroquinolones for the empirical treat-ment of human campylobacteriosis.
234

Published article
Physicians’ case management impacts on the mandatorysurveillance systemA stool test was performed only for 11.6% of patients consulting a Sen-tinella-physician due to AG. Of these, 19.8% (95% CI 15.1–25.6) had apositive result for a notifiable pathogen. Hence, a very small propor-tion of 2.3% (=11.6 × 19.8%) of AG patients consulting a Sentinella-physician were actually reportable to the mandatory reporting system.This is in line with Swiss physicians’ typical treatment pattern for AGof “wait & see”, which can be followed by a “treat & see” approach ora desirable (from the perspective of the NNSID) “test & see” or “test &treat” approach based on illness progression [8]. Considering the (main)reasons mentioned for stool testing, patients with a prolonged durationof illness and patients reporting recent travel abroad are likely overrep-resented among notified cases. The proportion of patients with stooltesting varies substantially between countries: it was found to be 4.3or 9.1% in France [29], 6% in Italy [30], 7% in Ireland [31], 12% in theNetherlands [32], 19% in the US [33] and 25% in Denmark [34].The pathogen most often identified through stool testing in this study(Campylobacter spp.) is also the pathogen most frequently reported toSwiss national surveillance. Norovirus, which is not notifiable in Switzer-land but in several countries of the European Union, was the second mostcommon identified pathogen.
Mild disease with high socio-economic burdenPhysicians rated the general condition of AG patients as relatively good.Nevertheless, a high proportion of 86.3% of employed patients was notable to work due to the illness. Sick leave is considerable with a me-dian of 4 days. The risk of transmission seems to play a subordinaterole as a reason for inability to work. Similar findings were reported ina French study where 79% of working patients were on sick leave for amedian duration of 3 days [35]. In a Danish study, only 35% of patientswith AG reported having missed work or school as a result of illness[34]. However, this Danish study was a population-based study in whichonly 13% of patients were seen by a physician and/or hospitalised. Inour study, we did not observe a difference in time from symptom onsetto consultation between employed and unemployed patients (data notshown). This indicates that the need of a medical certificate is unlikelyto be a main reason for consultation.It is well known that some pathogens causing AG are easily transmitted
235

11 Acute gastroenteritis in primary care, Sentinella
from human-to-human, especially viruses, and contact with diarrhoeapatients has been described as a risk factor for AG previously [35, 36].In our study, 28.6% (95% CI 24.9–32.6) of the patients had contact toother people suffering from similar signs and symptoms in the 7 dayspreceding symptom onset. Thus, it is possible that these patients hada common source of infection or transmitted the disease among eachother.In summary, our findings suggest that AG is a common, but gener-ally mild disease which results, however, in a high social and economicburden. The overall financial burden due to AG (including losses inproductivity) is likely a multiple of the healthcare costs estimated forSwitzerland in the range of e29–45 million annually [14].
Sentinella is invaluable to investigate current publichealth issuesAll information for this study was derived from physicians in the SwissSentinel Surveillance Network. This study was specifically set up by theFOPH to clarify current epidemiological questions about gastroenteritisin Switzerland, using a national primary care sentinel surveillance plat-form.We consider it a strength of the study to have obtained information ondiagnosis and treatment directly from treating primary care physicians.However, the actual duration of sick leave might have been longer orshorter than reported or certified by the physician. Similarly, we couldnot record the overall duration of the illness as in this study we couldnot send out follow-up questionnaires at the end of an AG episode.A limitation of our study is the change in sampling scheme for supple-mentary questionnaires for the second half of the study period, especiallyconsidering that AG is subject to seasonal variation. However, we be-lieve that changing to full sampling and using weighted analyses to adjustfor the change in sampling scheme resulted in more reliable data thancontinuing without changing the sampling scheme and obtaining far lesssupplementary questionnaires.We expected to observe a seasonality of case reports considering the lit-erature [4, 36], results of a previous study [8] and surveillance data [12],with a peak of AG in winter (December–March) and during summer(June–September). Instead we found a decreasing number of initial con-sultations per 1’000 PPCs over the year which we assume is partially dueto reporting fatigue of the Sentinella-physicians partaking in the study.This is supported by a survey conducted among Sentinella-physicians in
236

Published article
which they were asked about the time required for participating in thesentinel network – in total and for the different research topics. Physi-cians indicated that the study on AG was comparatively time-consumingalthough the majority indicated that the total amount of time requiredfor notifying was acceptable [37].
ConclusionNot to our complete surprise, this study has shown that acute gastroen-teritis is a common disease in Switzerland with consultation frequenciescomparable to influenza-like illnesses. AG presented to physicians leadto substantial sick leave in the employed, resulting in considerable socio-economic costs due to productivity loss.Furthermore, as suspected, the study confirms that the National Notific-ation System for Infectious Diseases captures – if at all – only a fractionof the scope of the problem (see introduction for currently notifiablediarrhoea-causing pathogens). Hence, the Swiss Sentinel SurveillanceNetwork, Sentinella, represents a very important complementary sur-veillance instrument to grasp principal dynamics of infectious diseaseepidemiology at the primary care level.The FOPH and the Federal Food Safety and Veterinary Office, being re-sponsible to maintain population health and food safety in Switzerland,are currently lacking effective tools for pinpointing and a comprehens-ive national programme addressing the control of foodborne diseases andAG. While there are efforts to increase food safety and consumer hygieneincluding campaigns to increase awareness for food and kitchen hygieneamong consumers in Switzerland, prevention measures to reduce con-tamination at food production or retail level are incomplete. Overall,there is an imbalance in national disease prevention and control effortsfor AG considering that national strategies to reduce the burden of sea-sonal influenza – an infection with a disease burden comparable to AG– exist since many years.
AcknowledgementsWe thank all physicians who contributed and provided feedback to pre-testing the questionnaire, especially Professor Andreas Zeller and Dr.Christoph Merlo. Albeit being formally listed in globo as co-authors,all the physicians constituting the Swiss Sentinel Surveillance Networkdeserve a special word of thanks for relentlessly contributing to the net-
237

11 Acute gastroenteritis in primary care, Sentinella
work and collaborating with us weekly in this 1-year study. The authorsgratefully acknowledge the help of the Notification Systems Unit of theFederal Office of Public Health, especially Ms. Diana Guido and Dr.Raphael Rytz, for their help in preparing the study and during data col-lection. The statistical support of Dr. Jan Hattendorf (Swiss Tropicaland Public Health Institute) is gratefully acknowledged. We thank theFederal Office of Public Health, Bern, Switzerland for funding this study.
Compliance with ethical standardsEthical statementThis study was conducted under the Swiss Epidemics Act (SR 818.101)and the ordinance on disease notification of humans (SR 818.141.1).
Conflict of interestThis study was funded by the Federal Office of Public Health, Bern,Switzerland (Grant numbers 13.004570, 14.000710 and 15.007090). MJand MM are on the staff of the Federal Office of Public Health and parti-cipated in their capacities as public health specialists and their functionas scientific collaborators within the organisation.
Electronic supplementary materialThe online version of this article (doi:10.1007/s15010-017-1049-5) con-tains supplementary material, which is available to authorized users.Please visit https://doi.org/10.1007/s15010-017-1049-5.
References1. Majowicz SE, Hall G, Scallan E, Adak GK, Gauci C, Jones TF, et al. A
common, symptom-based case definition for gastroenteritis. EpidemiolInfect. 2008;136:886–94. doi:10.1017/S0950268807009375.
2. de Wit MA, Hoogenboom-Verdegaal AM, Goosen ES, Sprenger MJ,Borgdorff MW. A population-based longitudinal study on the incidenceand disease burden of gastroenteritis and Campylobacter and Salmon-ella infection in four regions of the Netherlands. Eur J Epidemiol.2000;16:713–8.
238

Published article
3. Kuusi M, Aavitsland P, Gondrosen B, Kapperud G. Incidence of gast-roenteritis in Norway – a population-based survey. Epidemiol Infect.2003;131:591–7. doi:10.1017/S0950268803008744.
4. Huhulescu S, Kiss R, Brettlecker M, Cerny RJ, Hess C, Wewalka G, etal. Etiology of acute gastroenteritis in three sentinel general practices,Austria 2007. Infection. 2009;37:103–8. doi:10.1007/s15010-008-8106-z.
5. Morgan DR, Chidi V, Owen RL. Gastroenteritis. In: Schlossberg D,editor. Clinical infectious disease. 2nd ed. Cambridge: CambridgeUniversity Press; 2015. p. 334–341.
6. Tam CC, Rodrigues LC, Viviani L, Dodds JP, Evans MR, Hunter PR,et al. Longitudinal study of infectious intestinal disease in the UK (IID2study): incidence in the community and presenting to general practice.Gut. 2012;61:69–77. doi:10.1136/gut.2011.238386.
7. Das Eidgenössische Departement des Innern. Verordnung des EDIüber die Meldung von Beobachtungen übertragbarer Krankheiten desMenschen vom 01. Dezember 2015. Stand am 5. März 2016 (SR818.101.126). [Ordinance of the FDHA on notification of observationson communicable diseases of human beings of 01 December 2015. Statusas of 5 March 2016; in German, French and Italian]. https://www.admin.ch/opc/de/classified-compilation/20151622/index.html. Ac-cessed 24 Aug 2016.
8. Bless PJ, Muela Ribera J, Schmutz C, Zeller A, Mäusezahl D. Acutegastroenteritis and campylobacteriosis in Swiss primary care: theviewpoint of general practitioners. PLoS One. 2016;11:e0161650.doi:10.1371/journal.pone.0161650.
9. Gibbons CL, Mangen MJJ, Plass D, Havelaar AH, Brooke RJ, KramarzP, et al. Measuring underreporting and under-ascertainment in infec-tious disease datasets: a comparison of methods. BMC Public Health.2014;14:147. doi:10.1186/1471-2458-14-147.
10. Doorduyn Y, Van Pelt W, Havelaar AH. The burden of infectiousintestinal disease (IID) in the community: a survey of self-repor-ted IID in The Netherlands. Epidemiol Infect. 2012;140:1185–92.doi:10.1017/S0950268811001099.
11. Van Cauteren D, De Valk H, Sommen C, King LA, Jourdan-Da SilvaN, Weill FX, et al. Community incidence of campylobacteriosis andnontyphoidal salmonellosis, France, 2008–2013. Foodborne Pathog Dis.2015;12:664–9. doi:10.1089/fpd.2015.1964.
12. Schmutz C, Mäusezahl D, Jost M, Baumgartner A, Mäusezahl-FeuzM. Inverse trends of Campylobacter and Salmonella in Swiss surveil-lance data, 1988–2013. Euro Surveill. 2016;21:30130. doi:10.2807/1560-7917.ES.2016.21.6.30130.
13. Bless PJ, Schmutz C, Suter K, Jost M, Hattendorf J, Mäusezahl-Feuz
239

11 Acute gastroenteritis in primary care, Sentinella
M, et al. A tradition and an epidemic: determinants of the campylobac-teriosis winter peak in Switzerland. Eur J Epidemiol. 2014;29:527–37.doi:10.1007/s10654-014-9917-0.
14. Schmutz C, Mäusezahl D, Bless PJ, Hatz C, Schwenkglenks M,Urbinello D. Estimating healthcare costs of acute gastroenteritisand human campylobacteriosis in Switzerland. Epidemiol Infect.2017;145:627–41. doi:10.1017/S0950268816001618.
15. Foederatio Medicorum Helveticorum. FMH-Ärztestatistik. Beruf-stätige Ärzte nach Hauptfachgebiet. FMH-Generalsekretariat. 2014.http://aerztestatistik.myfmh2.fmh.ch/. Accessed 03 Jan 2017.
16. Altpeter E, Zimmermann H, Oberreich J, Péter O, Dvořák C, Swiss Sen-tinel Surveillance Network. Tick related diseases in Switzerland, 2008 to2011. Swiss Med Wkly. 2013;143:w13725. doi:10.4414/smw.2013.13725.
17. Bundesamt für Statistik. STAT-TAB: Die interaktive Statistikdaten-bank. Swiss Federal Statistical Office, Neuchâtel. 2016. http://www.pxweb.bfs.admin.ch. Accessed 31 Aug 2016.
18. Bundesamt für Gesundheit. Saisonbericht Grippe 2015/16. BAG Bul-letin. 2016;37.
19. Bundesamt für Gesundheit. Saisonale Grippe 2013/14: Epidemiologie,Virologie, Impfstoffversorgung und -zusammensetzung. BAG Bulletin.2014;27.
20. Bundesamt für Gesundheit. Saisonale Grippe 2014/15: Epidemiologie,Virologie, Impfstoffversorgung und -zusammensetzung. BAG Bulletin.2015;28.
21. Scallan E, Fitzgerald M, Cormican M, Smyth B, Devine M, Daly L,et al. The investigation of acute gastroenteritis in general practice:a survey of general practitioners in Northern Ireland and Republic ofIreland. Eur J Gen Pract. 2005;11:136–8.
22. McNulty CA, Lasseter G, Newby K, Joshi P, Yoxall H, Kumaran K, etal. Stool submission by general practitioners in SW England – when,why and how? A qualitative study. BMC Fam Pract. 2012;13:77.doi:10.1186/1471-2296-13-77.
23. Hennessy TW, Marcus R, Deneen V, Reddy S, Vugia D, Townes J, et al.Survey of physician diagnostic practices for patients with acute diarrhea:clinical and public health implications. Clin Infect Dis. 2004;38:S203–S211. doi:10.1086/381588.
24. Guerrant RL, Van Gilder T, Steiner TS, Thielman NM, Slutsker L,Tauxe RV, et al. Practice guidelines for the management of infectiousdiarrhea. Clin Infect Dis. 2001;32:331–51. doi:10.1086/318514.
25. DuPont HL. Acute infectious diarrhea in immunocompetent adults. NEngl J Med. 2014;370:1532–40. doi:10.1056/NEJMra1301069.
26. Stefanoff P, Rogalska J, Czech M, Staszewska E, Rosinska M. An-
240

tibacterial prescriptions for acute gastrointestinal infections: un-covering the iceberg. Epidemiol Infect. 2013;141:859–67.doi:10.1017/S0950268812001173.
27. Swiss Centre for Antibiotic resistance. Antibiotic resistance data.2016. http://anresis.ch/index.php/Interactive-database.html.Accessed 16 Nov 2016.
28. European Food Safety Authority, European Centre for Disease Preven-tion and Control. The European Union summary report on antimicro-bial resistance in zoonotic and indicator bacteria from humans, animalsand food in 2014. EFSA J. 2016;14:4380. doi:10.2903/j.efsa.2016.4380.
29. Van Cauteren D, Turbelin C, Fonteneau L, Hanslik T, De Valk H, Blan-chon T. Physician practices in requesting stool samples for patients withacute gastroenteritis, France, August 2013–July 2014. Epidemiol Infect.2015;143:2532–8. doi:10.1017/S0950268814003884.
30. Scavia G, Baldinelli F, Busani L, Caprioli A. The burden of self-reportedacute gastrointestinal illness in Italy: a retrospective survey, 2008–2009.Epidemiol Infect. 2012;140:1193–206. doi:10.1017/S0950268811002020.
31. Scallan E, Fitzgerald M, Collins C, Crowley D, Daly L, Devine M, et al.Acute gastroenteritis in northern Ireland and the Republic of Ireland:a telephone survey. Commun Dis Public Health. 2004;7:61–67.
32. van den Brandhof WE, Bartelds AI, Koopmans MP, van DuynhovenYT. General practitioner practices in requesting laboratory tests forpatients with gastroenteritis in the Netherlands, 2001–2002. BMC FamPract. 2006;7:56. doi:10.1186/1471-2296-7-56.
33. Scallan E, Jones TF, Cronquist A, Thomas S, Frenzen P, Hoefer D, etal. Factors associated with seeking medical care and submitting a stoolsample in estimating the burden of foodborne illness. Foodborne PathogDis. 2006;3:432–438. doi:10.1089/fpd.2006.3.432.
34. Müller L, Korsgaard H, Ethelberg S. Burden of acute gastrointestinal ill-ness in Denmark 2009: a population-based telephone survey. EpidemiolInfect. 2012;140:290–298. doi:10.1017/S0950268811000471.
35. Arena C, Amoros JP, Vaillant V, Ambert-Balay K, Chikhi-Brachet R,Jourdan-Da Silva N, et al. Acute diarrhea in adults consulting a gen-eral practitioner in France during winter: incidence, clinical character-istics, management and risk factors. BMC Infect Dis. 2014;14:574.doi:10.1186/s12879-014-0574-4.
36. Karsten C, Baumgarte S, Friedrich AW, von Eiff C, Becker K, WosniokW, et al. Incidence and risk factors for communityacquired acute gast-roenteritis in north-west Germany in 2004. Eur J Clin Microbiol InfectDis. 2009;28:935–43. doi:10.1007/s10096-009-0729-1.
37. Auswertung der Umfrage zum Meldeaufwand in Sentinella. Sentinella-News. 2014;3:5–9. http://www.sentinella.ch/de/news/media/0b36a3a5956842e2bb79f2d54d8749aa. Accessed 30 Aug 2016.
241


Part IV
THE SOCIAL AND FINANCIALBURDEN OF
GASTROINTESTINALDISEASES ACROSS THEBURDEN OF ILLNESS
PYRAMID


12 Estimating healthcare costs ofacute gastroenteritis and humancampylobacteriosis in Switzerland
Claudia Schmutz1, 2, Daniel Mäusezahl1, 2, Philipp JustusBless1, 2, Christoph Hatz1, 2, 3, Matthias Schwenkglenks2, 3, 4,and Damiano Urbinello1, 2
1 Swiss Tropical and Public Health Institute, Basel, Switzerland2 University of Basel, Basel, Switzerland3 Epidemiology, Biostatistics and Prevention Institute, University ofZurich, Zurich, Switzerland4 Institute of Pharmaceutical Medicine, University of Basel, Basel,Switzerland
This article was published in:
Epidemiology and Infection (2017), 145, 627–641.doi: 10.1017/S0950268816001618This is an Open Access article, distributed under the terms of the Creat-ive Commons Attribution licence (http://creativecommons.org/licenses/by/4.0/), which permits unrestricted re-use, distribution, and reproduction in anymedium, provided the original work is properly cited.
245


Published article
SummaryRising numbers of campylobacteriosis case notifications in Switzerlandresulted in an increased attention to acute gastroenteritis (AG) in gen-eral. Patients with a laboratory-confirmed Campylobacter infection per-ceive their disease as severe and around 15% of these patients are hos-pitalized. This study aimed at estimating healthcare costs due to AGand campylobacteriosis in Switzerland. We used official health statistics,data from different studies and expert opinion for estimating individualtreatment costs for patients with different illness severity and for extra-polating overall costs due to AG and campylobacteriosis. We estimatedthat total Swiss healthcare costs resulting from these diseases amountto e29–45 million annually. Data suggest that patients with AG con-sulting a physician without a stool diagnostic test account for e9.0–24.2million, patients with a negative stool test result for Campylobacter spp.for e12.3 million, patients testing positive for Campylobacter spp. fore1.8 million and hospitalized campylobacteriosis patients for e6.5 mil-lion/year. Healthcare costs of campylobacteriosis are high and mostlikely increasing in Switzerland considering that campylobacteriosis casenotifications steadily increased in the past decade. Costs and poten-tial cost savings for the healthcare system should be considered whendesigning sectorial and cross-sectorial interventions to reduce the bur-den of human campylobacteriosis in Switzerland.
IntroductionSince 1995 Campylobacter spp. has been the most frequently repor-ted gastrointestinal bacterial pathogen in humans in Switzerland [1] andsince 2005 in the European Union (EU) [2]. An estimated 9.25 mil-lion cases of campylobacteriosis occurred in 2009 in the 27 EU memberstates, of which around 2% were reported [3]. Havelaar et al. estimatedthe ‘true’ incidence rate of campylobacteriosis in these countries at 30–13’500/100’000 population (350/100’000 in Switzerland).In Switzerland, positive test results for Campylobacter spp. have to benotified by diagnostic laboratories to the Federal Office of Public Health(FOPH) since 1988 [4]. In 2012, 8’480 campylobacteriosis cases were re-gistered within the National Notification System for Infectious Diseases(NNSID), which is the highest number reported so far [1]. This corres-ponds to a notification rate of 105 cases/100’000 resident population inSwitzerland. The extent to which campylobacteriosis contributes to thepublic health burden of acute gastrointestinal illness is unknown. In The
247

12 Healthcare costs of acute gastroenteritis and campylobacteriosis
Netherlands, about twice the population size of Switzerland, approxim-ately 4.8 million cases of gastroenteritis occur annually, whereby 220’000patients need medical consultation [5].A study among 69 general practitioners (GPs) concluded a rising aware-ness of campylobacteriosis as a public health problem in Switzerland(Supplementary material). Despite its mostly self-limiting nature, thehealth burden of campylobacteriosis in the Swiss population may be sig-nificantly higher than figures from the NNSID indicate. Severe casesand complications such as Guillain-Barré syndrome, reactive arthritisand post-infectious irritable bowel syndrome amplify the burden of dis-ease and in particular the economic burden [6-8].The estimated economic burden (equating healthcare costs at large, in-cluding, e.g. loss of productivity and/or transportation and other directand indirect non-healthcare costs) of gastrointestinal infections or food-borne illnesses in high-income countries varies between e14 (Australia[9]) and e1’305 (United States [10]) per case in the community ([9-20]in table 12.1). Thereby, healthcare costs account for e3–155/case in thecommunity [9-20]. This wide range is partially due to heterogeneity incase definitions and definitions of economic burden. The yearly costs forgastroenteritis due to 14 food-related pathogens and associated sequelaein The Netherlands were estimated at around e468 million [11].For campylobacteriosis, the estimated economic burden per case varies,ranging from e117 (The Netherlands [17]) to e6’141 (United States [12])([8,10-12, 17, 20, 26] in table 12.2). Healthcare costs of campylobacteri-osis cases were estimated at e8/case in New Zealand, e82–280 in TheNetherlands and e163–253 in the United States ([8, 10-12, 20] in table12.2). These numbers are difficult to compare as case definitions andcost items included vary between studies. For example, sequelae due tocampylobacteriosis were considered in some studies while in others theywere not. Campylobacteriosis-associated acute gastroenteritis (AG)* ac-counts for approximately 108’000 cases/year in The Netherlands, caus-ing annual societal costs of about e81.5 million (including sequelae) [11].In the EU, campylobacteriosis cases account for expenditures of publichealth systems and for productivity losses of around e2.4 billion/yearaccording to the European Food Safety Authority [28]. The economicburden highlights the importance of this widespread and common dis-ease.A quantification of healthcare costs due to AG and/or campylobacterio-sis in Switzerland is lacking so far. Due to the rising number of campylo-bacteriosis case notifications in recent years, we conducted several studieswhich aimed at generating a better understanding of the epidemiology
248

Published article
of campylobacteriosis in Switzerland. We investigated epidemiologicaldeterminants [29], described time trends in notification data [1], thecampylobacteriosis-associated illness experience from the patients’ per-spective [29, 30], the case management strategies of GPs (Supplementarymaterial) and laboratory positivity rates of Campylobacter spp. (Supple-mentary material). In concert, these studies indicate that campylobac-teriosis is causing a considerable burden of disease which considerablyimpacts the health system in Switzerland and is likely associated withhigh costs.The aim of this study was to estimate the total annual costs for themedical treatment of campylobacteriosis in Switzerland. However, giventhat available data do not systematically distinguish campylobacteriosisfrom AG we focused this analysis on available data of both conditions.To the best of our knowledge, this is the first study estimating healthcarecosts due to AG and campylobacteriosis in Switzerland.
MethodsWe developed patient management models and estimated their frequencyand associated costs from the perspective of the healthcare system.
Typology of patients: patient management modelsCost estimation was based on four different patient management mod-els for AG which were derived from a broad expert consultation across apurposive enquiry among practitioners in private general and specializedpractices (four), clinics and university hospitals (four), authors opinionsand data available to them: (i) patients consulting a physician withoutstool testing (patient management model A), (ii) patients consulting aphysician with negative Campylobacter stool test results (patient man-agement model B), (iii) patients consulting a physician and having a pos-itive Campylobacter stool test result (patient management model C), and(iv) hospitalized campylobacteriosis cases (patient management modelD).
Population figures as basis for modelling: sources andapproachThe number of notified campylobacteriosis cases occurring each year inSwitzerland was retrieved from the NNSID [1]. A study assessing the
249

12Healthcare
costsofacute
gastroenteritisand
campylobacteriosis
Table 12.1: Overview of selected studies estimating the cost of illness of gastrointestinal or foodborne illnesses
Costs includeda
Firstauthor,year[ref.]
Nation Year Pathogens/diseaseconsidered(community cases,unless specifiedotherwise)
Casesperyear
Dir-ecthealth-carecosts
Pa-tientcosts(e.g.travelcosts)
Prod-ucti-vitylosses
Oth-ersb
Ex-changerateused(e1=. . . )c
Dir-ecthealth-carecost,percase(ine)
Dir-ecthealth-carecosts,yearly(inmil-lione)
Totalcostspercase(ine)
Totalyearlycosts(inmil-lione)
Hoffmann,2015[10]
UnitedStates
2013 15 foodbornepathogensincludinglong-termdisabilities; onlydomesticallyacquired andfoodborne cases
8’914’713 X X X USD1.34
155d 1’384 1’305d 11’636
Mangen,2015[11]
Netherlands 2011 14 foodbornepathogens;including sequelae
4’810’000 X X X EUR1
31d 147 97d 468
Scharff,2012[12]
UnitedStates
2010 All domesticallyacquired,foodborne illnesses
47’780’778 X X X USD1.33
75 3568d 806–1’227
38’506–58’589
Friesema,2012[13]
Netherlands 2009 Gastroenteritis 4’600’000 X X X EUR1
14d–32d
63–147
133–151
611–695
Gauci,2007[14]
Malta 2004/05
Infectiousintestinal disease
164’471 X X X Lm0.44e
72d 12 108 17
250

Published
article
Table 12.1: (continued)
Costs includeda
Firstauthor,year[ref.]
Nation Year Pathogens/diseaseconsidered(community cases,unless specifiedotherwise)
Casesperyear
Dir-ecthealth-carecosts
Pa-tientcosts(e.g.travelcosts)
Prod-ucti-vitylosses
Oth-ersb
Ex-changerateused(e1=. . . )c
Dir-ecthealth-carecost,percase(ine)
Dir-ecthealth-carecosts,yearly(inmil-lione)
Totalcostspercase(ine)
Totalyearlycosts(inmil-lione)
Abelson,2006[15]
Australia 2004 Gastroenteritisdue to foodborneillnesses
5’400’000f X X X AUD1.69
22d 118 111d 598
Majowicz,2006[16]
City ofHamilton,Canada
2001 Acutegastroenteritis
619’334g X X CAD1.39
17d 11d 66 40
VandenBrand-hof,2004[17]
Netherlands 1999 Gastroenteritis 4’476’399 X X X EUR1
14 61 77 345
Roberts,2003[18]
England 1994 Infectiousintestinal disease
9’400’000h X X X GBP0.66(year1999)
16d–44d
153–412
109d–120
1’028–1’128
Hellard,2003[9]
Australia 1999 Highly crediblegastroenteritis
15’173’430 X X AUD1.65
3d 46 14d 208
251

12Healthcare
costsofacute
gastroenteritisand
campylobacteriosis
Table 12.1: (continued)
Costs includeda
Firstauthor,year[ref.]
Nation Year Pathogens/diseaseconsidered(community cases,unless specifiedotherwise)
Casesperyear
Dir-ecthealth-carecosts
Pa-tientcosts(e.g.travelcosts)
Prod-ucti-vitylosses
Oth-ersb
Ex-changerateused(e1=. . . )c
Dir-ecthealth-carecost,percase(ine)
Dir-ecthealth-carecosts,yearly(inmil-lione)
Totalcostspercase(ine)
Totalyearlycosts(inmil-lione)
Lindquist,2001[19]
MunicipalityofUppsala,Sweden
1999 Foodborneillnesses
500’000i
(Sweden)X X SEK
8.81117 58d 246 123
Scott,2000[20]
NewZealand
1999 Foodborneinfectious disease
119’320 X X X X NZD2.01
9d 1.0 229 27
Karve,2014[21]
UnitedStates
2010/11
Acutegastroenteritis;only casesconsulting aphysician, visitingemergencydepartment andinpatient caresetting
6’668’944j X USD1.36
472d 3’151 472 3’151
a Categories represent only a very broad classification of costs included in the studies. Certain items may be included in different categor-ies, depending on the study. For example, transportation cost was sometimes considered as ‘direct healthcare cost’ (when covered by thehealth system) and sometimes included in ‘patient costs’.b For example, food recalls, or intangible costs for reduced quality of life (intangible costs are monetary representations of pain, sufferingand fear which can be obtained through willingness-to-pay studies [22]), or value of statistical life for premature deaths.
252

Published
article
Table 12.1: (continued)
Costs includeda
Firstauthor,year[ref.]
Nation Year Pathogens/diseaseconsidered(community cases,unless specifiedotherwise)
Casesperyear
Dir-ecthealth-carecosts
Pa-tientcosts(e.g.travelcosts)
Prod-ucti-vitylosses
Oth-ersb
Ex-changerateused(e1=. . . )c
Dir-ecthealth-carecost,percase(ine)
Dir-ecthealth-carecosts,yearly(inmil-lione)
Totalcostspercase(ine)
Totalyearlycosts(inmil-lione)
c Average exchange rates of the calendar year when the study was conducted (as indicated in the column ‘year’) were used and extractedfrom [23].d Calculated based on yearly case numbers and either costs per case (for calculating yearly costs) or yearly costs (for calculating costs percase) as reported in the original publication.e Exchange rate as indicated in the original publication (1 Maltese lira = e2.29)f According to Hall et al. 2005 [24].g Calculated based on a population size of 490’290 and 126’320 cases/100’000 population as reported in the original publication.h Calculated based on total yearly costs (£742.8 million) divided by total costs per case (£79) as reported in the original publication,rounded to the next 100’000.i According to Norling, 1994 [25].j Sum of estimated annual episodes of acute gastroenteritis in physician’s office (5’337’473), emergency department (1’032’064) and inpa-tients (447’580) as reported in the original publication.
253

12Healthcare
costsofacute
gastroenteritisand
campylobacteriosis
Table 12.2: Overview of selected studies estimating the cost of illness of campylobacteriosis
Costs includeda
Firstauthor,year[ref.]
Nation Year Pathogens/diseaseconsidered(communitycases, unlessspecifiedotherwise)
Seque-laecon-sidered
Casesperyear
Dir-ecthealth-carecosts
Pa-tientcosts(e.g.travelcosts)
Prod-ucti-vitylosses
Oth-ersb
Ex-changerateused(e1=. . . )c
Dir-ecthealth-carecost,percase(ine)
Dir-ecthealth-carecosts,yearly(inmil-lione)
Totalcostspercase(ine)
Totalyearlycosts(inmil-lione)
Hoffmann,2015[10]
UnitedStates
2013 Campylobacterspp.; onlydomesticallyacquired andfoodborne cases
GBS 845’024e X X X USD1.34
253d 213 1710 1445
Mangen,2015[11]
Nether-lands
2011 Campylobacterspp.
GBS,ReA,IBS,IBD
108’000 X X X EUR1
280d 30 757 82
Scharff,2012[12]
UnitedStates
2010 Campylobacterspp.; onlydomesticallyacquired andfoodborne cases
GBS,ReA
845’024e X X X USD1.33
163 138d 1’392–6’141
1’177–5’189
Gellynck,2008[26]
Belgium 2004 Campylobacter-associatedgastroenteritisand sequelae
GBS,ReA,IBD
55’000 X X X EUR1
n.a. n.a. 497d 27
Mangen,2005[8]
Nether-lands
2000 Campylobacterspp. andsequelae
GBS,ReA,IBD
79’000 X X X EUR1
82d 6.5 261d 21
254

Published
article
Table 12.2: (continued)
Costs includeda
Firstauthor,year[ref.]
Nation Year Pathogens/diseaseconsidered(communitycases, unlessspecifiedotherwise)
Seque-laecon-sidered
Casesperyear
Dir-ecthealth-carecosts
Pa-tientcosts(e.g.travelcosts)
Prod-ucti-vitylosses
Oth-ersb
Ex-changerateused(e1=. . . )c
Dir-ecthealth-carecost,percase(ine)
Dir-ecthealth-carecosts,yearly(inmil-lione)
Totalcostspercase(ine)
Totalyearlycosts(inmil-lione)
VandenBrand-hof,2004[17]
Nether-lands
1999 Campylobacterspp.
Notcon-sidered
79’000f X X X EUR1
n.a. n.a. 117d 9
Scott,2000[20]
NewZea-land
1999 Proportion offoodborneCampylobacterspp.
GBS,ReA,HUS
75’345 X X X X NZD2.01
8d 0.6 265 20
Roberts,2003[18]
England 1994 Campylobacterspp.
Notcon-sidered
n.a. X X X GBP0.66(year1999)
n.a. 15 n.a. 106
GBS, Guillain-Barré Syndrome; HUS, haemolytic uraemic syndrome; IBD, inflammatory bowel disease; IBS, irritable bowel syndrome;n.a., not available; ReA, reactive arthritis.a Categories represent only a very broad classification of costs included in the studies. Certain items may be included in different categor-ies, depending on the study. For example, transportation cost was sometimes considered as ‘direct healthcare cost’ (when covered by thehealth system) and sometimes included in ‘patient costs’.b For example, food recalls, or intangible costs for reduced quality of life (intangible costs are monetary representations of pain, sufferingand fear which can be obtained through willingness-to-pay studies [22]), or value of statistical life for premature deaths.
255

12Healthcare
costsofacute
gastroenteritisand
campylobacteriosis
Table 12.2: (continued)
Costs includeda
Firstauthor,year[ref.]
Nation Year Pathogens/diseaseconsidered(communitycases, unlessspecifiedotherwise)
Seque-laecon-sidered
Casesperyear
Dir-ecthealth-carecosts
Pa-tientcosts(e.g.travelcosts)
Prod-ucti-vitylosses
Oth-ersb
Ex-changerateused(e1=. . . )c
Dir-ecthealth-carecost,percase(ine)
Dir-ecthealth-carecosts,yearly(inmil-lione)
Totalcostspercase(ine)
Totalyearlycosts(inmil-lione)
c Average exchange rates of the calendar year when the study was conducted (as indicated in the column ‘year’) were used and extractedfrom [23].d Calculated based on yearly case numbers and either costs per case (for calculating yearly costs) or yearly costs (for calculating costs percase) as reported in the original publication.e According to Scallan et al. 2011 [27].f Assumed, according to Mangen et al., 2005 [8].
256

Published article
trend in Campylobacter positivity rates was conducted (thereafter re-ferred to as the ‘Positivity study’). This study used data of eight Swissdiagnostic laboratories on Campylobacter tests performed between 2003and 2012. Positivity rates, defined as the proportion of Campylobacter-positive to total number of Campylobacter tests, were calculated. Thenumber of Campylobacter tests performed in Switzerland was estimatedbased on the preliminary positivity rate of 2012.In 2013, a qualitative study among 69 GPs was conducted in Switzer-land (thereafter referred to as the ‘Swiss GP study’). Using a semi-structured questionnaire, physicians were interviewed about their casemanagement strategies for and general perception of AG and campylo-bacteriosis. From this study, GPs’ estimates on the proportion of AGpatients with a stool test prescribed were available.In 2014, the Swiss Sentinel Surveillance Network decided to study AGfor 12 months; 170 participating GPs reported all cases consulting dueto AG. This study (thereafter referred to as the ‘Sentinella study’) alsoprovides estimates on the proportion of patients with a stool test.The results used for cost estimates from the ‘Positivity’, the ‘Swiss GP’and the ‘Sentinella study’ are preliminary. Short summaries of thesestudies including the preliminary results used for estimating healthcarecosts can be found in the supplementary material. Final results of allthese studies will be published separately.We used the number of hospitalizations due to the ICD-10 code ‘A04.5Campylobacter enteritis’ as reported in official hospital statistics pub-lished by the Federal Statistical Office [31]. We compared this numberwith estimates based on the hospitalization rate found in our case-con-trol study on determinants of campylobacteriosis [29] and the number ofcampylobacteriosis case notifications from the NNSID [1].
Population-level estimates
The number of campylobacteriosis cases registered at the FOPH wasassumed to correspond to the number of patients in management modelsC and D in the whole of Switzerland. The number of hospitalizations inSwitzerland (patient management model D) was extracted from officialhospital statistics (hospitalizations due to Campylobacter enteritis, ICD-10 code A04.5) [31].
Patients in management model D =cases hospitalized due to ICD-10 code A04.5
257

12 Healthcare costs of acute gastroenteritis and campylobacteriosis
Patients in management model C =cases in NNSID − patients in management model D
The proportion of positive to total number of campylobacteriosis testswas used to estimate the number of patients in management model Bbased on notified cases (hence, cases with a positive test result).
Patients in management model B =cases in NNSID
positivity rate(= positive tests in x labs
all tests in x labs
) − cases in NNSID
The proportion of patients with stool testing (as opposed to consultationwithout stool testing) was used to estimate case numbers for patientmanagement model A.
P atients in management model A =(patients in management model B + cases in NNSID (= all tested)
proportion of patients with stool test
)− all tested
The data sources used for the extrapolation from individual to popula-tion-based costs are summarized in figure 12.1a.
Healthcare expendituresHealthcare costs for each of the patient management models were estim-ated by combining associated medical standard procedures with publiclyavailable respective rates for accounting. We extrapolated these indi-vidual case management costs to estimate healthcare costs associatedwith AG and campylobacteriosis in Switzerland in 2012.
Sources of cost data
We used different sources in order to calculate healthcare expendituredue to Campylobacter infections: from the Swiss GP study, based on ex-pert opinions and using preliminary results of the Sentinella study, treat-ment schemes and standard approaches for case management (includingnumber and duration of consultations, laboratory tests performed andmedications prescribed) were identified. Consultation costs of GPs werecalculated using the number of points from the publicly available Swissmedical tariff system, TARMED (as of June 2012) [32] and a point value
258

Published
article
Figure 12.1: Overview of data sources used for (a) extrapolation of treatment costs and (b) for cost estimation for acutegastroenteritis and campylobacteriosis patients.a Qualitative study about case management of campylobacteriosis patients among 69 general practitioners in Switzerland(Supplementary material).b Study on acute gastroenteritis conducted within the Swiss Sentinel Surveillance Network ‘Sentinella’ (www.sentinella.ch)in 2014 (Supplementary material).c Study on laboratory positivity rates of Campylobacter, Salmonella and Shigella diagnostic tests in Switzerland (Supple-mentary material).
259

12 Healthcare costs of acute gastroenteritis and campylobacteriosis
of e0.7138 which is used in the canton of Bern [33]. Similarly, points forlaboratory diagnostics were extracted from the official tariff list (‘Ana-lysenliste’; as of January 2012) using a point value of e0.83 appliedthroughout Switzerland [34]. Costs for medications were extracted fromthe list of pharmaceutical specialities (‘Spezialitätenliste’, version of 1January 2012) [35]. Calculation of hospitalization costs was based onthe flat rates of the Swiss diagnosis-related group-based (DRG-based)hospital reimbursement system and a base rate which is applied by sev-eral regional hospitals in the canton of Bern, both for 2012 [36, 37].Costs in Swiss francs were converted to Euros using an exchange ratefor the Euro of e0.83 per Swiss franc (average exchange rate January2012–December 2012) [23]. The cost estimation process for the patientmanagement models is presented in figure 12.1b.We obtained primary cost data from invoices for consultations of Cam-pylobacter-positive patients, covering all patient consultations between2011 and 2013 at the Swiss TPH travel clinic. This part of the studywas approved by the local ethical committee (Ethikkommission Nordw-est- und Zentralschweiz ref. no. EKNZ: 2014–159).
Data analysisCosts per patient treated
Differentiating by patient management model (models A–D), we evalu-ated the costs for consultations, medication, laboratory tests and hos-pitalization until conclusion of medical treatment. For all patient man-agement models we defined two scenarios to account for some of theheterogeneity of the patients and the case management strategies withina given model: a minimal and an extended or prolonged scenario. Theproportions of patients treated with the minimal and the extended scen-ario were estimated based on results of the case-control (e.g. proportionof patients treated with antibiotics) [29] and the Sentinella study (e.g.number of consultations; supplementary material). Afterwards, expertswere asked whether they considered the estimated proportions reason-able. The two scenarios do not imply any chronology of the steps in-volved.Estimates for patient management model C were validated using realpatient records of the Swiss TPH travel clinic. Patient invoices wereentered in an electronic database and analysed using Stata v. 13 (Stata-Corp., USA). Costs for laboratory tests or medication not primarilyassociated with AG were excluded, i.e. tests for Echinococcus, Filaria,flavivirus and Plasmodium, vaccines for rabies and tetanus, and electro-
260

Published article
cardiograms. Laboratory tests performed in external laboratories wereinvoiced by these laboratories and could, hence, not be considered in ouranalysis. However, we added costs for one positive stool test for Cam-pylobacter spp. as patients were selected based on having laboratory-confirmed campylobacteriosis.
ResultsFrequency of different patient management models inSwitzerlandIn the NNSID, 8’480 cases of campylobacteriosis were registered in 2012[1]. Preliminary results from the positivity study showed that 10.9%of all campylobacteriosis tests were positive (Supplementary material).Consequently, we estimated that 77’798 tests for Campylobacter spp.were made in 2012, of which 69’318 had a negative test result (pa-tient management model B). Estimates of the Swiss GP study indicatedthat one in four AG patients has a stool test performed (Supplement-ary material), suggesting that 233’394 patients consult a physician eachyear without further stool testing (patient management model A). How-ever, preliminary results from the Sentinella study suggest that only11% (420/3’794) of patients had stool testing performed (Supplement-ary material). In this case a total of 629’457 patients would be in patientmanagement model A.The number of hospitalizations due to ‘Campylobacter enteritis’ (ICD-10code A04.5) as reported in the official Swiss hospital statistics increasedsteadily since 2004. In 2012, 1’348 hospitalizations were reported whichis the maximum so far (Figure 12.2). For comparison, 14.5% (23/159)of interviewed patients in the recent case-control study, with laborat-ory-confirmed campylobacteriosis, reported hospitalization due to theirillness [29]. Considering the case notification numbers of 2012 (8’480cases), this proportion would result in 1’230 hospitalizations (patientmanagement model D). Patient management model C includes all no-tified cases except those being hospitalized (1’348), resulting in 7’132patients annually in Switzerland.
Individual case management costs for AG andcampylobacteriosis patientsThe costs per case are highly variable ranging from e30 (patient man-agement model A) to e4’828 (patient management model D). The cost
261

12Healthcare
costsofacute
gastroenteritisand
campylobacteriosis
Figure 12.2: Number of hospitalizations due to ICD-10 code A04.5 ‘Campylobacter enteritis’ in Switzerland from 2004to 2012 (blue dotted line with circles, left axis, [31]), number of hospitalizations extrapolated from results of a case-controlstudy in Switzerland [29] assuming hospitalization of 14.5% of cases registered in the National Notification System forInfectious Diseases (NNSID) (green dashed line with triangles, left axis) and number of case notifications from the NNSID[1] (black solid line with squares; right axis).
262

Published
article
Table 12.3: Healthcare costs associated with the management of acute gastroenteritis and campylobacteriosis for fourpatient management models with two scenarios each (values reflect costs in e)
Patient managementmodel A
Patient managementmodel B
Patient managementmodel C
Patient managementmodel D
Consultation withoutstool test
Consultation with neg-ative stool culturea
Consultation with pos-itive stool culturea
Hospitalization
Minimal scenario 10 minconsultationb
19.02 15 minconsultationb
31.69 15 minconsultationb
31.69 15 minconsultationb
31.69
1 medicationc 10.79 Stoolculturea
(negative)
64.74 Stoolculturea
(positive)
128.65 Hospital stay(DRGG67Be)
4’727.36
Taking bloodsample
5.85 Taking bloodsample
5.85
Haemogramd
and CRP18.26 Haemogramd
and CRP18.26
1 medicationc 10.79 1 medicationc 10.795 minreviewingpatient file
12.68 5 minreviewingpatient file
12.68
5 mintelephoneconsultation
12.68 5 mintelephoneconsultation
12.68
Total, minimal scenario 29.81 156.68 220.59 4’759.06Extended scenario + Taking
blood sample5.85 + Antibiotic 24.90 + Antibiotic 24.90 + 5 min
reviewingpatient file
12.68
(costs additional tominimal scenario)
+Haemogramd
and CRP
18.26 + Pharmacyfeesf
6.27 + Pharmacyfeesf
6.27 + Takingblood sample
5.85
+ 10 minsecondconsultationb
19.02 + 10 minsecondconsultationb
19.02 + 10 minsecondconsultationb
19.02 +Haemogramd
and CRP
18.26
263

12Healthcare
costsofacute
gastroenteritisand
campylobacteriosis
Table 12.3: (continued)
Patient managementmodel A
Patient managementmodel B
Patient managementmodel C
Patient managementmodel D
Consultation withoutstool test
Consultation with neg-ative stool culturea
Consultation with pos-itive stool culturea
Hospitalization
+ 15 minsecondconsultationb
31.69
Total, extended scenario 72.93 206.87 270.78 4’827.53
Proportion of patientsrequiring extendedscenario:
20% 40% 65% 50%
Data sourcesExpert opinion x x x x
TARMEDg [32] x x x x
List of pharmaceuticalspecialities [35]
x x x x
Official laboratory tarifflist [34]
x x x x
Flat rates of Swiss DRG,version 1.0 [36]
x
Swiss GP studyh x x x
Sentinella studyi x x xSwiss TPH travel clinic x
CRP, C-reactive protein; NNSID, National Notification System for Infectious Diseases.a Stool culture includes Campylobacter, Salmonella and Shigella.b Or telephone consultation of same duration.c Of the following medications: antidiarrhoeal, antiemetics, probiotics; average price of those medications: e10.79 (13 CHF).
264

Published
article
Table 12.3: (continued)
Patient managementmodel A
Patient managementmodel B
Patient managementmodel C
Patient managementmodel D
Consultation withoutstool test
Consultation with neg-ative stool culturea
Consultation with pos-itive stool culturea
Hospitalization
d Including erythrocytes, leucocytes, haemoglobin, haematocrit, thrombocytes, and ≥5 subpopulations of leucocytes.e For a patient with Campylobacter enteritis (ICD-10 code A04.5), aged ≥1 year, with a length of stay between 2 and 11 nights, theDRG group ‘G67B’ is assigned. Cost weight: 0.573, base rate (applied by several regional hospitals in Bern): e8250.20 (9940 CHF) [37].Quote from Swiss DRG version 1.0 [36] defining code ‘G67B’: [translated from German] ‘Oesophagitis, gastroenteritis and other diseasesof the digestive organs with a complex diagnosis or age <1 year or gastrointestinal bleeding, with very severe or severe complications orcomorbidities or age >74 years or peptic ulcer disease with severe complications or comorbidities or age >74 year, hospital occupancy >1 day, without complicating diagnosis, without dialysis’.f Fees include check of the prescription which can be invoiced once per item prescribed (‘Medikamenten-Check’; e3.57, CHF 4.30) andcheck of the purchase which can be invoiced once per patient, per day and per provider (‘Bezugs-Check’; e2.70, CHF 3.25) [49]g Costs vary among cantons; median costs are used (tariff point value e0.7138 or 0.86 CHF, e.g. canton Bern) [33].h Qualitative study about case management of campylobacteriosis patients among 69 general practitioners in Switzerland (Supplementarymaterial).i Study on acute gastroenteritis conducted within the Swiss Sentinel Surveillance Network ‘Sentinella’ (www.sentinella.ch) in 2014 (Sup-plementary material).
265

12 Healthcare costs of acute gastroenteritis and campylobacteriosis
items attributed to the different patient management models and scen-arios and associated costs are presented in table 12.3. (For a list of unitcosts see supplementary table S2.)The healthcare costs of 41 patients with laboratory-confirmed Campy-lobacter spp. infection were analysed. Costs for those 19 male and 22female patients aged between 1 and 72 years were in the range of e179–1’033 (median e464). The number of consultations varied between 1 and8 per patient (median 2), the number of blood samples taken between 0and 4 (median 1) and the time between the first and the last consultationbetween 0 (only one consultation) and 65 days (median 3). Consulta-tion costs and costs for laboratory testing of real patient data were higherthan estimated costs for patient management model C (Supplementarytable S3).
Healthcare costs due to AG and campylobacteriosisTotal healthcare costs for the management of the four different patientmanagement models combined in Switzerland in 2012 were estimated ate29.5–44.7 million (Table 12.4). Costs for the different patient manage-ment model groups (A–D) were e9.0–24.2, e12.3, e1.8 and e6.5 million,respectively (Supplementary figure S1).Costs separated by type/provider were: e11.1–20.6 million for GPs’services (including medical assistants), e7.7–9.1 million for laboratorydiagnostics, e4.4–8.6 million for medications and e6.4 million for hos-pitalizations (Supplementary figure S2).
DiscussionThis study provides for the first time an assessment of total Swiss health-care costs due to AG and campylobacteriosis by estimating the individualcosts of four types of patient management models and their frequency:patients suffering from AG and seeking medical care without being tested(model A); patients seeking medical care and having a Campylobacter-negative stool test (model B); patients seeking medical care and having aCampylobacter-positive stool test (model C); and patients with a severecourse of campylobacteriosis requiring hospitalization (model D).Cases of campylobacteriosis increased in the last decade 1.5-fold, imply-ing a contemporarily relevant public health problem. We estimated thatin Switzerland, each year 311’192–707’255 patients consult a physiciandue to AG or campylobacteriosis, leading to annual healthcare costs ran-ging from e29 to e45 million.
266

Published
article
Table 12.4: Estimated healthcare costs for the treatment of acute gastroenteritis and campylobacteriosis in Switzerland.Costs for individual cases are based on resource use estimates presented in table 12.3
PatientmanagementmodelASentinella
PatientmanagementmodelASwiss GP
Patientmanagementmodel B
Patientmanagementmodel C
Patientmanagementmodel D
Estimated number ofcases (n)
629’457 233’394 69’318 7’132 1’348
In minimal scenario 503’566 186’715 41’591 2’496 674In extended scenario 125’891 46’679 27’727 4’636 674
Consultation e11’969’523 e4’438’134 e4’359’611 e448’552 e42’722Laboratory diagnostics e0 e0 e5’753’394 e1’047’762 e0Medication e6’791’841 e2’518’321 e747’941 e76’954 e0Hospitalization e0 e0 e0 e0 e6’372’487
+Consultation e3’129’858 e1’160’517 e527’246 e88’156 e33’845+Laboratory diagnostics e2’298’770 e852’359 e0 e0 e12’307+Medication e0 e0 e864’154 e144’488 e0
Healthcare costs bypatient managementmodel
e24’189’992a e8’969’331a e12’252’346a e1’805’913a e6’461’362a
Total healthcare costs e29’488’953–44’709’613a
a Totals do not always add up because of rounding.
267

12 Healthcare costs of acute gastroenteritis and campylobacteriosis
The calculations were based on several assumptions as this studyprovides the first estimates of healthcare costs due to AG and campylo-bacteriosis in Switzerland. The country has no central database whichis based on diagnostic codes and where healthcare costs from outpatientcare are systematically recorded. Therefore, we tried to cross-validateour estimates whenever possible by combining different data sources.The real patient data which we used for comparison with cost estimatesfor patient management model C originated from our own institution’s(Swiss TPH) travel clinic. These real patient data suggested higher costsfor laboratory-confirmed, ambulatory patients than we used for our cal-culations. Possibly consultation time in returning travellers was longerbecause of the travel anamnesis and laboratory tests were more extens-ive. Nevertheless, returning travellers are likely to be overrepresentedalso in the patients with AG seen by GPs. When using the median totalcosts of the real patient data of the travel clinic for patients in manage-ment model C, the costs for this group would be e3.3 million (instead ofe1.8 million; Supplementary figures S1 and S2). Hence, we believe thecost estimates used for patient management model C are conservative.Some physicians reported performing a second stool test after a positiveresult for certain patient groups (e.g. working in the food sector) beforeallowing the patients to return to work. A few experts claimed that theconsultation times we applied in our models were rather short. Theysuggested consultation times of 5–10 min longer for selected (but not forall) consultations. The case-control study [29] found that about 10% ofcampylobacteriosis patients in outpatient treatment received intravenoustherapy, which was not considered in our models. Furthermore, patientsrequiring hospitalization may be transferred to the hospital by ambu-lance causing additional costs. Taking all these points into account, webelieve that our estimates reflect rather conservative approximations.
Healthcare costs of laboratory-confirmedcampylobacteriosis patientsCampylobacteriosis cases as registered in the NNSID were estimated tocost around e8.3 million/year (patient management models C and D).The majority of these costs are attributable to hospitalizations. Compar-ison of our estimates with actual patient data suggests that our estim-ates (at least for patient management model C) underestimated actualcosts occurring in the health system. The number of hospitalizationsdue to ‘Campylobacter enteritis’ (ICD-10 code A04.5) matches well withthe calculated number of hospitalized patients using the official notifica-
268

Published article
tion data together with the hospitalization rate found in the case-controlstudy (1’348 vs. 1’230 cases). The hospitalization costs, which are basedon DRG flat rates, include all costs occurring during the hospital stay.This flat rate is independent of the length of stay as long as it is within2–11 nights (for DRG code G67B, according to DRG v. 1.0 [36]).
Healthcare costs of AG patientsThe costs for AG patients without laboratory-confirmed campylobacte-riosis varied significantly depending on the proportion of stool testingwe used to calculate patient numbers for patient management model A.The proportion of stool testing is highly variable also in other countries:it was found to be 12% in The Netherlands [38], 19–44% in the UnitedStates [39, 40] and 27% in England [41]. Even though our estimate of11% from the Sentinella study is lower compared to the proportions re-ported in other countries we believe that this number is more accuratethan the semi-quantitative estimates obtained from the Swiss GP study.Moreover, the figure from the Sentinella study represents the proportionof patients for which the physician initiated stool testing. It is likelythat not all patients actually provided a stool specimen. Hence, usingthe proportion of actually completed stool tests would increase case num-bers in model A and our cost estimates. Additionally, our calculation forpatient management model A is based on the estimated number of testsfor Campylobacter spp. This may in fact underestimate the total num-ber of stool tests as in some instances physicians might only test theirpatients for viruses, for example. In this case, the number of patients inmanagement models A and B would be even larger.Apart from Campylobacter both Salmonella and Shigella infections arenotifiable in Switzerland. Usually, basic stool bacteriology involves test-ing for these three pathogens [42]. Under this assumption and ignoringthe chance of mixed infections, all Salmonella- or Shigella-positive pa-tients were assigned to management model B (patients with Campylobac-ter-negative stool test). This leads again to a rather conservative estim-ate of costs since stool cultures with a positive result are more expensivethan negative stool cultures (e64.74 vs. e128.65) [34]. Additionally,salmonellosis and shigellosis patients may also need hospitalization andthose patients are, therefore, more likely to create costs similar to thoseestimated for campylobacteriosis patient management models C and D.In 2012, 1’243 cases of salmonellosis and 159 cases of shigellosis werereported [43, 44]. Moreover, AG patients with viral infections and pa-tients without an identified causative agent might be hospitalized. The
269

12 Healthcare costs of acute gastroenteritis and campylobacteriosis
hospitalization costs for these patients were not considered in our study.Patients consulting a physician not at all or only by phone and patientsseeking help in a pharmacy have not been considered in this study. Up to60% of gastroenteritis patients calling the medical practice are managedby phone, according to the Swiss GP study (Supplementary material).Individual (healthcare) costs for these patients may be low. However,the high quantity of these patients might still lead to considerable costs.
Comparison of cost estimates for Switzerland withestimates of other countriesVarious studies have been conducted in several countries to estimatecosts for gastrointestinal infections or campylobacteriosis (Tables 12.1and 12.2). However, comparison of costs is very difficult due to vary-ing case definitions used, heterogeneity in costs included, differences inhealth systems and health-system use and time. We estimated that acase of laboratory-confirmed campylobacteriosis costs on average e975(average per case for models C and D). The extent of underreportedcampylobacteriosis infections – defined as infections in individuals whoseek healthcare but whose infection is not captured by the surveillancesystem [45] – is unknown for Switzerland. The multiplication factor dueto underreporting of campylobacteriosis was estimated at 1.3 in the UK[46] and at 2.0–5.6 in The Netherlands [6, 47]. Applying the same factorsto Swiss data would result in 2’544–39’008 additional campylobacterio-sis cases. Assuming that underreporting was due to under-diagnosis (asopposed to under-notification), these cases are automatically includedin our patient management model A (where model A represents all con-sulting AG patient without stool diagnostics.) Hence, costs in modelA attributable to under-diagnosed campylobacteriosis cases would rangebetween e0.98 and e1.50 million. Total costs attributable to campylo-bacteriosis would then range between e8.4 and e9.8 million in Switzer-land (representing 19–33% of total AG costs) or e206–759/case. Health-care costs per case are higher than Dutch (e82–280/case, table 12.2) orUS estimates (e163–253/case). However, the latter two were based onthe yearly estimated number of campylobacteriosis cases in the popula-tion while we considered only campylobacteriosis cases presenting to theGP or being hospitalized.On average, a case of AG (including campylobacteriosis) in Switzerlandwas estimated at e63–95. Again, our cost estimates are based on casespresenting to the GP while estimates from other countries usually arepresented for cases in the community. Hence, values are not comparable
270

Published article
even though our cost estimates are within the range of cost estimatesfrom other countries (e3–155 [9-20], table 12.1).
Unknown socioeconomic burdenWe only assessed direct healthcare costs for AG and campylobacterio-sis. The average hospital stay of three nights and the median diseaseduration of 7 days of campylobacteriosis patients which were found inthe case-control study [29] suggest that the socioeconomic burden dueto productivity loss and home care is a multiple of the healthcare costs.Additionally, we neither considered costs arising from complications ofthe disease (e.g. Guillain-Barré syndrome, reactive arthritis or irritablebowel syndrome) nor did we include out-of-pocket expenses for medica-tions of patients not consulting a physician or costs arising of patientsconsulting the physician exclusively by phone. This further underscoresthe conservative nature of our overall healthcare cost estimated at e29–45 million.The disease burden and economic consequences are further increased byyears of life lost due to premature mortality. The ICD-10 codes A02‘other Salmonella infections’ and A04.5 ‘Campylobacter enteritis’ wererecorded only for four patients in 2011 as the main cause of death (SwissFederal Statistical Office, personal communication). When consideringalso secondary causes of deaths, 104 deaths were registered in 2011. Forinfluenza it was shown that mortality is underreported in official statist-ics [48]. We assume that such underreporting is also the case for deathsdue to campylobacteriosis (and salmonellosis).AG and campylobacteriosis cause a marked public health problem gener-ating considerable costs. To our knowledge, this is the first study invest-igating healthcare costs due to AG and campylobacteriosis in Switzer-land. Further research is needed for more accurate cost estimation. Inorder to reduce the financial burden and suffering of patients, there isa need for implementing health policy measures, sectorial and inter-sec-torial public health interventions and increasing awareness in the popu-lation at all levels.
Supplementary materialFor supplementary material accompanying this paper visit http://dx.doi.org/10.1017/S0950268816001618.
271

12 Healthcare costs of acute gastroenteritis and campylobacteriosis
AcknowledgementsThe authors gratefully acknowledge Professor Johannes Blum (SwissTPH), Dr Klaus Bally, Professor Lukas Degen (University Hospital ofBasel), Dr Alexandre Kummer and Dr Ursina Halter for sharing theirclinical experience and providing feedback to the patient managementmodels. We thank Dr Monika Diebold (Obsan) for providing a criticalreview of the final draft version of the manuscript and Dr Jan Hattendorffor fruitful and stimulating discussions. The help of Dr Hanspeter Marti,Mrs Astrid Haas (both Swiss TPH) and Mrs Heidi Farner (Medibact) inidentifying, extracting and blinding patient invoices of campylobacteri-osis patients is much appreciated.This research received no specific grant from any funding agency, com-mercial or not-for-profit sectors.
Declaration of interestNone.
References1. Schmutz C, et al. Inverse trends of Campylobacter and Salmonella
in Swiss surveillance data, 1988–2013. Eurosurveillance 2016; 21:pii=30130.
2. European Food Safety Authority, European Centre for Disease Preven-tion and Control. The European Union summary report on trends andsources of zoonoses, zoonotic agents and food-borne outbreaks in 2013.EFSA Journal 2015; 13: 3991, 165 pp.
3. Havelaar AH, et al. Estimating the true incidence of campylobacterio-sis and salmonellosis in the European Union, 2009. Epidemiology andInfection 2013; 141: 293–302.
4. The Swiss Federal Council. Ordinance on disease notification of humansfrom 13 January 1999 (version from 1 January 2014 [in German]. Bern:The Swiss Federal Council, 2014. (http://www.admin.ch/ch/d/sr/8/818.141.1.de.pdf).
5. Havelaar AH, et al. Disease burden of foodborne pathogens in theNetherlands, 2009. International Journal of Food Microbiology 2012;156: 231–238.
6. Haagsma JA, et al. Disease burden of post-infectious irritable bowelsyndrome in The Netherlands. Epidemiology and Infection 2010; 138:1650–1656.
272

Published article
7. Buzby JC, Allos BM, Roberts T. The economic burden of Campylobac-ter-associated Guillain-Barré syndrome. Journal of Infectious Diseases1997; 176 (Suppl. 2), S192–197.
8. Mangen MJJ, et al. The costs of human Campylobacter infections andsequelae in the Netherlands: a DALY and cost-of-illness approach. FoodEconomics – Acta Agriculturae Scandinavica, Section C 2005; 2: 35–51.
9. Hellard ME, et al. Cost of community gastroenteritis. Journal of Gast-roenterology and Hepatology 2003; 18: 322–328.
10. Hoffmann S, Maculloch B, Batz M. Economic burden of major food-borne illnesses acquired in the United States: U.S. Department of Agri-culture, Economic Research Service, 2015 (Economic Information Bul-letin No. 140).
11. Mangen MJJ, et al. Cost-of-illness and disease burden of food-relatedpathogens in the Netherlands, 2011. International Journal of Food Mi-crobiology 2015; 196: 84–93.
12. Scharff RL. Economic burden from health losses due to foodborne illnessin the United States. Journal of Food Protection 2012; 75: 123–131.
13. Friesema IHM, Lugnér AK, van Duynhoven YTHP. Costs of gast-roenteritis in the Netherlands, with special attention for severe cases.European Journal of Clinical Microbiology & Infectious Diseases 2012;31: 1895–1900.
14. Gauci C, et al. Estimating the burden and cost of infectious intestinaldisease in the Maltese community. Epidemiology and Infection 2007;135: 1290–1298.
15. Abelson P, Potter Forbes M, Hall G. The annual cost of foodborne illnessin Australia. Canberra, Australia: Australian Government Departmentof Health and Ageing, 2006: pp. 97.
16. Majowicz SE, et al. Burden and cost of gastroenteritis in a Canadiancommunity. Journal of Food Protection 2006; 69, 651–659. [Erratum inJournal of Food Protection 2011; 1: 2–2.].
17. van den Brandhof WE, et al. Costs of gastroenteritis in The Nether-lands. Epidemiology and Infection 2004; 132: 211–221.
18. Roberts JA, et al. The study of infectious intestinal disease in England:socio-economic impact. Epidemiology and Infection 2003; 130: 1–11.
19. Lindqvist R, et al. A one-year study of foodborne illnesses in the mu-nicipality of Uppsala, Sweden. Emerging Infectious Diseases 2001; 7:588–592.
20. Scott WG, et al. Economic cost to New Zealand of foodborne infectiousdisease. New Zealand Medical Journal 2000; 113: 281–284.
21. Karve S, et al. Burden of acute gastroenteritis, norovirus and rotavirusin a managed care population. Human Vaccines & Immunotherapeutics2014; 10: 1544–1556.
273

12 Healthcare costs of acute gastroenteritis and campylobacteriosis
22. Meltzer MI. Introduction to health economics for physicians. Lancet2001; 358: 993–998.
23. European Central Bank. Euro foreign exchange reference rates(http://www.ecb.europa.eu/stats/exchange/eurofxref/html/index.en.html). Accessed 15 April 2016.
24. Hall G, et al. Estimating foodborne gastroenteritis, Australia. Emer-ging Infectious Diseases 2005; 11: 1257–1264.
25. Norling B. Food poisoning in Sweden – results of a field survey. Uppsala,Sweden: National Food Administration, 1994, 41/94.
26. Gellynck X, et al. Economics of reducing Campylobacter at differentlevels within the Belgian poultry meat chain. Journal of Food Protection2008; 71: 479–485.
27. Scallan E, et al. Foodborne illness acquired in the United States – majorpathogens. Emerging Infectious Diseases 2011; 17: 7–15.
28. European Food Safety Authority. EFSA explains zoonotic diseases:Campylobacter (http://www.efsa.europa.eu/sites/default/files/corporate_publications/files/factsheetcampylobacter.pdf).Accessed 3 May 2016.
29. Bless PJ, et al. A tradition and an epidemic: determinants of thecampylobacteriosis winter peak in Switzerland. European Journal ofEpidemiology 2014; 29: 527–537.
30. Suter K. Campylobacteriosis in Switzerland. Characterisation of cam-pylobacteriosis patients. Time trend in positivity rate (MSc thesis).Basel, Switzerland: University of Basel & Swiss Tropical and PublicHealth Institute; 2014, 107 pp.
31. Swiss Federal Statistical Office. Swiss Statistics Website: MedicalStatistic of Hospitals [in German] (http://www.bfs.admin.ch/bfs/portal/de/index/themen/14/04/01/data/01/05.html). Accessed 3 April2014.
32. TARMED. TARMED tariff version 1.08.0000 of 1 June 2012[in German] (http://www.tarmedsuisse.ch/pdf-tarifbrowser.html).Accessed 20 April 2016.
33. NewIndex AG. Cantonal tariff point values [in German] (http://www.newindex.ch/Taxpunktwerte-100). Accessed 20 April 2016.
34. Federal Department of Home Affairs. Official laboratory tariff list from1 January 2012. Appendix 3 of ‘Ordinance of the FDHA from 29September 1995 on payments of the compulsory health insurance SR832.112.31’. Bern, 2012 [in German] (http://www.bag.admin.ch/al).
35. Swiss Federal Statistical Office. List of pharmaceutical specialities asper 1 January 2012 [in German] (http://www.sl.bag.admin.ch). Ac-cessed 24 April 2015.
36. SwissDRG. SwissDRG version 1.0 [in German] (http://www.swissdrg.
274

Published article
org/de/12_archiv/swissDRG_system_1.0.asp). Accessed 6 November2015.
37. Ministry for public health and social welfare of the canton of Bern.Overview of inpatient hospital rates 2012 from canton Bern [in German](http://www.gef.be.ch/gef/de/index/gesundheit/gesundheit/spitalversorgung/spitaeler/superprovisorischetarife.assetref/dam/documents/GEF/SPA/de/Spitalversorgung/Tarife/Tarif%C3%BCbersicht_2012_d_141016.pdf). Accessed 6 November 2015.
38. van den Brandhof WE, et al. General practitioner practices in request-ing laboratory tests for patients with gastroenteritis in the Netherlands,2001–2002. BMC Family Practice 2006; 7: 56.
39. Scallan E, et al. Factors associated with seeking medical care and sub-mitting a stool sample in estimating the burden of foodborne illness.Foodborne Pathogens and Disease 2006; 3: 432–438.
40. Hennessy TW, et al. Survey of physician diagnostic practices for pa-tients with acute diarrhea: Clinical and public health implications.Clinical Infectious Diseases 2004; 38: S203–S211.
41. Wheeler JG, et al. Study of infectious intestinal disease in England:rates in the community, presenting to general practice, and reported tonational surveillance. The Infectious Intestinal Disease Study Execut-ive. British Medical Journal 1999; 318: 1046–1050.
42. Schweiger A, Markwalder K, Vogt M. Infectious diarrhoea: epidemi-ology, clinic, and diagnostics [in German]. Swiss Medical Forum 2005;5: 714–723.
43. Federal Office of Public Health. Detailed data on salmonellosis [inGerman] (http://www.bag.admin.ch/k_m_meldesystem/00733/00813/index.html?webgrab_path=aHR0cDovL3d3dy5iYWctYW53LmFkbWluLmNoL2luZnJlcG9ydGluZy9kYXRlbmRldGFpbHMvZC9zYWxtb25lbGxhLmh0bQ%3D%3D&lang=de). Accessed 3 February 2015.
44. Federal Office of Public Health. Detailed data on shigellosis [inGerman] (http://www.bag.admin.ch/k_m_meldesystem/00733/00813/index.html?webgrab_path=aHR0cDovL3d3dy5iYWctYW53LmFkbWluLmNoL2luZnJlcG9ydGluZy9kYXRlbmRldGFpbHMvZC9zaGlnZWxsYS5odG0%3D&lang=de). Accessed 3 February 2015.
45. Gibbons CL, et al. Measuring underreporting and underascertainmentin infectious disease datasets: a comparison of methods. BMC PublicHealth 2014; 14: 147.
46. Tam CC, et al. Longitudinal study of infectious intestinal disease inthe UK (IID2 study): incidence in the community and presenting togeneral practice. Gut 2012; 61: 69–77.
47. Havelaar AH, et al. Immunity to Campylobacter : its role in risk as-sessment and epidemiology. Critical Reviews in Microbiology 2009; 35:1–22.
275

12 Healthcare costs of acute gastroenteritis and campylobacteriosis
48. Brinkhof MWG, et al. Influenza-attributable mortality among the eld-erly in Switzerland. Swiss Medical Weekly 2006; 136: 302–309.
49. Anon. Agreement on tariffs between the Swiss organisa-tion of pharmacies (pharmaSuisse) and santésuisse – the Swisshealth insurers (santésuisse) [in German]. Final version from06.03.2009 (http://www.pharmasuisse.org/data/Oeffentlich/de/Themen/Tarifvertrag_LOA-IV_def_d_09-03-6.pdf).
276

13 The burden of gastroenteritis inSwitzerland (BUGS) study: aresearch proposal for a one-year,prospective cohort study
Claudia Schmutz1, 2, Daniel Mäusezahl1, 2
1 Swiss Tropical and Public Health Institute, Socinstrasse 57, P.O. Box,4002 Basel, Switzerland2 University of Basel, Petersplatz 1, P.O. Box, 4001 Basel, Switzerland
This article will be published in:
BMC Research Notes (accepted, Nov. 2018)
The final version of this article will be published in a monograph(foreseen in 2019):“Schmutz C. Infectious disease surveillance in Switzerland: VolumeII. Foodborne diseases in Switzerland: understanding the burden ofillness pyramid to improve Swiss infectious disease surveillance. PhDthesis. Basel, Switzerland”
277


AbstractObjectives: Acute gastroenteritis (AG) is a usually self-limiting, butcommon disease worldwide. In Europe, incidence estimates range from0.3–1.5 AG episodes/person-year. For Switzerland, available informa-tion on AG is restricted to notifiable foodborne diseases and findingsfrom research studies starting at primary care level. The aims of thisone-year, population-based prospective cohort study are to assess theincidence, burden of disease, aetiology and socio-economic impact of AGin the Swiss general population. Additionally, the prevalence of bacterialgastrointestinal pathogens and bacteria harbouring antimicrobial resist-ances in the asymptomatic population shall be assessed.Results: Weekly follow-up of the cohort consisting of 3’000 participantswill provide incidence estimates of AG. Furthermore, information collec-ted will be used to assess risk factors for experiencing an episode of AG,to explore determinants for help seeking, and to characterise the socio-economic impact of AG including absence from work and inability toperform daily activities. Aetiology of AG is determined by investigat-ing stool samples from symptomatic participants. Finally, stool samplesfrom participants collected during an asymptomatic period will be usedto assess the prevalence of enterohaemorrhagic E. coli, Campylobacterspp., Salmonella spp. and Shigella spp. as well as of resistance to dif-ferent antibiotics (extended-spectrum beta-lactamase-, fluoroquinolone-and carbapenemase-resistance).
IntroductionAcute gastroenteritis (AG)*, manifesting with signs and symptoms ofdiarrhoea, vomiting, abdominal pain or cramps, fever, dehydration,nausea and/or loss of appetite, is usually self-limiting, but leads to aconsiderable burden of disease, health system use and socio-economicimpact. Studies in several European countries estimated the incidenceof AG at 0.3–1.5 episodes per person and year [1-14]. Furthermore,it was found that a considerable 11% of patients with infectious en-teritis develop post-infectious irritable bowel syndrome [15, 16]. Incid-ence of AG for Switzerland is assumed to be comparable, but data islimited to notifiable pathogens reported to the Federal Office of Pub-lic Health (FOPH) based on the Epidemics Act. Several studies fromother European countries have shown that (i) only 6.4%–37.8% of allAG episodes lead to consultation of a physician [1-9, 11, 12, 14], and(ii) 0.2%–1.8% of episodes are reported to national surveillance systems
279
13 Burden of gastroenteritis in Switzerland (BUGS) research proposal
[1, 11, 14]. These proportions are highly variable between countries andpathogens due to different help seeking behaviour, case management andsurveillance systems [17]. From a study in the Swiss Sentinel Surveil-lance Network, Sentinella, we estimated that around 175’000 individualsconsulted a physician due to acute gastroenteritis in Switzerland in 2014[18]. Around 12% of cases were asked to submit a stool specimen andhence, could potentially – if positive – be reported to the National No-tification System for Infectious Diseases (NNSID) if their sample testedpositive for a notifiable pathogen and was reported by the diagnosticlaboratory. However, the proportion of AG patients consulting a phys-ician is currently not known for Switzerland. Consequently, inferencefrom the above-mentioned frequencies and proportions to the incidenceand burden of AG at population level is not possible.Therefore, the present study primarily aims at measuring the incidenceof acute gastroenteritis in the general population in Switzerland. Sec-ondary objectives are to describe the burden of disease and the socio-economic impact of AG, to assess its aetiology and to investigate the fre-quency of selected risk exposures. Finally, the carriage rate of selectedpathogenic bacteria and bacteria harbouring selected antibiotic resist-ances among the “healthy” (non-diarrhoeal) population in Switzerlandis assessed.
Main textStudy design and methodologyA one-year, prospective cohort study is conducted to determine the in-cidence of AG in the general population in Switzerland. The study willassess signs and symptoms of AG and exposure to selected risk factors(incl. antibiotic use). In case of symptoms, the help seeking beha-viour of patients, inability to work or to perform usual daily activities,perceived illness experience and socio-economic consequences of the ill-ness will be explored. Furthermore, the aetiology of AG is investigatedby examining stool samples from a subsample of participants report-ing gastrointestinal symptoms. Finally, the prevalence of selected bac-terial gastrointestinal pathogens (enterohaemorrhagic Escherichia coli[EHEC], Campylobacter, Salmonella and Shigella) and bacteria with se-lected antibiotic resistances (extended-spectrum beta-lactamase [ESBL],carbapenemase, fluoroquinolone, and mobilised colistin resistance [mcr]-1) is assessed among participants during an asymptomatic period.
280

Study setting, recruitment process and eligibilityA representative sample of the Swiss population will be requested fromthe Federal Statistical Office. The cohort is recruited by postal mail.The procedure for cohort recruitment is shown in figure 13.1. Invitationletters include a study information document, an informed consent form,a contact information questionnaire (for obtaining participants’ contactdetails and for selection of the preferred language and means of commu-nication) and a short screening questionnaire to assess study eligibility.Eligibility criteria for participating in the study are: living in Switzer-land; speaking German, French or Italian; age ≥14 years; not sufferingfrom cancer of the bowel, irritable bowel syndrome, Crohn’s disease, ul-cerative colitis, cystic fibrosis, coeliac disease or another chronic illnesswith symptoms of diarrhoea or vomiting.
Data collection and managementUpon return of the signed informed consent and the completed contactinformation and screening questionnaires, eligible study participants re-ceive a baseline questionnaire, a stool sampling kit including an inform-ation and instruction sheet on stool sampling, and the first weekly ques-tionnaire. The content of each questionnaire is summarised in table 13.1.Participants will continuously receive the weekly questionnaire duringone year (52 weeks; figure 13.2). Participants receive an additional ques-tionnaire (“illness questionnaire”) in case of reporting gastrointestinalsigns and symptoms. Furthermore, participants are advised to imme-diately report occurrence of diarrhoea and/or vomiting actively to thestudy team by phone, e-mail or SMS (during the day, including week-ends) (Figure 13.3). This “active reporting system” is used to selectAG episodes for microbiological investigation based on a pre-defined al-gorithm considering moderate and severe cases of illness as defined byRiddle, et al. [19]. In case the study subject’s AG episode is selected, thestudy team will advise him/her to use the stool sampling kit receivedat the beginning of the study and send a stool sample to the studylaboratory as fast as possible. After sending in a stool sample, the par-ticipant’s stool sampling kit will be replaced. The list of diagnostic testsperformed on stool samples from symptomatic participants is providedin table 13.1.Each week, a pre-defined number of randomly selected participants (seesample size calculation) will receive a stool sampling kit to send in astool sample immediately. Those stool samples will be tested for se-lected pathogenic bacteria and presence of certain antibiotic resistances
281

13 Burden of gastroenteritis in Switzerland (BUGS) research proposal
Figure 13.1: Operational flowchart of cohort recruitment for the burden ofgastroenteritis in Switzerland (BUGS) studyFSO: Federal Statistical Office; tbd: to be defined
282

Table 13.1: Overview and content of different questionnaires used and other data collection for the burden of gastroenteritisin Switzerland (BUGS) study
Datacollectiontool
Means ofapplication
Frequency Content
Contactinformationquestionnaire
Paper-based 1x beforeenrolment
Address, e-mail, phone number, language, preferred means ofcommunication (electronic questionnaire with link sent bye-mail [default] or paper-based questionnaire sent by postalmail)
Screeningquestionnaire
Paper-based 1x beforeenrolment
General demographic characteristics (age, sex), characteristicsto assess eligibility; for those not willing to participate: reasonfor non-participation
Baselinequestionnaire
Electronic andpaper-based
1x at thebeginning of theobservationperiod
Baseline characteristics: detailed demographic characteristics,dietary habits, regular medication intake, chronic diseases,permanent and long-term exposure risks (e.g. occupational),general health seeking
Weeklyquestionnaire
Electronic andpaper-based
Weekly (52x) Occurrence of gastrointestinal signs and symptoms andshort-term / transient risk exposures (e.g. food consumption,travel)
Illnessquestionnaire
Electronic andpaper-based
Afterexperiencinggastrointestinalsigns andsymptoms
Disease determinants, health and help seeking, health careutilisation, (self-)medication, consultations, absence from work,ability to perform usual daily activities
283

13Burden
ofgastroenteritisin
Switzerland
(BUGS)
researchproposal
Table 13.1: (continued)
Datacollectiontool
Means ofapplication
Frequency Content
Stool sample(sympto-matic)
Sampling kitsent toparticipant atbaseline; uponinstruction bystudypersonnelparticipantsends to studylaboratory
Selectedepisodes of acutegastroenteritis
Stool sample investigated for:• Bacteria: Campylobacter spp., Salmonella spp., Shigella spp.,
Yersinia spp. (all culture & PCR); Clostridium difficile(RDT & PCR); Plesiomonas shigelloides, Vibrio spp.,EAEC, EPEC, ETEC, EHEC (all PCR)
• Viruses: adenovirus, astrovirus, norovirus, rotavirus,sapovirus (all PCR)
• Protozoa & parasites: Cryptosporidium, Cyclosporacyetanensis, Entamoeba histolytica, Giardia lamblia
• Selected samples (depending on risk profile): additionally forcestodes, trematodes, nematodes and protozoa
Stool sample(asympto-matic)
Sampling kitsent toparticipant;Participantsends to studylaboratory
Max. 1x duringobservationperiod; randomselection
Stool sample investigated for:• Antibiotic resistance: ESBL, carbapenemase,
fluoroquinolones; if carbapenemase-positive: MCR-1• Bacteria: Campylobacter spp., Salmonella spp.,
Shigella/EIEC, EHEC (all PCR)
Stool samplequestionnaire(asympto-matic)
Electronic andpaper-based
Max. 1x duringobservationperiod; randomselection
Risk factors for carrying antibiotic-resistant bacteria, recentantibiotic consumption, visits to or stay in medical institutions,contact to animals and/or raw food
PCR: Polymerase Chain Reaction; RDT: Rapid diagnostic test; EAEC: enteroaggregative Escherichia coli; EPEC: en-teropathogenic E. coli; ETEC: enterotoxigenic E. coli; EHEC: enterohaemorrhagic E. coli; EIEC: enteroinvasive E. coli
284

Figure 13.2: Flowchart of cohort observation period for the burden of gastroenteritis in Switzerland (BUGS) study
285

13Burden
ofgastroenteritisin
Switzerland
(BUGS)
researchproposalFigure 13.3: Timeline from occurrence of symptoms until sending of illness questionnaire for the burden of gastroenteritis
in Switzerland (BUGS) studyGI: gastrointestinal
286

with the aim to assess respective prevalences in the asymptomatic popu-lation (Table 13.1). The stool sample will be discarded if the participantreported diarrhoea with or without vomiting in the 4 weeks precedingsampling. Sampling is conducted weekly throughout the observationperiod to account for potential seasonal differences in prevalence. Eachparticipant is selected at most once for “asymptomatic sampling”.All questionnaires apart from the contact information and screeningquestionnaires will be available in electronic- and paper-format. By de-fault, participants will receive an e-mail containing a personalised linkto the electronic questionnaires. However, during recruitment, they mayopt for paper-based questionnaires sent by postal mail. LimeSurvey, anopen source software set-up on a secured server at our institution (SwissTPH), will be used for electronic data collection. The software allowscompletion of the questionnaire in a standard internet browser usingdesktop or laptop computers, tablets or smartphones.Electronic questionnaires will be programmed to require an answer toensure completeness of the data collected but will include an option “Ido not want to answer” or “not applicable” (where appropriate) in orderto prevent a forced-choice bias.Paper questionnaires are entered by study personnel at the study centreusing a LimeSurvey data entry mask which is slightly adapted from theone used by participants (e.g. containing an additional field “no answergiven” for each mandatory question). A sample of 10% of paper ques-tionnaires is entered twice for data quality control. Discordant resultsare checked against paper originals. A full double entry is conducted forthe “contact information questionnaire” as correct address details arecrucial for successfully contacting participants.Quality control of data from study laboratories (stool sample results)will be with the diagnostic laboratories, operating according to theirstandard operating procedures in their daily routine. The study teamwill only check plausibility of the data and values.Electronic data are stored on secured network drives accessible only bythe study team. Data on the network drive is backed-up regularly, ac-cording to institutional policy. Electronic data is stored in original fileformats and in comma-separated values (csv) format, where appropriate,to ensure long-term accessibility.
Sample size calculationWe calculated the minimal sample size based on different parameter as-sumptions for comparisons between two distinct groups and for within-
287

13 Burden of gastroenteritis in Switzerland (BUGS) research proposal
subject comparisons between two distinct periods. Underlying formulasand results are provided in additional file 1 (Appendix E).A cohort size of 3’000 individuals is envisaged to allow analysis of sec-ondary outcomes and comparisons between groups and to assert enoughpower in case assumptions were too optimistic based on the differentsample size calculations. We plan to start the observation period with acohort size of 3’500 individuals in order to achieve an average cohort sizeof 3’000 after withdrawals and loss to follow-up during the 52 week studyperiod. Assuming a participation rate of 25% (including loss of peoplenot meeting the eligibility criteria) and a loss to follow-up of 20%, 15’000people will be contacted initially. For planning purposes, we assume anaverage cohort size of 3’000 throughout the one-year observation period.The sample size (n) needed to reach a specific relative precision (ε) forthe microbiological outcomes in asymptomatic participants (prevalenceof antibiotic resistances and selected pathogenic bacteria) was calculatedusing the following formula (based on [20]):
n = 1.962 ∗ (1− P )ε2 ∗ P
For the prevalence of ESBL, a relative precision of 20% is envisaged at a95% confidence level. Assuming a prevalence (P) of 5–6% (based on [21,22]), a sample size of 1’505–1’825 is needed. Considering that the previ-ous prevalence estimates are from groups of potentially higher prevalencethan the general population (staff members of meat-processing compan-ies with likely higher exposure risk; and primary care patients), we planto investigate 2’000 samples. Hence, every week 40 subjects are randomlyselected. Given the very low prevalence of Carbapenemase-resistance(0.1%; personal communication) and mcr-1 (not found in 1’000 samples;personal communication) it is questionable whether these resistances willbe found at all in our cohort. The prevalence of fluoroquinolone-resist-ance in E. coli has not yet been investigated in the asymptomatic Swisspopulation. Fluoroquinolone resistance prevalence in E. coli is at around20% based on resistance data generated during routine medical care [23].Hence, using the same sample size as for ESBL (N=2’000) should allowfor an estimate with a relative precision of at least 20% even if the pre-valence in the general Swiss population is somewhat lower than 20%.The presence of pathogenic bacteria (EHEC, Campylobacter spp., Sal-monella spp., and Shigella spp.) can only be investigated in 1’600samples of asymptomatic participants (of 2’000 collected) due to fin-ancial constraints. For this investigation, the main interest is on EHEC
288

prevalence in asymptomatic people. Considering that this prevalence isexpected at around 7–10% (personal communication) a sample size of1’600 will still allow for a relative precision of 15–18%.
Approach to analysisDefinition of AG disease episode
The primary outcome of our study is presence or absence of an AGepisode and the incidence of AG in the general population. For this pur-pose, an episode of AG is classified according to a modified version ofthe definition suggested by Majowicz et al. [24]: a case of gastroenteritisis an individual with ≥3 loose stools in 24 h, with or without vomiting,but excluding those (a) with cancer of the bowel, irritable bowel syn-drome, Crohn’s disease, ulcerative colitis, cystic fibrosis, coeliac disease,or another chronic illness with symptoms of diarrhoea, or (b) who reporttheir symptoms were due to drugs, alcohol, or pregnancy. An episodeis defined to begin on the first day and end on the last day of reporteddiarrhoea and/or vomiting, followed by a diarrhoea- and vomiting-freeperiod of 3 days [25].
Statistical analysis
Data cleaning and analysis will be conducted with the statistical soft-ware Stata and/or R. All steps performed to clean and analyse the dataare documented in scripts (R) or do-files (Stata).The cohort will be characterised in terms of demographic characteristics,health status, dietary habits and permanent or long-term risk exposuresas reported at baseline. Similarly, cohort participants lost to follow-upwill be compared to those remaining in the cohort.The primary outcome defined at the level of person-week is presence orabsence of an AG episode. Risk factors for experiencing an episode of AGwill be determined using multivariable mixed logistic regression analyseswith the individual included as a random effect. A basic multivariablemodel including the biologically most plausible variables, region andseason will be defined a priori. Generalised estimating equation models(GEE) will be considered in case of convergence issues of the mixed lo-gistic regression models.Secondary analyses will include calculating the incidence of AG as thenumber of AG episodes per person-year under observation and the in-cidence of gastrointestinal signs and symptoms (including episodes notfulfilling the case definition of AG). Furthermore, transient risk factors
289

13 Burden of gastroenteritis in Switzerland (BUGS) research proposal
for experiencing an episode of AG will be explored in uni- and mul-tivariable mixed logistic regression models, including the individual asrandom effect. Exposure information from the week preceding the AGepisode will be used. Determinants for presenting to the health system(pharmacies, primary care, specialists or hospitals) in case of AG are alsoinvestigated, again using uni- and multivariable mixed logistic regressionmodels (with the individual as random effect). Predictor variables in-clude signs and symptoms, and perceived severity of AG, demographiccharacteristics (age, sex, occupational status), co-morbidity, and type ofhealth insurance. Additionally, the socio-economic impact such as ab-sence from work, inability to perform usual daily activities and the needfor care by family members or friends related to AG disease episodes willbe described.Results from stool sample investigations from symptomatic participantswill be used to estimate pathogen-specific incidence rates of AG.Finally, the prevalences of bacteria harbouring ESBL-, carbapenem- andfluoroquinolone-resistance, and of EHEC, Campylobacter, Salmonellaand Shigella in the asymptomatic population is calculated.
Ethical considerationsHealth-related personal data and stool samples from participants arecollected for this study. Therefore, the study is subject to the FederalAct on Research on Human Beings and requires ethical approval. Ap-proval will be sought from the responsible local ethical committee(s) fora non-clinical trial study with minimal risks. All participants will beasked for written informed consent before enrolment. The study will beconducted according to the principles of Good Epidemiological Practice[26] and the Declaration of Helsinki [27].Participants will be advised to seek health care as they would do withoutparticipating in this study. Similarly, it will be emphasised that invest-igation of stool samples in the framework of this study does not replacestool sample investigation potentially initiated by their health care pro-vider. Results of stool investigations of symptomatic participants con-ducted as part of this study are obtained with a time delay due to studylogistics. Hence, microbiological results will be known to the study teamtoo late to affect treatment considering the short disease duration ofmost AG episodes and, therefore, will not be communicated to parti-cipants or their physicians.Participants are informed if antibiotic resistances are identified in theirstool samples during an asymptomatic period and advised to inform
290

their physician in case of illness.
Operational issuesData confidentiality and personalisation
Ideally, questionnaires should be anonymous as soon as they containhealth-related personal information. However, we must be able to linkthe different questionnaires completed by each study participant. Tominimize the risk that unauthorised people are able to link the parti-cipants’ names to their questionnaire data, we plan to implement severalmeasures: each participant is given a person identification code (“personID”) as well as a questionnaire identification code (“questionnaire ID”).The person ID is used in all files/data sets containing personal inform-ation. The questionnaire ID is used in all files/data sets containing in-formation obtained from questionnaires or from laboratory testing. Thekey file, linking the person ID and the questionnaire ID will be passwordprotected and stored separately from the other data sets. Access to thiskey file will be limited to the principal investigator, the study coordinatorand an additional person (substitute of the study coordinator). For pa-per-based questionnaires, both codes (person ID and questionnaire ID)are printed on the empty questionnaires. However, as soon as receipt ofthe completed questionnaires is registered in the study centre, the personID will be removed (cut off). In order to avoid that both codes are easilyvisible and recognised as such by unauthorised persons, one of the codes(the person ID) is printed in directly readable format (Arabic letters andnumerals) and the other code is printed as a QR- or bar-code. Also, thetwo codes are not labelled with “person ID” or “questionnaire ID”. Forelectronic questionnaires only the “questionnaire ID” will be used andno names are stored in LimeSurvey (where questionnaire data is enteredand stored during the entire data collection phase). In order to completethe questionnaire, participants will receive an e-mail including a link tothe questionnaire containing the questionnaire ID.
Active reporting system needed
For investigating the aetiology of AG, stool samples need to be obtainedquickly after disease onset as AG is usually a short, self-limiting disease.Therefore, the information on signs and symptoms obtained through theweekly questionnaire is too much delayed to be the basis for selection ofepisodes for aetiological investigation (especially in those completing thepaper-based questionnaires; figure 13.3). We expect reporting delays of
291

13 Burden of gastroenteritis in Switzerland (BUGS) research proposal
1–13 days in those completing electronic questionnaires and of at least3–10 days (best case scenario) for paper-based questionnaires which willseverely impact the likelihood to detect pathogens. To address this lim-itation, we plan to set up an “active reporting system” for participants(see “data collection and management”). These parallel ways of collect-ing data on diarrhoea and vomiting have advantages and disadvantages:on the one hand, we can compare reporting completeness of the twomethods. On the other hand, participants are required to actively thinkof the study when experiencing signs and symptoms, and have to reporttheir symptoms twice – potentially increasing reporting fatigue and re-porting bias due to sensitisation. Further, the active reporting systemrequires that study personnel being able to communicate in all threestudy languages is on call every day, including weekends and public hol-idays.
LimitationsOur study will be subject to limitations. Participation bias is likely tooccur. Considering the rather long observation period (one year withweekly follow-ups), a certain amount of participants will be lost to fol-low-up or withdraw from the study; these participants might differ fromthose completing the entire follow-up period. Similarly, reporting fatiguemight occur, especially in those experiencing more than one episode ofAG. However, all those biases and limitations are unavoidable in cohortstudies and their mitigation is difficult. To address reporting fatigue, weconsider establishing a project newsletter to give participants feedbackabout interim results of the study and additional information related tothe topic to highlight the importance of their contribution to research.Inverse probability weighting will be considered if characteristics of ourfinal cohort differ from those of the general population.Furthermore, compliance in actively reporting signs and symptoms aswell as in providing stool samples is crucial. Therefore, its importancewill be emphasised repeatedly to study participants. We suspect thatcompliance might be associated with the (perceived) severity of the dis-ease episode. However, we can only try to assess this bias at the end ofthe study by comparing data from active reporting/stool sampling anddata from weekly questionnaires.Recall bias and telescoping have been described as major challenges instudies on AG. We believe that this bias might not be a notable problemin our study considering the rather short recall period of 1 week.
292

Participants travelling will still receive the electronic questionnaire butthose completing paper-based questionnaires will be able to completethe questionnaire only once they returned. This might lead to differentcompliance and recall bias in those two groups. On the other hand, itprovides an opportunity to assess potential differences in results betweenthe two methods.
DeclarationsEthics approval and consent to participateApproval for this study will be sought from the responsible local ethicalcommittee(s) for a non-clinical trial study with minimal risks. All par-ticipants will be asked for written informed consent. The study will beconducted according to the principles of Good Epidemiological Practiceand the Declaration of Helsinki.
Consent for publicationNot applicable
Availability of data and materialData sharing not applicable to this article as datasets were not yet gen-erated for the presented study.
Competing interestsThe authors declare that they have no competing interests.
FundingThis study is funded by the Federal Office of Public Health (FOPH;Bern, Switzerland) and the Federal Food Safety and Veterinary Office(FSVO; Bern, Switzerland). The FOPH and the FSVO expressed spe-cific research needs which this study should answer but did not have anyrole in the design of the study and in writing the manuscript.
Authors’ contributionsDM and CS conceptualised the study and wrote the manuscript. Bothauthors approved the final manuscript.
293

13 Burden of gastroenteritis in Switzerland (BUGS) research proposal
AcknowledgementsThe authors thank Philipp Bless, Sören Becker and Roger Stephan forproviding important inputs to earlier versions of this study proposal.Andreas Neumayr’s and Esther Künzli’s insights provided and their re-commendations in dealing with issues related to medical practice arevery much appreciated. The statistical advice provided by Jan Hatten-dorf and statistical advice and feedback to the manuscript by ChristianSchindler are gratefully acknowledged.
References1. Tam CC, Rodrigues LC, Viviani L, Dodds JP, Evans MR, et al.: Lon-
gitudinal study of infectious intestinal disease in the UK (IID2 study):incidence in the community and presenting to general practice. Gut2012, 61:69–77.
2. Scallan E, Fitzgerald M, Collins C, Crowley D, Daly L, et al.: Acutegastroenteritis in northern Ireland and the Republic of Ireland: a tele-phone survey. Commun Dis Public Health 2004, 7:61–67.
3. Wilking H, Spitznagel H, Werber D, Lange C, Jansen A, et al.: Acutegastrointestinal illness in adults in Germany: a population-based tele-phone survey. Epidemiol Infect 2013, 141:2365–2375.
4. Doorduyn Y, Van Pelt W, Havelaar AH: The burden of infectious in-testinal disease (IID) in the community: a survey of self-reported IIDin The Netherlands. Epidemiol Infect 2012, 140:1185–1192.
5. Scavia G, Baldinelli F, Busani L, Caprioli A: The burden of self-reportedacute gastrointestinal illness in Italy: a retrospective survey, 2008–2009.Epidemiol Infect 2012, 140:1193–1206.
6. Kuusi M, Aavitsland P, Gondrosen B, Kapperud G: Incidence of gast-roenteritis in Norway – a population-based survey. Epidemiol Infect2003, 131:591–597.
7. Müller L, Korsgaard H, Ethelberg S: Burden of acute gastrointestinal ill-ness in Denmark 2009: a population-based telephone survey. EpidemiolInfect 2012, 140:290–298.
8. Hansdotter FI, Magnusson M, Kuhlmann-Berenzon S, Hulth A, Sund-strom K, et al.: The incidence of acute gastrointestinal illness in Sweden.Scand J Public Health 2015, 43:540–547.
9. Edelstein M, Merk H, Deogan C, Carnahan A, Wallensten A: Quanti-fying the incidence and cost of acute gastrointestinal illness in Sweden,2013–2014. Epidemiol Infect 2016, 144:2831–2839.
10. Viviani L, van der Es M, Irvine L, Tam CC, Rodrigues LC, et al.:Estimating the incidence of acute infectious intestinal disease in the
294

community in the UK: A retrospective telephone survey. PLoS One2016, 11:e0146171.
11. Baumann-Popczyk A, Sadkowska-Todys M, Rogalska J, Stefanoff P:Incidence of self-reported acute gastrointestinal infections in the com-munity in Poland: a population-based study. Epidemiol Infect 2012,140:1173–1184.
12. Van Cauteren D, De Valk H, Vaux S, Le Strat Y, Vaillant V: Burdenof acute gastroenteritis and healthcare-seeking behaviour in France: apopulation-based study. Epidemiol Infect 2012, 140:697–705.
13. Gauci C, Gilles H, Mamo J, Ruggieri F-M, Di Bartolo I, et al.: Theaetiology of infectious intestinal disease in the community in Malta.Malta Medical Journal 2010, 22.
14. Grilc E, Sočan M: Population based self-reported acute gastrointestinalinfection in Slovenia: multiplier study. Slovenian J Public Health 2014,53:125–132.
15. Klem F, Wadhwa A, Prokop LJ, Sundt WJ, Farrugia G, et al.: Pre-valence, risk factors, and outcomes of irritable bowel syndrome afterinfectious enteritis: A systematic review and meta-analysis. Gastroen-terology 2017, 152:1042–1054 e1041.
16. Ng QX, Soh AYS, Loke W, Lim DY, Yeo WS: The role of inflammationin irritable bowel syndrome (IBS). J Inflamm Res 2018, 11:345–349.
17. Gibbons CL, Mangen MJJ, Plass D, Havelaar AH, Brooke RJ, et al.:Measuring underreporting and under-ascertainment in infectious diseasedatasets: a comparison of methods. BMC Public Health 2014, 14.
18. Schmutz C, Bless PJ, Mäusezahl D, Jost M, Mäusezahl-Feuz M, et al.:Acute gastroenteritis in primary care: a longitudinal study in the SwissSentinel Surveillance Network, Sentinella. Infection 2017, 45:811–824.
19. Riddle MS, DuPont HL, Connor BA: ACG clinical guideline: Diagnosis,treatment, and prevention of acute diarrheal infections in adults. Am JGastroenterol 2016, 111:602.
20. Lwanga SK, Lemeshow S: Sample size determination in health studies.A practical manual. Geneva: World Health Organization; 1991.
21. Geser N, Stephan R, Korczak BM, Beutin L, Hächler H: Molecularidentification of extended-spectrum-beta-lactamase genes from Entero-bacteriaceae isolated from healthy human carriers in Switzerland. An-timicrob Agents Chemother 2012, 56:1609–1612.
22. Nüesch-Inderbinen MT, Abgottspon H, Zurfluh K, Nuesch HJ, StephanR, et al.: Cross-sectional study on fecal carriage of Enterobacteriaceaewith resistance to extended-spectrum cephalosporins in primary carepatients. Microbial Drug Resistance 2013, 19:362–369.
23. Swiss Centre for Antibiotic Resistance: Antibiotic resistance data. http://anresis.ch/index.php/Interactive-database.html. Accessed
295

13 Burden of gastroenteritis in Switzerland (BUGS) research proposal
21 Feb 2018.24. Majowicz SE, Hall G, Scallan E, Adak GK, Gauci C, et al.: A com-
mon, symptom-based case definition for gastroenteritis. Epidemiol In-fect 2008, 136:886–894.
25. Morris SS, Cousens SN, Lanata CF, Kirkwood BR: Diarrhoea – Definingthe episode. Int J Epidemiol 1994, 23:617–623.
26. Altpeter E, Burnand B, Capkun G, Carrel R, Cerutti B, et al.: Essen-tials of good epidemiological practice. Soz Praventivmed 2005, 50:12–27.
27. World Medical Association: World Medical Association Declaration ofHelsinki: ethical principles for medical research involving human sub-jects. JAMA 2013, 310:2191–2194.
296

Part V
DISCUSSION ANDCONCLUSIONS


14 Discussion
Surveillance of infectious diseases in Switzerland mainly relies on two sys-tems: the National Notification System for Infectious Diseases (NNSID)and the Swiss Sentinel Surveillance Network (Sentinella). However, bothsystems are subject to different degrees of underestimation* of diseasefrequency. There is insufficient knowledge on how disease incidence orprevalence in the general population relates to the number of notifiedcases in Switzerland. Therefore, the aim of this doctoral research wasto improve the understanding of this burden of illness pyramid usingthe example of foodborne infections, exemplified in studying Campy-lobacter , Salmonella and enterohaemorrhagic Escherichia coli (EHEC)among others.Trends in the frequency of Campylobacter and Salmonella were assessedanalysing data from the NNSID from 1988 to 2013 (chapter 4). The twopathogens, presenting with similar signs and symptoms, showed inversetrends pointing at changes in disease incidence. Indeed, several interven-tions to control Salmonella spp. were implemented after the peak levelsin the early 1990ies and appear to have been successful. In contrast,no limits at all for Campylobacter spp. in food were in place between2006 and 2013 in Switzerland. Analysis of surveillance data of hepat-itis A, another disease which may be transmitted through contaminatedfood, revealed difficulties in interpreting long-term trends given frequentchanges in notification forms (chapter 5).Results from positivity studies for Campylobacter and Salmonella, hence,studies taking into consideration the number of tests conducted apartfrom the number of positive results, lead to the same conclusions asanalysis of notification data alone: Campylobacter is increasing whileSalmonella is decreasing (chapter 6). At the same time, stool testingfrequency was found to be increasing for both pathogens. Part of theincrease in case numbers for Campylobacter can, therefore, be attributedto increased testing while the observed decrease in Salmonella notifica-tions seems even more significant considering this aspect. Understandingdiagnostic procedures and testing behaviour was consequently deemedessential. Increased testing volume was also considered the main reasonfor the observed strong increase in EHEC notifications since 2015, asstated by laboratory experts (chapter 7). However, analysis of laborat-
299

14 Discussion
ory data suggested that increased testing only partially explained thestrong increase (chapter 8). We, hence, concluded that the occurrenceof epidemic events cannot be ruled out in the case of EHEC.Swiss general practitioners (GPs) mostly follow a “wait & see” approachwhen managing cases of acute gastroenteritis (AG)* as seen in a qualit-ative (chapter 10) as well as in a quantitative assessment (chapter 11).Both studies showed that only a minority of patients (one in four to onein ten patients) is prescribed stool testing and hence, the illness has achance to be captured by the surveillance system if a notifiable pathogenis found. In brief, there is already a rather small chance to start withfor an AG episode to proceed to higher levels of the burden of illnesspyramid and potentially being notified. Finally, all steps along the bur-den of illness pyramid are associated with costs. In absence of availabledata on costs associated with AG in Switzerland, we estimated that AGand campylobacteriosis resulted in substantial healthcare costs of e29–45 million in 2012 (chapter 12). Patients with AG neither approachinga GP nor being hospitalised were not considered in these cost estim-ates. Similarly, absence from work and other indirect costs were notconsidered. Further research at the population level to understand thefull burden of disease of AG is urgently needed in Switzerland given thelarge burden associated with AG identified through our research alreadywhen looking only at levels starting from primary care. Consequently,a research proposal was developed to explore the incidence, burden ofdisease, social and societal impact of AG (chapter 13).The research presented in this thesis was conducted in close collabor-ation with and support of federal authorities (Federal Office of PublicHealth (FOPH), Federal Food Safety and Veterinary Office (FSVO)).This public-public partnership was mutually beneficial: it allowed us(the researchers) to get direct and easy access to existing structures (e.g.Sentinella) and data (e.g. disease notifications). Vice versa, our multi-faceted research could be targeted to the needs of public authorities,assuring that research is close to application. This improved accept-ance of the research conducted, guaranteed support of our projects byfederal authorities and increased the chance of further use and dissem-ination of research results by those stakeholders or consideration andimplementation of recommendations originating from our research. Fur-thermore, our research supported the federal offices in several ways (e.g.implementation of measures or recommendations, justify priorities) byproviding sound, scientific evidence of long-standing hypotheses and byquantifying disease burden. Publication of results lead to media reac-tions (Appendix, section F.1), raising attention to the topic by the public
300

14.1 Reconstructing the burden of illness pyramid
and increasing external validity of our research.This chapter consists of three main parts. In the first part, the dif-ferent levels of the burden of illness pyramid are discussed in the lightof the research results presented in this PhD thesis and findings fromother countries (section 14.1). The second part critically reflects on theSwiss NNSID: whether the NNSID fulfils its purpose (subsection 14.2.1),whether the purpose of the NNSID fulfils ‘our’ (the researchers’, epidemi-ologists’, public health experts’) expectations (subsection 14.2.2), and fi-nally suggestions for improving the NNSID are made (subsection 14.2.3).The third part then illustrates how the ideal case management of AGlooks like from different perspectives and discusses the various andpartly conflicting wants and needs of patients (subsection 14.3.1), phys-icians (subsection 14.3.2) and of the public health community (subsec-tion 14.3.3).
14.1 Reconstructing the burden of illnesspyramid
14.1.1 From infection to disease notificationSeveral steps are involved until a case is reported to national surveillance,as already mentioned in the introduction of this thesis (section 1.1 andfigure 1.1): after an individual is exposed to a certain pathogen, theperson has to be infected and/or develop (gastrointestinal) symptoms.Then, the individual has to seek medical care. The physician has torequest a (stool) sample from his patient. The patient has to complywith this request and the sample has to be sent to the diagnostic labor-atory. At the diagnostic laboratory, the sample has to be analysed. Ifa pathogen can be identified by the laboratory and if this pathogen isnotifiable, the laboratory has to report it to the FOPH. Finally, if thelaboratory complies with its obligation to report and the reporting formis entered at the FOPH, only then, the case is registered in official dis-ease surveillance statistics.At each step, some cases are “lost” and hence, what is registered inthe NNSID does not reflect the actual disease incidence in the popula-tion. However, the proportion of cases reaching the tip of the ‘burdenof illness pyramid’ depends on the pathogen, the patient, the physician,the laboratory and the federal administration and hence, can neitherbe compared across pathogens nor across countries or health systems.The different levels of the burden of illness pyramid and factors associ-
301

14 Discussion
ated with the transition from one level to the next are discussed in thefollowing sections.
14.1.2 Before primary care: The “invisible” part of theburden of illness pyramid
The lowest levels of the burden of illness pyramid, those before primarycare, are the most difficult to explore, understand and comprehend. Atthis stage, no healthcare professionals are involved and hence, the health-care system does not “see” those cases. Considering that most traditionalsurveillance systems collect information from actors of the health caresystem, i.e. physicians and/or diagnostic laboratories, these lower levelsare not captured. In Switzerland, the incidence of AG and the propor-tion of individuals approaching a physician are not known but will beexplored in an upcoming prospective cohort study (Burden of gastroen-teritis in Switzerland (BUGS) study; chapter 13).A study in the United Kingdom (UK) showed that 533–1’530 cases of in-fectious intestinal disease (IID) occurred per 1’000 person-years [Vivianiet al., 2016]. The incidence found in this retrospective telephone surveydiffered depending on the recall period (7 vs. 28 days). Furthermore, in-cidence rates found by Viviani et al. [2016] were higher than those foundin a prospective cohort study conducted in the UK at around the sametime (274 cases/1’000 person-years [Tam et al., 2012]). They concludedthat alterations in study design (e.g. recall period or case definition) canstrongly impact on study findings.Tam et al. [2012] found that 25.3 cases per 1’000 person-years consultedtheir GP in the aforementioned cohort study, hence, around 9% of com-munity cases. A retrospective survey in the Netherlands found a com-munity incidence of IID of 964 cases/1’000 person-years with 8% of casesvisiting a physician [Doorduyn et al., 2012]. Duration of symptoms of ≥3days, blood in the stool and young age were predictors for consulting aGP. Similarly, an Australian study found that disease duration, presenceof fever or chills, respiratory symptoms, and earache increased the oddsof visiting a physician due to infectious gastroenteritis while stomachcramps decreased the odds [Chen et al., 2016]. In a study among cam-pylobacteriosis patients in Switzerland, participants mentioned severityand lack of improvement of symptoms as reasons for care seeking [Blesset al., 2014]. One third of patients (32.7%) consulted the physician dir-ectly, but some had consulted friends and family (42.8%), a pharmacy(19.5%), the internet (14.5%) and/or called a medical hotline (5.0%) be-fore visiting a physician. In the aforementioned Australian study, 36.1%
302

14.1 Reconstructing the burden of illness pyramid
of gastroenteritis cases visited any type of healthcare professional (e.g.pharmacists or doctors) while 13.4% visited a physician [Chen et al.,2016]. Similarly, our qualitative study among Swiss GPs provided evid-ence that there is a substantial proportion of people with AG who doeither seek help at pharmacy level or by contacting the practice nurse,apart from not seeking help at all (section 10.1 and Bless et al. [2016]).As mentioned above, traditional surveillance systems (referred to as the“indicator-based component” of epidemic intelligence* [Paquet et al.,2006]) do not cover these lower parts of the burden of illness pyramid.In recent years, numerous so-called “event-based internet surveillancesystems” have been developed. The “‘event-based component’ [of epi-demic intelligence] refers to unstructured data gathered from sources ofintelligence of any nature” [Paquet et al., 2006]. Information sources in-clude news feeds, social media, search engine queries, and users activelyreporting health events [O’Shea, 2017]. This has the advantage that theydo not rely on information from healthcare professionals [O’Shea, 2017]and hence, also levels below primary care can be covered. Additionally,processes for notification are shorter and therefore, faster. However,so far, such event-based internet surveillance systems have mainly beenused for early detection of emerging infectious diseases or outbreaks.Milinovich et al. [2014] found a correlation between a selected inter-net search term and notifications for 17 infectious diseases in Australia.However, they also highlighted that there is a complex interplay betweeninternet searches, media attention, and actual disease incidence. There-fore, more detailed analyses are needed to further explore the potentialof using search terms for monitoring disease occurrence. It seems thatevent-based surveillance is able to detect changes in disease occurrence.By contrast, and similar to traditional surveillance, it is probably notsuitable to measure actual disease prevalence or incidence consideringthat it is not possible to directly infer from baseline levels of search termactivity to disease prevalence. Syndromic surveillance is another optionfor early detection of outbreaks. Syndromic surveillance can be based ondifferent data sources ranging from clinical observations over laboratorydata to drug sales and use of web pages and helplines [Dupuy et al.,2013]. Clinical observations and laboratory data require contact withthe healthcare system and hence, are again subject to underestimation.One example of syndromic surveillance based on clinical observations isthe study on AG conducted within Sentinella (chapter 11). The use ofdata on drug sales, use of web pages and helplines are all subject to thesame limitations as discussed above: they are probably able to detectchanges in disease frequency but baseline levels of disease activity cannot
303

14 Discussion
be directly quantified. Finally, in the context of One Health*, surveil-lance in the veterinary sector has been proposed for earlier detectionof outbreaks of emerging zoonotic diseases, thereby reducing costs foroutbreak control [The World Bank, 2012]. However, most surveillancesystems are passive and hence, rely on signs and symptoms of the diseaseor syndrome under surveillance. Therefore, this One Health approachusing veterinary syndromic surveillance is not suitable for foodborne dis-eases such as Campylobacter as this zoonosis is mostly asymptomatic inpoultry, cattle, and pigs which are important sources of human Cam-pylobacter infections in Switzerland [Horrocks et al., 2009; Jonas et al.,2015; Kittl et al., 2011]. Furthermore, human AG is frequently causedby viruses having no animal reservoir (e.g. Norovirus, rotavirus) [Halland Lopman, 2015; Patel, 2015]. Therefore, in order to quantify thelowest levels of the burden of illness pyramid, research studies such asthe BUGS study (chapter 13) are needed.
14.1.3 At primary care: physicians’ case management ispatient-oriented
Patients with AG consult a physician two days (median) after onsetof symptoms, according to the Sentinella study (chapter 11). Cam-pylobacteriosis patients in a case-control study reported a median timeinterval between first symptoms and consultation of three days [Blesset al., 2014]. Nevertheless, physicians frequently report to follow a “wait& see” approach for patients with AG (section 10.1 and Bless et al.[2016]). This is in line with American guidelines for the managementof acute diarrhoea in adults recommending stool diagnostics “in casesof dysentery, moderate-severe disease, and symptoms lasting >7 days”[Riddle et al., 2016]. However, testing is also recommended accordingto those guidelines “in situations where the individual patient is at highrisk of spreading disease to others, and during known or suspected out-breaks”. Several studies reported that protracted or long course of dis-ease, poor general condition, blood in stool, and reporting recent travelswere important factors favouring stool diagnostics [Bless et al., 2016;Hennessy et al., 2004; McNulty et al., 2012, 2014; Scallan et al., 2005;Schmutz et al., 2017a; Van Cauteren et al., 2015b; Van den Brandhofet al., 2006]. Hence, physicians consider mainly patient characteristicsand patients’ well-being when deciding for or against stool testing. Pub-lic health considerations play only a minor role in this decision, mainly ifthe case is linked to the healthcare sector (either working or living in aninstitution), or to the hospitality or food industry (section 10.1 and Bless
304

14.1 Reconstructing the burden of illness pyramid
et al. [2016]). Decisions for testing were also reported to be driven bypatient characteristics (e.g. age, length of hospital stay, clinical details)in a study about the management of patients with suspected infectiousdiarrhoea in hospitals in England [Buchanan et al., 2015].Physicians estimated to request stool samples for 18% of patients (range:5–60%) (section 10.1 and Bless et al. [2016]). The Sentinella study founda slightly lower proportion of 12% (chapter 11). A wide range and het-erogeneity in stool sampling rates were reported in other countries, withindividual physicians reporting stool sampling rates ranging from zeroper cent to 100% [McNulty et al., 2014; Van Cauteren et al., 2015b;Van den Brandhof et al., 2006]. The number of stool tests conductedvaries also strongly throughout the year as seen in the positivity stud-ies (chapter 6 and 8). Apart from seasonality in disease incidence, thiscould also be due to seasonality in the prevalence of “risk factors forstool testing” such as travel activity.Stool sample investigation does not only depend on the decision of thephysician, but also on compliance of the patient. A qualitative studyin the UK revealed that embarrassment, fear of results and lack of in-formation on why and how to collect the stool were barriers for patientsto providing stool samples [Lecky et al., 2014]. Fear of results mightbe more strongly related to colorectal cancer screening than to acuteinfectious gastroenteritis. Embarrassment was partly mentioned in con-nection with handing over the sample to the receptionist, consideringthat the reception is a public area where other people may listen to theconversation or observe the situation. This factor might be differentin Switzerland as some physicians would instruct patients to directlysending the stool sample to the diagnostic laboratory by postal mail.Furthermore, participants mentioned concerns about hygiene (handlingfaeces could contaminate own hands and objects; waste disposal) andgenerally considered it “dirty” to handle their own stool. The Sentinellastudy indicated that in 94% of cases where the physician decided to dostool diagnostics a sample was actually sent to the laboratory (12.3%vs. 11.6%) (chapter 11). Consistently, Swiss GPs reported that com-pliance of patients to provide a stool sample is generally not an issue(chapter 10). However, they also stated that if the patient would refusestool sampling, they would usually not insist as results are not crucialfor therapy in most cases of AG. For patients, there might be a trade-off between embarrassment and perceived benefit of getting the results.This trade-off might favour perceived benefit in case of acute infectionand suffering (in the case of AG) as opposed to preventive screening.
305

14 Discussion
14.1.4 After primary care: beyond sensitivity andspecificity of diagnostic methods
Traditional stool culture for gastrointestinal pathogens is increasinglyreplaced by culture-independent methods such as multiplex PCR panelsin Switzerland (chapters 7 and 8) and elsewhere [Gibney et al., 2017;Iwamoto et al., 2015; Marder et al., 2017; May et al., 2017]. This leadsnot only to changes in diagnostic sensitivity and specificity but alsoto changes in testing frequency, mainly due to co-testing for multiplepathogens. For example, if the physician ordered tests for two or threesingle pathogens, a laboratory using multiplex polymerase chain reac-tion (PCR) panels is likely to test the sample using the panel (given therequested pathogens are included in the panel) instead of using singletests for each pathogen due to economic considerations (chapter 7). Testresults from pathogens included in the panel but not ordered by the phys-ician would then usually be reported by the laboratory if positive dueto ethical reasons (chapter 7). However, there are also laboratories con-sidering not to report results of tests not ordered to the physician (asalready routine in case of blood exams). Such information on co-testingand ways of reporting of results from tests not ordered is usually not col-lected by surveillance systems. However, it can impact on surveillancedata as shown at the example of EHEC in Switzerland, where it leadto a strong increase in case numbers (chapters 7 and 8), and Campylob-acter in the United States of America (USA), where culture-confirmedcases decreased while notification rates adjusted for culture-independentdiagnostic tests remained stable [Gu et al., 2018].It was mentioned that not only EHEC but also other pathogens caus-ing diarrhoeal diseases should be detected more frequently with the in-creasing use of multiplex PCR panels [Bundesamt für Gesundheit andNationales Referenzzentrum für enteropathogene Bakterien und Lister-ien, 2015]. However, the authors hypothesised that this was not thecase because there is still enough expertise and equipment available toconfirm positive PCR results using culture-based methods. This is notthe only explanation for the lacking (strong) increase even though cul-ture-confirmation was indeed required for Campylobacter to fulfil thecase definition of the NNSID (until 2017; in 2018, the FOPH changedthe case definition for Campylobacter to include also cases with PCR-confirmation only. This change is valid retroactively for cases notifiedsince January 2013 [personal communication]). According to laboratoryexperts, testing for EHEC was rarely specifically requested while Cam-pylobacter , Salmonella and Shigella all were routinely tested. Hence, the
306

14.1 Reconstructing the burden of illness pyramid
use of multiplex PCR panels did probably not have a large impact ontest numbers for Campylobacter , Salmonella and Shigella while it hada tremendous impact on test numbers for EHEC (and other pathogenswhich are not notifiable). Therefore, it is conceivable that the increasinguse of multiplex PCR panels had a much larger impact on EHEC testand case numbers than on the other three notifiable bacterial pathogensincluded in most panels (Campylobacter , Salmonella and Shigella).Nevertheless, also changes in diagnostic methods affecting sensitivity andspecificity must obviously be taken into account when interpreting sur-veillance data, as described by Bless [2018]; Gu et al. [2018]; Hurd et al.[2012] using the example of Campylobacter .Statements from physicians and laboratory experts indicated that theselection of diagnostic tests by the physician – both, concerning the in-clusion of pathogens and the method applied – is not only dependenton subject-specific or medical reasons but is also influenced by presenta-tion of options on laboratory test order forms (unpublished observation).Studies in Finland, Israel and the Netherlands have shown that phys-icians’ ordering behaviour can be altered by changing how laboratorytest options are presented on order forms [Kahan et al., 2009; Seppänenet al., 2016; Shalev et al., 2009; Zaat et al., 1992]. Hence, also changesin something “simple” such as a laboratory test order form can influencesurveillance data. Given that diagnostic laboratories in Switzerland op-erate in the private sector, harmonisation of order forms is hardly achiev-able.Furthermore, testing algorithms offered and used by diagnostic laborat-ories are likely also influenced by economic considerations. It has beenshown that the workload at the laboratory and the overall turnaroundtime of the sample can be reduced by screening samples first using PCRfollowed by culture of PCR-positive samples (compared to culture only)[Van Lint et al., 2016].In summary, medical decisions and technical features such as sensitivityand specificity of diagnostic methods are not the only factors influencingunder-diagnosis*. Laboratory test order forms and “translation” of phys-icians’ laboratory orders into actual selection of tests at the laboratoryare also factors to be considered.
14.1.5 At the tip of the iceberg: the notification systemis not static
Finally, physicians and laboratories have to comply with their obligationto report notifiable observations. Self-reported knowledge of physicians
307

14 Discussion
and employees of laboratories about the notification system is generally“good” in Switzerland, according to an evaluation report of 2012 [vonStokar et al., 2012].Analysis of hepatitis A, B and C notification data showed that for allthree diseases, no report on clinical findings was received by the FOPHfor about 14–15% of cases (chapter 5, Richard et al. [2017, 2018]). Thisis in line with previous analyses reporting that for 6% to 21% of casesof gonorrhoea or invasive meningococcal disease reports from physicianswere missing [von Stokar et al., 2012]. Furthermore, a report on labor-atory findings was missing for 6% of hepatitis A cases. Additionally,for a study on EHEC, laboratories were asked to send stool samples orEHEC isolates to the National Reference Centre for EnteropathogenicBacteria and Listeria (NENT). Comparison of samples received by thereference laboratory and notifications recorded at the FOPH revealedthat for around 10% of 900 samples no corresponding notification couldbe identified (personal communication). There might be other reasonsfor those discrepancies apart from non-compliance in reporting. Never-theless, it is reasonable to assume that there is some under-notification*in Switzerland. Yet, a quantitative assessment of under-notification hasnot been conducted systematically.The challenges associated with surveillance systems do not end oncethe notification arrives at the point of notification (in Switzerland: theFOPH) and hence, the case is captured by the system (here: the NNSID).Further issues include the reliability and validity of the data as well asquality of data entry and proper documentation of changes in data entryprocedures, data entry masks, and notification forms (see also subsec-tion 14.2.1). Analysis of hepatitis A notification data in Switzerland(chapter 5) has shown that (a) changes in notification forms occur fre-quently, (b) changes in both, data entry and forms are difficult to track,and (c) certain sections of reports on clinical findings (e.g. assumedplace and source of exposure) are poorly filled in. The number of vari-ables included in the surveillance system changed (increased) over time inAustralia [Gibney et al., 2017], indicating changes in notification formswhich may make interpretation of long-term trends difficult. Further-more, notification forms used in Australia and Canada may even differbetween states (or province/territory) [Neave et al., 2016]. In Switzer-land, notification forms are provided at national level (by the FOPH).In conclusion, cases registered in the surveillance system are not onlysubject to underestimation, resulting in a non-random selection of casesoccurring at population level. Heterogeneity in surveillance data is fur-ther increased, and comparability reduced, by changes in notification
308

14.1 Reconstructing the burden of illness pyramid
forms and procedures, under-notification and incompleteness of data.
14.1.6 From disease notification back to infectionThe research work presented provides insights into and quantitative es-timates for the most important steps from attending primary care tobeing notified to the NNSID. Figure 14.1 summarises the multiplica-tion factors as we found them from our different studies for the differentlevels of the burden of illness pyramid and extrapolation of NNSID casenumbers of Campylobacter , Salmonella and EHEC to consultation fre-quencies at primary care level. Estimated multiplication factors did notdistinguish between pathogens except for positivity rates. When calcu-lating backwards from pathogen-specific case numbers, estimated con-sultation frequencies at primary care differ widely. This is not surprisingconsidering that prevalence and incidence of these pathogens, and theproportion of cases seeking care, getting tested and finally notified differ.Additionally, it has to be noted that estimated numbers at all except thetop two levels of the pyramid are not pathogen-specific and are, there-fore, not cumulative. In other words, AG cases tested for Campylobacterspp. and Salmonella spp. will be included in both, Campylobacter andSalmonella estimates. Therefore, based on our extrapolation, “true”consultation frequencies at primary care level are likely in the range of230’000 (lowest estimate for EHEC) and 1.1 million (highest estimatefor Salmonella) per year. These estimates are substantial in size buthave to be interpreted with care as they are subject to several additionallimitations. Certain multiplication factor estimates did not include thehospital setting. For example, the proportion of individuals requested toprovide a stool sample was taken from the Sentinella study (chapter 11).This study involved GPs only. Physicians working in a hospital may usea different case management strategy. Additionally, the positivity studieson Campylobacter and Salmonella (chapter 6) did only include privatesector laboratories (no hospital laboratories). Positivity rates of hospitallaboratories may differ. Finally, multiplication factors and case numbersused for this calculation originate from different years which could alsoaffect extrapolation results.The Sentinella study (chapter 11) and the study on healthcare costs(chapter 12) also provided estimates of consultations due to AG at pri-mary care level: the Sentinella study estimates (174’610 first consulta-tions due to AG) were lower while the estimates from the assessment ofhealthcare costs (311’192–707’255 patients consulting due to AG or cam-pylobacteriosis) were comparable to the “downward calculation” presen-
309

14Discussion
Figure 14.1: Estimation of case numbers at different levels of the burden of illness pyramid for foodborne infections.Note that numbers across pathogens are not cumulative and do not reflect estimated numbers for this specific pathogen.Estimated multiplication factors are from different yearsPositivity: see studies on positivity rates, chapters 6 and 8; Sentinella: see study within the Swiss Sentinel SurveillanceNetwork, chapter 11; Swiss GP: see study among Swiss GPs, chapter 10; BUGS: see study on burden of gastroenteritis inSwitzerland, chapter 13
310

14.2 The NNSID: a critical reflection
ted in this chapter (Figure 14.1). It has to be considered that the lattertwo calculations were based on the same information sources (the health-care cost estimations using mostly preliminary results of the same studiesas the calculation in this chapter). Additionally, those two calculationsstarted from the top of the pyramid and calculated downwards while theSentinella extrapolation relied on consultation frequencies at primarycare level in Switzerland considering the proportion of consultations bySentinella-physicians and the proportion thereof which is due to AG. Allcalculations are based on several assumptions making it difficult to as-sess which of them is most reliable and closest to reality. Furthermore,estimates were calculated for different calendar years. Nevertheless, allestimates point at a substantial burden due to AG at the primary carelevel in Switzerland which is partly preventable. Furthermore, the es-timates are indicative of a large, yet unquantified burden to the Swisseconomy and society.
14.2 The National Notification System forInfectious Diseases: a critical reflection
14.2.1 Does the NNSID fulfil its purpose?When judging about the performance of a system, its intended purposehas to be taken into account. The purpose of the NNSID is the earlydetection and surveillance of communicable diseases [Die Bundesvers-ammlung der Schweizerischen Eidgenossenschaft, 2012b]. This shouldsupport to prevent epidemics and further spread of those diseases, and toevaluate if control measures were effective. Critique was raised that datafrom the Swiss NNSID do not allow distinguishing between changes indisease frequency at population level and changes in other factors influ-encing case numbers [Bundesamt für Gesundheit and Nationales Refer-enzzentrum für enteropathogene Bakterien und Listerien, 2015; Schmutzet al., 2013, 2016]. The same was reported for surveillance systems ofother countries [Henao et al., 2015; Janiec et al., 2012; Lake et al., 2010].In the subsequent paragraphs, the NNSID’s performance is assessed,roughly following the handbook of the European Centre for Disease Pre-vention and Control (ECDC) for surveillance system evaluation (chapter3) [European Centre for Disease Prevention and Control, 2014]. Theseguidelines were chosen as they were recent (from 2014) and developedfor the European Union (EU) with the aim to improve comparability ofcountry-specific data collected within The European Surveillance Sys-
311

14 Discussion
tem (TESSy). Switzerland does not belong to the EU and hence, doesnot participate in TESSy but it still reports case numbers for selecteddiseases to ECDC. Therefore, it would be ideal if the Swiss surveillancesystem was comparable to those of the EU countries considering the geo-graphic proximity and the (relative) similarity of health systems. Still,guidelines of the Centers for Disease Control and Prevention (CDC) forevaluating public health surveillance systems (task D) [German et al.,2001] were considered in addition to complement the assessment.
External completeness – Under-notification
According to the ECDC handbook, external completeness refers to thelevel of under-notification, hence, the cases correctly diagnosed by notreported to the surveillance system (note, however, that the term “un-der-reporting” is used in the handbook) [European Centre for DiseasePrevention and Control, 2014]. In contrast, sensitivity of a surveillancesystem includes under-notification, under-diagnosis and under-ascertain-ment* of cases. For a discussion on the sensitivity of the Swiss surveil-lance system, please see the next section.Both, the actual external completeness and the target level of externalcompleteness depend on the pathogen studied. Diseases for which ahigh level of external completeness is important include highly conta-gious diseases, diseases with high case-fatality, rare diseases, (re-)emer-ging diseases, new strains, and diseases for which eradication or control isenvisaged [European Centre for Disease Prevention and Control, 2014].For other diseases in the surveillance system, lower levels of externalcompleteness may be acceptable. Acceptable levels for external com-pleteness of notifications should be defined before conducting a formalevaluation.One way to assess external completeness is comparison of notifications re-ceived from physicians and from laboratories for diseases for which bothreports are required. Von Stokar et al. [2012] looked at five diseases inSwitzerland (invasive meningococcal disease, measles, gonorrhoea, tick-borne encephalitis and hepatitis B) and reported that between 2.8% and21% of cases missed physician reports in 2008 or 2009, depending on thedisease. Analysis of Swiss hepatitis A notification data revealed that areport on clinical findings was missing for 14% of cases between 1988 and2016 (chapter 5). Data for this kind of assessment is readily available atthe FOPH and hence, analysis should be conducted on a routine basisfor all notifiable diseases.Another method for assessing external completeness is comparison of
312

14.2 The NNSID: a critical reflection
surveillance data with databases of data providers (i.e. laboratories andphysicians) or with medical records. For our positivity studies we re-ceived data from diagnostic laboratories directly and compared it to casenumbers reported by the corresponding diagnostic laboratories accord-ing to the NNSID database. Comparison of positive laboratory reportsreceived from the laboratories directly and cases recorded in the NNSIDfor EHEC revealed that numbers differed by up to 21% annually for thetime period from 2007 to 2016 (chapter 8).Capture-recapture studies are a third way of assessing external com-pleteness. However, appropriate data sources are limited to compare theNNSID data with. Only the subset of hospitalised cases reported in theNNSID could be compared with hospital statistics. Mortality statisticsare not very suitable either as (fortunately) the majority of cases reportedto the infectious disease surveillance system will not be fatal. Sentinellaseems suitable in the first instance. However, case definitions often differbetween the NNSID and Sentinella – if the same diseases are surveyedat all – and notifications lack a common identifier. Hence, the propor-tion of patients captured by both systems cannot easily be quantified.However, other countries have evaluated reporting completeness usingcapture-recapture studies. For example, in Wallonia, Belgium, a com-pleteness rate of 65% for notification of Legionnaires’ disease was found[Jacquinet et al., 2015]. A similar rate of 60% was found for Creutzfeldt-Jakob disease (CJD) in Belgium [Litzroth et al., 2015]. It was con-cluded that the surveillance system was able to detect changes in CJDincidence. Low reporting completeness was found in the Netherlands forpertussis-related hospitalisations and deaths [Van der Maas et al., 2017].Similar to Switzerland, cases must be reported to the Dutch notificationsystem upon laboratory-confirmation. Hence, hospitalisations occurringafter laboratory-confirmation may be missed. Despite limitations, cap-ture-recapture studies should be considered to formally assess externalcompleteness of the NNSID.
Sensitivity and specificity
The ECDC handbook defines sensitivity as the “proportion of the ac-tual cases that were reported to the system”; Specificity, on the otherhand, is the “proportion of non-cases identified as such and not reportedto the system” [European Centre for Disease Prevention and Control,2014]. Therefore, sensitivity and specificity also depend on the diseaseconsidered and are not universal to a surveillance system. Reconstruc-tion of the burden of illness pyramid from consultation at primary care to
313

14 Discussion
disease notification using the example of foodborne infections has shownthat underreporting* is substantial in Switzerland (subsection 14.1.6),and hence, sensitivity of the NNSID is low. However, diagnostic testsused have changed: the increasing use of multiplex PCR panels – forgastrointestinal infections but also for other diseases – increases testnumbers and case detections and, hence, sensitivity (chapter 7). On theother hand, rare diseases may not be at the forefront of physicians mindsand hence, may not be considered at all or diagnosed with a substantialdelay (chapter 5), again at the cost of sensitivity. Considering that manyobservations are notifiable upon positive laboratory diagnosis and thatdiagnostic methods are of high quality in Switzerland, both, specificityand positive predictive value (PPV) of the surveillance system are as-sumed to be high.Another aspect affecting sensitivity of the surveillance system is accessto healthcare. Access to healthcare is assumed high considering thathealth insurance is compulsory in Switzerland and that 78% of the pop-ulation reported having consulted a physician within the last 12 monthsaccording to the Swiss health survey in 2012 [Bundesamt für Statistik,2017b]. The BUGS study (chapter 13) will provide further informationfor assessing sensitivity of the NNSID by looking at patients’ help seek-ing behaviour and quantifying under-ascertainment.The CDC guidelines define a second approach to measure sensitivity ofa surveillance system apart from underreporting: the “ability to detectoutbreaks, including to monitor changes in the number of cases overtime” [German et al., 2001].Sensitivity to detect outbreaks or changes in disease frequency can stillbe good even if underestimation is substantial as long as factors affectingunderestimation remain constant. A change in one or several of thosefactors can either affect sensitivity or the PPV of the system. The PPVof an outbreak or “alert” could be considered instead of looking at thePPV of an individual case. However, no proportion of correct alerts canbe estimated in the absence of knowing the number of “true” changesin disease occurrence (or outbreaks). However, experiences with EHEC(chapters 7 and 8), Legionella [Fischer et al., 2017; Gysin, 2018] andChlamydia trachomatis [Schmutz et al., 2013] – all showing an increasein notified cases which does not necessarily represent an increase in dis-ease frequency at population level – point at a rather low PPV of theNNSID.
314

14.2 The NNSID: a critical reflection
External validity
External validity is assessed by comparing data from the surveillancesystem with data from another system, ideally from a source consideredthe “gold standard”. A common method used is record linkage usingdifferent data sources, e.g. medical records, or death certificates. Astudy comparing measles case notifications concluded that the NNSIDhad a lower sensitivity but a higher specificity compared to Sentinellain terms of case detection [Richard et al., 2008]. However, the NNSID’sperformance was better for identifying outbreaks.Hospital and mortality statistics are another source for comparison ofcase numbers. However, different case definitions hamper easy compar-isons. Furthermore, the three systems (NNSID, hospital and mortalitystatistics) collect information at different time points during the courseof disease additionally complicating comparability. Comparison of dataon hepatitis A from the three aforementioned systems has shown thatcase numbers from hospital statistics are comparable with the numberof cases reported to be hospitalised according to the NNSID – but onlywhen excluding secondary diagnoses from hospital statistics (chapter 5).More deaths due to hepatitis A were recorded in mortality statistics thanin the NNSID.Studies assessing external validity of data collected through the NNSIDare recommended.
Usefulness of the surveillance system
A system can be considered useful if it fulfils its purpose and results areused for public health action. However, it can also be useful if it gen-erates evidence for action beyond its intended purpose [German et al.,2001]. Data from Swiss surveillance systems (NNSID and Sentinella)have been used for several studies presented in this thesis (chapters 4, 5,6, 8, 9, and 12). They stimulated research [Bless et al., 2014; Schmutzet al., 2013], and served as basis for research articles [Richard et al.,2017, 2018; Schuler et al., 2014] as well as for detection of outbreaks[Delaporte et al., 2011; Knoblauch et al., 2015; Stephan et al., 2015].Furthermore, notification data influenced policy. For example, the Swissnational programme against human immunodeficiency virus (HIV) ex-panded its scope to include also other sexually transmitted infections dueto the increase in Chlamydia trachomatis infections, syphilis and gonor-rhoea [Federal Office of Public Health, 2010]. Finally, data from theNNSID and from Sentinella, published in the “BAG Bulletin”, are reg-ularly taken up by public media (Appendix, section F.2). These are all
315

14 Discussion
factors indicative of the system’s usefulness. Similarly, increasing Cam-pylobacter case numbers lead to the establishment of the so-called “Cam-pylobacter-Plattform” in 2008, a multi-stakeholder platform consistingof representatives from research, from cantonal and federal authorities,and from the poultry industry [Federal Veterinary Office, 2008], aim-ing at reducing Campylobacter case numbers in Switzerland. However,despite continuous high levels of Campylobacter case notifications, theplatform was abolished in 2016 [Bundesamt für Lebensmittelsicherheitund Veterinärwesen, 2016].Factors defining usefulness of a system vary between users [EuropeanCentre for Disease Prevention and Control, 2014]. Therefore, a list ofintended and actual users of the systems would be required to formallyassess the NNSID’s and Sentinella’s usefulness.
Simplicity
The process of notification is shown in appendix B. Given the admin-istrative structure of Switzerland, the reporting entities have to reportto one of 26 cantonal health authorities, and selected reports must besent to the federal health authority. Furthermore, the NNSID still relieson paper-based notification forms transmitted to the cantonal physicianand/or the FOPH by postal mail or fax (or telephone in case of observa-tions notifiable within 2 hours). Notifications received by the cantonalauthorities are forwarded to the federal authorities again by postal mailor fax. The notification process could significantly be modernised andsimplified if notifications could be filled in directly in an electronic sys-tem. This would then automatically and efficiently transmit the noti-fication to the appropriate authorities (federal and concerned cantonalauthorities). Also Germany still uses paper-based notification for phys-icians to report to local health authorities [Robert Koch-Institut, 2017].In contrast to Switzerland, however, notification forms are entered intoan electronic system at the local level and forwarded to the state andfederal health departments electronically.Information requested for reports on laboratory findings are mostly tech-nical (such as type of specimen and diagnostic method) and thereforeroutinely collected, known and easily recordable at the laboratory. How-ever, reports on clinical findings also include information which may notbe known by physicians if they did not explicitly ask for during theconsultation (e.g. exposure history; see also “Data quality” in this sub-section, 14.2.1, for a discussion of resulting consequences).Furthermore, the Swiss system is rather complex when it comes to inter-
316

14.2 The NNSID: a critical reflection
vening in public health matters such as contact tracing and prophylaxisamong contacts: responsibilities are dependent on the circumstances.The cantonal authority (cantonal physician) is responsible for case man-agement of a case within his own canton [Der Schweizerische Bundesrat,2015b]. Cantonal authorities may collaborate if several cantons are in-volved (e.g. in case of small clusters or if the patient was travelling),but the federal authority may also take over the responsibility. Finally,the federal authority (the FOPH) is responsible if the case was travellingabroad, hence, for communication with international authorities.
Flexibility – responsiveness to changing needs
Following reports of numerous countries of autochthonous transmissionof Zika virus disease and clusters of microcephaly and other neurologicdisorders in Brazil, the World Health Organization (WHO) declared aPublic Health Emergency of International Concern on 1st February 2016[World Health Organization, 2016]. On 5th March 2016, a revised DHAOrdinance entered into force declaring Zika virus a notifiable disease inSwitzerland [Das Eidgenössische Departement des Innern, 2015b]. Simil-arly, notification of hepatitis E was introduced on 1st January 2018 in re-sponse to the increasing awareness that hepatitis E is endemic in Europeand not only travel-associated [Bundesamt für Gesundheit, 2017a; DasEidgenössische Departement des Innern, 2015a]. Hence, the NNSID isable to quickly respond to changing needs – at least in case of emergingdiseases.The obligation to reconsider the list of notifiable observations and thecontent of the notifications at least once a year is stipulated in the “DHAOrdinance on the reporting of observations on human communicable dis-eases” [Das Eidgenössische Departement des Innern, 2015a]. Content (orat least wording) of notification forms was changed quite frequently forhepatitis A and Legionella (chapter 5; Gysin [2018]) – and likely also forother diseases. For example, the clinical sign of jaundice was promptedin at least three different ways: it was listed as one of the signs andsymptoms under the heading “clinical signs” from 1988–1990, it couldbe checked as “reason for laboratory testing” from 1991–1998, and waslisted again under “manifestation” or “clinical manifestation” from 1999onwards. Whether this kind of flexibility of the system is favourable is,however, questionable considering that such changes can make interpret-ation of long-term trends difficult. Case definitions were also changedrepeatedly. For example, in 2018 the case definition for Campylobacterwas adapted to include also cases with laboratory-confirmation using
317

14 Discussion
culture-independent methods as confirmed cases (personal communica-tion). Case definitions used by ECDC are also regularly updated; alsoat the European level, the case definition for Campylobacter newly in-cludes laboratory-confirmed cases using nucleic acid detection methodsas confirmed cases in the 2018 update [European Commission, 2018].Implementation of electronic reporting for laboratories was plannedalready for 2012/13 [von Stokar et al., 2012] but is still pending (asof August 2018).In conclusion, the NNSID is responsive to changing epidemiologicalneeds. However, when it comes to adapting to technological advances,the NNSID’s flexibility is limited.
Data quality
A substantial proportion of “unknown” or “not specified” responses tocertain variables has been noted for different notifiable diseases, espe-cially regarding exposure information and risk factors (chapter 5, Gysin[2018]). The assumed place of exposure was unknown or missing for41% and 70% of acute and chronic hepatitis B cases, respectively andfor 25% and 68% of acute and non-acute hepatitis C cases recorded inthe NNSID [Richard et al., 2017, 2018]. Poor completion of suspectedcountry of exposure was also reported in Australia [Gibney et al., 2017].The study among Swiss GPs has further shown that taking the exposurehistory is not among the top priorities during a consultation for somephysicians – at least for diarrhoeal diseases (section 10.2). This is likelyalso the case for other diseases which would explain the poor completionof exposure information by the physician on notification forms.The physician is required to complete the form as soon as the criterionfor notification is fulfilled [Das Eidgenössische Departement des Innern,2015a]. Considering that this criterion for notification is often dependenton laboratory-confirmation of the disease, the physician knows that he isrequested to complete the notification form only after the consultation.The physician may not routinely collect all information requested on thenotification form, e.g. on exposure history, given that it is not requiredfor case management. Hence, filling in the form after seeing the patientfurther contributes to incomplete information if no follow-up consulta-tions are scheduled and not all information required was obtained andrecorded during the initial consultation. Extra efforts would be requiredby the physician in order to be able to answer all questions on the noti-fication form (e.g. “preventively” collecting the information needed eventhough the suspected case might not be confirmed); else, data quality is
318

14.2 The NNSID: a critical reflection
at stake.Moreover, considering the validity of data even if all information wasobtained, it reflects one point in time but certain factors such as hos-pitalisation status could change. In this regard, also new diagnosticmethods providing faster results could change the time point of com-pletion of the notification form because the criterion for notification isfulfilled at a different point in time during the course of disease. Thiscould influence content of the notification.For HIV, influenza and Legionella the number of tests conducted hadto be reported by diagnostic laboratories already before implementationof the new Epidemics Act in 2016. For example, for Legionella this in-formation is required since 2006 [Gysin, 2018]. However, reporting isincomplete and has not been enforced. Sometimes even fewer tests thancases (positive tests) were recorded for Legionella [Gysin, 2018]. Know-ledge gaps on laboratory routine procedures in testing make it difficultto evaluate data quality of reports on the “statistic of reports on labor-atory findings” (i.e. the number of tests performed and the number ofpositive tests thereof) which are notifiable since 2016 (chapter 9).
Acceptability of the surveillance system
The interviews with Swiss GPs and laboratory experts (chapters 7 and10) indicated that there are differences between them concerning accept-ability of the surveillance system but they generally see the need for anotification system. On the other hand, they mentioned that they haveto provide a lot of information for little return (e.g. statistics as reportedin the bulletin of the FOPH, the “BAG-Bulletin”). Von Stokar et al.[2012] found that some physicians would wait notifying a case until theywere reminded to report it by the cantonal physician (who sends remind-ers based on reports from laboratories). Diagnosing a notifiable diseaseis not everyday business for most physicians. Therefore, they might nothave a routine procedure and might not be aware of all notifiable dis-eases. In contrast, in laboratories, reporting is frequently automated orthere is at least a defined procedure for reporting.On the other hand, physicians in an Australian study reported that theydid not notify a case of Campylobacter because the laboratory wouldnotify it anyway, they did not know the reason for not reporting, or theydid not consider the notification important [Grills et al., 2010]. Hence,increasing the physicians’ awareness that every single notification is im-portant and that the information provided by physicians is complement-ary to the laboratory notification are key to improve acceptability and
319

14 Discussion
compliance.Another reason for higher acceptability and compliance by laboratoriescompared to physicians could be that notification forms for laboratoriesrequire fewer information and information which is easier to obtain (e.g.age and sex of the patient) compared to physician notifications (e.g. riskfactors and exposure).Acceptability of a system is subjective and its proper assessment wouldrequire a separate study. Nevertheless, based on the indications dis-cussed above, it can be concluded that the NNSID is accepted by Swisssystem actors. Despite, its acceptance could be improved by providingfeedback (e.g. in the form of more frequent, timely and targeted analysesof notification data; more than “simple” tables with case numbers in theweekly “BAG Bulletin”) and increasing awareness of the importance ofevery single notification. In line, physicians in Australia reported thatimproved feedback beyond “automatically generated summary reports”would increase their compliance to notify [Grills et al., 2010].
Representativeness
Cases captured by the NNSID are unlikely to be representative of thecases occurring in the general population in Switzerland – at least inthe case of foodborne diseases. The study among Swiss GPs and theSentinella study (chapters 10 and 11) have shown that, for example, pa-tients reporting recent travel are much more likely to be tested in caseof AG and hence, are more likely to be captured by the system. Fur-thermore, patients with severe disease, poor general health state or co-morbidities are more likely to seek care and to be tested. Physicians’(mis-)perception of risk factors can additionally influence their approachto diagnosis as well as their awareness of a certain disease influencingcase-ascertainment.Representativeness is likely to vary between diseases. The factor of un-derestimation is probably lower for highly virulent pathogens and theirrepresentativeness in the NNSID is higher. In contrast, the case as-certainment bias is presumably higher for pathogens frequently causingasymptomatic or mild infections.
Timeliness of reporting and outbreak detection
Timeliness is partly inherent to the system set-up (e.g. defined timeframe for reporting as stipulated in the Epidemics Act) and partly de-pendent on the persons and processes involved. Notification is required
320

14.2 The NNSID: a critical reflection
within 2 or 24 hours or 7 days, depending on the pathogen [Das Ei-dgenössische Departement des Innern, 2015a]. Furthermore, help seekingbehaviour of patients, diagnostic approaches of the physicians, specimencollection and transportation, laboratory methods used by laborator-ies, compliance with the reporting requirements and data processing atthe cantonal and federal authorities are influencing timeliness of report-ing. New diagnostic methods such as multiplex PCR panels replacingtraditional culture-based methods for stool testing reduce the time todiagnosis. However, patients with AG do not immediately seek help andphysicians frequently follow a “wait & see” approach (section 10.1 andchapter 11), both delaying case detection. Richard et al. [2008] reportedthat timeliness of case detection was better in Sentinella than in theNNSID but it should be improved in both systems.Another aspect of the surveillance system’s timeliness is the time to de-tection of an “event” (a potential cluster or outbreak). This is dependenton the processing of the data received, on data analyses and on informa-tion sources used. In order to increase the chance to react timely in caseof a foodborne outbreak, the time frame for notification was reduced to24 hours for most foodborne pathogens in Switzerland [Das Eidgenöss-ische Departement des Innern, 2015a]. However, the timeliness of theNNSID could certainly be further improved by introducing electronicreporting, allowing for an almost simultaneous information of cantonaland federal authorities and minimising time needed for data entry. Ad-ditionally, automated outbreak detection tools could be applied for rapididentification of clusters in case reports. First positive experiences arereported from Germany where such a system was implemented in 2013[Salmon et al., 2016].
Stability
Reliability and availability of the surveillance system itself (not the datacollected within the system) are key factors of stability according to theCDC guidelines [German et al., 2001]. The studies conducted as partof this thesis do not assess stability of the NNSID; however, no eventshave been noted pointing at a lack of stability. Yet, the system’s stabil-ity could potentially still be improved, e.g. by implementing electronicnotification, considering that data processing at the cantonal and fed-eral authorities is mostly manual and hence, dependent on availabilityof workforce.
321

14 Discussion
Conclusions on the system’s performance
This rough evaluation of the Swiss surveillance system showed that theNNSID is a useful, well accepted and stable system. Sensitivity of thesystem at case-level is low but sensitivity of outbreak detection still seemsacceptable. The system is able to adapt to changing epidemiologicalneeds but lacks flexibility to accommodate technical improvements suchas electronic reporting. Introducing electronic reporting could increasetimeliness of the system as well as simplicity and data quality. Combin-ing and comparing notification data with data collected through othersystems (e.g. hospital and mortality statistics) is recommended to eval-uate the data in terms of external completeness and validity, and tofurther increase data use.In summary, the NNSID does fulfil its purpose but should still be im-proved in various aspects. It has to be noted that this is not a formalevaluation of the Swiss surveillance system. A detailed evaluation fol-lowing all steps described in the ECDC handbook [European Centre forDisease Prevention and Control, 2014] goes beyond the scope of thisthesis but is strongly recommended. Furthermore, costs and cost effect-iveness of disease surveillance were not considered but should be includedin a future evaluation.
14.2.2 Does the purpose of the NNSID match ourexpectations?
A more refined definition of the NNSID’s purpose in combination withtargeted research systematically evaluating all system characteristics isneeded to further assess the system’s performance.Critique about the NNSID which was raised may not only signal failuresof the system but could also be attributed to high or wrong expectationstowards the system. A surveillance system is not designed to provideanswers to all epidemiological research questions. Hence it cannot beexpected that it replaces epidemiological research. As discussed above(subsection 14.2.1), simplicity is a key factor of a surveillance system.Therefore, keeping the public health surveillance system simple, flexible,acceptable, timely and stable and complementing findings by separateresearch studies is likely more efficient and appropriate than overloadingthe surveillance system with complementary research questions.In that sense, it might be worthwhile considering alterations to the ex-isting NNSID. For example, the burden of notification could be reducedfor physicians by decreasing the amount of data requested, especially
322

14.2 The NNSID: a critical reflection
for data with poor quality (e.g. exposure information). Complementaryresearch could be mandated using the resources saved to gather this in-formation, when needed. This approach would have the advantage thatstudies could be targeted to specific research questions circumventinglimitations inherent to surveillance systems such as case ascertainmentbias.Additional possibilities to improve the NNSID are discussed in the fol-lowing subsection.
14.2.3 How could the NNSID be improved?An evaluation of the NNSID was conducted in 2011 based on a mandatefrom the FOPH, as referred to already before [von Stokar et al., 2012].The evaluation report concluded that the NNSID is a well functioningand accepted system. Nevertheless, several recommendations to improvethe NNSID were given, mainly in terms of compliance and quality, someof which are listed below:• Regularly assess compliance of reporting taking into account other
information sources such as SwissDRG and medical statistics of hos-pitals
• Simplify process of reporting by merging initial and complementaryreport to improve compliance
• Implement an electronic notification system (which can ideally belinked to practice-, hospital-, and laboratory-software informationsystems) to improve compliance
• Improve knowledge about the NNSID among those required to no-tify (e.g. on the selection of notifiable observations, time limit forreporting and process of reporting)
• Actively inform about functionality and benefit of the NNSID throughdifferent information channels
• Actively communicate changes in the NNSID to those concerned• Specify contact persons who are readily available in case of questions
about technicalities of the NNSID• Involve cantonal physicians to inform about the NNSID as they are
in close(r) contact with physicians• Involve professional associations and stakeholders to act as role mod-
els and implement clear processes within institutions (hospitals, labor-atories) defining responsibilities
323

14 Discussion
Optimising communication and increasing compliance
Some of the recommendations by von Stokar et al. [2012] have beenaddressed. For example, initial and complementary reports have beenreplaced by one notification form (report on clinical findings) for all butfour notifiable observations with the implementation of the new Epidem-ics Act in 2016.The benefit and importance of the NNSID was discussed controversiallyamong Swiss GPs participating in the qualitative study (section 10.2).Both, laboratory experts and GPs from the stakeholder consultation(chapters 7 and 10) mentioned the difficulty to identify and contact re-sponsible persons at the FOPH. Hence, the FOPH should still try toimprove communication and specify personal contact partner(s). Fur-thermore, the contacts established during the laboratory visits should bemaintained or even strengthened, and expanded to include more laborat-ories, generating a community of practice of actors of the Swiss surveil-lance system. Regular exchanges should be organised, e.g. as monthlytelephone conferences complemented by an annual meeting. If this ap-proach proves successful, a similar network and exchange with physiciansshould be considered.The suggestion by von Stokar et al. [2012] to involve cantonal physi-cians as mediators between physicians and the FOPH seems promising:GPs participating in the qualitative study mentioned closer contact withcantonal physicians than with the FOPH and perception of cantonalauthorities was generally more positive than perception of the FOPH(chapter 10). It has to be noted, however, that the recommendations ofvon Stokar et al. [2012] and most of the study findings originate fromtimes before introduction of the new Epidemics Act.With the implementation of the new Epidemics Act, the FOPH releaseda “manual on notifiable diseases” [Bundesamt für Gesundheit, 2018a] aswell as a poster with an overview of all notifiable diseases and pathogens[Bundesamt für Gesundheit, 2018]. The latter was displayed in severallaboratories, as noted during the visits (chapter 7). This suggests thatthe poster was considered attractive and acts as a good tool to increasevisibility of the notification system. Weekly reporting of influenza dur-ing the influenza season was mentioned several times by Swiss GPs andconsidered useful (unpublished observation). Communication of surveil-lance data on influenza should, therefore, be used as a role model alsofor other diseases considering that this reporting is well-known and per-ceived positive by both, physicians and public media.Findings from the qualitative study among Swiss GPs (section 10.2)
324

14.2 The NNSID: a critical reflection
suggest that events for continuous education and Swiss medical journals(e.g. Swiss Medical Weekly or Primary Care) are suitable tools to reacha high proportion of GPs in Switzerland. Therefore, these communic-ation channels should be used more actively by the FOPH to informabout issues related to disease surveillance, including changes in thenotification system but also to communicate results from analyses of no-tification data. Publishing articles in existing local medical journals issuggested rather than creating an own journal or newsletter consideringthat physicians reported being overwhelmed by the flood of information.In addition, active participation of staff from the FOPH at conferencesand events for continuous education should be increased to foster directpersonal contact between system actors.
Content of notification forms
Reliability and usefulness of risk factor and exposure information (per-sonal risk factors, exposure risks, potential source and place of exposure)collected in surveillance systems must be questioned: first, the informa-tion is often incomplete (chapter 5; Gibney et al. [2017]; Richard et al.[2017, 2018]). Second, the information relies on proper and systematicanamnesis by the physician completing the form. However, the studyamong Swiss GPs indicated that anamnesis on risk factors is not the mostimportant part of a consultation for some physicians, at least concerningfood anamnesis in case of diarrhoeal diseases (section 10.2). Further-more, the physicians’ correct knowledge on incubation period, potentialsources of exposure and risk factors is crucial for accurate anamnesis andcompletion of notification forms but must be questioned (section 10.2).Neave et al. [2016] evaluated notification forms from Australia, New Zea-land, the UK and Canada for selected diseases and made recommenda-tions about which variables should be collected on notification forms toinform public health policy in the context of imported infections. Theyrecommended the collection of at least the following variables: “Travel-related information: recent international travel; reason for travel; datesof entry to and departure from the countries visited during the diseaseincubation period; and vaccination details. Demographic information:traveller’s and parent’s country of birth; country of usual residence;length of time resident in current country; postcode. There was noagreement about whether ethnicity should be collected. Disease severityinformation: hospitalisation; death.”Following these recommendations, completely refraining from obtaininginformation on possible exposure may not be appropriate. However,
325

14 Discussion
every variable of the notification form should be evaluated, carefullyconsidering validity, reliability and importance. Moreover, wording ofquestions should be cautiously and deliberately chosen. For example,there is a slight, but potentially important difference in asking “in whichcountry has the patient been during the incubation period” (objectiveinformation) and “in which country has the patient likely been infected?”(information with some subjective component, including interpretationof the physician). Subtle changes in wording of notification forms caninfluence responses, but the extent can hardly be quantified (chapter 5).Therefore, it is recommended to refrain from those changes if ever pos-sible. Collecting objective information (e.g. where has the person been)rather than partly subjective information (e.g. where has the personbeen exposed) is recommended to reduce heterogeneity in surveillancedata and increase reliability.
Electronic notification
Electronic notification has not been implemented in the NNSID yet, butis still planned to be implemented in the future. Implementing electronicnotification can improve the NNSID in several ways: first, it is likely toincrease compliance by reducing the time needed for notification (lesspaper handling; quicker search for appropriate form). Second, quality ofthe data could be improved (e.g. automatically highlighting fields withmissing or erroneous information, no data entry of paper forms). Third,under-notification could be reduced if the electronic reporting systemis linked to the practice-, hospital-, or laboratory information systemand generates automatic reminders that a certain diagnosis is notifiable.Fourth, timeliness could be improved by simplifying the reporting pro-cess. The Sentinella network offers both, electronic and paper-basednotification. Electronic notification was chosen by more than half ofparticipating physicians (chapter 11). Currently, the FOPH considersswitching to electronic notification only in the Sentinella system andasked participating physicians still reporting on paper forms about theirwillingness to switch [Sentinella, 2017]. More than a third of respond-ents each were willing to switch immediately (26/70) or in case paper-notification is ceased (25/70). One fourth of respondents still preferredpaper-based forms (18/70). For 14 of 70 respondents offering electronicnotification only would be a reason to quit Sentinella. These experiencesand results indicate that electronic notification would be well-acceptedamong the majority of Swiss physicians. Nevertheless, there is still aminority with a negative attitude towards electronic reporting. Proact-
326

14.2 The NNSID: a critical reflection
ive information of physicians (and others required to report) will, hence,be very important when changing to electronic notification in other sur-veillance systems, e.g. the NNSID.In the Netherlands, introduction of an electronic reporting systembetween the municipal and the national health services lead to improvedtimeliness and completeness of notifications despite reports from clini-cians and laboratories were still sent using conventional phone, fax ore-mail to report to the municipal level [Ward et al., 2005]. Similarly,Gibney et al. [2017] suggested that increasing case numbers seen in theAustralian surveillance system are partly attributable to changing frommanual notification of clinicians to automatic notification of laboratories.
Comprehensive vs. sentinel surveillance
During the evaluation of the NNSID it was also discussed if the nation-ally compulsory notifications could be replaced by a sentinel surveillancesystem [von Stokar et al., 2012]. It was shown that the NNSID is lesssensitive than Sentinella to detect cases of measles, despite the formerrelying on two information sources (physicians and laboratories) whilethe latter is exclusively supported by physicians [Richard et al., 2008].Nevertheless, the NNSID was more sensitive to detect outbreaks. Ad-ditionally, Sentinella lacked specificity and both systems showed weaktimeliness. Considering that outbreak detection is one of the main pur-poses of disease surveillance, a comprehensive system such as the NNSIDshould not generally be replaced by sentinel surveillance.
Collection of summary statistics (denominator information)
Knowledge of denominator information such as the number of tests per-formed is important for interpretation of case numbers, as shown by ourpositivity studies (chapters 6 and 8; Schmutz et al. [2013]). Reportingof summary statistics for laboratories has been introduced more widelywith the new Epidemics Act: Laboratories have to report the numberof tests conducted for certain diseases once a year (chapter 9). Knowingthis denominator would allow rough analyses similar to our positivitystudies (chapters 6 and 8; Schmutz et al. [2013]). Repeated tests in thesame individual cannot be considered when analysing those data in con-trast to our positivity studies where individual-based information wascollected. Experiences from the aforementioned studies suggest that in-terpretation of findings do not change considerably if repeated tests arenot considered – at least when looking at trends. On the other hand,preliminary analysis of summary statistics from the first two years of
327

14 Discussion
reporting has identified several limitations (chapter 9). One of thoselimitations – confirmatory (“reflex”) testing – was not routinely appliedby diagnostic laboratories for the pathogens considered in our positivitystudies during the time periods studied. It is conceivable that systematicreflex testing does affect positivity considerably and hence, should notbe ignored. In this case, collection of aggregated (vs. individual-based)data on test numbers would no longer suffice. Furthermore, validity andusefulness of data collected through current notification forms on “stat-istic of reports on laboratory findings” must be questioned (chapter 9).
14.3 The ideal case management for acutegastroenteritis from different perspectives
14.3.1 The patients’ perspective: reducing illnessduration and social impact
Laboratory-confirmed campylobacteriosis patients in Switzerland repor-ted consulting a physician mainly due to severity, persistence or lack ofperceived amelioration of signs and symptoms [Bless et al., 2014; Suter,2014]. The need for a medical certificate was spontaneously reportedas a reason for consultation in 4% of cases only. However, this findingmight be influenced by the fact that the study was conducted duringthe festive season. Furthermore, the need for a medical certificate maynot be the primary reason for consultation in severely affected patients(such as laboratory-confirmed campylobacteriosis cases) while it mightbe a more prominent reason among moderately affected patients withAG. The expectations of the patients towards the physician have notbeen assessed in the aforementioned study. Swiss physicians reportedthat patients rather expect some sort of “action” (e.g. treatment orlaboratory investigation) as opposed to what physicians called “watch-ful waiting” (chapter 10).Generally, little is published about patients’ expectations when consult-ing a physician due to AG. Both, patients’ reported reason for consulta-tion in the Swiss case-control study on campylobacteriosis [Bless et al.,2014] and physicians’ perception of patients’ expectations (chapter 10),point at a reduction of illness duration, and measures mitigating signsand symptoms and therefore reducing suffering and social impact as themain expectations of patients consulting a physician due to AG. A studyinvestigating antibiotic prescription in patients with acute diarrhoea vis-
328

14.3 Ideal case management for AG: different perspectives
iting emergency departments in the USA found that 91% of patientsexpected prescription of an antibiotic and/or another medication [Kar-ras et al., 2003]. A study among participants of the Swiss inflammat-ory bowel disease (IBD) national cohort revealed that individuals’ mostimportant expectations were good coordination between GPs and spe-cialists, receiving information on adverse events of treatment, and easierdrug treatments [Pittet et al., 2018]. However, those expectations arelikely different in IBD patients compared to AG patients considering thechronic nature of IBD. A study exploring reasons for attending an ur-gent care centre in England found that patients with a “minor illness”(as classified by a GP) mentioned quick access to care as a main reasonfor consulting the centre (as opposed to a GP) [Amiel et al., 2014].Furthermore, more than half of patients expected receiving prescriptionmedication.Patients’ expectations towards the physician when consulting due toAG will be explored in detail in the framework of the BUGS study(chapter 13).
14.3.2 The physicians’ perspective: reducing sufferingand caring for the vulnerable
There are no Swiss guidelines on the management of acute diarrhoea.The Swiss Society for Gastroenterology refers to international guide-lines [Schweizerische Gesellschaft für Gastroenterologie, 2018]. Americanguidelines for the management of acute diarrhoea in adults suggest initi-ation of stool diagnostics “in cases of dysentery, moderate-severe disease,and symptoms lasting >7 days” in line with common practice reportedby Swiss physicians (chapter 10; Riddle et al. [2016]). In those cases,diagnosis serves to enable targeted treatment of the individual patient.Assessing aetiology is usually not considered in mild to moderate andrecent cases as it hardly affects treatment for mainly two reasons: first,AG is usually self-limiting and hence, symptomatic treatment and/ordietary recommendations are generally sufficient (chapter 10). Second,physicians want to help the (suffering) patient immediately rather thanin a few days when diagnostic results are available. In this perspective,the use of new multiplex PCR panels seems to have advantages over tra-ditional culture by providing results in hours rather than days (once thestool sample arrived at the laboratory). Fast results provide the basisto adjust treatment based on the aetiology of disease. Ideally, this thenhelps to reduce both, suffering of the patient and empirical antibiotictherapy. The latter should be avoided in the light of antibiotic resist-
329

14 Discussion
ances [Review on Antimicrobial Resistance, 2016].The GP acts as the counterpart of the patient which is reflected in vari-ous aspects of his attitude towards diagnosis, treatment and perceptionof AG in general: as discussed above and in chapters 10, 11 and 14.1.3,the decision for or against stool diagnostics is mainly dependent on thepatient’s health status rather than on public health considerations. Sim-ilarly, the decision for or against prescription of antibiotics is based onthe individuals’ well-being rather than on the general aim to reduce an-timicrobial use in the population (chapter 10; Review on AntimicrobialResistance [2016]). This leads to pragmatic decisions and empiric ther-apy, and puts microbiological findings in the rear. A qualitative studyamong English GPs found that high patients’ expectations for relief andlack of time during consultation to explain inappropriateness of antibi-otics were barriers for appropriate antibiotic prescription in the generalpractice outpatient setting [Yates et al., 2018]. Furthermore, a recentliterature review concluded that the link between over-prescribing of an-tibiotics by physicians and the increase of antimicrobial resistance isneither immediate nor apparent to the physician while missed bacterialinfections with potentially serious patient outcomes are clearly coupled[Krockow et al., 2018].When asked about the importance of diarrhoeal diseases, many GPs re-sponded that diarrhoea is not a problem because it is self-limiting, easyto treat and generally not dangerous (chapter 10). They stated thatAG is frequent, but harmless. Hence, GPs’ reasoning suggests that theydid not consider the public health aspect of diarrhoeal diseases or theireconomic impact in their response. Also when asked about the influenceof costs on their decision for or against stool diagnostics, GPs’ answerswere patient-focused (testing only if it is to the benefit of the patient toreduce costs for the individual) rather than population-oriented (testingfor knowing the aetiology and typing to foster outbreak detection and toplan targeted interventions) (chapter 10). Assessing potential exposure isnot a priority for some physicians (chapter 10). Similarly, McNulty et al.[2014] reported that occupational risks and contact with farm animalswere frequently only recorded by physicians if spontaneously reported bythe patient. Furthermore, a study analysing data from a listeriosis out-break investigation concluded that the physicians’ food history takingappeared unstructured [Kiefer et al., 2016]. All above-mentioned factorssuggest that also physicians are mainly interested in AG (the syndrome,as it presents as an illness/disease) as opposed to foodborne disease*(with a focus on the transmission pathway).Apart from reducing suffering of the patient, one of the physicians’ main
330

14.3 Ideal case management for AG: different perspectives
concerns is to identify vulnerable patients and patients at risk of com-plications and sequelae such as infants, elderly people and patients withco-morbidities (chapter 10). Public health considerations seem to play aminor role. In line, aetiological diagnosis is not generally recommended[Riddle et al., 2016]. Furthermore, counselling on preventive measures isonly recommended for individuals at high risk of complications and fortravellers [Riddle et al., 2016]. This recommendation seems questionableas contact with a person with acute diarrhoea was the only preventablerisk factor identified in a French study [Arena et al., 2014].
14.3.3 The public health or epidemiologists’ perspective:identifying sources and outbreaks and preventingspread of disease
From a public health perspective, investigating the aetiology of a diseaseis central. In the case of AG, the aetiology should be assessed if there is ahigh risk of human-to-human transmission and during outbreaks [Riddleet al., 2016]. Knowing the aetiology is key to identify outbreaks, to checkif clustered cases are indeed linked to each other, to link outbreak casesto suspected sources and/or to implement targeted interventions. There-fore, the public health specialist concerned with prevention and controlof outbreaks is rather interested in foodborne disease (the aetiologicalperspective) than in AG (the symptomatic perspective).In terms of diagnostic methods, culture or a combination of cultureand culture-independent methods is preferred over culture-independentmethods alone from a public health point of view [Macfarlane-Smithet al., 2018; Riddle et al., 2016]. Culture-based methods are crucial toobtain isolates which are important for identifying clustered cases andpotential sources through typing. Shea et al. [2017] argued that isolatesare the “most effective tool” for maintaining and improving food safety.In contrast, in the hospital setting, the use of multiplex gastrointestinal(GI) panels could help infection control by quickly identifying patientsfor which isolation (in the sense of quarantine) is indicated. A studyfrom the USA showed that among 158 patients with a negative test for C.difficile and/or rotavirus using conventional methods, about a fifth waspositive for another GI pathogen using the FilmArray R© Gastrointestinal(GI) Panel [Rand et al., 2015]. Among those, 60% were not isolated ap-propriately. On the other hand, isolation could have been suspended for25 patients testing negative with the panel. Also, culture-independentmethods help reducing the use of antibiotics as well as the length of hos-pitalisation, and are, therefore, preferred from an economic point of view
331

14 Discussion
[Beal et al., 2018]. For laboratories, using culture-independent methodssuch as multiplex PCR panels is financially attractive as well as alreadymentioned before – even when followed by reflex testing in case of PCR-positive results [Shea et al., 2017; Van Lint et al., 2016]. In conclusion,from a public health perspective, there are factors favouring culture-dependent methods and factors favouring culture-independent methods.Screening samples with culture-independent methods followed by isol-ation/culture-confirmation in case of positive screening results seems aviable compromise. Nevertheless, the prolonged time delay from takingthe sample to starting bacterial culture must be taken into considerationwhen choosing this approach [Shea et al., 2017]. In the future, next-gen-eration sequencing (NGS) could be an alternative diagnostic approachcombining advantages of PCR (fast results) and culture-based meth-ods (allowing epidemiological investigations, e.g. transmission dynam-ics) [Gardy and Loman, 2018]. Gardy and Loman [2018] even suggestedthat NGS could be used as a basis for a global surveillance system giventhat the technology becomes affordable (both, in terms of money andresources needed) and data is made available worldwide.In Switzerland, laboratories mostly operate in the private sector. Hence,the decision which diagnostic methods to apply is with the laboratoriesthemselves. Nevertheless, federal authorities could issue recommenda-tions and guidelines. Furthermore, on a political level, testing procedurescan be influenced by adapting the official tariff lists for reimbursement ofcosts by the compulsory health insurance. The potential impact of suchchanges on laboratory diagnostics has been described using the exampleof Aeromonas spp. [Tritten et al., 2014].Aetiological assessment and susceptibility testing are highly recommen-ded given the increasing problem of antimicrobial resistance and globalefforts to reduce antibiotic prescription [Review on Antimicrobial Resist-ance, 2016]. Similarly, the Strategy on Antibiotic Resistance Switzerland(StAR) aims at using antibiotics only in case of a proven bacterial infec-tion without alternative treatment options [Der Schweizerische Bundes-rat, 2015a]. The review on antimicrobial resistance highlighted the needfor rapid, low-cost point-of-care diagnostics [Review on AntimicrobialResistance, 2016]. Furthermore, they suggested that “high-income coun-tries should make it mandatory that by 2020 the prescription of antibi-otics will need to be informed by data and testing technology whereverit is available”. Multiplex PCR panels provide faster results than tradi-tional culture techniques. However, they are neither low-cost nor point-of-care diagnostics. Furthermore, they do not allow antimicrobial sus-ceptibility testing. Hence, other diagnostic tools are most likely needed
332

14.3 Ideal case management for AG: different perspectives
to tackle the increasing problem of antimicrobial resistance. StAR alsomentions the need to develop new laboratory tests which are inexpens-ive, provide rapid results and have “a strong practical emphasis” [DerSchweizerische Bundesrat, 2015a]. “Competent learned societies, thereference laboratories and industry” are responsible for the developmentand implementation of these new tools according to the Swiss strategy.Independently, financial responsibility needs to be clarified: can the pa-tient be obliged to pay for diagnostics if diagnostics are performed forthe sake of population health – without immediate benefit for the indi-vidual? Compliance of Swiss GPs in following such recommendations ofuniversal testing must be doubted given their patient-centred view andtheir perceived unimportance of microbiological results for the majorityof individuals.Knowing the aetiology of AG is not only important to identify outbreaks,to adjust control measures (e.g. patient isolation) and to reduce anti-microbial prescription but also to improve population health at largeby implementing targeted interventions for prevention. For example, itis of utmost importance to know if the majority of AG is caused bybacteria (the most common ones being zoonotic agents) or by viruses(mostly with the human as main or sole reservoir). Similarly, the estim-ated proportion of foodborne origin is highly dependent on the pathogen(Table 1.1; [Hald et al., 2016; Havelaar et al., 2015]). For example, hu-mans are the only known reservoir for norovirus. Its transmission occursmainly from person-to-person or via contaminated food or water (thefood and water being contaminated by infected individuals) [Hall andLopman, 2015]. Outbreaks are very common, especially in places wheremany people convene, such as hospitals, nursery homes, schools, cruiseships, restaurants and hotels. Prevention and control, therefore, relies onproper hygiene including hand hygiene, disinfection of the environmentand patient isolation [Hall and Lopman, 2015]. In contrast, campylo-bacteriosis cases are mostly sporadic and frequently linked to contam-inated food (mostly meat, contamination originating from the infectedanimal or spread during the slaughtering process) or infected animals[Mahon and Patrick, 2015]. Direct transmission from infected humansis considered rare. Consequently, prevention starts at controlling con-tamination at animal level, throughout the food chain (“from farm tofork”) and ends at the consumer level with campaigns on kitchen hy-giene. In summary, while some prevention efforts (e.g. general hygieneinterventions) might help mitigating the risk of infection with severalfoodborne or gastrointestinal pathogens for humans, others are patho-gen-specific (e.g. mandatory freezing of poultry-liver for retail to reduce
333

14 Discussion
Campylobacter) and are, therefore, relying on aetiological assessment.
334

15 Conclusions
The burden of illness pyramid for foodborne infections was investigatedusing different research approaches. These have shown that the burdenof AG in Switzerland is considerable. Many cases seen at primary carelevel are mild or moderate and can easily be managed by GPs. How-ever, these cases still cause a considerable burden due to their frequency.In line, healthcare costs of an individual mild case of AG may be low,but the sum is still noteworthy and underestimated. Furthermore, evenmild cases result in work loss which could not be quantified within thescope of this research but must be substantial. Cases seen in the no-tification system do not represent a random selection of patients withAG considering the rather sparing use of stool diagnostics. Hence, theNNSID overrepresents severe or co-morbid cases and those with specificrisk factors for infection or testing, like recent travels. Furthermore,there are many pathogens causing AG which are not notifiable, suchas norovirus and rotavirus. Cases appearing in the notification systemare much lower in numbers than those missed but individual healthcarecosts are higher. Strategies for saving healthcare costs should, there-fore, target mild and severe cases as well as cases caused by notifiableand non-notifiable pathogens. Assessment of non-healthcare costs suchas work loss is recommended to prioritise interventions and to evaluatetheir cost-effectiveness.
The number of human Campylobacter and EHEC infections is increas-ing while the number of Salmonella and hepatitis A infections is stableor even decreasing in Switzerland according to notification data. Thetrends observed for the first three pathogens mentioned are also suppor-ted by positivity studies taking into account the number of tests conduc-ted. Those analyses have shown that the NNSID is a useful system toidentify outbreaks but it is not sufficient for characterising the epidemi-ology of foodborne diseases in Switzerland. It needs to be complementedby research for confirming presence of and investigating suspected dis-ease outbreaks. Furthermore, complementary research should be used forassessing epidemiological determinants such as patients’ and physicians’behaviour, the burden of disease at population level and obtaining othersupplementary information for setting priorities and informing policy.
335

15 Conclusions
Sentinella is a useful sentinel surveillance system to complement find-ings from the NNSID. It allows assessing the epidemiology of diseasesat primary care level including cases without laboratory confirmation.Still, it does not provide the full picture as patients not approaching aphysician will be missed. Additionally, it does not cover patients seekinghelp at emergency departments of hospitals directly.
National guidelines for the management of AG do not exist for Switzer-land. Case management by the physician and processing of the stoolsample by the laboratory are very heterogeneous. National guidelinescould help to harmonise physicians’ and laboratories’ approaches towardsdiagnosis and treatment of AG. It is important to consider the differentperspectives of patients, physicians, laboratory and public health expertswhen developing diagnosis and treatment guidelines. Awareness of phys-icians for the public health aspects of AG should be strengthened whilethe public health specialist should consider the patient-focused view ofphysicians.
Estimation of healthcare costs need to be updated and/or refined oncenew findings are available, either from research studies (such as the up-coming population-based cohort study on AG in Switzerland) or fromsurveillance systems. Furthermore, indirect healthcare costs and non-healthcare costs due to AG should be explored. Additionally, modellingstudies of healthcare and non-healthcare costs should be used to informdevelopment of AG case management guidelines and to evaluate theireconomic impact.
15.1 RecommendationsThe experiences from the different research projects which are part ofthis thesis can be translated into recommendations for policy makers,authorities and researchers:
For policy makers:
• The purpose and set-up of surveillance systems with their strengthsand limitations need to be considered when interpreting surveil-lance data.
• The (disease-specific) burden of disease below the tip of the iceberg(hence, beyond notification data) and its determinants must betaken into account for planning and prioritising interventions.
336

15.1 Recommendations
• Always include components of operations research when mandatingstudies on specific infectious diseases in Switzerland to constantlyimprove the Swiss infectious disease surveillance system.
For health authorities:
• Pilot testing of data collection tools and meticulous documentationof changes therein is good practice for research studies. Pilot test-ing should also be conducted when notification forms are changed.Similarly, all changes potentially affecting surveillance data (e.g.in data entry, case definition, notification forms, analysis) need tobe rigorously documented for accurate interpretation of long-termtrends.
• Strengthen personal contact between federal authorities andhealthcare personnel “on the ground” (physicians, laboratory ex-perts). This will help improving compliance of reporting as wellas understanding of surveillance data. A community of practiceamong actors of the Swiss surveillance system should be estab-lished.
• Restrict information obtained on notification forms to minimumessential and reliable data needed to decide if further action isrequired (e.g. decision for or against contact tracing). Certaininformation, e.g. on risk factors and exposures, can more reliablybe obtained through complementary research. Before changingnotification forms, research studies could be mandated to assessvalidity of specific information.
• Consider conducting surveys among physicians and clinical labor-atories to determine practices in case management on a regularbasis, either additional to or in replacement for collecting laborat-ory statistics (number of tests conducted).
For researchers:
• Triage steps and approaches to case management of AG is likelydifferent in the outpatient and inpatient setting. Additional re-search studies focussing on the hospital setting – from the emer-gency (outpatient) department to intensive care – are needed toassess the full (clinical) picture of foodborne diseases at the healthcare system level in Switzerland.
• Combining authorities’ and scientists’ research needs is beneficialfor both sides: it can help to obtain funding (e.g. mandated re-search), it can ease implementation of studies by providing access
337

15 Conclusions
to existing structures (e.g. Sentinella), and it increases the likeli-hood that findings are taken up by stakeholders. Therefore, seekingclose collaboration with health authorities is recommended.
• Explore best practices or ways to collect information on laboratorystatistics (number of tests conducted) allowing routine analysisof data, or explore alternative approaches for taking into accountchanging laboratory practices when interpreting surveillance data.
• Make use of and combine existing networks and data sets con-sidering all surveillance systems (e.g. NNSID, Sentinella, SwissPediatric Surveillance Unit (SPSU)) and data sources (e.g. pop-ulation, hospital and mortality statistics) to increase validity ofresults and effectiveness of surveillance systems.
338

16 BibliographyThis bibliography contains all references used in the unpublishedchapters of this thesis (except of those submitted or prepared for submis-sion). Reference lists of published articles (including those submitted)are provided at the end of the corresponding chapter/article.
Allos BM, Moore MR, Griffin PM, Tauxe RV [2004] ‘Surveillance for sporadicfoodborne disease in the 21st century: the FoodNet perspective.’ Clin InfectDis, 38(Suppl 3), S115–S120
Altpeter E, Burnand B, Capkun G, Carrel R, Cerutti B, Mäusezahl-FeuzM, Gassner M, Junker C, Künzli N, Lengeler C, Minder C, RickenbachM, Schorr D, Vader JP, Zemp E [2005] ‘Essentials of good epidemiolo-gical practice.’ Soz Praventivmed, 50(1), 12–27. Available at: http://dx.doi.org/10.1007/s00038-004-4008-8
Altpeter E, Zimmermann H, Oberreich J, Péter O, Dvořák C, Swiss SentinelSurveillance Network [2013] ‘Tick related diseases in Switzerland, 2008 to2011.’ Swiss Med Wkly, 143, w13725. Available at: http://dx.doi.org/10.4414/smw.2013.13725
Amiel C, Williams B, Ramzan F, Islam S, Ladbrooke T, Majeed A, GnaniS [2014] ‘Reasons for attending an urban urgent care centre with minorillness: a questionnaire study.’ Emerg Med J, 31(e1), e71–e75. Available at:http://dx.doi.org/10.1136/emermed-2012-202016
Arena C, Amoros JP, Vaillant V, Ambert-Balay K, Chikhi-Brachet R,Jourdan-Da Silva N, Varesi L, Arrighi J, Souty C, Blanchon T, FalchiA, Hanslik T [2014] ‘Acute diarrhea in adults consulting a general prac-titioner in France during winter: incidence, clinical characteristics, man-agement and risk factors.’ BMC Infect Dis, 14, 574. Available at: http://dx.doi.org/10.1186/s12879-014-0574-4
Baumgartner A, Felleisen R, Gut C [2012] ‘Campylobacter in derSchweiz – Risikofaktoren und Massnahmen zum Umgang mit derProblematik.’ Report, BAG, Bern, Switzerland. Available at:https://www.blv.admin.ch/dam/blv/de/dokumente/lebensmittel-und-ernaehrung/lebensmittelsicherheit/krankheitserreger-und-hygiene/campylobacter-schweiz-risikoanalyse-blv.pdf.download.pdf/Campylobacter%20in%20der%20Schweiz%20%E2%80%93%20Risikoanalyse%20des%20BLV.pdf, accessed: 22 Mar 2018
Beal SG, Tremblay EE, Toffel S, Velez L, Rand KH [2018] ‘A gastrointestinal
339

16 Bibliography
PCR panel improves clinical management and lowers health care costs.’ JClin Microbiol, 56(1), e01457–17. Available at: http://dx.doi.org/10.1128/JCM.01457-17
Becton, Dickinson and Company [2016] ‘BD MAXTM Enteric Bacterial Panel.’Available at: http://moleculardiagnostics.bd.com/wp-content/uploads/2017/08/Enteric-Bacterial-Panel-Info-Sheet.pdf, accessed: 16 Jan2018
BioFire Diagnostics [2016] ‘FilmArrayR© Gastrointestinal (GI) Panel. Instruc-tion Booklet.’ Available at: http://www.biomerieux-diagnostics.com/filmarrayr-gi-panel, accessed: 16 Jan 2018
Bless PJ [2018] Epidemiology of campylobacteriosis and acute gastroenteritisfrom a human and health system’s perspective in Switzerland. PhD thesis,Swiss Tropical and Public Health Institute and University of Basel, Basel,Switzerland
Bless PJ, Muela Ribera J, Schmutz C, Zeller A, Mäusezahl D [2016] ‘Acutegastroenteritis and campylobacteriosis in Swiss primary care: the viewpointof general practitioners.’ PLoS One, 11(9), e0161650. Available at: http://dx.doi.org/10.1371/journal.pone.0161650
Bless PJ, Schmutz C, Sartori K, Mäusezahl D [2017] ‘Time trends of positivityrates from foodborne pathogen testing in Switzerland, 2003 to 2012.’ SwissMed Wkly, 147, w14569. Available at: http://dx.doi.org/10.4414/smw.2017.14569
Bless PJ, Schmutz C, Suter K, Jost M, Hattendorf J, Mäusezahl-Feuz M,Mäusezahl D [2014] ‘A tradition and an epidemic: determinants of thecampylobacteriosis winter peak in Switzerland.’ Eur J Epidemiol, 29(7),527–537. Available at: http://dx.doi.org/10.1007/s10654-014-9917-0
Buchanan J, Wordsworth S, O’Connor L, Pike G, Walker A, Wilcox M, CrookD [2015] ‘Management of patients with suspected infectious diarrhoea inhospitals in England.’ J Hosp Infect, 90(3), 199–207. Available at: http://dx.doi.org/10.1016/j.jhin.2014.12.021
Bundesamt für Statistik [2017a] ‘Die Bevölkerung der Schweiz 2016.’Statistics of Switzerland, BfS, Neuchâtel, Switzerland. Availableat: https://www.bfs.admin.ch/bfs/de/home/statistiken/bevoelkerung.assetdetail.3902098.html, accessed: 02 Feb 2018
Bundesamt für Statistik [2017b] ‘Gesundheit.’ Taschenstatistik 2017, BfS,Neuchâtel, Switzerland. Available at: https://www.bfs.admin.ch/bfs/de/home/statistiken/gesundheit/erhebungen/sgb.assetdetail.4342091.html, accessed: 17 Aug 2018
Bundesamt für Gesundheit [1993] ‘100 Jahre für alle (1893–1993). Sonderbeil-age "100 Jahre BAG" zum Bulletin Nr. 33.’ Special supplement, BAG, Bern,Switzerland
340
http://moleculardiagnostics.bd.com/wp-content/uploads/2017/08/Enteric-Bacterial-Panel-Info-Sheet.pdf

16 Bibliography
Bundesamt für Gesundheit [2016] ‘Neues Epidemiengesetz und Verordnungenin Kraft.’ BAG Bulletin, 3, 57–60
Bundesamt für Gesundheit [2017a] ‘Einführung der Meldepflicht für HepatitisE.’ BAG Bulletin, 51, 13–14
Bundesamt für Gesundheit [2017b] ‘Häufung von Hepatitis-A-Fällen in derSchweiz, Stand 29. Mai 2017.’ BAG Bulletin, 27, 9–10
Bundesamt für Gesundheit [2018] ‘Meldepflichtige übertragbare Krankheitenund Erreger.’ Poster. https://www.bag.admin.ch/bag/de/home/themen/mensch-gesundheit/uebertragbare-krankheiten/meldesysteme-infektionskrankheiten/meldepflichtige-ik.html. Accessed: 10 May2018
Bundesamt für Gesundheit [2018a] ‘Meldepflichtige übertragbare Krankheitenund Erreger. Leitfaden zur Meldepflicht.’ Manual, BAG, Bern, Switzerland.Available at: https://www.bag.admin.ch/bag/de/home/themen/mensch-gesundheit/uebertragbare-krankheiten/meldesysteme-infektionskrankheiten/meldepflichtige-ik.html, accessed: 10 May 2018
Bundesamt für Gesundheit [2018b] ‘Sentinella-Meldesystem.’ Avail-able at: https://www.bag.admin.ch/bag/de/home/themen/mensch-gesundheit/uebertragbare-krankheiten/meldesysteme-infektionskrankheiten/sentinella-meldesystem.html, accessed: 24 Jan 2018
Bundesamt für Gesundheit [2018c] ‘Zahlen zu Infektionskrankheiten.’ Avail-able at: https://www.bag.admin.ch/bag/de/home/service/zahlen-fakten/zahlen-zu-infektionskrankheiten.html, data as per 13 Mar 2018, ac-cessed: 21 Mar 2018
Bundesamt für Gesundheit, Nationales Referenzzentrum für enteropathogeneBakterien und Listerien [2015] ‘Auffälliger Anstieg der Meldezahlen entero-hämorrhagischer E.coli-Infektionen über die letzten Monate in der Schweiz:Einfluss neuer Multiplex PCR-Methoden in der Primär-Diagnostik?’ BAGBulletin, 52, 988–990
Bundesamt für Gesundheit, Schweizerische Expertengruppe für viraleHepatitis, Schweizerische Arbeitsgruppe für reisemedizinische Be-ratung, Eidgenössische Kommission für Impffragen [2007] ‘Em-pfehlungen zur Hepatitis-A-Prävention in der Schweiz.’ Guide-lines and recommendations, BAG, Bern, Switzerland. Availableat: https://www.bag.admin.ch/dam/bag/de/dokumente/mt/i-und-b/richtlinien-empfehlungen/empfehlungen-spezifische-erreger-krankheiten/hepatitis/empfehlungen-hepatitis-a-praevention-ch.pdf.download.pdf/empfehlungen-hepatitis-a-praevention-d.pdf,accessed: 28 Mar 2018
Bundesamt für Lebensmittelsicherheit und Veterinärwesen [2016] ‘Bericht zurÜberwachung von Tierseuchen und Zoonosen – Daten 2015.’ Annual report,
341

16 Bibliography
BLV, Bern, Switzerland. Available at: https://www.blv.admin.ch/dam/blv/de/dokumente/tiere/publikationen-und-forschung/statistik-und-berichte/bericht-ueberwachung-tg-2015.pdf.download.pdf/Bericht_%C3%9Cberwachung_Tiergesundheit_Daten_2015_final_DE.pdf,accessed: 19 Aug 2018
Bundesamt für Lebensmittelsicherheit und Veterinärwesen, Bundesamt für Ge-sundheit [2017] ‘Bericht zur Überwachung von Zoonosen und lebensmittel-bedingten Krankheitsausbrüchen. Daten 2016.’ Annual report, BLV andBAG. Available at: https://www.blv.admin.ch/blv/de/home/tiere/tiergesundheit/ueberwachung/ueberwachung-von-zoonosen.html, accessed:23 Jan 2018
Bundesamt für Statistik [n.d.] ‘Webseite Statistik Schweiz: Medizinis-che Statistik der Krankenhäuser. Anzahl Fälle und durchschnittlicheAufenthaltsdauer (DAD) nach Altersklasse und Diagnosekode.’ Availableat: https://www.bfs.admin.ch/bfs/de/home/statistiken/kataloge-datenbanken/tabellen.html?dyn_inquiry=95&dyn_publishingyearend=2018&dyn_title=diagnosekode, accessed: 23 Jan 2018
Bundesblatt [1882] ‘Bundesgesez betreffend Massnahmen gegen gemeingefähr-liche Epidemien. (Vom 31. Jänner 1882.).’ Available at: https://www.amtsdruckschriften.bar.admin.ch/viewOrigDoc.do?id=10011380, accessed:05 Jan 2018
Bundesblatt [1886a] ‘Botschaft des Bundesrathes an die Bundesversammlungzum Gesetzesentwurf betreffend Massnahmen gegen gemeingefährlicheEpidemien. (Vom 1. Juni 1886.).’ Available at: https://www.amtsdruckschriften.bar.admin.ch/viewOrigDoc.do?id=10013129, accessed: 05 Jan2018
Bundesblatt [1886b] ‘Bundesgesetz betreffend Massnahmen gegen gemeinge-fährliche Epidemien. (Vom 2. Juli 1886.).’ Available at: https://www.amtsdruckschriften.bar.admin.ch/viewOrigDoc.do?id=10013186, accessed:05 Jan 2018
Bundesblatt [1887] ‘Kreisschreiben des Bundesrathes an sämmtliche eidgenöss-ische Stände, über die Durchführung des Bundesgesetzes betreffend Mass-nahmen gegen gemeingefährliche Epidemien, vom 2. Juli 1886. (Vom 4.November 1887.).’ Available at: https://www.amtsdruckschriften.bar.admin.ch/viewOrigDoc.do?id=10013721, accessed: 05 Jan 2018
Bundesblatt [1893a] ‘Botschaft des Bundesrates an die Bundesversammlung,betreffend Organisation einer besondern Abteilung für Gesundheitswesen(schweizerisches Gesundheitsamt) beim eidgenössischen Departement desInnern. (Vom 19. Mai 1893.).’ Available at: https://www.amtsdruckschriften.bar.admin.ch/viewOrigDoc.do?id=10016162, accessed: 11 Jan 2018
Bundesblatt [1893b] ‘Bundesbeschluss betreffend Organisation einer besondernAbteilung für Gesundheitswesen (schweizerisches Gesundheitsamt) beim
342

16 Bibliography
eidgenössischen Departement des Innern. (Vom 28. Juni 1893.).’ Avail-able at: https://www.amtsdruckschriften.bar.admin.ch/viewOrigDoc.do?id=10016229, accessed: 11 Jan 2018
Bundesblatt [1894] ‘Kreisschreiben des Bundesrates an sämtliche eidgenöss-ische Stände, betreffend die Anzeige gemeingefährlicher epidemischerKrankheiten. (Vom 19. Januar 1894.).’ Available at: https://www.amtsdruckschriften.bar.admin.ch/viewOrigDoc.do?id=10016478, accessed: 05Jan 2018
Bundesblatt [1911] ‘Botschaft des Bundesrates an die Bundesversammlung be-treffend Revision des Art. 69 der Bundesverfassung im Sinne vermehrterBefugnis des Bundes bei der Bekämpfung menschlicher und tierischerKrankheiten. (Vom 20. Dezember 1911.).’ Available at: https://www.amtsdruckschriften.bar.admin.ch/viewOrigDoc.do?id=10024452, accessed:05 Jan 2018
Bundesblatt [1913] ‘Bundesbeschluss betreffend Revision der Art. 69 und31, 2. Absatz, lit. d, der Bundesverfassung (Bekämpfung menschlicherund tierischer Krankheiten). (Vom 18. Dezember 1912.).’ Availableat: https://www.amtsdruckschriften.bar.admin.ch/viewOrigDoc.do?id=10024879, accessed: 05 Jan 2018
Bundesblatt [1920] ‘Botschaft zum Entwurf eines Gesetzes über Abänder-ung des Bundesgesetzes betreffend Massnahmen gegen gemeingefährlicheEpidemien. (Vom 3. Dezember 1920.).’ Available at: https://www.amtsdruckschriften.bar.admin.ch/viewOrigDoc.do?id=10027759, accessed: 05Jan 2018
Bundesblatt [1921] ‘Bundesgesetz betreffend Abänderung des Bundesgeset-zes vom 2. Juli 1886 betreffend Massnahmen gegen gemeingefährlicheEpidemien. (Vom 18. Februar 1921.).’ Available at: https://www.amtsdruckschriften.bar.admin.ch/viewOrigDoc.do?id=10027849, accessed: 05Jan 2018
Bundesblatt [1970a] ‘Botschaft des Bundesrates an die Bundesversammlungzum Entwurf eines Bundesgesetzes über die Bekämpfung übertragbarerKrankheiten des Menschen (Epidemiengesetz) (Vom 11. Februar 1970).’Available at: https://www.amtsdruckschriften.bar.admin.ch/viewOrigDoc.do?id=10044625, accessed: 05 Jan 2018
Bundesblatt [1970b] ‘Bundesgesetz über die Bekämpfung übertragbarerKrankheiten des Menschen (Epidemiengesetz) (Vom 18. Dezember 1970).’Available at: https://www.amtsdruckschriften.bar.admin.ch/viewOrigDoc.do?id=10044907, accessed: 05 Jan 2018
Burgess CM, Gianotti A, Gruzdev N, Holah J, Knøchel S, Lehner A, MargasE, Schmitz Esser S, Sela (Saldinger) S, Tresse O [2016] ‘The response offoodborne pathogens to osmotic and desiccation stresses in the food chain.’Int J Food Microbiol, 221, 37–53. Available at: http://dx.doi.org/10.10
343

16 Bibliography
16/j.ijfoodmicro.2015.12.014
Chen Y, Ford L, Hall G, Dobbins T, Kirk M [2016] ‘Healthcare utilization andlost productivity due to infectious gastroenteritis, results from a nationalcross-sectional survey Australia 2008–2009.’ Epidemiol Infect, 144(2), 241–246. Available at: http://dx.doi.org/10.1017/S0950268815001375
Das Eidgenössische Departement des Innern [1999] ‘Verordnung des EDI vom13. Januar 1999 über Arzt- und Labormeldungen (SR 818.141.11). Standam 01. Januar 2014.’ [DHA Ordinance of 13 January 1999 on physician andlaboratory notifications. Status as of 1 January 2014; in German, French andItalian]; available at: https://www.admin.ch/opc/de/classified-compilation/19983530/201401010000/818.141.11.pdf, accessed: 17 May 2018
Das Eidgenössische Departement des Innern [2015a] ‘Verordnung des EDI vom01. Dezember 2015 über die Meldung von Beobachtungen übertragbarerKrankheiten des Menschen (SR 818.101.126). Stand am 1. Januar 2018.’[DHA Ordinance of 1 December 2015 on the reporting of observations onhuman communicable diseases. Status as of 1 January 2018; in German,French and Italian]; available at: https://www.admin.ch/opc/de/classified-compilation/20151622/201801010000/818.101.126.pdf, accessed: 25Jan 2018
Das Eidgenössische Departement des Innern [2015b] ‘Verordnung des EDI vom01. Dezember 2015 über die Meldung von Beobachtungen übertragbarerKrankheiten des Menschen (SR 818.101.126). Stand am 5. März 2016.’ [DHAOrdinance of 1 December 2015 on the reporting of observations on humancommunicable diseases. Status as of 5 March 2016; in German, French andItalian]; available at: https://www.admin.ch/opc/de/classified-compilation/20151622/201603050000/818.101.126.pdf, accessed: 17 May 2018
Delaporte E, Richard JL, Wyler Lazarevic CA, Lacour O, Girard M, GinetC, Iten A, Sudre P [2011] ‘Ongoing measles outbreak, Geneva, Switzerland,January to March 2011.’ Euro Surveill, 16(10), pii=19815. Available at:http://dx.doi.org/10.2807/ese.16.10.19815-en
Der Schweizerische Bundesrat [2015a] ‘Strategie Antibiotikaresistenzen Sch-weiz.’ Available at: https://www.bundespublikationen.admin.ch/cshop_mimes_bbl/2C/2C59E545D7371EE5A7B0EF1D8BC8BB01.pdf, accessed: 15Aug 2018
Der Schweizerische Bundesrat [2015b] ‘Verordnung vom 25. April 2015 über dieBekämpfung übertragbarer Krankheiten des Menschen (Epidemienverord-nung, EpV; SR 818.101.1). Stand am 1. Januar 2016.’ [Ordinance of 25 April2015 on the control of human communicable diseases. Status as of 1 Janu-ary 2016; in German, French and Italian]; available at: https://www.admin.ch/opc/de/classified-compilation/20133212/index.html, accessed: 10Jan 2018
Die Bundesversammlung der Schweizerischen Eidgenossenschaft [2011]
344

16 Bibliography
‘Bundesgesetz über die Forschung am Menschen (Humanforschungsge-setz, HFG; SR 810.30) vom 30. September 2011. Stand am 01. Januar2014.’ [Federal Act on Research involving Human Beings (Human Re-search Act, HRA) of 30 September 2011. Status as of 1 January 2014];available at: https://www.admin.ch/opc/de/classified-compilation/20061313/index.html, accessed: 04 Apr 2018
Die Bundesversammlung der Schweizerischen Eidgenossenschaft [2012a]‘Bundesgesetz vom 28. September 2012 über die Bekämpfung übertrag-barer Krankheiten des Menschen (Epidemiengesetz, EpG; SR 818.101).Stand am 01. Januar 2016.’ [Federal Act of 28 September 2012 onCombating Communicable Human Diseases (Epidemics Act, EpidA).Status as of 1 January 2016; in German, French and Italian]; avail-able at: https://www.admin.ch/opc/de/classified-compilation/20071012/201601010000/818.101.pdf, accessed: 24 Apr 2018
Die Bundesversammlung der Schweizerischen Eidgenossenschaft [2012b]‘Bundesgesetz vom 28. September 2012 über die Bekämpfung übertrag-barer Krankheiten des Menschen (Epidemiengesetz, EpG; SR 818.101).Stand am 01. Januar 2017.’ [Federal Act of 28 September 2012 on Com-bating Communicable Human Diseases (Epidemics Act, EpidA). Status asof 1 January 2017; in German, French and Italian]; available at: https://www.admin.ch/ch/d/sr/818.101, accessed: 24 Apr 2018
Doorduyn Y, van Pelt W, Havelaar AH [2012] ‘The burden of infectiousintestinal disease (IID) in the community: a survey of self-reported IIDin The Netherlands.’ Epidemiol Infect, 140(7), 1185–1192. Available at:http://dx.doi.org/10.1017/S0950268811001099
Dundas S, Todd WT [2000] ‘Clinical presentation, complications and treat-ment of infection with verocytotoxin-producing Escherichia coli. Challengesfor the clinician.’ Symp Ser Soc Appl Microbiol, 88, 24S–30S. Available at:http://dx.doi.org/10.1111/j.1365-2672.2000.tb05329.x
DuPont HL [2014] ‘Acute infectious diarrhea in immunocompetent adults.’ NEngl J Med, 370(16), 1532–1540. Available at: http://dx.doi.org/10.1056/NEJMra1301069
Dupuy C, Bronner A, Watson E, Wuyckhuise-Sjouke L, Reist M, Fouillet A,Calavas D, Hendrikx P, Perrin JB [2013] ‘Inventory of veterinary syndromicsurveillance initiatives in Europe (Triple-S project): current situation andperspectives.’ Prev Vet Med, 111(3–4), 220–229. Available at: http://dx.doi.org/10.1016/j.prevetmed.2013.06.005
European Centre for Disease Prevention and Control [2014] ‘Data qualitymonitoring and surveillance system evaluation – a handbook of methodsand applications.’ ECDC technical document, ECDC, Stockholm, Sweden.Available at: http://dx.doi.org/10.2900/35329, accessed:
European Centre for Disease Prevention and Control [2017] ‘Hepatitis A
345

16 Bibliography
outbreaks in the EU/EEA mostly affecting men who have sex with men– third update, 28 June 2017.’ Rapid risk assessment, ECDC, Stockholm,Sweden. Available at: https://ecdc.europa.eu/sites/portal/files/documents/RRA%20hep%20A%20outbreak%20EU%20EEA%20in%20MSM%20third%20update%2028%20June%202017_0.pdf, accessed: 28 Mar 2018
European Commission [2018] ‘Commission implementing decision of 22 june2018 on the communicable diseases and related special health issues tobe covered by epidemiological surveillance as well as relevant case defin-itions.’ Non-legislative act, European Commission, Brussels. Avail-able at: https://eur-lex.europa.eu/legal-content/EN/TXT/PDF/?uri=CELEX:32018D0945&from=EN, accessed: 25 Aug 2018
European Food Safety Authority, European Centre for Disease Prevention andControl [2017] ‘The European Union summary report on trends and sourcesof zoonoses, zoonotic agents and food-borne outbreaks in 2016.’ Scientificreport 12, EFSA and ECDC. Available at: http://dx.doi.org/10.2903/j.efsa.2017.5077
Federal Office of Public Health [2010] ‘National programme on HIV and otherSTI (NPHS) 2011–2017.’ National programme, FOPH, Bern, Switzerland.Available at: https://www.bag.admin.ch/bag/en/home/themen/strategien-politik/nationale-gesundheitsstrategien/nationales-programm-hiv-und-andere-sexuell-uebertragbare-infektionen/strategie.html,accessed: 17 May 2018
Federal Veterinary Office [2008] ‘Medienmitteilung: Campylobacter-Plattform für koordinierte Bekämpfung gegründet.’ Available at:https://www.admin.ch/gov/de/start/dokumentation/medienmitteilungen.msg-id-24514.html, accessed: 19 Aug 2018
Fischer F, Schmutz C, Saucy A, Gysin N, Mäusezahl D [2017] ‘Le-gionnaires’ disease: Uncovering the increase of reported legion-ellosis cases in Switzerland.’ Poster presentation at the SwissPublic Health Conference, 22–23 Nov 2017, Basel, Switzerland.https://organizers-congress.org/frontend/index.php?page_id=4146&additions_conferenceschedule_action=detail&additions_conferenceschedule_controller=paperList&pid=4448&hash=7207784abd781794629843bfcc14f5b751647bb51bc91231f879782e021fb84b. Accessed: 18May 2018
Fonseca BB, Beletti ME, de Melo R, Mendonça E, Coelho LR, NalevaikoPC, Rossi DA [2014] ‘Campylobacter jejuni in commercial eggs.’ Braz JMicrobiol, 45(1), 76–79
Frese T, Klauss S, Herrmann K, Sandholzer H [2011] ‘Nausea and vomitingas the reasons for encounter.’ J Clin Med Res, 3(1), 23–29. Available at:http://dx.doi.org/10.4021/jocmr410w
Gardy JL, Loman NJ [2018] ‘Towards a genomics-informed, real-time, global
346

16 Bibliography
pathogen surveillance system.’ Nat Rev Genet, 19(1), 9–20. Available at:http://dx.doi.org/10.1038/nrg.2017.88
GBD 2016 DALYs and HALE Collaborators [2017] ‘Global, regional, andnational disability-adjusted life-years (DALYs) for 333 diseases and in-juries and healthy life expectancy (HALE) for 195 countries and territ-ories, 1990–2016: a systematic analysis for the Global Burden of Dis-ease Study 2016.’ Lancet, 390(10100), 1260–1344. Available at: http://dx.doi.org/10.1016/S0140-6736(17)32130-X
GBD Diarrhoeal Diseases Collaborators [2017] ‘Estimates of global, regional,and national morbidity, mortality, and aetiologies of diarrhoeal diseases: asystematic analysis for the Global Burden of Disease Study 2015.’ LancetInfect Dis, 17(9), 909–948. Available at: http://dx.doi.org/10.1016/S1473-3099(17)30276-1
German RR, Lee LM, Horan JM, Milstein RL, Pertowski CA, Waller MN,Guidelines Working Group Centers for Disease Control and Prevention[2001] ‘Updated guidelines for evaluating public health surveillance systems:recommendations from the Guidelines Working Group.’ MMWR RecommRep, 50(RR-13), 1–35
Germinario C, Caprioli A, Giordano M, Chironna M, Gallone MS, Tafuri S,Minelli F, Maugliani A, Michelacci V, Santangelo L, Mongelli O, MontagnaC, Scavia G, on behalf of all participants of the Outbreak investigationteam [2016] ‘Community-wide outbreak of haemolytic uraemic syndromeassociated with Shiga toxin 2-producing Escherichia coli O26:H11 in south-ern Italy, summer 2013.’ Euro Surveill, 21(38), pii=30343. Available at:http://dx.doi.org/10.2807/1560-7917.ES.2016.21.38.30343
Gibbons CL, Mangen MJJ, Plass D, Havelaar AH, Brooke RJ, Kramarz P,Peterson KL, Stuurman AL, Cassini A, Fèvre EM, Kretzschmar MEE, onbehalf of the Burden of Communicable diseases in Europe (BCoDE) con-sortium [2014] ‘Measuring underreporting and under-ascertainment in in-fectious disease datasets: a comparison of methods.’ BMC Public Health,14(1). Available at: http://dx.doi.org/10.1186/1471-2458-14-147
Gibney KB, Cheng AC, Hall R, Leder K [2017] ‘Australia’s National Noti-fiable Diseases Surveillance System 1991–2011: expanding, adapting andimproving.’ Epidemiol Infect, 145(5), 1006–1017. Available at: http://dx.doi.org/10.1017/S0950268816002752
Gibney KB, O’Toole J, Sinclair M, Leder K [2014] ‘Disease burden of selectedgastrointestinal pathogens in Australia, 2010.’ Int J Infect Dis, 28, 176–185.Available at: http://dx.doi.org/10.1016/j.ijid.2014.08.006
Gould LH, Bopp C, Strockbine N, Atkinson R, Baselski V, Body B, Carey R,Crandall C, Hurd S, Kaplan R, Neill M, Shea S, Somsel P, Tobin-D’AngeloM, Griffin PM, Gerner-Smidt P [2009] ‘Recommendations for diagnosis ofShiga toxin-producing Escherichia coli infections by clinical laboratories.’
347

16 Bibliography
MMWR Recomm Rep, 58(RR12), 1–14. Available at: https://www.cdc.gov/mmwr/preview/mmwrhtml/rr5812a1.htm, accessed: 26 Jan 2018
Grills NJ, Rowe SL, Gregory JE, Lester RA, Fielding JE [2010] ‘Evaluationof Campylobacter infection surveillance in Victoria.’ Commun Dis Intell QRep, 34(2), 110–115
Gu W, Dutta V, Patrick M, Bruce BB, Geissler A, Huang J, Fitzgerald C,Henao O [2018] ‘Statistical adjustment of culture-independent diagnostictests for trend analysis in the Foodborne Diseases Active SurveillanceNetwork (FoodNet), USA.’ Int J Epidemiol, p. dyy041. Available at:http://dx.doi.org/10.1093/ije/dyy041
Guerrant RL, Van Gilder T, Steiner TS, Thielman NM, Slutsker L, Tauxe RV,Hennessy T, Griffin PM, DuPont H, Sack RB, Tarr P, Neill M, NachamkinI, Reller LB, Osterholm MT, Bennish ML, Pickering LK [2001] ‘Practiceguidelines for the management of infectious diarrhea.’ Clin Infect Dis, 32(3),331–351. Available at: http://dx.doi.org/10.1086/318514
Gysin N [2018] Legionnaires’ disease in Switzerland: Analysis of Swiss sur-veillance data, 2000 to 2016, with emphasis on spatial and seasonal de-terminants. MPH thesis, Interuniversitärer Weiterbildungsstudiengang derUniversitäten Basel, Bern und Zürich, Zurich, Switzerland
Haagsma JA, Geenen PL, Ethelberg S, Fetsch A, Hansdotter F, Jansen A,Korsgaard H, O’Brien SJ, Scavia G, Spitznagel H, Stefanoff P, Tam CC,Havelaar AH, on behalf of a Med-Vet-Net Working Group [2013] ‘Com-munity incidence of pathogen-specific gastroenteritis: reconstructing thesurveillance pyramid for seven pathogens in seven European Union mem-ber states.’ Epidemiol Infect, 141(08), 1625–1639. Available at: http://dx.doi.org/10.1017/S0950268812002166
Hald T, Aspinall W, Devleesschauwer B, Cooke R, Corrigan T, Havelaar AH,Gibb HJ, Torgerson PR, Kirk MD, Angulo FJ, Lake RJ, Speybroeck N, Hoff-mann S [2016] ‘World Health Organization estimates of the relative contri-butions of food to the burden of disease due to selected foodborne hazards:A structured expert elicitation.’ PLoS One, 11(1), e0145839. Available at:http://dx.doi.org/10.1371/journal.pone.0145839
Hall A, Lopman B [2015] Norovirus infection. In: Heymann DL (editor) Con-trol of communicable diseases manual. 20th edition. Washington, DC, USA:American Public Health Association. ISBN 978-0-87553-018-5
Havelaar AH, Ivarsson S, Löfdahl M, Nauta MJ [2013] ‘Estimating the trueincidence of campylobacteriosis and salmonellosis in the European Union,2009.’ Epidemiol Infect, 141(2), 293–302. Available at: http://dx.doi.org/10.1017/S0950268812000568
Havelaar AH, Kirk MD, Torgerson PR, Gibb HJ, Hald T, Lake RJ, Praet N,Bellinger DC, de Silva NR, Gargouri N, Speybroeck N, Cawthorne A, Math-
348

16 Bibliography
ers C, Stein C, Angulo FJ, Devleesschauwer B, on behalf of World Health Or-ganization Foodborne Disease Burden Epidemiology Reference Group [2015]‘World Health Organization global estimates and regional comparisons ofthe burden of foodborne disease in 2010.’ PLoS Med, 12(12), e1001923.Available at: http://dx.doi.org/10.1371/journal.pmed.1001923
Henao OL, Jones TF, Vugia D, Griffin PM [2015] ‘Foodborne Diseases ActiveSurveillance Network – 2 decades of achievements, 1996–2015.’ Emerg InfectDis, 21(9), 1529–1536. Available at: http://dx.doi.org/10.3201/eid2109.150581
Hennessy TW, Marcus R, Deneen V, Reddy S, Vugia D, Townes J, BardsleyM, Swerdlow D, Angulo FJ, Emerging Infections Program FoodNet WorkingGroup [2004] ‘Survey of physician diagnostic practices for patients withacute diarrhea: clinical and public health implications.’ Clin Infect Dis,38(Suppl 3), S203–S211. Available at: http://dx.doi.org/10.1086/381588
Horrocks S, Anderson R, Nisbet D, Ricke S [2009] ‘Incidence and ecology ofCampylobacter jejuni and coli in animals.’ Anaerobe, 15(1), 18–25. Availableat: http://dx.doi.org/10.1016/j.anaerobe.2008.09.001
Hurd S, Patrick M, Hatch J, Clogher P, Wymore K, Cronquist AB, Segler S,Robinson T, Hanna S, Smith G, Fitzgerald C [2012] ‘Clinical laboratorypractices for the isolation and identification of Campylobacter in FoodborneDiseases Active Surveillance Network (FoodNet) sites: baseline informationfor understanding changes in surveillance data.’ Clin Infect Dis, 54(Suppl5), S440–S445. Available at: http://dx.doi.org/10.1093/cid/cis245
Iwamoto M, Huang JY, Cronquist AB, Medus C, Hurd S, Zansky S, Dunn J,Woron AM, Oosmanally N, Griffin PM, Besser J, Henao OL [2015] ‘Bac-terial enteric infections detected by culture-independent diagnostic tests –FoodNet, United States, 2012–2014.’ MMWR Morb Mortal Wkly Rep, 64(9),252–257
Jacquinet S, Denis O, Valente Soares F, Schirvel C [2015] ‘Legionnaires’ dis-ease: overview of the situation concerning notification in Wallonia (Bel-gium) in 2012, a retrospective descriptive study based on a capture-recapture method.’ Archives of Public Health, 73(1), 2. Available at:http://dx.doi.org/10.1186/2049-3258-73-2
Janiec J, Evans MR, Thomas DR, Davies GH, Lewis H [2012] ‘Laboratory-based surveillance of Campylobacter and Salmonella infection and the im-portance of denominator data.’ Epidemiol Infect, 140(11), 2045–2052. Avail-able at: http://dx.doi.org/10.1017/S0950268811002822
Jonas R, Kittl S, Overesch G, Kuhnert P [2015] ‘Genotypes and antibi-otic resistance of bovine Campylobacter and their contribution to humancampylobacteriosis.’ Epidemiol Infect, 143(11), 2373–2380. Available at:http://dx.doi.org/10.1017/S0950268814003410
349

16 Bibliography
Kaakoush NO, Castaño Rodríguez N, Mitchell HM, Man SM [2015] ‘Globalepidemiology of Campylobacter infection.’ Clin Microbiol Rev, 28(3), 687–720. Available at: http://dx.doi.org/10.1128/CMR.00006-15
Kahan NR, Waitman DA, Vardy DA [2009] ‘Curtailing laboratory test order-ing in a managed care setting through redesign of a computerized orderform.’ Am J Manag Care, 15(3), 173–176
Karch H, Tarr PI, Bielaszewska M [2005] ‘Enterohaemorrhagic Escherichiacoli in human medicine.’ Int J Med Microbiol, 295(6), 405–418. Availableat: http://dx.doi.org/10.1016/j.ijmm.2005.06.009
Karras DJ, Ong S, Moran GJ, Nakase J, Kuehnert MJ, Jarvis WR, TalanDA [2003] ‘Antibiotic use for emergency department patients with acutediarrhea.’ Ann Emerg Med, 42(6), 835–842. Available at: http://dx.doi.org/10.1016/s0196-0644(03)00602-4
Keithlin J, Sargeant J, Thomas MK, Fazil A [2014] ‘Systematic review andmeta-analysis of the proportion of Campylobacter cases that develop chronicsequelae.’ BMC Public Health, 14, 1203. Available at: http://dx.doi.org/10.1186/1471-2458-14-1203
Keithlin J, Sargeant JM, Thomas MK, Fazil A [2015] ‘Systematic review andmeta-analysis of the proportion of non-typhoidal Salmonella cases that de-velop chronic sequelae.’ Epidemiol Infect, 143(7), 1333–1351. Available at:http://dx.doi.org/10.1017/S0950268814002829
Kiefer S, Kling K, Stephan R, Bratschi MW, Jost M, Bless PJ, Schmutz C,Mäusezahl D, Wyss K, Mäusezahl-Feuz M, Hatz C [2016] ‘How can patientsand their physicians contribute to an outbreak investigation? Experiencesfrom a nationwide listeriosis outbreak in Switzerland.’ Swiss Med Wkly, 146,w14366. Available at: http://dx.doi.org/10.4414/smw.2016.14366
Kirk MD, Pires SM, Black RE, Caipo M, Crump JA, Devleesschauwer B, Döp-fer D, Fazil A, Fischer-Walker CL, Hald T, Hall AJ, Keddy KH, Lake RJ,Lanata CF, Torgerson PR, Havelaar AH, Angulo FJ [2015] ‘World HealthOrganization estimates of the global and regional disease burden of 22 food-borne bacterial, protozoal, and viral diseases, 2010: A data synthesis.’ PLoSMed, 12(12), e1001921. Available at: http://dx.doi.org/10.1371/journal.pmed.1001921
Kittl S, Kuhnert P, Hächler H, Korczak BM [2011] ‘Comparison of genotypesand antibiotic resistance of Campylobacter jejuni isolated from humans andslaughtered chickens in Switzerland.’ J Appl Microbiol, 110(2), 513–520.Available at: http://dx.doi.org/10.1111/j.1365-2672.2010.04906.x
Klevens RM, Liu S, Roberts H, Jiles RB, Holmberg SD [2014] ‘Estimatingacute viral hepatitis infections from nationally reported cases.’ Am J PublicHealth, 104(3), 482–487. Available at: http://dx.doi.org/10.2105/AJPH.2013.301601
350
16 Bibliography
Kløvstad H, Aavitsland P [2015] ‘Denominators count: supplementing surveil-lance data for genital Chlamydia trachomatis infection with testing data,Norway, 2007 to 2013.’ Euro Surveill, 20(36), pii=30012. Available at:http://dx.doi.org/10.2807/1560-7917.ES.2015.20.36.30012
Knoblauch AM, Bratschi MW, Zuske MK, Althaus D, Stephan R, HächlerH, Baumgartner A, Prager R, Rabsch W, Altpeter E, Jost M, MäusezahlM, Hatz C, Kiefer S [2015] ‘Cross-border outbreak of Salmonella entericassp. enterica serovar Bovismorbificans: multiple approaches for an outbreakinvestigation in Germany and Switzerland.’ Swiss Med Wkly, 145, w14182.Available at: http://dx.doi.org/10.4414/smw.2015.14182
Krockow EM, Colman AM, Chattoe-Brown E, Jenkins DR, Perera N, Me-htar S, Tarrant C [2018] ‘Balancing the risks to individual and soci-ety: A systematic review and synthesis of qualitative research on anti-biotic prescribing behaviour in hospitals.’ J Hosp Infect. Available at:http://dx.doi.org/10.1016/j.jhin.2018.08.007
Lake RJ, Adlam SB, Perera S, Campbell DM, Baker MG [2010] ‘The diseasepyramid for acute gastrointestinal illness in New Zealand.’ Epidemiol Infect,138(10), 1468–1471. Available at: http://dx.doi.org/10.1017/S0950268810000397
Lambert SB, Faux CE, Grant KA, Williams SH, Bletchly C, Catton MG,Smith DW, Kelly HA [2010] ‘Influenza surveillance in Australia: we needto do more than count.’ Med J Aust, 193(1), 43–45
Lecky DM, Hawking MK, McNulty CA, ESBL steering group [2014] ‘Patients’perspectives on providing a stool sample to their GP: a qualitative study.’Br J Gen Pract, 64(628), e684–e693. Available at: http://dx.doi.org/10.3399/bjgp14X682261
Litzroth A, Patrick C, De Vil B, Quoilin S [2015] ‘Overview and evaluation of15 years of Creutzfeldt-Jakob disease surveillance in Belgium, 1998–2012.’BMC Neurol, 15(1), 250. Available at: http://dx.doi.org/10.1186/s12883-015-0507-x
Luminex [2012] ‘xTAGR© Gastrointestinal Pathogen Panel (GPP).’ Availableat: https://www.luminexcorp.com/en/?wpdmdl=24534, accessed: 16 Jan2018
MacDougall L, Majowicz S, Doré K, Flint J, Thomas K, Kovacs S, Sock-ett P [2008] ‘Under-reporting of infectious gastrointestinal illness in Brit-ish Columbia, Canada: who is counted in provincial communicable dis-ease statistics?’ Epidemiol Infect, 136(02), 248–256. Available at: http://dx.doi.org/10.1017/S0950268807008461
Macfarlane-Smith LR, Ahmed S, Wilcox MH [2018] ‘Molecular versus culture-based testing for gastrointestinal infection.’ Curr Opin Gastroenterol, 34(1),19–24. Available at: http://dx.doi.org/10.1097/MOG.0000000000000405
351

16 Bibliography
Mahon B, Patrick M [2015] Campylobacter enteritis. In: Heymann DL (editor)Control of communicable diseases manual. 20th edition. Washington, DC,USA: American Public Health Association. ISBN 978-0-87553-018-5
Majowicz SE, Hall G, Scallan E, Adak GK, Gauci C, Jones TF, O’Brien S,Henao O, Sockett PN [2008] ‘A common, symptom-based case definitionfor gastroenteritis.’ Epidemiol Infect, 136(7), 886–894. Available at: http://dx.doi.org/10.1017/S0950268807009375
Manatsathit S, DuPont HL, Farthing M, Kositchaiwat C, Leelakusolvong S,Ramakrishna BS, Sabra A, Speelman P, Surangsrirat S [2002] ‘Guidelinefor the management of acute diarrhea in adults.’ J Gastroenterol Hepatol,17(Suppl.), S54–S71. Available at: http://dx.doi.org/10.1046/j.1440-1746.17.s1.11.x
Marder EP, Cieslak PR, Cronquist AB, Dunn J, Lathrop S, Rabatsky-EhrT, Ryan P, Smith K, Tobin-D’Angelo M, Vugia DJ, Zansky S, Holt KG,Wolpert BJ, Lynch M, Tauxe R, Geissler AL [2017] ‘Incidence and trends ofinfections with pathogens transmitted commonly through food and the effectof increasing use of culture-independent diagnostic tests on surveillance –Foodborne Diseases Active Surveillance Network, 10 U.S. sites, 2013–2016.’MMWR Morb Mortal Wkly Rep, 66(15), 397–403. Available at: http://dx.doi.org/10.15585/mmwr.mm6615a1
May FJ, Stafford RJ, Carroll H, Robson JM, Vohra R, Nimmo GR, BatesJ, Kirk MD, Fearnley EJ, Polkinghorne BG [2017] ‘The effects of cultureindependent diagnostic testing on the diagnosis and reporting of entericbacterial pathogens in Queensland, 2010 to 2014.’ Commun Dis Intell QRep, 41(3), E223–E230
McNulty CA, Lasseter G, Newby K, Joshi P, Yoxall H, Kumaran K, O’BrienSJ, Evans M [2012] ‘Stool submission by general practitioners in SW Eng-land – when, why and how? A qualitative study.’ BMC Fam Pract, 13(1),77. Available at: http://dx.doi.org/10.1186/1471-2296-13-77
McNulty CA, Lasseter G, Verlander NQ, Yoxall H, Moore P, O’Brien SJ,Evans M [2014] ‘Management of suspected infectious diarrhoea by EnglishGPs: are they right?’ Br J Gen Pract, 64(618), e24–e30. Available at:http://dx.doi.org/10.3399/bjgp14X676429.
Milinovich GJ, Avril SMR, Clements ACA, Brownstein JS, Tong S, Hu W[2014] ‘Using internet search queries for infectious disease surveillance:screening diseases for suitability.’ BMC Infect Dis, 14(1), 690. Availableat: http://dx.doi.org/10.1186/s12879-014-0690-1
Modi S, Brahmbhatt MN, Chatur YA, Nayak JB [2015] ‘Prevalence of Cam-pylobacter species in milk and milk products, their virulence gene profileand antibiogram.’ Vet World, 8(1), 1–8. Available at: http://dx.doi.org/10.14202/vetworld.2015.1-8
352

16 Bibliography
Neave PE, Heywood AE, Gibney KB, Leder K [2016] ‘Imported infections:What information should be collected by surveillance systems to informpublic health policy?’ Travel Med Infect Dis, 14(4), 350–359. Available at:http://dx.doi.org/10.1016/j.tmaid.2016.05.007
O’Brien SJ [2017] ‘The consequences of Campylobacter infection.’ Curr OpinGastroenterol, 33(1), 14–20. Available at: http://dx.doi.org/10.1097/MOG.0000000000000329
O’Brien SJ, Rait G, Hunter PR, Gray JJ, Bolton FJ, Tompkins DS, McLauch-lin J, Letley LH, Adak GK, Cowden JM, Evans MR, Neal KR, SmithGE, Smyth B, Tam CC, Rodrigues LC [2010] ‘Methods for determiningdisease burden and calibrating national surveillance data in the UnitedKingdom: the second study of infectious intestinal disease in the com-munity (IID2 study).’ BMC Med Res Methodol, 10(1), 39. Available at:http://dx.doi.org/10.1186/1471-2288-10-39
O’Shea J [2017] ‘Digital disease detection: A systematic review of event-basedinternet biosurveillance systems.’ Int J Med Inform, 101, 15–22. Availableat: http://dx.doi.org/10.1016/j.ijmedinf.2017.01.019
Paquet C, Coulombier D, Kaiser R, Ciotti M [2006] ‘Epidemic intelligence:a new framework for strengthening disease surveillance in Europe.’ EuroSurveill, 11(12), 5–6. Available at: http://dx.doi.org/10.2807/esm.11.12.00665-en
Patel M [2015] Rotavirus infection. In: Heymann DL (editor) Control of com-municable diseases manual. 20th edition. Washington, DC, USA: AmericanPublic Health Association. ISBN 978-0-87553-018-5
Pfeiffer ML, DuPont HL, Ochoa TJ [2012] ‘The patient presenting with acutedysentery – a systematic review.’ J Infect, 64(4), 374–386. Available at:http://dx.doi.org/10.1016/j.jinf.2012.01.006
Pittet V, Vaucher C, Froehlich F, Maillard MH, Michetti P, Swiss IBD Co-hort Study Group, [2018] ‘Patient-reported healthcare expectations in in-flammatory bowel diseases.’ PLoS One, 13(5), e0197351. Available at:http://dx.doi.org/10.1371/journal.pone.0197351
Porta M (editor) [2014] A Dictionary of Epidemiology. Sixth edition. OxfordUniversity Press. ISBN 9780199976720. Available at: http://dx.doi.org/10.1093/acref/9780199976720.001.0001
Rand KH, Tremblay EE, Hoidal M, Fisher LB, Grau KR, Karst SM [2015]‘Multiplex gastrointestinal pathogen panels: implications for infection con-trol.’ Diagn Microbiol Infect Dis, 82(2), 154–157. Available at: http://dx.doi.org/10.1016/j.diagmicrobio.2015.01.007
Review on Antimicrobial Resistance [2016] ‘Tackling drug-resistant infec-tions globally: Final report and recommendations.’ Report. Availableat: https://amr-review.org/sites/default/files/160525_Final%20pa
353

16 Bibliography
per_with%20cover.pdf, accessed: 12 Jun 2018Richard JL, Schaetti C, Basler S, Masserey Spicher V [2017] ‘Reduction of
acute hepatitis B through vaccination of adolescents with no decrease inchronic hepatitis B due to immigration in a low endemicity country.’ SwissMed Wkly, 147, w14409. Available at: http://dx.doi.org/10.4414/smw.2017.14409
Richard JL, Schaetti C, Basler S, Mäusezahl M [2018] ‘The epidemiology ofhepatitis C in Switzerland: trends in notifications, 1988–2015.’ Swiss MedWkly, 148, w14619. Available at: http://dx.doi.org/10.4414/smw.2018.14619
Richard JL, Vidondo B, Mäusezahl M [2008] ‘A 5-year comparison of per-formance of sentinel and mandatory notification surveillance systems formeasles in Switzerland.’ Eur J Epidemiol, 23(1), 55–65. Available at:http://dx.doi.org/10.1007/s10654-007-9187-1
Riddle MS, DuPont HL, Connor BA [2016] ‘ACG clinical guideline: Diagnosis,treatment, and prevention of acute diarrheal infections in adults.’ Am JGastroenterol, 111, 602–622. Available at: http://dx.doi.org/10.1038/ajg.2016.126
Robert Koch-Institut [2017] ‘Infektionsepidemiologisches Jahrbuch meldepf-lichtiger Krankheiten für 2016.’ Annual report, RKI, Berlin, Germany.Available at: https://www.rki.de/DE/Content/Infekt/Jahrbuch/Jahrbuch_2016.pdf?__blob=publicationFile, accessed: 17 Aug 2018
Salmon M, Schumacher D, Burmann H, Frank C, Claus H, Höhle M [2016]‘A system for automated outbreak detection of communicable diseases inGermany.’ Euro Surveill, 21(13), pii=30180. Available at: http://dx.doi.org/10.2807/1560-7917.ES.2016.21.13.30180
Savage RD, Rosella LC, Brown KA, Khan K, Crowcroft NS [2016] ‘Un-derreporting of hepatitis A in non-endemic countries: a systematic re-view and meta-analysis.’ BMC Infect Dis, 16(1), 281. Available at:http://dx.doi.org/10.1186/s12879-016-1636-6
Scallan E, Fitzgerald M, Cormican M, Smyth B, Devine M, Daly L, ReillyP, Crowley D, O’Sullivan MB, Collins C, Harkins V, McKeown P, TohaniV [2005] ‘The investigation of acute gastroenteritis in general practice: asurvey of general practitioners in Northern Ireland and Republic of Ireland.’Eur J Gen Pract, 11(3–4), 136–138. Available at: http://dx.doi.org/10.3109/13814780509178257
Schjørring S, Gillesberg Lassen S, Jensen T, Moura A, Kjeldgaard JS, MüllerL, Thielke S, Leclercq A, Maury MM, Tourdjman M, Donguy MP, Lecuit M,Ethelberg S, Nielsen EM [2017] ‘Cross-border outbreak of listeriosis causedby cold-smoked salmon, revealed by integrated surveillance and whole gen-ome sequencing (WGS), Denmark and France, 2015 to 2017.’ Euro Surveill,
354

16 Bibliography
22(50), pii=17–00762. Available at: http://dx.doi.org/10.2807/1560-7917.ES.2017.22.50.17-00762
Schmid H, Baumgartner A [2013] ‘Epidemiology of infections with enteric sal-monellae in Switzerland with particular consideration of travelling activit-ies.’ Swiss Med Wkly, 143, w13842. Available at: http://dx.doi.org/10.4414/smw.2013.13842
Schmutz C, Bless PJ, Mäusezahl D, Jost M, Mäusezahl-Feuz M, Swiss SentinelSurveillance Network [2017a] ‘Acute gastroenteritis in primary care: a lon-gitudinal study in the Swiss Sentinel Surveillance Network, Sentinella.’ Infec-tion, 45(6), 811–824. Available at: http://dx.doi.org/10.1007/s15010-017-1049-5
Schmutz C, Burki D, Frei R, Mäusezahl-Feuz M, Mäusezahl D [2013] ‘Testingfor Chlamydia trachomatis: time trends in positivity rates in the canton ofBasel-Stadt, Switzerland.’ Epidemiol Infect, 141(9), 1953–1964. Availableat: http://dx.doi.org/10.1017/S0950268812002567
Schmutz C, Mäusezahl D, Bless PJ, Hatz C, Schwenkglenks M, UrbinelloD [2017b] ‘Estimating healthcare costs of acute gastroenteritis and hu-man campylobacteriosis in Switzerland.’ Epidemiol Infect, 145(4), 627–641.Available at: http://dx.doi.org/10.1017/S0950268816001618
Schmutz C, Mäusezahl D, Jost M [2018] ‘Hepatitis A in Switzerland: Ananalysis of 29 years of surveillance data and contemporary challenges.’ TravelMed Infect Dis. Available at: http://dx.doi.org/10.1016/j.tmaid.2018.07.012
Schmutz C, Mäusezahl D, Jost M, Baumgartner A, Mäusezahl-Feuz M [2016]‘Inverse trends of Campylobacter and Salmonella in Swiss surveillance data,1988–2013.’ Euro Surveill, 21(6), pii=30130. Available at: http://dx.doi.org/10.2807/1560-7917.ES.2016.21.6.30130
Schuler M, Zimmermann H, Altpeter E, Heininger U [2014] ‘Epidemiology oftick-borne encephalitis in Switzerland, 2005 to 2011.’ Euro Surveill, 19(13),pii=20756. Available at: http://dx.doi.org/10.2807/1560-7917.ES2014.19.13.20756
Schweiger A, Markwalder K, Vogt M [2005a] ‘Infektiöse Diarrhoe: Epidemiolo-gie, Klinik und Diagnostik.’ Swiss Medical Forum, 5(27), 714–723. Availableat: http://dx.doi.org/10.4414/smf.2005.05592
Schweiger A, Markwalder K, Vogt M [2005b] ‘Infektiöse Diarrhoe: Therapieund Prophylaxe.’ Swiss Medical Forum, 5(28), 742–747. Available at: http://dx.doi.org/10.4414/smf.2005.05598
Schweizerische Gesellschaft für Gastroenterologie [2018] ‘Richtlinien / Em-pfehlungen.’ Available at: http://www.sggssg.ch/richtlinien-empfehlungen/, accessed: 15 Aug 2018
Sentinella [2017] ‘Weitere Neuigkeiten – Elektronische Meldung.’ Sentinella-
355

16 Bibliography
News, 3, 3. Available upon request at [email protected] [2018a] ‘Organisationsform.’ Available at: http://www.sentinella
.ch/de/info/org, accessed: 24 Jan 2018Sentinella [2018b] ‘Themenübersicht Allgemeinpraktiker.’ Available at: http:
//www.sentinella.ch/de/subject/generalists, accessed: 24 Jan 2018Seppänen K, Kauppila T, Pitkälä K, Kautiainen H, Puustinen R, Iivanainen
A, Mäki T [2016] ‘Altering a computerized laboratory test order form ra-tionalizes ordering of laboratory tests in primary care physicians.’ Int J MedInform, 86, 49–53. Available at: http://dx.doi.org/10.1016/j.ijmedinf.2015.11.013
Shalev V, Chodick G, Heymann AD [2009] ‘Format change of a laboratory testorder form affects physician behavior.’ Int J Med Inform, 78(10), 639–644.Available at: http://dx.doi.org/10.1016/j.ijmedinf.2009.04.011
Shea S, Kubota KA, Maguire H, Gladbach S, Woron A, Atkinson-Dunn R,Couturier MR, Miller MB [2017] ‘Clinical microbiology laboratories’ adop-tion of culture-independent diagnostic tests is a threat to foodborne-diseasesurveillance in the United States.’ J Clin Microbiol, 55(1), 10–19. Availableat: http://dx.doi.org/10.1128/JCM.01624-16
Stephan R, Althaus D, Kiefer S, Lehner A, Hatz C, Schmutz C, Jost M,Gerber N, Baumgartner A, Hächler H, Mäusezahl-Feuz M [2015] ‘Foodbornetransmission of Listeria monocytogenes via ready-to-eat salad: A nationwideoutbreak in Switzerland, 2013–2014.’ Food Control, 57, 14–17. Available at:http://dx.doi.org/10.1016/j.foodcont.2015.03.034
Suter K [2014] Campylobacteriosis in Switzerland. Characterisation of cam-pylobacteriosis patients. Time trend in positivity rate. MSc thesis, SwissTropical and Public Health Institute and University of Basel, Basel, Switzer-land
Tam CC, Rodrigues LC, Viviani L, Dodds JP, Evans MR, Hunter PR, GrayJJ, Letley LH, Rait G, Tompkins DS, O’Brien SJ [2012] ‘Longitudinal studyof infectious intestinal disease in the UK (IID2 study): incidence in thecommunity and presenting to general practice.’ Gut, 61(1), 69–77. Availableat: http://dx.doi.org/10.1136/gut.2011.238386
The World Bank [2012] ‘People, pathogens and our planet. Volume 2. The eco-nomics of One Health.’ Report 69145-GLB, The World Bank, WashingtonDC, USA
Tritten ML, Siegrist HH, Jacquet A, Lienhard R [2014] ‘Retrospective ana-lysis of stool culture results during the time period 1997–2013. Effect of theFOPH tariff on the recovery of Aeromonas spp. Qui cherche trouve!’ Avail-able at: http://admed.ne.ch/files/inm/preanalytique/poster_SSM_2014_copro_def.pdf, accessed: 20 Jan 2018. Poster presentation at the An-nual Meeting of the Swiss Society of Microbiology, 19–20 Jun 2014, Fribourg,
356

16 Bibliography
SwitzerlandVan Cauteren D, De Valk H, Sommen C, King LA, Jourdan-Da Silva N,
Weill FX, Le Hello S, Mégraud F, Vaillant V, Desenclos JC [2015a] ‘Com-munity incidence of campylobacteriosis and nontyphoidal salmonellosis,France, 2008–2013.’ Foodborne Pathog Dis, 12(8), 664–669. Available at:http://dx.doi.org/10.1089/fpd.2015.1964
Van Cauteren D, De Valk H, Vaux S, Le Strat Y, Vaillant V [2012] ‘Bur-den of acute gastroenteritis and healthcare-seeking behaviour in France: apopulation-based study.’ Epidemiol Infect, 140(4), 697–705. Available at:http://dx.doi.org/10.1017/S0950268811000999
Van Cauteren D, Turbelin C, Fonteneau L, Hanslik T, De Valk H, BlanchonT [2015b] ‘Physician practices in requesting stool samples for patients withacute gastroenteritis, France, August 2013–July 2014.’ Epidemiol Infect,143(12), 2532–2538. Available at: http://dx.doi.org/10.1017/S0950268814003884
Van den Brandhof WE, Bartelds AI, Koopmans MP, van Duynhoven YT [2006]‘General practitioner practices in requesting laboratory tests for patientswith gastroenteritis in The Netherlands, 2001–2002.’ BMC Fam Pract, 7,56. Available at: http://dx.doi.org/10.1186/1471-2296-7-56
Van der Maas N, Hoes J, Sanders E, de Melker H [2017] ‘Severe underestim-ation of pertussis related hospitalizations and deaths in The Netherlands:A capture-recapture analysis.’ Vaccine, 35(33), 4162–4166. Available at:http://dx.doi.org/10.1016/j.vaccine.2017.06.037
Van Lint P, De Witte E, Ursi JP, Van Herendael B, Van Schaeren J [2016]‘A screening algorithm for diagnosing bacterial gastroenteritis by real-timePCR in combination with guided culture.’ Diagn Microbiol Infect Dis, 85(2),255–259. Available at: http://dx.doi.org/10.1016/j.diagmicrobio.2016.03.017
Verfassungen der Schweiz. Bundesverfassung der Schweizerischen Eidgenos-senschaft vom 12. September 1848 [n.d.] Available at: http://www.verfassungen.de/ch/index48.htm, accessed: 05 Jan 2018
Verfassungen der Schweiz. Bundesverfassung der Schweizerischen Eidgenos-senschaft vom 29. Mai 1874 [n.d.] Available at: http://www.verfassungen.de/ch/verf74-i.htm, accessed: 05 Jan 2018
Viviani L, van der Es M, Irvine L, Tam CC, Rodrigues LC, Jackson KA,O’Brien SJ, Hunter PR, IID2 Study Executive Committee [2016] ‘Estim-ating the incidence of acute infectious intestinal disease in the communityin the UK: A retrospective telephone survey.’ PLoS One, 11(1), e0146171.Available at: http://dx.doi.org/10.1371/journal.pone.0146171
von Stokar T, Vettori A, Fliedner J [2012] ‘Evaluation des obligatorischenMeldesystems übertragbarer Krankheiten.’ Evaluation report, INFRAS,
357

16 Bibliography
Zurich, Switzerland. Available at: https://www.bag.admin.ch/dam/bag/de/dokumente/e-f/evalber-mt/2012-evaluation-meldesystem-uebertragbare-krankheiten-schlussbericht.pdf.download.pdf/2012-schlussbericht-evaluation-meldesystem-d.pdf, accessed: 09 May 2018
Vygen-Bonnet S, Rosner B, Wilking H, Fruth A, Prager R, Kossow A, Lang C,Simon S, Seidel J, Faber M, Schielke A, Michaelis K, Holzer A, KamphausenR, Kalhöfer D, Thole S, Mellmann A, Flieger A, Stark K [2017] ‘On-going haemolytic uraemic syndrome (HUS) outbreak caused by sorbitol-fermenting (SF) Shiga toxin-producing Escherichia coli (STEC) O157, Ger-many, December 2016 to May 2017.’ Euro Surveill, 22(21), pii=30541. Avail-able at: http://dx.doi.org/10.2807/1560-7917.ES.2017.22.21.30541
Ward M, Brandsema P, van Straten E, Bosman A [2005] ‘Electronic reportingimproves timeliness and completeness of infectious disease notification, TheNetherlands, 2003.’ Euro Surveill, 10(1), pii=513. Available at: http://dx.doi.org/10.2807/esm.10.01.00513-en
Werber D, Frank C, Wadl M, Karch H, Fruth A, Stark K [2008] ‘Looking fortips to find icebergs – surveillance of haemolytic uraemic syndrome to detectoutbreaks of shiga toxin-producing E. coli infection.’ Euro Surveill, 13(9),pii=8053. Available at: http://dx.doi.org/10.2807/ese.13.09.08053-en
Wheeler JG, Sethi D, Cowden JM, Wall PG, Rodrigues LC, Tompkins DS,Hudson MJ, Roderick PJ, on behalf of the Infectious Intestinal DiseaseStudy Executive [1999] ‘Study of infectious intestinal disease in England:rates in the community, presenting to general practice, and reported tonational surveillance.’ BMJ, 318(7190), 1046–1050
Wilking H, Spitznagel H, Werber D, Lange C, Jansen A, Stark K [2013] ‘Acutegastrointestinal illness in adults in Germany: a population-based telephonesurvey.’ Epidemiol Infect, 141(11), 2365–2375. Available at: http://dx.doi.org/10.1017/S0950268813000046
World Health Organization [2008] ‘Foodborne disease outbreaks: guidelines forinvestigation and control.’ Manual, WHO, Geneva, Switzerland. Availableat: http://www.who.int/foodsafety/publications/foodborne_disease/outbreak_guidelines.pdf, accessed: 26 Jan 2018
World Health Organization [2016] ‘Zika situation report. Neurological syn-drome and congenital anomalies. 5 February 2016.’ Situation report, WHO.Available at: http://www.who.int/emergencies/zika-virus/situation-report/5-february-2016/en/, accessed: 17 May 2018
World Health Organization [2017] ‘Strengthening surveillance of and responseto foodborne diseases: a practical manual. Introductory module.’ Manual,WHO, Geneva, Switzerland. Available at: http://apps.who.int/iris/bitstream/10665/259469/1/9789241513227-eng.pdf?ua=1, accessed: 26 Jan2018. Licence: CC BY-NC-SA 3.0 IGO
358

16 Bibliography
World Health Organization [2018] ‘Immunization, vaccines and bio-logicals. National passive surveillance.’ Available at: http://www.who.int/immunization/monitoring_surveillance/burden/vpd/surveillance_type/passive/en/, accessed: 06 Jan 2018
World Medical Association [2013] ‘World Medical Association Declaration ofHelsinki: Ethical principles for medical research involving human subjects.’JAMA, 310(20), 2191–2194. Available at: http://dx.doi.org/10.1001/jama.2013.281053
Yates TD, Davis ME, Taylor YJ, Davidson L, Connor CD, Buehler K, SpencerMD [2018] ‘Not a magic pill: a qualitative exploration of provider perspect-ives on antibiotic prescribing in the outpatient setting.’ BMC Fam Pract,19(1), 96. Available at: http://dx.doi.org/10.1186/s12875-018-0788-4
Zaat JO, van Eijk JT, Bonte HA [1992] ‘Laboratory test form design influencestest ordering by general practitioners in The Netherlands.’ Med Care, 30(3),189–198
Zinsstag J, Meisser A, Schelling E, Bonfoh B, Tanner M [2012] ‘From ‘twomedicines’ to ‘one health’ and beyond.’ Onderstepoort J Vet Res, 79(2).Available at: http://dx.doi.org/10.4102/ojvr.v79i2.492
359


Part VI
APPENDICES


Appendix A
List of notifiable observations inSwitzerland, as per January 2018
The following table provides an overview of all notifiable observations asdefined in appendices 1–4 of the “DHA Ordinance on the reporting ofobservations on human communicable diseases” of 1st December 2015,as per 01 January 2018 [Das Eidgenössische Departement des Innern,2015a].
III

Appendix
AList
ofnotifiableobservations
inSw
itzerlandTable A.1: List of notifiable observations for physicians and laboratories with time frame for notification in Switzerland,as per 01 January 2018 [Das Eidgenössische Departement des Innern, 2015a]
Observation Time frame fornotification
Report onclinicalfindings
Supplementaryreport onclinicalfindingsa
Report onlaboratoryfinding
Statistics onlaboratoryfindingsb
Cluster ofclinical/laboratoryfindings
24 hours x x
Unusualclinical/laboratory finding
2 hours x x
AIDS / Humanimmunodeficiency virus
1 week x x
Anthrax / Bacillusanthracis
2 hours x x
Botulism / Clostridiumbotulinum
2 hours x x
Brucellosis / Brucellaspp.
1 week x x
Campylobacter spp. 24 hours x xCarbapenemase-producingEnterobacteriaceae
1 week x x x
Chikungunya fever/virus 24 hours x xChlamydia trachomatis 1 week x xCholera/Vibrio cholerae 24 hours x xCoxiella burnetii 1 week x
IV

Table A.1: (continued)
Observation Time frame fornotification
Report onclinicalfindings
Supplementaryreport onclinicalfindingsa
Report onlaboratoryfinding
Statistics onlaboratoryfindingsb
Creutzfeldt-Jakobdisease / Prions
1 week x x x
Crimean-Congo(haemorrhagic)fever/virus
2 hours x x
Dengue fever/virus 24 hours x xDiphtheria /Corynebacteriumdiphtheriae and othertoxin-producingCorynebacteriaceae(C. ulcerans,C. pseudotuberculosis)
24 hours x x
Ebola (haemorrhagic)fever/virus
2 hours x x
EnterohaemorrhagicEscherichia coli(infection)
24 hours x x
Gonorrhoea / Neisseriagonorrhoeae
1 week x x x
(Invasive) Haemophilusinfluenzae (disease)
1 week x x
V

Appendix
AList
ofnotifiableobservations
inSw
itzerlandTable A.1: (continued)
Observation Time frame fornotification
Report onclinicalfindings
Supplementaryreport onclinicalfindingsa
Report onlaboratoryfinding
Statistics onlaboratoryfindingsb
Hantaviraldiseases / Hanta virus
1 week x x
Hepatitis A (virus) 24 hours x xHepatitis B (virus) 1 week x xHepatitis C (virus) 1 week x x xHepatitis E (virus) 24 hours x x xHIV infection / HI virus 1 week x x xInfluenza A HxNy (newsubtype)
2 hours x x
Influenza virus (seasonal,non-pandemic types andsubtypes)
1 week x
Lassa fever/virus 2 hours x xLegionellosis / Legionellaspp.
1 week x x x
Listeriosis / Listeriamonocytogenes
24 hours x x
Malaria / Plasmodiumspp.
1 week x x
Marburg fever/virus 2 hours x xMeasles (virus) 24 hours x x x
VI

Table A.1: (continued)
Observation Time frame fornotification
Report onclinicalfindings
Supplementaryreport onclinicalfindingsa
Report onlaboratoryfinding
Statistics onlaboratoryfindingsb
(Invasive) meningococcaldisease / Neisseriameningitidis
24 hours x x
Middle East respiratorysyndrome / MERScoronavirus
2 hours x x
Plague / Yersinia pestis 2 hours x x(Invasive) pneumococcaldisease / Streptococcuspneumoniae
1 week x x
Poliomyelitis / Poliovirus 24 hours x xRabies (virus) 24 hours x xRubella (virus) 24 hours x xc xSalmonella spp. 24 hours x xSevere acute respiratorysyndrome / SARScoronavirus
2 hours x x
Shigella spp. 24 hours xSmallpox / Variola/Vaccinia virus
2 hours x x
Syphilis / Treponemapallidum
1 week x x
VII
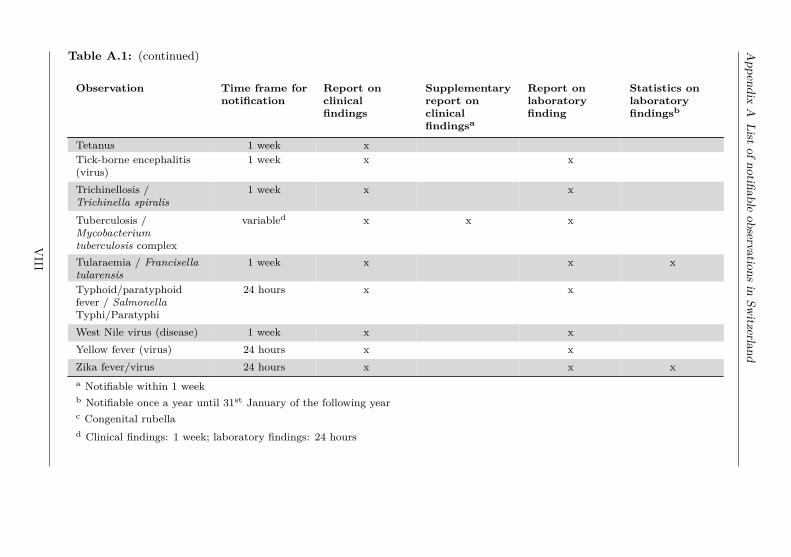
Appendix
AList
ofnotifiableobservations
inSw
itzerlandTable A.1: (continued)
Observation Time frame fornotification
Report onclinicalfindings
Supplementaryreport onclinicalfindingsa
Report onlaboratoryfinding
Statistics onlaboratoryfindingsb
Tetanus 1 week xTick-borne encephalitis(virus)
1 week x x
Trichinellosis /Trichinella spiralis
1 week x x
Tuberculosis /Mycobacteriumtuberculosis complex
variabled x x x
Tularaemia / Francisellatularensis
1 week x x x
Typhoid/paratyphoidfever / SalmonellaTyphi/Paratyphi
24 hours x x
West Nile virus (disease) 1 week x xYellow fever (virus) 24 hours x xZika fever/virus 24 hours x x xa Notifiable within 1 weekb Notifiable once a year until 31st January of the following yearc Congenital rubellad Clinical findings: 1 week; laboratory findings: 24 hours
VIII

Appendix B
Process of compulsory diseasenotification in Switzerland
Figure B.1: Process map of disease notification of "report on laboratoryfindings" in Switzerland
IX

Appendix B Process of disease notification in Switzerland
Figure B.2: Process map of disease notification of "report on clinical findings"in Switzerland
X

Appendix C
The influence of changes in diagnosticapproaches on disease surveillancedata: Time trend in positivity of EHECtesting in Switzerland, 2007–2016:Supplementary material
SeasonalityThe positivity of enterohaemorrhagic Escherichia coli testing shows astrong seasonality. The seasonality of the total number of tests andthe number of positives was calculated as the average number of tests(positives) of all test years (2007–2016) per calendar month. The numberof total tests performed increased by 68% from February with 553 testsuntil September with 928 tests. The number of positively tested casesfollows a similar seasonal pattern with 6 cases detected in February and16 in August. Positivity peaked in July with 1.9%. The seasonality hasbeen incorporated into the mixed effect logistic regression using sine andcosine functions, in the form of sin(d ∗ 2 ∗ π/T ) and cos(d ∗ 2 ∗ π/T ),where d is the time period (e.g. January, February) and T is one year,as described by Stolwijk et al. [1]. The predicted probabilities for apositive test outcome of the univariable logistic regression are shown infigure C.1.
References1. Stolwijk AM, Straatman H, Zielhuis GA. Studying seasonality by using sine
and cosine functions in regression analysis. J Epidemiol Community Health1999; 53:235–238.
XI

Appendix
CTim
etrend
inpositivity
ofEHEC:Suppl.
material
Figure C.1: Predicted probability per calendar month for a positive test outcome of an enterohaemorrhagic Escherichiacoli infection for the univariable model using sine and cosine functions, 2007–2016, Switzerland
XII

XIII

Appendix D Statistic of reports on laboratory findings 2017
Appendix D
Notification form: Statistic of reportson laboratory findings 2017
XIV

XV


Appendix E
The burden of gastroenteritis in Switzerland (BUGS) study: aresearch proposal for a one-year, prospective cohort study:Additional file 1
Sample size calculation for the burden of gastroenteritis in Switzerland(BUGS) study based on different parameter assumptions, includingderivation of underlying formulasComparison between two distinct groups (exposed and unexposed)Power calculations were based on Hayes and Bennett [1], with adjustment for the situation of unequal group sizes.Let
λ = average event rate among exposed persons (expressed as number of events per person year)dλ = hypothesized difference in average event rate between exposed and unexposed personsλ1 = average event rate among exposed personsλ0 = average event rate among exposed persons
XVII

Appendix
EBUGSresearch
proposal:Additionalfile
1
q = proportion of exposed person
Then,λ1 = λ+ (1− q)× dλ and λ0 = λ− q × dλ.
The corresponding weekly event rates are λ′1 = λ152 , λ′0 = λ0
52 .Let y = average number of weeks of observation per subject.Then, formula (2) of Hayes and Bennett [1] was adapted and slightly simplified to provide the minimal totalnumber N of subjects required as
N = (1.96 + z1−β)2 ×[(
λ′1q
+ λ′01− q
)/y + CV 2 ×
(λ′21q
+ λ′201− q
)]/ (λ′1 − λ′0)2
where β denotes the accepted type II-error probability. In case of q = 0.5, N equals 2× (c− 1), where c = numberof clusters per group according to formula (2) of Hayes and Bennett [1].
XVIII

Table E.1: Sample size calculation for the burden of gastroenteritis in Switzerland (BUGS) study for a comparison ofthe mean number of events per person and year between two distinct groups (exposed and unexposed) based on differentparameter assumptions
Parameters specified / assumptions Comparison of mean number ofevents per person and year betweentwo distinct groups (exposed andunexposed)
Mean num-ber ofevents perperson andyear
Difference inmean number ofevents per personand year betweenexposed and un-exposed
PowerPro-portionexposed
ICCAveragenumberof weeksobserved
Calculated sample size needed
1 0.3 0.9 0.2 0.2 40 1’162 (n1= 929, n2= 233)0.75 0.3 0.9 0.2 0.2 40 909 (n1= 727, n2= 182)0.75 0.3 0.9 0.2 0.2 26 1’384 (n1=1’107, n2= 277)0.75 0.3 0.9 0.2 0.2 52 705 (n1= 564, n2= 141)0.75 0.2 0.9 0.2 0.2 40 1’908 (n1=1’526, n2= 382)0.75 0.2 0.8 0.2 0.2 40 1’425 (n1=1’140, n2= 285)0.75 0.1 0.8 0.2 0.2 40 5’295 (n1=4’236, n2=1’059)0.75 0.2 0.9 0.2 0.5 40 2’172 (n1=1’737, n2= 435)0.75 0.2 0.9 0.2 0.5 26 3’172 (n1=2’537, n2= 635)0.75 0.2 0.8 0.2 0.5 26 2’369 (n1=1’895, n2= 474)0.75 0.3 0.9 0.1 0.2 40 1’722 (n1=1’549, n2= 173)0.75 0.2 0.9 0.1 0.2 40 3’552 (n1=3’196, n2= 356)0.75 0.2 0.8 0.1 0.2 40 2’653 (n1=2’387, n2= 266)0.5 0.3 0.9 0.2 0.2 26 1’008 (n1= 806, n2= 202)
XIX

Appendix
EBUGSresearch
proposal:Additionalfile
1Table E.1: (continued)
Parameters specified / assumptions Comparison of mean number ofevents per person and year betweentwo distinct groups (exposed andunexposed)
Mean num-ber ofevents perperson andyear
Difference inmean number ofevents per personand year betweenexposed and un-exposed
PowerPro-portionexposed
ICCAveragenumberof weeksobserved
Calculated sample size needed
0.5 0.3 0.9 0.2 0.2 40 660 (n1= 528, n2= 132)0.5 0.3 0.8 0.2 0.2 26 753 (n1= 602, n2= 151)0.5 0.3 0.9 0.2 0.5 40 733 (n1= 586, n2= 147)0.5 0.2 0.9 0.2 0.5 40 1’484 (n1=1’187, n2= 297)0.5 0.1 0.9 0.2 0.5 40 5’299 (n1=4’239, n2=1’060)0.5 0.1 0.8 0.2 0.2 40 3’634 (n1=2’907, n2= 727)
ICC = intraclass correlation coefficientbold: Calculated minimal sample size exceeds envisaged cohort size of 3’000 individuals
Within-subject comparison between two distinct periods (high and low risk period):Longitudinal comparison of ratesLet X(1)
ij = number of events in subject i during unit interval j (e.g. week j) in low risk periodLet X(2)
ij = number of events in subject i during unit interval j (e.g. week j) in high risk period
XX

Assumptions:(1) X(1)
ij = Pois (λ1 + dλi0 + dλi1), j = 1, . . . , m1
(2) X(2)ij = Pois (λ2 + dλi0 + dλi2 + dλi3), j = m1 + 1, . . . , m1 +m2
where λ1 and λ2 denote the average rates in the low and high risk period, respectively,dλi0 denotes a subject-specific random effect with E (dλi0) = 0 across both periods,dλi1 and dλi2 denote subject-specific random period effects with E (dλi1) = E (dλi2) = 0 and E
(dλ2
i1)
= E(dλ2
i2),
and dλi3 denotes an additional subject-specific random effect in the high risk period with E (dλi3) = 0.All random effects are assumed to be mutually independent.We define:
Ui = 1m2
m1+m2∑j=m1+1
X(2)ij −
1m1
m1∑j=1
X(1)ij
The variance of Ui conditional on fixed values of the random effects then becomes:
V ar (Ui|random effects) = 1m2
(λ2 + dλi0 + dλi2 + dλi3) + 1m1
(λ1 + dλi0 + dλi1)
givingE [V ar (Ui|random effects)] = 1
m2λ2 + 1
m1λ1 (E.1)
Moreover,
E (U1|random effects) = (λ2 + dλi0 + dλi2 + dλi3)− (λ1 + dλi0 + dλi1) = (λ2 − λ1) + (dλi2 − dλi1) + dλi3
XXI

Appendix
EBUGSresearch
proposal:Additionalfile
1
implying that
E[E (Ui|random effects)2
]= (λ2 − λ1)2 + V ar (dλi2) + V ar (dλi1) + V ar (dλi3)
andV ar [E (Ui|random effects)] = V ar (dλi2) + V ar (dλi1) + V ar (dλi3) (E.2)
For the variance of Ui, which is the sum of E.1 and E.2, we thus obtain
V ar (Ui) = 1m2
λ2 + 1m1
λ1 + 2× V ar (dλi1) + V ar (dλi3) (E.3)
If we assume that V ar (dλi1) = V ar (dλi2) = V ar (dλi0) and relate V ar (dλi0) to λ1 through
V ar (dλi0) = (λ1 × CV1)2
where CV1 is the coefficient of variation of λ1 + dλi0, and V ar (dλi3) to |λ2 − λ1| through
V ar (dλi3) = (|λ2 − λ1| × CV2)2
where CV2 is the coefficient of variation of |λ2 − λ1|+ dλi3, then we finally obtain
V ar (Ui) = 1m2
λ2 + 1m1
λ1 + 2× (λ1 × CV1)2 + (|λ2 − λ1| × CV2)2 (E.4)
In our power calculations we chose CV1 = CV2 = 0.25. If all random effects were normally distributed, thiswould imply that dλi1, dλi2 ∈ (−0.5× λ1, 0.5× λ1) and dλi3 ∈ (−0.5× |λ2 − λ1| , 0.5× |λ2 − λ1|), each with aprobability of 95%.
XXII

Table E.2: Sample size and power calculation for the burden of gastroenteritis in Switzerland (BUGS) study for acomparison of the mean number of events per person and year between two distinct periods (high and low risk period)based on different parameter assumptions
Parameters specified / assumptions Comparison of mean num-ber of events per personand year between two dis-tinct periods
Mean num-ber ofevents perperson andyear
Difference inmean number ofevents per personand year betweenhigh and low riskperiod
Power Proportionobservedweeks athigh risk
Indi-vidualcoeffi-cient ofvariation
Averagenumberof weeksobserved
Calculated sample size needed
1 0.3 0.9 0.2 0.25 40 1’1330.75 0.3 0.9 0.2 0.25 40 8900.75 0.3 0.9 0.2 0.25 26 1’3650.75 0.3 0.9 0.2 0.25 52 6870.75 0.2 0.9 0.2 0.25 40 1’8750.75 0.2 0.8 0.2 0.25 40 1’4000.75 0.1 0.8 0.2 0.25 40 5’2190.75 0.2 0.9 0.2 0.5 40 1’9260.75 0.2 0.9 0.2 0.5 26 2’9260.75 0.2 0.8 0.2 0.5 26 2’1860.75 0.3 0.9 0.1 0.25 40 1’6780.75 0.2 0.9 0.1 0.25 40 3’4720.75 0.2 0.8 0.1 0.25 40 2’5930.5 0.3 0.9 0.2 0.25 26 996
XXIII

Appendix
EBUGSresearch
proposal:Additionalfile
1Table E.2: (continued)
Parameters specified / assumptions Comparison of mean num-ber of events per personand year between two dis-tinct periods
Mean num-ber ofevents perperson andyear
Difference inmean number ofevents per personand year betweenhigh and low riskperiod
Power Proportionobservedweeks athigh risk
Indi-vidualcoeffi-cient ofvariation
Averagenumberof weeksobserved
Calculated sample size needed
0.5 0.3 0.9 0.2 0.25 40 6490.5 0.3 0.8 0.2 0.25 26 7440.5 0.3 0.9 0.2 0.5 40 6590.5 0.2 0.9 0.2 0.5 40 1’3540.5 0.1 0.9 0.2 0.5 40 4’9050.5 0.1 0.8 0.2 0.25 40 3’595
bold: Calculated minimal sample size exceeds envisaged cohort size of 3’000 individuals
References1. Hayes RJ, Bennett S: Simple sample size calculation for cluster-randomized trials. Int J Epidemiol 1999, 28:319–326.
XXIV

Appendix F
Selected media articles
F.1 Selected media reactions on studiespresented in this thesis
Figure F.1: Newspaper article in response to publication on healthcare costsof acute gastroenteritis and campylobacteriosis; Source: Volksblatt Liechten-stein, 13.08.2016, page 32
XXV

Appendix F Selected media articles
Figure F.2: Newspaper article in response to publication on acute gast-roenteritis in Swiss primary care, Sentinella; Source: Corriere del Ticino,05.08.2017, page 5
Figure F.3: Newspaper article in response to publication on acute gastroen-teritis in Swiss primary care, Sentinella; Source: Walliser Bote, 05.08.2017,page 19
XXVI

F.1Media
reactionson
studiespresented
inthis
thesis
Figure F.4: Newspaper article in response to publication on acute gastroenteritis in Swiss primary care, Sentinella; Source:Tages-Anzeiger, 26.08.2017, page 58
XXVII

Appendix F Selected media articles
F.2 Selected media reactions on surveillancedata
Figure F.5: Newspaper article in response to interview aired on Swiss TV,based on weekly situation report on influenza-like illnesses published in the“BAG Bulletin”; Source: 20 Minuten (issue region Basel), 09.03.2018, page 9
Figure F.6: Newspaper article in response to weekly situation report on tick-borne diseases published in the “BAG Bulletin”; Source: 20 Minuten (issueregion Basel), 10.07.2018, page 11
XXVIII