Swiss National Joint Registry - ANQ
88
SIRIS Report 2019 Annual Report of the Swiss National Joint Registry, Hip and Knee, 2012 – 2018 Swiss National Joint Registry
-
Upload
khangminh22 -
Category
Documents
-
view
1 -
download
0
Transcript of Swiss National Joint Registry - ANQ

SIRIS Report 2019 Page 1
SIRIS Report 2019Annual Report of the Swiss National Joint Registry, Hip and Knee, 2012 – 2018
Swiss National Joint Registry

Page 2 SIRIS Report 2019
Hip and knee replacement results 2012 –2018
SIRIS Report 2019
Annual Report of the Swiss National Joint Registry, Hip and Knee
SIRIS – Foundation for Quality Assurance in Implant Surgery
swiss orthopaedics – Swiss Society of Orthopaedics and Traumatology
ANQ – National Association for the Development of Quality in Swiss Hospitals and Clinics
SwissRDL – Medical Registries and Data Linkage, Institute of Social and Preventive Medicine,
University of Bern

Page 4 SIRIS Report 2019
SIRIS Report 2019 Page 5
Preface
Transparent publication within reach
The Swiss Implant Register (SIRIS) is an active im-
plant registry that is constantly being further de-
veloped. Key milestones have been reached since
the publication of the last SIRIS report. Links with
the Swiss Federal Statistical Office’s (BFS) death
records and the CCO social security registry allow
for more reliable two-year revision rates to be cal-
culated. Revision rates can now also be determined
for each implant brand, which further enhances the
registry.
With regard to transparent publication, all parties
involved agreed on an optimal way of presenting in-
formation for the direct comparison of hospitals and
clinics. The Swiss National Association for Quality
Development in Hospitals and Clinics (ANQ), warmly
welcomes their decision, as the selected funnel plot
diagrams for rates and other measured values have
so far proven to be very successful at ANQ.
In ANQ’s view, this preliminary work has satisfied
all the key requirements for the publication of the
knee and hip implant results in the next annual re-
port, with hospital and clinic names to be included.
The transparent publication will be put into effect
from 2020. We would like to thank everyone who
contributed their invaluable expertise, including
the specialists, team of authors, SIRIS foundation,
expert associations and SwissRDL, for helping to
make SIRIS what is now Switzerland’s largest im-
plant registry.
Thomas Straubhaar
President of the National Association for the
Development of Quality in Swiss Hospitals and
Clinics (ANQ)
Measurable quality is becoming ever more
important
The industry organization Swiss Medtech stands for
high quality, safe medical technology and has been
an advocate for the development of an independent
national implant registry from the very beginning
(founding member of the SIRIS foundation, 2007).
By registering all hip and knee prosthetics (ANQ
National Quality Agreement), the SIRIS implant re-
gistry has developed into an excellent early war-
ning system that makes a valuable contribution to
healthcare provision. It would be ideal if all medical
organizations could agree on a central registry for
the implants they use.
The quality of treatment available today is partly due
to the manufacturers’ and distribution partners’ in-
novative products and additional services (e.g. sur-
gery training and support, regulatory responsibility
and prompt replacement of products, etc.).
Drawing on international practice, Swiss Medtech
has supported the comparative evaluation of im-
plants from the very beginning. The analyses from
the SIRIS implant registry provide an important ad-
ditional source of information for the identification
of potential outliers. The weaknesses they make vi-
sible need to be analyzed and addressed together.
Our ultimate goal is to avoid or minimize any potenti-
al patient suffering as much as possible.
Dr. iur. Beat Vonlanthen, Councilor of States
President of the Association of the
Swiss Medtech Industry
(Swiss Medtech)
Page 6 SIRIS Report 2019
Acknowledgements
SIRIS Scientific Advisory Board
Prof. Martin Beck, MD
Head of Orthopaedic Clinic
Canton Hospital of Lucerne,
swiss orthopaedics Hip Expert Group,
Author of the scientific SIRIS-Report
Dr. med. Bernhard Christen, MD, M.H.A.
articon, Salem-Spital Berne,
swiss orthopaedics Knee Expert Group,
Author of the scientific SIRIS-Report
Dr. med. Vilijam Zdravkovic, MSc
Senior Research Officer, Department of
Orthopaedic Surgery and Traumatology,
Canton Hospital of St Gall
Author of the scientific SIRIS-Report
SIRIS Expert Group
Prof. Martin Beck, MD
Canton Hospital of Lucerne,
swiss orthopaedics Hip Expert Group
Christian Brand, PhD, MSc
Statistical Analysis and Research
Dr. med. Bernhard Christen, MD, M.H.A.
articon, Salem-Spital Berne,
swiss orthopaedics Knee Expert Group
Prof. Claudio Dora, MD
Schulthess Clinic, Zurich, Senior Consultant Hip
Surgery, SIRIS Board Member
Regula Heller, MNSc, MPH
Chair Akutsomatik ANQ
Lead and moderation SIRIS Expert Group
Peter Liniger
Johnson & Johnson AG, SIRIS Board Member
Andreas Mischler
conidea GmbH, SIRIS Administration Lead
Jasmin Vonlanthen
User support for SIRIS Hip and Knee, SwissRDL,
ISPM, University of Berne
Dr. Peter Wahl, MD
Staff surgeon, Division of Orthopaedics and
Traumatology, Cantonal Hospital Winterthur
Dr. Christian Westerhoff, MD
Chief Clinical Officer Hirslanden,
Member QA Akutsomatik ANQ
Dr. med. Vilijam Zdravkovic, MSc
Canton Hospital of St Gall
Senior Research Officer
SIRIS Report 2019 Page 7
All information in this report was composed with
the utmost care. If any changes or modifications are
made after publication, these will be published
on our website www.siris-implant.ch, where you
can also download the SIRIS Report 2019 and all
previous reports.
Foundation for quality assurance
in implant surgery – SIRIS
c/o Conidea GmbH, 3604 Thun
[email protected], www.siris-implant.ch
SwissRDL, ISPM, University of Bern
Adrian Spörri, PhD, MPH
Head of SwissRDL, Statistical Analysis,
Data Linkage and Research
Christian Brand, PhD, MSc
Statistical Analysis and Research
Author of the scientific SIRIS-Report
Partner associations of SIRIS
ANQ
National Association for the Development of Quality
in Swiss Hospitals and Clinics, [email protected]
Hplus
Association of the Hospitals of Switzerland
Swiss Medtech
Association of the Swiss Medtech Industry
santésuisse
Association of Swiss Medical Insurers
swiss orthopaedics
Swiss Society of Orthopaedics and Traumatology
Page 8 SIRIS Report 2019
Definitions
Acetabular component The part of a hip prosthesis that is
implanted into the acetabulum – the socket part of a ball and
socket joint.
Arthrodesis A procedure in which a natural joint is fused
together.
Arthrofibrosis Rigidity of the joint as a consequence of
connective tissue adhesion.
Arthrotomy The opening of a joint during surgery.
Articulation The two surfaces that move together
(articulate) in a total joint replacement.
ASA score The scoring system of the American Society of
Anaesthesiologists (ASA) for grading the overall physical
condition of the patient, as follows: I: fit and healthy;
II: mild disease, not incapacitating; III: incapacitating
systemic disease; IV: life-threatening disease.
Benchmark Comparing the performances at a specific
hospital to the mean performances of hospitals throughout
Switzerland.
Bilateral Replacing the same joint on both sides of the body
(typically both hips or knees) by means of a prosthesis (here
meaning the replacement on both sides in one session).
Body Mass Index. Is obtained by dividing body weight in
kilograms by height in meters squared. Interpretation: <18.5:
underweight; 18.5–24.9: normal weight; 25–29.9: over-
weight; 30–34.9: obese class I; 35–39.9: obese class II;
>40: obese class III.
Case mix Term used to describe variation in the population,
relating to factors such as diagnosis, patient age, gender and
health condition.
Cement Material (polymethyl methacrylate) used to fix joint
replacements to bone.
Charnley score Clinical classification system – A: one joint
affected; B1: both joints affected; B2: contralateral joint with
a prosthesis; C: several joints affected or a chronic disease
that affects quality of life.
Competing risks survival analysis Method to calculate
survival taking into account various outcomes, in this case
revision and death.
Cumulative incidence Overall incidences over a specific
period of an event (such as the revision of a prosthesis or
death of a patient).
Cumulative revision percentage Overall revision percen-
tage over a specific period.
Femoral component Part of a hip or knee prosthesis that is
implanted into the femur (thigh bone) of the patient.
Girdlestone Hip revision procedure in which the hip joint
or hip prosthesis is removed and no new prosthesis
is implanted (usually because of a bacterial infection).
Hybrid fixation Fixation of a prosthesis in which one of the
two parts of a prosthesis is cemented and the other one
uncemented.
Head component Part of a hip prosthesis that is implanted
on top of the femoral component of a hip prosthesis and
moves inside the acetabular component of the hip joint.
Hospital service volumes In the tables depicting the total
number arthroplasty procedures per year. Four categories
of hospital service volume were used (<100, 100–199,
200–299, 300+ procedures per year). The calculation of the
annual volume was performed separately for hip and knee
surgeries, using the average of all (primary and revision)
procedures recorded in each hospital service in 2013–2018.
Acetabular inlay (insert) Intermediate component (inner
layer), made usually of polyethylene (but also other materi-
als), which is placed in the acetabular component.
Kaplan-Meier survival analysis Method to calculate
survival, in which only one end point is possible, in this case
revision.
Kernel density plot A variation of a histogram that uses
kernel smoothing to plot values. The underlying kernel is
usually Gaussian distribution. One advantage of density
plots over histograms is that they are not stepped depen-
ding of the number of bins used (histogram bars), but are
SIRIS Report 2019 Page 9
always smooth lines. The second advantage is that several
lines can be plotted over each other and still be visible,
which could be difficult with more than two overlaying
histograms.
Knee inlay (insert) Intermediate component of the knee
prosthesis. It is made of polyethylene and placed between
the femoral and tibial components.
Lateral collateral ligament Lateral (outer) knee ligament.
Malalignment Malpositioning of prosthetic components
significantly deviating from physiological norms.
Meniscectomy Meniscus removal.
Metallosis Deposition of metal debris in soft tissues of the
body, usually around the prosthesis.
Osteoarthritis Disease of the joint in which the cartilage is
damaged/destroyed, and the underlying bone altered
Osteochondral bone defect Defect of the joint surface in
which both cartilage and the underlying bone are affected
Osteonecrosis Cellular death of bone tissue.
Osteosynthesis Securing broken bone parts together with
plates, pins and/or screws.
Osteotomy Cut of the bone with a saw or chisel in order to
correct its position, to shorten or lengthen it.
Patellar component Part of a knee prosthesis that is im-
planted on the inner side of the knee cap.
Patellofemoral prosthesis Two-piece knee prosthesis that
provides a prosthetic (knee) articulation surface between
the patella and trochlea (furrow) of the thigh bone (femur).
Primary prosthesis The first time replacement of the origi-
nal joint with a prosthesis .
PROMs Patient Reported Outcome Measures.
Resurfacing hip arthroplasty Hip prosthesis in which the
cup (acetabulum) is replaced and a metal cap is implanted
on top of the femoral head.
Reverse hybrid fixation hip prosthesis Fixation of a hip or
knee prosthesis in which one component is cemented and the
other uncemented.
Revision A revision procedure is a secondary surgical proce-
dure of a patient’s hip or knee joint whereby the complete
primary implant or parts thereof are replaced by new compo-
nents.
Reoperation All secondary procedures, where no compo-
nents of the primary implantation are removed.
Revision burden The ratio of revision procedures to all pri-
mary and arthroplasty procedures.
Sarcopenia The degenerative loss of skeletal muscle mass
and strength associated with aging.
Synovectomy Removal of inflamed mucosa in a joint.
Tibial component Part of a knee prosthesis that is inserted in
the tibia (shin bone) of a patient.
Total joint arthroplasty Arthroplasty in which the entire joint
of a patient is replaced.
Unicompartimental knee arthroplasty Replacement of half
the knee (either inner or outer side) by a prosthesis.
Abbreviations
ASA American Society of Anaesthesiologists
BMI Body Mass Index
CI Confidence Interval
CRF Case Report Form
PROMs Patient Reported Outcome Measures
SD Standard Deviation
THA Total Hip Arthroplasty
TKA Total Knee Arthroplasty
UKA Unicompartmental Knee Arthroplasty
AVN Avascular Necrosis

Page 10 SIRIS Report 2019
SIRIS Report 2019 Page 11
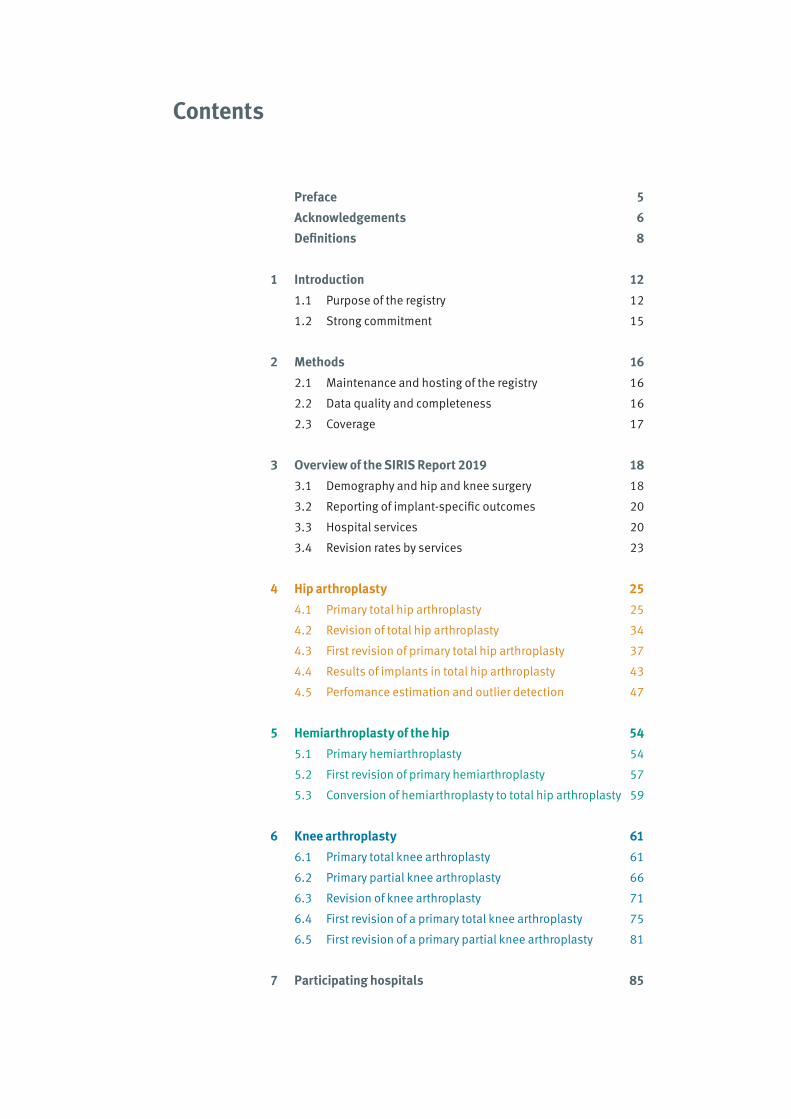
Contents
Preface 5
Acknowledgements 6
Definitions 8
1 Introduction 12
1.1 Purpose of the registry 12
1.2 Strong commitment 15
2 Methods 16
2.1 Maintenance and hosting of the registry 16
2.2 Data quality and completeness 16
2.3 Coverage 17
3 Overview of the SIRIS Report 2019 18
3.1 Demography and hip and knee surgery 18
3.2 Reporting of implant-specific outcomes 20
3.3 Hospital services 20
3.4 Revision rates by services 23
4 Hip arthroplasty 25
4.1 Primary total hip arthroplasty 25
4.2 Revision of total hip arthroplasty 34
4.3 First revision of primary total hip arthroplasty 37
4.4 Results of implants in total hip arthroplasty 43
4.5 Perfomance estimation and outlier detection 47
5 Hemiarthroplasty of the hip 54
5.1 Primary hemiarthroplasty 54
5.2 First revision of primary hemiarthroplasty 57
5.3 Conversion of hemiarthroplasty to total hip arthroplasty 59
6 Knee arthroplasty 61
6.1 Primary total knee arthroplasty 61
6.2 Primary partial knee arthroplasty 66
6.3 Revision of knee arthroplasty 71
6.4 First revision of a primary total knee arthroplasty 75
6.5 First revision of a primary partial knee arthroplasty 81
7 Participating hospitals 85
Page 12 SIRIS Report 2019
1. Introduction
1.1 Purpose of the registry
The Swiss National Implant Registry SIRIS was for-
mally introduced and began registering of hip and
knee implants in September 2012. Participation
in the activity of SIRIS became compulsory for all
hospitals and clinics performing knee and hip ar-
throplasties and that had signed the ANQ’s National
Quality agreement, i.e. practically all Swiss hospi-
tals and clinics.
The mission of a national joint registry needs to be
clearly defined so that all stakeholders and partici-
pants strive towards a common goal. This also influ-
ences the granularity of the information contained in
the registry as this will be quite a different require-
ment for each of the involved partners. The fact that
a multi-partner association was needed to get SIRIS
off the ground signified that more than one point of
view had to be taken into consideration if success
were to be achieved. Although each of the partners
naturally tends to focus more on a particular aspect
of their interest, in the end there is one basic interest
common to all partners: The long-term wellbeing of
the patient after prosthetic joint replacement.
Patient perspective. Patients expect their implant
to provide them with a long-lasting, pain-free result.
The operation needs to be adapted to their level of
activity and should be tissue sparing and compli-
cation-free, followed by rapid rehabilitation. The
registry data should be presented in such a way as
to be readily comprehensible, allowing patients to
extract the information of interest despite complex
methodology behind the tables and graphs. Not all
patients will read the registry reports, but those that
will might better understand and discuss their past
or future operation with their surgeon. The SIRIS reg-
istry should provide them both with interesting facts
to discuss.
From the surgeon’s point of view. Surgeons are
primarily concerned with avoiding surgical com-
plications and shortcomings in their individual pa-
tients. Indeed, the goal of patients and surgeons is
the same: Long-lasting pain-free full function of the
prosthesis. The difference is that the patients ex-
pect the goal to be achieved while surgeons promise
and attempt to achieve the goal. Certainly, all sur-
geons try to do their best for each and every patient,
but by implanting a particular prosthesis they inte-
grate the performance of the implant into their own
performance.
The implants must be impeccable in their manu-
facture, versatile and avoid problems such as early
loosening, particle disease, breakage, dislocation,
infection, stiffness, or chronic pain. A long, prob-
lem-free implant life with a minimum amount of wear
of the bearing surfaces is the ultimate goal. The reg-
istry should identify in a relatively short timeframe
the problematic implants and provide valuable early
warnings to surgeons. However, entering individu-
al clinical results into the data collection system is
not a welcome addition to surgeons’ daily activities.
Although surgeons may appreciate benchmarking
their own results to the overall results, a controver-
sial question remains the public availability of in-
formation at the individual surgeon level. This may
lead to bias entering into the system and potential
changes in patient recruitment practice.
From an industrial point of view. The industry’s
main activity is manufacturing and sales driven by
profit orientation, which is fine in our industrialized
world. Designing and providing first-rate, prob-
lem-free implant systems is the only worthwhile
strategy because a single implant that causes fail-
ures in a series of patients may lead to allegations
and financially destabilize the company. It is clear
that the interest of industry is the same as the in-
terest of patients: The long-term wellbeing of the
SIRIS Report 2019 Page 13
patient after prosthetic joint replacement. Progress
and technical innovation are extremely important for
an industry dedicated to providing safe high-perfor-
mance implants. The registry is also seen as an es-
sential tool for post-market surveillance and clinical
control that validates improvements in materials,
design, and concepts in real-life clinical settings. If
industry accepts quality as the principal market-reg-
ulating factor, then the registry is a welcome tool
and the motivation of industry to participate should
be high. The goal is not to regulate the market, but
to define and provide tools for market regulation
through quality assessment.
From the hospitals’ point of view. Hospitals aim
to provide excellent and safe care, at a reasonable
cost, to a large number of patients. Hospitals are a
framework where surgeon / patient interaction finds
place and both parties have a common interest: Af-
ter prosthetic replacement patients should be so
well that they forget their treated joint in daily living
(forgotten joint concept). However, patients should
not forget the hospital where they were treated so
successfully, and should be confident of coming
again to the same hospital, should it be necessary.
The registry is perceived as a quality control instru-
ment, not only of the implants used, but of the whole
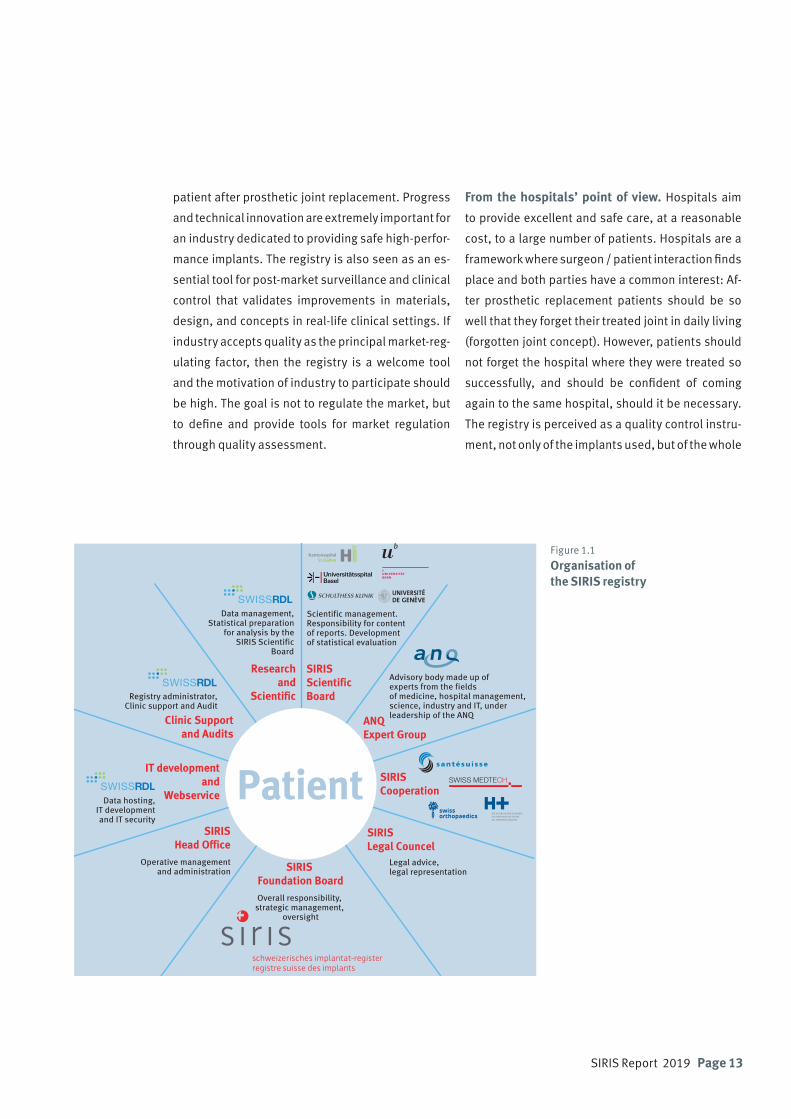
SIRIS Foundation BoardOverall responsibility,
strategic management, oversight
ANQ Expert Group
SIRIS Cooperation
SIRIS Legal Councel
SIRIS ScientificBoard
Researchand
Scientific
Clinic Supportand Audits
IT developmentand
Webservice
SIRISHead Office
Operative managementand administration
Advisory body made up of experts from the fields of medicine, hospital management, science, industry and IT, under leadership of the ANQ
Scientific management.Responsibility for content of reports. Development of statistical evaluation
Data hosting, IT development and IT security
Registry administrator,Clinic support and Audit
Data management, Statistical preparation
for analysis by the SIRIS Scientific
Board
Legal advice, legal representation
Patient
Figure 1.1 Organisation of the SIRIS registry
Page 14 SIRIS Report 2019
process, ranging from the preoperative consultation,
to the procedures in the operating room and to the
post-operative follow-up. Hospitals, being health-
care providing institutions in today’s competitive
environment, are also very keen to uphold their rep-
utation and a registry is an invaluable tool for this
purpose. Some cantons even require SIRIS reports in
order to prove that the number of procedures is suffi-
cient for placement of the hospital on contract lists.
It appears that participating in the registry might be
crucial for survival of some hospitals, and this is a
strong motivation in an environment where hospital
mergers and closures are frequently discussed.
From the insurer’s point of view. Insurers and
third-party payers want minimal delays and wait-
ing times for insured patients, short hospitalization
times, no expensive re-admissions for complica-
tions, and a quick return to work. Insurers are very
cost conscious when it comes to implant pricing,
medical honorarium, and hospital bills. The insurers’
wish is to provide equal benefits to all their clients
within the budget available to them. The registry
is therefore perceived as an instrument for quali-
ty control of surgeons and institutions and also as
a cost-control tool. Because revisions are causing
massive additional and unnecessary costs, the inter-
est of patients is the same as the interest of insur-
ers: Long-lasting pain-free function after prosthetic
replacement.
Point of view of the government. The government
organizes the healthcare system on behalf of all cit-
izens. Therefore, it has no inherent financial inter-
est, but shares the patients’ interest: Cost-efficient
treatment providing long-lasting good results. The
government therefore needs data on the overall sur-
gical activity for public health purposes, for needs
assessments, and for planning the macroeconomic
policies related to healthcare. Government agencies
are commissioned to ensure that the institutions
under their supervision provide high-quality and
complication-free healthcare to the overall pop-
ulation. The agencies will also have an interest in
benchmarking hospitals and in keeping insurance
and third-party payer costs down to a reasonable
minimum. Health agencies also play an important
role in supervising implant systems as they require
guarantees that the industrial standards of nation-
ally manufactured and imported implants are safe
and reliable for institutional usage.

SIRIS Report 2019 Page 15
Patient reported factors
Surgery related factorsPatient related factors
Main DiagnosisPrevious SurgerySurgery Date and PlaceMorbidity StateCharnley ClassInterventionApproach, PositioningComponent FixationCementing Technique
Implant related factorsType of ImplantArticle NumberCompany NameBrand Name
NameBirthdate
GenderHeightWeight
only in ZH, BL, BS, SO General health
Mobility and Self-careUsual activities
Pain / DiscomfortAnxiety / Depression
Joint specific painJoint-specific satisfaction
Level of education
1.2 Strong commitment
The 2019 SIRIS report represents a collaborative
data collection effort involving all the institutional
partners of SIRIS and including the surgeons and
operating teams in 186 hospital services. Streamlin-
ing, improving and optimizing the data collection is
a work in progress involving expert groups and all
stakeholders, including the industrial partners.
It is difficult to assess the coverage of the SIRIS reg-
ister (almost 90% of all performed arthroplasties
that were submitted to the registry as closed cases
were used in the analysis). As a benchmark we used
data from the hospital quality report published by
the Swiss Federal Health Authorities (BAG) for 2017.
Although the registry officially only started in 2012,
it has already enjoyed a coverage of 100% of the in-
volved institutions. This demonstrates not only the
strong commitment to the project by the surgeons
and their teams both in public and private institu-
tions, but also the high quality of the organization,
coaching, and data collection of the SIRIS team. This
report provides factual information on the state of
hip and knee replacements in Switzerland and pres-
ents a wealth of new information. The report also
offers important and verifiable information that
the healthcare community, third-party payers, and
healthcare regulators will hopefully find useful.
Figure 1.2 Variables collected of the SIRIS registry
Patient
Page 16 SIRIS Report 2019
2. Methods
2.1 Maintenance and hosting of the registry
The Swiss National Implant Registry, Hip and Knee
(SIRIS) is hosted and maintained by SwissRDL at the
Institute for Social and Preventive Medicine ISPM,
University of Bern. A dedicated team consisting of
a project manager, data management specialists,
statistician and an epidemiologist is responsible
for the management and maintenance, technical
support and reporting and analysis of the registry. A
data monitor supervises the data entry at the hospi-
tals and supports and trains the collaborators at the
participating hospital services to ensure the smooth
and efficient conduct of the registry.
SIRIS data are collected on the online documenta-
tion IT platform (accessible on www.siris-doc.ch).
Clinical data on primary and revision operations
as well as implant data are recorded. The current
used version of the SIRIS forms for data entry can be
downloaded from www.siris-implant.ch. Most par-
ticipating hospital services use the online interface
when documenting their operations, while a small
minority sends completed paper forms to SwissRDL
for processing. As a third data entry method, two
large services send data exports from their hospital
information system via web service client to Swiss-
RDL.
Implant specification data are entered into SIRIS
by scanning the bar codes of the implant tags in
the operation room in most participating facilities.
It was also possible to enter the information man-
ually via the web interface. However, data quality
was reduced and caused substantial time-inten-
sive data-cleaning. Therefore, manual data entry of
implants is now restricted to multiple choice drop-
down menus containing only registered implants,
instead of free manual entry. New implants may be
registered by SwissRDL on demand by SIRIS user or
upon notification by producer.
The clinical data of the SIRIS registry is stored on
dedicated servers at the University of Bern. Swiss-
RDL is able to leverage the IT infrastructure of the
ISPM and the data protection resources of the uni-
versity. The ISPM IT team is managing roughly 30
physical servers and 120 virtual servers.
The clinical data of SIRIS is stored physically sepa-
rated from the patient identifying information (e.g.
medical record number, name and date of birth),
which is stored on a specific module server. The
identifying information is encrypted into a salted
hash code, which allows patients who receive the
revision of the primary implantation at a different
health facility to be identified. This is needed for the
calculation of revision rates and for continuous fol-
low-up of the implants.
In order to estimate the number of patients at risk of
revision, all patients from SIRIS are cross-checked
with the database of the Swiss Central Compensa-
tion Office (ZAS Geneva) and the Federal Statistical
Office (FSO Neuchâtel). Whether somebody has died
could only be verified until the end of 2017, as the
FSO has not published the data for 2018 yet. Only
patients confirmed alive and residing in Switzerland
were considered “at risk”. Patients who died or emi-
grated during the observation period were account-
ed for proportionally in terms of the number of days
until emigration or death. Only 4% had unknown
status or were foreigners operated on in Switzerland
but not registered in ZAS. Those patients were con-
sidered lost to follow-up and subsequently excluded
from the analysis of revision rates.
SwissRDL data protection was audited recently to
ensure compliance with current standards. The
methodology of splitting the clinical from the pa-
tient identifying information was reviewed and ap-
proved by data protection delegates (from the can-
ton of Bern and from the federal authority). Patients
must provide written informed consent before data
are entered into SIRIS. They have the right to with-
draw, to see what is stored and to have their data
deleted completely.
SIRIS Report 2019 Page 17
2.2 Data quality and completeness
Data for this report were exported from the database
on May 1, 2019. The consistency and completeness
of SIRIS data is checked through systematic soft-
ware-generated validation tests of received data
and a rollback in case of errors. This means that data
entered in the registry is checked both for complete-
ness and plausibility. For example, when a case of
developmental hip dysplasia is entered, the system
automatically checks that subsequent items on the
questionnaire relevant for this pathology are com-
pleted and plausible. Error messages are displayed
if the system detects missing or implausible infor-
mation, and only fully completed forms can be saved
and submitted to the central database.
Two case report form (CRF) versions have been used
in SIRIS. The first version was used between 2012
and 2014. Since January 2015, an updated version
has been used. It includes some changes in the
definition of existing variables (particularly for the
arthroplasty of the knee), and some new variables
were added, most notably the body mass index (BMI)
and the morbidity state (ASA). The latter allows the
answer “unknown”, which was inconsistently used
across hospital service providers, including one ser-
vice reporting unknown ASA status in almost all cas-
es. Close monitoring of the hospitals will be set in
place to reduce missing values, for example for BMI
and ASA.
2.3 Coverage
To estimate the coverage of SIRIS, we compared the
annual numbers of cases reported in the registry
with those available in the Swiss hospital discharge
master file of the Federal Statistical Office (FSO). This
encompasses a complete survey of all annual hospi-
tal discharges in Switzerland. Each entry represents
a hospital discharge of a person residing in Switzer-
land and includes information about the patient’s
socio-demographic characteristics, diagnosis and
treatment. This is the only available reference data
set in Switzerland that could have been used to esti-
mate the coverage of the SIRIS register. Because the
FSO will release the data for 2018 after the closure of
the SIRIS 2019 Report, we could perform the cover-
age analysis only for 2017. The analysis is restricted
to primary hip and knee implantations for any rea-
son except fractures.
In the Swiss hospital discharge master file, cases of
an arthroplasty surgery are identified using CH-IQI
quality indicators (Version 4.2). Detailed definitions
may be found here (in German, French and Italian):
https://www.bag.admin.ch/bag/de/home/zahlen-
und-statistiken.
Codes I.1.8.M, I.1.10.M, and I.1.21.M have been
used to identify primary hip prostheses. Codes
I.1.15.M, I.1.16.M, and I.1.21.M have been used to
identify knee prostheses.
The overall coverage of SIRIS in 2017 was 89.4% for
THA and 87.8% for TKA. Note that different sources
of information have been used for this estimation
and the case definition for FSO and SIRIS are not
identical (e.g. operations on both sides, or primary
and revision operation in one hospital stay). Nev-
ertheless, the coverage figures are confident. FSO
data contains information about the hospital unit
that performed the operation, and this allows anal-
ysis of coverage on the level of single unit. However,
hospital mergers along with different definitions of
units registered in SIRIS leads to figures over 100%
Page 18 SIRIS Report 2019
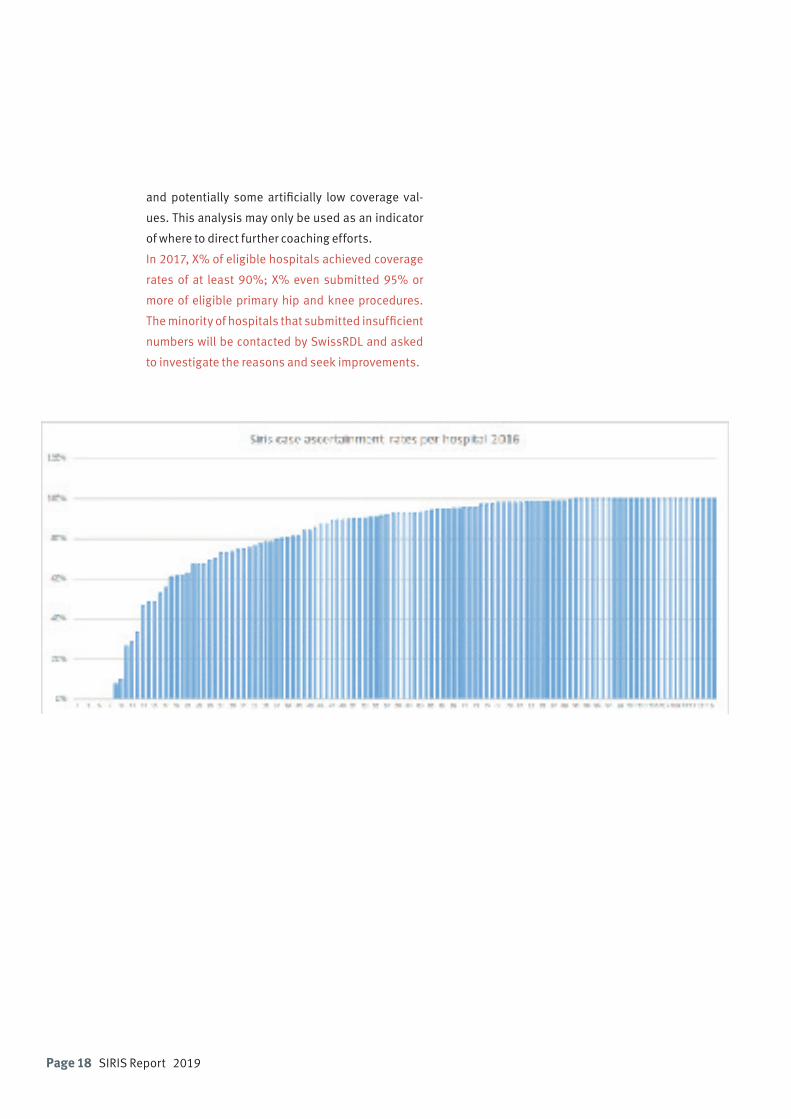
and potentially some artificially low coverage val-
ues. This analysis may only be used as an indicator
of where to direct further coaching efforts.
In 2017, X% of eligible hospitals achieved coverage
rates of at least 90%; X% even submitted 95% or
more of eligible primary hip and knee procedures.
The minority of hospitals that submitted insufficient
numbers will be contacted by SwissRDL and asked
to investigate the reasons and seek improvements.
SIRIS Report 2019 Page 19
3. Overview of the SIRIS report 2019
3.1 Demography and hip and knee surgery
Since its inception in 2012, SIRIS has registered more
than 200,000 primary hip and knee procedures and
nearly 30,000 revisions. The absolute number of hip
procedures in particular has been growing steadily,
with annual growth rates since 2013 averaging more
than 2%. In this report we take a closer look at the
development of relative figures. As the Swiss popu-
lation is aging fast, it is apparent that the increases
in both main procedures are broadly in line with the
increase of the population most at risk of needing
those procedures; that is 50 to 89 year olds. It should
be noted, however, that these figures only include
procedures registered in SIRIS and that the regis-
try’s coverage is still incomplete. The actual annual
incidence rates for Switzerland are slightly higher.
The comparison of the incidence of implantation of
prosthesis with incidences in other healthcare sys-
tems can be difficult, and interpretations must be
made cautiously. It usually is presented as a fraction
where the counter shows the number of all pros-
theses implanted during a given period and the de-
nominator defining the base to which the counter is
analyzed. The problem is that the denominator can
be very variable between reports and calculations.
Therefore, this report presents two calculations with
different denominators.
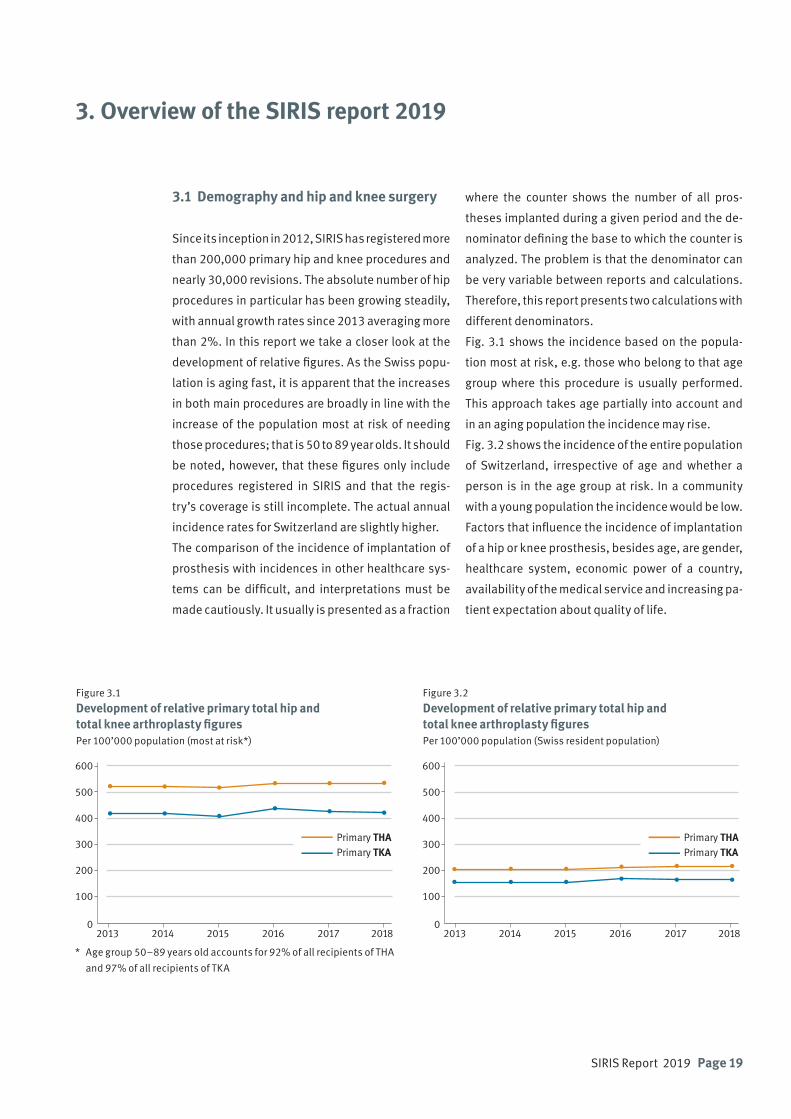
Fig. 3.1 shows the incidence based on the popula-
tion most at risk, e.g. those who belong to that age
group where this procedure is usually performed.
This approach takes age partially into account and
in an aging population the incidence may rise.
Fig. 3.2 shows the incidence of the entire population
of Switzerland, irrespective of age and whether a
person is in the age group at risk. In a community
with a young population the incidence would be low.
Factors that influence the incidence of implantation
of a hip or knee prosthesis, besides age, are gender,
healthcare system, economic power of a country,
availability of the medical service and increasing pa-
tient expectation about quality of life.
Figure 3.1 Development of relative primary total hip and total knee arthroplasty figures Per 100’000 population (most at risk*)
Figure 3.2 Development of relative primary total hip and total knee arthroplasty figuresPer 100’000 population (Swiss resident population)
2013 2014 2015 2016 2017 20180
100
200
300
400
500
600
Primary THA Primary TKA
* Age group 50–89 years old accounts for 92% of all recipients of THA
and 97% of all recipients of TKA
2013 2014 2015 2016 2017 20180
100
200
300
400
500
600
Primary THA Primary TKA
Page 20 SIRIS Report 2019
Year Primary total
Revision* total
Total
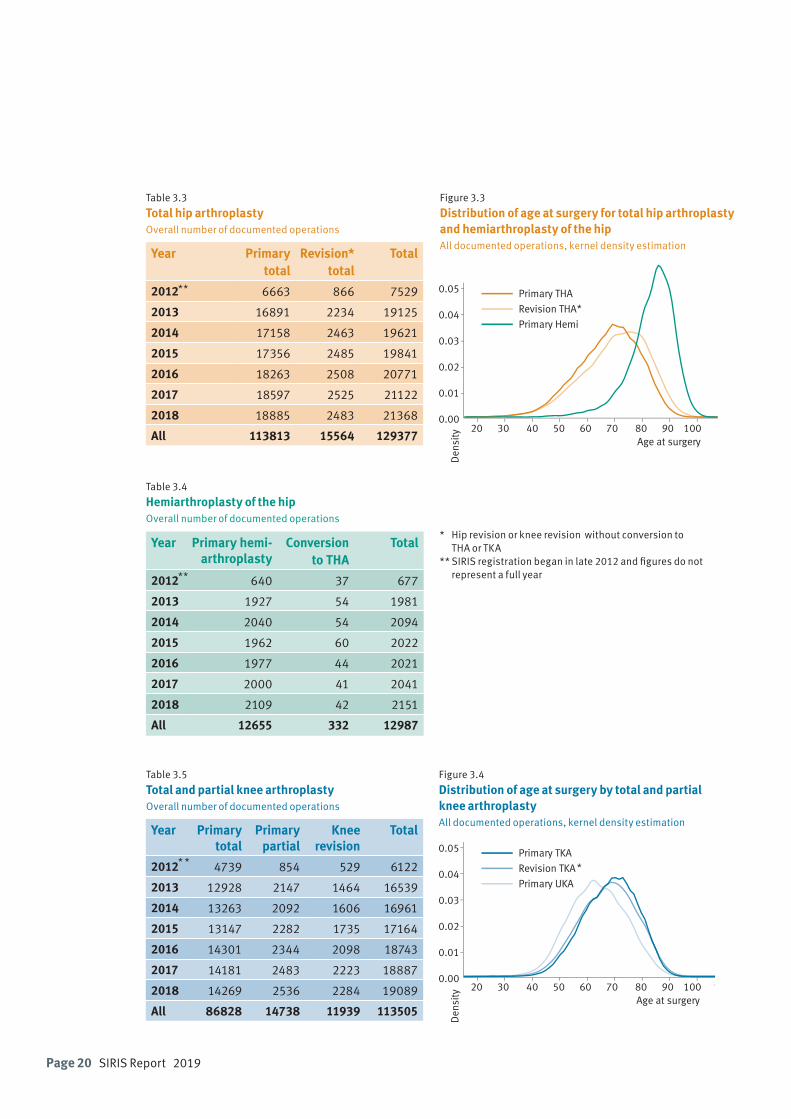
2012 6663 866 7529
2013 16891 2234 19125
2014 17158 2463 19621
2015 17356 2485 19841
2016 18263 2508 20771
2017 18597 2525 21122
2018 18885 2483 21368
All 113813 15564 129377
Table 3.3 Total hip arthroplasty Overall number of documented operations
Table 3.5
Total and partial knee arthroplastyOverall number of documented operations
Year Primary total
Primary partial
Knee revision
Total
2012 4739 854 529 6122
2013 12928 2147 1464 16539
2014 13263 2092 1606 16961
2015 13147 2282 1735 17164
2016 14301 2344 2098 18743
2017 14181 2483 2223 18887
2018 14269 2536 2284 19089
All 86828 14738 11939 113505
Table 3.4
Hemiarthroplasty of the hip Overall number of documented operations
Year Primary hemi-arthroplasty
Conversion to THA
Total
2012 640 37 677
2013 1927 54 1981
2014 2040 54 2094
2015 1962 60 2022
2016 1977 44 2021
2017 2000 41 2041
2018 2109 42 2151
All 12655 332 12987
Figure 3.3 Distribution of age at surgery for total hip arthroplasty and hemiarthroplasty of the hipAll documented operations, kernel density estimation
Figure 3.4
Distribution of age at surgery by total and partial knee arthroplastyAll documented operations, kernel density estimation
Age at surgeryD
ensi
ty 20 30 40 50 60 70 80 90 100 0.00
0.01
0.02
0.03
0.04
0.05 Primary THA
Revision THA
Primary Hemi
Age at surgery
Den
sity
20 30 40 50 60 70 80 90 100 1100.00
0.01
0.02
0.03
0.04
0.05 Primary TKA
Revision TKA
Primary UKA
* Hip revision or knee revision without conversion to THA or TKA** SIRIS registration began in late 2012 and figures do not represent a full year
**
**
* *
*
*
SIRIS Report 2019 Page 21
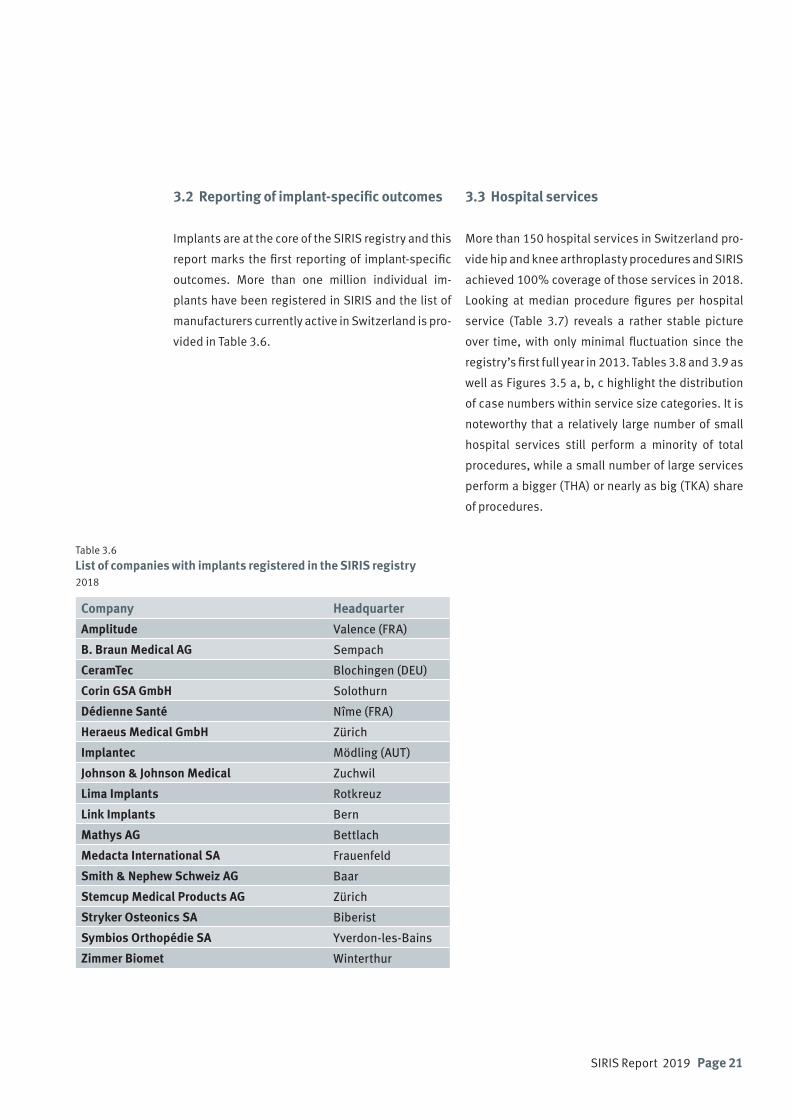
Company Headquarter
Amplitude Valence (FRA)
B. Braun Medical AG Sempach
CeramTec Blochingen (DEU)
Corin GSA GmbH Solothurn
Dédienne Santé Nîme (FRA)
Heraeus Medical GmbH Zürich
Implantec Mödling (AUT)
Johnson & Johnson Medical Zuchwil
Lima Implants Rotkreuz
Link Implants Bern
Mathys AG Bettlach
Medacta International SA Frauenfeld
Smith & Nephew Schweiz AG Baar
Stemcup Medical Products AG Zürich
Stryker Osteonics SA Biberist
Symbios Orthopédie SA Yverdon-les-Bains
Zimmer Biomet Winterthur
Table 3.6 List of companies with implants registered in the SIRIS registry 2018
3.2 Reporting of implant-specific outcomes
Implants are at the core of the SIRIS registry and this
report marks the first reporting of implant-specific
outcomes. More than one million individual im-
plants have been registered in SIRIS and the list of
manufacturers currently active in Switzerland is pro-
vided in Table 3.6.
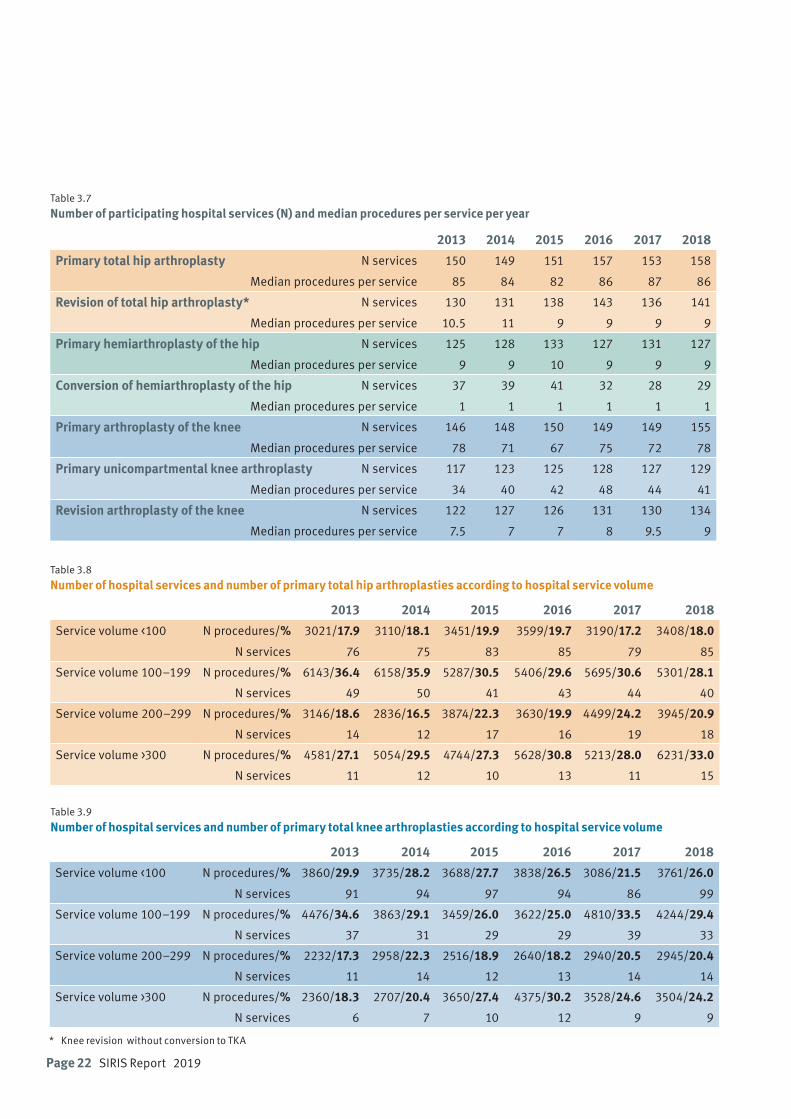
3.3 Hospital services
More than 150 hospital services in Switzerland pro-
vide hip and knee arthroplasty procedures and SIRIS
achieved 100% coverage of those services in 2018.
Looking at median procedure figures per hospital
service (Table 3.7) reveals a rather stable picture
over time, with only minimal fluctuation since the
registry’s first full year in 2013. Tables 3.8 and 3.9 as
well as Figures 3.5 a, b, c highlight the distribution
of case numbers within service size categories. It is
noteworthy that a relatively large number of small
hospital services still perform a minority of total
procedures, while a small number of large services
perform a bigger (THA) or nearly as big (TKA) share
of procedures.
Page 22 SIRIS Report 2019
Table 3.7
Number of participating hospital services (N) and median procedures per service per year
2013 2014 2015 2016 2017 2018
Primary total hip arthroplasty N services 150 149 151 157 153 158
Median procedures per service 85 84 82 86 87 86
Revision of total hip arthroplasty* N services 130 131 138 143 136 141
Median procedures per service 10.5 11 9 9 9 9
Primary hemiarthroplasty of the hip N services 125 128 133 127 131 127
Median procedures per service 9 9 10 9 9 9
Conversion of hemiarthroplasty of the hip N services 37 39 41 32 28 29
Median procedures per service 1 1 1 1 1 1
Primary arthroplasty of the knee N services 146 148 150 149 149 155
Median procedures per service 78 71 67 75 72 78
Primary unicompartmental knee arthroplasty N services 117 123 125 128 127 129
Median procedures per service 34 40 42 48 44 41
Revision arthroplasty of the knee N services 122 127 126 131 130 134
Median procedures per service 7.5 7 7 8 9.5 9
Table 3.9
Number of hospital services and number of primary total knee arthroplasties according to hospital service volume
2013 2014 2015 2016 2017 2018
Service volume <100 N procedures/% 3860/29.9 3735/28.2 3688/27.7 3838/26.5 3086/21.5 3761/26.0
N services 91 94 97 94 86 99
Service volume 100–199 N procedures/% 4476/34.6 3863/29.1 3459/26.0 3622/25.0 4810/33.5 4244/29.4
N services 37 31 29 29 39 33
Service volume 200–299 N procedures/% 2232/17.3 2958/22.3 2516/18.9 2640/18.2 2940/20.5 2945/20.4
N services 11 14 12 13 14 14
Service volume >300 N procedures/% 2360/18.3 2707/20.4 3650/27.4 4375/30.2 3528/24.6 3504/24.2
N services 6 7 10 12 9 9
Table 3.8
Number of hospital services and number of primary total hip arthroplasties according to hospital service volume
2013 2014 2015 2016 2017 2018
Service volume <100 N procedures/% 3021/17.9 3110/18.1 3451/19.9 3599/19.7 3190/17.2 3408/18.0
N services 76 75 83 85 79 85
Service volume 100–199 N procedures/% 6143/36.4 6158/35.9 5287/30.5 5406/29.6 5695/30.6 5301/28.1
N services 49 50 41 43 44 40
Service volume 200–299 N procedures/% 3146/18.6 2836/16.5 3874/22.3 3630/19.9 4499/24.2 3945/20.9
N services 14 12 17 16 19 18
Service volume >300 N procedures/% 4581/27.1 5054/29.5 4744/27.3 5628/30.8 5213/28.0 6231/33.0
N services 11 12 10 13 11 15
* Knee revision without conversion to TKA

SIRIS Report 2019 Page 23
Figures 3.5 a, b and c
Cases per hospital service 2018
3.5aTotal hiparthroplasty
3.5bHemiarthroplastyof the hip
3.5cTotal knee arthroplasty
0
200
400
600
800
1000Ca
ses
Hospital service
Hip revision
Hip primary
0
200
400
600
800
1000
Case
s
Hospital service
Knee revisionKnee primary
0
30
60
90
120
150
Case
s
Hospital service
ConversionPrimary
Page 24 SIRIS Report 2019
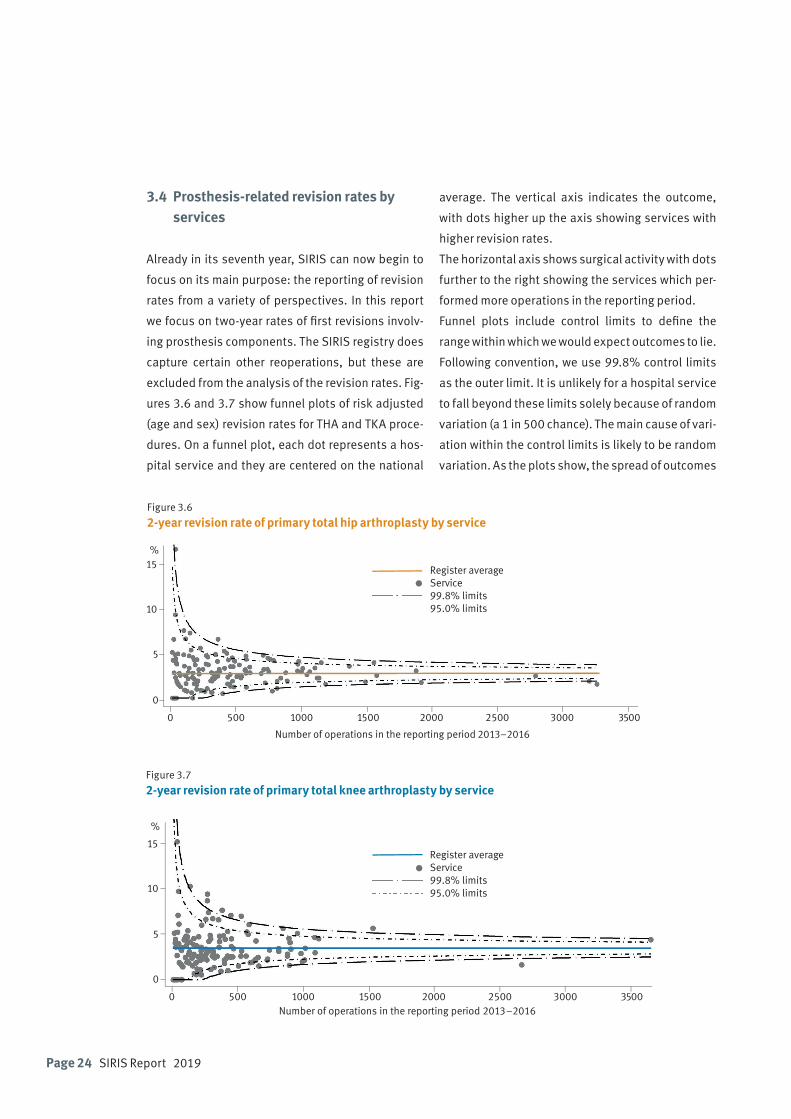
Figure 3.6
2-year revision rate of primary total hip arthroplasty by service
Figure 3.7
2-year revision rate of primary total knee arthroplasty by service
3.4 Prosthesis-related revision rates by services
Already in its seventh year, SIRIS can now begin to
focus on its main purpose: the reporting of revision
rates from a variety of perspectives. In this report
we focus on two-year rates of first revisions involv-
ing prosthesis components. The SIRIS registry does
capture certain other reoperations, but these are
excluded from the analysis of the revision rates. Fig-
ures 3.6 and 3.7 show funnel plots of risk adjusted
(age and sex) revision rates for THA and TKA proce-
dures. On a funnel plot, each dot represents a hos-
pital service and they are centered on the national
average. The vertical axis indicates the outcome,
with dots higher up the axis showing services with
higher revision rates.
The horizontal axis shows surgical activity with dots
further to the right showing the services which per-
formed more operations in the reporting period.
Funnel plots include control limits to define the
range within which we would expect outcomes to lie.
Following convention, we use 99.8% control limits
as the outer limit. It is unlikely for a hospital service
to fall beyond these limits solely because of random
variation (a 1 in 500 chance). The main cause of vari-
ation within the control limits is likely to be random
variation. As the plots show, the spread of outcomes
0 500 1000 1500 2000 2500 3000 3500
5
0
10
15%
Number of operations in the reporting period 2013–2016
Register averageService99.8% limits95.0% limits
0 500 1000 1500 2000 2500 3000 3500
5
0
10
15
%
Number of operations in the reporting period 2013–2016
Register averageService99.8% limits95.0% limits
SIRIS Report 2019 Page 25
in Switzerland is relatively homogeneous, but there
are exceptions, and there appears to be more varia-
tion in knee than in hip procedures.
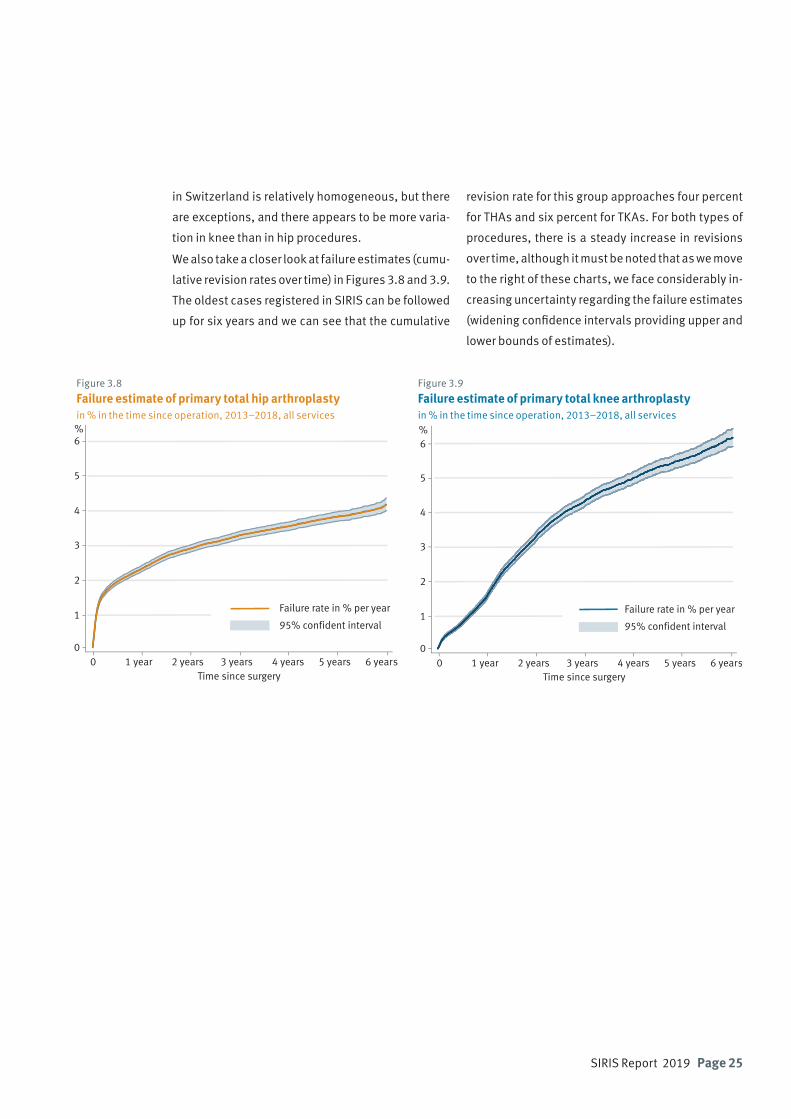
We also take a closer look at failure estimates (cumu-
lative revision rates over time) in Figures 3.8 and 3.9.
The oldest cases registered in SIRIS can be followed
up for six years and we can see that the cumulative
revision rate for this group approaches four percent
for THAs and six percent for TKAs. For both types of
procedures, there is a steady increase in revisions
over time, although it must be noted that as we move
to the right of these charts, we face considerably in-
creasing uncertainty regarding the failure estimates
(widening confidence intervals providing upper and
lower bounds of estimates).
Figure 3.8
Failure estimate of primary total hip arthroplasty in % in the time since operation, 2013–2018, all services
Figure 3.9
Failure estimate of primary total knee arthroplasty in % in the time since operation, 2013–2018, all services
0 1 year 2 years 3 years 4 years 5 years 6 years
1
0
2
3
4
5
6%
Time since surgery
Failure rate in % per year
95% confident interval1
0
2
3
4
5
6%
Time since surgery
Failure rate in % per year
95% confident interval
0 1 year 2 years 3 years 4 years 5 years 6 years

Page 26 SIRIS Report 2019

SIRIS Report 2019 Page 27
4.1 Primary total hip arthroplasty
The SIRIS registry has documented the implantation
of 107,150 primary total hip arthroplasties (THA)
over the past six years (Table 4.1). Implantation is
slightly more frequent in women (52.8%), and their
mean age of 68.4 years is higher than in men (66.4
years).
4. Hip arthroplasty
The majority are implanted at between 55 and 84
years of age, covering 81.3% of all implants. Only
6.4% are implanted in patients older than 85 years.
Patients younger than 55 years constitute 12.3%
of the recipients. The distribution among the age
groups remained stable during the observation pe-
riod.
Table 4.1
Primary total hip arthroplasty: Baseline patient characteristics by year2013–2018. BMI and ASA class data only available from 2015 onwards
2013 2014 2015 2016 2017 2018 AllN 16891 17158 17356 18263 18597 18885 107150
Diagnosis [%] Primary OA 85.4 85.6 84.3 83.4 84 83.9 84.4
Secondary OA 9 8.2 9.4 10.1 9.5 9.2 9.2
Fracture 5.6 6.2 6.3 6.5 6.5 6.9 6.3
Women [%] 52.3 52.5 52.6 52.9 53.1 53.1 52.8
Mean age (SD) All 67.9 (12.1) 68.3 (12.2) 68.6 (11.6) 68.4 (11.6) 68.5 (11.6) 68.9 (11.5) 68.4 (11.8)
Women 69.7 (11.8) 70 (11.9) 70.4 (11.3) 70.2 (11.2) 70.3 (11.3) 70.6 (11.2) 70.2 (11.4)
Men 65.9 (12.1) 66.4 (12.2) 66.6 (11.7) 66.4 (11.6) 66.5 (11.6) 66.9 (11.6) 66.4 (11.8)
Age group [%] <45 3.3 3.2 2.6 2.8 2.7 2.3 2.8
45–54 9.9 9.2 9.8 9.5 9.4 9.3 9.5
55–64 22 21.3 21.2 21.5 21.9 21.7 21.6
65–74 33.5 33.4 33.6 34.2 33.5 32.6 33.5
75–84 25.5 26.6 26.2 25.7 26.1 27.1 26.2
85+ 5.8 6.2 6.6 6.3 6.4 7 6.4
N unknown BMI (%) 4482 (26) 3783 (21) 3336 (18) 3055 (16) 14656 (20)N known BMI 12874 14480 15261 15830 58445Mean BMI (SD) 27.1 (5) 27.2 (5.4) 27.1 (5.1) 27.2 (5.5) 27.1 (5.3)BMI [%] <18.5 1.8 1.8 1.8 2.1 1.9
18.5–24.9 35.1 34.9 35.4 34.8 35
25–29.9 38.9 39.2 38.9 38.2 38.8
30–34.9 17.1 17.4 17.1 17.5 17.3
35–39.9 5.4 4.9 5.2 5.4 5.2
40+ 1.7 1.7 1.7 2 1.8
N unknown ASA (%) 2393 (14) 2226 (12) 2014 (11) 1786 (9) 8419 (12)N known ASA 14963 16037 16583 17099 64682
Morbidity ASA 1 16.4 14.7 13.3 11.9 14
state [%] ASA 2 58.2 59.5 60 59.6 59.4
ASA 3 24.8 25 26 27.6 25.9
ASA 4/5 0.6 0.8 0.6 0.9 0.7
Primary total hip arthroplasty
Page 28 SIRIS Report 2019
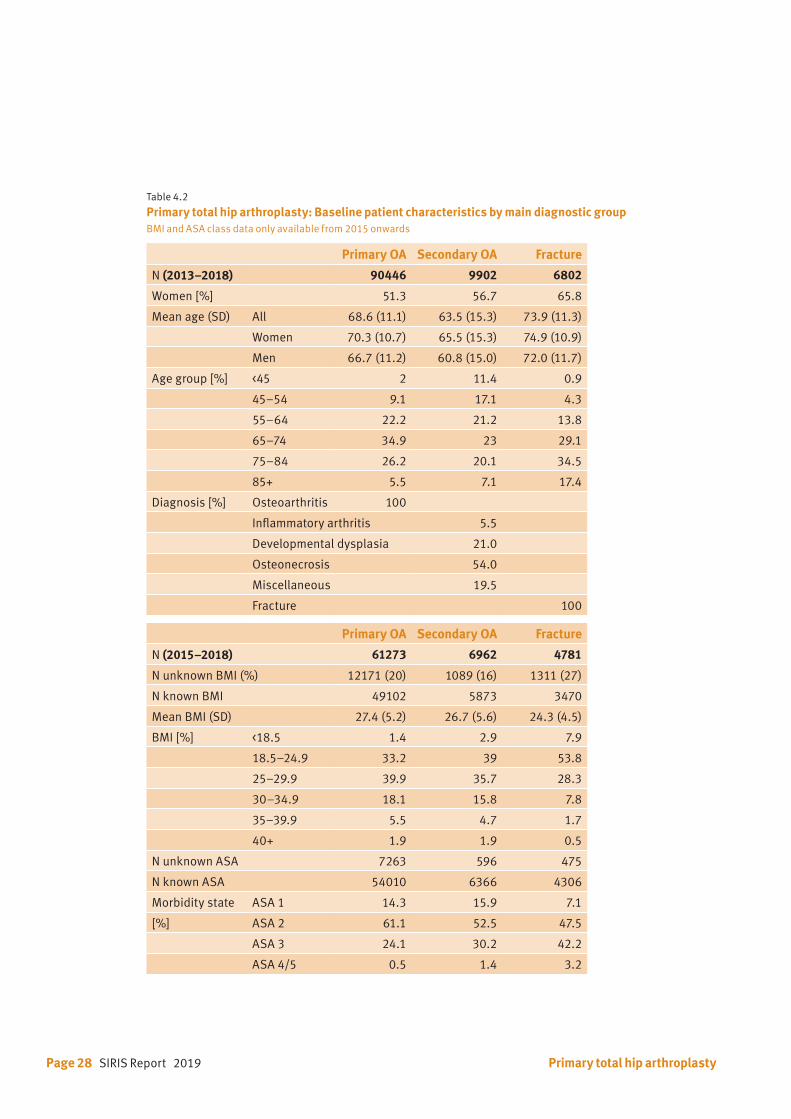
Table 4.2 Primary total hip arthroplasty: Baseline patient characteristics by main diagnostic groupBMI and ASA class data only available from 2015 onwards
Primary OA Secondary OA Fracture
N (2013–2018) 90446 9902 6802
Women [%] 51.3 56.7 65.8
Mean age (SD) All 68.6 (11.1) 63.5 (15.3) 73.9 (11.3)
Women 70.3 (10.7) 65.5 (15.3) 74.9 (10.9)
Men 66.7 (11.2) 60.8 (15.0) 72.0 (11.7)
Age group [%] <45 2 11.4 0.9
45–54 9.1 17.1 4.3
55–64 22.2 21.2 13.8
65–74 34.9 23 29.1
75–84 26.2 20.1 34.5
85+ 5.5 7.1 17.4
Diagnosis [%] Osteoarthritis 100
Inflammatory arthritis 5.5
Developmental dysplasia 21.0
Osteonecrosis 54.0
Miscellaneous 19.5
Fracture 100
Primary OA Secondary OA Fracture
N (2015–2018) 61273 6962 4781
N unknown BMI (%) 12171 (20) 1089 (16) 1311 (27)
N known BMI 49102 5873 3470
Mean BMI (SD) 27.4 (5.2) 26.7 (5.6) 24.3 (4.5)
BMI [%] <18.5 1.4 2.9 7.9
18.5–24.9 33.2 39 53.8
25–29.9 39.9 35.7 28.3
30–34.9 18.1 15.8 7.8
35–39.9 5.5 4.7 1.7
40+ 1.9 1.9 0.5
N unknown ASA 7263 596 475
N known ASA 54010 6366 4306
Morbidity state ASA 1 14.3 15.9 7.1
[%] ASA 2 61.1 52.5 47.5
ASA 3 24.1 30.2 42.2
ASA 4/5 0.5 1.4 3.2
Primary total hip arthroplasty
SIRIS Report 2019 Page 29
Age at surgery 20 30 40 50 60 70 80 90 100 110
0.01
0.02
0.03
0.04
Den
sity
BMI*
<18.5
18.5–24.9
25–29.9
30–34.9
35–39.9
40+
The registry differentiates between THAs performed
for primary osteoarthritis (84.4%) being the largest
group and implantations done for treatment of sec-
ondary osteoarthrosis, including post-traumatic hip
joint degeneration, avascular necrosis and sequels
of childhood diseases like dysplasia and perthes
(9.2%). The third group includes implantation of
THAs in fractures of the hip (6.3%).
In general, the revision rate of a specific implant,
hospital or surgeon is calculated based on hips
treated for primary osteoarthrosis. For benchmark-
ing, only primary THAs for primary osteoarthrosis
are included in the calculations.
BMI and ASA score have been recorded since 2015.
The documentation has improved over time. In the
first year of recording 34.8% of the BMI data were
missing. This has improved although 19.3% of BMI
data are still missing. This is important, because the
previous report has shown an increase of the revi-
sion rate with increasing BMI. The situation is less
deficient for the ASA score. The documentation has
improved from missing data of 15.9% in 2015 to
10.4% in 2018.
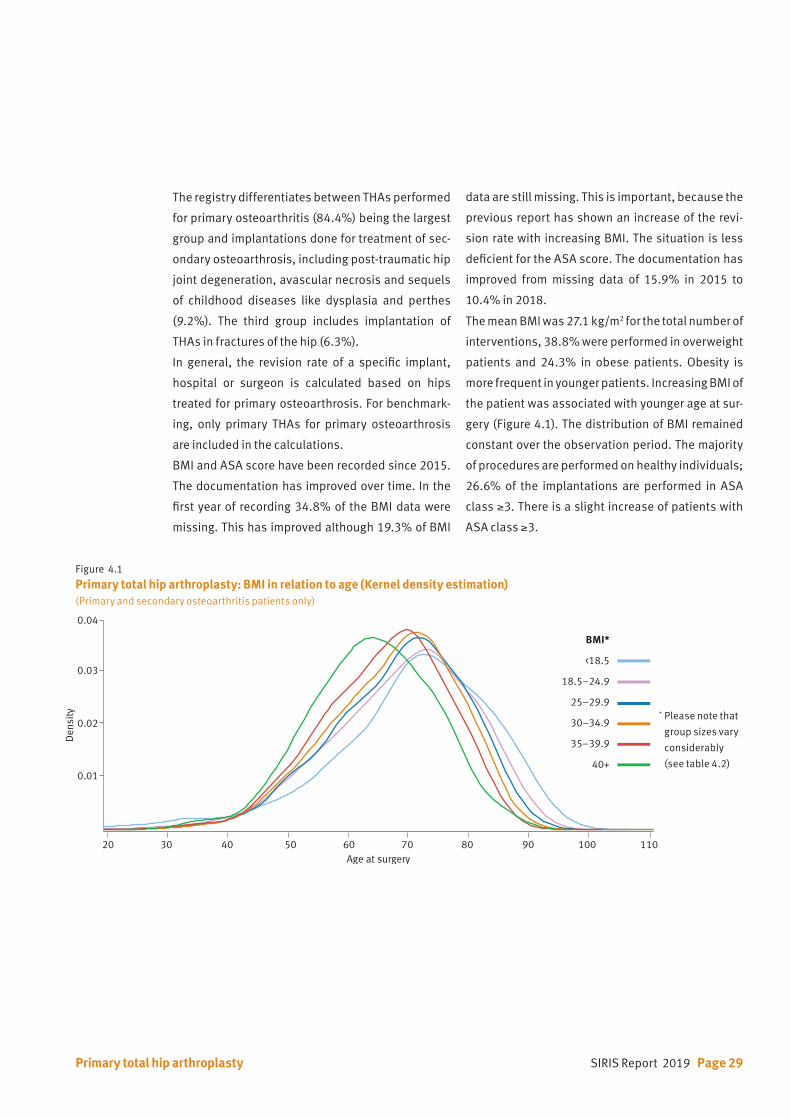
The mean BMI was 27.1 kg/m2 for the total number of
interventions, 38.8% were performed in overweight
patients and 24.3% in obese patients. Obesity is
more frequent in younger patients. Increasing BMI of
the patient was associated with younger age at sur-
gery (Figure 4.1). The distribution of BMI remained
constant over the observation period. The majority
of procedures are performed on healthy individuals;
26.6% of the implantations are performed in ASA
class ≥3. There is a slight increase of patients with
ASA class ≥3.
Figure 4.1
Primary total hip arthroplasty: BMI in relation to age (Kernel density estimation)(Primary and secondary osteoarthritis patients only)
Primary total hip arthroplasty
* Please note that
group sizes vary
considerably
(see table 4.2)
Page 30 SIRIS Report 2019
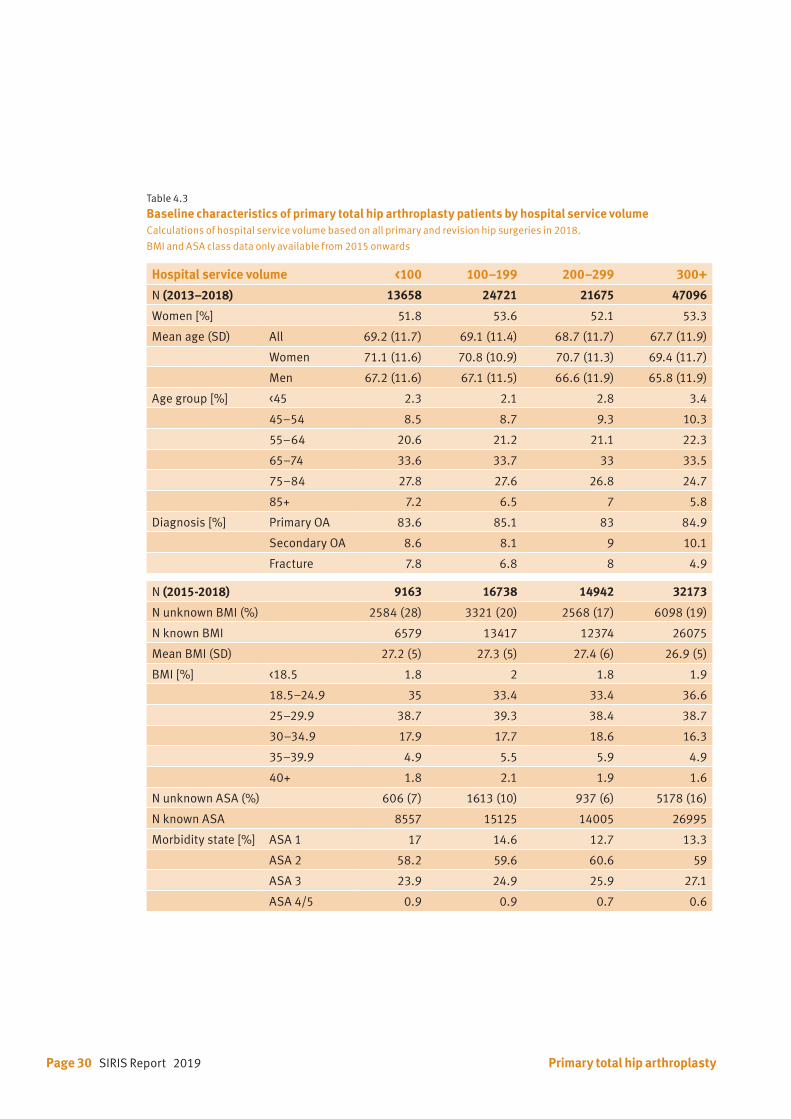
Table 4.3
Baseline characteristics of primary total hip arthroplasty patients by hospital service volumeCalculations of hospital service volume based on all primary and revision hip surgeries in 2018.
BMI and ASA class data only available from 2015 onwards
Hospital service volume <100 100–199 200–299 300+
N (2013–2018) 13658 24721 21675 47096
Women [%] 51.8 53.6 52.1 53.3
Mean age (SD) All 69.2 (11.7) 69.1 (11.4) 68.7 (11.7) 67.7 (11.9)
Women 71.1 (11.6) 70.8 (10.9) 70.7 (11.3) 69.4 (11.7)
Men 67.2 (11.6) 67.1 (11.5) 66.6 (11.9) 65.8 (11.9)
Age group [%] <45 2.3 2.1 2.8 3.4
45–54 8.5 8.7 9.3 10.3
55–64 20.6 21.2 21.1 22.3
65–74 33.6 33.7 33 33.5
75–84 27.8 27.6 26.8 24.7
85+ 7.2 6.5 7 5.8
Diagnosis [%] Primary OA 83.6 85.1 83 84.9
Secondary OA 8.6 8.1 9 10.1
Fracture 7.8 6.8 8 4.9
N (2015-2018) 9163 16738 14942 32173
N unknown BMI (%) 2584 (28) 3321 (20) 2568 (17) 6098 (19)
N known BMI 6579 13417 12374 26075
Mean BMI (SD) 27.2 (5) 27.3 (5) 27.4 (6) 26.9 (5)
BMI [%] <18.5 1.8 2 1.8 1.9
18.5–24.9 35 33.4 33.4 36.6
25–29.9 38.7 39.3 38.4 38.7
30–34.9 17.9 17.7 18.6 16.3
35–39.9 4.9 5.5 5.9 4.9
40+ 1.8 2.1 1.9 1.6
N unknown ASA (%) 606 (7) 1613 (10) 937 (6) 5178 (16)
N known ASA 8557 15125 14005 26995
Morbidity state [%] ASA 1 17 14.6 12.7 13.3
ASA 2 58.2 59.6 60.6 59
ASA 3 23.9 24.9 25.9 27.1
ASA 4/5 0.9 0.9 0.7 0.6
Primary total hip arthroplasty
SIRIS Report 2019 Page 31
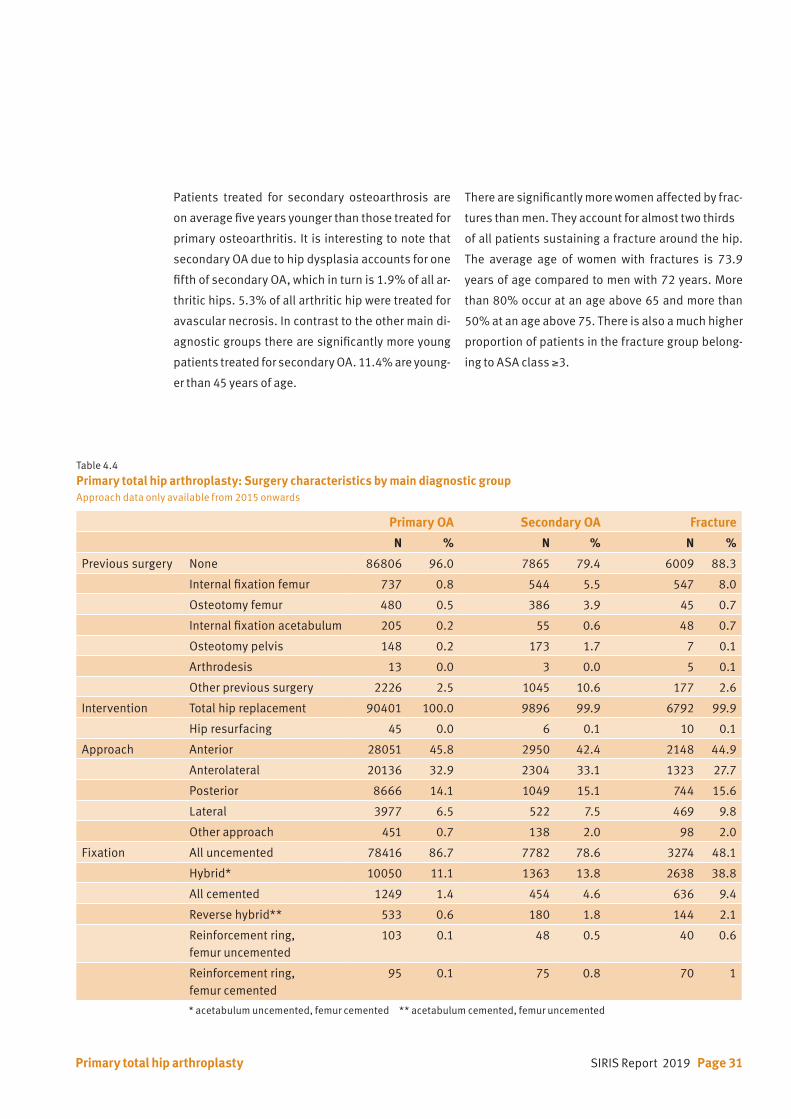
Table 4.4 Primary total hip arthroplasty: Surgery characteristics by main diagnostic groupApproach data only available from 2015 onwards
Primary OA Secondary OA Fracture
N % N % N %
Previous surgery None 86806 96.0 7865 79.4 6009 88.3
Internal fixation femur 737 0.8 544 5.5 547 8.0
Osteotomy femur 480 0.5 386 3.9 45 0.7
Internal fixation acetabulum 205 0.2 55 0.6 48 0.7
Osteotomy pelvis 148 0.2 173 1.7 7 0.1
Arthrodesis 13 0.0 3 0.0 5 0.1
Other previous surgery 2226 2.5 1045 10.6 177 2.6
Intervention Total hip replacement 90401 100.0 9896 99.9 6792 99.9
Hip resurfacing 45 0.0 6 0.1 10 0.1
Approach Anterior 28051 45.8 2950 42.4 2148 44.9
Anterolateral 20136 32.9 2304 33.1 1323 27.7
Posterior 8666 14.1 1049 15.1 744 15.6
Lateral 3977 6.5 522 7.5 469 9.8
Other approach 451 0.7 138 2.0 98 2.0
Fixation All uncemented 78416 86.7 7782 78.6 3274 48.1
Hybrid* 10050 11.1 1363 13.8 2638 38.8
All cemented 1249 1.4 454 4.6 636 9.4
Reverse hybrid** 533 0.6 180 1.8 144 2.1
Reinforcement ring, femur uncemented
103 0.1 48 0.5 40 0.6
Reinforcement ring, femur cemented
95 0.1 75 0.8 70 1
* acetabulum uncemented, femur cemented ** acetabulum cemented, femur uncemented
Primary total hip arthroplasty
Patients treated for secondary osteoarthrosis are
on average five years younger than those treated for
primary osteoarthritis. It is interesting to note that
secondary OA due to hip dysplasia accounts for one
fifth of secondary OA, which in turn is 1.9% of all ar-
thritic hips. 5.3% of all arthritic hip were treated for
avascular necrosis. In contrast to the other main di-
agnostic groups there are significantly more young
patients treated for secondary OA. 11.4% are young-
er than 45 years of age.
There are significantly more women affected by frac-
tures than men. They account for almost two thirds
of all patients sustaining a fracture around the hip.
The average age of women with fractures is 73.9
years of age compared to men with 72 years. More
than 80% occur at an age above 65 and more than
50% at an age above 75. There is also a much higher
proportion of patients in the fracture group belong-
ing to ASA class ≥3.
Page 32 SIRIS Report 2019
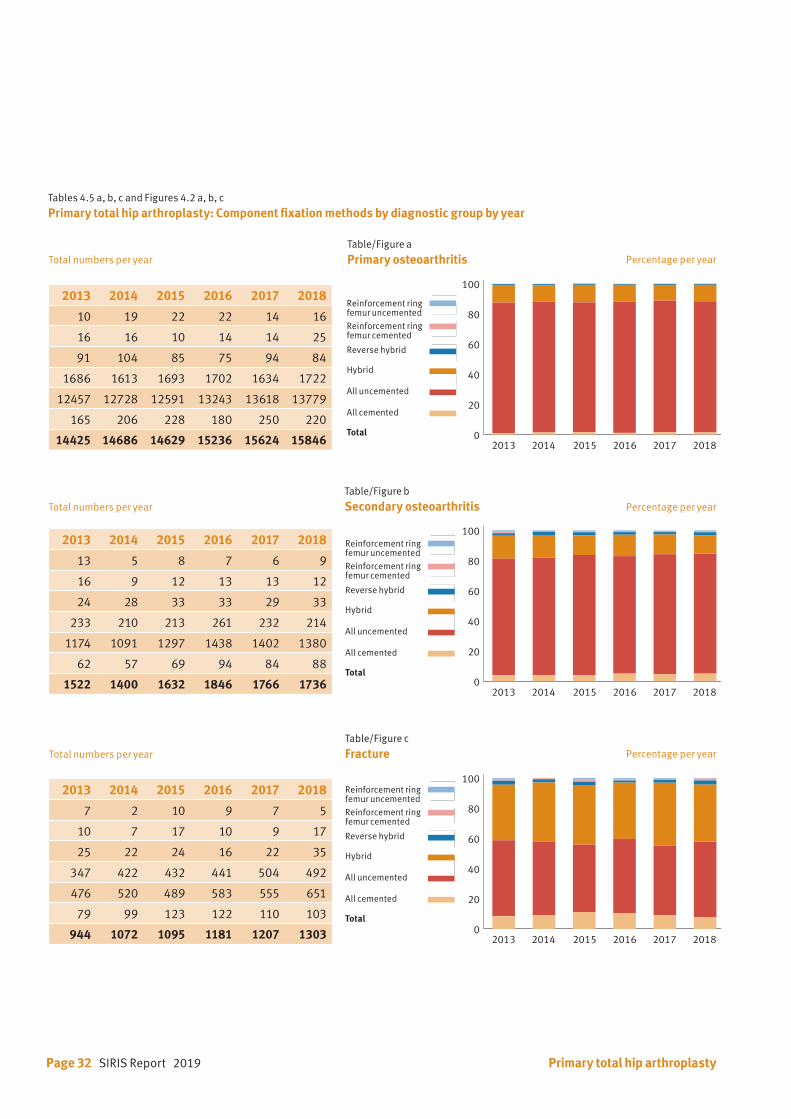
Tables 4.5 a, b, c and Figures 4.2 a, b, c
Primary total hip arthroplasty: Component fixation methods by diagnostic group by year
Table/Figure a Primary osteoarthritis
Table/Figure b Secondary osteoarthritis
Table/Figure c Fracture
2013 2014 2015 2016 2017 2018
10 19 22 22 14 16
16 16 10 14 14 25
91 104 85 75 94 84
1686 1613 1693 1702 1634 1722
12457 12728 12591 13243 13618 13779
165 206 228 180 250 220
14425 14686 14629 15236 15624 15846
2013 2014 2015 2016 2017 2018
13 5 8 7 6 9
16 9 12 13 13 12
24 28 33 33 29 33
233 210 213 261 232 214
1174 1091 1297 1438 1402 1380
62 57 69 94 84 88
1522 1400 1632 1846 1766 1736
2013 2014 2015 2016 2017 2018
7 2 10 9 7 5
10 7 17 10 9 17
25 22 24 16 22 35
347 422 432 441 504 492
476 520 489 583 555 651
79 99 123 122 110 103
944 1072 1095 1181 1207 1303
Reinforcement ringfemur uncemented
Reinforcement ringfemur cemented
Reverse hybrid
Hybrid
All uncemented
All cemented
Total
0
20
40
60
80
100
120
Reinforcement ring, femur uncemented
Reinforcement ring, femur cemented
Reverse hybrid
Hybrid
All uncemented
All cemented2012 2013 2014 2015 20160
20
40
60
80
100
120
Reinforcement ring, femur uncemented
Reinforcement ring, femur cemented
Reverse hybrid
Hybrid
All uncemented
All cemented2012 2013 2014 2015 20160
20
40
60
80
100
120
Reinforcement ring, femur uncemented
Reinforcement ring, femur cemented
Reverse hybrid
Hybrid
All uncemented
All cemented2012 2013 2014 2015 2016
Primary total hip arthroplasty
0
20
40
60
80
100
120reinforcement ring, femur uncem
reinforcement ring, femur cem
reverse hybrid
hybrid
all uncemented
all cemented
0
20
40
60
80
100
120
reinforcement ring, femur uncem
reinforcement ring, femur cem
reverse hybrid
hybrid
all uncemented
all cemented
0
20
40
60
80
100
120
reinforcement ring, femur uncem
reinforcement ring, femur cem
reverse hybrid
hybrid
all uncemented
all cemented
2013 2014 2015 2016 2017 2018
2013 2014 2015 2016 2017 2018
2013 2014 2015 2016 2017 2018
0
20
40
60
80
100
120reinforcement ring, femur uncem
reinforcement ring, femur cem
reverse hybrid
hybrid
all uncemented
all cemented
0
20
40
60
80
100
120
reinforcement ring, femur uncem
reinforcement ring, femur cem
reverse hybrid
hybrid
all uncemented
all cemented
0
20
40
60
80
100
120
reinforcement ring, femur uncem
reinforcement ring, femur cem
reverse hybrid
hybrid
all uncemented
all cemented
2013 2014 2015 2016 2017 2018
2013 2014 2015 2016 2017 2018
2013 2014 2015 2016 2017 2018
Total numbers per year
Total numbers per year
Total numbers per year
Percentage per year
Percentage per year
Percentage per year
SIRIS Report 2019 Page 33
Within minimal variations the percentage of the fixa-
tion methods have remained stable over the last five
years (Table 4.5, Figure 4.2) for all three diagnostic
groups. In the secondary OA group relatively more
acetabular reinforcement rings were used, reflect-
ing more complex surgery. For treatment of hip frac-
tures, significantly more stems are cemented and
there are more hybrid fixations.
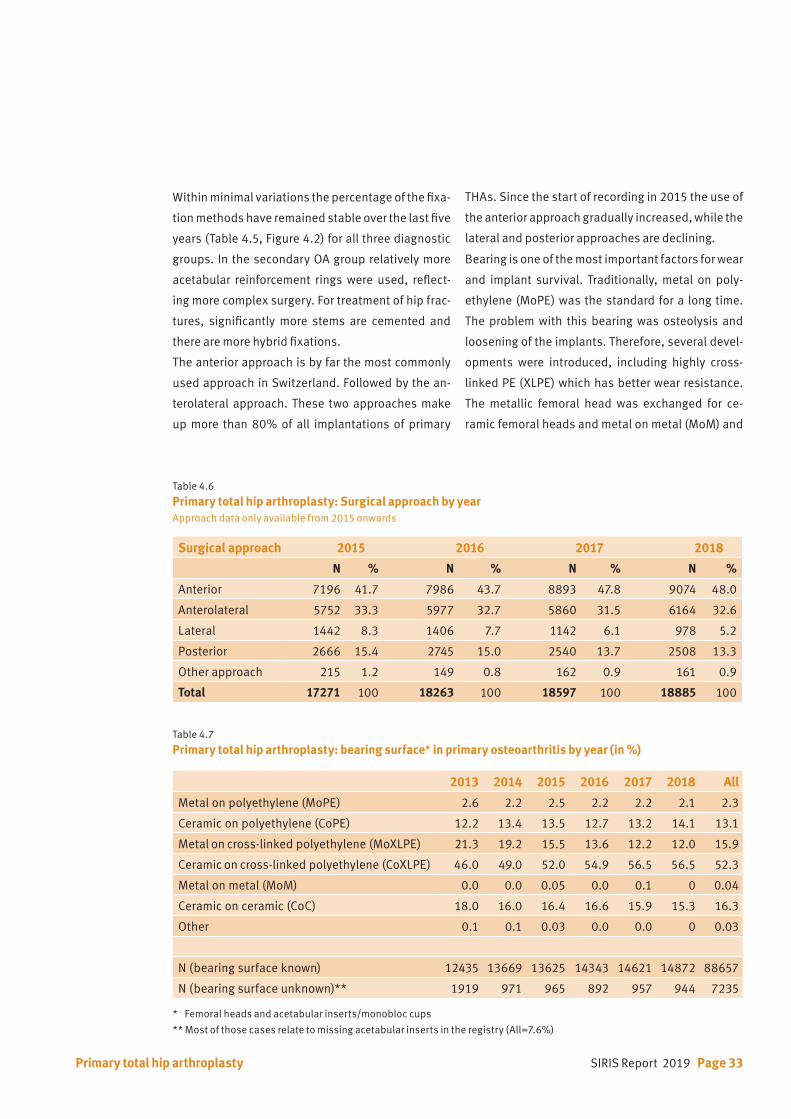
The anterior approach is by far the most commonly
used approach in Switzerland. Followed by the an-
terolateral approach. These two approaches make
up more than 80% of all implantations of primary
Surgical approach 2015 2016 2017 2018
N % N % N % N %
Anterior 7196 41.7 7986 43.7 8893 47.8 9074 48.0
Anterolateral 5752 33.3 5977 32.7 5860 31.5 6164 32.6
Lateral 1442 8.3 1406 7.7 1142 6.1 978 5.2
Posterior 2666 15.4 2745 15.0 2540 13.7 2508 13.3
Other approach 215 1.2 149 0.8 162 0.9 161 0.9
Total 17271 100 18263 100 18597 100 18885 100
2013 2014 2015 2016 2017 2018 All
Metal on polyethylene (MoPE) 2.6 2.2 2.5 2.2 2.2 2.1 2.3
Ceramic on polyethylene (CoPE) 12.2 13.4 13.5 12.7 13.2 14.1 13.1
Metal on cross-linked polyethylene (MoXLPE) 21.3 19.2 15.5 13.6 12.2 12.0 15.9
Ceramic on cross-linked polyethylene (CoXLPE) 46.0 49.0 52.0 54.9 56.5 56.5 52.3
Metal on metal (MoM) 0.0 0.0 0.05 0.0 0.1 0 0.04
Ceramic on ceramic (CoC) 18.0 16.0 16.4 16.6 15.9 15.3 16.3
Other 0.1 0.1 0.03 0.0 0.0 0 0.03
N (bearing surface known) 12435 13669 13625 14343 14621 14872 88657
N (bearing surface unknown)** 1919 971 965 892 957 944 7235
Table 4.6
Primary total hip arthroplasty: Surgical approach by yearApproach data only available from 2015 onwards
Table 4.7
Primary total hip arthroplasty: bearing surface* in primary osteoarthritis by year (in %)
THAs. Since the start of recording in 2015 the use of
the anterior approach gradually increased, while the
lateral and posterior approaches are declining.
Bearing is one of the most important factors for wear
and implant survival. Traditionally, metal on poly-
ethylene (MoPE) was the standard for a long time.
The problem with this bearing was osteolysis and
loosening of the implants. Therefore, several devel-
opments were introduced, including highly cross-
linked PE (XLPE) which has better wear resistance.
The metallic femoral head was exchanged for ce-
ramic femoral heads and metal on metal (MoM) and
Primary total hip arthroplasty
* Femoral heads and acetabular inserts/monobloc cups
** Most of those cases relate to missing acetabular inserts in the registry (All=7.6%)

Page 34 SIRIS Report 2019
<45 45–54 55–64 65–74 75–84 85+ All
Metal on polyethylene (MoPE) 0.4 0.5 0.4 1.2 4.7 9.8 2.3
Ceramic on polyethylene (CoPE) 8.6 9.3 9.7 11.9 17.6 22.0 13.1
Metal on cross-linked polyethylene (MoXLPE) 17.2 13.7 14.9 15.7 17.0 19.9 15.9
Ceramic on cross-linked polyethylene (CoXLPE) 51.1 54.1 55.1 54.6 48.8 40.2 52.3
Metal on metal (MoM) 0.12 0.04 0.05 0.04 0.03 0.02 0.04
Ceramic on ceramic (CoC) 22.5 22.4 19.8 16.6 11.9 8.1 16.3
Other 0.06 0.01 0.02 0.01 0.07 0.06 0.03
N (bearing surface known) 1733 8081 19794 30987 23217 4730 88542
N (bearing surface unknown)** 129 634 1558 2500 1935 472 7235
<45 45–54 55–64 65–74 75–84 85+ All
All cemented 0.5 0.4 0.4 0.7 2.3 6.8 1.4
All uncemented 95.0 96.5 95.3 90.4 76.5 57.6 86.7
Hybrid* 2.8 2.6 3.8 8.3 20.1 33.4 11.1
Reverse hybrid** 1.4 0.3 0.3 0.4 0.8 1.7 0.6
Reinforcement ring, femur cemented 0.0 0.1 0.1 0.1 0.2 0.4 0.1
Reinforcement ring, femur uncemented 0.3 0.1 0.1 0.1 0.1 0.1 0.1
N 1862 8715 21352 33487 25152 5202 95770
Table 4.8
Primary total hip arthroplasty: bearing surface* in primary osteoarthritis by age (in %)
Table 4.9
Primary total hip arthroplasty: fixation methods in primary osteoarthritis by age (in %)
* Femoral heads and acetabular inserts/monobloc cups
** Most of those cases relate to missing acetabular inserts in the registry (All=7.6%)
* acetabulum uncemented, femur cemented
** acetabulum cemented, femur uncemented
Primary total hip arthroplasty
SIRIS Report 2019 Page 35
Women Men All
All cemented 1.9 0.8 1.4
All uncemented 82.4 91.2 86.7
Hybrid* 14.6 7.5 11.1
Reverse hybrid** 0.8 0.4 0.6
Reinforcement ring, femur cemented 0.2 0.1 0.1
Reinforcement ring, femur uncemented 0.1 0.1 0.1
N 49098 46794 95892
Table 4.10
Primary total hip arthroplasty: fixation methods in primary osteoarthritis by gender (in %)
* acetabulum uncemented, femur cemented
** acetabulum cemented, femur uncemented
Primary total hip arthroplasty
ceramic on ceramic (CoC) bearings were developed
to minimize wear. Currently, the most frequently
used bearing in Switzerland is CoXLPE, being used
in an average of 52.3% of all bearings (Table 4.7). Its
use showed a steady increase from 46% in 2013 to
56.5% in 2018. CoPE also showed a small increase
from 12.2% in 2013 to 14.1% in 2018. The applica-
tion of MoPE remained low during the observation
period. Since the inception of the registry essentially
no MoM bearings were used, most likely due to the
severe complications and excessively high revision
rates for such bearings, especially those with large
diameter femoral heads. Use of CoC bearings has
also been declining over time.
The selection of the bearing surface depends,
amongst other criteria, on activity and age of the pa-
tient (Table 4.8). Bearings with favorable wear char-
acteristics are most often used in younger patients,
e.g. CoXLPE and CoC. Standard PE is more often used
in older patients, combined with a metal or ceramic
head.
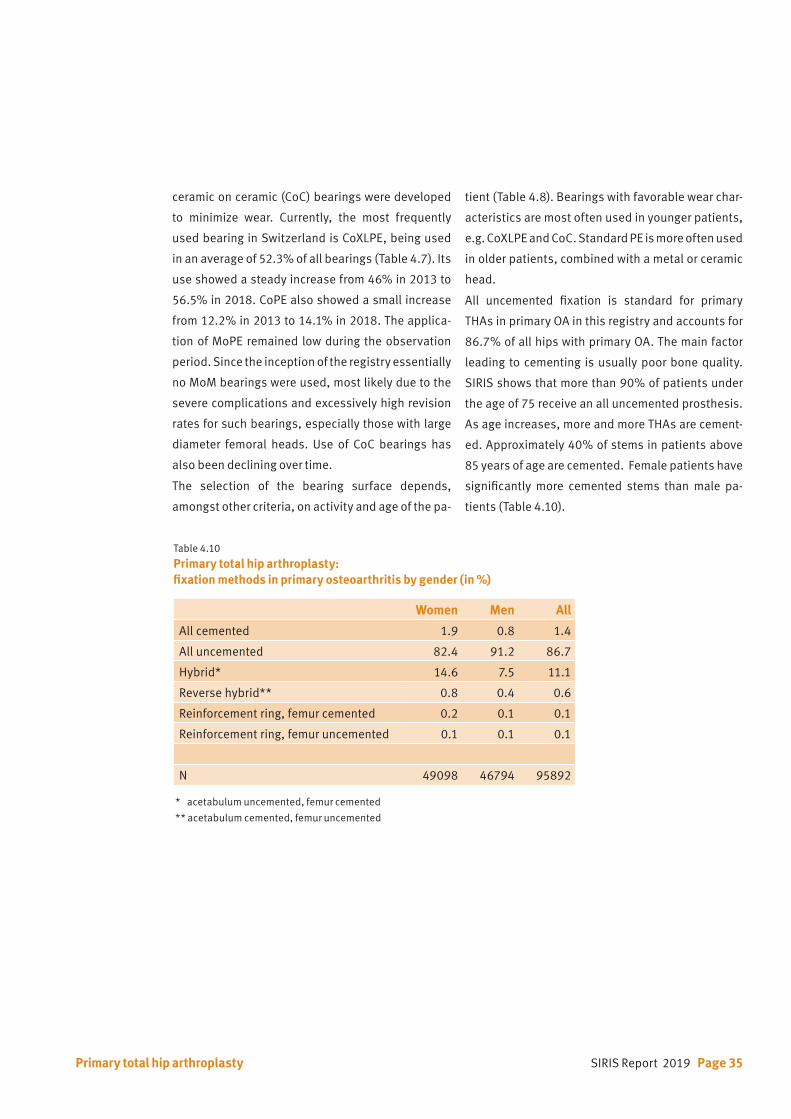
All uncemented fixation is standard for primary
THAs in primary OA in this registry and accounts for
86.7% of all hips with primary OA. The main factor
leading to cementing is usually poor bone quality.
SIRIS shows that more than 90% of patients under
the age of 75 receive an all uncemented prosthesis.
As age increases, more and more THAs are cement-
ed. Approximately 40% of stems in patients above
85 years of age are cemented. Female patients have
significantly more cemented stems than male pa-
tients (Table 4.10).
Page 36 SIRIS Report 2019
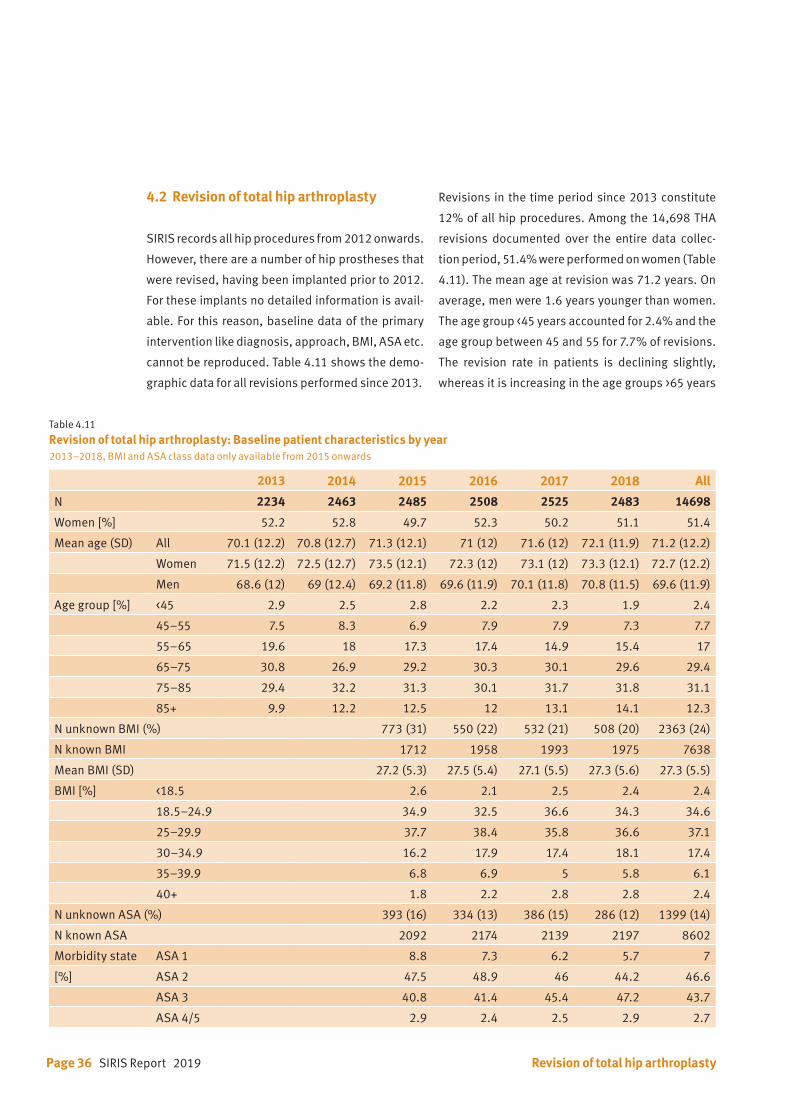
Table 4.11
Revision of total hip arthroplasty: Baseline patient characteristics by year2013–2018, BMI and ASA class data only available from 2015 onwards
2013 2014 2015 2016 2017 2018 All
N 2234 2463 2485 2508 2525 2483 14698
Women [%] 52.2 52.8 49.7 52.3 50.2 51.1 51.4
Mean age (SD) All 70.1 (12.2) 70.8 (12.7) 71.3 (12.1) 71 (12) 71.6 (12) 72.1 (11.9) 71.2 (12.2)
Women 71.5 (12.2) 72.5 (12.7) 73.5 (12.1) 72.3 (12) 73.1 (12) 73.3 (12.1) 72.7 (12.2)
Men 68.6 (12) 69 (12.4) 69.2 (11.8) 69.6 (11.9) 70.1 (11.8) 70.8 (11.5) 69.6 (11.9)
Age group [%] <45 2.9 2.5 2.8 2.2 2.3 1.9 2.4
45–55 7.5 8.3 6.9 7.9 7.9 7.3 7.7
55–65 19.6 18 17.3 17.4 14.9 15.4 17
65–75 30.8 26.9 29.2 30.3 30.1 29.6 29.4
75–85 29.4 32.2 31.3 30.1 31.7 31.8 31.1
85+ 9.9 12.2 12.5 12 13.1 14.1 12.3
N unknown BMI (%) 773 (31) 550 (22) 532 (21) 508 (20) 2363 (24)
N known BMI 1712 1958 1993 1975 7638
Mean BMI (SD) 27.2 (5.3) 27.5 (5.4) 27.1 (5.5) 27.3 (5.6) 27.3 (5.5)
BMI [%] <18.5 2.6 2.1 2.5 2.4 2.4
18.5–24.9 34.9 32.5 36.6 34.3 34.6
25–29.9 37.7 38.4 35.8 36.6 37.1
30–34.9 16.2 17.9 17.4 18.1 17.4
35–39.9 6.8 6.9 5 5.8 6.1
40+ 1.8 2.2 2.8 2.8 2.4
N unknown ASA (%) 393 (16) 334 (13) 386 (15) 286 (12) 1399 (14)
N known ASA 2092 2174 2139 2197 8602
Morbidity state ASA 1 8.8 7.3 6.2 5.7 7
[%] ASA 2 47.5 48.9 46 44.2 46.6
ASA 3 40.8 41.4 45.4 47.2 43.7
ASA 4/5 2.9 2.4 2.5 2.9 2.7
4.2 Revision of total hip arthroplasty
SIRIS records all hip procedures from 2012 onwards.
However, there are a number of hip prostheses that
were revised, having been implanted prior to 2012.
For these implants no detailed information is avail-
able. For this reason, baseline data of the primary
intervention like diagnosis, approach, BMI, ASA etc.
cannot be reproduced. Table 4.11 shows the demo-
graphic data for all revisions performed since 2013.
Revisions in the time period since 2013 constitute
12% of all hip procedures. Among the 14,698 THA
revisions documented over the entire data collec-
tion period, 51.4% were performed on women (Table
4.11). The mean age at revision was 71.2 years. On
average, men were 1.6 years younger than women.
The age group <45 years accounted for 2.4% and the
age group between 45 and 55 for 7.7% of revisions.
The revision rate in patients is declining slightly,
whereas it is increasing in the age groups >65 years
Revision of total hip arthroplasty

SIRIS Report 2019 Page 37
Table 4.12 Reason for revision of primary total hip arthroplasty Multiple reasons are possible per patient. The reasons for revisions categories as listed below are only available from 2015 onwards.
2015–2018
N %
Loosening femoral 2144 21.5
Infection 1903 19.1
Loosening acetabular 1799 18.1
Periprosthetic fracture 1554 15.6
Dislocation 1124 11.3
Wear 603 6.1
Metallosis 505 5.1
Acetabular osteolysis 384 3.9
Position/Orientation of cup 359 3.6
Femoral osteolysis 335 3.4
Trochanter pathology 207 2.1
Status after spacer 206 2.1
Implant breakage 197 2.0
Blood ion level 194 1.9
Position/Orientation of stem 165 1.7
Impingement 164 1.6
Acetabular protrusion 132 1.3
Squeaking 55 0.6
Other 2222 22.3
Total 2015–2018 14252 143.1
of age. The age groups 65 to 85 enclosed 60.5% of all
revisions. There is an ever-increasing proportion of
revisions in the age category 85 years and older from
9.9% in 2013 to 14.1% in 2016.
The mean BMI at time of revision was 27.4 kg/m2 re-
maining unchanged since 2016 and was similar to
primary THA (26.9 kg/m2).
While information on the type of revision has been
available since the start of the registry in 2012, the
current listing of the reasons for revisions and the
information on approach have only been recorded
since 2015. Aseptic loosening of the femoral com-
ponent was the most common reason for revision,
followed by aseptic loosening of the acetabular com-
ponent, infection, periprosthetic fracture, and dis-
location (Table 4.12). Compared to the previous re-
port, infection has increased from 18.0% to 19.1%.
Detailed information about the type of revision is
presented in Table 4.13 to 4.15 and Figure 4.3. Re-
vision of femoral and acetabular components was
Revision of total hip arthroplasty
Table 4.13 Type of revision of total hip arthroplasty2013–2018
2013–2018
N %
Exchange acetabular and femoral components
3006 20.5
Exchange acetabular component and head
2974 20.2
Exchange femoral component 2351 16.0
Exchange head and inlay 1329 9.0
Exchange acetabular component
983 6.7
Exchange femoral component and inlay
841 5.7
Component reimplantation (after spacer or Girdlestone)
805 5.5
Exchange head 693 4.7
Component removal, spacer implantation
409 2.8
Girdlestone 244 1.7
Exchange femoral component, inlay and osteosynthesis
165 1.1
Exchange inlay 144 1.0
Prosthesis preserving revision 135 0.9
Osteosynthesis 106 0.7
Other intervention 513 3.5
Total 2013–2018 14698 100.0

Page 38 SIRIS Report 2019
performed in 20.5%. Revision of the femoral compo-
nent alone or in combination with acetabular inlay
revision was done in 21.7%. In 26.9% the acetabular
component was revised, and in 20.2% this was com-
bined with an exchange of the femoral head implant.
The most frequently used approach is the posterior
approach with 48%. The utilization of the approach-
es remains stable.
Table 4.14
Approach of revision of total hip arthroplastyData only available from 2015 onwards
Table 4.15 Revision of total hip arthroplasty: Component fixation by year
2015–2018
N %
Posterior 3378 33.9
Lateral 2203 22.1
Anterolateral 1749 17.6
Anterior 1645 16.5
Transfemoral 572 5.7
Other approach 411 4.1
2013 2014 2015 2016 2017 2018 2013 – 2018
N N N N N N N %
Reinforcement ringfemur uncemented
100 132 57 69 65 68 491 4.3
Reinforcement ringfemur cemented
53 65 36 51 52 46 303 2.6
Reverse hybrid* 115 129 162 144 165 134 849 7.4
Hybrid** 166 176 163 190 176 141 1012 8.8
All uncemented 1011 1062 1122 1163 1145 1162 6665 58.0
All cemented 305 369 394 380 378 340 2166 18.9
Total 1750 1933 1934 1997 1981 1891 11486 100.0
* acetabulum cemented, femur uncemented** acetabulum uncemented, femur cemented
Figure 4.3
Revision of total hip arthroplasty: Component fixation by yearPercentage per year
0
20
40
60
80
100
120
Reinforcement ring, femur uncemented
Reinforcement ring, femur cemented
Reverse hybrid
Hybrid
All uncemented
All cemented2012 2013 2014 2015 20160
20
40
60
80
100
120
Reinforcement ring, femur uncemented
Reinforcement ring, femur cemented
Reverse hybrid
Hybrid
All uncemented
All cemented2012 2013 2014 2015 20160
20
40
60
80
100
120
Reinforcement ring, femur uncemented
Reinforcement ring, femur cemented
Reverse hybrid
Hybrid
All uncemented
All cemented2012 2013 2014 2015 2016
Revision of total hip arthroplasty
0
20
40
60
80
100reinforcement ring, femur uncem
reinforcement ring, femur cem
reverse hybrid
hybrid
all uncemented
all cemented
2013 2014 2015 2016 2017 2018
Reinforcement ringfemur uncemented
Reinforcement ringfemur cemented
Reverse hybrid
Hybrid
All uncemented
All cemented
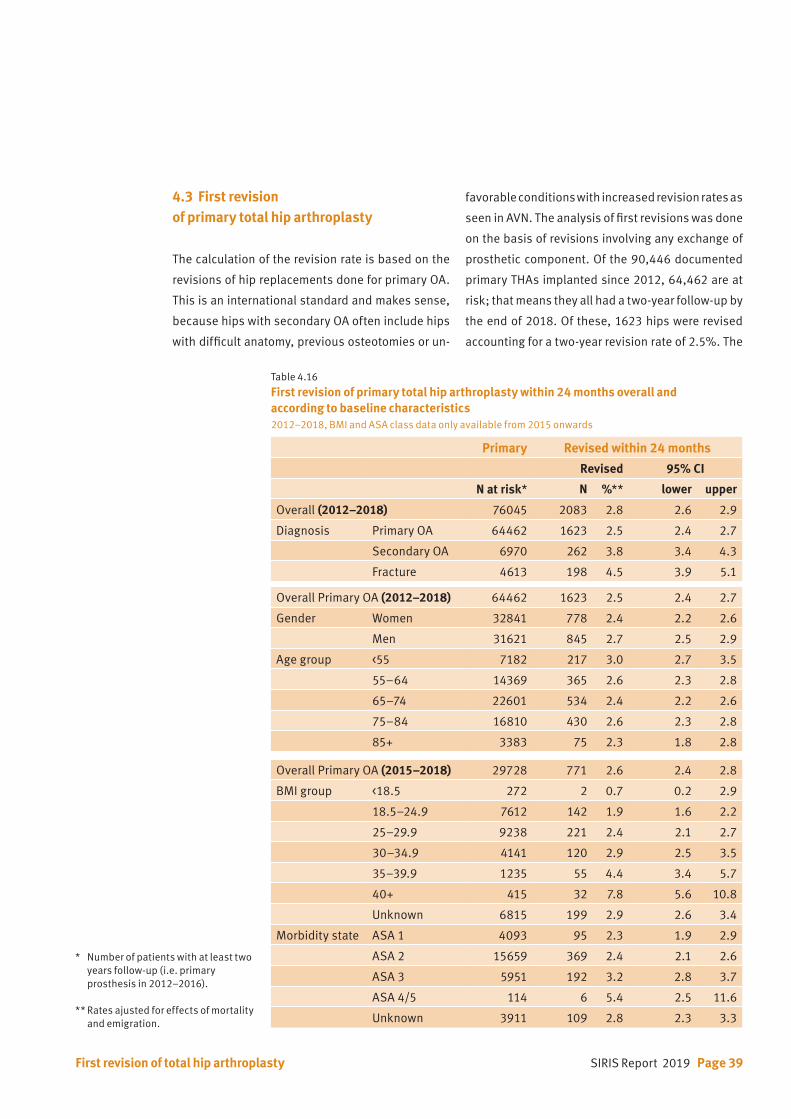
SIRIS Report 2019 Page 39First revision of total hip arthroplasty
4.3 First revision of primary total hip arthroplasty
The calculation of the revision rate is based on the
revisions of hip replacements done for primary OA.
This is an international standard and makes sense,
because hips with secondary OA often include hips
with difficult anatomy, previous osteotomies or un-
favorable conditions with increased revision rates as
seen in AVN. The analysis of first revisions was done
on the basis of revisions involving any exchange of
prosthetic component. Of the 90,446 documented
primary THAs implanted since 2012, 64,462 are at
risk; that means they all had a two-year follow-up by
the end of 2018. Of these, 1623 hips were revised
accounting for a two-year revision rate of 2.5%. The
Table 4.16 First revision of primary total hip arthroplasty within 24 months overall and according to baseline characteristics2012–2018, BMI and ASA class data only available from 2015 onwards
Primary Revised within 24 months
Revised 95% CI
N at risk* N %** lower upper
Overall (2012–2018) 76045 2083 2.8 2.6 2.9
Diagnosis Primary OA 64462 1623 2.5 2.4 2.7
Secondary OA 6970 262 3.8 3.4 4.3
Fracture 4613 198 4.5 3.9 5.1
Overall Primary OA (2012–2018) 64462 1623 2.5 2.4 2.7
Gender Women 32841 778 2.4 2.2 2.6
Men 31621 845 2.7 2.5 2.9
Age group <55 7182 217 3.0 2.7 3.5
55–64 14369 365 2.6 2.3 2.8
65–74 22601 534 2.4 2.2 2.6
75–84 16810 430 2.6 2.3 2.8
85+ 3383 75 2.3 1.8 2.8
Overall Primary OA (2015–2018) 29728 771 2.6 2.4 2.8
BMI group <18.5 272 2 0.7 0.2 2.9
18.5–24.9 7612 142 1.9 1.6 2.2
25–29.9 9238 221 2.4 2.1 2.7
30–34.9 4141 120 2.9 2.5 3.5
35–39.9 1235 55 4.4 3.4 5.7
40+ 415 32 7.8 5.6 10.8
Unknown 6815 199 2.9 2.6 3.4
Morbidity state ASA 1 4093 95 2.3 1.9 2.9
ASA 2 15659 369 2.4 2.1 2.6
ASA 3 5951 192 3.2 2.8 3.7
ASA 4/5 114 6 5.4 2.5 11.6
Unknown 3911 109 2.8 2.3 3.3
* Number of patients with at least two years follow-up (i.e. primary prosthesis in 2012–2016).
** Rates ajusted for effects of mortality and emigration.
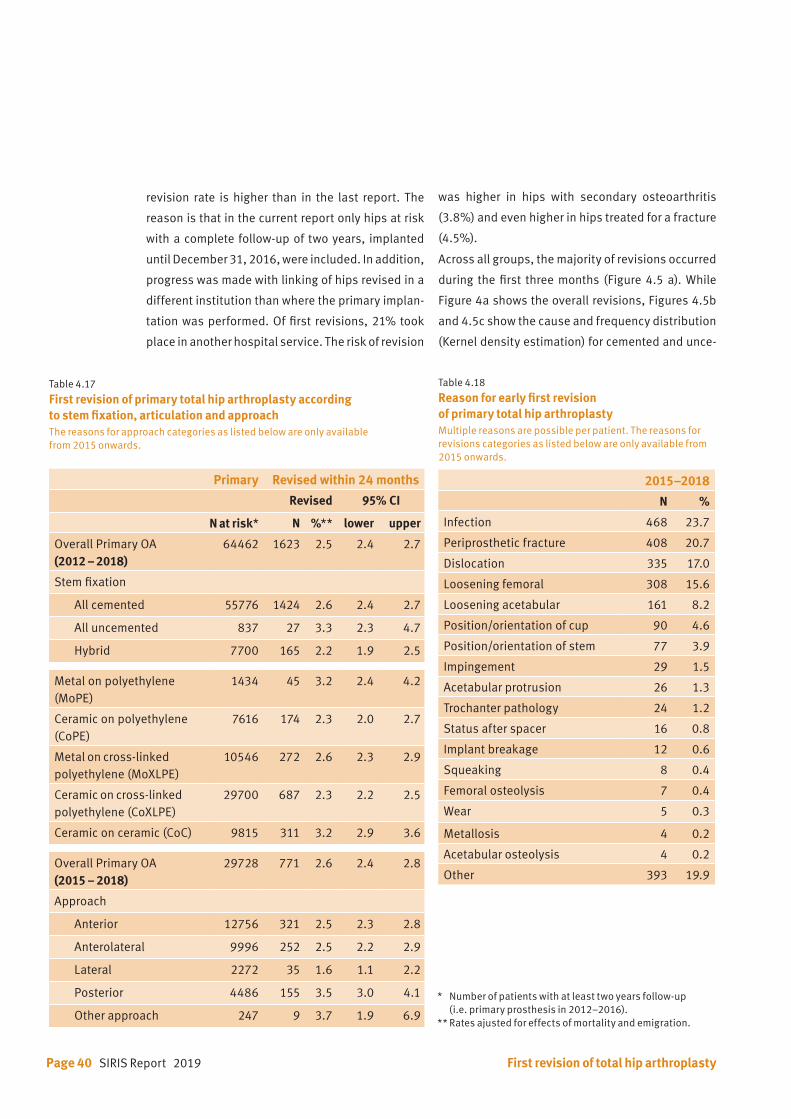
Page 40 SIRIS Report 2019
revision rate is higher than in the last report. The
reason is that in the current report only hips at risk
with a complete follow-up of two years, implanted
until December 31, 2016, were included. In addition,
progress was made with linking of hips revised in a
different institution than where the primary implan-
tation was performed. Of first revisions, 21% took
place in another hospital service. The risk of revision
was higher in hips with secondary osteoarthritis
(3.8%) and even higher in hips treated for a fracture
(4.5%).
Across all groups, the majority of revisions occurred
during the first three months (Figure 4.5 a). While
Figure 4a shows the overall revisions, Figures 4.5b
and 4.5c show the cause and frequency distribution
(Kernel density estimation) for cemented and unce-
Table 4.17 First revision of primary total hip arthroplasty according to stem fixation, articulation and approachThe reasons for approach categories as listed below are only available from 2015 onwards.
Primary Revised within 24 months
Revised 95% CI
N at risk* N %** lower upper
Overall Primary OA(2012 – 2018)
64462 1623 2.5 2.4 2.7
Stem fixation
All cemented 55776 1424 2.6 2.4 2.7
All uncemented 837 27 3.3 2.3 4.7
Hybrid 7700 165 2.2 1.9 2.5
Metal on polyethylene (MoPE)
1434 45 3.2 2.4 4.2
Ceramic on polyethylene (CoPE)
7616 174 2.3 2.0 2.7
Metal on cross-linked polyethylene (MoXLPE)
10546 272 2.6 2.3 2.9
Ceramic on cross-linked polyethylene (CoXLPE)
29700 687 2.3 2.2 2.5
Ceramic on ceramic (CoC) 9815 311 3.2 2.9 3.6
Overall Primary OA(2015 – 2018)
29728 771 2.6 2.4 2.8
Approach
Anterior 12756 321 2.5 2.3 2.8
Anterolateral 9996 252 2.5 2.2 2.9
Lateral 2272 35 1.6 1.1 2.2
Posterior 4486 155 3.5 3.0 4.1
Other approach 247 9 3.7 1.9 6.9
Table 4.18
Reason for early first revision of primary total hip arthroplasty Multiple reasons are possible per patient. The reasons for revisions categories as listed below are only available from 2015 onwards.
2015–2018
N %
Infection 468 23.7
Periprosthetic fracture 408 20.7
Dislocation 335 17.0
Loosening femoral 308 15.6
Loosening acetabular 161 8.2
Position/orientation of cup 90 4.6
Position/orientation of stem 77 3.9
Impingement 29 1.5
Acetabular protrusion 26 1.3
Trochanter pathology 24 1.2
Status after spacer 16 0.8
Implant breakage 12 0.6
Squeaking 8 0.4
Femoral osteolysis 7 0.4
Wear 5 0.3
Metallosis 4 0.2
Acetabular osteolysis 4 0.2
Other 393 19.9
First revision of total hip arthroplasty
* Number of patients with at least two years follow-up (i.e. primary prosthesis in 2012–2016).** Rates ajusted for effects of mortality and emigration.
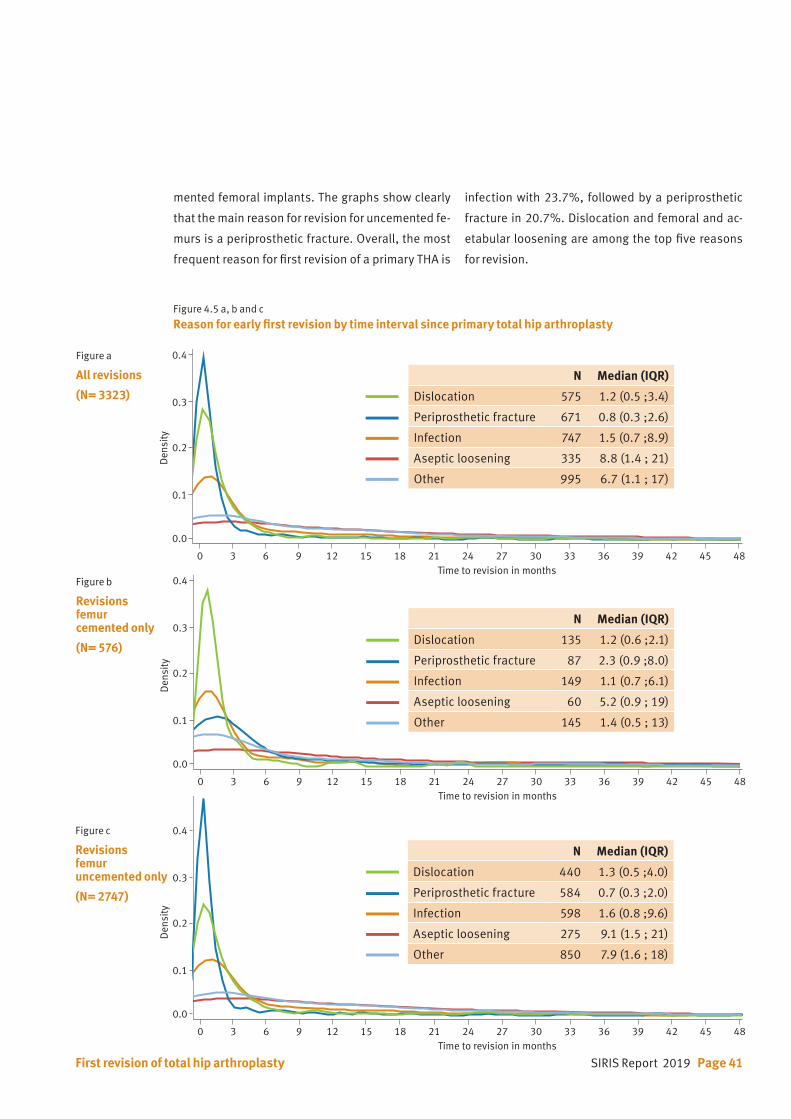
SIRIS Report 2019 Page 41First revision of total hip arthroplasty
Figure 4.5 a, b and c
Reason for early first revision by time interval since primary total hip arthroplasty
Figure a
All revisions
(N= 3323)
Figure b
Revisionsfemur cemented only
(N= 576)
Figure c
Revisionsfemur uncemented only
(N= 2747)
0.1
0.2
0.3
0.4
0.5
0.0
Den
sity
Time to revision in months0 3 6 9 12 15 18 21 24 27 30 33 36 39 42 45 48
0.1
0.2
0.3
0.4
0.5
0.0
Den
sity
Time to revision in months0 3 6 9 12 15 18 21 24 27 30 33 36 39 42 45 48
0.1
0.2
0.3
0.4
0.5
0.0
Den
sity
Time to revision in months0 3 6 9 12 15 18 21 24 27 30 33 36 39 42 45 48
N Median (IQR)
Dislocation 575 1.2 (0.5 ;3.4)
Periprosthetic fracture 671 0.8 (0.3 ;2.6)
Infection 747 1.5 (0.7 ;8.9)
Aseptic loosening 335 8.8 (1.4 ; 21)
Other 995 6.7 (1.1 ; 17)
N Median (IQR)
Dislocation 135 1.2 (0.6 ;2.1)
Periprosthetic fracture 87 2.3 (0.9 ;8.0)
Infection 149 1.1 (0.7 ;6.1)
Aseptic loosening 60 5.2 (0.9 ; 19)
Other 145 1.4 (0.5 ; 13)
N Median (IQR)
Dislocation 440 1.3 (0.5 ;4.0)
Periprosthetic fracture 584 0.7 (0.3 ;2.0)
Infection 598 1.6 (0.8 ;9.6)
Aseptic loosening 275 9.1 (1.5 ; 21)
Other 850 7.9 (1.6 ; 18)
mented femoral implants. The graphs show clearly
that the main reason for revision for uncemented fe-
murs is a periprosthetic fracture. Overall, the most
frequent reason for first revision of a primary THA is
infection with 23.7%, followed by a periprosthetic
fracture in 20.7%. Dislocation and femoral and ac-
etabular loosening are among the top five reasons
for revision.
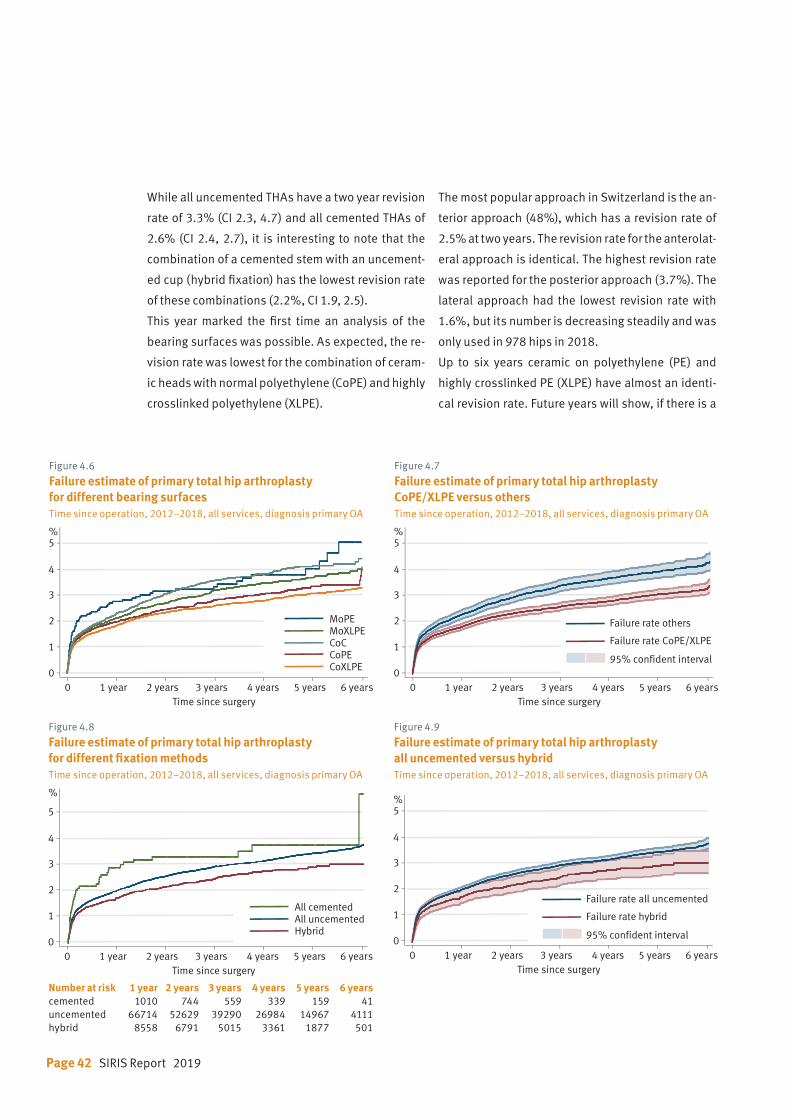
Page 42 SIRIS Report 2019
Figure 4.6
Failure estimate of primary total hip arthroplasty for different bearing surfacesTime since operation, 2012–2018, all services, diagnosis primary OA
Figure 4.8
Failure estimate of primary total hip arthroplasty for different fixation methodsTime since operation, 2012–2018, all services, diagnosis primary OA
Figure 4.7
Failure estimate of primary total hip arthroplasty CoPE/XLPE versus othersTime since operation, 2012–2018, all services, diagnosis primary OA
Figure 4.9
Failure estimate of primary total hip arthroplasty all uncemented versus hybridTime since operation, 2012–2018, all services, diagnosis primary OA
0 1 year 2 years 3 years 4 years 5 years 6 years
1
0
2
3
4
5%
Time since surgery
MoPEMoXLPECoCCoPECoXLPE
0 1 year 2 years 3 years 4 years 5 years 6 years
1
0
2
3
4
5
%
Time since surgery
All cementedAll uncementedHybrid
0 1 year 2 years 3 years 4 years 5 years 6 years
1
0
2
3
4
5%
Time since surgery
95% confident interval
Failure rate CoPE/XLPE
Failure rate others
0 1 year 2 years 3 years 4 years 5 years 6 years
1
0
2
3
4
5%
Time since surgery
95% confident interval
Failure rate hybrid
Failure rate all uncemented
Number at risk 1 year 2 years 3 years 4 years 5 years 6 yearscemented 1010 744 559 339 159 41uncemented 66714 52629 39290 26984 14967 4111hybrid 8558 6791 5015 3361 1877 501
While all uncemented THAs have a two year revision
rate of 3.3% (CI 2.3, 4.7) and all cemented THAs of
2.6% (CI 2.4, 2.7), it is interesting to note that the
combination of a cemented stem with an uncement-
ed cup (hybrid fixation) has the lowest revision rate
of these combinations (2.2%, CI 1.9, 2.5).
This year marked the first time an analysis of the
bearing surfaces was possible. As expected, the re-
vision rate was lowest for the combination of ceram-
ic heads with normal polyethylene (CoPE) and highly
crosslinked polyethylene (XLPE).
The most popular approach in Switzerland is the an-
terior approach (48%), which has a revision rate of
2.5% at two years. The revision rate for the anterolat-
eral approach is identical. The highest revision rate
was reported for the posterior approach (3.7%). The
lateral approach had the lowest revision rate with
1.6%, but its number is decreasing steadily and was
only used in 978 hips in 2018.
Up to six years ceramic on polyethylene (PE) and
highly crosslinked PE (XLPE) have almost an identi-
cal revision rate. Future years will show, if there is a
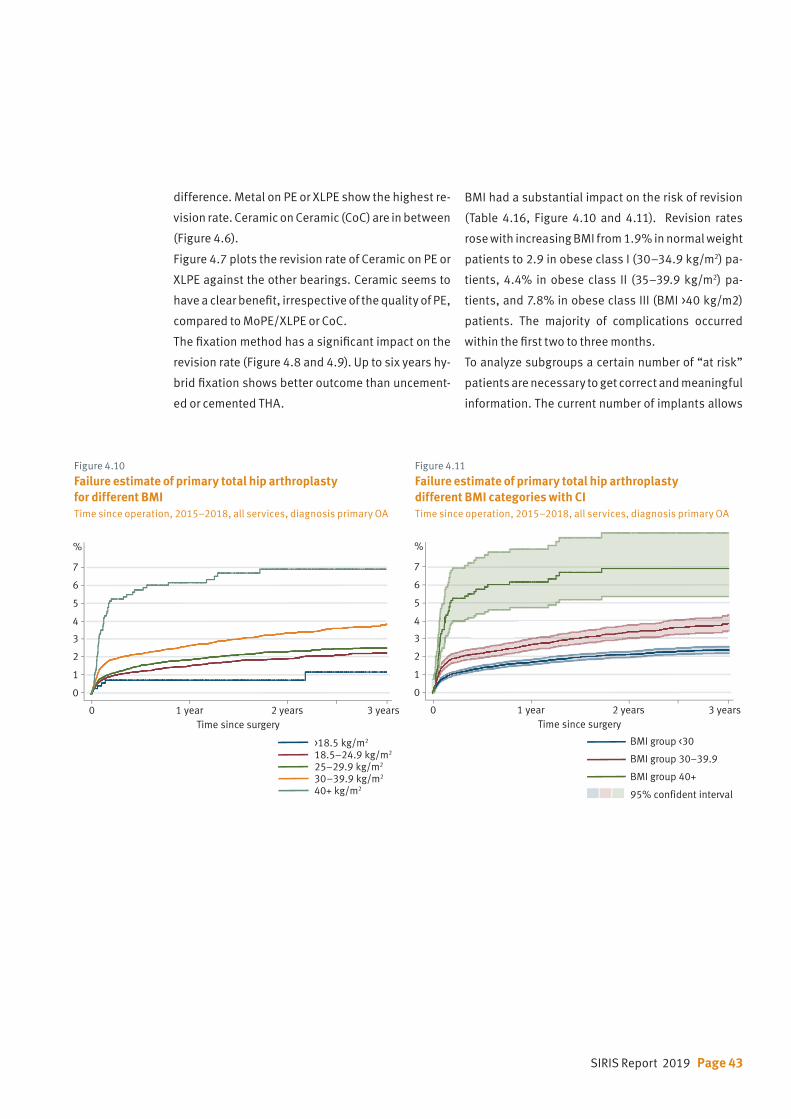
SIRIS Report 2019 Page 43
difference. Metal on PE or XLPE show the highest re-
vision rate. Ceramic on Ceramic (CoC) are in between
(Figure 4.6).
Figure 4.7 plots the revision rate of Ceramic on PE or
XLPE against the other bearings. Ceramic seems to
have a clear benefit, irrespective of the quality of PE,
compared to MoPE/XLPE or CoC.
The fixation method has a significant impact on the
revision rate (Figure 4.8 and 4.9). Up to six years hy-
brid fixation shows better outcome than uncement-
ed or cemented THA.
BMI had a substantial impact on the risk of revision
(Table 4.16, Figure 4.10 and 4.11). Revision rates
rose with increasing BMI from 1.9% in normal weight
patients to 2.9 in obese class I (30–34.9 kg/m2) pa-
tients, 4.4% in obese class II (35–39.9 kg/m2) pa-
tients, and 7.8% in obese class III (BMI >40 kg/m2)
patients. The majority of complications occurred
within the first two to three months.
To analyze subgroups a certain number of “at risk”
patients are necessary to get correct and meaningful
information. The current number of implants allows
Figure 4.10
Failure estimate of primary total hip arthroplasty for different BMITime since operation, 2015–2018, all services, diagnosis primary OA
Figure 4.11
Failure estimate of primary total hip arthroplasty different BMI categories with CITime since operation, 2015–2018, all services, diagnosis primary OA
0 1 year 2 years 3 years
1
0
2
3
4
5
%
6
7
Time since surgery
>18.5 kg/m2
18.5–24.9 kg/m2
25–29.9 kg/m2
30 –39.9 kg/m2
40+ kg/m2
0 1 year 2 years 3 years
1
0
2
3
4
5
%
6
7
Time since surgery
95% confident interval
BMI group 30–39.9
BMI group 40+
BMI group <30
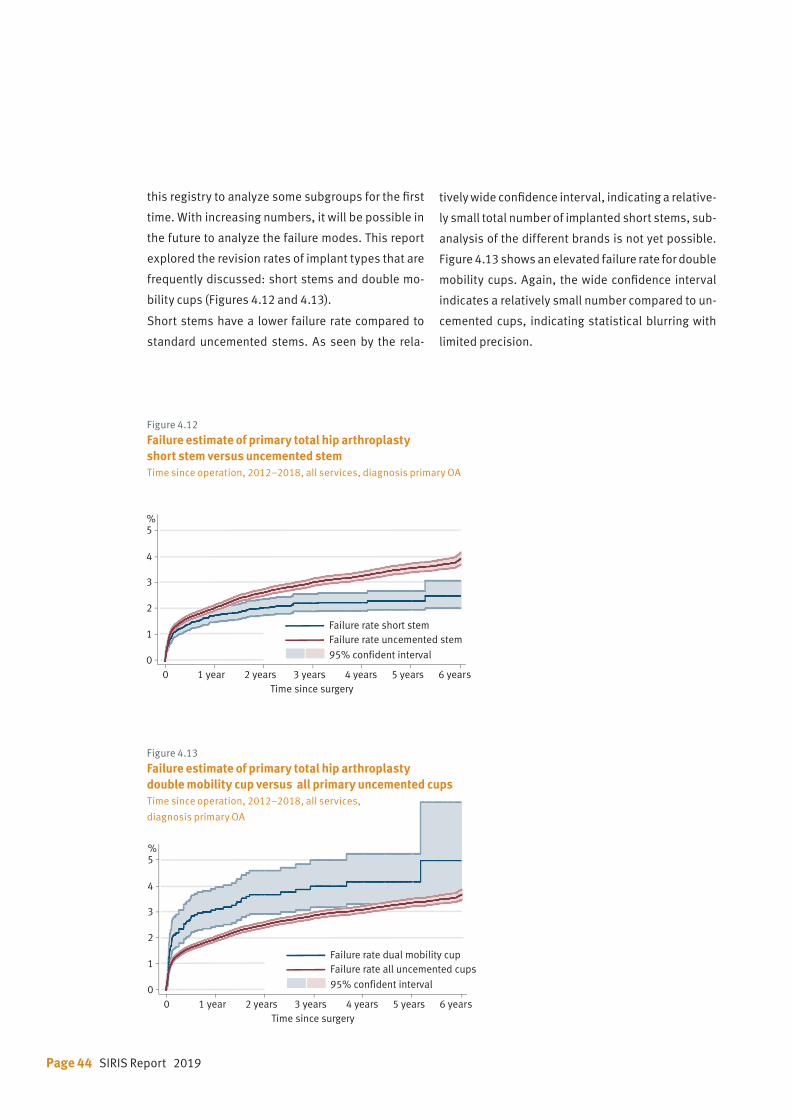
Page 44 SIRIS Report 2019
Figure 4.12
Failure estimate of primary total hip arthroplasty short stem versus uncemented stemTime since operation, 2012–2018, all services, diagnosis primary OA
Figure 4.13
Failure estimate of primary total hip arthroplasty double mobility cup versus all primary uncemented cupsTime since operation, 2012–2018, all services,
diagnosis primary OA
0 1 year 2 years 3 years 4 years 5 years 6 years
1
0
2
3
4
5%
Time since surgery
95% confident interval
Failure rate uncemented stemFailure rate short stem
0 1 year 2 years 3 years 4 years 5 years 6 years
1
0
2
3
4
5%
Time since surgery
95% confident interval
Failure rate all uncemented cupsFailure rate dual mobility cup
this registry to analyze some subgroups for the first
time. With increasing numbers, it will be possible in
the future to analyze the failure modes. This report
explored the revision rates of implant types that are
frequently discussed: short stems and double mo-
bility cups (Figures 4.12 and 4.13).
Short stems have a lower failure rate compared to
standard uncemented stems. As seen by the rela-
tively wide confidence interval, indicating a relative-
ly small total number of implanted short stems, sub-
analysis of the different brands is not yet possible.
Figure 4.13 shows an elevated failure rate for double
mobility cups. Again, the wide confidence interval
indicates a relatively small number compared to un-
cemented cups, indicating statistical blurring with
limited precision.
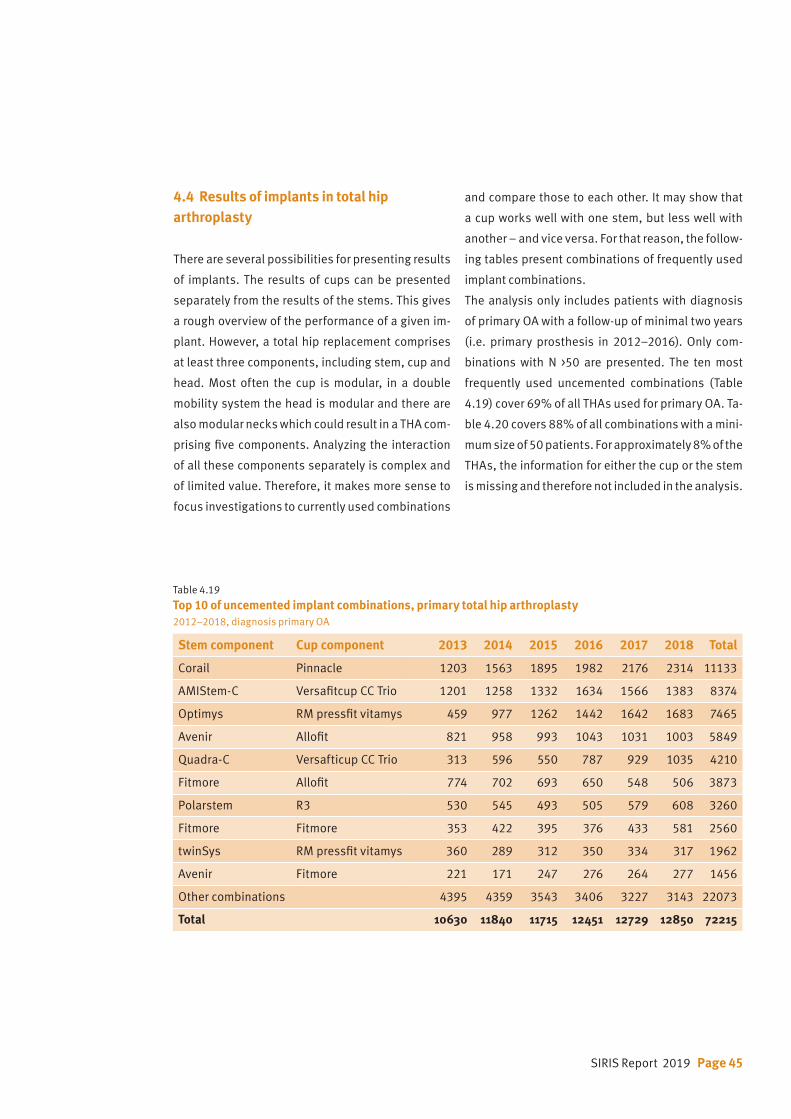
SIRIS Report 2019 Page 45
4.4 Results of implants in total hip arthroplasty
There are several possibilities for presenting results
of implants. The results of cups can be presented
separately from the results of the stems. This gives
a rough overview of the performance of a given im-
plant. However, a total hip replacement comprises
at least three components, including stem, cup and
head. Most often the cup is modular, in a double
mobility system the head is modular and there are
also modular necks which could result in a THA com-
prising five components. Analyzing the interaction
of all these components separately is complex and
of limited value. Therefore, it makes more sense to
focus investigations to currently used combinations
and compare those to each other. It may show that
a cup works well with one stem, but less well with
another – and vice versa. For that reason, the follow-
ing tables present combinations of frequently used
implant combinations.
The analysis only includes patients with diagnosis
of primary OA with a follow-up of minimal two years
(i.e. primary prosthesis in 2012–2016). Only com-
binations with N >50 are presented. The ten most
frequently used uncemented combinations (Table
4.19) cover 69% of all THAs used for primary OA. Ta-
ble 4.20 covers 88% of all combinations with a mini-
mum size of 50 patients. For approximately 8% of the
THAs, the information for either the cup or the stem
is missing and therefore not included in the analysis.
Table 4.19 Top 10 of uncemented implant combinations, primary total hip arthroplasty 2012–2018, diagnosis primary OA
Stem component Cup component 2013 2014 2015 2016 2017 2018 Total
Corail Pinnacle 1203 1563 1895 1982 2176 2314 11133
AMIStem-C Versafitcup CC Trio 1201 1258 1332 1634 1566 1383 8374
Optimys RM pressfit vitamys 459 977 1262 1442 1642 1683 7465
Avenir Allofit 821 958 993 1043 1031 1003 5849
Quadra-C Versafticup CC Trio 313 596 550 787 929 1035 4210
Fitmore Allofit 774 702 693 650 548 506 3873
Polarstem R3 530 545 493 505 579 608 3260
Fitmore Fitmore 353 422 395 376 433 581 2560
twinSys RM pressfit vitamys 360 289 312 350 334 317 1962
Avenir Fitmore 221 171 247 276 264 277 1456
Other combinations 4395 4359 3543 3406 3227 3143 22073
Total 10630 11840 11715 12451 12729 12850 72215
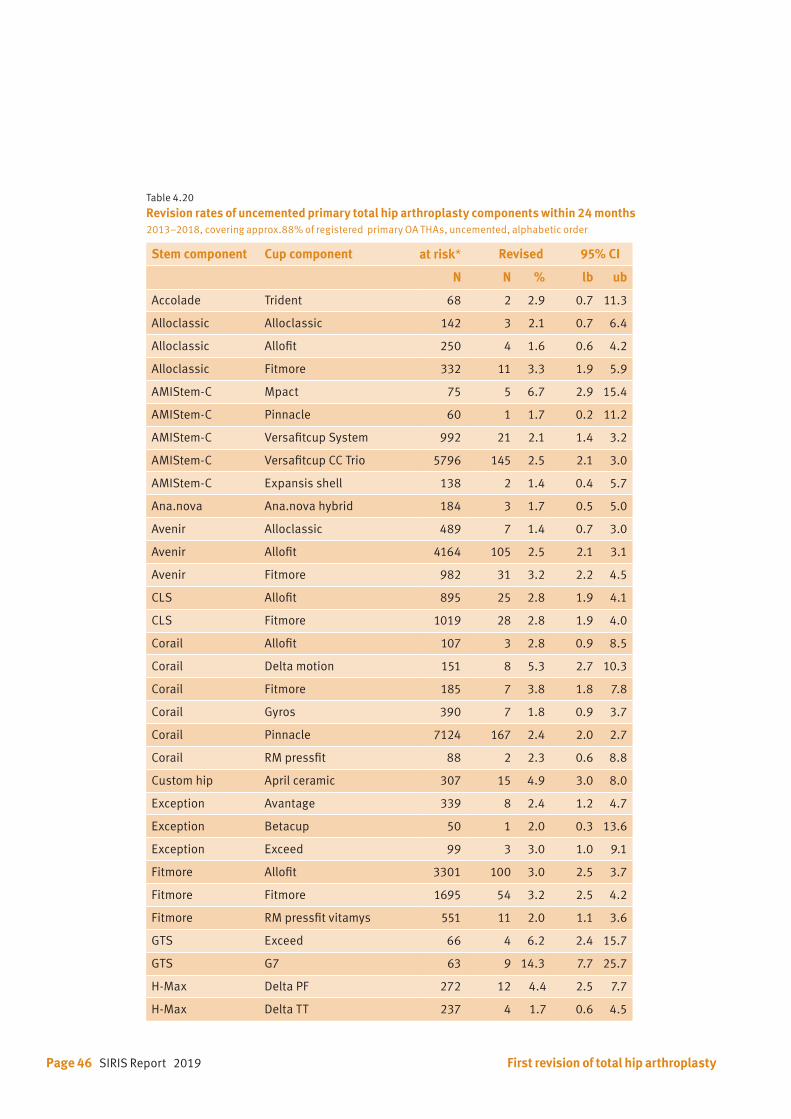
Page 46 SIRIS Report 2019
Table 4.20 Revision rates of uncemented primary total hip arthroplasty components within 24 months 2013–2018, covering approx.88% of registered primary OA THAs, uncemented, alphabetic order
Stem component Cup component at risk* Revised 95% CI
N N % lb ub
Accolade Trident 68 2 2.9 0.7 11.3
Alloclassic Alloclassic 142 3 2.1 0.7 6.4
Alloclassic Allofit 250 4 1.6 0.6 4.2
Alloclassic Fitmore 332 11 3.3 1.9 5.9
AMIStem-C Mpact 75 5 6.7 2.9 15.4
AMIStem-C Pinnacle 60 1 1.7 0.2 11.2
AMIStem-C Versafitcup System 992 21 2.1 1.4 3.2
AMIStem-C Versafitcup CC Trio 5796 145 2.5 2.1 3.0
AMIStem-C Expansis shell 138 2 1.4 0.4 5.7
Ana.nova Ana.nova hybrid 184 3 1.7 0.5 5.0
Avenir Alloclassic 489 7 1.4 0.7 3.0
Avenir Allofit 4164 105 2.5 2.1 3.1
Avenir Fitmore 982 31 3.2 2.2 4.5
CLS Allofit 895 25 2.8 1.9 4.1
CLS Fitmore 1019 28 2.8 1.9 4.0
Corail Allofit 107 3 2.8 0.9 8.5
Corail Delta motion 151 8 5.3 2.7 10.3
Corail Fitmore 185 7 3.8 1.8 7.8
Corail Gyros 390 7 1.8 0.9 3.7
Corail Pinnacle 7124 167 2.4 2.0 2.7
Corail RM pressfit 88 2 2.3 0.6 8.8
Custom hip April ceramic 307 15 4.9 3.0 8.0
Exception Avantage 339 8 2.4 1.2 4.7
Exception Betacup 50 1 2.0 0.3 13.6
Exception Exceed 99 3 3.0 1.0 9.1
Fitmore Allofit 3301 100 3.0 2.5 3.7
Fitmore Fitmore 1695 54 3.2 2.5 4.2
Fitmore RM pressfit vitamys 551 11 2.0 1.1 3.6
GTS Exceed 66 4 6.2 2.4 15.7
GTS G7 63 9 14.3 7.7 25.7
H-Max Delta PF 272 12 4.4 2.5 7.7
H-Max Delta TT 237 4 1.7 0.6 4.5
First revision of total hip arthroplasty
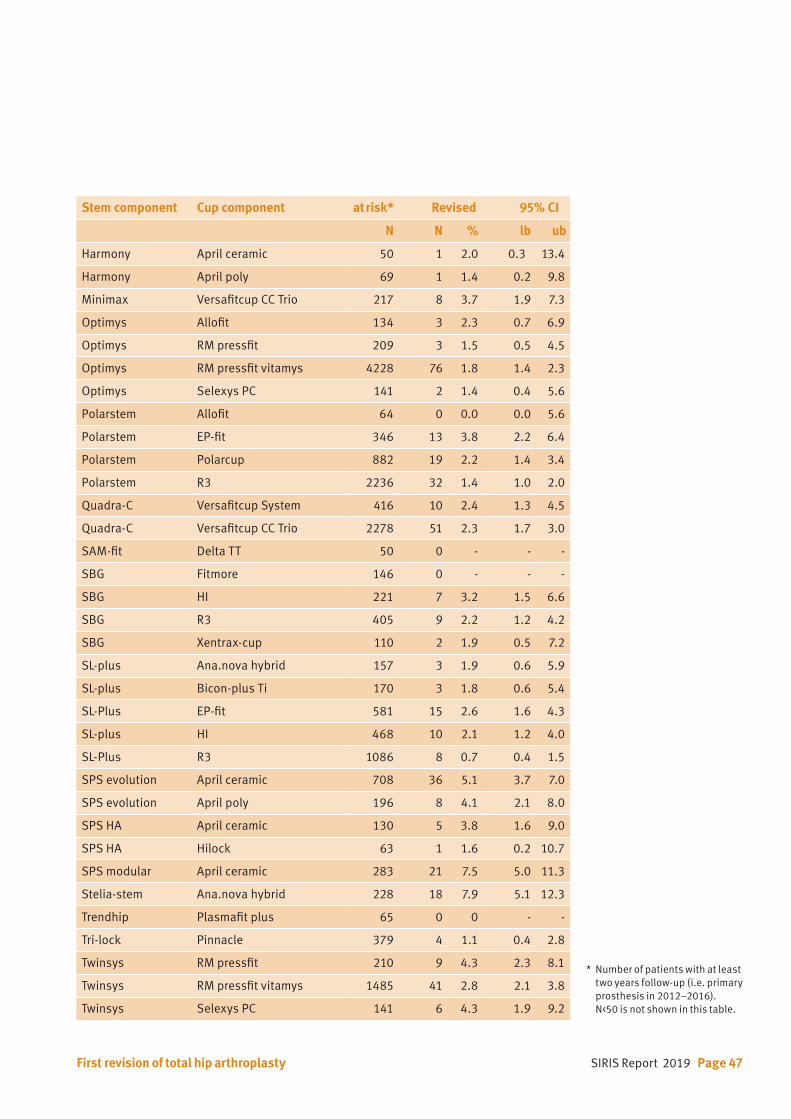
SIRIS Report 2019 Page 47
Stem component Cup component at risk* Revised 95% CI
N N % lb ub
Harmony April ceramic 50 1 2.0 0.3 13.4
Harmony April poly 69 1 1.4 0.2 9.8
Minimax Versafitcup CC Trio 217 8 3.7 1.9 7.3
Optimys Allofit 134 3 2.3 0.7 6.9
Optimys RM pressfit 209 3 1.5 0.5 4.5
Optimys RM pressfit vitamys 4228 76 1.8 1.4 2.3
Optimys Selexys PC 141 2 1.4 0.4 5.6
Polarstem Allofit 64 0 0.0 0.0 5.6
Polarstem EP-fit 346 13 3.8 2.2 6.4
Polarstem Polarcup 882 19 2.2 1.4 3.4
Polarstem R3 2236 32 1.4 1.0 2.0
Quadra-C Versafitcup System 416 10 2.4 1.3 4.5
Quadra-C Versafitcup CC Trio 2278 51 2.3 1.7 3.0
SAM-fit Delta TT 50 0 - - -
SBG Fitmore 146 0 - - -
SBG HI 221 7 3.2 1.5 6.6
SBG R3 405 9 2.2 1.2 4.2
SBG Xentrax-cup 110 2 1.9 0.5 7.2
SL-plus Ana.nova hybrid 157 3 1.9 0.6 5.9
SL-plus Bicon-plus Ti 170 3 1.8 0.6 5.4
SL-Plus EP-fit 581 15 2.6 1.6 4.3
SL-plus HI 468 10 2.1 1.2 4.0
SL-Plus R3 1086 8 0.7 0.4 1.5
SPS evolution April ceramic 708 36 5.1 3.7 7.0
SPS evolution April poly 196 8 4.1 2.1 8.0
SPS HA April ceramic 130 5 3.8 1.6 9.0
SPS HA Hilock 63 1 1.6 0.2 10.7
SPS modular April ceramic 283 21 7.5 5.0 11.3
Stelia-stem Ana.nova hybrid 228 18 7.9 5.1 12.3
Trendhip Plasmafit plus 65 0 0 - -
Tri-lock Pinnacle 379 4 1.1 0.4 2.8
Twinsys RM pressfit 210 9 4.3 2.3 8.1
Twinsys RM pressfit vitamys 1485 41 2.8 2.1 3.8
Twinsys Selexys PC 141 6 4.3 1.9 9.2
First revision of total hip arthroplasty
* Number of patients with at least two years follow-up (i.e. primary prosthesis in 2012–2016). N<50 is not shown in this table.
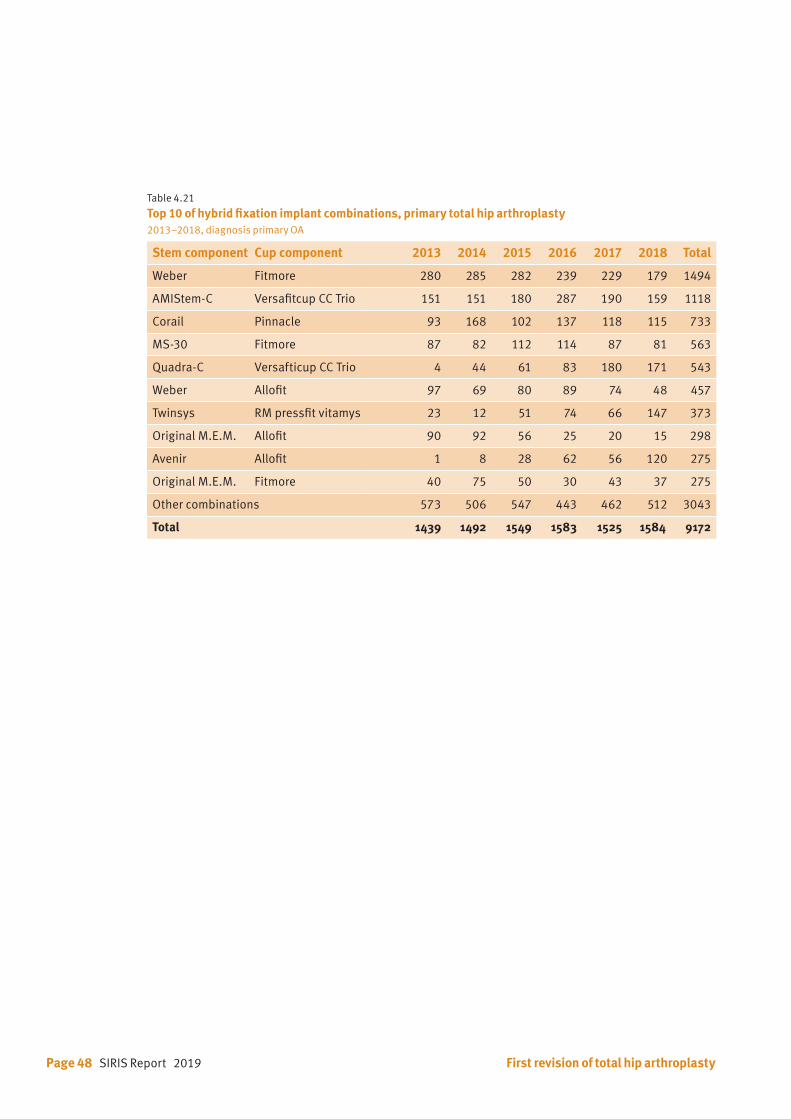
Page 48 SIRIS Report 2019 First revision of total hip arthroplasty
Table 4.21 Top 10 of hybrid fixation implant combinations, primary total hip arthroplasty2013–2018, diagnosis primary OA
Stem component Cup component 2013 2014 2015 2016 2017 2018 Total
Weber Fitmore 280 285 282 239 229 179 1494
AMIStem-C Versafitcup CC Trio 151 151 180 287 190 159 1118
Corail Pinnacle 93 168 102 137 118 115 733
MS-30 Fitmore 87 82 112 114 87 81 563
Quadra-C Versafticup CC Trio 4 44 61 83 180 171 543
Weber Allofit 97 69 80 89 74 48 457
Twinsys RM pressfit vitamys 23 12 51 74 66 147 373
Original M.E.M. Allofit 90 92 56 25 20 15 298
Avenir Allofit 1 8 28 62 56 120 275
Original M.E.M. Fitmore 40 75 50 30 43 37 275
Other combinations 573 506 547 443 462 512 3043
Total 1439 1492 1549 1583 1525 1584 9172
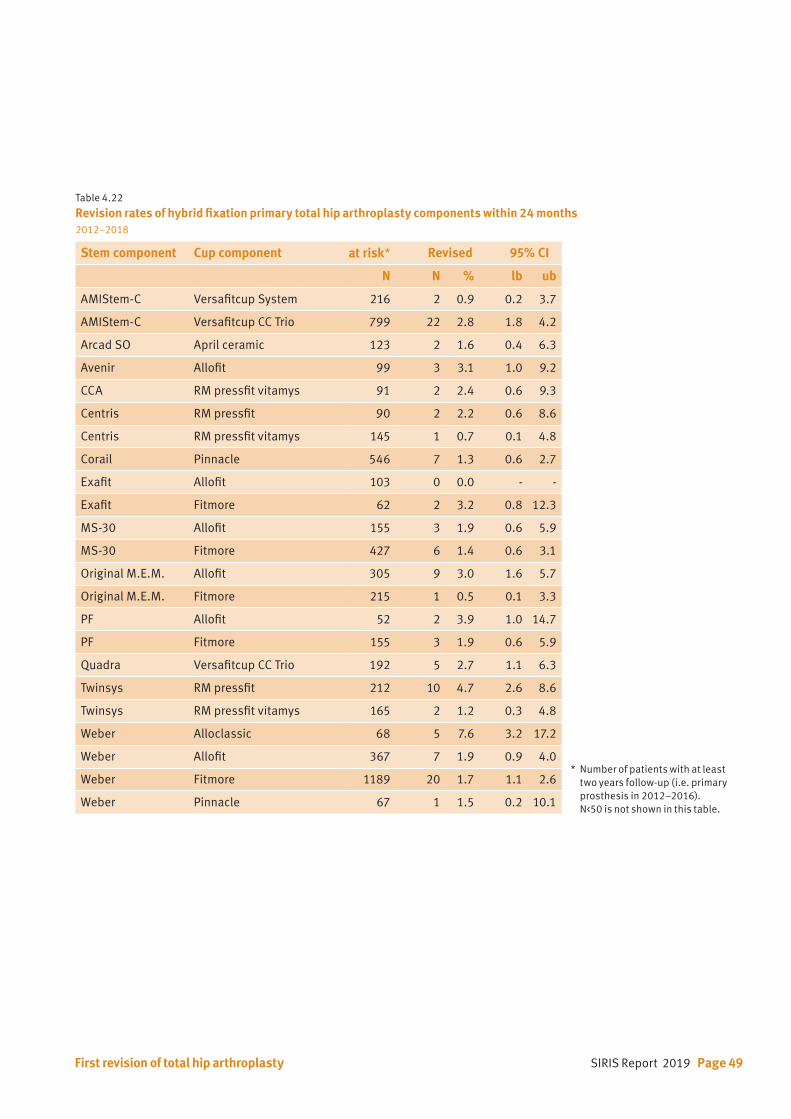
SIRIS Report 2019 Page 49First revision of total hip arthroplasty
Table 4.22 Revision rates of hybrid fixation primary total hip arthroplasty components within 24 months 2012–2018
Stem component Cup component at risk* Revised 95% CI
N N % lb ub
AMIStem-C Versafitcup System 216 2 0.9 0.2 3.7
AMIStem-C Versafitcup CC Trio 799 22 2.8 1.8 4.2
Arcad SO April ceramic 123 2 1.6 0.4 6.3
Avenir Allofit 99 3 3.1 1.0 9.2
CCA RM pressfit vitamys 91 2 2.4 0.6 9.3
Centris RM pressfit 90 2 2.2 0.6 8.6
Centris RM pressfit vitamys 145 1 0.7 0.1 4.8
Corail Pinnacle 546 7 1.3 0.6 2.7
Exafit Allofit 103 0 0.0 - -
Exafit Fitmore 62 2 3.2 0.8 12.3
MS-30 Allofit 155 3 1.9 0.6 5.9
MS-30 Fitmore 427 6 1.4 0.6 3.1
Original M.E.M. Allofit 305 9 3.0 1.6 5.7
Original M.E.M. Fitmore 215 1 0.5 0.1 3.3
PF Allofit 52 2 3.9 1.0 14.7
PF Fitmore 155 3 1.9 0.6 5.9
Quadra Versafitcup CC Trio 192 5 2.7 1.1 6.3
Twinsys RM pressfit 212 10 4.7 2.6 8.6
Twinsys RM pressfit vitamys 165 2 1.2 0.3 4.8
Weber Alloclassic 68 5 7.6 3.2 17.2
Weber Allofit 367 7 1.9 0.9 4.0
Weber Fitmore 1189 20 1.7 1.1 2.6
Weber Pinnacle 67 1 1.5 0.2 10.1
* Number of patients with at least two years follow-up (i.e. primary prosthesis in 2012–2016). N<50 is not shown in this table.
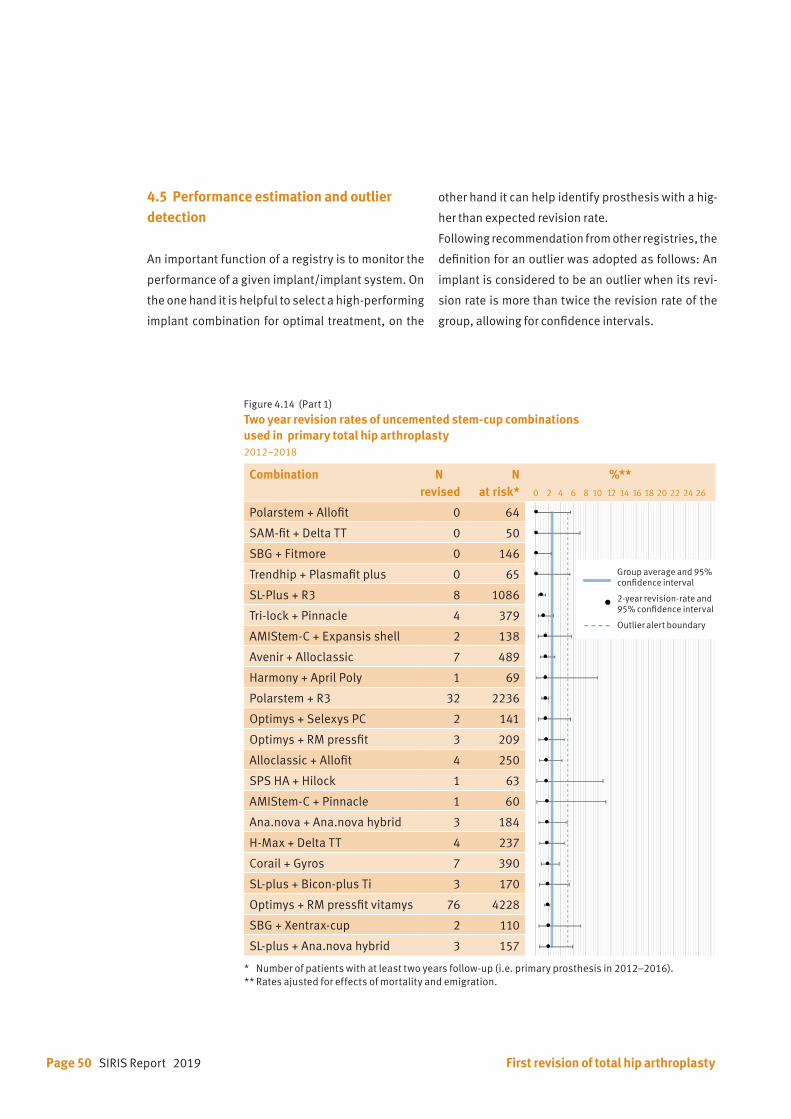
Page 50 SIRIS Report 2019 First revision of total hip arthroplasty
Figure 4.14 (Part 1) Two year revision rates of uncemented stem-cup combinations used in primary total hip arthroplasty 2012–2018
Combination N revised
N at risk*
%** 0 2 4 6 8 10 12 14 16 18 20 22 24 26
Polarstem + Allofit 0 64
SAM-fit + Delta TT 0 50
SBG + Fitmore 0 146
Trendhip + Plasmafit plus 0 65
SL-Plus + R3 8 1086
Tri-lock + Pinnacle 4 379
AMIStem-C + Expansis shell 2 138
Avenir + Alloclassic 7 489
Harmony + April Poly 1 69
Polarstem + R3 32 2236
Optimys + Selexys PC 2 141
Optimys + RM pressfit 3 209
Alloclassic + Allofit 4 250
SPS HA + Hilock 1 63
AMIStem-C + Pinnacle 1 60
Ana.nova + Ana.nova hybrid 3 184
H-Max + Delta TT 4 237
Corail + Gyros 7 390
SL-plus + Bicon-plus Ti 3 170
Optimys + RM pressfit vitamys 76 4228
SBG + Xentrax-cup 2 110
SL-plus + Ana.nova hybrid 3 157
* Number of patients with at least two years follow-up (i.e. primary prosthesis in 2012–2016).** Rates ajusted for effects of mortality and emigration.
Group average and 95% confidence interval
2-year revision-rate and 95% confidence interval
Outlier alert boundary
4.5 Performance estimation and outlier detection
An important function of a registry is to monitor the
performance of a given implant/implant system. On
the one hand it is helpful to select a high-performing
implant combination for optimal treatment, on the
other hand it can help identify prosthesis with a hig-
her than expected revision rate.
Following recommendation from other registries, the
definition for an outlier was adopted as follows: An
implant is considered to be an outlier when its revi-
sion rate is more than twice the revision rate of the
group, allowing for confidence intervals.
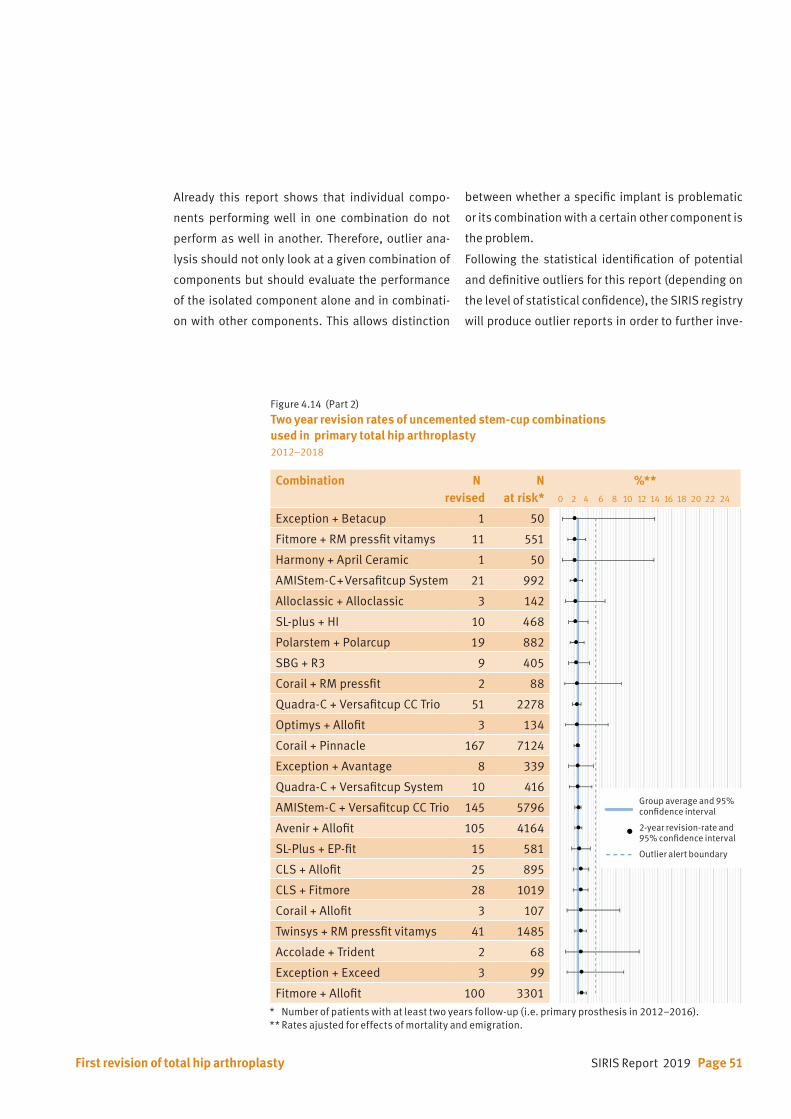
SIRIS Report 2019 Page 51
Combination Nrevised
N at risk*
%** 0 2 4 6 8 10 12 14 16 18 20 22 24
Exception + Betacup 1 50
Fitmore + RM pressfit vitamys 11 551
Harmony + April Ceramic 1 50
AMIStem-C + Versafitcup System 21 992
Alloclassic + Alloclassic 3 142
SL-plus + HI 10 468
Polarstem + Polarcup 19 882
SBG + R3 9 405
Corail + RM pressfit 2 88
Quadra-C + Versafitcup CC Trio 51 2278
Optimys + Allofit 3 134
Corail + Pinnacle 167 7124
Exception + Avantage 8 339
Quadra-C + Versafitcup System 10 416
AMIStem-C + Versafitcup CC Trio 145 5796
Avenir + Allofit 105 4164
SL-Plus + EP-fit 15 581
CLS + Allofit 25 895
CLS + Fitmore 28 1019
Corail + Allofit 3 107
Twinsys + RM pressfit vitamys 41 1485
Accolade + Trident 2 68
Exception + Exceed 3 99
Fitmore + Allofit 100 3301
Figure 4.14 (Part 2) Two year revision rates of uncemented stem-cup combinations used in primary total hip arthroplasty 2012–2018
Group average and 95% confidence interval
2-year revision-rate and 95% confidence interval
Outlier alert boundary
Already this report shows that individual compo-
nents performing well in one combination do not
perform as well in another. Therefore, outlier ana-
lysis should not only look at a given combination of
components but should evaluate the performance
of the isolated component alone and in combinati-
on with other components. This allows distinction
between whether a specific implant is problematic
or its combination with a certain other component is
the problem.
Following the statistical identification of potential
and definitive outliers for this report (depending on
the level of statistical confidence), the SIRIS registry
will produce outlier reports in order to further inve-
* Number of patients with at least two years follow-up (i.e. primary prosthesis in 2012–2016).** Rates ajusted for effects of mortality and emigration.
First revision of total hip arthroplasty

Page 52 SIRIS Report 2019 First revision of total hip arthroplasty
Combination N revised
N at risk*
%** 0 2 4 6 8 10 12 14 16 18 20 22 24 26 28
Avenir + Fitmore 31 982
Fitmore + Fitmore 54 1695
SBG + HI 7 221
Alloclassic + Fitmore 11 332
Minimax + Versafitcup CC Trio 8 217
Corail + Fitmore 7 185
Polarstem + EP-fit 13 346
SPS HA + April ceramic 5 130
SPS evolution + April poly 8 196
Twinsys + RM pressfit 9 210
Twinsys + Selexys PC 6 141
H-Max + Delta PF 12 272
Custom hip + April ceramic 15 307
SPS evolution + April ceramic 36 708
Corail + Delta motion 8 151
GTS + Exceed 4 66
AMIStem-C + Mpact 5 75
SPS modular + April ceramic 21 283
Stelia-stem + Ana.nova hybrid 18 228
GTS + G7 9 63
Figure 4.14 (Part 3) Two year revision rates of uncemented stem-cup combinations used in primary total hip arthroplasty 2012–2018
Group average and 95% confidence interval
2-year revision-rate and 95% confidence interval
Outlier alert boundary
stigate the reasons for the observed deviations from
the national average.
The average revision rate is calculated on all primary
implants for primary OA per fixation group. The aver-
age revision rate for all uncemented THAs is 2.6% (CI
2.4 to 2.7) and 2.2% (CI 1.9 to 2.5) for hybrid fixation.
Because of its infrequent use and small numbers,
the analysis for all cemented THAs was omitted.
Figures 4.14 and 4.15 show the two-year revision
rate of all combinations with N >50. The revision rates
are adjusted for effects of mortality and emigration.
Combinations of implants lying outside the outlier
boundary (revision rate twice the revision rate of the
group) are potential outliers. They are further analy-
zed following the protocol described above.
* Number of patients with at least two years follow-up (i.e. primary prosthesis in 2012–2016).** Rates ajusted for effects of mortality and emigration.
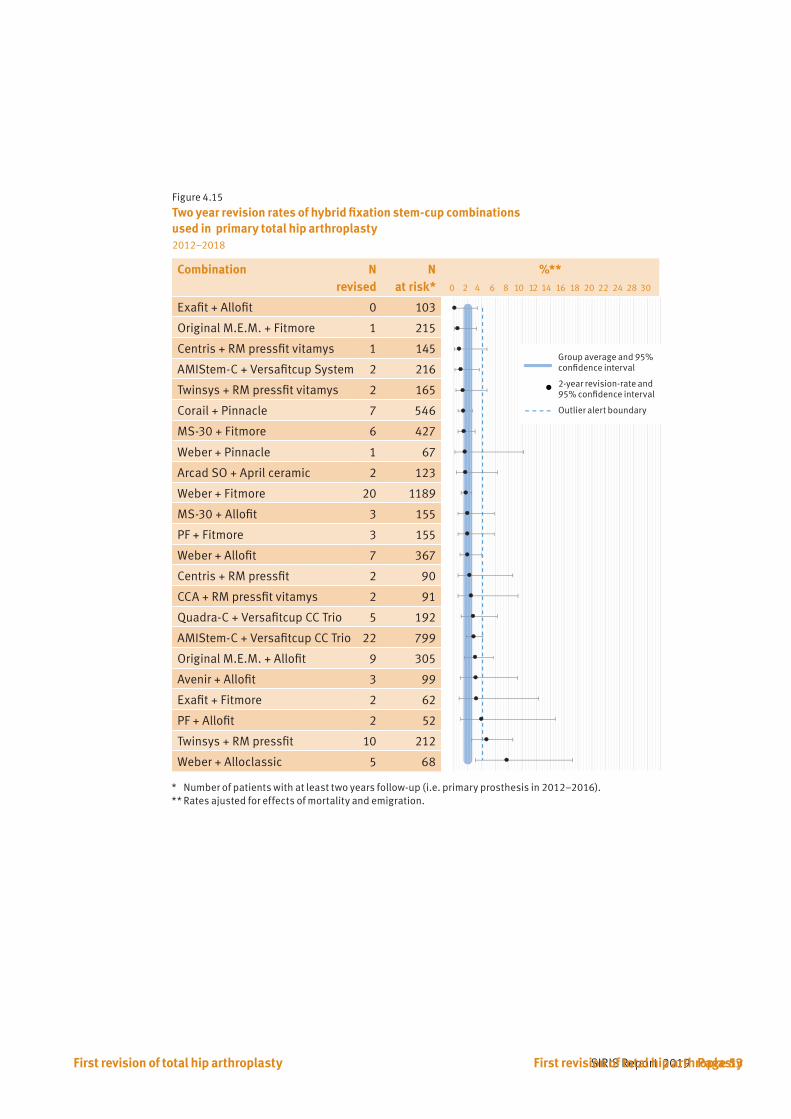
SIRIS Report 2019 Page 53First revision of total hip arthroplasty
Figure 4.15 Two year revision rates of hybrid fixation stem-cup combinations used in primary total hip arthroplasty 2012–2018
Combination N revised
N at risk*
%** 0 2 4 6 8 10 12 14 16 18 20 22 24 28 30
Exafit + Allofit 0 103
Original M.E.M. + Fitmore 1 215
Centris + RM pressfit vitamys 1 145
AMIStem-C + Versafitcup System 2 216
Twinsys + RM pressfit vitamys 2 165
Corail + Pinnacle 7 546
MS-30 + Fitmore 6 427
Weber + Pinnacle 1 67
Arcad SO + April ceramic 2 123
Weber + Fitmore 20 1189
MS-30 + Allofit 3 155
PF + Fitmore 3 155
Weber + Allofit 7 367
Centris + RM pressfit 2 90
CCA + RM pressfit vitamys 2 91
Quadra-C + Versafitcup CC Trio 5 192
AMIStem-C + Versafitcup CC Trio 22 799
Original M.E.M. + Allofit 9 305
Avenir + Allofit 3 99
Exafit + Fitmore 2 62
PF + Allofit 2 52
Twinsys + RM pressfit 10 212
Weber + Alloclassic 5 68
Group average and 95% confidence interval
2-year revision-rate and 95% confidence interval
Outlier alert boundary
* Number of patients with at least two years follow-up (i.e. primary prosthesis in 2012–2016).** Rates ajusted for effects of mortality and emigration.
First revision of total hip arthroplasty
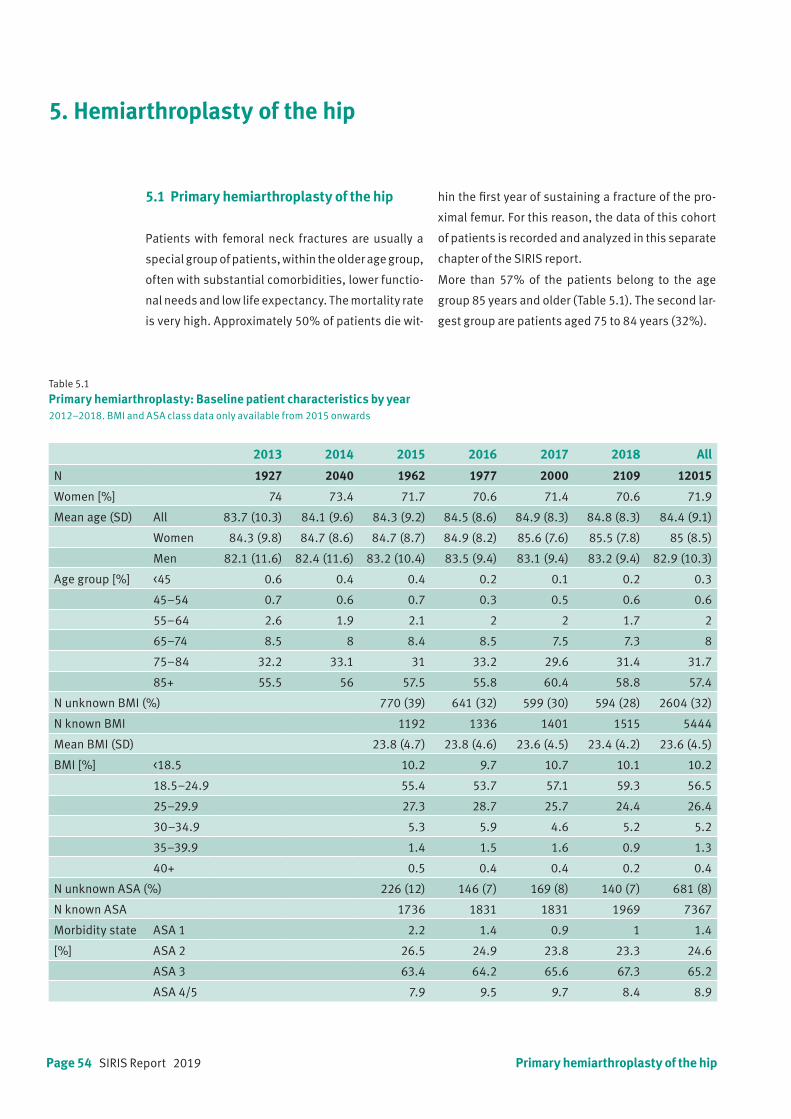
Page 54 SIRIS Report 2019 Primary hemiarthroplasty of the hip
5. Hemiarthroplasty of the hip
5.1 Primary hemiarthroplasty of the hip
Patients with femoral neck fractures are usually a
special group of patients, within the older age group,
often with substantial comorbidities, lower functio-
nal needs and low life expectancy. The mortality rate
is very high. Approximately 50% of patients die wit-
Table 5.1 Primary hemiarthroplasty: Baseline patient characteristics by year2012–2018. BMI and ASA class data only available from 2015 onwards
2013 2014 2015 2016 2017 2018 All
N 1927 2040 1962 1977 2000 2109 12015
Women [%] 74 73.4 71.7 70.6 71.4 70.6 71.9
Mean age (SD) All 83.7 (10.3) 84.1 (9.6) 84.3 (9.2) 84.5 (8.6) 84.9 (8.3) 84.8 (8.3) 84.4 (9.1)
Women 84.3 (9.8) 84.7 (8.6) 84.7 (8.7) 84.9 (8.2) 85.6 (7.6) 85.5 (7.8) 85 (8.5)
Men 82.1 (11.6) 82.4 (11.6) 83.2 (10.4) 83.5 (9.4) 83.1 (9.4) 83.2 (9.4) 82.9 (10.3)
Age group [%] <45 0.6 0.4 0.4 0.2 0.1 0.2 0.3
45–54 0.7 0.6 0.7 0.3 0.5 0.6 0.6
55–64 2.6 1.9 2.1 2 2 1.7 2
65–74 8.5 8 8.4 8.5 7.5 7.3 8
75–84 32.2 33.1 31 33.2 29.6 31.4 31.7
85+ 55.5 56 57.5 55.8 60.4 58.8 57.4
N unknown BMI (%) 770 (39) 641 (32) 599 (30) 594 (28) 2604 (32)
N known BMI 1192 1336 1401 1515 5444
Mean BMI (SD) 23.8 (4.7) 23.8 (4.6) 23.6 (4.5) 23.4 (4.2) 23.6 (4.5)
BMI [%] <18.5 10.2 9.7 10.7 10.1 10.2
18.5–24.9 55.4 53.7 57.1 59.3 56.5
25–29.9 27.3 28.7 25.7 24.4 26.4
30–34.9 5.3 5.9 4.6 5.2 5.2
35–39.9 1.4 1.5 1.6 0.9 1.3
40+ 0.5 0.4 0.4 0.2 0.4
N unknown ASA (%) 226 (12) 146 (7) 169 (8) 140 (7) 681 (8)
N known ASA 1736 1831 1831 1969 7367
Morbidity state ASA 1 2.2 1.4 0.9 1 1.4
[%] ASA 2 26.5 24.9 23.8 23.3 24.6
ASA 3 63.4 64.2 65.6 67.3 65.2
ASA 4/5 7.9 9.5 9.7 8.4 8.9
hin the first year of sustaining a fracture of the pro-
ximal femur. For this reason, the data of this cohort
of patients is recorded and analyzed in this separate
chapter of the SIRIS report.
More than 57% of the patients belong to the age
group 85 years and older (Table 5.1). The second lar-
gest group are patients aged 75 to 84 years (32%).
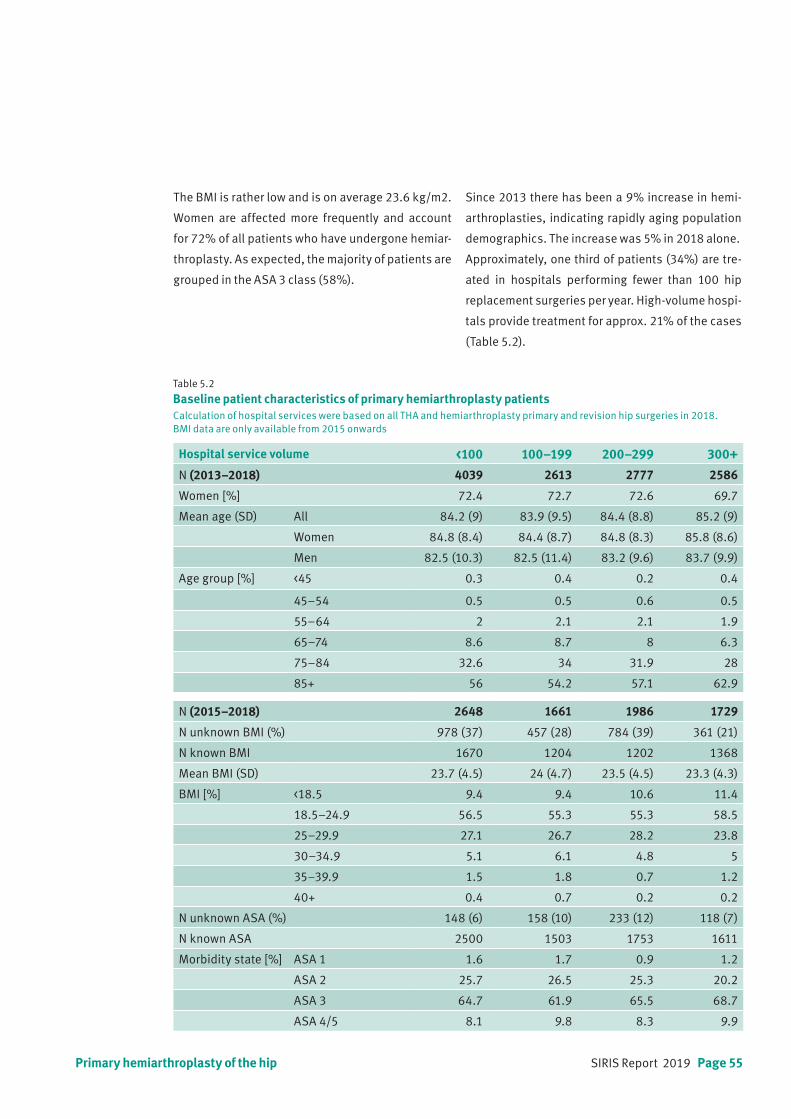
SIRIS Report 2019 Page 55
Table 5.2 Baseline patient characteristics of primary hemiarthroplasty patientsCalculation of hospital services were based on all THA and hemiarthroplasty primary and revision hip surgeries in 2018. BMI data are only available from 2015 onwards
Hospital service volume <100 100–199 200–299 300+
N (2013–2018) 4039 2613 2777 2586
Women [%] 72.4 72.7 72.6 69.7
Mean age (SD) All 84.2 (9) 83.9 (9.5) 84.4 (8.8) 85.2 (9)
Women 84.8 (8.4) 84.4 (8.7) 84.8 (8.3) 85.8 (8.6)
Men 82.5 (10.3) 82.5 (11.4) 83.2 (9.6) 83.7 (9.9)
Age group [%] <45 0.3 0.4 0.2 0.4
45–54 0.5 0.5 0.6 0.5
55–64 2 2.1 2.1 1.9
65–74 8.6 8.7 8 6.3
75–84 32.6 34 31.9 28
85+ 56 54.2 57.1 62.9
N (2015–2018) 2648 1661 1986 1729
N unknown BMI (%) 978 (37) 457 (28) 784 (39) 361 (21)
N known BMI 1670 1204 1202 1368
Mean BMI (SD) 23.7 (4.5) 24 (4.7) 23.5 (4.5) 23.3 (4.3)
BMI [%] <18.5 9.4 9.4 10.6 11.4
18.5–24.9 56.5 55.3 55.3 58.5
25–29.9 27.1 26.7 28.2 23.8
30–34.9 5.1 6.1 4.8 5
35–39.9 1.5 1.8 0.7 1.2
40+ 0.4 0.7 0.2 0.2
N unknown ASA (%) 148 (6) 158 (10) 233 (12) 118 (7)
N known ASA 2500 1503 1753 1611
Morbidity state [%] ASA 1 1.6 1.7 0.9 1.2
ASA 2 25.7 26.5 25.3 20.2
ASA 3 64.7 61.9 65.5 68.7
ASA 4/5 8.1 9.8 8.3 9.9
Primary hemiarthroplasty of the hip
The BMI is rather low and is on average 23.6 kg/m2.
Women are affected more frequently and account
for 72% of all patients who have undergone hemiar-
throplasty. As expected, the majority of patients are
grouped in the ASA 3 class (58%).
Since 2013 there has been a 9% increase in hemi-
arthroplasties, indicating rapidly aging population
demographics. The increase was 5% in 2018 alone.
Approximately, one third of patients (34%) are tre-
ated in hospitals performing fewer than 100 hip
replacement surgeries per year. High-volume hospi-
tals provide treatment for approx. 21% of the cases
(Table 5.2).
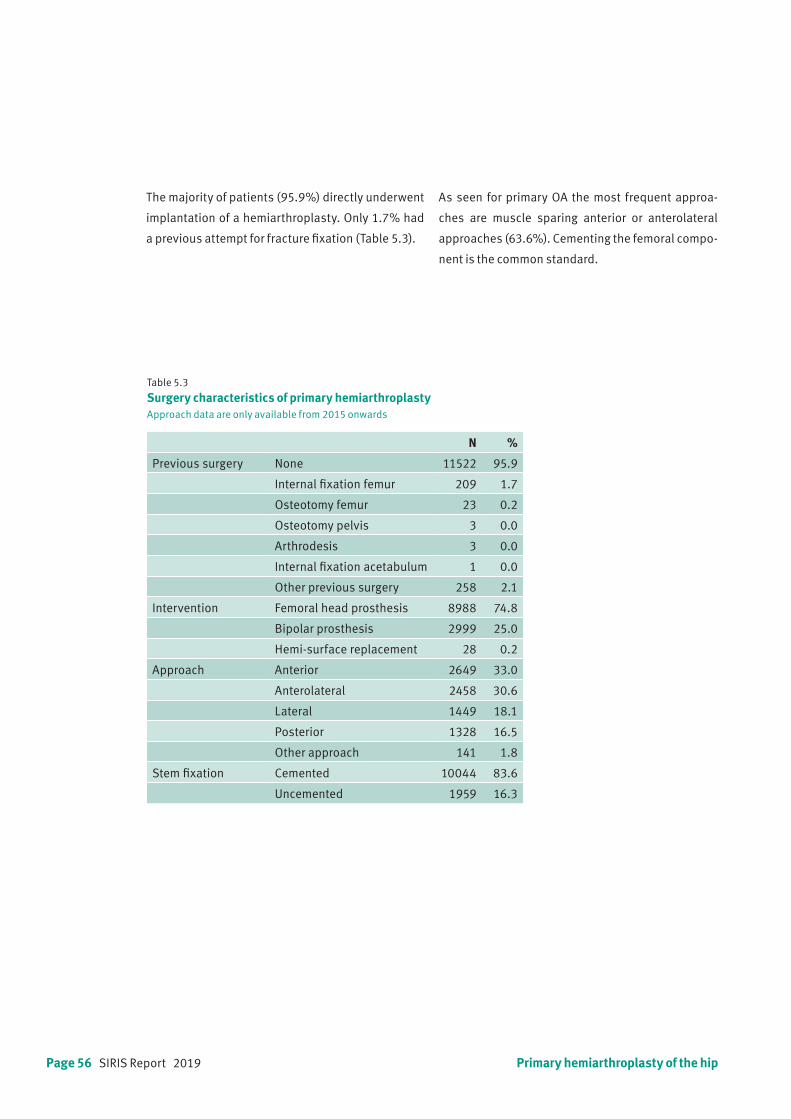
Page 56 SIRIS Report 2019
Table 5.3
Surgery characteristics of primary hemiarthroplastyApproach data are only available from 2015 onwards
N %
Previous surgery None 11522 95.9
Internal fixation femur 209 1.7
Osteotomy femur 23 0.2
Osteotomy pelvis 3 0.0
Arthrodesis 3 0.0
Internal fixation acetabulum 1 0.0
Other previous surgery 258 2.1
Intervention Femoral head prosthesis 8988 74.8
Bipolar prosthesis 2999 25.0
Hemi-surface replacement 28 0.2
Approach Anterior 2649 33.0
Anterolateral 2458 30.6
Lateral 1449 18.1
Posterior 1328 16.5
Other approach 141 1.8
Stem fixation Cemented 10044 83.6
Uncemented 1959 16.3
The majority of patients (95.9%) directly underwent
implantation of a hemiarthroplasty. Only 1.7% had
a previous attempt for fracture fixation (Table 5.3).
Primary hemiarthroplasty of the hip
As seen for primary OA the most frequent approa-
ches are muscle sparing anterior or anterolateral
approaches (63.6%). Cementing the femoral compo-
nent is the common standard.
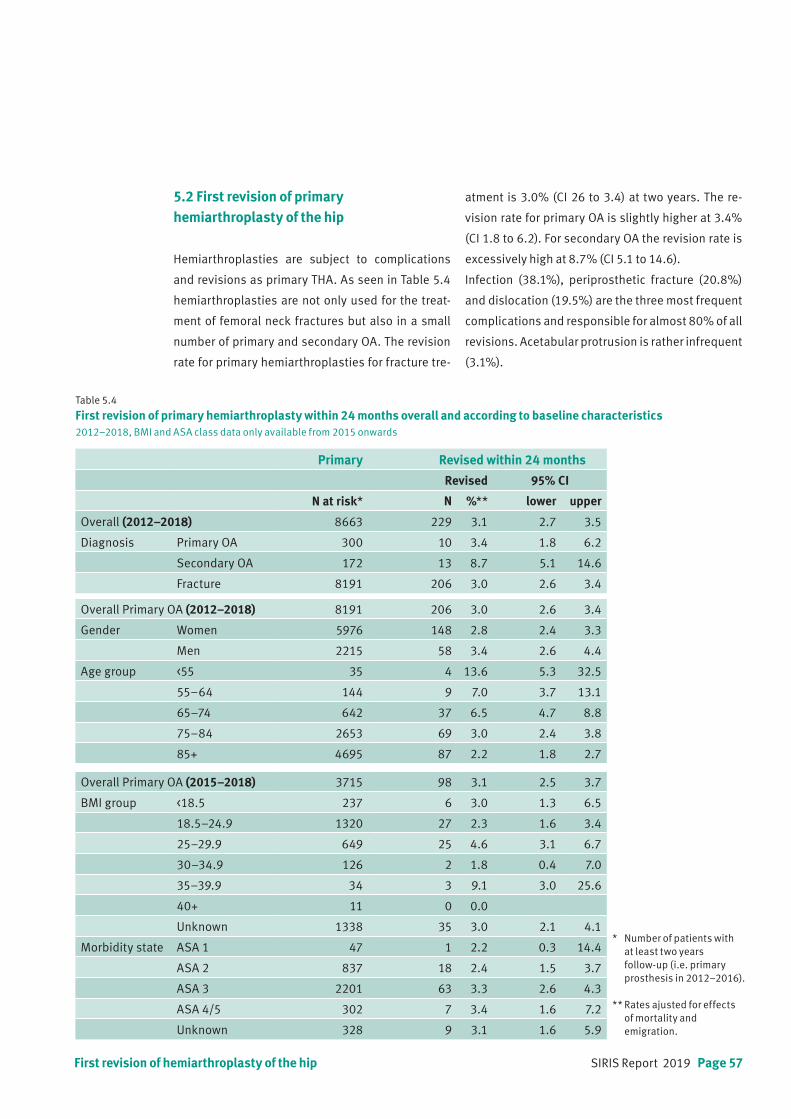
SIRIS Report 2019 Page 57
Table 5.4 First revision of primary hemiarthroplasty within 24 months overall and according to baseline characteristics2012–2018, BMI and ASA class data only available from 2015 onwards
Primary Revised within 24 months
Revised 95% CI
N at risk* N %** lower upper
Overall (2012–2018) 8663 229 3.1 2.7 3.5
Diagnosis Primary OA 300 10 3.4 1.8 6.2
Secondary OA 172 13 8.7 5.1 14.6
Fracture 8191 206 3.0 2.6 3.4
Overall Primary OA (2012–2018) 8191 206 3.0 2.6 3.4
Gender Women 5976 148 2.8 2.4 3.3
Men 2215 58 3.4 2.6 4.4
Age group <55 35 4 13.6 5.3 32.5
55–64 144 9 7.0 3.7 13.1
65–74 642 37 6.5 4.7 8.8
75–84 2653 69 3.0 2.4 3.8
85+ 4695 87 2.2 1.8 2.7
Overall Primary OA (2015–2018) 3715 98 3.1 2.5 3.7
BMI group <18.5 237 6 3.0 1.3 6.5
18.5–24.9 1320 27 2.3 1.6 3.4
25–29.9 649 25 4.6 3.1 6.7
30–34.9 126 2 1.8 0.4 7.0
35–39.9 34 3 9.1 3.0 25.6
40+ 11 0 0.0
Unknown 1338 35 3.0 2.1 4.1
Morbidity state ASA 1 47 1 2.2 0.3 14.4
ASA 2 837 18 2.4 1.5 3.7
ASA 3 2201 63 3.3 2.6 4.3
ASA 4/5 302 7 3.4 1.6 7.2
Unknown 328 9 3.1 1.6 5.9
* Number of patients with at least two years follow-up (i.e. primary prosthesis in 2012–2016).
** Rates ajusted for effects of mortality and emigration.
5.2 First revision of primaryhemiarthroplasty of the hip
Hemiarthroplasties are subject to complications
and revisions as primary THA. As seen in Table 5.4
hemiarthroplasties are not only used for the treat-
ment of femoral neck fractures but also in a small
number of primary and secondary OA. The revision
rate for primary hemiarthroplasties for fracture tre-
atment is 3.0% (CI 26 to 3.4) at two years. The re-
vision rate for primary OA is slightly higher at 3.4%
(CI 1.8 to 6.2). For secondary OA the revision rate is
excessively high at 8.7% (CI 5.1 to 14.6).
Infection (38.1%), periprosthetic fracture (20.8%)
and dislocation (19.5%) are the three most frequent
complications and responsible for almost 80% of all
revisions. Acetabular protrusion is rather infrequent
(3.1%).
First revision of hemiarthroplasty of the hip
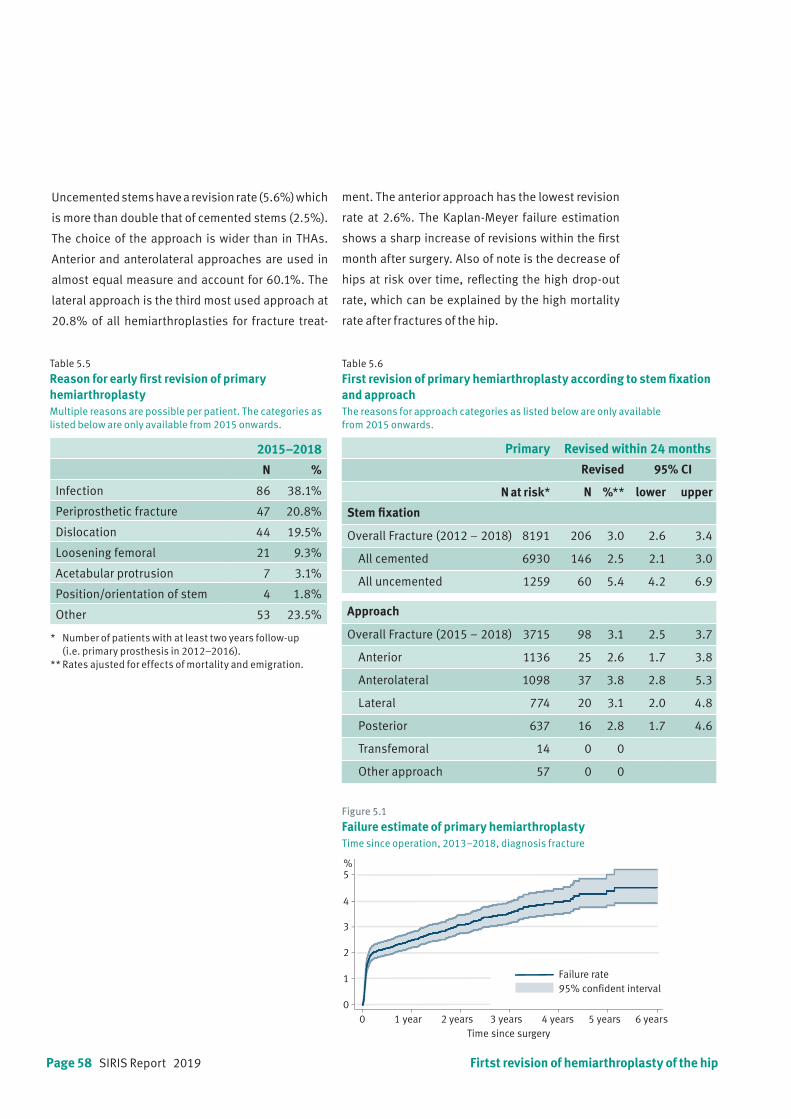
Page 58 SIRIS Report 2019
* Number of patients with at least two years follow-up (i.e. primary prosthesis in 2012–2016).** Rates ajusted for effects of mortality and emigration.
Uncemented stems have a revision rate (5.6%) which
is more than double that of cemented stems (2.5%).
The choice of the approach is wider than in THAs.
Anterior and anterolateral approaches are used in
almost equal measure and account for 60.1%. The
lateral approach is the third most used approach at
20.8% of all hemiarthroplasties for fracture treat-
ment. The anterior approach has the lowest revision
rate at 2.6%. The Kaplan-Meyer failure estimation
shows a sharp increase of revisions within the first
month after surgery. Also of note is the decrease of
hips at risk over time, reflecting the high drop-out
rate, which can be explained by the high mortality
rate after fractures of the hip.
Table 5.5
Reason for early first revision of primary hemiarthroplasty Multiple reasons are possible per patient. The categories as listed below are only available from 2015 onwards.
2015–2018
N %
Infection 86 38.1%
Periprosthetic fracture 47 20.8%
Dislocation 44 19.5%
Loosening femoral 21 9.3%
Acetabular protrusion 7 3.1%
Position/orientation of stem 4 1.8%
Other 53 23.5%
Table 5.6 First revision of primary hemiarthroplasty according to stem fixation and approachThe reasons for approach categories as listed below are only available from 2015 onwards.
Primary Revised within 24 months
Revised 95% CI
N at risk* N %** lower upper
Stem fixation
Overall Fracture (2012 – 2018) 8191 206 3.0 2.6 3.4
All cemented 6930 146 2.5 2.1 3.0
All uncemented 1259 60 5.4 4.2 6.9
Approach
Overall Fracture (2015 – 2018) 3715 98 3.1 2.5 3.7
Anterior 1136 25 2.6 1.7 3.8
Anterolateral 1098 37 3.8 2.8 5.3
Lateral 774 20 3.1 2.0 4.8
Posterior 637 16 2.8 1.7 4.6
Transfemoral 14 0 0
Other approach 57 0 0
Figure 5.1
Failure estimate of primary hemiarthroplastyTime since operation, 2013–2018, diagnosis fracture
0 1 year 2 years 3 years 4 years 5 years 6 years
1
0
2
3
4
5%
Time since surgery
95% confident intervalFailure rate
Firtst revision of hemiarthroplasty of the hip
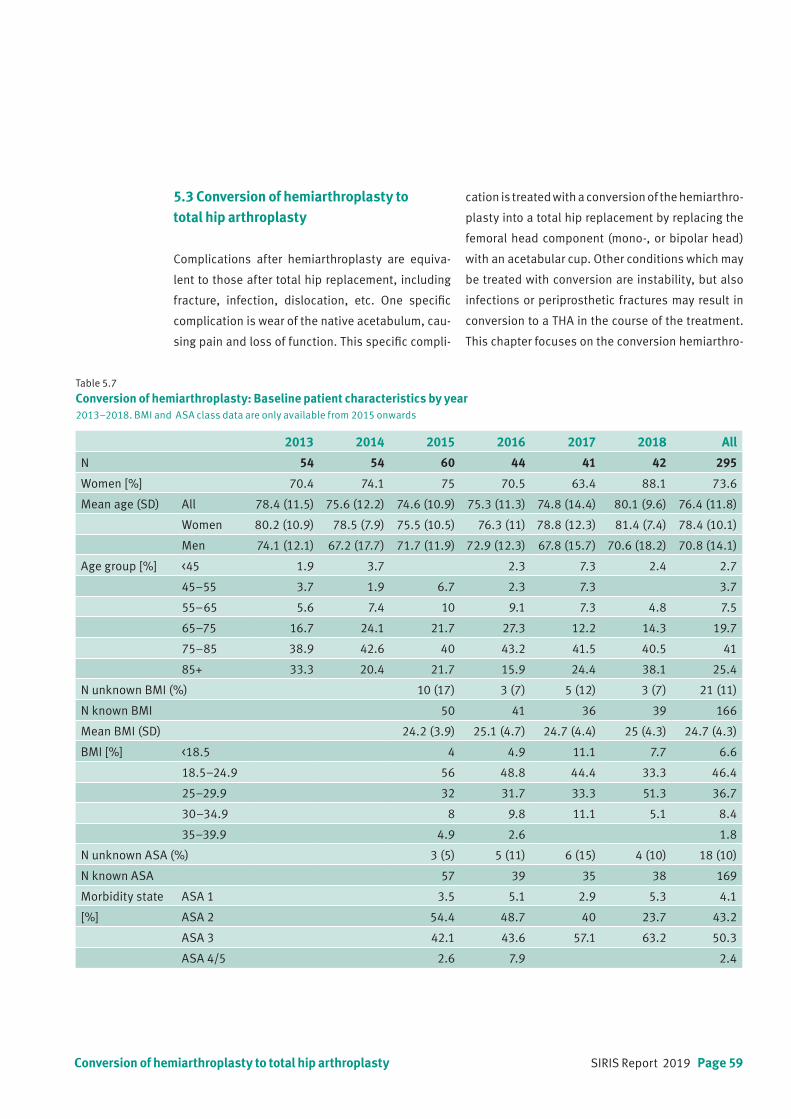
SIRIS Report 2019 Page 59
Table 5.7
Conversion of hemiarthroplasty: Baseline patient characteristics by year2013–2018. BMI and ASA class data are only available from 2015 onwards
2013 2014 2015 2016 2017 2018 All
N 54 54 60 44 41 42 295
Women [%] 70.4 74.1 75 70.5 63.4 88.1 73.6
Mean age (SD) All 78.4 (11.5) 75.6 (12.2) 74.6 (10.9) 75.3 (11.3) 74.8 (14.4) 80.1 (9.6) 76.4 (11.8)
Women 80.2 (10.9) 78.5 (7.9) 75.5 (10.5) 76.3 (11) 78.8 (12.3) 81.4 (7.4) 78.4 (10.1)
Men 74.1 (12.1) 67.2 (17.7) 71.7 (11.9) 72.9 (12.3) 67.8 (15.7) 70.6 (18.2) 70.8 (14.1)
Age group [%] <45 1.9 3.7 2.3 7.3 2.4 2.7
45–55 3.7 1.9 6.7 2.3 7.3 3.7
55–65 5.6 7.4 10 9.1 7.3 4.8 7.5
65–75 16.7 24.1 21.7 27.3 12.2 14.3 19.7
75–85 38.9 42.6 40 43.2 41.5 40.5 41
85+ 33.3 20.4 21.7 15.9 24.4 38.1 25.4
N unknown BMI (%) 10 (17) 3 (7) 5 (12) 3 (7) 21 (11)
N known BMI 50 41 36 39 166
Mean BMI (SD) 24.2 (3.9) 25.1 (4.7) 24.7 (4.4) 25 (4.3) 24.7 (4.3)
BMI [%] <18.5 4 4.9 11.1 7.7 6.6
18.5–24.9 56 48.8 44.4 33.3 46.4
25–29.9 32 31.7 33.3 51.3 36.7
30–34.9 8 9.8 11.1 5.1 8.4
35–39.9 4.9 2.6 1.8
N unknown ASA (%) 3 (5) 5 (11) 6 (15) 4 (10) 18 (10)
N known ASA 57 39 35 38 169
Morbidity state ASA 1 3.5 5.1 2.9 5.3 4.1
[%] ASA 2 54.4 48.7 40 23.7 43.2
ASA 3 42.1 43.6 57.1 63.2 50.3
ASA 4/5 2.6 7.9 2.4
5.3 Conversion of hemiarthroplasty to total hip arthroplasty
Complications after hemiarthroplasty are equiva-
lent to those after total hip replacement, including
fracture, infection, dislocation, etc. One specific
complication is wear of the native acetabulum, cau-
sing pain and loss of function. This specific compli-
cation is treated with a conversion of the hemiarthro-
plasty into a total hip replacement by replacing the
femoral head component (mono-, or bipolar head)
with an acetabular cup. Other conditions which may
be treated with conversion are instability, but also
infections or periprosthetic fractures may result in
conversion to a THA in the course of the treatment.
This chapter focuses on the conversion hemiarthro-
Conversion of hemiarthroplasty to total hip arthroplasty
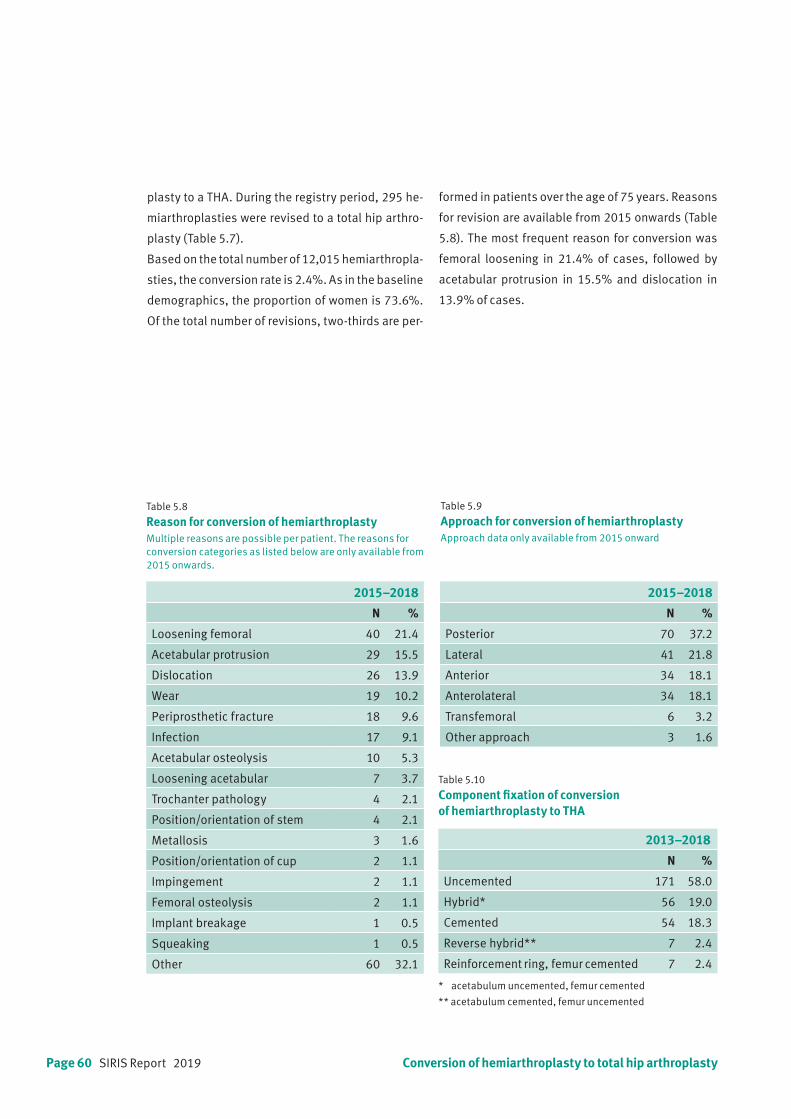
Page 60 SIRIS Report 2019
Table 5.9
Approach for conversion of hemiarthroplastyApproach data only available from 2015 onward
Table 5.10 Component fixation of conversion of hemiarthroplasty to THA
Table 5.8 Reason for conversion of hemiarthroplastyMultiple reasons are possible per patient. The reasons for conversion categories as listed below are only available from 2015 onwards.
2015–2018
N %
Loosening femoral 40 21.4
Acetabular protrusion 29 15.5
Dislocation 26 13.9
Wear 19 10.2
Periprosthetic fracture 18 9.6
Infection 17 9.1
Acetabular osteolysis 10 5.3
Loosening acetabular 7 3.7
Trochanter pathology 4 2.1
Position/orientation of stem 4 2.1
Metallosis 3 1.6
Position/orientation of cup 2 1.1
Impingement 2 1.1
Femoral osteolysis 2 1.1
Implant breakage 1 0.5
Squeaking 1 0.5
Other 60 32.1
2015–2018
N %
Posterior 70 37.2
Lateral 41 21.8
Anterior 34 18.1
Anterolateral 34 18.1
Transfemoral 6 3.2
Other approach 3 1.6
2013–2018
N %
Uncemented 171 58.0
Hybrid* 56 19.0
Cemented 54 18.3
Reverse hybrid** 7 2.4
Reinforcement ring, femur cemented 7 2.4
* acetabulum uncemented, femur cemented
** acetabulum cemented, femur uncemented
Conversion of hemiarthroplasty to total hip arthroplasty
plasty to a THA. During the registry period, 295 he-
miarthroplasties were revised to a total hip arthro-
plasty (Table 5.7).
Based on the total number of 12,015 hemiarthropla-
sties, the conversion rate is 2.4%. As in the baseline
demographics, the proportion of women is 73.6%.
Of the total number of revisions, two-thirds are per-
formed in patients over the age of 75 years. Reasons
for revision are available from 2015 onwards (Table
5.8). The most frequent reason for conversion was
femoral loosening in 21.4% of cases, followed by
acetabular protrusion in 15.5% and dislocation in
13.9% of cases.
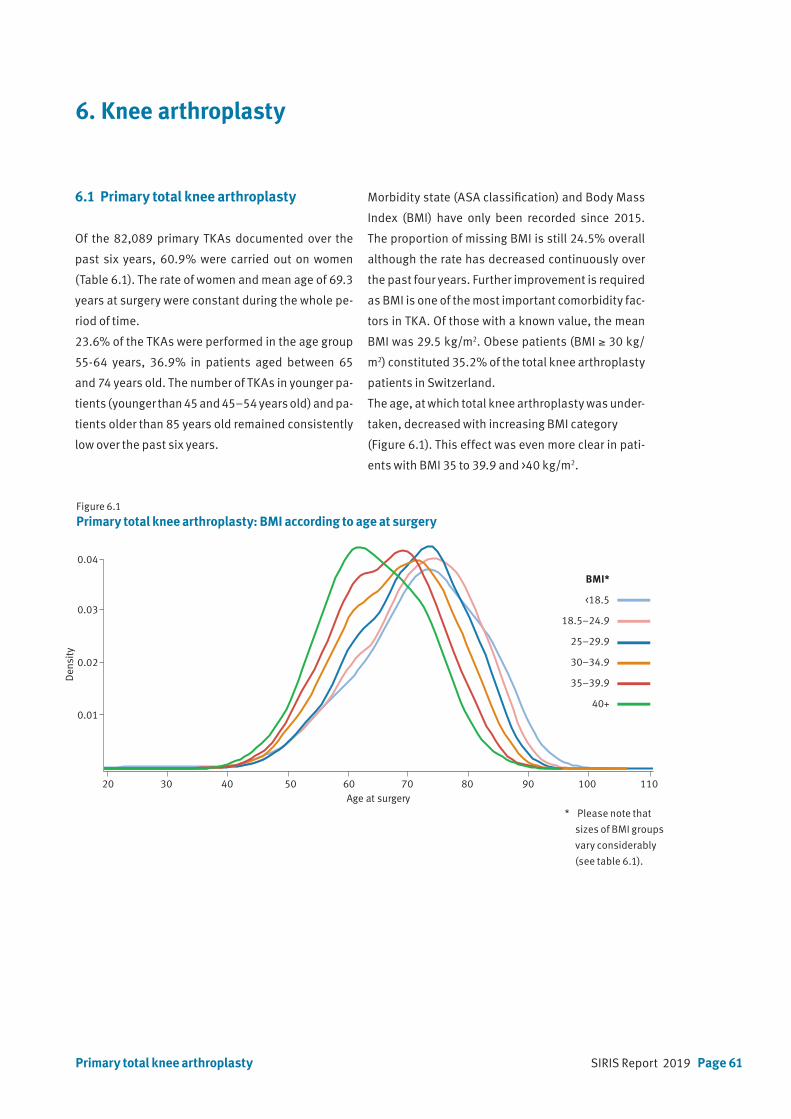
SIRIS Report 2019 Page 61
* acetabulum uncemented, femur cemented
** acetabulum cemented, femur uncemented
6. Knee arthroplasty
6.1 Primary total knee arthroplasty
Of the 82,089 primary TKAs documented over the
past six years, 60.9% were carried out on women
(Table 6.1). The rate of women and mean age of 69.3
years at surgery were constant during the whole pe-
riod of time.
23.6% of the TKAs were performed in the age group
55-64 years, 36.9% in patients aged between 65
and 74 years old. The number of TKAs in younger pa-
tients (younger than 45 and 45–54 years old) and pa-
tients older than 85 years old remained consistently
low over the past six years.
Figure 6.1 Primary total knee arthroplasty: BMI according to age at surgery
Morbidity state (ASA classification) and Body Mass
Index (BMI) have only been recorded since 2015.
The proportion of missing BMI is still 24.5% overall
although the rate has decreased continuously over
the past four years. Further improvement is required
as BMI is one of the most important comorbidity fac-
tors in TKA. Of those with a known value, the mean
BMI was 29.5 kg/m2. Obese patients (BMI ≥ 30 kg/
m2) constituted 35.2% of the total knee arthroplasty
patients in Switzerland.
The age, at which total knee arthroplasty was under-
taken, decreased with increasing BMI category
(Figure 6.1). This effect was even more clear in pati-
ents with BMI 35 to 39.9 and >40 kg/m2.
Primary total knee arthroplasty
Age at surgery 20 30 40 50 60 70 80 90 100 110
0.01
0.02
0.03
0.04
Den
sity
BMI*
<18.5
18.5–24.9
25–29.9
30–34.9
35–39.9
40+
* Please note that
sizes of BMI groups
vary considerably
(see table 6.1).

Page 62 SIRIS Report 2019
Table 6.1
Primary total knee arthroplasty: Baseline patient characteristics by yearBMI and ASA class data areonly available from 2015 onwards
Primary total knee arthroplasty
+Prozentwerte in Klammernneue Tabellen von Christian
+Prozentwerte in Klammernneue Tabellen von Christian
N 2013 2014 2015 2016 2017 2018
N 82089 12928 13263 13147 14301 14181 14269
Diagnosis [%] Primary OA 90.9 96.4 96.7 88 88.3 87.9 88.7
Secondary OA 9.1 3.6 3.3 12 11.7 12.1 11.3
Inflammatory origin 1.0 0.9 0.9 1.2 1.2 0.8 0.9
Fracture 1.6 0.4 0.5 2.3 2 2.2 2.1
Lesion of ligament 3.4 4.7 5.1 5.4
Infection 0.1 0.2 0.2 0.2
Osteonecrosis 1.8 1.7 1.4 2.2 1.8 1.8 1.8
Other 1.2 0.6 0.5 1.4 1.4 1.7 1.4
Women [%] 60.9 61.2 60.7 61.3 61.2 60.6 60.4
Mean age (SD) All 69.3 (10) 69.2 (10.7) 69.2 (10.4) 69.4 (10) 69.3 (9.7) 69.4 (9.5) 69.3 (9.8)
Women 69.9 (10) 70.3 (10.3) 69.8 (10.7) 70.1 (10) 70 (9.7) 70 (9.6) 69.9 (9.7)
Men 68.3 (9.9) 67.9 (10.6) 68.2 (10) 68.3 (9.9) 68.3 (9.6) 68.4 (9.3) 68.5 (9.8)
Age group [%] <45 0.7 1.2 0.9 0.7 0.6 0.5 0.6
45–54 6.5 6.4 6.6 6.6 6.6 6.3 6.4
55–64 23.6 23 23.2 23.4 23.5 23.7 24.6
65–74 36.9 36.3 37 36.7 37.5 37.6 36
75–84 27.8 28.4 28 28 27.7 27.4 27.7
85+ 4.5 4.7 4.4 4.6 4.2 4.4 4.8
N unknown BMI (%) 10991 (20) 3257 (25) 2891 (20) 2590 (18) 2253 (16)
N known BMI 44907 9890 11410 11591 12016
Mean BMI (SD) 29.5 (5.9) 29.4 (6.1) 29.5 (5.6) 29.5 (5.7) 29.5 (5.9)
BMI [%] <18.5 0.5 0.5 0.4 0.5 0.5
18.5–24.9 20.9 21.1 21.1 20.9 20.5
25–29.9 38.9 39.6 38.9 38.5 38.7
30–34.9 24.8 24.2 24.5 24.9 25.4
35–39.9 10.4 10.1 10.5 10.6 10.5
40+ 4.6 4.5 4.6 4.7 4.5
N unknown ASA (%) 5902 (11) 1700 (13) 1546 (11) 1431 (10) 1225 (9)
N known ASA 49996 11447 12755 12750 13044
Morbidity state ASA 1 9.5 11.8 9.7 8.5 8.2
[%] ASA 2 62.7 61.4 62.5 63.5 63.1
ASA 3 27.5 26.4 27.4 27.6 28.3
ASA 4/5 0.4 0.3 0.3 0.4 0.4
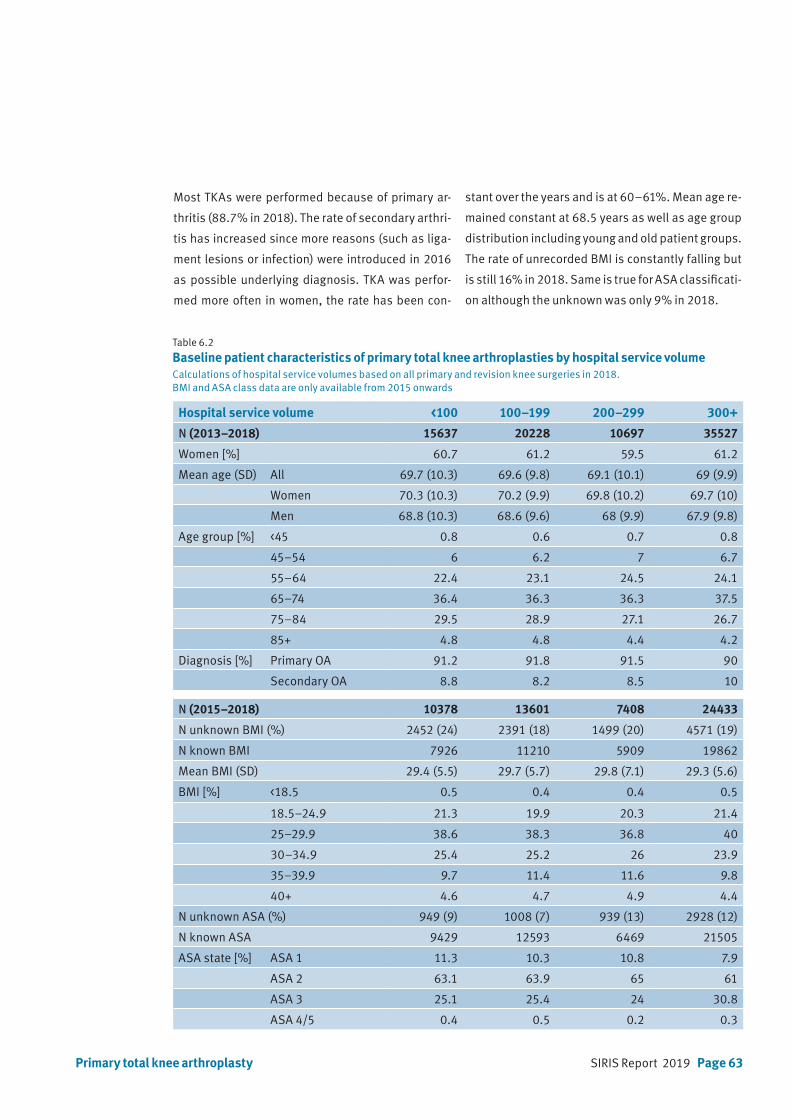
SIRIS Report 2019 Page 63
Table 6.2 Baseline patient characteristics of primary total knee arthroplasties by hospital service volume Calculations of hospital service volumes based on all primary and revision knee surgeries in 2018. BMI and ASA class data are only available from 2015 onwards
Hospital service volume <100 100–199 200–299 300+
N (2013–2018) 15637 20228 10697 35527
Women [%] 60.7 61.2 59.5 61.2
Mean age (SD) All 69.7 (10.3) 69.6 (9.8) 69.1 (10.1) 69 (9.9)
Women 70.3 (10.3) 70.2 (9.9) 69.8 (10.2) 69.7 (10)
Men 68.8 (10.3) 68.6 (9.6) 68 (9.9) 67.9 (9.8)
Age group [%] <45 0.8 0.6 0.7 0.8
45–54 6 6.2 7 6.7
55–64 22.4 23.1 24.5 24.1
65–74 36.4 36.3 36.3 37.5
75–84 29.5 28.9 27.1 26.7
85+ 4.8 4.8 4.4 4.2
Diagnosis [%] Primary OA 91.2 91.8 91.5 90
Secondary OA 8.8 8.2 8.5 10
N (2015–2018) 10378 13601 7408 24433
N unknown BMI (%) 2452 (24) 2391 (18) 1499 (20) 4571 (19)
N known BMI 7926 11210 5909 19862
Mean BMI (SD) 29.4 (5.5) 29.7 (5.7) 29.8 (7.1) 29.3 (5.6)
BMI [%] <18.5 0.5 0.4 0.4 0.5
18.5–24.9 21.3 19.9 20.3 21.4
25–29.9 38.6 38.3 36.8 40
30–34.9 25.4 25.2 26 23.9
35–39.9 9.7 11.4 11.6 9.8
40+ 4.6 4.7 4.9 4.4
N unknown ASA (%) 949 (9) 1008 (7) 939 (13) 2928 (12)
N known ASA 9429 12593 6469 21505
ASA state [%] ASA 1 11.3 10.3 10.8 7.9
ASA 2 63.1 63.9 65 61
ASA 3 25.1 25.4 24 30.8
ASA 4/5 0.4 0.5 0.2 0.3
Primary total knee arthroplasty
Most TKAs were performed because of primary ar-
thritis (88.7% in 2018). The rate of secondary arthri-
tis has increased since more reasons (such as liga-
ment lesions or infection) were introduced in 2016
as possible underlying diagnosis. TKA was perfor-
med more often in women, the rate has been con-
stant over the years and is at 60–61%. Mean age re-
mained constant at 68.5 years as well as age group
distribution including young and old patient groups.
The rate of unrecorded BMI is constantly falling but
is still 16% in 2018. Same is true for ASA classificati-
on although the unknown was only 9% in 2018.

Page 64 SIRIS Report 2019
Table 6.3
Primary total knee arthroplasty: Surgery characteristics
2013–2014 2015–2018
N % N %
Previous surgery None 17794 67.7 36701 65.7
Knee arthroscopy 5595 21.3 9631 17.3
Meniscectomy 9320 16.7
ACL reconstruction 2211 4.0
Osteotomy tibia close to knee 705 2.7 1740 3.1
Osteosynthesis tibia close to knee 399 1.5 705 1.3
Surgery for patella stabilization 385 1.5 692 1.2
Synovectomy 459 0.8
Osteotomy femur close to knee 134 0.5 287 0.5
Osteosynthesis femur close to knee 133 0.5 277 0.5
Surgery for treating infection 74 0.3 96 0.2
Surgery for tumor 22 0.0
Ligament reconstruction 1019 3.9
Other 1585 6.0 1723 3.1
Intervention CS (cruciate sacrificing) / UCOR 18450 33.1
unlinked post. stabilised 7026 26.7 16274 29.2
PCR (posterior cruciate retaining) 14398 25.8
BCR (bicruciate retaining) 875 1.6
hinge type 499 1.9 849 1.5
unlinked semi-constrained 1473 5.6 745 1.3
CCK constrained condylar knee 512 0.9
unlinked cruciate retaining 6001 22.8
unlinked meniscal 2745 10.4
unlinked rotating 7696 29.3
Other 829 3.2 3717 6.7
Technology Conventional 19366 73.7 40242 72.1
Computer assisted 3173 12.1 6840 12.3
Patient specific instrumentation 2218 8.4 6761 12.1
Minimal invasive 2147 8.2 3477 6.2
Other 685 1.2
Primary total knee arthroplasty
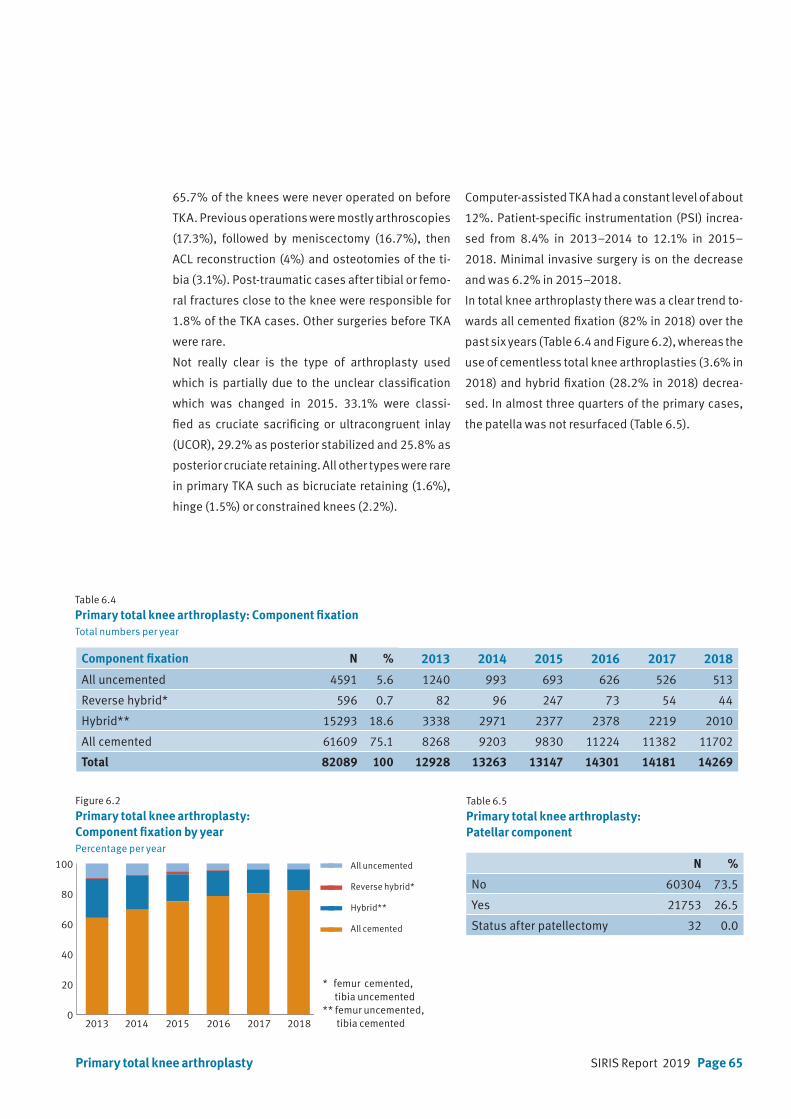
SIRIS Report 2019 Page 65
65.7% of the knees were never operated on before
TKA. Previous operations were mostly arthroscopies
(17.3%), followed by meniscectomy (16.7%), then
ACL reconstruction (4%) and osteotomies of the ti-
bia (3.1%). Post-traumatic cases after tibial or femo-
ral fractures close to the knee were responsible for
1.8% of the TKA cases. Other surgeries before TKA
were rare.
Not really clear is the type of arthroplasty used
which is partially due to the unclear classification
which was changed in 2015. 33.1% were classi-
fied as cruciate sacrificing or ultracongruent inlay
(UCOR), 29.2% as posterior stabilized and 25.8% as
posterior cruciate retaining. All other types were rare
in primary TKA such as bicruciate retaining (1.6%),
hinge (1.5%) or constrained knees (2.2%).
Computer-assisted TKA had a constant level of about
12%. Patient-specific instrumentation (PSI) increa-
sed from 8.4% in 2013–2014 to 12.1% in 2015–
2018. Minimal invasive surgery is on the decrease
and was 6.2% in 2015–2018.
In total knee arthroplasty there was a clear trend to-
wards all cemented fixation (82% in 2018) over the
past six years (Table 6.4 and Figure 6.2), whereas the
use of cementless total knee arthroplasties (3.6% in
2018) and hybrid fixation (28.2% in 2018) decrea-
sed. In almost three quarters of the primary cases,
the patella was not resurfaced (Table 6.5).
Table 6.4
Primary total knee arthroplasty: Component fixationTotal numbers per year
Table 6.5
Primary total knee arthroplasty: Patellar component
Figure 6.2
Primary total knee arthroplasty: Component fixation by yearPercentage per year
Component fixation N % 2013 2014 2015 2016 2017 2018
All uncemented 4591 5.6 1240 993 693 626 526 513
Reverse hybrid* 596 0.7 82 96 247 73 54 44
Hybrid** 15293 18.6 3338 2971 2377 2378 2219 2010
All cemented 61609 75.1 8268 9203 9830 11224 11382 11702
Total 82089 100 12928 13263 13147 14301 14181 14269
N %
No 60304 73.5
Yes 21753 26.5
Status after patellectomy 32 0.0
2012 2013 2014 2015 20160
3000
6000
9000
12000
15000
All uncemented
Femur cementedTibia uncemented
Femur uncemented Tibia cemented
All cemented
2012 2013 2014 2015 20160
3000
6000
9000
12000
15000
All uncemented
Femur cementedTibia uncemented
Femur uncemented Tibia cemented
All cemented
All uncemented
Reverse hybrid*
Hybrid**
All cemented
Primary total knee arthroplasty
2013 2014 2015 2016 2017 20180
20
40
60
80
100
120
all uncemented
femur cement, tibia no cement
femur no cement, tibia cement
all cemented
* femur cemented, tibia uncemented** femur uncemented, tibia cemented
Page 66 SIRIS Report 2019
6.2 Primary partial knee arthroplasty
Of all primary knee arthroplasties, 17.0% were par-
tial knee replacements (Table 3.5). The proportion
remained constant over the past five years and is the
highest in the international community including the
United Kingdom. 50.1% were carried out on women.
Mean age at surgery was almost 65 years (Table 6.6).
In the younger age groups, 2% of partial knee repla-
cements were performed on patients younger than
45 years and 14.2% on 45 to 54 year olds. In elderly
patients, 16.1% of partial knee replacements were
performed on of 75–84 year olds, and 2% of the pa-
tients were older than 85. Mean BMI was 28.4 kg/m2
in the partial knee replacement group. BMI was not
recorded in 27.6% of the cases.
84.3% of patients had an ASA classification of 1 or
2. In 10.6% of cases, the morbidity state was not re-
corded.
81.5% of the partial knee replacements were perfor-
med in hospitals with more than 100 interventions
per year (Table 6.7). 61.2% of the patients had not
Primary partial knee arthroplasty
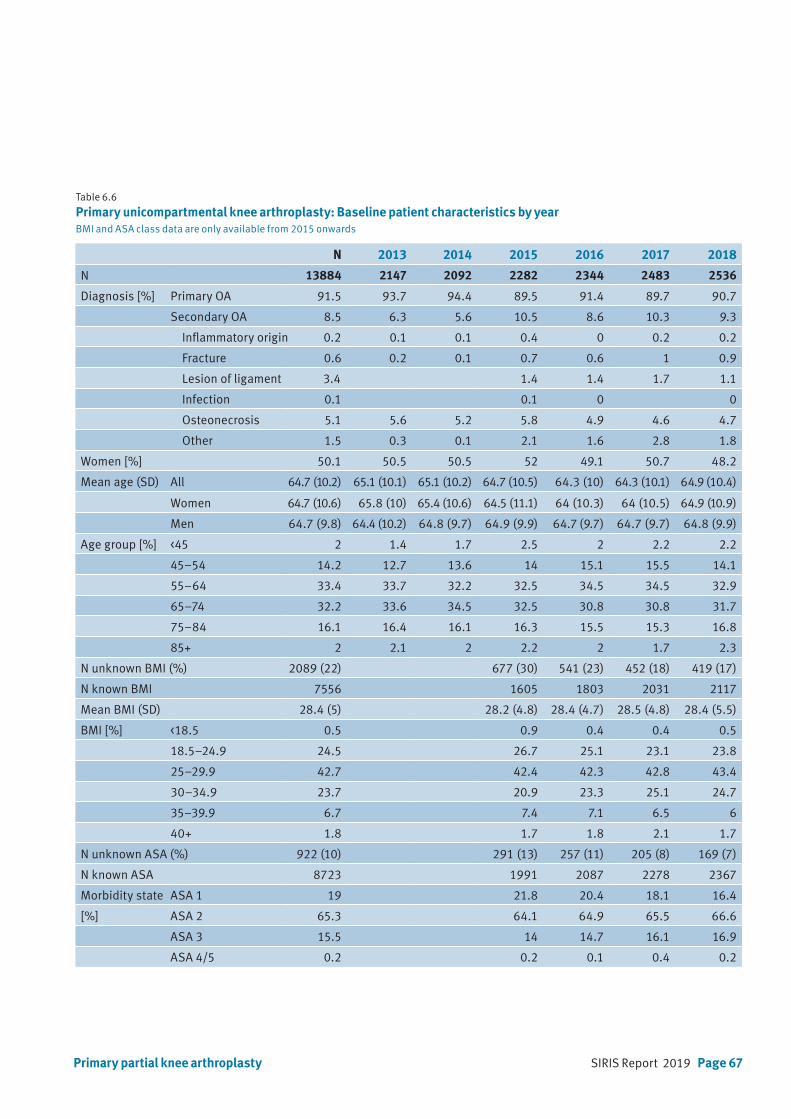
SIRIS Report 2019 Page 67Primary partial knee arthroplasty
Table 6.6
Primary unicompartmental knee arthroplasty: Baseline patient characteristics by yearBMI and ASA class data are only available from 2015 onwards
N 2013 2014 2015 2016 2017 2018
N 13884 2147 2092 2282 2344 2483 2536
Diagnosis [%] Primary OA 91.5 93.7 94.4 89.5 91.4 89.7 90.7
Secondary OA 8.5 6.3 5.6 10.5 8.6 10.3 9.3
Inflammatory origin 0.2 0.1 0.1 0.4 0 0.2 0.2
Fracture 0.6 0.2 0.1 0.7 0.6 1 0.9
Lesion of ligament 3.4 1.4 1.4 1.7 1.1
Infection 0.1 0.1 0 0
Osteonecrosis 5.1 5.6 5.2 5.8 4.9 4.6 4.7
Other 1.5 0.3 0.1 2.1 1.6 2.8 1.8
Women [%] 50.1 50.5 50.5 52 49.1 50.7 48.2
Mean age (SD) All 64.7 (10.2) 65.1 (10.1) 65.1 (10.2) 64.7 (10.5) 64.3 (10) 64.3 (10.1) 64.9 (10.4)
Women 64.7 (10.6) 65.8 (10) 65.4 (10.6) 64.5 (11.1) 64 (10.3) 64 (10.5) 64.9 (10.9)
Men 64.7 (9.8) 64.4 (10.2) 64.8 (9.7) 64.9 (9.9) 64.7 (9.7) 64.7 (9.7) 64.8 (9.9)
Age group [%] <45 2 1.4 1.7 2.5 2 2.2 2.2
45–54 14.2 12.7 13.6 14 15.1 15.5 14.1
55–64 33.4 33.7 32.2 32.5 34.5 34.5 32.9
65–74 32.2 33.6 34.5 32.5 30.8 30.8 31.7
75–84 16.1 16.4 16.1 16.3 15.5 15.3 16.8
85+ 2 2.1 2 2.2 2 1.7 2.3
N unknown BMI (%) 2089 (22) 677 (30) 541 (23) 452 (18) 419 (17)
N known BMI 7556 1605 1803 2031 2117
Mean BMI (SD) 28.4 (5) 28.2 (4.8) 28.4 (4.7) 28.5 (4.8) 28.4 (5.5)
BMI [%] <18.5 0.5 0.9 0.4 0.4 0.5
18.5–24.9 24.5 26.7 25.1 23.1 23.8
25–29.9 42.7 42.4 42.3 42.8 43.4
30–34.9 23.7 20.9 23.3 25.1 24.7
35–39.9 6.7 7.4 7.1 6.5 6
40+ 1.8 1.7 1.8 2.1 1.7
N unknown ASA (%) 922 (10) 291 (13) 257 (11) 205 (8) 169 (7)
N known ASA 8723 1991 2087 2278 2367
Morbidity state ASA 1 19 21.8 20.4 18.1 16.4
[%] ASA 2 65.3 64.1 64.9 65.5 66.6
ASA 3 15.5 14 14.7 16.1 16.9
ASA 4/5 0.2 0.2 0.1 0.4 0.2
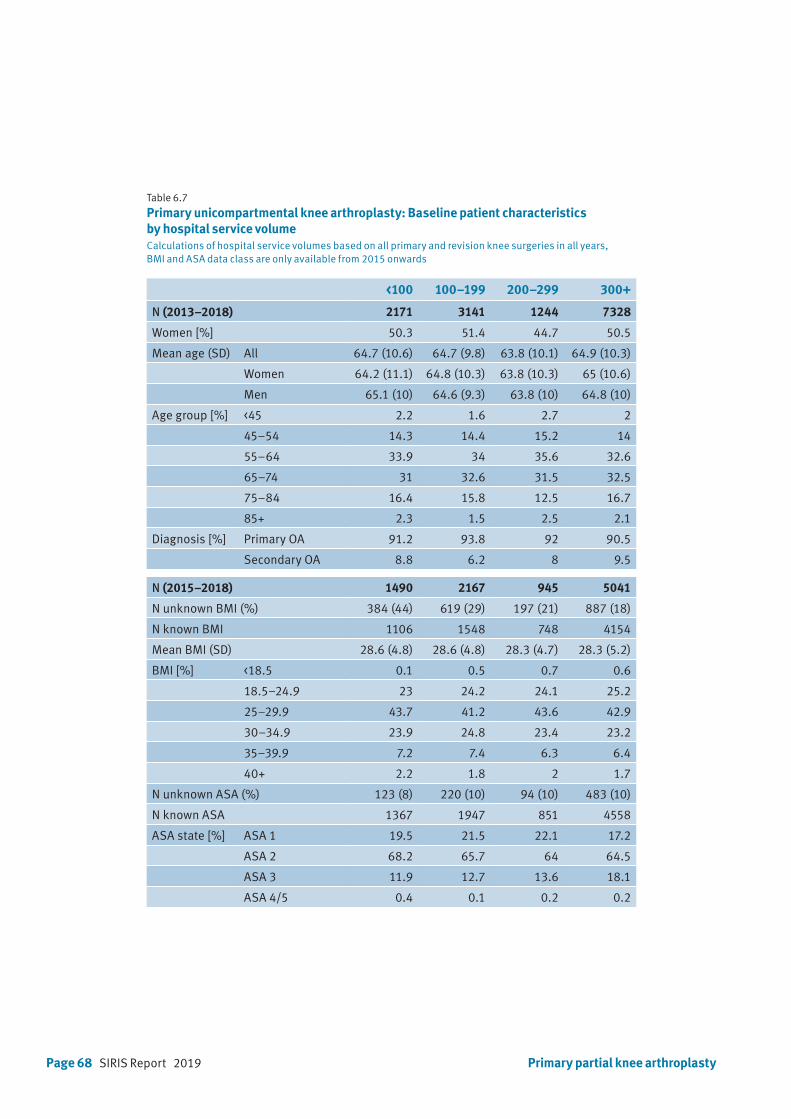
Page 68 SIRIS Report 2019
Table 6.7
Primary unicompartmental knee arthroplasty: Baseline patient characteristics by hospital service volumeCalculations of hospital service volumes based on all primary and revision knee surgeries in all years, BMI and ASA data class are only available from 2015 onwards
<100 100–199 200–299 300+
N (2013–2018) 2171 3141 1244 7328
Women [%] 50.3 51.4 44.7 50.5
Mean age (SD) All 64.7 (10.6) 64.7 (9.8) 63.8 (10.1) 64.9 (10.3)
Women 64.2 (11.1) 64.8 (10.3) 63.8 (10.3) 65 (10.6)
Men 65.1 (10) 64.6 (9.3) 63.8 (10) 64.8 (10)
Age group [%] <45 2.2 1.6 2.7 2
45–54 14.3 14.4 15.2 14
55–64 33.9 34 35.6 32.6
65–74 31 32.6 31.5 32.5
75–84 16.4 15.8 12.5 16.7
85+ 2.3 1.5 2.5 2.1
Diagnosis [%] Primary OA 91.2 93.8 92 90.5
Secondary OA 8.8 6.2 8 9.5
N (2015–2018) 1490 2167 945 5041
N unknown BMI (%) 384 (44) 619 (29) 197 (21) 887 (18)
N known BMI 1106 1548 748 4154
Mean BMI (SD) 28.6 (4.8) 28.6 (4.8) 28.3 (4.7) 28.3 (5.2)
BMI [%] <18.5 0.1 0.5 0.7 0.6
18.5–24.9 23 24.2 24.1 25.2
25–29.9 43.7 41.2 43.6 42.9
30–34.9 23.9 24.8 23.4 23.2
35–39.9 7.2 7.4 6.3 6.4
40+ 2.2 1.8 2 1.7
N unknown ASA (%) 123 (8) 220 (10) 94 (10) 483 (10)
N known ASA 1367 1947 851 4558
ASA state [%] ASA 1 19.5 21.5 22.1 17.2
ASA 2 68.2 65.7 64 64.5
ASA 3 11.9 12.7 13.6 18.1
ASA 4/5 0.4 0.1 0.2 0.2
Primary partial knee arthroplasty

SIRIS Report 2019 Page 69Primary partial knee arthroplasty
Table 6.8
Primary unicompartmental knee arthroplasty: Surgery characteristics
2013–2014 2015–2018
N % N %
Previous surgery
None 2629 62.0 5904 61.2
Meniscectomy 2157 22.4
Knee arthroscopy 1364 32.2 2145 22.2
osteotomy tibia close to knee 58 1.4 140 1.5
ACL reconstruction 134 1.4
Surgery for patella stabilization 11 0.3 111 1.2
Synovectomy 37 0.4
Osteosynthesis tibia close to knee 26 0.6 36 0.4
Osteosynthesis femur close to knee 3 0.1 17 0.2
Osteotomy femur close to knee 8 0.2 15 0.2
Surgery for treating infection 3 0.1 5 0.1
Surgery for tumor 3 0.0
Ligament reconstruction 70 1.7
Other 192 4.5 248 2.6
Intervention
Unicompartment medial 3937 92.8 8329 86.4
Femoropatellar 708 7.3
Unicompartment lateral 304 7.2 606 6.3
Technology
Conventional 2708 63.9 6599 68.4
Minimal invasive 1341 31.6 2553 26.5
Patient specific instrumentation 197 4.6 446 4.6
Computer assisted 25 0.6 66 0.7
Other 75 0.8
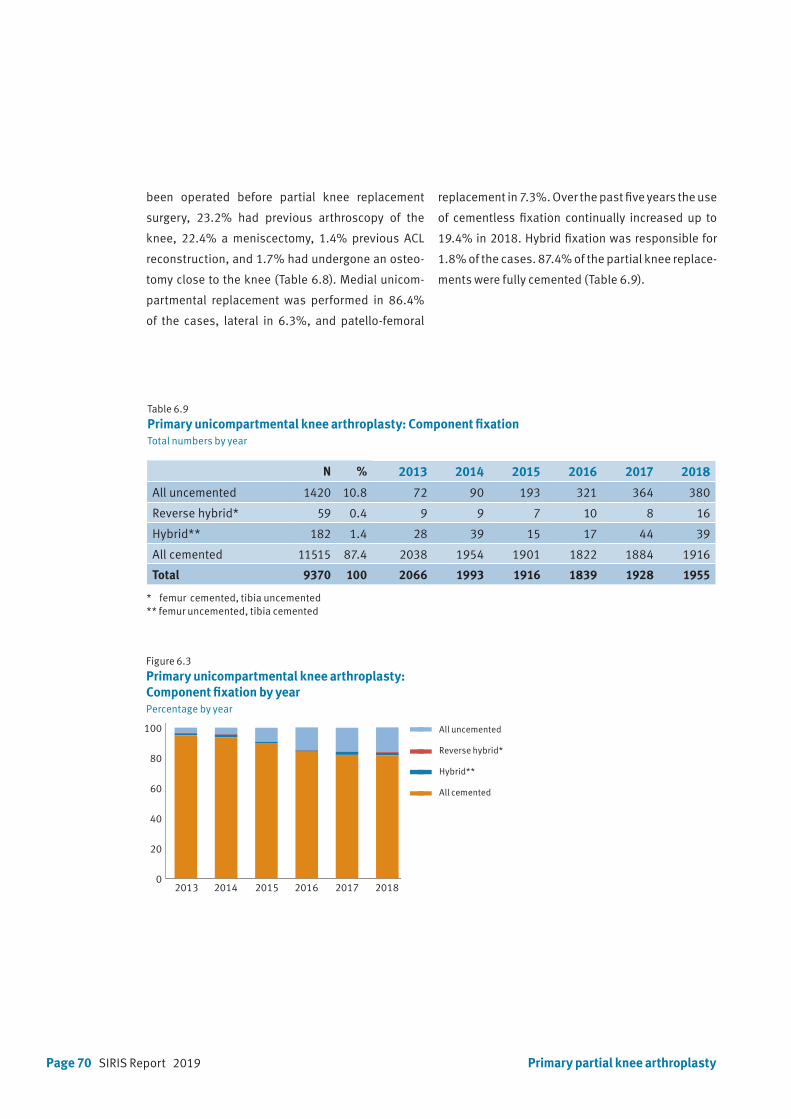
Page 70 SIRIS Report 2019
Table 6.9
Primary unicompartmental knee arthroplasty: Component fixationTotal numbers by year
Figure 6.3
Primary unicompartmental knee arthroplasty: Component fixation by yearPercentage by year
2012 2013 2014 2015 20160
3000
6000
9000
12000
15000
All uncemented
Femur cementedTibia uncemented
Femur uncemented Tibia cemented
All cemented
2012 2013 2014 2015 20160
3000
6000
9000
12000
15000
All uncemented
Femur cementedTibia uncemented
Femur uncemented Tibia cemented
All cemented
All uncemented
Reverse hybrid*
Hybrid**
All cemented
N % 2013 2014 2015 2016 2017 2018
All uncemented 1420 10.8 72 90 193 321 364 380
Reverse hybrid* 59 0.4 9 9 7 10 8 16
Hybrid** 182 1.4 28 39 15 17 44 39
All cemented 11515 87.4 2038 1954 1901 1822 1884 1916
Total 9370 100 2066 1993 1916 1839 1928 1955
been operated before partial knee replacement
surgery, 23.2% had previous arthroscopy of the
knee, 22.4% a meniscectomy, 1.4% previous ACL
reconstruction, and 1.7% had undergone an osteo-
tomy close to the knee (Table 6.8). Medial unicom-
partmental replacement was performed in 86.4%
of the cases, lateral in 6.3%, and patello-femoral
replacement in 7.3%. Over the past five years the use
of cementless fixation continually increased up to
19.4% in 2018. Hybrid fixation was responsible for
1.8% of the cases. 87.4% of the partial knee replace-
ments were fully cemented (Table 6.9).
Primary partial knee arthroplasty
2013 2014 2015 2016 2017 20180
20
40
60
80
100
120all uncemented
femur cement, tibia no cement
femur no cement, tibia cement
all cemented
All uncemented
Femur cementedTibia uncemented
Femur uncemented Tibia cemented
All cemented
* femur cemented, tibia uncemented** femur uncemented, tibia cemented
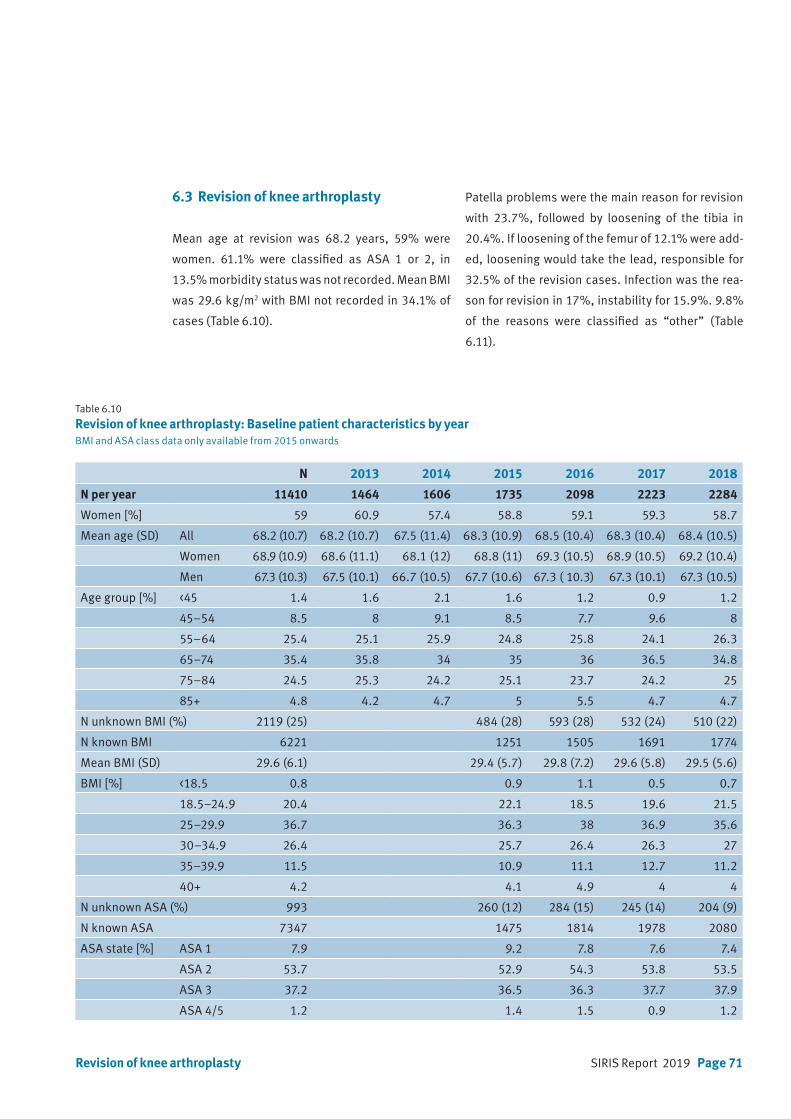
SIRIS Report 2019 Page 71
Table 6.10
Revision of knee arthroplasty: Baseline patient characteristics by yearBMI and ASA class data only available from 2015 onwards
N 2013 2014 2015 2016 2017 2018
N per year 11410 1464 1606 1735 2098 2223 2284
Women [%] 59 60.9 57.4 58.8 59.1 59.3 58.7
Mean age (SD) All 68.2 (10.7) 68.2 (10.7) 67.5 (11.4) 68.3 (10.9) 68.5 (10.4) 68.3 (10.4) 68.4 (10.5)
Women 68.9 (10.9) 68.6 (11.1) 68.1 (12) 68.8 (11) 69.3 (10.5) 68.9 (10.5) 69.2 (10.4)
Men 67.3 (10.3) 67.5 (10.1) 66.7 (10.5) 67.7 (10.6) 67.3 ( 10.3) 67.3 (10.1) 67.3 (10.5)
Age group [%] <45 1.4 1.6 2.1 1.6 1.2 0.9 1.2
45–54 8.5 8 9.1 8.5 7.7 9.6 8
55–64 25.4 25.1 25.9 24.8 25.8 24.1 26.3
65–74 35.4 35.8 34 35 36 36.5 34.8
75–84 24.5 25.3 24.2 25.1 23.7 24.2 25
85+ 4.8 4.2 4.7 5 5.5 4.7 4.7
N unknown BMI (%) 2119 (25) 484 (28) 593 (28) 532 (24) 510 (22)
N known BMI 6221 1251 1505 1691 1774
Mean BMI (SD) 29.6 (6.1) 29.4 (5.7) 29.8 (7.2) 29.6 (5.8) 29.5 (5.6)
BMI [%] <18.5 0.8 0.9 1.1 0.5 0.7
18.5–24.9 20.4 22.1 18.5 19.6 21.5
25–29.9 36.7 36.3 38 36.9 35.6
30–34.9 26.4 25.7 26.4 26.3 27
35–39.9 11.5 10.9 11.1 12.7 11.2
40+ 4.2 4.1 4.9 4 4
N unknown ASA (%) 993 260 (12) 284 (15) 245 (14) 204 (9)
N known ASA 7347 1475 1814 1978 2080
ASA state [%] ASA 1 7.9 9.2 7.8 7.6 7.4
ASA 2 53.7 52.9 54.3 53.8 53.5
ASA 3 37.2 36.5 36.3 37.7 37.9
ASA 4/5 1.2 1.4 1.5 0.9 1.2
6.3 Revision of knee arthroplasty
Mean age at revision was 68.2 years, 59% were
women. 61.1% were classified as ASA 1 or 2, in
13.5% morbidity status was not recorded. Mean BMI
was 29.6 kg/m2 with BMI not recorded in 34.1% of
cases (Table 6.10).
Patella problems were the main reason for revision
with 23.7%, followed by loosening of the tibia in
20.4%. If loosening of the femur of 12.1% were add-
ed, loosening would take the lead, responsible for
32.5% of the revision cases. Infection was the rea-
son for revision in 17%, instability for 15.9%. 9.8%
of the reasons were classified as “other” (Table
6.11).
Revision of knee arthroplasty
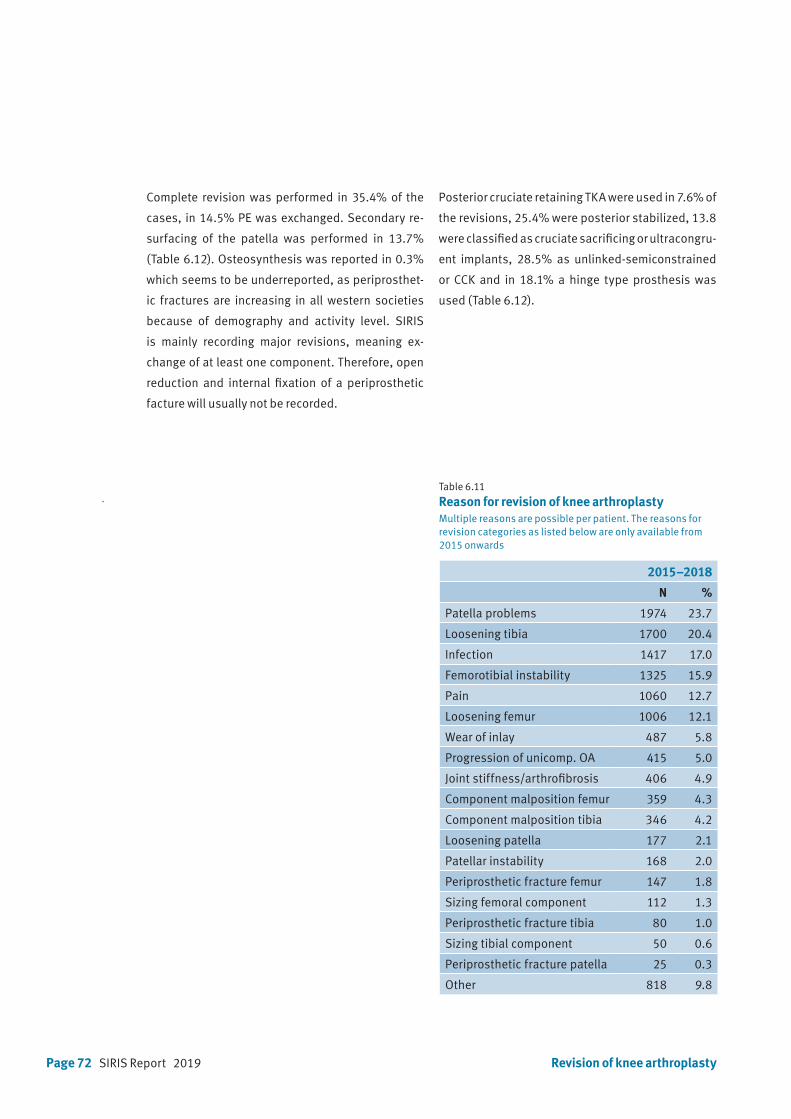
Page 72 SIRIS Report 2019
Complete revision was performed in 35.4% of the
cases, in 14.5% PE was exchanged. Secondary re-
surfacing of the patella was performed in 13.7%
(Table 6.12). Osteosynthesis was reported in 0.3%
which seems to be underreported, as periprosthet-
ic fractures are increasing in all western societies
because of demography and activity level. SIRIS
is mainly recording major revisions, meaning ex-
change of at least one component. Therefore, open
reduction and internal fixation of a periprosthetic
facture will usually not be recorded.
Table 6.11
Reason for revision of knee arthroplastyMultiple reasons are possible per patient. The reasons for revision categories as listed below are only available from 2015 onwards
2015–2018
N %
Patella problems 1974 23.7
Loosening tibia 1700 20.4
Infection 1417 17.0
Femorotibial instability 1325 15.9
Pain 1060 12.7
Loosening femur 1006 12.1
Wear of inlay 487 5.8
Progression of unicomp. OA 415 5.0
Joint stiffness/arthrofibrosis 406 4.9
Component malposition femur 359 4.3
Component malposition tibia 346 4.2
Loosening patella 177 2.1
Patellar instability 168 2.0
Periprosthetic fracture femur 147 1.8
Sizing femoral component 112 1.3
Periprosthetic fracture tibia 80 1.0
Sizing tibial component 50 0.6
Periprosthetic fracture patella 25 0.3
Other 818 9.8
Revision of knee arthroplasty
Posterior cruciate retaining TKA were used in 7.6% of
the revisions, 25.4% were posterior stabilized, 13.8
were classified as cruciate sacrificing or ultracongru-
ent implants, 28.5% as unlinked-semiconstrained
or CCK and in 18.1% a hinge type prosthesis was
used (Table 6.12).
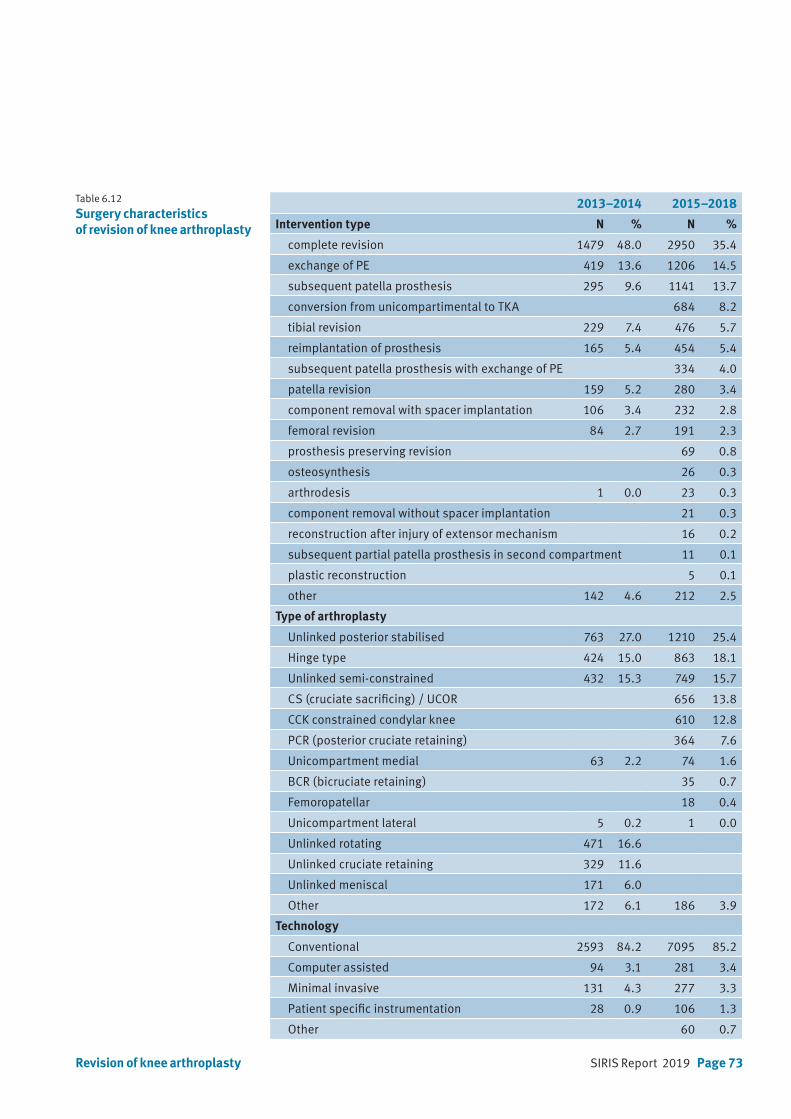
SIRIS Report 2019 Page 73
2013–2014 2015–2018
Intervention type N % N %
complete revision 1479 48.0 2950 35.4
exchange of PE 419 13.6 1206 14.5
subsequent patella prosthesis 295 9.6 1141 13.7
conversion from unicompartimental to TKA 684 8.2
tibial revision 229 7.4 476 5.7
reimplantation of prosthesis 165 5.4 454 5.4
subsequent patella prosthesis with exchange of PE 334 4.0
patella revision 159 5.2 280 3.4
component removal with spacer implantation 106 3.4 232 2.8
femoral revision 84 2.7 191 2.3
prosthesis preserving revision 69 0.8
osteosynthesis 26 0.3
arthrodesis 1 0.0 23 0.3
component removal without spacer implantation 21 0.3
reconstruction after injury of extensor mechanism 16 0.2
subsequent partial patella prosthesis in second compartment 11 0.1
plastic reconstruction 5 0.1
other 142 4.6 212 2.5
Type of arthroplasty
Unlinked posterior stabilised 763 27.0 1210 25.4
Hinge type 424 15.0 863 18.1
Unlinked semi-constrained 432 15.3 749 15.7
CS (cruciate sacrificing) / UCOR 656 13.8
CCK constrained condylar knee 610 12.8
PCR (posterior cruciate retaining) 364 7.6
Unicompartment medial 63 2.2 74 1.6
BCR (bicruciate retaining) 35 0.7
Femoropatellar 18 0.4
Unicompartment lateral 5 0.2 1 0.0
Unlinked rotating 471 16.6
Unlinked cruciate retaining 329 11.6
Unlinked meniscal 171 6.0
Other 172 6.1 186 3.9
Technology
Conventional 2593 84.2 7095 85.2
Computer assisted 94 3.1 281 3.4
Minimal invasive 131 4.3 277 3.3
Patient specific instrumentation 28 0.9 106 1.3
Other 60 0.7
Table 6.12
Surgery characteristics of revision of knee arthroplasty
Revision of knee arthroplasty
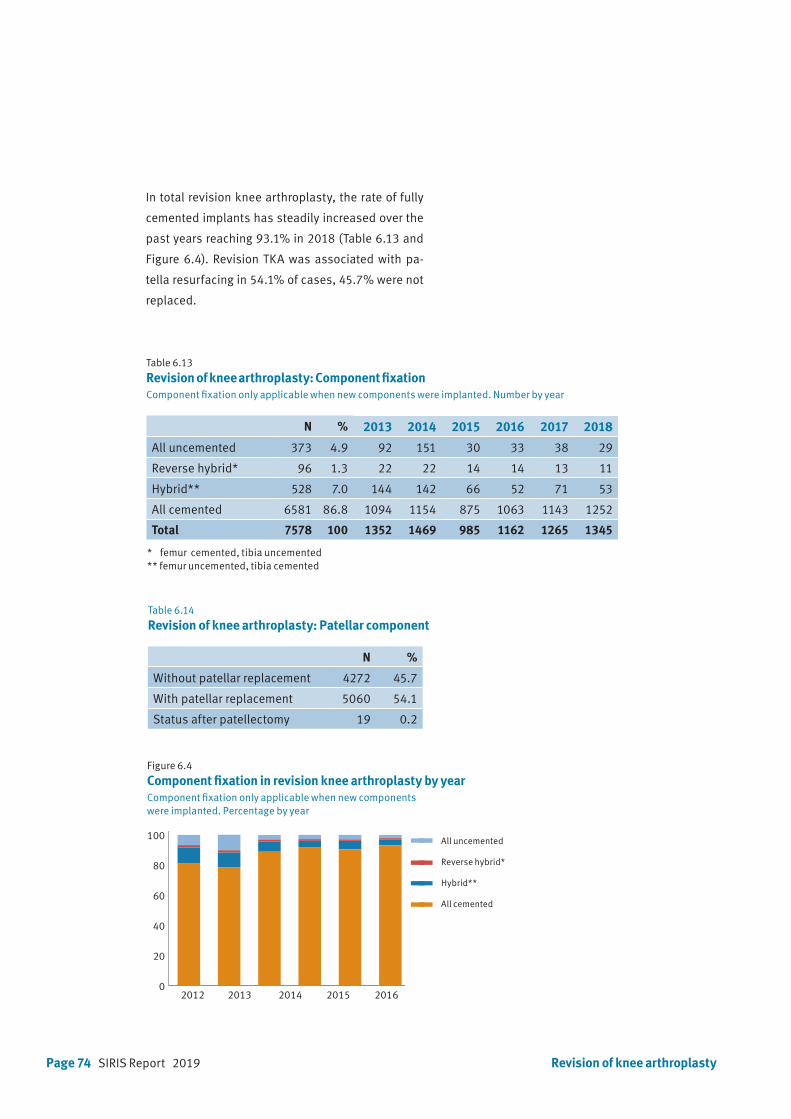
Page 74 SIRIS Report 2019 Revision of knee arthroplasty
Table 6.13
Revision of knee arthroplasty: Component fixationComponent fixation only applicable when new components were implanted. Number by year
Figure 6.4
Component fixation in revision knee arthroplasty by yearComponent fixation only applicable when new componentswere implanted. Percentage by year
Table 6.14
Revision of knee arthroplasty: Patellar component
N %
Without patellar replacement 4272 45.7
With patellar replacement 5060 54.1
Status after patellectomy 19 0.2
2012 2013 2014 2015 20160
3000
6000
9000
12000
15000
All uncemented
Femur cementedTibia uncemented
Femur uncemented Tibia cemented
All cemented
2012 2013 2014 2015 20160
3000
6000
9000
12000
15000
All uncemented
Femur cementedTibia uncemented
Femur uncemented Tibia cemented
All cemented
All uncemented
Reverse hybrid*
Hybrid**
All cemented
N % 2013 2014 2015 2016 2017 2018
All uncemented 373 4.9 92 151 30 33 38 29
Reverse hybrid* 96 1.3 22 22 14 14 13 11
Hybrid** 528 7.0 144 142 66 52 71 53
All cemented 6581 86.8 1094 1154 875 1063 1143 1252
Total 7578 100 1352 1469 985 1162 1265 1345
2012 2013 2014 2015 20160
20
40
60
80
100
120all uncemented
femur cement, tibia no cement
femur no cement, tibia cement
all cemented
All uncemented
Femur cementedTibia uncemented
Femur uncementedTibia cemented
All cemented
In total revision knee arthroplasty, the rate of fully
cemented implants has steadily increased over the
past years reaching 93.1% in 2018 (Table 6.13 and
Figure 6.4). Revision TKA was associated with pa-
tella resurfacing in 54.1% of cases, 45.7% were not
replaced.
* femur cemented, tibia uncemented** femur uncemented, tibia cemented
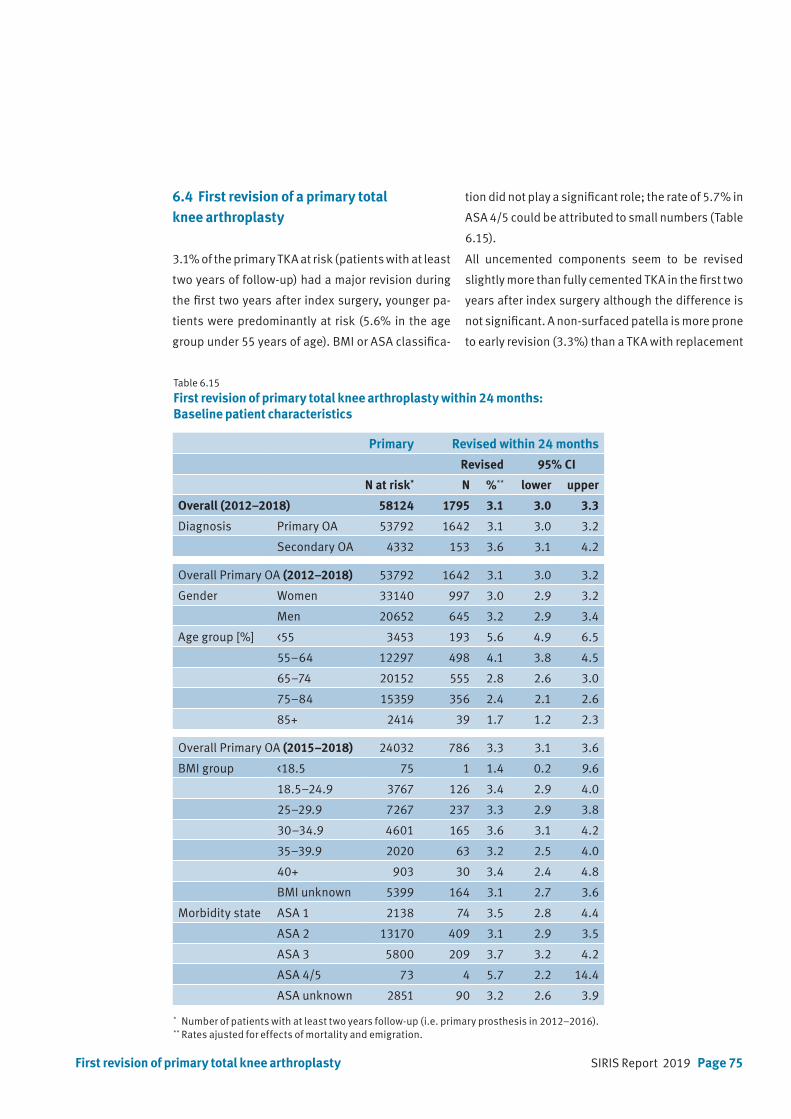
SIRIS Report 2019 Page 75
6.4 First revision of a primary total knee arthroplasty
3.1% of the primary TKA at risk (patients with at least
two years of follow-up) had a major revision during
the first two years after index surgery, younger pa-
tients were predominantly at risk (5.6% in the age
group under 55 years of age). BMI or ASA classifica-
tion did not play a significant role; the rate of 5.7% in
ASA 4/5 could be attributed to small numbers (Table
6.15).
All uncemented components seem to be revised
slightly more than fully cemented TKA in the first two
years after index surgery although the difference is
not significant. A non-surfaced patella is more prone
to early revision (3.3%) than a TKA with replacement
First revision of primary total knee arthroplasty
Table 6.15
First revision of primary total knee arthroplasty within 24 months: Baseline patient characteristics
Primary Revised within 24 months
Revised 95% CI
N at risk* N %** lower upper
Overall (2012–2018) 58124 1795 3.1 3.0 3.3
Diagnosis Primary OA 53792 1642 3.1 3.0 3.2
Secondary OA 4332 153 3.6 3.1 4.2
Overall Primary OA (2012–2018) 53792 1642 3.1 3.0 3.2
Gender Women 33140 997 3.0 2.9 3.2
Men 20652 645 3.2 2.9 3.4
Age group [%] <55 3453 193 5.6 4.9 6.5
55–64 12297 498 4.1 3.8 4.5
65–74 20152 555 2.8 2.6 3.0
75–84 15359 356 2.4 2.1 2.6
85+ 2414 39 1.7 1.2 2.3
Overall Primary OA (2015–2018) 24032 786 3.3 3.1 3.6
BMI group <18.5 75 1 1.4 0.2 9.6
18.5–24.9 3767 126 3.4 2.9 4.0
25–29.9 7267 237 3.3 2.9 3.8
30–34.9 4601 165 3.6 3.1 4.2
35–39.9 2020 63 3.2 2.5 4.0
40+ 903 30 3.4 2.4 4.8
BMI unknown 5399 164 3.1 2.7 3.6
Morbidity state ASA 1 2138 74 3.5 2.8 4.4
ASA 2 13170 409 3.1 2.9 3.5
ASA 3 5800 209 3.7 3.2 4.2
ASA 4/5 73 4 5.7 2.2 14.4
ASA unknown 2851 90 3.2 2.6 3.9
* Number of patients with at least two years follow-up (i.e. primary prosthesis in 2012–2016).** Rates ajusted for effects of mortality and emigration.
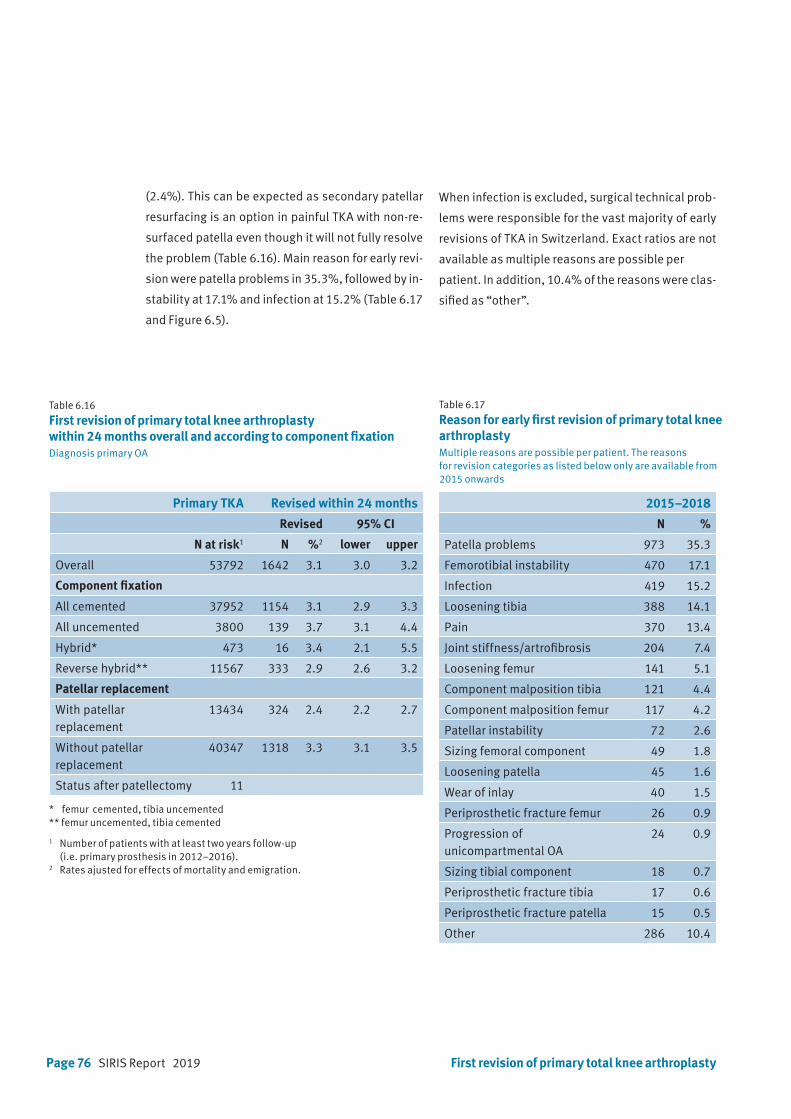
Page 76 SIRIS Report 2019
(2.4%). This can be expected as secondary patellar
resurfacing is an option in painful TKA with non-re-
surfaced patella even though it will not fully resolve
the problem (Table 6.16). Main reason for early revi-
sion were patella problems in 35.3%, followed by in-
stability at 17.1% and infection at 15.2% (Table 6.17
and Figure 6.5).
When infection is excluded, surgical technical prob-
lems were responsible for the vast majority of early
revisions of TKA in Switzerland. Exact ratios are not
available as multiple reasons are possible per
patient. In addition, 10.4% of the reasons were clas-
sified as “other”.
Table 6.16
First revision of primary total knee arthroplasty within 24 months overall and according to component fixationDiagnosis primary OA
Primary TKA Revised within 24 months
Revised 95% CI
N at risk1 N %2 lower upper
Overall 53792 1642 3.1 3.0 3.2
Component fixation
All cemented 37952 1154 3.1 2.9 3.3
All uncemented 3800 139 3.7 3.1 4.4
Hybrid* 473 16 3.4 2.1 5.5
Reverse hybrid** 11567 333 2.9 2.6 3.2
Patellar replacement
With patellar replacement
13434 324 2.4 2.2 2.7
Without patellar replacement
40347 1318 3.3 3.1 3.5
Status after patellectomy 11
First revision of primary total knee arthroplasty
Table 6.17
Reason for early first revision of primary total knee arthroplastyMultiple reasons are possible per patient. The reasons for revision categories as listed below only are available from 2015 onwards
2015–2018
N %
Patella problems 973 35.3
Femorotibial instability 470 17.1
Infection 419 15.2
Loosening tibia 388 14.1
Pain 370 13.4
Joint stiffness/artrofibrosis 204 7.4
Loosening femur 141 5.1
Component malposition tibia 121 4.4
Component malposition femur 117 4.2
Patellar instability 72 2.6
Sizing femoral component 49 1.8
Loosening patella 45 1.6
Wear of inlay 40 1.5
Periprosthetic fracture femur 26 0.9
Progression of unicompartmental OA
24 0.9
Sizing tibial component 18 0.7
Periprosthetic fracture tibia 17 0.6
Periprosthetic fracture patella 15 0.5
Other 286 10.4
1 Number of patients with at least two years follow-up (i.e. primary prosthesis in 2012–2016).2 Rates ajusted for effects of mortality and emigration.
* femur cemented, tibia uncemented** femur uncemented, tibia cemented
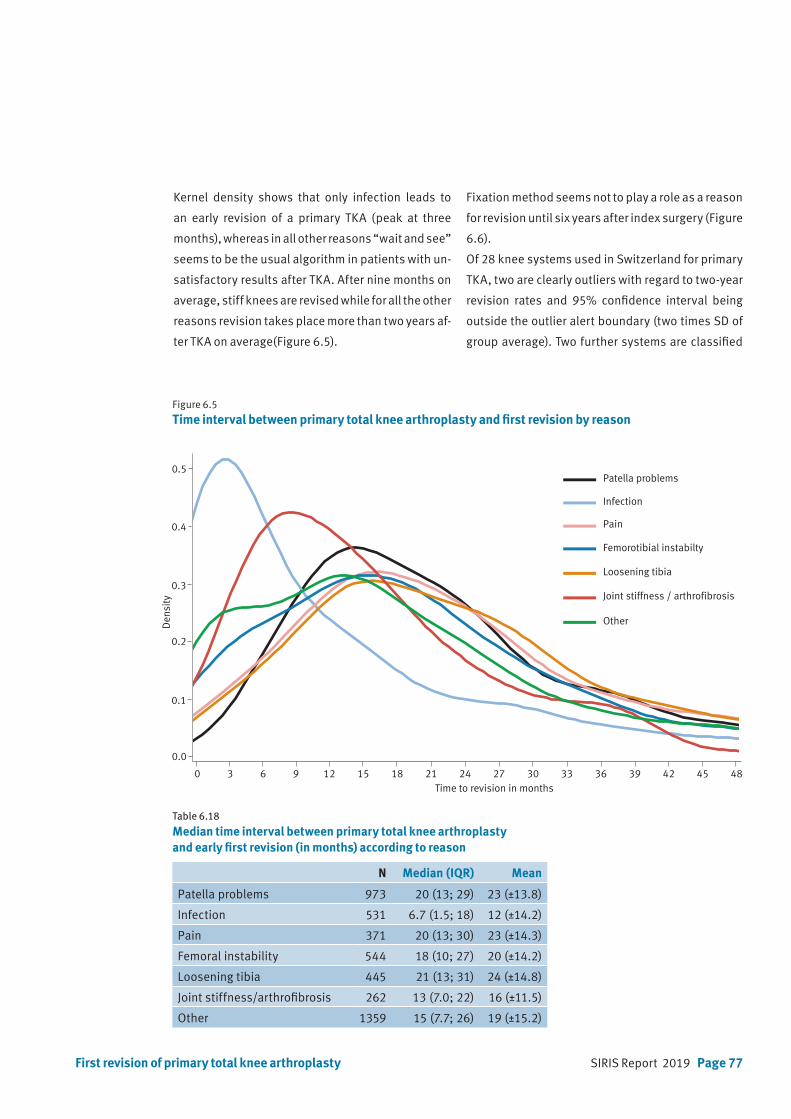
SIRIS Report 2019 Page 77First revision of primary total knee arthroplasty
Table 6.18
Median time interval between primary total knee arthroplasty and early first revision (in months) according to reason
N Median (IQR) Mean
Patella problems 973 20 (13; 29) 23 (±13.8)
Infection 531 6.7 (1.5; 18) 12 (±14.2)
Pain 371 20 (13; 30) 23 (±14.3)
Femoral instability 544 18 (10; 27) 20 (±14.2)
Loosening tibia 445 21 (13; 31) 24 (±14.8)
Joint stiffness/arthrofibrosis 262 13 (7.0; 22) 16 (±11.5)
Other 1359 15 (7.7; 26) 19 (±15.2)
Figure 6.5
Time interval between primary total knee arthroplasty and first revision by reason
Time to revision in months0 3 6 9 12 15 18 21 24 27 30 33 36 39 42 45 48
0.1
0.2
0.3
0.4
0.5
0.0
Den
sity
Patella problems
Infection
Pain
Femorotibial instabilty
Loosening tibia
Joint stiffness / arthrofibrosis
Other
Kernel density shows that only infection leads to
an early revision of a primary TKA (peak at three
months), whereas in all other reasons “wait and see”
seems to be the usual algorithm in patients with un-
satisfactory results after TKA. After nine months on
average, stiff knees are revised while for all the other
reasons revision takes place more than two years af-
ter TKA on average(Figure 6.5).
Fixation method seems not to play a role as a reason
for revision until six years after index surgery (Figure
6.6).
Of 28 knee systems used in Switzerland for primary
TKA, two are clearly outliers with regard to two-year
revision rates and 95% confidence interval being
outside the outlier alert boundary (two times SD of
group average). Two further systems are classified
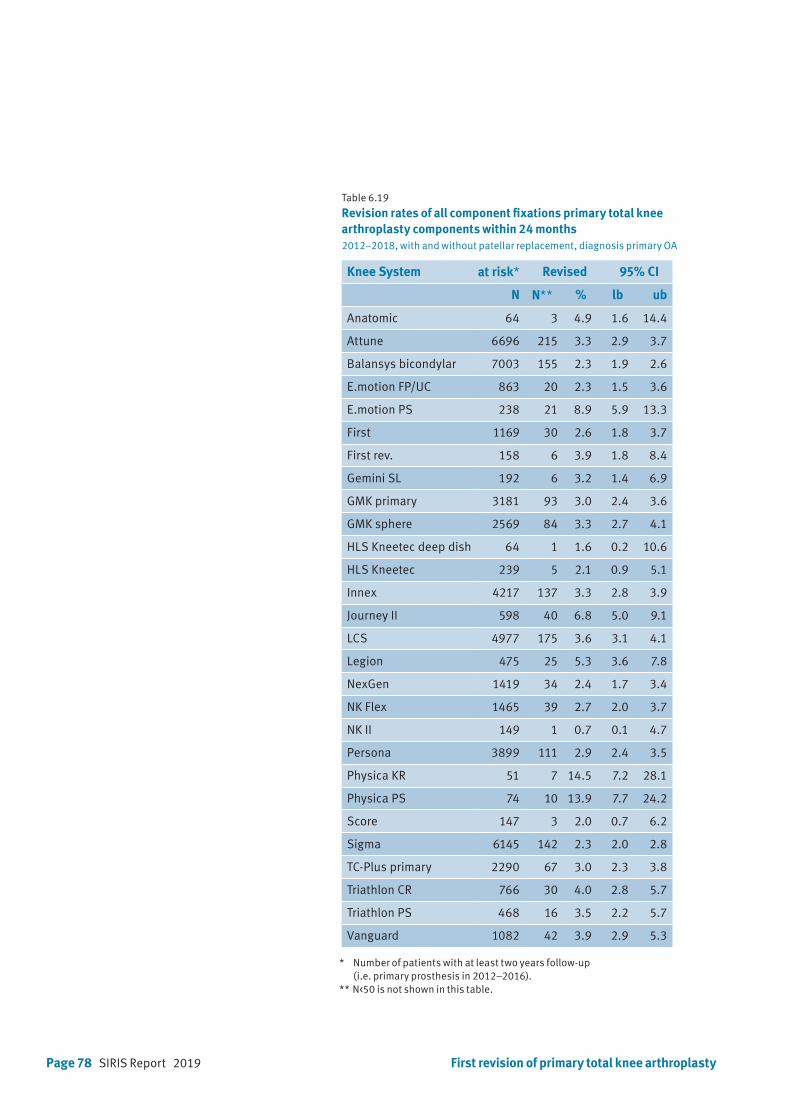
Page 78 SIRIS Report 2019 First revision of primary total knee arthroplasty
Table 6.19 Revision rates of all component fixations primary total knee arthroplasty components within 24 months 2012–2018, with and without patellar replacement, diagnosis primary OA
Knee System at risk* Revised 95% CI
N N** % lb ub
Anatomic 64 3 4.9 1.6 14.4
Attune 6696 215 3.3 2.9 3.7
Balansys bicondylar 7003 155 2.3 1.9 2.6
E.motion FP/UC 863 20 2.3 1.5 3.6
E.motion PS 238 21 8.9 5.9 13.3
First 1169 30 2.6 1.8 3.7
First rev. 158 6 3.9 1.8 8.4
Gemini SL 192 6 3.2 1.4 6.9
GMK primary 3181 93 3.0 2.4 3.6
GMK sphere 2569 84 3.3 2.7 4.1
HLS Kneetec deep dish 64 1 1.6 0.2 10.6
HLS Kneetec 239 5 2.1 0.9 5.1
Innex 4217 137 3.3 2.8 3.9
Journey II 598 40 6.8 5.0 9.1
LCS 4977 175 3.6 3.1 4.1
Legion 475 25 5.3 3.6 7.8
NexGen 1419 34 2.4 1.7 3.4
NK Flex 1465 39 2.7 2.0 3.7
NK II 149 1 0.7 0.1 4.7
Persona 3899 111 2.9 2.4 3.5
Physica KR 51 7 14.5 7.2 28.1
Physica PS 74 10 13.9 7.7 24.2
Score 147 3 2.0 0.7 6.2
Sigma 6145 142 2.3 2.0 2.8
TC-Plus primary 2290 67 3.0 2.3 3.8
Triathlon CR 766 30 4.0 2.8 5.7
Triathlon PS 468 16 3.5 2.2 5.7
Vanguard 1082 42 3.9 2.9 5.3
* Number of patients with at least two years follow-up (i.e. primary prosthesis in 2012–2016).** N<50 is not shown in this table.
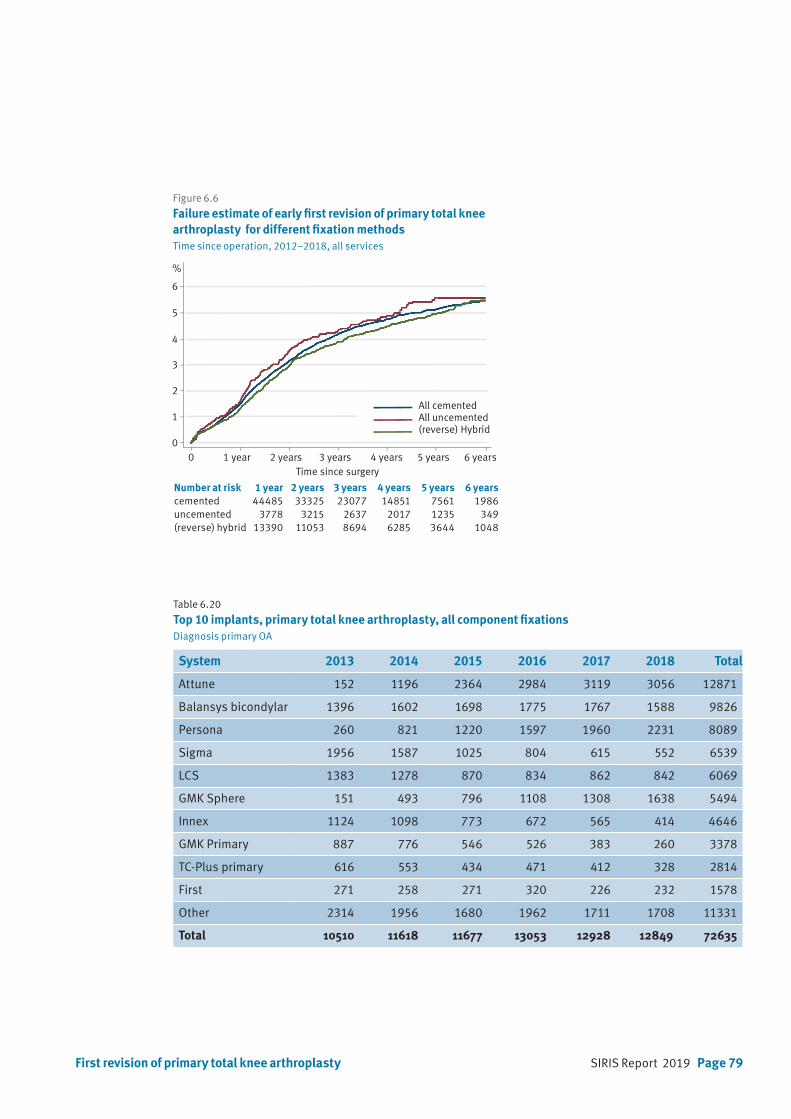
SIRIS Report 2019 Page 79First revision of primary total knee arthroplasty
Figure 6.6
Failure estimate of early first revision of primary total knee arthroplasty for different fixation methodsTime since operation, 2012–2018, all services
0 1 year 2 years 3 years 4 years 5 years 6 years
1
0
2
3
4
5
%
6
Time since surgery
All cementedAll uncemented(reverse) Hybrid
Table 6.20 Top 10 implants, primary total knee arthroplasty, all component fixationsDiagnosis primary OA
System 2013 2014 2015 2016 2017 2018 Total
Attune 152 1196 2364 2984 3119 3056 12871
Balansys bicondylar 1396 1602 1698 1775 1767 1588 9826
Persona 260 821 1220 1597 1960 2231 8089
Sigma 1956 1587 1025 804 615 552 6539
LCS 1383 1278 870 834 862 842 6069
GMK Sphere 151 493 796 1108 1308 1638 5494
Innex 1124 1098 773 672 565 414 4646
GMK Primary 887 776 546 526 383 260 3378
TC-Plus primary 616 553 434 471 412 328 2814
First 271 258 271 320 226 232 1578
Other 2314 1956 1680 1962 1711 1708 11331
Total 10510 11618 11677 13053 12928 12849 72635
Number at risk 1 year 2 years 3 years 4 years 5 years 6 yearscemented 44485 33325 23077 14851 7561 1986uncemented 3778 3215 2637 2017 1235 349(reverse) hybrid 13390 11053 8694 6285 3644 1048

Page 80 SIRIS Report 2019
Figure 6.7 2-year revision rates of primary total knee arthroplasty systems, all component fixations2012 –2018
Knee system Nrevised
N at risk*
%**0 2 4 6 8 10 12 14 16 18 20 22 24 26
NK II 1 149
HLS Knee Tec Deep Dish 1 64
Score 3 147
HLS Kneetec 5 239
Balansys Bicondylar 155 7003
Sigma 142 6145
E.motion FP/UC 20 863
Nexgen 34 1419
First 30 1169
NK Flex 39 1465
Persona 111 3899
GMK Primary 93 3181
TC-Plus primary 67 2290
Gemini SL 6 192
Attune 215 6696
Innex 137 4217
GMK Sphere 84 2569
Triathlon PS 16 468
LCS 175 4977
Vanguard 42 1082
First rev 6 158
Triathlon CR 30 766
Anatomic 3 64
Legion 25 475
Journey II 40 598
E.motion PS 21 238
Physica PS 10 74
Physica KR 7 51
Y
Group average and 95% confidence interval
2-year revision-rate and 95% confidence interval
Outlier alert boundary
* Number of patients with at least two years follow-up (i.e. primary prosthesis in 2012–2016).** Rates ajusted for effects of mortality and emigration.
First revision of primary total knee arthroplasty
as possible outliers where 95% confidence interval
is still lying within the outlier boundary. Most of the
systems reach group average, some are better than
average. One should note the small numbers used
of some systems where additional revisions can
considerably change the performance (Figure 6.7).
Following the statistical identification of potential
and definitive outliers for this report (depending on
the level of statistical confidence), the SIRIS registry
will produce outlier reports in order to further inves-
tigate the reasons for the observed deviations from
the national average.
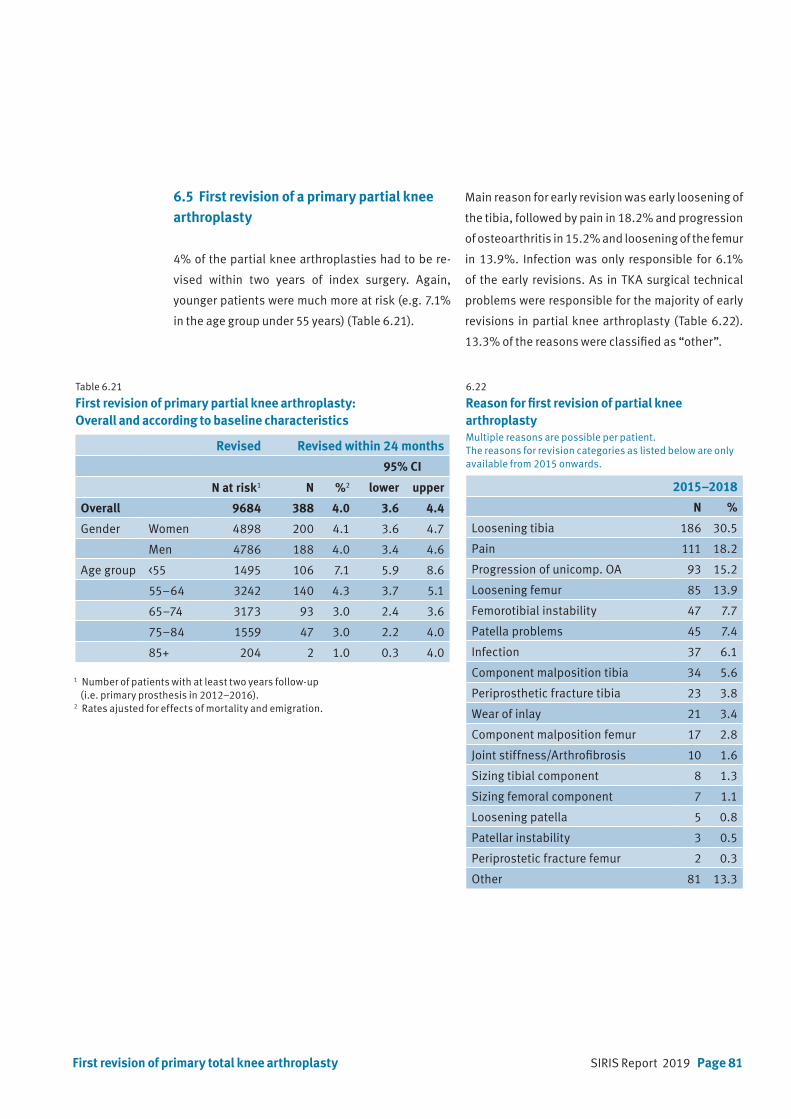
SIRIS Report 2019 Page 81First revision of primary total knee arthroplasty
6.5 First revision of a primary partial knee arthroplasty
4% of the partial knee arthroplasties had to be re-
vised within two years of index surgery. Again,
younger patients were much more at risk (e.g. 7.1%
in the age group under 55 years) (Table 6.21).
Main reason for early revision was early loosening of
the tibia, followed by pain in 18.2% and progression
of osteoarthritis in 15.2% and loosening of the femur
in 13.9%. Infection was only responsible for 6.1%
of the early revisions. As in TKA surgical technical
problems were responsible for the majority of early
revisions in partial knee arthroplasty (Table 6.22).
13.3% of the reasons were classified as “other”.
Table 6.21
First revision of primary partial knee arthroplasty: Overall and according to baseline characteristics
Revised Revised within 24 months
95% CI
N at risk1 N %2 lower upper
Overall 9684 388 4.0 3.6 4.4
Gender Women 4898 200 4.1 3.6 4.7
Men 4786 188 4.0 3.4 4.6
Age group <55 1495 106 7.1 5.9 8.6
55–64 3242 140 4.3 3.7 5.1
65–74 3173 93 3.0 2.4 3.6
75–84 1559 47 3.0 2.2 4.0
85+ 204 2 1.0 0.3 4.0
6.22
Reason for first revision of partial knee arthroplastyMultiple reasons are possible per patient. The reasons for revision categories as listed below are only available from 2015 onwards.
2015–2018
N %
Loosening tibia 186 30.5
Pain 111 18.2
Progression of unicomp. OA 93 15.2
Loosening femur 85 13.9
Femorotibial instability 47 7.7
Patella problems 45 7.4
Infection 37 6.1
Component malposition tibia 34 5.6
Periprosthetic fracture tibia 23 3.8
Wear of inlay 21 3.4
Component malposition femur 17 2.8
Joint stiffness/Arthrofibrosis 10 1.6
Sizing tibial component 8 1.3
Sizing femoral component 7 1.1
Loosening patella 5 0.8
Patellar instability 3 0.5
Periprostetic fracture femur 2 0.3
Other 81 13.3
1 Number of patients with at least two years follow-up (i.e. primary prosthesis in 2012–2016).2 Rates ajusted for effects of mortality and emigration.
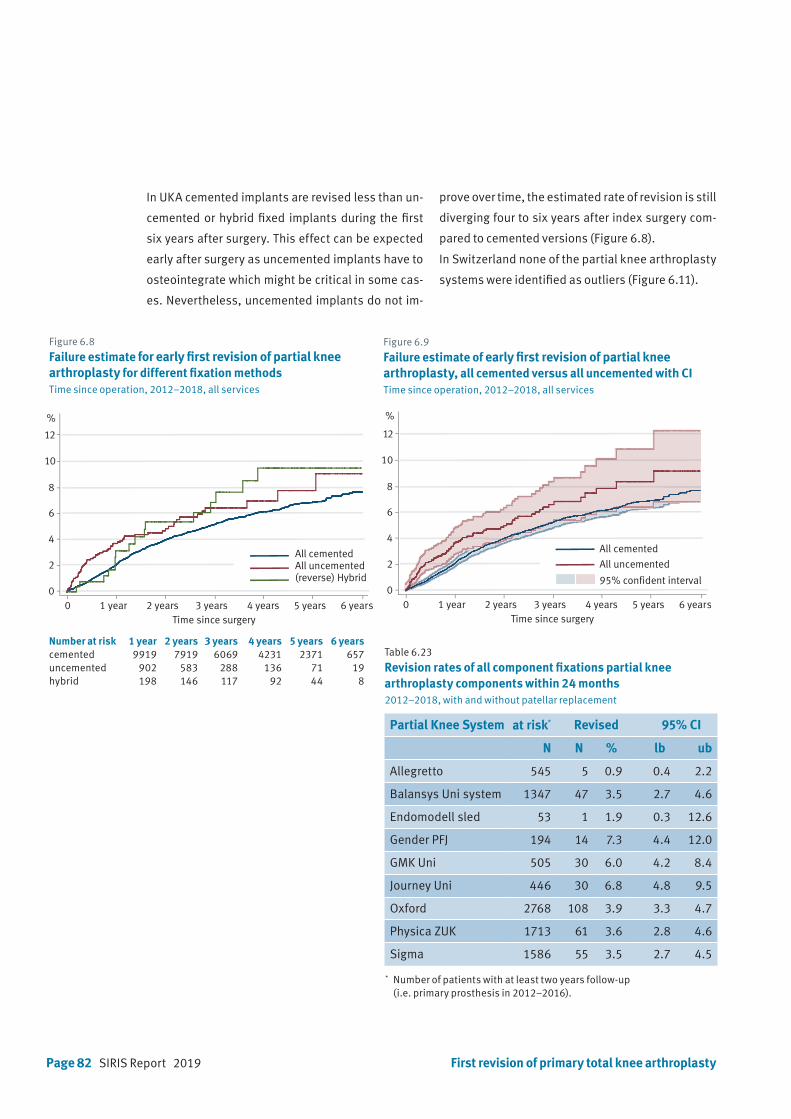
Page 82 SIRIS Report 2019
Figure 6.8
Failure estimate for early first revision of partial knee arthroplasty for different fixation methodsTime since operation, 2012–2018, all services
Table 6.23 Revision rates of all component fixations partial knee arthroplasty components within 24 months 2012–2018, with and without patellar replacement
Partial Knee System at risk* Revised 95% CI
N N % lb ub
Allegretto 545 5 0.9 0.4 2.2
Balansys Uni system 1347 47 3.5 2.7 4.6
Endomodell sled 53 1 1.9 0.3 12.6
Gender PFJ 194 14 7.3 4.4 12.0
GMK Uni 505 30 6.0 4.2 8.4
Journey Uni 446 30 6.8 4.8 9.5
Oxford 2768 108 3.9 3.3 4.7
Physica ZUK 1713 61 3.6 2.8 4.6
Sigma 1586 55 3.5 2.7 4.5
* Number of patients with at least two years follow-up (i.e. primary prosthesis in 2012–2016).
Number at risk 1 year 2 years 3 years 4 years 5 years 6 yearscemented 9919 7919 6069 4231 2371 657uncemented 902 583 288 136 71 19hybrid 198 146 117 92 44 8
Figure 6.9
Failure estimate of early first revision of partial knee arthroplasty, all cemented versus all uncemented with CITime since operation, 2012–2018, all services
0 1 year 2 years 3 years 4 years 5 years 6 years
2
0
4
6
8
10
%
12
Time since surgery
95% confident interval
All uncemented
All cemented
0 1 year 2 years 3 years 4 years 5 years 6 years
2
0
4
6
8
10
%
12
Time since surgery
All cementedAll uncemented(reverse) Hybrid
In UKA cemented implants are revised less than un-
cemented or hybrid fixed implants during the first
six years after surgery. This effect can be expected
early after surgery as uncemented implants have to
osteointegrate which might be critical in some cas-
es. Nevertheless, uncemented implants do not im-
prove over time, the estimated rate of revision is still
diverging four to six years after index surgery com-
pared to cemented versions (Figure 6.8).
In Switzerland none of the partial knee arthroplasty
systems were identified as outliers (Figure 6.11).
First revision of primary total knee arthroplasty
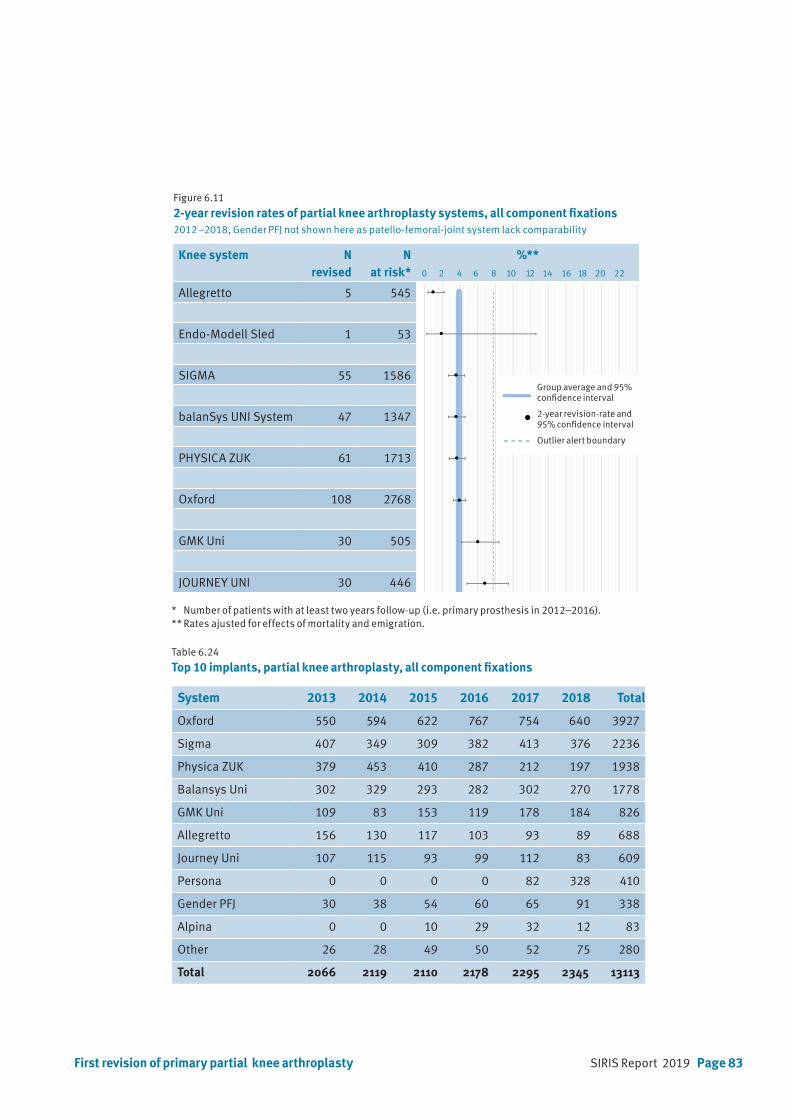
SIRIS Report 2019 Page 83First revision of primary partial knee arthroplasty
Table 6.24 Top 10 implants, partial knee arthroplasty, all component fixations
System 2013 2014 2015 2016 2017 2018 Total
Oxford 550 594 622 767 754 640 3927
Sigma 407 349 309 382 413 376 2236
Physica ZUK 379 453 410 287 212 197 1938
Balansys Uni 302 329 293 282 302 270 1778
GMK Uni 109 83 153 119 178 184 826
Allegretto 156 130 117 103 93 89 688
Journey Uni 107 115 93 99 112 83 609
Persona 0 0 0 0 82 328 410
Gender PFJ 30 38 54 60 65 91 338
Alpina 0 0 10 29 32 12 83
Other 26 28 49 50 52 75 280
Total 2066 2119 2110 2178 2295 2345 13113
Knee system N revised
N at risk*
%**0 2 4 6 8 10 12 14 16 18 20 22
Allegretto 5 545
Endo-Modell Sled 1 53
SIGMA 55 1586
balanSys UNI System 47 1347
PHYSICA ZUK 61 1713
Oxford 108 2768
GMK Uni 30 505
JOURNEY UNI 30 446
Figure 6.11 2-year revision rates of partial knee arthroplasty systems, all component fixations2012 –2018, Gender PFJ not shown here as patello-femoral-joint system lack comparability
* Number of patients with at least two years follow-up (i.e. primary prosthesis in 2012–2016).** Rates ajusted for effects of mortality and emigration.
Group average and 95% confidence interval
2-year revision-rate and 95% confidence interval
Outlier alert boundary
Page 84 SIRIS Report 2019
7. Participating hospitals
Asana Gruppe AG, Spital Menziken
Asana Gruppe, Spital Leuggern
Berit Klinik, Speicher
Center da Sandà, Engiadina Bassa CSEB, Scuol
Centre Hospitalier Universitaire Vaudois CHUV, Lausanne
CIC Groupe Santé SA, Clinique CIC Riviera Centre, Clarens
CIC Groupe Santé SA, Valais, Saxon
Clinica Luganese SA, Lugano
Clinica Santa Chiara SA, Locarno
Clinique de la Source, Lausanne
Clinique Générale Beaulieu, Genève
EHC, Hôpital de Morges
eHnv, Hôpital St-Loup, Pompaples
eHnv, Hôpital Yverdon-les-Bains
EOC, Ospedale regionale di Bellinzona (San Giovanni)
EOC, Ospedale regionale di Locarno (La Carità)
EOC, Ospedale regionale di Lugano (Civico e Italiano)
EOC, Ospedale regionale di Mendrisio (Beata Vergine)
Flury Stiftung, Spital Schiers
Gesundheitszentrum Fricktal AG, Spital Laufenburg
Gesundheitszentrum Fricktal AG, Spital Rheinfelden
Groupement Hospitalier de l’Ouest Lémanique GHOL, Nyon
GZO AG Spital Wetzikon
Hirslanden AndreasKlinik Cham, Zug
Hirslanden Bern AG, Klinik Beau-Site, Bern
Hirslanden Bern AG, Klinik Permanence, Bern
Hirslanden Bern AG, Klinik Salem, Bern
Hirslanden Clinique La Colline SA, Genève
Hirslanden Clinique des Grangettes SA, Chêne-Bougeries
Hirslanden Klinik Aarau
Hirslanden Klinik am Rosenberg, Heiden
Hirslanden Klinik Belair, Schaffhausen
Hirslanden Klinik im Park, Zürich
Hirslanden Klinik Linde AG, Biel
Hirslanden Klinik St. Anna AG, Luzern
Hirslanden Klinik St. Anna AG, Meggen
Hirslanden Klinik Stephanshorn, St. Gallen
Hirslanden Lausanne SA, Clinique Bois-Cerf, Lausanne
Hirslanden Klinik Birshof AG, Münchenstein
Hôpital du Jura bernois SA, Site de Moutier
Hôpital du Jura bernois SA, Site de Saint-Imier
Hôpital du Jura, Site de Delémont
Hôpital du Pays-d’Enhaut, Château-d‘Oex
Hôpital du Valais (RSV), Martigny
Hôpital du Valais (RSV), Sion
Hôpital du Valais SZO, Spital Brig
Hôpital du Valais SZO, Spital Visp
Hôpital fribourgeois HFR, Hôpital cantonal, Fribourg
Hôpital fribourgeois HFR, Site de Riaz
Hôpital fribourgeois HFR, Site de Tafers
Hôpital intercantonal de la Broye HIB, Payerne
Hôpital neuchâtelois HNE, Site de la Chaux-de-Fonds
Hôpital neuchâtelois HNE, Site de Pourtalès, Neuchâtel
Hôpital Riviera-Chablais, Site de Monthey
Hôpital Riviera-Chablais, Site de Montreux
Hôpital Riviera-Chablais, Site de Vevey
Hôpitaux Universitaires de Genève (HUG)
Insel Gruppe AG, Inselspital, Univesitätsspital Bern
Insel Gruppe AG, Spital Aarberg
Insel Gruppe AG, Spital Münsingen
Insel Gruppe AG, Spital Riggisberg
Insel Gruppe AG, Spital Tiefenau, Bern
Kantonales Spital und Pflegeheim Appenzell
Kantonsspital Aarau AG
Kantonsspital Baden AG
Kantonsspital Baselland, Standort Bruderholz
Kantonsspital Baselland, Standort Laufen
Kantonsspital Baselland, Standort Liestal
Kantonsspital Glarus AG
Kantonsspital Graubünden, Chur
Kantonsspital Nidwalden, Stans
Kantonsspital Obwalden, Sarnen
Kantonsspital St. Gallen, Spital Flawil
Kantonsspital St. Gallen, Spital Rorschach
Kantonsspital St. Gallen, Standort St. Gallen
Kantonsspital Uri, Altdorf
Kantonsspital Winterthur
Klinik Gut, Fläsch
Klinik Gut, St. Moritz
Klinik Hirslanden Zürich
Klinik Hohmad, Thun
Klinik Pyramide am See AG, Zürich
SIRIS Report 2019 Page 85
Klinik Seeschau AG, Kreuzlingen
Klinik Siloah AG, Gümligen
La Tour Réseau de Soins SA, Hôpital de la Tour, Meyrin
Lichtensteinisches Landesspital, Vaduz
Lindenhofgruppe, Sonnenhofspital, Bern
Lindenhofgruppe, Lindenhofspital Bern
Luzerner Kantonsspital LUKS, Luzern
Luzerner Kantonsspital LUKS, Sursee
Luzerner Kantonsspital LUKS, Wolhusen
Merian Iselin Klinik, Basel
Nouvelle Clinique Vert-Pré SA, Conches-Genève
Praxisklinik Rennbahn AG, Muttenz
Regionalspital Surselva AG, Ilanz
Réseau Santé Balcon du Jura RSBJ, St. Croix
Rosenklinik, Rapperswil
Schulthess Klinik, Zürich
See-Spital, Horgen
See-Spital, Kilchberg
SMN SA, Clinica Ars Medica, Gravesano
SMN SA, Clinique de Genolier
SMN SA, Clinique de Montchoisi, Lausanne
SMN SA, Clinique de Valère, Sion
SMN SA, Clinique Générale Ste-Anne SA, Fribourg
SMN SA, Clinique Montbrillant, La Chaux-de-Fonds
SMN SA, Hôpital de la Providence, Neuchâtel
SMN SA, Klinik Villa im Park AG, Rothrist
SMN SA, Privatklinik Bethanien, Zürich
SMN SA, Privatklinik Lindberg, Winterthur
SMN SA, Privatklinik Obach AG, Solothurn
Solothurner Spitäler AG, Bürgerspital Solothurn
Solothurner Spitäler AG, Kantonsspital Olten
Solothurner Spitäler AG, Spital Dornach
Spital Affoltern, Affoltern a. A.
Spital Bülach
Spital Davos AG
Spital Einsiedeln
Spital Emmental AG, Burgdorf
Spital Emmental AG, Langnau
Spital Lachen AG
Spital Limmattal, Schlieren
Spital Linth, Uznach
Spital Männedorf AG
Spital Muri
Spital Oberengadin, Samedan
Spital Schwyz
Spital STS AG, Spital Thun
Spital Thurgau AG, Kantonsspital Frauenfeld
Spital Thurgau AG, Kantonsspital Münsterlingen
Spital Thusis
Spital Uster
Spital Zofingen
Spital Zollikerberg
Spitäler fmi AG, Spital Frutigen
Spitäler fmi AG, Spital Interlaken
Spitäler Schaffhausen. Kantonsspital
Spitalregion Fürstenland Toggenburg, Spital Wattwil
Spitalregion Fürstenland Toggenburg, Spital Wil
Spitalverbund Appenzell Ausserrhoden, Heiden
Spitalverbund Appenzell Ausserrhoden, Herisau
Spitalzentrum Biel AG
SRRWS Spital Altstätten
SRRWS Spital Grabs
SRRWS Spital Walenstadt
SRO AG, Spital Langenthal
St. Claraspital AG, Basel
Stadtspital Triemli, Zürich
Stadtspital Waid, Zürich
Universitätsklinik Balgrist, Zürich
Universitätsspital Basel USB
UniversitätsSpital Zürich
Zuger Kantonsspital AG, Baar
Status 2019 – 153 Clinics


SIRIS Report 2019 Page 87

Page 88 SIRIS Report 2019
Foundation for quality assurance
in implant surgery – SIRIS
c/o conidea GmbHWaldheimstrasse 223604 Thun