Analysis of Utility Models for the Base of the Pyramid
34
Inter-American Development Bank Analysis of Utility Models for the Base of the Pyramid Final Report Report prepared by: Carlued Leon MANAUS Consulting 11620 Wilshire Blvd, Suite 610 Los Angeles, CA 90025 p: +1 213.599.7442 Contact for this report: Tamar Koosed, CEO, [email protected] Carlued Leon, Global Research Manager, [email protected] 8 February 2016
-
Upload
khangminh22 -
Category
Documents
-
view
0 -
download
0
Transcript of Analysis of Utility Models for the Base of the Pyramid

Inter-American Development Bank
Analysis of Utility Models for the Base of the Pyramid
Final Report Report prepared by: Carlued Leon
MANAUS Consulting 11620 Wilshire Blvd, Suite 610 Los Angeles, CA 90025 p: +1 213.599.7442
Contact for this report: Tamar Koosed, CEO, [email protected] Carlued Leon, Global Research Manager, [email protected]
8 February 2016

IDB Research Utility Models for the BOP | Page
11620WilshireBlvd,Suite610 www.manausconsulting.com p:+1(213)599.7442LosAngeles,CA90025 [email protected]
1
About MANAUS Consulting
MANAUS provides consulting services to companies and organizations working with corporate social responsibility and international development projects. MANAUS works with businesses, nonprofit organizations, and multilateral institutions to help them understand the impact their initiatives are having on beneficiaries and their communities.
MANAUS Consulting was commissioned by the Inter-American Development Bank to carry out research on the business models of utility companies that have reached the base of the pyramid and provided low-income populations with access to finance.
www.manausconsulting.com

IDB Research Utility Models for the BOP | Page
11620WilshireBlvd,Suite610 www.manausconsulting.com p:+1(213)599.7442LosAngeles,CA90025 [email protected]
2
Table of Contents
Executive Summary ....................................................................................................................... 3
Introduction ................................................................................................................................... 6
Methodology ................................................................................................................................. 6
The BOP Market ............................................................................................................................ 7
The Financial Access Gap in Latin America and Asia ..................................................................... 8
Utilities Companies and the BOP ................................................................................................. 10
Successful Utility Models Serving the BOP .................................................................................. 12
Common and differentiating characteristics among the models ............................................... 23
Common success factors ........................................................................................................ 24
Common challenges ................................................................................................................ 26
Lessons Learned ......................................................................................................................... 27
Recommendations ...................................................................................................................... 28
Potential for Serving the BOP in Asia ........................................................................................... 28
Conclusions ................................................................................................................................. 30
References .................................................................................................................................. 31
Annexes ...................................................................................................................................... 32

IDB Research Utility Models for the BOP | Page
11620WilshireBlvd,Suite610 www.manausconsulting.com p:+1(213)599.7442LosAngeles,CA90025 [email protected]
3
Executive Summary Four billion people in the world are individuals at the base of the pyramid (BOP), representing a $5 trillion global consumer market in local purchasing power (PPP). The largest BOP markets are found in Asia and Latin America and the Caribbean, with aggregate incomes of PPP$3,470 billion1 and PPP$759 billion,2 respectively. As those living at the BOP are generally in remotes areas and lack the necessary documentation for credit risk evaluations, it is costly for the traditional financial system to overcome physical and information asymmetry barriers to meet the financial needs of this segment of the population.3
As providers of products and services that meet basic needs, utility companies —providers of water, gas, telephone and the like— are uniquely positioned to provide financial access and alternative services at a large scale by leveraging their distribution channels, billing infrastructure, and payment records. Three main factors allow utility companies to effectively provide financial products to the BOP:4
1) Reduced information costs for credit risk assessment: Utilities payment records provide alternative measures of risk to assess the creditworthiness of clients. Based on this information, utilities can offer credit only to reliable customers, reducing default risks and simplifying document requirements for BOP consumers.5
2) Reduced distribution costs to reach underserved populations: While reaching the BOP can be costly for traditional financial service providers, utility companies’ extensive distribution networks and existing billing infrastructure allow these corporations to provide and collect payment for financial products and services at marginal costs.6
3) Ability to bring innovative products and services to market: With lower distribution and information costs, utility companies can offer new services, for example, financing access to products not previously available to the BOP, and earn higher profits from expanding sales to an untapped market.7
As Latin America and Asia house the world’s two largest BOP markets, this study focuses on the experiences of utility companies in Colombia that layer alternative services atop their core products and draws relevant lessons to utility companies in Asia seeking to enter the BOP market.
Successful BOP utility business models in Colombia
Three Colombian utility providers have successfully entered traditionally underserved BOP markets to provide access to finance for products and services: Promigas, a private gas company, through its financing program Brilla; Codensa, a private electricity company, through program Crédito Fácil; and Empresas Públicas de Medellín (EPM), a public energy and water company, through the program Financiación Social.
These companies have developed new business lines to finance the consumption of non-core products and services, such as construction materials for home improvement, household appliances, school fees, and computers, among others. The programs offer a revolving loan at market interest rates and collect loan payments through the utility bill. Customers can use the loan to purchase prequalified products that improve their quality of life at partnering retail stores.
1 IFC. (2007). “The Next 4 Billion: Market Size and Business Strategy at the Base of the Pyramid.” 2 IDB. (2015). “A Rising US$750 Billion Market.” 3 IFC. (2007). “The Next 4 Billion: Market Size and Business Strategy at the Base of the Pyramid.” 4 Costa & Ehrbeck. (2015). “A Market-Building Approach to Financial Inclusion.” 5 Marquez & Rufín. (2011). “Private Utilities and Poverty Alleviation: Market Initiatives at the Base of the Pyramid.” 6 Ibid. 7 Mas & Sullivan. (2011). “Mobile Money as an Information Utility That Touches Everyone: Refining the Vision for Financial Inclusion.”

IDB Research Utility Models for the BOP | Page
11620WilshireBlvd,Suite610 www.manausconsulting.com p:+1(213)599.7442LosAngeles,CA90025 [email protected]
4
Beyond providing BOP customers with access to basic products and services, these programs have produced important business benefits. The programs have diversified and increased revenues for the utility companies, with EBITDA shares ranging from 11% to 25%. Partner stores have also benefited from a larger customer base and increases in sales between 20% and 40%.
Promigas Brilla Presence in Barranquilla and other 12 Colombian departments
BOP beneficiaries (2015): 1.3 million Portfolio (2015): US$128 million
Codensa Crédito Fácil Presence in Bogotá, Cundinamarca, Boyacá, and Tolima
BOP beneficiaries (2015): 1.2 million Portfolio (2015): US$426 million
EPM Financiación Social Presence in Antioquia, Caldas, Quindío, and Santander
BOP beneficiaries (2015): 151,567 Portfolio (2015): US$27.5 million
Note: The table shows figures as of December 2015. BOP beneficiaries are cumulative figures. Portfolio figures are outstanding loans.
The following are common success factors, challenges, and lessons learned from the three programs.
Common Success Factors
Good reputation and disassociation from traditional financial institutions. Customers regard the three companies as responsible and competent, willing to serve everyone equally. At the same time, there is a generalized adverse perception of traditional banks among the BOP. As a result, the BOP is more trusting of the financing provided by the utility companies.
Leverage of existing billing and communications infrastructure. Including financing charges in the utility bill is a major contributing factor to the success of the programs, as clients do not have to make separate transactions to repay their loans. All three companies contact clients two to three times a month as part of their core business, which helps them collect loan payments and assess if clients are having difficulties to pay their loans and offer payment alternatives.
Advantageous regulatory environment. Per Colombian law, utility companies can include charges in their bills for services other than utilities. Some countries have regulations that do not permit this. Separate bills can lead BOP clients to prioritize the payment of one bill over the other, increasing default risk and operational costs.
Separate mechanisms to pay the utility bill and repay loans. Clients can choose to pay their entire utility bill, including credit payments, or only pay the utilities portion of the bill. To pay just one portion of the bill, clients must go to a utility customer service office and have separate bills printed. When splitting the bill, credit representatives assess the client’s situation and come up with an alternative payment plan. These mechanisms to split the bill and on-time intervention to help clients pay their bills contribute to the high loan repayment rates of the programs.
Strong retail partners who understand the business model. All three companies first partnered with large, well-known businesses to launch the programs. This helped the programs attract financing clients. Beyond the economic benefits of the models, such as increased customer base and cash sales, these partners understood the social goal of the programs. The participation of large retailers also signaled to other businesses that the programs do not compete with the financing programs provided by the stores themselves, as utilities target a different segment of the population.
Set-up of financing programs as a separate business unit. Because the programs were conceived as part of business strategies, Promigas and Codensa gave their respective programs the importance of other business lines and placed the programs under strategic units. When EPM restructured its program in 2014 and treated it as another business line, the model became financially viable. Giving programs a strategic corporate role is critical to ensure their success.

IDB Research Utility Models for the BOP | Page
11620WilshireBlvd,Suite610 www.manausconsulting.com p:+1(213)599.7442LosAngeles,CA90025 [email protected]
5
Program piloting and continuous market research. All three companies conducted extensive research on the target population’s characteristics, needs, and challenges to properly develop the initiatives. Management staff said that researching and piloting are needed to preserve the quality of the loan portfolio and ensure the sustainability of the programs.
Common Challenges
Some retail partners opposed the merchant fees charged by utility companies and passed those on to the end customers. Though the program gives partners access to an untapped market and to an important volume of sales, some partners initially overlooked this business benefit because of a merchant fee charged to finance program logistics. Some partners reflected the merchant fee in the final cost of the financed product, transferring it to the BOP customer.
Some retail partners perceived the programs as competing with their financial solutions. Most large retailers nowadays have their own financing programs, usually in the form of company credit cards. Though these financial products do not cater to the BOP, some partners initially perceived the programs of utilities as financing competitors and were at first reluctant to participate.
Utility bill cycles do not always align with clients’ income cycles, delaying loan repayments. Employed clients receive their salaries once or twice a month (e.g. mid and end of the month) and self-employed clients rely on their customers’ payment cycle to receive payments for their services. Utility billing cycles instead respond to when the utility service started or when the utility readings are done. Due to this asynchrony, clients can have difficulties meeting loan payments on time.
Lessons Learned and Recommendations
Training partners’ staff and harmonizing systems make operations smoother. Partners’ staff must understand how the programs work, how to properly collect application documents, and know to adequately report credit transactions. Harmonizing the programs’ and partners’ systems helps ensure that clients can easily use their credit and that companies track such consumption.
Adequate communication with the BOP is critical for credit take up. The BOP often lacks understanding about how credit works. All three programs avoid technical language on their communication strategies, i.e. interest rates. They use simple messages around how much credit is available to clients, how much they need to repay a month, and how to make credit payments.
The business models have to be adaptable to the income patterns of the BOP. The income cycles of the BOP are generally inconsistent and such cycles do not often overlap with utility billing cycles. All three programs offer clients flexibility to meet credit payments, for example, by providing deadline extensions or offering refinancing plans. This flexibility is key for program viability.
The programs must lend responsibly to the BOP. The three Colombian models have learned that BOP clients are aspirational, make purchases primarily to improve their quality of life, and are adverse to over-indebtedness. Nonetheless, the BOP is highly vulnerable to unexpected shocks, such as job loss. Though the programs seek to meet social needs, they have been successful in recognizing when not to extend credit to avoid long-term adverse effects.
The programs have to be financially viable so that social benefits are sustainable. Management in all three companies agrees the programs must be financially sustainable to produce tangible, long-lasting social benefits and to maintain internal buy-in for the initiatives. To be successful, these models need to be their own business lines with enough internal support and resources and have the capacity to generate sufficient financial and social returns.

IDB Research Utility Models for the BOP | Page
11620WilshireBlvd,Suite610 www.manausconsulting.com p:+1(213)599.7442LosAngeles,CA90025 [email protected]
6
Introduction Formal financial services have traditionally been delivered through the brick-and-mortar model. Under this scheme, branches are located primarily where potential clients are easy to access and where customers possess the documentation and credit history necessary for appropriate risk evaluations. Rural and low-income communities find it difficult to access this model, as these individuals are generally located in remote areas and lack the paperwork needed to prove their purchasing power. This makes it costly for the traditional financial system to reach and serve the BOP.
Utility companies—defined here as providers of products and services that meet basic needs through dedicated physical networks—represent a promising opportunity to deliver financial access at scale. This report aims to showcase how utility companies are uniquely positioned to provide alternative services to the BOP by leveraging existing distribution channels and payment records. The research focuses on the experiences of utility companies in Colombia that provide access to finance to the BOP to identify lessons learned relevant to other utility companies looking to enter similar markets, especially in Asian countries. The findings of this study are to be presented at the Asian Development Bank’s Inclusive Business Forum to take place in Manila in February 2016.
The report comprises six sections. The first section provides an overview of the characteristics of the BOP globally and regionally. A second section presents common challenges that BOP populations face to access credit in Latin America and Asia. The third part of the report discusses the characteristics of utility companies that make these entities uniquely suited to reach and serve the BOP. A fourth section presents the cases of three successful business models adopted by Colombian utility companies to offer financial services to the BOP, including a description of program characteristics, common success factors, and common challenges. The fifth and last section provides examples of companies in Asia that already serve the BOP or have the potential to implement similar models.
Methodology The study employed a series of qualitative methodologies to assess the potential of utility companies to meet BOP needs while generating valuable business benefits. Research methods included a thorough desk research, the revision of secondary data sources, and the collection of primary data through key informant interviews (Annex 1). The methodology also involved an in-country visit to learn about the three utility companies in Colombia in December 2015.
The desk research aimed to identify overall challenges to access finance as well as the existing involvement of the private and public sectors in Latin America and Asia to provide the BOP financial solutions to access basic goods and services. Researchers also used regional and country-level statistics to understand the gap to access financing across countries. A number of Asian countries were selected to draw more specific comparisons around financial gap with Colombia. For these comparisons, researchers selected Asian countries based on population size, income per capita, and human development levels.8 Researchers cross-referenced and systematically analyzed all collected information to arrive at the findings presented in this report.
8 Population aged 15-64 (% of total population) and GDP per capita (PPP, current international $) were retrieved from The World Bank’s database; HDI scores were for each country were retrieved from the UNDP website: http://hdr.undp.org/en/countries.

IDB Research Utility Models for the BOP | Page
11620WilshireBlvd,Suite610 www.manausconsulting.com p:+1(213)599.7442LosAngeles,CA90025 [email protected]
7
The BOP Market Four of the seven billion people in the world are individuals at the base of the pyramid, with annual incomes below $3,000 in local purchasing power, representing a PPP$5 trillion global consumer market. About 81% of the BOP population is concentrated in Asia and Latin America and the Caribbean. The BOP market is generally rural, particularly in Asia, and largely functions through the informal economy. This informality represents an important portion of the economy in these regions, accounting for approximately 30% of GDP in Asia and 43% in Latin America.9 Asia houses the largest BOP market in the world, representing 83% of the region’s population with an aggregate income of PPP$3,470 billion (Figure 1).10 The second largest BOP market is Latin America and the Caribbean, accounting for 70% of the region’s population and with a market size of PPP$759 billion.11
Figure 1. BOP Market Size by Region
Data Source: IFC (2007) and IDB (2015)
At the country level, though Colombia, China, Indonesia, Sri Lanka, and Thailand share similar socioeconomic characteristics, the size of their BOP markets vary significantly (Figure 2). Among these countries, China has the largest BOP market, accounting for 55% of the country’s aggregate purchasing power. The second largest BOP market is that of Thailand, representing 47% of its aggregate purchasing power.12 Colombia ranks third with a BOP market that represents 36% of its aggregate purchasing power. 13 While Indonesia and Sri Lanka have smaller BOP markets compared to the other countries, the BOP in these two countries accounts for the highest share of aggregate purchasing power, at 92% and 67% respectively. The BOP markets in all these countries are sizable and represent the needs of 70% or more of the countries’ populations.14
9 IFC. (2007). “The Next 4 Billion: Market Size and Business Strategy at the Base of the Pyramid.” 10 Ibid. 11 IDB. (2015). “A Rising US$750 Billion Market.” 12 IFC. (2007). “The Next 4 Billion: Market Size and Business Strategy at the Base of the Pyramid.” 13 IDB. (2015). “A Rising US$750 Billion Market.” 14 IFC. (2007). “The Next 4 Billion: Market Size and Business Strategy at the Base of the Pyramid.”
$3,470 billion !
$759 billion ! $458 billion ! $429 billion!
Asia! Latin America and the Caribbean !
Eastern Europe ! Africa!
Figure 2. BOP Population and Market Size by Country
Data Source: IFC (2007) and IDB (2015)

IDB Research Utility Models for the BOP | Page
11620WilshireBlvd,Suite610 www.manausconsulting.com p:+1(213)599.7442LosAngeles,CA90025 [email protected]
8
The Financial Access Gap in Latin America and Asia
Despite their size and economic potential, BOP populations are generally not integrated into the global market economy. It is costly for traditional financial institutions to establish a physical presence in BOP communities, as these populations are mostly located in remote rural and semi-urban areas. It is also costly for formal, traditional lenders to assess the creditworthiness of the BOP, as this segment of the population is often employed in the informal economy and lack formal proof of income. These physical barriers and information asymmetries result in a lower penetration of the traditional financial sector among the BOP or in higher lending costs.15, 16, 17
Even when there is physical access to financial institutions, this does not always translate into access to financing. In 2014, while 62% of adults globally held a bank account, only 11% of account holders formally borrowed from a financial institution. By region, East Asia and the Pacific show the largest disparity between owning a bank account (69%) and borrowing (11%), followed by South Asia (46% versus 6%), and Latin America (51% versus 11%). Colombia shows a similar trend, with 39% of adults owning a bank account and only 12% borrowing from formal financial institutions (Figure 3). 18 Additionally, over two-thirds (61%)19 of the Colombian adult population has no access to formal financial services and, according to the Colombian Banking Association, 79% have no access to credit cards.20
Figure 3. Select Financial Inclusion Indicators by Region, 201421
Source: World Bank, The Global Findex Database 2014.
As a result of these barriers, people turn to non-traditional channels of financing. In Colombia, as well as in the rest of Latin America and developing Asia, unbanked populations typically turn to friends, family or informal moneylenders as sources of credit, which can result in significantly higher interest rates.22, 23 Across regions, family or friends are the most common source of borrowing, ranging from 13% in Latin 15 IFC. (2007). “The Next 4 Billion: Market Size and Business Strategy at the Base of the Pyramid.” 16 World Bank. “The Global Findex Database 2014: Measuring Financial Inclusion Around the World.” 17 ADB. (2015). “Asian Development Outlook 2015.” 18 World Bank. “The Global Findex Database 2014: Measuring Financial Inclusion Around the World.” 19 Ibid. 20 IDB. (2013). “Banking the Unbanked in Colombia.” 21 East Asia and Pacific includes: Cambodia, China, Indonesia, Malaysia, Mongolia, Myanmar, Philippines, Thailand, and Vietnam. South Asia includes: Afghanistan, Bangladesh, Bhutan, India, Nepal, Pakistan, and Sri Lanka. Europe and Central Asia includes: Albania, Armenia, Azerbaijan, Belarus, Bosnia and Herzegovina, Bulgaria, Georgia, Hungary, Kazakhstan, Kosovo, Kyrgyz Republic, former Yugoslav Republic of Macedonia, Moldova, Montenegro, Romania, Serbia, Tajikistan, Turkey, Turkmenistan, Ukraine, and Uzbekistan. 22 IDB. (2013). “Banking the Unbanked in Colombia.” 23 ADB. (2015). “Asian Development Outlook 2015.”
62%!
69%!
46%!51%! 51%!
39%!
11%! 11%!6%!
11%! 12%!16%!
0%
10%
20%
30%
40%
50%
60%
70%
80%
World! East Asia and Pacific!
South Asia! Latin America and Caribbean!
Europe and Central Asia!
Colombia!
Perc
enta
ge o
f Pop
ulat
ion
aged
15
and
abov
e!
Account Ownership! Borrowed from a financial institution!

IDB Research Utility Models for the BOP | Page
11620WilshireBlvd,Suite610 www.manausconsulting.com p:+1(213)599.7442LosAngeles,CA90025 [email protected]
9
America and the Caribbean to 31% in South Asia (Figure 4). Using retail store credit is the second alternative form of borrowing across geographies with the exception of South Asia, where people tend to resort to informal lenders.24
Figure 4. Sources of (new) formal and informal loans, 2014
Source: World Bank, The Global Findex Database 2014.
Despite these challenges, there have been important innovations to improve financial access. For example, the transition from cash to digital payments has led to several benefits, including increased speed of payments, lower costs of disbursing and receiving payments, improved security and enhanced record-keeping for the purposes of building credit. Branchless banking, which replaced the need for physical offices and allowed transactions to take place at retail stores, supermarkets, or gas stations, has also improved financial access. The branchless model has gained much traction in Latin America. Colombia, in particular, has made significant strides to improve financial access using this model, which is present in 88% of the country’s municipalities.25
While these mechanisms have reduced financing costs and improved financial access, other innovations hold promise to widen financial inclusion around the world. Utility companies have robust distribution channels and in-depth consumer information that can be leveraged for the provision of financing for goods and services. For instance, in 2014, 60% of adults worldwide reported payments for water, electricity, or trash collection, with regional averages at 37% in South Asia, 62% in Latin America and the Caribbean, and 76% in East Asia and the Pacific.26 The next section of the report describes how utility companies can use their networks as distribution channels to offer the BOP products and services that go beyond their core offerings.
24 World Bank. “The Global Findex Database 2014: Measuring Financial Inclusion Around the World.” 25 Dabla-Norris et al. (2015). “Financial Inclusion: Zooming in on Latin America.” 26 World Bank. “The Global Findex Database 2014: Measuring Financial Inclusion Around the World.”
11%!
6% !
11%! 12%!15%!
28%!31%!
13%!
24%!
16%!
3% !
11%!
5%!2%!
8%!
4% !
9%!12%!
10%!9%!
0%
5%
10%
15%
20%
25%
30%
35%
East Asia and Pacific! South Asia! Latin America and Caribbean !
Europe and Central Asia!
Colombia!
Perc
enta
ge o
f Pop
ulat
ion
aged
15
and
abov
e!
Financial institution! Family or friends! Private informal lender ! Retail store (store credit)!

IDB Research Utility Models for the BOP | Page
11620WilshireBlvd,Suite610 www.manausconsulting.com p:+1(213)599.7442LosAngeles,CA90025 [email protected]
10
Utilities Companies and the BOP Utility companies have begun to participate in financial inclusion. They enter the financial market by leveraging existing resources and capabilities, including distribution networks, customer relationships, and market knowledge. These entities, both private and public, enter the market for a variety of reasons, including to make charitable contributions and augment their corporate social responsibility initiatives. However, they also enter the market to increase consumer loyalty and improve profitability.
Utility companies can contribute to and benefit from the provision of financial products and services to the BOP in three major ways:27
1) Reducing information costs of credit risk assessment: Understanding the risk associated with extending credit requires reliable information on individuals’ income levels, spending, and repayment behavior. The cost of collecting and validating such information can be high for most organizations, either in the form of high operational costs to directly gather this information from potential clients or in the form of investments in data analytics to assess the creditworthiness of the unbanked. Regular payment records provide alternative indicators of financial history and measures of risk.28 By leveraging utility payment histories, companies are solving the problems of adverse selection, which arises when a supplier cannot determine the reliability of the buyer, and of moral hazard, which occurs when the reliability of a customer declines after the product is sold. With access to payment histories, utility companies can choose to offer additional services and products only to reliable customers, significantly reducing default risks for the company and simplifying document requirements for consumers. 29
2) Reducing distribution costs to reach underserved populations: Traditional financial providers seeking to expand their services to the poor often face the barrier of high distribution costs. The brick-and-mortar bank model has failed to reach a large portion of low-income populations, particularly those residing in rural, sparsely populated areas.30 In contrast, utility companies are uniquely positioned to serve BOP populations due to their existing, extensive distribution networks. By meeting basic human needs, such as energy, water, sanitation, and information technologies, the utility market inherently includes a significant portion of the population in a given region.31 It can also be costly for traditional financial institutions to collect payments from the unbanked. But utilities’ existing billing infrastructure provides a way to collect payments for non-core products and services at marginal additional costs.32
3) Bringing innovative products and services to the BOP market: With lower distribution and information costs, companies can bring new products and services beyond their traditional offerings to underserved markets. Specifically, the existing delivery channels of utility companies set up to provide their core services mean low marginal entry costs for the provision of new services (e.g. financial services), high potential returns from expanding alternative sales to an
27 Costa & Ehrbeck. (2015). “A Market-Building Approach to Financial Inclusion.” Note: Though the authors developed these three approaches specifically in relation to the private sector, the three points are also relevant to public sector entities. 28 Ibid. 29 Marquez & Rufín. (2011). “Private Utilities and Poverty Alleviation: Market Initiatives at the Base of the Pyramid.” 30 Costa & Ehrbeck. (2015). “A Market-Building Approach to Financial Inclusion.” 31 Mas & Sullivan. (2011). “Mobile Money as an Information Utility That Touches Everyone: Refining the Vision for Financial Inclusion.” 32 Marquez & Rufín. (2011). “Private Utilities and Poverty Alleviation: Market Initiatives at the Base of the Pyramid.”

IDB Research Utility Models for the BOP | Page
11620WilshireBlvd,Suite610 www.manausconsulting.com p:+1(213)599.7442LosAngeles,CA90025 [email protected]
11
untapped market, and the benefits from revenue diversification. At the same time, there are important benefits for consumers from accessing services not previously available to them.33
While some utility companies have acted on the opportunity to provide financial products and services to traditionally untapped markets, widespread participation of the sector in financial access initiatives for the BOP has yet to take off in most developing countries. The following are three key factors underlying this slow uptake:
1) Lack of adequate regulatory environments: Utility companies are highly vulnerable to political intervention, for example, through pricing regulations that hold rates artificially low. Consequently, companies seeking to serve BOP communities may have difficulties anticipating revenues and profitability. 34 Utility companies seeking to provide financial services may also need to meet cumbersome financial sector regulations. For instance, onerous know-your-customer regulations35 have sometimes prevented the most vulnerable populations from accessing formal financial services, while also proving costly for entities seeking compliance.36
2) Limited demand for alternative products and services: Utility companies delivering products and services beyond their traditional offerings may face low demand due to the inability of BOP consumers to pay for certain products and services. Companies interested in serving the BOP must develop models tailored to the income streams, consumption patterns, price points, overall constraints, and decision-making processes of the BOP. The culture of non-payment among BOP communities can be an important challenge to building demand as well. This non-payment culture can be attributed to a number of factors, including prior policies authorizing free utilities or the perception that private utility companies are profiting unjustly from the poor.37
3) Limited supply as a result of seeing the BOP as an unprofitable market: In addition to demand-side barriers, utility companies may also face pushback from their own leaders. Utility managers may not consider BOP communities as potential customers or a viable market. As such, company leadership focuses on optimizing operations and hesitates to provide alternative products or services (e.g. financing) that may not be strictly related to the utility company’s core business.38
Despite these challenges, the business and social benefits of entering BOP markets are significant and some utility companies have successfully taken advantage of characteristics intrinsic to their businesses to serve these populations.
33 Mas & Sullivan. (2011). “Mobile Money as an Information Utility That Touches Everyone: Refining the Vision for Financial Inclusion.” 34 Marquez & Rufín. (2011). “Private Utilities and Poverty Alleviation: Market Initiatives at the Base of the Pyramid.” 35 Regulatory requirements related to Anti-Money Laundering (AML) compliance. 36 Costa & Ehrbeck. (2015). “A Market-Building Approach to Financial Inclusion.” 37 Marquez & Rufín. (2011). “Private Utilities and Poverty Alleviation: Market Initiatives at the Base of the Pyramid.” 38 Ibid.

IDB Research Utility Models for the BOP | Page
11620WilshireBlvd,Suite610 www.manausconsulting.com p:+1(213)599.7442LosAngeles,CA90025 [email protected]
12
Successful Utility Models Serving the BOP This section describes the business models of three Colombian utility providers that have successfully entered traditionally underserved BOP markets. The section details the business opportunity identified by the companies, their implementation strategies, and results to date.
Background
Promigas is one of the largest providers of natural gas in Colombia, with a market share of 40%. The company serves households in 13 of the country’s 32 departments through five gas distribution companies: Surtigas, Gases de La Guajira, Gases del Caribe, Efigas, and Gases de Occidente (Figure 5). 39 Nearly 90% of its 2.96 million customers belong to the country’s lowest income strata.40
Promigas’ distribution companies traditionally concentrated their operations on three areas: government-regulated business (distribution and commercialization of natural gas), mixed business (combination of regulated and non-regulated services, e.g. sale of the gas connection), and non-regulated products and services (e.g. financing of the connection cost).41
In the area of non-regulated services, Promigas started providing financing solutions to help BOP customers cover the cost of new gas connections (approximately US$500 per home42),
39 IFC. (2014). “Inclusive Business Case Study: Promigas.”40 Promigas. (2015). “Presentación Corporativa Brilla.”41 Ibid.42 Promigas. (2015). “Presentación Corporativa Brilla.”
Location: Barranquilla, Colombia Program start: 2007
Sector: Private Total beneficiaries (2015): 1,678,655 individuals
Distribution: 13 Colombian departments BOP beneficiaries (2015):
1,246,690 individuals (74% of all program beneficiaries)
Utility:
natural gas
Loan portfolio (COL$ million, 2015): 405,979 (US$128 million)
Non-performing loans (2015): 2.7%
Figure 5: Promigas’ Gas Distributors in Colombia
Dark areas are Promigas’ distribution areas
Source: Promigas, 2015
Company: Promigas Program: Brilla

IDB Research Utility Models for the BOP | Page
11620WilshireBlvd,Suite610 www.manausconsulting.com p:+1(213)599.7442LosAngeles,CA90025 [email protected]
13
as such costs can represent as much as three times the monthly income of these families.43 Repayment for the financing requires an up front deposit of US$25 and up to 72 subsequent payments of US$10-$15 per month included in the gas bills. Approximately 98% of Promigas’ customers use this option to establish gas connections for the first time.44
As with any monopoly, the government closely regulates the commercialization and distribution of natural gas, which limits the revenue growth potential of Promigas’ core business. The mixed and non-regulated business areas thus offer higher return potential for the company. However, in 2005, as more customers paid off their connections, Promigas’ revenues from the mixed and non-regulated businesses began to decline. The company forecasted that the EBITDA share from these business lines would decrease from 44% to 23% in ten years. In response, Promigas created Brilla as a business strategy to increase earnings from non-regulated services and create additional value for customers.45
Business opportunity and social need
Through the experience of financing the cost of a new gas connection, Promigas realized that BOP customers had purchasing power and that 70% of them had no credit history or access to the formal financial system. It specifically learned that BOP families could at least repay the equivalent of the first-time connection cost in monthly installments of US$10-15. To understand what other products or services it could finance with this “share of wallet,” the company launched a survey and found that BOP customers mainly needed credit for home improvements, school fees, household appliances, and emergencies.46
Design strategy
Promigas capitalized on its knowledge of the payment habits of two million clients, a hidden asset, to offer financial products for the BOP. It used over thirty years of records from financing home connections to assess risk and develop a financial solution tailored to the needs and characteristics of the BOP. The company specifically focused on retaining its “share of wallet” and not exceeding this amount so that consumers could afford the loans and avoid over-indebtedness.47
In 2007, Promigas formally launched Brilla as a solution to finance construction materials for home improvement and household appliances. The company later expanded the portfolio of products eligible for financing to include televisions,48 computers, education, motorcycle insurance, and audio and video items. More recently, Brilla started financing clothing and food during the Christmas season.49
Business model
Brilla offers a fixed loan quota equivalent to the cost of a new connection (share of wallet), which varies according to the socioeconomic strata of the customer. Colombia has six well-defined socioeconomic strata, where strata one, two and three are the segments with those with the lowest income and strata four, five and six are the segments with highest income. Brilla’s loan quotas are different across
43 IFC. (2014). “Inclusive Business Case Study: Promigas.”44 Promigas. (2015). “Presentación Corporativa Brilla;” Interviews with Promigas staff (December 2015).45 Ibid.46 Ibid.47 Ibid.48 Televisions are important means of entertainment for low-income populations, as money is tight and there is little to no disposable income for other forms of entertainment (e.g. movies, concerts, etc.). 49 Promigas. (2015). “Presentación Corporativa Brilla;” Interviews with Promigas staff (December 2015).

IDB Research Utility Models for the BOP | Page
11620WilshireBlvd,Suite610 www.manausconsulting.com p:+1(213)599.7442LosAngeles,CA90025 [email protected]
14
distribution companies but are on average: COL$1.3 million (US$400) for stratus one; COL$1.4 million (US$430) for stratus two; COL$1.6 million (US$490) for stratus three; COL$1.8 million (US$550) for stratus four; and COL$2.6 million (US$800) for strata five and six.50
As of October 2015, the average loan taken by a client was COL$978,000 (US$300). The program lends at the maximum market interest rate allowed by Colombian regulations, approximately 29% per year. Clients can choose repayment terms of up to 60 months. The Brilla credit does not involve an administration fee (cuota de manejo) and customers pay their financed products through their gas bills.51
Brilla does not require a down payment, co-signer, or collateral. To be eligible for the program, a prospective borrower must be a Promigas account holder with at least two years of on-time gas payments and must have finished repaying the gas connection. Only one person per household, the account holder, can request the credit. Other members of the household can benefit from the credit—for example, a parent that takes the credit to pay for his/her children’s education—but the account holder is the person legally responsible for the repayment of the loan.52
As for credit risk assessment, Brilla does not conduct credit studies on customers. The company checks the status of the client with credit bureaus only to ensure s/he has not been reported for defaults. If the client has consistently paid the gas bill for the past two years, the credit is automatically available.53
Once a quota has been approved, the client can purchase products using the credit at over 185 retailers registered with Promigas, including hardware stores, appliance vendors, and department stores.54 Promigas limits the type of items that can be purchased with Brilla credit, allowing clients to purchase products that improve the quality of life of BOP customers only. As of October 2015, 32% of the Brilla loans corresponded to construction materials for home improvement, 31% to home appliances, 11% to televisions, 9% to computers, and 7% to furniture.55
In contrast to the other two models described in this report, Brilla loans are not offered through a credit card. Instead, program partners have access to Brilla’s online portal and can check in real time the quota available to the client and register the client’s purchase. Brilla charges a merchant fee to partners, which ranges from 1.5% to 5% of sales, depending on the sales channel and type of vendor. Brilla and partners share the cost of discounts offered exclusively to Brilla costumers.56
50 Promigas. (2015). “Presentación Corporativa Brilla;” Interviews with Promigas staff (December 2015).51 Information provided by Silvia Adie, Manager of Non-bank Financing at Promigas (December 2015).52 Promigas. (2015). “Presentación Corporativa Brilla;” Interviews with Promigas staff (December 2015).53 Ibid.54 IFC. (2014). “Inclusive Business Case Study: Promigas.”55 Promigas. (2015). “Presentación Corporativa Brilla;” Interviews with Promigas staff (December 2015).56 Ibid.
Figure 6: Brilla Credits per Item, 2015
Results as of October 2015. Figure produced by MANAUS with
data taken from “Brilla Presentación Corporativa.”

IDB Research Utility Models for the BOP | Page
11620WilshireBlvd,Suite610 www.manausconsulting.com p:+1(213)599.7442LosAngeles,CA90025 [email protected]
15
Social benefits
As of October 2015, Brilla has benefited over 1.7 million families, 74% of them are households in the two lowest socioeconomic strata (Figure 7). In 2013, Promigas commissioned an impact evaluation to quantify the economic benefits of Brilla. The study found that Brilla is the only financial tool available to 29% of program participants. About 12% of program participants use the Brilla credit to substitute informal financing, which led to average savings of 6% of the household’s income due to lower interest payments. 57
As program participants often use Brilla to create alternative sources of income—for instance, by expanding their houses to rent out rooms or by establishing home-based micro-enterprises—the study estimated that the program has led to an approximately 14% increase in household income. Brilla also contributed to pulling 10% of its beneficiaries above the poverty line.58 Other indirect results included a 7% increase in the number of families connected to the Internet through the financing of computers.59
Business benefits
As of October 2015, Brilla has provided nearly COL$1.5 billion (US$460 million) worth of credits, with an outstanding portfolio of almost COL$406 billion (US$128 million). Only 2.7% of the portfolio is 60 days past due. Over 50% of clients reuse the Brilla credit to purchase new products.60 As of December 2015, Promigas projected to close 2015 with an EBITDA of COL$65,067 million (US$21.4 million) and COL$38,504 million (US$12 million) in profit.61 Promigas’ management staff indicated that, across all five distribution companies, Brilla represents approximately 11% of EBITDA. Management at the distributor Gases del Caribe stated that Brilla currently accounts for 14% of the distributor’s EBITDA.62
Brilla also generates important benefits for participating suppliers and retailers. The program brings in customers that would be unable to access partners' products without the Brilla credit, importantly increasing sales volumes. The program also increases partners’ cash flow, as Brilla absorbs the lending risk and pays in full for the cost of the product as soon as the partner invoices Brilla. Partners also benefit from improved brand recognition, as their businesses are known within a broader customer base and are associated with the good reputation of Promigas, its distribution companies, and Brilla. According to interviewed stakeholders, Brilla can represent up to 90% of sales for small and medium sized partners and 20%-40% for large retail partners.63
57 Promigas. (2015). “Presentación Corporativa Brilla;” Interviews with Promigas staff (December 2015).58 Econometría Consultores. (2013). “Evaluación de impacto del Programa BRILLA sobre la calidad de vida de sus usuarios.”59 Promigas. (2015). “Presentación Corporativa Brilla;” Interviews with Promigas staff (December 2015).60 Ibid.61 Information provided by Silvia Adie, Manager of Non-bank Financing at Promigas (December 2015).62 Interviews with Silvia Adie, Manager of Non-bank Financing at Promigas, and Angela Piñeros, Manager of Non-bank Financing at Gases del Caribe (December 2015).63 Interviews with Angela Piñeros, Manager of Non-bank Financing at Gases del Caribe, and customers and partners of Brilla at Gases del Caribe (December 2015).
Figure 7: Social Results of Brilla, 2015
Results as of October 2015. Data source: “Brilla Presentación
Corporativa.”

IDB Research Utility Models for the BOP | Page
11620WilshireBlvd,Suite610 www.manausconsulting.com p:+1(213)599.7442LosAngeles,CA90025 [email protected]
16
Background
Codensa provides electric power to the city of Bogotá and 103 municipalities in the department of Cundinamarca since 1997. It also operates in eight municipalities of Boyacá and one of Tolima. It is part of the Enel Group, the second largest electric power company in Europe, with presence in 32 countries including Chile, Brazil, Colombia, Argentina, and Peru. The company is the leading electricity company in Colombia in number of clients and has a national market share of 24%.64
At the time of its founding, Codensa was losing electricity at an annual rate of 23% of its total output and had bad debts of 115% of its monthly billing. Codensa conducted a study to understand the causes of losses and debt, finding that customers’ resistance to pay for utilities played a significant role. The study also found that 83% of Codensa’s clients belonged to the lowest three socioeconomic strata and that lack of payment was concentrated in these segments.65
In response, Codensa deployed a comprehensive strategy to improve the business, including technical measures to reduce theft, a plan to improve community relations, a program to reduce late payments through soft financing, and an investment plan to enhance service quality. While the strategy successfully strengthened the company’s financial and operational infrastructure, the liberalization process of the electricity market in Colombia in the early 2000s allowed clients to freely choose power providers. With increased competition, Codensa saw the need to develop strategies to build its brand and retain clients.66
Business opportunity and social need
In anticipation of losing its monopoly of electricity distribution due to increased competition, Codensa sought to diversify its business and conducted preliminary market studies to determine what other products or services it could offer. One of the studies revealed the existence of an untapped market, a high proportion of customers who could not buy household appliances because they did not have enough cash and could not access credit. Codensa saw the opportunity to help BOP customers access basic products that could improve their standard of living while increasing company sales and retaining customers.67
64 Codensa (2015). “About Codensa: Our History.” 65 Lobo et al. (2014). “Codensa: Easy Credit for All.” 66 Ibid.67 Ibid.
Location: Bogotá, Colombia Program start: 2001
Sector: Private Total beneficiaries (2015): 1,240,262 individuals
Distribution: Bogotá, Cundinamarca, Boyacá, and Tolima
BOP beneficiaries (2015):
1,184,928 individuals (96% of all program beneficiaries)
Utility:
electricity
Loan portfolio (COL$ million, 2015):
1,353,181,723,045 (US$426 million)
Non-performing loans (2015): 4.98%
Company: Codensa-Colpatria Program: Crédito Fácil

IDB Research Utility Models for the BOP | Page
11620WilshireBlvd,Suite610 www.manausconsulting.com p:+1(213)599.7442LosAngeles,CA90025 [email protected]
17
Design strategy
In 2001, Codensa formally launched the program Codensa Hogar (renamed Crédito Fácil in 2006), a business line to finance the purchase of household appliances. From inception, Codensa sought to use third party companies with the know-how to handle the credit and commercialization side of the business, while the company would use its capacity to reach customers and collect payments through the electricity bill.68
For credit structuring, Codensa was not able to find a bank to partner with. Most banks declined to partner with the company because they believed it was too risky to provide credit to BOP borrowers. Only one bank was initially interested in the program but later withdrew from the partnership since Codensa and the bank did not agree on the credit conditions to offer customers. The company then outsourced credit-structuring activities to a credit factory, a company that streamlines risk assessment, establishment of creditworthiness, and loan approval. On the retail side, Codensa saw the need to partner with a well-established retailer to help promote loans and reach volume. It closed a successful partnership with Alkosto, the largest retailer of household appliances in Colombia at the time. Codensa piloted the program in November 2001 and reached US$389,565 in sales within a month.69
In 2004, Codensa established new strategic partnerships with two other large retailers, Éxito and Carrefour. In 2005, the company expanded its portfolio to finance home improvement products (e.g. flooring, construction materials, furniture, among others). In 2006, the program introduced the use of a closed credit card, a card with an approved loan amount that clients could use only at partnering stores and for qualified products. The program grew rapidly and, in 2009, Codensa sold the portfolio of Crédito Fácil to Colpatria Bank, part of the Scotiabank Group, and signed a 10-year cooperation agreement for Colpatria to continue using Codensa’s brand and billing infrastructure to operate the program. In 2010, Crédito Fácil started financing clothing, footwear, motorcycles, and leisure trips. In 2014, the program began to offer personal lines of credit.70
Business model
Credito Fácil offers revolving loans ranging from COL$350,000 to COL$12 million (US$110 to US$3,700) through a closed credit card. The program currently works with three financial products: the seed credit card, which is the most basic product and is usually offered to unbanked clients; the yellow credit card, the most commonly used card; and the VIP credit card, offered only to select clients with consistent good payment. The program lends at the maximum legally allowed market interest rate, approximately 29% per year, and approves loans for up to four times the client’s salary. Clients can choose terms of repayment between six and 48 months.71
All financial products involve a monthly administration fee, ranging from COL$7,500 to COL$10,900 (US$2-3). This fee is lower than that of competitor credit cards (COL$15,000-20,000 or US$5-6 per month) and is only charged if there is an outstanding balance. Other credit cards tend to charge this fee regardless of whether the client has a balance or not.72
68 Lobo et al. (2014). “Codensa: Easy Credit for All.” 69 Ibid. 70 Colpatria. (2015). “Crédito Fácil Codensa: Una herramienta financiera que bancariza y mejora la calidad de vida de la familia bogotana - Noviembre 2015.” 71 Ibid. 72 Ibid. Interviews with Colpatria’s Crédito Fácil management staff and clients (December 2015).

IDB Research Utility Models for the BOP | Page
11620WilshireBlvd,Suite610 www.manausconsulting.com p:+1(213)599.7442LosAngeles,CA90025 [email protected]
18
Both property owners and renters can apply for the credit. The application process requires an application form and three supporting documents: identification document, electricity bill, and income certification. For self-employed or unbanked clients, Crédito Fácil has identified an alternative set of documents that can be used as proof of income, such as payment receipts. Potential clients can apply for credit with incomes as low as half the minimum wage (approx. US$100 per month),73 which is lower than the amount required by most Colombian banks. The loan approval rate of Crédito Fácil is approximately 40%-50% of applicants.74
Once the credit card has been approved, customers can use it to purchase qualified products in more than 900 partner stores. The average size of an approved loan is COL$2.5 million (US$780) and the average loan used by clients is COL$1.25 million (US$400). Most clients use only half of their approved loan amount at a time. Clients pay the financed amount through their electricity bill. A third (33%) of Crédito Fácil’s financing corresponds to purchases of household appliances, followed by products for home improvement (23%), and clothing and footwear (23%).75
Crédito Fácil charges a merchant fee of approximately 2.4% of sales. This fee is higher than that charged by other financial products (approximately 1.4%) since the program brings a higher volume of clients to partner stores. Colpatria staff explained that despite the higher merchant fee, most partners earn double the profit through Crédito Fácil, compared to other financial products, due to the size of the BOP market. As for discounts offered exclusively to Crédito Fácil users, Colpatria and partners contribute to a fund to share the costs of the discounts. To use Codensa’s billing infrastructure and brand, Colpatria pays the utility company a billing fee as part of the 10-year collaboration agreement.76
Social benefits
Since its creation in 2001 and until the end of 2015, Crédito Fácil has benefited over 1.2 million Colombians in Bogotá and surrounding municipalities. Nearly all program participants (96%) are individuals in the three lowest socioeconomic strata. For 77% of its customers, Crédito Fácil was the first time they accessed credit. Crédito Fácil makes clients who previously had no access to finance visible to the formal financial system, as it reports the repayment behavior of its clients to credit bureaus. Today, 54% of the program’s clients use Crédito Fácil as their only financing tool, while 23% of the program’s clients have now been able to access financing at other institutions (Figure 9).77
73 As of 2015, the minimum wage in Colombia was set at COL$644,350 (US$200) per month. 74 Colpatria. (2015). “Crédito Fácil Codensa: Una herramienta financiera que bancariza y mejora la calidad de vida de la familia bogotana - Noviembre 2015.” Interviews with Colpatria’s Crédito Fácil management staff and clients (December 2015). 75 Ibid. 76 Interviews with Colpatria’s Crédito Fácil management staff and partners (December 2015). 77 Colpatria. (2015). “Crédito Fácil Codensa: Una herramienta financiera que bancariza y mejora la calidad de vida de la familia bogotana - Noviembre 2015.” Interviews with Colpatria’s Crédito Fácil management staff and clients (December 2015).
Figure 8: Crédito Fácil’s Purchases per Item Group, 2015
* books, car tires, musical instruments, accessories for cars, optical stores.
Source: Colpatria. Results as of November 2015.

IDB Research Utility Models for the BOP | Page
11620WilshireBlvd,Suite610 www.manausconsulting.com p:+1(213)599.7442LosAngeles,CA90025 [email protected]
19
Even as Crédito Fácil creates a credit history for clients, the program continues to reach an important BOP segment with a high credit risk profile and for whom there is little credit offer. Among the current clients who only access financing through Crédito Fácil, 73% are from the lowest two socioeconomic strata; most are 18-25 or over 55 years old; 70% have basic education; and most are single or cohabitating with a partner.78
In addition to giving access to credit, Crédito Fácil provides other tangible benefits to clients. It gives BOP customers access to a wide range of high quality products that can significantly improve their life standards, which they could not otherwise purchase. It has a positive effect on household income since it finances consumption at a lower cost. This is particularly the case among the unbanked, who often resort to informal, expensive financial alternatives, such as small moneylenders, that charge as much as 20% interest daily.79
Business benefits
As of December 2015, Crédito Fácil has provided over COL$3,000 billion (US$960 million) worth of credits, representing approximately COL$8,000 billion (US$2.6 billion) in total loans disbursed. At the end of 2015, the program had an outstanding portfolio of COL$1,300 billion (US$426 million). Non-performing loans account for 4.98% of the portfolio, lower than the average for the credit card industry (5.99%) and competitor products, such as the credit cards of retailers Éxito (8.75%) and Falabella (5.67%).80 Crédito Fácil is the leading credit card in Bogotá, with a market share of 18%, ahead of the share of Colpatria’s other financial products and that of similar products offered by other banks and retailers. Crédito Fácil is also the most profitable product of Colpatria, representing about 10% of the company’s assets and 25% of its revenues. It is also the main contributor to the bank’s EBITDA.81
Crédito Fácil also provides tangible benefits for partnering stores. Even though most large partnering retailers have their own financing products, Crédito Fácil gives them access to a market that their programs do not reach. According to Crédito Fácil staff, the program represents an average of 18%-20% of partners’ sales. Management staff at retailer Alkosto, a key program partner, indicated that Crédito Fácil currently accounts for 30% of their sales in Bogotá. Crédito Fácil also holds the risk of lending to the BOP, as partnering stores receive full payment for their products upon invoicing.82
78 Ibid. 79 Ibid. 80 Colpatria. (2015). “Crédito Fácil Codensa: Una herramienta financiera que bancariza y mejora la calidad de vida de la familia bogotana - Noviembre 2015.” Interviews with Colpatria’s Crédito Fácil management staff and clients (December 2015). 81 Interviews with Colpatria’s Crédito Fácil management staff (December 2015). Colpatria staff declined to provide a precise figure on the program’s EBITDA. 82 Interviews with Colpatria’s Crédito Fácil management staff and partners (December 2015).
Figure 9: Crédito Fácil’s Clients, 2015
At origination Today
Source: Colpatria. Results as of November 2015.

IDB Research Utility Models for the BOP | Page
11620WilshireBlvd,Suite610 www.manausconsulting.com p:+1(213)599.7442LosAngeles,CA90025 [email protected]
20
Background
Empresas Públicas de Medellín (EPM) is a public utility company that provides water, electricity, and natural gas services to Medellín and to over 120 municipalities in the department of Antioquia. The company was established in 1955 and the municipality of Medellín is its owner. EPM does not receive funding from the municipality and relies on its own revenues to run operations.83
In 2003, the company expanded to the departments of Caldas and Quindío through the acquisition of Central Hidroeléctrica de Caldas (CHEC) and Empresa de Energia del Quindío (EDEQ). In 2006, EPM established UNE, its telecommunications branch. In 2009, the company acquired two electricity companies in the department of Santander, Centrales Eléctricas del Norte de Santander (CENS) and Electrificadora Santander S.A. (ESSA). The EPM Group currently includes 48 utility companies: 13 in Colombia and 35 in Panama, Mexico, Caiman Islands, Bermuda, Guatemala, El Salvador, and Chile. It currently serves 13 million people in Colombia and another seven million in other countries.84
EPM has traditionally had programs especially designed for the BOP, as more than 80% of its customers pertain to the three lowest socioeconomic strata.85 For instance, the company has had a program to finance the connection to utility services since 1964, which has connected more than 35,000 low-income customers to electricity and over 82,000 to gas services.86
Business opportunity and social need
In contrast to the other two companies discussed in this report, EPM primarily developed Financiación Social to fulfill a social objective and not as a business strategy. The program was specifically designed to respond to the reality that most EPM customers were low-income individuals, living in inadequate housing and with little to no access to credit.87 Eliezer Contreras, the head of the loyalty program unit at EPM, explained: “All of this started as a social discussion. We wondered at the time [2007] what was the point of giving customers electricity and other utility services when they did not even have the minimum living conditions.” 88
At the same time, EPM’s recently created telecommunications branch, UNE, was looking to increase the population’s access to computers and Internet. The Mayor of Medellín, who is legally the head of 83 EPM. (2015). “Quienes somos,” “Historia,” and “Nuestros servicios.” Retrieved from: http://www.epm.com.co/site/Home/Institucional.aspx 84 EPM. (2015). “Innovamos al Servicio de la Gente.” Retrieved from: http://www.epm.com.co/site/portals/descargas/2015/Brochure_EPM.pdf 85 Interviews with EPM staff (December 2015). 86 EPM. (2015). “Innovamos al Servicio de la Gente.” Retrieved from: http://www.epm.com.co/site/portals/descargas/2015/Brochure_EPM.pdf 87 Interviews with EPM staff (December 2015). 88 Ibid.
Location: Medellín, Colombia Program start: 2008
Sector: Public Total beneficiaries (2015): 184,838 individuals
Distribution: Antioquia, Caldas, Quindío, and Santander
BOP beneficiaries (2015):
151,567 individuals (82% of all program beneficiaries)
Utility:
water electricity gas
Loan portfolio (COL$ million, 2015): 87.3 billion (US$27.5 million)
Non-performing loans (2015): 5.8%
Empresas Públicas de Medellín Program: Financiación Social

IDB Research Utility Models for the BOP | Page
11620WilshireBlvd,Suite610 www.manausconsulting.com p:+1(213)599.7442LosAngeles,CA90025 [email protected]
21
EPM, suggested that both companies join efforts. In 2008, the business group formally established Financiación Social with 83% participation from EMP and 17% from UNE. The program aimed to improve the living standards of its customers through access to quality products. Because it was initially created with a social mission, EPM structured the program with a series of subsidies, such as interest rates at half of the market rate. This produced a series of inefficiencies financed entirely against the PEG (price/earnings to growth) of the company and resulted in a cumulative loss of COL$19,000 million (US$6 million). In 2013, the municipality’s accountability office raised concerns about the financial viability of the program and recommended that EPM restructure it so that it was self-sustainable.89
Business model90
Financiación Social currently offers revolving loans ranging from COL$1 million and COL$4 million (US$325-1,350) through a closed credit card and at the maximum annual market interest rate (29%). Customers pay the financed amount in monthly installments through the utility bill. The financing involves a monthly maintenance fee of COL$2,000 (US$0.60) when there is an outstanding balance in the card. This fee is lower than those charged by similar products. For example, the credit card of Éxito, a large retailer and a key partner of Financiación Social, charges a fee of approximately COL$18,000 (US$6) per month.91
In 2011, EPM outsourced the credit structuring and assessment side of the business to institutions that specialize in credit history, payments networks, credit card production, and legal enforcement.92 A credit factory first built a credit model using generic information from the credit sector. In 2013, the credit factory adjusted the model to use repayment information from Financiación Social’s customers. The credit factory, together with EPM, calibrates the credit model every year. Outsourcing activities related to credit risk assessment and loan approval has introduced important efficiencies to the model that have reduced operational costs.93
EPM assesses Financiación Social applicants by classifying them as high, medium, and low risk and then automatically accepts those with low risk. It also provides credit to applicants with medium risk, but invites them to attend workshops on interest rates, revolving credit, and credit history.94 The model has an approval rate of approximately 75%-80% of credit applications.95
To apply for a Financiación Social credit, a potential customer must complete the application form and provide three supporting documents: identification document, recent utility bills (clients with more than two overdue bills or two service suspensions are automatically declined credit), and proof of income. It
89 Interviews with EPM staff (December 2015); EMP (2015). “Ficha de participación en el Foro Latinoamericano de Vivienda.” 90 Financiación Social has been importantly restructured in the past two years. Important changes to the original model include the use of market interest rates, as opposed to subsidized rates, an administration fee (since August 2015), and the segmentation of clients for risk assessment purposes. This section of the report presents the characteristics of the business model as it currently operates. 91 Colpatria. (2015). ““Crédito Fácil Codensa: Una herramienta financiera que bancariza y mejora la calidad de vida de la familia bogotana - Noviembre 2015.” Interviews with Colpatria’s Crédito Fácil management staff and clients (December 2015). 92 Marquez & Rufín. (2011). “Private Utilities and Poverty Alleviation: Market Initiatives at the Base of the Pyramid.” 93 Interviews with EPM staff (December 2015). 94 IDB. (2012). “Empresas Públicas de Medellín: Going Beyond the Basics and Banking the Unbanked;” Interviews with EPM staff (December 2015).95 Interviews with EPM staff (December 2015).
Table 1: Financiación Social’s Loan Size by Socioeconomic Strata, 2015
Stratus Amount (COL$)
1 1,036,000
2 1,215,000
3 1,816,000
4 2,882,000
5 3,607,000
6 4,333,000
Average 1,605,000
Source: EMP, 2015. “Programa de reconomicimiento del Grupo EPM,” Power Point presentation.

IDB Research Utility Models for the BOP | Page
11620WilshireBlvd,Suite610 www.manausconsulting.com p:+1(213)599.7442LosAngeles,CA90025 [email protected]
22
does not require co-signers or collateral. In the case of independent or unbanked workers, EPM accepts alternative forms of proof of income, such as certification of payments or invoices.96
In regard to partner stores, EPM charges an average merchant fee of 1.57% of sales, depending on the sales volume and type of vendor. This merchant fee is lower than the fees charged by other banks and retailors, approximately 4%-5%. EPM and its partners established a common fund to pay for the costs of discounts and events that are exclusive for Financiación Social users.97
In 2014, EPM established a loyalty program, Somos, which gives Financiación Social clients additional benefits. The program aims to improve customer behavior regarding the use and payment of utilities. It works through a point system that rewards customers when they pay their utility bills on time, when they acquire new services, or when they pay their bills online, among others. Clients can use points to make purchases from a catalog of products, to pay for city services (e.g. public transportation), or to pay their utility bills.98
Social benefits
Since its creation in 2008 and until the end of 2015, Financiación Social has benefited 184,838 clients, 82% who belonged to the three lowest socioeconomic strata. In 2014, clients participating in the program saved an estimated COL$5.3 billion (US$1.6 million) from avoiding more expensive credit options (formal and informal).99
Most benefited clients are customers segmented as ‘vulnerable clients’ (2.3%), who are clients with less than 33 points in the National System for the Identification of Potential Beneficiaries for Social Programs (SISBEN, for its acronym in Spanish), a government program that segments individals who qualify for social programs; ‘default risk clients’ (38.5%), who are individuals with unstable income and who pay utilities irregularly; and ‘rural clients’ (20.4%), who live in hard to reach, remote areas. The remaining 40% corresponds primarily to ‘traditional clients’ (37.6%), those who regularly pay their services through a financial institution, and to ‘avant-garde clients’ (1.2%), who regularly pay their services using digital means such as the Internet.100
96 Ibid. 97 Interviews with EPM staff (December 2015). 98 EMP (2015). “Programa de reconomicimiento del Grupo EPM,” Power Point presentation. 99 EMP (2015). “Informe de Sostenibilidad: Financiación Social.” 100 Interviews with EPM staff (December 2015).
Figure 11: Results of Financiación Social, 2015
Source: EPM.
Figure 10: Financiación Social’s Purchases, 2015
Home Improvement includes construction material; Energy includes purchases of
electric and gas household appliances; ICTs include computers, laptops, tablets, etc.
Source: EPM. Results as of December 2015.
IDB Research Utility Models for the BOP | Page
11620WilshireBlvd,Suite610 www.manausconsulting.com p:+1(213)599.7442LosAngeles,CA90025 [email protected]
23
Business benefits
Between 2008 and 2015, Financiación Social awarded COL$305 billion (US$96 million) in credits. As of December 2015, the program had an outstanding portfolio of COL$87.3 billion (US$27.5 million). In 2015 alone, the program awarded COL$66 billion (US$21 million) in credits, up from COL$63 billion (US$19 million) in 2014. 101 , 102 Financiación Social’s non-performing loan rate is 5.8%, which is significantly lower than that of similar products in the market (roughly 10%).103
Since 2013, after the adjustment of the business model, Financiación Social is fully sustainable and has been able to recover COL$7 billion (US$2.2 million) of the COL$19 billion (US$6 million) loss generated by the old, subsidized model. From January to November 2015, the portfolio generated COL$3.4 billion (US$1.1 million) in profits and an EBITDA of COL$4.2 billion (US$1.3 million).104
Financiación Social also generates positive business benefits for partners. Some interviewed partners indicated that sales increased by 15%-20% soon after they joined the program. Even partners who offered other financing options (e.g. through banks or through their own financing programs) experienced similar increases in sales when they introduced Financiación Social to clients. Some partners even said they stopped offering their own financing programs when they started working with Financiación Social. Financiación Social represents an important share of overall sales for most partners, varying from 15% to as much as 40%. Interviewees also said the program helps improve trust among consumers and better position their brand, as EPM has an established reputation in the community.105
Although partners contribute to a fund together with EPM for discounts and joint events, such costs often result in highly profitable incursions for both the program and its partners. For instance, Financiación Social and its partner retailer Éxito organized a one-day event for the holidays, offering discounts of up to 50%. They had projected the event would generate COL$350 million (US$110,000) in revenues. The event attracted approximately 900 clients and resulted in COL$700 million (US$221,000) in sales.106
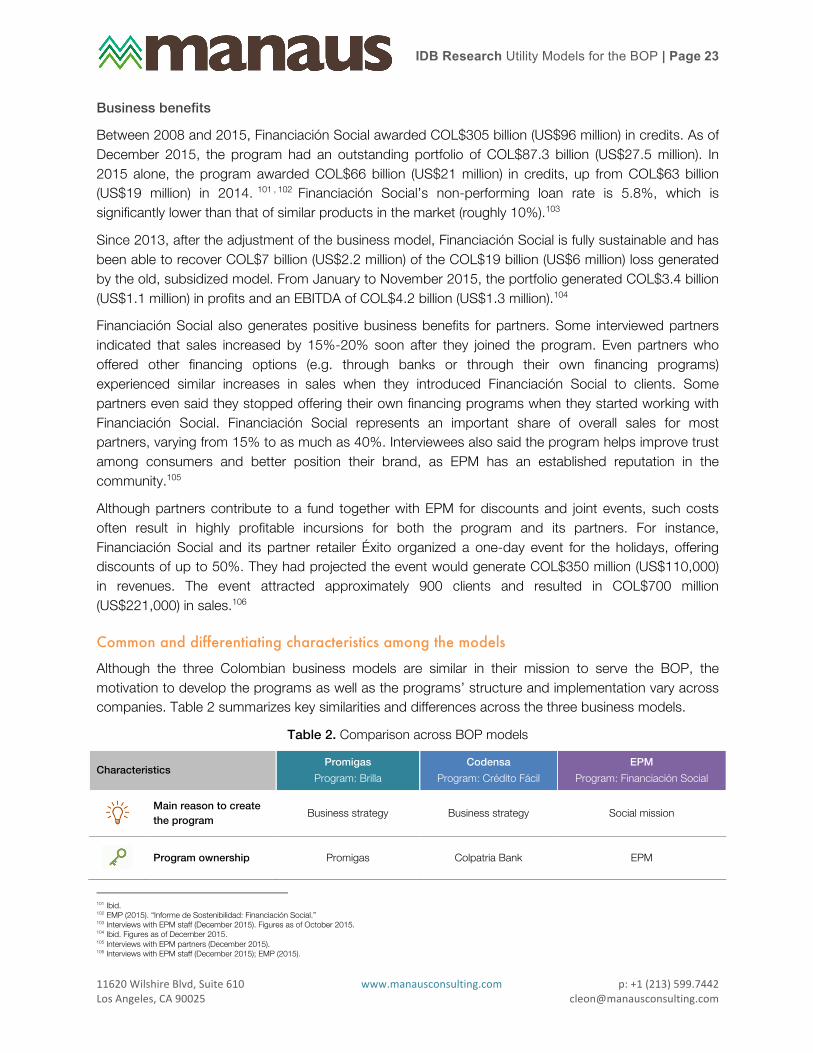
Common and differentiating characteristics among the models
Although the three Colombian business models are similar in their mission to serve the BOP, the motivation to develop the programs as well as the programs’ structure and implementation vary across companies. Table 2 summarizes key similarities and differences across the three business models.
Table 2. Comparison across BOP models
Characteristics Promigas
Program: Brilla Codensa
Program: Crédito Fácil EPM
Program: Financiación Social
Main reason to create the program Business strategy Business strategy Social mission
Program ownership Promigas Colpatria Bank EPM
101 Ibid. 102 EMP (2015). “Informe de Sostenibilidad: Financiación Social.” 103 Interviews with EPM staff (December 2015). Figures as of October 2015. 104 Ibid. Figures as of December 2015. 105 Interviews with EPM partners (December 2015). 106 Interviews with EPM staff (December 2015); EMP (2015).

IDB Research Utility Models for the BOP | Page
11620WilshireBlvd,Suite610 www.manausconsulting.com p:+1(213)599.7442LosAngeles,CA90025 [email protected]
24
Characteristics (cont.) Promigas Program: Brilla
Codensa Program: Crédito Fácil
EPM Program: Financiación Social
Credit structuring and underwriting In-house Outsourced Partially outsourced
Entails credit study of client
No Yes Yes
Who can apply for credit Account holder only Property owners as well as
renters Account holder only
Application requirements No application needed
• Application form • I.D. • Utility bill • Proof of income
• Application form • I.D. • Utility bill • Proof of income
Credit type Revolving, fixed quota with no credit card
Revolving loan through a closed credit card
Revolving loan through a closed credit card
Interest rates Market interest rate (currently at APR 29%)
Market interest rate (currently at APR 29%)
Market interest rate (currently at APR 29%)
Government regulated107 No Yes No
Common success factors
The three business models owe their success to a series of similar factors, including the following:
Utility companies’ good reputation and disassociation from the image of traditional financial institutions. All three companies have a good reputation in the communities where they operate. All interviewees indicated that people regard these utility companies as responsible and competent, willing to serve everyone equally. At the same time, there is a generalized adverse perception of traditional banks among the BOP, who regard banks as either only serving those with high income or unfairly profiting from the poor. As a result, the BOP trusts the financing of utility companies more. Colpatria Bank knew this when it purchased Crédito Fácil and it is one of the reasons why it continues to operate the program under the Codensa brand.
Utilities’ geographic reach and inclusion of credit payments in the utility bill. Reaching the BOP can be expensive, as this segment is often in rural or semi-urban remote areas. Once utility companies have made the investment to bring their core business to these areas and have set up a billing system, bringing additional services to clients and adding a line item on the utility bill to collect loan payments comes at a marginal cost to the companies. Including charges related to the financing in the utility bill is another major success factor of the three programs, as clients do not have to make separate transactions or go to a different office/bank to repay the loan. All three companies contact clients at least two to three times a month, either for invoicing or for technical purposes (e.g. utility reading, maintenance, bill
107 It refers to the oversight of the Superintendencia Financiera de Colombia.

IDB Research Utility Models for the BOP | Page
11620WilshireBlvd,Suite610 www.manausconsulting.com p:+1(213)599.7442LosAngeles,CA90025 [email protected]
25
delivery, bill payment, etc.). This regular contact facilitates the collection of loan payments and the assessment of clients’ difficulties to pay their debts, which allows the programs to offer payment alternatives (e.g. refinancing). This is a key contributing factor to the low rate of non-performing loans the three programs have.
Advantageous regulatory environment. Per the Presidential Decree 828 of 2007, Colombian law allows utility companies to include charges in their bills for services other than for the provision of utilities. The law does require companies to itemize all charges and clearly separate utility charges from credit charges. Some countries’ regulations do not allow utility companies to combine utility charges with other services. For instance, Promigas is seeking to replicate Brilla in Peru, but Peruvian law does not permit the inclusion of additional service charges. This is an important issue since the separation of bills can lead BOP clients to prioritize the payment of one bill over the other, making the credit default risk higher and increasing the programs’ operations costs.
Separate mechanisms to pay a portion of the utility bill. Per Colombian law, utility companies cannot suspend utility services due to lack of loan payment. Clients also have the right to pay only the utilities, that is, the programs cannot force clients to pay the total amount of the bill that includes the credit payments. While clients can pay their utility bills at practically any bank, if they wish to pay just one portion, they need to go to the utility companies’ customer service offices, have a representative print separate bills, and then pay one of them. This is inconvenient for many customers who often prefer to simply pay the bill in full. Additionally, when clients go to the customer service offices to split the bill, program representatives have the opportunity to assess clients’ situation and tailor a payment plan for them. Mechanisms to split the bill and on-time intervention to assess clients’ difficulties to pay both contribute to the high debt repayment rate of the programs.
Strong partners who understand the business model. All three companies first partnered with large, well-known businesses to launch the programs. Promigas initially launched Brilla in partnership with retailers Metrópolis and Creditítulos. Codensa’s Crédito Fácil began with retailer Alkosto. EPM started Financiación Social with retailer Éxito. This helped the programs attract clients, since these partners are known for selling quality products. Beyond the economic benefits of the model for retailers, such as increased customer base and cash sales, partner stores understood the social mission of the programs. The participation of these large retailers also helped signal to other potential partners that these credit programs do not compete with in-store financing schemes, as the utilities’ programs target a different, riskier segment of the population that businesses would not lend to.
Management of programs as another business unit. Because the programs originally started as business strategies, Promigas and Codensa gave their respective programs the importance of any other business line and placed them under strategic departments of the companies. For instance, in the case of Promigas’ Brilla, the unit of credit risk at each distribution company reports directly to each distributor’s CEO and their general directors then report directly to Promigas’ non-bank financing manager; this manager in turn reports directly to Promigas’ CFO. In contrast, because the program started as a social initiative and not as a business strategy, EPM’s Financiación Social initially rotated from one business unit

IDB Research Utility Models for the BOP | Page
11620WilshireBlvd,Suite610 www.manausconsulting.com p:+1(213)599.7442LosAngeles,CA90025 [email protected]
26
to another and program managers had difficulties securing resources. It was not until 2014, when the company restructured the program, that EPM placed Financiación Social under the commercial unit and gave it the relevance of other business lines. Giving the programs a strategic role within the companies is critical to ensure the success of the models.
Program piloting and continuous market research. All three companies conducted extensive research on the target populations’ characteristics, needs, and challenges to properly develop the initiatives. They also piloted the programs with a narrow set of qualified products (usually household appliances and construction materials) and in a smaller geography prior to scaling up. The companies carefully study the financial and commercial feasibility of new financial products or the inclusion of new items as qualified for purchase. Management said this is fundamental to preserve the quality of the portfolio and ensure the sustainability of the programs.
Common challenges
The three business models also faced similar challenges during the development and implementation of the BOP programs, including the following:
Some partners initially opposed the merchant fee and passed it on to the end customers. Because some merchant fees can be higher than those charged by other credit providers, as it is the case of Codensa’s Crédito Fácil, some partners were at first reluctant to participate in the program. Though the program gives partners access to an untapped market and to an important increase in sales volume, some partners initially overlooked this business benefit because of the merchant fee. In other instances, some partners reflected the fee in the final cost of the financed product, transferring it to the end customer.
Some partners perceived the credit programs as competing with their own financing solutions. Most large retailers nowadays have their own financing options, usually in the form of closed credit cards. Though these financial products are not targeted at the BOP and often decline applications from these customers, some partners perceived the utilities’ credit programs as competing with their own financing and were initially reluctant to participate.
Utility payment cycles do not always align with clients’ income cycles, delaying credit payment collection. Most employed clients receive their salaries once or twice a month on specific dates (e.g. mid and end of the month). Self-employed clients often rely on their customers’ payment cycle to receive payments for their services. The utility billing cycle instead responds to when the utility service started and when the utility readings are done. Because of this asynchrony between the utility billing and customers’ payment cycles, clients can have difficulties meeting credit payments on time.

IDB Research Utility Models for the BOP | Page
11620WilshireBlvd,Suite610 www.manausconsulting.com p:+1(213)599.7442LosAngeles,CA90025 [email protected]
27
Lessons Learned This section presents the most relevant lessons learned the three Colombian companies have identified throughout the implementation of their business models. These learnings can guide other utilities interested in serving the BOP on how to best replicate the models.
Training partners’ staff and harmonizing data systems make operations smoother. Because partners’ staff is generally the main point of contact with borrowers, either at stores or through door-to-door selling, it is important that this staff understands how the program works, is able to answer clients’ questions, and can properly collect application documents. All three companies provide training for partners’ staff. Harmonizing the programs’ and partners’ systems is necessary to ensure clients can easily use their credit and the model can track consumption. In the case of Brilla, partners can access an online platform to confirm a client’s available loan quota. Crédito Fácil and Financiación Social employ dataphones, devices enabled to process consumption through their credit cards.
Adequate communication about the programs is critical for credit take up and community acceptance. As those in the BOP have generally been excluded from the traditional financial market, they often lack understanding of how credit and other financial tools work. All three programs avoid technical language on their communication strategies, i.e. principal, interest rates, etc. Instead, they use transparent and simple messages around how much money is available to each client, how much s/he would need to repay a month, and how to make loan payments. To the community side, it is important to properly communicate what the program is and why it was created. For instance, EPM first faced significant pushback from the housing appliances industry, including legal action, as businesses initially perceived the program as EPM entering the appliances market and competing in the sector.
The business models have to be flexible and adjust to the volatile income patterns of the BOP. The income cycles of the BOP are generally inconsistent and, as explained earlier, such cycles do not necessarily overlap with those of utility billing cycles. All three business models offer flexibility for clients to meet credit payments, from allowing customers to call and ask for a payment deadline extension to offering refinancing plans. Throughout the programs’ implementation, all three companies have learned that the BOP has capacity to repay and that, when clients are able to earn enough money, they will meet their payment obligations. The flexibility offered to clients has been key to the viability of the three programs.
The programs must responsibly lend to the BOP and avoid over-indebtedness. The three Colombian models have learned that BOP clients are aspirational, make purchases primarily aimed to improve life quality, and are adverse to over-indebtedness. Interviewed program managers and clients said they mostly use the credit for products that will benefit the household and tend to purchase one large product at a time (e.g. fridge), even when they have credit capacity to borrow more. Nonetheless, this segment of the population is highly vulnerable to unexpected shocks, such as health issues, job loss, or overall deterioration of the economic environment. Though the programs seek to meet important

IDB Research Utility Models for the BOP | Page
11620WilshireBlvd,Suite610 www.manausconsulting.com p:+1(213)599.7442LosAngeles,CA90025 [email protected]
28
social needs, they have been successful in responsibly lending to the BOP and recognizing when not to extend credit to avoid adverse effects.
The programs have to be financially viable so that social benefits are sustainable. Management in all three companies agrees that the programs must be financially sustainable to produce tangible, long-lasting social benefits and to keep internal buy-in for the initiatives. A business model that requires continuous financial support from other business lines is unlikely to last. As explained earlier, to be successful, these types of business models need to be separate business lines with internal support, enough resources, and the capacity to generate sufficient financial and social returns.
Recommendations The following are a series of recommendations for utility companies seeking to leverage their existing infrastructure to establish business models and enter the BOP market.
• Study the BOP market to understand who the clients are, what are their characteristics, and what products and services they need most.
• Offer products and services that improve the quality of life of the BOP, such as cost-saving household appliances.
• Partner first with one well-known service or product provider and start by offering a narrow set of products to test the demand side as well as to identify what internal changes need to be made to operate efficiently.
• Develop transparent and simple communication campaigns on how the program works both for potential clients and partnering organizations.
• Include loan charges in the utility bill and establish different mechanisms to split the bill for separate payments.
• Offer options for clients to request payment deadline extensions and alternative payment methods (e.g. refinancing plans) for when customers face challenges in making loan payments.
• Provide extensive training to program staff as well as partners’ staff to properly communicate about the program and its benefits.
• Harmonize the program’s and partners’ operation systems to ensure that the program can adequately register transactions and clients can easily use their financing.
• Avoid offering products and services that are not financially viable for the company or that can produce long-term adverse effects on clients (i.e. over-indebtedness).
Potential for Serving the BOP in Asia There are many opportunities for utility companies in Asia to enter the BOP market. As explained earlier, BOP individuals in this region represent a sizable market that faces important barriers to access financing. As in most countries, utility companies in Asia already have extensive distribution networks and billing systems in place, along with historical data on customer utility payment behavior, all which enable these companies to successfully enter untapped markets.

IDB Research Utility Models for the BOP | Page
11620WilshireBlvd,Suite610 www.manausconsulting.com p:+1(213)599.7442LosAngeles,CA90025 [email protected]
29
Some utility companies in the region have already recognized the purchasing power of low-income populations and have started to finance core business products and services. For instance, Manila Water, a private concessionaire of the city’s Metropolitan Water and Sewage Systems, created in 1998 the Water for the Community program (Tubig Para Sa Barangay, TPSB). Recognizing the difficulties that low-income communities face when connecting to a reliable water source, TPSB aimed to reduce the barriers to water provision by easing land title requirements and introducing flexible financing options. The TPSB program has delivered improved water services to over 1.7 million low-income individuals and resulted in other important benefits for the BOP, such as improved health and sanitation due to a decrease in waterborne diseases.108 This program can be leveraged to finance non-core products and services to meet additional basic needs.
Other utility companies in Asia have started to offer a number of non-credit financial products to low-income customers. For instance, India’s postal network, the largest in the world with over 155,000 offices mostly (90%) located in rural areas, has a long history of offering financial products in the form of savings, mutual funds, life insurance, and domestic and international remittances. In August 2015, the Reserve Bank of India issued a license for the postal network to operate a payments bank, which the India Post plans to launch in 2016 or 2017.109 This new banking division and the post’s existing infrastructure that reaches everyone, including the BOP, make this public entity a feasible provider of credit-based financing for low-income households.
Similar to the case of the India Post, the mobile money industry in Indonesia has leveraged the familiarity and accessibility of the BOP to mobile phones to provide non-credit financial products and services, such as saving accounts, money transfers, and digital payments, among others. Three mobile operators in Indonesia have successfully operationalized this model: Telkomsel with TCash in 2007; Indosat followed in 2008 with Dompetku; and XL joined in 2012 with XL Tunai.110 These companies followed the business model of M-PESA, run by Kenyan mobile phone operator Safaricom that later expanded from a mobile money-transfer system to provide mobile loans for the consumption of non-phone products (M-Shwari).111 These platforms open a range of opportunities for telecommunication companies to extend access to financing for non-core products to the BOP.
These efforts in the region show there is momentum to develop and expand business models that provide financing to BOP populations for the consumption of basic products and services while generating business returns.
108 Rivera, V. (2014). “Tap Secrets: The Manila Water Story.” 109 Clotteau, N. (2015). “Can India Post rise up to the digital payments and financial inclusion challenge?”110 Camner, G. (2014). “Implementing mobile money interoperability in Indonesia.” 111 The Economist. (2013). “Is it a phone, is it a bank?”

IDB Research Utility Models for the BOP | Page
11620WilshireBlvd,Suite610 www.manausconsulting.com p:+1(213)599.7442LosAngeles,CA90025 [email protected]
30
Conclusions Utility companies’ inherent characteristics that allow them to reach wide geographies to provide core products and services—such as extensive distribution networks, established billing systems, collections capabilities, regular contact with clients, and reliable knowledge of customers’ repayment behavior—uniquely position these entities to offer alternative products and services that meet important social needs. The experience of Promigas, Codensa, and EPM in Colombia showcases the viability of lending to the BOP through a win-win business model that creates benefits for the utility company, customers, and partners. These programs not only solve a market failure—the lack of credit for a large segment of the population that has purchasing power—but also produce added social value by orienting BOP consumption toward products and services that increase the quality of life of these beneficiaries.
The learnings that the three Colombian utility companies have accumulated throughout the years can serve as valuable guidelines for companies seeking to replicate these business models. These learnings are particular relevant for Asian utility companies given that the BOP in this region is the largest in the world and that there are already Asian companies leveraging their infrastructure to bring non-traditional products and services to the BOP.

IDB Research Utility Models for the BOP | Page
11620WilshireBlvd,Suite610 www.manausconsulting.com p:+1(213)599.7442LosAngeles,CA90025 [email protected]
31
References Asian Development Bank Institute. (2014). “Financial Inclusion in Asia: Country Surveys.” Camner, G. (2014) “Snapshot: Implementing mobile money interoperability in Indonesia.” GSMA. Center for Financial Inclusion.(2011). “Opportunities and Obstacles to Financial Inclusion.” Clotteau, N. (2015). “Can India Post rise up to the digital payments and financial inclusion challenge?” Better Than Cash
Alliance. Costa, A. & Ehrbeck, T. (2015). “A Market-Building Approach to Financial Inclusion,” Innovations, MIT Press, Vol. 10, No.
1 – 2. Dabla-Norris, E. et al. (2015). “Financial Inclusion: Zooming in on Latin America,” IMF Working Paper. Econometría Consultores. (2013). “Evaluación de impacto del Programa BRILLA sobre la calidad de vida de sus
usuarios.” Economist Intelligence Unit. (2014). “Global Microscope 2014: The Enabling Environment for Financial Inclusion.” Fabella, R. (2011). “The Privatization of the Metropolitan Waterworks and Sewerage System: How and Why It Was Won”
from Built on Dreams, Grounded in Reality: Economic Policy Reform in the Philippines. The Asia Foundation. Gradl, C. & Knobloch, C. (2011). “Energize the BOP! Energy Business Model Generator for Low-Income Markets,”
Enterprise Solutions for Development. Hidayati, S. (2011). “Cash in and Cash Out Agents for Mobile Money in Indonesia,” Innovations, MIT Press, Vol. 6, No. 4. Inter-American Development Bank. (2012). “Empresas Públicas de Medellín and Opportunities for the Majority.” Inter-American Development Bank. (2015). “A Rising US$750 Billion Market:Unlocking Opportunities at the Base of the
Pyramid in Latin America and the Caribbean.” International Finance Corporation. (2014). “Inclusive Business Case Study: Promigas.” International Monetary Fund. (2015). “Colombia: Selected Issues Paper,” IMF Country Report No. 15/111. Karpowicz, I. (2014). “Financial Inclusion, Growth, and Inequality: A Model Application to Colombia,” IMF Working Paper. Lobo, I. et al. (2014). “Codensa: Easy Credit for All,” Social Enterprise Knowledge Network. Márquez, P. & Rufín, C. (2011). Private Utilities and Poverty Alleviation: Market Initiatives at the Base of the Pyramid. Mas, I. & Sullivan, N. (2011). “Mobile Money as an Information Utility That Touches Everyone: Refining the Vision for
Financial Inclusion,” Innovations, MIT Press, Vol. 6, No. 4. Mori, M. & Zimmer, T. (2014). “Mobilizing Banking for Indonesia’s Poor,” The Institute for Business in the Global Context,
The Fletcher School. Reddy, R. et al. (2013). “Financial Capabilities in Colombia: Results from a National Survey on Financial Behaviors,
Attitudes, and Knowledge,” The World Bank Group. Rivera, V. (2014). “Tap Secrets: The Manila Water Story,” a co-publication of the Asian Development Bank and Manila
Water Company. Rojas-Suarez, L. & Amado, M. (2014). “Understanding Latin America’s Financial Inclusion Gap,” Working Paper 367,
Center for Global Development. The Economist. (2013). “Is it a phone, is it a bank?” Retrieved from: http://www.economist.com/news/finance-and-
economics/21574520-safaricom-widens-its-banking-services-payments-savings-and-loans-it World Bank. (2015). “The Global Findex Database 2014: Measuring Financial Inclusion Around the World.” World Bank. (2015). “The Little Data Book on Financial Inclusion.” World Business Council for Sustainable Development. (2013). “Enabling financial inclusion in Colombia: Empresas
Públicas de Medellín.” World Resources Institute. (2007). “The Next 4 Billion: Market Size and Business Strategy at the Base of the Pyramid,” a
co-publication of the World Resources Institute and the International Finance Corporation.

IDB Research Utility Models for the BOP | Page
11620WilshireBlvd,Suite610 www.manausconsulting.com p:+1(213)599.7442LosAngeles,CA90025 [email protected]
32
Annexes Annex 1: List of Interviewees
No. Interviewee 1 Silvia Adie, Manager of non-bank financing and channels, Promigas 2 Eduardo Senior, Professional of non-bank financing and channels, Promigas 3 Julio Martin, Director, Promigas Foundation 4 Marina Silva, Research Coordinator, Promigas Foundation 5 Angela Pineros, Head of non-bank financing, Gases del Caribe 6 Lazaro, program beneficiary, Brilla 7 Peter Balsa, program beneficiary, Brilla 8 Rosa, program beneficiary, Brilla 9 Sergio del Gordo, program partner, Brilla
10 Fernando Alvarez, Manager, Crédito Fácil 11 Jahir Villarreal, Finance Manager, Crédito Fácil 12 Deyanira Ariza, Credit Placement Manager, Crédito Fácil 13 Giovanni Vera, Commercial Manager, Crédito Fácil 14 Yadira Sanabria, Customer Service Manager, Crédito Fácil 15 Sandra, program beneficiary, Crédito Fácil 16 Laura, program beneficiary, Crédito Fácil 17 Ana Victoria, program beneficiary, Crédito Fácil 18 Yomara, program beneficiary, Crédito Fácil 19 Leidy, program beneficiary, Crédito Fácil 20 Lina Gambas, Crédito Fácil partner, Alkosto 21 Luis Fernando Angel, Professional at the Loyalty Unit, EPM 22 Eliecer Contreras, Loyalty Unit Manager, EPM 23 Jaqueline Sanabria, Credit Portfolio Unit, EPM 24 Diego Hernan, Credit Portfolio Unit, EPM 25 Natalia Betancourt, Program Marketing, EPM 26 Henry Salgado, Technical Support, Loyalty Unit, EPM 27 Luis G. Toro, Credit Portfolio Unit, EPM 28 Adriana Valencia, EPM program partner, TeSuma 29 Julian Giraldo, EPM program partner 30 Jorge Castañeda, EPM program partner, Gas & Hogar 31 Catalina Colorado, EPM program partner, Haceb 32 Luz Marina Bedoya, EPM program partner, Gas Nueva Era 33 Piedad Roman, EPM program beneficiary 34 Oscar Panyagua, EPM program beneficiary 35 Seir Cardona, EPM program beneficiary 36 Isabel Pulgarin, EPM program beneficiary 37 Gloria Ruiz, EPM program beneficiary

IDB Research Utility Models for the BOP | Page
11620WilshireBlvd,Suite610 www.manausconsulting.com p:+1(213)599.7442LosAngeles,CA90025 [email protected]
33
Annex 2: Utility Credit Programs in Colombia112
Company Program Name City Start Date
Codensa Crédito Fácil Bogotá 2001
Electrificadora de Santander (ESSA) ESSA Bucaramanga 2005
Aguas de Manizales Compráctico Manizales 2005
EDATEL Cred1UNO Apartado, Turbo,
Carepa and Chigorodó
2005
EPSA Crédito Positivo Popayán 2005
EBSA EBSA es Hogar Tunja 2005
Central Hidroeléctrica de Caldas
Pagos por cuotas Caldas 2005
Promigas Brilla 13 departments 2007
EPM Financiación Social Medellín and other
municipalities in Antioquia
2008
Electrificadora del Meta EMSA Servicios Villavicencio 2008
112 Marquez & Rufín. (2011). “Private Utilities and Poverty Alleviation: Market Initiatives at the Base of the Pyramid.”