Delaware Aviation System Plan Update 2019
259
-
Upload
khangminh22 -
Category
Documents
-
view
0 -
download
0
Transcript of Delaware Aviation System Plan Update 2019


Delaware State Aviation System Plan UpdateChapter 1 – Draft Interim Report August 2011
R.A. Wiedemann & Associates, Inc. 1 1
Chapter 1ISSUES, GOALS, AND OBJECTIVES
HE PREVIOUS DELAWARE STATE AVIATION SYSTEM PLAN Update was completed in 2007, withmuch of the activity data coming from 2005. Since that time the aviation industry inDelaware has undergone significant changes. In particular, the recession of 2007 2009,
soaring avgas and jet fuel prices, the scarcity of funding for operations and capitalimprovements, and the increasing development of land near airports and throughout the Statefor residential housing. Of significant concern in this study effort is the economic sustainabilityof the aviation system over the long term. This study will focus on strategies that are aimed atproviding revenue enhancement, cost reductions, and managerial efficiencies. The DelawareState Aviation System Plan Update (SASPU) affords all interested parties in the State anopportunity to discuss these and other aviation challenges and to constructively plan for thefuture of aviation.
The Delaware Department of Transportation, Office of Aeronautics has initiated a two phaseaviation system planning program. This planning effort will be reviewed for content by DelDOTand the Delaware Aviation Advisory Council. Phase I of the program will quantify the existingand forecast aviation needs for the State, compare the future facility needs to the existingcapacity and identify bottlenecks and potential problem areas. Phase II will translate thoseneeds into potential solutions, facilities, services, and financial support for a twenty yearplanning timeframe. This planning effort will incorporate current planning studies beingconducted at Sussex County Airport, Delaware Airpark, and New Castle Airport, along with theresults of an assessment of the impacts of green technologies and energy savings for airportsin the State.
It is anticipated that all nine public use airports, one public use heliport, and the Civil AirTerminal will be included in the SASPU. The study is anticipated to take between eighteen andtwenty four months to complete. This document is the first chapter prepared for inclusion inthe Phase I report. Organization of the remainder of this chapter is as follows:
State Aviation IssuesState Aviation Goals & ObjectivesSummary
The listing and discussion of these topics does not imply that a final listing of State aviationgoals, objectives, and issues has been determined. Rather, these lists can be expanded orcontracted throughout the study process as new information becomes available or as a resultof Delaware Aviation Advisory Council review.

Delaware State Aviation System Plan UpdateChapter 1 – Draft Interim Report August 2011
R.A. Wiedemann & Associates, Inc. 1 2
1. STATE AVIATION ISSUES
EFORE THE INCEPTION OF THE DELAWARE STATE Aviation System Plan Update, a number ofissues relating to aviation were known to exist in the State. Some of these issues canreadily be resolved in the system planning process. Others are outside the scope of the
system planning process and may not be resolved in the context of this study. However, thisstudy can be used to bring awareness of the needs and effects of those issues upon the State'saviation system. An initial list of issues identified for study (in no particular order) include thefollowing:
Future Airport Funding ShortfallsFAA, State, LocalNeed for Strategic Plan of Economic Sustainability
Civil Air Terminal DevelopmentAir CargoSchedule Airline Service
Airport Security ProgramsDelaware Airpark ExpansionSummit Airport ExpansionMitigation or Removal of Airport Airspace ObstructionsEconomic Impacts of Aviation in Delaware
Airport Community Value Applied to Recommended PlanRecommendations Prioritized by Economic Sustainability
Protection/Development of Non NPIAS AirportsAirport/Community Land Use CompatibilityCoordination of SASPU with Other Transportation Planning & the PublicFuture of Military Aviation in DelawareReliable Airport Operations CountsGreen Technology Impacts
1.1 Future Airport Funding Shortfalls
A significant issue at all Delaware Airports involves the prospect of future funding shortfalls forboth operations and capital development. In this regard, the lack of the permanent fundingprogram for FAA has created some uncertainty as to the level of future funding and the needfor local matching funds. FAA has informed a number of airports that they do not have themoney to implement the larger planned projects that require discretionary funding. Thesefunding issues do not reside solely at the federal level. Both State and local funding shortfalls,caused by the decrease in tax revenues during the recent recession, have had an impact onspending at airports in Delaware. As such, there is a perceived need for a comprehensivestrategic plan of economic sustainability for airports in the State.

Delaware State Aviation System Plan UpdateChapter 1 – Draft Interim Report August 2011
R.A. Wiedemann & Associates, Inc. 1 3
1.2 Civil Air Terminal Development
Opportunities to develop the Civil Air Terminal for air cargo and airline service have beenmissed in the past, as inquiries from both air cargo carriers and passenger airlines continue tobe made. The process of developing additional ramp for the CAT had progressed to the pointof agreement between DelDOT and Kent County, who is the owner of part of the propertyneeded for the ramp expansion. However, that development stalled early in 2011. Similarly,calls from Allegiant Airlines for possible start up service at the CAT have been met with localenthusiasm but no actual funding for needed improvements. Because the opportunities at theCAT represent potential economic development and job creation, there is some need to findways of funding the infrastructure required by the carriers requesting its use.
1.3 Airport Security Programs
Because of the proximity of Delaware to Washington, D.C. and other large population centers,potential aviation borne threats to the Capitol and other large cities are taken seriously. TheDepartment of Homeland Security has had significant interest in making general aviationairports more secure. Guidelines have been published by the Transportation SecurityAdministration for enhancing security at general aviation airports.1 At the State level, theconstant upgrading of security programs are working to reduce the probability of attack orlikelihood of terrorist success. The SASPU will incorporate previous statewide general aviationsecurity program work which included vulnerability assessments for each system airport.DelDOT, through its Transportation Management Center, monitors incidents, accidents,events, and potential threats at airports and on highways, coordinating responses throughappropriate emergency agencies.
1.4 Expansion of Delaware Airpark
The Delaware Airpark Master Plan recommended the expansion of the airport to incorporate areplacement runway that is longer and wider than the current one. The implementation ofthis plan was delayed by environmental work, funding shortfalls, and the purchase of neededproperty around the airport. In fact, the land cost exceeded estimates by a factor of morethan three, due to changes in the land’s proposed use from agricultural farmland to residentialhousing. However, it is anticipated that in 2013 the construction of the new runway will becompleted. This improvement to the airport should serve to attract more business aviationand based aircraft.
1 Security Guidelines for General Aviation Airports, Transportation Security Administration, InformationPublication A 001, May 2004.

Delaware State Aviation System Plan UpdateChapter 1 – Draft Interim Report August 2011
R.A. Wiedemann & Associates, Inc. 1 4
1.5 Expansion of Summit Airport
Summit Airport was sold to Greenwich AeroGroup in June of 2008. Since that time, Greenwichhas taken an aggressive market position, expanding the facilities and work force at SummitAirport. In 2011, new hangars, a paint facility, and roughly 12,000 square feet of office areawere under development. Summit has proposed to expand their runway length from theexisting 4,488 feet to about 5,300 feet. This increased length would permit Summit toaccommodate a number of business jet aircraft types that are currently unable to land at thefacility. In addition, Greenwich AeroGroup intends to grow the business at Summit whichcould mean hundreds of additional jobs at the airport.
1.6 Mitigation or Removal of Potential Airspace Obstructions
The Delaware Code has empowered the Department of Transportation to protect airports andtheir neighboring areas from potential hazardous operating conditions. This involves theremoval or mitigation of existing and potential airspace obstructions to air navigation. Inparticular, objects that penetrate imaginary approach surfaces to airports can be hazardous tolives and property. Alternatively, obstructions can decrease the capability of the airport byincreasing weather minimums. Existing regulations permit the removal of existingobstructions and empower the Office of Aeronautics with review and approval responsibilitiesfor new building permit applications near Delaware airports. Thus far, these obstructions havebeen identified and the cost of their removal has been estimated. The next step is to prioritizethe funding of their removal. The current weakness in the system is the lack of fundingneeded to remove existing obstructions at privately owned, public use airports.
1.7 Economic Impacts of Aviation
Accurate estimates of the economic impacts of aviation are significant to the assessment ofresource allocation by local and state decision makers. When municipal projects mustcompete for shrinking amounts of funding, comparative estimates of the return on capitalinvestment between projects can be important. Often the return is measured by the numberof jobs, income, and total output created by the undertaking. The current economic impactassessment for Delaware airports is five years old and lacks relevancy for the post 2009recession period. As such, there is a need to update these numbers and combine them withthe recent work on Airport Community Value. Other studies have demonstrated how AirportCommunity Value can be used to prioritize system plan recommendations to reflect economicsustainability. This is in contrast to the FAA’s priority rating system that prioritizes fundingbased on safety and security at eligible airports.

Delaware State Aviation System Plan UpdateChapter 1 – Draft Interim Report August 2011
R.A. Wiedemann & Associates, Inc. 1 5
1.8 Protection/Development of Private Airports and the CAT
Airports are a vanishing resource, not just in Delaware, but across the nation. NASA’s SmallAircraft Transportation System (SATS) research has pointed to the increased use of smallairports by a greater portion of the general public. Over 98 percent of the nation’s populationlives within 30 minutes of a small airport. This statistic holds true in Delaware. To make such asystem work, small airports and landing sites must be preserved until technology enables theirefficient use. While publicly owned airports in Delaware are not under threat of closure,numerous privately owned airports face financial pressures that favor more profitable uses ofthe land. For example, although Summit Airport is privately owned and included in the NPIAS,its sponsor has not accepted funding from FAA for ten years and as such, is not subject to grantassurances that require the airport to remain open as an airport. Recently, privately ownedairports such as Summit Airport and Chorman have invested heavily in their respectivefacilities. Since 2008, Greenwich AeroGroup has invested more than $12 million in SummitAirport. The owners of Chorman Airport have recently invested in the development of newhangars and taxiway access. The Civil Air Terminal, which is publicly owned, is not a NPIASairport and thus must rely upon local funding for development. Given that these airports donot enjoy federal funding, the system plan should examine creative ways of supporting theirprotection and development.
1.9 Airport/Community Land Use Compatibility
An issue that goes hand in hand with airport or heliport preservation involves compatible landuses of adjacent properties. In this regard, the land use controls, zoning, and existing land usesof areas surrounding public use airports and/or heliports will be noted in the inventory effort.Recommendations that could potentially impact surrounding land uses in a negative mannerwill be avoided if possible. Also, development plans for surrounding land which couldadversely affect airports and/or heliports will be addressed. The upshot of this issue may bethe recommendation of legislative actions that would protect both airports and theirsurrounding land uses from incompatible development or use.
1.10 Coordination of SASPU with Other Transportation Planning & thePublic
In order to have maximum effectiveness, the State Aviation System Plan Update should becoordinated with other transportation planning in the State and the general public. Recentemphasis upon intermodal transportation, the reduction in carbon footprints, and air/groundlinkages for economic development point to the need for a well defined and coordinated plan.In this regard, the SASPU provides a forum for the aviation community and general public to beincluded in the overall aviation transportation planning in the State. This process is needed inorder to better define priorities in funding, project development, and policy consensus. To

Delaware State Aviation System Plan UpdateChapter 1 – Draft Interim Report August 2011
R.A. Wiedemann & Associates, Inc. 1 6
address this important issue, goals and objectives of the SASPU are directed toward thecoordination of the plan with other ongoing transportation planning and the public. Inparticular, the work of the Delaware Valley Regional Planning Commission, Wilmington AreaPlanning Council, other State agencies in Delaware, and any other relevant sources will beincluded in the SASPU.
1.11 Geographic Information System for Delaware Airports
DelDOT has a significant investment in Geographic Information System (GIS) technology. Inthe past, those resources have not focused on aviation infrastructure in any great detail.Because the need for GIS is increasing in every planning discipline, the aviation system inDelaware should be fully incorporated into the State’s GIS. The SASPU will permit the State todevelop detailed GIS data for their use. Information including facilities, leases, utilities,property lines, easements, and any other relevant data can be included in the GIS database.Administration of the aviation system can be facilitated by the use of current data that isassembled in one place.
1.12 Future of Military Aviation in Delaware
Military aviation, both at New Castle Airport and Dover Air Force Base, is the single greatesteconomic impact of aviation in Delaware. Military aviation contributes over $500 million tothe State’s economy each year and supports thousands of military and civilian jobs.Preservation of the military mission in Delaware should be a top priority to State governmentalleaders and should be addressed in the SASPU. Coordination of military aviation planning withcivilian aviation planning could be enhanced through this process. For example, developmentor expansion of the Civil Air Terminal will rely on significant coordination with the military.
1.13 Reliable Airport Operations Counts
Reliable airport operations counts have been difficult to obtain at non towered airports inDelaware without some type of aircraft counting devices that could be used to sampleoperational activity. In the past, FAA 5010 forms have been used in estimating annual aircraftoperations. These numbers are actually estimates of airport managers and owners and haveshown wide variations in the aircraft utilization rates at individual airports. Accurateoperations counts are needed in developing forecasts, noise studies, compatible land useplans, and financial plans. Without accurate operations counts, the impacts of an airport maybe misrepresented to the local community. For several years, DelDOT’s Office of Aeronauticshas been collecting data through its noise activated counters. This program needs to be reenergized and more formalized in order to record any uptick in operational activity that maybe occurring since the economic recovery began in 2009. That program and methods for

Delaware State Aviation System Plan UpdateChapter 1 – Draft Interim Report August 2011
R.A. Wiedemann & Associates, Inc. 1 7
accurately estimating operational activity can be incorporated into the inventory database as apart of the SASPU.
1.14 Green Technology and Energy Savings
In keeping with the economic sustainability strategy for Delaware airports, advances in greentechnology and energy savings need to be applied to facilities and operational practices.Typically, there can be improvements at airports to reduce energy usage and utility costs byemploying green technology and conservation methods. Buildings’ visible envelope, heating,electrical lighting, and utility infrastructure systems are all subject to review for improvementssuch as new low energy lighting, building insulation, alternative energy generation includingwind and solar, and environmentally green methods of operating or developing the facility.These methods are becoming standard practices at airports and must be employed inDelaware. The SASPU can suggest ways to improve overall adaptation to green technologiesand utility cost reduction.

Delaware State Aviation System Plan UpdateChapter 1 – Draft Interim Report August 2011
R.A. Wiedemann & Associates, Inc. 1 8
2. STATE AVIATION GOALS & OBJECTIVES
NCE THE STUDY'S ISSUES HAVE BEEN IDENTIFIED, the goals and objectives for the state aviationsystem must be delineated. While the general approach and format of aviation systemplanning studies are well established, the ultimate success of the resulting plan
depends largely on the initial planning goals and objectives. If the plan is responsive to localand regional aviation goals and objectives, its effectiveness is greatly increased. The goalsselected for aviation express desired ends which relate in a technical, operational, economic,environmental, or social context to how the aviation system should develop and how it shouldbe operated. For the purposes of this study, goals are defined as conditions to be achieved.They are derived from values and can be stated, but the degree of their achievement may notbe definable. Objectives refer to specific, attainable, and measurable actions which lead to theattainment of goals. Study objectives were classified into categories that help define each ofthe goals.
The overall goal of the Delaware Department of Transportation, Office of Aeronautics withregard to aviation can be stated as follows:
To enhance Delaware's economic development by fostering and promoting asafe and efficient aviation system for the movement of goods, services, andpeople and to encourage and promote aviation and aviation safety. Objectivesthat support this goal include, but are not limited to the following:
To facilitate the timely development of airports that will meet the airtransportation needs and economic goals of the State.To ensure that a system of airports is developed that provides a high degreeof safety to the users, while at the same time provides adequate levels ofservice and facilities throughout the State.To maximize the economic benefits and sustainability of the aviationsystem.To minimize the airport system’s environmental impact.Participate in the process of determining the appropriate role for eachDelaware airport and in the provision of a portion of the financial assistancefor this development.Make available to the flying public current and accurate informationregarding Delaware's aviation system.
With these overall goals and objectives as a background, the more specific system plan studygoals and objectives can be created. The following goals and objectives represent an initial setof desired conditions to be achieved in the Delaware aviation system. They will be usedthroughout the study to shape policy, influence technical criteria and standards, and guide the

Delaware State Aviation System Plan UpdateChapter 1 – Draft Interim Report August 2011
R.A. Wiedemann & Associates, Inc. 1 9
day to day work efforts. In addition, these goals and objectives will provide the impetus andmeans to examine all of the issues identified previously.
2.1 Aviation System Goals & Objectives
Goals for the aviation system would provide for the development of facilities and services in amanner consistent with and complementary to local economic and social development. Assuch, an initial goal for the system plan update includes the following:
Goal:Develop a system of airports that meets acceptable physical developmentstandards issued by Federal, State, and local agencies, as well as aviationindustry development standards.
Objectives:To collect all relevant data necessary to develop a system of airports andfacilities that maximizes their use.To forecast aviation demand for the State's airports through the year 2030,adequately assessing airline, general aviation, cargo, military aviationoperations, and surface access needs.To monitor airport operations at non towered airports.To quantify existing capacity of airport airside and landside facilities for usein Phase II alternative development scenarios.To evaluate the role of privately owned or non NPIAS airports and makerecommendations regarding possible preservation or development of thesefacilities for the long term to satisfy operational demands and service areavoids.To evaluate the application of multi modal linkages to system airports.To develop a plan with enough flexibility to be implemented even whencertain recommendations cannot be executed.To adequately assess and plan for airport security for the State’s aviationsystem.To develop a GIS database for system airports.
2.2 Economic Sustainability and Development Goals and Objectives
Ideally, the aviation system would strive for economic sustainability for each of its componentairports. In addition, the airport system should support local and State economic goals andplans while providing flexibility to accommodate new opportunities and shifts in developmentpatterns. As such, economic sustainability goals and objectives include the following:

Delaware State Aviation System Plan UpdateChapter 1 – Draft Interim Report August 2011
R.A. Wiedemann & Associates, Inc. 1 10
Goal:Enhance economic sustainability of system airports through the fundingmethods, economic incentives, and strategic planning recommendations.
Objectives:Consider the economic and financial viability of the State’s aviation systemand plan for potential future shortfalls in capital funding sources.Assist in the funding of revenue producing infrastructure and otherinfrastructure related to retention of existing clients and economicdevelopment.Seek a developmental balance of publicly and privately owned airports inthe State, while maintaining the public's access to safe, adequate facilities.Disseminate information to airports on green technology improvementrecommendations.Maximize Federal financial participation in the development of the aviationsystem.Encourage financial self sufficiency for airports within the aviation systemby enacting policies favorable to aviation businesses and aircraft ownership.Incorporate Airport Community Value metrics into the priority ranking ofrecommendations resulting from the SASPU.Develop strategic airport business plans as a part of the statewide aviationsystem planning efforts.
2.3 Environmental Goals and Objectives
Ideally, airport development would occur in harmony with both the natural environment andhuman affected environment. As such, goals and objectives pertaining to the environment areas follows:
Goal:Develop a system of airports that conforms to environmental preceptscontained in the National Environmental Policy Act Implementing Instructionsfor Airport Projects (FAA Order 5050.4B).
Objectives:Minimize potential environmental impacts identified in FAA Order 5050.4Bwith special attention to minimizing residential dislocation, mitigating noiseimpacts, minimizing air and water pollution, protecting wildlife, andpreserving cultural resources.

Delaware State Aviation System Plan UpdateChapter 1 – Draft Interim Report August 2011
R.A. Wiedemann & Associates, Inc. 1 11
Develop future recommendations that are compatible with existing land useplans and desired land uses and that reduce objectionable effects ofaviation facilities on non compatible areas, to the extent possible.Plan for an energy efficient system of airports that provides ease of air andground access.Promulgate information concerning environmentally “green” methods ofundertaking infrastructure development projects.
2.4 Social Goals and Objectives
Appropriate social goals and objectives would provide facilities and services for all citizens in amanner that maximizes safety, efficiency, and opportunity for use. The primary goal then, is asfollows:
Goal:Respond to the needs and desires of aviation system users and those affectedby the aviation system.
Objectives:Plan for the orderly and timely development of the aviation system,maximizing services provided to the system users while minimizingcommunity disruption.Integrate airport and airport related developments with other localcommunity, county, and State development plans and policies along withthose proposed by individual airport sponsors and other agencies such asthe Wilmington Area Planning Council (WILMAPCO) and the Delaware ValleyRegional Planning Commission (DVRPC).Ensure the safety of each airport as well as the safety of the entireintegrated aviation system.Work toward the development of an aviation system that benefits themaximum number of air travelers and job holders, while conservingeconomic and natural resources to the greatest extent practical.
2.5 Internal Study Process Goals and Objectives
From the FAA’s standpoint, Advisory Circular 150/5070 7, The Airport System PlanningProcess describes the content and methods and with which airport systems should bedeveloped. As such, the overall goal of any airport system planning process is to ensure thatthe air transportation needs of a state or metropolitan area are adequately served by itssystem of airports, both now and in the future. Translated into the overall goal or purpose forDelaware’s system planning study:

Delaware State Aviation System Plan UpdateChapter 1 – Draft Interim Report August 2011
R.A. Wiedemann & Associates, Inc. 1 12
Goal:A primary purpose of this airport system plan is to study the performance andinteraction of the State’s aviation system to understand the interrelationship ofthe member airports.
Objectives:
To determine the type, extent, location, timing, and cost of the airportdevelopment needed in Delaware to establish a viable system of airports,both now and in the future.The system planning processes should result in products that can be used bythe airport sponsors, State, and FAA in determining these future airportdevelopment needs.
Study process goals and objectives provide for an open forum on all aspects of aviationplanning within Delaware. These goals and objectives include:
Goal:Coordinate the aviation planning process through the Delaware AviationAdvisory Council (DAAC) to develop an awareness of the aviation planningprocess.
Objectives:Coordinate the SASPU process through periodic meetings with the DAAC todiscuss interim findings and to integrate those with other transportationplanning initiatives and applicable economic development actions.Provide information to all groups, agencies, and organizations concernedwith aviation and the Delaware State Aviation System Plan Update.Ensure that Federal, State, and local officials have an opportunity toparticipate in the decision making process during the development andimplementation of the system plan.
It should be noted that the goals and objectives presented here represent an initial listing andare subject to additions and revisions as other input is obtained. The study process, therefore,will remain flexible and adaptable to the specific needs of the State of Delaware.

Delaware State Aviation System Plan UpdateChapter 1 – Draft Interim Report August 2011
R.A. Wiedemann & Associates, Inc. 1 13
4. SUMMARY
HE ISSUES IDENTIFIED EARLIER SERVE AS focus points for the aviation system planning process inDelaware. The issues mainly refer to specific problem areas that were identified early inthe study process. These issues must be dealt with in order to establish an effective
State Aviation System for Delaware.
Goals and objectives are the essential bridge between study issues (representing the needsand desires of the local aviation interests) and the technical standards and policies set for theSASPU. In addition, goals and objectives serve to describe the aviation needs and requirementsof the entire State. Without goals and objectives, the formulation of consistent policy anddirection is difficult, if not impossible.
In general, the system plan is programmed to answer the following primary set of questions:
How many public use airports and heliports are needed in Delaware?Where should they be located?What should be each airport's function and how will its service level bestrespond to local aviation demand?How much will it cost to develop the system of airports and aviation facilities?How should the SASPU recommendations be phased over the next 20 years toensure timely development of the aviation system?
Once these basic questions are answered, a corollary set of questions must then be addressed.These include:
How can the development of the system encourage economic sustainability forall of the component airports?Where will the funding required for development of the system be obtainedand who should sponsor the development?How will the recommendations of the system plan affect the environment?What development is needed at non NPIAS airports in Delaware and how willthat be accomplished over the long term?What are the impacts of the aviation system on the other transportationsystems within Delaware?How does the airport system affect the economy of Delaware?How should airport security be addressed by aviation stakeholders includingState and local units of government as well as airport tenants and businesses.What is the future of military aviation in Delaware and how is it integrated intolong range aviation system planning?

Delaware State Aviation System Plan UpdateChapter 1 – Draft Interim Report August 2011
R.A. Wiedemann & Associates, Inc. 1 14
Other decision making information will be made available to the DAAC and policy makers as aresult of the study. It is anticipated that answers to all of the questions will come from acombination of quantitative analyses and public input and participation in the development ofthe study.
It cannot be overemphasized that the success of the plan hinges upon aviation communityparticipation and acceptance of the entire process. The most highly sophisticatedmethodologies and quantitative techniques are of little value if the resulting recommendationsare never implemented. The opportunity to participate in this process is a major part of theState Aviation System Plan Update and should be used by interested parties in Delaware totheir advantage.


Delaware State Aviation System Plan UpdateChapter 2 – Draft Interim Report August 2011
R.A. Wiedemann & Associates, Inc. 2 1
Chapter 2Analysis of Existing System
HE STATE AVIATION SYSTEM PLAN UPDATE (SASPU) process for Delaware is being undertakenat a time of transition in the State's approach to transportation and the administrationof its transportation responsibilities. This document will amend the previous State
Aviation System Plan to reflect current thinking and update all relevant portions as needed.
The previous Delaware Aviation System Plan Inventory of Existing System was completed in2006 and featured a system of ten public use airports and one public use heliport. Thesefacilities included:
Chandelle EstatesChorman AirportCivil Air Terminal at Dover AFBDelaware Airpark (NPIAS)Jenkins AirportLaurel Airport
New Castle Airport (NPIAS)Smyrna AirportSummit Airport (NPIAS)Sussex County Airport (NPIAS)DelDOT Helistop
Only four of the State’s airports are included in the National Plan of Integrated Airport Systems(NPIAS) and thus they were the only facilities eligible for federal funding assistance. The SASPconcluded that the recommended system would rely primarily on this minimum system, withsupplemental demand accommodation from the other public use facilities. These otherpublic use airports, while important to the system, could not be relied upon to remain openthroughout the planning period. This includes the Civil Air Terminal at Dover AFB which wasclosed for six months to civilian flights immediately after 9/11/2001. The privately owned,public use airports are subject to ownership changes, financial failures, land developmentpressures, and taxation. Recognizing these factors, the SASP recommended that these facilitiesbe encouraged and supported to the extent possible by State policy and decision makers.However, the bulk of capital funding support was to be directed to the NPIAS airports. Toadequately address the analysis of existing system effort, this Chapter has been organized toinclude the following sections:
Purpose and NeedInventory of Existing Airport SystemAirport Activity LevelsAirspace Obstructions and NavaidsSurface Access SystemSocioeconomic BaseEnvironmental Considerations

Delaware State Aviation System Plan UpdateChapter 2 – Draft Interim Report August 2011
R.A. Wiedemann & Associates, Inc. 2 2
1. PURPOSE AND NEED
O UNDERSTAND THE PURPOSE AND NEED FOR a State Aviation System Plan, it is helpful toconsult the Federal Aviation Administration's (FAA's) Advisory Circular (AC) 150/5070 7,The Airport System Planning Process. That document summarizes the reasons for
conducting a SASP. As stated in the AC, the main purpose of the airport system planningprocess is to determine the type, extent, location, timing, and cost of the airport developmentneeded in a state or metropolitan area to establish a viable system of airports. DelDOT and theFAA should use the findings of the planning process to guide them in making informeddecisions regarding which local airport development proposals to consider for future reviewand support. The airport system planning process also clarifies Federal, state, and localsponsor objectives, and helps make development of airports part of a regional transportationsystem.
The product of the process is a cost effective plan of action to develop airports consistent withestablished goals and objectives. The process also results in the establishment of perspectiveson aviation priorities, such as airport roles, funding, policy strategies, and system trends inactivity level. The process ensures that aviation plans remain responsive to the overall airtransportation needs of the state or metropolitan area, while identifying the roles andcharacteristics of existing and recommended new airports, and describing the overalldevelopment required at each, including timeframes and estimated project costs. Moredetailed design, and capital and environmental planning are accomplished under an individualairport’s master plan.
In the context of significant State activity, system planning can be used for a number ofpurposes including:
Development of goals and objectives pertaining to airport development,economic development, transportation infrastructure, land use, andenvironmental factors.Development of aviation oriented objectives involving safety, efficiency, level ofservice, and economic self sufficiency.Provision of realistic resource requirements for State budgetary consideration.Provision of policy and technical direction for master planning efforts at localairports.Provision of a forum for public coordination and information concerningaviation policy and pertinent aviation issues.Development of recommendations for airport inclusion in the FAA's NationalPlan of Integrated Airport Systems (NPIAS).Development of special studies, in various degrees of detail, concerning safety,environmental, funding, or airport development issues.

Delaware State Aviation System Plan UpdateChapter 2 – Draft Interim Report August 2011
R.A. Wiedemann & Associates, Inc. 2 3
As directed by the AC, this airport system planning process will result in products that can beused by the planning organization or individual airport owner or the FAA in determining futureairport development needs. In this regard, DelDOT has initiated this process committed to thegoal of developing useable end products that will result in implementation of an aviationsystem that effectively meets user and community needs. The process will focus on thedevelopment of a thoughtful, well coordinated, and practical plan, including projectscheduling, as well as on the interagency and public coordination needed to successfully putthe plan into effect. Ultimately, the SASPU will outline the organizational structure, authority,and responsibility for implementation and will provide a realistic assessment of needs andresources. The plan will also provide guidance and input for the preparation of airport masterplans and airport capital improvement plans and serve as an important contribution to theNational Plan of Integrated Airport Systems.

Delaware State Aviation System Plan UpdateChapter 2 – Draft Interim Report August 2011
R.A. Wiedemann & Associates, Inc. 2 4
2. INVENTORY OF EXISTING AIRPORT SYSTEM
HE FIRST STEP IN DEVELOPING A DATABASE for use in subsequent phases of the study was toanalyze the existing aviation system in Delaware. Pertinent data, regarding eachairport/heliport and the area it serves was collected or updated from the facilities
themselves and appropriate State and local agencies. In addition to the data provided bythese sources, Office of Aeronautics staff have collected, tabulated, and reviewed datapublished by the Federal government and other sources required for comprehensiveunderstanding of the existing aviation system. Maximum use was made of the previoussystem planning work, various existing airport master plans, and environmental studies thathave been completed or that are in process. From these data, the analysis of the existingsystem was completed.
2.1 Airport and Heliport Facilities
Figure 2 1 presents a map of Delaware showing the locations of each of the existing public useairports and heliports. The facility inventory records of DelDOT (which are used for the FAAForm 5010), were used as one source of inventory data for airport and heliport facilities.Additional data and information was obtained through review of existing completed airportmaster plans, and those that are in progress. In addition to the data from published records,on site inspections of some of the system airports were necessary to inspect runway andtaxiway pavement conditions. The inventory effort collected information concerningobstruction data and existing navaids; aircraft operations by type; general condition and typeof runways, taxiways, and aprons; size and condition of terminal buildings, and parkingfacilities. Special attention was given to the physical limitations of each airport for expansion.
Data from the published records, airport master plans, and the on site inspections providedinformation for each airport including but not limited to:
Present classificationLand area owned or available at the airportAn inventory of facilities at each airport, such as runways and taxiways, terminalbuildings, hangar buildings, and airport lighting systems, aircraft apron, autoparking, cargo facilities, and fueling facilitiesAny limitations on future expansionPlanned improvementsPavement conditionsGround access to the airportNavigational aids, airspace conditionsExisting activity levels at system airports

Delaware State Aviation System Plan UpdateChapter 2 – Draft Interim Report August 2011
R.A. Wiedemann & Associates, Inc. 2 5

Delaware State Aviation System Plan UpdateChapter 2 – Draft Interim Report August 2011
R.A. Wiedemann & Associates, Inc. 2 6
As mentioned above, part of the output from the existing airport facility inventory involved thecreation of a computerized database that contains much of the inventory data. In addition tothe database, accurate counts of aircraft operations and based aircraft are in the process ofbeing surveyed as a part of the inventory process. For this survey, the State's aircraftoperations counting devices are being used by Office of Aeronautics staff to gather accurateoperational data.
Airport Classifications
Airport classifications are based on an Airport Reference Code (ARC). The ARC is used to relateairport design criteria to the operational and physical characteristics of the airplanes intendedto operate at the airport. The coding system has two components: the aircraft approachcategory, and the airplane design group. The first component is depicted by a letter (A, B, C, D,or E) and is related to the aircraft approach speed. The second component is depicted by aRoman numeral and is related to the airplane wingspan. The categories of each componentare described as follows:
Aircraft Approach Category is based upon 1.3 times an aircraft's stall speed intheir landing configuration at their maximum certificated landing weight:
A: Speed less than 91 knots.B: Speed 91 knots or more but less than 121 knots.C: Speed 121 knots or more but less than 141 knots.D: Speed 141 knots or more but less than 166 knots.E: Speed 166 knots or more
Airplane Design Group is based upon wingspan:I: Up to but not including 49 feet.II: 49 feet up to but not including 79 feet.III: 79 feet up to but not including 118 feet.IV: 118 feet up to but not including 171 feet.V: 171 feet up to but not including 214 feet.VI: 214 feet up to but not including 262 feet.
Under this system, short runway airports and turf airports are classified as A I and Less than AI, respectively. Other airports are classified, based upon their design characteristics and criticalaircraft type usage. In this regard, each of the State’s airports can be classified by ARC asfollows:
A I or Less:Chandelle Estates AirportJenkins AirportLaurel Airport

Delaware State Aviation System Plan UpdateChapter 2 – Draft Interim Report August 2011
R.A. Wiedemann & Associates, Inc. 2 7
Smyrna AirportB I, B II, or B III
Chorman AirportDelaware AirparkSummit AirportSussex County
C I or HigherNew Castle AirportCivil Air Terminal at Dover AFB
Description of Facilities
Since the previous aviation system plan, there have been no changes in the number of publicuse airports in Delaware. As such, there are currently 9 public use airports, one joint usemilitary air base, and one public use heliport in Delaware. In the following pages, Table 2 1presents graphic and tabular data that describe each of the existing public use airports. Theseairports make up the database of existing facilities from which the recommended aviationsystem will be developed.

Delaware State Aviation System Plan UpdateChapter 2 – Draft interim Report August 2011
R.A. Wiedemann & Associates, Inc. 2 8

Delaware State Aviation System Plan UpdateChapter 2 – Draft interim Report August 2011
R.A. Wiedemann & Associates, Inc. 2 9

Delaware State Aviation System Plan UpdateChapter 2 – Draft interim Report August 2011
R.A. Wiedemann & Associates, Inc. 2 10

Delaware State Aviation System Plan UpdateChapter 2 – Draft interim Report August 2011
R.A. Wiedemann & Associates, Inc. 2 11

Delaware State Aviation System Plan UpdateChapter 2 – Draft interim Report August 2011
R.A. Wiedemann & Associates, Inc. 2 12

Delaware State Aviation System Plan UpdateChapter 2 – Draft interim Report August 2011
R.A. Wiedemann & Associates, Inc. 2 13

Delaware State Aviation System Plan UpdateChapter 2 – Draft interim Report August 2011
R.A. Wiedemann & Associates, Inc. 2 14

Delaware State Aviation System Plan UpdateChapter 2 – Draft interim Report August 2011
R.A. Wiedemann & Associates, Inc. 2 15

Delaware State Aviation System Plan UpdateChapter 2 – Draft interim Report August 2011
R.A. Wiedemann & Associates, Inc. 2 16

Delaware State Aviation System Plan UpdateChapter 2 – Draft interim Report August 2011
R.A. Wiedemann & Associates, Inc. 2 17

Delaware State Aviation System Plan UpdateChapter 2 – Draft interim Report August 2011
R.A. Wiedemann & Associates, Inc. 2 18

Delaware State Aviation System Plan UpdateChapter 2 – Draft interim Report August 2011
R.A. Wiedemann & Associates, Inc. 2 19

Delaware State Aviation System Plan UpdateChapter 2 – Draft interim Report August 2011
R.A. Wiedemann & Associates, Inc. 2 20

Delaware State Aviation System Plan UpdateChapter 2 – Draft interim Report August 2011
R.A. Wiedemann & Associates, Inc. 2 21

Delaware State Aviation System Plan UpdateChapter 2 – Draft interim Report August 2011
R.A. Wiedemann & Associates, Inc. 2 22

Delaware State Aviation System Plan UpdateChapter 2 – Draft interim Report August 2011
R.A. Wiedemann & Associates, Inc. 2 23

Delaware State Aviation System Plan UpdateChapter 2 – Draft interim Report August 2011
R.A. Wiedemann & Associates, Inc. 2 24

Delaware State Aviation System Plan UpdateChapter 2 – Draft interim Report August 2011
R.A. Wiedemann & Associates, Inc. 2 25

Delaware State Aviation System Plan UpdateChapter 2 – Draft interim Report August 2011
R.A. Wiedemann & Associates, Inc. 2 26

Delaware State Aviation System Plan UpdateChapter 2 – Draft interim Report August 2011
R.A. Wiedemann & Associates, Inc. 2 27

Delaware State Aviation System Plan UpdateChapter 2 – Draft interim Report August 2011
R.A. Wiedemann & Associates, Inc. 2 28

Delaware State Aviation System Plan UpdateChapter 2 – Draft interim Report August 2011
R.A. Wiedemann & Associates, Inc. 2 29

Delaware State Aviation System Plan UpdateChapter 2 – Draft Interim Report August 2011
R.A. Wiedemann & Associates, Inc. 2 30
3. AIRPORT ACTIVITY LEVELS
HE PAST AND PRESENT AIR TRAFFIC VOLUMES at the existing public use airports in the Statewere reviewed to establish a basis for forecasting future aeronautical activity. Thecategories of air traffic activity collected and studied included:
General AviationRegistered aircraftBased aircraftFleet mixAircraft operations and peaking characteristics
MilitaryTotal aircraft operations at system airports
The primary source for aircraft activity information at the outset of the planning effort wasairport management records, Air Traffic Control Tower (ATCT) records, FAA Form 5010 data,and aircraft activity counts from the State's airport operations counting program. Historicalinformation used to develop the registered aircraft forecast was based on data compiled byprivate vendors (Avantext, Hi Tech Marketing) for the years 1997 2010.
Data regarding military aviation operations was collected from Dover AFB, New Castle Airport,and Sussex County Airport. Although the Civil Air Terminal is located at Dover Air Force Base,military operations at Dover AFB are not considered to be a part of the CAT's operations.Sussex County Airport and Summit Airport show only a small number of military operationseach year. Military activity in the State consists mostly of Dover traffic, with additionalweekend training and transport operations conducted by the Air National Guard. The level ofmilitary operations is determined by the Department of Defense policy and Congressionalfunding.
Table 2 2 presents a summary of aircraft activity for all categories. As shown, all generalaviation activity for 2010 totaled 129,773 operations. Military operations totaled 132,674, withDover AFB showing the major share of activity (125,000). The top three airports in the Statewith regard to based aircraft are: New Castle County (189), Sussex County (62), and DelawareAirpark (56).

Delaware State Aviation System Plan UpdateChapter 2 – Draft Interim Report August 2011
R.A. Wiedemann & Associates, Inc. 2 31
Table 2 2 – Airport Activity Summary
AIRPORTANNUAL OPERATIONS
BASED AIRCRAFTGeneral Aviation Military
Chandelle Estates 3,200 0 24Chorman 13,200 0 19Civil Air Terminal at Dover AFB 600 124,0001 0Delaware Airpark 22,650 0 56Jenkins Airport 1,400 0 20Laurel Airport 8,950 0 14New Castle Airport 69,970 8,870 189Smyrna Airport 2,300 0 10Summit Airport 41,400 100 43Sussex County Airport 33,900 100 62DELDOT Helistop 0 0GRAND TOTALS 197,570 133,070 4371 Dover Air Force Base Operations

Delaware State Aviation System Plan UpdateChapter 2 – Draft Interim Report August 2011
R.A. Wiedemann & Associates, Inc. 2 32
4. AIRSPACE OBSTRUCTIONS AND NAVAIDS
OR THIS SASPU, THE AIRSPACE INVENTORY FOCUSED on the obstructions and navaids associatedwith each airport. In the past, emphasis was given to airspace structure and en routefacilities which could not be impacted by airport sponsor actions. By turning the focus
onto the obstructions and instrument approaches, the SASPU can become more relevant toDelDOT and airport sponsors charged with improving air transportation operations at Delawareairports. As such, this section is organized to address the following topics:
Airspace ObstructionsInstrument Approaches and Navaids
4.1 Airspace Obstructions
Airspace obstructions are defined by FAR Part 77 – Objects Affecting Navigable Airspace. InDelaware, many of the public use airports have obstructions of varying severity. Some arelighted for visual reference and avoidance at night. In other cases, runway thresholds havebeen displaced to permit obstruction clearance in the approach slope of landing aircraft. Otherobstructions simply exist and must be avoided by pilots. To adequately address airspaceobstructions in this inventory, the FAR Part 77 definitions are presented, along with recentinformation on obstruction identification at Delaware airports.
FAR Part 77 Objects Affecting Navigable Airspace
Obstruction clearance requirements on and around the airport are contained in FederalAviation Regulation Part 77, Objects Affecting Navigable Airspace. Objects which penetratethese imaginary surfaces are considered obstructions and may require removal, lowering orlighting. These surfaces consist of five areas that vary in size and configuration based upon thefunction of the airport and the type of approach to that airport. The following discusses thelocation of these five areas:
Primary Surface: The primary surface is an imaginary surface longitudinally centeredon the runway. The primary surface extends 200 feet beyond each runway end. Theelevation of any point on the primary surface is the same as the elevation along thenearest associated point on the runway centerline.
Approach Surface: An approach surface is also established for each runway. Theapproach surface is the same width as the primary surface and begins at the primarysurface end. The approach surface will extend upward and outward from theprimary surface end and is centered along an extended runway centerline.

Delaware State Aviation System Plan UpdateChapter 2 – Draft Interim Report August 2011
R.A. Wiedemann & Associates, Inc. 2 33
Transitional Surface: Each runway has a transitional surface that begins at theoutside edge of the primary surface at the same elevation as the runway. Thetransitional surface also connects with the approach surfaces of each runway. Thesurface rises at a slope of 7:1, up to a height 150 feet above the highest runwayelevation. At that point, the transitional surface is replaced by the horizontalsurface.
Horizontal Surface: The horizontal surface is established at 150 feet above thehighest elevation of the runway surface. Having no slope, the horizontal surfaceconnects the transitional and approach surfaces to the conical surface at a distanceof 10,000 feet from the end of the primary surfaces of each runway.
Conical Surface: The conical surface begins at the outer edge of the horizontalsurface. The conical surface then continues for an additional 4,000 feet horizontallyat a slope of 20:1. Therefore, at 4,000 feet from the horizontal surface, the elevationof the conical surface is 350 feet above the highest airport elevation.
Figure 2 2 – FAR Part 77 Imaginary Surfaces

Delaware State Aviation System Plan UpdateChapter 2 – Draft Interim Report August 2011
R.A. Wiedemann & Associates, Inc. 2 34
Inventory of Obstructions
In the subsections that follow, a summary table of height obstructions is presented for eachpublic use airport in the State. Because the LiDAR data used in compiling these results is two orthree years old, some data may be outdated as of this printing. However, it represents themost comprehensive compilation of data on airport obstructions for public use airports in theState.
Chandelle Estates
Chandelle Estates Airport (0N6) has one paved runway 2,533 feet in length by 28 feet in width.There are significant displaced thresholds on both runway ends caused by trees. Runway End 4has a displaced threshold of 539 feet and Runway End 22 has a displaced threshold of 538 feet.The analysis of Chandelle Estates identified 11 main areas of obstructions located on 24.35acres surrounding the Airport. These obstructions penetrate three of the Airport’s surfaces:Primary, Approach, and Transitional. There are an additional 154 single obstructions identifiedat the Airport. A summary of the existing height obstructions identified using LIDAR and GISdata are presented in Table 2 3.
Table 2 3 Chandelle Estates Height ObstructionsID Type Max HAS Average
HASAcres Runway
OrientationFAR Part 77 Surface
2 Forested Area 75.23 32.46 4.98 22 Approach3 Forested Area 70.00 20.84 9.93 22 Transitional4 Cluster of Trees 6.64 8.90 0.63 22 Approach/Transitional5 Power Lines 42.12 2.95 1.85 22 Approach6 Forested Area 23.36 0.30 1.37 22 Primary7 Forested Area 55.36 24.28 1.35 4/22 Primary/Transitional8 Cluster of Trees 38.94 15.50 0.54 4/22 Primary/Transitional9 Forested Area 5.98 8.75 0.71 4 Transitional10 Trees & Buildings 5.19 5.54 1.97 4 Transitional49 Cluster of Trees 47.25 19.27 .68 22 Primary/Transitional50 Cluster of Trees 47.77 20.47 .34 22 Primary/Transitional
12 Obstructions 22 Primary4 Obstructions 22 Approach30 Obstructions 22 Transitional
25 Obstructions 4 22 Primary49 Obstructions 4 22 Transitional
10 Obstructions 4 Primary12 Obstructions 4 Approach12 Obstructions 4 Transitional
Legend – HAS = Height Above Part 77 Surface, FAR = Federal Aviation Regulations

Delaware State Aviation System Plan UpdateChapter 2 – Draft Interim Report August 2011
R.A. Wiedemann & Associates, Inc. 2 35
Figure 2 3 Chandelle Estates Obstruction Areas
Chorman Airport
Chorman Airport (D74) has one paved runway 3,588 feet by 37 feet. The runway does not havea displaced threshold. The analysis of Chorman Airport identified six main areas ofobstructions located on 19.88 acres of land. The existing height obstructions identified usingLIDAR and GIS data are presented in Table 2 4.
Table 2 4 Chorman Airport Height ObstructionsID Type Max HAS Average
HASAcres Runway
OrientationFAR Part 77 Surface
12 Forested Area 15.23 3.47 1.16 16/34 Transitional13 Forested Area 4.02 5.97 1.31 16 Transitional14 Forested Area 4.08 8.17 3.09 16 Approach11 Forested Area 27.04 1.10 5.15 34 Approach15 Forested Area 21.50 1.00 7.60 34 Transitional16 Forested Area 14.05 2.75 1.57 34 Transitional

Delaware State Aviation System Plan UpdateChapter 2 – Draft Interim Report August 2011
R.A. Wiedemann & Associates, Inc. 2 36
10 Obstructions 34 Approach9 Obstructions 34 Transitional1 Obstruction 16 Transitional
Figure 2 4 Chorman Obstruction Areas
Delaware Airpark
Delaware Airpark (33N) has one paved runway 3,582 feet by 60 feet. Runway End 27 has adisplaced threshold of 350 feet. The analysis of Delaware Airpark identified 12 main areas ofobstructions located on 69 acres of land. Forty four individual obstructions were alsoidentified through this process. The existing height obstructions identified using LIDAR and GISdata are presented in Table 2 5.
Table 2 5 Delaware Airpark Height Obstructions
ID Type Max HAS AverageHAS Area (acres) Runway
Orientation Part 77 Surface
51 Forested Area 27.49 0.92 6.64 9 Approach52 Forested Area 26.34 0.39 8.48 9 Transitional53 Forested Area 12.70 2.18 2.09 9 Transitional54 Line of Trees 40.08 14.78 1.27 9 Primary

Delaware State Aviation System Plan UpdateChapter 2 – Draft Interim Report August 2011
R.A. Wiedemann & Associates, Inc. 2 37
Table 2 5 Delaware Airpark Height Obstructions
ID Type Max HAS AverageHAS Area (acres) Runway
Orientation Part 77 Surface
55 Forested Area 33.96 6.70 1.74 9 Transitional56 Forested Area 66.99 14.76 5.15 9 27 Transitional57 Forested Area 32.47 4.60 1.53 9 27 Transitional58 Forested Area 82.31 31.08 2.02 9 27 Primary59 Forested Area 78.96 33.38 3.44 27 Primary60 Forested Area 69.69 12.22 26.40 27 Transitional61 Trees and Buildings 41.96 6.89 0.82 27 Transitional62 Forested Area 13.75 4.37 9.37 27 Approach
1 Obstruction 27 Primary16 Obstructions 27 Approach7 Obstructions 27 Transitional2 Obstructions 9 Transitional14 Obstructions 9 27 Primary4 Obstructions 9 27 Transitional
Figure 2 5 Delaware Airpark Obstruction Areas

Delaware State Aviation System Plan UpdateChapter 2 – Draft Interim Report August 2011
R.A. Wiedemann & Associates, Inc. 2 38
Jenkins Airport
Jenkins Airport (15N) has two turf runways. Runway 18 36 is 2,842 feet by 70 feet and Runway12 30 is a crosswind runway that is 2,035 feet by 70 feet. Runway End 36 has a displacedthreshold of 225 feet. The analysis of Jenkins Airport identified 16 main areas of obstructionslocated on 86.11 acres of land. Seventy one individual obstructions were also identifiedthrough this process. The existing height obstructions identified using LIDAR and GIS data arepresented in Table 2 6.
Table 2 6 – Jenkins Airport Height Obstructions
ID Type MaxHAS
AverageHAS Acres Runway
Orientation FAR Part 77 Surface
17 Forested Area 89.22 31.52 7.10 18 Approach18 Forested Area 97.63 12.59 9.90 18 Transitional19 Forested Area 63.12 15.32 6.49 18 Transitional20 Forested Area 99.30 39.13 3.79 12 and 18 Primary/approach 12;
Transitional 1821 Forested Area 102.37 44.65 0.56 18 Primary/Approach22 Forested Area 104.01 28.82 12.95 18 and 12 Approach/Transitional23 Forested Area 82.75 18.74 18.03 18 and 36 Transitional24 Forested Area 70.53 25.43 4.93 30 Primary/Approach/Transitional25 Cluster of Trees 50.87 25.85 0.39 30 Approach/Transitional26 Cluster of Trees 2.31 5.59 0.24 30 Approach27 Cluster of Trees 14.51 2.18 0.73 30 Primary/Transitional28 Trees and
Buildings17.16 3.39 2.36 18 and 30 Transitional
29 Trees andBuildings
61.96 14.00 3.01 30 and 36 Primary/Transitional
30 Aircraft Salvage 65.79 6.44 4.50 30 and 36 Primary/Transitional31 Forested Area 43.84 2.79 7.72 36 Transitional32 Trees and
Buildings66.83 22.10 3.41 36 and 30 Approach/Transitional
3 Obstructions 30 Approach8 Obstructions 30 Transitional5 Obstructions 36 Primary17 Obstructions 36 Approach36 Obstructions 36 Transitional1 Obstruction 18 Approach1 Obstruction 18 Transitional

Delaware State Aviation System Plan UpdateChapter 2 – Draft Interim Report August 2011
R.A. Wiedemann & Associates, Inc. 2 39
Figure 2 6 Jenkins Obstruction Areas
Laurel Airport
Laurel Airport (N06) has one turf runway that is 3,175 feet by 270 feet. Runway End 33 has adisplaced threshold of 270 feet. The analysis of Laurel Airport identified 5 main areas ofobstructions located on 28.53 acres of land. Twenty five individual obstructions were alsoidentified through this process. The existing height obstructions identified using LIDAR and GISdata are presented in Table 2 7.
Table 2 7 – Laurel Airport Height Obstructions
ID Type Max HAS AverageHAS Acres Runway
Orientation FAR Part 77 Surface
33 Forested Area 88.13 7.86 9.78 15 Approach34 Forested Area 54.29 12.88 9.11 15 Transitional35 Line of Trees 33.44 4.88 0.52 15 Transitional36 Forested Area 38.72 1.75 3.01 15 Transitional37 Forested Area 14.11 1.73 6.12 16 Approach/Transitional
2 Obstructions 15 Primary

Delaware State Aviation System Plan UpdateChapter 2 – Draft Interim Report August 2011
R.A. Wiedemann & Associates, Inc. 2 40
Table 2 7 – Laurel Airport Height Obstructions
ID Type Max HAS AverageHAS Acres Runway
Orientation FAR Part 77 Surface
1 Obstruction 15 Transitional1 Obstruction 33 Primary4 Obstructions 33 Approach17Obstructions
33 Transitional
Figure 2 7 Laurel Obstruction Areas
Smyrna Airport
Smyrna Airport (38N) has one turf runway that is 2,600 feet by 125 feet. The Airport issurrounded by open fields and wetlands. The analysis of Smyrna Airport identified one mainarea of obstructions located on 3.09 acres of land. Three individual obstructions were also

Delaware State Aviation System Plan UpdateChapter 2 – Draft Interim Report August 2011
R.A. Wiedemann & Associates, Inc. 2 41
identified through this process. The existing height obstructions identified using LIDAR and GISdata are presented in Table 2 8.
Table 2 8 – Smyrna Airport Height ObstructionsID Type Max HAS Average
HASAcres Runway
OrientationFAR Part 77 Surface
38 Future TreeGrowth
0.74 6.05 3.09 28 Approach
Tree 9.47 28 TransitionalTree 8.05 10 ApproachTree 6.68 10 Transitional
Figure 2 8 Smyrna Obstruction Area
Summit Airport
Summit Airport (EVY) has one paved runway that is 4,488 feet by 65 feet and one turf runwaythat is 3,601 feet by 200 feet. The Airport does not have any displaced thresholds. The analysisof Summit Airport identified 10 main areas of obstructions located on 64.64 acres of land.Forty three individual obstructions were also identified through this process.. The existingheight obstructions identified using LIDAR and GIS data are presented in Table 2 9.
Table 2 9 – Summit Airport Height Obstructions
ID Type Max HAS AverageHAS Acres Runway
Orientation FAR Part 77 Surface
39 Forested Area 43.18 7.21 13.17 17, 11/29 Transitional40 Forested Area 48.72 8.16 10.38 17, 11/29 Transitional41 Forested Area 66.71 11.37 5.39 11/29 Transitional42 Forested Area 52.98 11.23 13.29 35 Primary/Transitional

Delaware State Aviation System Plan UpdateChapter 2 – Draft Interim Report August 2011
R.A. Wiedemann & Associates, Inc. 2 42
Table 2 9 – Summit Airport Height Obstructions
ID Type Max HAS AverageHAS Acres Runway
Orientation FAR Part 77 Surface
43 Cluster of Trees 26.59 2.41 3.63 35 Approach/Transitional44 Cluster of Trees 25.86 0.32 4.18 35 Approach/Transitional45 Forested Area 49.53 6.05 6.76 11/29 Transitional46 Forested Area 0.45 23.74 5.29 17 Approach47 Cluster of Trees 5.13 4.85 0.36 17 Approach48 Forested Area 0.56 6.73 2.19 17 Approach/Transitional
2 Obstructions 11 Approach11Obstructions
11 Transitional
18Obstructions
17 Approach
3 Obstructions 17 Transitional5 Obstructions 17/35 Transitional4 Obstructions 35 Transitional
Figure 2 9 – Summit Airport Obstruction Areas

Delaware State Aviation System Plan UpdateChapter 2 – Draft Interim Report August 2011
R.A. Wiedemann & Associates, Inc. 2 43
Sussex County Airport
Sussex County Airport (GED) has two paved runways. Runway 4 22 is 5,000 feet by 100 feetand Runway 10 28 is 3,109 feet by 75 feet. The Airport does not have any displacedthresholds. The analysis of Sussex County Airport identified eight main areas of obstructionslocated on 61 acres of land. Ten individual obstructions were also identified through thisprocess. The existing height obstructions identified using LIDAR and GIS data are shown inTable 2 10.
Table 2 10 – Sussex County Airport Height Obstructions
ID Type Max HAS AverageHAS Acres Runway
Orientation FAR Part 77 Surface
71 Forested Area 61.98 24.85 2.85 28 Transitional72 Forested Area 39.63 0.45 29.70 4 Approach73 Forested Area 35.98 4.05 6.33 4 Transitional74 Forested Area 15.20 3.38 1.82 28 Transitional75 Forested Area 40.05 6.15 4.31 22 Approach/Transitional76 Forested Area 1.36 7.07 6.69 22 Approach77 Forested Area 26.94 2.36 4.52 22 Transitional78 Forested Area 18.02 3.08 4.98 22 Transitional
4 obstructions 4 Transitional3 obstructions 28 Transitional2 obstructions 22 Approach1 obstruction 4 22 Transitional
Figure 2 10 –Sussex County Airport Obstruction Areas

Delaware State Aviation System Plan UpdateChapter 2 – Draft Interim Report August 2011
R.A. Wiedemann & Associates, Inc. 2 44
New Castle Airport
New Castle Airport (ILG) has three paved runways. Runway 9 27 is 7,181 feet by 150 feet,Runway 1 19 is 7,002 feet by 200 feet and Runway 14 32 is 5,004 feet by 150 feet. The Airportdoes not have any displaced thresholds. The analysis New Castle Airport identified eight mainareas of obstructions located on 34.7 acres of land. One hundred and six individualobstructions were also identified as a part of this process. The existing height obstructionsidentified using LIDAR and GIS data are presented in Table 2 11.
Table 2 11 – New Castle Airport Height Obstructions
ID Type Max HAS AverageHAS Acres Runway
Orientation FAR Part 77 Surface
63 Forested Area 8.71 4.51 0.88 19 Approach/Transitional64 Forested Area 6.67 8.78 0.39 19 Approach65 Forested Area 4.97 8.20 0.52 19 Approach66 Forested Area 5.64 4.03 0.41 19 Approach/Transitional67 Forested Area 5.10 8.33 1.09 19 Transitional68 Forested Area 47.61 5.23 16.26 19, 9 27 Transitional69 Forested Area 17.42 2.45 14.34 9 Approach70 Forested Area 2.17 6.31 0.83 27 Approach/Transitional
6 Obstructions 1 Approach4 Obstruction 1 Transitional20 Obstruction 9 Approach9 Obstructions 9 Transitional1 Obstruction 14 Approach1 Obstruction 14 Transitional1 Obstruction 19 Approach3 Obstructions 19 Transitional53Obstructions
27 Approach
6 Obstructions 27 Transitional1 Obstruction 14 32 Transitional1 Obstruction 19, 27 Transitional

Delaware State Aviation System Plan UpdateChapter 2 – Draft Interim Report August 2011
R.A. Wiedemann & Associates, Inc. 2 45
Figure 2 11 – New Castle Airport Obstruction Areas
4.2 Instrument Approaches and Navaids
This inventory identifies each of the available types of Instrument Approaches and theirpossible application in Delaware. All existing electronic navigation aids including GlobalPositioning System (GPS) approaches, Instrument Landing Systems (ILS), localizers, very highfrequency omni directional range (VOR), and non directional radio beacons (NDB) at Delawareairports were listed. These instrument approaches are used to improve flight safety andprovide improved all weather capability for airports within the State.
Instrument Approaches
Airports in Delaware have three main types of approaches: visual, nonprecision and precision.A visual approach can be conducted in both instrument flight rules (IFR) and visual flight rules(VFR) conditions. This type of approach authorizes the pilot to proceed visually and clear ofclouds to the airport. The pilot must, at all times, have either the airport or the precedingaircraft in sight. This approach must be authorized and under the control of the appropriate air

Delaware State Aviation System Plan UpdateChapter 2 – Draft Interim Report August 2011
R.A. Wiedemann & Associates, Inc. 2 46
traffic control facility. Reported weather at the airport must be ceiling at or above 1,000 ft andvisibility of 3 miles or greater.
Two types of instrument approaches that contribute to all weather accessibility arenonprecision and precision. Non precision approaches provide only horizontal or lateralguidance, along with electronic information to aircraft during their approach and landingprocedures at an airport. These systems provide support to aircraft approaching an airportduring periods of poor visibility and inclement weather when visual approaches are notpossible. If these systems are ground based, they are typically less expensive to install andmaintain compared to a precision approach.
Precision approach systems utilize both horizontal and vertical guidance providing better than1 meter horizontal and 1 meter vertical accuracy. These systems allow aircraft to locate anairport and land on a specific runway during periods of poor visibility and/or inclementweather. Typically, the most demanding general aviation aircraft, such as corporate aircraft,prefer to operate at an airport with all weather instrument coverage. These systems reducetravel delays associated with airport closure due to poor visibility, which would result inrerouting aircraft and an increased ground travel time due to not being able to access thenearest airport to the final destination.
A precision approach procedure requires additional airport infrastructure including a paralleltaxiway, 4,200’ runway and improved lighting. The requirements for a nonprecision procedureare less stringent. It is important to note that procedures such as LNAV/VNAV and LPV arecategorized as nonprecision, whereas WAAS and LAAS procedures are currently identified asmeeting precision criteria.
Navaids
There are numerous types of precision and nonprecision instrument approaches available foruse in Delaware including RNAV (GPS), ILS, MLS, LOC, VOR, NDB, SDF, and radar approaches.Each approach has separate and individual design criteria, equipment requirements, andsystem capabilities. Table 2 12 presents a listing of navigational aids at Delaware airports.
Table 2 12 Navigational Aids at Delaware Airports
Airport RunwayOrientation
Runwaylength Navigational Aids Tower
ChandelleEstates
4 22 2,533’ X 28’ None No
Chorman 16 34 3,588’ X 37’ None No
Civil AirTerminal
14 321 19
12,903’ X 150’9,602’ X 200’
ILS – 01, 19; RNAV 01, 19, 32;VOR/DME 01, 32; TACAN – 01, 19,32
Yes (Military)

Delaware State Aviation System Plan UpdateChapter 2 – Draft Interim Report August 2011
R.A. Wiedemann & Associates, Inc. 2 47
Table 2 12 Navigational Aids at Delaware Airports
Airport RunwayOrientation
Runwaylength Navigational Aids Tower
DelawareAirpark
9 27 3,582’ X 60’ VOR – 27; RNAV (GPS) 09, 27 No
Jenkins 18 3612 30
2,842’ X 70’2,035’ X 70’
None No
Laurel 15 33 3,175’ X 270’ GPS A No
New Castle 9 271 1914 32
7,181’ X 150’7,002’ X 200’5,004’ X 150’
ILS or LOC 1; VOR or GPS 1,19;GPS 9,27; VOR 9,27
Yes
Smyrna 10 28 2,600’ X 125’ None No
Summit 17 3511 29
4,487’ X 65’3,600’ X 200’
RNAV (GPS) 17,35; NDB A No
Sussex County 4 2213 31
5,000’ X 150’2,330’ X 50’
VOR 4,22; RNAV (GPS) 4,22 No

Delaware State Aviation System Plan UpdateChapter 2 – Draft Interim Report August 2011
R.A. Wiedemann & Associates, Inc. 2 48
5. SURFACE TRANSPORTATION.
An inventory of the surface transportation network in Delaware provides the capability toexamine the interaction of the air and ground transportation systems in the State. The surfacetransportation system in Delaware is comprised of a network of roadways that provide groundconnectivity throughout the State.
Interstate 95 crosses Delaware southwest to northeast across New Castle County. In additionto I 95, there are seven principal highways: U.S. Highway 9, U.S. Highway 13, U.S. Highway 40,U.S. Highway 113, U.S. Highway 202, U.S. Route 301, and Delaware Route 1. U.S. 13, U.S. 113,and Delaware Route 1 are primary north south highways connecting Wilmington andPennsylvania with Maryland’s eastern shore, while U.S. 40, the primary east west route,connects Maryland with New Jersey. The state also operates two toll highways, the DelawareTurnpike, which is Interstate 95 between Maryland and New Castle and the Korean WarVeterans Memorial Highway, which is Delaware Route 1 between Dover and Interstate 95 nearWilmington.
For reference, Figure 2 12 shows transportation infrastructure and the different public transitmodes available in the State of Delaware. As shown, the availability of public passenger transit,by both bus and rail, is concentrated in northern New Castle County. Services and serviceinfrastructure in southern New Castle County and south through Kent and Sussex Countiesbecomes less concentrated and generally follows major north/south highway corridors.
5.1 Airport Specific Demand
On airport or at airport access in the state features highways of varying capacities and demandloadings. To support this influx of traffic, airports in the state of Delaware should haveadequate parking accommodations. For this reason, the main focus of this section will beTraffic Generated by Airports and the Current Parking Capacities of Airports.

Delaware State Aviation System Plan UpdateChapter 2 – Draft Interim Report August 2011
R.A. Wiedemann & Associates, Inc. 2 49

Delaware State Aviation System Plan UpdateChapter 2 – Draft Interim Report August 2011
R.A. Wiedemann & Associates, Inc. 2 50
Traffic Generated by Airports.
Existing traffic generated from airport operations are shown in Table 2 13. As shown, thenumber of peak hour vehicles generated by each public use airport varies by airport type andlocation. New Castle Airport has the highest demand, but there are more than four separateentrance ways to the Airport spreading peak hour demand.
Table 2 13 – GA Airport Activity SummaryAirport Name Access Road 2010 Peak Hour
Operations12010 Peak HourVehicle Trips2
Chandelle Estates Route 9 3 7Chorman Nine Foot Road 8 19
Civil Air Terminal Horsepond Road 24 56Delaware Airpark State Route 42 14 33
Jenkins Westville Road 2 5Laurel State Route 24 7 16
New Castle US 13, State Routes 273, 58, 202 70 165Smyrna State Route 6 2 5Summit US 301 25 59
Sussex County Airport Road, S Railroad Ave 21 491 Source: Inventory of aviation activity2 Vehicle trips estimated from general aviation industry averages of 2.35 times peak hour operations. Thisnumber accounts for pilots, passengers, and employees at the airport.
5.2 Public Transportation
The public transportation system, DART First State, has broad coverage within New CastleCounty with close association to major highways in Kent and Sussex Counties. The systemincludes bus, passenger rail, subsidized taxi and paratransit modes, the latter consisting of astate wide door to door bus service for the elderly and disabled. Passenger rail service, likeinterstate highway service, is limited to a single southwest to northeast corridor in New CastleCounty. Ferry service exists between Lewes, Delaware and Cape May, New Jersey, across themouth of the Delaware Bay.
Bus Service
DART First State provides local fixed route bus service throughout the state operating 68routes reaching most areas of Delaware. Bus and van services are available within each of theprimary service areas in Delaware. In this regard, intra city bus service is available inWilmington and Dover. DART First State operated by the Delaware Transit Corporationprovides transportation services statewide with over 400 buses and over 60 bus routes

Delaware State Aviation System Plan UpdateChapter 2 – Draft Interim Report August 2011
R.A. Wiedemann & Associates, Inc. 2 51
including its Sussex County Resort Service and paratransit service. Thus, regional bus service isavailable in southern Delaware and is not limited to a single city.
Another program of DART is RideShare Delaware, which is a commuter carpool assistanceprogram. The program matches commuters interested in carpooling using a database thatsynergizes home addresses and work schedules, and is open to anyone who lives and/or worksin Delaware, including individuals who commute from surrounding counties in Pennsylvania,New Jersey, and Maryland.
Passenger Rail Service
In terms of rail service, Delaware is served by freight railroad in all three counties, andpassenger rail that traverses east to west across northern New Castle County (see Figure 212). Delaware's only passenger rail service is in Wilmington, Claymont, and Newark. In thisregard, Wilmington is located on Amtrak's Northeast Rail corridor which connects Delaware toBaltimore, Philadelphia, New York, Washington and others. Wilmington's train station is theninth busiest station in Amtrak's Northeast region and is served by over 100 passenger trainsper weekday.
The Delaware Transit Corporation (DTC) contracts with the Southeastern PennsylvaniaTransportation Authority (SEPTA) to provide commuter rail service between Delaware andCenter City Philadelphia. This service provides connections to SEPTA's bus and train systemsincluding the Philadelphia International Airport, PATCO, and New Jersey Transit (NJT).

Delaware State Aviation System Plan UpdateChapter 2 – Draft Interim Report August 2011
R.A. Wiedemann & Associates, Inc. 2 52
6. SOCIOECONOMIC BASE
OCIOECONOMIC STATISTICS ARE GENERALLY USED TO DESCRIBE the economic and demographictrends expected to occur in a particular area. Socioeconomic factors have been shown innumerous studies sponsored by the FAA to be related to an area's demand for aviation
facilities and services. Among the most significant are population, income, and employment.This section identifies each of these factors and presents historical statistics and trends for theyears 2000 2010 for all three Delaware counties.
6.1 Recent Recession
The National Bureau of Economic Research pegged the start of the most recent recession toDecember 2007, lasting until July of 2009 making it the longest since the Great Depression.1
By definition, a recession is period of economic decline, typically measured by a decline inGross Domestic Product (GDP) for two consecutive quarters. The effects of this recession haveimpacted the State of Delaware, where tax revenues have declined, creating budget deficits atall levels of government for the first time in a number of years. In addition, the real estateboom that was pushing economic development in the housing market in central and southernDelaware has been dampened, resulting in higher unemployment, lower demand for durablegoods, and tourism and business slowdowns. There are, of course, exceptions to this rule. Butgenerally, aviation activity and demand has suffered along with the national economicdownturn.
To estimate the effects of the recession on general aviation activity, general aviationoperations were correlated to unemployment rates. General aviation incorporates all aviationactivity except scheduled passenger operations and military operations. For the U.S., thefollowing statistics were available for the 2007 2009 period:
U.S. GA Operations U.S. Unemployment Rate2007 80,747,523 4.6%2008 78,225,420 5.8%2009 74,556,114 9.3%
Correlation coefficient (R) between GA Operations and the Unemployment Rate equaled(negative) 0.986. Thus, for the nation, there is a highly correlated inverse relationshipbetween general aviation operations and the unemployment rate. It can be noted that a 4.7percent rise in unemployment occurred coincident with an 8.3 percent decline in total U.S.general aviation operations. Thus, for every 1.0 percent increase in unemployment, total U.S.general aviation operations declined by 1.77 percent.
1 Source: http://money.cnn.com/2008/12/01/news/economy/recession/index.htm.

Delaware State Aviation System Plan UpdateChapter 2 – Draft Interim Report August 2011
R.A. Wiedemann & Associates, Inc. 2 53
On a statewide basis, the relationships between employment and aviation activity indicatorswill be explored. Much of these statistical relationships will be incorporated into the forecastof aviation demand, presented in the following Chapter.
6.2 Population
Analysis and projection of population are the basis for almost all major planning decisions. Inmany instances, they determine the level of demand for future facilities and serve as indices ofmost county and urban characteristics. Further, they have typically served as one of the bestindicators of local aviation demand. Historical population, when compared to aviation demandstatistics, has shown a high correlation in many areas of the country. Until population growthor decline in the study area is compared to aviation demand statistics in Delaware, it isuncertain whether or not population can be used as a prediction variable in the forecastingprocess.
Table 2 14 presents the historical population growth for Delaware counties. As shown, KentCounty has a slightly higher percentage growth (25.9 percent) than Sussex County (25.1percent), while Sussex County shows the highest actual population growth (a net gain of39,556 over the period). For the State, there has been a 13.8 percent growth over the 20002010 period, growing from 786,411 to 895,173.
Table 2 14 – Delaware Historical Population Trends2
Year Kent New Castle Sussex State Total2000 127,109 501,913 157,389 786,4112001 128,821 505,564 160,235 794,6202002 131,301 509,113 163,717 804,1312003 134,222 512,919 167,764 814,9052004 138,382 516,887 171,370 826,6392005 143,294 520,918 175,694 839,9062006 148,041 524,473 180,508 853,0222007 152,090 527,786 185,020 864,8962008 155,492 531,057 189,662 876,2112009 157,741 534,634 192,747 885,1222010 160,058 538,170 196,945 895,173
% Change 25.9% 7.2% 25.1% 13.8%
2 Source: Regional Economic Information System, Bureau of Economic Analysis (BEA), U.S. Departmentof Commerce, May 2011. This source is the same used by the University of Delaware, Bureau ofEconomic Research.

Delaware State Aviation System Plan UpdateChapter 2 – Draft Interim Report August 2011
R.A. Wiedemann & Associates, Inc. 2 54
6.3 Income
Similar to population, an area's income and economic activity has been shown to be positivelyrelated to the demand for aviation services and facilities in many parts of the country. Further,there is an assumed causal relationship between concentrated economic activity and demandfor air transportation.
Income statistics commonly include Total Personal Income (TPI) and Per Capita PersonalIncome (PCPI). For aviation demand forecasting purposes, PCPI is the preferred statistic since itremoves the population growth factor from the income growth factor. Thus, PCPI statistics forDelaware counties were collected for the inventory. Table 2 15 presents the historical growthin PCPI for the three counties.
Table 2 15 – Study Area Historical PCPI3
Year Kent New Castle Sussex State Total2000 $23,952 $34,752 $24,763 $31,0072001 $25,126 $36,094 $26,563 $32,3942002 $26,155 $37,183 $26,534 $33,2142003 $26,665 $37,822 $27,643 $33,8892004 $27,898 $39,810 $29,666 $33,7132005 $28,741 $41,292 $31,013 $37,0012006 $29,521 $44,056 $32,535 $39,0962007 $30,743 $44,861 $34,319 $40,1232008 $31,279 $45,530 $34,652 $40,6462009 $31,127 $43,957 $34,434 $39,5972010 $32,195 $45,570 $35,872 $41,045
% Change 34.4% 31.1% 44.9% 32.4%
As shown in the table, per capita personal income in Delaware area has grown by 32 percentover the ten year period. This translates into a compound growth of 2.8 percent per year.Sussex County has shown the highest percentage growth (44.9 percent), with Kent and NewCastle showing strong growth rates over 30 percent.
6.4 Employment
Employment statistics are another measure of economic activity and thus are related to thedemand for air transportation facilities and services. Historical employment statistics forDelaware counties are presented in Table 2 16. As shown, overall employment for Delaware
3 Source: Regional Economic Information System, Bureau of Economic Analysis (BEA), U.S. Departmentof Commerce.

Delaware State Aviation System Plan UpdateChapter 2 – Draft Interim Report August 2011
R.A. Wiedemann & Associates, Inc. 2 55
grew by 7.8 percent over the period. Sussex County showed the fastest growth with 26.9percent, while New Castle County had the slowest growth with 1.5 percent. These statistics areconsistent with the population trends described earlier. Within the study period, there wasonly one year where statewide negative growth was observed. Due to the recent globaleconomic recession, the state of Delaware saw a decrease of employment of 3.6 percent, or19,746 jobs. This negative growth rate measures only slightly higher than the nationalemployment decrease (3.3 percent) for that time period. Even though overall employmentgrew by 7.8 percent for the entire study period, the 2010 figures show employment has notyet fully recovered to levels prior to the recession.
Table 2 16 – Delaware Historical Employment4
Year Kent New Castle Sussex State Total2000 71,849 349,291 82,427 503,5672001 73,704 344,210 82,353 500,2672002 75,820 340,283 85,119 501,2222003 77,553 341,571 86,754 505,8782004 80,521 347,860 91,131 519,5122005 83,895 351,811 94,505 530,2112006 85,267 357,047 98,085 540,3992007 87,297 361,378 100,353 549,0282008 87,069 362,059 100,414 549,5422009 84,490 347,119 98,187 529,7962010 83,677 354,397 104,662 542,736
% Change 16.5% 1.5% 26.9% 7.8%
4 Source: Regional Economic Information System, Bureau of Economic Analysis (BEA), U.S. Departmentof Commerce, May 2011.

Delaware State Aviation System Plan UpdateChapter 2 – Draft Interim Report August 2011
R.A. Wiedemann & Associates, Inc. 2 56
7. LAND USE & ENVIRONMENTAL FACTORS
This section summarizes the land use and environmental factors considered in the preparationof this plan. Areas of concern that affect airport development in Delaware include:
Land Use Impacting AviationEnvironmental Factors:
Aircraft Noise ImpactsWildlife Reservations and Waterfowl RefugesWetland Areas and FloodplainsPublic Parks and Recreation AreasHistoric and Cultural ResourcesPrime & Unique FarmlandAir QualityWater Quality
7.1 Land Use Impacting Aviation
Compatible land uses around airports follow a reasonable hierarchy of those land uses that aremore appropriate than others near an airport environment. Listed from most desirable toleast desirable, this hierarchy can be understood as:
1) Undeveloped Land: Any areas of land yet vacant or undeveloped due to lowlevels of socioeconomic activity, and/or significant constraints to such activitysuch as protected scenic and recreational areas, or natural physical constraintsthat have made economic activity cost prohibitive.
2) Rural/Agricultural Areas: Any areas that can be characterized as being sparselysettled with primary activities being related to agricultural use. Potentialairport related noise would have minimal impact on these areas. In addition,the rural nature of these areas poses little threat to life and property damage inthe event of an aircraft emergency or incident.
3) Industrial Areas: Industrial areas are those where some degree ofmanufacturing, warehousing, distribution, assembly, or production activityoccurs. Typically, industrial areas are characterized by private interests andenterprises that have organized for the purpose of making goods and/orservices for sale. Industrial areas are more capable of absorbing noise impactsthan other high density development. However, industrial areas are lessdesirable in the vicinity of airports than are agricultural areas due to the highernumbers of people that are attracted to these areas.

Delaware State Aviation System Plan UpdateChapter 2 – Draft Interim Report August 2011
R.A. Wiedemann & Associates, Inc. 2 57
4) Commercial/Retail Areas: Commercial and retail areas are those that can becharacterized as having office buildings and commerce parks, restaurants,franchise and specialty goods outlets and the like. These areas are impactedmore by airport related noise than the three previous categories listed abovedue mostly to the human activities that occur there. Commercial and retailareas represent nodes of economic activity for most cities, towns, and suburbs,that attract larger numbers of people.
5) Residential Areas: Residential areas are those characterized by thepredominance of single and multi family dwelling units located there, alongwith the wide variety of public and quasi public institutions that support theseareas. In addition to homes, residential uses include schools, churches,community centers, recreation/sports facilities, daycare centers, nursing andassisted living facilities, and other uses that are generally enjoyed as quality oflife enhancing amenities. Residential areas are the least compatible withairport related noise due to the fact that people live and sleep in thesebuildings. In addition, safety concerns for both property owners and airportusers should limit the amount of residential land use in the near airportapproach areas.
The inventory focused on these criteria as a benchmark for assessing each County’s zoningregulations on/around airports. The essential take away from the research became theanswer to a simple question: Does the regulation/code contain some measure of thesecriteria? The answers for each County are presented in Table 2 17.
Table 2 17 Performance of County Zoning againstBaseline Compatible Land Use Criteria
County DistinctAirportDistrict
CompatibleUses Defined
Airport UseDist. Reflects
Part 77
Airport UseDist. Reflects
DNL
DisclosureRequired
New Castle1 No Minimal Yes Yes YesKent2 Yes No No Yes YesSussex Yes No Yes No No
As shown in Table 2 17, each County appears to address airports and land uses surroundingairports in a different manner. New Castle County does not have a distinct airport zoningdistrict, however development around airports is addressed under Special Use regulations,
1 New Castle County Unified Development Code regulates airports as a Special Use, and references FARPart 77 and DNL contours in the Special Use section that addresses airports.
2 Kent County Code, Airport Environs Zoning Overlay.

Delaware State Aviation System Plan UpdateChapter 2 – Draft Interim Report August 2011
R.A. Wiedemann & Associates, Inc. 2 58
where airports themselves are regulated as a land use. Compliance to FAR Part 77 surfacesand current DNL contours are referenced in the New Castle County Unified DevelopmentCode. Kent County does have an Airport Environs Overlay District, but does not refer to FARPart 77 surfaces for height obstructions. Sussex County appears to have the mostcomprehensive set of land use controls, having adopted the Sussex County Airport HazardZoning Ordinance; however, no requirement for disclosure of airport locations or impacts wasfound in the ordinance. Additionally, the Sussex County Airport Hazard Zoning Ordinance onlyidentifies Sussex County Airport; no reference is made to Laurel Airport.
7.2 Environmental Factors
There are a number of environmental factors that affect aviation and the development orimprovement of airports. These factors include weather conditions and a host ofenvironmentally sensitive elements. As defined in this study, environmentally sensitive areasimpacted by aviation include all of the environmental factors described in FAA Order 5050.4B(there are 20 categories). Of these, the most significant impacts relative to aviation andairport development in Delaware would include:
Aircraft Noise ImpactsWildlife Reservations and Waterfowl RefugesWetland Areas and FloodplainsPublic Parks and Recreation AreasHistoric and Cultural ResourcesPrime & Unique FarmlandAir QualityWater Quality
Many of the impacts on these areas for the State's larger airports are covered inEnvironmental Assessments associated with recent master plans. Brief summaries of theseimpacts are contained in the following sections.
Aircraft Noise Impacts
Noise generated by aircraft can have a negative impact on the compatibility of land adjacent toairports. Typically churches, hospitals, schools, parks, amphitheaters, and residential districtsare considered to be noise sensitive receptors. Conversely, noise generated by airports isusually compatible with industrial and agricultural activities. It is important to note that at thesystem planning level of detail, noise studies for individual airports are beyond the work scope.These detailed studies are prepared for airport master plans and environmental assessmentsusing the latest version of the FAA’s Integrated Noise Model (INM). This computer modelcalculates cumulative aircraft noise, expressed in decibels (dB), at ground level using the yearlyaverage day night sound level (DNL).

Delaware State Aviation System Plan UpdateChapter 2 – Draft Interim Report August 2011
R.A. Wiedemann & Associates, Inc. 2 59
For this study, an approximate measure of potential aircraft noise impact can be gained byexamining land uses in the immediate vicinity of each system airport. These uses, combinedwith the activity levels at each airport will yield a ranking of potential impact from aircraftnoise. Such a ranking will be helpful in evaluating alternatives in Phase 2 of the system plan.While not as accurate as the INM, this qualitative measure of noise impact provides anintuitively reasonable means of assessing relative impacts among airports.
Wildlife Reservations and Waterfowl Refuges
Delaware has several wildlife reservations and waterfowl refuges located throughout theState. Those reservation and refuges closest to the system airports and their distance anddirection from the airports are listed in Table 2 18. Also shown are distances from the wildlifereservations and waterfowl refuges, none of which are adversely impacted by Delaware'spublic use airports.
Table 2 18 Delaware Wildlife Reservation/Waterfowl RefugesCounty/Airport Wildlife Area Approximate
Distance/DirectionKENTChandelle Estates Little Creek Wildlife Area 1 mile eastCivil Air Terminal Little Creek Wildlife Area 3 miles eastChorman Norman G. Wilder Wildlife Area 12 miles northDelaware Airpark Blackiston Wildlife Area 6 miles westJenkins Norman G. Wilder Wildlife Area 3 miles southwestSmyrna Woodland Beach Wildlife Area
Bombay Hook National Wildlife Area4 miles east southeast
NEW CASTLENew Castle Airport Killcohook National Wildlife Refuge (NJ) 4 miles southeastSummit Canal Wildlife Area/Lums Pond State Park 1 mile northSUSSEXLaurel Nanticoke Wildlife Area 4 miles west
Wetland Areas and Floodplains
In Delaware, wetlands are located in every county due to the State's low, flat topography.Wetlands are located on or near every public use airport. For this inventory, wetland mapsprovided by the U.S. Department of Interior, Fish and Wildlife Service were collected for eachairport facility. These maps will be used later as references for the analysis of alternatives todetermine whether any proposed airport expansion will impact nearby wetlands. It is knownthat wetlands currently impact plans for airport expansion or improvement at DelawareAirpark, Sussex County Airport, and at New Castle Airport.

Delaware State Aviation System Plan UpdateChapter 2 – Draft Interim Report August 2011
R.A. Wiedemann & Associates, Inc. 2 60
Floodplains in the vicinity of airports will be examined as a part of the SASPU. In this regard,Federal Emergency Management Agency (FEMA) and state mapping will be used to determinethe limits of the base 100 year floodplains and floodways near public use airports.
Public Parks and Recreation Areas
Delaware has fourteen state parks and recreation areas totaling 20,879 acres. These parksrange in size from 150 acres at Alapocas Run to 5,193 acres at Cape Henlopen. Activities atthese parks include boating, camping, fishing, game courts, swimming, picnicking, horsebackriding, and others. The fifteen state parks, by county of location, and acreage are as follows:
Kent CountyKillens Pond State Park 1,444
New Castle CountyAlapocas Run State Park 150Bellevue State Park 328Fox point State Park 171Brandywine Creek State Park 933Wilmington State Parks 387White Clay Creek State Park 3,384Fort Delaware State Park 288Fort Dupont State Park 332Lums Pond State Park 1,790
Sussex CountyCape Henlopen State Park 5,193Delaware Seashore State Park 2,825Fenwick Island State Park 344Holts Landing State Park 204Trap Pond State Park 3,106
GRAND TOTAL 20,879
An examination of the distance of airports in the system from these parks and recreationalareas indicated that none of the airports are located adjacent to any of the parks orrecreational areas. In Kent County, Jenkins Airport is the closest airport to Killens Pond StatePark at just under 9 miles. In New Castle County, Summit Airport is within 2 miles of LumsPond State Park. These proximities will be used during the evaluation of alternatives todetermine whether or not state parks and recreational areas could be negatively impacted bychanges or improvements to the State’s aviation system.

Delaware State Aviation System Plan UpdateChapter 2 – Draft Interim Report August 2011
R.A. Wiedemann & Associates, Inc. 2 61
In addition to parks and recreational areas, other attractions within Delaware draw largenumbers of people each year. For some of these events, visitors may use air transportation asa means of access:
Air Mobility Command Museum: The Air Mobility Command Museum is locatedat Dover AFB and was founded in 1986. It is dedicated to military airlift andtanker history. The base has long been associated with military airlift which isreflected in the museum's collection of vintage transport aircraft dating back toWWII. The museum has done numerous restoration projects and has planesand exhibits from the Berlin Airlift, the Korean War, and World War II.Delaware State Fair: The Delaware State Fair has an attendance of over300,000. The 300 acre fairgrounds are home to the annual ten day Fair in Julyand encompasses several businesses including The Centre Ice Rink, theHarrington Raceway and Casino.NASCAR: Dover International Speedway seats 135,000 people and hostsNASCAR races two weekends a year.Horse Racing: Delaware has three race tracks: Delaware Park, Dover DownsHarness Racing, and Harrington Raceway. Gaming legislation in Delaware in1996 allowed the state’s three racetracks to have video lottery machines.Dover Downs Hotel and Casino: Offers over 2,800 slot machines, table games,horse racing November through April and simulcast all year. The four diamondHotel has 500 luxury guest rooms, and live entertainment all year round.
Historic and Cultural Resources
An action causing an adverse effect on historic or cultural property protected by Section 106 ofthe National Historic Preservation Act or by provisions of the National EnvironmentalProtection Act (NEPA), must be considered in airport planning or policy making. Eligibilitydeterminations and effects determinations are solely FAA’s responsibilities under Section 106of the National Historic Preservation Act. In Delaware airport specific projects involvingfederal or state funding must be coordinated with the State Historic Preservation Office(SHPO) during the planning stages of any development. Often for these site specific studiesthere are requirements to perform archeological site analyses through literature searches, onsite inspections, and various levels of archeological excavation. In addition, architecturalstudies of historic structures must be made to determine their eligibility for inclusion on theNational Register of Historic Places. Impacts to these sites and structures must be evaluated inairport specific environmental studies funded by the FAA and State.
Prime And Unique Farmland
Delaware's fertile soils grow corn, truck crops, soybeans, and potatoes. These are foundthroughout the State, but are predominately evident in the southern two thirds of the State.

Delaware State Aviation System Plan UpdateChapter 2 – Draft Interim Report August 2011
R.A. Wiedemann & Associates, Inc. 2 62
The variety of crops grown evidences the existence of prime farmlands in the State. Thegrowing season is approximately six months long and extends from mid March to the end ofSeptember.
Under the Farmland Protection Policy Act (FPPA), the U.S. Department of Agriculture has theauthority to protect certain types of farmland from being converted to non agricultural uses.Farmland protected by the FPPA is either prime farmland which is not already committed tourban development or water storage, or unique farmland, or farmland which is of state or localimportance as determined by the appropriate state or local government agency with theconcurrence of the Secretary of Agriculture. Some actions are exempt from the FPPA andtherefore do not need to be coordinated with the U.S. Department of Agriculture (SoilConservation Service). Prime farmland is defined by the FPPA as land that has the bestcombination of physical and chemical characteristics for producing food, feed, fiber withoutintolerable soil erosion as determined by the Secretary of Agriculture. Prime farmland doesnot include land already in or committed to urban development or water storage. Uniquefarmland is land other than prime farmland that is used for production of specific high valuefood and fiber crops, as determined by the Secretary of Agriculture.
Air Quality
Air quality at airports can be affected by the number of aircraft operations, configuration ofvehicle access roads and parking, the physical plant, and the types and numbers of groundsupport equipment. Under the U.S. Environmental Protection Agency (USEPA) conformityregulations, a determination must be made as to whether the project related emission levelsexceed established threshold values. Threshold values are outlined in the FAA Air QualityHandbook. If threshold values are not exceeded, the project is assumed to conform to theState Implementation Plan (SIP) goal of eliminating or reducing the severity and number ofviolations of NAAQS and achieving attainment of those standards and no further analysis isnecessary.
The Clean Air Act of 1990 as amended states:
"No department, agency, or instrumentality of the Federal Government shall engage in,support in any way or provide financial assistance for, license or permit, or approve, anyactivity which does not conform to a [State Implementation Plan]."
Thus, in order to gain Federal funding for Delaware Airports, it must be determined whether ornot airport improvement projects conform to State or Federal air quality plans. Conformity isdefined in the Clean Air Act as conformity to the SIP's purpose of eliminating or reducing theseverity and number of violations of the national ambient air quality standards (NAAQS) andachieving expeditious attainment of such standards, and that such Federal activities will not:
Cause or contribute to any new violation of any standard in any area.

Delaware State Aviation System Plan UpdateChapter 2 – Draft Interim Report August 2011
R.A. Wiedemann & Associates, Inc. 2 63
Increase the frequency or severity of any existing violation of any standard inany area.Delay timely attainment of any standard or any required interim emissionreductions or other milestones in any area.
Water Quality
Water quality standards apply to certain types of airport development projects. Similar to airquality standards, the emphasis on enforcement deals with new development actions atairports that have received or are eligible for Federal funding. Construction impacts on waterquality deal with water supplies, waste treatment capacity, erosion controls to preventsiltation, provisions for containing fuel spills, and location with regard to an aquifer or sensitiveecological area such as a wetland.
Of significance is the Environmental Protection Agency's National Pollution DischargeElimination System (NPDES) permit application regulations for storm water discharges. Theregulations require operators of large municipal separate stormwater systems servingmunicipalities with populations greater than 250,000, and medium municipalities withpopulation greater than 100,000 but less than 250,000 to submit permit applications for theirseparate municipal storm sewer system. Covered by the regulations are transportationfacilities such as vehicle maintenance, equipment cleaning areas, and airport de icing areas.As nonpoint source polluters, airports have been required to file for an NPDES permit if theyare using their own separate stormwater system, or, if they are using a municipal stormwatersystem for surfacewater runoff, they are required to certify to the municipality that thesurfacewater runoff is in compliance with the municipality's NPDES permit requirements.
New airport development projects are subject to the NPDES regulations. In addition, thesystem plan has documented airports in Delaware that have complied with the regulations.These include:
Civil Air Terminal at Dover AFBDelaware AirparkNew Castle AirportSummit AirportSussex County Airport
Presently, no other Delaware airports are required to obtain NPDES permits.


Delaware State Aviation System Plan UpdateChapter 3 – Draft Interim Report August 2011
R.A. Wiedemann & Associates, Inc. 3 1
Chapter 3FORECAST OF AVIATION DEMAND
HE FORECAST OF AVIATION DEMAND FOR THE State of Delaware stands as a foundation forsubsequent recommendations of the State System Plan Update. In this regard, demandforecasts, are based upon the desires and needs of the service area, and provide a basis
for determining the type, size, and timing of aviation facility development. Forecasts must berealistic to provide adequate justification for the airport planning and development beingrecommended. A forecast that is either too high or too low can jeopardize a project byaffecting environmental and funding decisions. Therefore, it was important to quantify theaviation activity indicators that will be used in the development of facility recommendations,airport reference codes, noise analysis inputs, and financial priority rankings. This chapterdocuments the forecasting effort used to project aviation demand through the year 2030.Major sections of this chapter include:
Role of the FAA's Terminal Area ForecastsTechnical ApproachProjection MethodologyForecast of General Aviation DemandAviation Demand Forecast Summary
1. ROLE OF THE FAA'S TERMINAL AREA FORECASTS
HE TERMINAL AREA FORECAST SYSTEM (TAF) IS the official forecast of aviation activity at FAAfacilities. These forecasts are prepared annually to meet the budget and planning needsof FAA and provide information for use by state and local authorities, the aviation
industry, and the public. The TAF includes forecasts for active airports in the National Plan ofIntegrated Airport System (NPIAS). In all, there are currently 3,366 airports included in theforecasting database.
Guidance from the FAA indicates that independent forecasts such as those generated by theSASPU must conform to the TAF in order to be approved for FAA funded projects. Locallydeveloped forecasts for operations, based aircraft, and enplanements are consideredconsistent with the FAA’s Terminal Area Forecasts if the meet the following criteria:
All NPIAS Airports:The forecast must differ by less than 10 percent in the 5 year forecast periodand by 15 percent within the 10 year forecast period.Forecast activity levels do not affect the timing or scale of an airport project.

Delaware State Aviation System Plan UpdateChapter 3 – Draft Interim Report August 2011
R.A. Wiedemann & Associates, Inc. 3 2
Commercial Service Airports other than Large, Medium, and Small Hub facilities,and General Aviation and Reliever Airports:
The forecast activity levels do not affect the role of the airport as defined inthe NPIAS
General Aviation and Reliever Airports:Airports with under 100,000 annual operations or with less than 100 basedaircraft are exempt from the 10 and 15 percent conformance rules.
Only one Delaware airport is impacted by these guidelines (New Castle Airport), since all othershave or are forecast to have less than 100,000 annual operations within the forecast period.With this in mind, forecasts generated by this SASPU have been coordinated with the TAF andare consistent with the guidelines listed above.
2. TECHNICAL APPROACH
VIATION DEMAND FORECASTS PROCEED THROUGH TWO DISTINCT phases or processes: the analytical,followed by the judgmental. During the analytical process, past aviation activity dataare examined for trends in anticipation of future activity levels. Past trends in the
various demand elements are extended into the future using a variety of procedures andassumptions, and a series of projections are developed. After preparing a number of suchprojections, the analyst is able to identify a range of growth within which the true trend willprobably fall.
The second phase of demand forecasting requires experienced professional judgment. Theanalyst examines various growth projections for each demand element, studies the character ofthe airport and the community and how they will influence the particular element, then theanalyst makes a subjective determination of the preferred forecast.
3. PROJECTION METHODOLOGY
HE MOST RELIABLE WAY TO ESTIMATE AVIATION demand is to use more than one analyticaltechnique. The three methods considered in this forecast include regression analysis,market share analysis, and trend analysis.
3.1 Socioeconomic Regression Analysis
The socioeconomic regression projection is based upon an assumed causal relationshipbetween population, income, or employment and the aviation activity in a particular area. Thisprojection of demand is obtained by relating socioeconomic data via regression analysis toaviation activity. The resulting set of regression equations produces a projection of aviationactivity when they are coupled with independent projections of future socioeconomic data.

Delaware State Aviation System Plan UpdateChapter 3 – Draft Interim Report August 2011
R.A. Wiedemann & Associates, Inc. 3 3
This forecast utilized population, income (in the form of Per Capita Personal Income), andemployment statistics as the independent socioeconomic variables. These statistics wereobtained from the U.S. Department of Commerce, Bureau of Economic Analysis, andprojections of these variables (except for PCPI) were collected from the latest DelawarePopulation Consortium report.1 These projections are officially recognized by the DelawareState Planning Office and the U.S. Department of Housing and Urban Development.
3.2 Market Share Projection
Market share projections are developed by calculating historical shares of national or regionalactivity measures and projecting these respective shares into future time frames. This methodof projection reflects demand based upon trends occurring in the entire U.S. It is essentially a“top down” method of forecasting where other forecasts of activity for larger areas are used asdrivers of the local share of that demand. Socioeconomic projections, on the other hand, areconsidered “bottom up” methodologies and are based upon local factors. Market shareprojections reflect historical trends and may include increasing, constant, or decreasing futuremarket shares.
3.3 Trend Analysis
Trend projections use historical data to formulate predictions of future activity. For this study,two trend analysis methods were used to project baseline aviation activity: double exponentialsmoothing and least squares linear trending.
Double Exponential Smoothing
The double exponential smoothing process produces projections by combining the forecast forthe previous period with an adjustment for past errors. It is desirable to correct for past errorswhen the error has resulted from changes in the trend. In this case, correcting for past errorswill put the forecast back on track. The exponential smoothing process can be describedmathematically as follows:
Double exponential smoothing is appropriate when the time series contains a linear trend. Itacts by calculating two smoothed series a single and a double smoothed value. Both will lag
1 Delaware Population Consortium Annual Population Projections, October 28,2010, Version 2010.0

Delaware State Aviation System Plan UpdateChapter 3 – Draft Interim Report August 2011
R.A. Wiedemann & Associates, Inc. 3 4
behind any trend. However, the difference between them indicates the size of the trend. Thisdifference is used to adjust the forecast for the trend.
Time Series Least Squares
The second trend method incorporated is a least squares linear trend. This method usesaviation activity regressed against time to produce a projection. The R2 statistics are used togauge the significance of the trend. An R2 of 0 means there is no statistical relationshipbetween the passage of time and the trend of growth or decline of a forecast variable. R2
values near 1 indicate a significant relationship and trend. For this study, R2 values over 0.70were considered significant.
4. GENERAL AVIATION DEMAND FORECASTS
ENERAL AVIATION ACTIVITY IS DEFINED AS CIVIL aviation aircraft takeoffs and landings notclassified as commercial or military. Forecasts of aviation demand can be developed fora variety of activity indicators. With the lack of airline service in the State, all demand
for airports, airport facilities, and airport services stems from general aviation. Basic activityindicators include the type and number of aircraft operations, along with the number of aircraftbased at each airport in the system. Other important elements are derived from these basicindicators. These different elements include:
Registered Aircraft ForecastBased Aircraft Forecast
Based Aircraft Fleet MixGeneral Aviation Aircraft
Annual OperationsLocal Versus ItinerantFleet Mix ForecastPeak Period Operations (Monthly, Daily, Hourly)
General Aviation Enplaned Passengers
4.1 Registered Aircraft Forecast
A registered aircraft is defined as being either fixed or rotary wing, operated in non airlineservice with a current registration. Historical information used to develop the registeredaircraft forecast is based on data compiled by private vendors (Avantext, Hi Tech Marketing) forthe years 1997 2010. These sources provide aircraft information, by type for the state andcounty on an annual basis. Figure 1 presents a graphic illustration of the study area’s registeredaircraft growth trends since 2000. As shown, there has been an overall increase in the numberof registered aircraft reported in the study area with a small decline in 2010 from 2009.

Delaware State Aviation System Plan UpdateChapter 3 – Draft Interim Report August 2011
R.A. Wiedemann & Associates, Inc. 3 5
Registered aircraft forecasts were developed for the state of Delaware and were then allocatedto each of the three countiesbased upon market share. Itshould be noted that most ofthe registered aircraft inDelaware are not based in thestate. Corporations located inthe state register their aircraftin Delaware because of thetax sheltering benefits andmay base their aircraftelsewhere. In 2010, therewere 13,249 registeredaircraft in Delaware, with only437 of those aircraft based inthe state.
Table 3 1 presents a summary of the nine projections of registered aircraft demand forDelaware. Also presented are the regression R2 values for each projection. The ConstantMarket Share Projection of demand predicts the number of registered aircraft if Delawarekeeps pace with the anticipated national growth in registered aircraft. This projection yields atotal of 15,783 registered aircraft by the year 2030. The Dynamic Market Share Projection ofdemand examines historical market shares and develops a linear trend of these market sharesto generate the projection of 18,199 registered aircraft by the year 2030.
The Socioeconomic Regression Projections included population, employment, and incomestatistics from Delaware. These projections resulted from the regression analyses between eachindicator and registered aircraft in Delaware from 2001 through 2010. All three of theseprojections showed positive growth throughout the period.
The Trend Analysis Projection, similar to the Socioeconomic Regression Projections, examinedthe historical trend of registered aircraft growth using Linear Trend Analysis (least squares) andDouble Exponential Smoothing Analysis. Since the historical trend is upward, both the lineartrend projection and the exponential smoothing projection show an increase in registeredaircraft over the period.
Table 3 1 Projections of Study Area Registered AircraftProjection Type 2010 2015 2020 2030 R2
Market ShareConstant 13,249 13,543 14,054 15,783Dynamic 13,249 14,033 15,111 18,199
8,0009,000
10,00011,00012,00013,00014,000
Num
bero
fAirc
raft
Year
Registered Aircraft HistoryDelaware
Figure 3 1 – Registered Aircraft History

Delaware State Aviation System Plan UpdateChapter 3 – Draft Interim Report August 2011
R.A. Wiedemann & Associates, Inc. 3 6
Table 3 1 Projections of Study Area Registered AircraftProjection Type 2010 2015 2020 2030 R2
RegressionPopulation 13,249 14,619 15,734 17,688 0.975Employment 13,249 14,277 14,535 14,916 0.736PCPI 13,249 14,124 15,139 17,197 0.915
Trend AnalysisExp. Smoothing 13,249 14,738 16,127 18,904Linear Trend 13,249 15,024 16,580 19,692 0.978
Derived ProjectionsHigh/Low Average 13,249 14,283 15,317 17,304Multi Average 13,249 14,337 15,326 17,483
Selected Forecast 13,249 14,337 15,326 17,483
The Derived Projections are simply derivatives of the other existing projections. For example,the High/Low Average is the average of the highest and lowest viable projections. The MultipleAverage is the average of all viable projections. As shown, these Derived Projections producemid range estimates of demand. Both of these derived projections were above the constantmarket share projection, (meaning that Delaware is anticipated to grow ahead of the US trend).
The Selected Forecast considered each of the projections as a possible forecast for theregistered aircraft within Delaware. Since none could be ruled out on statistical grounds, theMulti Average projection was selected as the preferred registered aircraft forecast. Thisforecast represents the mid range or average of all of the projections. The forecast ofregistered aircraft shows a growth from 13,249 in the year 2010 to 17,483 by the year 2030 a32 percent growth over the period. Figure two shows the registered aircraft forecasts ingraphic form.

Delaware State Aviation System Plan UpdateChapter 3 – Draft Interim Report August 2011
R.A. Wiedemann & Associates, Inc. 3 7
4.2 Based Aircraft Forecast
By definition, a based aircraft is a general aviation aircraft that is stationed at an airport.Forecasting based aircraft at Delaware proceeded through the same process as all otherdemand elements: an analysis of historical data followed by forecasting into future years. Theonly difference is that unlike registered aircraft forecasts, which draw from an array ofpublished historical data sources, based aircraft forecasts are hindered by the lack of reliablehistorical data. For this study, existing and historical based aircraft information was taken fromthe FAA's Form 5010 1, supplemented by input from the FAA’s Terminal Area Forecasts, andairport manager reviews.
The forecast of registered aircraft was used as the "market" and the based aircraft at all publicuse airports in Delaware constituted the "share." Table 3 2 presents the forecasts of basedaircraft for all public use airports in Delaware. In addition to the forecasts made for individualairports, based aircraft totals for the State are also presented.
Table 3 2 Based Aircraft ForecastAirport 2010 2015 2020 2030Chandelle Estates 24 26 28 32Chorman 19 21 22 25Civil Air Terminal 0 0 0 0
9000
11000
13000
15000
17000
19000
21000
2000 2005 2010 2015 2020 2025 2030
Num
bero
fRegisteredAircraft
Year
Delaware Registered Aircraft Forecasts
1. Constant
2. Dynamic
3. Population
4. Employment
5. PCPI
6. Exp. Smoothing
7. Linear Trend
8. High/Low Average
9. Multi Average
Figure 3 2 – Delaware Registered Aircraft Forecasts

Delaware State Aviation System Plan UpdateChapter 3 – Draft Interim Report August 2011
R.A. Wiedemann & Associates, Inc. 3 8
Table 3 2 Based Aircraft ForecastAirport 2010 2015 2020 2030Delaware Airpark 56 61 65 74Jenkins 20 22 23 26Laurel 14 15 16 18New Castle 189 205 219 249Smyrna 10 11 12 13Summit 43 47 50 57Sussex County 62 67 72 82
Delaware Total 437 475 507 576
As shown, the numbers of based aircraft in the State are forecast to increase from 437 in thefirst period to 576 by the year 2030 a 31.8 percent growth over the period. This growth ishigher than the national average of 19 percent growth of active aircraft over the same period.
This is still considered reasonable due to the fact that in 2005 there were 506 based aircraft atthe public use airports in Delaware, a number that is forecasted to be reached in 2020.
Based Aircraft Fleet Mix
An aircraft fleet mix refers to the characteristics of a population of aircraft. General aviationaircraft are classified with regard to specific physical traits such as aircraft type (whether fixedwing or rotorcraft), their weight, and number and type of engines. Aircraft having dissimilarphysical and operating traits require varying types and amounts of airport facilities. For thisreason, it is important to estimate the type of aircraft that will be operating and based atDelaware airports.
In the forecasting process, the based aircraft fleet mix is used as one component to helpdetermine operational fleet mix forecasts. It is also used to determine the future designcategory each public use airport. Fleet mix categories included: single engine, multi engine,turbojet, rotorcraft, and "other." This information was available from the most recent FAAForm 5010 1, Airport Master Record.
Projection of the fleet mix involved the consideration of the effects of the national trends inaircraft manufacturing, and the service area registered aircraft fleet mix. Table 3 3 presents thenational forecasts of fleet mix from the most recent FAA forecast publication. Because the totalnumber of based aircraft in Delaware is expected to grow moderately over the forecast period,fleet mix changes will occur as a result of new aircraft being based at system airports. Table 3 4presents the forecast of based aircraft fleet mix anticipated for each public use airport inDelaware. As shown, the predominance of single engine aircraft will continue into the future,with gains in multi engine and turbo jet aircraft.

Delaware State Aviation System Plan UpdateChapter 3 – Draft Interim Report August 2011
R.A. Wiedemann & Associates, Inc. 3 9
Table 3 3 – U.S. Fleet Mix Forecast1
Year Single Engine Multi Engine Jet Rotorcraft Other Total2010 173,711 23,240 11,568 10,165 5,487 224,1722015 175,025 22,960 14,110 11,570 5,475 229,1402020 178,786 22,774 17,465 13,320 5,450 237,7952030 195,510 22,775 26,325 17,035 5,410 267,055
1 Source: FAA Aerospace Forecasts for Fiscal Years 2011 2031
Table 3 4 Forecast of Based Aircraft Fleet Mix by AirportAirport Name Single Engine Multi Engine Jet Rotor Other Total
Chandelle Estates2010 22 2 0 0 0 242015 24 2 0 0 0 262020 26 2 0 0 0 282030 30 2 0 0 0 32
Chorman2010 17 2 0 0 0 192015 19 2 0 0 0 212020 20 2 0 0 0 222030 22 3 0 0 0 25
Delaware Airpark2010 48 7 1 0 0 562015 50 9 2 0 0 612020 51 11 3 0 0 652030 55 12 5 2 0 74
Jenkins2010 18 1 0 0 1 202015 20 1 0 0 1 222020 21 1 0 0 1 232030 24 0 0 0 2 26
Laurel2010 13 1 0 0 0 142015 14 1 0 0 0 152020 15 1 0 0 0 162030 17 1 0 0 0 18
New Castle2010 91 21 53 4 20 1892015 100 23 56 6 20 2052020 106 25 60 8 20 219

Delaware State Aviation System Plan UpdateChapter 3 – Draft Interim Report August 2011
R.A. Wiedemann & Associates, Inc. 3 10
Table 3 4 Forecast of Based Aircraft Fleet Mix by AirportAirport Name Single Engine Multi Engine Jet Rotor Other Total
2030 119 32 70 8 20 249Smyrna
2010 8 0 0 0 2 102015 9 0 0 0 2 112020 10 0 0 0 2 122030 11 0 0 0 2 13
Summit2010 39 4 0 0 0 432015 41 5 0 1 0 472020 43 6 0 1 0 502030 48 8 0 1 0 57
Sussex County2010 44 9 2 6 1 622015 46 10 3 7 1 672020 47 12 4 8 1 722030 50 15 7 9 1 82
STATEWIDE TOTALS2010 300 47 56 10 24 4372015 323 53 61 14 24 4752020 339 60 67 17 24 5072030 376 73 82 20 25 576
4.3 General Aircraft Operations Forecast
An aircraft operation is defined as either a takeoff or a landing. A takeoff and landing areconsidered two operations. General aviation operations forecasts were prepared for eachpublic use airport in Delaware for a number of activity measures. In this regard, the followingoperational elements were forecast:
Total Annual OperationsLocal versus ItinerantFleet Mix Forecast
Peak Period Operations (Monthly, Daily, Hourly)
The general aviation annual operations forecast (Table 3 5) was derived for both local anditinerant operations through the use of an operations per based aircraft (OPBA) ratio. TheOPBA's are ratios of total general aviation operations at an airport divided by the correspondingnumber of based aircraft. These OPBA ratio's were further subdivided into local and itinerant

Delaware State Aviation System Plan UpdateChapter 3 – Draft Interim Report August 2011
R.A. Wiedemann & Associates, Inc. 3 11
OPBA ratios. By definition, local operations are performed by aircraft that operate within thelocal traffic pattern or within site of the airport. They can also be assigned to aircraft arriving ordeparting from local practice areas within 20 miles of the airport. In essence, local operationsare associated with pilot training. Itinerant operations, on the other hand, are all other aircraftoperations other than local operations. Table 3 5 presents the forecast of local and itinerantgeneral aviation operations for each Delaware public use airport.

DelawareStateAv
iatio
nSystem
Plan
Upda
teCh
apter3
–DraftInterim
Repo
rtAu
gust2011
R.A.
Wiedeman
n&Associa
tes,Inc.
312
Table35–Forecastof
Gene
ralA
viationOpe
ratio
ns
Airport
2010
2015
2020
2030
Local
Itine
rant
Total
Local
Itine
rant
Total
Local
Itine
rant
Total
Local
Itine
rant
Total
Chande
lleEstates
2,950
250
3,200
3,200
300
3,500
3,400
300
3,700
3,900
300
4,200
Chorman
1,300
11,900
13,200
1,500
13,100
14,600
1,500
13,800
15,300
1,700
15,600
17,300
CivilA
irTerm
inal
0600
600
0800
800
01,000
1,000
01,400
1,400
DelawareAirpark
18,550
4,100
22,650
20,200
4,400
24,600
21,600
4,700
26,300
24,500
5,400
29,900
Jenkins
850
550
1,400
900
600
1,500
1,000
600
1,600
1,100
700
1,800
Laurel
8,050
900
8,950
8,600
1,000
9,600
9,200
1,000
10,200
10,400
1,200
11,600
New
Castle
35,480
34,490
69,970
38,500
37,400
75,900
41,100
40,000
81,100
46,700
45,400
92,100
Smyrna
2,000
300
2,300
2,200
300
2,500
2,400
400
2,800
2,600
400
3,000
Summit
25,000
16,400
41,400
27,300
18,100
45,400
29,000
19,200
48,200
33,100
21,900
55,000
Sussex
Coun
ty26
,200
7,700
33,900
28,300
8,300
36,600
30,400
9,000
39,400
34,600
10,200
44,800
DelawareTo
tal
120,38
077
,190
197,57
013
0,70
084
,300
215,00
013
9,60
090
,000
229,60
015
8,60
010
2,50
026
1,10
0

Delaware State Aviation System Plan UpdateChapter 3 – Draft Interim Report August 2011
R.A. Wiedemann & Associates, Inc. 3 13
Operational Fleet Mix Forecast
The operational fleet mix forecast was derived directly from based aircraft fleet mix unlessother specific information concerning operational use was available. The process involvedmultiplying the operations per based aircraft (OPBA) utilization rate times the number ofaircraft in each category. Table 3 6 presents the forecast of operational fleet mix for eachpublic use airport in Delaware.
Table 3 6 – Forecast of Operational Fleet Mix
Airport SingleEngine
MultiEngine Jet Rotor Other Total
Chandelle Estates2010 2,933 267 0 0 0 3,2002015 3,231 269 0 0 0 3,5002020 3,436 264 0 0 0 3,7002030 3,938 263 0 0 0 4,200
Chorman2010 11,811 1,389 0 0 0 13,2002015 13,210 1,390 0 0 0 14,6002020 13,909 1,391 0 0 0 15,3002030 15,224 2,076 0 0 0 17,300
Civil Air Terminal2010 0 91 429 80 0 6002015 0 158 536 106 0 8002020 0 197 670 133 0 1,0002030 0 276 938 186 0 1,400
Delaware Airpark2010 19,414 2,831 404 0 0 22,6502015 20,164 3,630 807 0 0 24,6002020 20,635 4,451 1,214 0 0 26,3002030 22,223 4,849 2,020 808 0 29,900
Jenkins2010 1,260 70 0 0 70 1,4002015 1,364 68 0 0 68 1,5002020 1,461 70 0 0 70 1,6002030 1,662 0 0 0 138 1,800
Laurel2010 8,311 639 0 0 0 8,9502015 8,960 640 0 0 0 9,6002020 9,563 638 0 0 0 10,200

Delaware State Aviation System Plan UpdateChapter 3 – Draft Interim Report August 2011
R.A. Wiedemann & Associates, Inc. 3 14
Table 3 6 – Forecast of Operational Fleet Mix
Airport SingleEngine
MultiEngine Jet Rotor Other Total
2030 10,956 644 0 0 0 11,600New Castle
2010 37,676 8,694 21,943 1,656 0 69,9702015 41,027 9,436 22,975 2,462 0 75,9002020 43,199 10,188 24,452 3,260 0 81,1002030 47,860 12,870 28,153 3,217 0 92,100
Smyrna2010 1,840 0 0 0 460 2,3002015 2,045 0 0 0 455 2,5002020 2,333 0 0 0 467 2,8002030 2,538 0 0 0 462 3,000
Summit2010 37,549 3,851 0 0 0 41,4002015 39,604 4,830 0 966 0 45,4002020 41,452 5,784 0 964 0 48,2002030 46,316 7,719 0 965 0 55,000
Sussex County2010 24,372 4,921 780 3,281 547 33,9002015 25,597 5,463 1,170 3,824 546 36,6002020 26,348 6,567 1,560 4,378 547 39,4002030 28,411 8,195 2,730 4,917 546 44,800
STATEWIDE TOTALS2010 145,165 22,755 23,556 5,017 1,077 197,5702015 155,202 25,884 25,487 7,358 1,069 215,0002020 162,336 29,549 27,896 8,735 1,083 229,6002030 179,127 36,892 33,841 10,094 1,146 261,100
Peak Period Operations
Since many general aviation landside and airfield facility needs are related to the levels ofactivity during peak periods, forecasts were developed for peak month, design day, and peakhour general aviation operations at Delaware public use airports. Typically, non toweredgeneral aviation airports do not keep accurate records of peak period activity. Thus, anindustry accepted method of estimation was used to predict peak period activity that does notrequire a census of hourly operations totals. The approach used in developing the peak periodoperations forecasts is outlined as follows:

Delaware State Aviation System Plan UpdateChapter 3 – Draft Interim Report August 2011
R.A. Wiedemann & Associates, Inc. 3 15
Peak Month GA Operations: This level of activity is defined as the calendarmonth when peak aircraft operations occur. Peak Month percentages atDelaware Airports were estimated using the assumption that peak monthoperations are 10 percent greater than average month operations. The onlyexception to this rule was for New Castle Airport, where actual FAA Air TrafficControl Tower statistics were used to establish general aviation peak monthoperations.
Design Day Operations: This level of operations is defined as the average daywithin the peak month. This indicator can be developed by dividing peak monthoperations by 30 or 31. For conservative forecasting purposes, a 30 day monthwas selected rather than a 31 day month.
Peak Hour Operations: This level of operations is defined as the peak hourwithin the design day. For airports with between 50 and 300 design dayoperations, general aviation peak hour operations tend to be 20 percent ofthose design day operations. As the design day operations decrease, the peakhour percentage increases and vice versa.
Table 3 7 – Forecast of Peak OperationsAirport GA Operations Peak Month Design Day Peak Hour
Chandelle Estates2010 3,200 293 10 32015 3,500 321 11 32020 3,700 339 11 32030 4,200 385 13 4
Chorman2010 13,200 1,210 40 82015 14,600 1,338 45 92020 15,300 1,403 47 92030 17,300 1,586 53 11
Civil Air Terminal2010 600 300 120 242015 800 400 160 322020 1,000 500 200 402030 1,400 700 280 56
Delaware Airpark2010 22,650 2,076 69 142015 24,600 2,255 75 152020 26,300 2,411 80 162030 29,900 2,741 91 18

Delaware State Aviation System Plan UpdateChapter 3 – Draft Interim Report August 2011
R.A. Wiedemann & Associates, Inc. 3 16
Table 3 7 – Forecast of Peak OperationsAirport GA Operations Peak Month Design Day Peak Hour
Jenkins2010 1,400 128 4 22015 1,500 138 5 22020 1,600 147 5 22030 1,800 165 6 2
Laurel2010 8,950 820 27 72015 9,600 880 29 72020 10,200 935 31 82030 11,600 1,063 35 9
New Castle2010 69,970 7,375 414 702015 75,900 8,030 451 772020 81,100 8,580 482 822030 92,100 9,744 547 88
Smyrna2010 2,300 211 7 22015 2,500 229 8 22020 2,800 257 9 32030 3,000 275 9 3
Summit2010 41,400 3,795 127 252015 45,400 4,162 139 282020 48,200 4,418 147 292030 55,000 5,042 168 34
Sussex County2010 33,900 3,108 104 212015 36,600 3,355 112 222020 39,400 3,612 120 242030 44,800 4,107 137 27
4.4 General Aviation Enplanements
Forecasts of annual general aviation enplaned passengers play an important role indetermining such landside facilities as access roads, the general aviation terminal buildingsizes, and the amount of automobile parking areas. This activity indicator is often ignored dueto the lack of historical data.

Delaware State Aviation System Plan UpdateChapter 3 – Draft Interim Report August 2011
R.A. Wiedemann & Associates, Inc. 3 17
To forecast general aviation enplaned passengers, an aircraft occupancy rate was multiplied bythe number of itinerant general aviation departures from the Airport. In 2008, the AircraftOwners and Pilots Association (AOPA) estimated that an average of 2.5 passengers per generalaviation itinerant departure was a reasonable estimate of aircraft occupancy. For this study,this factor was applied to all forecast itinerant departures and 10 percent of local departures(except for the Civil Air Terminal which used a much higher ratio because of the high numberof passengers per aircraft using the facility during NASCAR races). Local departures areconsidered training operations and do not add to the landside facility use. Therefore, only afraction of those operations were counted as contributing passengers to the landside facilityuse.
Table 3 8 Forecast of Aviation EnplanementsAirport 2010 2015 2020 2030Chandelle Estates 700 800 800 900Chorman 15,000 16,600 17,400 19,700Civil Air Terminal 5,000 5,500 6,000 7,000Delaware Airpark 7,400 8,000 8,600 9,800Jenkins 800 900 900 1,000Laurel 2,100 2,300 2,400 2,800New Castle 47,500 51,600 55,100 62,600Smyrna 600 700 800 800Summit 23,600 26,000 27,600 31,500Sussex County 12,900 13,900 15,100 17,100
Delaware Total 115,600 126,300 134,700 153,200
It can be argued that this methodology ignores 90 percent of the local operations component,which is true. However, local operations are primarily training and are typically made up ofrepeated takeoffs and landings. Pilots in training do not add significantly to the passengerthrough put of the airport facilities and thus their total inclusion would unduly raise theprojected demand levels, which in turn, would suggest unnecessary facilities.
4.5 Military Forecasts
Military activity shows little or no correlation to community socioeconomic data or otherrecognized air traffic indicators. The level of military operations is a function of Department ofDefense Policy and Congressional funding. Therefore, it is difficult to accurately predict thelevel of activity for Delaware airports. Table 3 9 presents the existing and forecast militaryactivity for each Delaware public use airport with existing military operations. To develop aforecast, the most recent historical level of activity was simply held constant throughout theplanning period. In addition to the annual operations forecast, a projection of peak hour

Delaware State Aviation System Plan UpdateChapter 3 – Draft Interim Report August 2011
R.A. Wiedemann & Associates, Inc. 3 18
operations was included in Table 3 9. The New Castle Airport peak hour military operationswere taken from FAA Control Tower records.
Table 3 9 Forecast of Military OperationsAirport 2010 2015 2020 2030New Castle 8,870 8,900 8,900 8,900Peak Hour 30 30 30 30Summit 100 100 100 100Peak Hour 4 4 4 4Sussex County 100 100 100 100Peak Hour 4 4 4 4
5. SUMMARY OF AVIATION DEMAND FORECASTS
ABLE 3 10 PRESENTS A SUMMARY OF THE aviation demand forecasts for each system airport.Included in summary are airport specific based aircraft and operations numbers, alongwith enplanement and peak period statistics. It should be noted that peak hour
components were added to project the highest potential peak period operations for eachairport. While rare, all of the types of activity could potentially occur during the same hour.
Table 3 10 Summary of Aviation Demand ForecastsAirport/Forecast Component 2010 2015 2020 2030Chandelle EstatesBased Aircraft 24 26 28 32Operations 3,200 3,500 3,700 4,200Peak Hour Operations 3 3 3 4Enplanements GA 700 800 800 900ChormanBased Aircraft 19 21 22 25Operations 13,200 14,600 15,300 17,300Peak Hour Operations 8 9 9 11Enplanements GA 15,000 16,600 17,400 19,700Civil Air TerminalBased Aircraft 0 0 0 0Operations 600 800 1,000 1,400Peak Hour Operations 24 32 40 56Enplanements GA 5,000 5,500 6,000 7,000Delaware AirparkBased Aircraft 56 61 65 74

Delaware State Aviation System Plan UpdateChapter 3 – Draft Interim Report August 2011
R.A. Wiedemann & Associates, Inc. 3 19
Table 3 10 Summary of Aviation Demand ForecastsAirport/Forecast Component 2010 2015 2020 2030Operations 22,650 24,600 26,300 29,900Peak Hour Operations 14 15 16 18Enplanements GA 7,400 8,000 8,600 9,800JenkinsBased Aircraft 20 22 23 26Operations 1,400 1,500 1,600 1,800Peak Hour Operations 2 2 2 2Enplanements GA 800 900 900 1,000LaurelBased Aircraft 14 15 16 18Operations 8,950 9,600 10,200 11,600Peak Hour Operations 7 7 8 9Enplanements GA 2,100 2,300 2,400 2,800New Castle AirportBased Aircraft 189 205 219 249Operations Total 78,840 84,800 90,000 101,000General Aviation 69,970 75,900 81,100 92,100Military 8,870 8,900 8,900 8,900Peak Hour Operations Total 100 107 112 118General Aviation 70 77 82 88Military 30 30 30 30Enplanements GA 47,500 51,600 55,100 62,600SmyrnaBased Aircraft 10 11 12 13Operations 2,300 2,500 2,800 3,000Peak Hour Operations 2 2 3 3Enplanements GA 600 700 800 800SummitBased Aircraft 43 47 50 57Operations Total 41,500 45,500 48,300 55,100General Aviation 41,400 45,400 48,200 55,000Military 100 100 100 100Peak Hour Operations Total 29 32 33 38General Aviation 25 28 29 34Military 4 4 4 4Enplanements GA 23,600 26,000 27,600 31,500Sussex County

Delaware State Aviation System Plan UpdateChapter 3 – Draft Interim Report August 2011
R.A. Wiedemann & Associates, Inc. 3 20
Table 3 10 Summary of Aviation Demand ForecastsAirport/Forecast Component 2010 2015 2020 2030Based Aircraft 62 67 72 82Operations Total 34,000 36,700 39,500 44,900General Aviation 33,900 36,600 39,400 44,800Military 100 100 100 100Peak Hour Operations Total 25 26 28 31General Aviation 21 22 24 27Military 4 4 4 4Enplanements GA 12,900 13,900 15,100 17,100DELAWARE TOTALSBased Aircraft 437 475 507 576Operations Total 206,640 224,100 238,700 270,200General Aviation 197,570 215,000 229,600 261,100Military 9,070 9,100 9,100 9,100Peak Hour Operations Total 214 235 255 289Enplanements GA 115,600 126,300 134,700 153,200


Delaware State Aviation System Plan UpdateChapter 4 – Draft Interim Report August 2011
R.A. Wiedemann & Associates, Inc. 4 1
Chapter 4DEMAND/CAPACITY &
AVIATION SYSTEM NEEDS
OR AN AVIATION SYSTEM TO PROPERLY SERVICE existing and forecast levels of activity, it musthave the ability to efficiently process the demand of its users. This chapter reviews theability of the existing airport facilities in Delaware to accommodate the number of
projected aircraft operations during the planning period by gathering estimates of operationalcapacity. By definition, operational capacity is determined by the amount of average delayincurred. Therefore, the determination of capacity is a measure of acceptable levels of delay.As demand approaches 100 percent of estimated capacity, the delay incurred by an aircraftincreases and the quality of service deteriorates.
To understand the ability of the Delaware system of airports to process demand, available datapertaining to airport capacity were compared to forecast levels of demand. Results of thiscomparison, or demand/capacity analysis, offered insight into the locations and types of airportfacilities needed to adequately serve the State of Delaware over the long term future. Areaswhere capacity deficiencies are expected can be given special attention in the identification ofappropriate alternatives that will deal with the specific problems. This chapter is divided intothree major sections:
Demand/Capacity AnalysisFacility Needs AnalysisSummary of Findings

Delaware State Aviation System Plan UpdateChapter 4 – Draft Interim Report August 2011
R.A. Wiedemann & Associates, Inc. 4 2
1. DEMAND/CAPACITY ANALYSIS
SING EXISTING AIRPORT MASTER PLANS, THE PRIOR aviation system plan, and Federal AviationAdministration (FAA) Advisory Circular 150/5060 5 Airport Capacity and Delay, airportairfield capacities for public use system airports were determined. It should be noted
that the forecast capacity availability at Delaware's public use airports differs significantly fromthe previous SASPU. This is due to the change in demand caused by the negative effects of theRecession of 2007 2009 and higher avgas and jet fuel prices. With overall aviation demandlevels lower throughout the State, the available airfield capacity throughout the system hasincreased.
This section briefly outlines the process by which airfield capacity was obtained or calculatedand presents the results of the analysis. The discussion is organized as follows:
Definition of Airfield CapacityMethodology UsedHourly Capacity and Annual Service VolumeAnnual Aircraft Delay
1.1 Definition of Airfield Capacity
Airfield capacity, as it applies to the Delaware Aviation System Plan Update is a measure ofterminal area airspace and airfield saturation. It is defined as the maximum rate at whichaircraft can arrive and depart an airfield with an acceptable level of delay. Measures of capacityin this chapter include the following:
Hourly Capacity of Runways: The maximum number of aircraft operations thatcan take place on an airport runway system in one hour.Annual Service Volume: The annual capacity or a maximum level of annualaircraft operations that can be accommodated on an airport runway system withan acceptable level of delay.Annual Delay: The total amount of time per year that aircraft are delayed due toa constrained operating environment at an airport.
1.2 Methodology Used
A variety of techniques have been developed for the analysis of airfield capacity. The currenttechnique accepted by the Federal Aviation Administration and employed in this study isdescribed in the FAA Advisory Circular 150/5060 5, Airport Capacity and Delay. The AirportCapacity and Delay Model (ACDM) from that Advisory Circular uses the following inputs toderive an estimated airport capacity:

Delaware State Aviation System Plan UpdateChapter 4 – Draft Interim Report August 2011
R.A. Wiedemann & Associates, Inc. 4 3
Meteorological ConditionsAirfield Layout and ConfigurationNavigational AidsAircraft Operational Fleet MixTouch and Go Operations
These inputs were used in the calculation of airfield capacity at public use airports in Delaware.
Meteorological Conditions
Wind conditions are of prime importance in determining runway use and orientation. The mostdesirable runway orientation based on wind is the one which has the largest wind coverage andminimum crosswind components. Wind coverage is that percentage of time crosswindcomponents are below an acceptable velocity. In this regard, the FAA recommends that arunway system provide 95 percent wind coverage.
In addition to wind coverage, meteorological conditions involve visibility and cloud ceilingconditions. Visual Meteorological Conditions (VMC) are those weather conditions that permitaircraft to operate and maintain safe separations by visual means (generally a minimum of a1,000 foot cloud ceiling with 3 miles horizontal visibility). Aircraft that operate under theseconditions generally use Visual Flight Rules (VFR). Instrument Meteorological Conditions (IMC)exist when the height of the dominant cloud base falls below that prescribed under VMC, andthe range of horizontal visibility is constrained below VMC limits. During these weatherconditions, aircraft must operate under Instrument Flight Rules (IFR), which tends to constraincapacity because of the greater aircraft separations needed for safety. Other factors notassociated with weather can also influence the use of VFR and IFR operations such as airlineoperations and instrument flight training.
Airfield Layout and Configuration
Airfield layout and configuration affects the ability of the airport to efficiently accommodateaircraft operations. There are several airport geometrical designs which improve operationalcapacity. For example, runways with full length parallel taxiways are more efficient thanrunways with partial length or no parallel taxiways because departing aircraft can taxi to thethreshold with another aircraft on a final approach. Full length taxiways permit a more rapidexit of aircraft from the runway, reducing the amount of time pilots must spend Aback taxiing@on the runway to the threshold for departure or to an exit taxiway. The number of taxiway exitson the runway and their width also affects operational capacity.
The spacing between the primary runway and its parallel taxiway are important considerationsin the airfield capacity calculation. Additionally, airports with intersecting runways may have alower annual operational capacity than airports with nonintersecting runways, as intersectingrunways require more separation to be provided between aircraft using both runways at the

Delaware State Aviation System Plan UpdateChapter 4 – Draft Interim Report August 2011
R.A. Wiedemann & Associates, Inc. 4 4
same time. Airports with appropriately spaced, parallel runways are the most efficient sincethey may allow aircraft to land and take off simultaneously. Also, it should be noted that forcapacity calculation purposes, multiple runway airports are treated as single runway airports ifthere is no Air Traffic Control Tower (ATCT) available at the facility.
Navigational Aids
The availability of navigational aids permits airports to remain open for greater portions of theyear than non instrument capable airports. For example, airports without navigational aidscannot be used during Instrument Flight Rule (IFR) conditions. Thus, airports that do not haveIFR capacity will have a lower overall capacity than airports with such capability. The influenceof Air Traffic Control facilities available at an airport is also important. If an Approach Controlfacility with radar can directly vector an aircraft to a position from which an instrument landingcan occur, the separation between arriving aircraft can be shortened. This separation mustnecessarily increase for safety purposes if no radar or Approach Control facility is available.Thus, the capacity of an instrument equipped airport will differ, based upon the complexity offacilities available.
Aircraft Operational Fleet Mix
The aircraft fleet mix is an important factor in determining an airport's operational capacity.The FAA's Airport Capacity and Delay Model identifies an airport's aircraft fleet mix in terms offour classifications ranging from A (small, single engine with gross weight 12,500 lbs. or less) toD (large aircraft with gross weights over 300,000 lbs.). These classifications and examples ofeach are identified in Table 4 1.
The capacity model requires that total annual operations be converted to operations by specificaircraft classification category. In particular, the “C” plus “D” percentage (if greater than zero)significantly impacts the capacity calculation. Since requirements for aircraft are based on theirapproach speed and size, capacity decreases as the number and diversity of approach speedsincreases. The greater the difference in size and speed of the aircraft in the fleet, the greaterthe space required between aircraft and, therefore, the lower the operational capacity
Table 4 1 Aircraft Classification System Used In Capacity ModelCLASS A Small single engine, gross weight 12,500 pounds or less
Examples: Cessna 172/182 Cirrus SR20/22
Beech Bonanza Piper Cherokee/Warrior
CLASS B Twin engine, gross weight 12,500 pounds or less
Examples: Beech Baron Piper Navajo
Cessna 402 Beech 99
Mitsubishi Mu 2 Rockwell Turbo

Delaware State Aviation System Plan UpdateChapter 4 – Draft Interim Report August 2011
R.A. Wiedemann & Associates, Inc. 4 5
Table 4 1 Aircraft Classification System Used In Capacity ModelCommander
CLASS C Large aircraft, gross weight 12,500 pounds to 300,000 pounds
Examples Boeing 737/757 Gulfstream G II/III/IV/V
Lear 35/55 Airbus 319/320/321
McDonnell Douglas MD80/88
Challenger 600/601
CLASS D Large aircraft, gross weight more than 300,000 pounds
Examples Boeing 747/767/777 Airbus A 300/310/380
Touch And Go Operations
A touch and go operation occurs when an aircraft lands and then makes and immediate takeoffwithout coming to a full stop. Touch and go operations increase the number of operations thata runway system can process due to the low occupancy time associated with each operation.The primary purpose of touch and go operations is for the training of student pilots. InDelaware, Chandelle Estates and Jenkins Airport are two privately owned airports that do notpermit touch and go operations. Delaware Airpark has a significant number of touch and gooperations as a result of the Delaware State University flight training program.
1.3 Hourly Capacity and Annual Service Volume
It is important to note that it is possible for airports to operate at operational levels in excess oftheir Airport Service Volume (ASV). However, ASV is widely used as a reference point for thegeneral planning of capacity related improvements. Detailed airfield capacity analysis, which isoften part of an airport master plan, should be conducted for airports where operations areapproaching their estimated ASVs.
For each system airport, the FAA's Airport Capacity and Delay Model combined informationconcerning runway configuration, runway usage, meteorology, operational fleet mix, andtouch and go operations to produce the ASV and adjusted hourly capacity for each VFR and IFRoperational runway use configuration. Table 4 2 shows the hourly capacity and ASV for each ofthe public use airports in Delaware.
Table 4 2 Airport Airfield Capacity Adjustment Inputs and Results
FacilityName
WindCoverage % TNG Taxiway ATCT Lighting IAP
MixIndexC +3D
AdjustedHourly Adjusted
VFR IFR ASVChandelle 91.6% 0.0% No No LI No 0 22 0 46,400Chorman 95.7% 10% No No LI No 0 23 0 53,100DelawareAirpark 95.4% 40% Full No MI Yes 0 87 20 171,300

Delaware State Aviation System Plan UpdateChapter 4 – Draft Interim Report August 2011
R.A. Wiedemann & Associates, Inc. 4 6
Table 4 2 Airport Airfield Capacity Adjustment Inputs and Results
FacilityName
WindCoverage % TNG Taxiway ATCT Lighting IAP
MixIndexC +3D
AdjustedHourly Adjusted
VFR IFR ASVJenkins 98.6% 0.0% No No LI No 0 22 0 24,800Laurel 93.6% 30% No No LI Yes 0 27 20 32,200New Castle 99.5% 20% Full Yes HI Yes 28% 73 44 194,000Summit 95.9% 20% Full No MI Yes 0 73 20 170,800Smyrna 91.8% 30% No No LI No 0 27 0 30,000Sussex 99.1% 20% Full No MI Yes 1.8% 73 20 174,500
The FAA recommends that individual airports should begin planning for additional airfieldcapacity when actual annual operations reach 60 percent of ASV. Additionally, FAArecommends that capacity enhancing improvements should be designed and constructed whenactual annual operations reach 80 percent of ASV. Projections of total annual operations ateach system airport were compared to published airfield operational capacity figures to identifyfacilities projected to exceed 60 percent of airfield capacity during the twenty year planningperiod. Table 4 3 presents a summary of airfield demand/capacity comparisons for eachsystem airport.
Table 4 3 Airfield Demand/Capacity Comparisons
Airport Annual ServiceVolume
Year 2030Operations
Percent ofCapacity
Annual Delay(Hours)
Chandelle Estates 46,400 4,200 9% 0Chorman 53,100 17,300 33% 66Delaware Airpark 171,300 29,900 17% 35Jenkins 24,800 1,800 7% 0Laurel 32,200 11,600 36% 50New Castle 194,000 101,000 52% 707Summit 170,800 55,100 32% 202Smyrna 30,000 3,000 10% 0Sussex County 174,500 44,900 26% 120STATE TOTAL 897,100 268,800 30% 1,180
As shown in Table 4 3, none of the public use airports are projected to reach 60 percent of theircapacity by 2030. Only 30 percent of the airfield capacity available at the State's public useairports will be used by the year 2030.

Delaware State Aviation System Plan UpdateChapter 4 – Draft Interim Report August 2011
R.A. Wiedemann & Associates, Inc. 4 7
1.4 Annual Aircraft Delay
Annual aircraft delay is an important measure of how well the airfield services demand. It canalso be used to estimate economic costs of experiencing delay and thus provide a feasibilitymeasure for airport improvement projects. Delay statistics can be expressed either in totalnumber of annual hours or as an average in minutes per aircraft operation. Table 4 4, derivedfrom FAA data, shows the typical relationship between the ratio of annual demand at an airportto its calculated ASV and the average annual aircraft delay per operation based on the variousdemand/capacity ratios:
Table 4 4 – Relationship of ASV to Potential DelayRatio of AnnualDemand to ASV
Average Aircraft Delay(min/op)
Peak Delay Range for IndividualAircraft (min)
0.1 0 0.0 0.50.2 0.1 0.5 1.00.3 0.2 1.0 2.00.4 0.3 1.5 3.00.5 0.4 2.0 4.00.6 0.5 2.5 5.00.7 0.7 3.5 7.00.8 0.9 4.5 9.00.9 1.4 7.0 14.01.0 2.8 13.0 26.01.1 5.4 27.0 54.0
As shown, when annual aircraft operations equal annual service volume (ratio of 1.0), theaverage annual aircraft delay is 2.8 minutes per aircraft. The actual delay at any given timedepends on a number of conditions and can vary by a factor of five or more. Once an airportexceeds 80 percent of its operational capacity (a demand to ASV ratio of 0.8), average delay peroperation begins to increase rapidly and resulting peak delays can vary widely.
Average annual delay estimates for each of the Delaware Aviation System Airports werepresented earlier in Table 4 3. If no capacity expansion is undertaken for the future, theaviation system is anticipated to experience almost 1,180 hours of aircraft operational delay bythe year 2030. Sixty percent of this delay will be attributable to New Castle Airport (707 hoursof delay). Summit and Sussex County Airports will experience the next highest amounts ofdelay (202 annual hours and 120 annual hours respectively). Aircraft operational delays at theremaining public use airports will be negligible.
On a State wide basis, the sum of all airport capacities is enough to handle all future traffic inthe area. This assumes that if one airport becomes saturated in terms of aircraft operations,the excess demand would be distributed to nearby airports with surplus capacity. The

Delaware State Aviation System Plan UpdateChapter 4 – Draft Interim Report August 2011
R.A. Wiedemann & Associates, Inc. 4 8
combined airfield capacities of all system airports is about 897,000 operations per year. Thetotal number of operations projected for the year 2030 is roughly 259,700 or about 30 percentof total capacity.

Delaware State Aviation System Plan UpdateChapter 4 – Draft Interim Report August 2011
R.A. Wiedemann & Associates, Inc. 4 9
2. AVIATION SYSTEM NEEDS
NE OF THE ULTIMATE OUTPUTS OF THE system plan is to determine the locations and types ofairport facilities needed to adequately serve the State of Delaware. The purpose ofgenerating airport facility needs is to identify potential capacity deficiencies or airport
improvement needs. This section builds on the results of the Demand/Capacity Analysis inSection 1 and will ultimately provide a base upon which the analysis of alternatives can beperformed. In order to adequately address aviation system requirements this chapter has beenorganized to include the following sections:
Airport Systems ConceptAirport Facility Need StandardsAirfield Facility NeedsLandside Facility NeedsAirspace/Navaid NeedsSurface Transportation NeedsSummary of Findings
2.1 Airport Systems Concept
An airport "system" implies a group of interdependent airports regularly interacting toward aunified goal. Each airport in a system, therefore, has a specific function which contributestoward that goal. The Aviation System Needs portion of the analysis applies system parametersto the network of Delaware public use airports in order to better define the needs of airportusers and citizens of the State. In this regard, the goals and objectives of the study providedirection as to what is ultimately desirable in the State's air transportation system. To betterdefine the location and types of facilities needed, the following criteria were developed:
Demand/Capacity Relationships: Where capacity deficits appear (either for theairfield or for the landside), additional airport facilities are needed. Facilityrequirements in this chapter deal only with existing airports and use FAA andaviation industry standards.Airport Locational Criteria: These standards are based upon the stated goalsand objectives of the study. As such, the following locational standards apply:
Commercial air service should be within 60 minutes driving time for all of theState's citizens.Business jet airports (ARC: C II or Larger) should be within 30 minutes drivingtime of all significant population centers of more than 25,000.Utility airports (ARC: B I and B II) should be within 30 minutes driving time ofall cities with over 2,500 population.
Planned Improvements/Airport Master Planning Recommendations: Currentplanned improvements and recent master plans were examined to determine

Delaware State Aviation System Plan UpdateChapter 4 – Draft Interim Report August 2011
R.A. Wiedemann & Associates, Inc. 4 10
their site specific facility recommendations for Delaware airports. Airportmaster plans often have examined local issues in far greater detail than ispossible in a study of this scope. Thus, the facility recommendations fromairport master plan studies along with planned improvements will be examinedfor use in this system plan.
Using these three input factors, a general idea of the location and types of airports needed inDelaware can be generated.
Airport Demand/Capacity Relationships
From the Demand/Capacity Analysis section, all public use airports were below their estimatedairfield and landside capacities during the long range planning period. New Castle Airport isprojected to have the highest percentage of capacity used, with 52 percent used by 2030.
The public use airports in Delaware will not need new facilities from a capacity reliefstandpoint, but this does not preclude the development of runway and taxiway facilities toaccommodate larger or heavier aircraft. For example, some airports may need additionalrunway length, based upon the type of aircraft forecast to use the facility. In these cases, theairport will have sufficient capacity to accommodate the number of operations forecast, butmay not have the length, width, or strength to adequately serve forecast demand.
From the landside perspective, many aircraft owners desire hangar facilities due to inclementwinter weather or summer sun/heat exposure in Delaware. As the cost of aircraft continues torise, the relative value of each aircraft appreciates. Thus, hangars are used both forconvenience and to protect valuable investments. Presently, many system airports havewaiting lists for hangar space. These examples point to a need for continuous upgrading offacilities. Airfield and landside improvements at system airports are discussed later in thischapter under the topic of airport facility needs standards.
Airport Locational Criteria
Airport locational criteria were developed in response to the goals and objectives of the studypertaining to air transportation accessibility. These goals and objectives translated the need forcommercial service and general aviation airport availability into driving times from populationcenters. Figure 4 1 presents a graphic depiction of 30 minute driving times around B I or largerairports. For commercial service airports (Philadelphia International, BWI, and Salisbury, MD),Figure 4 2 presents a depiction of 60 minute driving times around each facility, as they impactDelaware.
As shown on the maps, there are two areas that are beyond the 30 minute driving timeboundary of B I or larger airports in Delaware. However, no incorporated cities with more than2,500 population are outside the 30 minute driving time areas. Even so, it can be argued that

Delaware State Aviation System Plan UpdateChapter 4 – Draft Interim Report August 2011
R.A. Wiedemann & Associates, Inc. 4 11

Delaware State Aviation System Plan UpdateChapter 4 – Draft Interim Report August 2011
R.A. Wiedemann & Associates, Inc. 4 12

Delaware State Aviation System Plan UpdateChapter 4 – Draft Interim Report August 2011
R.A. Wiedemann & Associates, Inc. 4 13
the western portions of Kent and Sussex County are "unserved" by a Delaware general aviationairport, since it is over 30 minutes driving time to the Sussex County Airport or DelawareAirpark. However, these areas are served by airports in Maryland including CambridgeDorchester and Easton.
The significant population centers of Wilmington, Newark, and Dover are all within 30 minutesdriving time of C II or larger airports. New Castle Airport is classified as a D III facility whileDover AFB qualifies as a transport airport since it can safely accommodate jets of all sizes and isclassified as an E VI airport. As long as Dover AFB accepts civilian aircraft operations, no new CII facilities are needed in Delaware according to service area criteria. It should be noted thatboth Summit Airport and Sussex County Airport are classified as B II and B III facilitiesrespectively and both currently accommodate limited business jet activity.
For commercial air service, Philadelphia International Airport provides airline access tonorthern Delaware residents extending south to the city of Smyrna. From the south, Salisbury,Maryland provides airline service to residents in Sussex County and southern Kent Countywithin an hour’s driving time. As shown in Figure 4 2, the State has inadequate coverage withregard to airline service availability.
Planned Improvements/Airport Master Planning Recommendations
Recommendations from airport master plans along with current planned improvements wereused for the four National Plan of Integrated Airport Systems (NPIAS) airports and were carriedthrough this analysis:
Delaware AirparkNew Castle AirportSummit AirportSussex County Airport
Although not on the list, it should be noted that the Civil Air Terminal is also expected toundergo facility improvement during the planning period. This improvement would requirefunding from state and local sources, because the facility is not classified as a NPIAS airport.
For the NPIAS airports, the master planning level of detail exceeds that for system planning.Thus, relevant facility recommendations from these plans were used to complement the airportfacility requirements standards used in this study. Recommended airfield facility improvementsresulting from the application of master planning studies included the following:
Delaware Airpark: A new replacement runway for 9 27 that measures 4,200' x75' with a full parallel taxiway is scheduled to be completed in 2013. The currentAirport Reference Code of B I will change to ARC B II when the new runway is

Delaware State Aviation System Plan UpdateChapter 4 – Draft Interim Report August 2011
R.A. Wiedemann & Associates, Inc. 4 14
completed. Other findings indicated a need to develop additional apron areaand hangars.New Castle Airport: Airfield improvements have been made and more are to becompleted as a result of the ongoing New Castle Airport Master Plan. In addition,landside facilities and a potential new terminal area are recommended fordevelopment. Roadway changes including the closure of Old Churchmans Roadas a thru street will alter the access to the general aviation hangar area on thatside of the airport.Summit Airport: Airport owners plan the expansion of Runway 17 35 to 5,320feet with a full parallel taxiway.Sussex County Airport: Recommendations include the extension of Runway 4 22from 5,000 feet to 6,000 feet over the long term, moving the ARC from a B III toa C III. However, an intermediate length of 5,500 feet will occur in the nearfuture, as demand and justification for the longer length are then recorded.
2.2 Airport Facility Need Standards
From the criteria applied in the previous section, the airport locations and types needed inDelaware become more well defined. This section sets forth the facility need standards thatwill be used on an individual airport basis throughout the remainder of this study. Facility needstandards refer to acceptable planning guidelines issued by the State, FAA, or other recognizedindustry authorities. These guidelines deal with airport improvements and are linked toincreased aviation activity as it affects the role and service level of an airport. The generalplanning standards used in developing facility recommendations in this study are gearedtoward airports with paved runways. Development standards used in this analysis include thefollowing improvement categories:
Land HangarsRunways and Taxiways Auto ParkingAircraft Parking Aprons MiscellaneousLighting Systems and Approach Aids
Land
Airside land requirements include acreage under runway protection zones, the primary runwaysurface, and the land under transitional slopes extending from the runway centerline out to thebuilding restriction lines. The dimensional standards for airside land requirements can bederived from FAA A/C 150 5300 13 (with Changes), Airport Design. These dimensional criteriawere followed as closely as possible in determining minimum land requirements for smallgeneral aviation airports and were extrapolated for larger airports. Privately owned airportswhere no airport upgrades were recommended were not subject to these standards.
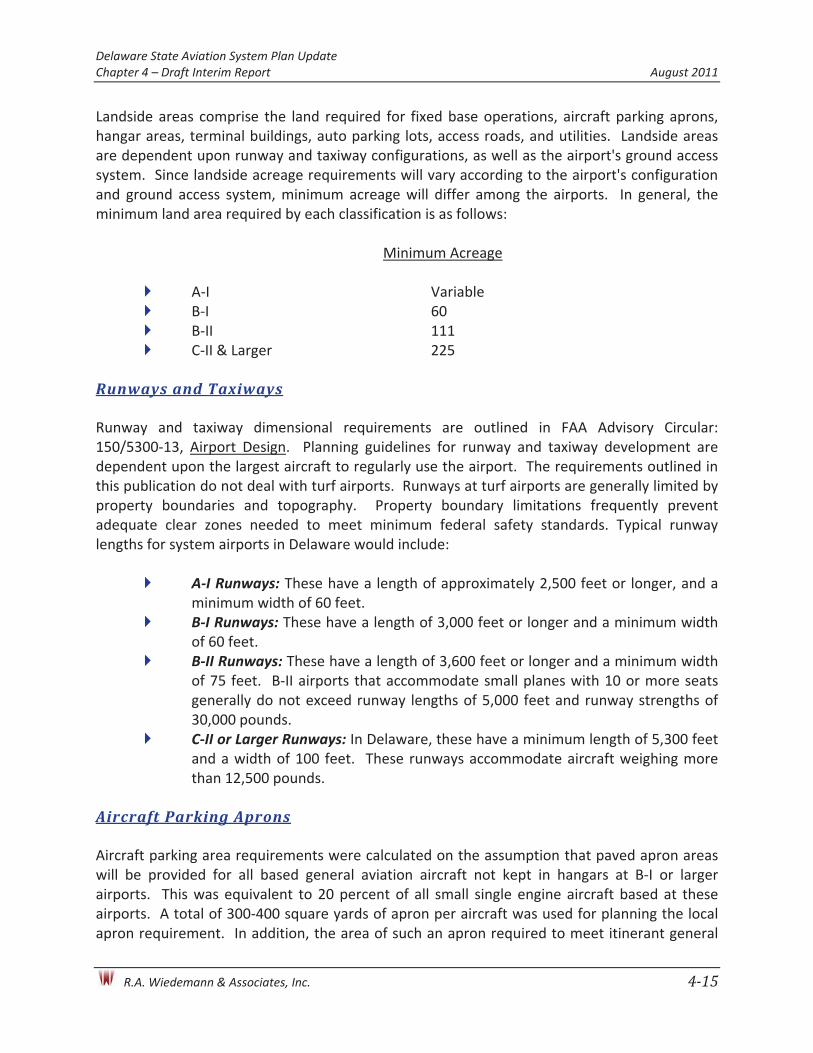
Delaware State Aviation System Plan UpdateChapter 4 – Draft Interim Report August 2011
R.A. Wiedemann & Associates, Inc. 4 15
Landside areas comprise the land required for fixed base operations, aircraft parking aprons,hangar areas, terminal buildings, auto parking lots, access roads, and utilities. Landside areasare dependent upon runway and taxiway configurations, as well as the airport's ground accesssystem. Since landside acreage requirements will vary according to the airport's configurationand ground access system, minimum acreage will differ among the airports. In general, theminimum land area required by each classification is as follows:
Minimum Acreage
A I VariableB I 60B II 111C II & Larger 225
Runways and Taxiways
Runway and taxiway dimensional requirements are outlined in FAA Advisory Circular:150/5300 13, Airport Design. Planning guidelines for runway and taxiway development aredependent upon the largest aircraft to regularly use the airport. The requirements outlined inthis publication do not deal with turf airports. Runways at turf airports are generally limited byproperty boundaries and topography. Property boundary limitations frequently preventadequate clear zones needed to meet minimum federal safety standards. Typical runwaylengths for system airports in Delaware would include:
A I Runways: These have a length of approximately 2,500 feet or longer, and aminimum width of 60 feet.B I Runways: These have a length of 3,000 feet or longer and a minimum widthof 60 feet.B II Runways: These have a length of 3,600 feet or longer and a minimum widthof 75 feet. B II airports that accommodate small planes with 10 or more seatsgenerally do not exceed runway lengths of 5,000 feet and runway strengths of30,000 pounds.C II or Larger Runways: In Delaware, these have a minimum length of 5,300 feetand a width of 100 feet. These runways accommodate aircraft weighing morethan 12,500 pounds.
Aircraft Parking Aprons
Aircraft parking area requirements were calculated on the assumption that paved apron areaswill be provided for all based general aviation aircraft not kept in hangars at B I or largerairports. This was equivalent to 20 percent of all small single engine aircraft based at theseairports. A total of 300 400 square yards of apron per aircraft was used for planning the localapron requirement. In addition, the area of such an apron required to meet itinerant general

Delaware State Aviation System Plan UpdateChapter 4 – Draft Interim Report August 2011
R.A. Wiedemann & Associates, Inc. 4 16
aviation demand was estimated using an approach suggested by the FAA in Advisory Circular150/5300 13, Airport Design. This approach indicates that 50 percent of the daily itinerantoperations on a busy day (a busy day is 10 percent busier than the average day) will representaircraft on the ground at any one time. Itinerant apron requirements for general aviationaircraft in Delaware indicate that 400 600 square yards per itinerant aircraft is a reasonabledistribution. This will permit the accommodation of aircraft ranging from large multi engineturboprops to single engine piston aircraft.
Lighting Systems and Approach Aids
Criteria for airport lighting systems and approach aids were developed for the system planusing FAA standards as a basis. Based on these criteria, high intensity runway lighting (HIRL)and medium intensity approach light systems (MALS) were recommended at airports thatqualify for a precision instrument approach. All other runways were recommended to havemedium intensity runway lighting (MIRL) systems. The taxiway lighting for all taxiways andturnarounds adjoining a lighted runway was medium intensity taxiway lighting (MITL). For turfairports, low intensity runway lights (LIRL) are considered sufficient. Approach aids wererecommended at B I or larger airports as follows:
A Non Precision Instrument Approach Aid was recommended at all C II andlarger airports and other airports with over 20,000 annual operations. Inaddition, a Global Positioning System (GPS) non precision instrument approachwas recommended for public use airports with qualifying airfield facilities(proper separation standards for runways and taxiways, lighted obstructions,etc.).
GPS based Wide Area Augmentation System (WAAS), Vertical Navigation(VNAV), or LPV1 approaches were recommended at airports with qualifyingforecasts of operations or instrument approaches or where safety concerns ortraining activity levels dictated a need.
A Medium intensity Approach Light System (MALS) was recommended atairports that qualify for precision instrument approaches.
Runway End Identifier Lights (REIL) were recommended for all paved and lightedrunways except those with MALS, since they are not compatible.
Visual approach aids such as Precision Approach Path Indicators (PAPI) or VisualApproach Slope Indicators (VASI) were recommended for all B I or larger airportrunways not already equipped.
1 The name LPV is used for approaches constructed with WAAS criteria where the value for thevertical alarm limit is more than 12 meters and less than 50 meters.

Delaware State Aviation System Plan UpdateChapter 4 – Draft Interim Report August 2011
R.A. Wiedemann & Associates, Inc. 4 17
Buildings
Hangar space requirements at system airports were based upon industry standards andexperience with aircraft owner preferences in Delaware. These take into account the relativevalue of each type of aircraft and thus, the relative importance of protecting that investment.Year 2030 hangar space requirements were calculated for each airport as follows:
Percent of Aircraft Type Type of Storage
100% of Jet Aircraft Conventional Hangar50% of Multi Engine Aircraft Conventional Hangar50% of Multi Engine Aircraft T Hangar80% of Single Engine Aircraft T Hangar20% of Single Engine Aircraft Apron Tie Down
Conventional hangar space requirements assumed 3,600 square feet per based jet aircraft and1,600 square feet per multi engine aircraft, while T hangar units for single engine aircraft wereassumed to average 1,200 square feet. General aviation terminal space was recommended forsystem airports in differing degrees. B I airports were recommended to have at least 500square feet for pilot shelter, phone, and restrooms. B II airports were recommended to have aminimum 800 square feet, while C II and larger airports were recommended to have aminimum of 1,000 square feet.
Auto Parking
Auto parking areas were recommended for all classifications of airports. Auto parking spacerequirements are a function of the number of passengers, employees, and pilots expected touse an airport during the daily peak hour. At general aviation airports, planning standardsindicate that roughly 1.3 auto parking spaces per total number of peak hour general aviationpilots and passengers is adequate.
Miscellaneous
All public use airports were recommended to have both a rotating beacon and a lighted windindicator. Table 4 5 presents a summary of facility need standards used for the general aviationairports in the Delaware system.
Table 4 5 General Aviation Minimum Facility Needs StandardsFACILITIES B I Airports1 B II Airports1 C II & Larger Airports1
LandAirfield 33 Acres 59 Acres 131 AcresRunway Protection Zones 16 Acres 28 Acres 59 Acres

Delaware State Aviation System Plan UpdateChapter 4 – Draft Interim Report August 2011
R.A. Wiedemann & Associates, Inc. 4 18
Table 4 5 General Aviation Minimum Facility Needs StandardsFACILITIES B I Airports1 B II Airports1 C II & Larger Airports1
Landside 8 Acres 24 Acres 24 AcresTOTALS 57 Acres 111 Acres 214 AcresRunwaysLength 3,000 Feet2 3,600 Feet3 5,300 FeetWidth 60 Feet2 75 Feet 100/150 FeetStrength 12,500 Lbs. 12,500 Lbs.3 Over 12,500 Lbs.
TaxiwaysParallel (Width) 25 Feet 35 Feet 35/50/75 FeetTurn around (Area) 1,400 s.y. 3,000 s.y. 4,000 s.y.
Aircraft Parking ApronBased Aircraft (Area) 300 s.y. 300 s.y. 400 s.y.Itinerant Tiedown (Area) 400 s.y. 400 s.y. 600 s.y.
Lighting and Approach AidsHIRL No w/Precision Instrument
Approachw/Precision Instrument
ApproachMIRL Yes Yes YesMITL Yes Yes YesLIRL Less than utility Airport OnlyILS/GPS4 No Conditional ConditionalNPIA Demand Driven Demand Driven YesVisual Approach Aids Yes Yes YesMALS No w/Precision Approach w/Precision ApproachREIL Yes Yes (not w/MALS) Yes (not w/MALS)
BuildingsGA Terminal (Minimum)5 500 s.f. 800 s.f. 1,000 s.f.Conventional Hangar As Required As Required As RequiredT Hangar6 As Required As Required As Required
Auto ParkingArea per Space 35 s.y. 35 s.y. 35 s.y.
MiscellaneousFencing As Required As Required As RequiredRotating Beacon Yes Yes YesWind Indicator Yes Yes YesPavement Overlay7 As Required As Required As Required
LegendHIRL: High Intensity Runway LightsMIRL: Medium Intensity Runway LightsMITL: Medium Intensity Taxiway LightsLIRL: Low Intensity Runway LightsGPS: Global Positioning System ApproachILS: Instrument Landing System

Delaware State Aviation System Plan UpdateChapter 4 – Draft Interim Report August 2011
R.A. Wiedemann & Associates, Inc. 4 19
NPIA: Non Precision Instrument ApproachMALS: Medium Intensity Approach Light SystemREIL: Runway End Identifier Lights
1 U.S. Department of Transportation, Federal Aviation Administration, Airport Design, AC No. 150/5300 13,with Changes.
2 A I runways have a length of approximately 2,500 feet or longer, and a minimum width of 60 feet. Turfrunways are not subject to these standards.
3 B II airports that accommodate small planes with 10 or more seats can have a runway length of up to 5,000'and runway strengths up to 30,000 pounds.
4 FAA Order 7031.2C, November 1994, Airway Planning Standard Number One Terminal Air NavigationFacilities and Air Traffic Control Services, FAA Order 8260.3B, United State Standard for Terminal InstrumentProcedures (TERPS) with Changes.
5 Delaware recommended standard.6 Hangar space dictated by fleet mix: Jets 100% stored in conventional hangars; Multi Engine 50% stored in
conventional hangars, 50% stored in T hangars; Single Engine 80% stored in T hangars.7 Maximum pavement life assumed to be 20 years.
2.3 Airfield Facility Needs
Having stated the dimensional requirements of the airfield facilities, the next step was to applythese standards to the airports in Delaware. The runway extensions indicated by the masterplan input, the locational standards, or the fleet mix forecast are included as "needed" facilities.It should be understood that the designation of an upgrade or improvement for an airportindicates a future aviation need for the general area and does not represent a decision toupgrade that particular airport. Such a decision must be made by the airport Sponsor, using theresults of master planning and appropriate environmental studies as a basis. Table 4 6 presentsthe airfield improvements suggested by the analysis.
Table 4 6 Suggested Airfield Improvements to System Airports: Year 2030
Airport NameExisting Primary Runway
DimensionsFuture Primary
Runway Dimensions Dimensional Upgrade
Chandelle Estates 2,533' x 28' 2,533' x 60' 32' in width
Chorman 3,588' x 40' 3,600' x 60' 12' in length20' in width
Delaware Airpark1 3,582' x 60' 4,200' x 75' New Runway and FullParallel Taxiway
Dover AFB2 12,902' x 150' N/A N/A
Jenkins 2,842' x 70' 2,842' x 70' None
Laurel 3,175' x 270' 3,175' x 270' None
New Castle 7,012' x 150' 7,012' x 150' None
Summit1 4,488' x 65' 5,320' x 75' 833' in length and 10' inwidth
Smyrna 2,600' x 125' 2,600' x 125' None
Sussex County1 5,000' x 150' 6,000' x 150' 1,000' in length

Delaware State Aviation System Plan UpdateChapter 4 – Draft Interim Report August 2011
R.A. Wiedemann & Associates, Inc. 4 20
1 Recommendations from airport master plans and current ALPs.2 Recommendations for military runway lengths are made solely by the military.
2.4 Landside Facility Needs
The landside facility needs for Delaware airports were developed on a generalized basis usingthe demand/capacity relationships developed earlier in this Chapter. For the purposes of thisanalysis, landside facility requirements refer to the aircraft or passenger processing capability ofan airport. As such, landside facility needs were identified for the hangar and apron areas ofthe general aviation areas of all airports. It should be remembered that facility needs outlinedin this section are simply suggestions and cannot be implemented at any of the system airportswithout airport owner/sponsor support (particularly the privately owned airports). Table 4 7presents a summary of additional terminal, hangar, or apron facility needs.
In addition, it should be noted that this analysis is meant to identify potential capacityconstraints within the system regarding landside passenger handling and aircraft processingcapability. That is why the focus of the analysis is on terminal, hangar, and apron area facilities.In Phase 2 of the System Plan, the entire range of airport facilities including land acquisition,pavement overlays, airfield lighting, and miscellaneous items will be considered using thefacility requirements standards outlined in this chapter.
Table 4 7 Suggested Additional Landside Facility Needs (Year 2030)
Airport NameTerminalBuilding
Improvements
AdditionalApron Area
(s.y.)
Additional CHangar Space
(s.f.)
Additional Thangar Units1
Chandelle Estates None 1,900 s.y. None 8 Units
Chorman 500 s.f. 3,700 s.y. None None
Delaware Airpark None None 28,900 s.f. 29 Units
Dover AFB/Civil AirTerminal2 4,000 s.f. 50,000 s.y. N/A N/A
Jenkins 500 s.f. None None None
Laurel None None None None
New Castle None 9,900 s.y. None None
Summit None None None 9 Units
Smyrna None None None 4 Units
Sussex County None None None None
TOTAL ADDITIONALFACILITIES 5,000 s.f. 65,500 s.y. 28,900 s.f. 50 Units

Delaware State Aviation System Plan UpdateChapter 4 – Draft Interim Report August 2011
R.A. Wiedemann & Associates, Inc. 4 21
1 Aircraft that require T hangars were assumed to move to any unused conventional hangar space beforeadditional T hangar units would be built.2 The Civil Air Terminal work would be undertaken with State and local funding, and reflects economicdevelopment activities to increase usage by NASCAR race teams and air cargo carriers.
2.5 Airspace Obstructions/Navaid Needs
The inventory chapter focused on the airspace obstructions and navaid needs at systemairports. The purpose of this section is to examine the future airspace use patterns for eachairport and to identify airspace obstruction removal needs along with future IFR demands thatwill require improved navaid facilities.
The facility needs portion of this analysis specified recommendations for the removal ofairspace obstructions, based upon the inventory of those presented in Chapter 2. Airspaceobstructions that penetrate FAR Part 77 imaginary surfaces include the following:
Chandelle Estates: 24.35Acres + 154 ObstructionsChorman: 19.88 Acres + 20 ObstructionsDelaware Airpark: 69.00 Acres + 44 ObstructionsJenkins: 86.11 Acres + 71 ObstructionsLaurel: 28.53 Acres + 25 ObstructionsNew Castle Airport: 34.70 Acres + 106 ObstructionsSmyrna: 3.09 Acres + 3 ObstructionsSummit 64.64 Acres + 43 ObstructionsSussex County 61.00 Acres + 10 Obstructions
Rather than remove all of these, many non critical obstructions can be lighted or marked,resulting in a much lower cost of remediation.
From navaid need perspective, there are visual navaids such as Visual Approach SlopeIndicators (VASIs) or Precision Approach Path Indicators (PAPIs) lacking on some runway ends atsystem airports. For the NPIAS airports, runway ends at Delaware Airpark (both Runway end 9and Runway end 27) need some type of visual landing aids.
From an IFR perspective, it should be noted that the FAA has primary responsibility for thedevelopment and management of the airways system. Thus, it is beyond the scope of thisstudy to detail requirements pertaining to Air Traffic Control facilities or equipment. Rather,the focus of this analysis is directed toward specific airport instrumentation that can serve toincrease the level of safety at system airports. In this regard, it was recommended that anonprecision Global Positioning System (GPS) instrument approach be available at public useairports in Delaware that had qualifying facilities (proper separation standards for runways andtaxiways, lighted obstructions, etc.) Currently, six airports (New Castle County, Summit Airport,Sussex County Airport, Delaware Airpark, Laurel Airport, and Dover AFB) are already equipped

Delaware State Aviation System Plan UpdateChapter 4 – Draft Interim Report August 2011
R.A. Wiedemann & Associates, Inc. 4 22
with a minimum of one or more nonprecision instrument approaches. Of these airports, NewCastle Airport and Dover AFB have precision instrument approaches. Sussex County Airport isworking to upgrade their nonprecision approach to a precision approach in the near future.
Of the remaining airports, Chorman would have the activity needed to justify aninstrument approach in the future. However, current runway safety areas would not permit aninstrument approach due to the lack of separation between the runway and the various hangarfacilities along the flight line. Thus, Chorman would only be eligible if either the runway wererelocated or the terminal buildings were relocated. At some point in the future, it is anticipatedthat the GPS system (WAAS, LPV, VNAV) will permit the addition of precision instrumentapproach at Summit Airport. The major concern is not whether the technology exists toestablish such an approach. Rather, future un obstructed approach surfaces supporting a 50:1slope are the main concern for establishing a precision approach at Summit Airport. Increasingdevelopment to the north and south of the airport may rule out the possible development of aprecision approach at that facility.
2.6 Surface Transportation Needs
Appendix 4 A presents the analysis of Surface Access to Airports in Delaware. Because there area number of planned developments at system airports, the needs for surface access differ byfacility. From a demand/capacity standpoint, there are only two anticipated shortfalls orconstraints. These deal with on airport access or parking issues. In addition to these, there area number of improvements that are planned, particularly where new airport development mustbe integrated into the surface transportation system. When improvements are undertaken,they will be for improved convenience or operational efficiency rather than for capacityreasons. Findings from the analysis are described as follows:
Civil Air Terminal: If there is no further development of the Civil Air Terminal, itsexisting roadway system will be adequate for the long term future. However, ifthe facility is developed either for airline service or air cargo aircraftaccommodation, significant changes will be needed in the future:
If airline service is initiated, a potential of 300 peak hour vehicles arepossible for Horsepond Road. This will hasten the need for capacity reliefimprovements including turn lanes, road widening, and increased parkingarea at the CAT. A minimum of 150 new auto parking spaces will beneeded if airline service materializes.If domestic air cargo service is initiated, the roadway system connectingthe CAT to State Route 1 will need to be improved for truck traffic. Thiswould include possible widening and strengthening of the roadwaysconnecting to Route 1 (Horsepond Road and Lafferty Lane).
Delaware Airpark: No significant changes to the surface access are anticipatedor required for this airport.

Delaware State Aviation System Plan UpdateChapter 4 – Draft Interim Report August 2011
R.A. Wiedemann & Associates, Inc. 4 23
The current Annual Average Daily Traffic (AADT) for State Route is 5,262,with a projected total of 7,700 AADT by 2040. This increase is still wellbelow the roadway capacity.On airport traffic levels are only anticipated to grow to 43 peak hourvehicles by 2030, which is roughly 22 percent of the entrance roadwaycapacity.At least 20 more airport auto parking spaces will be needed by 2030.
New Castle Airport: At some point in the future, airline service is likely to beinitiated at New Castle Airport due to overcrowding at PhiladelphiaInternational. If this occurs prior to 2030, new surface access improvements willbe needed at the airport:
Redevelopment of Old Churchmans Road: Should an airline terminal belocated off Old Churchmans Road, the roadway will be closed as athrough street and access to the new terminal will only be available viaChurchmans Road.Auto parking for a major airline service is not adequate at the airport.With only 1,000 parking spaces in the current terminal area, an additional2,300 would be needed adjacent to the new terminal area (shuttlingparking traffic to the existing parking areas at this scale is not costeffective).The existing turn signal on U.S. 40/DuPont Highway at the terminalentrance is adequate to accommodate traffic accessing the generalaviation functions in the terminal area.Current infrastructure (terminal and hangar buildings) will limit thegrowth of on airport traffic in the existing terminal area. As such, thecurrent configurations of traffic in that area (Flight Safety, FAA Tower,general aviation terminal, and Dassault) will not significantly degradeover the planning period.Rail access to the airport is considered impractical at this time. Thecurrent locations of rail lines to the north of the airport cannot beconnected to the existing or future terminal areas without significantcapital expenditures.Public transportation in the form of bus service will continue to connectthe airport to downtown Wilmington.
Summit Airport: Summit Airport will continue to grow its maintenance, avionics,and aircraft retrofitting businesses, along with its government contracts. Assuch, the airport is anticipated to increase its employment base over theplanning period. Airport management has estimated that this growth may createup to 600 new jobs. Given the new employment numbers, surface access to theairport may need improvement:

Delaware State Aviation System Plan UpdateChapter 4 – Draft Interim Report August 2011
R.A. Wiedemann & Associates, Inc. 4 24
A traffic light may be needed at the main airport entrance in theintermediate planning timeframe to accommodate peak period trafficthat would occur during the start and end of work shifts at the airport.Additional on airport parking spaces will be needed. It is anticipated thatat least 500 more spaces would be required as the number of employeesand visitors to the airport increase. These spaces may be developed inassociation with new hangars that are planned for the south end ofRunway 17 35, with a connecting roadway inside the airport that leads tothe main entranceway.
Sussex County Airport: Sussex County Airport has two primary surface accessneeds:
Sussex County Airport’s runway expansion program will require therelocation of a portion of U.S. 9T (Park Avenue), changing the intersectionlocation of S. Bedford Street and Park Avenue. That relocation willrequire at least $9 million and a purpose and need generated by therunway expansion project. Prior to that project, the FAA must sign off onthe extension of Runway 4 22 to 6,000 feet. This sign off is based ondemand for large aircraft reaching 500 annual itinerant operations forthese large critical aircraft types.With only 40 parking spaces at the terminal building, airport parking isconstrained and use of overflow parking at the Sussex County EmergencyOperations Center has been one option. There are 60 auto parking spacesat the EOC. However, should a real emergency occur, these parkingspaces may be needed for law enforcement and other emergencypersonnel. Planning for additional airport parking should be undertaken.Highway access from S. Railroad Street and from U.S. Route 9 via AirportRoad is adequate to serve the airport through the long term future.
Other Public Use System Airports: Chandelle Estates, Chorman Airport, Jenkins,Laurel, and Smyrna Airport are not anticipated to create significant surfaceaccess demand throughout the period. Only one airport has significantexpansion plans – Chorman Airport. That facility has received approval fromKent County for the development of up to 136 T hangar units. If developed, theadditional hangar units will attract pilots and passengers to the airport, but notat levels that would require any surface access improvements or changes.
Airport generated surface vehicle traffic was projected to the year 2030 to determine whetheror not hourly roadway capacities at each facility would be exceeded. These peak hour vehicletrips were estimated using a general aviation industry standard of 2.35 times the number of

Delaware State Aviation System Plan UpdateChapter 4 – Draft Interim Report August 2011
R.A. Wiedemann & Associates, Inc. 4 25
peak hour aircraft operations.1 This number accounts for employees, passengers, and pilotsusing the airport.
In addition to airport generated trips, an existing hourly roadway capacity was estimated foreach airport. From a systems planning level of detail, the estimation process used theminimum hourly roadway capacity of 200 vehicles for turn lanes into and out of systemairports. As shown in Table 4 8, projected peak hour vehicle trips will not exceed minimumlevels of highway capacity during the period. Except for the Civil Air Terminal, none of theairports exceed 22 percent of their on airport hourly capacity. The Civil Air Terminal isprojected to reach 66 percent of its capacity, primarily due to the peak hour activity associatedwith the NASCAR race weekends.
Table 4 8 Forecast Surface Access Demand
Airport Name Access Road2030 Peak
Hour VehicleTrips*
Existing HourlyRoadwayCapacity*
2030Surplus or(Deficit)
ChandelleEstates Route 9 10 200 190
Chorman Nine Foot Road 25 200 175
Civil AirTerminal atDover AFB
Horsepond Road 132 200 68
DelawareAirpark State Route 42 43 200 157
Jenkins Westville Road 7 200 195
Laurel State Route 24 22 200 178
New CastleAirport
US 13 and 40, State Routes 273,58, 141 206 1,200 994
Smyrna State Route 6 7 200 193
Summit US 301 79 400 321
Sussex County Airport Road, S Railroad Ave 65 400 335* Vehicle trips estimated from general aviation industry averages of 2.35 times peak hour operations. This
number accounts for pilots, passengers, and employees at the airport.** Estimated minimum capacity of 200 hourly vehicles for airport ingress and egress turn lanes
1 Source: Originally published in Aviation Demand and Airport Facility Requirement Forecasts for Medium AirTransportation Hubs Through 1980. This standard is still applicable at GA airports.

Delaware State Aviation System Plan UpdateChapter 4 – Draft Interim Report August 2011
R.A. Wiedemann & Associates, Inc. 4 26
3. SUMMARY OF FINDINGS
T IS IMPORTANT AT THIS POINT IN the study to assess the findings that have resulted from theanalysis. Further, these findings will have implications on the direction and focus of thealternatives analysis. This chapter has centered around the needs of the aviation system
based on the goals and objectives of the plan. As such there were three main criteria used toassess the "system" needs of Delaware airports.
Demand/Capacity RelationshipsAirport Locational StandardsAirport Master Planning Recommendations
Airport upgrades and facility needs based on these criteria affect 9 of the 10 public use airportscarried through this analysis. Of these airports, 5 have runway or taxiway upgrades listed asneeded, while 9 airports have landside improvement needs listed. For airfield improvements,suggested runway extensions or upgrades were made for the following Delaware airports:
Chandelle EstatesChorman AirportDelaware AirparkSummit AirportSussex County
Landside improvements focused mostly upon aircraft storage hangar and apron areaimprovements at various system airports. In this regard, a total 31,000 square feet of terminalspace, 30,600 square feet of conventional hangar space, 178 T hangar units, and almost 12,600square yards of apron area are needed at system airports within the planning horizon.
From the overall analysis, it was shown that no airfield demand/capacity shortfalls are expectedto develop over the planning period. Only New Castle Airport came within 52 percent of itsestimated airfield capacity. The aviation system requirements estimated for each airportrepresent normal improvements to provide safety and meet demand increases over theplanning period. The focus of the landside analysis was upon the passenger and aircraftprocessing capabilities of the individual airports. The alternatives analysis in Phase 2 of thesystem plan (Chapter 6) will consider the entire range of facility requirements and associatedcosts including land acquisition, pavement overlays, airfield lighting, and miscellaneous items.


Delaware State Aviation System Plan UpdateInterim Report – Appendix 4 A August 2011
R.A. Wiedemann & Associates, Inc. A 1
Appendix 4 A Surface Access toAirports in Delaware
In planning future aviation facilities in Delaware, it is important to know the impact of thecurrent surface access network on the demand for air transportation services. This isbecoming increasingly clear, as air service options are tried in Wilmington, and possibly inDover. In addition, the general aviation service levels may be increased by improving thesurface access network to Delaware’s airport system.
For example, unlike other metro areas or small cities lacking air service, the level and scope ofWilmington’s corridor rail service is a significant alternative to air service. In fact, one couldargue that rather than lacking air service, the market response for most regional businesstravel originating in Delaware has been Amtrak’s service. In addition, Continental Airlinessome years ago established a “code share” arrangement with Amtrak for travel originating inboth Wilmington and Philadelphia which can be booked either through the Amtrak orContinental websites. This makes Allegiant’s case for air service from Dover that muchstronger. By virtue of its isolation, Dover customers have fewer attractive options thannorthern residents.
On the general aviation side, the surface access network has some issues with ingress andegress from airports. Traffic levels along Route 13 at New Castle Airport create queuing delaysand cross traffic turning delays. However, other airports experience fewer traffic problems,but they do have on airport access issues that should be addressed – particularly with regardto flow and parking access.
To assess the surface access network, this appendix has been organized to include thefollowing sections:
Surface Access IssuesExisting Traffic Demand at System AirportsFuture Traffic ProjectionsFindings and Conclusions

Delaware State Aviation System Plan UpdateInterim Report – Appendix 4 A August 2011
R.A. Wiedemann & Associates, Inc. A 2
1. SURFACE ACCESS ISSUES
There are a number of issues facing transportation planners in Delaware. In a meeting at theWilmington Area Planning Council (WILMAPCO) in June, some of these issues were discussedin the context of developing long term solutions. In other analysis, surface access issuesinvolving downstate airports were also identified:
Protecting Future Airline Terminal Options at New Castle Airport: A potentialfuture airline terminal area on the south side of the airport (Figure A 1) willbenefit from the protection of surface access options. The development ofproperty adjacent to the airport for a shopping center limits the landsideoptions for the airport and may limit ground access options as well. Severalterminal area options have been suggested, all of which show the closure of OldChurchmans Road as a thru road. The new access to the terminal area wouldbe via Churchmans Road, which would serve both the shopping center and theproposed passenger terminal. Other issues associated with this developmentinvolve the potential public transportation connection with DART (DelawareAuthority for Regional Transit), and the bundling of parking area and rental carparking facilities at the new facility, including the possibility of a shared parkingstructure for the airport and shopping center.
Currently the intersection of State Route 273 and U.S. Highway 40 (N. DuPontHighway) is one of the most dangerous pedestrian crossing areas in the State.Location of a new shopping area and airline terminal in that area may need toexamine pedestrian access as well. Previously, a pedestrian walkway under U.S.40 was rejected because of safety concerns at night. A pedestrian bridge at thatlocation was estimated to cost over $3 million because of the need to includeramps for Americans with Disabilities Act (ADA) accessibility. Also of concern arethe FAR Part 77 imaginary surfaces associated with the approach to Runway 1that may limit the height of a pedestrian bridge over U.S. 40, thereby making itimpractical to construct.
On Airport Access Capacity of Roadways and Parking at New Castle Airport: Anumber of internal roadways at New Castle Airport converge on the terminalside into two potential outlet roads that pass in front of the terminal building.The demand on these roadways during peak hours has not been measured.However, examination of the parking capacity at tenant businesses that use theroadways (Flight Safety International, Dassault Falcon, corporate hangars, theFAA Tower, and the terminal building parking area itself) indicate that totalpeak loading could range from 400 to 500 vehicles.

Delaware State Aviation System Plan UpdateInterim Report – Appendix 4 A August 2011
R.A. Wiedemann & Associates, Inc. A 3
The terminal area at New Castle Airport has roughly 1,000 parking spaces,which include those at the FAA tower, Dassault Falcon, Flight Safety, andTerminal parking lot with overflow. In addition to the 1,000 parking spaces,there are a significant number of general aviation and military auto parkingspaces associated with access points off Churchmans Road or Airport Road.These spaces are adequate for their respective functions. Of concern in thisanalysis are the numbers of public auto parking spaces available or developableshould airline service be offered at New Castle Airport.
Potential Rail Access to New Castle Airport: Discussions with WILMAPCO andDRBA indicate that there is little chance that a light rail line can be constructedto connect New Castle Airport to downtown Wilmington. Numerous physicalconstraints limit these possibilities. As such, the airport’s surface access systemwill likely have to depend upon automobile and bus transportation exclusively.The closest commuter rail line is located north of Interstate Highway 95 andwould require new right of way to reach the airport (Figure A 2).
On Airport Parking Capacity at Summit: In recent months, the 127 spaceparking area at the terminal building has not been large enough to hold all theemployee and visitor parking needs during certain peak periods (Figure A 3).When overflow parking is needed, cars are escorted through the gate onto the

Delaware State Aviation System Plan UpdateInterim Report – Appendix 4 A August 2011
R.A. Wiedemann & Associates, Inc. A 4
airfield area and parked remotely. With an increase in the number of employeesanticipated at Summit Airport over the next five years, there should be plans toexpand auto parking capacity as well.

Delaware State Aviation System Plan UpdateInterim Report – Appendix 4 A August 2011
R.A. Wiedemann & Associates, Inc. A 5
Surface Access for a Potential Air Cargo Operation at the Civil Air Terminal(CAT) at Dover AFB: A potential air cargo operation at the CAT could bringdomestic air cargo distribution to central Delaware (Figure A 4). EvergreenInternational Airlines has expressed interest in possibly using the CAT as analternative to a small portion of air cargo traffic that currently is handled attheir JFK International hub. This usage would trigger the need for adequatesurface access connections to Route 1 and other major highways in Dover.
Highway Issues Surrounding Expansion of Sussex County Airport: The potentialexpansion by 1,000 feet of Runway 4 22 (to a total usable length of 6,000 feet)at Sussex County Airport could require the relocation of Route 9 near theairport (see Figure A 5). In the near term, a proposal to expand the runway by500 feet is being studied. If the runway is only expanded by 500 feet, no
relocation is needed. However, the long term plan calls for the full 1,000 footexpansion. Thus, at some point the relocation issue must be addressed. Asignificant impediment to this process is the cost of the proposed roadway
relocation, which could run as high as $9 million. Another factor that delayedthe funding of the project involved the reduction in the number of critical

Delaware State Aviation System Plan UpdateInterim Report – Appendix 4 A August 2011
R.A. Wiedemann & Associates, Inc. A 6
aircraft operations that justify the expansion. In the early 2000’s, jet traffic wasgrowing at the airport and the need for a runway expansion to 6,000 feetseemed assured. However, the recession of 2008 2009 decreased the critical jetaircraft demand and reduced the justifiable increase in runway length to 500feet (5,500 feet in total usable runway length).
In two of the above cases, on airport surface access or auto parking capacity constraints areinvolved. In addition to these, there are a number of improvements that are planned,particularly where new airport development must be integrated into the surfacetransportation system. The following section documents the highway traffic counts onroadways that serve system airports. This information will help assess the need forimprovements to the surface access system serving airports over the long term future.

Delaware State Aviation System Plan UpdateInterim Report – Appendix 4 A August 2011
R.A. Wiedemann & Associates, Inc. A 7
2. EXISTING TRAFFIC DEMAND AT SYSTEM AIRPORTS
In order to determine the demand levels on roadways that serve system airports, traffic countdata collected by DelDOT was used, in conjunction with airport generated traffic demand.Automatic Traffic Recorder (ATR) stations are traffic volume counter stations permanentlyinstalled throughout the road network covering all functional classifications of highways inDelaware except on local streets. Equipped with loop detectors, these ATR stations count thenumber of all vehicles passing through each location, continuously throughout the year, andtransmit the recorded data to the traffic monitoring computers at the Office of InformationTechnology (OIT) headquarters at DelDOT for electronic data processing. AADT is the AnnualAverage Daily Traffic for all 365 days of the year.
Key traffic counts for this analysis involved roadways that serve the entrances to systemairports in Delaware. For New Castle Airport and Sussex County Airport, there are multipleentranceways to the facilities. Listed below are the system airports, the associated roadwaysserving them, along with their annual average daily traffic:
Chandelle EstatesSilver Leaf Lane – 168 AADTState Route 9 – 1,289 AADT
ChormanNine Foot Road – 793 AADTU.S. Route 13 – 23,901 AADT
Civil Air Terminal at Dover AFBHorsepond Road – 1,898 AADT
Delaware AirparkState Route 42 – 5,262 AADT
JenkinsWestville Road – 2,735 AADT
LaurelSharptown Road – 1,610 AADT
New Castle AirportU.S. 40/DuPont Highway – 77,366 AADTU.S. 202/E. Basin Road (State Route 141) – 41,783 AADTCommons Boulevard/State Route 37 – 18,645 AADTAirport Road – 9,320 AADTChurchmans Road/State Route 58 – 10,267 AADTOld Churchmans Road – 712 AADT
SmyrnaCommerce Street/State Route 6 – 1,807 AADT
Summit

Delaware State Aviation System Plan UpdateInterim Report – Appendix 4 A August 2011
R.A. Wiedemann & Associates, Inc. A 8
U.S. 301 – 21,798 AADTSussex County
Road 319 – 941 AADTU.S. Route 9 – 13,139 AADTU.S. Route 9T – 4,995 AADT
The demand loadings of surface access routes to system airports are instructive. New CastleAirport, for example, has the highest annual average daily traffic of all Delaware airports.Chandelle Estates has the least traffic using the roadway for its direct entrance. Highlights ofthe data for NPIAS airports are presented in the following paragraphs.
2.1 Civil Air Terminal at Dover AFB
Although not a NPIAS airport at this time, the potential initiation of airline service may changethe status of the Civil Air Terminal in the future to NPIAS designation. Currently, the onlyaccess to the Civil Air Terminal is via Horsepond Road. This roadway also serves the KentCounty Aero Park, which is not operating at its existing capacity (at least one large facility isvacant). The AADT of 1,898 indicates that peak period demand levels of under 300 vehiclesper hour are likely. This level of demand includes the use of the Civil Air Terminal, Kent CountyAero Park, and the small residential area off County Road 347.
For the future, there are a number of access issues that involve the potential development ofthe CAT, including potential civilian cargo distribution, potential airline service, and continuedaccommodation of NASCAR racing teams’ aircraft. If civilian air cargo distribution is initiatedby one of the supplemental military air cargo carriers (such as Evergreen International),increased truck traffic will be experienced on Horsepond Road and access to Route 1 may needto be improved. If airline service is initiated by Allegiant, the auto parking area will need to beexpanded from its current level of 50 spaces to at least 200 spaces. These developmentswould directly benefit the accommodation of NASCAR racing team aircraft via the expansion ofthe terminal building and auto parking areas.
2.2 Delaware Airpark
Access to Delaware Airpark’s terminal area is only available from State Route 42. This highwayhad an AADT of 5,262 in 2010. Peak period traffic is less than 800 vehicles per hour. Mostvehicles accessing the airport come from the direction of Route 13 and thus, can turn rightonto the airport. Users approaching from the west must make a left turn across on comingtraffic. However, since traffic from that direction is very low, there are few times that leftturns onto the airport are needed. Given all of these factors, access to the airport is notconstrained.

Delaware State Aviation System Plan UpdateInterim Report – Appendix 4 A August 2011
R.A. Wiedemann & Associates, Inc. A 9
There are only 37 parking spaces at the terminal building at Delaware Airpark. At times, everyspace is taken, with no nearby overflow parking. For the future, this may become a capacityissue, if continued pilot training for Delaware State University occurs at the facility (bothground school in the terminal building and flight training on the airfield).
2.3 New Castle Airport
Peak hour traffic on U.S. 40/DuPont Highway can exceed 12,000 vehicles. Traffic accessing theairport heading southbound on U.S. 40 can turn directly onto airport property through one oftwo main access roads. However, northbound traffic must turn across southbound lanes at thestoplight at the terminal entrance. The left turn light can sequence on a minimum of 140seconds. The light responds to traffic queues, allowing a minimum five seconds for one car,and up to 25 seconds for multiple cars. Cars exiting the terminal and desiring to travelnorthbound on U.S. 40 (left turn out of the terminal) are subject to the same 140 secondtraffic light sequence. This can create some backups during peak periods, but generally all arecleared within a one light sequence.
It is interesting to note that an average 712 vehicles use Old Churchmans Road each day –most of which is for airport access only. The National Guard and businesses along AirportRoad have a significant daily use of 18,645 vehicles – many of which must access U.S. 202.
Although the internal daily vehicle traffic counts for New Castle Airport are not available, aerialphotos reveal auto parking demand in the terminal area of about 50 percent of capacity.Because not all users or employees of the airport park at the facility, there may be othervehicles using the access during peak periods. Thus, a worst case scenario daily loading couldapproach 500 vehicles or more.
The terminal area at New Castle Airport has roughly 1,000 parking spaces, which include thoseat the FAA tower, Dassault Falcon, Flight Safety, and Terminal parking lot with overflow. Anoverflow parking lot with 100 spaces has been established on a portion of the terminal apronfor airport employees. This lot can be converted to public parking if an airline begins service tothe airport. If only the terminal building parking is considered, there are only about 460 spacesavailable. Of these, roughly 160 are taken by employees, rental cars, and visitors. Thus, only300 spaces may be available at any one period to serve as airline passenger auto parking. Thisnumber of spaces is adequate for airline passenger levels below 150,000.
2.4 Summit Airport
Peak hour traffic on U.S. Highway 301 can exceed 3,500 vehicles. This is significant becausevehicles accessing the airport from the south must cross south bound traffic in a left turnconfiguration. There is no traffic signal at the airport, so drivers must judge the oncoming

Delaware State Aviation System Plan UpdateInterim Report – Appendix 4 A August 2011
R.A. Wiedemann & Associates, Inc. A 10
speed of vehicles in making their turning decisions. In departing the airport, vehicles must turnright and cannot access the northbound lanes until the first turning opportunity at the trafficlight at Victoria Drive (0.25 miles south of the airport entrance).
Another issue for Summit Airport involves the on airport parking capacity. In this regard, thecurrent airport parking lot has a capacity of 137 vehicles. When these are filled, cars must parkon the airport either near the terminal or to the south at the entrance to the hangar area. Inprevious periods where overflow parking was needed, cars were escorted through the securitygate at the north end of the terminal building and parked in a remote area adjacent to the Thangars. It is assumed that as more employees are hired, additional auto parking at the newhangar areas to the south of the terminal building will be constructed.
2.5 Sussex County Airport
Access to Sussex County Airport is via Airport Road and S. Railroad Avenue (Road 319). Thehighest traffic demand for this looping road is from the S. Railroad segment, with 941 AADT.This translates into an approximate peak hour of about 140 vehicles, which is below itscapacity.
Other surface access issues at Sussex County Airport involve the need for more terminal areaauto parking and the eventual relocation of U.S. Highway 9T to accommodate the extension ofRunway 4 22. With only 40 parking spaces, auto parking is currently constrained at theterminal building. At times, the overflow reaches the County Emergency Operations Center(EOC) across the street. There are 60 auto parking spaces at the EOC.
The relocation of U.S. Highway 9T (Figure x), is required if Runway 4 22 is to be extended to6,000 feet. That highway had an AADT of 4,995 in 2010. The runway can be extended to 5,500feet without a relocation of the roadway, and that project is currently scheduled to occur overthe next two years. However, beyond that period, the roadway will need to be relocated topermit the attainment of safety areas on the future runway extension.

Delaware State Aviation System Plan UpdateInterim Report – Appendix 4 A August 2011
R.A. Wiedemann & Associates, Inc. A 11
3. FUTURE TRAFFIC PROJECTIONS
HERE ARE TWO COMPONENTS TO FUTURE TRAFFIC projections considered in this analysis. Thefirst involves projections of AADT on highways surrounding Delaware system airports.This can be considered the “ambient” traffic into which the airport and aviation related
traffic must flow. The second component is the airport generated traffic that results fromactivity at each airport within the system.
3.1 Projected AADT for Highways Near System Airports
Future traffic counts were provided by DelDOT for the roadways involved in direct surfaceaccess to Delaware’s system airports. These projections tend to change often due to forecastmodel improvements and updated assumptions regarding land use and system capacity.However, this section presents the best available projections to the year 2040 at this time.While it is understood that the system plan’s planning horizon is 2030, we are using the onlyprojections available that are broken down by street segment. These projections can beconsidered a worst case loading for the system plan. For comparison purposes the 2010 AADTis also shown along with the percentage growth over the period:
Chandelle EstatesSilver Leaf Lane – 168 AADT (240 Projected, +42.9%)State Route 9 – 1,289 AADT (1,750 Projected, +35.8%)
ChormanNine Foot Road – 793 AADT (1,030 Projected, +29.9%)U.S. Route 13 – 23,901 AADT (35,900 Projected, +50.2%)
Civil Air Terminal at Dover AFBHorsepond Road – 1,898 AADT (2,100 Projected, +10.6%)
Delaware AirparkState Route 42 – 5,262 AADT (7,700 Projected, +46.3%)
JenkinsWestville Road – 2,735 AADT (4,000 Projected, +46.3%)
LaurelSharptown Road – 1,610 AADT (2,300 Projected, +42.9%)
New Castle AirportU.S. 40/DuPont Highway – 77,366 AADT (95,000 Projected, +22.8%)U.S. 202/E. Basin Road (State Route 141) – 41,783 AADT (63,000 Projected,+50.8%)Commons Boulevard/State Route 37 – 18,645 AADT (25,500 Projected,+36.8)Airport Road – 9,320 AADT (14,000 Projected, +50.2%)

Delaware State Aviation System Plan UpdateInterim Report – Appendix 4 A August 2011
R.A. Wiedemann & Associates, Inc. A 12
Churchmans Road/State Route 58 – 10,267 AADT (15,000 Projected,+46.1%)Old Churchmans Road – 712 AADT (800 Projected, +12.4%)
SmyrnaCommerce Street/State Route 6 – 1,807 AADT (2,000 Projected, +10.7%)
SummitU.S. 301 – 21,798 AADT (28,000 Projected, +28.5%)
Sussex CountyRoad 319 – 941 AADT (1,050 Projected, +11.6%)U.S. Route 9 – 13,139 AADT (17,500 Projected, +33.2%)U.S. Route 9T – 4,995 AADT (7,500 Projected, +50.2%)
As shown, New Castle Airport has the highest traffic volumes in surrounding roadways bothnow and in the future. U.S. 202/State Route 141 has the highest absolute growth (measuredin number of vehicles) of any of the roadways listed – 21,217 additional AADT. This is followedclosely by U.S. 40/DuPont Highway which is projected with a growth of 17,634 additionalAADT.
In cases where a roadway leads directly to an airport entrance (Old Churchmans at New CastleAirport, Horsepond Road at the Civil Air Terminal, and Road 319 at Sussex County Airport) allhave growth rates under 13 percent. These projections may not incorporate future plans ofthe airport into the modeling. For example, a new terminal area off Old Churchmans Roadwould significantly increase that level of traffic. Similarly, a new air cargo operation or newairline service at the Civil Air Terminal would significantly impact those projected surfaceaccess numbers.
Airports posting the highest growth in AADT on surrounding roadways include:
Silver Leaf Lane – Chandelle: 42.9%State Route 42 – Delaware Airpark: 46.3%Westville Road – Jenkins: 46.3%Sharptown Road – Laurel: 42.9%New Castle Airport:
U.S. 202/State Route 141: 50.8%Airport Road: 50.2%Churchmans Road/State Route 58: 46.1%
U.S. Route 9T – Sussex County Airport: 50.2%
Except for New Castle Airport, many of the high growth rates involve relatively low activityroadways. For example, Silver Leaf Lane is growing from an AADT of 168 to 240 – only 72vehicles per day. At Delaware Airpark, State Route 42 is projected to grow by 2,438 AADT. Butthis is significantly less than the large numbers surrounding New Castle Airport, described

Delaware State Aviation System Plan UpdateInterim Report – Appendix 4 A August 2011
R.A. Wiedemann & Associates, Inc. A 13
previously. U.S. 301, which provides access to Summit Airport, is anticipated to grow from21,798 to 28,000 over the period. This growth will increase the difficulty of turning left intothe airport without a stop light to assist traffic across the southbound lanes.
3.2 Forecast of Airport Generated Surface Vehicle Traffic
Airport generated surface vehicle traffic was projected to the year 2030 to determine whetheror not hourly roadway capacities at each facility would be exceeded. These peak hour vehicletrips were estimated using a general aviation industry standard of 2.35 times the number ofpeak hour aircraft operations.1 This number accounts for employees, passengers, and pilotsusing the airport.
In addition to airport generated trips, an existing hourly roadway capacity was estimated foreach airport. From a systems planning level of detail, the estimation process used theminimum hourly roadway capacity of 200 vehicles for turn lanes into and out of systemairports. As shown in Table A 1, projected peak hour vehicle trips will not exceed minimumlevels of highway capacity during the period. Except for the Civil Air Terminal, none of theairports exceed 22 percent of their on airport hourly capacity. The Civil Air Terminal isprojected to reach 66 percent of its capacity, primarily due to the peak hour activity associatedwith the NASCAR race weekends.
Table A 1 Forecast Surface Access Demand
Airport Name Access Road2030 Peak
Hour VehicleTrips*
Existing HourlyRoadwayCapacity*
2030Surplus or(Deficit)
ChandelleEstates Route 9 10 200 190
Chorman Nine Foot Road 25 200 175
Civil AirTerminal atDover AFB
Horsepond Road 132 200 68
DelawareAirpark State Route 42 43 200 157
Jenkins Westville Road 7 200 195
Laurel State Route 24 22 200 178
New CastleAirport
US 13 and 40, State Routes 273,58, 141 206 1,200 994
Smyrna State Route 6 7 200 193
1 Source: Originally published in Aviation Demand and Airport Facility Requirement Forecasts for Medium AirTransportation Hubs Through 1980. This standard is still applicable at GA airports.

Delaware State Aviation System Plan UpdateInterim Report – Appendix 4 A August 2011
R.A. Wiedemann & Associates, Inc. A 14
Table A 1 Forecast Surface Access Demand
Airport Name Access Road2030 Peak
Hour VehicleTrips*
Existing HourlyRoadwayCapacity*
2030Surplus or(Deficit)
Summit US 301 79 400 321
Sussex County Airport Road, S Railroad Ave 65 400 335* Vehicle trips estimated from general aviation industry averages of 2.35 times peak hour operations. This
number accounts for pilots, passengers, and employees at the airport.** Estimated minimum capacity of 200 hourly vehicles for airport ingress and egress turn lanes
3.3 Impact of New Development Options
From Table A 1 it can be concluded that roadway capacity will not be a problem during theplanning period, unless new developments take place that are not a part of the status quoforecast. In this regard, potential development of the Civil Air Terminal into an airline andcargo capable handling facility, the potential development of airline service at New CastleAirport, and plans for expansion of Summit Airport’s workforce could increase local trafficsignificantly to these facilities. These potential developments will be analyzed in Phase II ofthe system plan. For this analysis, a brief discussion of the potential impacts is outlined asfollows:
Civil Air Terminal Developments: The development of the apron and taxiway atthe CAT has the potential to attract air cargo activity and freight handlingfacilities at Kent County Aeropark. In this regard, it has been suggested that afreight forwarding operation could employ as many as 200. These newemployees would be using Horsepond Road on a daily basis. In addition tothese employees, truck traffic used to load and unload the air cargo aircraftwould be using the road. One B 747 aircraft can fill five or more semi tractortrailers. Similarly, the addition of proposed Allegiant Airline service could addup to 300 vehicles during arriving and departing flights. Under the highestvehicle use scenario, all 150 passengers arriving would deplane to theirindividual vehicles, to be replaced by incoming passengers in an equal numberof vehicles. In a worst case scenario, Horsepond Road could be faced with ademand of over 500 vehicles in its peak hour. The actual use would likely beless, but it could still exceed the current minimum roadway capacity of 200vehicles per hour.

Delaware State Aviation System Plan UpdateInterim Report – Appendix 4 A August 2011
R.A. Wiedemann & Associates, Inc. A 15
Potential Airline Service at New Castle Airport: If airline service is developed atNew Castle Airport, the surface access system would have to be upgraded andexpanded to meet increased demand levels. A 2009 statewide air service studyestimated that the size of potential airline passenger demand capture at NewCastle Airport was about 640,000. This demand would require a significantaccess system and internal parking capacity above current levels. Using theguidance from FAA Advisory Circular 150/5360 13 (with Changes), Planning andDesign Guidance For Airport Terminal Facilities, a total of approximately 2,300parking spaces would be needed to accommodate annual passengerenplanement levels of 640,000. This parking is in addition to the existing airportparking needs. Should airline service begin at New Castle Airport, the DRBA willdevelop a terminal area on the south side, off Old Churchmans Road. A newaccess configuration will be developed off Churchmans Road to service the newfacility and the parking needs. There have been discussions that if a parkingstructure were developed for the new shopping area in that location, apotential sharing of parking space may be arranged. Figure A 6 presents oneoption under consideration in the form of a schematic drawing of the newairline terminal area.
Figure A 6 – Airline Terminal and Access Option

Delaware State Aviation System Plan UpdateInterim Report – Appendix 4 A August 2011
R.A. Wiedemann & Associates, Inc. A 16
Expansion of Summit Airport’s Workforce: The potential expansion of SummitAirport’s workforce could mean a significant increase in traffic entering andexiting the airport. Potential growth from 100 to 600 employees with a decadehas been mentioned as possible. This new traffic would require either anadditional set of entranceways on the southern portion of the terminal area oran internal access road to a central entrance/exit. If a central entrancewaywere developed, it is likely that a stoplight would be needed in order tofacilitate left turns on U.S. 301. The U.S. Department of Transportation Manualof Uniform Traffic Control Devices specifies criteria (call warrants) to helpensure that traffic lights are only installed where they will do more good thanharm. At least two of the nine warrants listed in the Manual may be found toapply to the Summit situation: Peak Hour Volume or Delay, and CrashExperience. The peak hour warrant is only applied in unusual cases such as ashift change at an office park, factory, or a school, where large numbers ofvehicles are attracted or discharged in a short period of time. During thesetimes, the side road traffic suffers undue delay when entering or crossing themajor street. The other case would be contingent upon the safety record of theairport entrance. If vehicle crashes increase over time at that location, it mayjustify the location of a traffic light.

Delaware State Aviation System Plan UpdateInterim Report – Appendix 4 A August 2011
R.A. Wiedemann & Associates, Inc. A 17
4. FINDINGS AND CONCLUSIONS
HE EVALUATION OF SURFACE ACCESS FOR SYSTEM airports in Delaware has yielded resultsregarding needed actions over the planning period to accommodate increased demand.In addition, possible development of aviation infrastructure to accommodate more
aviation activity such as airline passenger traffic, air cargo activity, and increased aircraftmaintenance and repair operations is likely to impact the need for additional surface accesscapacity. These topics have been addressed in this analysis and the following findings andconclusions have been reached:
Civil Air Terminal: If there is no further development of the Civil Air Terminal,its existing roadway system will be adequate for the long term future. However,if the facility is developed either for airline service or air cargo aircraftaccommodation, significant changes will be needed in the future:
If airline service is initiated, a potential of 300 peak hour vehicles arepossible for Horsepond Road. This will hasten the need for capacity reliefimprovements including turn lanes, road widening, and increased parkingarea at the CAT. A minimum of 150 new auto parking spaces will be neededif airline service materializes.If domestic air cargo service is initiated, the roadway system connecting theCAT to State Route 1 will need to be improved for truck traffic. This wouldinclude possible widening and strengthening of the roadways connecting toRoute 1 (Horsepond Road and Lafferty Lane).
Delaware Airpark: No significant changes to the surface access are anticipatedor required for this airport.
The current AADT for State Route is 5,262, with a projected total of 7,700AADT by 2040. This increase is still well below the roadway capacity.On airport traffic levels are only anticipated to grow to 43 peak hourvehicles by 2030, which is roughly 22 percent of the entrance roadwaycapacity.At least 20 more airport auto parking spaces will be needed by 2030.
New Castle Airport: At some point in the future, airline service is likely to beinitiated at New Castle Airport due to overcrowding at PhiladelphiaInternational. If this occurs prior to 2030, new surface access improvementswill be needed at the airport:
Redevelopment of Old Churchmans Road: Should an airline terminal belocated off Old Churchmans Road, the roadway will be closed as a throughstreet and access to the new terminal will only be available via ChurchmansRoad (see Figure A 6 shown previously).

Delaware State Aviation System Plan UpdateInterim Report – Appendix 4 A August 2011
R.A. Wiedemann & Associates, Inc. A 18
Auto parking for a major airline service is not adequate at the airport. Withonly 1,000 parking spaces in the current terminal area, an additional 2,300would be needed adjacent to the new terminal area (shuttling parking trafficto the existing parking areas at this scale is not cost effective).The existing turn signal on U.S. 40/DuPont Highway at the terminal entranceis adequate to accommodate traffic accessing the general aviation functionsin the terminal area.Current infrastructure (terminal and hangar buildings) will limit the growthof on airport traffic in the existing terminal area. As such, the currentconfigurations of traffic in that area (Flight Safety, FAA Tower, generalaviation terminal, and Dassault) will not significantly degrade over theplanning period.Rail access to the airport is considered impractical at this time. The currentlocations of rail lines to the north of the airport cannot be connected to theexisting or future terminal areas without significant capital expenditures.Public transportation in the form of bus service will continue to connect theairport to downtown Wilmington.
Summit Airport: Summit Airport will continue to grow its maintenance,avionics, and aircraft retrofitting businesses, along with its governmentcontracts. As such, the airport is anticipated to increase its employment baseover the planning period. Airport management has estimated that this growthmay create up to 600 new jobs. Given the new employment numbers, surfaceaccess to the airport may need improvement:
A traffic light may be needed at the main airport entrance in theintermediate planning timeframe to accommodate peak period traffic thatwould occur during the start and end of work shifts at the airport.Additional on airport parking spaces will be needed. It is anticipated that atleast 500 more spaces would be required as the number of employees andvisitors to the airport increase. These spaces may be developed inassociation with new hangars that are planned for the south end of Runway17 35, with a connecting roadway inside the airport that leads to the mainentranceway.
Sussex County Airport: Sussex County Airport has two primary surface accessneeds:
Sussex County Airport’s runway expansion program will require therelocation of a portion of U.S. 9T (Park Avenue), changing the intersectionlocation of S. Bedford Street and Park Avenue. That relocation will requireat least $9 million and a purpose and need generated by the runwayexpansion project. Figure A 5 (presented earlier) shows the plannedrelocation. Prior to that project, the FAA must sign off on the extension of

Delaware State Aviation System Plan UpdateInterim Report – Appendix 4 A August 2011
R.A. Wiedemann & Associates, Inc. A 19
Runway 4 22 to 6,000 feet. This sign off is based on demand for largeaircraft reaching 500 annual itinerant operations for these large criticalaircraft types.With only 40 parking spaces at the terminal building, airport parking isconstrained and use of overflow parking at the Sussex County EmergencyOperations Center has been one option. There are 60 auto parking spaces atthe EOC. However, should a real emergency occur, these parking spacesmay be needed for law enforcement and other emergency personnel.Planning for additional airport parking should be undertaken.Highway access from S. Railroad Street and from U.S. Route 9 via AirportRoad is adequate to serve the airport through the long term future.
Other Public Use System Airports: Chandelle Estates, Chorman Airport, Jenkins,Laurel, and Smyrna Airport are not anticipated to create significant surfaceaccess demand throughout the period. Only one airport has significantexpansion plans – Chorman Airport. That facility has received approval fromKent County for the development of up to 136 T hangar units. If developed, theadditional hangar units will attract pilots and passengers to the airport, but notat levels that would require any surface access improvements or changes.


Delaware State Aviation System Plan UpdateChapter 5 – Interim Report September 2012
R.A. Wiedemann & Associates, Inc. 5 1
IDENTIFICATION OF AVIATIONSYSTEM ALTERNATIVES
HE STATE AVIATION SYSTEM PLAN UPDATE (PHASES I and II) is taking a fresh look at theclassifications of airports and heliports and providing guidelines for their orderlydevelopment. The study serves as a forum for public input to the State aviation policy
decision process. Review and comment from the Aviation Advisory Committee, combined withthe input from State and local agencies and interested general public are important factors indeciding the course of aviation priorities and issues. When completed, the system plan willgenerate valuable management information tools, general aviation airport security plans, andlegislative recommendations. In Phase I of the State Aviation System Plan, four work elementswere undertaken:
Element 1: Issues, Goals, and ObjectivesElement 2: Analysis of Existing SystemElement 3: Forecast of Aviation DemandElement 4: Demand/Capacity & Aviation System Needs
Phase II of the State System Plan addresses the following questions:
How has the most recent recession impacted aviation in Delaware?Can the long term system be sustained with fewer FAA dollars?What are the implications of full (unrestricted) joint use at Dover Air Force Base andhow would that impact the public use airport system?What are the implications of scheduled airline passenger service in central Delaware?Is civilian air cargo service possible in Delaware?What impact would the implementation of green technology have on system airports?What types of aviation subsystems require State regulation, guidance, policy input, orfinancing?What are the financial implications of the recommended plan?How is the recommended plan implemented?
Key issues that could change the aviation system in Delaware include the possible unrestrictedjoint use of Dover AFB, the development of a civilian air cargo hub at the Civil Air Terminal atDover AFB, the loss of one or more private airports, and the removal of Summit Airport fromthe FAA funding program. Also, even though Allegiant Airlines has selected Salisbury, MD toinitiate service to the Orlando, FL area, Dover is still in the running as another outlet or locationfor Allegiant service.

Delaware State Aviation System Plan UpdateChapter 5 – Interim Report September 2012
R.A. Wiedemann & Associates, Inc. 5 2
To fully examine the aviation alternatives and issues facing Delaware aviation, the Phase II workscope is composed of six primary work elements including:
Element 5: Identification of Aviation System AlternativesElement 6: Evaluation of Aviation System AlternativesElement 7: Selection and Description of Recommended SystemElement 8: Financial and Implementation PlanElement 9: Special Study ProductsElement 10: Coordination and Documentation
Element 5 Identification of Aviation System Alternatives is based upon the forecasts ofdemand and the system requirements established in the preceding work phases. Includedamong the concepts which are considered as alternatives are:
The Baseline Alternative (Status Quo)A Contracted System of Airports AlternativeA Contingency Aviation System Alternative
System requirements, based on the demand and capacity analyses, were established for theairports included in the proposed alternative systems prior to subjecting them to evaluation.For each alternative, the number of based aircraft and operations were determined for eachairport as a part of the identification process (Table 5 1).

Delaware State Aviation System Plan UpdateChapter 5 – Interim Report September 2012
R.A. Wiedemann & Associates, Inc. 5 3
1. BACKGROUND
N FORMULATING ALTERNATIVES, IT IS IMPORTANT TO review and use the information gathered in thedata collection effort. In this regard, the Phase I study performed a detailed analysis of theaviation system that answered the following questions:
What are the most pressing aviation issues facing decision makers in Delaware?What are the State's overall goals with respect to aviation?What is the present make up of the aviation system in Delaware?In the future, what will aviation activity be like in the State?What are the physical development needs of the system?
Since the previous aviation system plan, several new issues have arisen that will change thefocus of the present planning. These are described below.
1.1 Delaware’s Most Pressing Aviation Issues:
The most pressing aviation issues identified in Phase I of this study included the following:
Future Airport Funding ShortfallsFAA, State, LocalNeed for Strategic Plan of Economic Sustainability
Civil Air Terminal DevelopmentAir CargoSchedule Airline Service
Airport Security ProgramsDelaware Airpark ExpansionSummit Airport ExpansionMitigation or Removal of Airport Airspace ObstructionsEconomic Impacts of Aviation in Delaware
Airport Community Value Applied to Recommended PlanRecommendations Prioritized by Economic Sustainability
Protection/Development of Non NPIAS AirportsAirport/Community Land Use CompatibilityCoordination of SASPU with Other Transportation Planning & the PublicFuture of Military Aviation in DelawareReliable Airport Operations CountsGreen Technology Impacts

Delaware State Aviation System Plan UpdateChapter 5 – Interim Report September 2012
R.A. Wiedemann & Associates, Inc. 5 4
Since the release of the Phase I study, two other important issues have arisen that willimpact the aviation system and the development of alternatives for the Phase II study.These issues include the following:Potential Loss of Privately Owned Airports to the Public Use SystemPotential Full (Unrestricted) Joint Use of Dover AFB
1.2 Delaware’s Overall Aviation Goal:
Aviation Goal: To enhance Delaware's economic development by fostering andpromoting a safe and efficient aviation system for the movement of goods, services, andpeople and to encourage and promote aviation and aviation safety.
1.3 Delaware’s Existing Airport System:
Airport Facilities: Currently, there are nine (9) public use airports and one (1) jointmilitary civilian use airport in the State, along with one (1) public use helistop. Of theseeleven (11) aviation facilities, five (5) are privately owned. Eight (8) have pavedsurfaces, while the remaining three (3) have turf surfaces.
Aeronautical Activity: Historical levels of aviation activity have been stable in Delawarewith areas of slow growth. Total existing based aircraft = 437; total annual aircraftoperations = 197,600.
Airspace Structure and Navaids: Low activity levels indicate that significant airspacecapacity is available for the future. New Castle Airport has the greatest airspacechallenges due to its proximity to the Class B airspace associated with PhiladelphiaInternational. These and other airspace issues will be examined in the Evaluation ofAlternatives.
Surface Transportation: The present interaction of the highway and airport system isadequate. However, estimates of future aviation related surface traffic will becompared to capacities of airport access points.
Environmental Considerations: For airport development to occur, planners need to beaware of the extensive amount of wetlands in and around Delaware airports. Anotherenvironmental concern includes the fact that all of Delaware is classified as nonattainment for ozone standards.

Delaware State Aviation System Plan UpdateChapter 5 – Interim Report September 2012
R.A. Wiedemann & Associates, Inc. 5 5
1.4 Delaware Aviation Activity in the Future:
Forecast Aviation Activity: Total based aircraft are forecast to grow from 437 in 2010 to576 by the year 2030. Aircraft operations are anticipated to grow from 197,600 to261,100 during the same period. There are no airfield operational capacity constraintsanticipated during the planning period. However, there may be constraints to the sizeand type of aircraft that desire to use certain airports in Delaware because of limitedrunway lengths and strengths.
1.5 Physical Development Needs of the System:
Airport upgrades and facility needs based on these criteria affect 9 of the 10 public use airportscarried through this analysis. Of these airports, 5 have runway or taxiway upgrades listed asneeded, while 9 airports have landside improvement needs listed. For airfield improvements,suggested runway extensions or upgrades were made for the following Delaware airports:
Chandelle EstatesChorman AirportDelaware AirparkSummit AirportSussex County
Landside improvements focused mostly upon aircraft storage hangar and apron areaimprovements at various system airports. In this regard, a total 31,000 square feet of terminalspace, 30,600 square feet of conventional hangar space, 178 T hangar units, and almost 12,600square yards of apron area are needed at system airports within the planning horizon.
From the overall analysis, it was shown that no airfield demand/capacity shortfalls are expectedto develop over the planning period. Only New Castle Airport came within 52 percent of itsestimated airfield capacity. The aviation system requirements estimated for each airportrepresent normal improvements to provide safety and meet demand increases over theplanning period. The focus of the landside analysis was upon the passenger and aircraftprocessing capabilities of the individual airports.

Delaware State Aviation System Plan UpdateChapter 5 – Interim Report September 2012
R.A. Wiedemann & Associates, Inc. 5 6
2. IDENTIFICATION OF ALTERNATIVES
ASED UPON THE FORECASTS OF DEMAND AND the system requirements established in thepreceding work phases, three alternative systems were identified for further evaluation.Concepts of which were considered for development as alternatives included:
The Baseline Alternative: This alternative is based on an analysis of the adequacy of theexisting aviation system. It assumes a status quo scenario where no changes other thanthose already planned are included.
A Contracted System of Airports Alternative: This alternative considers potentialclosures of privately owned airports and associated impacts.
A Contingency Aviation System Alternative: This alternative considers the potentialimpacts of several possible occurrences that could significantly change the aviationsystem in Delaware. These impacts revolve mostly around potential changes at DoverAFB, but also include changes to public use status of some privately owned airports.
For each alternative, the number of based aircraft and operations is presented in Table 5 1.
Table 5 1 Year 2030 Forecast GA Demand for Each Alternative
Aviation Facility Alternative 1 Alternative 2 Alternative 3
Based A/C Operations Based A/C Operations Based A/C Operations
Chandelle Estates 32 4,200 0 0 16 2,100
Chorman Airport 25 17,300 0 0 25 17,300
Delaware Airpark 74 29,900 153 44,700 89 30,300
DELDOT Helistop 0 50 0 50 0 50
Dover AFB1 0 1,400 0 0 21 5,500
Jenkins Airport 26 1,800 0 0 13 900
Laurel Airport 18 11,600 0 0 18 11,600
New Castle Airport 249 92,100 249 93,150 249 92,100
Smyrna Airport 13 3,000 0 0 6 1,500
1 Represents general aviation activity only.

Delaware State Aviation System Plan UpdateChapter 5 – Interim Report September 2012
R.A. Wiedemann & Associates, Inc. 5 7
Table 5 1 Year 2030 Forecast GA Demand for Each Alternative
Aviation Facility Alternative 1 Alternative 2 Alternative 3
Based A/C Operations Based A/C Operations Based A/C OperationsSummit Airport 57 55,000 57 55,000 57 55,000
Sussex County Airport 82 44,800 117 68,250 82 44,800
GRAND TOTALS 576 261,150 576 261,150 576 261,150
This distribution of demand is based on the Forecast of Aviation Demand (Chapter 3 of Phase1). Each alternative system has the same number of based aircraft and the same number ofoperations. However, the assumptions about the availability of facilities in each option dictatedthe demand distribution. Each alternative system is described in the following sections.
2.1 Alternative 1 – No Action (Adequacy of Existing System)
Alternative 1 is called the “No Action” Alternative because it examines the adequacy of theexisting system without changes or improvements (see Figure 5 1). The alternative serves as abaseline comparison to each of the “action” alternatives (2 and 3) and subsystems.
The adequacy of the existing system of airports to meet the State's air transportation demandsis determined by relating the findings concerning the needed number, type, and generallocation of airports to the inventory of existing airports. In this determination, consideration isgiven to the estimated aircraft processing capacity of the existing airports, the compatibility ofthe existing airports with the surrounding community in terms of environmental factors,existing and planned land use and development programs, and the adequacy of existing andplanned surface access.
It should be noted that Alternative 1 may represent the highest utilization of some privatelyowned, public use airports in Delaware. That is, the status quo may actually be optimistic,relative to the preservation of all privately owned, public use airports in the State. As describedbelow, Alternative 2 presents a contracted option, while Alternative 3 shows in the impact of anumber of possible future scenarios.

Delaware State Aviation System Plan UpdateChapter 5 – Interim Report September 2012
R.A. Wiedemann & Associates, Inc. 5 8
2.2 Alternative 2 – Contracted System of Airports
Alternative 2 is called the “Contracted System of Airports” because it examines the impactscreated with the loss of certain privately owned airports in the State. Under this alternative, 5of the 10 existing system airports were assumed to close by the year 2030 for various reasons.In addition, it was assumed that no joint use of Dover AFB would be permitted due to securityor other concerns. Alternative 3 focuses on a core system of airports needed to accommodateaviation demand in the State. This alternative is also considered a "worst case" scenario since itassesses the capability of a contracted system of airports to meet the long term Delawareaviation needs.
Economic and land development pressures have served to close many privately owned airportsacross the nation. Delaware is not immune from that process. This alternative examines thepotential impacts of losing privately owned airports in Delaware including: Chandelle Estates,Chorman, Jenkins, Smyrna, and Laurel. It was assumed that privately owned Summit Airportwould survive due to its existing business model, funding, and planned facility expansion.Summit Airport is owned by Greenwich AeroGroup, a large aircraft services company with morethan 650 employees.
It was assumed that Dover AFB would not be available for civil aviation use under thisalternative. As such, many of the business jet operations that would have taken place at theCivil Air Terminal would be transferred to other airports. The closure to civil aviation would notimpact the potential air cargo operation at the CAT, but it would impact the two NASCARweekends each year. In this regard, many of the race teams rely upon air access to DoverDowns via Dover AFB. With increasing competition from other venues, the loss of thisconvenient access point could trigger a cutback in NASCAR activities. Thus, this alternative willexamine the impacts of the potential closure of Dover AFB to civil aviation.
Figure 5 3 presents a graphic depiction of Alternative 3 while Table 5 1 (presented earlier)shows the forecast based aircraft and operations associated with each system airport. Asshown, there are a number of transfers of based aircraft from the airports that may close to theremaining airports in the system. Most of these transfers were made based upon geographicproximity of existing airports to future airports.

Delaware State Aviation System Plan UpdateChapter 5 – Interim Report September 2012
R.A. Wiedemann & Associates, Inc. 5 9

Delaware State Aviation System Plan UpdateChapter 5 – Interim Report September 2012
R.A. Wiedemann & Associates, Inc. 5 10

Delaware State Aviation System Plan UpdateChapter 5 – Interim Report September 2012
R.A. Wiedemann & Associates, Inc. 5 11
2.3 Alternative 3 – Contingency Aviation System
Alternative 3 is called the “Contingency Aviation System” because it considers the potentialimpacts of several possible occurrences that could significantly change the aviation system inDelaware. These impacts revolve mostly around potential changes at Dover AFB, but alsoinclude changes to public use status of some privately owned airports. Contingency changesthat were factored into the analysis included the following:
Full Joint Use of Dover AFB: There is some talk about a new round of Base Realignment& Closure (BRAC) for Dover AFB for 2015 or before. These talks center on the possibilityof consolidating the role of Dover AFB with that of McGuire AFB in New Jersey. Underthe scenario, McGuire would gain the heavy lift cargo mission from Dover, while Dovermay keep the mortuary and its mission.
There is also the possibility of future full joint use of Dover AFB, without a BRAC. Thiswould permit full civilian use of the facility, while at the same time, keep the heavylift mission. Such a circumstance would favor the development of the CAT forsupplemental air cargo carrier overnight parking.
Loss of Public Use status of Chandelle Estates, Jenkins, and Smyrna.Loss of NPIAS funding eligibility of Summit Airport.Expansion of Sussex County Airport primary runway to 6,000 feet.
Of significance in the potential BRAC of Dover AFB are the civilian options that becomeavailable with that occurrence. The potential relocation of the Dover AFB mission could alsojeopardize the current attempt to develop the Civil Air Terminal ramp for overnightsupplemental cargo carrier aircraft. In this regard, any loss of mission at Dover AFB will havedire impacts on local employment, income, total spending and tax collections in centralDelaware. However, one potential benefit to the civilian general aviation system would be thepossible full joint use of the Base (no prior permission requirement, no cap on civilianoperations). Such a situation would require rethinking of the need for an expanded DelawareAirpark, as all of those operations and more could be accommodated by the Dover AFB runwaysystem.
It is possible that in the future, full joint use of Dover AFB could be achieved (similar toCharleston, SC), without a BRAC. If that were to occur, the benefits of developing the CAT for aircargo carrier overnight parking would still have a demand. It would also permit civilian use ofthe facility, thereby decreasing the need for expansion of Delaware Airpark. In addition, theloss of public use status of Chandelle Estates, Jenkins, and Smyrna would likely drive somebased aircraft to a newly full joint use facility such as the CAT at Dover AFB. Other possible usesfor the CAT could occur with or without the BRAC, including airline passenger service andcivilian air cargo operations. All of these contingencies are examined in the evaluation ofaviation system alternatives (Chapter 6).

Delaware State Aviation System Plan UpdateChapter 5 – Interim Report September 2012
R.A. Wiedemann & Associates, Inc. 5 12

Delaware State Aviation System Plan UpdateChapter 5 – Interim Report September 2012
R.A. Wiedemann & Associates, Inc. 5 12


Delaware State Aviation System Plan UpdateChapter 6 – Interim Report September 2012
R.A. Wiedemann & Associates, Inc. 6 1
EVALUATION OF ALTERNATIVES
1. INTRODUCTION
DENTIFYING POTENTIAL ALTERNATIVE SOLUTIONS TO DELAWARE’S LONG term aviation needs was thefirst step toward developing an updated detailed plan of recommended action. Thatprocess, completed in Chapter 5, identified three primary alternatives for further review.
The second step is to analyze these alternatives, using a number of criteria and evaluatingthem relative to each other. This chapter presents a summary of the methods, analysis, andfindings of the evaluation process.
As an overview, the evaluation of alternatives used a multiple criteria process to analyze andevaluate the various alternatives. Each criterion was applied to each alternative and scored ina comparative ranking procedure. This approach permitted a direct comparison of alternativesin each area of evaluation. Criteria used in the evaluation process included the followinggeneral factors:
Ability to Serve Forecast Demand: How well will each alternative accommodateprojected demand? This includes general aviation activity and potential airline and aircargo demand. Alternative 3 will test the limits of this evaluation criterion relative tothe need for additional facilities in Central Delaware.
Impact of Airspace Obstructions: This criterion was included because the State has aninterest in the potential removal of obstructions via State law and regulations thatauthorize the removal of airspace obstructions from public use airports in Delaware.The alternatives impact the required funding for obstruction removal by virtue ofhaving different numbers of public use airports included in each.
Impact on Surface Transportation System: The evaluation uses previous work onsurface transportation to determine if the new alternatives have any significant impactor deviation from previous analyses.
Environmental & Land Use Compatibility: The impact of airport operations onenvironmental and land use compatibility will be measured indirectly by determiningaverage real estate values in the airport area as compared with other areas of acommunity that are not impacted by airport noise.
Development Costs: The cost of each alternative will be estimated in order todetermine which is the most cost effective. These costs must be weighed against thebenefits provided by each alternative.

Delaware State Aviation System Plan UpdateChapter 6 – Interim Report September 2012
R.A. Wiedemann & Associates, Inc. 6 2
Impact of Contingencies: Because there are a number of contingencies described inAlternative 3, there are several potential impacts to Delaware’s aviation system thatshould be addressed individually. This criterion examines the potential contingenciesthat could happen at Dover AFB that are not measured against Alternatives 1 or 2.
A composite ranking of the alternatives, based upon all criteria and using a matrix format toarray information was prepared. As a result of this approach, the original alternatives werenarrowed to those attributes in each alternative that have the most potential for success.

Delaware State Aviation System Plan UpdateChapter 6 – Interim Report September 2012
R.A. Wiedemann & Associates, Inc. 6 3
2. EVALUATION OF ABILITY TO SERVE FORECAST DEMAND
ACH OF THE ALTERNATIVES WAS EVALUATED TO determine its ability to meet forecast demandlevels within accepted performance standards. These evaluations were performed on afacility by facility basis and results were aggregated to permit comparisons at the
systems level. Included among the material analyzed in determining this overall ability tomeet forecast demand levels were the number, types, and quantities of airport facilitiesneeded to serve aviation demand for each alternative.
One measure of the ability to serve forecast aviation demand is the service capability of eachalternative airport system. In this regard, service capability can be identified for two separatecomponents of the airport: airfield and landside.
Airfield Service Capability: This is the ability of Delaware airports to accommodateforecast demand operations depicted in each alternative. Deficiencies in airfieldcapacity would be remedied in each alternative by the conceptual addition of runwaysor taxiways where needed.
Landside Service Capability: This is the ability of Delaware airports to process aircraftand passengers at the hangars and terminal areas of each airport. Deficiencies inlandside capacity would be remedied in each alternative by the conceptual addition ofapron area, T hangars, conventional hangars, terminal building space, and automobileparking space.
It should be noted that privately owned, public use airports were included in the analysis sincethey are eligible for some State funding (obstruction removal and other project funding).
2.1 Airfield Service Capability
In Chapter 4 of the Phase I study, a demand/capacity analysis and facility needs analysis wasperformed for the existing system of airports. When loaded with forecast demand, theneeded facilities were identified and quantified for each airport. Chapter 5 identified threeprimary alternatives for further review and analysis. Alternative 1 is called the “Baseline”Alternative because it examines the adequacy of the existing system. It assumes a status quoscenario where no changes other than those already planned are included. This alternativeserves as a baseline comparison to each of the “action” alternatives (2 and 3). Alternative 1has the following assumptions:
No changes are made to the existing GA system assets in terms of capacity.Delaware Airpark will construct a 4,200' X 75' replacement runway with a full paralleltaxiway.

Delaware State Aviation System Plan UpdateChapter 6 – Interim Report September 2012
R.A. Wiedemann & Associates, Inc. 6 4
Sussex County Airport will expand its primary runway to 5,500 feet.
Alternative 2 is called the “Contracted System of Airports” because it examines the impactscreated with the loss of certain privately owned airports in the State. Alternative 2 focuses ona core system of airports needed to accommodate aviation demand in the State. Thisalternative is also considered a "worst case" scenario since it assesses the capability of acontracted system of airports to meet the long term Delaware aviation needs. Assumptionsused in Alternative 2 included the following:
Chandelle Estates, Chorman, Jenkins, Laurel, and Smyrna are assumed to close by 2030for various reasons.Dover AFB (CAT) will no longer be a joint use facility due to unforeseen security issuesor other concerns. The 1,400 GA itinerant operations at the CAT move to (75%) NewCastle and (25%) to Sussex County.Delaware Airpark will construct a 5,500 X 75' replacement runway with a full paralleltaxiway. Delaware Airpark absorbs the demand from Chandelle Estates, Jenkins,Smyrna, and 32 percent of Chorman’s aircraft and operations.Expansion of Sussex County Airport's primary runway to 6,000 feet. Sussex Countyabsorbs Laurel Airport's demand and 68 percent of aircraft and operations fromChorman.
Alternative 3 is called the “Contingency Aviation System” because it considers the potentialimpacts of several possible occurrences that could significantly change the aviation system inDelaware. These impacts revolve mostly around potential changes at Dover AFB, but alsoinclude changes to public use status of some privately owned airports.
Full Joint Use of Dover AFB: A new round of Base Realignment & Closure (BRAC) forDover AFB for 2015 or before would consolidate the role of Dover AFB with that ofMcGuire AFB in New Jersey.Unrestricted joint use of Dover AFB will change the ASV of the CAT from 13,500operations to 230,000 operations.
There is also the possibility of future full joint use of Dover AFB, without a BRAC.This would permit full civilian use of the facility, while at the same time, keep theheavy lift mission.
Loss of Public Use status of Chandelle Estates, Jenkins, and Smyrna. Half of eachairport's operations and based aircraft are relocated to nearby airports.Expansion of Sussex County Airport primary runway to 6,000 feet.Delaware Airpark will construct a 4,200' X 75' replacement runway with a full paralleltaxiway.Chorman Airport will construct a 3,600' X 60' runway with full parallel taxiway.Summit Airport will extend their primary runway to 5,320’ but is expected to loseNPIAS funding eligibility prior to developing the extension.

Delaware State Aviation System Plan UpdateChapter 6 – Interim Report September 2012
R.A. Wiedemann & Associates, Inc. 6 5
The airfield demand/capacity capabilities for each of the airports by alternative are shown inTable 6 1.
Table 6 1 Airfield Demand/Capacity Comparisons
Alternative/Airport Annual ServiceVolume
Year 2030Demand
Percent ofCapacity
Annual Delay(Hours)
Alternative 1Chandelle Estates 46,400 4,200 9% 0Chorman Airport 53,100 17,300 33% 66Delaware Airpark 171,300 29,900 17% 35DelDOT Helistop 5,000 50 1% 0Dover AFB 13,500 1,400 10% N/AJenkins Airport 24,800 1,800 7% 0Laurel Airport 32,200 11,600 36% 50New Castle Airport 194,000 101,000 52% 707Smyrna Airport 30,000 3,000 10% 0Summit Airport 170,800 55,100 32% 202Sussex County Airport 174,500 44,900 26% 120Total For Alt. 1 915,600 270,250 30% 1,180
Alternative 2Delaware Airpark 171,300 44,400 26% 118DelDOT Helistop 5,000 50 1% 0New Castle Airport 194,000 102,050 53% 731Summit Airport 170,800 55,100 32% 202Sussex County Airport 174,500 68,650 39% 332Total For Alt. 2 715,600 270,250 38% 1,384
Alternative 3Chorman Airport 53,100 17,300 33% 66Delaware Airpark 171,300 30,395 18% 41DelDOT Helistop 5,000 50 1% 0Dover AFB 230,000 5,5201 2% N/ALaurel Airport 32,200 11,600 36% 50New Castle Airport 194,000 101,000 52% 707Summit Airport 170,800 55,100 32% 202Sussex County Airport 174,500 44,900 26% 120Total For Alt. 3 1,030,900 265,865 28%2 1,1861GA operations only2Although future military use is unknown at Dover AFB, this analysis assumes 24,000 military operations in theyear 2030 to calculate the percent of capacity used for the entire system in Alternative 3.
As shown none of the public use airports are projected to reach 60 percent of their capacity by2030. On an airport level, New Castle uses the most of its available capacity throughout all ofthe Alternatives and has the highest amounts of delay. Summit and Sussex County Airports willexperience the next highest amounts of delay depending on Alternative.

Delaware State Aviation System Plan UpdateChapter 6 – Interim Report September 2012
R.A. Wiedemann & Associates, Inc. 6 6
The 2030 state wide demand in Alternative 1 and 2 are the same, while Alternative 3 assumesthat Chandelle Estates, Jenkins, and Smyrna are no longer public use facilities and half of eachairport's operations and based aircraft relocate to nearby airports. This decreases the demandin Alternative 3 by 4,385 operations and 35 aircraft (Table 6 3).
Table 6 2 Airfield Demand/Capacity Comparisons, by AlternativeAlternative 1 Alternative 2 Alternative 3
Based Aircraft 576 576 5412030 Demand 270,250 270,250 265,865Annual Service Volume 915,600 715,600 1,030,900Percent of Capacity 30% 38% 28%1
Annual Delay (Hours) 1,180 1,384 1,186Surplus Capacity 645,350 445,350 789,035Percent of Available Capacity 70% 62% 72%1Although future military use is unknown at Dover AFB, this analysis assumes 24,000 military operations in theyear 2030 to calculate the percent of capacity used for the entire system in Alternative 3
As shown, Alternative 3 has the greatest surplus airfield capacity (789,035 operations),followed by Alternative 1 (645,350 operations), and then by Alternative 2 (445,350operations).
Alternative 1 has the second largest Annual Service Volume capacity of all the alternatives.Alternative 3 has the most Capacity because it assumes that full joint use of Dover AFB isachieved which changes the Annual Service Volume of Dover AFB in Alternative 1 from 13,500operations to 230,000 operations.
Alternative 2 shows the largest percent of capacity used and the largest annual delay due tothe assumptions that 5 of the 10 system airports close due to various reasons by 2030 and thatDover AFB will no longer allow public operations. Because of this, demand at each of theclosed airports was reallocated to other airports which increases their capacity use and in turnincreases their delay. Table 6 3 shows the proposed runway improvements to system airportsby the year 2030, while Table 6 4 shows the proposed additional airside facilities for the sametime period.

Delaware State Aviation System Plan UpdateChapter 6 – Interim Report September 2012
R.A. Wiedemann & Associates, Inc. 6 7
Table 6 3 Runway Improvements to System Airports: Year 2030
Airport NameExisting Primary Runway
DimensionsFuture Primary Runway
Dimensions Dimensional Upgrade
Alternative 1
Chandelle Estates 2,533' x 28' 2,533' x 28' None
Chorman Airport 3,588' x 40' 3,588' x 40' None
Delaware Airpark 3,582' x 60' 4,200' x 75' New Runway and FullParallel Taxiway
Dover AFB 9,602’ x 200' 9,602’ x 200’ None
Jenkins Airport1 2,842' x 70' 2,842' x 70' None
Laurel Airport1 3,175' x 270' 3,175' x 270' None
New Castle Airport 7,012' x 150' 7,012' x 150' None
Smyrna Airport1 2,600' x 125' 2,600' x 125' None
Summit Airport 4,488' x 65' 4,488' x 65' None
Sussex County Airport 5,000' x 150' 5,500' x 150' 500' in length
Turf Subtotal 153,466 S.Y. 153,466 S.Y. 0
Pavement Subtotal 493,698 S.Y. 502,031 S.Y. 58,070 S.Y.2
Total For Alt. 1 647,164 S.Y. 655,497 S.Y. 58,070 S.Y.2
Alternative 2
Delaware Airpark 3,582' x 60' 5,500' x 75' New Runway & Full ParallelTaxiway
New Castle Airport 7,012' x 150' 7,012' x 150' None
Summit Airport 4,488' x 65' 4,488' x 65' None
Sussex County Airport 5,000' x 150' 6,000' x 150' 1,000' in Length & FullParallel Taxiway
Total For Alt. 2 256,493 S.Y. 295,113 S.Y. 85,069 S.Y.2
Alternative 3
Chorman Airport 3,588' x 40' 3,600' x 60' New Runway & ParallelTaxiway
Delaware Airpark 3,582' x 60' 4,200' x 75' New Runway & Full ParallelTaxiway
Dover AFB 9,602’ x 200' 9,602’ x 200' None
Laurel Airport11 3,175' x 270' 3,175' x 270' None
New Castle Airport 7,012' x 150' 7,012' x 150' None
Summit Airport 4,488' x 65' 5,320' x 65' 832’ in Length & FullParallel Taxiway
Sussex County Airport 5,000' x 150' 6,000' x 150' 1,000' in Length & FullParallel Taxiway
Turf Subtotal 95,250 S.Y. 95,250 S.Y. 0

Delaware State Aviation System Plan UpdateChapter 6 – Interim Report September 2012
R.A. Wiedemann & Associates, Inc. 6 8
Table 6 3 Runway Improvements to System Airports: Year 2030
Airport NameExisting Primary Runway
DimensionsFuture Primary Runway
Dimensions Dimensional Upgrade
Pavement Subtotal 485,818 S.Y. 527,667 S.Y. 108,524 S.Y.2
Total For Alt. 3 581,068 S.Y. 622,917 S.Y. 108,524 S.Y.21 Turf runway. 2 Includes additional runway and taxiway extensions.
Table 6 4 Additional Airside Facilities, by Alternative*
Alternative/Airport RunwayLighting VASI/PAPI REIL Runway (S.Y.) Taxiway (S.Y.)
Alternative 1Chandelle Estates 2 REILChorman Airport MIRL 1 VASIDelaware Airpark 2 VASI 2 REIL 35,000 8,626Jenkins Airport 2 REILLaurel Airport 1 REILSussex County Airport 8,333 6,111Total For Alt. 1 1 3 7 43,333 14,737
Alternative 2Delaware Airpark MIRL 2 VASI 2 REIL 45,833 13,681Sussex County Airport MIRL 16,666 8,889
Total For Alt. 2 0 2 2 62,499 22,570
Alternative 3Chorman Airport MIRL 1 VASI 24,000 6,000Delaware Airpark MIRL 2 VASI 2 REIL 35,000 8,626Summit Airport MIRL 6,010 3,333Laurel Airport 1 REILSussex County Airport MIRL 16,666 8,889Total For Alt 3. 1 3 3 81,676 26,848* Only airports that have airside needs are shown for each alternative.
Table 6 5 presents a summary of airside alternative differences for the various facilities. Notshown, but also included in the costs will be the overlay of all pavements with 20 year lifespans.
Table 6 5 – Summary of Incremental Airside Alternative DifferencesAirside Facilities Alternative 1 Alternative 2 Alternative 3Runway (paving) SY 43,333 62,499 81,676Taxiway (paving) SY 14,737 22,570 26,848Runway Lighting (LF) 8,288 6,000 9,632VASI/PAPI 3 2 3REIL 7 2 3LF = Linear Foot

Delaware State Aviation System Plan UpdateChapter 6 – Interim Report September 2012
R.A. Wiedemann & Associates, Inc. 6 9
2.3 Landside Service Capability
The landside service capability refers to the ability of Delaware airports to process aircraft andpassengers at the hangars and terminal areas of each airport. Deficiencies in landside capacitywould be remedied in each alternative by the conceptual addition of apron area, T hangars,conventional hangars, terminal building space, and automobile parking space. Table 6 6presents the additional landside facilities needed for each alternative.
Table 6 6 Additional Landside Facilities
Alternative/Airport Apron Area(SY)
T Hangars(Units)
ConventionalHangar Space
(SF)
TerminalBuilding Space
(SF)
Auto Parking(SY)
Alternative 1Chandelle Estates 1,900 8 0 0 0Chorman Airport 3,700 0 0 500 700Delaware Airpark 0 29 28,900 0 1,050DelDOT Helistop 0 0 0 0 0Dover AFB CAT 63,700 0 0 4,000 3,500Jenkins Airport 0 0 0 500 0Laurel Airport 0 0 0 0 0New Castle Airport 9,900 0 0 0 0Smyrna Airport 0 4 0 0 0Summit Airport 0 9 0 0 7,000Sussex County Airport 0 10 0 0 0Total For Alt. 1 79,200 60 28,900 5,000 12,250
Alternative 2Delaware Airpark 4,678 70 30,500 0 1,050DelDOT Helistop 0 0 0 0 0New Castle Airport 9,900 0 0 0 0Summit Airport 0 9 0 0 7,000Sussex County Airport 0 35 0 0 0
Total For Alt. 2 14,578 114 30,500 0 8,050
Alternative 3Chorman Airport 3,700 0 0 500 700Delaware Airpark 0 44 10,900 0 1,050DelDOT Helistop 0 0 0 0 0Dover AFB CAT 63,700 11 19,600 4,000 3,500Laurel Airport 0 0 0 0 0New Castle Airport 9,900 0 0 0 0Summit Airport 0 9 0 0 7,000Sussex County Airport 0 10 0 0 0Total For Alt 3. 77,300 74 30,500 4,500 12,250

Delaware State Aviation System Plan UpdateChapter 6 – Interim Report September 2012
R.A. Wiedemann & Associates, Inc. 6 10
By way of explanation, in Alternative 3 Chandelle Estates, Jenkins, Smyrna Airport will nolonger be public use airports. A full BRAC of Dover AFB is not the option considered inAlternative 3 facility needs. Rather, the conservative option of full joint military/civilian use isanalyzed. Thus, the CAT would need its planned 63,700 square yards of apron to accommodatecivilian air cargo carrier parking. Table 6 7 presents a summary of the additional landsidefacilities needed, by alternative.
Table 6 7 – Summary of Additional Landside Facilities, by AlternativeAlternative 1 Alternative 2 Alternative 3
Apron Area (SY) 79,200 14,578 77,300T Hangar (Units) 60 114 74Conventional Hangar Space (SF) 28,900 30,500 30,500Terminal Building Space (SF) 5,000 0 4,500Auto Parking (SY) 12,250 8,050 12,250

Delaware State Aviation System Plan UpdateChapter 6 – Interim Report September 2012
R.A. Wiedemann & Associates, Inc. 6 11
3. EVALUATION OF AIRSPACE OBSTRUCTIONS
HE STATE HAS AN INTEREST IN THE potential removal of obstructions via State law andregulations that authorize the removal of airspace obstructions from public use airportsin Delaware. Therefore, this section describes the results of the evaluation of airspace
obstructions for each of the alternatives and is organized to include the following major topics:
Existing Airspace ObstructionsIncremental Changes by AlternativeSummary and Ranking of Airspace Factors
The product of this evaluation was a set of scores for the airports in each alternative whichcould be compared via cost analysis. The alternatives could be ranked according to costs andpotential public sector funding of obstruction removal.
3.1 Existing Airspace Obstructions and Navaids
The object of this analysis is to learn the differences between the impacts of airspaceobstructions and navaids on the aviation system in each alternative. As mentioned in Phase 1of this study, airspace obstructions are defined by FAR Part 77 – Objects Affecting NavigableAirspace. In Delaware, many of the public use airports have obstructions of varying severity.Some are lighted for visual reference and avoidance at night. In other cases, runway thresholdshave been displaced to permit obstruction clearance in the approach slope of landing aircraft.Other obstructions simply exist and must be avoided by pilots.
Chapter 2, Section 4 of this report contains an inventory of airspace obstructions for eachpublic use airport in Delaware. Rather than repeat those obstructions here, they areincorporated into this analysis by reference.
Perhaps the easiest method of summarizing the impacts of the need for obstruction removalat existing public use airports is to present the costs of their removal. This provides a universalcomparison factor that is applicable between alternatives, without having to compare theindividual obstructions to one another. In previous system planning work, costs were assignedto the removal of obstructions at existing public use airports. Unit costs for obstructionremoval were developed as shown in Table 6 8.
Table 6 8 Estimated Removal CostsWork Description CostLighting Obstruction $1,700Power Lines Case by Case BasisClearing/Grubbing/Removal $14,000/ Acre

Delaware State Aviation System Plan UpdateChapter 6 – Interim Report September 2012
R.A. Wiedemann & Associates, Inc. 6 12
Table 6 8 Estimated Removal CostsOff Airport PropertyCost of Easement Per Acre $17,000Removal of Tree in Field $2,000Removal of Tree in Yard $10,000On Airport PropertyRemoval of Tree $500
Based on these cost assumptions, the following obstruction removal and lighting estimateshave been developed for the existing public use airports in Delaware (Table 6 9). As shown,the cost to remove or light obstructions at these airports has been estimated at more than$11.5 million.
Table 6 9 – Alternative 1 (Existing System) Obstruction Removal EstimatesAirport Removal/Lighting Estimate
Chandelle Estates $1,200,000Chorman $612,000Delaware Airpark $1,726,000Jenkins $2,574,000Laurel $727,000New Castle $1,451,000Smyrna $45,000Summit $1,292,000Sussex County $1,897,000Total $11,524,000
3.2 Incremental Changes by Alternative
Depending upon the number of types of airports included in each alternative, therequirements for obstruction removal will differ. In this regard, Alternative 2 ContractedAlternative – has fewer airports than the existing system, and thus, a lower obstructionremoval cost. Similarly, Alternative 3 – Contingency Aviation System – has fewer public useairports than the existing system, and thus also lowers overall costs.
Table 6 10 presents the costs of obstruction removal for Alternative 2. As shown, these costsare more than $5 million less than Alternative 1 and represent the reduction in airport facilitiesrequiring obstruction removal. Total cost for Alternative 2 is approximately $6.4 million. Withonly the publicly owned airports and Summit included in this alternative, most of thesignificant obstructions have already been removed or lighted. However, according to theLiDAR analysis, the obstructions for which costs were generated still exist and should beremoved or lighted.

Delaware State Aviation System Plan UpdateChapter 6 – Interim Report September 2012
R.A. Wiedemann & Associates, Inc. 6 13
Table 6 10 – Alternative 2 Obstruction Removal EstimatesAirport Removal/Lighting Estimate
Delaware Airpark $1,726,000New Castle $1,451,000Summit $1,292,000Sussex County $1,897,000Total $6,366,000
Table 6 11 presents the obstruction removal costs for the public use airports included inAlternative 3. This alternative is also less costly than Alternative 1, but because of the inclusionof several privately owned airports, it is more expensive than Alternative 2. Total removal andlighting costs for Alternative 3 are $7.7 million.
Table 6 11 – Alternative 3 Obstruction Removal EstimatesAirport Removal/Lighting Estimate
Chorman $612,000Delaware Airpark $1,726,000Laurel $727,000New Castle $1,451,000Summit $1,292,000Sussex County $1,897,000Total $7,705,000
3.3 Summary and Ranking of Airspace Compatibility Factors
From an evaluation standpoint, the differences between alternatives involved thepotential funding needs for the removal of airspace obstructions. In this regard, the overallranking of alternatives was as follows:
Alternative 2 First: $6,366,000Alternative 3 Second: $7,705,000Alternative 1 Third: $11,524,000
These scores indicate that Alternative 2 creates the least impact in obstruction removalrequirements, because that alternative has the fewest number of airports. Alternative 1 hasthe greatest number of public use airports and thus would require the highest level ofobstruction removal. Because the State is considering undertaking some of these removalcosts, Alternative 2 clearly has the least impact on funding requirements.

Delaware State Aviation System Plan UpdateChapter 6 – Interim Report September 2012
R.A. Wiedemann & Associates, Inc. 6 14
4. IMPACT ON SURFACE TRANSPORTATION
ROM THE PHASE 1 STUDY, A FORECAST of airport generated surface vehicle traffic wasprojected to the year 2030 to determine whether or not hourly roadway capacities ateach facility would be exceeded. This forecast was for the existing system – essentially
Alternative 1. In addition to airport generated trips, an existing hourly roadway capacity wasestimated for each airport. As shown in Table 6 12, projected peak hour vehicle trips will notexceed minimum levels of highway capacity during the planning period for Alternative 1.
Table 6 12 – Alternative 1 Forecast Surface Access Demand
Airport Name Access Road2030 Peak
Hour VehicleTrips*
Existing HourlyRoadwayCapacity*
2030Surplus or(Deficit)
ChandelleEstates Route 9 10 200 190
Chorman Nine Foot Road 25 200 175Civil AirTerminal atDover AFB
Horsepond Road 132 200 68
DelawareAirpark State Route 42 43 200 157
Jenkins Westville Road 7 200 195Laurel State Route 24 22 200 178New CastleAirport
US 13 and 40, State Routes 273,58, 141 206 1,200 994
Smyrna State Route 6 7 200 193Summit US 301 79 400 321Sussex County Airport Road, S Railroad Ave 65 400 335* Vehicle trips estimated from general aviation industry averages of 2.35 times peak hour operations. Thisnumber accounts for pilots, passengers, and employees at the airport.** Estimated minimum capacity of 200 hourly vehicles for airport ingress and egress turn lanes
4.1 Aviation Demand Generated Vehicle Trips
Table 6 13 presents the forecast vehicle trips for Alternatives 1, 2, and 3, given the differentforecast aviation demand projected for each scenario. As shown, there are minimal differencesin overall peak hour vehicle trips for most alternatives. Notably, there are a number of airportsmissing from Alternative 2, by definition. However, of the airports with the least surpluscapacity, the Civil Air Terminal at Dover AFB shows the use of 66 percent of its capacity inAlternatives 1 and 2. In Alternative 3, that increases to a potential range of 70 155 percent ofcapacity, depending upon whether or not airline service is attracted to the CAT. While thereare other airports that have significant roadway capacity available for aviation related

Delaware State Aviation System Plan UpdateChapter 6 – Interim Report September 2012
R.A. Wiedemann & Associates, Inc. 6 15
demand, it should be noted that non aviation demand will increase on these highways in thefuture as well. In fact, the non aviation demand is much higher in most cases than the aviationgenerated demand.
Table 6 13 – 2030 Aviation Related Peak Hour Vehicle Trips by AlternativeAirport Name Alternative 1 Alternative 2 Alternative 3Chandelle Estates 10 0 5Chorman 25 0 25Civil Air Terminal at Dover AFB 132 0 141 310*Delaware Airpark 43 61 45Jenkins 7 0 7Laurel 22 0 22New Castle 206 206 206Smyrna 7 0 7Summit 79 79 79Sussex County 73 94 73* Upper range would include potential airline service and air cargo operations at the CAT.
4.2 Total Traffic Counts
As described in Phase 1 of the System Plan, future traffic counts were provided by DelDOT forthe roadways involved in direct surface access to Delaware’s system airports. Theseprojections can be considered a worst case loading for the system plan. For comparisonpurposes the 2010 Annual Average Daily Traffic is also shown along with the percentagegrowth over the period:
Chandelle EstatesSilver Leaf Lane – 168 AADT (240 Projected, +42.9%)State Route 9 – 1,289 AADT (1,750 Projected, +35.8%)
ChormanNine Foot Road – 793 AADT (1,030 Projected, +29.9%)U.S. Route 13 – 23,901 AADT (35,900 Projected, +50.2%)
Civil Air Terminal at Dover AFBHorsepond Road – 1,898 AADT (2,100 Projected, +10.6%)
Delaware AirparkState Route 42 – 5,262 AADT (7,700 Projected, +46.3%)
JenkinsWestville Road – 2,735 AADT (4,000 Projected, +46.3%)
LaurelSharptown Road – 1,610 AADT (2,300 Projected, +42.9%)

Delaware State Aviation System Plan UpdateChapter 6 – Interim Report September 2012
R.A. Wiedemann & Associates, Inc. 6 16
New Castle AirportU.S. 40/DuPont Highway – 77,366 AADT (95,000 Projected, +22.8%)U.S. 202/E. Basin Road (State Route 141) – 41,783 AADT (63,000 Projected, +50.8%)Commons Boulevard/State Route 37 – 18,645 AADT (25,500 Projected, +36.8)Airport Road – 9,320 AADT (14,000 Projected, +50.2%)Churchmans Road/State Route 58 – 10,267 AADT (15,000 Projected, +46.1%)Old Churchmans Road – 712 AADT (800 Projected, +12.4%)
SmyrnaCommerce Street/State Route 6 – 1,807 AADT (2,000 Projected, +10.7%)
SummitU.S. 301 – 21,798 AADT (28,000 Projected, +28.5%)
Sussex CountyRoad 319 – 941 AADT (1,050 Projected, +11.6%)U.S. Route 9 – 13,139 AADT (17,500 Projected, +33.2%)U.S. Route 9T – 4,995 AADT (7,500 Projected, +50.2%)
Except for New Castle Airport, many of the high growth rates involve relatively low activityroadways. For example, Silver Leaf Lane is growing from an AADT of 168 to 240 – only 72vehicles per day. At Delaware Airpark, State Route 42 is projected to grow by 2,438 AADT. Butthis is significantly less than the large numbers surrounding New Castle Airport, describedpreviously. U.S. 301, which provides access to Summit Airport, is anticipated to grow from21,798 to 28,000 over the period. This growth will increase the difficulty of turning left intothe airport without a stop light to assist traffic across the southbound lanes.
In cases where a roadway leads directly to an airport entrance (Old Churchmans at New CastleAirport, Horsepond Road at the Civil Air Terminal, and Road 319 at Sussex County Airport) allhave growth rates under 13 percent. These projections can be associated with Alternative 1 ofthe System Plan. Increases in airport activity in either Alternative 2 or 3 may increase thesenumbers and percentages. For example, a new terminal area off Old Churchmans Road wouldsignificantly increase that level of traffic. Similarly, a new air cargo operation or new airlineservice at the Civil Air Terminal would significantly impact those projected surface accessnumbers.
4.3 Surface Access Evaluation Findings
For this analysis, the findings for surface access needs and potential improvements werelimited to the immediate access of each airport within the various alternatives and did notcover the general needs of highways leading to the system airports. Rather, the findings andrecommendations focused on the impacts of each alternative on the surface accessibility ofsystem airports. From the evaluation, the following key findings were made:

Delaware State Aviation System Plan UpdateChapter 6 – Interim Report September 2012
R.A. Wiedemann & Associates, Inc. 6 17
Civil Air TerminalUnder Alternative 1, the Civil Air Terminal existing roadway system will be adequatefor the long term future.Under Alternative 2, it is assumed that the Civil Air Terminal is closed to public usedue to security or other reasons. As such, no surface access aviation relateddemand is generated.Under Alternative 3, if airline service is initiated, a potential of 300 peak hourvehicles are possible for Horsepond Road. This will hasten the need for capacityrelief improvements including turn lanes, road widening, and increased parkingarea at the CAT. A minimum of 150 new auto parking spaces will be needed ifairline service materializes. Also for Alternative 3, full joint use of Dover AFB isassumed. Therefore, up to five business jets and 31 propeller aircraft are forecastfor the facility, increasing the total number of potential peak hour vehicle trips by 9.Finally, if domestic air cargo service is initiated, the roadway system connecting theCAT to State Route 1 will need to be improved for truck traffic. This would includepossible widening and strengthening of the roadways connecting to Route 1(Horsepond Road and Lafferty Lane).
Delaware AirparkNo significant changes to the surface access are anticipated or required for thisairport under any of the three alternatives. On airport traffic levels are onlyanticipated to grow to 61 peak hour vehicles by 2030 for Alternative 2, which is thehighest level of demand of any of the options. This level of demand is only 30percent of the entrance roadway capacity.At least 20 more airport auto parking spaces will be needed by 2030.
New Castle AirportThere are no significant changes between alternatives for this airport, as all havethe same forecast demand. Thus, whatever happens at this facility can be assumedto occur within each of the alternatives.At some point in the future, airline service is likely to be initiated at New CastleAirport due to overcrowding at Philadelphia International. If this occurs prior to2030, new surface access improvements will be needed at the airport, includingaccess to the new terminal area and significant expansion of auto parking.
Summit AirportThere are no significant changes between alternatives for this airport, as all havethe same forecast demand. Thus, whatever happens at this facility can be assumedto occur within each of the alternatives.Summit Airport will continue to grow its maintenance, avionics, and aircraftretrofitting businesses, along with its government contracts. As such, the airport isanticipated to increase its employment base over the planning period. Airport

Delaware State Aviation System Plan UpdateChapter 6 – Interim Report September 2012
R.A. Wiedemann & Associates, Inc. 6 18
management has estimated that this growth may create up to 600 new jobs. Giventhe new employment numbers, surface access to the airport may needimprovement, including a traffic light at the main airport entrance in theintermediate planning timeframe to accommodate peak period traffic that wouldoccur during the start and end of work shifts at the airport. In addition, it isanticipated that at least 500 more auto parking spaces would be required as thenumber of employees and visitors to the airport increase.
Sussex County AirportUnder all alternatives there are no new surface access needs that would betriggered by vehicle trips to the airport. The highest level of access road peak hourcapacity used is 47 percent under Alternative 2.Under Alternative 3, it is assumed that the primary runway will be extended to6,000 feet. This will trigger the need to relocate a portion of U.S. 9T (Park Avenue),changing the intersection location of S. Bedford Street and Park Avenue. Thischange will not impact highway capacities, but will permit the runway extension tooccur.
Other Public Use System Airports: Chandelle Estates, Chorman Airport, Jenkins, Laurel,and Smyrna Airport are not anticipated to create significant surface access demandthroughout the period under any of the Alternatives.

Delaware State Aviation System Plan UpdateChapter 6 – Interim Report September 2012
R.A. Wiedemann & Associates, Inc. 6 19
5. ENVIRONMENTAL & LAND USE COMPATIBILITY
OR THIS EVALUATION CRITERION, LAND USE COMPATIBILITY is sometimes measured by the realestate value established in the near airport environs. Noise impact, in particular, isblamed by many to cause a devaluation of real estate. Thus, the impact of airport
operations on environmental and land use compatibility can be measured indirectly bydetermining average real estate values in the airport area as compared with other areas of acommunity that are not impacted by airport noise. If the conventional wisdom holds, theproperty in the near airport areas should average significantly less in value from similar landuses that are not impacted by airports.
In Delaware, an analysis was completed that examined the data concerning the value ofdifferent types of real estate located near airports and similar properties located away fromthe influence of airport related noise. The purpose was to learn which alternatives have thegreatest impact on land use compatibility. This impact will be measured by the potentialdifferences in airport area land values between alternatives.
5.1 Evaluation Concepts
The impacts of aviation on real estate values are active on a large scale. Airports that attractbusinesses to an area stimulate commercial real estate and create jobs. Increased employmentin turn, causes growth in retail, industrial, office, and residential real estate. Thus, aviation isone industry that supplements economic growth and the demand for real estate. The questionposed by this analysis involves whether or not airports help or hurt real estate values in theirimmediate vicinity. If noise really is the environmental influence that aviation opponents claim,then residential property values should suffer as the size and activity of an airport increases.On the other hand, commercial property may not be subject to this hypothesis.
Concepts that are evaluated in this analysis include the impact of airport operations on bothcommercial and residential real estate values. The results are presented in the followingsections.
5.2 Commercial Property Values
Delaware's four NPIAS airports proved to be the most viable for this type of study, as otherprivately owned airports did not have enough commercial properties located adjacent toairport property to draw meaningful conclusions. Therefore, the in depth examination ofcommercial real estate values focused on the following Airports:
New Castle AirportSussex County Airport

Delaware State Aviation System Plan UpdateChapter 6 – Interim Report September 2012
R.A. Wiedemann & Associates, Inc. 6 20
Summit AirportDelaware Airpark
Commercial properties within a five mile radius of each airport were evaluated, based on theirproximity to the airports’ runway areas. This study area was then divided into sections fromclosest to farthest away from the airport. Figure 6 1 depicts these sections divided into rings.
With sections divided in this manner, conclusionscan be drawn about property values specificallywith relation to the distance from airports. The endgoal is to identify a trend in the difference inproperty values within the divided sections. Forexample, if property values are consistently higher inthe inner sections close to an airport, and lower inthe outer sections away from the airport, one couldmake the determination that the airport is a positiveinfluence on property values in that area. Of course,
if property values were consistently lower in the innerrings and higher in the outer rings, the reverse would be true. One question for this analysis iswhether or not there is any difference between commercial property values near an airportand residential property values.
For this report, commercial real estate values were collected from the CoStar.com real estatedatabase. This resource allows for the collection of commercial real estate data bygeographical location, and is able to separate findings by the categories of Industrial, Office,and Retail space. For this study, average sale price per square foot was the metric used toevaluate value.
To conduct the analysis, all commercial property data within a five mile radius of an airportwas collected and divided into sections based on proximity to the airport. The properties wereanalyzed by category to provide an understanding of an airport's influence on commercialproperty values. It is important to note that within this report, all commercial real estatevalues were current as of April 2012.
New Castle Airport
Figure 6 2 presents a geographical summary of average property values surrounding NewCastle Airport. As shown in Figure 6 2 and Table 6 14, commercial real estate within a fivemile radius of New Castle International Airport is priced at a higher value closer to the airport.The highest value commercial real estate is within the segment one mile around the airport,priced at an average of $150 per square foot. The segment with the lowest real estate value is
Figure 6 1 – Airport Real Estate Analysis Area

Delaware State Aviation System Plan UpdateChapter 6 – Interim Report September 2012
R.A. Wiedemann & Associates, Inc. 6 21
within the 4 5 mile segment, averaging $80 per square foot. This represents an 85.7 percentincrease from the outermost segment to the innermost.
Figure 6 2 Commercial Real Estate Surrounding New Castle Airport
Table 6 14 Commercial Real Estate Surrounding New Castle Airport1 Mile 1 2 Miles 2 3 Miles 3 4 Miles 4 5 Miles
Properties by SegmentIndustrial (682) 141 149 97 193 102Office (601) 54 46 80 148 273Retail (1,052) 132 117 129 306 368Total (2,335) 327 312 306 647 743
Average Price Per Sq. Ft.Industrial $58 $49 $64 $57 $41Office $142 $166 $214 $106 $85Retail $251 $148 $156 $116 $88Total Weighted Average $150 $103 $142 $96 $80
The 3 4 and 4 5 mile segments contained the highest number of commercial properties, with647 and 743 properties respectively. This outcome is to be expected as these segments cover amuch greater surface area than the segments directly adjacent to the airport. Retail spacesoccupy the majority of commercial real estate within a five mile radius of the airport with

Delaware State Aviation System Plan UpdateChapter 6 – Interim Report September 2012
R.A. Wiedemann & Associates, Inc. 6 22
1,052 properties. Office and Industrial spaces were fairly even in numbers with 601 and 682properties respectively. With a total of 2,335 commercial properties, the New Castle Airportstudy area provides an excellent sample size that definitively portrays commercial real estatetrends. Conclusively this represents that the airport and its noise do not negatively impact thevalues of commercial real estate. While residential real estate values may have a differentresult, it can be concluded that commercial real estate is compatible with airport operations,from an economic standpoint. In fact, the data shows that New Castle Airport provides a veryhealthy environment for businesses to thrive, particularly those closer to the airport.
Sussex County Airport
Figure 6 3 presents a geographical summary of average commercial property valuessurrounding Sussex County Airport. As shown, there is a lack of commercial real estate datafor at least one geographic segment in the airport area. Though one industrial property wasexamined in the 3 4 mile segment, no pricing information was available for that property.Therefore, it was not taken into consideration in calculating the total weighed average priceper square foot. This same issue was recognized for industrial properties in the 1 2 mile and 45 mile segments.
Table 6 15 shows the breakdown of properties and costs by geographic location. Commercialproperty values closest to the airport showed the least expensive pricing in the study area,averaging $121 per square foot. The highest commercial property pricing was in the 2 3 milesegment, averaging $318 per square foot. This represents commercial values that are overtwice as expensive as properties adjacent to the airport. However, many of these propertiesare located in the downtown area of Georgetown and as such, are not entirely indicative of theairport's actual influence. Specifically, the 2 3 mile segment was only made up of 11properties, four of which were valued at an average $499 per square foot. This number isextraordinarily high, and does not necessarily represent normal pricing within the 2 3 milesegment.
It is important to note that the area within one mile of the airport contained a greater numberof commercial properties than any other segment with 57 properties. This represents only 10fewer properties than all other segments in the study area combined. The low sample sizesfrom other segments does not allow for conclusively regarding price per square foot, as theymay not accurately represent the actual norms in those areas. However, the relative highdensity of commercial properties near the airport indicates that relatively speaking, the landsurrounding the airport is attracting more businesses than other segments in the study area.

Delaware State Aviation System Plan UpdateChapter 6 – Interim Report September 2012
R.A. Wiedemann & Associates, Inc. 6 23
Figure 6 3 Commercial Real Estate Surrounding Sussex County Airport
Table 6 15 Commercial Real Estate Surrounding Sussex County Airport1 Mile 1 2 Miles 2 3 Miles 3 4 Miles 4 5 Miles
Properties by SegmentIndustrial (31) 20 4 2 1 4Office (57) 22 23 4 0 8Retail (36) 15 13 5 0 3Total (124) 57 40 11 1 15
Average Price Per Sq. Ft.Industrial $100 NA $130 NA NAOffice $122 $137 $499 NA $125Retail $149 $215 $249 NA $194Total Weighted Average $121 $165 $318 NA $143
Summit Airport
Due to lack of information, little can be concluded about the commercial property surroundingSummit Airport. While research findings indicate that there are retail properties adjacent tothe airport, there was no pricing information readily available. Most of the properties in thestudy area were located in the 4 5 mile segment, which passed directly through the businesscenter of Middletown. Because of the airport's location and lack of sufficient data, no

Delaware State Aviation System Plan UpdateChapter 6 – Interim Report September 2012
R.A. Wiedemann & Associates, Inc. 6 24
conclusions could be made about the direct effect of Summit Airport on nearby commercialreal estate. Figure 6 4 presents a geographical summary of average property valuessurrounding Summit Airport, while Table 6 16 shows the breakdown of properties and costs bygeographic location.
Figure 6 4 Commercial Real Estate Surrounding Summit Airport
Table 6 16 Commercial Real Estate Surrounding Summit Airport1 Mile 1 2 Miles 2 3 Miles 3 4 Miles 4 5 Miles
Properties by SegmentIndustrial (7) 0 0 0 2 5Office (63) 0 0 16 13 34Retail (89) 6 1 4 8 70Total (159) 6 1 20 21 104
Average Price Per Sq. Ft.Industrial NA NA NA NA NAOffice NA NA NA $111 $206Retail NA NA NA $83 $160Total Weighted Average NA NA NA $100 $175

Delaware State Aviation System Plan UpdateChapter 6 – Interim Report September 2012
R.A. Wiedemann & Associates, Inc. 6 25
Delaware Airpark
Figure 6 5 presents a geographical summary of average property values surrounding DelawareAirpark, while Table 6 17 shows the breakdown of properties and costs by geographic location.
Figure 6 5 Commercial Real Estate Surrounding Delaware Airpark
Table 6 17 Commercial Real Estate Surrounding Delaware Airpark1 Mile 1 2 Miles 2 3 Miles 3 4 Miles 4 5 Miles
Properties by SegmentIndustrial (46) 4 14 8 5 15Office (106) 0 10 9 8 79Retail (210) 4 38 25 30 113Total (362) 8 62 42 43 207
Average Price Per Sq. Ft.Industrial NA $161 $45 $86 $122Office NA NA $171 NA $89Retail NA $134 $46 $167 $163Total Weighted Average NA $141 $73 $155 $132
The one mile adjacent to the airport showed the lowest amount of commercial real estate withonly eight properties. With this small sample size, no pricing information was available.

Delaware State Aviation System Plan UpdateChapter 6 – Interim Report September 2012
R.A. Wiedemann & Associates, Inc. 6 26
However, the 1 2 mile segment showed a significant number of industrial and retailestablishments. The highest concentration of commercial real estate was within the 4 5 milesegment, with 207 properties. This result is primarily made up by properties in downtownDover, and some within the town of Smyrna. It is difficult to compare these properties tocommercial real estate nearby the airport, given its location in the town of Cheswold.
It is also important to note the proximity of Dover Air Force Base to the study area surroundingDelaware Airpark. Normally, commercial properties on the outermost segments of a studyarea represent properties not affected by airport noise. Unfortunately, the outermostsegments in this case clearly overlap into geographical areas directly affected by Dover AFB. Asa result, the study area encompassed properties from different towns near different airports.While 362 properties made up a useable sample size, the apples to oranges comparison wasdifficult to decipher with regard to airport impacted land values.
Civil Air Terminal at Dover Air Force Base
Figure 6 6 presents the graphic display of real estate values surrounding the Civil Air Terminal,while Table 6 18 lists the data used in developing the Figure. As previously mentioned, thestudy area for the Civil Air Terminal at Dover AFB overlaps with the study area surroundingDelaware Airpark. Not surprisingly, the commercial real estate data results varied across eachstudy area segment. The highest values per square foot were found within the 1 2 mile and 2 3mile segments, which covered the area through downtown Dover. In addition to this, thesesegments had the fewest amount of low value industrial properties, which considerablyaffected the averages of the other segments. The 2 3 mile segment showed the highestdensity of commercial properties, far outnumbering all other segments combined with 338properties. These properties were primarily composed of office and retail spaces.
Table 6 18 Commercial Real Estate Surrounding CAT1 Mile 1 2 Miles 2 3 Miles 3 4 Miles 4 5 Miles
Properties by SegmentIndustrial (65) 12 5 9 25 14Office (309) 2 39 165 86 17Retail (395) 20 69 164 110 32Total (769) 34 52 338 35 63
Average Price Per Sq. Ft.Industrial $45 NA $63 $44 $64Office NA $155 $129 $101 $121Retail $129 $126 $139 $88 $100Total Weighted Average $98 $136 $132 $88 $98

Delaware State Aviation System Plan UpdateChapter 6 – Interim Report September 2012
R.A. Wiedemann & Associates, Inc. 6 27
Figure 6 6 Commercial Real Estate Surrounding the Civil Air Terminal
Summary and Findings for Commercial Real Estate
Though a lack of sufficient data was apparent at some airports, useful conclusions may bedrawn from this analysis. The results from the New Castle Airport study area proved to havethe clearest findings. From this data a great deal can be concluded about the airport's effect oncommercial real estate. Significantly higher commercial property values closer to the airportindicate that in Wilmington, New Castle Airport has had a positive influence on commercialland prices.
Sussex County, with the lowest sample size of 124 properties, showed a much higher densityof commercial real estate within one mile of the airport than all other segments in its studyarea. Delaware Airpark, with no pricing information within one mile of the airport had thesecond highest commercial real estate value in its study area within the 1 2 mile segment.While a lack of pricing information was available for commercial properties near SummitAirport, there is a thriving, high end residential community surrounding the airport thatwarrants further study.
While there are many factors that contribute to commercial real estate prices, there doesappear to be an overall positive trend with commercial real estate value and proximity to an

Delaware State Aviation System Plan UpdateChapter 6 – Interim Report September 2012
R.A. Wiedemann & Associates, Inc. 6 28
airport. Some factors not considered in the above analysis included the number of operationsat each airport, the size of each airport, and the actual level of noise generated by aviationactivity. It is possible that airports with higher operational counts could have a greater positiveinfluence on commercial real estate values. While these results concerning commercial realestate can be considered positive, additional research is needed to assess the effect of airportson surrounding residential properties.
5.3 Residential Property Values
In addition to commercial property values, it was determined that an examination ofresidential property values was needed. Thus, the residential property values surrounding thefollowing ten aviation facilities were examined:
New Castle AirportSussex County AirportSummit AirportDelaware AirparkCivil Air Terminal at Dover AFBChorman AirportLaurel AirportChandelle EstatesSmyrna AirportJenkins Airport
Like commercial real estate, data was collected on property values directly surrounding theairport. Because of limitations regarding the collection of this data, a sampling method had tobe utilized. A control group of properties similar in size and surroundings were examinedwithin the 4 5 mile segment surrounding the airport.
As an illustration, determining the effect of an airport on properties adjacent to an airportwould involve studying those same houses in a similar neighborhood without the airportpresent. To best replicate this process, the study compared the difference in price per squarefoot between properties adjacent to the airport and similar properties farther away. It wasassumed that the variable of airport activity would be removed from the sample group fartheraway, and the difference (if any) in price per square foot would represent the effect of airportactivity on property value.
Because the control group of houses should simulate the conditions next to the airport, it is ofvital importance that samples be chosen carefully. For an airport surrounded by densehousing, it would be unreasonable for the control group to be made up of agriculturaldwellings and vice versa. Rather, the sampling of real estate properties was made to selectresidential homes that had very similar characteristics at both the airport and control group

Delaware State Aviation System Plan UpdateChapter 6 – Interim Report September 2012
R.A. Wiedemann & Associates, Inc. 6 29
locations. Land within a 4 5 mile radius from each airport was determined to be the boundaryfor the selection of control group properties. These properties are close enough to be withinthe same community without being directly affected by aircraft noise.
To research property values by geographical distance to Airports, the database atwww.homes.com was used. The home valuation process for this resource combines taxassessment values with recent home sales data to produce market value estimates used forproperty evaluation. From this, an average price per square foot was determined for each setof selected properties. In total, 6,208 properties were examined for the residential analysis ofDelaware public use airports, with sample sizes varying by airport. New Castle had the largestsample size with 1,878 properties, and Chorman Airport had the smallest sample size with 110properties. For each airport, two percent of the properties examined (representing the highestand lowest values) were removed when calculating final averages to exclude statisticaloutliers. It is also important to note that property values for apartments and condominiumswere not taken into account for this study.
New Castle Airport
Figure 6 7 displays the sampling areas utilized for New Castle Airport. Because of the highdensity of residential properties within the study area, sample areas were selected to bestrepresent average property values near the airport. In the 4 5 mile segment, properties weresampled that were similar in size and surroundings to those found within one mile of theairport to allow for property value comparison.
Table 6 19 shows the study results for New Castle Airport, with property values adjacent to theairport averaging 18 percent lower value per square foot than properties sampled within the4 5 mile range. New Castle Airport contained the largest sample size of any other airport inthis study, with 990 properties averaging $122 per square foot within one mile of the airportand 888 properties averaging $148 per square foot within 4 5 miles of the airport.
Table 6 19 Residential Real Estate Surrounding New Castle Airport1 Mile Properties 4 5 Mile Properties Price Difference (%)
Properties by Segment 990 888Average Price Per Sq. Ft. $122 $148 18%Average Property Size 1,244 Sq. Ft. 1,396 Sq. Ft.

Delaware State Aviation System Plan UpdateChapter 6 – Interim Report September 2012
R.A. Wiedemann & Associates, Inc. 6 30
Figure 6 7 Residential Real Estate Surrounding New Castle Airport
Sussex County Airport
For Sussex County Airport, all residential properties within one mile were able to be examineddue to the smaller amount of properties available. Figure 6 8 shows the sample areas utilizedwithin the 4 5 mile segment that closely resemble residential properties adjacent to theairport.
As shown in Table 6 20, very little difference in property values were recorded betweenproperties near the airport and those farther away. Within one mile of the airport, propertyvalues only averaged one percent lower than those within the 4 5 mile segment. This defiesthe conventional wisdom that all airports negatively affect residential real estate value. Thesample size for Sussex County Airport analysis consisted of 278 properties. Within one mile ofthe airport the average price per square foot was $121, while similar properties not affectedby the airport averaged $122 per square foot.

Delaware State Aviation System Plan UpdateChapter 6 – Interim Report September 2012
R.A. Wiedemann & Associates, Inc. 6 31
Figure 6 8 Residential Real Estate Surrounding Sussex County Airport
Table 6 20 Residential Real Estate Surrounding Sussex County1 Mile Properties 4 5 Mile Properties Price Difference (%)
Properties by Segment 174 104Average Price Per Sq. Ft. $121 $122 1%Average Property Size 1,841 Sq. Ft. 1,872 Sq. Ft.
Summit Airport
Because the study area is defined as properties within one mile of airport runways and SummitAirport consists of only one main runway, the shape of the study area adjacent to the airportdiffers from other airports examined. While not perfectly circular, the study area accuratelycovers all properties within one mile of Summit's main runway. Figure 6 9 shows this studyarea, as well as the sample areas within the 4 5 mile segment that replicate the housingenvironment adjacent to the airport.

Delaware State Aviation System Plan UpdateChapter 6 – Interim Report September 2012
R.A. Wiedemann & Associates, Inc. 6 32
Figure 6 9 Residential Real Estate Surrounding Summit Airport
The residences immediately surrounding Summit Airport were the largest of any airport in thestudy, averaging 2,547 square feet within one mile of the airport. These high end residentialproperties were compared to other large residences outside of direct airport influence. Asshown, the overall price difference of one dollar per square foot does not indicate that SummitAirport is negatively affecting properties near the airport.
Table 6 21 Residential Real Estate Surrounding Summit Airport1 Mile Properties 4 5 Mile Properties Price Difference (%)
Properties by Segment 372 421Average Price Per Sq. Ft. $128 $129 1%Average Property Size 2,547 Sq. Ft. 2,490 Sq. Ft.
Delaware Airpark
Figure 6 10 shows the sample areas used to represent the average residential property valuessurrounding Delaware Airpark. The data collected show little difference between propertieswithin a one mile radius of the airport and similar samples outside away from any airportinfluence; averaging $109 per square foot within one mile of the airport, and $110 per squarefoot within 4 5 miles of the airport.

Delaware State Aviation System Plan UpdateChapter 6 – Interim Report September 2012
R.A. Wiedemann & Associates, Inc. 6 33
Figure 6 10 Residential Real Estate Surrounding Delaware Airpark
Table 6 22 Residential Real Estate Surrounding Delaware Airpark1 Mile Properties 4 5 Mile Properties Price Difference (%)
Properties by Segment 297 320Average Price Per Sq. Ft. $109 $110 1%Average Property Size 1,983 Sq. Ft. 1,954 Sq. Ft.
Civil Air Terminal at Dover Air Force Base
Data collected surrounding the Civil Air Terminal at Dover Air Force Base was the mostsurprising of any airport in this study, with residential property values averaging 19 percenthigher within one mile of the airport compared to samples taken within a 4 5 mile radius ofthe airport.

Delaware State Aviation System Plan UpdateChapter 6 – Interim Report September 2012
R.A. Wiedemann & Associates, Inc. 6 34
Figure 6 11 Residential Real Estate Surrounding CAT
As shown in Table 6 23, the average price per square foot within one mile of the Civil AirTerminal was $122. This was $19 more per square foot than similar properties within a 4 5mile radius of the airport which had an average value of $103 per square foot. With a total of810 properties examined, CAT had the second largest sample size of any airport in the study.
Table 6 23 Residential Real Estate Surrounding CAT1 Mile Properties 4 5 Mile Properties Price Difference (%)
Properties by Segment 211 599Average Price Per Sq. Ft. $122 $103 19%Average Property Size 1,999 Sq. Ft. 2,056 Sq. Ft.
Other Public Use Airports
For this study, other public use airports included in the residential analysis included Chorman,Laurel, Chandelle Estates, Smyrna, and Jenkins Airport. These airports were not included in thecommercial real estate portion of this report based upon the absence of commercial realestate near the airports due to location outside major commercial centers. Figure 6 12 displaysthe sample areas utilized in the data collection for these airports, and Table 6 24 lists thenumbered results.

Delaware State Aviation System Plan UpdateChapter 6 – Interim Report September 2012
R.A. Wiedemann & Associates, Inc. 6 35
Figure 6 12 Other Public Use Airport Residential Property Sample Areas
Chorman Airport Laurel Airport Chandelle Estates
Smyrna Airport
Jenkins Airport
Of the airports examined, Chorman Airport displayed the highest positive effect on residentialreal estate, with properties within one mile of the airport displaying 10 percent higher valueper square foot than similar properties examined 4 5 miles from the airport. The otherairport's displayed little to no effect on property values, with Chandelle Estates recording thesecond highest positive influence at six percent higher value, and Jenkins Airport recording theonly negative effect of 1 percent value. These findings are not unexpected, as low operationcounts on these airports provide low noise impacts on surrounding properties compared tothe NPIAS airports in this study.
Table 6 24 Residential Real Estate Surrounding Other Public Use Airports1 Mile Properties 4 5 Mile Properties Price Difference (%)
Chorman AirportSample Size 47 63Average Price Per Sq. Ft. $122 $111 10%Average Property Size 1,913 Sq. Ft. 1,954 Sq. Ft.
Laurel Airport

Delaware State Aviation System Plan UpdateChapter 6 – Interim Report September 2012
R.A. Wiedemann & Associates, Inc. 6 36
Table 6 24 Residential Real Estate Surrounding Other Public Use Airports1 Mile Properties 4 5 Mile Properties Price Difference (%)
Sample Size 45 155Average Price Per Sq. Ft. $108 $106 1%Average Property Size 2,061 Sq. Ft. 1,903 Sq. Ft.
Chandelle EstatesSample Size 120 192Average Price Per Sq. Ft. $103 $97 6%Average Property Size 1,632 Sq. Ft. 1,841 Sq. Ft.
Smyrna AirportSample Size 244 318Average Price Per Sq. Ft. $116 $115 1%Average Property Size 1,331 Sq. Ft. 2,101 Sq. Ft.
Jenkins AirportSample Size 198 450Average Price Per Sq. Ft. $105 $107 1%Average Property Size 1,765 Sq. Ft. 1,908 Sq. Ft.
Summary and Findings for Residential Real Estate
While some airports demonstrated negative effecting residential real estate, it can beconcluded that this is not a blanket rule that can be applied to any airport. In fact, only oneairport demonstrated negatively affecting adjacent residential property values while sevenairports displayed no tangible effect, and two airports demonstrated positively affectingproperty values. However, to understand the full story, both residential and commercialproperty values must be examined. For example, New Castle Airport showed a negative impacton residential property values, but a very high positive impact on commercial property values.The alternative ranking process attempts to combine the scores of these various land uses todetermine which option is best.
5.4 Alternative Ranking Process
In order to rank alternatives with respect to the environmental and land use compatibilityfactors described in this analysis, a method was developed that gave higher rankings to thealternative that resulted in the highest overall land values. Because both commercial andresidential land values near airports were examined, there were some mixed results at specificairports. For example, New Castle Airport showed average commercial property values thatwere almost 88 percent higher near the airport than similar properties between four and fivemiles away. Conversely, residential property values were 18 percent higher away from theairport relative to those nearby.
Key factors in ranking the alternatives involved the number of airports in each alternative andthe cumulative effect of aircraft activity on land values. In this regard, Alternative 2 –

Delaware State Aviation System Plan UpdateChapter 6 – Interim Report September 2012
R.A. Wiedemann & Associates, Inc. 6 37
Contracted System of Airports, has the fewest airports, but the greatest concentration ofaircraft activity at each of those airports. Alternative 1 – Baseline Alternative has the greatestnumber of airports, but the widest dispersion of aircraft operations. Thus, the ranking ofalternatives had to consider these factors, along with the actual impact of each airport on itsimmediate area land values. Table 6 25 presents a summary of the ranking process.
Table 6 25 – Ranking of AlternativesAirport Alt 1 Alt. 2 Alt. 3
Commercial Residential Commercial Residential Commercial ResidentialChandelle Estates N/A 0.06Chorman N/A 0.1 N/A 0.1Delaware Airpark 0.06 0.01 0.06 0.01 0.06 0.01Dover CAT 0 0.19 0 0.19Jenkins N/A 0.01Laurel N/A 0.01 N/A 0.01New Castle Airport 0.87 0.18 0.87 0.18 0.87 0.18Smyrna N/A 0.01Summit N/A 0.01 N/A 0.01 N/A 0.01Sussex County 0.18 0.01 0.18 0.01 0.18 0.01Totals 0.75 0.15 0.75 0.21 0.75 0.09Average 0.90 0.54 0.84
As shown, the percentage difference between airport impacted and non airport impactedproperty values was included for both types of land use. From this table, it can be shown thatthe existing system averages slightly better than Alternative 3, primarily because of the goodinfluence of the smaller privately owned airports on property values. Alternative 2 is a distantthird. Ranking from highest to lowest with regard to environmental and land useconsiderations would include the following:
Alternative 1 – FirstAlternative 3 – SecondAlternative 2 – Third (distant)
This scoring will be taken into account in selecting the preferred alternative in Chapter 7 of this report.

Delaware State Aviation System Plan UpdateChapter 6 – Interim Report September 2012
R.A. Wiedemann & Associates, Inc. 6 38
6. DEVELOPMENT COSTS FOR ALTERNATIVES
HE EVALUATION OF ALTERNATIVES INCLUDES AN EXAMINATION of system wide costs in order tocompare the resources needed to fund each concept. Once these differences areestimated, a comparison or ranking of alternatives with respect to cost can be made. All
public use airports (both publicly owned and privately owned) were included in the cost totals,since the costs are representative of the deficiencies as they currently exist and the fundingrequired to correct those deficiencies.
The process used to estimate system costs involved two steps. First, a determination ofapplicable unit costs was made; then these costs were applied to the development proposedin each alternative system. Comparative cost estimates were prepared using the requirementsfor each airport in each alternative. A detailed description of unit costs is presented in Table 68. All unit cost estimates are in constant 2012 dollars. It should be noted that these costsestimates are averages and that specific costs will differ by airport. However, since eachalternative uses that same unit cost estimates, total costs for each alternative will becomparative.
Table 6 8 Unit Cost EstimatesITEM Unit Price/UnitRunway Paving – Asphalt (includes site prep) Square Yard $40 $117Runway Paving – Concrete (includes site prep) Square Yard $135Taxiway Paving – Asphalt Square Yard $40 $117Runway & Taxiway Paving Overlay Square Yard $30 $35Apron Paving – Asphalt Square Yard $135Automotive Parking Space Square Yard $50Terminal Building Square Foot $230Conventional Hangar Square Foot $150T Hangars Unit $75,000High Intensity Runway Lighting Linear Foot $40Medium Intensity Runway Lighting Linear Foot $40Low Intensity Runway Lighting Linear Foot $40Medium Intensity Taxiway Lighting Linear Foot $40PAPI Each $75,000VASI Each $75,000REILS Each $75,000MALSR Each $1,000,000Localizer Each $500,000Glide Slope Each $1,500,000

Delaware State Aviation System Plan UpdateChapter 6 – Interim Report September 2012
R.A. Wiedemann & Associates, Inc. 6 39
Table 6 8 Unit Cost EstimatesITEM Unit Price/UnitAirport Rotating Beacon Each $15,000Segmented Circle & Wind Sock Each $40,000Wind Indicator Each $12,000Weather Station Each $125,000
To estimate total costs, these unit costs were applied to the required number of units for eachplanning period. Table 6 9 presents a summary of costs by airport and alternative. Notincluded in these costs are the obstruction removal costs that were estimated as a part ofSection 3 of this evaluation. Those costs are included in Table 6 10 in the totals comparison.
The comparison of airport development costs in each alternative shows that Alternative 2 isthe least expensive and Alternative 3 is most expensive. However, this ranking accounts forspending at both public and privately owned airports. When the costs are broken down in alater chapter, the private sector funding will be separated from the total fundingrequirements. At that time, it will be shown that Alternative 2 is actually the most expensiveoption, relative to public funding.
Table 6 10 presents a summary of the total costs for each alternative, broken down by costcomponent. This table includes the airfield overlay costs and obstruction removal costs foreach alternative. As such, this Table presents a full picture of the impacts of variousdevelopment decisions at Delaware airports. The overall cost for these alternatives includesthe following, by rank:
Alternative 2 $89,389,600Alternative 1 $90,085,900Alternative 3 $96,556,400
From a cost perspective, the alternative rankings show that the addition of the obstructioncosts to the other development costs brought Alternatives 1 and 3 closer together in totalcosts.

DelawareStateAv
iatio
nSystem
Plan
Upda
teCh
apter6
–Interim
Repo
rtSeptem
ber2
012
R.A.
Wiedeman
n&Associa
tes,Inc.
640
Table69
Developm
entC
ostsby
Alterin
ative
Airport
Alternative1
Alternative2
Alternative3
Land
side
Costs
Airside
Costs
TotalCosts
Land
side
Costs
Airside
Costs
TotalCosts
Land
side
Costs
Airside
Costs
TotalCosts
Chande
lleEstates
$856,500
$425,800
$1,282
,300
Chorman
Airport
$649,500
$776,700
$1,426
,200
$649,500
$3,729
,000
$4,378
,500
DelawareAirpark
$6,562
,500
$19,782,000
$26,344,500
$10,509,000
$25,643,800
$36,152,800
$4,987
,500
$19,782,000
$24,769,500
DelDOTHe
listop
$0$0
$0$0
$0$0
$0$0
$0Do
verA
FBCA
T$9
,694
,000
$0$9
,694
,000
$13,459,500
$0$13,459,500
JenkinsA
irport
$115,000
$150,000
$265,000
LaurelAirport
$0$75,000
$75,000
$0$75,000
$75,000
New
CastleAirport
$1,336
,500
$23,360,900
$24,697,400
$1,336
,500
$23,360,900
$24,697,400
$1,336
,500
23,360
,900
$24,697,400
Smyrna
Airport
$300,000
$0$300,000
SummitAirport
$1,025
,000
$1,625
,200
$2,650
,200
$1,025
,000
$1,625
,200
$2,650
,200
$1,025
,000
$2,798
,300
$3,823
,300
Sussex
Coun
tyAirport
$750,000
$11,388,800
$12,138,800
$2,625
,000
$16,898,200
$19,673,200
$750,000
$16,898,200
$17,648,200
Total
$21,289,000
$57,272,400
$78,873,400
$15,495,500
$67,528,100
$83,023,600
$22,208,000
$66,643,400
$88,851,400
Table610
TotalCostsBy
Alternative
Developm
entItem
Alternative1
Alternative2
Alternative3
Land
side
$21,28
9,50
0$1
5,49
5,50
0$2
2,20
8,00
0Airside
$57,27
2,40
0$6
7,52
8,10
0$6
6,64
3,40
0Obstructio
ns$1
1,52
4,00
0$6
,366
,000
$7,705
,000
TotalCosts
$90,08
5,90
0$8
9,38
9,60
0$9
6,55
6,40
0

Delaware State Aviation System Plan UpdateChapter 6 – Interim Report September 2012
R.A. Wiedemann & Associates, Inc. 6 41
7. IMPACT OF CONTINGENCIES
LTERNATIVE 3 PRESENTS A NUMBER OF CONTINGENCIES that will have significant impacts on theDelaware Aviation System if they come to pass. Two of the contingencies mentionedwill likely happen in each/all of the Alternatives. These involve the runway expansion at
Sussex County and the loss of NPIAS funding at Summit. Other contingencies that are notlikely to have a significant impact on the system involve the loss of some public use airports toprivate use only. These airports are likely to be in Kent County and would include ChandelleEstates, Jenkins, and Smyrna. The other privately owned, public use airports are consideredactive enough and financially strong enough to continue as public use facilities. Two of thoseairports are anticipated to develop runway improvements at some point within the planninghorizon – Chorman Airport and Summit Airport.
Perhaps the greatest impact on the system is the possible Base Realignment And Closure(BRAC) process for Dover AFB. If the heavy lift mission of the Base is transferred to McGuireAFB in New Jersey, it will mean a significant loss of personnel, aircraft activity, and localeconomic impact. This loss would mean that only the mortuary and perhaps the hospitalwould remain active on the Base. Such a loss might mean a reduction of as much as 7,000direct jobs, leaving about 800 base personnel and contractor jobs. Such a move would reducethe economic impact on the community from $528.2 million to roughly $60 million. Inaddition, the loss of indirect jobs (jobs created in Dover, Kent County, and Delaware becauseof the spending of Base employees) totaling almost 3,500.
In addition to the negative impact, there are several potential positive impacts associated withthe BRAC of Dover AFB. The first would be the availability of the Base for full joint use bycivilian aircraft. This possibility provides a number of cost offsets for future plans at DelawareAirpark, as well as the accommodation of airline service, air cargo service, and private aircraftstorage at the Base. For this analysis, the following benefits of full joint use/civilian ownershipof the Base were examined:
Decreased need for expansion of Delaware Airpark (remains at 4,200 feet)Possible use of Base passenger terminal for potential airline serviceUse of the Base for civilian air cargo
Decreased need to restructure roadway access system to reach CAT with heavytrucks (can use main roads through Base)
Use of the Base for Maintenance/Repair/Overhaul (MRO) of large aircraftDecreased need to develop large hangar on CAT property for aircraft maintenance
Redevelopment of some Base facilitiesPotential relocation of small GA aircraft from private use airports to the Base
Each of these potential benefits is discussed below.

Delaware State Aviation System Plan UpdateChapter 6 – Interim Report September 2012
R.A. Wiedemann & Associates, Inc. 6 42
7.1 Decreased Need to Expand Delaware Airpark
If Dover AFB is opened to full, unrestricted joint use by general aviation aircraft, there is animpact on the need to further expand Delaware Airpark in the future. Assumptions in thisscenario include the following:
Any BRAC process or other means of taking Dover AFB to full, unrestricted joint usewould not occur until 2015.Current expansion plans to take Delaware Airpark to 4,200 feet of runway length willremain intact and be implemented prior to 2015.Costs to be incurred for the expansion of Delaware Airpark that include the new 4,200foot runway and associated property acquisition will not likely be avoided due to thetiming of potential actions at Dover AFB. Because it is not likely that the joint use statusof Dover AFB will change before 2015, current plans in place for Delaware Airpark will,in all probability, move forward. Planned expenditures for the improvement atDelaware Airpark include approximately $17 million for the following:
Site PreparationNew Runway and Taxiway DevelopmentNew Access RoadOther Items: Obstruction Removal, Mitigation Construction, Perimeter Road
While these costs can be considered “sunk” costs for purposes of this analysis, thepotential full joint use of Dover AFB would eliminate the need to further expandDelaware Airpark. For example, in Alternative 2, the assumption of lack of joint use ofDover AFB would result in the need to provide business aviation access to Kent County,DE. Such access would involve the expansion of Delaware Airpark’s future 4,200 footrunway to 5,500 feet. Additional land acquisition, runway extension construction costs,and other costs are estimated to total $7.5 million. This capital investment could besaved or even reinvested into general aviation facilities at Dover AFB if that facilitywere to gain full, unrestricted joint use.
7.2 Possible Airline Service
Dover AFB serves as an embarkation point for military service men and women traveling toand from theaters of U.S. operations. The current terminal building (436th Aerial Port SquadronPassenger Terminal) is capable of processing more than 100,000 passengers per year. Shouldthe Base mission change through a BRAC process, the terminal building should be available forlocal airline service.
For several years, potential airline service has been courted in Dover. The most recent interesthas been shown from Allegiant Airlines, which selected Dover as one of eight future expansion

Delaware State Aviation System Plan UpdateChapter 6 – Interim Report September 2012
R.A. Wiedemann & Associates, Inc. 6 43
points in its route structure. By using the military terminal rather than developing a newterminal building at the Civil Air Terminal,
additional capital investment dollarscould be saved. As an initial temporaryprovision, the existing terminal buildingat the CAT was to be expanded viamanufactured modules. Rental rates forthese modular units were expected tocost $30,000 annually. Assumingsuccessful airline service, a replacementterminal building would be constructed atsome point in the future. Costs for such abuilding could run $2 million or more.Thus, long term savings by using the436th APS Passenger Terminal for civilianairline service could exceed $2 million.
7.3 Civilian Air Cargo
A third potential use for the full and unrestricted joint use of Dover AFB would be thedevelopment of a civilian air cargo hub. Discussions with current civilian cargo airlines thatprovide supplemental cargo air lift for the military indicated that some would be interested inusing the CAT. Currently, more than 10 percent of all domestic air freight travels through JFKInternational. For companies such as Evergreen Airlines International, much of their civilianfreight travels through New York or Miami. An air cargo hub or freight forwarding location inthe mid Atlantic region would aid in faster distribution to the geographic center of the EastCoast via trucking versus trucking from JFK or Miami International.
If the existing Dover AFB air cargo infrastructure was available for civilian use, no new facilitieswould be needed at the CAT to support freight forwarding activities. This could save millionsof dollars in the development of ramp space and freight transloading facilities. In addition, themain roadways into and out of the Base could be used for truck traffic rather than HorsepondRoad. Together, savings on the upgrading of Horsepond Road access and development of acivilian air cargo facility could total over $25 million, depending upon when a potential BRACwas announced. That is, if the BRAC is announced before development of reinforced rampspace at the CAT, a total of up to $17 million could be saved on pavement reconstructioncosts. If the announcement comes after the potential improvement of the CAT, that capitalinvestment would be considered sunk costs.
If there was not a BRAC of the Base mission, then the civilian air cargo operation could stilloccur, but it would be limited to the expanded CAT property. Under these circumstances, the
Figure 6 23 436th APS Passenger Terminal at Dover AFB

Delaware State Aviation System Plan UpdateChapter 6 – Interim Report September 2012
R.A. Wiedemann & Associates, Inc. 6 44
improvement in roadway access (Horsepond Road), the strengthening of the CAT ramp, andthe development of an air cargo facility on non Base property would be necessary. Thus,without a BRAC there would be no civilian savings for the potential air cargo activity.
7.4 MRO Facilities
A fourth potential benefit resulting from a BRAC of the Dover AFB heavy lift mission would bethe potential development of Maintenance/Repair/Overhaul facilities for large aircraft. One ormore of the large military hangars would be ideal for maintenance and refurbishmentactivities. In fact, PATS in Georgetown, DE once considered the development of MRO facilitiesat the CAT. While there were numerous reasons why that never occurred, the fact that asignificant operator considered the location gives rise to a belief that other operators maydesire such a location – particularly if facilities were already in place. Of significance is the factthat the Base has 12,900 feet of runway – enough for the largest aircraft in the world’s fleet.All apron areas are capable of the load bearing requirements for B 747 and larger aircraft.Thus, operationally and logistically the Base can accommodate very large aircraft for MROactivities. While there are no current plans to develop civilian MRO facilities at the CAT, the aircargo airlines have indicated that they would like a large hangar to perform maintenance workon their aircraft while at the CAT. Such a facility was previously estimated to cost about $8million. If available for use at the Base, this facility would provide an opportunity for the aircargo airlines or any private MRO operator to perform heavy maintenance.
7.5 Redevelopment of Base Facilities
In every BRAC, there are redevelopment activities where the local community strives tointegrate the former military facilities into civilian use. Sometimes this results in the expansionof the inventory of community housing facilities, new industrial locations, additionalwarehousing space, and aviation related development. For Dover AFB, all of these options areavailable if there is a significant BRAC. With any BRAC, there is funding available forredevelopment from the military, which would include the establishment of a temporaryredevelopment organization. This entity would work with local economic developmentorganizations to infill Base infrastructure with tenants.
In Kent County, the Kent Economic Partnership is a not for profit economic developmentorganization that oversees the Kent County Aero Park. In addition, the Partnership is involvedin economic development activities within the County such as recruitment of industrial andcommercial companies to the area. This organization, along with the Delaware EconomicDevelopment Office (DEDO), DelDOT, DRBA, the City of Dover, and other key stakeholderswould be involved in any redevelopment efforts.

Delaware State Aviation System Plan UpdateChapter 6 – Interim Report September 2012
R.A. Wiedemann & Associates, Inc. 6 45
7.6 Attraction of GA Based Aircraft
Under full and unrestricted joint use, general aviation based aircraft would be permitted at theBase. This condition would not require a BRAC, but would require a revised joint useagreement. Based aircraft could locate at the CAT, or in the case of a BRAC, they could locateon the Base. It is a little known fact that general aviation aircraft are currently based at DoverAFB. These belong to a flying club of military pilots. At one point there were more than 20 ofthese aircraft located on the Base. Currently, there are only about 10 such based aircraft.Without the military mission and its pilots, it is likely that these aircraft would not remain atthe Base after a BRAC.
The aviation system planning analysis estimated that the Base would attract 21 generalaviation based aircraft from surrounding airports. This estimate was coupled with theassumptions that Chandelle Estates would revert to private use and that five previouslyforecast business jets at Delaware Airpark would actually locate at Dover AFB if it wereavailable for unrestricted joint use. It should be remembered that Delaware Airpark will notexpand to accommodate larger business jet aircraft if Dover AFB is available for full joint use.
7.7 Summary
In summary, it can be concluded that there are significant economic implications to either fulljoint use of Dover AFB or a BRAC of the facility. These implications are slightly different foreach option. Under unrestricted joint use, it is assumed that the Air Force continues to operatethe Base and that civilian aircraft cannot be housed on AFB property. In this regard, it isassumed that all general aviation based aircraft, airline operations, air cargo operations, etc.,must occur on the CAT if there is no BRAC. If a BRAC creates the unrestricted joint usecondition, then many of the former military facilities would be available for redevelopmentand reuse.
The economic differences associated with unrestricted joint use of Dover AFB are summarizedas follows:
Joint Use – No BRAC SavingsNo Expansion of Delaware Airpark Beyond 4,200 Feet: $7,500,000Airline Terminal at CAT: ($2,140,000)Civilian Air Cargo at CAT: ($25,000,000)MRO Facilities at CAT: ($8,000,000)Redevelopment of Base Facilities: N/AAttraction of GA Based Aircraft: N/A _TOTAL ($27,640,000)

Delaware State Aviation System Plan UpdateChapter 6 – Interim Report September 2012
R.A. Wiedemann & Associates, Inc. 6 46
Joint Use – BRAC SavingsNo Expansion of Delaware Airpark Beyond 4,200 Feet: $7,500,000Airline Terminal at CAT: $2,140,000Civilian Air Cargo at CAT: $25,000,000MRO Facilities at CAT: $8,000,000Redevelopment of Base Facilities: N/AAttraction of GA Based Aircraft: N/A _TOTAL $42,640,000
The above comparison indicates that if there is full joint use of Dover AFB without a BRAC,then only minor savings can occur – this involves an estimated $7.5 million in future expansioncosts for Delaware Airpark. “Non savings” of $35.14 million would be incurred through thedevelopment of the CAT to meet potential airline, air cargo, and MRO functions.
On the other hand, if a BRAC occurs at Dover AFB which provides civilian use of Base facilities atotal of $42.64 million in savings could occur by using these facilities rather than constructingthem either at Delaware Airpark or the CAT. It should be noted, that only $9.64 million insavings would be available to the public sector, since the civilian air cargo and MRO facilities($33 million in costs) would be developed using private funding. Thus, from a public fundingstandpoint, there is only $2.14 million in potential savings between the full joint use without aBRAC and full joint use with a BRAC.
Not included in this analysis is the potential revenue and economic activity that may occurthrough the redevelopment of Base facilities. In many communities where a military base hasundergone a BRAC, this redevelopment activity and associated economic returns aresignificant. Also not included in the comparison was the potential loss of economic impactfrom the Base that can amount to hundreds of millions of dollars. Thus, the above comparisonis simply a simple analysis of how to make the best of a bad situation. Under all scenarios, theBRAC of the Base would result in negative economic consequences for an extended period oftime.

Chapter 7: Recommended Aviation System Plan

Delaware State Aviation System Plan UpdateChapter 7 – Interim Report September 2012
R.A. Wiedemann & Associates, Inc. 7 1
Recommended Aviation System Plan
HE RECOMMENDED AVIATION SYSTEM WAS FORMALIZED BY describing each airport's location,physical facilities, role, timing of development, and cost. This chapter is organized toinclude the following sections:
Selection of Preferred AlternativeDescription of Recommended Aviation SystemSummary
The process of selecting the recommended system along with the system's attributes aredescribed below.
1. SELECTION OF PREFERRED ALTERNATIVE
The selection of a preferred alternative aviation system had to consider the original goals andobjectives of the system plan, the inherent scoring of each alternative against each otheralternative, and a number of judgmental factors.
1.1 Study Objectives
From the Phase 1 portion of the analysis, the overall goal of the Delaware Department ofTransportation, Office of Aeronautics with regard to aviation can be stated as follows:
To enhance Delaware's economic development by fostering and promoting a safe andefficient aviation system for the movement of goods, services, and people and toencourage and promote aviation and aviation safety. Objectives that support this goalinclude, but are not limited to the following:
To facilitate the timely development of airports that will meet the air transportationneeds and economic goals of the State.To ensure that a system of airports is developed that provides a high degree ofsafety to the users, while at the same time provides adequate levels of service andfacilities throughout the State.To maximize the economic benefits and sustainability of the aviation system.To minimize the airport system’s environmental impact.Participate in the process of determining the appropriate role for each Delawareairport and in the provision of a portion of the financial assistance for thisdevelopment.

Delaware State Aviation System Plan UpdateChapter 7 – Interim Report September 2012
R.A. Wiedemann & Associates, Inc. 7 2
Make available to the flying public current and accurate information regardingDelaware's aviation system.
In order to select the recommended plan, the objectives from the various system planninggoals were consulted. Table 7 1 presents a summary of the objectives within each systemplanning goal. Two columns on the right side of the table indicate whether or not the objectivewas completed as a part of the system planning effort and whether or not the objective wasused as a decision factor in selecting the recommended plan.
Table 7 1 – Role of System Plan Objectives in Selection ProcessSystem Plan Goals/Individual Objectives Completed? Decision Factor
Aviation System1. To collect all relevant data necessary to develop a system of airports andfacilities that maximizes their use.
Yes No
2. To forecast aviation demand for the State's airports through the year 2030,adequately assessing airline, general aviation, cargo, military aviationoperations, and surface access needs.
Yes Yes
3. To monitor airport operations at non towered airports. Yes No4. To quantify existing capacity of airport airside and landside facilities for usein Phase II alternative development scenarios.
Yes Yes
5. To evaluate the role of privately owned or non NPIAS airports and makerecommendations regarding possible preservation or development of thesefacilities for the long term to satisfy operational demands and service areavoids.
Yes Yes
6. To evaluate the application of multi modal linkages to system airports. Yes Yes7. To develop a plan with enough flexibility to be implemented even whencertain recommendations cannot be executed.
Yes Yes
8. To adequately assess and plan for airport security for the State’s aviationsystem.
Yes No
Economic Sustainability and Development1. Consider the economic and financial viability of the State’s aviation systemand plan for potential future shortfalls in capital funding sources.
No* No
2. Assist in the funding of revenue producing infrastructure and otherinfrastructure related to retention of existing clients and economicdevelopment.
No* No
3. Seek a developmental balance of publicly and privately owned airports inthe State, while maintaining the public's access to safe, adequate facilities.
Yes Yes
4. Disseminate information to airports on green technology improvementrecommendations.
No* Yes
5. Maximize Federal financial participation in the development of the aviationsystem.
No* Yes
6. Encourage financial self sufficiency for airports within the aviation system byenacting policies favorable to aviation businesses and aircraft ownership.
No* No
7. Incorporate Airport Community Value metrics into the priority ranking ofrecommendations resulting from the SASPU.
No* No
8. Assist airport sponsors in developing strategic airport business plans as apart of the statewide aviation system planning efforts.
No** No

Delaware State Aviation System Plan UpdateChapter 7 – Interim Report September 2012
R.A. Wiedemann & Associates, Inc. 7 3
Table 7 1 – Role of System Plan Objectives in Selection ProcessSystem Plan Goals/Individual Objectives Completed? Decision Factor
Environmental1. Minimize potential environmental impacts identified in FAA Order 5050.4Bwith special attention to minimizing residential dislocation, mitigating noiseimpacts, minimizing air and water pollution, protecting wildlife, and preservingcultural resources.
Yes/Partial Yes
2. Develop future recommendations that are compatible with existing land useplans and desired land uses and that reduce objectionable effects of aviationfacilities on non compatible areas, to the extent possible.
Yes Yes
3. Plan for an energy efficient system of airports that provides ease of air andground access.
No* Yes
4. Promulgate information concerning environmentally “green” methods ofundertaking infrastructure development projects.
No* No
Social1. Plan for the orderly and timely development of the aviation system,maximizing services provided to the system users while minimizing communitydisruption.
Yes Yes
2. Integrate airport and airport related developments with other localcommunity, county, and State development plans and policies along with thoseproposed by individual airport sponsors and other agencies such as theWilmington Area Planning Council (WILMAPCO) and the Delaware ValleyRegional Planning Commission (DVRPC).
Yes Yes
3. Ensure the safety of each airport as well as the safety of the entireintegrated aviation system.
No** No
4. Work toward the development of an aviation system that benefits themaximum number of air travelers and job holders, while conserving economicand natural resources to the greatest extent practical.
Yes Yes
* To be completed in Financial & Implementation Plan** Not included in work scope
1.2 Alternative Evaluation Scoring
The scoring for each alternative was based, in part, on the list of objectives shown above. Ineach case where a decision factor is marked “Yes,” that factor was considered in theevaluation process. In some cases, the impact of the objective is indirect, such as the objectiveto forecast aviation demand through the year 2030. The forecast was used in allocatingdemand to each alternative and was important in assessing future impacts. However, that wasan indirect input to the decision process.
From Chapter 6, there were six evaluation criteria, including:
Ability to Serve Forecast DemandImpact of Airspace ObstructionsImpact on Surface Transportation SystemEnvironmental & Land Use Compatibility

Delaware State Aviation System Plan UpdateChapter 7 – Interim Report September 2012
R.A. Wiedemann & Associates, Inc. 7 4
Development CostsImpact of Contingencies
In this section, a summary of the scoring is presented in matrix format. It should be noted thatfor some of the Contingencies, the matrix format could not display the entire decision process.For those items, the evaluation process and its resulting conclusions are described. Table 7 2presents a summary of the scoring process.
Table 7 2 – Alternative Scoring Process
Criteria Alternative 1 Alternative 2 Alternative 3 PreferredAlternative
Serve Forecast DemandAirside Facilities 1 3 2 Alt. 1Landside Facilities 2 3 1 Alt. 3Airspace ObstructionsRemoval Needs 3 1 2 Alt. 2Surface TransportationInfrastructure Improvements 2 3 1 Alt. 3Environmental & Land UseLeast Impact to Land Values 1 3 2 Alt. 1Development CostsLeast Cost 2 1 3 Alt. 2Impact of ContingenciesHigh/Medium/Low 3 2 1 Alt. 3Sum of Scores 14 16 12 Alt. 3Average Score 2.00 2.29 1.71 Alt. 3
As shown, rankings were made on the basis of first, second, and third. The higher the rankingis the lower the score is. Thus, Alternative 3 scored the lowest on average (1.71), which meantthat it had the highest overall ranking. Alternative 1 scored second, with Alternative 2 rankedthird. A description of the rationale behind the scoring process is presented below.
Ability to Serve Forecast Demand
In ranking the alternatives with respect to their ability to serve demand, two items wereconsidered (airside and landside facilities), along with a notion of geographic coverage forusers. For the airside facilities, Alternative 1 was ranked first, since it provided the mostnumber of runways available to the flying public. At the same time, it required the leastamount of new runway paving. Alternative 3 was ranked second since it had the second mostnumber of runways. Although it showed the greatest amount of new runway paving, one ofthe included projects involved a new runway for Chorman Airport.

Delaware State Aviation System Plan UpdateChapter 7 – Interim Report September 2012
R.A. Wiedemann & Associates, Inc. 7 5
Landside facility rankings were based on the alternative with the least required facilities. Thatalternative had, by default, the greatest amount of facilities on hand to serve future forecastdemand. In this regard, Alternative 3 ranked first, followed by Alternative 2 and thenAlternative 1. One significant factor in this ranking is the assumption that Alternative 3 willhave some type of full civilian joint use at Dover AFB.
A judgmental consideration in the ability of an alternative to serve demand was the geographiccoverage offered by each option. This was in keeping with the economic objective: “Seek adevelopmental balance of publicly and privately owned airports in the State, while maintainingthe public's access to safe, adequate facilities.” In this regard, Alternative 1 has the greatestgeographic coverage in Delaware regarding public use airport locations. However, Alternative3 assumes the same number of airports, but several of them are assumed to no longer bepublic use facilities (Chandelle Estates, Smyrna, and Jenkins). Alternative 2 has the leastnumber of facilities and service area coverage.
Impact of Airspace Obstructions
The requirement to remove airspace obstructions is governed to some extent by the numberand type of airport facilities included in the recommended plan. Airspace obstruction removalwas included in the evaluation of alternatives to comply with the social objective: “Ensure thesafety of each airport as well as the safety of the entire integrated aviation system.” Foralternatives with more airports, there are more costs for obstruction removal – particularly ifmany of those airports are privately owned and have no jurisdiction for removing obstructionson adjacent property that they do not own. This ranking process is borne out by the costsassociated with obstruction removal for each alternative. As expected, Alternative 1 had thehighest cost, followed by Alternative 3. Alternative 2 had the lowest cost because it had thefewest airport obstructions and runways. Because the State has enabling legislation forobstruction removal, the plan with the lowest required cost ranked highest. It should be notedthat in no instance is safety compromised in this ranking process. That is, all airports withineach alternative are assumed to have their required airspace obstructions removed.
Impact on Surface Transportation System
Many surface transportation infrastructure improvements will have to be made regardless ofthe alternative aviation system involved. However, of all the options, Alternative 3 has thegreatest surface access improvement needs. Evaluation criteria were guided by a combinationof objectives which were described earlier. The first was an environmental objective: “Plan foran energy efficient system of airports that provides ease of air and ground access.” At thesame time, the Aviation System objective: “To evaluate the application of multi modal linkagesto system airports” had to be considered in the development of surface access infrastructurefor any air cargo hub that may be developed at the Civil Air Terminal. Finally, in the

Delaware State Aviation System Plan UpdateChapter 7 – Interim Report September 2012
R.A. Wiedemann & Associates, Inc. 7 6
preservation and creation of jobs, an Economic objective had to be considered: “Assist in thefunding of revenue producing infrastructure and other infrastructure related to retention ofexisting clients and economic development.” The additional highway infrastructureimprovements at Sussex County Airport will help retain the jobs at PATS for the County. Thus,this improvement along with the improvements to Horsepond Road under Alternative 3 willserve to either retain or create jobs.
Because of the high secondary impacts (jobs) of creating additional highway infrastructureover and above the other Alternatives, the scoring system used for this criterion favors theadditional development. This method is consistent with the study objectives, which weigh thedevelopment of infrastructure against the retention or creation of new jobs. Simply stated,new jobs are worth the development of roadway improvements.
Given these parameters, Alternative 3 was ranked highest, followed by Alternative 1. With theleast number of facilities and job creation capabilities, Alternative 2 ranked third.
Environmental and Land Use Compatibility
The ranking process used for the Environmental and Land Use Compatibility evaluation criteriafocused on the value of property near airports in Delaware. These property values were usedas surrogates to measure the impact of airport noise on surrounding land uses. Noise impact,in particular is blamed by many to cause a devaluation of real estate. If the conventionalwisdom holds, the property in the near airport areas should average significantly less in valuefrom similar land uses that are not impacted by airports.
The analysis for Delaware airports yielded mixed results. That is, the conventional wisdom thatairport operations impact land values immediately adjacent to airports was not borne outuniformly among all airports. For example, New Castle Airport showed average commercialproperty values that were almost 88 percent higher near the airport than similar propertiesbetween four and five miles away. Conversely, residential property values were 18 percenthigher away from the airport relative to those nearby.
Key factors in ranking the alternatives involved the number of airports in each alternative andthe cumulative effect of aircraft activity on land values. In this regard, Alternative 2 –Contracted System of Airports, had the fewest airports, but the greatest concentration ofaircraft activity at each of those airports. Alternative 1 – Baseline Alternative had the greatestnumber of airports, but the widest dispersion of aircraft operations. Thus, the ranking ofalternatives had to consider these factors, along with the actual impact of each airport on itsimmediate area land values.

Delaware State Aviation System Plan UpdateChapter 7 – Interim Report September 2012
R.A. Wiedemann & Associates, Inc. 7 7
Development Costs
The comparison of airport development costs in each alternative shows that Alternative 2 isthe least expensive and Alternative 3 is most expensive. The reason that Alternative 1 costs areless than the other alternatives can be attributed to the fact that fewer airports are includedand thus, the costs of obstruction removal are lower. In addition, the assumption that SussexCounty Airport would only expand its primary runway to 5,500 feet versus 6,000 feet (asshown in Alternatives 2 and 3) and that Delaware Airpark would only expand its runway to4,200 feet versus 5,500 feet (as shown in Alternative 2) impact the costs. The overall cost forthese alternatives includes the following, by rank:
Alternative 2 $89,389,600Alternative 1 $90,085,900Alternative 3 $96,556,400
From a cost perspective, the alternative rankings show that the addition of the obstructioncosts to the other development costs brought Alternatives 1 and 3 closer together in totalcosts. Because of the numeric nature of the evaluation, the ranking is very straightforwardwith Alternative 2 ranked first, Alternative 1 ranked second, and Alternative 3 ranked third.
Impact of Contingencies
An analysis of the potential impacts of various contingencies was undertaken as a part of theEvaluation of Alternatives. Contingency actions identified in the analysis included the followingmajor possible occurrences:
Expansion of Sussex County Airport Primary RunwayLoss of Three Privately Owned, Public Use Airports to Private Use OnlyRunway Expansion/Improvements at Two Privately Owned AirportsPotential Full Joint Use of Dover AFB Either Through Negotiation or BRAC
For purposes of this analysis, all of the Alternatives are likely to experience the first twocontingency bullet points in some form. That is, the Sussex County Airport primary runway willbe expanded, either to 5,500 feet or to 6,000 feet within the planning period. It is also likelythat the public use aspect of some privately owned airports in Kent County will be lost duringthe period, even if those airports remain open. The difference between Alternatives 1 andAlternatives 3 and 2, however, is the expansion of Sussex County to the full 6,000 foot runwaylength rather than 5,500 feet. This expansion will preserve a number of jobs at the Airport andtherefore is ranked higher in Alternatives 3 and 2 than in Alternative 1 with respect to thiscriterion.

Delaware State Aviation System Plan UpdateChapter 7 – Interim Report September 2012
R.A. Wiedemann & Associates, Inc. 7 8
For the Alternatives Analysis, runway improvements at Chorman (3,600 foot replacementrunway) and Summit (832 foot runway extension) were reserved for Alternative 3. These arecontingencies that may or may not occur. In addition, any improvements at Summit would beprivately funded, which will not constrain the public funding of other eligible Delawareairports. The replacement runway at Chorman would likely require some State fundingassistance.
However, the most significant contingency of the three involves the future of Dover AFB andthe associated development at the Civil Air Terminal. This contingency involves the full civilianjoint use of Dover AFB, either through agreement or through the BRAC realignment of one ormore military functions at facility. It is already likely that the Civil Air Terminal will bedeveloped so that supplemental air cargo carriers can use it for overnight parking and lightmaintenance, at a minimum. So the main impact of this contingency would be the ability tohave unrestricted civilian use of the airfield at the Base. If the facility is realigned via a BRACprocess, it is possible that following benefits of full joint use/civilian ownership of the Basecould occur:
Decreased need for expansion of Delaware Airpark (remains at 4,200 feet)Possible use of Base passenger terminal for potential airline serviceUse of the Base for civilian air cargo
Decreased need to restructure roadway access system to reach CAT with heavytrucks (can use main roads through Base)
Use of the Base for Maintenance/Repair/Overhaul (MRO) of large aircraftDecreased need to develop large hangar on CAT property for aircraft maintenance
Redevelopment of some Base facilitiesPotential relocation of small GA aircraft from private use airports to the Base
Of significance, the immediate savings to the future Delaware aviation system of having DoverAFB available for civilian use via the BRAC process was more than $42 million, not including thepotential redevelopment of Base facilities to other civilian uses. However, because such anoccurrence is considered extremely remote, it was not used in the evaluation scoring. Rather,a more realistic option – full civilian joint use simultaneous with ongoing military operations –was used as the most likely future occurrence for Dover AFB. For purposes of this analysis, fulljoint use without BRAC was assumed and ranked accordingly.
Impacts of the various contingencies described in Alternative 3 are considerable and will likelyhave a significant impact on the system. Each alternative was ranked in a simple scoringsystem equating to high, medium, and low positive impact. The alternative with the highestpositive impact was ranked first, followed by the lower positive impacts. As such, the rankingsshowed Alternative 3 first, Alternative 2 second, and Alternative 1 third with respect to theimpact of contingencies.

Delaware State Aviation System Plan UpdateChapter 7 – Interim Report September 2012
R.A. Wiedemann & Associates, Inc. 7 9
2. DESCRIPTION OF RECOMMENDED AVIATION SYSTEM
HE RECOMMENDED AVIATION SYSTEM WAS SELECTED in the previous section from the preferredalternative scoring. From that analysis, Alternative 3 emerged as the preferredalternative. As the recommended plan, it can be described in terms of the following:
Recommended Aviation SystemAirport RolesAirport FacilitiesCapital Cost Estimates
Other recommendations pertaining to the recommended system are presented in Chapter 8,Financial and Implementation Plan.
2.1 Recommended Aviation System
To say that Alternative 3 is the Recommended Aviation System leaves a number of specificquestions unanswered. In particular, which set of contingencies are most likely to occur andwhich are proverbial “long shots?” In this section, an outline of the most likely or reasonablefuture aviation system is projected. Much of the projections are based upon currentdevelopments throughout the State and an historical knowledge of aviation in Delaware.
Recommendations for the shape and character of the future aviation system can be brieflyidentified as follows:
Seven public use airports (including Dover AFB) and three private use airports (seeFigure 7 1) are included in the Recommended Aviation System. This is the samenumber of facilities and classifications as Alternative 3.
The three private use airports include Chandelle Estates, Jenkins, and Smyrna.Dover AFB is assumed to have full joint use capability and be available to the public foroperations. It is assumed that the military will continue its heavy lift air transportmission from the Base.
Delaware Airpark is assumed to remain at 4,200 feet of runway length (notexpanded further because of the full joint use of Dover AFB).It is possible and likely that the Civil Air Terminal will have some type of scheduledairline service.
Sussex County Airport is assumed to develop 6,000 feet of useable runway length.Summit Airport will extend their primary runway to 5,320’ but is expected to loseNPIAS funding eligibility prior to developing the extension.Chorman Airport will likely construct a replacement 3,600' X 60' runway with fullparallel taxiway.

Delaware State Aviation System Plan UpdateChapter 7 – Interim Report September 2012
R.A. Wiedemann & Associates, Inc. 7 10
While it is possible that New Castle Airport gain some type of airline service, it may notbe likely during the planning period.
With this future aviation system in mind, the following sections describe the individual airportroles, facilities, and costs associated with the Recommended Aviation System.
2.2 Airport Roles
An airport system is a group of interdependent airports, which work together toward theshared purpose of providing aviation services to operators and access to users of the system.Often, this system is not defined until a state or regional planning effort analyzes the interworkings of airports and identifies the system functionality. Throughout the State of Delawareeach airport plays a role which contributes toward that central purpose. The RecommendedAviation System, therefore, includes the future roles for each airport, based upon theprojected levels of demand along with input from current local airport planning work. Theseroles group airports into categories that relate to the air transportation service that eachoffers. For example, airports with only turf runways cater to a particular clientele that includestraining and recreational flyers. Similarly, full service paved runway airports can servicecorporate and business interests that require all weather airport operations and use.
Airport Reference Codes (ARC) are used by the FAA to classify airports to denote both theAircraft Approach Category and the Airplane Design Group capable of using the airport. Thisclassification system fits well in describing the role of the airport as it relates to the rest of theaviation system. In the Phase I study, definitions of the ARC categories were given. Eachcategory has two components: the aircraft approach category, and the airplane design group.The first component is depicted by a letter (A, B, C, D, or E) and is related to the aircraftapproach speed. The second component is depicted by a Roman numeral and is related to theairplane wingspan. The categories of each component are described as follows:
Aircraft Approach Category is based upon 1.3 times an aircraft's stall speed in theirlanding configuration at their maximum certificated landing weight:
A: Speed less than 91 knots.B: Speed 91 knots or more but less than 121 knots.C: Speed 121 knots or more but less than 141 knots.D: Speed 141 knots or more but less than 166 knots.E: Speed 166 knots or more
Airplane Design Group is based upon wingspan:I: Up to but not including 49 feet.II: 49 feet up to but not including 79 feet.III: 79 feet up to but not including 118 feet.

Delaware State Aviation System Plan UpdateChapter 7 – Interim Report September 2012
R.A. Wiedemann & Associates, Inc. 7 11
IV: 118 feet up to but not including 171 feet.V: 171 feet up to but not including 214 feet.VI: 214 feet up to but not including 262 feet.
Listed below are the roles for Delaware airports included in the Recommended AviationSystem.
A I and Less than A I Category Airports
For airports in Delaware, an A I ARC implies an airport with a paved runway that is at least2,400 feet in length by 60 feet in width. Airports with shorter recommended runway lengthsor widths or turf airports are classified as Less than A I category airports. There is only oneairport with these characteristics included in the Recommended Plan: Laurel Airport. WhileChandelle Estates, Jenkins Airport, and Smyrna Airport meet this classification, their collectivetransition to private use status removes them from the public system.
The role of Laurel Airport includes recreational flying, aerial application/spray business flying,parachute training, and pilot training. Laurel serves this demand and also fills a geographic“hole” in the State’s aviation service area in eastern Sussex County.
From an aviation demand standpoint, Laurel is anticipated to accommodate 18 based aircraftand 11,600 operations by the year 2030. While this is not a large number, the airport does fillimportant aviation and economic roles such as parachute training and crop spraying. It shouldbe noted that the three private use airports in this category are anticipated to accommodate acombined total of 35 based aircraft and 4,500 aircraft operations.
There is one heliport in the Recommended Aviation System – the DelDOT helistop. This facilityis rarely used and serves as a convenience to the Department of Transportation. As a publicuse facility, pilots desiring to use it typically check with DelDOT first. No improvements to thisfacility are planned over the period.
B I and B II Category Airports
B I and B II category airports included in the Recommended Aviation System have minimumrunway dimensions of 3,000 feet by 60 feet. Delaware airports in this group are:
Chorman AirportDelaware AirparkSummit Airport
The role of B I and B II airports is to accommodate a greater mix of business and transientaircraft than A I or smaller facilities, in addition to recreational and flight training operations.

Delaware State Aviation System Plan UpdateChapter 7 – Interim Report September 2012
R.A. Wiedemann & Associates, Inc. 7 12
The Recommended System Plan includes recommended airfield improvements, such asprimary runway lengthening and/or widening projects, to provide for added safety. ForChorman, it is anticipated that a new 3,600 foot runway will be developed. Delaware Airparkwill receive a new 4,200 foot runway, while Summit is likely to develop an 832 foot runwayextension to their existing 4,488 foot primary runway. The Recommended System Plan alsoestimates a combined need for 53 T hangar storage units, and roughly 11,000 square feet ofconventional hangar storage space at these three airports. All of these recommended airsideand landside improvements are responsive to forecast levels of demand, including the need toaccommodate over 39 percent of total annual operations in the State.
B III and Larger Category Airports
B III and larger category airports included in the Recommended Aviation System feature thefollowing three facilities:
Civil Air Terminal/Dover AFBNew Castle AirportSussex County Airport
The role of this group of airports is to provide full service, all weather air transportationfacilities for all types of aircraft from small, single engine aircraft to large corporate andbusiness jet aircraft. These facilities also offer opportunities for aviation related businesses tobe located on and/or adjacent to the airport. Such facilities are an integral part of local andregional economies, providing access to the national air transportation system for a widerange of business needs.
Civil Air Terminal/Dover AFB
While the Civil Air Terminal is not technically an airport, it is adjacent to Dover AFB the largestairport in Delaware. The Civil Air Terminal shares the runway system with Dover AFB forcurrently qualified civil aircraft operations. For the future, there are a number of possiblescenarios that are likely to change the use and character of the CAT. The RecommendedAviation System projects the following roles for the CAT:
Potential Full Civilian/Military Joint Use: If this joint use involves a Base Realignment,it will impact the actual development at the CAT. For example, if the Base is availablefor civilian aviation via Air Force mission realignment, many of the expansion plans forthe CAT would not be required. However, the Recommended Plan assumes full jointuse without military mission realignment. Thus, the CAT would be subject to capitalimprovement plans for its expansion.Potential Airline Service: Ongoing air service improvement efforts have identified anairline that desires to initiate service to Dover. Should this occur, the CAT terminal

Delaware State Aviation System Plan UpdateChapter 7 – Interim Report September 2012
R.A. Wiedemann & Associates, Inc. 7 13
building and parking area would be improved to accommodate this new passengerdemand.Wide body Jet Air Cargo Overnight Parking: There are plans underway to expand theCAT ramp to permit overnight parking by B 747 or similar aircraft used by supplementalcarriers in the Civil Reserve Aircraft Fleet military airlift program.NASCAR Race Aircraft Parking: The CAT will continue to serve as the location forNASCAR aircraft drop off and pick up during race weekends.
Total civilian operations at the CAT, not including the air cargo carrier overnight parking, isanticipated to be 5,500 by the year 2030.
New Castle Airport
New Castle Airport is poised to become a corporate airport of choice within the southPhiladelphia/northern Delaware Metroplex. However, there have been repeated suggestionsthat airline service be incorporated into the airport’s mission. In the past New Castle Airporthas had scheduled airline service and has produced a number of passengers. However, itsproximity to Philadelphia International Airport (PHL) and the decision of some low cost carriersto enter the PHL market have made it very difficult to sustain conventional airline service atNew Castle Airport.
For the Recommended Aviation System, New Castle Airport stands as the busiest generalaviation airport in Delaware. It is anticipated to accommodate 249 based aircraft and morethan 92,000 aircraft operations. Should airline service eventually be located at the airport, itwill likely increase the operational totals and will require terminal area improvements.However, if these changes occur, they will not significantly impact any other airports withinthe Recommended Aviation System.
Sussex County Airport
Current plans for Sussex County Airport are to extend their current runway to 6,000 feet ofuseable length. This will require the relocation of US 9T in order to achieve the needed runwaylength. It is anticipated that this runway extension will permit the aircraft modification andrefurbishment company (PATS) to accommodate larger aircraft. Ultimately, it is believed thatthis action will save the PATS jobs at Sussex County Airport. In addition, the runway extensionwill serve to make Sussex County Airport more competitive in the future with other jet capableairports in the region. The Recommended Aviation System projects that Sussex County Airportwill accommodate 82 based aircraft and 44,800 aircraft operations by the year 2030.

Delaware State Aviation System Plan UpdateChapter 7 – Interim Report September 2012
R.A. Wiedemann & Associates, Inc. 7 14
2.3 Airport Facilities
Tables 7 3 through 7 9 present summaries of individual airport facility recommendations. Thedescriptions and recommendations for many of these facilities reflect input from coordinationmeetings, master plans, and other fine tuning adjustments not previously shown. It should benoted that the facility recommendations in this plan are considered "minimum” requirementsin order to support an airport system to meet future needs. Development above these levelsshould be undertaken if aviation activity forecasts are exceeded, or local airport activityindicates a specific need. Such activity includes local economic growth such as corporateexpansions or relocations, which could increase operations, need for additional aircraftstorage, or air charter activity.
Table 7 3 Chorman AirportITEM Existing 2015 2020 2030 IncrementalFacility CharacteristicsOwnership Private Private Private PrivateARC Classification Less than B I Less than B I Less than B I B IInstrumentation None None None Non PrecisionRunway Configuration Single Single Single SinglePrimary RunwayDimensions 3,588' x 37' 3,588' x 37' 3,588' x 37' 3,600' x 60'
Runway Surface Asphalt Asphalt Asphalt AsphaltTaxiway Type Turn around Turn around Turn around ParallelDemand/CapacityBased Aircraft 19 21 22 25Annual Operations 13,200 14,600 15,300 17,300Annual Service Volume 53,100 53,100 53,100 53,100
Facility Needs Existing AdditionalPhase 1
AdditionalPhase 2
AdditionalPhase 3
IncrementalTotals
PAVING (s.y.) (s.y.) (s.y.) (s.y.) (s.y.)Runway Paving 14,750 24,000 24,000Runway OverlayTaxiway Paving 6,000 6,000Taxiway OverlayApron Paving 2,900 3,700 3,700Auto Parking 350 700 700BUILDINGS (s.f./Units) (s.f./Units) (s.f./Units) (s.f./Units) (s.f./Units)Terminal 500 500Conventional Hangars 48,760T Hangars 8LIGHTING/NAVAIDS (linear ft./ (linear ft./ (linear ft./ (linear ft./ (linear ft./

Delaware State Aviation System Plan UpdateChapter 7 – Interim Report September 2012
R.A. Wiedemann & Associates, Inc. 7 15
Table 7 3 Chorman AirportITEM Existing 2015 2020 2030 Incremental
Units) Units) Units) Units) Units)
Runway Lighting 3,588' LIRL 3,588' LIRL 3,588' LIRL 3,600' MIRL 3,600' MIRLVAGL 2REIL 2 2Legend: LIRL=Low Intensity Runway Lights; MIRL=Medium Intensity Runway Lights; VAGL=Visual ApproachGuidance Lights; REIL=Runway End Identifier Lights
Table 7 4 Delaware AirparkITEM Existing 2015 2020 2030 IncrementalFacility CharacteristicsOwnership Public Public Public PublicClassification B I B II B II B IIInstrumentation Non Precision Non Precision Non Precision Non PrecisionRunway Configuration Single Single Single SinglePrimary RunwayDimensions 3,582' x 60' 4,200' x 75' 4,200' x 75' 4,200' x 75'
Runway Surface Asphalt Asphalt Asphalt AsphaltTaxiway Type Parallel Parallel Parallel ParallelDemand/CapacityBased Aircraft 56 61 65 74Annual Operations 22,650 24,600 26,300 29,900Annual Service Volume 171,300 171,300 171,300 171,300
Facility Needs Existing AdditionalPhase 1
AdditionalPhase 2
AdditionalPhase 3
IncrementalTotals
PAVING (s.y.) (s.y.) (s.y.) (s.y.) (s.y.)Runway Paving 23,880 35,000 35,000Runway OverlayTaxiway Paving 10,728 8,626 8,626Taxiway Overlay 23,880 23,880Apron Paving 11,222Auto Parking 1,470 350 350 350 1,050BUILDINGS (s.f./Units) (s.f./Units) (s.f./Units) (s.f./Units) (s.f./Units)Terminal 3,400Conventional Hangars 6,800 10,900 10,900T Hangars 18 12 14 18 44
LIGHTING/NAVAIDS (linear ft./Units)
(linear ft./Units)
(linear ft./Units)
(linear ft./Units)
(linear ft./Units)
Runway Lighting 3,582 4,200 4,200VAGL 2 2

Delaware State Aviation System Plan UpdateChapter 7 – Interim Report September 2012
R.A. Wiedemann & Associates, Inc. 7 16
Table 7 4 Delaware AirparkITEM Existing 2015 2020 2030 IncrementalREIL 2 2Legend: VAGL=Visual Approach Guidance Lights; REIL=Runway End Identifier Lights
Table 7 5 Civil Air Terminal/Dover AFB (Full Joint Use)ITEM Existing 2015 2020 2030 Incremental
Facility CharacteristicsOwnership Public/Military Public/Military Public/Military Public/MilitaryClassification E VI E VI E VI E VIInstrumentation Precision Precision Precision PrecisionRunway Configuration Intersecting Intersecting Intersecting IntersectingPrimary RunwayDimensions 9,602' x 200' 9,602' x 200' 9,602' x 200' 9,602' x 200'
Runway Surface Asphalt Asphalt Asphalt AsphaltTaxiway Type Parallel Parallel Parallel ParallelDemand/CapacityBased Aircraft 21Annual Operations 600 800 1,000 5,500Annual Service Volume 13,700 13,700 13,700 230,000
Facility Needs Existing AdditionalPhase 1
AdditionalPhase 2
AdditionalPhase 3
IncrementalTotals
PAVING (s.y.) (s.y.) (s.y.) (s.y.) (s.y.)Runway Paving 428,430Runway OverlayTaxiway Paving 327,800Taxiway OverlayApron Paving (CAT) 31,415 63,700 63,700Auto Parking 2,100 3,500 3,500BUILDINGS (CAT) (s.f./Units) (s.f./Units) (s.f./Units) (s.f./Units) (s.f./Units)Terminal 1,980 4,000 4,000Conventional Hangars 19,600 19,600T Hangars 11 11
LIGHTING/NAVAIDS (linear ft./Units)
(linear ft./Units)
(linear ft./Units)
(linear ft./Units)
(linear ft./Units)
Runway Lighting 22,505VAGL 4REIL 4Legend: VAGL=Visual Approach Guidance Lights; REIL=Runway End Identifier Lights

Delaware State Aviation System Plan UpdateChapter 7 – Interim Report September 2012
R.A. Wiedemann & Associates, Inc. 7 17
Table 7 6 Laurel AirportITEM Existing 2015 2020 2030 IncrementalFacility CharacteristicsOwnership Private Private Private PrivateClassification Less than A I Less than A I Less than A I Less than A IInstrumentation Non Precision Non Precision Non Precision Non PrecisionRunway Configuration Single Single Single SinglePrimary RunwayDimensions 3,175' x 230' 3,175' x 230' 3,175' x 230' 3,175' x 230'
Runway Surface Turf Turf Turf TurfTaxiway Type Turf Turf Turf TurfDemand/CapacityBased Aircraft 14 15 16 18Annual Operations 8,950 9,600 10,200 11,600Annual Service Volume 32,200 32,200 32,200 32,200
Facility Needs Existing AdditionalPhase 1
AdditionalPhase 2
AdditionalPhase 3
IncrementalTotals
PAVING (s.y.) (s.y.) (s.y.) (s.y.) (s.y.)Runway Paving NoneRunway Overlay NoneTaxiway Paving NoneTaxiway Overlay NoneApron Paving NoneAuto Parking NoneBUILDINGS (s.f./Units) (s.f./Units) (s.f./Units) (s.f./Units) (s.f./Units)Terminal 290Conventional Hangars 6,900T Hangars 20
LIGHTING/NAVAIDS (linear ft./Units)
(linear ft./Units)
(linear ft./Units)
(linear ft./Units)
(linear ft./Units)
Runway Lighting NoneVAGL NoneREIL 1 1 1Legend: VAGL=Visual Approach Guidance Lights; REIL=Runway End Identifier Lights
Table 7 7 New Castle AirportITEM Existing 2015 2020 2030 IncrementalFacility CharacteristicsOwnership Public Public Public PublicClassification D III D III D III D IIIInstrumentation Precision Precision Precision Precision

Delaware State Aviation System Plan UpdateChapter 7 – Interim Report September 2012
R.A. Wiedemann & Associates, Inc. 7 18
Table 7 7 New Castle AirportITEM Existing 2015 2020 2030 IncrementalRunway Configuration Intersecting Intersecting Intersecting IntersectingPrimary RunwayDimensions 7,012' x 150' 7,012' x 150' 7,012' x 150' 7,012' x 150'
Runway Surface Asphalt Asphalt Asphalt AsphaltTaxiway Type Parallel Parallel Parallel ParallelDemand/CapacityBased Aircraft 189 205 219 249Annual Operations 78,840 84,800 90,000 101,000Annual Service Volume 194,000 194,000 194,000 194,000
Facility Needs Existing AdditionalPhase 1
AdditionalPhase 2
AdditionalPhase 3
IncrementalTotals
PAVING (s.y.) (s.y.) (s.y.) (s.y.) (s.y.)Runway Paving 314,817Runway Overlay 314,817 314,817Taxiway Paving 352,636Taxiway Overlay 352,636 352,636Apron Paving 74,102 9,900 9,900Auto Parking 16,590BUILDINGS (s.f./Units) (s.f./Units) (s.f./Units) (s.f./Units) (s.f./Units)Terminal 27,200Conventional Hangars 570,000T Hangars 72
LIGHTING/NAVAIDS (linear ft./Units)
(linear ft./Units)
(linear ft./Units)
(linear ft./Units)
(linear ft./Units)
Runway Lighting 18,889VAGL 4REIL 3Legend: VAGL=Visual Approach Guidance Lights; REIL=Runway End Identifier Lights
Table 7 8 Summit AirportITEM Existing 2015 2020 2030 IncrementalFacility CharacteristicsOwnership Private Private Private PrivateClassification B II B II B II B IIInstrumentation Non Precision Non Precision Non Precision Non PrecisionRunway Configuration Intersecting Intersecting Intersecting IntersectingPrimary RunwayDimensions 4,488' x 65' 4,488' x 65' 5320' x 65' 5320' x 65'
Runway Surface Asphalt Asphalt Asphalt AsphaltTaxiway Type Parallel Parallel Parallel Parallel

Delaware State Aviation System Plan UpdateChapter 7 – Interim Report September 2012
R.A. Wiedemann & Associates, Inc. 7 19
Table 7 8 Summit AirportITEM Existing 2015 2020 2030 IncrementalDemand/CapacityBased Aircraft 43 47 50 57Annual Operations 41,400 45,400 48,200 55,000Annual Service Volume 170,800 170,800 170,800 170,800
Facility Needs Existing AdditionalPhase 1
AdditionalPhase 2
AdditionalPhase 3
IncrementalTotals
PAVING (s.y.) (s.y.) (s.y.) (s.y.) (s.y.)Runway Paving 32,413 6,010 6,010Runway Overlay 32,413 32,413Taxiway Paving 14,020 3,333 3,333Taxiway Overlay 14,020 14,020Apron Paving 48,720Auto Parking 4,375 3,500 3,500 7,000BUILDINGS (s.f./Units) (s.f./Units) (s.f./Units) (s.f./Units) (s.f./Units)Terminal 10,200Conventional Hangars 33,000T Hangars 31 9 9
LIGHTING/NAVAIDS (linear ft./Units)
(linear ft./Units)
(linear ft./Units)
(linear ft./Units)
(linear ft./Units)
Runway Lighting 4,488 832 832VAGL 2REIL 2Legend: VAGL=Visual Approach Guidance Lights; REIL=Runway End Identifier Lights
Table 7 9 Sussex County AirportITEM Existing 2015 2020 2030 IncrementalFacility CharacteristicsOwnership Public Public Public PublicClassification B III B III C III C IIIInstrumentation Non Precision Non Precision Precision PrecisionRunway Configuration Intersecting Intersecting Intersecting IntersectingPrimary RunwayDimensions 5,000' x 150' 5,000' x 150' 6,000' x 150' 6,000' x 150'
Runway Surface Asphalt Asphalt Asphalt AsphaltTaxiway Type Parallel Parallel Parallel ParallelDemand/CapacityBased Aircraft 62 67 72 82Annual Operations 33,900 36,600 39,400 44,800Annual Service Volume 174,500 174,500 174,500 174,500

Delaware State Aviation System Plan UpdateChapter 7 – Interim Report September 2012
R.A. Wiedemann & Associates, Inc. 7 20
Table 7 9 Sussex County AirportITEM Existing 2015 2020 2030 Incremental
Facility Needs Existing AdditionalPhase 1
AdditionalPhase 2
AdditionalPhase 3
IncrementalTotals
PAVING (s.y.) (s.y.) (s.y.) (s.y.) (s.y.)Runway Paving 109,242 16,667 16,667Runway Overlay 109,242 109,242Taxiway Paving 49,444 8,889 8,889Taxiway Overlay 49,444 49,444Apron Paving 45,628Auto Parking 8,400BUILDINGS (s.f./Units) (s.f./Units) (s.f./Units) (s.f./Units) (s.f./Units)Terminal 6,150Conventional Hangars 213,850T Hangars 18 10 10
LIGHTING/NAVAIDS (linear ft./Units)
(linear ft./Units)
(linear ft./Units)
(linear ft./Units)
(linear ft./Units)
Runway Lighting 8,109 1,000 1,000VAGL 4REIL 4Legend: VAGL=Visual Approach Guidance Lights; REIL=Runway End Identifier Lights
2.4 Capital Cost Estimates
Capital development costs for the Recommended Aviation System were estimated to total$96,556,400. These cost estimates correspond to the recommended facility developmentschedules shown previously in this System Plan, but do not include engineering and/orcontingency fees. In this analysis, both publicly and privately owned airports were shown asrequiring facility development or capital maintenance. Several sources were used indeveloping cost estimates to assure that relatively accurate costs were derived. These sourcesincluded:
RSMeans construction cost data.1
Cost data from other statewide aviation planning documents.Examination of Airport Capital Improvement Plans (ACIPs) filed with the FAA.
Obstruction removal costs, estimated in Chapter 6, were included in each future planningphase to show an approximate need for those funding resources. In this regard, the removalcosts were divided equally among the planning periods, reflecting a consistent annual fundingeffort to improve aviation system safety.
1 Source: http://rsmeans.reedconstructiondata.com/

Delaware State Aviation System Plan UpdateChapter 7 – Interim Report September 2012
R.A. Wiedemann & Associates, Inc. 7 21
Total capital costs have been assigned to short, intermediate, and long term phases, inrecognition that some portion of total capital development costs will be expended in soonerthan others, depending on demand placed on the airport. Table 7 10 presents these costswhich show $29,658,700 for Phase 1, $17,435,800 for Phase 2, and $49,461,900 for the longrange period.
Table 7 10 Airport CostsAirport Phase 1 Phase 2 Phase 3 Total
Chorman Airport $0 $0 $4,378,500 $4,378,500
Delaware Airpark $19,863,700 $2,702,500 $2,203,300 $24,769,500
DelDOT Helistop $0 $0 $0 $0
Dover AFB CAT $8,774,500 $0 $4,685,000 $13,459,500
Laurel Airport $75,000 $0 $0 $75,000
New Castle Airport $0 $0 $24,697,400 $24,697,400
Summit Airport $175,000 $1,848,100 $1,800,200 $3,823,300
Sussex County Airport $0 $11,344,200 $6,304,000 $17,648,200
Obstruction Removal Costs $770,500 $1,541,000 $5,393,500 $7,705,000Total $29,658,700 $17,435,800 $49,461,900 $96, 556,400
It should be noted that these costs estimates are just that estimates. More detailed studies(master planning) must be undertaken to calculate precise cost figures, which can be used toprocure bids for design, engineering, and construction.

Delaware State Aviation System Plan UpdateChapter 7 – Interim Report September 2012
R.A. Wiedemann & Associates, Inc. 7 22
3. SUMMARY
N SUMMARY, IT CAN BE STATED THAT there are a number of changes that are anticipated forDelaware’s aviation system over the next 20 years. These changes are related to the futureimpacts of technology, fuel prices, aircraft costs, declining pilot population, and the
growing need for business aviation. The Recommended Aviation System Plan for Delawareincorporates the following predictions:
It is likely that Dover AFB will become a full joint use facility for civilian and militaryaircraft operations.The Civil Air Terminal is projected to become an air cargo overnight parking facility,with significant infrastructure improvements including more than 60,000 square yardsof reinforced pavement capable of accommodating multiple wide body jet aircraft.It is likely that three privately owned, public use airports will become private useairports within the planning period:
Chandelle EstatesJenkinsSmyrna
Chorman Airport is anticipated to develop a new runway at some point during theplanning period.Because of the anticipated joint use at Dover AFB, Delaware Airpark is projected toexpand to only 4,200 feet of runway length throughout the planning period.Laurel Airport is projected to remain within the public use system because of itsimportant training role for skydivers and its aerial spray operations.New Castle Airport is anticipated to continue its focus on corporate aviation. However,there may be some movement toward airline activity accommodation toward the endof the planning period.Summit Airport is anticipated to expand its runway by 832 feet for a total of 5,320 feet.Sussex County Airport is projected to expand its runway to 6,000 feet of useable length.
The cost of the Recommended Aviation System is estimated at $96.6 million for all threeperiods. In the next Chapter of this report, a detailed discussion of the funding requirements,by eligible agency will be undertaken. In addition, recommendations for policy issues,implementation process, and contingency planning will be presented.

Chapter 8: Financial and Implementation Plan

Delaware State Aviation System Plan UpdateInterim Report Chapter 8 September 2012
R.A. Wiedemann & Associates, Inc. 8 1
Financial and Implementation Plan
HE PURPOSE OF THIS CHAPTER IS TO describe the financial plan along with the recommendedmethods, policies, and action steps necessary to implement the Recommended AviationSystem. In addition, recommendations for other continuing aviation system planning
are made as a part of this report. The chapter is organized to include the following sections:
Financial PlanCapital Improvement ProgramCapital Funding Eligibility
Implementation PlanImplementation Strategy – ACV InputContinuing Planning Process
1. FINANCIAL PLAN
HE PURPOSE OF THE FINANCIAL PLAN IS to determine the costs and appropriate funding sourcesfor the Recommended Aviation System Plan. To do this, information was usedconcerning the overall capital requirements, the eligibility status of each improvement
project for Federal, State, local, and private funding, and the sources and amounts ofanticipated funding availability. Discussed below are each of the components of the financialplan for the Recommended Aviation System.
1.1 Capital Improvement Program
The capital improvement program for the Recommended Aviation System has been identifiedby short (2010 2015), intermediate (2016 2020), and long range (2021 2030) system needs.These costs and improvements were staged with respect to the forecasted levels of systemdemand and capacity to bring all airports to their desired system standards in the appropriatetime frame.
The total cost of developing the recommended system of airports in Delaware has beensummarized for each airport by time period and eligible funding source and is presented inTable 8 1. The total cost in 2012 dollars for the 20 year (2010 2030) program is estimated at$96,556,400. As shown in Table 8 1, four sources of funds are expected to finance thedevelopment program. Projected financial needs from each of those sources are as follow:

Delaware State Aviation System Plan UpdateInterim Report Chapter 8 September 2012
R.A. Wiedemann & Associates, Inc. 8 2
Federal Funding: $65,497,900State Funding: $14,767,400Local Funding: $5,659,100Private Funding: $10,632,000TOTAL $96,556,400
The calculation of these costs estimates relied upon a number of assumptions regardingFederally eligible projects, and those funded through State, Local/Sponsor, and Privateresources.
Table 8 1 Airport Funding EligibilitySASP Facility 2015 2025 2030 Total CostsChorman Airport $0 $0 $4,378,500 $4,378,500Federal $0 $0 $0 $0State $0 $0 $3,356,100 $3,356,100Local $0 $0 $522,900 $522,900Private $0 $0 $499,500 $499,500
Total $0 $0 $4,378,500 $4,378,500Civil Air Terminal/Dover AFB $8,774,500 $0 $4,685,000 $13,459,500Federal $7,739,600 $0 $0 $7,739,600State $430,000 $0 $0 $430,000Local $605,000 $0 $920,000 $1,525,000Private $0 $0 $3,765,000 $3,765,000
Total $8,774,500 $0 $4,685,000 $13,459,500Delaware Airpark $19,863,700 $2,702,500 $2,203,300 $24,769,500Federal $17,051,600 $0 $752,200 $17,803,800State $947,300 $0 $41,800 $989,100Local $964,800 $17,500 $59,300 $1,041,600Private $900,000 $2,685,000 $1,350,000 $4,935,000
Total $19,863,700 $2,702,500 $2,203,300 $24,769,500Laurel Airport $0 $0 $0 $0Federal $0 $0 $0 $0State $67,500 $0 $0 $67,500Local $0 $0 $0 $0Private $7,500 $0 $0 $7,500
Total $75,000 $0 $0 $75,000

Delaware State Aviation System Plan UpdateInterim Report Chapter 8 September 2012
R.A. Wiedemann & Associates, Inc. 8 3
Table 8 1 Airport Funding EligibilitySASP Facility 2015 2025 2030 Total CostsNew Castle Airport $0 $0 $24,697,400 $24,697,400Federal $0 $0 $22,227,600 $22,227,600State $0 $0 $1,234,900 $1,234,900Local $0 $0 $1,234,900 $1,234,900Private $0 $0 $0 $0
Total $0 $0 $24,697,400 $24,697,400Summit Airport $175,000 $1,848,100 $1,800,200 $3,823,300Federal $0 $1,055,800 $1,462,600 $2,518,500State $0 $58,700 $81,300 $139,900Local $175,000 $58,700 $256,300 $489,900Private $0 $675,000 $0 $675,000
Total $175,000 $1,848,100 $1,800,200 $3,823,300Sussex County Airport $0 $11,344,200 $6,304,000 $17,648,200Federal $0 $10,209,800 $4,998,600 $15,208,400State $0 $567,200 $277,700 $844,900Local $0 $567,200 $277,700 $844,900Private $0 $0 $750,000 $750,000
Total $0 $11,344,200 $6,304,000 $17,648,200Obstruction Removal
State $770,500 $1,541,000 $5,393,500 $7,705,000Total SASP Funding Sources
Federal $24,791,200 $11,265,600 $29,441,000 $65,497,900State $2,215,300 $2,166,900 $10,385,300 $14,767,400Local $1,744,800 $643,400 $3,271,100 $5,659,200Private $907,500 $3,360,000 $6,364,500 $10,632,000
Total $29,658,800 $17,435,900 $49,461,900 $96,556,500
1.2 Capital Funding Eligibility
Capital funding eligibility is based upon a number of factors including the type of project, thetype of sponsorship at the airport in question, and its eligibility and priority for FAA AirportImprovement Program (AIP) funding. Funding descriptions for each of the categories describedabove are presented in the following paragraphs.

Delaware State Aviation System Plan UpdateInterim Report Chapter 8 September 2012
R.A. Wiedemann & Associates, Inc. 8 4
Federal Funding
The largest single source for airport development funds is the Federal government. Mostairport development items such as land, runways, taxiways, and apron areas are eligible for 90percent Federal participation at publicly owned airports and some grandfathered relieverairports (regardless of ownership). At New Castle, Delaware Airpark, and Sussex Countyairports, eligible projects include the planning, design, and construction of projects associatedwith public use non revenue generating facilities and equipment of the Airport. Typical AIPeligible projects include: airport master plans and airport layout plans; land acquisition and sitepreparation, airfield pavements, e.g. runways, taxiways, and transient aprons; lighting andnavigational aids; safety, security, and snow removal equipment; selected passenger terminalfacilities; and obstruction identification and removal. Highest funding priority according toFAA’s rating procedure is generally given those projects that are safety related such asobstruction removal, runway safety area improvements and facility improvements to meetcurrent FAA Airport Design Standards.
The most recent legislation enacted to authorize funding for FAA projects is the FAAModernization and Reform Act of 2012. The law is designed to provide the FAA with $63.6billion between 2012 and 2015. It is important to note, that this Reauthorization Act includesfunding eligibility for some revenue producing facilities such as fuel farms and hangars atnonprimary airports. These items can be supported by the eligible airport’s nonprimaryentitlement funding if the airport sponsor has made adequate provision for financing airsideneeds of the airport.
Of the capital improvements needed for the Recommended Aviation System Plan by the year2030, nearly $65.5 million are eligible for Federal funding. Over the 20 year planning period,the total requirement averages almost $3.3 million annually. Based on the historical record ofAIP apportionment funding for Delaware airports, it is clear that this total is significantly largerthan historical contributions of FAA to the State’s airports. For example, FY 2012Apportionment funding for Delaware is roughly $402,000 – significantly below the average$3.3 million needed. Therefore, Delaware will need a considerable amount of FAAdiscretionary funding to achieve capital development funding for the Recommended AviationSystem.
State Funding
An amendment to the Aeronautics Code in 1996 changed the scope of State funding to includeprivately owned public use airports. In this regard, the State is empowered to fund any publicuse airport whether privately owned or publicly owned in the acquisition, development,operation, or maintenance of the facility. Sources of funds for these projects can be generatedthrough fees, taxes, and other sources applicable to aeronautics and administered by DelDOTand its Office of Aeronautics. This considerably broader scope of funding capability has

Delaware State Aviation System Plan UpdateInterim Report Chapter 8 September 2012
R.A. Wiedemann & Associates, Inc. 8 5
positively impacted the continuing viability of the privately owned airports in Delaware.However, it has increased the need for State aviation funding.
The estimate of State funding needed for airport improvements listed in the RecommendedAviation System Plan is approximately $7 million through the year 2030. However, additionalfunding of $7.7 million is necessary for airport obstruction removal. Together, these systemimprovements increase the level of State funding required to $14.77 million through 2030.
Legislative proposals have been made that will broaden the revenue collection base for theState by imposing registration fees for aircraft registered in Delaware and the imposition of anew tax on Jet A fuel amounting to $0.05 per gallon. For both of these new fees, a dedicatedfund for aviation would be created, assuring aviation users that their funds are being recycledinto the aviation system.
Local Share Funding
Local airport sponsors such as counties, municipalities, other political subdivisions, or privateowners are responsible for costs associated with airport development projects that remainafter Federal and State shares have been applied. The cost of projects not eligible for Federalor State funds is paid through local or private funds and is wholly the responsibility of the localsponsor. For publicly owned airports, this sponsor share of the eligible project cost is asfollows:
5 percent for Federally eligible projectsVariable percentage for non FAA eligible projects where State funds are used.1
100 percent for non Federal and non State eligible projects.
For privately owned airports, the private owner share is 100 percent for the non State eligibleprojects (no private airports in Delaware are now eligible for Federal funding).
Local sponsors of publicly owned Delaware SASP airports have been identified as the sourcefor almost $5.7 million in capital development projects enumerated in this plan. Just as withthe State estimate, this does not include numerous discretionary projects, maintenanceprograms, or equipment purchases that public use airports may require during the planningperiod. Local airport sponsors must rely upon funding from four primary sources:
Airport Generated RevenuesLoans Based on Anticipated RevenuesGeneral Fund Revenues (for publicly owned airports)Bond Issues
1 State funding procedures in this area are not precise.

Delaware State Aviation System Plan UpdateInterim Report Chapter 8 September 2012
R.A. Wiedemann & Associates, Inc. 8 6
Airport generated revenues are available to both public and private airport sponsors. Generalfund revenues and bond issues are typically only available to public airport sponsors that havetaxing authority.
Airport Generated Revenues
Owners and operators of profitable airports use operating revenues to fund the sponsor shareof development funds. In Delaware, the privately owned airports must be profitable or at leastbreak even over the long term in order to survive. Whether there is money available forcapital development after operating expenses have been paid will differ by airport. In thepast, New Castle Airport has been the only publicly owned airport in the State to have beenfinancially self sufficient except for certain large capital improvement projects. Sussex CountyAirport and Delaware Airpark have required operating subsidies. However, with the decreasein projected capital funding by FAA there is an increasing emphasis on airport self funding forboth operating costs and capital projects. With this in mind, typical revenue sources at generalaviation airports include:
Fuel Flowage FeesAircraft Storage Fees and Tie Down FeesRents and LeasesSales and ServiceOther Miscellaneous Fees
Experience has shown that only large general aviation airports in busy metropolitan areas cansuccessfully charge landing fees. Landing fees at other less congested general aviation airportstends to drive users away to the non landing fee facilities.
General Fund Revenues
General fund revenues refer to tax supported financing of airport operations and capitaldevelopment programs. General funds are derived from tax revenues that have not beendirected toward a specific area or project as a prerequisite to their collection. The amount ofgeneral fund support for airport improvement projects is based upon the local tax base,priority of the development project, historical funding trends and, of course, local attitudesconcerning the importance of aviation.
Bond Issues
Bond issues that fund the local share of airport development projects must compete withbond issues for other types of community improvements, schools, highways, and sewersystems. In addition, limitations on municipal debt are imposed for all counties in Delaware.

Delaware State Aviation System Plan UpdateInterim Report Chapter 8 September 2012
R.A. Wiedemann & Associates, Inc. 8 7
Most general aviation airports do not qualify for revenue bond issues because they do notearn surplus revenues capable of paying off such bonds. Rather, general obligation bondswould be used if debt financing was required for an airport project. General obligation bondsare based on the full faith and credit of the issuer and do not depend upon revenue from thespecific project. Like the general fund apportionment, bond issues supporting airportdevelopment depend greatly on the priority assigned to such projects by the local community.
Private Funding
Privately owned, public use facilities are not eligible for Federal funding for capitalimprovement projects. Therefore, improvements must be funded by the airport owner,and/or other sources that can be identified. In the Recommended Aviation System Plan,improvements at Chorman Airport were assumed to be funded by State grants. Laurel Airporthas only one significant capital cost identified during the planning period – a visual approachslope indicator. The other privately owned airports, Chandelle Estates, Jenkins, and SmyrnaAirport were assumed to become private use facilities and thus, not be counted as a part ofthe public use system in the long term.
Private enterprise funding of capital development is defined as the funding needed to supportall non governmentally eligible projects. The system plan calls for some State funding at twoprivate airports (Chorman and Laurel) for which, private enterprise funding will be needed forthe local share match. Private funding for the Recommended Aviation System Plan is neededfor the development of conventional hangars and T hangars, and for matching funds forrunway/taxiway development at Chorman and for visual approach slope aids at Laurel. A totalof over $10.6 million of investment is needed from private sources through the year 2030.
Due to the nature of private enterprise and free market economics, there is no way to forecastlevels of private capital that may be available. Market forces of supply and demand willdetermine prices and decisions to invest will likely be based on risk, general economic health,and the outlook of the aviation industry. Therefore, it can only be assumed that privateinvestment will occur if sufficient profit is available for the project. If private investment isslow to materialize, it is assumed that non operational, revenue producing projects will bepostponed into the future.

Delaware State Aviation System Plan UpdateInterim Report Chapter 8 September 2012
R.A. Wiedemann & Associates, Inc. 8 8
2. IMPLEMENTATION PLAN
HE IMPLEMENTATION PLAN DESCRIBES SPECIFIC METHODS FOR accomplishing therecommendations in the Delaware State Aviation System Plan Update. These methodswere developed to ensure the practicality and flexibility of the plan. To adequately
address the implementation strategies, this section is organized to include the following:
Implementation Strategy – ACV InputContinuing Planning Process
2.1 Implementation Strategy – ACV Input
For this system plan update, one strategy that was developed for Plan implementationinvolved the use of the Airport/Community Value (ACV) scores from recent work that could beupdated and modified to provide benchmarks for capital spending, similar to other modes oftransportation. These benchmarks or Areport cards@ on DelDOT spending will help theDepartment spend its resources in accordance with the system plan. In addition, it isimportant to show when the Office of Aeronautics invests in the system, they are actuallymoving the system forward/improving its performance.
ACV Description
ACV metrics employed in this plan are both the estimate of economic impact (total output)combined with estimates of the existing value of an airport. This method is analogous toexamining both an income statement and a balance sheet when looking at the financial healthof a business. These baseline values can then be subjected to a number of sustainabilityassessment factors called Economic Sustainability Factors (ESF) in reaching a future estimate ofan overall Airport Community Value.
Both traditional and new methods of economic impact analysis are used in this process. The“Airport Community Value” method incorporates familiar measures of job, income, and totaloutput figures along with new metrics for estimating the value of an airport to a community.The process adds the existing value components and establishes a base year ESF score for eachairport. For the future, the operational economic activity plus any capital investment ismultiplied by the change in future ESF to yield the actual value of the future airportinvestments. This total is then added to the future (depreciated or appreciated) value of theairport to arrive at a future ACV. Thus, there are “before” and “after” ACV sets showingexisting and future projected values. It is the future projected values that will have thegreatest impact on system planning funding recommendations and priorities in this analysis.The measures include the following factors:

Delaware State Aviation System Plan UpdateInterim Report Chapter 8 September 2012
R.A. Wiedemann & Associates, Inc. 8 9
Existing Value ComponentsEconomic Impacts From ActivityAirport Property and Facility Value
Replacement ValueCurrent Costs of Facilities Based on Useful Life Estimates
Economic Sustainability Factors (Sustainability Assessment)Regional Airport Resource Factor
Geographic CoverageAirport Protection Factor
Land Use and Zoning Controls around AirportLocation/AccessBusiness Use Index
Multi engine PropellerBusiness Jet
Expandability FactorAirside, Landside
Community Commitment FactorPlans on FileCommunity Use of Airport
Future Value AdditionsEconomic Impacts From Future Activity
Recommended Plan Impacts IncludedAirport Replacement Value
Recommended Plan Capital Spending IncludedEconomic Sustainability Factors
Proactive Measures That Can Increase or Decrease Airport Investment Value
A community can, at any time change its future ACV by undertaking actions impacting theEconomic Sustainability Factors (ESF). For example, by lengthening a runway, an airport mayincrease its accommodation of business aviation, raising its Business Use Index (BUI). If thecommunity is willing to commit dollars to capital improvements, this can increase theCommunity Commitment Factor (CCF) and so on. Taken together, these proactive measurescan increase the value of an airport to a community. Local and regional planners as well asdecision makers can use this tool to measure their airports’ ACV and to estimate return oninvestment from their future capital contributions. Figure 8 1 presents a graphic illustration ofthe ACV estimation process. Methods for collecting or developing these measures aredescribed in the following subsections.

Delaware State Aviation System Plan UpdateInterim Report Chapter 8 September 2012
R.A. Wiedemann & Associates, Inc. 8 10
Existing Value Components
Existing value components were estimated through the system planning process using existingeconomic impact assessment numbers. This includes the number of existing jobs, the amountof income produced, and the total output for each system airport. In addition to the economicimpact, an estimate of the current value of the system airport were developed, using areplacement cost basis or replacement value minus useful life estimates of existing facilities.These numbers will be updated in 2013, but they are not the specific components thatdetermine future airport investment value. Rather, the ESF changes are used in thatdetermination.
Figure 8 1 – Airport Community Value Modeling Process
Source: R.A. Wiedemann & Associates, Inc.
ExistingEconomic Impact
Future Additions(EconomicImpact Plus capitalExpenditures)
ExistingReplacement Value
Future Airport Value(based on incrementaladditions)
Regional Contribution Factor
Airport Protection
Factor
Location and Access Factor Airport
Community Value
ValueComponents
Existing Economic Sustainability Factors
Business Use Use Index
Expandability Factor
+
Community Commitment
Factor
Existing Value (based on useful life) +
Future Value Additions
=
Future Airport Community Value +
Regional Contribution Factor
Airport Protection
Factor
Location and Access Factor
Business Use Use Index
Expandability Factor
Community Commitment
Factor
Economic Sustainability Factors
X

Delaware State Aviation System Plan UpdateInterim Report Chapter 8 September 2012
R.A. Wiedemann & Associates, Inc. 8 11
Economic Sustainability Factors (Sustainability Assessment)
The existing values for economic impact and airport replacement costs offer a baselineestimate of overall economic value. However, this value is a static snapshot of a constantlymoving economic flow. The six primary factors that modify these values are discussed below.
Regional Airport Resource Factors
Airports are regional resources that serve areas beyond their immediate sponsors’ politicalboundaries. As entry points to the nation’s airspace system, airports can be considered “onramps” to the national air transportation system. A loss of such a facility reduces the overallservice level of the national and regional system to some degree. The regional system planshould place a value on the on going operations or expansion of each airport as a resourceworthy of protection. Although it can be argued that all airports contribute to their localcommunities, this value differs on a case by case basis. This value can be estimated on asystems level using geographic coverage as one parameter. Using normal system planningguidelines of geographic coverage, a rating system should include:
The classification of airport type (jet capable, single engine, etc.), which indicates theservice level available at that location.The population served by the airport as measured within 30 minutes of driving.
Loss of an airport in any category would be scored negatively using a point system definedlater in this section.
Airport Protection Factor
Communities that take measures to protect their airports are increasing the value of theirinvestment. Protection of airport facilities includes any action that increases land use andzoning controls to ensure compatible land uses near the site. This also includes appropriateheight hazard zoning. Scoring this factor involves the following primary components:
Control of Runway Protection ZoneRunway Safety Areas in PlaceLand Use CompatibilityHeight Hazard Zoning for AirportOther Protective Zoning for the Airport
Location/Access Factor
When speaking of location or access, the factor being measured is convenience. The primaryreason for using air transportation is to save travel time. In this regard, access to an airport by

Delaware State Aviation System Plan UpdateInterim Report Chapter 8 September 2012
R.A. Wiedemann & Associates, Inc. 8 12
ground is critical. The relative ease by which an airport can be accessed increases its value tothe local community and to the regional system of airports. Similarly, the location of theairport relative to the community it serves is a factor that increases convenience for users.Scoring for this factor includes the following two primary criteria:
Surface access within three miles of the airport on interstate, regional arterial, localarterial, freight or passenger railLocation of the airport in relation to economic activity centers, major employers,central business districts, et cetera
Business Use Index
Similar to geographic coverage, airports should be scored relative to their accommodation ofbusiness aviation. As described in this system plan, business aviation has a much brighterfuture than most other general aviation use. Therefore, if an airport is able to accommodatebusiness jets, it should receive a higher score in this category than airports with short, low loadlimit pavements. In addition, the number of jets or multi engine propeller aircraft based at theairport should be used as a factor in the rating process. Scoring includes the following primarycriteria:
The ability to accommodate business aviation as measured by airport classificationThe number of business type aircraft (jet, multi engine propeller) already based at theairport as well as the number of itinerant operations
Expandability Factor
The ability of an airport to expand is a significant factor in its future value to the community itserves. If an airport cannot expand, there is limited return on additional capital investment inthe facility, since the population of aircraft it serves will not be significantly altered. For thisfactor, two primary criteria are used as a gauge. The first involves the ability to expand withinexisting airport property. Both airside and landside are included in this scoring. The secondgauge is the potential ability of the airport to expand outside of its existing propertyboundaries. This measure should be qualitatively assessed, though non park or wetland openspace can exist outside airport boundaries, primarily off existing runway ends. Scoring itemsinclude the following:
On airport expandability, airside and landsideOff airport expandability, primarily off existing runway ends

Delaware State Aviation System Plan UpdateInterim Report Chapter 8 September 2012
R.A. Wiedemann & Associates, Inc. 8 13
Community Commitment Factor
The level of community commitment to a local airport is an important factor in assessing itsexisting and future value. Communities that have developed current master plans and thathave airport capital improvement programs on file with funding agencies can be consideredproactive in this area. In addition, examining the operations of the airport compared its servicearea population is a good measure of community support. Airports that show a low utilizationratio when weighed against their service air population are not considered supported by theiraviation user groups. Criteria used in ranking community commitment include the following:
Current plans on file with funding agencies such as airport master plans, airport capitalimprovement programs, airport zoning plans, FAR Part 150 studies, and airportbusiness plansTotal aircraft operations at the airport divided by service area population
Method for Evaluation of ACV Scoring
This section presents the method for evaluation of ACV scoring for airports included in thesystem plan modeling process. All of the ESF are assigned evaluation values, based upon thecriteria described above. All of the factors except the Business Use Index (BUI) have thepotential of scoring between zero and four points in the matrix. Because of its overallimportance in aviation’s future, the BUI scoring ranges from one to eight, essentially giving itdouble the weight of other evaluation factors.
No airport is confined to its current ACV score. By implementing any of the actions listed asfactors in the process, the ACV can be altered. With changing economic conditions, the ACV isa fluid number, moving with supply and demand, investment capital, and policy changesdesigned to protect local airports. Because of this ability to alter an ACV, a methodology toestimate future ACV is included in this section. This future add on value is estimated from theincreases in projected aviation activity and capital investment at each airport. The ACVmethodology permits decision makers to estimate a return on investment, which can beincrementally impacted by proactive measures described in the ESF section.
Matrix Scoring System
The matrix scoring system used to estimate existing Airport Community Values for each systemairport was developed in a previous working paper. The scores include measures of the variousinputs described in the preceding sections of this report. The subtotal of the existing ACV issimply the existing total economic output combined with the existing airport value with usefullife reductions. This dollar amount is accompanied by an ESF.

Delaware State Aviation System Plan UpdateInterim Report Chapter 8 September 2012
R.A. Wiedemann & Associates, Inc. 8 14
ESFs are useful for all future actions and investments in the airport. Each ESF with theexception of the BUI has a maximum point total of four. The BUI has a maximum point total ofeight. The maximum point total for an airport under the ESF rating system is 28. The ranking ofairports with regard to their existing ESF score does not imply a best to worst rank order.Instead, the ranking shows the leeway for each airport to adjust its future ACV. Those withlower ESF scores have more potential to improve their future ACV than those at the very top.This improvement potential implies that future investments in the airport can have a high rateof return if the future ESF is increased.
Airport Replacement Value and Existing Value Estimation
Key indicators of value involve the physical assets associated with airports and theirinfrastructure. By including the airport replacement value and the existing value estimation, alarger picture concerning the actual worth of the airport to the community is presented. Also,by introducing asset valuation, a mechanism for better measuring return on investment can bedeveloped. Inputs needed for Airport Replacement Value estimates include the following:
Total airport acreage and the most recent estimate of price per acre.Runway and taxiway area in square feet (length times width) and cost per square foot.Apron Area (in square feet) requires estimates either from airport management orfrom aerial photography, along with cost per square foot.Conventional hangar square footage.Number of T hangar units.The fuel system replacement value is based on the size of the facility.The instrument approach capability places a value on those facilities or services, withnon precision valued at $500,000 and precision valued at $1,500,000.An air traffic control tower is valued at $2 million.Non hangar buildings on the airport are valued at $230 per square foot.
Existing Airport Value with Useful Life Reductions are estimated for each airport using thereplacement value estimates combined with knowledge of the age of the various facilities.
Pavements are assumed to have a 20 year life.For hangars and non hangar buildings, a 40 year life is assumedOther facilities were not reduced in value, since their replacement costs are assumedto increase at the same rate as their depreciation.
Future Value Additions
One of the purposes of the ACV modeling system is to provide good information concerninginvestment decisions in public infrastructure such as the local airport. Key to estimating returnon investment is information about the assets involved, their potential for increasing the

Delaware State Aviation System Plan UpdateInterim Report Chapter 8 September 2012
R.A. Wiedemann & Associates, Inc. 8 15
return, or the risks associated with negative community actions that may threaten the viabilityof the airport. The ESF provides analysts with this information and capability. The inputs forthe future ESFs follow the same method as for the existing ESF scoring with the exception thatany known changes in these values should be recorded. This may include proactive measuresby a community to protect their airport through zoning or planned runway expansions andgreater business use. Changes to the future ESF are compared to the existing ESF and thepercentage change is multiplied by the future funding/output additions and added to thefuture facility value. Essentially, the increase or decrease in value from the actual futurefunding or output additions is due to the change in ESF. Proactive measures that impact theESF are the leverage that can be used by a community to increase its airport’s value and thereturn on investment. Conversely, if negative actions occur such as residential encroachment,funding lapses, or loss of business aviation activity, the airport can show a value that is lessthan future amounts invested in its infrastructure.
Future ACV is based on the future capital investments multiplied by the ESF percentage changeplus the future facility value. If the value of the future additions is desired, then the futurefacility value can be subtracted from the future ACV total. Depending upon the change in ESF,the value of future additions can be more or less than the actual amount invested in theairport.
ACV Scoring
The ACV metric described in the preceding sections was calculated for seven airports includedin the Recommended Plan. The product of the exercise is an estimate of the following threevalues for each airport and for the system as a whole: the economic impact value; the existing(depreciated) airport asset value; and, the airport facility replacement value. To complete theACV metric and to estimate the value of each airport to its community and the airport systemin total, more than 20 discrete data values for each airport were researched and assembledinto a database. This data correspond to those described in preceding sections.
Existing Value Components
Existing value components include the existing economic impact assessment data, the currentvalue of the airport, and the replacement value of the airport. Existing value components werecompiled or estimated for use in calculating each system airport as follows.
Economic Impacts: Economic impacts include the number of existing jobs, the amountof income produced, the total output for each system airport, and the contributions intax revenues to local and state jurisdictions. The data was taken from the most recentstate wide Economic Impact Assessment2 and was available through DelDOT.
2 Source: Delaware Airports & Aviation Economic Impact Assessment, 2006

Delaware State Aviation System Plan UpdateInterim Report Chapter 8 September 2012
R.A. Wiedemann & Associates, Inc. 8 16
Airport Property and Facility Value: Two estimates of existing airport values wereused:
Replacement Value: The estimate of replacement values was calculated bymultiplying unit costs of construction by the existing quantities of facilities to derivean approximate infrastructure investment need. Not included are the potentialunknown costs or time delays related to environmental and land use constraints.Existing/Depreciated Value: Estimates of an existing/depreciated facility valueemployed “useful life” estimates of facilities at system airports on a systematicbasis across the State of Delaware. For instance, pavement life was reasonablyassumed to be 20 years, and the useful life of buildings was assumed to be 40years. Some estimates were made of the age of facilities if that data was notavailable for this study. These useful life estimates were then multiplied by thereplacement value costs.
Economic Sustainability Factors
The existing values for economic impact and airport replacement costs discussed above offer abaseline estimate of facility values. However, these values are a snapshot of a constantlymoving economic target. The ESFs discussed in this report address the market impacts of thesevalues and offer insight into certain strategies that individual airport sponsors might considerto improve their airport values and economic impacts.
ACV Metric Results
Table 8 2 presents the results of the ACV input and scoring for all seven airports included inthis study. Existing and replacement values were calculated by the ACV matrix.
Table 8 2 – Existing and Replacement ValuesAirport Name Total ACV ESF Score Total Output Existing Value Replacement Value
New Castle $563,849,410 23.92 $272,111,000 $291,738,410 $337,207,584
Sussex County $237,695,669 15.44 $151,048,700 $86,646,969 $120,823,600
Summit $53,612,060 15.14 $27,997,100 $25,614,960 $49,462,904
Delaware Airpark $21,807,838 17.03 $3,610,600 $18,197,238 $24,277,660
Civil Air Terminal* N/A 16.27 N/A $12,415,250 $14,479,400
Chorman $13,485,246 10.61 $2,515,000 $10,970,246 $15,667,744
Laurel $8,822,777 7.58 $3,121,900 $5,700,877 $7,326,900* Civilian operations only

Delaware State Aviation System Plan UpdateInterim Report Chapter 8 September 2012
R.A. Wiedemann & Associates, Inc. 8 17
Total ACV represents the added value of the economic activity at an airport plus the existingasset value of that facility. As mentioned earlier, this snapshot of the overall value of an airportincludes both the “income statement” and the “balance sheet” components of economicvalue. In one sense, the loss of the airport would eliminate both the economic activity and theasset value for the airport function. In addition to the Total ACV, the existing ESF scores areshown in Table 8 2.
Interpreting the results in the Table, New Castle Airport has the highest ACV of any airport inthe region. Given the size and economic importance of ILG to the region, this result wasexpected. In terms of total airport community value, the four NPIAS airports (New Castle,Sussex County, Summit, and Delaware Airpark) round out the top four of the airports includedin this analysis.
Economic Sustainability Factors scores range from 7.58 at Laurel Airport to 23.92 at New CastleAirport. These scores can be interpreted to mean that the sponsors of Laurel Airport have asignificant opportunity to improve their facility and increase the future value of theirinvestments by protecting the airport from incompatible development and attracting morebusiness aviation. New Castle, on the other hand, is somewhat land locked and would havedifficulty expanding. New Castle’s high ESF indicates that it is already highly economicallysustainable. Because it is near the top of the scoring, there are fewer investment leveragingoptions available to the airport’s sponsors because of the dense development around theairport.
ESF and Priority Ranking of Future Recommended Plan Projects
When future Economic Sustainability Factors are estimated for the Recommended AviationSystem Plan airports, the numbers can be compared with existing ESF ratings to determinewhether or not a net gain or loss occurs. For airports with a higher future ESF, the value of therecommendations can be said to increase above and beyond the actual dollar investments. Inshort, those airports with future ESF ratios that are greater than 1.0 have a net gain in AirportCommunity Value over airports with lower future ESF ratios.
Table 8 3 presents a comparison of existing and future ESF scores, along with the resultingratios.
Table 8 3 – Existing and Future ESF ScoresAirport Name Existing ESF Score Future ESF Score Future ESF Ratio
New Castle 23.92 23.92 1.000
Sussex County 15.44 17.62 1.141
Summit 15.14 16.05 1.060
Delaware Airpark 17.03 18.32 1.076

Delaware State Aviation System Plan UpdateInterim Report Chapter 8 September 2012
R.A. Wiedemann & Associates, Inc. 8 18
Table 8 3 – Existing and Future ESF ScoresAirport Name Existing ESF Score Future ESF Score Future ESF Ratio
Civil Air Terminal* 16.27 17.95 1.103
Chorman 10.61 11.28 1.063
Laurel 7.58 7.68 1.013* Civilian operations only
When the future ESF ratio is applied to the capital spending at each system airport, it showsthe additional value gained by the investments. For example, Sussex County Airport with a1.141 future ESF ration is shown to receive the highest value from its capital investmentprogram, followed by the Civil Air Terminal with a 1.103 ratio, and so on. It should be notedthat many capital investments such as pavement overlays and other capital maintenance mustbe undertaken to keep the airport open. As such, investments at airports with low future ESFratios cannot only be judged using this overall ratio. Also, the higher ESF scores can be used toset priorities for individual projects because the evaluation criteria consider the importance ofeach airport to the system.
When applying the ESF gains to the capital investment totals for each airport, there is someidea of the impact of the improvements on the overall value of each airport. The values addedby the types of investments themselves, over and above the amount of actual spending, areshown in Table 8 4. The Table simply converts the percentage gains into dollars so that acomparison can be made. As shown, Sussex County has the highest percentage gain andhighest absolute gain on future capital spending values of any of the system airports.Conversely, Laurel has the lowest percentage gain and the lowest absolute gain on futurecapital spending values. Because New Castle Airport’s ESF ratio is 1.0, there is no additionalfuture value gained beyond the Airport’s capital investments themselves.
Table 8 4 – Impact of ESF on Future Capital Spending ValuesAirport Name Future ESF Ratio Future Capital Spending Added Future Value
New Castle 1.000 $24,697,400 $0
Sussex County 1.141 $17,648,200 $2,488,400
Summit 1.060 $3,823,300 $229,400
Delaware Airpark 1.076 $24,769,500 $1,882,500
Civil Air Terminal* 1.103 $13,459,500 $1,386,300
Chorman 1.063 $4,378,500 $275,800
Laurel 1.013 $75,000 $1,000* Civilian operations only
The following section examines individual project priorities and how they are ranked.

Delaware State Aviation System Plan UpdateInterim Report Chapter 8 September 2012
R.A. Wiedemann & Associates, Inc. 8 19
Individual Project Priorities
In addition to learning how to measure the greatest “bang for the buck” for future capitalinvestment, there is a need to how individual project priorities rank among themselves. In thisregard, a process was developed that helps to measure the relative value of various projects inprotecting the airport investment to the community. From an economic standpoint, projectsthat will bring additional revenue or permit additional revenue to take place will strengthenthe self sufficiency of an airport. With a stronger revenue base, the airport has a greaterchance for long term economic survival. Thus, these projects have the potential to improvethe airport’s economic future and as such, the overall value of the airport to the community.
Table 8 5 presents a listing of airport projects and their rank order with regard to economicsustainability. The weighting factors for each project type are meant to show relativeimportance rather than absolute mathematical ranking. Thus, there is room for some debateover the scores. However, when examined on the basis of each project contributing to thebusiness use of the airport, these fractional multipliers serve as rating factors for the project’scontributing value.
Table 8 5 – Economic Sustainability Ranking of Capital ProjectsRating Factor Capital Project
1.00 Primary Runway Length0.95 Landside0.92 Instrument Approach0.90 Runway Pavement Overlay0.88 Conventional Hangar Space0.85 Itinerant Apron0.85 Visual Approach Aids0.80 Load Bearing Capacity0.75 Jet Fuel0.72 Taxiway Paving0.70 Primary Runway Width0.70 Taxiway Overlay0.68 T Hangar Space0.65 Avgas0.55 Based Aircraft Apron0.50 Terminal Building0.45 Apron Pavement Overlay0.35 Auto Parking
In the overall ranking process, all of the proposed future projects are included. These projectsare ranked by multiplying the rating factor for each project times the future ESF of the airport

Delaware State Aviation System Plan UpdateInterim Report Chapter 8 September 2012
R.A. Wiedemann & Associates, Inc. 8 20
at which the project is undertaken. Appendix 8 A presents a listing of the results of thisprocess. As shown, there are priorities for certain groups of projects that occur in a highest tolowest order ranking. It should be noted that these rankings are only suggestions, but they doreflect the economic sustainability priorities for the State system.
2.2 Legislation and Regulations
In 2007, the SASPU proposed a number of recommendations for legislative changes for Statelaws. These included changes to the Aeronautics Code to bring various regulations in line withcurrent practices and federal standards. In addition, proposed legislation for increasingrevenue to the State to be used for the aviation system was discussed. Thoserecommendations have not yet been implemented. Thus, they are repeated here so as to beincluded in the latest State Aviation System Plan Update.
Recommendations for Changes to Existing Legislation
Many of these recommendations were made to update the law to reflect the currentadministrative structure and response to various responsibilities. The relevant sectionsinclude:
§ 133. Reports to federal agencies; preservation of aircraft involved in accidents.§ 170. Operation of airport, landing area, etc. without license; approval of site requiredbefore acquisition.§ 173. Exceptions from approval and licensing requirements.§ 602. Erection or maintenance of obstructions; prohibitions.
Changes to Section 602 will bring Delaware into conformance with federal standards forairspace obstruction definitions contained in Federal Aviation Regulations Part 77.
Recommendations for New Legislation
Recommendations for new legislation were brought forward by the Delaware AviationAdvisory Council in accordance with their constituents’ desires. In summary, theserecommended changes involve the imposition of fees for aircraft registrations in Delaware andthe institution of a Jet A fuel tax of $0.05 per gallon. These new fees would generate almost$1.5 million in new revenues each year that could be applied to Delaware aviation capitalneeds.
2.3 Continuing Planning Process
The continuing planning process provides a means for timely updating of the DelawareAviation System Plan. In the continuing airport system planning process, activities that the

Delaware State Aviation System Plan UpdateInterim Report Chapter 8 September 2012
R.A. Wiedemann & Associates, Inc. 8 21
Delaware DOT Office of Aeronautics would undertake can be grouped into five generalcategories:
Monitoring: System airports should be surveyed on an annual basis (as is presently thecase for licensing purposes) to determine how well they are accommodating aviationdemand, the condition of runway surfaces and visual ranges, the status of obstructionremoval programs, general aviation security program implementation, and the statusof development activity. This is necessary not only to fulfill State aviation regulations,but also to compare the actual conditions at each airport with the forecast needs todetermine if the assumptions made during the planning process are holding over time.
Operations Counting Program: In 2012, the State purchased two acoustical aircraftcounting devices to continue the airport traffic counting program which verifies activitylevels at non towered airports in Delaware. For one year, these counters will be movedfrom airport to airport at two week intervals. This program should be updated in thefuture to see if the level of forecast operations are tracking with actual operations.
Delaware Aviation Advisory Council: This Council was created by State legislation andhas reviewed the aviation system plan and will continue to serve at the Secretary’sdiscretion. The DAAC has been involved in other aviation issues such as the DelawareAviation Summit, the Statewide General Aviation Security Plan, and the review ofsafety initiatives as private use airports. Other aviation issues can be vetted throughthis committee as they arise.
Special Studies: These studies include business plans, economic impact studies, andother items of interest that may require special study. In general, the application ofthese studies is on a statewide basis. Thus, airport business plans are developed for alleligible airports. The economic impact study is also statewide.
Implementation "Trigger Points”: Aviation demand trigger points or milestones can bedefined as those aviation activity levels that, upon being reached at an airport, willrequire an implementation action by airport sponsors or State or local officials.
Airport expansion that is tied closely to aviation activity must be tracked closely. In thesecases, when aviation demand falls behind predicted levels or if it is improbable that forecastswill be met, further development activity at that airport should be postponed until thoseactivity levels are reached. Conversely, if airport activity exceeds forecast demand levels, theirdevelopment activities should be implemented on an accelerated schedule. In this manner itis possible that Phase I development activities would be postponed until Phase II. Guidelinesfor the identification of implementation trigger points in Delaware are presented in Table 8 6.It should be noted that these trigger points are not intended to constrain or prevent airport

Delaware State Aviation System Plan UpdateInterim Report Chapter 8 September 2012
R.A. Wiedemann & Associates, Inc. 8 22
development desired by airport sponsors. Rather, they are meant as general planningguidelines in a rule of thumb context.
Table 8 6 SASP Implementation Trigger PointsImplementation Action CriteriaPurchase land for airport expansion Based upon Master Plan or Airport Layout Plan
recommendations and sponsor approval.Improve runway system capacity When airfield activity exceeds 80 percent of capacity.
(No Delaware airports are forecast to exceed 80% oftheir runway capacity by the year 2030.)
Extend, widen, or strengthen airport runway Based upon airport sponsor support and existingdemand or immediate forecast demand of 500 annualitinerant operations by an aircraft or aircraft typeneeding the upgraded condition.
Initiate general aviation apron/rampexpansion
When tie down space exceeds 80 percent occupancy.
Initiate aircraft hangar expansion Based upon aircraft owner waiting lists.Expand airport terminal building When terminal building utilization exceeds 6.0
enplaned passengers per square foot annually.Develop Civil Air Terminal for overnight aircargo airline parking
Once funding and environmental approvals areobtained.
Extend Sussex County runway to 6,000 feetof usable runway length
Once funding is obtained.
A vital part of successful implementation of the plan is establishing and maintaining a dialogueamong the aviation community and the general public as well as the various agencies involvedin the study. Implementation of the plan, however, must begin with the local sponsorsinitiating and partially financing the system improvements. The system plan will succeed onlyif these local sponsors know, in advance of their own planning, where they fit in the overallsystem and the reasoning and assumptions on which the recommendations for their airportswere made in the recommended aviation system. If the system plan is viewed by allconcerned as a flexible working tool to guide and direct their efforts, aviation users and facilitysponsors in Delaware can work toward the airport system they need.

Appendix 8-A: ACV Project Priorities

Appendix 8 A
Table 8 A 1 – Economic Sustainability Ranking of Capital ProjectsRating Factor Capital Project
1.00 Primary Runway Length0.95 Landside0.92 Instrument Approach0.90 Runway Pavement Overlay0.88 Conventional Hangar Space0.85 Itinerant Apron0.85 Visual Approach Aids0.80 Load Bearing Capacity0.75 Jet Fuel0.72 Taxiway Paving0.70 Taxiway Overlay0.70 Primary Runway Width0.68 T Hangar Space0.65 Avgas0.55 Based Aircraft Apron0.50 Terminal Building0.45 Apron Pavement Overlay0.35 Auto Parking
Table 8 A 2 Phase I Project RankingRanking Project (Airport) Airport Future ESF Project Rating Factor
17.030 Runway Paving (DE Airpark) 17.03 1.00
14.476 Runway Lighting (DE Airpark) 17.03 0.85
14.476 VAGL (DE Airpark) 17.03 0.85
14.476 REIL (DE Airpark) 17.03 0.85
13.830 Apron Paving (CAT) 16.27 0.85
12.262 Taxiway Paving (DE Airpark) 17.03 0.72
11.580 T Hangars (DE Airpark) 17.03 0.68
6.443 Approach Light Aid (Laurel) 7.58 0.85
5.961 Auto Parking (DE Airpark) 17.03 0.35
5.695 Auto Parking (CAT) 16.27 0.35
5.299 Auto Parking (Summit) 15.14 0.35

Table 8 A 3 Phase II Project RankingRanking Project (Airport) Airport Future ESF Project Rating Factor
15.440 Runway Paving (Sussex) 15.44 1.00
15.140 Runway Paving (Summit) 15.14 1.00
14.986 Conventional Hangars (DE Airpark) 17.03 0.88
13.124 Runway Lighting (Sussex) 15.44 0.85
12.869 Runway Lighting (Summit) 15.14 0.85
11.580 T Hangars (DE Airpark) 17.03 0.68
11.117 Taxiway Paving (Sussex) 15.44 0.72
10.901 Taxiway Paving (Summit) 15.14 0.72
10.295 T Hangars (Summit) 15.14 0.68
5.961 Auto Parking (DE Airpark) 17.03 0.35
Table 8 A 4 Phase III Project RankingRanking Project (Airport) Airport Future ESF Project Rating Factor
21.528 Runway Overlay (New Castle) 23.92 0.90
20.332 Apron Paving (New Castle) 23.92 0.85
16.744 Taxiway Overlay (New Castle) 23.92 0.70
14.318 Conventional Hangars (CAT) 16.27 0.88
13.896 Runway Overlay (Sussex) 15.44 0.90
13.626 Runway Overlay (Summit) 15.14 0.90
11.921 Taxiway Overlay (DE Airpark) 17.03 0.70
11.580 T Hangars (DE Airpark) 17.03 0.68
11.064 T Hangars (CAT) 16.27 0.68
10.808 Taxiway Overlay (Sussex) 15.44 0.70
10.610 Runway Paving (Chorman) 10.61 1.00
10.598 Taxiway Overlay (Summit) 15.14 0.70
10.499 T Hangars (Sussex) 15.44 0.68
9.019 Apron Paving (Chorman) 10.61 0.85
9.019 REIL (Chorman) 10.61 0.85
9.019 Runway Lighting (Chorman) 10.61 0.85
8.135 Terminal (CAT) 16.27 0.50
7.639 Taxiway Paving (Chorman) 10.61 0.72

Table 8 A 4 Phase III Project RankingRanking Project (Airport) Airport Future ESF Project Rating Factor
5.961 Auto Parking (DE Airpark) 17.03 0.35
5.305 Terminal (Chorman) 10.61 0.50
5.299 Auto Parking (Summit) 15.14 0.35
3.714 Auto Parking (Chorman) 10.61 0.35