China Aviation Oil
11
ed: TH/ sa: AS, PY, CS BUY Last Traded Price (21 Aug 2020): S$0.86 (STI : 2,528.54) Price Target 12-mth: S$1.20 (40% upside) (Prev S$1.65) Analyst Paul YONG, CFA +65 6682 3712 [email protected] What’s New • Strong trading activity and margins helped CAO record credible 1H20 earnings of US$23.6m (-57% y-o-y) • Recovery in departing frequencies at Shanghai Pudong International Airport should help drive a stronger 2H20 • Net cash accounts for c.74% of CAO’s market cap and the stock trades at an attractive 1.5x FY20 ex-cash PE • Maintain BUY with S$1.20 target price Source of all data on this page: Company, DBS Bank, Bloomberg Finance L.P. Deep value at 1.5x FY20 ex-cash PE Investment Thesis Recommend BUY with TP of S$1.20 as the stock is trading at just 1.5x FY20 ex-cash PE with improving outlook. CAO has net cash of c. US$400m, representing 74% of its market cap, that it can utilize to fund accretive acquisitions. Key associate SPIA to bounce firmly in 2H20. Departing frequencies at Shanghai Pudong International Airport has picked up substantially since May and should drive higher earnings at SPIA. Stronger volumes ahead as air travel gradually recovers: CAO should also see higher supply and trading volumes driving better gross profits in 2H20 as air travel gradually recovers. Valuation: TP of S$1.20 based on 11x blended FY20/21 PE. With the worst for the aviation sector likely behind us, we value the company based on 11x (+1 SD of its mean) blended FY20/21 PE as earnings are set to recover firmly in the next 18 months. Our TP is lowered from S$1.65 previously as we cut FY20F/21F EPS by 47%/26%. Where we differ: We have higher FY20F and FY21F forecasts than consensus as we have a more optimistic view on international air travel recovery. We have also not factored in any potential accretive acquisitions in our assumptions. Key Risks to Our View: A sustained weaker demand for international air travel would negatively impact CAO’s revenue and earnings. A sharp drop in oil prices would lead to mark-to-market losses for its key associate SPIA, which would impact its contribution to CAO. At A Glance Issued Capital (m shrs) 860 Mkt. Cap (S$m/US$m) 740 / 539 Major Shareholders (%) China National Aviation Fuel Group Ltd 51.3 BP Investments 20.2 Free Float (%) 28.5 3m Avg. Daily Val (US$m) 0.40 GIC Industry : Energy / Oil, Gas & Consumable Fuels DBS Group Research . Equity 24 Aug 2020 Singapore Company Update China Aviation Oil Version 11 | Bloomberg: CAO SP | Reuters: CNAO.SI Refer to important disclosures at the end of this report Price Relative Forecasts and Valuation FY Dec (US$m) 2018A 2019A 2020F 2021F Revenue 20,612 20,343 9,991 14,362 EBITDA 106 110 61.9 90.9 Pre-tax Profit 101 106 58.2 87.3 Net Profit 93.9 99.8 54.2 81.2 Net Pft (Pre Ex.) 93.9 99.8 54.2 81.2 Net Pft Gth (Pre-ex) (%) 10.5 6.4 (45.8) 49.8 EPS (S cts) 15.0 15.9 8.64 12.9 EPS Pre Ex. (S cts) 15.0 15.9 8.64 12.9 EPS Gth Pre Ex (%) 11 6 (46) 50 Diluted EPS (S cts) 15.0 15.9 8.64 12.9 Net DPS (S cts) 4.52 4.78 2.59 3.88 BV Per Share (S cts) 123 133 139 148 PE (X) 5.7 5.4 10.0 6.6 PE Pre Ex. (X) 5.7 5.4 10.0 6.6 P/Cash Flow (X) 3.7 9.6 6.9 38.4 EV/EBITDA (X) 1.7 1.5 1.4 0.6 Net Div Yield (%) 5.3 5.6 3.0 4.5 P/Book Value (X) 0.7 0.6 0.6 0.6 Net Debt/Equity (X) CASH CASH CASH CASH ROAE (%) 12.6 12.4 6.3 9.0 Earnings Rev (%): (47) (26) Consensus EPS (S cts): 13.2 15.5 Other Broker Recs: B: 2 S: 0 H: 1 55 75 95 115 135 155 175 195 215 0.7 0.9 1.1 1.3 1.5 1.7 1.9 Aug-16 Aug-17 Aug-18 Aug-19 Aug-20 Relative Index S$ China Aviation Oil (LHS) Relative STI (RHS)
-
Upload
khangminh22 -
Category
Documents
-
view
0 -
download
0
Transcript of China Aviation Oil
ed: TH/ sa: AS, PY, CS
BUY Last Traded Price (21 Aug 2020): S$0.86 (STI : 2,528.54)
Price Target 12-mth: S$1.20 (40% upside) (Prev S$1.65)
Analyst
Paul YONG, CFA +65 6682 3712 [email protected]
What’s New • Strong trading activity and margins helped CAO record
credible 1H20 earnings of US$23.6m (-57% y-o-y)
• Recovery in departing frequencies at Shanghai Pudong
International Airport should help drive a stronger 2H20
• Net cash accounts for c.74% of CAO’s market cap and
the stock trades at an attractive 1.5x FY20 ex-cash PE
• Maintain BUY with S$1.20 target price
Source of all data on this page: Company, DBS Bank, Bloomberg
Finance L.P.
Deep value at 1.5x FY20 ex-cash PE Investment Thesis Recommend BUY with TP of S$1.20 as the stock is trading at
just 1.5x FY20 ex-cash PE with improving outlook. CAO has net
cash of c. US$400m, representing 74% of its market cap, that it
can utilize to fund accretive acquisitions.
Key associate SPIA to bounce firmly in 2H20. Departing
frequencies at Shanghai Pudong International Airport has
picked up substantially since May and should drive higher
earnings at SPIA.
Stronger volumes ahead as air travel gradually recovers: CAO
should also see higher supply and trading volumes driving better
gross profits in 2H20 as air travel gradually recovers.
Valuation:
TP of S$1.20 based on 11x blended FY20/21 PE. With the
worst for the aviation sector likely behind us, we value the
company based on 11x (+1 SD of its mean) blended FY20/21
PE as earnings are set to recover firmly in the next 18 months.
Our TP is lowered from S$1.65 previously as we cut FY20F/21F
EPS by 47%/26%.
Where we differ:
We have higher FY20F and FY21F forecasts than consensus as
we have a more optimistic view on international air travel
recovery. We have also not factored in any potential accretive
acquisitions in our assumptions.
Key Risks to Our View:
A sustained weaker demand for international air travel would
negatively impact CAO’s revenue and earnings. A sharp drop
in oil prices would lead to mark-to-market losses for its key
associate SPIA, which would impact its contribution to CAO.
At A Glance Issued Capital (m shrs) 860
Mkt. Cap (S$m/US$m) 740 / 539
Major Shareholders (%)
China National Aviation Fuel Group Ltd 51.3
BP Investments 20.2
Free Float (%) 28.5
3m Avg. Daily Val (US$m) 0.40
GIC Industry : Energy / Oil, Gas & Consumable Fuels
DBS Group Research . Equity
24 Aug 2020
Singapore Company Update
China Aviation Oil Version 11 | Bloomberg: CAO SP | Reuters: CNAO.SI Refer to important disclosures at the end of this report
Price Relative
Forecasts and Valuation
FY Dec (US$m) 2018A 2019A 2020F 2021F
Revenue 20,612 20,343 9,991 14,362 EBITDA 106 110 61.9 90.9 Pre-tax Profit 101 106 58.2 87.3 Net Profit 93.9 99.8 54.2 81.2 Net Pft (Pre Ex.) 93.9 99.8 54.2 81.2 Net Pft Gth (Pre-ex) (%) 10.5 6.4 (45.8) 49.8 EPS (S cts) 15.0 15.9 8.64 12.9 EPS Pre Ex. (S cts) 15.0 15.9 8.64 12.9 EPS Gth Pre Ex (%) 11 6 (46) 50 Diluted EPS (S cts) 15.0 15.9 8.64 12.9 Net DPS (S cts) 4.52 4.78 2.59 3.88 BV Per Share (S cts) 123 133 139 148 PE (X) 5.7 5.4 10.0 6.6 PE Pre Ex. (X) 5.7 5.4 10.0 6.6 P/Cash Flow (X) 3.7 9.6 6.9 38.4 EV/EBITDA (X) 1.7 1.5 1.4 0.6 Net Div Yield (%) 5.3 5.6 3.0 4.5 P/Book Value (X) 0.7 0.6 0.6 0.6 Net Debt/Equity (X) CASH CASH CASH CASH ROAE (%) 12.6 12.4 6.3 9.0 Earnings Rev (%): (47) (26) Consensus EPS (S cts): 13.2 15.5 Other Broker Recs: B: 2 S: 0 H: 1
55
75
95
115
135
155
175
195
215
0.7
0.9
1.1
1.3
1.5
1.7
1.9
Aug-16 Aug-17 Aug-18 Aug-19 Aug-20
Relative IndexS$
China Aviation Oil (LHS) Relative STI (RHS)

Page 2
Company Update
China Aviation Oil
WHAT’S NEW
Strong trading profits offset by a plunge in contribution from SPIA, which is already seeing a rebound in traffic
Credible interim results. Total revenue fell 44.5% y-o-y to
US$5.4bn on a 22% y-o-y decline in overall volume to 5.49m
tonnes. Despite jet fuel volumes falling by 30% y-o-y, gross
profit fell by a slower 20% y-o-y to US$22.9m as better
trading profits helped to offset some of the lower supply
volumes due to COVID-19. EBIT rose 6% y-o-y to US$21.8m
as there was a reversal of expected credit loss provision of
US$1m compared to an impairment provision of US$6.2m in
1H19, which was due to lower receivables at end-June 2020.
Contribution from Shanghai Pudong International Airport
Aviation Fuel Supply Co., (SPIA) plunged by 94% y-o-y to
US$2.1m due to lower volumes and lower oil prices caused
by the COVID-19 outbreak. As a result, net profit for the year
fell by 57% y-o-y to US$23.6m.
CAO’s 1H20 results at a glance
% Chg
US$m 1H19 1H20 y-o-y
Revenue 9683.3 5373.4 -45%
Cost of Sales (9654.6) (5350.5) -45%
Gross Profit 28.7 22.9 -20%
Other op. income 4.2 3.3 -21%
Admin Expenses (5.9) (5.0) -15%
Other Op. Expenses (6.6) 0.6 -109%
Operating Profit 20.5 21.8 6%
Finance Costs (1.2) (0.5) -59%
Associates 38.3 3.9 -90%
Pretax Profit 57.6 25.2 -56%
Tax (2.8) (1.6) -41%
PAT 54.8 23.6 -57%
Source: Company, DBS Bank Estimates
Banking on a recovery at SPIA in 2H20. Profit contribution
from SPIA made up 59-76% of CAO’s total net profit from
FY15- FY19 but accounted for just 9% of its profit in the first
half of 2020. Besides lower volumes, the plunge in
contribution from SPIA is also likely due to marked-to-market
losses on lower fuel prices.
We believe that SPIA will see a rebound in its profit
contribution to CAO in the second half of 2020 as the
number of weekly departing frequencies averaged less than
2,000 from mid-February to end-April but has now
rebounded to c. 3,800 in August, which is about 20% off its
pre-COVID-19 levels. Additionally, the mark-to-market losses
that SPIA incurred in the first half of 2020 are unlikely to
recur unless jet fuel prices plunge even further. Our house
view for oil price is that it will gradually firm up as demand
rebounds in line with the easing of social distancing
measures globally, and as supply remains disciplined.
Pudong Int’l Airport – Weekly departing frequencies
Source: CAPA, DBS Bank Estimates
0
1000
2000
3000
4000
5000
6000

Page 3
Company Update
China Aviation Oil
Historical PE and PB band
Forward PE band (x) PB band (x)
Source: Bloomberg Finance L.P., DBS estimates
Source: Bloomberg Finance L.P., DBS estimates
6.0
7.0
8.0
9.0
10.0
11.0
12.0
13.0
14.0
15.0
16.0
Aug-16 Aug-17 Aug-18 Aug-19 Aug-20
(x)
Avg: 10.49x
+1sd: 11.97x
+2sd: 13.44x
-1sd: 9.01x
-2sd: 7.54x

Page 4
Company Update
China Aviation Oil
Key Assumptions
FY Dec 2017A 2018A 2019A 2020F 2021F
Middle Distillates Volumes
(m tonnes)
19.8 18.2 22.3 16.7 19.2
Other Oil Product
Volumes (m tonnes)
16.1 14.3 14.7 11.0 12.7
Implied Average Middle
Distillate Price (USD/bbl)
65.2 85.6 82.5 48.3 60.4
Gross Profit per Tonne
(US$)
1.08 1.54 1.58 1.74 1.65
Contribution from
Associates (US$ m)
71.5 72.1 65.5 25.0 50.5
Segmental Breakdown
FY Dec 2017A 2018A 2019A 2020F 2021F Revenues (US$m)
Middle distillates 10,233 12,362 13,594 6,397 9,195
Other oil products 6,034 8,250 6,749 3,595 5,167
Total 16,268 20,612 20,343 9,991 14,362
Income Statement (US$m)
FY Dec 2017A 2018A 2019A 2020F 2021F
Revenue 16,268 20,612 20,343 9,991 14,362
Cost of Goods Sold (16,229) (20,562) (20,285) (9,943) (14,310)
Gross Profit 38.7 50.0 58.5 48.2 52.7 Other Opng (Exp)/Inc (15.7) (16.9) (14.8) (12.2) (13.2)
Operating Profit 23.1 33.1 43.7 36.0 39.5 Other Non Opg (Exp)/Inc 0.0 0.0 0.0 0.0 0.0
Associates & JV Inc 71.5 72.1 65.5 25.0 50.5
Net Interest (Exp)/Inc (2.8) (4.6) (2.8) (2.8) (2.8)
Exceptional Gain/(Loss) 0.0 0.0 0.0 0.0 0.0
Pre-tax Profit 91.8 101 106 58.2 87.3 Tax (6.9) (6.7) (6.6) (4.1) (6.1)
Minority Interest 0.0 0.0 0.0 0.0 0.0
Preference Dividend 0.0 0.0 0.0 0.0 0.0
Net Profit 84.9 93.9 99.8 54.2 81.2 Net Profit before Except. 84.9 93.9 99.8 54.2 81.2
EBITDA 95.5 106 110 61.9 90.9 Growth
Revenue Gth (%) 39.0 26.7 (1.3) (50.9) 43.7
EBITDA Gth (%) 1.3 11.1 3.8 (43.8) 46.9
Opg Profit Gth (%) (13.8) 43.4 32.0 (17.6) 9.8
Net Profit Gth (Pre-ex) (%) (4.5) 10.5 6.4 (45.8) 49.8 Margins & Ratio
Gross Margins (%) 0.2 0.2 0.3 0.5 0.4
Opg Profit Margin (%) 0.1 0.2 0.2 0.4 0.3
Net Profit Margin (%) 0.5 0.5 0.5 0.5 0.6
ROAE (%) 12.4 12.6 12.4 6.3 9.0
ROA (%) 5.2 5.3 5.7 3.2 5.1
ROCE (%) 2.7 3.8 5.0 3.8 4.0
Div Payout Ratio (%) 34.1 30.2 30.0 30.0 30.0
Net Interest Cover (x) 8.3 7.1 15.9 13.1 14.4
Source: Company, DBS Bank
Page 5
Company Update
China Aviation Oil
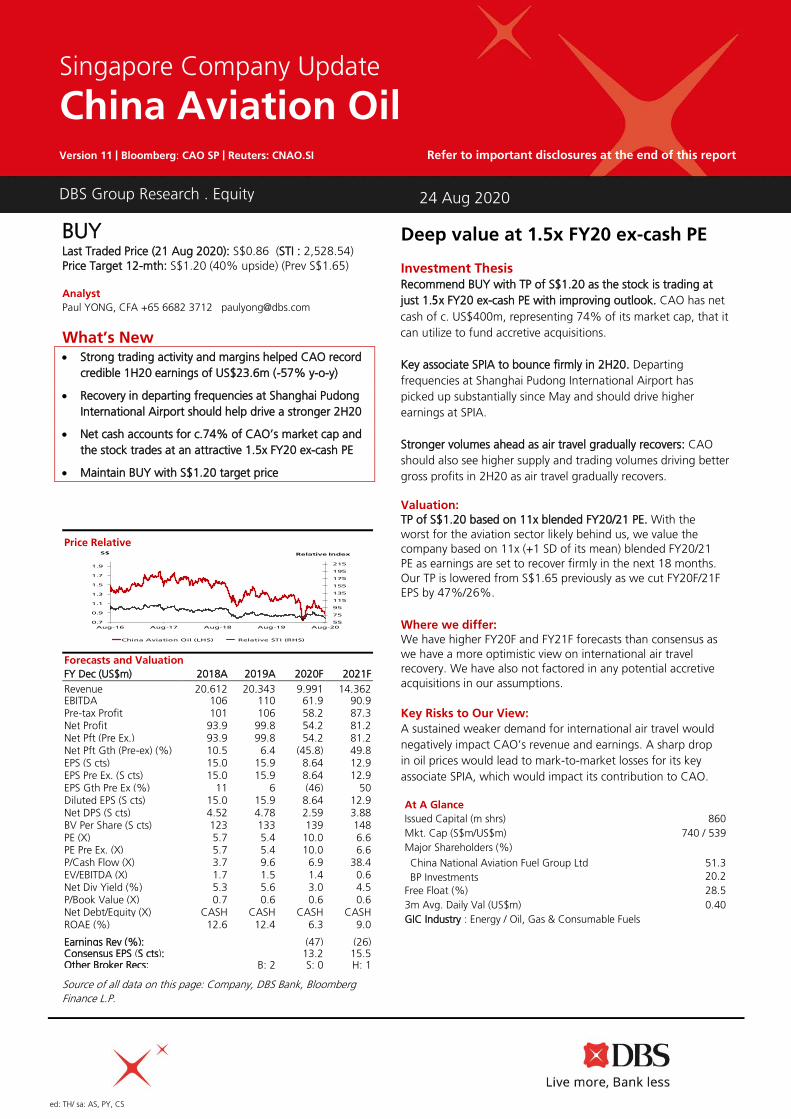
Balance Sheet (US$m)
FY Dec 2017A 2018A 2019A 2020F 2021F Net Fixed Assets 5.19 5.25 4.91 4.81 4.72
Invts in Associates & JVs 321 311 362 368 376
Other LT Assets 7.53 6.17 25.4 25.1 24.9
Cash & ST Invts 300 358 379 459 491
Inventory 210 111 58.7 28.8 41.4
Debtors 1,066 862 894 439 631
Other Current Assets 0.0 0.0 145 145 145
Total Assets 1,910 1,653 1,868 1,470 1,714
ST Debt
120 0.0 0.0 0.0 0.0
Creditor 1,060 875 860 421 607
Other Current Liab 0.95 0.83 158 160 162
LT Debt 0.0 0.0 3.92 3.92 3.92
Other LT Liabilities 7.92 8.05 11.7 11.7 11.7
Shareholder’s Equity 721 769 835 873 930
Minority Interests 0.0 0.0 0.0 0.0 0.0
Total Cap. & Liab. 1,910 1,653 1,868 1,470 1,714
Non-Cash Wkg. Capital 215 96.6 79.5 31.1 48.6
Net Cash/(Debt) 180 358 375 456 487
Debtors Turn (avg days) 18.6 17.1 15.8 24.3 13.6
Creditors Turn (avg days) 18.5 17.2 15.6 23.5 13.1
Inventory Turn (avg days) 4.3 2.8 1.5 1.6 0.9
Asset Turnover (x) 10.0 11.6 11.6 6.0 9.0
Current Ratio (x) 1.3 1.5 1.5 1.8 1.7
Quick Ratio (x) 1.2 1.4 1.3 1.5 1.5
Net Debt/Equity (X) CASH CASH CASH CASH CASH
Net Debt/Equity ex MI (X) CASH CASH CASH CASH CASH
Capex to Debt (%) 0.4 N/A 14.7 14.7 14.7
Z-Score (X) 12.3 14.0 12.3 12.4 12.2
Source: Company, DBS Bank
Cash Flow Statement (US$m)
FY Dec 2017A 2018A 2019A 2020F 2021F
Pre-Tax Profit 91.8 101 106 58.2 87.3
Dep. & Amort. 0.94 0.94 11.6 0.94 0.94
Tax Paid (0.7) (0.7) (0.8) (2.1) (4.1)
Assoc. & JV Inc/(loss) (71.5) (72.1) (65.5) (25.0) (50.5)
Chg in Wkg.Cap. (46.1) 118 16.0 46.4 (19.6)
Other Operating CF (1.7) (0.4) (11.4) 0.0 0.0
Net Operating CF (27.2) 146 56.3 78.5 14.0 Capital Exp.(net) (0.4) (1.1) (0.6) (0.6) (0.6)
Other Invts.(net) 0.0 (7.6) 0.0 0.0 0.0
Invts in Assoc. & JV 0.0 0.0 0.0 0.0 0.0
Div from Assoc & JV 45.5 67.4 3.62 19.0 42.8
Other Investing CF 3.60 4.58 0.0 0.0 0.0
Net Investing CF 48.7 63.2 3.05 18.4 42.2 Div Paid (27.7) (29.2) (28.5) (16.3) (24.3)
Chg in Gross Debt 20.0 (120) (10.7) 0.0 0.0
Capital Issues 0.0 0.0 0.0 0.0 0.0
Other Financing CF (1.6) (3.2) 0.0 0.0 0.0
Net Financing CF (9.3) (152) (39.2) (16.3) (24.3) Currency Adjustments 0.62 0.24 0.90 0.0 0.0
Chg in Cash 12.8 57.7 21.1 80.7 31.9
Opg CFPS (S cts) 3.00 4.51 6.43 5.12 5.36
Free CFPS (S cts) (4.4) 23.2 8.89 12.4 2.14
Source: Company, DBS Bank
Page 6
Company Update
China Aviation Oil
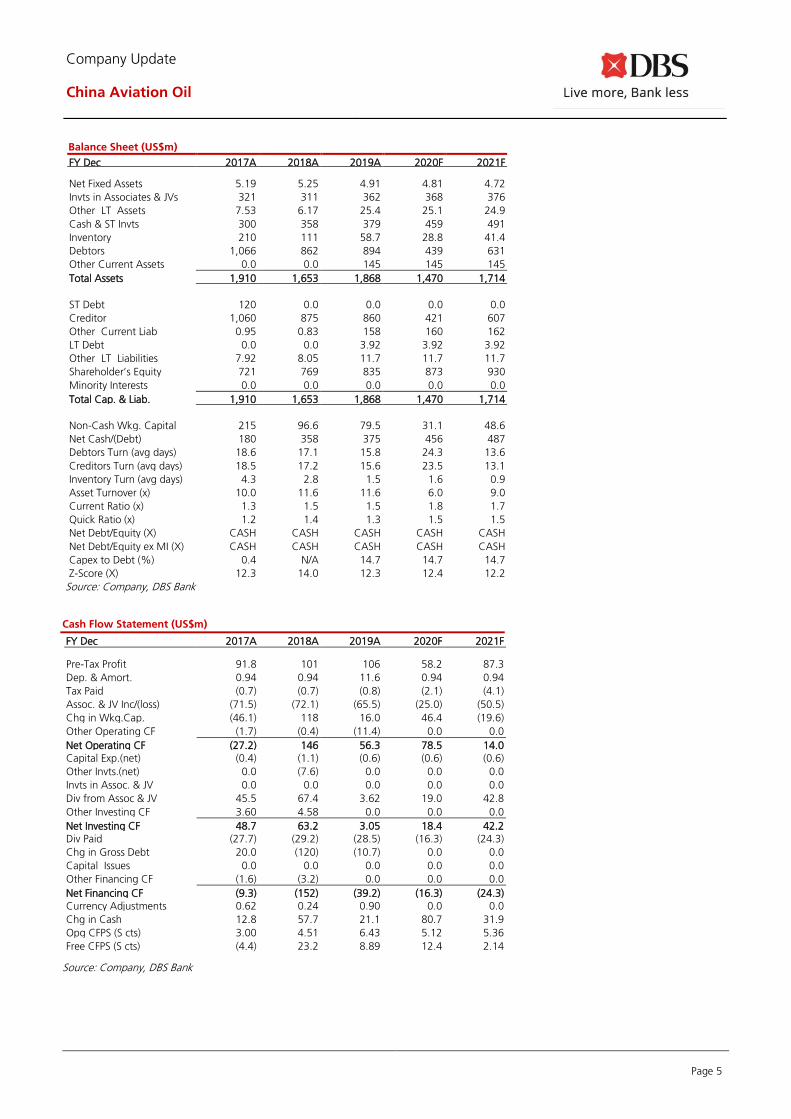
Target Price & Ratings History
Source: DBS Bank
Analyst: Paul YONG, CFA
S.No.Date of
Report
Clos ing
Price
12-mth
Target
Price
Rating
1: 26 Feb 20 1.16 1.65 BUY
Note : Share price and Target price are adjusted for corporate actions.
1
0.69
0.79
0.89
0.99
1.09
1.19
1.29
Aug-19 Oct-19 Dec-19 Feb-20 Apr-20 Jun-20 Aug-20
S$

Page 7
Company Update
China Aviation Oil
DBS Bank recommendations are based on an Absolute Total Return* Rating system, defined as follows:
STRONG BUY (>20% total return over the next 3 months, with identifiable share price catalysts within this time frame)
BUY (>15% total return over the next 12 months for small caps, >10% for large caps)
HOLD (-10% to +15% total return over the next 12 months for small caps, -10% to +10% for large caps)
FULLY VALUED (negative total return, i.e., > -10% over the next 12 months)
SELL (negative total return of > -20% over the next 3 months, with identifiable share price catalysts within this time frame)
*Share price appreciation + dividends
Completed Date: 24 Aug 2020 19:02:27 (SGT)
Dissemination Date: 24 Aug 2020 19:27:46 (SGT)
Sources for all charts and tables are DBS Bank unless otherwise specified.
GENERAL DISCLOSURE/DISCLAIMER
This report is prepared by DBS Bank Ltd. This report is solely intended for the clients of DBS Bank Ltd, its respective connected and associated
corporations and affiliates only and no part of this document may be (i) copied, photocopied or duplicated in any form or by any means or (ii)
redistributed without the prior written consent of DBS Bank Ltd.
The research set out in this report is based on information obtained from sources believed to be reliable, but we (which collectively refers to DBS
Bank Ltd, its respective connected and associated corporations, affiliates and their respective directors, officers, employees and agents (collectively,
the “DBS Group”) have not conducted due diligence on any of the companies, verified any information or sources or taken into account any other
factors which we may consider to be relevant or appropriate in preparing the research. Accordingly, we do not make any representation or
warranty as to the accuracy, completeness or correctness of the research set out in this report. Opinions expressed are subject to change without
notice. This research is prepared for general circulation. Any recommendation contained in this document does not have regard to the specific
investment objectives, financial situation and the particular needs of any specific addressee. This document is for the information of addressees
only and is not to be taken in substitution for the exercise of judgement by addressees, who should obtain separate independent legal or financial
advice. The DBS Group accepts no liability whatsoever for any direct, indirect and/or consequential loss (including any claims for loss of profit)
arising from any use of and/or reliance upon this document and/or further communication given in relation to this document. This document is not
to be construed as an offer or a solicitation of an offer to buy or sell any securities. The DBS Group, along with its affiliates and/or persons
associated with any of them may from time to time have interests in the securities mentioned in this document. The DBS Group, may have
positions in, and may effect transactions in securities mentioned herein and may also perform or seek to perform broking, investment banking and
other banking services for these companies.
Any valuations, opinions, estimates, forecasts, ratings or risk assessments herein constitutes a judgment as of the date of this report, and there can
be no assurance that future results or events will be consistent with any such valuations, opinions, estimates, forecasts, ratings or risk assessments.
The information in this document is subject to change without notice, its accuracy is not guaranteed, it may be incomplete or condensed, it may
not contain all material information concerning the company (or companies) referred to in this report and the DBS Group is under no obligation to
update the information in this report.
This publication has not been reviewed or authorized by any regulatory authority in Singapore, Hong Kong or elsewhere. There is no planned
schedule or frequency for updating research publication relating to any issuer.
The valuations, opinions, estimates, forecasts, ratings or risk assessments described in this report were based upon a number of estimates and
assumptions and are inherently subject to significant uncertainties and contingencies. It can be expected that one or more of the estimates on
which the valuations, opinions, estimates, forecasts, ratings or risk assessments were based will not materialize or will vary significantly from actual
results. Therefore, the inclusion of the valuations, opinions, estimates, forecasts, ratings or risk assessments described herein IS NOT TO BE RELIED
UPON as a representation and/or warranty by the DBS Group (and/or any persons associated with the aforesaid entities), that:
(a) such valuations, opinions, estimates, forecasts, ratings or risk assessments or their underlying assumptions will be achieved, and
(b) there is any assurance that future results or events will be consistent with any such valuations, opinions, estimates, forecasts, ratings or risk
assessments stated therein.
Please contact the primary analyst for valuation methodologies and assumptions associated with the covered companies or price targets.

Page 8
Company Update
China Aviation Oil
Any assumptions made in this report that refers to commodities, are for the purposes of making forecasts for the company (or companies)
mentioned herein. They are not to be construed as recommendations to trade in the physical commodity or in the futures contract relating to the
commodity referred to in this report.
DBSVUSA, a US-registered broker-dealer, does not have its own investment banking or research department, has not participated in any public
offering of securities as a manager or co-manager or in any other investment banking transaction in the past twelve months and does not engage
in market-making.
ANALYST CERTIFICATION
The research analyst(s) primarily responsible for the content of this research report, in part or in whole, certifies that the views about the
companies and their securities expressed in this report accurately reflect his/her personal views. The analyst(s) also certifies that no part of his/her
compensation was, is, or will be, directly or indirectly, related to specific recommendations or views expressed in the report. The research analyst
(s) primarily responsible for the content of this research report, in part or in whole, certifies that he or his associate1 does not serve as an officer of
the issuer or the new listing applicant (which includes in the case of a real estate investment trust, an officer of the management company of the
real estate investment trust; and in the case of any other entity, an officer or its equivalent counterparty of the entity who is responsible for the
management of the issuer or the new listing applicant) and the research analyst(s) primarily responsible for the content of this research report or
his associate does not have financial interests2 in relation to an issuer or a new listing applicant that the analyst reviews. DBS Group has
procedures in place to eliminate, avoid and manage any potential conflicts of interests that may arise in connection with the production of
research reports. The research analyst(s) responsible for this report operates as part of a separate and independent team to the investment
banking function of the DBS Group and procedures are in place to ensure that confidential information held by either the research or investment
banking function is handled appropriately. There is no direct link of DBS Group's compensation to any specific investment banking function of
the DBS Group.
COMPANY-SPECIFIC / REGULATORY DISCLOSURES
1. DBS Bank Ltd, DBS HK, DBS Vickers Securities (Singapore) Pte Ltd (''DBSVS'') or their subsidiaries and/or other affiliates do not have
a proprietary position in the securities recommended in this report as of 31 Jul 2020.
2. Neither DBS Bank Ltd nor DBS HK market makes in equity securities of the issuer(s) or company(ies) mentioned in this Research
Report.
Compensation for investment banking services:
3. DBSVUSA does not have its own investment banking or research department, nor has it participated in any public offering of
securities as a manager or co-manager or in any other investment banking transaction in the past twelve months. Any US persons
wishing to obtain further information, including any clarification on disclosures in this disclaimer, or to effect a transaction in any
security discussed in this document should contact DBSVUSA exclusively.
Disclosure of previous investment recommendation produced:
4. DBS Bank Ltd, DBS Vickers Securities (Singapore) Pte Ltd (''DBSVS''), their subsidiaries and/or other affiliates may have published
other investment recommendations in respect of the same securities / instruments recommended in this research report during the
preceding 12 months. Please contact the primary analyst listed in the first page of this report to view previous investment
recommendations published by DBS Bank Ltd, DBS Vickers Securities (Singapore) Pte Ltd (''DBSVS''), their subsidiaries and/or other
affiliates in the preceding 12 months.
1 An associate is defined as (i) the spouse, or any minor child (natural or adopted) or minor step-child, of the analyst; (ii) the trustee of a trust of
which the analyst, his spouse, minor child (natural or adopted) or minor step-child, is a beneficiary or discretionary object; or (iii) another person
accustomed or obliged to act in accordance with the directions or instructions of the analyst.
2 Financial interest is defined as interests that are commonly known financial interest, such as investment in the securities in respect of an issuer or a
new listing applicant, or financial accommodation arrangement between the issuer or the new listing applicant and the firm or analysis. This term
does not include commercial lending conducted at arm's length, or investments in any collective investment scheme other than an issuer or new
listing applicant notwithstanding the fact that the scheme has investments in securities in respect of an issuer or a new listing applicant.

Page 9
Company Update
China Aviation Oil
RESTRICTIONS ON DISTRIBUTION
General This report is not directed to, or intended for distribution to or use by, any person or entity who is a citizen or resident of
or located in any locality, state, country or other jurisdiction where such distribution, publication, availability or use
would be contrary to law or regulation.
Australia This report is being distributed in Australia by DBS Bank Ltd, DBSVS or DBSV HK. DBS Bank Ltd holds Australian Financial
Services Licence no. 475946.
DBSVS and DBSV HK are exempted from the requirement to hold an Australian Financial Services Licence under the
Corporation Act 2001 (“CA”) in respect of financial services provided to the recipients. Both DBS Bank Ltd and DBSVS
are regulated by the Monetary Authority of Singapore under the laws of Singapore, and DBSV HK is regulated by the
Hong Kong Securities and Futures Commission under the laws of Hong Kong, which differ from Australian laws.
Distribution of this report is intended only for “wholesale investors” within the meaning of the CA.
Hong Kong This report is being distributed in Hong Kong by DBS Bank Ltd, DBS Bank (Hong Kong) Limited and DBS Vickers (Hong
Kong) Limited, all of which are registered with or licensed by the Hong Kong Securities and Futures Commission to carry
out the regulated activity of advising on securities. DBS Bank Ltd., Hong Kong Branch is a limited liability company
incorporated in Singapore.
For any query regarding the materials herein, please contact Carol Wu (Reg No. AH8283) at [email protected]
Indonesia This report is being distributed in Indonesia by PT DBS Vickers Sekuritas Indonesia.
Malaysia This report is distributed in Malaysia by AllianceDBS Research Sdn Bhd ("ADBSR"). Recipients of this report, received
from ADBSR are to contact the undersigned at 603-2604 3333 in respect of any matters arising from or in connection
with this report. In addition to the General Disclosure/Disclaimer found at the preceding page, recipients of this report
are advised that ADBSR (the preparer of this report), its holding company Alliance Investment Bank Berhad, their
respective connected and associated corporations, affiliates, their directors, officers, employees, agents and parties
related or associated with any of them may have positions in, and may effect transactions in the securities mentioned
herein and may also perform or seek to perform broking, investment banking/corporate advisory and other services for
the subject companies. They may also have received compensation and/or seek to obtain compensation for broking,
investment banking/corporate advisory and other services from the subject companies.
Wong Ming Tek, Executive Director, ADBSR
Singapore This report is distributed in Singapore by DBS Bank Ltd (Company Regn. No. 196800306E) or DBSVS (Company Regn
No. 198600294G), both of which are Exempt Financial Advisers as defined in the Financial Advisers Act and regulated by
the Monetary Authority of Singapore. DBS Bank Ltd and/or DBSVS, may distribute reports produced by its respective
foreign entities, affiliates or other foreign research houses pursuant to an arrangement under Regulation 32C of the
Financial Advisers Regulations. Where the report is distributed in Singapore to a person who is not an Accredited
Investor, Expert Investor or an Institutional Investor, DBS Bank Ltd accepts legal responsibility for the contents of the
report to such persons only to the extent required by law. Singapore recipients should contact DBS Bank Ltd at 6327
2288 for matters arising from, or in connection with the report.

Page 10
Company Update
China Aviation Oil
Thailand This report is being distributed in Thailand by DBS Vickers Securities (Thailand) Co Ltd.
United
Kingdom
This report is produced by DBS Bank Ltd which is regulated by the Monetary Authority of Singapore.
This report is disseminated in the United Kingdom by DBS Vickers Securities (UK) Ltd, ("DBSVUK"). DBSVUK is authorised
and regulated by the Financial Conduct Authority in the United Kingdom.
In respect of the United Kingdom, this report is solely intended for the clients of DBSVUK, its respective connected and
associated corporations and affiliates only and no part of this document may be (i) copied, photocopied or duplicated in
any form or by any means or (ii) redistributed without the prior written consent of DBSVUK. This communication is
directed at persons having professional experience in matters relating to investments. Any investment activity following
from this communication will only be engaged in with such persons. Persons who do not have professional experience in
matters relating to investments should not rely on this communication.
Dubai
International
Financial
Centre
This research report is being distributed by DBS Bank Ltd., (DIFC Branch) having its office at units 608 - 610, 6th Floor,
Gate Precinct Building 5, PO Box 506538, DIFC, Dubai, United Arab Emirates. DBS Bank Ltd., (DIFC Branch) is regulated
by The Dubai Financial Services Authority. This research report is intended only for professional clients (as defined in the
DFSA rulebook) and no other person may act upon it.
United Arab
Emirates
This report is provided by DBS Bank Ltd (Company Regn. No. 196800306E) which is an Exempt Financial Adviser as
defined in the Financial Advisers Act and regulated by the Monetary Authority of Singapore. This report is for information
purposes only and should not be relied upon or acted on by the recipient or considered as a solicitation or inducement to
buy or sell any financial product. It does not constitute a personal recommendation or take into account the particular
investment objectives, financial situation, or needs of individual clients. You should contact your relationship manager or
investment adviser if you need advice on the merits of buying, selling or holding a particular investment. You should note
that the information in this report may be out of date and it is not represented or warranted to be accurate, timely or
complete. This report or any portion thereof may not be reprinted, sold or redistributed without our written consent.
United States This report was prepared by DBS Bank Ltd. DBSVUSA did not participate in its preparation. The research analyst(s)
named on this report are not registered as research analysts with FINRA and are not associated persons of DBSVUSA. The
research analyst(s) are not subject to FINRA Rule 2241 restrictions on analyst compensation, communications with a
subject company, public appearances and trading securities held by a research analyst. This report is being distributed in
the United States by DBSVUSA, which accepts responsibility for its contents. This report may only be distributed to Major
U.S. Institutional Investors (as defined in SEC Rule 15a-6) and to such other institutional investors and qualified persons as
DBSVUSA may authorize. Any U.S. person receiving this report who wishes to effect transactions in any securities
referred to herein should contact DBSVUSA directly and not its affiliate.
Other
jurisdictions
In any other jurisdictions, except if otherwise restricted by laws or regulations, this report is intended only for qualified,
professional, institutional or sophisticated investors as defined in the laws and regulations of such jurisdictions.

Page 11
Company Update
China Aviation Oil
DBS Regional Research Offices
HONG KONG
DBS (Hong Kong) Ltd
Contact: Carol Wu
13th Floor One Island East,
18 Westlands Road,
Quarry Bay, Hong Kong
Tel: 852 3668 4181
Fax: 852 2521 1812
e-mail: [email protected]
MALAYSIA
AllianceDBS Research Sdn Bhd
Contact: Wong Ming Tek (128540 U)
19th Floor, Menara Multi-Purpose,
Capital Square,
8 Jalan Munshi Abdullah 50100
Kuala Lumpur, Malaysia.
Tel.: 603 2604 3333
Fax: 603 2604 3921
e-mail: [email protected]
SINGAPORE
DBS Bank Ltd
Contact: Janice Chua
12 Marina Boulevard,
Marina Bay Financial Centre Tower 3
Singapore 018982
Tel: 65 6878 8888
Fax: 65 65353 418
e-mail: [email protected]
Company Regn. No. 196800306E
THAILAND
DBS Vickers Securities (Thailand) Co Ltd
Contact: Chanpen Sirithanarattanakul
989 Siam Piwat Tower Building,
9th, 14th-15th Floor
Rama 1 Road, Pathumwan,
Bangkok Thailand 10330
Tel. 66 2 857 7831
Fax: 66 2 658 1269
e-mail: [email protected]
Company Regn. No 0105539127012
Securities and Exchange Commission, Thailand
INDONESIA
PT DBS Vickers Sekuritas (Indonesia)
Contact: Maynard Priajaya Arif
DBS Bank Tower
Ciputra World 1, 32/F
Jl. Prof. Dr. Satrio Kav. 3-5
Jakarta 12940, Indonesia
Tel: 62 21 3003 4900
Fax: 6221 3003 4943
e-mail: [email protected]