Integrating economic, environmental and GIS modeling to target cost effective land retirement in...
19
ANALYSIS Integrating economic, environmental and GIS modeling to target cost effective land retirement in multiple watersheds Wanhong Yang a, *, Madhu Khanna b , Richard Farnsworth c , Hayri O ¨ nal b a Department of Geography, University of Guelph, Guelph, Ontario, Canada N1G 2W1 b Department of Agricultural and Consumer Economics, University of Illinois at Urbana-Champaign, Urbana, IL 61801, USA c Department of Forestry and Natural Resources, Purdue University, West Lafayette, IN 47907-2033, USA Received 26 September 2002; received in revised form 13 April 2003; accepted 15 May 2003 Abstract An integrated framework of economic, environmental and GIS modeling is developed to study cost-effective retirement of cropland within and across multiple watersheds to achieve environmental goals. This framework is applied to 12 contiguous agricultural watersheds in the Illinois Conservation Reserve Enhancement Program region of the United States. A key goal of this program is to reduce sediment loadings in the Illinois River by 20% by retiring land from crop production. The characteristics of land parcels to be targeted for retirement within each watershed and the criteria for cost-effective allocation of abatement responsibility across watersheds are analyzed. Our analysis suggests that program costs are minimized when the abatement standard is set for the region rather than uniformly for each watershed. For both policy scenarios, the land parcels targeted for retirement should be those that are highly sloping and adjacent to a water body. # 2003 Elsevier B.V. All rights reserved. Keywords: Cost effectiveness; Land retirement; Multiple watersheds; Uniform and non-uniform standards 1. Introduction Increasing emphasis on protecting water quality from nonpoint pollution sources has led to a shift in the policy objectives of conservation programs, such as, the Conservation Reserve Program (CRP), from on-site erosion control towards controlling off-site sediment loadings. More re- cently, with the development of the Conservation Reserve Enhancement Program (CREP) the focus of these programs has shifted towards achieving explicitly defined goals for water quality in locally identified environmentally sensitive river basins. The goals of the CREP in Illinois include a 20% reduction in sediment loadings, a 10% reduction in nitrogen and phosphorus loadings and an increase in aquatic and wildlife populations in the Illinois River (USDA, 1998). The program seeks to achieve these goals by retiring about 94 thousand hectares of cropland in the Illinois River Basin for at least 15 years and possibly for 35 years or * Corresponding author. Tel.: /1-519-824-4120x53090; fax: /1-519-837-2940. E-mail address: [email protected] (W. Yang). Ecological Economics 46 (2003) 249 /267 www.elsevier.com/locate/ecolecon 0921-8009/03/$ - see front matter # 2003 Elsevier B.V. All rights reserved. doi:10.1016/S0921-8009(03)00141-1
-
Upload
independent -
Category
Documents
-
view
1 -
download
0
Transcript of Integrating economic, environmental and GIS modeling to target cost effective land retirement in...
ANALYSIS
Integrating economic, environmental and GIS modeling totarget cost effective land retirement in multiple watersheds
Wanhong Yang a,*, Madhu Khanna b, Richard Farnsworth c, Hayri Onal b
a Department of Geography, University of Guelph, Guelph, Ontario, Canada N1G 2W1b Department of Agricultural and Consumer Economics, University of Illinois at Urbana-Champaign, Urbana, IL 61801, USA
c Department of Forestry and Natural Resources, Purdue University, West Lafayette, IN 47907-2033, USA
Received 26 September 2002; received in revised form 13 April 2003; accepted 15 May 2003
Abstract
An integrated framework of economic, environmental and GIS modeling is developed to study cost-effective
retirement of cropland within and across multiple watersheds to achieve environmental goals. This framework is
applied to 12 contiguous agricultural watersheds in the Illinois Conservation Reserve Enhancement Program region of
the United States. A key goal of this program is to reduce sediment loadings in the Illinois River by 20% by retiring land
from crop production. The characteristics of land parcels to be targeted for retirement within each watershed and the
criteria for cost-effective allocation of abatement responsibility across watersheds are analyzed. Our analysis suggests
that program costs are minimized when the abatement standard is set for the region rather than uniformly for each
watershed. For both policy scenarios, the land parcels targeted for retirement should be those that are highly sloping
and adjacent to a water body.
# 2003 Elsevier B.V. All rights reserved.
Keywords: Cost effectiveness; Land retirement; Multiple watersheds; Uniform and non-uniform standards
1. Introduction
Increasing emphasis on protecting water quality
from nonpoint pollution sources has led to a shift
in the policy objectives of conservation programs,
such as, the Conservation Reserve Program
(CRP), from on-site erosion control towards
controlling off-site sediment loadings. More re-
cently, with the development of the Conservation
Reserve Enhancement Program (CREP) the focus
of these programs has shifted towards achieving
explicitly defined goals for water quality in locally
identified environmentally sensitive river basins.
The goals of the CREP in Illinois include a 20%
reduction in sediment loadings, a 10% reduction in
nitrogen and phosphorus loadings and an increase
in aquatic and wildlife populations in the Illinois
River (USDA, 1998). The program seeks to
achieve these goals by retiring about 94 thousand
hectares of cropland in the Illinois River Basin for
at least 15 years and possibly for 35 years or
* Corresponding author. Tel.: �/1-519-824-4120x53090; fax:
�/1-519-837-2940.
E-mail address: [email protected] (W. Yang).
Ecological Economics 46 (2003) 249�/267
www.elsevier.com/locate/ecolecon
0921-8009/03/$ - see front matter # 2003 Elsevier B.V. All rights reserved.
doi:10.1016/S0921-8009(03)00141-1
permanently through offering rental payments to
landowners based on soil productivity. Eligible
land for enrollment is defined as cropland within
the basin’s 100-year floodplains, highly erodible
cropland adjacent to riparian areas, and cropland
where landowners are willing to create wetlands. A
secondary program restriction requires that 85%
of the land enrolled be within the basin’s envir-
onmentally sensitive riparian areas defined above
as 100-year floodplains. The amount of eligible
land is spread out over 100 sub-watersheds1 and is
more than six times larger than the program’s
acreage enrollment goal of 94 thousand hectares.
This raises two program implementation issues
on which the program description itself is silent.
First, should land enrollment be targeted to
achieve the environmental goals of the program
at the sub-watershed level or in the aggregate for
the river basin as a whole? Second, what types of
land parcels should be selected for enrollment in
each sub-watershed to achieve the environmental
goals cost-effectively?
The literature in environmental economics sug-
gests that when polluters are heterogeneous, an
aggregate abatement goal can be achieved cost-
effectively if each polluter undertakes pollution
abatement such that the cost of the last unit of
abatement is equalized throughout the river basin
(Baumol and Oats, 1971). This concept implies
that more abatement will occur in sub-watersheds
with low abatement costs, and less abatement will
occur in high abatement cost sub-watersheds;
implying that a non-uniform performance stan-
dard will be more cost effective than a uniform
standard. However, a social planner may prefer a
uniform performance standard where the same
abatement goal must be achieved in every sub-
watershed, for equity reasons (Schleich et al.,
1996), or to reduce transaction costs. The firstobjective of this paper is to estimate and compare
differences in costs, hectares retired and land
retirement patterns between the two performance
standards on sediment loadings.
The second objective is to develop criteria for
the land parcels that should be selected for
enrollment to meet the sediment abatement goals
of the program cost-effectively. Land parcels evenwithin a watershed are heterogeneous in their
characteristics and differ in their opportunity costs
of retirement (that is the forgone profits from crop
production) and in the extent to which their
retirement would reduce off-site sediment loadings
in the water body. Babcock et al. (1996, 1997)
suggest that land with the highest abatement
benefits to opportunity cost ratio should beselected to achieve abatement goals efficiently.
Determining the contribution of each land parcel
to off-site sediment loading requires estimation of
its sediment-trapping coefficient, and those of the
downslope parcels. Each parcel’s coefficient de-
pends on that parcel’s site-specific characteristics
(slope, soil characteristics, and distance from the
water body) and land use decision (crops, trees,pasture or grass) as well as highly complex
interdependencies between land use and sediment
trapping efficiencies of upslope and downslope
land parcels. Thus, the sediment deposition coeffi-
cient of a land parcel needs to be determined
endogenously with the land use decisions upslope
and downslope parcels.
To address these issues we develop an integratedeconomic, environmental and GIS modeling
framework that includes an endogenously deter-
mined sediment transport process and incorpo-
rates the micro-economic decision by a farmer to
retire land or continue crop production and the
environmental impacts of such decisions. This
framework extends the model development in
Khanna et al. (2003) and applies it to comparecost, acreage, location and parcel differences
between a non-uniform and uniform standard
across twelve sub-watersheds in the Illinois River
Basin.
Our research builds upon previous studies of
environmental programs on land use and farming
practices in several ways. A few studies have
1 A sub-watershed is defined as an 11-digit watershed.
Watersheds are delineated by USGS using a nationwide system
based on surface hydrologic features. Regions are defined using
a 2-digit classification, subregions are defined at the 4-digit level
accounting units and cataloguing units are defined as the 6 and
8 digit levels. A watershed is defined using an 11-digit
classification system and its size can vary between 16,000 and
101,000 hectares. For details, see http://www.ftw.nrcs.usda.gov/
UC/ni170304.html.
W. Yang et al. / Ecological Economics 46 (2003) 249�/267250
compared the efficiency and distributional impli-
cations of setting environmental standards at a
field/farm/watershed level or analyzed crop man-
agement strategies at a watershed level to reduce
pollution loadings. However, these studies as-
sumed that the relationship between on-site pollu-
tion generation and off-site pollution loadings is
dependent on exogenously given site-specific fac-
tors (Kramer et al. 1983; Ribaudo, 1986, 1989;
Prato and Wu, 1996; Carpentier et al., 1998).
Braden et al. (1989) assumed a more complex
pollution transport process in which the portion of
pollution trapped depends not only on the site-
specific characteristics but also on the manage-
ment practices of downslope parcels. However,
they did not incorporate the effect of the volume of
runoff flowing from upslope parcels on the trap-
ping capacity of downslope land parcels and
therefore ignored the impact of land use changes
upslope on sediment transport coefficients. Lint-
ner and Weersink (1999) was one of the few studies
incorporating economic, environmental and spa-
tial analyses to examine policies to reduce nitrogen
and phosphorus runoff. They incorporated the
interdependence between sediment deposition
coefficients and fertilizer-use decisions of all par-
cels in a flow path, but they assumed that all
parcels were identical. This assumption allowed
the sediment deposition ratio of a parcel to be
dependent only on its own characteristics and
reduced the true complexity of the problem. The
approach we present in this paper offers a more
realistic simulation of the sediment generation and
transport process by simultaneously determining
heterogeneous land use decisions and off-site
sediment abatement for all parcels in a flow path.
In Section 2, we present the conceptual frame-
work underlying the empirical model described in
Section 3. In Sections 4 and 5, we describe the data
used for 12 sub-watersheds in the study area
targeted under Illinois’ CREP and the results
obtained under both non-uniform and uniform
performance standards. In Section 6, we discuss
the policy implications and conclusions from this
research.
2. Conceptual framework
We assume a social planner who wants to
achieve a given sediment abatement target at
least-cost by selecting the land parcels to be retired
from crop production in a region with multiple
watersheds. The aggregate cost of abatement is
represented by the sum of abatement costs in-
curred by the owners of individual parcels whohave a choice of whether to retire their land from
crop production or to continue production. The
stringency of the sediment abatement objective
influences the amount the social planner would be
willing to compensate the landowners for retiring
their land from crop production and the parcels
that would be offered for enrollment in the land
retirement program.Consider a region with n�/l, 2, . . ., N water-
sheds, where each watershed is divided into j�/
1, . . ., Jn surface runoff channels by which pollu-
tants are transported from land to a river. Each
runoff channel comprises of i�/1, . . ., Ijn land
parcels of equal size, say a , with parcel i�/1 being
the closest to the river. The runoff channels are
independent of each other and each land parcel isassumed to be homogeneous in terms of its site-
specific characteristics such as slope, soil type, and
productivity. For each land parcel we have two
choices, either retire the land or continue crop
production on that parcel. Let pnijk be the per acre
quasi-rent earned on the ith land parcel in the jth
channel with the k th activity in watershed n , where
k�/0 indicates retirement of land and k�/1indicates crop production. The quasi-rent is de-
fined as total revenue minus total variable costs
(Just et al., 1982). For activity k , sediment
generated per land unit is denoted by snijk .
The total amount of sediment produced by the
ith parcel is given by a1k�0 snijkXnijk; where Xnijk
denotes the amount of land in that parcel allocated
to activity k . Determining the portion of thissediment that is transported to the river is a
complex process. If one parcel in a runoff channel
is converted into grass cover, not only the sedi-
ment generation and deposition ratio of that
parcel are affected, but also the deposition ratios
of all downslope parcels are affected because of the
reduced runoff volume and velocity.
W. Yang et al. / Ecological Economics 46 (2003) 249�/267 251
A fraction of the sediment produced by the ithparcel, denoted by dn ,i ,i�m ,j , is deposited in each
of the i�/m downslope parcels in flow path j ,
where m�/0, . . ., i�/1. This is referred to as the
deposition ratio of land parcel i�/m which is a
function of its site-specific characteristics, Lnij ;
land use activities, Xnijk ; and the amount of
sediment inflow, Sn ,i�1,j , from upland parcels.
Thus, we have the functional relationship:
dn;i;i�m;j �d(Ln;i�m;j; Xn;i�m;j;k; Sn;i�m;j)
for m�0; . . . ; i�1; Where:(1)
Sn;i�m;j�s(Ln;i;m�1;j ; . . . ; Ln;Ij ;j; Xn;i;m�1;j;k; . . . ; Xn;Ijn;j;k
):
(2)
As Sn ,i�m ,j increases, the deposition ratio
dn ,i ,i�m ,j in Eq. (1) is expected to decrease. The
amount of sediment Sn ,i�m ,j flowing into the (i�/
m )th parcel also depends on the site-specificcharacteristics and land use decisions by all parcels
in the channel. Thus, the fraction of sediment
deposited on the land parcels in the flow channel
and not loaded into the water body is
ai�1m�0 dn;i;i�m;j 51: From (1) and (2) we see that
the deposition ratios dn ,i ,i�m ,j (for m�/0,. . .i�/1)
of each land parcel is simultaneously determined
with the land use decision of all parcels,Xn;i;m�1;j;k; . . . ; Xn;Ijn;j;k
; in the jth flow path.
The social planner seeking to meet a sediment
abatement target A at least-cost faces a twofold
decision problem: (a) to determine the amount of
abatement to be undertaken by each of the N
watersheds such that the aggregate abatement
target is met; and (b) to select the land parcels to
be targeted for enrollment in the land retirementprogram in each watershed. Assume that S0
n is the
level of sediment loading in watershed n before
land retirement. The ocially optimal land retire-
ment pattern can be determined by solving the
following optimization problem:
MinXN
n�1
XJn
j�1
XIjn
i�1
pnij1Xnij1�XN
n�1
XJn
j�1
XIjn
i�1
�X1
k�0
pnijkXnijk (3)
Subject to
X1
k�0
Xnijk�a; �n; i; j; (4)
XN
n�1
S0n�
XN
n�1
XJn
j�1
XIjn
i�1
�1�
Xi�1
m�0
dn;i;i�m;j
�
�X1
k�0
snijkXnijk
]A: (5)
The first order optimality conditions of the
Lagrangian are
@L
@Xnijk
��pnijk
�l
��1�
Xi�1
m�0
dn;i;i�m;j
�snijk�
Xi�1
m�0
� @dn;i;i�m;j
@Xnijk
X1
k�0
snijkXnijk�XIjn�i
m�1
@dn;i�m;i;j
@Xnijk
�X1
k�0
snijkXnijk
��mnij
]0 (6)
and
@L
@Xnijk
Xnijk�0; �n; i; j and k
where l and mnij are the Lagrange multipliers
associated with constraints (4) and (5).
From the social planner’s perspective it is
optimal to retire a land parcel from production,that is X nij1� �0; if @L /@Xnij 1�/0. In this case,
according to Eq. (4) we have X nij0� �a�0; which
implies that @L=@Xnij0�0: These two conditions
can be rearranged to show that retirement of land
parcel i from crop production is socially preferable
if the net social cost of land retirement is less than
the value of crop production on that parcel:
W. Yang et al. / Ecological Economics 46 (2003) 249�/267252
l���
1�Xi�1
m�0
dn;i;i�m;j��
(snij1�snij0)�2snij0aXi�1
m�0
@dn;i;i�m;j
@Xnij0
�2snij0aXIjn�i
m�1
@dn;i�m;i;j
@Xnij0
��pnij1: (7)
l* represents the marginal value per ton of the
abatement achieved by retiring a land parcel,which is the value that the planner would be
willing to pay per ton of abatement to induce
voluntary land retirements by farmers. With an
aggregate abatement constraint, this marginal
value is the same for all watersheds, implying
that a ton of abatement from any watershed
should be valued equally. If the watersheds differ
in their costs of abatement due to differences intheir land quality and topology, this equi-marginal
principle for cost-effective abatement will result in
a non-uniform allocation of abatement responsi-
bility across the watersheds. More abatement will
occur in watersheds where abatement costs are low
compared to watersheds where abatement costs
are higher.
To examine the type of land parcels within awatershed that should be retired from crop pro-
duction we examine each of the terms in Eq. (7).
The term (1�ai�1m�0 dn;i;i�m;j� )(snij1�snij0) shows the
off-site abatement of sediment generated on parcel
i due to a change in its land use. This term is likely
to be large if retirement by the ith parcel leads to a
large reduction in its sediment generation per acre
(that is, if (snij 1�/snij 0)�/0 is large) or ifai�1
m�0 dn;i;i�m;j� is small. The latter is the case if:
(1) there are few or no downslope parcels which
can trap the sediment generated by the i th parcel
or if the deposition capability of the downslope
parcels is small; or (2) the amount of sediment
flowing in from upslope parcels in the interior
of the watershed is large. The term
ai�1m�0 (@dn;i;i�m;j=@Xnij0) represents the effect of a
change in land use decision on the ith parcel on
deposition ratios of (i�/m ) downslope parcels2.
The indirect benefit of land retirement by the ith
parcel is large if the extent to which it raises
deposition ratios of downslope parcels by reducing
sediment runoff is large3. The benefits of increased
trapping of sediment flows on downslope parcels
become particularly important if the volume of
sediment generated by the ith parcel even after
land retirement is large. The third term
aIjn�i
m�1 (@dn;i�m;i;j=@Xnij0) represents the effect of
land retirement on the ability of the ith parcel to
capture sediment from upland parcels and it is
positive. The ith land parcel provides an external
benefit to upland parcels by trapping a portion of
their sediment and preventing it from being loaded
into the water body. Together the terms on the
left-hand side of Eq. (7) indicate the marginal
value per acre of retiring a land parcel from
cropping.
Based on the terms in Eq. (7), we can identify
two types of parcels that would be good candi-
dates for retiring from crop production. Any
cropland parcel that is close to a river, generating
a large amount of eroded soil and capable of
trapping sediment from upslope parcels when
converted to permanent cover makes a good
candidate for a land retirement program. Second,
upland parcels that substantially improve the
sediment trapping efficiencies of downslope par-
cels when taken out of crop production also make
good candidates for a retirement program. In
either case, land retirement is optimal if the
forgone quasi-rent from crop production is low.
Note that due to the homogeneity assumption, in
the optimal solution each parcel is either fully
retired or fully under crop production.
For equity reasons, or to keep transactions costs
low, social planners sometimes prefer to distribute
gains and losses proportionally. In that case,
instead of setting an abatement target for the
whole region and allocating abatement responsi-
bility non-uniformly across watersheds, the social
planner could set a uniform performance standard
for each watershed. This is represented by repla-
2 This term is positive because an increase in the retired
portion of the i th land parcel reduces the volume of sediment
runoff flowing to downslope parcels, thereby increasing the
deposition ratio of each of the i�/m parcels.
3 Hydrological models indicate that large sediment inflow
from upland parcels reduces the capacity of a land parcel to
deposit sediment.
W. Yang et al. / Ecological Economics 46 (2003) 249�/267 253
cing constraint (5) by N constraints as follows
S0n�
XJn
j�1
XIjn
i�1
�1�
Xi�1
m�0
dn;i;i�m;j
�X1
k�0
snijkxnijk]An
for n�1; . . . ;N
(8)
The optimal solution would now consist of N
values of l , which would be different in most cases
because of differences in land characteristics
among watersheds. Even though the same abate-
ment goal can be achieved either with an aggregate
abatement constraint or with a uniform standard
for each watershed, having N abatement con-
straints will increase the costs of abatement
according to the LeChatelier’s principle (Varian,1992).
3. Empirical model
The endogenous sediment transport process
causes high nonlinearity of the sediment abate-
ment constraint in the theoretical model and
precludes its use in an empirical analysis4. To
cope with this complexity, we modify the theore-tical model in two ways. First, we restrict any
possible changes in land use to only the first three
parcels of every runoff channel nearest or adjacent
to a water body. The defined area is a stylized
representation of the eligible land in the Illinois
CREP5. Justifications of this restriction are pro-
vided in the next section. Second, we consider
three-parcel chains in each runoff channel ratherthan individual parcels as the primary decision
units. For each three-parcel chain, we define
alternative land retirement scenarios that represent
all possible combinations of land management
decisions, such as crop �/crop �/crop or crop �/re-
tire �/crop , etc. If for instance, all the three parcels
that make up a chain are agricultural land, this
defines eight (�/23) combinations. For each op-
tion, the sediment flow from upland parcels is
exogenous because those parcels are not part of
the decision space. Note that the three-parcel
chains in the buffer region are linked to the inland
watershed so that runoff and sediment transport
from upland parcels beyond the eligible region are
tracked and incorporated into the sediment trans-
port process within the eligible region.
The decision problem for the social planner is to
select one of the eight land management options
for every flow channel so that a specified sediment
abatement goal is reached and the sum of forgone
quasi-rents is minimized in the program area. This
problem can be formulated as an integer program-
ming model by defining a binary selection variable
for each channel and each management option.
Although this would eliminate the endogeneity of
sediment deposition ratios of individual land
parcels, we would still have a computationally
difficult problem because even for a small wa-
tershed a large number of parcels and even more
land retirement scenarios would be involved and
therefore the resulting integer programming model
would not be tractable. However, it turns out that
even if we define the selection variables as con-
tinuous variables, which would lead to a linear
programming model, the optimal solution of the
model involves only binary values for all but at
most one pair of management alternatives for one
flow chain6. By rounding the solution for that pair
to the nearest binary values, an approximately
optimal solution is obtained. The approximation
error is extremely small and can be ignored, but
4 Optimization problems with too many nonlinear
constraints are in general harder to solve than problems with
a nonlinear objective and linear constraints (McCarl and Onal,
1989). Also, in order to define a convex programming problem
and guarantee the numerical solutions to be optimal, the
nonlinear constraint functions are required to possess certain
convexity properties (Bazaraa et al., 1993). In this particular
application, the AGNPS relations describing the sediment
deposition/transport process for multi-parcel flow chains are
highly complex and violate those requirements. Therefore, the
original nonlinear problem is computationally unmanageable.5 The defined area is 21% of the entire watershed area.
6 This is based on the theory of linear programming. A
rigorous proof is not given here for the sake of space, but it is
available from the authors upon request. Empirical results also
verified this theoretical fact. In most cases, the linear
programmiing model solutions were purely binary. Such
models are sometimes called ‘integer friendly’ linear programs
in the operations research literature.
W. Yang et al. / Ecological Economics 46 (2003) 249�/267254
the advantages of this method are enormous. First,we benefit from the computational convenience of
linear programming. Second, as will be elaborated
later, linear programming provides valuable sha-
dow price information that can be used to
determine economic incentives for voluntary land
retirement, which would not be possible if an
integer programming formulation was used.
An algebraic description of the linear program-ming model for finding the least-cost solution is
relatively straightforward. For watershed n , let
Znpj denote whether or not land retirement sce-
nario p is selected for channel j , and rnpj and snpj
denote the forgone quasi-rent and sediment abate-
ment, respectively, relative to the option where all
parcels are under crop production7. The model
below determines a cost-effective pattern of landretirement in multiple watersheds under an aggre-
gate sediment abatement target in the region, A:
MinXN
n�1
XJn
j�1
X8
p�1
rnpjZnpj (9)
Subject to
XN
n�1
XJn
j�1
X8
p�1
snpjZnpj ]A (10)
X8
p�1
Znpj �1 for all j�1; . . . ; J (11)
Znpj ]0
for all j�1; . . . ; J and p�1; . . . ; 8:(12)
The empirical model for a uniform standard in
multiple watersheds is structurally the same as the
above model except that the aggregate sedimentabatement constraint (10) should be defined for
each watershed, that is
aJn
j�1 a8p�1 snpjZnpj ]An; for all n�1; . . . ; N:/
Note that in the above formulation the selection
variables, Znpj are defined as continuous variables
rather than binary variables. Therefore, Eq. (9)
through Eq. (12) define a linear programming
model. The shadow price, s , associated withconstraint (10) represents the marginal cost of
sediment abatement at the constrained level. It canbe shown that it would be optimal for the land-
owner to select enrollment option p for channel j if
an economic incentive equal to sspj was offered8.
Therefore, the term sspj represents the maximum
payment a social planner would be willing to offer
for a voluntary enrollment schedule that is con-
sistent with the socially optimal solution.
4. Data description
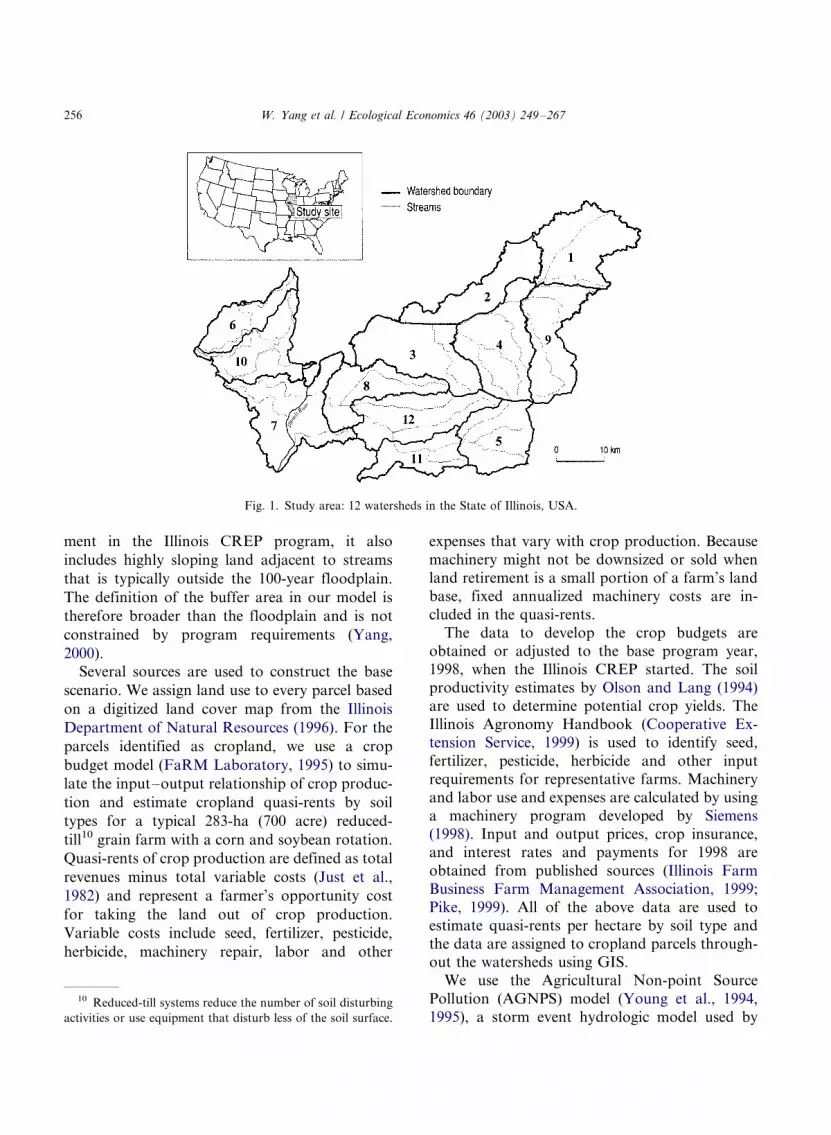
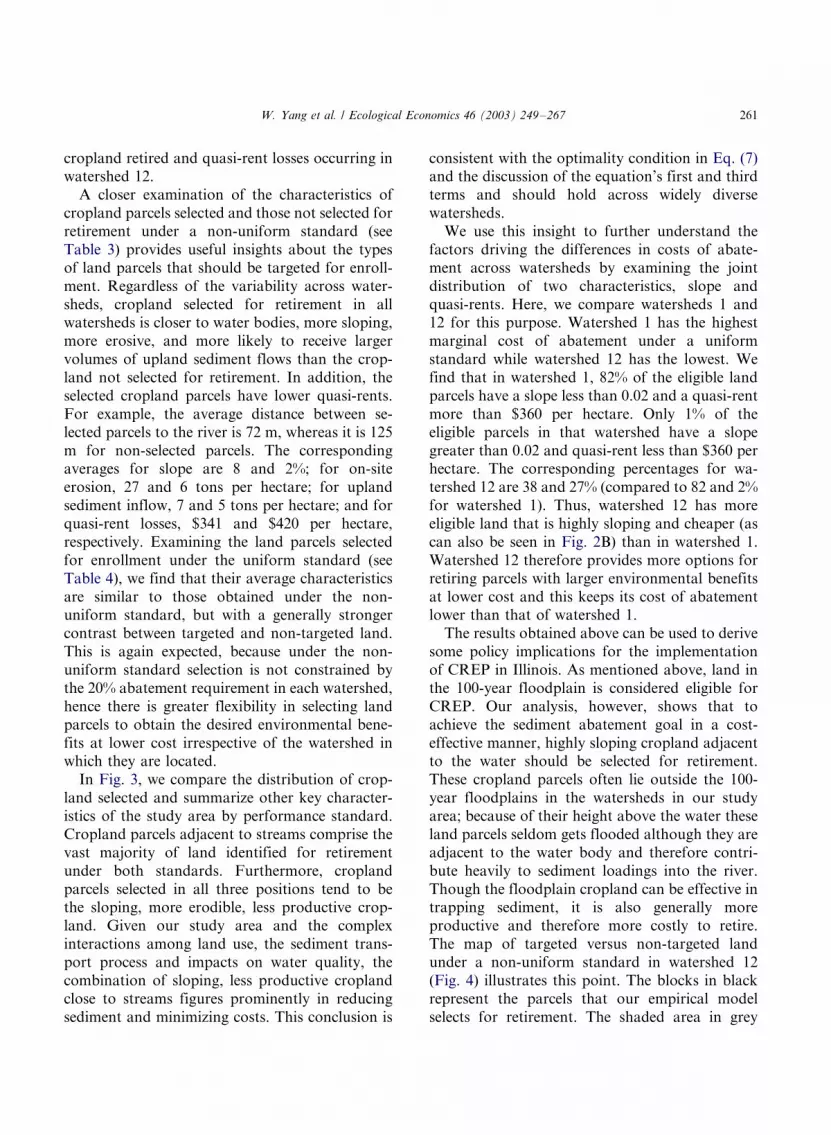
We apply the framework described above to an
area consisting of 12 contiguous watersheds inIllinois’ designated CREP region in the United
States (Fig. 1). This area lies within the boundaries
of Brown, Cass, Mason, Menard, Morgan, and
Sangaman counties in Illinois. Totaling about 250
thousand hectares, these watersheds adequately
represent the soil, terrain, crops, farming systems,
and climate found in the Illinois CREP region. For
the analysis, we partition the entire study regioninto 91-by-91 m (300-by-300 foot) parcels with
each parcel being 0.84 hectare and set the buffer
width eligible for enrollment in CREP equal to 274
meters (900 feet) along all streams and tributaries.
This parcel size matches the resolution of available
GIS data, thus minimizing problems associated
with heterogeneous characteristics within land
parcels. This definition of eligible land differsfrom the definition of riparian areas considered
to be eligible for enrollment in CREP (that is, the
100-year floodplain). For small streams in the
Illinois River Basin, this 274-in buffer generally
exceeds the 100-year floodplain boundaries, while
for major tributaries and the main Illinois River,
this buffer could be narrower than the floodplain9.
Although, for most part, this buffer closelyapproximates the floodplain eligibility require-
7 Note that rnpj and snpj are both zero for p�/1.
8 Proof of this is a straightforward matter and requires
standard linear programming theory and optimality conditions.
Therefore, it is not explained in detail here, but available upon
request.9 A 600 feet buffer is typically considered as sufficient to
meet the needs of many wildlife species, such as large mammals,
heron rookeries, bald eagles or cavity nesting birds USDA,
1996.
W. Yang et al. / Ecological Economics 46 (2003) 249�/267 255
ment in the Illinois CREP program, it also
includes highly sloping land adjacent to streams
that is typically outside the 100-year floodplain.
The definition of the buffer area in our model is
therefore broader than the floodplain and is not
constrained by program requirements (Yang,
2000).
Several sources are used to construct the base
scenario. We assign land use to every parcel based
on a digitized land cover map from the Illinois
Department of Natural Resources (1996). For the
parcels identified as cropland, we use a crop
budget model (FaRM Laboratory, 1995) to simu-
late the input�/output relationship of crop produc-
tion and estimate cropland quasi-rents by soil
types for a typical 283-ha (700 acre) reduced-
till10 grain farm with a corn and soybean rotation.
Quasi-rents of crop production are defined as total
revenues minus total variable costs (Just et al.,
1982) and represent a farmer’s opportunity cost
for taking the land out of crop production.
Variable costs include seed, fertilizer, pesticide,
herbicide, machinery repair, labor and other
expenses that vary with crop production. Because
machinery might not be downsized or sold when
land retirement is a small portion of a farm’s land
base, fixed annualized machinery costs are in-
cluded in the quasi-rents.
The data to develop the crop budgets are
obtained or adjusted to the base program year,
1998, when the Illinois CREP started. The soil
productivity estimates by Olson and Lang (1994)
are used to determine potential crop yields. The
Illinois Agronomy Handbook (Cooperative Ex-
tension Service, 1999) is used to identify seed,
fertilizer, pesticide, herbicide and other input
requirements for representative farms. Machinery
and labor use and expenses are calculated by using
a machinery program developed by Siemens
(1998). Input and output prices, crop insurance,
and interest rates and payments for 1998 are
obtained from published sources (Illinois Farm
Business Farm Management Association, 1999;
Pike, 1999). All of the above data are used to
estimate quasi-rents per hectare by soil type and
the data are assigned to cropland parcels through-
out the watersheds using GIS.
We use the Agricultural Non-point Source
Pollution (AGNPS) model (Young et al., 1994,
1995), a storm event hydrologic model used by
Fig. 1. Study area: 12 watersheds in the State of Illinois, USA.
10 Reduced-till systems reduce the number of soil disturbing
activities or use equipment that disturb less of the soil surface.
W. Yang et al. / Ecological Economics 46 (2003) 249�/267256
many researchers, to estimate erosion, sediment
and other hydrological variables. A GIS interface
originally developed by Liao (1997) is modified to
prepare parcel-specific input data (obtained from
GIS data layers) for the simulation model.
AGNPS requires input data for five parameters
at the regional (or watershed) level and 23 para-
meters at the parcel level11 (Young et al., 1994,
1995). Rainfall data from the Illinois State Survey
(Huff and Angel, 1989) are used to construct a
typical 5-year storm event (9.47 cm of rainfall for
12 h) for the study area12. The 23 parameters
required by the AGNPS model for every parcel are
derived from elevation (U.S. Geological Survey,
1997), soil (USDA, 1997) and land cover (Illinois
Department of Natural Resources, 1996) GIS data
layers and other published sources. Using the
elevation data, we assign surface runoff direction
(aspect) and slope to every parcel in each wa-
tershed. Then we associate every parcel with a
unique runoff channel, the end result being about
33 thousand channels in the 12 watersheds. The
soils data layer is used to assign soil texture,
erodibility, and soil hydrologic group to individual
parcels. Similarly, we use the land cover layer to
decide Manning’s roughness coefficient, surface
condition coefficient, cropping management fac-
tor, conservation practice factor and chemical
oxygen factor for every parcel (for definitions of
these parameters see Young et al., 1994; Wisch-
meier and Smith, 1978; Walker and Pope, 1983).
The Illinois Natural Resource Conservation Ser-
vice provided the required slope-based slope length
data and runoff curve number (USDA, 1972,1986). AGNPS defaults are employed for the
remaining parameters.
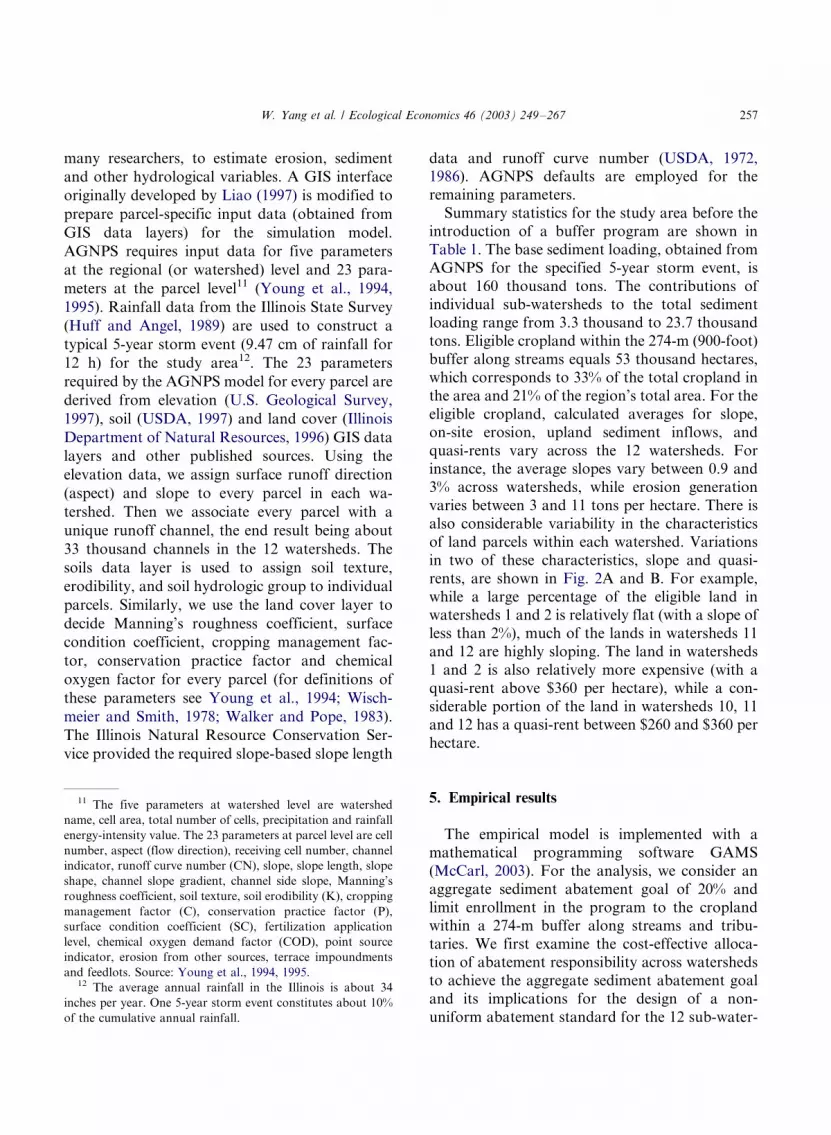
Summary statistics for the study area before the
introduction of a buffer program are shown in
Table 1. The base sediment loading, obtained from
AGNPS for the specified 5-year storm event, is
about 160 thousand tons. The contributions of
individual sub-watersheds to the total sedimentloading range from 3.3 thousand to 23.7 thousand
tons. Eligible cropland within the 274-m (900-foot)
buffer along streams equals 53 thousand hectares,
which corresponds to 33% of the total cropland in
the area and 21% of the region’s total area. For the
eligible cropland, calculated averages for slope,
on-site erosion, upland sediment inflows, and
quasi-rents vary across the 12 watersheds. Forinstance, the average slopes vary between 0.9 and
3% across watersheds, while erosion generation
varies between 3 and 11 tons per hectare. There is
also considerable variability in the characteristics
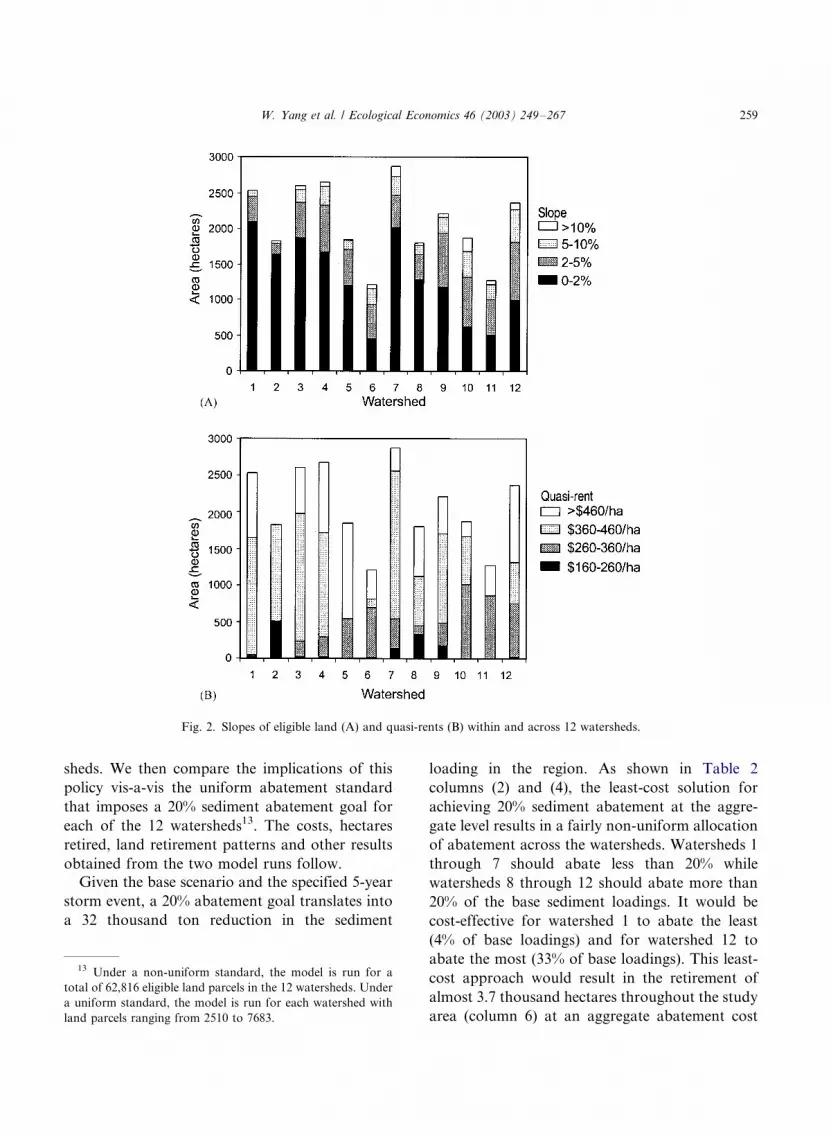
of land parcels within each watershed. Variations
in two of these characteristics, slope and quasi-
rents, are shown in Fig. 2A and B. For example,
while a large percentage of the eligible land inwatersheds 1 and 2 is relatively flat (with a slope of
less than 2%), much of the lands in watersheds 11
and 12 are highly sloping. The land in watersheds
1 and 2 is also relatively more expensive (with a
quasi-rent above $360 per hectare), while a con-
siderable portion of the land in watersheds 10, 11
and 12 has a quasi-rent between $260 and $360 per
hectare.
5. Empirical results
The empirical model is implemented with a
mathematical programming software GAMS
(McCarl, 2003). For the analysis, we consider an
aggregate sediment abatement goal of 20% and
limit enrollment in the program to the croplandwithin a 274-m buffer along streams and tribu-
taries. We first examine the cost-effective alloca-
tion of abatement responsibility across watersheds
to achieve the aggregate sediment abatement goal
and its implications for the design of a non-
uniform abatement standard for the 12 sub-water-
11 The five parameters at watershed level are watershed
name, cell area, total number of cells, precipitation and rainfall
energy-intensity value. The 23 parameters at parcel level are cell
number, aspect (flow direction), receiving cell number, channel
indicator, runoff curve number (CN), slope, slope length, slope
shape, channel slope gradient, channel side slope, Manning’s
roughness coefficient, soil texture, soil erodibility (K), cropping
management factor (C), conservation practice factor (P),
surface condition coefficient (SC), fertilization application
level, chemical oxygen demand factor (COD), point source
indicator, erosion from other sources, terrace impoundments
and feedlots. Source: Young et al., 1994, 1995.12 The average annual rainfall in the Illinois is about 34
inches per year. One 5-year storm event constitutes about 10%
of the cumulative annual rainfall.
W. Yang et al. / Ecological Economics 46 (2003) 249�/267 257
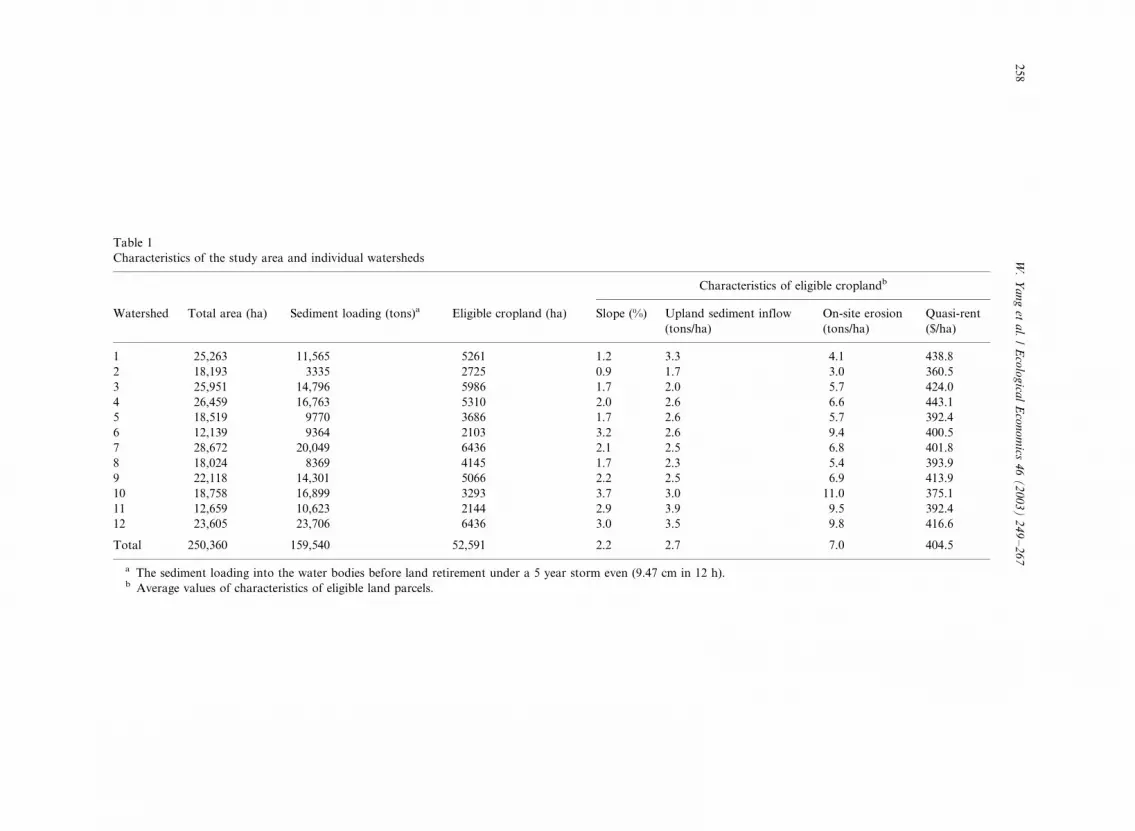
Table 1
Characteristics of the study area and individual watersheds
Characteristics of eligible croplandb
Watershed Total area (ha) Sediment loading (tons)a Eligible cropland (ha) Slope (%) Upland sediment inflow
(tons/ha)
On-site erosion
(tons/ha)
Quasi-rent
($/ha)
1 25,263 11,565 5261 1.2 3.3 4.1 438.8
2 18,193 3335 2725 0.9 1.7 3.0 360.5
3 25,951 14,796 5986 1.7 2.0 5.7 424.0
4 26,459 16,763 5310 2.0 2.6 6.6 443.1
5 18,519 9770 3686 1.7 2.6 5.7 392.4
6 12,139 9364 2103 3.2 2.6 9.4 400.5
7 28,672 20,049 6436 2.1 2.5 6.8 401.8
8 18,024 8369 4145 1.7 2.3 5.4 393.9
9 22,118 14,301 5066 2.2 2.5 6.9 413.9
10 18,758 16,899 3293 3.7 3.0 11.0 375.1
11 12,659 10,623 2144 2.9 3.9 9.5 392.4
12 23,605 23,706 6436 3.0 3.5 9.8 416.6
Total 250,360 159,540 52,591 2.2 2.7 7.0 404.5
a The sediment loading into the water bodies before land retirement under a 5 year storm even (9.47 cm in 12 h).b Average values of characteristics of eligible land parcels.
W.
Ya
ng
eta
l./
Eco
log
ical
Eco
no
mics
46
(2
00
3)
24
9�
/26
72
58
sheds. We then compare the implications of this
policy vis-a-vis the uniform abatement standard
that imposes a 20% sediment abatement goal for
each of the 12 watersheds13. The costs, hectares
retired, land retirement patterns and other results
obtained from the two model runs follow.
Given the base scenario and the specified 5-year
storm event, a 20% abatement goal translates into
a 32 thousand ton reduction in the sediment
loading in the region. As shown in Table 2
columns (2) and (4), the least-cost solution for
achieving 20% sediment abatement at the aggre-
gate level results in a fairly non-uniform allocation
of abatement across the watersheds. Watersheds 1
through 7 should abate less than 20% while
watersheds 8 through 12 should abate more than
20% of the base sediment loadings. It would be
cost-effective for watershed 1 to abate the least
(4% of base loadings) and for watershed 12 to
abate the most (33% of base loadings). This least-
cost approach would result in the retirement of
almost 3.7 thousand hectares throughout the study
area (column 6) at an aggregate abatement cost
Fig. 2. Slopes of eligible land (A) and quasi-rents (B) within and across 12 watersheds.
13 Under a non-uniform standard, the model is run for a
total of 62,816 eligible land parcels in the 12 watersheds. Under
a uniform standard, the model is run for each watershed with
land parcels ranging from 2510 to 7683.
W. Yang et al. / Ecological Economics 46 (2003) 249�/267 259
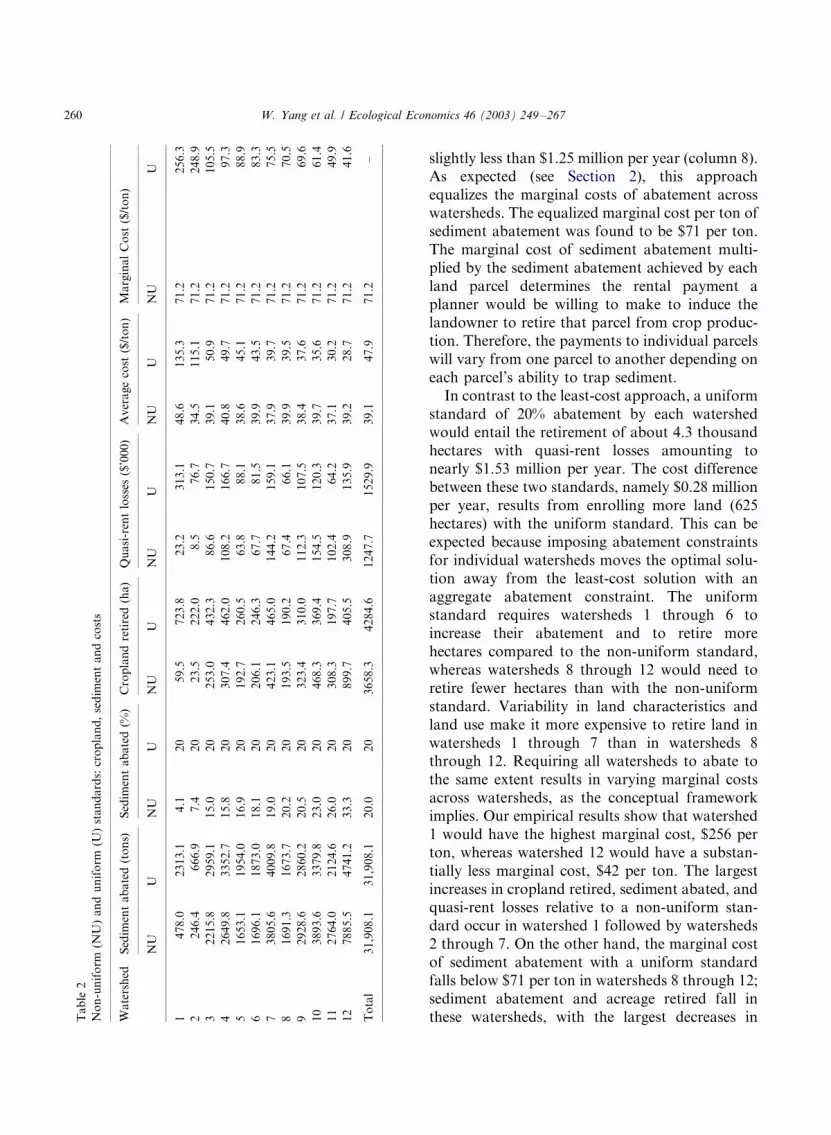
slightly less than $1.25 million per year (column 8).As expected (see Section 2), this approach
equalizes the marginal costs of abatement across
watersheds. The equalized marginal cost per ton of
sediment abatement was found to be $71 per ton.
The marginal cost of sediment abatement multi-
plied by the sediment abatement achieved by each
land parcel determines the rental payment a
planner would be willing to make to induce thelandowner to retire that parcel from crop produc-
tion. Therefore, the payments to individual parcels
will vary from one parcel to another depending on
each parcel’s ability to trap sediment.
In contrast to the least-cost approach, a uniform
standard of 20% abatement by each watershed
would entail the retirement of about 4.3 thousand
hectares with quasi-rent losses amounting tonearly $1.53 million per year. The cost difference
between these two standards, namely $0.28 million
per year, results from enrolling more land (625
hectares) with the uniform standard. This can be
expected because imposing abatement constraints
for individual watersheds moves the optimal solu-
tion away from the least-cost solution with an
aggregate abatement constraint. The uniformstandard requires watersheds 1 through 6 to
increase their abatement and to retire more
hectares compared to the non-uniform standard,
whereas watersheds 8 through 12 would need to
retire fewer hectares than with the non-uniform
standard. Variability in land characteristics and
land use make it more expensive to retire land in
watersheds 1 through 7 than in watersheds 8through 12. Requiring all watersheds to abate to
the same extent results in varying marginal costs
across watersheds, as the conceptual framework
implies. Our empirical results show that watershed
1 would have the highest marginal cost, $256 per
ton, whereas watershed 12 would have a substan-
tially less marginal cost, $42 per ton. The largest
increases in cropland retired, sediment abated, andquasi-rent losses relative to a non-uniform stan-
dard occur in watershed 1 followed by watersheds
2 through 7. On the other hand, the marginal cost
of sediment abatement with a uniform standard
falls below $71 per ton in watersheds 8 through 12;
sediment abatement and acreage retired fall in
these watersheds, with the largest decreases inTa
ble
2
No
n-u
nif
orm
(NU
)a
nd
un
ifo
rm(U
)st
an
da
rds:
cro
pla
nd
,se
dim
ent
an
dco
sts
Wa
ters
hed
Sed
imen
ta
ba
ted
(to
ns)
Sed
imen
ta
bate
d(%
)C
rop
lan
dre
tire
d(h
a)
Qu
asi
-ren
tlo
sses
($’0
00)
Aver
age
cost
($/t
on
)M
arg
ina
lC
ost
($/t
on
)
NU
UN
UU
NU
UN
UU
NU
UN
UU
14
78
.02
31
3.1
4.1
20
59
.57
23
.82
3.2
31
3.1
48
.61
35
.37
1.2
25
6.3
22
46
.46
66
.97
.42
02
3.5
22
2.0
8.5
76
.73
4.5
11
5.1
71
.22
48
.9
32
21
5.8
29
59.1
15
.02
02
53
.04
32
.38
6.6
15
0.7
39
.15
0.9
71
.21
05
.5
42
64
9.8
33
52.7
15
.82
03
07
.44
62
.01
08
.21
66
.74
0.8
49
.77
1.2
97
.3
51
65
3.1
19
54.0
16
.92
01
92
.72
60
.56
3.8
88
.13
8.6
45
.17
1.2
88
.9
61
69
6.1
18
73.0
18
.12
02
06
.12
46
.36
7.7
81
.53
9.9
43
.57
1.2
83
.3
73
80
5.6
40
09.8
19
.02
04
23
.14
65
.01
44
.21
59
.13
7.9
39
.77
1.2
75
.5
81
69
1.3
16
73.7
20
.22
01
93
.51
90
.26
7.4
66
.13
9.9
39
.57
1.2
70
.5
92
92
8.6
28
60.2
20
.52
03
23
.43
10
.01
12
.31
07
.53
8.4
37
.67
1.2
69
.6
10
38
93.6
33
79.8
23
.02
04
68
.33
69
.41
54
.51
20
.33
9.7
35
.67
1.2
61
.4
11
27
64.0
21
24.6
26
.02
03
08
.31
97
.71
02
.46
4.2
37
.13
0.2
71
.24
9.9
12
78
85.5
47
41.2
33
.32
08
99
.74
05
.53
08
.91
35
.93
9.2
28
.77
1.2
41
.6
To
tal
31
,908
.13
1,9
08
.12
0.0
20
36
58
.34
28
4.6
12
47.7
15
29.9
39
.14
7.9
71
.2� /
W. Yang et al. / Ecological Economics 46 (2003) 249�/267260
cropland retired and quasi-rent losses occurring inwatershed 12.
A closer examination of the characteristics of
cropland parcels selected and those not selected for
retirement under a non-uniform standard (see
Table 3) provides useful insights about the types
of land parcels that should be targeted for enroll-
ment. Regardless of the variability across water-
sheds, cropland selected for retirement in allwatersheds is closer to water bodies, more sloping,
more erosive, and more likely to receive larger
volumes of upland sediment flows than the crop-
land not selected for retirement. In addition, the
selected cropland parcels have lower quasi-rents.
For example, the average distance between se-
lected parcels to the river is 72 m, whereas it is 125
m for non-selected parcels. The correspondingaverages for slope are 8 and 2%; for on-site
erosion, 27 and 6 tons per hectare; for upland
sediment inflow, 7 and 5 tons per hectare; and for
quasi-rent losses, $341 and $420 per hectare,
respectively. Examining the land parcels selected
for enrollment under the uniform standard (see
Table 4), we find that their average characteristics
are similar to those obtained under the non-uniform standard, but with a generally stronger
contrast between targeted and non-targeted land.
This is again expected, because under the non-
uniform standard selection is not constrained by
the 20% abatement requirement in each watershed,
hence there is greater flexibility in selecting land
parcels to obtain the desired environmental bene-
fits at lower cost irrespective of the watershed inwhich they are located.
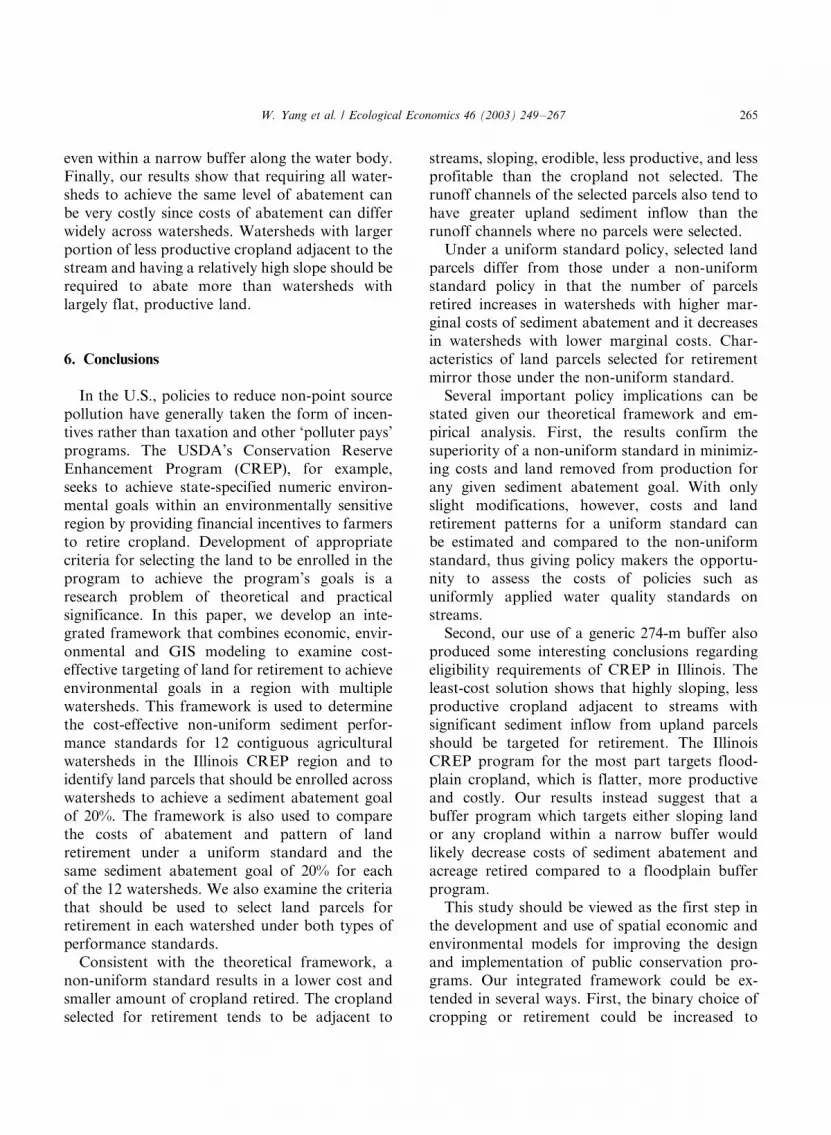
In Fig. 3, we compare the distribution of crop-
land selected and summarize other key character-
istics of the study area by performance standard.
Cropland parcels adjacent to streams comprise the
vast majority of land identified for retirement
under both standards. Furthermore, cropland
parcels selected in all three positions tend to bethe sloping, more erodible, less productive crop-
land. Given our study area and the complex
interactions among land use, the sediment trans-
port process and impacts on water quality, the
combination of sloping, less productive cropland
close to streams figures prominently in reducing
sediment and minimizing costs. This conclusion is
consistent with the optimality condition in Eq. (7)and the discussion of the equation’s first and third
terms and should hold across widely diverse
watersheds.
We use this insight to further understand the
factors driving the differences in costs of abate-
ment across watersheds by examining the joint
distribution of two characteristics, slope and
quasi-rents. Here, we compare watersheds 1 and12 for this purpose. Watershed 1 has the highest
marginal cost of abatement under a uniform
standard while watershed 12 has the lowest. We
find that in watershed 1, 82% of the eligible land
parcels have a slope less than 0.02 and a quasi-rent
more than $360 per hectare. Only 1% of the
eligible parcels in that watershed have a slope
greater than 0.02 and quasi-rent less than $360 perhectare. The corresponding percentages for wa-
tershed 12 are 38 and 27% (compared to 82 and 2%
for watershed 1). Thus, watershed 12 has more
eligible land that is highly sloping and cheaper (as
can also be seen in Fig. 2B) than in watershed 1.
Watershed 12 therefore provides more options for
retiring parcels with larger environmental benefits
at lower cost and this keeps its cost of abatementlower than that of watershed 1.
The results obtained above can be used to derive
some policy implications for the implementation
of CREP in Illinois. As mentioned above, land in
the 100-year floodplain is considered eligible for
CREP. Our analysis, however, shows that to
achieve the sediment abatement goal in a cost-
effective manner, highly sloping cropland adjacentto the water should be selected for retirement.
These cropland parcels often lie outside the 100-
year floodplains in the watersheds in our study
area; because of their height above the water these
land parcels seldom gets flooded although they are
adjacent to the water body and therefore contri-
bute heavily to sediment loadings into the river.
Though the floodplain cropland can be effective intrapping sediment, it is also generally more
productive and therefore more costly to retire.
The map of targeted versus non-targeted land
under a non-uniform standard in watershed 12
(Fig. 4) illustrates this point. The blocks in black
represent the parcels that our empirical model
selects for retirement. The shaded area in grey
W. Yang et al. / Ecological Economics 46 (2003) 249�/267 261
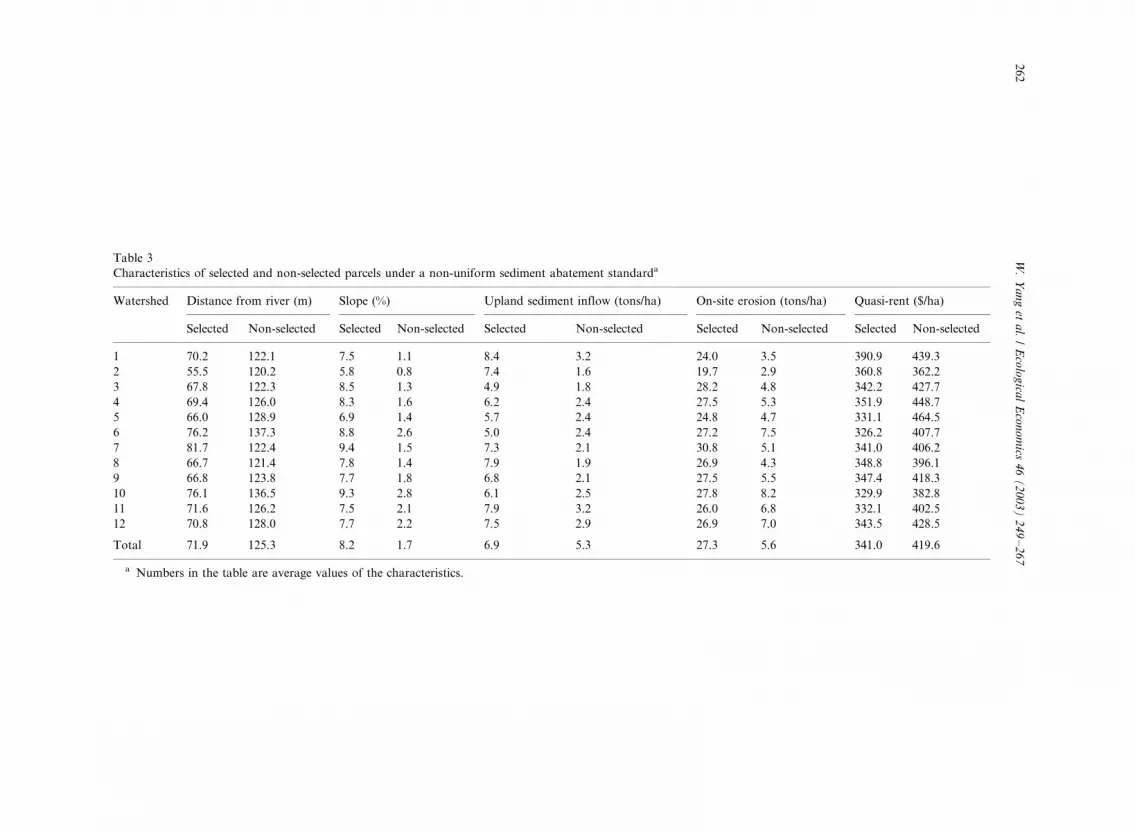
Table 3
Characteristics of selected and non-selected parcels under a non-uniform sediment abatement standarda
Watershed Distance from river (m) Slope (%) Upland sediment inflow (tons/ha) On-site erosion (tons/ha) Quasi-rent ($/ha)
Selected Non-selected Selected Non-selected Selected Non-selected Selected Non-selected Selected Non-selected
1 70.2 122.1 7.5 1.1 8.4 3.2 24.0 3.5 390.9 439.3
2 55.5 120.2 5.8 0.8 7.4 1.6 19.7 2.9 360.8 362.2
3 67.8 122.3 8.5 1.3 4.9 1.8 28.2 4.8 342.2 427.7
4 69.4 126.0 8.3 1.6 6.2 2.4 27.5 5.3 351.9 448.7
5 66.0 128.9 6.9 1.4 5.7 2.4 24.8 4.7 331.1 464.5
6 76.2 137.3 8.8 2.6 5.0 2.4 27.2 7.5 326.2 407.7
7 81.7 122.4 9.4 1.5 7.3 2.1 30.8 5.1 341.0 406.2
8 66.7 121.4 7.8 1.4 7.9 1.9 26.9 4.3 348.8 396.1
9 66.8 123.8 7.7 1.8 6.8 2.1 27.5 5.5 347.4 418.3
10 76.1 136.5 9.3 2.8 6.1 2.5 27.8 8.2 329.9 382.8
11 71.6 126.2 7.5 2.1 7.9 3.2 26.0 6.8 332.1 402.5
12 70.8 128.0 7.7 2.2 7.5 2.9 26.9 7.0 343.5 428.5
Total 71.9 125.3 8.2 1.7 6.9 5.3 27.3 5.6 341.0 419.6
a Numbers in the table are average values of the characteristics.
W.
Ya
ng
eta
l./
Eco
log
ical
Eco
no
mics
46
(2
00
3)
24
9�
/26
72
62
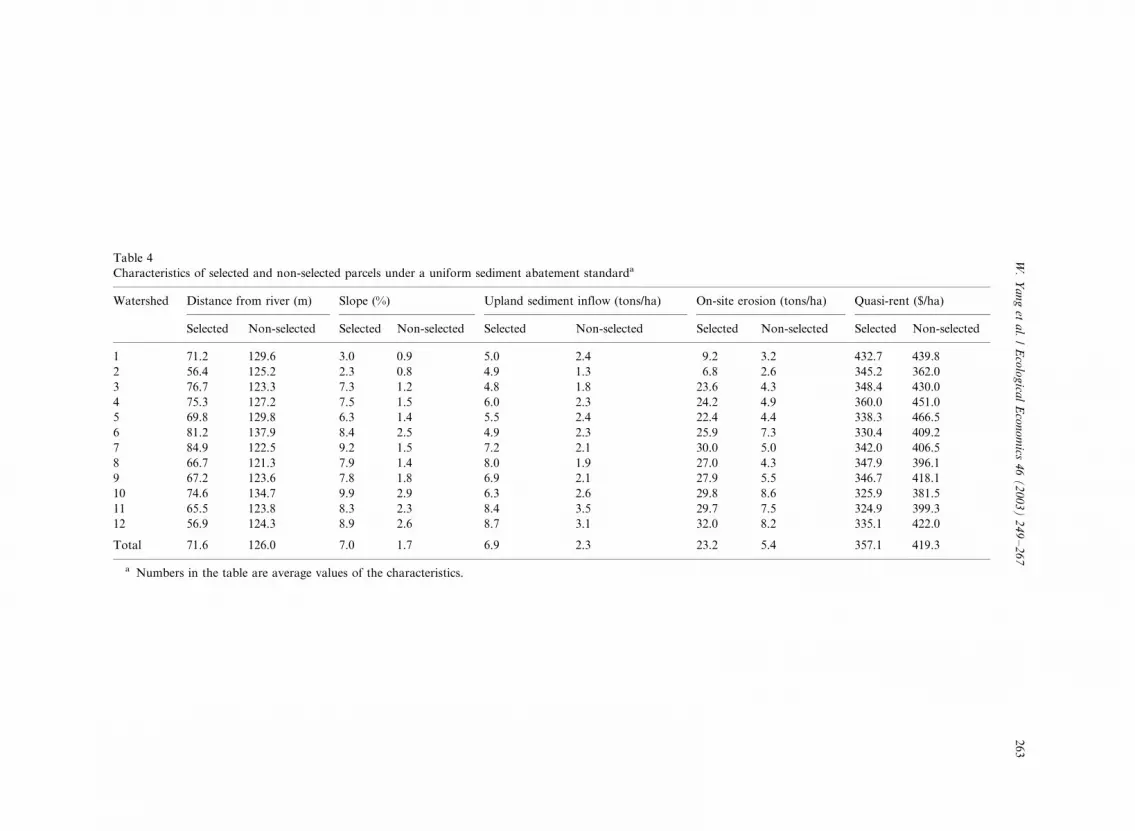
Table 4
Characteristics of selected and non-selected parcels under a uniform sediment abatement standarda
Watershed Distance from river (m) Slope (%) Upland sediment inflow (tons/ha) On-site erosion (tons/ha) Quasi-rent ($/ha)
Selected Non-selected Selected Non-selected Selected Non-selected Selected Non-selected Selected Non-selected
1 71.2 129.6 3.0 0.9 5.0 2.4 9.2 3.2 432.7 439.8
2 56.4 125.2 2.3 0.8 4.9 1.3 6.8 2.6 345.2 362.0
3 76.7 123.3 7.3 1.2 4.8 1.8 23.6 4.3 348.4 430.0
4 75.3 127.2 7.5 1.5 6.0 2.3 24.2 4.9 360.0 451.0
5 69.8 129.8 6.3 1.4 5.5 2.4 22.4 4.4 338.3 466.5
6 81.2 137.9 8.4 2.5 4.9 2.3 25.9 7.3 330.4 409.2
7 84.9 122.5 9.2 1.5 7.2 2.1 30.0 5.0 342.0 406.5
8 66.7 121.3 7.9 1.4 8.0 1.9 27.0 4.3 347.9 396.1
9 67.2 123.6 7.8 1.8 6.9 2.1 27.9 5.5 346.7 418.1
10 74.6 134.7 9.9 2.9 6.3 2.6 29.8 8.6 325.9 381.5
11 65.5 123.8 8.3 2.3 8.4 3.5 29.7 7.5 324.9 399.3
12 56.9 124.3 8.9 2.6 8.7 3.1 32.0 8.2 335.1 422.0
Total 71.6 126.0 7.0 1.7 6.9 2.3 23.2 5.4 357.1 419.3
a Numbers in the table are average values of the characteristics.
W.
Ya
ng
eta
l./
Eco
log
ical
Eco
no
mics
46
(2
00
3)
24
9�
/26
72
63
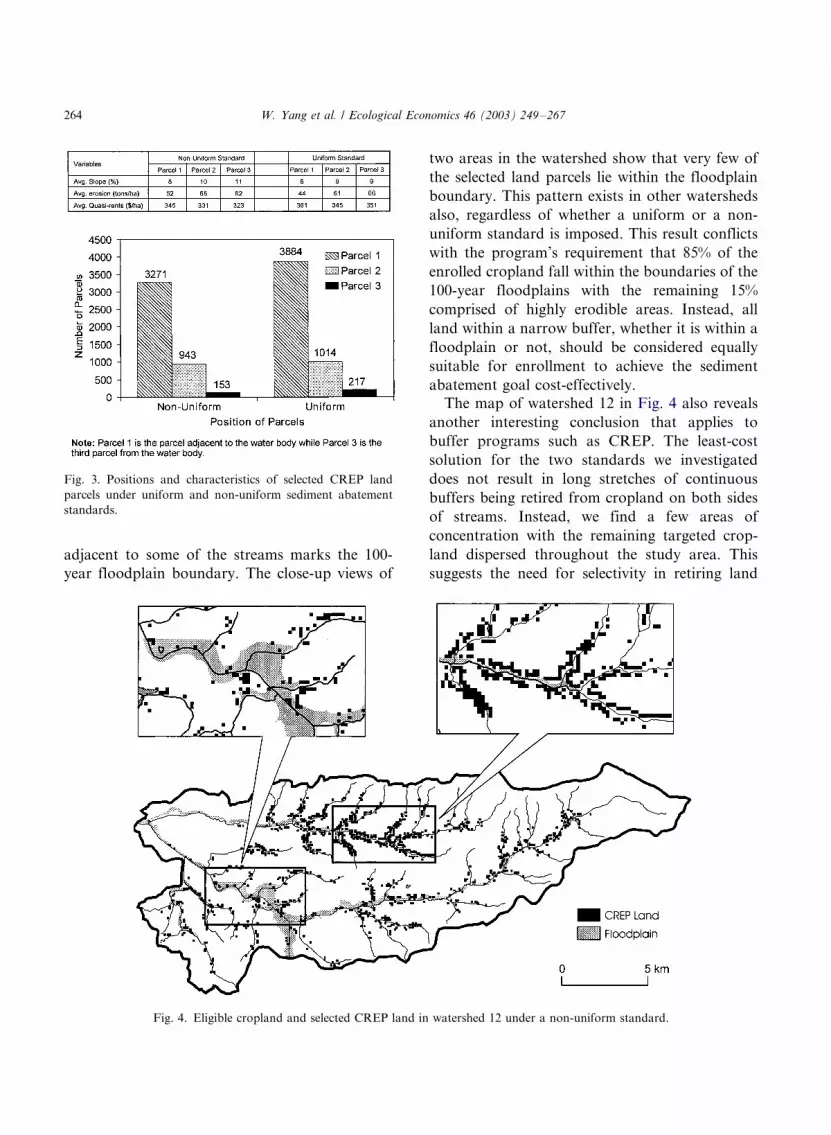
adjacent to some of the streams marks the 100-
year floodplain boundary. The close-up views of
two areas in the watershed show that very few of
the selected land parcels lie within the floodplain
boundary. This pattern exists in other watersheds
also, regardless of whether a uniform or a non-
uniform standard is imposed. This result conflicts
with the program’s requirement that 85% of the
enrolled cropland fall within the boundaries of the
100-year floodplains with the remaining 15%
comprised of highly erodible areas. Instead, all
land within a narrow buffer, whether it is within a
floodplain or not, should be considered equally
suitable for enrollment to achieve the sediment
abatement goal cost-effectively.
The map of watershed 12 in Fig. 4 also reveals
another interesting conclusion that applies to
buffer programs such as CREP. The least-cost
solution for the two standards we investigated
does not result in long stretches of continuous
buffers being retired from cropland on both sides
of streams. Instead, we find a few areas of
concentration with the remaining targeted crop-
land dispersed throughout the study area. This
suggests the need for selectivity in retiring land
Fig. 3. Positions and characteristics of selected CREP land
parcels under uniform and non-uniform sediment abatement
standards.
Fig. 4. Eligible cropland and selected CREP land in watershed 12 under a non-uniform standard.
W. Yang et al. / Ecological Economics 46 (2003) 249�/267264
even within a narrow buffer along the water body.Finally, our results show that requiring all water-
sheds to achieve the same level of abatement can
be very costly since costs of abatement can differ
widely across watersheds. Watersheds with larger
portion of less productive cropland adjacent to the
stream and having a relatively high slope should be
required to abate more than watersheds with
largely flat, productive land.
6. Conclusions
In the U.S., policies to reduce non-point source
pollution have generally taken the form of incen-
tives rather than taxation and other ‘polluter pays’
programs. The USDA’s Conservation Reserve
Enhancement Program (CREP), for example,seeks to achieve state-specified numeric environ-
mental goals within an environmentally sensitive
region by providing financial incentives to farmers
to retire cropland. Development of appropriate
criteria for selecting the land to be enrolled in the
program to achieve the program’s goals is a
research problem of theoretical and practical
significance. In this paper, we develop an inte-grated framework that combines economic, envir-
onmental and GIS modeling to examine cost-
effective targeting of land for retirement to achieve
environmental goals in a region with multiple
watersheds. This framework is used to determine
the cost-effective non-uniform sediment perfor-
mance standards for 12 contiguous agricultural
watersheds in the Illinois CREP region and toidentify land parcels that should be enrolled across
watersheds to achieve a sediment abatement goal
of 20%. The framework is also used to compare
the costs of abatement and pattern of land
retirement under a uniform standard and the
same sediment abatement goal of 20% for each
of the 12 watersheds. We also examine the criteria
that should be used to select land parcels forretirement in each watershed under both types of
performance standards.
Consistent with the theoretical framework, a
non-uniform standard results in a lower cost and
smaller amount of cropland retired. The cropland
selected for retirement tends to be adjacent to
streams, sloping, erodible, less productive, and lessprofitable than the cropland not selected. The
runoff channels of the selected parcels also tend to
have greater upland sediment inflow than the
runoff channels where no parcels were selected.
Under a uniform standard policy, selected land
parcels differ from those under a non-uniform
standard policy in that the number of parcels
retired increases in watersheds with higher mar-ginal costs of sediment abatement and it decreases
in watersheds with lower marginal costs. Char-
acteristics of land parcels selected for retirement
mirror those under the non-uniform standard.
Several important policy implications can be
stated given our theoretical framework and em-
pirical analysis. First, the results confirm the
superiority of a non-uniform standard in minimiz-ing costs and land removed from production for
any given sediment abatement goal. With only
slight modifications, however, costs and land
retirement patterns for a uniform standard can
be estimated and compared to the non-uniform
standard, thus giving policy makers the opportu-
nity to assess the costs of policies such as
uniformly applied water quality standards onstreams.
Second, our use of a generic 274-m buffer also
produced some interesting conclusions regarding
eligibility requirements of CREP in Illinois. The
least-cost solution shows that highly sloping, less
productive cropland adjacent to streams with
significant sediment inflow from upland parcels
should be targeted for retirement. The IllinoisCREP program for the most part targets flood-
plain cropland, which is flatter, more productive
and costly. Our results instead suggest that a
buffer program which targets either sloping land
or any cropland within a narrow buffer would
likely decrease costs of sediment abatement and
acreage retired compared to a floodplain buffer
program.This study should be viewed as the first step in
the development and use of spatial economic and
environmental models for improving the design
and implementation of public conservation pro-
grams. Our integrated framework could be ex-
tended in several ways. First, the binary choice of
cropping or retirement could be increased to
W. Yang et al. / Ecological Economics 46 (2003) 249�/267 265
include continuous cropping choices with conser-vation practices. Second, our modeling framework
could be extended to examine pollutant trading.
The least-cost non-uniform allocation of land
retirement could be achieved by a program that
allows trading of pollution permits across water-
sheds. Our results show the cost-savings that could
be achieved by allowing trading instead of requir-
ing each watershed to meet the same environmen-tal standard. Third, the hydrologic component
could be expanded to include tile drainage as well
as stream bank and in-stream erosion. There is
considerable debate among researchers regarding
the effectiveness of buffers in watersheds that have
been extensively tiled and watersheds where sedi-
ment from overland sediment flow is considerably
less compared to stream bank and in-streamerosion. Fourth, further research could be con-
ducted to study the implications of characterizing
or simplifying the endogenous pollution transport
process in model estimation. The investigation will
shed light on the errors involved in using exogen-
ously fixed pollution delivery coefficients and
developing simpler models that could be used for
policy analysis on a larger scale. Fifth, the institu-tional barriers to targeting conservation programs
and the transactions costs of targeting could be
incorporated to improve policy analysis. Finally,
more research is needed to examine how the
criteria for land enrollment would change if the
other objectives of CREP are included in our
analysis.
Acknowledgements
The authors would like to thank Hsiu-Hua Liao
for providing a prototype ARC/AGNPS interface
for our study and thank Marie Puddister for
designing figures in the paper. We also acknowl-
edge support from the Illinois Council on Foodand Agricultural Research and the Cooperative
State Research, Education and Extension Service,
U.S. Department of Agriculture, under Project
No. ILLU-05-0305. However, the views expressed
in this article are those of the authors and do not
necessarily reflect those of the Illinois Council on
Food and Agricultural Research or the U.S.Department of Agriculture.
References
Babcock, B.A., Lakshminarayan, P.G., Wu, J., Zilberman, D.,
1996. The Economics of a public fund for environmental
amenities: a study of CRP contracts. American Journal of
Agricultural Economics 78 (4), 961�/971.
Babcock, B.A., Lakshminarayan, P.G., Wu, J., Zilberman, D.,
1997. Targeting tools for the purchase of environmental
amenities. Land Economics 73 (3), 325�/339.
Baumol, W.J., Oats, W.E., 1971. The use of standards and
prices for protection of the environment. Swedish Journal of
Economics 73, 42�/54.
Bazaraa, M., Sherali, H.D., Shetty, C.M., 1993. Nonlinear
Programming: Theory and Algorithms. John Wiley and
Sons, New York.
Braden, J.B., Johnson, G.V., Bouzaher, A., Miltz, D., 1989.
Optimal spatial management of agricultural pollution.
American Journal of Agricultural Economics 61 (5), 404�/
413.
Carpentier, C.L., Bosch, D.J., Batie, S.S., 1998. Using spatial
information to reduce costs of controlling agricultural
nonpoint source pollution. Agricultural and Resources
Review 27 (1), 72�/84.
Cooperative Extension Service, 1999. Illinois Agronomy Hand-
book. Department of Crop Sciences, University of Illinois at
Urbana-Champaign.
FaRM Laboratory, 1995. Crop and Livestock Budgets: Exam-
ples for Illinois 1995�/1996. AE-4700-95. Department of
Agricultural and Consumer Economics, University of
Illinois at Urbana-Champaign.
Huff, F.A., Angel, J.R., 1989. Frequency Distributions of
Heavy Rainstorms in Illinois. Circular 172. Illinois Satte
Water Survey, Champaign, Illinois.
Illinois Department of Natural Resources, 1996. Illinois Geo-
graphic Information System. CD ROM.
Illinois Farm Business Farm Management Association, 1999.
Farm Income and Production Cost Summary from Illinois
Farm Business Records.
Just, E.R., Hueth, D.L., Schmitz, A., 1982. Applied Welfare
Economics and Public Policy. N.J, Englewood Cliffs,
Prentice-Hall.
Khanna, M., Yang, W., Farnsworth, R., Onal, H., 2003, Cost�/
effective targeting of CREP to improve water quality with
endogenous sediment deposition coefficients. American
Journal of Agricultural Economics 85 (3), 538�/553.
Kramer, R.A., McSweeny, W.T., Stavros, R.W, 1983. Soil
conservation with uncertain revenues and input supplies.
American Journal of Agricultural Economics 65 (4), 694�/
702.
Liao, H., 1997. AGNPS-ARC/INFO User Interface, unpub-
lished manual.
W. Yang et al. / Ecological Economics 46 (2003) 249�/267266
Lintner, A.M., Weersink, A., 1999. Endogenous transport
coefficients: implications for improving water quality from
multi-contaminants in an agricultural watershed. Environ-
mental and Resource Economics 14 (2), 269�/296.
McCarl, B.A., Onal, H., 1989. Linear approximation using
MOTAD and separable programming: Should it be done?
American Journal of Agricultural Economics 71, 158�/165.
McCarl, B. 2003. GAMS User Guide. http://www.gams.com/
dd/docs/bigdocs/gams2002/.
Olson, K.R., Lang, J.M., 1994. Productivity of Newly Estab-
lished Illinois Soils, 1978�/1994, Supplement to Soil Pro-
ductivity in Illinois. Department of Agronomy, University
of Illinois at Urbana-Champaign.
Pike, D.R., 1999. Market Survey of Agricultural Inputs.
Department of Crop Science, University of Illinois, Ur-
bana-Champaign.
Prato, T., Wu, S., 1996. Alternative spatial criteria for targeting
soil and water quality improvements in an agricultural
watershed. Review of Agricultural Economics 18, 293�/301.
Ribaudo, M.O., 1986. Considerations of offsite impacts in
targeting soil conservation programs. Land Economics 62
(4), 402�/411.
Ribaudo, M.O., 1989. Targeting the conservation reserve
program to maximize water quality benefits. Land Econom-
ics 65 (4), 320�/332.
Schleich, J., White, D., Stephenson, K., 1996. Cost implications
in achieving alternative water quality targets. Water Re-
sources Research 32 (9), 2879�/2884.
Siemens, J., 1998. Machinery Cost Program. Department of
Agricultural Engineering, University of Illinois at Urbana-
Champaign.
USDA, Soil Conservation Service, 1972. National Engineering
Handbook. Section 4, Hydrology. Washington, DC.
USDA, NRCS, 1996. Virginia Conservation Practice Standard:
Riparian Forest Buffer. Virginia Riparian Forest Buffer
391-1 Richmond, VA
USDA, 1986. Urban Hydrology for Small Watershed. Wa-
shington, DC.
USDA, NRCS-Soil Survey Division, 1997. National
STATSGO Database. http://www.ftw.nrcs.usda.gov/stats-
go_ftp.html.
USDA, FSA, 1998. Agreement between the U.S. Department
of Agriculture, Commodity Credit Corporation, and the
State of Illinois. http://www.fsa.usda.gov/dafp/cepd/crep/
ilagreement.htm.
U.S. Geological Survey, 1997. USGS Geographic Data Down-
load: 1:24,000 Scale Digital Elevation Model (DEM) SDTS
Format. http://edcwww.cr.usgs.gov/doc/edchome/ndcdb/
ndcdb.html.
Varian, H.R., 1992. Microeconomic Analysis, 3rd ed.. W.W.
Norton and Company, NY.
Walker, Robert D., Pope, R.A., 1983. Estimating Your Soil
Losses with the Universal Soil Loss Equation (USLE).
Cooperative Extension Service, University of Illinois at
Urbana-Champaign.
Wischmeier, W.H., Smith, D.D., 1978. Predicting Rainfall
Erosion Losses*/A Guide to Conservation Planning. U.S.
Department of Agriculture, Agricultural Handbook No.
537.
Yang, W., 2000. Cost Effective Targeting of Land Retirement
Programs to Improve Water Quality. Ph.D. Thesis, Depart-
ment of Agricultural and Consumer Economics, University
of Illinois.
Young, R.A., Onstad, C.A., Bosch, D.D. Bosch, Anderson,
W.P., 1994. AGNPS User’ Guide.
Young, R.A., Onstad, C.A., Bosch, D., 1995. AGNPS: An
Agricultural Nonpoint Source Model. In: Singh, V.P. (Ed.),
Computer Models of Watershed Hydrology. Water Re-
sources Publications, Highlands Ranch, CO, pp. 1001�/
1020.
W. Yang et al. / Ecological Economics 46 (2003) 249�/267 267