Geographic Information System (GIS) What is GIS? - Connect ...
Upload
independentCategory
view
6download
0
Proceedings of the Spatial Information Research Centre’s 10th Colloquium 343
Integrating 3D-GIS and Virtual RealityDesign and implementation of the Karma VI system
Gert van Maren1, Rick Germs2 & Frederik Jansen2
AbstractVirtual reality is becoming a popular tool to visualize
3D GIS data. Direct interaction with the GIS data,
however, is often limited. In this paper, we present a
multi-view approach to support 3D GIS interaction
within VR-environments. This approach is imple-
mented in the Karma VI system, using existing GIS
and VR technology. We describe the multi-view
approach, the system components and the internal
data models, and how CAD models can be imported
and be made consitent with the GIS data.
Keywords and phrases: 3D GIS, Virtual Reality,Visualization, and Manipulation.
1.0 IntroductionVirtual reality offers new and exiting opportunities to
visualize 3D GIS data. Users can walk through 3D
environments, see newly planned buildings and
appreciate changes in the landscape. In most cases,
however, interaction with the data is limited to
viewing. At the most there is some limited form of
navigation and interrogation, e.g. the user walks
around in the virtual environment and can point to
objects in the scene and ask for information from a
GIS database. The possibilities to interrogate the GIS
database in a more intelligent way and to access more
advanced GIS functionality are limited. One reason
being that within an immersive environment there is
no good 3D alternative for regular alphanumeric input
with mouse and keyboard, for instance to formulate a
SQL-query. Even if we introduce a spoken language
interface, then we will still miss the spatial references
and attributes to formulate these queries.
1.1 Multi-view approachTo support 3D GIS interaction within VR-environ-
ments we developed a multi-view approach based on
three types of visualization: plan view, model view
and world view. The ‘plan view’ visualizes the data as
a conventional cartographic map. The ‘model view’
provides a 3D bird’s-eye view on a partly symbolic
and simplified 3D representation of the data. The
‘world view’ gives the full immersive and photo-
realistic 3D display. These views or modes can be
used simultaneously or intermittently, and each
provides a repertoire of interaction possibilities that is
apt -but not necessarily limited- to that kind of
visualization and interaction.
The multi-view approach is based on the planning of
design projects for large infrastructure works.
Research of the planning of design projects in The
Netherlands (Verzijl, 1998), (Verbree, 1998) showed
that three main design stages can be discerned each
with a different use of GIS systems:
• Orientation (plan study)
• Modelling
• Presentation (decision making)
During the orientation stage, the use of GIS-systems
1Department of GIS TechnologyFaculty of Civil Engineering and Geosciences
Delft University of TechnologyThe Netherlands
Phone: +31 (0)15 2782795 Fax: +31 (0)15 2782745E-mail: [email protected]
Web: http://gisvr2.geo.tudelft.nl/3dgisvri/3dgisvri.htm
2Department of Technical Mathematics andInformatics
Faculty of Information Technology and SystemsDelft University of Technology
The NetherlandsPhone: +31 (0)15 2782795 Fax: +31 (0)15 2782745
E-mail: [email protected]: http://gisvr2.geo.tudelft.nl/3dgisvri/3dgisvri.htm
Presented at the 10th Colloquium of the Spatial Information Research Centre,University of Otago, New Zealand, 16-19 November, 1998
Proceedings of the Spatial Information Research Centre’s 10th Colloquium344
is confined to standard 2D functionality for creation,
manipulation and analysis of geographic objects.
Objects are only indicated by position and contour.
Visualization is achieved through 2D plans and maps.
In the modelling stage, infrastructure engineers are
more concerned with the general arrangement of
objects, as well as size, dimension and the relation
between objects. The use of GIS-systems in this stage
shifts from 2D to 3D modelling and analysis. A 3D-
scale model of the construction site and its surround-
ings is used for both visualization and manipulation
of 3D objects. Finally, during the presentation stage,
the design will be converted into a form to be
presented to all participants in the decision process.
This can be done either through detailed drawings,
artist’s impressions, CAD renderings, photo-collages,
or with very detailed and realistic scale models.
Visual analysis is the main task at this stage of the
plan process and a more realistic visualization will
only improve the presentation of the plans.
Summarizing, during the planning and development
process, the plan goes through different stages, each
using a specific representation of the plans, each
addressing specific ways of analysing and visualizing
the plans. We therefore decided to use a multi-view
approach with a preferred virtual reality display
system for each view.
1.2 Virtual RealityThe basic concept of virtual reality (VR) is the direct
coupling of the viewing position used to generate the
image on the display, with the head position and
viewing direction of the user. The head position of the
user is constantly tracked and fed into the display
algorithm to calculate a correct stereoscopic and
perspective display of the scene. This strong coupling
of the current eye position of the user and the image
offered by the display system gives the user the
illusion of ‘immersiveness’. Current VR systems
range from true immersive to non-immersive
displays.
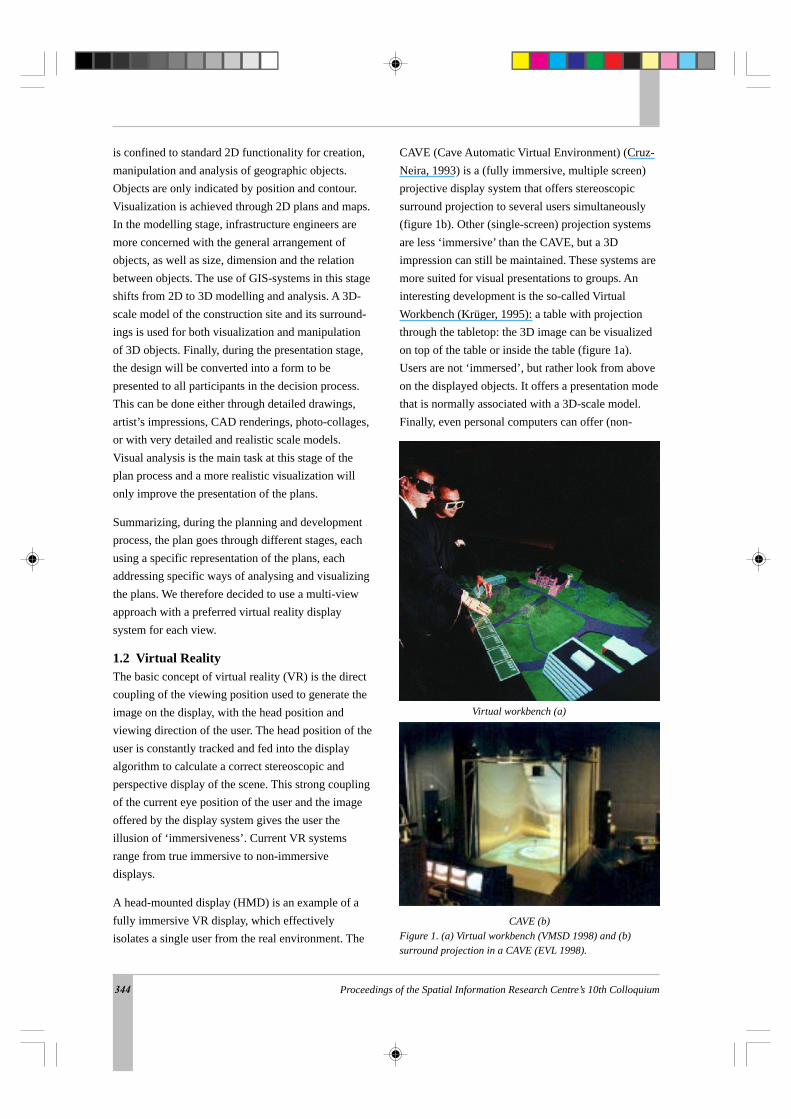
A head-mounted display (HMD) is an example of a
fully immersive VR display, which effectively
isolates a single user from the real environment. The
CAVE (Cave Automatic Virtual Environment) (Cruz-
Neira, 1993) is a (fully immersive, multiple screen)
projective display system that offers stereoscopic
surround projection to several users simultaneously
(figure 1b). Other (single-screen) projection systems
are less ‘immersive’ than the CAVE, but a 3D
impression can still be maintained. These systems are
more suited for visual presentations to groups. An
interesting development is the so-called Virtual
Workbench (Krüger, 1995): a table with projection
through the tabletop: the 3D image can be visualized
on top of the table or inside the table (figure 1a).
Users are not ‘immersed’, but rather look from above
on the displayed objects. It offers a presentation mode
that is normally associated with a 3D-scale model.
Finally, even personal computers can offer (non-
CAVE (b)
Figure 1. (a) Virtual workbench (VMSD 1998) and (b)surround projection in a CAVE (EVL 1998).
Virtual workbench (a)
Proceedings of the Spatial Information Research Centre’s 10th Colloquium 345
immersive) stereoscopic display, bringing VR to the
desktop (Earnshaw, 1993), (Kalawsky 1994).
1.3 Karma VIWe are currently developing a 3D GIS & VR system
called Karma VI, based on existing GIS and VR
technology to support the design, development and
presentation of large infrastructure plans in The
Netherlands. Karma VI uses the multi-view mode
approach where each view mode has a preferred VR
display system. Next to the different view modes, an
essential feature of the system is the support for
manipulation and editing of GIS data from within the
VR environment.
In the following sections, we describe the basic set-up
of the system. First, we will introduce the three views
for visualization of (3D) GIS data and next, we will
describe the system components, data models and
functionality in the system design section.
2 ViewsCombining the three design stages and interaction
modes with the different VR visualization techniques,
we derive three modes for modelling and visualiza-
tion, which we call ‘views’ (figure 2):
• Plan View
• Model View
• World View
First, we describe the visualization method and
preferred display system for each view. After that, we
look at the geometric representations of geographic
data used in each of the views. Finally, user interac-
tion modes are discussed.
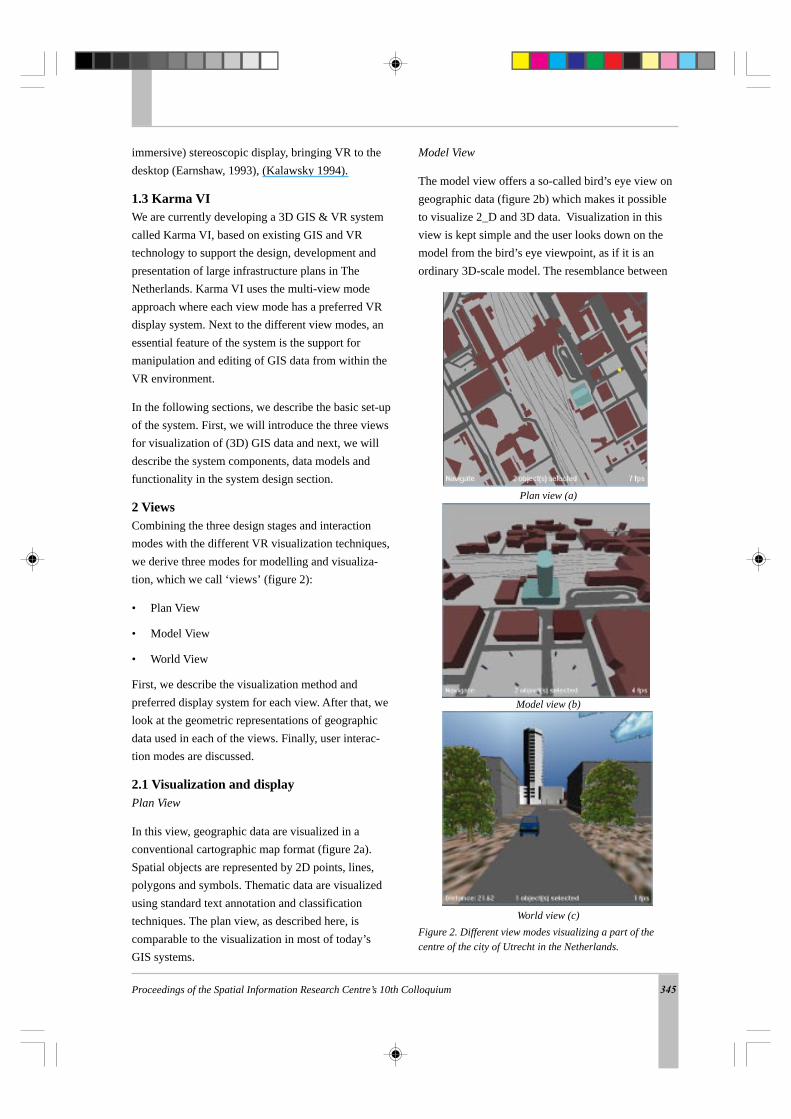
2.1 Visualization and displayPlan View
In this view, geographic data are visualized in a
conventional cartographic map format (figure 2a).
Spatial objects are represented by 2D points, lines,
polygons and symbols. Thematic data are visualized
using standard text annotation and classification
techniques. The plan view, as described here, is
comparable to the visualization in most of today’s
GIS systems.
Figure 2. Different view modes visualizing a part of the
centre of the city of Utrecht in the Netherlands.
Plan view (a)
Model view (b)
World view (c)
Model View
The model view offers a so-called bird’s eye view on
geographic data (figure 2b) which makes it possible
to visualize 2_D and 3D data. Visualization in this
view is kept simple and the user looks down on the
model from the bird’s eye viewpoint, as if it is an
ordinary 3D-scale model. The resemblance between
Proceedings of the Spatial Information Research Centre’s 10th Colloquium346
the model view and an ordinary 3D-scale model is not
just a coincidence. A 3D-scale model offers an
overview on the area of interest, giving users the
ability to make changes to the model without losing
sight on the (overall) effects of these changes.
Visualization in the model view is aimed at just that
type of functionality: to let users ‘model’ their 3D
geographic data.
World View
This is the immersive, first person view on the area of
interest. The purpose of this view is to give a realistic
impression of the changes in the landscape, using
both visual and auditive output. The user can ‘walk
through’ the geographic data, which are visualized
using detailed 3D CAD models and textures (figure
2c).
For each view, there is a preferred display system.
The plan view is most efficient on a monitor with
window and mouse interaction. For the model view, a
virtual workbench will be an appropriate display
system (see figure 1a). The world view is best viewed
with a truly immersive display. A HMD can be used,
but display systems with surround projection, such as
the CAVE are preferred (see figure 1b).
However, it would be very inconvenient to always
have to change display system when turning to
another view. Therefore, all views should be sup-
ported on all available systems. For example, it
should be possible to open a window in the world
view to display the plan view. Similarly, it should be
possible to display the world view on a standard
monitor, even if this would mean loss of stereo and
sense of immersion.
2.2 Geometric representationsEach view has its own visualization features, and will
consequently need its own geometric model represen-
tation. These representations range from 2D symbolic
(plan view), to 3D realistic models (world view).
The plan view requires 2D symbolic representations
that are defined in a (x, y) coordinate system, and are
built up out of points, lines and polygons (areas). The
model view relies on a 2_D geometric representation.
The 2_D representation is actually just a 2D data
representation, where each 2D point, line or area
feature is given an additional ‘height’ value (z-
coordinate). Only one z can exist at any (x, y)
coordinate. That is why this geometric representation
is called 2_D; in a real 3D coordinate space, any
combination of (x, y, z) is allowed. To model the
ground level, TINs (Triangular Irregular Networks)
are used. True 3D objects can be represented by
elementary 2_D building blocks (e.g. for houses,
buildings and other constructions). Finally, the world
view needs a very detailed 3D CAD model, enriched
with texture maps and procedural models (e.g. to
create vegetation, traffic and weather conditions).
2_D TINs can still be used to model the ground
surface.
2.3 User InteractionThe three views require different ways to navigate
through, and interact with the data. The plan view is
best suited for specifying, selecting and exploring
data. A user will be able to navigate through scrolling,
panning and zooming or through browsing via
hypertext links. The user interface will accommodate
most features of today’s GIS systems, using standard
interface components like menus and icons.
The model view lets a user arrange infrastructure
objects like buildings, roads and bridges. Therefore,
objects can be grouped or organized in a hierarchy or
layer and manipulated using relations and constraints.
These relations, constraints, layers and other hierar-
chical structures will have to support manipulation
and interaction. View point changes and navigation
can be steered by gestures (using a data glove), real
head movements or by using more conventional
devices like a trackball.
In the world view, attention is directed to navigation
and evaluation by ‘looking at’ the infrastructure
objects and their surroundings. Because of the lack of
overview, manipulation of objects is not considered
useful in this view. The user’s main activity will be
navigating through the 3D scene from a first-person
viewpoint, gathering information like object attributes
Proceedings of the Spatial Information Research Centre’s 10th Colloquium 347
and distance from the viewpoint. In an immersive VR
environment, input devices like a data glove or
‘magic wand’ are preferred.
GIS functionality (i.e. analyses and queries) should
also be supported in all views, although each view
may have a specific way of interaction to select
objects and to specify the query operators. For
instance, in the world view, it would be most natural
to have the symbolic (alphanumeric) information
specified with a spoken-language interface, while in
the plan view a more conventional interaction method
may give a better user support.
3 System designTo realize the above-mentioned concepts, we are
currently developing a 3D GIS & VR system called
Karma VI, using standard GIS, VR and CAD
components. In this section, we will present the
system design by describing the system components,
data model and system functionality.
3.1 ComponentsGIS
For the GIS, we have chosen for one central data
server. This way, Karma VI can act as a client on the
central data server in a client / server architecture and
existing GIS applications can make use of the same
data. Furthermore, data consistency and integrity can
be maintained better if the spatial and attribute data
are stored in one central database. In addition, many
users can access the same data simultaneously.
We selected the Spatial Database Engine from ESRI
(ESRI 1998) as our GIS data server. SDE is capable
of storing and retrieving spatial and attribute data in a
centrally maintained database built on open relational
database management system (RDBMS) standards.
We use Oracle (ORACLE 1998) as our RDBMS.
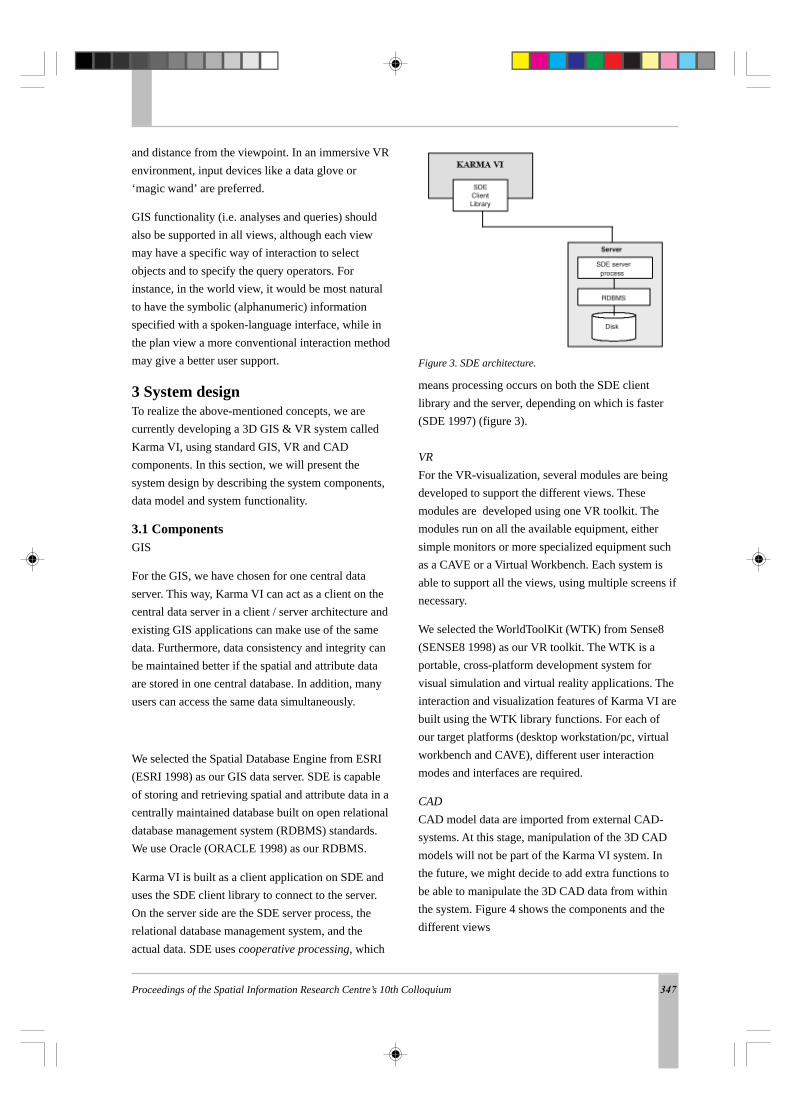
Karma VI is built as a client application on SDE and
uses the SDE client library to connect to the server.
On the server side are the SDE server process, the
relational database management system, and the
actual data. SDE uses cooperative processing, which
means processing occurs on both the SDE client
library and the server, depending on which is faster
(SDE 1997) (figure 3).
VR
For the VR-visualization, several modules are being
developed to support the different views. These
modules are developed using one VR toolkit. The
modules run on all the available equipment, either
simple monitors or more specialized equipment such
as a CAVE or a Virtual Workbench. Each system is
able to support all the views, using multiple screens if
necessary.
We selected the WorldToolKit (WTK) from Sense8
(SENSE8 1998) as our VR toolkit. The WTK is a
portable, cross-platform development system for
visual simulation and virtual reality applications. The
interaction and visualization features of Karma VI are
built using the WTK library functions. For each of
our target platforms (desktop workstation/pc, virtual
workbench and CAVE), different user interaction
modes and interfaces are required.
CAD
CAD model data are imported from external CAD-
systems. At this stage, manipulation of the 3D CAD
models will not be part of the Karma VI system. In
the future, we might decide to add extra functions to
be able to manipulate the 3D CAD data from within
the system. Figure 4 shows the components and the
different views
Figure 3. SDE architecture.
Proceedings of the Spatial Information Research Centre’s 10th Colloquium348
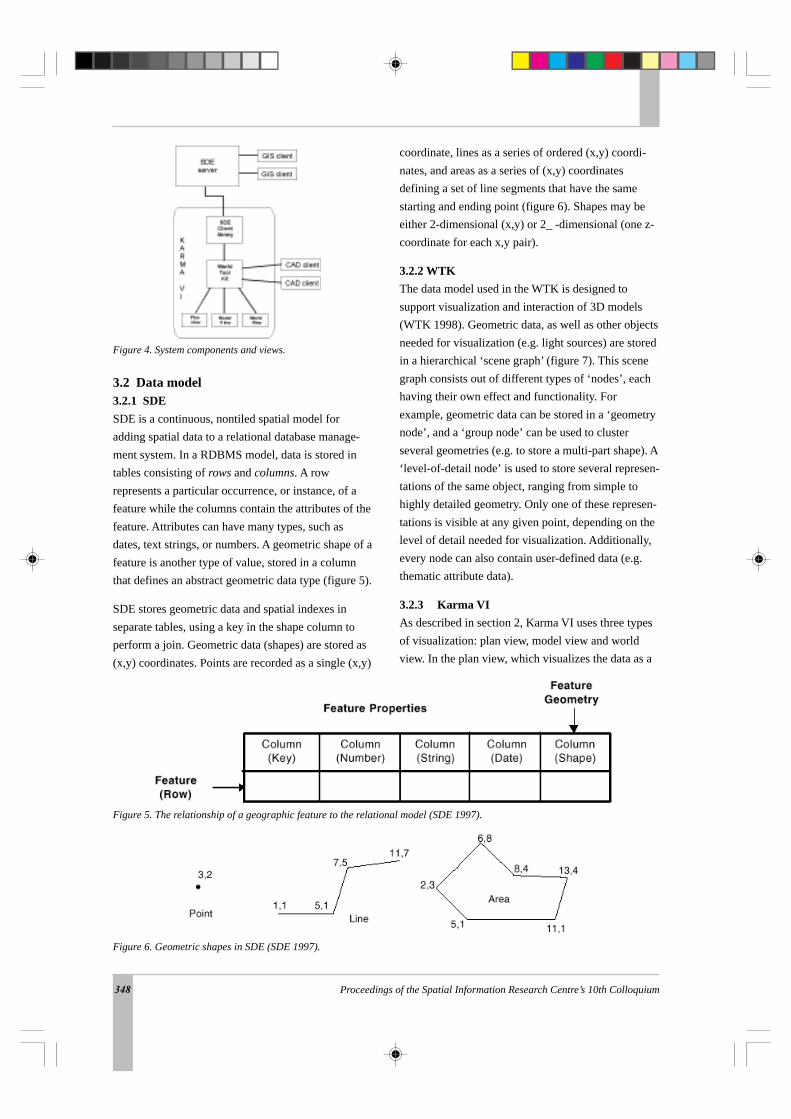
3.2 Data model3.2.1 SDE
SDE is a continuous, nontiled spatial model for
adding spatial data to a relational database manage-
ment system. In a RDBMS model, data is stored in
tables consisting of rows and columns. A row
represents a particular occurrence, or instance, of a
feature while the columns contain the attributes of the
feature. Attributes can have many types, such as
dates, text strings, or numbers. A geometric shape of a
feature is another type of value, stored in a column
that defines an abstract geometric data type (figure 5).
SDE stores geometric data and spatial indexes in
separate tables, using a key in the shape column to
perform a join. Geometric data (shapes) are stored as
(x,y) coordinates. Points are recorded as a single (x,y)
coordinate, lines as a series of ordered (x,y) coordi-
nates, and areas as a series of (x,y) coordinates
defining a set of line segments that have the same
starting and ending point (figure 6). Shapes may be
either 2-dimensional (x,y) or 2_ -dimensional (one z-
coordinate for each x,y pair).
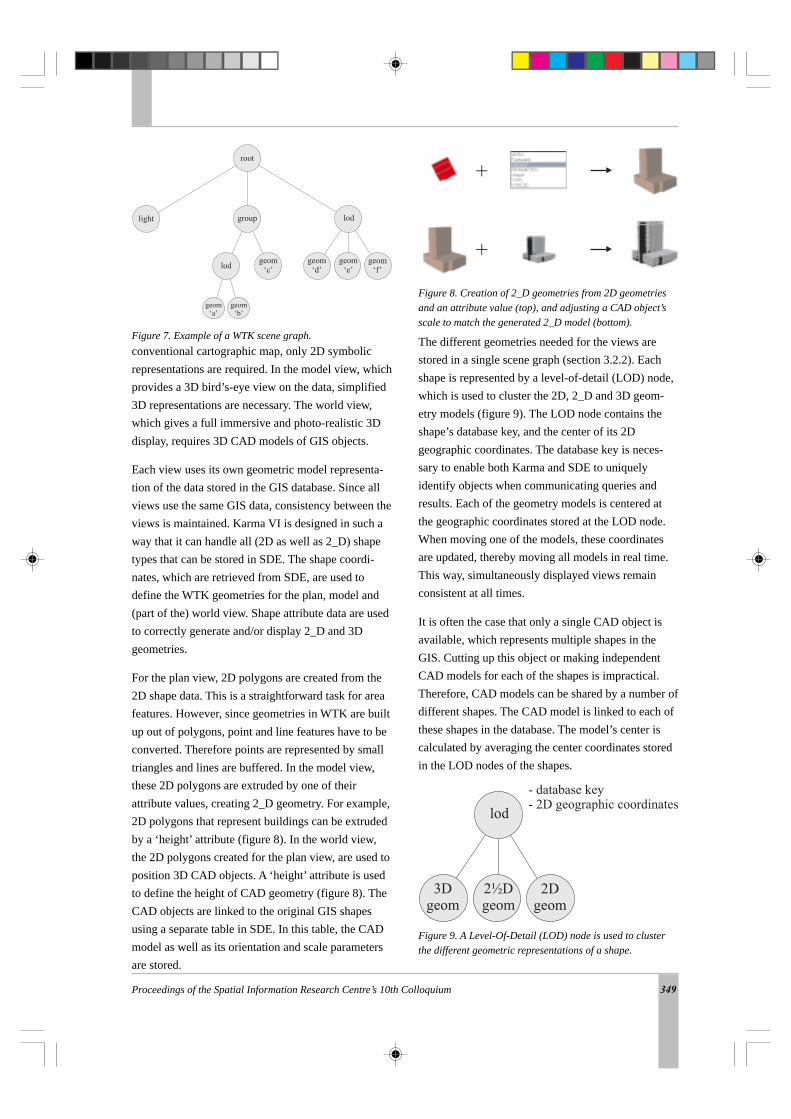
3.2.2 WTK
The data model used in the WTK is designed to
support visualization and interaction of 3D models
(WTK 1998). Geometric data, as well as other objects
needed for visualization (e.g. light sources) are stored
in a hierarchical ‘scene graph’ (figure 7). This scene
graph consists out of different types of ‘nodes’, each
having their own effect and functionality. For
example, geometric data can be stored in a ‘geometry
node’, and a ‘group node’ can be used to cluster
several geometries (e.g. to store a multi-part shape). A
‘level-of-detail node’ is used to store several represen-
tations of the same object, ranging from simple to
highly detailed geometry. Only one of these represen-
tations is visible at any given point, depending on the
level of detail needed for visualization. Additionally,
every node can also contain user-defined data (e.g.
thematic attribute data).
3.2.3 Karma VI
As described in section 2, Karma VI uses three types
of visualization: plan view, model view and world
view. In the plan view, which visualizes the data as a
Figure 4. System components and views.
Figure 6. Geometric shapes in SDE (SDE 1997).
Figure 5. The relationship of a geographic feature to the relational model (SDE 1997).
Proceedings of the Spatial Information Research Centre’s 10th Colloquium 349
conventional cartographic map, only 2D symbolic
representations are required. In the model view, which
provides a 3D bird’s-eye view on the data, simplified
3D representations are necessary. The world view,
which gives a full immersive and photo-realistic 3D
display, requires 3D CAD models of GIS objects.
Each view uses its own geometric model representa-
tion of the data stored in the GIS database. Since all
views use the same GIS data, consistency between the
views is maintained. Karma VI is designed in such a
way that it can handle all (2D as well as 2_D) shape
types that can be stored in SDE. The shape coordi-
nates, which are retrieved from SDE, are used to
define the WTK geometries for the plan, model and
(part of the) world view. Shape attribute data are used
to correctly generate and/or display 2_D and 3D
geometries.
For the plan view, 2D polygons are created from the
2D shape data. This is a straightforward task for area
features. However, since geometries in WTK are built
up out of polygons, point and line features have to be
converted. Therefore points are represented by small
triangles and lines are buffered. In the model view,
these 2D polygons are extruded by one of their
attribute values, creating 2_D geometry. For example,
2D polygons that represent buildings can be extruded
by a ‘height’ attribute (figure 8). In the world view,
the 2D polygons created for the plan view, are used to
position 3D CAD objects. A ‘height’ attribute is used
to define the height of CAD geometry (figure 8). The
CAD objects are linked to the original GIS shapes
using a separate table in SDE. In this table, the CAD
model as well as its orientation and scale parameters
are stored.
The different geometries needed for the views are
stored in a single scene graph (section 3.2.2). Each
shape is represented by a level-of-detail (LOD) node,
which is used to cluster the 2D, 2_D and 3D geom-
etry models (figure 9). The LOD node contains the
shape’s database key, and the center of its 2D
geographic coordinates. The database key is neces-
sary to enable both Karma and SDE to uniquely
identify objects when communicating queries and
results. Each of the geometry models is centered at
the geographic coordinates stored at the LOD node.
When moving one of the models, these coordinates
are updated, thereby moving all models in real time.
This way, simultaneously displayed views remain
consistent at all times.
It is often the case that only a single CAD object is
available, which represents multiple shapes in the
GIS. Cutting up this object or making independent
CAD models for each of the shapes is impractical.
Therefore, CAD models can be shared by a number of
different shapes. The CAD model is linked to each of
these shapes in the database. The model’s center is
calculated by averaging the center coordinates stored
in the LOD nodes of the shapes.
Figure 7. Example of a WTK scene graph.
Figure 8. Creation of 2_D geometries from 2D geometries
and an attribute value (top), and adjusting a CAD object’s
scale to match the generated 2_D model (bottom).
Figure 9. A Level-Of-Detail (LOD) node is used to cluster
the different geometric representations of a shape.
Proceedings of the Spatial Information Research Centre’s 10th Colloquium350
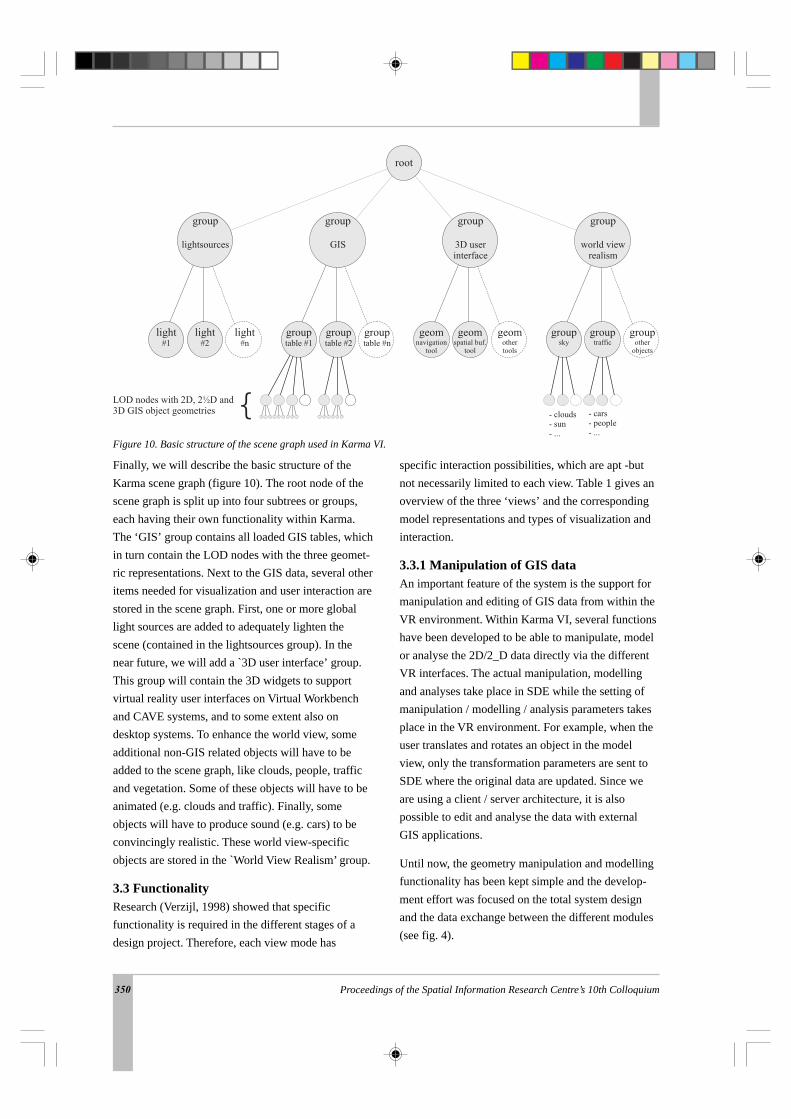
Finally, we will describe the basic structure of the
Karma scene graph (figure 10). The root node of the
scene graph is split up into four subtrees or groups,
each having their own functionality within Karma.
The ‘GIS’ group contains all loaded GIS tables, which
in turn contain the LOD nodes with the three geomet-
ric representations. Next to the GIS data, several other
items needed for visualization and user interaction are
stored in the scene graph. First, one or more global
light sources are added to adequately lighten the
scene (contained in the lightsources group). In the
near future, we will add a `3D user interface’ group.
This group will contain the 3D widgets to support
virtual reality user interfaces on Virtual Workbench
and CAVE systems, and to some extent also on
desktop systems. To enhance the world view, some
additional non-GIS related objects will have to be
added to the scene graph, like clouds, people, traffic
and vegetation. Some of these objects will have to be
animated (e.g. clouds and traffic). Finally, some
objects will have to produce sound (e.g. cars) to be
convincingly realistic. These world view-specific
objects are stored in the `World View Realism’ group.
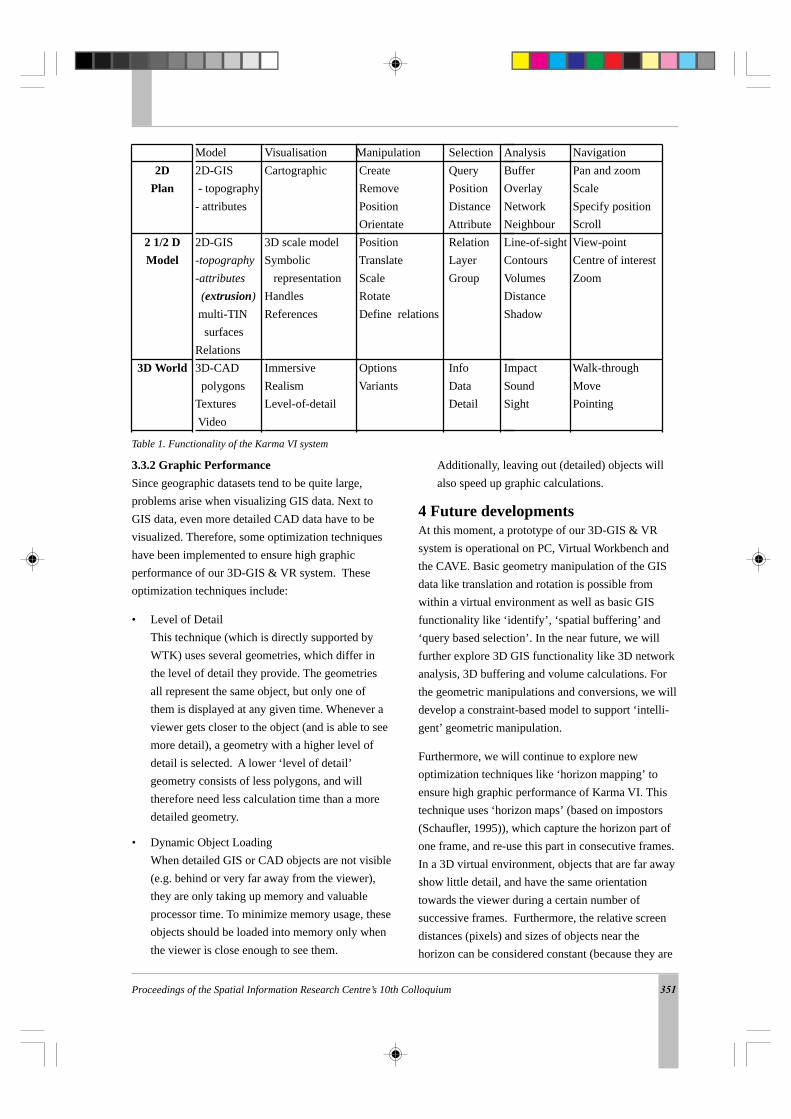
3.3 FunctionalityResearch (Verzijl, 1998) showed that specific
functionality is required in the different stages of a
design project. Therefore, each view mode has
specific interaction possibilities, which are apt -but
not necessarily limited to each view. Table 1 gives an
overview of the three ‘views’ and the corresponding
model representations and types of visualization and
interaction.
3.3.1 Manipulation of GIS dataAn important feature of the system is the support for
manipulation and editing of GIS data from within the
VR environment. Within Karma VI, several functions
have been developed to be able to manipulate, model
or analyse the 2D/2_D data directly via the different
VR interfaces. The actual manipulation, modelling
and analyses take place in SDE while the setting of
manipulation / modelling / analysis parameters takes
place in the VR environment. For example, when the
user translates and rotates an object in the model
view, only the transformation parameters are sent to
SDE where the original data are updated. Since we
are using a client / server architecture, it is also
possible to edit and analyse the data with external
GIS applications.
Until now, the geometry manipulation and modelling
functionality has been kept simple and the develop-
ment effort was focused on the total system design
and the data exchange between the different modules
(see fig. 4).
Figure 10. Basic structure of the scene graph used in Karma VI.
Proceedings of the Spatial Information Research Centre’s 10th Colloquium 351
3.3.2 Graphic Performance
Since geographic datasets tend to be quite large,
problems arise when visualizing GIS data. Next to
GIS data, even more detailed CAD data have to be
visualized. Therefore, some optimization techniques
have been implemented to ensure high graphic
performance of our 3D-GIS & VR system. These
optimization techniques include:
• Level of Detail
This technique (which is directly supported by
WTK) uses several geometries, which differ in
the level of detail they provide. The geometries
all represent the same object, but only one of
them is displayed at any given time. Whenever a
viewer gets closer to the object (and is able to see
more detail), a geometry with a higher level of
detail is selected. A lower ‘level of detail’
geometry consists of less polygons, and will
therefore need less calculation time than a more
detailed geometry.
• Dynamic Object Loading
When detailed GIS or CAD objects are not visible
(e.g. behind or very far away from the viewer),
they are only taking up memory and valuable
processor time. To minimize memory usage, these
objects should be loaded into memory only when
the viewer is close enough to see them.
Additionally, leaving out (detailed) objects will
also speed up graphic calculations.
4 Future developmentsAt this moment, a prototype of our 3D-GIS & VR
system is operational on PC, Virtual Workbench and
the CAVE. Basic geometry manipulation of the GIS
data like translation and rotation is possible from
within a virtual environment as well as basic GIS
functionality like ‘identify’, ‘spatial buffering’ and
‘query based selection’. In the near future, we will
further explore 3D GIS functionality like 3D network
analysis, 3D buffering and volume calculations. For
the geometric manipulations and conversions, we will
develop a constraint-based model to support ‘intelli-
gent’ geometric manipulation.
Furthermore, we will continue to explore new
optimization techniques like ‘horizon mapping’ to
ensure high graphic performance of Karma VI. This
technique uses ‘horizon maps’ (based on impostors
(Schaufler, 1995)), which capture the horizon part of
one frame, and re-use this part in consecutive frames.
In a 3D virtual environment, objects that are far away
show little detail, and have the same orientation
towards the viewer during a certain number of
successive frames. Furthermore, the relative screen
distances (pixels) and sizes of objects near the
horizon can be considered constant (because they are
2D
Plan
2 1/2 D
Model
3D World
Navigation
Pan and zoom
Scale
Specify position
Scroll
View-point
Centre of interest
Zoom
Walk-through
Move
Pointing
Model
2D-GIS
- topography
- attributes
2D-GIS
-topography
-attributes
(extrusion)
multi-TIN
surfaces
Relations
3D-CAD
polygons
Textures
Video
Visualisation
Cartographic
3D scale model
Symbolic
representation
Handles
References
Immersive
Realism
Level-of-detail
Analysis
Buffer
Overlay
Network
Neighbour
Line-of-sight
Contours
Volumes
Distance
Shadow
Impact
Sound
Sight
Selection
Query
Position
Distance
Attribute
Relation
Layer
Group
Info
Data
Detail
Manipulation
Create
Remove
Position
Orientate
Position
Translate
Scale
Rotate
Define relations
Options
Variants
Table 1. Functionality of the Karma VI system
Proceedings of the Spatial Information Research Centre’s 10th Colloquium352
far away from the viewer) during several frames.
When the user’s orientation or position invalidates the
current horizon map, a new map must be created. By
replacing a (possibly large) set of objects by a small
set of texture mapped polygons (one for desktop
systems, more for CAVE systems), we can increase
graphic performance.
Next to optimizing graphic performance, we will also
have to further develop the user interface. The
interface needs to be easy-to-use and intuitive. While
this is not a big problem on desktop systems, on true
VR systems like the Virtual Workbench or the CAVE,
it is difficult to develop an intuitive (thus usable)
interface. For example, in a CAVE, the use of a
keyboard for text input is not possible. We may have
to introduce speech recognition enable spoken
commands, and develop a way to let users specify
queries using a point-and-click interface. Further-
more, displaying alphanumeric results of a query in a
3D environment will be a problem, especially when a
lot of information is returned. This information must
be presented to the user in such a way, that the user
does not loose his/her sense of immersion. This
means that the information must only fill a small part
of the user’s field of view, or that the information is
integrated into the 3D world (e.g. projected onto the
walls of a virtual building). On the other hand, the
information must be presented to the users in a clear
way. Apart from textual in- and output, visual tools
(3D widgets) will have to be developed to let users
access the GIS functionality (e.g. 3D analyses,
manipulation) of the system.
ReferencesCruz-Neira C., D. J. Sandin and T. A. DeFanti (1993)
Surround-screen Projection-based Virtual Reality:
The Design and Implementation of the CAVE, in
Computer Graphics - Proceedings of SIGGRAPH
93.
Earnshaw R.A., M.A. Gigante and J. Hones (1993)
Virtual Reality Systems, London: Academic Press
Limited.
ESRI (1998) Homepage of Environmental Systems
Research Institute, Inc. Accessed September 1998.
<http://www.esri.com/base/products/sde/
sde.html>
EVL (1998) Homepage of Electronic Visualization
Laboratory. Accessed May 1998. <http://
www.evl.uic.edu/EVL/VR/systems.html#CAVE>
Kalawsky R.S. (1994) The Science of Virtual Reality
and Virtual Environments, Cambridge: University
Press.
Krüger W., C. A. Bohn, B. Fröhlich, H. Schüth, W.
Strauss and G. Wesche (1995) The Responsive
Workbench: A Virtual Work Environment. IEEE
Computer Society, IEEE Computer, Vol. 28, No.
7, pp. 42-48.
ORACLE (1998) Homepage of the Oracle Corporation.
Accessed June 1998. <http://www.oracle.com>
Schaufler G. (1995) Dynamically Generated Impostors
MDV’95 Modelling - Virtual Worlds – Distributed
Graphics, pp. 129-135.
SDE (1997) Technical documentation. Accessed July
1998. <http://www.esri.com/base/products/sde/
sde_api.html>
SENSE8 (1998) Homepage of the Sense8 Corporation.
Accessed June 1998. <http://www.sense8.com>
Verbree E. and L.D. Verzijl (1998) Integrated 3D-GIS
and VR: Use of Virtual Reality and 3D-GIS within
the Planning Process concerning the Infrastructure,
in preparation.
Verzijl L.D. (1998) Toepassingsmogelijkheden van 3D-
GIS en VR, Delft, University of Technology.
VMSD (1998) Homepage of Visualization and Media
Systems Design:. Accessed May 1998. <http://
v i s w i z . g m d . d e / V M S D / PA G E S . e n /
projects.workbench.html>
WTK 1998, WorldToolKit Reference Manual, Sense8
Corporation.
Copyright © 2022 FDOKUMEN