Input-Output Modelling in the MENA Region - A case study for Morocco
24
© GWS mbH 2012 gws gws gws gws Discussion Paper 2012/3 Input-Output Modelling in the MEA Region – A case study for Morocco Britta Stöver Kirsten S. Wiebe Ulrike Lehr Ingo Wolter gws Gesellschaft für Wirtschaftliche Strukturforschung mbH Heinrichstr. 30 D - 49080 Osnabrück [email protected] [email protected] Tel.: +49 (541) 40933-230 Fax: +49 (541) 40933-110 Internet: www.gws-os.com
Transcript of Input-Output Modelling in the MENA Region - A case study for Morocco

© GWS mbH 2012
gwsgwsgwsgws Discussion Paper 2012/3
Input-Output Modelling in the ME�A Region
–
A case study for Morocco
Britta Stöver
Kirsten S. Wiebe
Ulrike Lehr
Ingo Wolter
gws Gesellschaft für Wirtschaftliche Strukturforschung mbH
Heinrichstr. 30
D - 49080 Osnabrück
[email protected] [email protected]
Tel.: +49 (541) 40933-230
Fax: +49 (541) 40933-110
Internet: www.gws-os.com

gwsgwsgwsgws Discussion Paper 2012/3
© GWS mbH 2012
II
Osnabrück, April 2012

gwsgwsgwsgws Discussion Paper 2012/3
© GWS mbH 2012
III
ABSTRACT
Science-based policy analysis becomes increasingly important in the globalised world. Complex economic and social structures need to be thoroughly analysed and direct and indirect effects of policy measures should be identified and, if possible, quantified. Economic policy modelling has a long tradition (Almon, 1991) and economic models have over the past decades become more detailed regarding the economic structure and more extensive regarding the non-economic aspects represented in these models. There exist detailed structural economic models for most OECD countries. For newly emerging economies and developing countries only few such models exist. A global database and model environment is provided by the GTAP project, which is frequently used to develop computable general equilibrium (CGE) models. These models use a unique database, which often is not compatible to datasets of national statistic offices.
Still, there are countries for which no such structural economic models exist. The macro-economic PRESIMO model for Morocco for example does not include the industry structure of the Moroccan economy. However, analyses at the industry level are important when analysing the development of for example labour markets or energy demand. The economic opportunities from international projects such as DESERTEC (Concentrating Solar Power in the Saharan Region) could be evaluated identifying sectors, which benefit the most. Using the example of Morocco this paper outlines the prerequisites for developing structural economic models and shows application possibilities of these models for simulating the effects of policy measures.

gwsgwsgwsgws Discussion Paper 2012/3
© GWS mbH 2012
IV
CO�TE�TS
ABSTRACT ............................................................................................................................................. III
CO�TE�TS ............................................................................................................................................. IV
1 I�TRODUCTIO�: THE CRAFT OF SCIE�CE BASED POLICY A�ALYSIS ....................... 1
2 ECO�OMIC MODELLI�G ............................................................................................................ 2
2.1 STRUCTURAL ECONOMIC MODELS ............................................................................................... 2
2.2 DATA REQUIREMENTS ................................................................................................................. 5
3 A CASE STUDY FOR MOROCCO ................................................................................................ 6
3.1 MOROCCO’S DOMESTIC SITUATION ............................................................................................ 7
3.2 MOROCCO’S INTERNATIONAL RELATIONS: TRADE AND MIGRATION ........................................ 11
3.3 WHAT IS THE PURPOSE OF MODELLING MOROCCO’S ECONOMY? .............................................. 13
3.4 DATA FOR MOROCCO ................................................................................................................ 15
4 MODELLI�G OPPORTU�ITIES ................................................................................................ 16
REFERE�CES ......................................................................................................................................... 18

gwsgwsgwsgws Discussion Paper 2012/3
© GWS mbH 2012
1
1 I�TRODUCTIO�: THE CRAFT OF SCIE�CE BASED POLICY A�ALYSIS
Every policy-decision should be based on sound analysis supported by the best data available. Based on this principle, the European Commission (EC) developed guidelines for science-based policy analysis. These guidelines underline the importance of impact assessment to
• help the (…) institutions to design better policies and laws,
• facilitate better-informed decision making throughout the legislative process;
• ensure early coordination (…),
• take into account input from a wide range of external stakeholders (…),
• help to ensure coherence of (…) policies and consistency with overall objectives
(…), and to
• improve the quality of policy proposals by providing transparency on the
benefits and costs of different policy alternatives and helping to keep (…)
intervention as simple and effective as possible (…) (SEC(2009) 92).
The same document defines key analytical steps for analysing possible policy measures and especially emphasises the importance of identifying direct and indirect economic, social and environmental impacts, their causal connection, and who is affected and in what way. Further a sound policy analysis should “assess the impacts against the baseline in qualitative, quantitative and monetary terms.” (ibid, p.5). An in-depth quantitative analysis should be based on empirical data. The type of data that is needed for such an analysis depends on the policy measure in question and the modelling approach used.
This paper analyses the requirements and opportunities of developing macro-economic structural models for science-based policy analysis. It also discusses possible extensions of the models to cover socio-economic and environmental aspects. As for most OECD countries extensive statistical data exist, these countries are well represented in a variety of different national and international economic models and the culture of policy consultancy is well established and supported by national decision makers in these countries. The models INFORGE (Eurostat 2008) and PANTA RHEI for Germany and e3.at for Austria (Stocker et al. 2011) are examples for models that are frequently and successfully used in policy consulting and quantitative analysis. For newly emerging economies and developing countries however only few detailed economic models exist. Among other reasons, this can be due to low data availability for these countries, too little demand for policy advisory or limited support for this kind of research.
The political changes in the Middle-Eastern and North-African (MENA) countries that started in 2011 give rise to a possible restructuring of political decision making routines. The newly elected democratic governments will develop needs for science-based policy analysis, because they will have to evaluate their political measures. Using the example of Morocco, as one of the larger North African countries, this paper outlines the prerequisites for developing structural economic models and shows application possibilities of these models for simulating the effects of policy measures.

gwsgwsgwsgws Discussion Paper 2012/3
© GWS mbH 2012
2
The model building or adaption process consists of several steps. To start with, the purpose of the model should be defined. This gives constraints regarding content, scope and data requirements of the model or additional modules when updates or upgrades are considered. Second, data availability and data quality have to be assessed. Next, using the data as well as previous economic and political research, the economic development including the specific aspects of interest (e.g. social or environmental aspects) should be analysed to develop an intuition on how the country’s economy works.
Only then does the actual modelling start: Based on the data theoretical and empirical relations are integrated into one model environment and the historical model for a country’s economy is set up. To be able to assess impacts of planned policy measures a baseline scenario for the medium or long run development of the country’s economy must be developed. The baseline scenario has to be thoroughly tested and interpreted. This baseline or business-as-usual (BAU) scenario serves as a basis for the policy simulation scenarios. The outcomes of these scenarios should not be seen as a perfect prediction of future development; rather these simulations show the direction and dimension of the impacts of different policy measures. The more detailed the model, the more complex are the reaction chains. Therefore an economic modeller should always keep in mind to make the model as detailed as necessary, but to keep it as simple as possible.
The structure of the paper follows the different steps in the modelling procedure: The next section summarises the purpose of structural economic modelling, gives an overview on the different existing types of models and outlines the data requirements. Section 3 introduces the Moroccan economy and identifies modelling opportunities; Section 4 concludes.
2 ECO�OMIC MODELLI�G
The purpose of economic modelling is on the one hand to forecast prospective economic growth and on the other hand to have a tool for studying impacts of changing economic and social structures on the economy. In addition, depending on the focus of the model and the details that are included, effects of specific policies can be estimated using scenario analysis. These models can also be used for impact assessments as is for example often done to quantify the possible direct and indirect effects of EU legislation on the different European countries. This model-based economic analysis is an important instrument for guiding policy decisions.
2.1 STRUCTURAL ECO�OMIC MODELS
The term “structural” indicates that not only macro-economic key variables such as GDP and its components on the demand and supply side are modelled, but that the sectoral structure of the economy is represented as well. The primary, secondary and tertiary sectors develop very differently (three-sector hypothesis, Fourastié, 1963). Analyses of industry level data show that these disparities are even higher. When building an economic model of a country it is therefore important to use sectorally disaggregated data and allow the sectors to follow different development paths. Especially in times of political transformation the country’s (democratic) reform may induce changes in the social and

gwsgwsgwsgws Discussion Paper 2012/3
© GWS mbH 2012
3
economic structure of the economy. The impact of a new political system could hence vary considerably between the several economic actors and sectors. In addition, the different industries are not independent of each other; rather they are interlinked through intermediate demand relations. For example, Sectors A00 (Agriculture, hunting and forestry, see Table 1) and B05 (Fishing) provide intermediate products that are further processed in industry D01, Manufacturing of food products, beverages and tobacco products.
Macro-economic models that explicitly consider these interrelations are computable general equilibrium (CGE) models and macro-econometric input-output (MEIO) models. Both types of models originate from the seminal work of Wassily Leontief (1966) on the sectoral interdependencies through intermediate demand. Both CGE and MEIO models are based on input-output tables (Eurostat, 2008) and also incorporate the system of national accounts (UNSNA, 1993). The main difference is the setting of the behavioural model parameters: While for CGE models the parameters are calibrated and often based on values found in the literature, the behavioural parameters are econometrically estimated for MEIO models. This difference has an immediate effect on the data requirements of these models. To be able to econometrically estimate parameters for MEIO models, time series of the corresponding data are needed, whereas for CGE models historic data for one (the most recent) year/quarter/month is sufficient. One other important difference is the theoretical basis of the models. CGE models are based on neoclassical restrictions such as perfect information, perfect competition, rationality etc. whereas MEIO models allow for imperfect markets and actors with bounded rationality. A more detailed discussion on the differences of CGE and MEIO models can be found in Almon (1991), Nyhus (1991), West (1995) or Eurostat (2008).
The use of input-output data in macro-economic models entails a number of benefits, the two most important being an explicit representation of the domestic and international inter-industry relations and the detailed sectoral data on final demand and primary inputs. Both demand and supply side components are equally well represented. By being part of the System of National Accounts and Balancing Items (SNAB) the information of the IOT is harmonised with the other accounts and integrates in the system of double-entry accounting. The IOT data base can be linked to and processed with each of the other SNA values.
Figure 1 displays the general structure of an input-output table (IOT). An IOT is basically composed of three parts: the inter-industry requirements (flow) matrix, displayed in yellow, the final demand matrix, in red and green, and the primary inputs matrix, in grey. The blue boxes at the right and bottom represent sectoral output calculated from the demand side and supply side components, respectively.
The yellow boxes indicate the intermediate sectoral supply and demand structure: each box represents the monetary value of goods produced by industry i (row) and provided to industry j (column). Most statistical offices provide two matrices, one for domestically supplied and one for imported intermediates. The red boxes represent the sectoral final demand of households and government, gross fixed capital formation and the green boxes the sectoral trade balances, that is exports minus imports. The blue boxes (at the right) are the sum of intermediate (yellow) and final (red and green) demand for goods produced by industry i. The production side includes all intermediate goods used by industry j, plus primary inputs such as labour and capital. The sum of the primary inputs is gross value

gwsgwsgwsgws Discussion Paper 2012/3
© GWS mbH 2012
4
added, the grey boxes in Figure 1. The value of all intermediate goods used in sector j, that is the column sum of the yellow matrix, plus corresponding value added again sums up to total production in sector j.
The explicit modelling of the sectoral supply and demand structure allows for retracing domestic and international supply chains. This is especially useful in times of increasing globalisation and volatile world markets as import dependencies and associated vulnerabilities of individual industries can be identified. In addition, the effects of changes in the sectoral final demand structure or trade balances, as well as in the cost structure of primary inputs can be explicitly taken into account. Input-output tables in combination with the system of national accounts encompass the complete supply and demand structure and the full accounting system of all monetary transactions in an economy.
Figure 1: Input-output table concept
Inp
ut
of
go
od
sp
rod
uced
in In
du
str
yi
�
� � � � �
Intermediate consumption
of industries j
./.
./.
./.
./.
./.
Final consumption
+ GFCF
TradeB = EX-IM
=
=
=
=
=
�
� Production y by j ind.
� Gross Value Added ≅≅≅≅ GDP
Inp
ut
of
go
od
sp
rod
uced
in In
du
str
yi
�
� � � � �
Intermediate consumption
of industries j
./.
./.
./.
./.
./.
Final consumption
+ GFCF
TradeB = EX-IM
=
=
=
=
=
�
� Production y by j ind.� Production y by j ind.
� Gross Value Added ≅≅≅≅ GDP� Gross Value Added ≅≅≅≅ GDP
Source: based on EUROSTAT (2008)
The system of national accounts incorporates data for all institutional sectors (on top of Figure 2 in the green boxes) on monetary income and expenditures. The different accounts are displayed in the lower part of Figure 2. The money spent by each of the institutional sectors is received by the other institutional sectors. The production account contains information on the components of the production of goods and services such as the value of intermediate inputs and value added. The distribution and use of income accounts include operating surplus, compensation of employees and entrepreneurial income resulting in the net national income after primary distribution (II.1) and disposable income after secondary distribution (II.2). Account II.3 collects information about the redistribution of income mainly through social security contributions and taxes. Account II.4 shows how income is used by private households, NPISHs (non-profit institutions serving households) and government for final consumption and saving. The Accumulation Accounts (III) contain data on “the acquisition and disposal of financial and non-financial assets and liabilities by institutional units through transactions” (UNSNA 1993, p.2). The balance sheets (IV) of an economy are comparable to those of firms, that is they provide

gwsgwsgwsgws Discussion Paper 2012/3
© GWS mbH 2012
5
information on the assets and liabilities of the institutional sectors. And finally, the ‘Goods and services account’ gives an overview on the supply and use of goods and services in the economy.
Figure 2: Concept of the system of national accounts and balancing items
Households,
Non-profit
institutions
Serving
households
Government
units, incl.
social security
funds Financial
Rest of the
world
Current accounts
I. Production account
II. Distribution and use of income accountsII.1 Primary distribution of income accounts II.2 Secondary distribution of income accounts
II.3 Redistribution of income account II.4 Use of income account
Transaction accounts
0. Goods and services account
Non-financial
Corporations
IV. Balance sheetsIV.1 Opening balance sheet IV.2 Changes in balance sheet IV.3 Closing balance sheet
III. Accumulation accounts
III.1 Capital account III.2 Financial account III.3 Other changes in assets accounts
Source: based on U, S,A (1993)
2.2 DATA REQUIREME�TS
The basic data requirements for a macro-econometric inter-industry model are, next to input-output tables, data from the system of national accounts and corresponding sectoral data. In order to econometrically estimate model parameters, time series of the data should be available.
Input-output tables (IOTs) are the core of inter-industry models. It is sufficient to have an IOT for one year, but more is always better as calculating consistent IOTs for the other years is quite involving. The input coefficients give information about the technology used by an economy. If IOTs are available for more than one year, technological changes could be detected. IOTs also help identifying the structure of final demand and value added produced by each sector.
The system of national accounts (SNA) gives a reliable data base for the total economy and is internationally standardised. Thus, the resulting model is comparable to other country models using SNA data. Furthermore, the system of accounts ensures consistency within the model as total expenditures in the economy equals total income in the economy.
As the additional benefit of the model is the impact analysis on the industry level, sectoral data has to be incorporated. This data should include information about output, value added and final demand components, prices, employees and their compensation disaggregated according to industry and service sectors.

gwsgwsgwsgws Discussion Paper 2012/3
© GWS mbH 2012
6
This data is sufficient to build the macroeconomic core of a policy simulation model. For specific policy questions additional data is needed. Extending the model to include an energy-environment module or socio-economic modules is possible if corresponding data is available. Examples for thematic modules are
- Energy & environment
o Energy balances
o GHG emissions (Lutz et al. 2010, Lutz & Meyer 2010)
o Environmental tax reforms (Speck et al. 2011)
- Sustainable consumption and resource efficiency (Stocker et al. 2011, Lutz 2011)
- Trade (Mönnig & Wiebe, 2011)
- Demography, household structure and consumption (Drosdowski et al. 2010, Mönnig & Stöver 2010)
- Education & labour market qualifications (CEDEFOP, 2012).
3 A CASE STUDY FOR MOROCCO
Morocco is situated in North Africa, surrounded by the Mediterranean Sea and the Atlantic Ocean to the North and North-West, Mauritania to the South and Algeria to the East. Morocco’s population is about 32 million people, with 60% of the population living in urban areas, and per capita GDP is about 4600 USD1 (The World Factbook 2011). Even though the Arab Spring 2011 also affected Morocco, it did not lead to a violent revolution. King Mohammed VI acted quickly by announcing political reforms and a new constitution was approved in July 2011. Morocco now is a constitutional, democratic, parliamentary and social monarchy (Royaume du Maroc 2011, p.1903). The first elections after these changes have been held in November 2011. The participation was higher than in 2007, at the much criticized second election of the country. The major change in the political system is that, despite the on-going dominant position of the king, the parliament can gain more influence over the coming years. With an increasing authority of the parliament, the demand by the parliamentarians for policy advisory might increase as well.
According to World Bank (2011) currently the major issues in the MENA region are high and rising food prices and the resulting inflation. For the oil importing countries the inflation is accelerated by high fuel prices. The comparably low inflation (about 2%) in Morocco is due to a tight monetary policy and effective subsidies for food and fuel (about 2 billion US$). Furthermore, the unemployment rates, especially among the youth, are comparably high. Morocco set up an employment program for educated unemployed (Table 3 in World Bank, 2011). The expansion of social policies including subsidies on food prices and employment support “are not well targeted and will be costly” (World Bank, 2011, p.1). Using structural economic modelling, it is possible to compare existing
1 in international PPP of 2008.

gwsgwsgwsgws Discussion Paper 2012/3
© GWS mbH 2012
7
and alternative policy measures and assess their outcomes including costs and social impacts.
3.1 MOROCCO’S DOMESTIC SITUATIO�
The major economic problems in Morocco are social inequality, low wages, increases in food and resource prices, and a high unemployment rate especially among the youth (Greeman 2011). As in most Arab countries Morocco’s population is relatively young with almost 30% being younger than 15 (World Development Indicators online 2011). Over the past five decades the population grew by about 2% annually and real GDP by 4.5%, so that GDP per capita steadily increased from just below 7000 MAD in 1960 to almost 20000 MAD in 2010, that is from about 650 to 1850 USD (constant 2000 dollar).
Figure 3 displays GDP in constant and current prices and GDP growth since 1960. Nominal GDP growth was significantly higher than real GDP growth: almost 10% annually on average between 1960 and 2009. The periods with highest average GDP growth were the 1960s and 1970s. Growth rates fluctuated significantly during the 1990s and were negative for four years in that period due to droughts, which also reflected in the fluctuating share of agriculture value added in GDP during these years as displayed later in Figure 6. Since 2000 the fluctuations are smaller and GDP grew with an average of 4.8%.
Figure 3: GDP and GDP growth since 1960
-10%
-5%
0%
5%
10%
15%
20%
25%
30%
35%
1960
1962
1964
1966
1968
1970
1972
1974
1976
1978
1980
1982
1984
1986
1988
1990
1992
1994
1996
1998
2000
2002
2004
2006
2008
[in
%]
0
100000
200000
300000
400000
500000
600000
700000
800000
[in
mil
lio
n D
irh
am
]
GDP growth in % (current) GDP growth in % (constant) GDP (in constant Dirhams) GDP (in current Dirhams)
Source: World Development Indicators Online (2011)
The high inflation in the beginning of the 1990s was due to high increases in the consumer prices for food (blue dotted line in Figure 4), which directly relates to the problems in the agricultural sector. After 1996 the general price index stabilised at about 2%. The increase in inflation in 2008 was again mainly caused by increases in food prices during the World Food Crises in spring 2008.

gwsgwsgwsgws Discussion Paper 2012/3
© GWS mbH 2012
8
Figure 4: Development of the General Price Index and some components
100
110
120
130
140
150
160
170
180
190
200
1990199119921993199419951996199719981999200020012002200320042005200620072008
[In
dex 1
989 =
100]
-2
0
2
4
6
8
10
consumer prices for food
Generel Price Index
growth rates of consumer prices for food
growth rates of the Generel Price Index
Source: Haut commissariat au plan (2011a)
The development of different sectors varies and so does the influence of each sector on overall economic performance. More than 50% of GDP increase since 1980 is due to an increase in the service sector. Still, the industry sector gained importance during the past decade as can be seen in Figure 5. When further disaggregating agriculture, industry and services even higher disparities between individual sectors become apparent. It is therefore important to distinguish between the different sectors when analysing a country’s past economic development. This detailed sectoral information is necessary to be able to analyse the effects of policy measures directed at specific industries, e.g. agricultural subsidies, free trade agreements, innovation, tax break for newly developed industries or measures to attract (direct) foreign investment.
Figure 5: Increase in value added between 1980 and 2009
0
50000
100000
150000
200000
250000
300000
350000
400000
1980-1989 1990-1999 2000-2009
Inc
rea
se
in
GD
P in
cu
rre
nt
LC
U
Services, etc.
Industry
Agriculture
0%
10%
20%
30%
40%
50%
60%
70%
80%
90%
100%
1980-1989 1990-1999 2000-2009
Pe
rce
nt
of
inc
rea
se
in
GD
P in
cu
rren
t L
CU
Source: World Development Indicators Online (2011)

gwsgwsgwsgws Discussion Paper 2012/3
© GWS mbH 2012
9
Figure 6 shows the development of the economic structure in Morocco over the past three decades. The share of agriculture value added in GDP fluctuates between 12% and 20% without an obvious trend. The share of industry was relatively constant at about 34% until 19972 and then sharply dropped to below 30%. Services value added fluctuated around 50% before it increased to about 56% during the late nineties.
The agricultural sector in Morocco is important as more than 40% of all employees work in agriculture, while only about 20% are employed in industry and about 35% to 40% work in services. In the World Development Indicators (WDI) database, sectoral employment data is only available for 1994 and from 2002 on as displayed in Figure 6. Still, a difference to the value added shares becomes apparent: the share of services in value added is significantly higher than the share of workers in services of total workers. The opposite is true for agriculture, where more than 40% of the workforce only produce 20% of value added.
Figure 6: Economic and employment structure of Morocco
0
10
20
30
40
50
60
70
1980 1982 1984 1986 1988 1990 1992 1994 1996 1998 2000 2002 2004 2006 2008
[in
%]
Agriculture, value added (% of GDP) Industry, value added (% of GDP)
Services, etc., value added (% of GDP) Employment in agriculture (% of total employment)
Employment in industry (% of total employment) Employment in services (% of total employment)
Source: World Development Indicators Online (2011)
The employment data provided by Morocco’s national statistical office (Haut Commissariat du Plan 2011b) is more detailed, that is separated for rural and urban areas, and available from 1999 to 2010, see Figure 7. While more than 80% of rural employment is in agriculture, leaving about 10% of the workforce for both industry and services, urban employees predominantly work in services (more than 60%). 31% of the labour force work in industry, whereas the share of employees in agriculture, forestry and fishing is naturally
2 Political reforms resulted in a revised constitution and a bicameral legislature that came into effect in 1997.
This also included a decentralization law, which created sixteen new regions within Morocco. The change in the data may on the one hand occur due to a changing economic structure following these political turns, or on the other hand may simply a change in the data collection process.

gwsgwsgwsgws Discussion Paper 2012/3
© GWS mbH 2012
10
very small with 6%. Since 2005 the share of employees in agriculture is decreasing by about 1 percentage point annually in rural areas. This is in line with the overall decreasing share of agriculture in total employment as displayed in Figure 6.
Figure 7: Rural and urban employment structure of Morocco
rural
0
10
20
30
40
50
60
70
80
90
1999 2000 2001 2002 2003 2004 2005 2006 2007 2008 2009
[in
%]
Agriculture, forestry, fishery Industries (inlcuding construction)
urban
0
10
20
30
40
50
60
70
80
90
1999 2000 2001 2002 2003 2004 2005 2006 2007 2008 2009
Services
Source: Haut commissariat au plan (2011b)
Figure 8: Unemployment rates in percentage of employed people (older than 15
years) by age groups and in total between 1999 and 2010
0
5
10
15
20
25
1999 2000 2001 2002 2003 2004 2005 2006 2007 2008 2009 2010
[in
%]
15 - 24 years 25 - 34 years 35 - 44 years 45 and more years total
Source: Haut-commissariat au plan (2011c)
Figure 8 displays the unemployment rate for different age groups. In total, 10.6 million people were in employment in 2010, leaving 1.0 million unemployed. The highest unemployment rates can be found among those aged 15 to 24 and 25 to 34 (dark blue and light blue line in Figure 8, respectively). Since 2005 the situation for those aged 25 to 34 significantly improved. Generally, the unemployment rate is lower for higher age groups. Total unemployment declined between 1999 and 2010, while that of the 15 to 24 year olds increased since 2004, mainly due to high unemployment rates of up to 31% of young people in urban areas. Most of these belong to the group of first time job seekers who have graduated from higher education (Bougroum and Ibourk, 2003). In 2000 almost 30% of persons with a superior degree were unemployed (Haut Commissariat du Plan 2011c). Even though this number decreased to about 18% in 2010, the highly educated still had the highest unemployment rate. This is partly caused by the structure of the Moroccan manufacturing industry and the education system (Bougroum and Ibourk, 2003): Contrary
gwsgwsgwsgws Discussion Paper 2012/3
© GWS mbH 2012
11
to the production of intermediate goods, final consumption goods often require the knowledge of high skilled workers. However, the Moroccan industry has mainly specialised in the intermediate production process. Enterprises can chose from a wide range of unskilled workers keeping labour costs low. Graduate training aims primarily at educating people for the public and not for the private sector, which is problematic as the public sector is shrinking. At the same time the private sector is not yet sufficiently high developed and high-tech oriented to compensate for the surplus of young first-time job seekers. Even management positions are not necessarily filled with graduates. The manufacturing sector prefers on-the-job training. According to Bougroum and Ibourk, (2003) the public education system does not meet the demand for labour on the labour market. A sectorally disaggregated economic model can for example be used to analyse the effects of Morocco’s employment program for educated unemployed.
The brief overview suggests that a thorough investigation of the structural economic components could reveal more clearly the interactions between sectors and labour market. Domestic shortcomings and unused capacities could be directly addressed. Directed policy measures may work more efficiently and result in more dynamic economic development and a higher welfare level.
3.2 MOROCCO’S I�TER�ATIO�AL RELATIO�S: TRADE A�D MIGRATIO�
The global economic and financial crises in 2008 and 2009 clearly showed the global economic interdependence between countries. Morocco is classified as an oil importer with EU links by World Bank (2011), implying its dependence on oil imports and strong external relations with the EU. Both import dependence of important natural resources as well as strong external links increase a country’s vulnerability to external shocks. It is therefore important to model a country’s external relations by explicitly considering its import and export structure.
Morocco’s links with the global economy, especially to Europe, are trade and migration. Even though Morocco’s trade share (imports plus exports) in 2010 only amounted to 60% of GDP (Office de change, 2010), foreign economic performance and policies may still have a significant effect on the Moroccan economy through the high import dependency with respect to raw materials, energy carriers and final investment and consumption goods. In 2010 60% of the trade activities related to European countries (see Figure 9). France and Spain were the most important trade partners, importing 23% and 17% and exporting 16% and 11% of all goods traded with Morocco. Commercial activities between Morocco and the EU grew over the past years, except for 2009. Clothes, electronic and electric wires and cables as well as knitted and crocheted goods were the principal goods demanded by European countries. In return, Morocco mainly imported finished industrial products like machinery and equipment n.e.c. or motor vehicles for tourism. One interesting observation is that the ratio of final equipment and consumption goods imports to exports is 2/1, while that of raw materials and intermediate goods is only 5/4 (Office de change 2010). This shows that fewer high end products are manufactured in Morocco relative to intermediate goods. This is also reflected in the structure of the labour force: the manufacturing sector mainly employs low educated workers.

gwsgwsgwsgws Discussion Paper 2012/3
© GWS mbH 2012
12
Figure 9: Morocco’s trade by regions in 2010 [billion Dirhams]
-200
-150
-100
-50
0
50
100
150
200
250
300
350
Europe EU Asia America Africa Total
[in
bil
lio
n D
irh
am
s]
Imports Exports Balance
Source: Office des changes (2010)
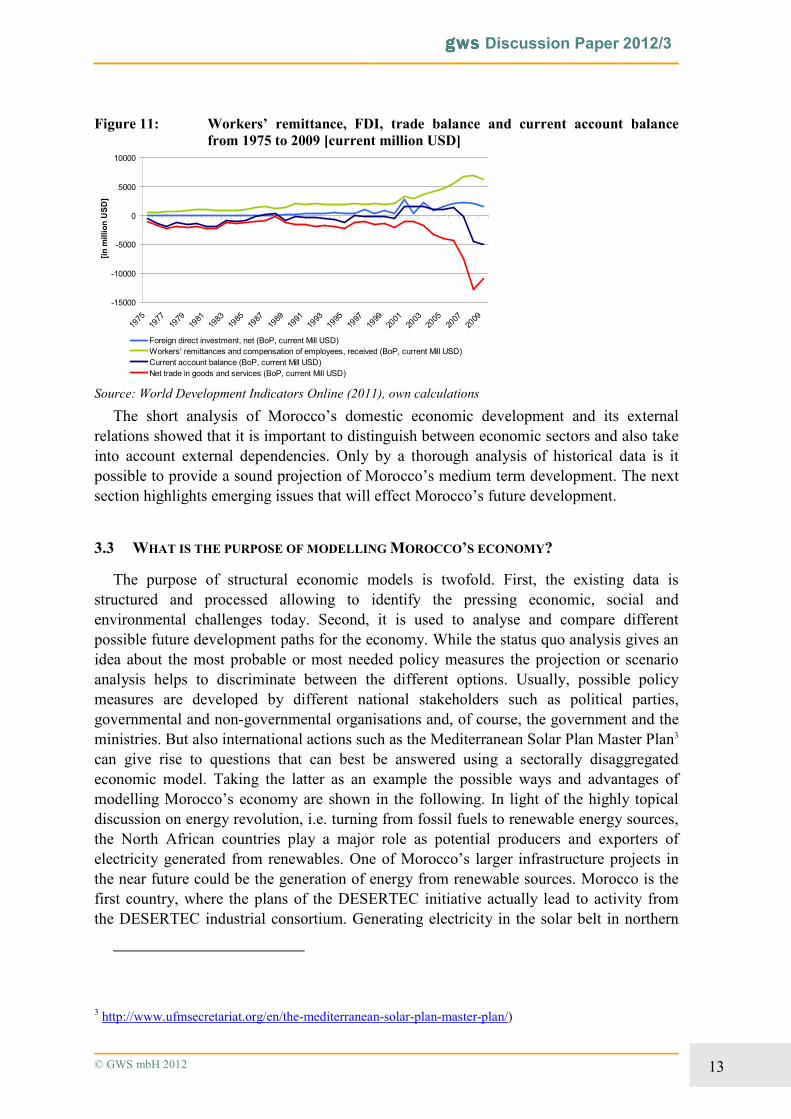
The second issue linking Morocco to the global development is migration, especially migration of Moroccans to Europe. More than 80% of Moroccans living abroad reside in European countries, whereof most are allocated in France, Spain and Italy (de Haas 2009). Remittances from Moroccan migrants are an important source of income and contribute 5% to 9% to GDP (see Figure 10). Except for a stagnating period in the 1990s the amount of remittances was continuously rising between 1975 and 2009. Figure 11 shows components of the balance of payments (BoP). Remittances (green line) gain importance in balancing the trade deficit (red line) and serve as cash inflow next to foreign direct investment (light blue line). Changing economic climate within Europe - as for example in 2009 - influences the amount sent from workers abroad and has direct impact on the available income in households in Morocco.
Figure 10: Workers’ remittances inflows from 1975 to 2009 [% of GDP and Index
2005 = 100, current USD]
0
1
2
3
4
5
6
7
8
9
10
1975
1977
1979
1981
1983
1985
1987
1989
1991
1993
1995
1997
1999
2001
2003
2005
2007
2009
[in
%]
0
20
40
60
80
100
120
140
160
[In
dex 1
00 =
2005]
Workers' remittances and compensation of employees, received (% of GDP)
Workers' remittances and compensation of employees, received (BoP, Index 100 = 2005, current USD)
Source: World Development Indicators Online (2011), own calculations
gwsgwsgwsgws Discussion Paper 2012/3
© GWS mbH 2012
13
Figure 11: Workers’ remittance, FDI, trade balance and current account balance
from 1975 to 2009 [current million USD]
-15000
-10000
-5000
0
5000
10000
1975
1977
1979
1981
1983
1985
1987
1989
1991
1993
1995
1997
1999
2001
2003
2005
2007
2009
[in
millio
n U
SD
]
Foreign direct investment, net (BoP, current Mill USD)
Workers' remittances and compensation of employees, received (BoP, current Mill USD)
Current account balance (BoP, current Mill USD)
Net trade in goods and services (BoP, current Mill USD)
Source: World Development Indicators Online (2011), own calculations
The short analysis of Morocco’s domestic economic development and its external relations showed that it is important to distinguish between economic sectors and also take into account external dependencies. Only by a thorough analysis of historical data is it possible to provide a sound projection of Morocco’s medium term development. The next section highlights emerging issues that will effect Morocco’s future development.
3.3 WHAT IS THE PURPOSE OF MODELLI�G MOROCCO’S ECO�OMY?
The purpose of structural economic models is twofold. First, the existing data is structured and processed allowing to identify the pressing economic, social and environmental challenges today. Second, it is used to analyse and compare different possible future development paths for the economy. While the status quo analysis gives an idea about the most probable or most needed policy measures the projection or scenario analysis helps to discriminate between the different options. Usually, possible policy measures are developed by different national stakeholders such as political parties, governmental and non-governmental organisations and, of course, the government and the ministries. But also international actions such as the Mediterranean Solar Plan Master Plan3 can give rise to questions that can best be answered using a sectorally disaggregated economic model. Taking the latter as an example the possible ways and advantages of modelling Morocco’s economy are shown in the following. In light of the highly topical discussion on energy revolution, i.e. turning from fossil fuels to renewable energy sources, the North African countries play a major role as potential producers and exporters of electricity generated from renewables. One of Morocco’s larger infrastructure projects in the near future could be the generation of energy from renewable sources. Morocco is the first country, where the plans of the DESERTEC initiative actually lead to activity from the DESERTEC industrial consortium. Generating electricity in the solar belt in northern
3 http://www.ufmsecretariat.org/en/the-mediterranean-solar-plan-master-plan/)
gwsgwsgwsgws Discussion Paper 2012/3
© GWS mbH 2012
14
Africa could provide a double dividend: electricity needed in Europe and qualified employment and economic growth in the region.
But what exactly will be the impact of solar power generation, wind energy production and a general switch to renewable energy generation? A first approach to this has been made for a neighbour country. Lehr & Mönnig (2012), funded by GIZ, have developed a small model for the Tunisian Solar Plan and its related employment impacts. It has been shown, that these impacts strongly hinge on the development of the productive structure in Tunisia. To answer the same question for Morocco a wide range of modelling opportunities could be used, e.g. an environmental (regional) economic model. Necessary data is available: Information on the domestic production structure, time series on wages, production and supply and use tables4.
Quantifying sectorally disaggregated employment and growth effects of the implementation of the national solar plans and the Mediterranean Solar Plan Master Plan are important for policy makers to correctly estimate socio-economic outcomes of engaging in and implementing this type of policy action. Economic structural models with a detailed energy sector, such as the PANTA RHEI model (Lehr et al. 2008, Eurostat 2008) for Germany, with the economic core INFORGE (Eurostat 2008, Ahlert et al. 2009, Maier et al. 2012), or the 3e-model for Austria e3.at (Stocker et al. 2011), are able to provide exactly this. If changes in labour market requirements regarding qualification and jobs are of main interest the modelling approach of Q-INFORGE (Helmrich et al. 2012) including an extensive labour market could be used as example. The detailed results for qualification could be important to overcome the identified weaknesses in the Moroccan educational system (section 3.1). Changes in labour demand by profession can be traced and the labour market requirements adapted to the new economic situation. With the construction of the energy plants and facilities the impact of the DESERTEC project has also a regional component. The analysis of regional disparities could be of political interesting as well. As the Moroccan statistical office (HCP) provides many data sets differentiated between rural and urban areas the analysis could be conducted on a more regional level as has been done by Ulrich et al. (2012) for Germany for example. Looking on a more global level the changes in the trade balance – changing from energy importing to exporting country – and the consequent interrelation between national and international markets could be also part of the model. The impact on Morocco’s world-market dependencies could be evaluated.
Before starting to build a new model, one should do some research on whether there already exist a similar model, and if so what the purpose of that model is and which data and which modelling approach is used. Together with the INSEE (Insitut National de la Statistique et des Etudes Economiques) in France, the Moroccan national statistical office (HCP) developed the macro-econometric model PRESIMO (Bakhti et al. 2011). This is the only macro-economic simulation model that exists for Morocco to our knowledge.5 It is
4 Supply and use tables can theoretically be combined into one symmetric input-output table. 5 One part of the project “Morocco Natural Hazard Probabilistic Risk Analysis and National Strategy
Development” that was put out to tender by the World Bank in May 2010 was to review existing input-

gwsgwsgwsgws Discussion Paper 2012/3
© GWS mbH 2012
15
based on data of HCP, Office de change, Ministère des Finances et de la Privatisation, Bank Al Maghreb and the IMF. Bakhti et al. (2011) classify their model as a Neo-Keynesian equilibrium model. It is a detailed model, considering demand and supply side components of the economy, as well as quantities and prices. Accounting identities are modelled as computable equations; the remaining relations are econometrically estimated behavioural equations. Still, it does not differentiate between industrial sectors. By including information about intermediate and final demand, output and employment structure, and energy consumption by industries and services it is possible to evaluate the whole impact chain of potential national and international policies. Policy scenarios show the distribution effects of taxes and indirect effects on sectoral production, employment and energy demand. An altered employment structure together with changing demographics in turn has impacts on the structure of final demand. In addition, with ongoing reforms, increasing political freedom and education possibilities, a better qualified workforce earning higher wages also changes the structure of final demand.
3.4 DATA FOR MOROCCO
For developing a quantitative structural economic model to analyse these emerging issues a sound statistical database is necessary. The data available for Morocco is shortly described in this section. Based on the requirements outlined in Section 2, the data sets for Morocco are sufficient to build a macro-econometric inter-industry model. The necessary data can be found at
- Haut-commissariat au plan (HCP) – national statistical office: http://www.hcp.ma/
- Centre d’Etude et de Recherche Démographique (HCP)
- Office de change
- Ministère des finances et de la privatisation
- Bank Al Maghreb
- UNIDO database: Rev. 2 for 1996-2000 & Rev. 3 for 2000-2006
- International Energy Agency (Energy Balances, Emissions)
Data on the System of �ational Accounts (SNA) is readily available from the national statistical office (HCP). Detailed time series (annual data 1990 – 2007) can be found in HCP (2009). HCP provides not only data for the SNA, but also a time series (1998 to 2007) of supply-and-use tables, which is consistent with the SNA data. This in turn implies that there is sectoral data for production, imports, exports, value added, including compensation of employees, social security contributions, taxes and subsidies, and final demand components household final consumption expenditures, government final consumption expenditures, changes in inventories. Both industrial sectors and goods have the same classification following ISIC Rev. 3 as displayed in Table 1. In addition, the HCP provides industry production indices from 1998 to 2010 for mining as a total and
output and CGE models for Morocco. Unfortunately we could neither find a project website, final report or anything else relating to the project.

gwsgwsgwsgws Discussion Paper 2012/3
© GWS mbH 2012
16
disaggregated into extraction of metallic minerals and non-metallic minerals, 21 manufacturing sectors and total industry, and electricity. Corresponding price indices are also available. The supply-and-use tables can further be used to estimate a symmetric input-output table. There exists one input-output table (IOT) for Morocco for 1990 which includes 133 industry sectors (Bussolo and Roland-Holst 1993). However, the sectoral classification does not fit the HCP SNA data and the structure of intermediate demand has most likely changed significantly since 1990.
Data for Morocco is also available in the international databases of the UN (UNIDO – United Nations Industrial Development Organization, UN COMTRADE), IMF and International Energy Agency (IEA). The IEA provides energy balances and emission
data for all years since 1971.
Table 1: Sectoral classification of HCP data
A00 Agriculture, forêt et services annexes Agriculture, hunting and forestry
B05 Pêche, aquaculture Fishing
C00 Industrie d’extraction Mining and quarrying
D01 Industries alimentaires et tabac Manufacture of food products, beverages and tobacco products
D02 Industries du textile et du cuir Manufacture of textiles, textile products, leather and footwear
D03 Industrie chimique et parachimique Manufacture of chemicals and chemical products
D04 Industrie mécanique, métallurgique et électrique
Manufacture of mechanical, metallic and electrical equipment
D05 Autres industries manufac. hors raffinage pétrole
Other manufacturing industries excl. D06
D06 Raffinage de pétrole et autres produits d’énergie
Manufacture of coke, refined petroleum products and nuclear fuel
E00 Electricité et eau Electricity, gas and water supply
F45 Bâtiment et travaux publics Construction
G00 Commerce Wholesale and retail trade
H55 Hôtels et restaurants Hotels and restaurants
I01 Transports Transport
I02 Postes et télécommunications Post and telecommunication
J00 Activités financières et assurances Financial intermediation
K00 Immobilier, location et serv. rendus entreprises
Real estate, renting and business activities
L75 Administration publique et sécurité sociale
Public administration and defence; compulsory social security
MNO Education, santé et action sociale Education, health and social work
OP0 Autres services non financiers Other community, social and personal service activities
4 MODELLI�G OPPORTU�ITIES
Morocco, being one of the largest North African countries in terms of population, offers numerous interesting areas to be analysed. So far, no detailed structural model for the Moroccan industry exists, but the data to set up such a model is all there. One important

gwsgwsgwsgws Discussion Paper 2012/3
© GWS mbH 2012
17
characteristic of the Moroccan economy, which is also typical for other developing countries and emerging economies, is the high discrepancy between rural and urban areas. The data that the national statistical office (HCP) provides in this context is sufficient to care for rural-urban differences in a model.
One of the most pressing economic problems in Morocco is unemployment, especially among the young and the highly educated workers. The structure of the Moroccan manufacturing industry and the education system can be identified as main reasons for the labour market imbalances discussed in section 3.1. The government programme for the educated unemployed is one example for a policy measure, which can be analysed in a model that includes the industry structure of an economy. The detailed representation of the structure allows for identifying the labour demand on a sectoral basis. These results can be used to formulate policy measures that are directly targeted at those sectors with an increasing labour demand.
Another subject addressed in section 3 that could be evaluated is the tight monetary policy and effective subsidies for food and fuel in order to prevent inflation. Using an inter-industry macro-econometric model it is possible to quantify the costs of those policy actions for sectors, private households, government, trade etc. Alternative policy scenarios can be produced for means of comparison.
An emerging issue in all North African countries is the expansion of renewable energy provision. Solar energy production is of special interest in this region and different national and international action programs have started: The Moroccan Solar Energy Agency is about to build the first large-scale solar thermal power station in Ouarzazate. Building this plant is the first step toward reaching the goal of generating 28% of Moroccan electricity from renewable energy sources by 2020. International actions include the Mediterranean Solar Plan Master Plan and the DESERTEC initiative. Effects of an increasing production of renewable energy on intermediate demand, sectoral production, employment structure and related socio-economic issues can be identified and quantified within a detailed structural economic model.
The increasing globalisation, the scarcity of raw materials and the growing dependency on the global markets affects the economic structure of Morocco. As described in section 3.2 Morocco mainly exports intermediate products and imports high end production goods. However, the value added generated by final demand goods is much higher. Finding opportunities for structural change in the production process to improve value added within the country might be one field of research. On the other hand the economic consequences of a continuing rise in fuel prices given the industrial structure could be assessed as well.
Overall, the database provided by the Statistical Office (HCP) offers modelling opportunities ranging from simple status-quo analysis to macro-econometric based scenario analysis. While the simpler approach gives a first impression, helps to identify needs for policy action or focus on one special subject the sophisticated model traces the full economic/social/environmental consequences and makes the linkages and interdependencies within the economy apparent. The choice finally depends on the specific problem at hand. The impact assessment of different policies makes it easier for politicians to choose a suitable solution and to legitimate their political actions.

gwsgwsgwsgws Discussion Paper 2012/3
© GWS mbH 2012
18
REFERE�CES
Ahlert, G., Distelkamp, M., Lutz, C., Meyer, B., Mönnig, A. & Wolter, M.I. (2009): Das IAB/INFORGE-Modell. In: Schnur, P. & Zika, G. [Hrsg]: Das IAB/INFORGE-Modell. Ein sektorales makroökonometrisches Projektions- und Simulationsmodell zur Vorausschätzung des längerfristigen Arbeitskräftebedarfs. IAB-Bibliothek 318, Nürnberg, S. 15-175.
Almon, C. (1991): The INFORUM Approach to Interindustry Modelling. In: Economic Systems Research. Vol. 3. pp. 1-7.
Bakhti, J., Brillet, J.L. & Sadiki, M.A. (2011): Presentation du modèle PRESIMO – Modèle de prévision et de simulation des politiques économique de l’économie marocaine. Haut-Commisariat au Plan, January 2011.
Bougroum, M. & Ibourk, A. (2003): The effects of job-creation schemes in Morocco. International Labour Review 142(3), 341-372.
Bussolo, M. & Roland-Holst, D. (1993): A detailed input-output table for Morocco 1990, OECD Development Centre Working Paper No. 90
CEDEFOP (2012): Development of national qualifications frameworks in Europe. October 2012. Working Paper No 12. http://www.cedefop.europa.eu/EN/Files/6112_en.pdf (23.01.2012)
De Haas, H. (2009): Morocco. focus Migration, country profile Morocco, No.16. http://focus-migration.hwwi.de
Drosdowski, T., Wolter, M.I., Helmrich, R. & Maier, T. (2010): Entwicklung der Erwerbspersonen nach Berufen und Qualifikationen bis 2025: Modellrechnung mit dem BIBB-Demos-Modell. In: Helmrich, R. & Zika, G. [Hrsg.]: Beruf und Qualifikation in der Zukunft, BIBB-IAB-Modellrechnungen zu den Entwicklungen in den Berufsfeldern und Qualifikationen bis 2025, Schriftenreihe bes Bundesinstituts für Berufsbildung, Bonn, S. 125-152.
Eurostat (2008): Eurostat Manual of Supply, Use and Input-Output Tables, Luxembourg.
Fourastié, J. (1963): Le grand espoir du XXe siécle. Édition définitive, Gallimard, Paris, 1963.
Greeman, R. (2011): The Arab Spring in Morocco. http://www.mamfakinch.com/the-arab-spring-in-morocco/, dated 27.05.2011, 21:53.
Haut Commissariat au Plan (2011a): ICV annuel par grands groupes (Base 100 : 1989). http://www.hcp.ma/ICV-par-grands-groupes_a184.html, dated 17.10.2011.
Haut Commissariat au Plan (2011b): Emploi par branche d'activité de la population active occupée au milieu rural et au milieu urbain. http://www.hcp.ma/Emploi-Ventilation-par-Branche_r68.html, dated 1.11.2011.
Haut Commissariat au Plan (2011c): Taux de chômage annuel national selon les tranches d'âge. http://www.hcp.ma/Taux-de-chomage-au-niveau-national-selon-les-tranches-d-age_a262.html, dated 31.10.2011.

gwsgwsgwsgws Discussion Paper 2012/3
© GWS mbH 2012
19
Haut Commissariat au Plan (2009): Comptes nationaux 1990-2007 (Base 1998), April 2009.
Helmrich, R., Zika, G., Wolter, M.I., Schandock, M., Maier, T., Kalinowski, M., Hummel, M., Haenisch, C., Drosdowski, T., Bremser, F. & Bott, P. (2012): Noch sind die Engpässe auf dem Arbeitsmarkt nicht so groß, wie oft behauptet. Ergebnisse der BIBB-IAB-Qualifikations- und Berufsfeldprojektionen bis zum Jahr 2030. Forthcoming.
Lehr, U. & Mönnig, A. (2012): Employment effects from the Tunisian Solar Plan, Study commissioned by GIZ, Tunis.
Lehr, U., Nitsch, J., Kratzat, M., Lutz, C. & Edler, D. (2008): Renewable Energy and Employment in Germany. Energy Policy, 36, pp. 108-117, DOI:10.1016/j.enpol.2007.09.004.
Leontief, W. (1966): Input-Output Economics. New York.
Lutz, C. (2011): How to increase global resource productivity? Findings from modelling in the petrE project. In: Bleischwitz, R., Welfens, P.J.J., Zhang, Z. [ed.]: International Economics of Resource Efficiency, pp. 317-334, Heidelberg.
Lutz, C. & Meyer, B. (2010): Environmental Tax Reform in the European Union: Impact on CO2 Emissions and the Economy. Zeitschrift für Energiewirtschaft, 34, pp. 1-10. DOI: 10.1007/s12398-010-0009-x
Lutz, C., Meyer, B. & Wolter, M.I. (2010): The Global Multisector/Multicountry 3E-Model GINFORS. A Description of the Model and a Baseline Forecast for Global Energy Demand and CO2-Emissions. International Journal of Global Environmental Issues, 10(1-2), pp. 25-45.
Maier, T., Mönnig, A. & Zika, G. (2012): Labour Demand by industrial sector, occupational field and qualification in Germany until 2025 – model calculations using the IAB/INFORGE model. In: Economic Systems Research. Forthcoming.
Mönnig, A. & Stöver, B. (2010): Change in Private Consumption Expenditure and its Consequences for the Economy – How Important is the Purchase of Cars? In: Počs, R., Auziņa, A. & Ozoliņa, V. [ed.]: Development and Applications of Multisectoral Macroeconomic Models, Riga, pp. 75-98.
Mönnig, A. & Wiebe, K. (2011): Macroeconomic Effects of the current Crisis in Japan and MENA Countries. In: The Business & Management Review, Conference Proceedings of the 2nd International Trade & Academic Research Conference (ITARC) in London, UK, 7th – 8th November 2011, Vol. 1 No. 2., pp. 222-231.
Nyhus, D. E. (1991): The INFORUM International System. Economic Systems Research, 3(1), pp. 55-64.
Office des Changes (2010): Commerce extérieur du Maroc 2010, édition provisoire. www.oc.gov.ma. 7.7.2011.
Royaume du Maroc (2011): La Constitution. Bulletin Officiel, Edition de traduction officielle, No. 5964 bis – 28 chaabane 1432 (30-7-2011).
SEC(2009) 92, Impact Assessment Guidelines, European Commission, January 2009.
Speck, S., Summerton, P., Lee, D. & Wiebe, K. (2011): Environmental Taxes and ETRs in Europe: The Current Situation and a Review of the Modelling Literature. In: Ekins,
gwsgwsgwsgws Discussion Paper 2012/3
© GWS mbH 2012
20
P. & Speck, S. [ed.]: Environmental Tax Reform (ETR) - A Policy for Green Growth, Oxford University Press, New York, pp. 99-130.
Stocker, A., Großmann, A., Madlener, R. & Wolter, M. I. (2011): Sustainable energy development in Austria until 2020: Insights from applying the integrated model "e3.at", Energy Policy 39 (2011) pp. 6082-6099.
The World Factbook (2011): Africa – Morocco. https://www.cia.gov/library/publications/ the-world-factbook/geos/mo.html, CIA, dated 24.11.2011.
Ulrich P., Distelkamp M. & Lehr U. (2012): Employment Effects of Renewable Energy Expansion on a Regional Level - First Results of a Model-Based Approach for Germany. Sustainability. 4(2), pp. 227-243.
UNSNA (1993): System of National Accounts 1993. European Commission, International Monetary Fund, OECD, United Nations and World Bank. WB Brussels/Luxembourg, New York, Paris, Washington, D.C., 1993
West, G.R. (1995): Comparison of Input–Output, Input–Output + Econometric and Computable General Equilibrium Impact Models at the Regional Level. Economic Systems Research 7(2), pp. 209-227.
World Bank (2011): MENA Facing Challenges and Opportunities. Middle East and North African Region – A Regional Economic Update, May 2011, Washington.
World Development Indicators online (2011), http://data.worldbank.org/data-catalog/world-development-indicators, dated 2011-08-02.