MENA Investment Banking Review First Nine Months 2020
18
1 Refinitiv Deals Intelligence MENA Investment Banking Review First Nine Months 2020
-
Upload
khangminh22 -
Category
Documents
-
view
5 -
download
0
Transcript of MENA Investment Banking Review First Nine Months 2020
1
Refinitiv Deals Intelligence
MENA Investment Banking Review
First Nine Months 2020
2
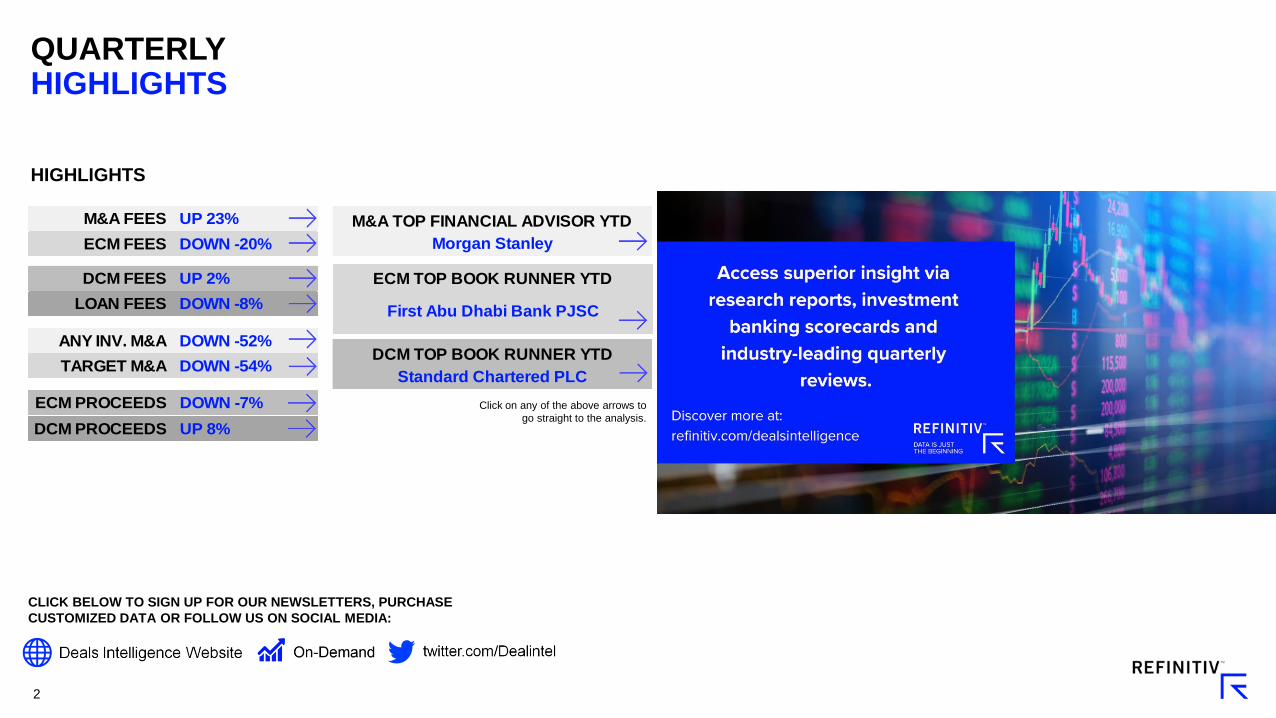
DCM PROCEEDS UP 8%
ECM PROCEEDS DOWN -7%
ANY INV. M&A DOWN -52%
TARGET M&A DOWN -54%
LOAN FEES DOWN -8%
DCM FEES UP 2%
ECM FEES DOWN -20%
M&A FEES UP 23%
Standard Chartered PLC
DCM TOP BOOK RUNNER YTD
First Abu Dhabi Bank PJSC
ECM TOP BOOK RUNNER YTD
M&A TOP FINANCIAL ADVISOR YTD
Morgan Stanley
QUARTERLY HIGHLIGHTS
HIGHLIGHTS
Click on any of the above arrows to
go straight to the analysis.
CLICK BELOW TO SIGN UP FOR OUR NEWSLETTERS, PURCHASE
CUSTOMIZED DATA OR FOLLOW US ON SOCIAL MEDIA:
3
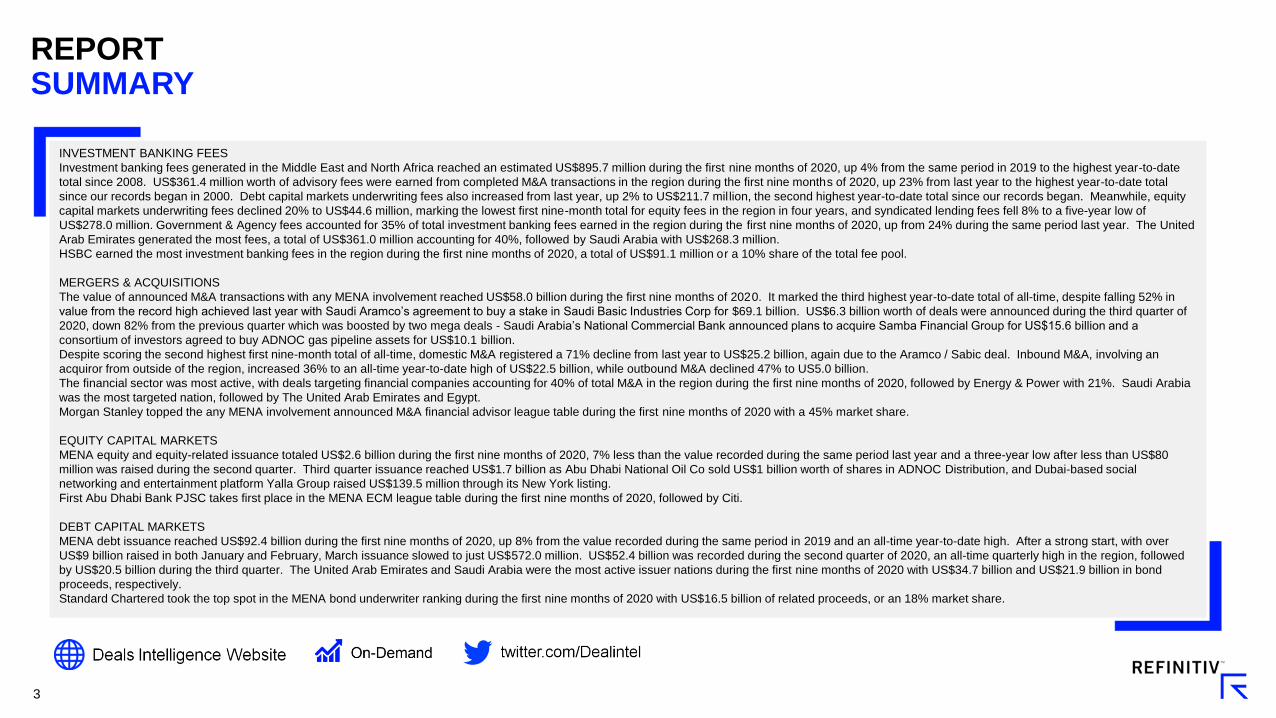
REPORTSUMMARY
INVESTMENT BANKING FEES
Investment banking fees generated in the Middle East and North Africa reached an estimated US$895.7 million during the first nine months of 2020, up 4% from the same period in 2019 to the highest year-to-date
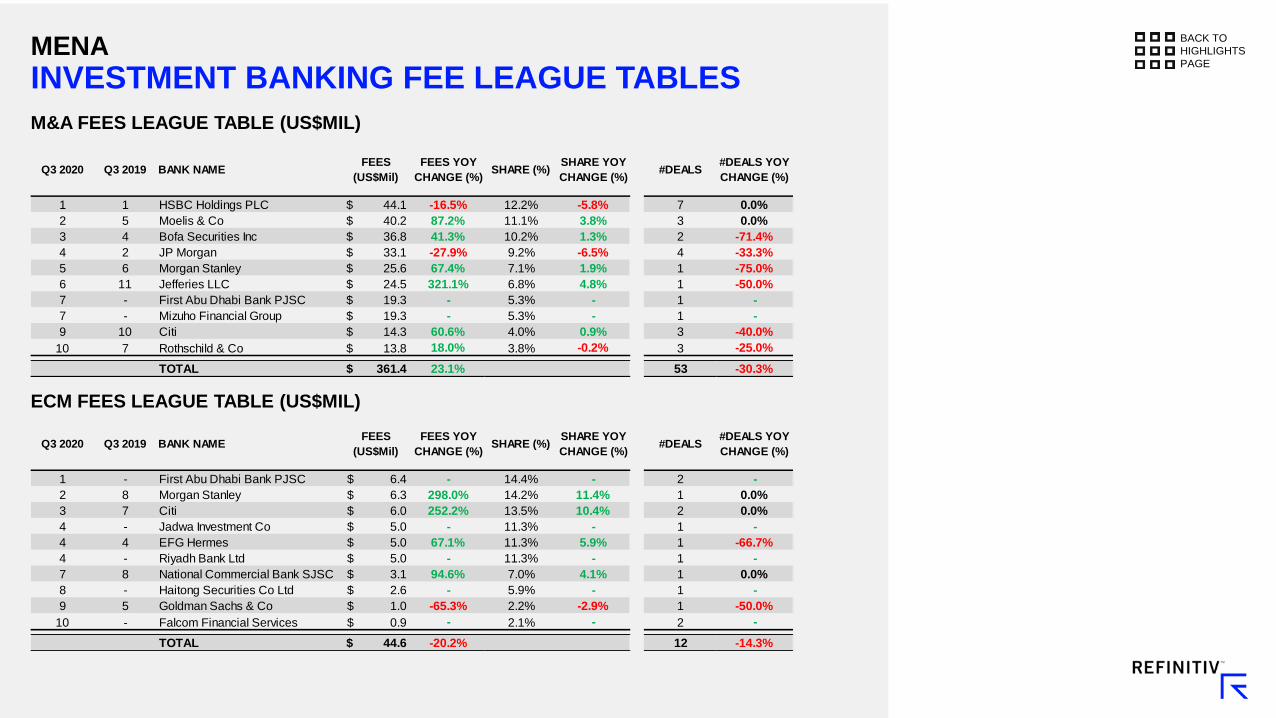
total since 2008. US$361.4 million worth of advisory fees were earned from completed M&A transactions in the region during the first nine months of 2020, up 23% from last year to the highest year-to-date total
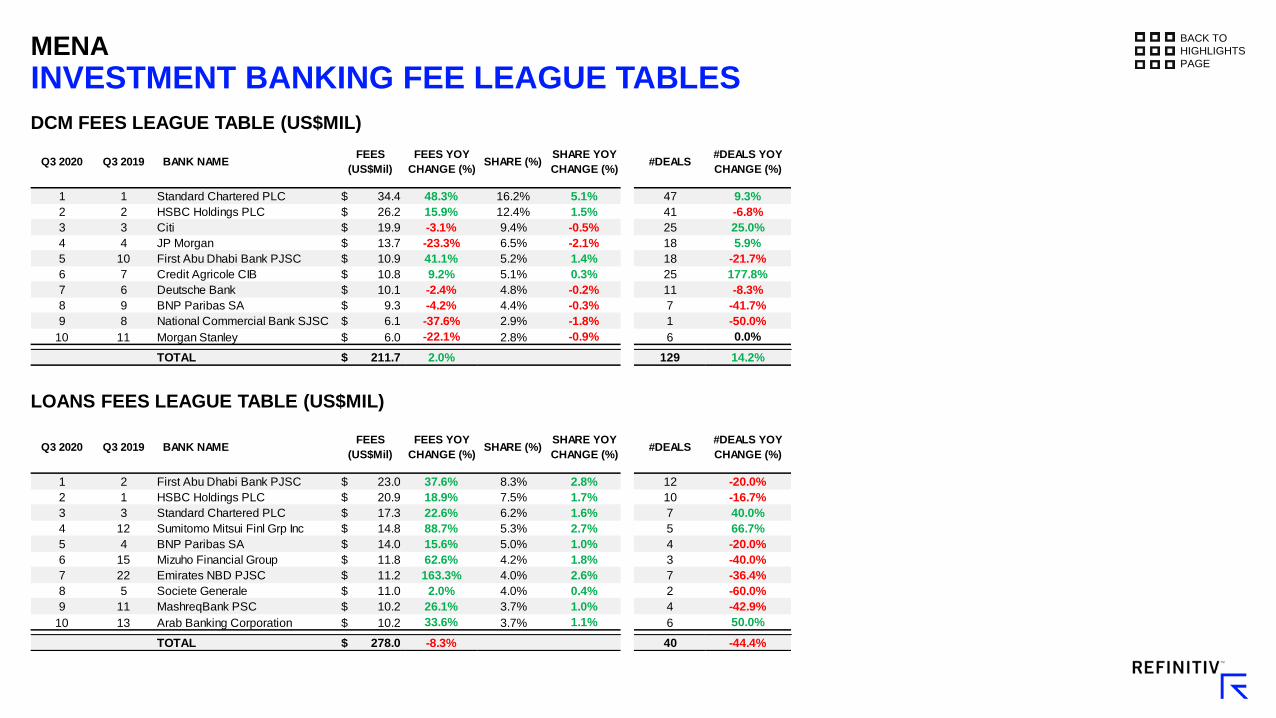
since our records began in 2000. Debt capital markets underwriting fees also increased from last year, up 2% to US$211.7 mil lion, the second highest year-to-date total since our records began. Meanwhile, equity
capital markets underwriting fees declined 20% to US$44.6 million, marking the lowest first nine-month total for equity fees in the region in four years, and syndicated lending fees fell 8% to a five-year low of
US$278.0 million. Government & Agency fees accounted for 35% of total investment banking fees earned in the region during the first nine months of 2020, up from 24% during the same period last year. The United
Arab Emirates generated the most fees, a total of US$361.0 million accounting for 40%, followed by Saudi Arabia with US$268.3 million.
HSBC earned the most investment banking fees in the region during the first nine months of 2020, a total of US$91.1 million or a 10% share of the total fee pool.
MERGERS & ACQUISITIONS
The value of announced M&A transactions with any MENA involvement reached US$58.0 billion during the first nine months of 2020. It marked the third highest year-to-date total of all-time, despite falling 52% in
value from the record high achieved last year with Saudi Aramco’s agreement to buy a stake in Saudi Basic Industries Corp for $69.1 billion. US$6.3 billion worth of deals were announced during the third quarter of
2020, down 82% from the previous quarter which was boosted by two mega deals - Saudi Arabia’s National Commercial Bank announced plans to acquire Samba Financial Group for US$15.6 billion and a
consortium of investors agreed to buy ADNOC gas pipeline assets for US$10.1 billion.
Despite scoring the second highest first nine-month total of all-time, domestic M&A registered a 71% decline from last year to US$25.2 billion, again due to the Aramco / Sabic deal. Inbound M&A, involving an
acquiror from outside of the region, increased 36% to an all-time year-to-date high of US$22.5 billion, while outbound M&A declined 47% to US5.0 billion.
The financial sector was most active, with deals targeting financial companies accounting for 40% of total M&A in the region during the first nine months of 2020, followed by Energy & Power with 21%. Saudi Arabia
was the most targeted nation, followed by The United Arab Emirates and Egypt.
Morgan Stanley topped the any MENA involvement announced M&A financial advisor league table during the first nine months of 2020 with a 45% market share.
EQUITY CAPITAL MARKETS
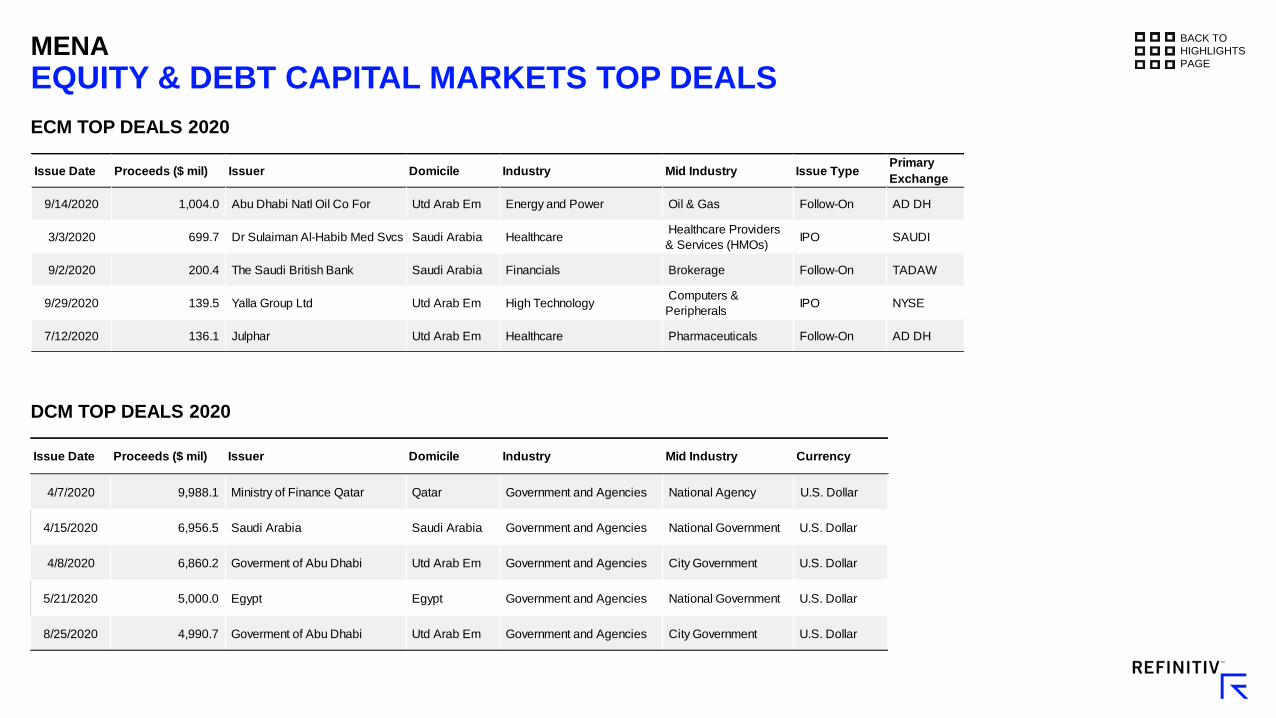
MENA equity and equity-related issuance totaled US$2.6 billion during the first nine months of 2020, 7% less than the value recorded during the same period last year and a three-year low after less than US$80
million was raised during the second quarter. Third quarter issuance reached US$1.7 billion as Abu Dhabi National Oil Co sold US$1 billion worth of shares in ADNOC Distribution, and Dubai-based social
networking and entertainment platform Yalla Group raised US$139.5 million through its New York listing.
First Abu Dhabi Bank PJSC takes first place in the MENA ECM league table during the first nine months of 2020, followed by Citi.
DEBT CAPITAL MARKETS
MENA debt issuance reached US$92.4 billion during the first nine months of 2020, up 8% from the value recorded during the same period in 2019 and an all-time year-to-date high. After a strong start, with over
US$9 billion raised in both January and February, March issuance slowed to just US$572.0 million. US$52.4 billion was recorded during the second quarter of 2020, an all-time quarterly high in the region, followed
by US$20.5 billion during the third quarter. The United Arab Emirates and Saudi Arabia were the most active issuer nations during the first nine months of 2020 with US$34.7 billion and US$21.9 billion in bond
proceeds, respectively.
Standard Chartered took the top spot in the MENA bond underwriter ranking during the first nine months of 2020 with US$16.5 billion of related proceeds, or an 18% market share.
4
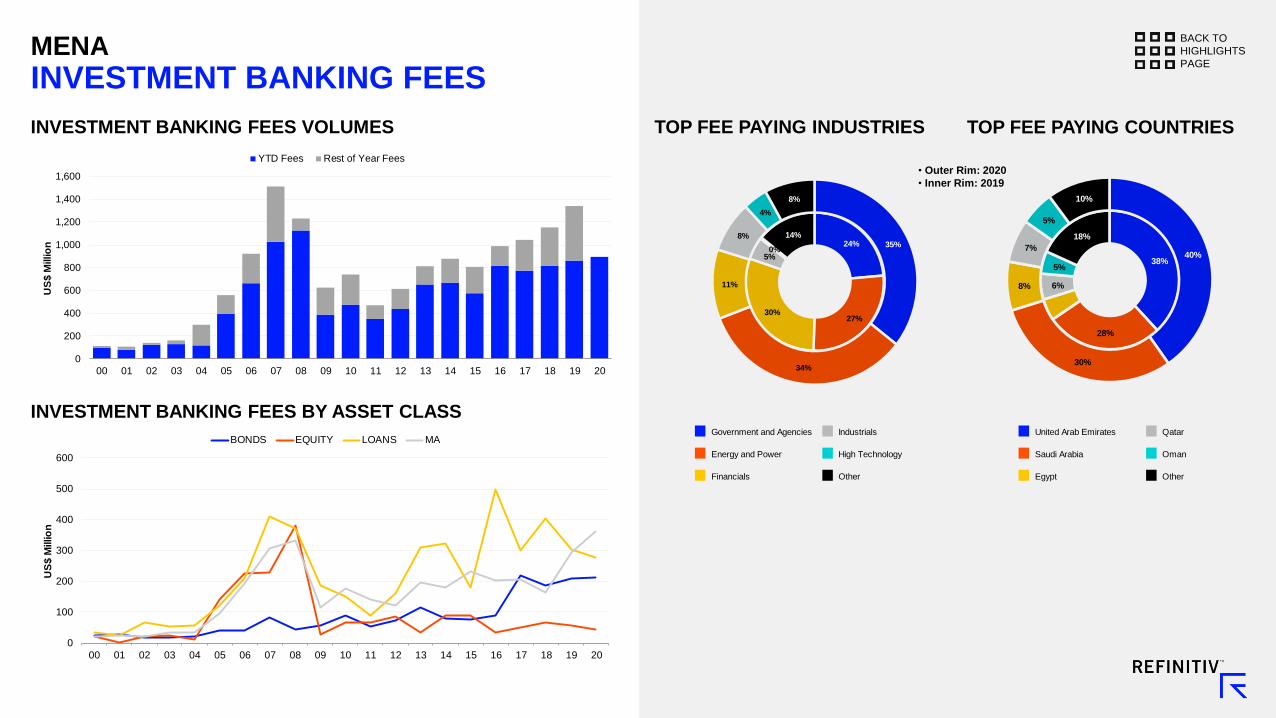
MENA
INVESTMENT BANKING FEES
INVESTMENT BANKING FEES VOLUMES
INVESTMENT BANKING FEES BY ASSET CLASS
TOP FEE PAYING INDUSTRIES TOP FEE PAYING COUNTRIES
BACK TO
HIGHLIGHTS
PAGE
0
200
400
600
800
1,000
1,200
1,400
1,600
00 01 02 03 04 05 06 07 08 09 10 11 12 13 14 15 16 17 18 19 20
US
$ M
illio
n
YTD Fees Rest of Year Fees
0
100
200
300
400
500
600
00 01 02 03 04 05 06 07 08 09 10 11 12 13 14 15 16 17 18 19 20
US
$ M
illio
n
BONDS EQUITY LOANS MA
24%
27%30%
5%0%
14%35%
34%
11%
8%
4%
8%
Government and Agencies Industrials
Energy and Power High Technology
Financials Other
38%
28%
6%
5%
18%
40%
30%
8%
7%
5%
10%
United Arab Emirates Qatar
Saudi Arabia Oman
Egypt Other
• Outer Rim: 2020
• Inner Rim: 2019
5
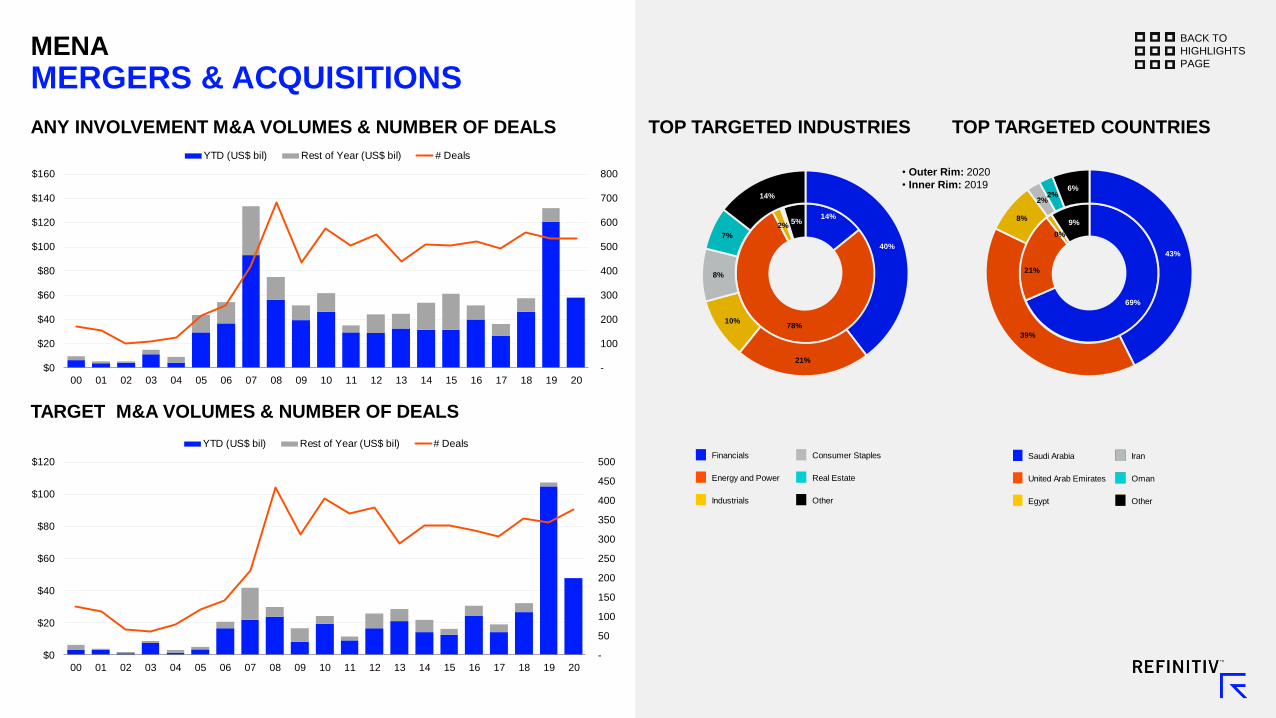
MENA
MERGERS & ACQUISITIONS
BACK TO
HIGHLIGHTS
PAGE
ANY INVOLVEMENT M&A VOLUMES & NUMBER OF DEALS
TARGET M&A VOLUMES & NUMBER OF DEALS
TOP TARGETED COUNTRIESTOP TARGETED INDUSTRIES
-
100
200
300
400
500
600
700
800
$0
$20
$40
$60
$80
$100
$120
$140
$160
00 01 02 03 04 05 06 07 08 09 10 11 12 13 14 15 16 17 18 19 20
YTD (US$ bil) Rest of Year (US$ bil) # Deals
-
50
100
150
200
250
300
350
400
450
500
$0
$20
$40
$60
$80
$100
$120
00 01 02 03 04 05 06 07 08 09 10 11 12 13 14 15 16 17 18 19 20
YTD (US$ bil) Rest of Year (US$ bil) # Deals
69%
21%
0%
9%
43%
39%
8%
2%2%
6%
14%
78%
2%5%
40%
21%
10%
8%
7%
14%
• Outer Rim: 2020
• Inner Rim: 2019
Financials Consumer Staples
Energy and Power Real Estate
Industrials Other
Saudi Arabia Iran
United Arab Emirates Oman
Egypt Other

6
MENA
MERGERS & ACQUISITIONS
BACK TO
HIGHLIGHTS
PAGE
ANY INVOLVEMENT M&A MONTHLY VOLUMES
-
20
40
60
80
100
120
$0
$10
$20
$30
$40
$50
$60
$70
$80
2010 2011 2012 2013 2014 2015 2016 2017 2018 2019 2020
Value (US$ bil) # Deals
US$69b Saudi Aramco / SABIC

7
MENA
MERGERS & ACQUISITIONS
BACK TO
HIGHLIGHTS
PAGE
INBOUND M&A DOMESTIC M&A OUTBOUND M&A
INBOUND M&A VOLUMESTOP TARGETED / TOP ACQUIRING NATIONS
DOMESTIC M&A VOLUMESTOP TARGETED / TOP ACQUIRING NATIONS
OUTBOUND M&A VOLUMESTOP TARGETED / TOP ACQUIRING NATIONS
-
50
100
150
200
250
300
350
$0
$10
$20
$30
$40
$50
$60
$70
$80
$90
$100
00 01 02 03 04 05 06 07 08 09 10 11 12 13 14 15 16 17 18 19 20
YTD (US$ bil) Rest of Year (US$ bil) # Deals
-
20
40
60
80
100
120
140
160
180
200
$0
$5
$10
$15
$20
$25
00 01 02 03 04 05 06 07 08 09 10 11 12 13 14 15 16 17 18 19 20
YTD (US$ bil) Rest of Year (US$ bil) # Deals
-
50
100
150
200
250
$0
$10
$20
$30
$40
$50
$60
$70
$80
00 01 02 03 04 05 06 07 08 09 10 11 12 13 14 15 16 17 18 19 20
YTD (US$ bil) Rest of Year (US$ bil) # Deals
Domestic M&A declined 71% YTD to US$25.2 billion.Inbound M&A increased 36% YTD to US$22.5 billion. Outbound M&A declined 47% YTD to US$5.0 billion.
$14.9
$3.7
$1.0
$1.0
$0.9
United ArabEmirates
SaudiArabia
Iran
Oman
Jordan
US$ Billion
$14.2
$3.0
$2.1
$1.0
$1.0
UnitedStates…
HongKong
Unknown
UnitedKingdom
Mauritius
US$ Billion
$19.1
$4.0
$1.0
$0.4
$0.4
Saudi Arabia
United ArabEmirates
Qatar
Egypt
Tunisia
US$ Billion
$16.7
$3.8
$3.2
$1.0
$0.4
Saudi Arabia
United ArabEmirates
Egypt
Qatar
Tunisia
US$ Billion
$3.6
$0.4
$0.3
$0.2
$0.1
UnitedStates…
India
Bermuda
Germany
UnitedKingdom
US$ Billion
$2.9
$0.7
$0.4
$0.4
$0.3
Saudi Arabia
Bahrain
United ArabEmirates
Qatar
Morocco
US$ Billion

8
MENA
MERGERS & ACQUISITIONS
BACK TO
HIGHLIGHTS
PAGE
ANY INVOLVEMENT M&A TOP DEALS YTD
Value ($Mil) Status Rank Date Target Name Target Nation Target Industry Acquiror NameAcquiror Parent
NationTarget Financial Advisor Acquiror Financial Advisor
15,630.9 Pending 6/25/2020 Samba Financial Group SJSC Saudi Arabia FinancialsNational Commercial Bank
SJSCSaudi Arabia Morgan Stanley JP Morgan & Co Inc
10,100.0 Completed 6/23/2020 ADNOC Gas Pipeline Assets LLC Utd Arab Em Energy and Power Investor Group United States
Bank of America Sec JAP
First Abu Dhabi Bank PJSC
Mizuho Securities Co Ltd
Moelis & Co
Rothschild & Co
Morgan Stanley
Citi
4,680.0 Pending 3/6/2020 Borealis AG Austria Materials OMV AG Austria Barclays
2,998.0 Completed 5/22/2020 Pinehill Co Ltd Saudi Arabia Consumer StaplesPT Indofood CBP Sukses
MakmurHong Kong
Somerley
Deutsche Bank
2,717.9 Completed 2/17/2020 DP World PLC Utd Arab Em Industrials Port & Free Zone World FZE Utd Arab Em Rothschild & Co
Citigroup Global Markets Ltd
Deutsche Bank Aktiengesellschaft
London Branch
2,700.0 Completed 9/2/2020 Abu Dhabi Ppty Ls Hldg RSC Ltd Utd Arab Em Real Estate Investor Group United StatesHSBC Holdings PLC
Moelis & Co
2,392.0 Pending 1/29/2020 Vodafone Egypt Telecommun SAE Egypt Telecommunications Saudi Telecom Co Sjsc Saudi Arabia Barclays
1,000.0 Completed 3/8/2020 Qatar Fertilizer Co PSC Qatar Materials Qatar Petroleum Corp Qatar
1,000.0 Pending 2/3/2020 Etihad Airways-Com Air Por(38) Utd Arab Em Industrials Altavair LP United States
1,000.0 Pending 6/30/2020 Jindal Shadeed Iron & Steel Oman Materials Templar Invests Ltd MauritiusAlpen Capital (ME) Ltd
Ernst & Young LLP

9
MENA
EQUITY CAPITAL MARKETS
BACK TO
HIGHLIGHTS
PAGE
ECM YTD PROCEEDS
ECM YTD PROCEEDS BY ISSUE TYPE
TOP ISSUING COUNTRIES
TOP ISSUING INDUSTRIES
$1.0
$0.8
$0.3
$0.2
$0.1
$0.0
$1.5
$0.7
Energy and Power
Healthcare
Financials
Real Estate
US$ Billion
YTD Proceeds YTDLY Proceeds
$1.3
$1.2
$0.1
$0.0
$0.1
$1.0
$0.1
$0.2
United Arab Emirates
Saudi Arabia
Morocco
Egypt
US$ Bllion
YTD Proceeds YTDLY Proceeds
$0
$5
$10
$15
$20
$25
$30
$35
00 01 02 03 04 05 06 07 08 09 10 11 12 13 14 15 16 17 18 19 20
US
$ B
illio
n
YTD Proceeds Rest of Year Proceeds
$0
$2
$4
$6
$8
$10
$12
$14
$16
$18
00 01 02 03 04 05 06 07 08 09 10 11 12 13 14 15 16 17 18 19 20
US
$ B
illio
n
IPO Follow-On Convertible

10
DCM YTD PROCEEDS
DCM MONTHLY PROCEEDS
TOP ISSUING COUNTRIES
TOP ISSUING INDUSTRIES
MENA
DEBT CAPITAL MARKETS
BACK TO
HIGHLIGHTS
PAGE
$0
$20
$40
$60
$80
$100
$120
00 01 02 03 04 05 06 07 08 09 10 11 12 13 14 15 16 17 18 19 20
US
$ B
illio
n
YTD Proceeds Rest of Year Proceeds
0
5
10
15
20
25
$0
$5
$10
$15
$20
$25
$30
$35
2015 2016 2017 2018 2019 2020
US
$ B
illio
n
Proceeds (US$ bil) # Issues
$34.7
$21.9
$19.4
$6.1
$5.8
$25.9
$27.6
$16.1
$3.6
$7.3
United Arab Emirates
Saudi Arabia
Qatar
Bahrain
Egypt
US$ Billion
YTD Proceeds YTDLY Proceeds
$50.6
$37.6
$3.8
$0.4
$45.4
$23.8
$13.1
$0.0
Government and Agencies
Financials
Energy and Power
Materials
US$ Billion
YTD Proceeds YTDLY Proceeds
11
MENA
EQUITY & DEBT CAPITAL MARKETS TOP DEALS
BACK TO
HIGHLIGHTS
PAGE
ECM TOP DEALS 2020
DCM TOP DEALS 2020
Issue Date Proceeds ($ mil) Issuer Domicile Industry Mid Industry Currency
4/7/2020 9,988.1 Ministry of Finance Qatar Qatar Government and Agencies National Agency U.S. Dollar
4/15/2020 6,956.5 Saudi Arabia Saudi Arabia Government and Agencies National Government U.S. Dollar
4/8/2020 6,860.2 Goverment of Abu Dhabi Utd Arab Em Government and Agencies City Government U.S. Dollar
5/21/2020 5,000.0 Egypt Egypt Government and Agencies National Government U.S. Dollar
8/25/2020 4,990.7 Goverment of Abu Dhabi Utd Arab Em Government and Agencies City Government U.S. Dollar
Issue Date Proceeds ($ mil) Issuer Domicile Industry Mid Industry Issue TypePrimary
Exchange
9/14/2020 1,004.0 Abu Dhabi Natl Oil Co For Utd Arab Em Energy and Power Oil & Gas Follow-On AD DH
3/3/2020 699.7 Dr Sulaiman Al-Habib Med Svcs Saudi Arabia Healthcare Healthcare Providers
& Services (HMOs) IPO SAUDI
9/2/2020 200.4 The Saudi British Bank Saudi Arabia Financials Brokerage Follow-On TADAW
9/29/2020 139.5 Yalla Group Ltd Utd Arab Em High Technology Computers &
Peripherals IPO NYSE
7/12/2020 136.1 Julphar Utd Arab Em Healthcare Pharmaceuticals Follow-On AD DH

12
MENA
INVESTMENT BANKING FEE LEAGUE TABLES
BACK TO
HIGHLIGHTS
PAGE
INVESTMENT BANKING FEES LEAGUE TABLE
INVESTMENT BANKING FEES LEAGUE TABLE (US$MIL)
10.2%
6.7%6.2% 6.0%
5.5%
4.5% 4.5% 4.2%3.9% 3.7%
0
20
40
60
80
100
120
0 1 2 3 4 5 6 7 8 9 10 11
Fe
es
US
$ M
illio
n
Rank
HSBC Holdings PLC First Abu Dhabi Bank PJSC Standard Chartered PLC JP Morgan Citi
Moelis & Co Bofa Securities Inc Morgan Stanley Mizuho Financial Group BNP Paribas SA
Q3 2020 Q3 2019 BANK NAMEFEES
(US$Mil)
FEES YOY
CHANGE (%)SHARE (%)
SHARE YOY
CHANGE (%)#DEALS
#DEALS YOY
CHANGE (%)
1 1 HSBC Holdings PLC 91.1$ -4.5% 10.2% -0.9% 58 -9.4%
2 9 First Abu Dhabi Bank PJSC 59.6$ 143.9% 6.7% 3.8% 33 -13.2%
3 5 Standard Chartered PLC 56.0$ 49.9% 6.2% 1.9% 55 14.6%
4 2 JP Morgan 53.9$ -18.1% 6.0% -1.6% 26 0.0%
5 4 Citi 49.4$ 28.6% 5.5% 1.1% 37 0.0%
6 11 Moelis & Co 40.2$ 87.2% 4.5% 2.0% 3 0.0%
7 7 Bofa Securities Inc 40.2$ 45.6% 4.5% 1.3% 6 -40.0%
8 6 Morgan Stanley 37.9$ 24.7% 4.2% 0.7% 8 -33.3%
9 28 Mizuho Financial Group 34.9$ 351.5% 3.9% 3.0% 19 111.1%
10 10 BNP Paribas SA 33.5$ 40.8% 3.7% 1.0% 16 -15.8%
TOTAL 895.7$ 4.1% 234 -14.9%
13
MENA
INVESTMENT BANKING FEE LEAGUE TABLES
BACK TO
HIGHLIGHTS
PAGE
M&A FEES LEAGUE TABLE (US$MIL)
ECM FEES LEAGUE TABLE (US$MIL)
Q3 2020 Q3 2019 BANK NAMEFEES
(US$Mil)
FEES YOY
CHANGE (%)SHARE (%)
SHARE YOY
CHANGE (%)#DEALS
#DEALS YOY
CHANGE (%)
1 1 HSBC Holdings PLC 44.1$ -16.5% 12.2% -5.8% 7 0.0%
2 5 Moelis & Co 40.2$ 87.2% 11.1% 3.8% 3 0.0%
3 4 Bofa Securities Inc 36.8$ 41.3% 10.2% 1.3% 2 -71.4%
4 2 JP Morgan 33.1$ -27.9% 9.2% -6.5% 4 -33.3%
5 6 Morgan Stanley 25.6$ 67.4% 7.1% 1.9% 1 -75.0%
6 11 Jefferies LLC 24.5$ 321.1% 6.8% 4.8% 1 -50.0%
7 - First Abu Dhabi Bank PJSC 19.3$ - 5.3% - 1 -
7 - Mizuho Financial Group 19.3$ - 5.3% - 1 -
9 10 Citi 14.3$ 60.6% 4.0% 0.9% 3 -40.0%
10 7 Rothschild & Co 13.8$ 18.0% 3.8% -0.2% 3 -25.0%
TOTAL 361.4$ 23.1% 53 -30.3%
Q3 2020 Q3 2019 BANK NAMEFEES
(US$Mil)
FEES YOY
CHANGE (%)SHARE (%)
SHARE YOY
CHANGE (%)#DEALS
#DEALS YOY
CHANGE (%)
1 - First Abu Dhabi Bank PJSC 6.4$ - 14.4% - 2 -
2 8 Morgan Stanley 6.3$ 298.0% 14.2% 11.4% 1 0.0%
3 7 Citi 6.0$ 252.2% 13.5% 10.4% 2 0.0%
4 - Jadwa Investment Co 5.0$ - 11.3% - 1 -
4 4 EFG Hermes 5.0$ 67.1% 11.3% 5.9% 1 -66.7%
4 - Riyadh Bank Ltd 5.0$ - 11.3% - 1 -
7 8 National Commercial Bank SJSC 3.1$ 94.6% 7.0% 4.1% 1 0.0%
8 - Haitong Securities Co Ltd 2.6$ - 5.9% - 1 -
9 5 Goldman Sachs & Co 1.0$ -65.3% 2.2% -2.9% 1 -50.0%
10 - Falcom Financial Services 0.9$ - 2.1% - 2 -
TOTAL 44.6$ -20.2% 12 -14.3%
14
MENA
INVESTMENT BANKING FEE LEAGUE TABLES
BACK TO
HIGHLIGHTS
PAGE
DCM FEES LEAGUE TABLE (US$MIL)
LOANS FEES LEAGUE TABLE (US$MIL)
Q3 2020 Q3 2019 BANK NAMEFEES
(US$Mil)
FEES YOY
CHANGE (%)SHARE (%)
SHARE YOY
CHANGE (%)#DEALS
#DEALS YOY
CHANGE (%)
1 1 Standard Chartered PLC 34.4$ 48.3% 16.2% 5.1% 47 9.3%
2 2 HSBC Holdings PLC 26.2$ 15.9% 12.4% 1.5% 41 -6.8%
3 3 Citi 19.9$ -3.1% 9.4% -0.5% 25 25.0%
4 4 JP Morgan 13.7$ -23.3% 6.5% -2.1% 18 5.9%
5 10 First Abu Dhabi Bank PJSC 10.9$ 41.1% 5.2% 1.4% 18 -21.7%
6 7 Credit Agricole CIB 10.8$ 9.2% 5.1% 0.3% 25 177.8%
7 6 Deutsche Bank 10.1$ -2.4% 4.8% -0.2% 11 -8.3%
8 9 BNP Paribas SA 9.3$ -4.2% 4.4% -0.3% 7 -41.7%
9 8 National Commercial Bank SJSC 6.1$ -37.6% 2.9% -1.8% 1 -50.0%
10 11 Morgan Stanley 6.0$ -22.1% 2.8% -0.9% 6 0.0%
TOTAL 211.7$ 2.0% 129 14.2%
Q3 2020 Q3 2019 BANK NAMEFEES
(US$Mil)
FEES YOY
CHANGE (%)SHARE (%)
SHARE YOY
CHANGE (%)#DEALS
#DEALS YOY
CHANGE (%)
1 2 First Abu Dhabi Bank PJSC 23.0$ 37.6% 8.3% 2.8% 12 -20.0%
2 1 HSBC Holdings PLC 20.9$ 18.9% 7.5% 1.7% 10 -16.7%
3 3 Standard Chartered PLC 17.3$ 22.6% 6.2% 1.6% 7 40.0%
4 12 Sumitomo Mitsui Finl Grp Inc 14.8$ 88.7% 5.3% 2.7% 5 66.7%
5 4 BNP Paribas SA 14.0$ 15.6% 5.0% 1.0% 4 -20.0%
6 15 Mizuho Financial Group 11.8$ 62.6% 4.2% 1.8% 3 -40.0%
7 22 Emirates NBD PJSC 11.2$ 163.3% 4.0% 2.6% 7 -36.4%
8 5 Societe Generale 11.0$ 2.0% 4.0% 0.4% 2 -60.0%
9 11 MashreqBank PSC 10.2$ 26.1% 3.7% 1.0% 4 -42.9%
10 13 Arab Banking Corporation 10.2$ 33.6% 3.7% 1.1% 6 50.0%
TOTAL 278.0$ -8.3% 40 -44.4%

15
MENA
INVESTMENT BANKING LEAGUE TABLES
BACK TO
HIGHLIGHTS
PAGE
ANY INVOLVEMENT M&A LEAGUE TABLE (US$MIL)
TARGET M&A LEAGUE TABLE (US$MIL)
Q3 2020 Q3 2019 BANK NAMERANK VALUE
(US$ Mil)
RANK VALUE YOY
CHANGE (%)SHARE (%)
SHARE YOY
CHANGE (%)#DEALS
#DEALS YOY
CHANGE (%)
1 6 Morgan Stanley 25,809.2$ -65% 45% -28% 3 -63%
2 2 JP Morgan 16,014.6$ -81% 28% -61% 4 -69%
3 10 Rothschild & Co 12,848.8$ 176% 22% 467% 6 -25%
4 7 Moelis & Co 12,800.0$ 27% 22% 163% 2 -50%
5* - Mizuho Financial Group 10,100.0$ - 17% - 1 -
5* - First Abu Dhabi Bank PJSC 10,100.0$ - 17% - 1 -
5* 5 BofA Securities Inc 10,100.0$ -87% 17% -73% 1 -90%
8 9 Barclays 8,183.9$ 71% 14% 253% 4 0%
9 15 Deutsche Bank 5,715.9$ 430% 10% 1000% 2 -33%
10 1 HSBC Holdings PLC 4,115.6$ -95% 7% -90% 4 -60%
TOTAL 58,044.3$ -52% 100.0% - 535 0%
Q3 2020 Q3 2019 BANK NAMERANK VALUE
(US$ Mil)
RANK VALUE YOY
CHANGE (%)SHARE (%)
SHARE YOY
CHANGE (%)#DEALS
#DEALS YOY
CHANGE (%)
1 6 Morgan Stanley 25,730.9$ -65% 54% -22% 2 -50%
2 3 JP Morgan 16,014.6$ -80% 34% -57% 3 -70%
3 13 Rothschild & Co 12,817.9$ 758% 27% 1821% 4 0%
4 7 Moelis & Co 12,800.0$ 27% 27% 179% 2 -50%
5* - Mizuho Financial Group 10,100.0$ - 21% - 1 -
5* - First Abu Dhabi Bank PJSC 10,100.0$ - 21% - 1 -
5* 5 BofA Securities Inc 10,100.0$ -86% 21% -70% 1 -80%
8 14 Deutsche Bank 5,715.9$ 430% 12% 1100% 2 100%
9 1 HSBC Holdings PLC 4,115.6$ -95% 9% -89% 4 -33%
10 9 Barclays 3,278.9$ -23% 7% 68% 2 0%
TOTAL 47,715.8$ -54% 100.0% - 379 10%

16
MENA
INVESTMENT BANKING LEAGUE TABLES
BACK TO
HIGHLIGHTS
PAGE
ECM LEAGUE TABLE (US$MIL)
DCM LEAGUE TABLE (US$MIL)
Q3 2020 Q3 2019 BANK NAMEPROCEEDS
(US$ Mil)
PROCEEDS YOY
CHANGE (%)SHARE (%)
SHARE YOY
CHANGE (%)#DEALS
#DEALS YOY
CHANGE (%)
1 - First Abu Dhabi Bank PJSC 638.1$ - 24% - 2 -
2 6* Citi 602.2$ 643% 23% 690% 2 0%
3* 2 EFG Hermes 233.2$ -25% 9% -19% 1 -75%
3* - Riyadh Bank Ltd 233.2$ - 9% - 1 -
3* - Jadwa Investment Co 233.2$ - 9% - 1 -
6 8* National Commercial Bank SJSC 115.9$ 58% 4% 69% 1 0%
7 - ANB Invest Co 106.7$ - 4% - 1 -
8 6* Goldman Sachs & Co 100.2$ 24% 4% 31% 1 -50%
9 - Falcom Financial Services 93.0$ - 4% - 2 -
10* - Haitong Securities Co Ltd 69.8$ - 3% - 1 -
10* 8* Morgan Stanley 69.8$ -5% 3% 4% 1 0%
TOTAL 2,627.8$ -7% 100.0% - 13 -13%
Q3 2020 Q3 2019 BANK NAMEPROCEEDS
(US$ Mil)
PROCEEDS YOY
CHANGE (%)SHARE (%)
SHARE YOY
CHANGE (%)#DEALS
#DEALS YOY
CHANGE (%)
1 1 Standard Chartered PLC 16,491.3$ 74% 18% 60% 47 18%
2 2 HSBC Holdings PLC 12,630.5$ 34% 14% 25% 39 15%
3 3 Citi 10,227.1$ 17% 11% 9% 25 32%
4 4 JP Morgan 5,605.7$ -29% 6% -34% 17 0%
5 7 First Abu Dhabi Bank PJSC 5,443.4$ 29% 6% 18% 18 -22%
6 9 Credit Agricole CIB 4,332.9$ 17% 5% 9% 17 113%
7 8 Deutsche Bank 3,974.6$ 1% 4% -7% 9 -25%
8 5 BNP Paribas SA 3,298.7$ -37% 4% -41% 5 -55%
9 11 Morgan Stanley 3,134.1$ 9% 3% 0% 6 0%
10 6 Goldman Sachs & Co 3,089.7$ -36% 3% -42% 3 -50%
TOTAL 92,425.2$ 8% 100.0% - 103 13%

17
CONTACTS / GLOSSARYBACK TO
HIGHLIGHTS
PAGE
MERGERS & ACQUISITIONSThe Refinitiv Mergers & Acquisitions database tracks changes in economic ownership at ultimate parent level in going
business concerns. All deals involving a purchase of at least a 5% stake, or 3% with a value of at least US$1 million are
tracked, subject to criteria. League tables include rank eligible mergers, acquisitions, repurchases, spin-offs, self-tenders,
minority stake purchases and debt restructurings. League tables, commentary, and charts citing announced activity are
based on Rank Date and include intended, pending, partially complete, completed, pending regulatory, and unconditional
transactions. Rank Date is defined as the earliest public announcement of when a value can be applied to a transaction.
EQUITY CAPITAL MARKETSThe Refinitiv Equity Capital Markets database covers domestic and international placements of equity offerings in addition
to domestic and international equity-related transactions. This includes IPOs, follow-on offerings, accelerated book builds
and block trades (with certain restrictions) and convertible bonds. Convertible Bonds with a minimum life of less than 360
days are excluded. Minimum life defined as the difference between the settlement date and the earliest maturity date or
first call/put option.
DEBT CAPITAL MARKETSThe Refinitiv Debt Capital Markets database covers underwritten debt with an issue size of over US$1 million, that
matures in at least 360 days from settlement. It includes all internationally offered underwritten debt transactions in all
currencies, Domestic issuance, Preferred Securities, High Yield and Emerging Market transactions that are offered in US
and Globally, Asset Backed Securities, Mortgage Backed Securities, Collateralized Debt Obligations (CDOs), MTN
takedowns and Certificate of Deposits, except in UK. Primary offerings only. All league tables are based on deal
proceeds (total issue amount multiplied by the issue price) unless otherwise stated. Full credit is given to the book
runner, equal if joint books. In cases of underwriter consolidation, credit is given to the surviving/parent firm. Non-US
dollar denominated transactions are converted to the US dollar equivalent at the time of announcement.
While Refinitiv has used reasonable endeavours to ensure that the information provided in this document is accurate and
up to date as at the time of issue, neither Refinitiv nor its third party content providers shall be liable for any errors,
inaccuracies or delays in the information, nor for any actions taken in reliance thereon, nor does it endorse any views or
opinions of any third party content provider. Refinitiv disclaims all warranties, express or implied, as to the accuracy or
completeness of any of the content provided, or as to the fitness of the content for any purpose to the extent permitted by
law. The content herein is not appropriate for the purposes of making a decision to carry out a transaction or trade and
does not provide any form of advice (investment, tax, legal) amounting to investment advice, nor make any
recommendations or solicitations regarding particular financial instruments, investments or products, including the buying
or selling of securities. Refinitiv has not undertaken any liability or obligation relating to the purchase or sale of securities
for or by any person in connection with this document.
ABOUT REFINITIVRefinitiv, formerly the Financial & Risk business of Thomson Reuters, is one of the world’s largest
providers of financial markets data and infrastructure. Serving more than 40,000 institutions in over 190
countries, we provide information, insights, and technology that drive innovation and performance in
global markets. Our 160-year Reuters heritage of integrity enables customers to make critical decisions
with confidence, while our unique open platform, best-in-class data, and cutting-edge technology bring
greater opportunity to our customers. By advancing our customers, we drive progress for the entire
financial community. For more information, go to www.refinitiv.com.
ABOUT DEALS INTELLIGENCEDeals Intelligence, a part of Refinitiv Investing & Advisory division, brings up to the minute market
intelligence to the deal making community and the financial media through a variety of research reports
including Daily Deals Insight, weekly Investment Banking Scorecard, monthly Deals Snapshots and our
industry-leading quarterly reviews highlighting trends in M&A and Capital Markets.
CONTACT INFORMATIONAMERICAS
Matt Toole I +1 646 223 7212 I [email protected]
EMEA
Lucille Jones l +44 207 542 4372 l [email protected]
Saiem Jalil l +44 (0) 207 542 2865 l [email protected]
ASIA
Elaine Tan l +63 (2) 459 1567 l [email protected]
CLICK BELOW TO SIGN UP FOR OUR NEWSLETTERS, PURCHASE
CUSTOMIZED DATA OR FOLLOW US ON SOCIAL MEDIA:

18