April 2015 Stone Industry in the MENA Region - ARB ...
27
1 April 2015 Stone Industry in the MENA Region Part I
-
Upload
khangminh22 -
Category
Documents
-
view
1 -
download
0
Transcript of April 2015 Stone Industry in the MENA Region - ARB ...
1
April 2015
Stone Industry in the MENA Region
Part I

2
Contents
Part I I. Introduction ......................................................................................................... 3
II. GCC building construction market ......................................................................... 3
GCC value of building projects at fit out stage ................................................................. 4
III. GCC stone industry ............................................................................................... 4
Market size and growth of the GCC stone market ............................................................. 5
Trends in the stone industry in the GCC ......................................................................... 5
Regulation for the stone industry in the GCC ................................................................... 6
Part II I. Trade analysis of stones in MENA region.................................................................. 3
UAE trade analysis ...................................................................................................... 3
KSA trade analysis ...................................................................................................... 4
Qatar trade analysis .................................................................................................... 4
Oman trade analysis ................................................................................................... 5
Kuwait trade analysis .................................................................................................. 6
Bahrain trade analysis ................................................................................................. 6
Egypt trade analysis ................................................................................................... 7
Jordan trade analysis .................................................................................................. 8
Algeria trade analysis .................................................................................................. 9
Libya trade analysis .................................................................................................... 9
Morocco trade analysis .............................................................................................. 10
Syria trade analysis .................................................................................................. 11
Iran trade analysis .................................................................................................... 11
Iraq trade analysis .................................................................................................... 12
Yemen trade analysis ................................................................................................ 13
Palestine trade analysis ............................................................................................. 13
II. Key news on GCC stones industry ........................................................................ 14
III. Major building construction projects at fit out stage across the GCC .................... 16
3
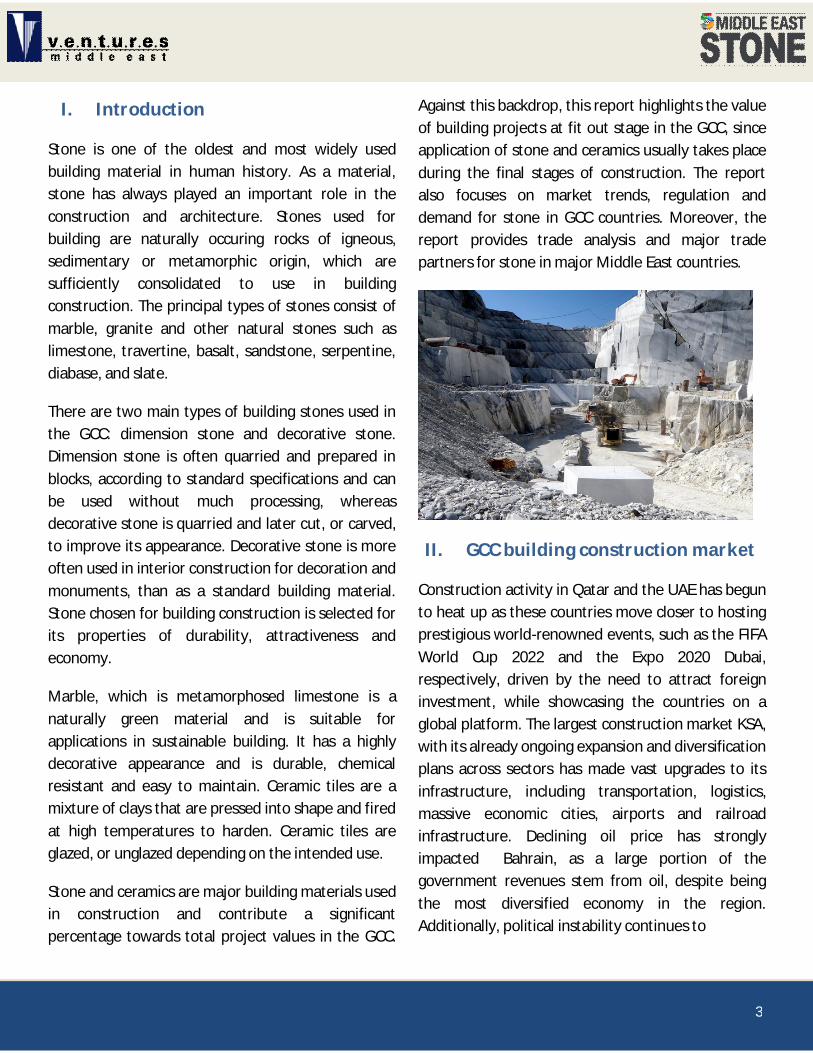
I. Introduction
Stone is one of the oldest and most widely used building material in human history. As a material, stone has always played an important role in the construction and architecture. Stones used for building are naturally occuring rocks of igneous, sedimentary or metamorphic origin, which are sufficiently consolidated to use in building construction. The principal types of stones consist of marble, granite and other natural stones such as limestone, travertine, basalt, sandstone, serpentine, diabase, and slate.
There are two main types of building stones used in the GCC: dimension stone and decorative stone. Dimension stone is often quarried and prepared in blocks, according to standard specifications and can be used without much processing, whereas decorative stone is quarried and later cut, or carved, to improve its appearance. Decorative stone is more often used in interior construction for decoration and monuments, than as a standard building material. Stone chosen for building construction is selected for its properties of durability, attractiveness and economy.
Marble, which is metamorphosed limestone is a naturally green material and is suitable for applications in sustainable building. It has a highly decorative appearance and is durable, chemical resistant and easy to maintain. Ceramic tiles are a mixture of clays that are pressed into shape and fired at high temperatures to harden. Ceramic tiles are glazed, or unglazed depending on the intended use.
Stone and ceramics are major building materials used in construction and contribute a significant percentage towards total project values in the GCC.
Against this backdrop, this report highlights the value of building projects at fit out stage in the GCC, since application of stone and ceramics usually takes place during the final stages of construction. The report also focuses on market trends, regulation and demand for stone in GCC countries. Moreover, the report provides trade analysis and major trade partners for stone in major Middle East countries.
II. GCC building construction market
Construction activity in Qatar and the UAE has begun to heat up as these countries move closer to hosting prestigious world-renowned events, such as the FIFA World Cup 2022 and the Expo 2020 Dubai, respectively, driven by the need to attract foreign investment, while showcasing the countries on a global platform. The largest construction market KSA, with its already ongoing expansion and diversification plans across sectors has made vast upgrades to its infrastructure, including transportation, logistics, massive economic cities, airports and railroad infrastructure. Declining oil price has strongly impacted Bahrain, as a large portion of the government revenues stem from oil, despite being the most diversified economy in the region. Additionally, political instability continues to

4
randomly influence the country’s growth prospects and policy. Kuwait and Oman have reacted with cautious spending and revenue side measures to the falling oil prices, while not compromising on developmental spend, as can be seen in the project completions for 2014 and 2015. Oman is also building the foundations of its growth model with tourism as the cornerstone.
GCC value of building projects at fit out stage
The building project values in 2014 and 2015 have been taken from Ventures Onsite database (www.venturesonsite.com) on the basis of year of completion. Building projects worth more than USD 67.6 billion were completed in 2014 across segments of the building sector that include residential, commercial, hospitality, retail, medical, education and mixed use projects. The figure is likely to reach USD 71.97 billion in 2015, thus posting a healthy growth of 6.5 percent year on year, with a number of projects nearing completion in different GCC countries.
GCC building projects value completed in 2014 and due for completion in 2015 (USD Mn)
Source: Ventures Onsite Database (www.venturesonsite.com)
III. GCC stone industry
Stone is mainly used in buildings as tiles for floors and paving; special works such as balustrades, columns, fireplaces or fountains; structural works, internal and external wall cladding and stairs or steps. The major end-users of stone and stone products in building construction in the GCC are construction contractors, interior fit out companies, landscape contractors and stone cladding contractors.
The market demand for stone in GCC countries has been estimated, taking into consideration the project value spent on stone works- mainly flooring, structural works, internal and external wall cladding,out of the total project value. Flooring work is usually carried out by main contractors, or the interior fit out companies. Landscaping works and internal and external wall cladding using stones are generally sub-contracted by the owner of the project/ consultants or main contractors to interior fit out companies, landscape contractors and stone cladding contractors.
0
5,000
10,000
15,000
20,000
25,000
30,000
35,000
Bahrain Kuwait UAE KSA Qatar Oman
2014 2015
5
Market size and growth of the GCC stone market
Stone products constitute approximately 6 per cent to 10 per cent of the building project value at fit out stage. The percentage of project value spent on stone products varies according to building project type such as residential, commercial, hospitality, retail, medical, education and mixed use projects. Based on the building project value at fit out stage in GCC countries, the market size for marble, stone and ceramics is estimated as USD 5.1 billion in 2014. The market size is expected to reach USD 5.4 billion by the end of 2015. With a share of 47 percent, KSA with its largest growing construction market is the largest market for marble and stone, followed by the UAE with a share of 31 percentin 2014. Qatar, with its FIFA World Cup 2022 spurred construction activities, is the third with an 11 percent share, followed by Kuwait, Oman and Bahrain with 5 percent, 4 percent and 2 percent shares respectively. The marble, stone and ceramics market closely mirror the movement of the building construction industry, as they constitute a significant portion of the total project costs.
GCC market size for marble, stone and ceramic in USD million (2014 & 2015)
Trends in the stone industry in the GCC
GCC countries are increasingly embracing sustainable and green building development wherein environmentally-friendly materials are used to build and the construction process ensures that there is minimal degradation of the environment. Ratings - such as BREEAM in the United Kingdom and LEED of the United States - have been introduced to encourage builders to conserve scarce resources through green building codes that help in establishing standards across the global construction industry. The United States Green Building Council (USGBC) estimates that a green building, on average would reduce energy usage by 30 percent, carbon emissions by 35 percent, water use by 30 to 50 percent, and generate waste cost savings of 50 to 90 percent. Both these and the regional green building codes such as ESTIDAMA and Qatar Sustainability Assessment System (QSAS) of Abu Dhabi and Qatar, all encourage using sustainable raw materials and those that help achieve these conservation targets for a green building.
0
500
1000
1500
2000
2500
Bahrain Kuwait UAE KSA Qatar Oman
2014 2015
Source: Ventures Middle East Analysis

6
Although usage of dimension stone is limited in the GCC, there is an increasing preference seen, mainly in projects that aim to be LEED certified. Dimension stone, which is inherently earth-friendly, has a higher advantage over steel, concrete, glass and laminated plastics that have energy intensive manufacturing process and create significant air and water pollution. As an entirely natural product, dimension stone also has an advantage over synthetic or artificial stone products, as well as composite materials. Natural stone therefore is an accepted alternative when selecting sustainable building materials for a green project. Dimension stone has certain attributes such as recyclability, durability and ease of maintenance, which makes it an environmentally friendly product. In addition, no toxic materials are used in its processing, no direct greenhouse gas emissions are emitted and the water used during processing is almost completely recycled. Besides these qualities, the natural stone industry constantly works to make its processes environmentally friendly by minimizing waste, preventing pollution, and conserving natural resources.
As demand for green buildings has increased, ceramic tile manufacturers have also started manufacturing tiles from recycled materials. Key manufacturers of ceramic and porcelain tiles in the Middle East have introduced a variety of green products that can improve the environmental quality of buildings. Some tile manufacturers use recycled glass in their ceramic products, for glazing applications, in line with the sustainability standards. With respect to the quality of stone and stone products, the specifications provided by consultants on projects have to be satisfied. In the GCC, high
preference exists for stone products that meet green building standards, in order to achieve LEED credits.
Regulation for the stone industry in the GCC
As per the LEED requirement, marble or stone used in a green building should be quarried within a 500-mile (800 km) radius of the building being constructed. This gives a clear advantage to local manufacturing companies. Marble is 100 percent reusable and can be retrieved for new construction, used as paving, or crushed for use as aggregates. A number of stone and marble suppliers in the GCC are promoting sustainable practices by ensuring the quarries from where they procure their raw materials adopt efficient and enhanced processes. In addition, recycling of unused stone in a different form and breaking the uneven stones into standard dimensions for tiling applications are other practices directed towards reducing waste. There are also green methods adopted for stone cleaning (for re-use), such as removing the black gypsum crusts that form on marble and limestone by applying sulfate-reducing bacteria to the crust.
According to LEED Green Building Rating System, stone and stone products help to improve the building quality and thereby achieve LEED credits in several categories:
Sustainable Sites (SS) Credit 7.1: Heat Island Effect, Non-Roof: Using light-colored natural stone with a solar-reflective index of 29 or greater can reduce heat-island effects.
Energy and Atmosphere (EA) Credit 1: Optimize Energy Performance: Natural stone has good thermal mass, which positively impacts indoor

7
ambient air temperature, and thus, energy efficiency.
Materials & Resources (MR): Due to the durability of stone, there are several credits in the MR category that can potentially be garnered.
o MR Credits 1.1 & 1.2 Building Reuse, Maintain 75-95 percent of Existing Walls, Floors, and Roof: These credits apply if the life-cycle of existing building stock can be maintained in a project.
o MR Credits 2.1 & 2.2 Construction Waste Management, Divert 50-75 percent from Disposal: These credits apply if “waste” stone used in construction is diverted to a beneficial use rather than being disposed.
o MR Credits 3.1 & 3.2 Materials Reuse, 5-10 percent: These credits apply if salvaged stone products can be reused for another purpose in a building design.
o MR Credits 5.1 & 5.2 Regional Materials, 10-20 percent Extracted, Processed & Manufactured: These credits apply if the project uses natural stone that has been extracted, harvested or recovered, as well as manufactured, within 500 miles of the project site for a minimum of 10 percent of the total materials value.
Innovation and Design (ID): Use of natural stone may contribute to exceptional performance in areas such as life-cycle cost and durability, mold resistance, and improved air quality.
On the global front, Natural Stone Council (NSC) has announced the new sustainability standard
‘ANSI/NSC-373’ for natural stone in 2014, which cover nine facets of a quarrier and fabricator's operation, including water usage and recycling, custody and transportation, site and plant management, land reclamation and adaptive use, corporate governance, energy use and conservation, management of excess process materials and waste, safer chemical and materials management and human and health considerations. As per the new standard, sustainability of natural stone now encompasses how the stone is quarried, processed and transported and how its use impacts the facilities, environments and people who work with it.

1
April 2015
Stone Industry in the MENA Region
Part II
2
Contents
Part I I. Introduction ......................................................................................................... 3
II. GCC building construction market ......................................................................... 3
GCC value of building projects at fit out stage ................................................................. 4
III. GCC stone industry ............................................................................................... 4
Market size and growth of the GCC stone market ............................................................. 5
Trends in the stone industry in the GCC ......................................................................... 5
Regulation for the stone industry in the GCC ................................................................... 6
Part II I. Trade analysis of stones in MENA region.................................................................. 3
UAE trade analysis ...................................................................................................... 3
KSA trade analysis ...................................................................................................... 4
Qatar trade analysis .................................................................................................... 4
Oman trade analysis ................................................................................................... 5
Kuwait trade analysis .................................................................................................. 6
Bahrain trade analysis ................................................................................................. 6
Egypt trade analysis ................................................................................................... 7
Jordan trade analysis .................................................................................................. 8
Algeria trade analysis .................................................................................................. 9
Libya trade analysis .................................................................................................... 9
Morocco trade analysis .............................................................................................. 10
Syria trade analysis .................................................................................................. 11
Iran trade analysis .................................................................................................... 11
Iraq trade analysis .................................................................................................... 12
Yemen trade analysis ................................................................................................ 13
Palestine trade analysis ............................................................................................. 13
II. Key news on GCC stones industry ........................................................................ 14
III. Major building construction projects at fit out stage across the GCC .................... 16
3
I. Trade analysis of stones in MENA region
The following section examines the import, export and re-export of stones in the major MENA countries. The section also highlights the major export and import partners for stone trade for each country. HS Code: 6802 (Worked monumental/building stone & art; mosaic cube, granules) has been used for the trade analysis.
UAE trade analysis
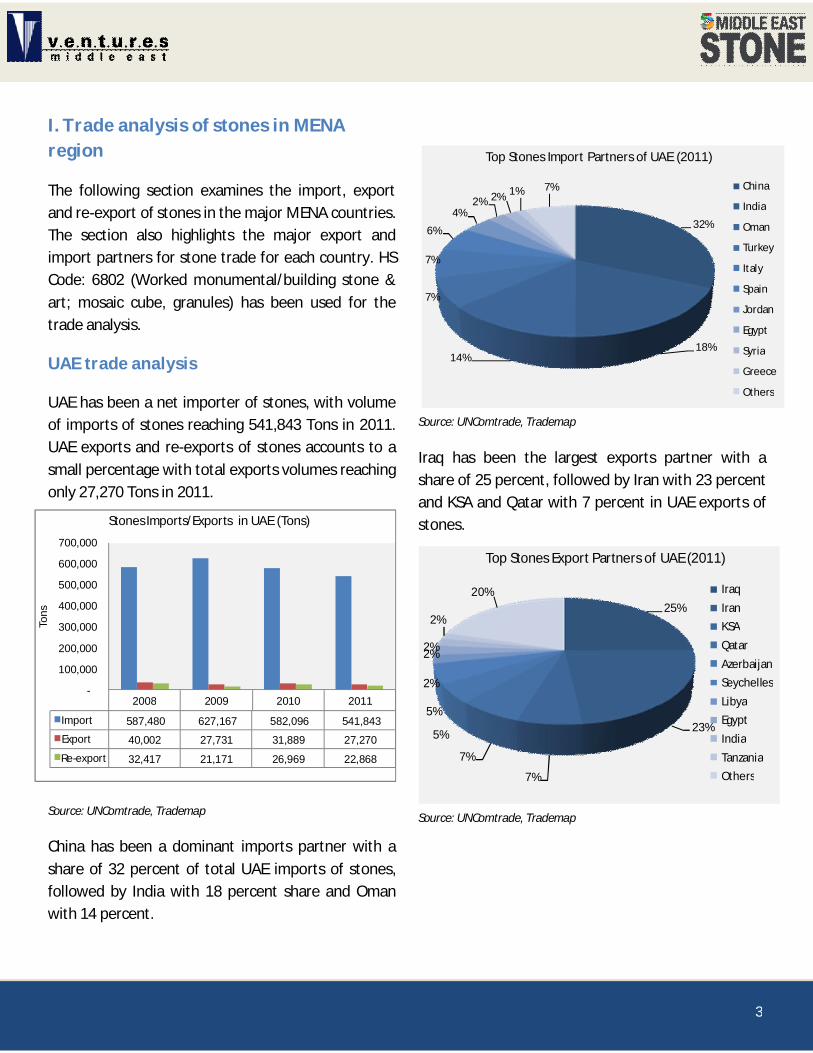
UAE has been a net importer of stones, with volume of imports of stones reaching 541,843 Tons in 2011. UAE exports and re-exports of stones accounts to a small percentage with total exports volumes reaching only 27,270 Tons in 2011.
Source: UNComtrade, Trademap
China has been a dominant imports partner with a share of 32 percent of total UAE imports of stones, followed by India with 18 percent share and Oman with 14 percent.
Source: UNComtrade, Trademap
Iraq has been the largest exports partner with a share of 25 percent, followed by Iran with 23 percent and KSA and Qatar with 7 percent in UAE exports of stones.
Source: UNComtrade, Trademap
2008 2009 2010 2011
Import 587,480 627,167 582,096 541,843
Export 40,002 27,731 31,889 27,270
Re-export 32,417 21,171 26,969 22,868
-
100,000
200,000
300,000
400,000
500,000
600,000
700,000
Tons
Stones Imports/Exports in UAE (Tons)
32%
18%14%
7%
7%
6%
4%2% 2% 1% 7%
Top Stones Import Partners of UAE (2011)
China
India
Oman
Turkey
Italy
Spain
Jordan
Egypt
Syria
Greece
Others
25%
23%
7%
7%
5%
5%
2%
2%2%
2%
20%
Top Stones Export Partners of UAE (2011)
IraqIranKSAQatarAzerbaijanSeychellesLibyaEgyptIndiaTanzaniaOthers

4
KSA trade analysis
KSA imports reflected an increasing trend from 249,726 Tons in 2010 to 378,574 Tons in 2013. Exports registered a sharp increase in 2013 reaching 213,956 Tons compared to 58,502 Tons in 2012.
Source: UNComtrade, Trademap
In 2013, Jordan was the largest import partner with an exorbitant share of 58 percent, followed by China and Syria with a share of 14 percent each.
Source: UNComtrade,Trademap
China and UAE were the major partners of KSA for stones exports with a share of 37 percent and 33 percent respectively in 2013.
Source: UNComtrade, Trademap
Qatar trade analysis
Qatar imports of stones shrank in volume in 2012, with stones imports reducing to 321,463 Tons from 498,302 Tons in 2011. However, imports registered a reviving trend in 2013 with imports increasing to 367,723 Tons. Export of stones from Qatar was marginal compared to imports which accounted to 568 Tons in 2013.
Source: UNComtrade, Trademap
58%
14%
14%
3%2%
2% 2% 2% 1% 1%1%
Top Stones Import Partners of KSA (2013)
JordanChinaSyriaPalestineSpainItalyPortugalUAEIndia
OmanOthers 2010 2011 2012 2013
Import 283,999 498,302 321,463 367,723
Export 1,146 1,682 614 568
Re-export - - 589 -
-
100,000
200,000
300,000
400,000
500,000
600,000
Tons
Stones Imports/Exports in Qatar (Tons)
2010 2011 2012 2013
Import 249,726 278,880 337,831 378,574
Export 57,503 22,600 58,502 213,956
Re-export 11,673 5,963 3,461 2,358
-
50,000
100,000
150,000
200,000
250,000
300,000
350,000
400,000
Tons
Stones Imports/Exports in KSA (Tons)
37%
33%
11%
7%4%
3%1% 1% 1% 1% 1%
Top Stones Export Partners of KSA (2013)
China
UAE
Qatar
Kuwait
USA
Jordan
Senegal
Lebanon
Bahrain
Taipei
Others

5
29 percent of imports of stones to Qatar came from China, 12 percent from UAE, 9 percent from Syria, and 8 percent from Italy. Spain, Oman and KSA followed with 7 percent, 6 percent and 6 percent respectively.
Source: UNComtrade, Trademap
91 percent of the stones from Qatar were exported to other GCC countries itself such as KSA, Bahrain, UAE and Kuwait. The remaining small percentage was exported to UK, USA, Turkey, Thailand etc.
Source: UNComtrade, Trademap
Oman trade analysis
Apart from other GCC countries, Oman is a net-exporter of stones with exports indicating an
increasing trend since 2011. Exports grew from 183,819 Tons in 2011 to 249,882 Tons in 2013, out of which re-exports accounts to only small percentage.
Source: UNComtrade, Trademap
UAE dominated Oman’s imports with a share of 49 percent, followed by China at 27 percent and India at 13 percent.
Source: UNComtrade, Trademap
KSA and UAE were the major export partners of Oman together accounting to 61 percent share in 2013. Korea and Singapore followed with a share of 6 percent and 5 percent respectively.
29%
12%
9%8%
7%
6%
6%
5%
5%4%
9%Top Stones Import Partners of Qatar (2013)
China
UAE
Syria
Italy
Spain
Oman
KSA
Jordan
India
Turkey
Others
49%
27%
13%
2%2%
2% 1% 1% 1% 2%
Top Stones Import Partners of Oman (2013)
UAE
China
India
Turkey
Italy
Pakistan
Spain
KSA
Portugal
Others
32%
29%
18%
12%3%
2% 1% 1% 1% 0.4%0.2%
Top Stones Export Partners of Qatar (2013)
KSABahrainUAEKuwaitUKUSATurkeyThailandLebanonOmanOthers
2010 2011 2012 2013
Import 59,129 51,794 64,827 73,298
Export 224,559 183,819 194,428 249,882
Re-export 229 383 429 607
-
50,000
100,000
150,000
200,000
250,000
300,000
Tons
Stones Imports/Exports in Oman (Tons)
6
Source: UNComtrade, Trademap
Kuwait trade analysis
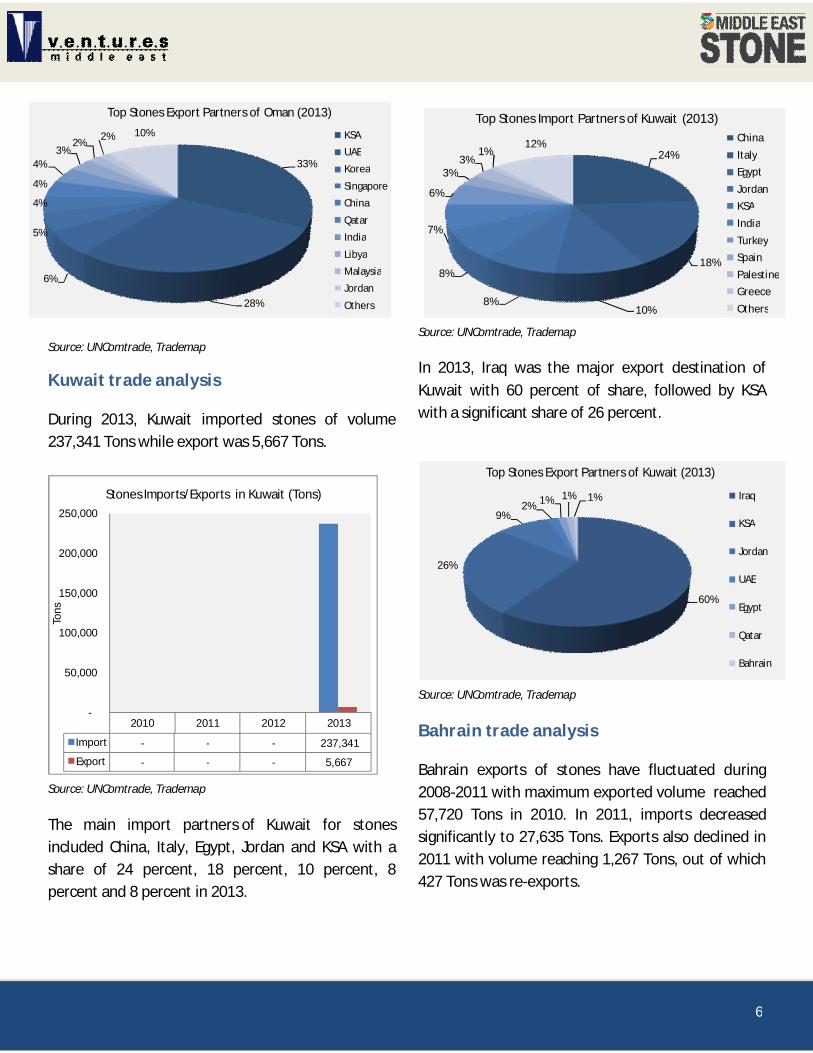
During 2013, Kuwait imported stones of volume 237,341 Tons while export was 5,667 Tons.
Source: UNComtrade, Trademap
The main import partners of Kuwait for stones included China, Italy, Egypt, Jordan and KSA with a share of 24 percent, 18 percent, 10 percent, 8 percent and 8 percent in 2013.
Source: UNComtrade, Trademap
In 2013, Iraq was the major export destination of Kuwait with 60 percent of share, followed by KSA with a significant share of 26 percent.
Source: UNComtrade, Trademap
Bahrain trade analysis
Bahrain exports of stones have fluctuated during 2008-2011 with maximum exported volume reached 57,720 Tons in 2010. In 2011, imports decreased significantly to 27,635 Tons. Exports also declined in 2011 with volume reaching 1,267 Tons, out of which 427 Tons was re-exports.
2010 2011 2012 2013
Import - - - 237,341
Export - - - 5,667
-
50,000
100,000
150,000
200,000
250,000
Tons
Stones Imports/Exports in Kuwait (Tons)
24%
18%
10%8%
8%
7%
6%
3%3%
1%12%
Top Stones Import Partners of Kuwait (2013)ChinaItalyEgyptJordanKSAIndiaTurkeySpainPalestineGreeceOthers
60%
26%
9%2% 1% 1% 1%
Top Stones Export Partners of Kuwait (2013)
Iraq
KSA
Jordan
UAE
Egypt
Qatar
Bahrain
33%
28%
6%
5%
4%
4%
4%3%
2% 2% 10%
Top Stones Export Partners of Oman (2013)
KSA
UAE
Korea
Singapore
China
Qatar
India
Libya
Malaysia
Jordan
Others

7
Source: UNComtrade, Trademap
China was the leading import partner for Bahrain stones, with a share of 38 percent in 2011. Other major import partners were India, Italy, Turkey and Spain with a share of 12 percent, 10 percent, 9 percent and 7 percent.
KSA was the first export market for Bahrain in terms of stones export with a share of 46 percent, followed by Qatar at a share of 40 percent. These two export market accounted to 86 percent of the total exports from the region.
Source: UNComtrade, Trademap
Egypt trade analysis
Egypt was a net-exporter of stones; however both exports and imports witnessed a sharp increase since 2011. Volume of stones exports and imports was 995,191 Tons and 602,682 Tons respectively in 2013.
Source: UNComtrade, Trademap
India was the dominant import partner of Egypt and supplied 96 percent of the stones imports in 2013.
2008 2009 2010 2011
Import 52,738 42,900 57,720 27,635
Export 3,114 2,251 4,396 1,267
Re-export 428 374 486 427
-
10,000
20,000
30,000
40,000
50,000
60,000
70,000
Tons
Stones Imports/Exports in Bahrain (Tons)
2010 2011 2012 2013
Import 15,859 11,887 29,037 602,682
Export 267,615 52,893 254,463 995,191
-
200,000
400,000
600,000
800,000
1,000,000
1,200,000
Tons
Stones Imports/Exports in Egypt (Tons)
38%
12%10%
9%
7%
6%
6%3%
2% 1% 6%Top Stones Import Partners of Bahrain (2011)
ChinaIndiaItalyTurkeySpainOmanKSASyriaUAEGreeceOthers
46%
40%
9%2% 1% 1% 1%
Top Stones Export Partners of Bahrain (2011)KSA
Qatar
India
Area Not Else Where SpecifiedUAE
Oman
Others
Source: UNComtrade, Trademap

8
The remaining small percentage was supplied by China, Italy, France, Oman, Spain and Turkey.
Source: UNComtrade, Trademap
China and Libya were the leading export markets for stones from Egypt accounting to 38 percent and 35 percent respectively in 2013. Egypt exported 377,788 Tons and 352,767 Tons of stones to China and Libyan markets respectively.
Source: UNComtrade, Trademap
Jordan trade analysis
Jordan was a net exporter of stones with exports maintaining an increasing trend during 2010-2013.
Export volume reached 296,977 Tons in 2013 from 254,525 Tons in 2010.
Source: UNComtrade, Trademap
China was the largest import partner. It accounted to 33 percent of the total imports in 2013, followed by Palestine (29 percent), Egypt (12 percent), India (9 percent) and KSA (6 percent).
Source: UNComtrade, Trademap
In 2013, KSA was Jordan's most important export partner with a total export share of 71 percent, while
2010 2011 2012 2013
Import 107,287 92,656 101,520 116,596
Export 254,525 261,642 288,406 296,977
Re-export 568 1,115 1,268 565
-
50,000
100,000
150,000
200,000
250,000
300,000
350,000
Tons
Stones Imports/Exports in Jordan (Tons)
33%
29%
12%
9%
6%4%
3%1% 1% 1%
1%
Top Stones Import Partners of Jordan (2013)
China
Palestine
Egypt
India
KSA
Oman
Spain
Syria
UAE
Brazil
Others
38%
35%
7.1%
4.4%
2.4%1.6%
1.2%1% 1% 1% 7%
Top Stones Export Partners of Egypt (2013)
China
Libya
KSA
Lebanon
Kuwait
Jordan
UAE
USA
Algeria
Palestine
Others
96%
2%0.4%
0.4% 0.3% 0.3%0.2%
Top Stones Import Partners of Egypt (2013)
India
China
Italy
France
Oman
Spain
Turkey

9
UAE holds a distant second place with a share of 12 per cent.
Source: UNComtrade, Trademap
Algeria trade analysis
Despite a positive trend, Algeria imports of stones had fluctuated during 2010-2013. The maximum export volume was in 2013, when it reached 122,758 Tons. Export of stones from Algeria has been negligible. The total export volume of stone was only 1 Ton in 2013, which was exported to Italy.
China has the largest share of Algerian import pie, accounting for 37 percent of the total imported volume in 2013. It is followed by India (15 percent), Turkey (14 percent), Egypt (10 percent), Spain (10 percent) and Italy (9 percent).
37%
15%14%
10%
10%
9%1% 1% 3%
Top Stones Import Partners of Algeria (2013)China
India
Turkey
Egypt
Spain
Italy
PortugalOman
Source: UNComtrade, Trademap
Libya trade analysis
From 2007 to 2010, Libyan imports of stones showed an increasing trend. In 2010, Libya’s imports of stone increased enormously to reach 316,907 Tons from 92,696 Tons in 2009.
Source: UNComtrade, Trademap
2010 2011 2012 2013
Import 76,861 97,334 93,076 122,758
Export 44 0.3 1 1
Re-export - - - -
-
20,000
40,000
60,000
80,000
100,000
120,000
140,000
Tons
Stones Imports/Exports in Algeria (Tons)
2007 2008 2009 2010
Import 28,201 30,419 92,696 316,907
Export - - - -
-
50,000
100,000
150,000
200,000
250,000
300,000
350,000
Tons
Stones Imports/Exports in Libya (Tons)
71%
12%
9%4%
1%1% 1% 1%
Top Stones Export Partners of Jordan (2013)
KSA
UAE
Qatar
Kuwait
Israel
Oman
Iraq
Others
Source: UNComtrade, Trademap

10
2010 2011 2012 2013
Import 173,504 190,113 194,993 192,018
Export 1,974 1,935.6 1,873 2,918
Re-export - - - -
-
50,000
100,000
150,000
200,000
250,000
Tons
Stones Imports/Exports in Morocco (Tons)
Major source of import of stones to Libya was Turkey covering 67 percent of the import volume in 2010. China and Italy contributed 16 percent and 5 percent respectively to the import pie in 2010.
Source: UNComtrade, Trademap
Morocco trade analysis
Stones imports to Morocco totaled 192,018 Tons in 2013. The import of stones depicted a stable trend since 2011, even though there was a marginal decline of 1.5 percent in import volume in 2013 when compared to 2012.
Source: UNComtrade, Trademap
Spain and Italy accounted to 80 percent of the stones import volume to Morocco in 2013. Other import partners were China (5 percent), Turkey (4 percent), Egypt (3 percent), Portugal (3 percent), India (3 percent) and others.
Source: UNComtrade, Trademap
The largest export markets for stones in 2013 were Kuwait (11 percent), Guinea (11 percent), UAE (9 percent), Italy (8 percent), Spain (7 percent) and Brazil (6 percent).
Source: UNComtrade, Trademap
67%
16%
5%2% 2%2% 1% 1% 1% 1%
2%
Top Stones Import Partners of Libya (2010) Turkey
China
Italy
UK
Spain
India
Canada
Portugal
Tunisia
Europe Othr. Nes
Others
47%
33%
5%4%
3%3% 2% 1% 1% 1%
Top Stones Import Partners of Morocco (2013)
Spain
Italy
China
Turkey
Egypt
Portugal
India
Greece
France
Others
11%
11%
9%
8%
7%
6%5%4%
3%3%
33%
Top Stones Export Partners of Morocco (2013)
Kuwait
Guinea
UAE
Italy
Spain
Brazil
France
Algeria
Mauritania
Portugal
Others

11
Syria trade analysis
In 2008, Syria’s total export volume was more 451,070 Tons. By 2010, the volume dropped to 249,736 Tons. Meanwhile, import volume registered an increasing trend even though the volume is low when compared to exports.
Source: UNComtrade, Trademap
UAE and India were the top import partners of Syria for stones in 2010 contributing to 29 percent and 20 percent of the share respectively. Other significant import sources include Oman (11 percent), China (11 percent), KSA (9 percent) and Jordan (6 percent).
Source: UNComtrade, Trademap
Lebanon was the largest export-trading partner for Syria, and in 2010 bought 27 percent of the total export volume of stones. Other key buyers of Syria’s stone products were UAE (15 percent), Kuwait (15 percent) and KSA (15 percent).
Source: UNComtrade, Trademap
Iran trade analysis
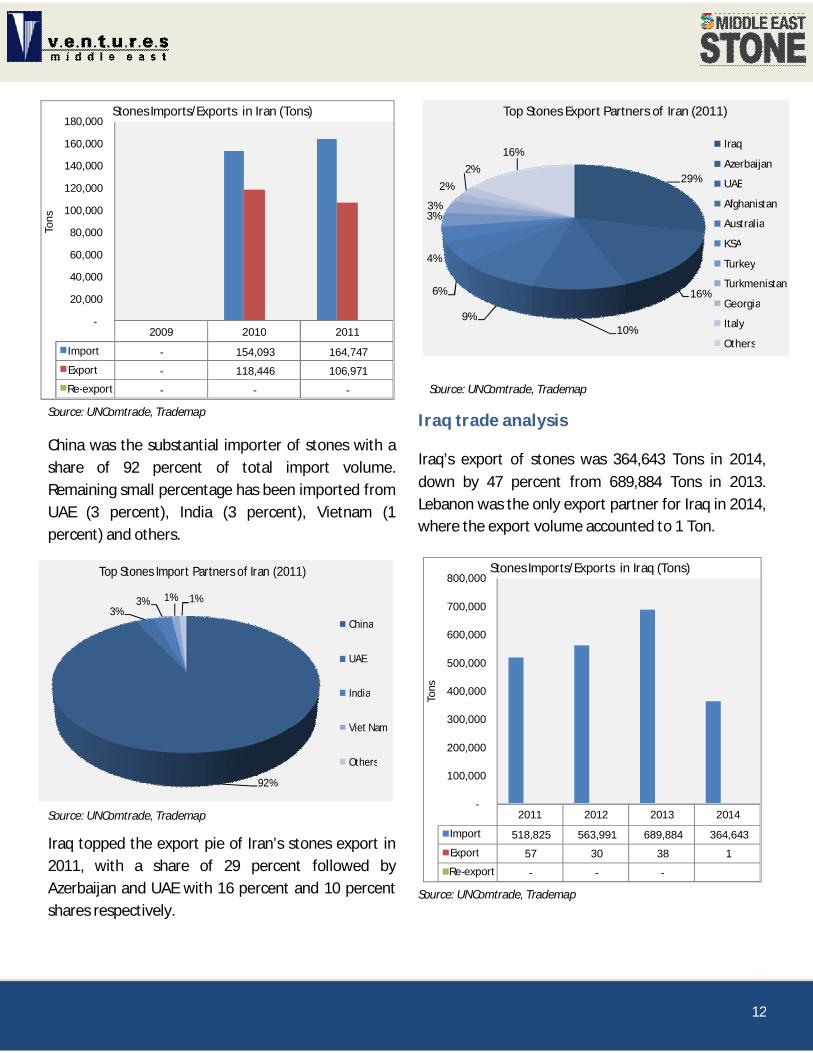
Iran’s import increased from 154,093 Tons in 2010 to 164,747 Tons in 2011 at a year-on year growth of 7 percent. Meanwhile, exports plummeted from 118,446 Tons in 2010 to 106,971 Tons in 2011.
27%
15%
15%
15%
9%
5%4%
2%1% 1% 6%
Top Stones Export Partners of Syria (2010)
Lebanon
UAE
Kuwait
KSA
Qatar
Greece
Cyprus
Iraq
Jordan
Bahrain
Others
2007 2008 2009 2010
Import 4,355 8,261 11,656 13,755
Export 132,933 451,070 255,805 249,736
Re-export - - - -
-
50,000
100,000
150,000
200,000
250,000
300,000
350,000
400,000
450,000
500,000
Tons
Stones Imports/Exports in Syria (Tons)
29%
20%
11%
11%
9%
6%
4%4%
2% 1% 3%
Top Stones Import Partners of Syria (2010)
UAE
India
Oman
China
KSA
Jordan
Lebanon
Egypt
Brazil
Italy
Others
12
Source: UNComtrade, Trademap
China was the substantial importer of stones with a share of 92 percent of total import volume. Remaining small percentage has been imported from UAE (3 percent), India (3 percent), Vietnam (1 percent) and others.
Source: UNComtrade, Trademap
Iraq topped the export pie of Iran’s stones export in 2011, with a share of 29 percent followed by Azerbaijan and UAE with 16 percent and 10 percent shares respectively.
29%
16%
10%9%
6%
4%
3%3%
2%2%
16%
Top Stones Export Partners of Iran (2011)
Iraq
Azerbaijan
UAE
Afghanistan
Australia
KSA
Turkey
Turkmenistan
Georgia
Italy
Others
Source: UNComtrade, Trademap
Iraq trade analysis
Iraq’s export of stones was 364,643 Tons in 2014, down by 47 percent from 689,884 Tons in 2013. Lebanon was the only export partner for Iraq in 2014, where the export volume accounted to 1 Ton.
2011 2012 2013 2014
Import 518,825 563,991 689,884 364,643
Export 57 30 38 1
Re-export - - -
-
100,000
200,000
300,000
400,000
500,000
600,000
700,000
800,000
Tons
Stones Imports/Exports in Iraq (Tons)
Source: UNComtrade, Trademap
92%
3%3% 1% 1%
Top Stones Import Partners of Iran (2011)
China
UAE
India
Viet Nam
Others
2009 2010 2011
Import - 154,093 164,747
Export - 118,446 106,971
Re-export - - -
-
20,000
40,000
60,000
80,000
100,000
120,000
140,000
160,000
180,000
Tons
Stones Imports/Exports in Iran (Tons)

13
In 2014, 98 percent of the stones were imported from Turkey which accounted to 358,029 Tons.
Source: UNComtrade, Trademap
Yemen trade analysis
Import of stones to Yemen has been increasing steadily between 2010 and 2013, however saw a drop in 2011 and has been recovering ever since. In 2013, Yemen’s stones export volume increased to 25,706 Tons, up from 23,017 Tons in 2012.
Source: UNComtrade, Trademap
In 2013, the top country for Yemen’s stones imports was China (81 percent) with total imported volume recording 20,861 Tons.
Source: UNComtrade, Trademap
China is Yemen's largest trading partner for both imports and exports in 2013. China accounted to 89 percent of the total imported volume, followed by UK and Jordan contributing smaller percentages to the import pie.
Source: UNComtrade, Trademap
Palestine trade analysis
Palestine exports increased from 2012 to 2013, from 148,143 Tons to 160,184 Tons. However, from 2011
89%
8%3%
Top Stones Export Partners of Yemen (2013)
China
UK
Jordan
2010 2011 2012 2013
Import 21,297 10,141 23,017 25,706
Export 708 520 1592 203
Re-export 7 18 18 -
-
5,000
10,000
15,000
20,000
25,000
30,000
Tons
Stones Imports/Exports in Yemen (Tons)
98%
1.5% 0.2% 0.04%0.03%
Top Stones Import Partners of Iraq (2014)
Turkey
Greece
Portugal
Korea
Lebanon81%
4%
4%3%
3% 2% 1% 2%
Top Stones Import Partners of Yemen (2013)
China
Egypt
Italy
Turkey
India
Oman
Portugal
Others

14
to 2012 there was a drop of 22 percent, from 190,444 Tons to 148,143 Tons.
Source: UNComtrade, Trademap
Israel was the major import partner of Palestine in 2013, it accounted for more than 86 percent of volume of imports.
Source: UNComtrade, Trademap
Israel was also the largest export destination for stones from Palestine and totaled to 92 percent of the export share.
Source: UNComtrade, Trademap
II. Key news on GCC stones industry
New sustainability standards announced for natural stone
Source: http://www.stoneworld.com/articles/88040-new-sustainability-standards-announced-for-natural-stone
Tough new sustainability standards for natural stone were recently announced by the Natural Stone Council (NSC), which said they would level the playing field between man's oldest building material and other building components. The product of nearly five years in the development stage, the new standard, called "ANSI/NSC-373, Sustainable Production of Natural Dimension Stone" will allow quarriers, processors and fabricators of natural stone who consistently meet or exceed the standards to label and promote their stone products as "certified Genuine Stone". The associated Chain of Custody standard is a companion document that tracks the material as it moves from the quarry through manufacturing and through the supply chain to the ultimate destination, including the jobsite or
86%
5%4%
1% 1% 1% 1%1%
Top Stones Import Partners of Palestine (2013)
Israel
China
India
Turkey
Oman
Jordan
Brazil
Others
2010 2011 2012 2013
Import 103,360 113,976 97,360 92,486
Export 130,043 190,444 148,143 160,184
Re-export 1,847 12,527 1,532 1,702
-20,000
40,000
60,000
80,000
100,000 120,000
140,000
160,000
180,000 200,000
Tons
Stones Imports/Exports in Palestine (Tons)
92%
6% 1% 1%
Top Stones Export Partners of Palestine (2013)
Israel
Jordan
Kuwait
Others

15
the end user. Distributors can obtain certification under the Chain of Custody protocols.
Plan to re-use 30m tonnes of construction waste
Source:http://thepeninsulaqatar.com/news/qatar/288871/plan-to-re-use-30m-tonnes-of-construction-waste
Qatar is looking to re-cycle and re-use the huge collection of construction waste stored at various parts of the country. Qatar Authority for Standards and Specifications at the Ministry of Environment yesterday discussed with officials and private agencies the possibility of re-using used rubble, bricks, stones and concrete blocks for new projects by adhering to the government’s construction quality standards. Ministry officials said an estimated 30m tonnes of waste are being stored in the Rowdat Rashid storage area. This waste could be effectively recycled and re-used for new projects, including buildings, road constructions and making hollow bricks. This would not only help reduce imports of primary construction materials significantly but will also help clean the environment.
Saudi Binladin buys 50% stake in Italian company
Source:http://www.constructionweekonline.com/article-29383-saudi-binladin-buys-50-stake-in-italian-company/
One of Saudi Arabia’s largest construction companies, Saudi Binladin Group (SBG), has announced that one of its divisions has bought a 50% stake in Italian marble manufacturer Marmi di Carrara in a deal worth $61mn.
SBG’s Saudi Marble & Granite Factory Company already has close ties with the Tuscan firm, having
bought around a fifth of the company’s output last year.
Among the projects that Saudi Marble & Granite has worked on include ministry buildings and palaces in Saudi Arabia, as well as Dubai International Airport, Abu Dhabi International Airport and New Delhi Airport.
According to the company’s website, Saudi Marble & Granite already produces 100,000m3 of marble and granite from 14 quarries across the kingdom.

16
III. Major building construction projects at fit out stage across the GCC
SI Project Name Country Client Consultant Contractor
Est. Value in USD
Mn
Construction Completion
1
Abu Dhabi Airport Expansion - Midfield Terminal
UAE Abu Dhabi Airports Co. (ADAC)
Kohn Pedersen Fox Associates (KPF)
Consolidated Contractors International Company (CCC) / Arabtec Construction / Tepe Akfen Ventures (TAV)
2,942 Q2, 2017
2 Pearl Dubai in Tecom UAE Pearl Dubai FZ LLC
Middle East Engineering Consultants (MEECON) / Le Gris Designers
Al Habtoor Leighton (HLG) 2,016 Q4, 2017
3
Viceroy Hotels, Resorts & Residences in Palm Jumeirah
UAE SKAI Holdings Ltd LLC
Engineering Consultants Group (ECG) / Palm & Turner Architects
China State Construction & Engineering Corporation (CSCEC)
1,000 Q4, 2016
4
Damac Towers by Paramount in Downtown Dubai
UAE Damac Properties, Dubai / Paramount Hotels & Resorts
Conin Incorporated Consultants / Khatib & Alami Consolidated Engineering Company
Tepe Akfen Ventures (TAV) 1,000 Q4, 2016
5
Concourse 4 in Dubai International Airport
UAE Dubai Aviation Engineering Projects (DAEP)
Dar Al Handasah Consultants (Shair and Partners)
Al Jaber Engineering and Contracting (ALEC) 816 Q2, 2015
6
The Louvre Museum on Saadiyat Island
UAE
Tourism Development & Investment Co. (TDIC)
Buro Happold, Dubai / Pascall & Watson (UK) / Ateliers Jean Nouvel, France
Constructora San Josa SA / Oger Abu Dhabi / Arabtec Construction
653 Q4, 2015
7
Al Habtoor City (Al Habtoor Palace) - St. Regis, Westin & W Hotel
UAE Al Habtoor Group
Khatib & Alami Consolidated Engineering Company, Dubai / Atkins, Dubai
Al Habtoor Leighton (HLG) 515 Q3, 2016
8
Dubai Design District (D3) - Phase 1 (11 Buildings)
UAE Tecom Investments
Woods Bagot / Kling Consult
Amana Contracting & Steel Buildings Company 504 Q1, 2015
9 The Onyx on Sheikh Zayed Road
UAE Ishraqah Development / Zahran Group
KEO International Consultants / Adnan Saffarini
Al Shafar General Contracting (ASGC) 500 Q4, 2015
10 Presidential Palace in Corniche
UAE Presidential Court
Ewan Architectural Engineering Consultancy / WSP Middle East Architectural &
Consolidated Contractors International Company (CCC) / Ghantoot Contracting
490 Q2, 2015
17
Engineering Consultancy
11
Opus Development in Business Bay
UAE Omniyat Properties
Brewer Smith & Brewer Gulf (BSBG)
Brookfield Multiplex 463 Q2, 2015
12 Dusit Thani on Palm Jumeirah
UAE Al Osaimi Group
Khatib & Alami Consolidated Engineering Company, Sharjah
Omis Contracting 409 Q3, 2015
13
National Guard - Housing Units - Phase 2
KSA Saudi National Guard
Dar Al Handasah Consultants (Shair and Partners), Riyadh / Saudi National Guard
Saudi Binladin Group 3,600 Q3, 2015
14
King Abdulaziz International Airport Expansion - Main Terminal Package - Phase 1
KSA
General Authority for Civil Aviation (GACA), Saudi Arabia
Aeroports de Paris Ingenierie (ADPI) / Atkins / Dar Al Handasah Consultants (Shair and Partners)
Saudi Binladin Group 3,013 Q1, 2015
15
Grand Mosque Expansion in Makkah
KSA
The High Commission For The Development of Makkah Province / General Presidency for affairs of the Prophet's Mosque
Dar Al Handasah Consultants (Shair and Partners)
Saudi Binladin Group 2,500 Q4, 2016
16
Prince Mohammad Bin Abdulaziz Airport Expansion in Madina - Phase 1
KSA
General Authority for Civil Aviation (GACA), Saudi Arabia / Tibah Airports Operation Company
Zuhair Fayez Partnership Consultants / Halcrow Group Ltd
Saudi Oger, / Al Rajhi Holding / TAV Airports 2,406 Q1, 2015
17
Stations for Makkah - Madina (Haramain) Railway Link - Phase 1 (Package 2)
KSA Saudi Railways Organization (SRO)
URS Corporation, Abu Dhabi / Atkins, Dubai / Dar Al Handasah Consultants (Shair and Partners), Makkah / Foster + Partners, UK (Foster & Partners) / Saudi Consulting Services (SaudConsult), Riyadh / Saudi Consolidated Engineering Company (Khatib & Alami),
Saudi Binladin Group / Saudi Oger / El Seif Engineering Contracting Company (ESEC) / Yapi Merkezi
2,400 Q2, 2015
18 Jeddah Kingdom KSA Kingdom Holding
Company Hyder Consulting / Arup, UK / Langan Saudi Binladin Group 1,500 Q4, 2018
18
Tower International
19
Expansion of Makkah Holy Haram - Mataaf Circle
KSA General Presidency of Holy Mosques Affairs
- Saudi Binladin Group 1,000 Q3, 2015
20
Expansion of Makkah Holy Haram - Eastern & Western Sides
KSA
General Presidency for affairs of the Prophet's Mosque / Madina Development Authority
Dar Al Handasah Consultants (Shair and Partners), Makkah
Saudi Binladin Group 1,000 Q4, 2015
21 Jabal Omar Development - Phase 1
KSA
Jabal Omar Development Company / Hilton International / Hyatt Regency / Marriott International; Global Sales Middle East & Africa / Mercure Hotels / Resta Hotels & Resorts / Sofitel Hotels
Saudi Consolidated Engineering Company (Khatib & Alami) / Dar Al Handasah Consultants (Shair and Partners) / Design & Construction Engineering (DEC) / Consolidated Consultants, Jordan
Nesma & Partners Contracting Company 908 Q3, 2015
22 Sidra Medical & Research Centre
Qatar
Qatar Foundation for Education Science & Community Development
Ellerbe Beckett
Consolidated Contractors Company (CCC) / Midmac Contracting / Contrack International / Obrascon Huarte Lain SA (OHL), Spain
2,400 Q3, 2015
23 Doha Festival City Qatar
Bawabat Al-Shamal / Al Futtaim Group / Qatar Islamic Bank / Aqar Real Estate Development Company
Arab Engineering Bureau (AEB)
Qatari Arabian Construction Company / Amana Contracting and Steel Buildings
1,650 Q4, 2017
24
Doha Convention Centre & Tower Project
Qatar
Qatari Diar Real Estate Investment Company (QDREIC) / Barwa Real Estate Company, Qatar
- Midmac Contracting / Six Construct 1,350 Q4, 2017
25 Qatar Petroleum District
Qatar
Barwa Real Estate Company, Qatar / Qatar Petroleum (QP)
KEO International / AECOM
Al Jaber Engineering / Midmac Contracting / Bouygues Construction
1,300 Q1, 2016
26 Mall of Qatar Qatar -
KEO International Consultants / Chapman Taylor, UK
Urbacon Construction 824 Q4, 2016
27 NDIA - North Node - Phase 3a
Qatar NDIA Steering Committee - Midmac Contracting / Six
Construct 745 Q3, 2015
28
Msheireb Downtown Doha - Phase 3
Qatar Msheireb Properties
Buro Happold / Gensler / Atelier Ten
HBK Contracting / Obayashi 669 Q1, 2016

19
29
Msheireb Downtown Doha - Phase 2
Qatar Msheireb Properties
Buro Happold / Gensler / Atelier Ten
Arabtec Construction 630 Q4, 2015
30
Muscat International Airport - Passenger Terminal
Oman
Ministry of Transport & Communications, Oman
Hill International LLC
Bechtel / Bahwan Contracting Company (BCC) / Enka Teknik, Turkey
1,826 Q3, 2016
31
New Terminal at Salalah International Airport
Oman
Ministry of Transport & Communications, Oman
Hill International Galfar Engineering & Contracting / Larsen & Toubro (L&T) Limited
760 Q2, 2015
32 Resort at Sifah Oman
Muriya Tourism Development Company
- Lupp Middle East LLC 300 Q4, 2018
33
Omran Convention & Exhibition Centre - Phase 1 Package 2
Oman Ministry of Tourism, Oman / Omran Office
RMJM (Robert Mathew Johnson Marshall) Limited, UK / Dar SSH International Engineering Consultant (SSH International Consultants)
Carillion Alawi 201 Q4, 2016
34 The Wave - Kempinski Hotel
Oman
Kempinski Hotel, Ajman / Omani Hospitality Company
WSP Middle East Architectural & Engineering Consultancy
Carillion Alawi 200 Q4, 2015
35 Rimal Development in Baushar
Oman
Aqar (Al Khonji Real Estate & Development L.L.C.)
Panorama Engineering Consultancy
Al Binaa Construction L.L.C. 200 Q1, 2015
36 Multipurpose Complex at Bowsher
Oman Public Authority for Social Insurance (PASI)
Dar Al Handasah Consultants (Shair and Partners)
Carillion Alawi 182 Q4, 2015
37 Shaden Al Hail Oman Tilal Development
Company (TDC) PDW Architects, Indonesia Adhi Oman 150 Q2, 2016
38
Jaber Al Ahmed Al Sabah Hospital
Kuwait
Ministry of Health, Kuwait / Ministry of Public Works (MPW), Kuwait
Gulf Consult / Langdon Wilson Kuwait Arab Contractors 1,057 Q4, 2015
39
Jaber Al Ahmad Cultural Center
Kuwait Amiri Diwan Pan Arab Consulting Engineers (PACE)
Al Hani Construction & Trading Company 815 Q4, 2015
40
Sabah Al Salem University - College of Science and the Faculty Club (COSc)
Kuwait Kuwait University Construction Program (KUCP)
Gulf Consult / NBBJ, UK
Khalid Ali Al Kharafi & Brothers Company / China Metallurgical Group Corporation, China
638 Q2, 2016
41
Sabah Al Salem University - College of Business &
Kuwait Kuwait University Construction Program (KUCP)
Gulf Consult / Cambridge 7 and Associates (US)
Al Hani Construction & Trading Company / Sinohydro Corporation, China
495 Q1, 2016

20
College of Women (COBW)
42
Sabah Al Salem University - College of Engineering & Petroleum (COEP)
Kuwait Kuwait University Construction Program (KUCP)
Gulf Consult / Cambridge 7 and Associates (US)
Khalid Ali Al Kharafi & Brothers Company / China Metallurgical Group Corporation, China
490 Q2, 2016
43 Ministry of Education Headquarters
Kuwait
Ministry of Education, Kuwait / Ministry of Public Works (MPW), Kuwait
Cambridge 7 and Associates (US) / Gulf Consult / NBBJ
Mohammed Abdulmohsin Al Kharafi & Sons Company WLL 266 Q4, 2015
44 Burj Al Shaya Center Kuwait Al Shaya Group
KEO International / LG Consulting / Gensler Associates
Al Bahar Construction Company 260 Q1, 2016
45
Headquarters for Kuwait Investment Authority
Kuwait Kuwait Investment Authority KEO International First United General Trading &
Contracting Co. 258 Q3, 2016
46 Amwaj Waves - Phase 1 Bahrain Lona Real Estate
Davenport Campbell, Australia
Charilaos Apostilides (Dar Al Bahrain Contracting Company) 396 Q2, 2015
47 Four Seasons Hotel in Bahrain Bay
Bahrain Arcapita COWI Gulf A/S / Skidmore, Owings & Merrill (SOM)
Six Construct 150 Q4, 2015
48 Sukoon Tower in Juffair
Bahrain Al Mannai Trading & Investment Company Ltd.
Syrconsult Consulting Engineers
Panorama Contracting & Engineering Services Ltd. (Al Mannai Trading & Contracting)
138 Q4, 2015
49 Dragon City Bahrain
China Middle East Investment and Trade Promotion Centre (Chinamex) / Diyar Al Muharraq
Gulf House Engineering Nass Contracting 68 Q2, 2015
50
5-Star Hotel & Multi-storey Apartment at Bahrain Investment Wharf
Bahrain
V.K Universal Property Management Company
Future Engineering Consultants
Al Namal Construction Company (Saudi Delmon Contracting)
50 Q4, 2015
Source: Ventures Onsite Database (www.venturesonsite.com)