Final MENA GEN 2030.indd - UNICEF
110
MENA Investing in children and youth today to secure a prosperous region tomorrow GENERATION 2030
-
Upload
khangminh22 -
Category
Documents
-
view
0 -
download
0
Transcript of Final MENA GEN 2030.indd - UNICEF

MENA Investing in children and youth today to secure a prosperous
region tomorrow
GENERATION 2030

Cover photo:
A Syrian refugee girl in an informal tented settlement in Jordan.
© UNICEF/UN0229230/Herwig
All reasonable precautions have been taken by UNICEF to verify the information contained in this publication. For corrigenda subsequent to publication, please see www. unicef. org/publications.
© United Nations Children’s Fund (UNICEF)Division of Data, Research and PolicyApril 2019
https://www.unicef.org/mena/reports/mena-generation-2030
The designations employed in this publication and the presentation of the material do not imply on the part of the United Nations Children’s Fund (UNICEF) the expression of any opinion whatsoever concerning the legal status of any country or territory, or of its authorities or the delimitations of its frontiers.
A C K N O W L E D G E M E N T SCore report team Veera Mendonca, Momo Duehring, and Arthur van Diesen from UNICEF, Middle East North Africa Regional Office; and Jan Beise, Sinae Lee, Bin Lian, Anastasia Mshvidobadze, and Danzhen You from UNICEF Headquarters.
The report was co-authored by Elizabeth Dalling, in close collaboration with the core team.
Design Razan Al Sheikh.
Acknowledgements In addition to the collaboration between UNICEF Headquarters and the MENA Regional Office, this report has benefited from valuable contributions made by many colleagues throughout UNICEF. Particular thanks to Geert Cappelaere, Bertrand Bainvel, Roumiana Gantcheva, Adriana Vogelaar, Ider Dungerdorj, Buthaina Al-Iryani, Esmaeil Ibrahim, Anirban Chatterjee, Catherine Barnett, Juliette Touma, Tamara Kummer and Salim Oweis.
The authors are also thankful for the support and expertise provided by the following experts in refining the recommendations and strategic priorities for action: Niranjan Sarangi, First
Economic Affairs Officer, United Nations Economic and Social Commission for Western Asia; Catriona Purfield, Assistant Director, Middle East and Central Asia Department, International Monetary Fund; Rabah Arezki, Chief Economist, Middle East and North Africa, The World Bank Group; Tariq A.Haq, Senior Employment Specialist & Coordinator, International Labor Organization, Regional Office for Arab States/DWT-Beirut; Ghada Barsoum, Associate Professor, The American University in Cairo.
The authors are grateful to the United Nations Population Division for providing the estimates and projections that form the basis of the population analysis in this report.
This report represents a significant creative
and technical collaboration
between colleagues from UNICEF
Headquarters and the Regional Office for
the Middle East and North Africa.

MENA GENERATION 2030
2 8 28 766638
EXECUTIVE SUMMARY
INTRODUCTION
12
CHAPTER 1Demographic projections for MENA
CHAPTER 2The prospect of a demographic dividend in MENA
ANNEXESAnnex 1: Implications for education service provisionAnnex 2: Implications for school-to-work transitionAnnex 3: Additional country-specifi c data
CHAPTER 4Reaping the dividend in MENA: priority policy actions
CHAPTER 3Barriers to the dividend in MENA and implications for service provision

2 E X E C U T I V E S U M M A R Y
Executive summaryThe opportunity
During the first half of the twenty-first century, an unprecedentedly large proportion of the population in the Middle East and North Africa will transition into their most productive years, opening up the potential for a demographic dividend - economic growth spurred by demographic changes. The most favourable period for the region as a whole will be between 2018 and 2040, when the dependency ratio is predicted to be lowest. This temporary lowering of the dependency ratio of the population has the potential to increase shared wealth and facilitate an expansion of opportunities for all - but only under certain conditions.
Children and young people (0-24 year olds) in the Middle East and North Africa currently account for nearly half of the region’s population and have the potential to become agents of change, acting for a more prosperous and stable future for themselves and their communities, and playing their part in reaping the demographic dividend. But unleashing this potential requires urgent and significant investment to create opportunities for meaningful learning, social engagement and work, all of which are currently limited, particularly for young women and the most vulnerable.
The time to act is now. Due to a rapidly growing elderly population across the region, the window of opportunity to benefit from the demographic dividend will begin to close in the second half of the century.
The problem
A favourable age structure is essential. But other prerequisites for realising a demographic dividend such as political and social stability; inclusive and equitable economic and social policies; and expanded employment opportunities all face significant challenges in the region.1:
Political and social instability
The cost of conflict and violence in the Middle East and North Africa is enormous and exposes children, adolescents and youth to the risk of death and injury; violence at home and school; lack of access to education; uncertainty and loss of investment, especially in human capital. These and other factors contribute to the region achieving the world’s lowest level of youth civic engagement – a key driver of instability in its own right.
Inequitable economic and social policies
Most countries in the region continue to marginalise adolescents and youth, particularly young women, the poor, refugees and those living with disabilities. Overlapping deprivations in the areas of health, protection and education severely compromise the ability of adolescents and youth to reach their full potential and become productive members of society and the economy.
Limited employment opportunities
Youth unemployment in the region is currently the highest in the world. Education systems are failing to prepare adolescents and youth for the workplace, and markets are not generating urgently needed jobs.
1 See also: UNFPA, 2016. Shaping the Future: How Changing Demographics Can Power Human Development; World Bank Group. 2016. Global Monitoring Report 2015/2016: Development Goals in an Era of Demographic Change. World Bank, Washington, D.C.
E X E C U T I V E S U M M A R Y 3
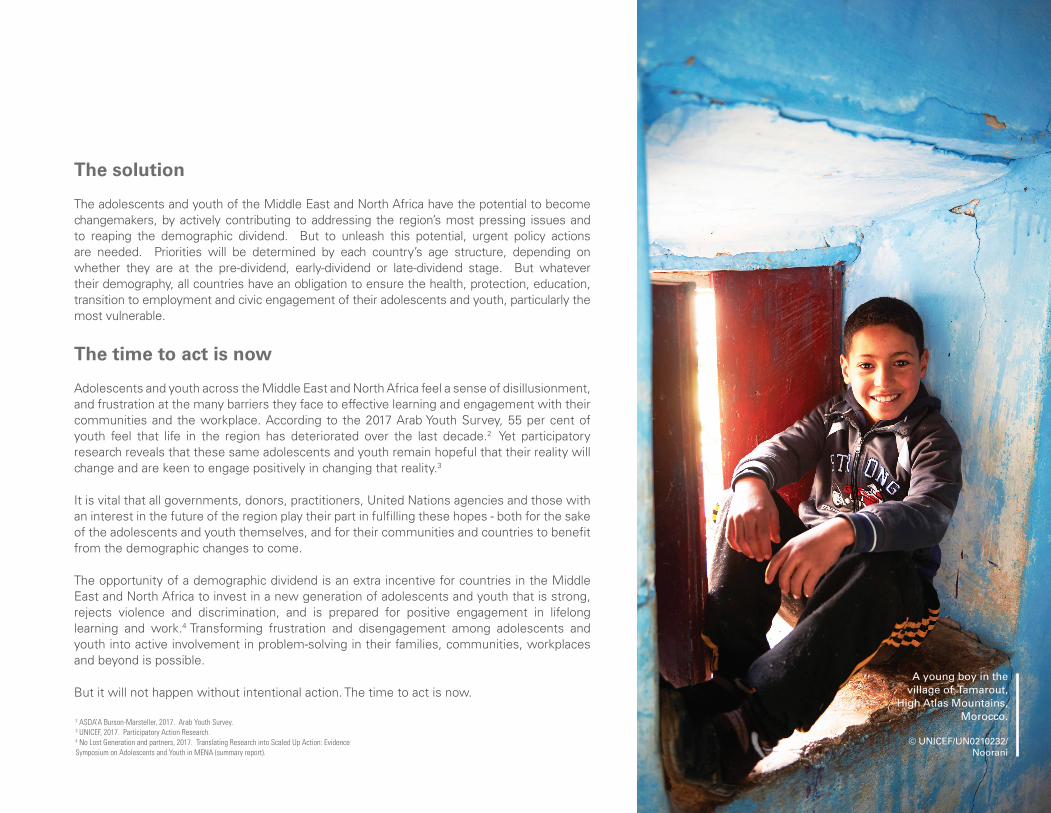
The solution
The adolescents and youth of the Middle East and North Africa have the potential to become changemakers, by actively contributing to addressing the region’s most pressing issues and to reaping the demographic dividend. But to unleash this potential, urgent policy actions are needed. Priorities will be determined by each country’s age structure, depending on whether they are at the pre-dividend, early-dividend or late-dividend stage. But whatever their demography, all countries have an obligation to ensure the health, protection, education, transition to employment and civic engagement of their adolescents and youth, particularly the most vulnerable.
The time to act is now
Adolescents and youth across the Middle East and North Africa feel a sense of disillusionment, and frustration at the many barriers they face to effective learning and engagement with their communities and the workplace. According to the 2017 Arab Youth Survey, 55 per cent of youth feel that life in the region has deteriorated over the last decade.2 Yet participatory research reveals that these same adolescents and youth remain hopeful that their reality will change and are keen to engage positively in changing that reality.3
It is vital that all governments, donors, practitioners, United Nations agencies and those with an interest in the future of the region play their part in fulfilling these hopes - both for the sake of the adolescents and youth themselves, and for their communities and countries to benefit from the demographic changes to come.
The opportunity of a demographic dividend is an extra incentive for countries in the Middle East and North Africa to invest in a new generation of adolescents and youth that is strong, rejects violence and discrimination, and is prepared for positive engagement in lifelong learning and work.4 Transforming frustration and disengagement among adolescents and youth into active involvement in problem-solving in their families, communities, workplaces and beyond is possible.
But it will not happen without intentional action. The time to act is now.
2 ASDA’A Burson-Marsteller, 2017. Arab Youth Survey. 3 UNICEF, 2017. Participatory Action Research. 4 No Lost Generation and partners, 2017. Translating Research into Scaled Up Action: Evidence Symposium on Adolescents and Youth in MENA (summary report).
A young boy in the village of Tamarout,
High Atlas Mountains, Morocco.
© UNICEF/UN0210232/Noorani

4 M E N A G E N E R AT I O N 2 0 3 0
Contents Executive summary .................................................................................................................................................................................................................Figures and tables ....................................................................................................................................................................................................................Acronyms and abbreviations ...................................................................................................................................................................................................Introduction ..............................................................................................................................................................................................................................Purpose and structure of the report ........................................................................................................................................................................................ Who we are talking about: children, adolescents and youth ................................................................................................................................................ Why demographic projections matter: the demographic dividend .....................................................................................................................................What we know so far: data sources and reliability ................................................................................................................................................................
1. Demographic projections for MENA Total population ........................................................................................................................................................................................................................Women of reproductive age and fertility ................................................................................................................................................................................Mortality (including child mortality) and life expectancy .....................................................................................................................................................Children and youth ...................................................................................................................................................................................................................Density and urbanisation .........................................................................................................................................................................................................Migration and forced displacement ........................................................................................................................................................................................
2. The prospect of a demographic dividend in MENA The demographic dividend: a window of opportunity .......................................................................................................................................................... Working age and dependent populations ...............................................................................................................................................................................Youth and gender in the labour market ..................................................................................................................................................................................
3. Barriers to the dividend in MENA and implications for service provisionBarriers related to political and social stability ......................................................................................................................................................................Barriers related to inclusive and equitable economic and social policy ..............................................................................................................................Barriers related to expanded employment opportunities .....................................................................................................................................................Implications for basic service provision .................................................................................................................................................................................
4. Reaping the dividend in MENA: priority policy actions Different countries, different challenges and opportunities .................................................................................................................................................Boosting the demographic dividend by investing in basic services ....................................................................................................................................Facilitating the school-to-work transition for all ....................................................................................................................................................................A double dividend? The economic benefits of peace ............................................................................................................................................................A triple dividend? Unlocking the potential of girls and women ...........................................................................................................................................
Annexes: Barriers to the dividend in MENA and implications for service provisionAnnex 1: Implications for education service provision .........................................................................................................................................................Annex 2: Implications for school-to-work transition .............................................................................................................................................................Annex 3: Additional country-specific data .............................................................................................................................................................................
256889910
1 2161920222526
28303135
3840434850
666869707273
76788284

M E N A G E N E R AT I O N 2 0 3 0 5
11172021222324323233343536363745515354555657586061
626364
FiguresFigure 1 Number of children (0-17 years), adolescents (10- 19 years), and youth (15-24 years) by country, 2015, 2030 and 2050 (in millions) .................Figure 2 Changes in total population from 2015 to 2030 and 2050 ...........................................................................................................................................Figure 3 Total fertility rate in MENA region by country, 2015, 2030 and 2050 .......................................................................................................................Figure 4 Estimated under-five mortality rates in MENA region by country, 1990 and 2015 .................................................................................................Figure 5 Estimated and projected life expectancy at birth in MENA region by country, 2015, 2030 and 2050 ....................................................................Figure 6 Percentage of total population represented by children, adolescents and youth (0-24 years), by country 2000-2050 .........................................Figure 7 Changes in youth population (15-24 years) from 2015 to 2030 and 2050 .................................................................................................................Figure 8 Composition of the total dependency ratio (child dependency ratio and old-age dependency ratio) for the MENA region, 1950-2100 ............Figure 9 Population of MENA by age and sex, 2015 (darker) and 2050 (lighter) ....................................................................................................................Figure 10 Countries in Middle East and North Africa by demographic type (1990-2085) ....................................................................................................Figure 11 Population by age and sex for selected countries in MENA in different demographic stages, 2015 (darker) and 2050 (lighter) .......................Figure 12 Annual increase of youth population (15-24 years) in MENA region, 2015-2050 .....................................................................................................Figure 13 Youth labour force participation rate and demographic type by country, 2015 .......................................................................................................Figure 14 Female to male labour force participation ratio and demographic type by country, 2015 ...................................................................................Figure 15 Youth not in education, employment or training (NEET) in selected countries (per cent) ......................................................................................Figure 16 Percentage of women aged 20 to 24 years who were first married or in union before age 15 and before age 18, by country ...........................Figure 17 Number of health service providers (doctors, nurses and midwives) for each scenario (in thousands) ..............................................................Figure 18 Proportional increase in school-age population between 2015 and 2030, by education level and country demographic stage ........................Figure 19 Quantitative increase in school-age population between 2015 and 2030 (in thousands), by education level and country demographic stageFigure 20 Quantitative increase in school-age population between 2015 and 2030 (in thousands), by country....................................................................Figure 21 Proportional increase in out-of-school children between 2015 and 2030, by education level and country demographic stage .........................Figure 22 Quantitative increase in out-of-school children between 2015 and 2030 (in thousands), by education level and country demographic stageFigure 23 Quantitative increase in out-of-school children between 2015 and 2030 (in thousands), by country ...................................................................Figure 24 Quantitative increase in the youth labour force between 2015 and 2030 (in thousands), by country demographic stage .................................Figure 25 Quantitative increase in the youth labour force between 2015 and 2030 (in thousands), by country ...................................................................Figure 26 Quantitative increase in the youth labour force between 2015 and 2030 (in thousands), while reducing / closing the gender gap in labour force participation, by country .....................................................................................................................................................................................Figure 27 Quantitative increase in unemployed youth between 2015 and 2030 (in thousands), by country demographic stage .......................................Figure 28 Quantitative increase in unemployed youth between 2015 and 2030 (in thousands), by country .........................................................................

6 M E N A G E N E R AT I O N 2 0 3 0
TablesTable 1 MENA countries and their population (in thousands) in 2018 ...................................................................................................................................Table 2 Total population in absolute terms, 2000 - 2050, by country (thousands) ................................................................................................................Table 3 Estimated number of health service providers (doctors, nurses and midwives) for each scenario by country ...................................................
Acronyms and abbreviationsILO IMAGESLSCEMENANCDNEET OCHAPCBS SDGs TFRTVET UNICEF UNPDWHO YLD
International Labour OrganizationInternational Men and Gender Equality SurveyLife Skills and Citizenship EducationMiddle East and North AfricaNon-Communicable DiseasesNot in Education, Employment, or TrainingOffice for the Coordination of Humanitarian AffairsPalestinian Central Bureau of StatisticsSustainable Development GoalsTotal Fertility RateTechnical and Vocational Education and TrainingUnited Nations Children’s FundUnited Nations Population DivisionWorld Health OrganizationYears of Life with a Disability
141852

M E N A G E N E R AT I O N 2 0 3 0 7
An adolescent girl, in the innovations lab in the UNICEF - support-
ed Makani center in Jerash, Jordan.
© UNICEF/UN0218778/Shennawi

8 I N T R O D U C T I O N
IntroductionPurpose and structure of report
The purpose of this report is to provide an in-depth analysis of demographic projections for children, adolescents and youth in the countries of the Middle East and North Africa (MENA) region,5 highlighting the significant changes and exploring their implications for policy-making and programming in the areas of health, protection, education, transition to employment, civic engagement and the empowerment of girls and women in the region.
A clear understanding of the projected demographic trends is essential if policy-making, programming and decision-making in the region are to be evidence-based. The report therefore examines projected estimates of population size, age structure and population density in the MENA region during the first half of the twenty-first century.6 The significance of these projections for the possibility of a demographic dividend in MENA is then highlighted.
Barriers to the key prerequisites for experiencing the benefits of a demographic dividend – for example, political and social stability, inclusive and equitable economic and social policy and expanded employment opportunities – are then outlined. These barriers include the impact of conflict and violence, lack of youth engagement, the marginalisation of MENA’s young women, the poor quality of education, and the lack of available jobs. Implications for service provision in health, education and facilitating school-to-work transition are then explored.
Finally, the policy actions most likely to enable adolescents and youth in MENA and their communities and countries to realise their potential and benefit from a demographic dividend are outlined. The report is therefore structured as follows:
Introduction
explains the purpose and structure of the report, the significance of demographic projections for the possibility of a demographic dividend and the nature of the data sources.
Chapter 1 Demographic projections for MENA
provides projections for the region to 2030 and 2050, including: total population; women of reproductive age and fertility; mortality and life expectancy; proportion of children and youth; density and urbanisation; migration and forced displacement.
Chapter 2 The prospect of a demographic dividendin MENA
includes the prerequisites for realising the benefits of a dividend, the nature of the dividend-related stages and the projections for dependency ratios, and the proportion of youth and women in the labour market in MENA.
Chapter 3 Barriers to the dividend in MENA and implications for service provision
outlines the obstacles to achieving the dividend prerequisites, including: conflict and violence; lack of engagement; poverty and gender-based exclusion; poor quality education and lack of available jobs. Implications for service provision in health, education and school-to-work transition are explored.
Chapter 4 Reaping the dividend in MENA: priority policy actions
makes recommendations for policy action in the areas of education, health, school-to-work transition and protection to enable all the adolescents and youth of the region – including young women and the most vulnerable - to make an effective transition to the workplace and active civic engagement, contributing to the reaping of the dividend.
5 The Middle East and North Africa (MENA ) as defi ned by UNICEF includes the following 20 countries and areas: Algeria, Bahrain, Djibouti, Egypt, Iran, Iraq, Jordan, Kuwait, Lebanon, Libya, Morocco, Oman, Qatar, Saudi Arabia, the State of Palestine, Sudan, Syria, Tunisia, UAE, and Yemen.6 Initial projections were presented at the Evidence Symposium on Adolescents and Youth in MENA in November 2017. See: No Lost Generation and partners, 2017. Translating Research into Scaled Up Action: Evidence Symposium on Adolescents and Youth in MENA (summary report).
8 12 28 38 66

I N T R O D U C T I O N 9
huge social and economic benefits for them, for their communities and for their countries.
However, many challenges remain in translating awareness of the issues faced by children, adolescents and youth in MENA10 into scaled up and effective action with respect to their health, education, protection and participation (social, civic and economic).11
As a result, many adolescents and youth, especially young women, refugees and those with disabilities, continue to remain socially, economically and politically excluded. The region has both the highest youth unemployment rate in the world12
and the lowest level of civic engagement by young people. Conflicts, political instability and climate change have further increased the vulnerabilities of adolescents and youth, exposing them to violence, exploitation and abuse.13 & 14
Why demographic projections matter: the demographic dividend
A demographic dividend is the element of
Who we are talking about: children and adolescents and youth
The focus group for this report is children, adolescents and youth (0-24 years old).
Categorisation of these groups follows UN definitions7 as follows:
Children: 0-17 yearsAdolescents: 10-19 yearsYouth: 15-24 years
The current numbers of these three groups in each MENA8 country and their projected numbers for 2030 and 2050 are shown in Figure 1.
Children and young people (0-24 year olds) in the Middle East and North Africa currently account for nearly half of the region’s population. Adolescents and youth (10-24 years olds) currently represent approximately 26 per cent of the total population of MENA9 and have recently been the focus of discussions concerning global, social, economic and political developments in the region. Investing in these adolescents and youth and the children who will reach this age by 2030, and expanding their opportunities for meaningful learning, social engagement and work could potentially reap
economic growth which can be attributed to changes in the demographic composition of a population, resulting in a working age population that is increasing as a proportion of the whole population and a dependent population – for example, children and the elderly – that is decreasing (see Chapter 3 for details). The main advantage of such a dividend for the prospects for MENA’s children and youth is increased shared wealth and the resulting fiscal space that can be used to further the realisation of their rights.
The pre-condition for an economy to experience a demographic dividend is entering a period of demographic transition, involving a decline in mortality and fertility, and the subsequent change in age structure of the population (see Box 1: Demographic transition in Chapter 2 for details). With fewer births each year, a country’s young dependent population decreases in relation to its working age population and with fewer people to support, the country has a window of opportunity for rapid economic growth.
A low dependency ratio (see Figure 8 in Chapter 3) should be seen as a window of opportunity for accelerated economic growth, which may – or may not – be realised. The window of economic opportunity closes when increasing longevity leads to rapid growth of the elderly population and a persistently low fertility rate results in a
7 UNICEF, 2017. Adolescent and Youth Engagement Strategy Framework. 8 No Lost Generation and partners, 2017. Translating Research into Scaled Up Action: Evidence Symposium on Adolescents and Youth in MENA (summary report). 9 UNDESA Population Division, World Population Prospects, 2017 update (medium variant).10 No Lost Generation and partners, 2017. Translating Research into Scaled Up Action: Evidence Symposium on Adolescents and Youth in MENA (summary report).11 UNDP, 2016. Arab Human Development Report 2016: Youth and the prospects for human development in a changing reality. 12 ILO Stat, 2017. 13 World Bank, 2017. Harmonized List of Fragile Situations. http://www.worldbank.org/en/topic/fragilityconflictviolence/brief/harmonized-list-of-fragile-situations. 14 No Lost Generation and partners, 2017. Translating Research into Scaled Up Action: Evidence Symposium on Adolescents and Youth in MENA (summary report).
Children and young people (0-24 year olds) account for nearly half of the region’s population

1 0 I N T R O D U C T I O N
working age population that decreases as a proportion of the whole population.
Though a favourable age structure is essential, additional prerequisites for reaping a demographic dividend include: political and social stability; inclusive and equitable economic and social policies (ensuring labour market entrants are healthy, well-nourished and well-equipped in terms of skills and competencies) and expanded employment opportunities.
What we know so far: data sources and reliability
The demographic projections and indicators included in this report are mainly based on the median variants of fertility projected by the United Nations Population Division (UNPD) in its 2017 revision of World Population Prospects.15 These projections take into account trends in fertility, mortality and migration, as well as the current age structure of a population.
It is important to note that policy changes may influence the underlying assumptions of these projections to some extent, leading
to actual demographic developments which diverge from them. This is particularly relevant for policies relating to fertility or urbanisation. The rising frequency and intensity of conflicts in the region may also reverse development-related gains and affect mortality, fertility and migration rates to varying degrees.
Projections covering shorter periods of time – the next 15 to 35 years – for example, are acknowledged as being fairly accurate depictions of the future situation, though projections for smaller populations, young populations and those experiencing large-scale and protracted crisis tend to have a larger margin of uncertainty.
Nevertheless, taking account of the demographic challenges and opportunities anticipated over the next few decades is crucial for designing effective regional and country-level interventions aimed at realising the rights and potential of children and adolescents and youth and thus contributing to inclusive and sustainable development in MENA.
15 United Nations Department of Economic and Social Affairs, Population Division, 2017. World Population Prospects: The 2017 Revision.
Three young girls laughing at a UNICEF-supported center in Sahab, Jordan.
© UNICEF/UN0250044/Rich

I N T R O D U C T I O N 1 1
FIG. 1 Number of children (0-17 years), adolescents (10-19 years), and youth (15-24 years) by country, 2015, 2030 and 2050 (in millions)
Number of children (0-17 years old) by country Number of adolescents (10-19 years old) by country Number of youth (15-24 years old) by country
250
200
150
100
50
0
120
100
120
100
in m
illio
ns
in m
illio
ns
in m
illio
ns
2015 2015 20152030 2030 20302050 2050 2050

1 2 M E N A G E N E R AT I O N 2 0 3 0
D E M O G R A P H I C P R O J E C T I O N S F O R M E N A
C h a p t e r 1
An adolescent boy smiles while his photo is being taken at his house in Sahab, Jordan.
© UNICEF/UN0249983/Rich

M E N A G E N E R AT I O N 2 0 3 0 1 3

1 4 M E N A G E N E R AT I O N 2 0 3 0
TABLE 1 MENA countries and their population (in thousands) in 2018
1 . D E M O G R A P H I C P R O J E C T I O N S F O R M E N A
MENA is a diverse region, including 20 countries and territories from North Africa and the Middle East (as defined by UNICEF). Table 1 below shows these 20 countries and their total population in 2018. These countries vary widely, in terms of Gross National Income (GNI), demographic trends and dynamics. While the majority of the countries are still in a phase of medium to high fertility and population growth, others are already at an advanced stage of demographic transition (See Box 1 next page), with low to very low fertility rates. The report highlights these important demographic differences and provides a brief analysis of associated policy issues.
Source: United Nations, Department of Economic and Social Affairs, Population Division, World Population Prospects: The 2017 Revision (UN WPP), United Nations, New York, 2017.
2018Algeria 42,008Bahrain 1,567Djibouti 971Egypt 99,376Iran 82,012Iraq 39,340Jordan 9,904Kuwait 4,197Lebanon 6,094Libya 6,471Morocco 36,192Oman 4,830State of Palestine 5,053Qatar 2,695Saudi Arabia 33,554Sudan 41,512Syria 18,284Tunisia 11,659UAE 9,542Yemen 28,915Total 484,175

M E N A G E N E R AT I O N 2 0 3 0 1 5
Box 1: DEMOGRAPHIC TRANSITION16
During demographic transition, the population moves from one demographic structure to another. Typically, following the initial stage, four stages are involved in the demographic transition process that describes how shifts in fertility and mortality levels change the age structure of a population from many children and few elderly to few children and many elderly. In the transitional period, countries can experience unprecedented levels of population growth.
Demographic Dividend: A large labour
force with few dependent children leading to accel-erated economic growth
Birth Rate
Death Rate
Population Growth
Dem
ogra
phic
tra
nsit
ion
Dem
ogra
phic
div
iden
d
Stage 1: Pre-dividend Stage 3: Mid-dividendStage 2: Early-dividend Stage 4: Late-dividend Stage 5: Post-dividendBirth RateDeath RatePopulation Growth
Many children, few elderly Many children per worker Fewer children per worker Few children, many elderly Fewer people
HighHighSlow
HighRapid fallRapid increase
Rapid fallSlow fallSlower increase
LowLowSlow increase
Very lowLowSlow decrease
The 5 stages (shown in the graph above) can be summarised as follows:
Fertility and mortality are high (population increases very slowly)
Mortality starts to decline, especially among children and young adults (population increases)
Fertility also starts to decline (population growth slows down)
Fertility and mortality are both low (low population growth)
Fertility levels fall below replacement levels (population will decline over the long term). Also called the second demographic transition.
16 UNICEF Division of Data, Research and Policy, 2014. Generation 2030 Africa.
1 6 M E N A G E N E R AT I O N 2 0 3 0
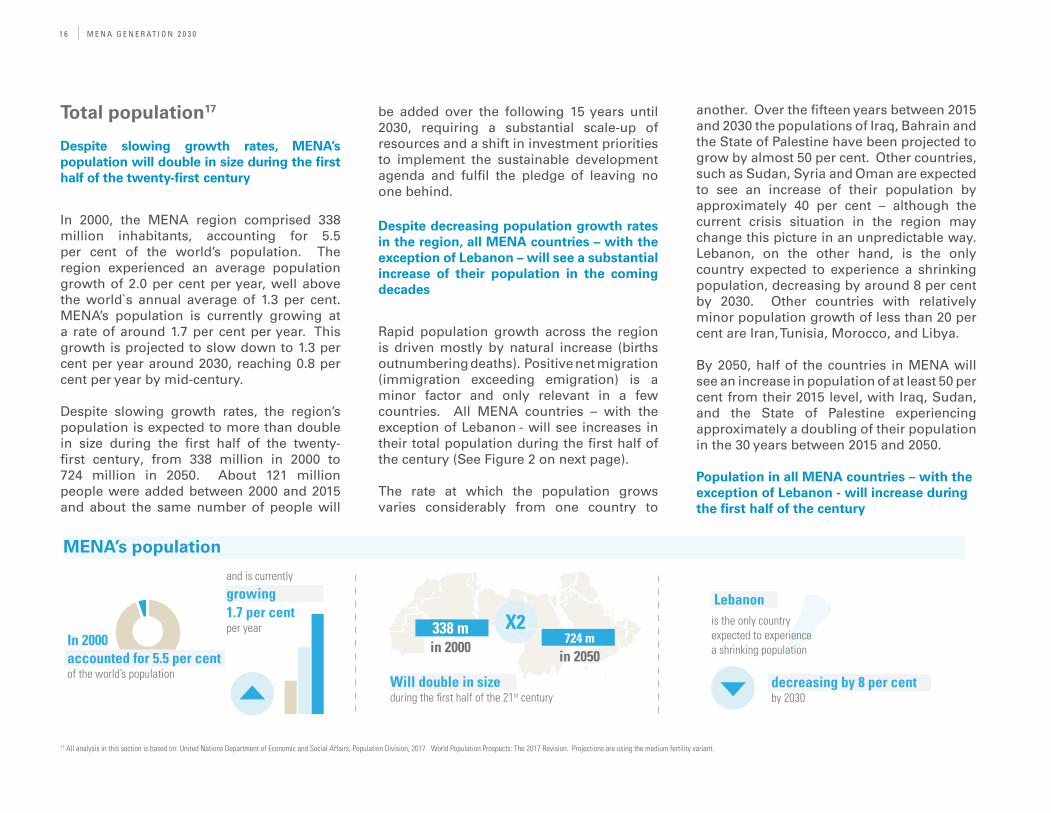
Total population17
Despite slowing growth rates, MENA’s population will double in size during the fi rst half of the twenty-fi rst century
In 2000, the MENA region comprised 338 million inhabitants, accounting for 5.5 per cent of the world’s population. The region experienced an average population growth of 2.0 per cent per year, well above the world`s annual average of 1.3 per cent. MENA’s population is currently growing at a rate of around 1.7 per cent per year. This growth is projected to slow down to 1.3 per cent per year around 2030, reaching 0.8 per cent per year by mid-century.
Despite slowing growth rates, the region’s population is expected to more than double in size during the first half of the twenty-first century, from 338 million in 2000 to 724 million in 2050. About 121 million people were added between 2000 and 2015 and about the same number of people will
17 All analysis in this section is based on: United Nations Department of Economic and Social Affairs, Population Division, 2017. World Population Prospects: The 2017 Revision. Projections are using the medium fertility variant.
be added over the following 15 years until 2030, requiring a substantial scale-up of resources and a shift in investment priorities to implement the sustainable development agenda and fulfil the pledge of leaving no one behind.
Despite decreasing population growth rates in the region, all MENA countries – with the exception of Lebanon – will see a substantial increase of their population in the coming decades
Rapid population growth across the region is driven mostly by natural increase (births outnumbering deaths). Positive net migration (immigration exceeding emigration) is a minor factor and only relevant in a few countries. All MENA countries – with the exception of Lebanon - will see increases in their total population during the first half of the century (See Figure 2 on next page).
The rate at which the population grows varies considerably from one country to
another. Over the fifteen years between 2015 and 2030 the populations of Iraq, Bahrain and the State of Palestine have been projected to grow by almost 50 per cent. Other countries, such as Sudan, Syria and Oman are expected to see an increase of their population by approximately 40 per cent – although the current crisis situation in the region may change this picture in an unpredictable way. Lebanon, on the other hand, is the only country expected to experience a shrinking population, decreasing by around 8 per cent by 2030. Other countries with relatively minor population growth of less than 20 per cent are Iran, Tunisia, Morocco, and Libya.
By 2050, half of the countries in MENA will see an increase in population of at least 50 per cent from their 2015 level, with Iraq, Sudan, and the State of Palestine experiencing approximately a doubling of their population in the 30 years between 2015 and 2050.
Population in all MENA countries – with the exception of Lebanon - will increase during the fi rst half of the century
accounted for 5.5 per centof the world’s population
and is currently growing 1.7 per cent per year 338 m
in 2000
MENA’s population
Will double in size during the fi rst half of the 21st century
724 min 2050
is the only country expected to experiencea shrinking population
Lebanon
decreasing by 8 per cent by 2030
In 2000X2
M E N A G E N E R AT I O N 2 0 3 0 1 7
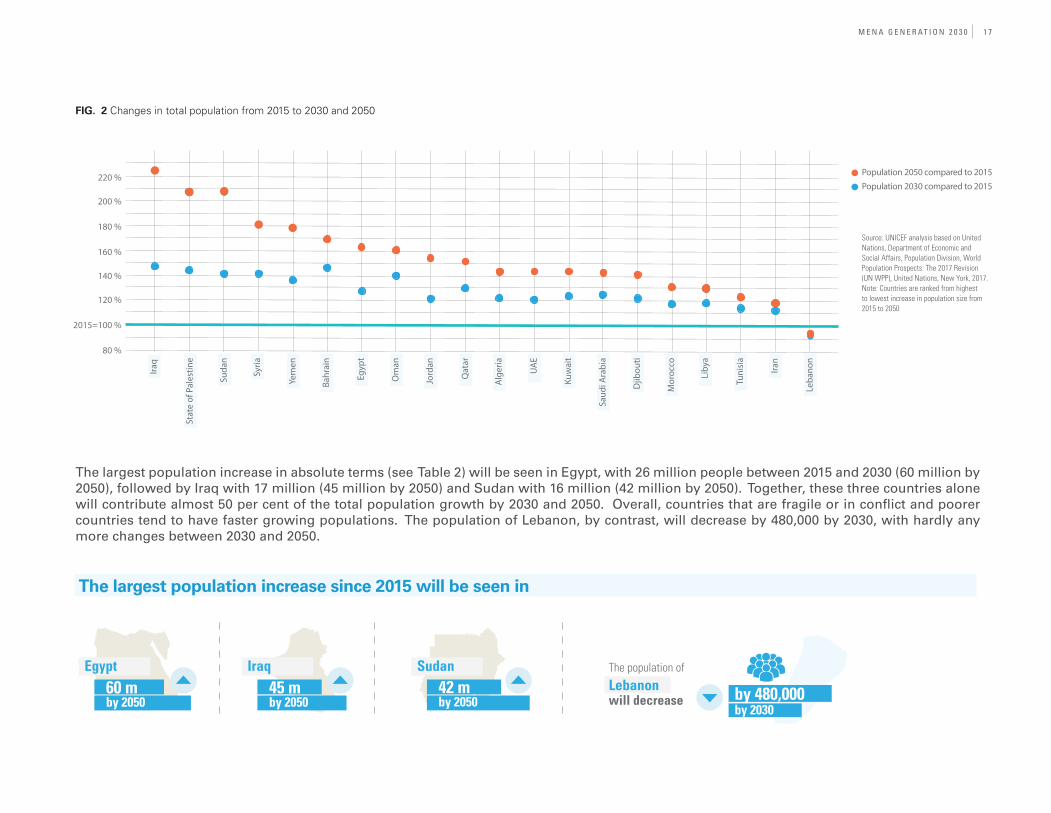
FIG. 2 Changes in total population from 2015 to 2030 and 2050
Source: UNICEF analysis based on United Nations, Department of Economic and Social Affairs, Population Division, World Population Prospects: The 2017 Revision (UN WPP), United Nations, New York, 2017. Note: Countries are ranked from highest to lowest increase in population size from 2015 to 2050
The largest population increase in absolute terms (see Table 2) will be seen in Egypt, with 26 million people between 2015 and 2030 (60 million by 2050), followed by Iraq with 17 million (45 million by 2050) and Sudan with 16 million (42 million by 2050). Together, these three countries alone will contribute almost 50 per cent of the total population growth by 2030 and 2050. Overall, countries that are fragile or in conflict and poorer countries tend to have faster growing populations. The population of Lebanon, by contrast, will decrease by 480,000 by 2030, with hardly any more changes between 2030 and 2050.
220 %
200 %
180 %
160 %
140 %
120 %
2015=100 %
80 %
Iraq
Stat
e of
Pal
estin
e
Suda
n
Syria
Yem
en
Bahr
ain
Egyp
t
Om
an
Jord
an
Qat
ar
Alge
ria
UAE
Kuw
ait
Saud
i Ara
bia
Djib
outi
Mor
occo
Liby
a
Tuni
sia Iran
Population 2050 compared to 2015Population 2030 compared to 2015
Leba
non
The population of Lebanon will decrease
60 mby 2050
Egypt
The largest population increase since 2015 will be seen in
45 mby 2050
42 mby 2050
Sudan
by 480,000by 2030
Iraq

1 8 M E N A G E N E R AT I O N 2 0 3 0
TABLE 2 Total population in absolute terms 2000-2050 by country (thousands)
2000 2015 2018 2030 2050
Algeria 31,184 39,872 42,008 48,822 57,437
Bahrain 665 1,372 1,567 2,013 2,327
Djibouti 718 927 971 1,133 1,308
Egypt 69,906 93,778 99,376 119,746 153,433
Iran 66,132 79,360 82,012 88,863 93,553
Iraq 23,565 36,116 39,340 53,298 81,490
Jordan 5,103 9,159 9,904 11,122 14,188
Kuwait 2,051 3,936 4,197 4,874 5,644
Lebanon 3,235 5,851 6,094 5,369 5,412
Libya 5,356 6,235 6,471 7,342 8,124
Morocco 28,850 34,803 36,192 40,874 45,660
Oman 2,268 4,200 4,830 5,897 6,757
State of Palestine 3,223 4,663 5,053 6,739 9,704
Qatar 592 2,482 2,695 3,232 3,773
Saudi Arabia 20,764 31,557 33,554 39,480 45,056
Sudan 27,251 38,648 41,512 54,842 80,386
Syria 16,411 18,735 18,284 26,608 34,021
Tunisia 9,699 11,274 11,659 12,842 13,884
UAE 3,155 9,154 9,542 11,055 13,164
Yemen 17,875 26,916 28,915 36,815 48,304
Total 338,002 459,038 484,175 580,966 723,624

M E N A G E N E R AT I O N 2 0 3 0 1 9
Women of reproductive age and fertility18
Despite falling fertility rates, the number of births in the region will remain relatively stable until 2050 because of the growing number of women of reproductive age
Once among the highest in the world, MENA’s fertility rate has been declining for decades, largely because of delayed marriages and the use of contraception. However, a history of high fertility has resulted in a growing number of women of reproductive age (15-49 years). This number (for the region as a whole) increased from 84 million in 2000 to 119 million in 2015, and is projected to increase further, reaching 147 million in 2030 and 169 million in 2050.
This demographic process, known as population momentum, will lead to a larger
By 2050, fertility will be below replacement level of 2.1 children in most countries, while still 3.0 births per woman in Iraq and Sudan
number of births in the region in 2050 compared to 2000, even though the average number of births per woman is declining.
Overall, the region will see over half a billion births during the first half of the century. The annual number of births was 9 million in 2000; it reached 11 million in 2015 and is expected to remain relatively stable until 2050.
By 2030, half of the MENA countries will have total fertility rates at or below replacement level
Both the onset and pace of fertility decline is projected to vary widely across the region (see Figure 3). In 2000, fertility in the MENA region averaged around 3.3 children per woman and none of the countries had fertility rates below the replacement level of 2.1 children per woman (though Tunisia, Iran and Lebanon were close). By 2015 however, fertility had fallen to just below three children per woman
in the region as a whole and to or below replacement level in six countries: Bahrain (2.1 children per woman), Kuwait (2.0), Qatar (1.9), UAE (1.8), Lebanon (1.7) and Iran (1.7).
The decreasing trend in fertility will continue for all countries over the next decades. By 2030, fertility in three more countries – Libya, Tunisia and Oman – is expected to have fallen below replacement level and only three countries will have fertility levels of more than 3 children per woman (but below 4). Yemen, which with 6.3 children per woman had the highest fertility rate in the region in 2000, is expected to halve this rate to 2.9 by 2030.
By 2050, 14 of the 20 countries in the region (70 per cent) are expected to have fertility rates below replacement level. The highest fertility rates are projected for Sudan and Iraq (3.0 children per woman in each).
18 All analysis in this section is based on: United Nations Department of Economic and Social Affairs, Population Division, 2017. World Population Prospects: The 2017 Revision. Projections are using the medium fertility variant.
MENA’s fertility rate has been declining, largely because of
The region will see over
births during the fi rst half of the century.
Delayed marriages
The use of contraception
500,000,000

2 0 M E N A G E N E R AT I O N 2 0 3 0
19 United Nations Inter-agency Group for Child Mortality Estimation (UN IGME), 2017. Levels and Trends in Child Mortality: Report 2017. Estimates developed by the UN Inter-agency Group for Child Mortality Estimation, United Nations Children’s Fund, New York, 2017.
Mortality (including child mortality) and life expectancy
The number of under-five deaths in the region will continue to decline over the coming decades
Life expectancy at birth in the MENA region has risen sharply since the 1950s and is projected to rise further over the coming decades, though at a slower rate. The gains observed in life expectancy are encouraging and are likely in large part the result of effective child survival interventions.
Between 1990 and 2015, national under-five mortality rates19 in the region decreased by between just under 50 per cent in Algeria, Djibouti, and Iraq to approximately 75 per cent in Tunisia, Lebanon, Egypt, Iran, and Oman, and are currently (as of 2016) ranging from around 65 deaths per 1,000 live births in Sudan and Djibouti to under 10 deaths in Qatar, Kuwait, Lebanon, UAE and Bahrain (See Figure 4).
In 2015, there were approximately 330,000 under-five deaths in the region, down from 440,000 fifteen years earlier (2000). If the current trend of mortality reduction continues, the annual number of under-five deaths will drop further, to 210,000 by 2030 and to 120,000 by 2050. However, even under this scenario of continuing decline, a total of 7.4 million children in the region are likely to die before reaching their fifth birthday between 2015 and the middle of the century.
FIG. 3 Total fertility rate in MENA region by country, 2015, 2030 and 2050
Source: UNICEF analysis based on United Nations, Department of Economic and Social Affairs, Population Division, World Population Prospects: The 2017 Revision (UN WPP), United Nations, New York, 2017.Note: Countries are ranked from highest to lowest total fertility in 2015.
Children per woman
FIG. 4 Estimated under-five mortality rates in MENA region by country, 1990 and 2015
Deaths per 1,000 live births
Source: United Nations Inter-agency Group for Child Mortality Estimation (UN IGME), Levelsand Trends in Child Mortality: Report 2017, Estimates developed by the UN Inter-agency Group for Child Mortality Estimation, United Nations Children’s Fund, New York, 2017. Note: Countries are ranked from highest to lowest U5MR in 2015.
State of Palestine

M E N A G E N E R AT I O N 2 0 3 0 2 1
20 Note that population projections are a complex process, based mostly on census and administrative data, relying on general assumptions regarding different demographic components (fertility, mortality and international migration) and heavily influenced by long-term trends. Past mortality crises due to conflict or natural disasters are considered in the estimation process and factored into the projections, but no assumptions regarding the effect of future crises is made. For more detailed information on estimation and projection methodology see: United Nations, Department of Economic and Social Affairs, Population Division, 2017). World Population Prospects: The 2017 Revision, Methodology of the United Nations Population Estimates and Projections, Working Paper No. ESA/P/WP. 250. United Nations, New York.
By 2050, life expectancy at birth will still be around 15 years longer in Lebanon (at 85, the highest in the region) than in Djibouti (at approximately 70, the lowest in the region)
At the beginning of the twenty-first century, mortality rates differed considerably across the region. All MENA countries saw improvements in child survival and life expectancy between 2000 and 2015, except for Syria where the situation has deteriorated dramatically in the last few years due to the ongoing conflict. Life expectancy in Syria decreased by more than 4 years between 2006 (74.4 years) and 2014 (69.8 years).
The future pace of increase in life expectancy is likely to vary between countries, with strong disparities being expected to persist until mid-century (See Figure 5). The best scenario is projected for Lebanon, where life expectancy at birth is expected to reach 85 years by 2050, followed by Oman, Qatar, Morocco, UAE, Algeria, Iran, Tunisia, and Bahrain, all of which have projected life expectancies of more than 80 years. Even Syria would join this group, if it were to follow pre-conflict trends.20 At the other end of the spectrum, the projected life expectancy at birth in 2050 will be only around 70 years in Djibouti, Yemen and Sudan.
FIG. 5 Estimated and projected life expectancy at birth in MENA region by country, 2015, 2030 and 2050
Iraq
State of Palestine
Sudan
Syria
Yemen
Bahrain
Egypt
Oman
Jordan
Qatar
Algeria
UAE
Kuwait
Saudi Arabia
Djibouti
Morocco
Libya
Tunisia
Iran
Lebanon
0 20 40 60 80
2015 2030 2050
Years
Source:UNICEF analysis based on United Nations, Department of Economic and Social Affairs, Population Division, World Population Prospects: The 2017 Revision (UN WPP), United Nations, New York, 2017.Note: Countries are ranked from highest to lowest life expectancy in 2015.
79.4
78
77.1
76.8
76.8
75.9
75.7
75.6
75.5
74.6
74.4
74.2
73.3
71.8
71.3
69.9
69.7
64.7
64.3
62.3

2 2 M E N A G E N E R AT I O N 2 0 3 0
compared to 50 per cent of the population in Iraq and Sudan
Children and youth
The overall proportion of children and youth (0-24 years) in the population is projected to continue to fall in all countries in the region and by 2050 will be well below 50 per cent (with the exception of Iraq and Sudan)
At the beginning of the century, children and adolescents and youth (0-24 years) accounted for 50 per cent or more of the population in all MENA countries except Qatar, UAE, Kuwait, Bahrain and Lebanon, where they accounted for more than 40 per cent (see Figure 6). Their share of the population will decline in all countries during the first half of the century, albeit at different rates.
In 2050, the proportion of children and adolescents and youth in the population is projected to be as low as 21 per cent for Qatar and UAE, and below 25 per cent in Bahrain and Iran. By contrast, the highest share of children and adolescents and youth by 2050 is projected to be in Iraq and Sudan, at around 50 per cent, followed by the State of Palestine, Yemen and Egypt, where their share is expected to remain above 40 per cent.
In 2050, children and youth 24 years and younger will account for
21 per cent of the population in Qatar and UAE
Abdulkadir blows bubbles as he goes blue for World Children’s Day in his local UNICEF-supported Makani centre in Mafraq, Jordan.
© UNICEF/UN0253286/Herwig

M E N A G E N E R AT I O N 2 0 3 0 2 3
The number of youth will continue to grow during the first half of the century in 12 out of 20 MENA countries, but falling fertility will lead to a decreasing share of the overall population
The first half of the century will be marked by major changes in population age structure.
FIG. 6 Percentage of total population represented by children, adolescents and youth (0-24 years), by country 2000-2050
Source: UNICEF analysis based on United Nations, Department of Economic and Social Affairs, Population Division, World Population Prospects: The 2017 Revision (UN WPP), United Nations, New York, 2017.
Pre-dividend
Early-dividend
Early-dividend
Late-dividend
In 2000, MENA’s youth (15-24 years) were 72 million in total. Due to falling fertility, their numbers will grow more slowly compared to the rest of the population. As of 2015, around 80 million youth were living in the region, with their total number projected to reach 100 million in 2030 and 104 million in 2050. This means that between 2015 and 2030 around 24 million
youth between 15 and 24 will be added to the population.
Almost all countries in MENA will see an increase of their youth population during the years to 2030 (see Figure 7 on next page). The youth population of both Kuwait and Iraq will increase by almost 50 per cent within only fifteen years, for example, adding

2 4 M E N A G E N E R AT I O N 2 0 3 0
FIG. 7 Changes in youth population (15-24 years) from 2015 to 2030 and 2050
Source: UNICEF analysis based on United Nations, Department of Economic and Social Affairs, Population Division, World Population Prospects: The 2017 Revision (UN WPP), United Nations, New York, 2017.
Note: Countries are ranked from highest to lowest relative change between 2015 and 2030.
21 The protracted violent crises in Syria and Yemen may lead to an outcome that differs from this projection. See footnote 19 (page 20) for more details on how projections incorporate crises.
200,000 youth in Kuwait and over 3.2 million in Iraq. In Egypt, the youth population will increase by 33 per cent or 5.5 million. Other countries that will see the addition of large numbers of youth up to 2030 are Sudan (3.1 million, a 39 per cent increase), Algeria (1.8 million, a 27 per cent increase), Yemen (1.5 million, a 25 per cent increase) and Syria (1.4 million, a 37 per cent increase).21
The exceptions are Lebanon, whose youth population is expected to drop by 50 per
220%
200%
180%
160%
140%
120%
2015=100%
80%
60%
Iraq
Stat
e of
Pal
estin
e
Suda
n
Syria
Yem
en
Bahr
ain
Egyp
t
Om
an
Jord
an
Qat
ar
Alge
ria
UAE
Kuw
ait
Saud
i Ara
bia
Djib
outi
Mor
occo
Liby
a
Tuni
sia Iran
Leba
non
cent, Djibouti and Qatar, both countries with population of less than 6 million, whose youth populations will hardly change.
Though the growth in youth population is projected to slow down towards mid-century, five countries will see an increase in youth population of 40 per cent or higher compared to the current level, including Iraq, for example, where the number of youth between 15 and 24 years will almost double.
Between 2015 and 2030
will be added to the population
24myouth
+
Population 2050 compared to 2015Population 2030 compared to 2015

M E N A G E N E R AT I O N 2 0 3 0 2 5
The decreasing share of the younger population groups, combined with increasing numbers of the youth population, presents a historic opportunity to invest in human capital by improving access to education, health and protection and enhancing the prospects for productive employment. As elaborated below, MENA countries should actively pursue this opportunity to reap the demographic dividend, both for the intrinsic value of realising the rights of children, adolescents and youth and as an investment in future economic growth and stability.
Population of Qatar and Kuwait will be nearly
Almost
Will still live in rural areas
Density and urbanisation
Population density will more than double during the fi rst half of the century
In 2000, the MENA region had an average population density of 26 persons per square kilometre. Population density is projected to more than double by 2050, reaching an average of 56 persons per square kilometre.22
According to the 2018 Revision of the United Nations World Urbanisation Prospects,23
the total number of urban dwellers in the region was 188 million in 2000. This number increased by 49 per cent to 281 million by 2015 and is projected to reach 381 million in
2030 and 527 million in 2050, representing an increase of 38 per cent between each period. This rate of urban population growth is faster in relative terms than that of the total population in the MENA region, which is projected to increase by 36 per cent, 27 per cent and 25 per cent over the same periods.
Overcrowding is likely to cause serious challenges, including scarce water supply, land degradation and air pollution. However, urbanisation can also contribute to development, as cities offer economies of scale, enabling the delivery of social services at much lower cost than would be required to reach the same number of people dispersed over rural areas.
In 2000, urbanisation was particularly advanced in Kuwait and Qatar. All MENA countries were already predominately urban, with the exception of Egypt, Sudan and Yemen. Between 2000 and 2015, countries saw varying paces of increase in the percentage of their population residing in cities. Urbanisation trends will continue over the coming decades, with differences between countries persisting up to 2050 and beyond.
With urban dwellers accounting for nearly 100 per cent of the population, Kuwait and Qatar will remain the most urbanised countries in the region, followed by Jordan, Oman, Lebanon, Bahrain, and UAE, all of
22 United Nations, Department of Economic and Social Affairs, Population Division, 2017. World Population Prospects: The 2017 Revision - Special Aggregates, DVD Edition. 23 United Nations Department of Economic and Social Affairs, Population Division, 2018. World Urbanisation Prospects: The 2018 Revision. United Nations, New York.
100 per cent urban in 2050
of Sudan’s population
of Yemen’s population
of Egypt’s population
50% 43% 44%
which are projected to be over 90 per cent urban in 2050. Conversely, approximately half of Sudan’s population will still live in rural areas, followed by Yemen and Egypt, which are projected to remain 43 and 44 per cent rural respectively by 2050.

2 6 M E N A G E N E R AT I O N 2 0 3 0
Migration and forced displacement
The region is likely to continue to see confl ict-induced displacements as well as work and climate-related migration in the near future
Conflict and fragility continue to undermine human rights and social and economic progress in a number of MENA countries. Eight of the 20 MENA countries were classified by the World Bank as being fragile or conflict-affected contexts in 2018,24 and two additional countries (Iran and Jordan) are hosting significant numbers of refugees from neighbouring countries.
According to the 2017 Revision of the United Nations Trends in International Migrant Stock,25 the number of international migrants in the MENA region surged from roughly 18 million in 2000 to 41 million in 2017. The region is also hosting an estimated almost 10 million refugees.26 In addition, over 14 million people in MENA were internally displaced as a result of conflict in 2017; more than in any other region of the world.27
Although population movements are the most difficult demographic processes to predict, it is likely that the region will continue to
experience conflict-induced displacement and work- and climate-related migration in the near future. Enabling access to social services, social protection and decent work for migrants and forcibly displaced persons is an integral part of sustainable development and can help promote regional stability.
At the regional level, international migration is a much smaller component of population change than births and deaths. However, in some MENA countries the impact of migration on population size and structure is substantial and will continue to be so in the coming years.
In the UAE, for example, international migrants accounted for roughly 80 per cent of residents in 2000 and 88 per cent in 2017. The other oil-producing Gulf countries – Qatar, Kuwait, Bahrain, Saudi Arabia and Oman – also received proportionally large numbers of economic migrants, predominantly men, at the beginning of the twenty-first century. In 2017, between 37 and 76 per cent of the resident populations in these countries consisted of people born abroad. The large proportion of migrants in Jordan and Lebanon, accounting for 33 and 32 per cent of their resident populations respectively in 2017, are mainly Palestinian refugees and refugees from Syria and Iraq.28
24 Djibouti, Iraq, Lebanon, Libya, the State of Palestine, Sudan, Syria, Yemen. Fragile and confl icted-affected States refer to the World Bank ‘Harmonised List of Fragile Situations FY19’. Fragile Situations have: either (a) a harmonised average country. Policy and Institutional Assessment (CPIA) country rating of 3. 2 or less, or (b) the presence of a UN and/or regional peace-keeping or peace-building mission during the past three years. For further details of this classifi cation please see: http://pubdocs. worldbank.org/en/892921532529834051/FCSList-FY19-Final.pdf 25 United Nations Department of Economic and Social Affairs, Population Division, 2017. Trends in International Migrant Stock: The 2017 Revisions. 26 This number includes 4. 5 million international refugees under UNHCR mandate (United Nations High Commissioner for Refugees, Global Trends: Forced Displacement in 2017, UNHCR, Geneva, 2018) and 5.3 million Palestinian refugees registered with UNRWA (United Nations Relief and Works Agency for Palestine Refugees in the Near East). UNRWA, 2018, Annual Operational Report 2017.27 Internal Displacement Monitoring Centre, 2018. Global Report on Internal Displacement 2018. 28 UNICEF analysis based on: United Nations Department of Economic and Social Affairs, Population Division, 2017. Trends in International Migrant Stock: The 2017 Revisions; United Nations, Department of Economic and Social Affairs, Population Division, 2017; and World Population Prospects: The 2017 Revision - Special Aggregates, DVD Edition. 29 Foresight, 2011. Migration and Global Environmental Change in: World Bank (2014) Climate Change and Migration in the MENA region. 30 World Resources Institute, 2015. World Resources Report: Creating a Sustainable Food Future.
The impact of economic migrants on population size and structure is significant in the oil-producing Gulf countries, as is the impact of refugees in Jordan, Iran, Lebanon and Sudan.
MENA is the world’s most water scarce region, due to climate change and other factors. Climate-induced migration will therefore be a future concern in the MENA region, as the projected increase in population will strain an already scarce resource.29 Six per cent of the world’s population (500 million) live in the region, with access to only 2 per cent of the world’s renewable fresh water.30 The region includes 12 of the world’s 43 most water scarce countries.
If current conditions persist, two-thirds of MENA countries could have less than 200 cubic metres of renewable water resources per person per year (a situation of absolute water scarcity) by 2050. The situation is compounded by the fact that over 60 per cent of MENA’s water resources are generated outside the region. This is currently giving rise to state-induced water scarcity, whereby upstream states constrict water flows to downstream riparian states.

M E N A G E N E R AT I O N 2 0 3 0 2 7
A young girl solves a math equation on blackboard at Umbatah Kadulgi, South Kordofan State, Sudan
© UNICEF/UN0211119/Noorani

2 8 M E N A G E N E R AT I O N 2 0 3 0
T H E P R O S P E C T O F A D E M O G R A P H I C D I V I D E N D I N M E N A
C h a p t e r 2
Young school children stand outside their primary school in the village of Tamarout, High Atlas Mountains, Morocco.
© UNICEF/UN0210355/Noorani

M E N A G E N E R AT I O N 2 0 3 0 2 9

3 0 M E N A G E N E R AT I O N 2 0 3 0
The demographic dividend: a window of opportunity31
A demographic dividend is catalysed by the demographic transition of a country’s population (see Box 1: Demographic transition in Chapter 2 above). As mortality and fertility rates decline, the population’s age structure changes. With fewer births each year, a country’s young, dependent population grows smaller in relation to the working age population.
This is the period when the dividend can materialise: the increasing share of working age population compared to other age groups – for example, children and the elderly – leaves each working age person with fewer dependents to support, and thus more disposable income, which can in turn spur greater consumption, production and investment, thereby accelerating growth and shared wealth. The window of opportunity for a demographic dividend is closely linked with such demographic transitions.
The prerequisites for ensuring that the window of opportunity for accelerated economic growth offered by a demographic dividend is realised, all of which will be explored further in Chapter 4, include:32
Political and social stabilityInclusive and equitable economic and social policies Expanded employment opportunities, for example, the ability of the economy to absorb new entrants into the labour market
There are no distinct criteria defining the beginning and end of the window, but it begins to open when the proportion of working age population begins to increase and reduction in the fertility rate progresses far enough to reduce the dependent child population. The window begins to close when the share of the working age population starts to decrease again, due to continued low fertility and an increasing proportion of the elderly in the population.
This section uses a typology which categorises countries according to their potential for reaping a demographic dividend based on two demographic indicators: the share of the working age population and fertility levels; see Box 2 below.
31 This section is adapted from the Generation 2030: Africa 2. 0 Report (UNICEF 2017), which includes the demographic projections on which the dividend-related categorisations of MENA countries given here are based. 32 See also: UNFPA, 2016. Shaping the Future: How Changing Demographics Can Power Human Development; World Bank Group. 2016. Global Monitoring Report 2015/2016: Development Goals in an Era of Demographic Change. Washington, DC: World Bank. 33 This categorisation follows the typology developed by the World Bank Group in their Global Monitoring Report 2015/2016 (World Bank Group. 2016. Global Monitoring Report 2015/2016: Development Goals in an Era of Demographic Change. Washington, DC: World Bank). Differences to the World Bank’s classifi cation come from slight differences in the adaptation of the criteria: this analysis here uses the total fertility rate for the exact years 2015 and 1985, respectively, while the World Bank used the period values 2015-2020 and 1985-1990.
Box 2: DIVIDEND-RELATED COUNTRY CATEGORISATIONS AND EXAMPLES FROM MENA33
Pre-dividend countriesCountries whose share of working age population will increase between 2015 and 2030 have an opportunity to reap a demographic dividend. Among them, those that had comparatively high total fertility (four or more births per woman) in 2015, are classified as ‘pre-dividend’ countries, since the window of the opportunity for accelerated economic growth has not yet opened, due to ongoing rapid population growth resulting in a high child dependency ratio. Only four MENA countries - Iraq, Sudan, Yemen and the State of Palestine - are in this phase.
Early-dividend countriesCountries showing a relative increase in the working age population and a total fertility of less than four births per woman in 2015 are further along the path toward reduced fertility, and thus experiencing lower child dependency ratios and a higher proportion of working age population. These countries are classified as ‘early-dividend’ countries and 50 per cent of MENA countries (10 of them) fall into this category: Algeria, Bahrain, Djibouti, Egypt, Iran, Jordan, Libya, Oman, Saudi Arabia and Syria.
Late-dividend countriesCountries with a declining share of working age population between 2015 and 2030 face a closing window for their first demographic dividend. Countries that in 1985 – roughly one generation ago – had a total fertility rate above replacement level are classified as ‘late-dividend’ countries. Most late-dividend countries have a large share of working age population and are in a position to continue harvesting the benefits of the first demographic dividend, but will face fundamental changes in coming years. Six MENA countries – Kuwait, Lebanon, Morocco, Tunisia, Qatar and UAE – are at this stage.
Post-dividend countries‘Post-dividend’ countries have experienced below-replacement level fertility since 1985, and will face a rapidly increasing elderly population, further decreasing the already diminishing share of working age population. No MENA countries have such characteristics yet.
2 . T H E P R O S P E C T O F A D E M O G R A P H I C D I V I D E N D I N M E N A
→ →
→
M E N A G E N E R AT I O N 2 0 3 0 3 1
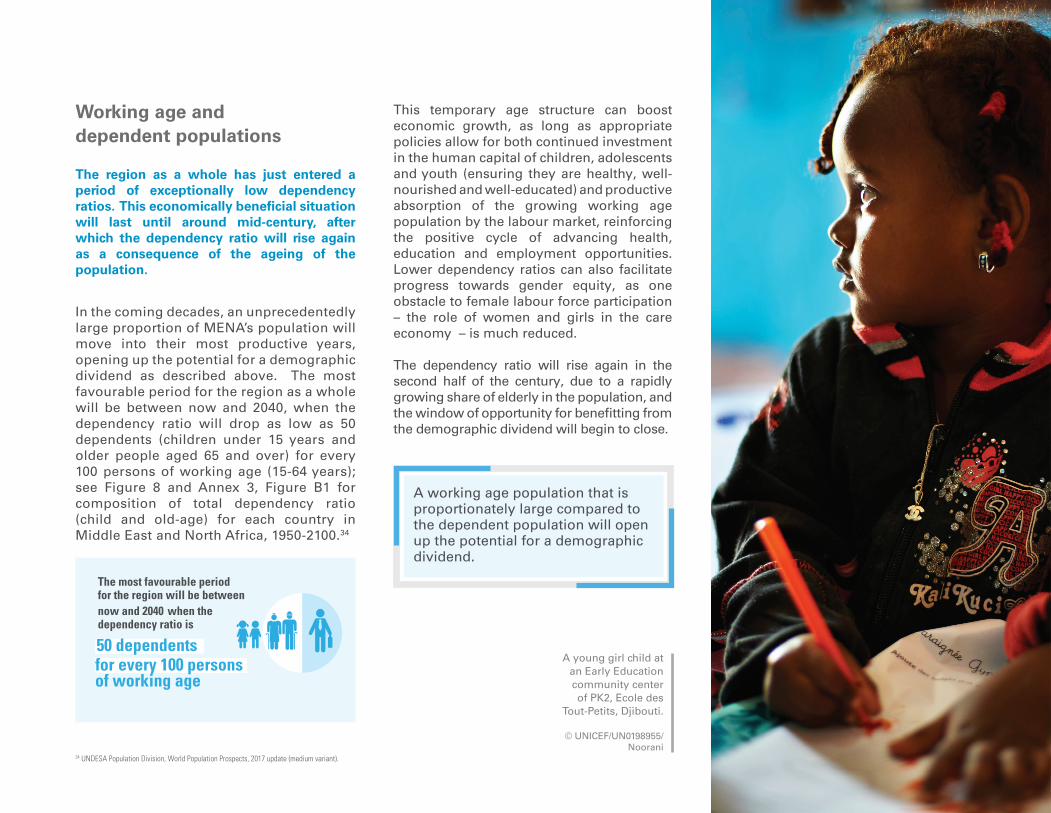
Working age and dependent populations
The region as a whole has just entered a period of exceptionally low dependency ratios. This economically benefi cial situation will last until around mid-century, after which the dependency ratio will rise again as a consequence of the ageing of the population.
In the coming decades, an unprecedentedly large proportion of MENA’s population will move into their most productive years, opening up the potential for a demographic dividend as described above. The most favourable period for the region as a whole will be between now and 2040, when the dependency ratio will drop as low as 50 dependents (children under 15 years and older people aged 65 and over) for every 100 persons of working age (15-64 years); see Figure 8 and Annex 3, Figure B1 for composition of total dependency ratio (child and old-age) for each country in Middle East and North Africa, 1950-2100.34
34 UNDESA Population Division, World Population Prospects, 2017 update (medium variant).
A working age population that is proportionately large compared to the dependent population will open up the potential for a demographic dividend.
This temporary age structure can boost economic growth, as long as appropriate policies allow for both continued investment in the human capital of children, adolescents and youth (ensuring they are healthy, well-nourished and well-educated) and productive absorption of the growing working age population by the labour market, reinforcing the positive cycle of advancing health, education and employment opportunities. Lower dependency ratios can also facilitate progress towards gender equity, as one obstacle to female labour force participation – the role of women and girls in the care economy – is much reduced.
The dependency ratio will rise again in the second half of the century, due to a rapidly growing share of elderly in the population, and the window of opportunity for benefitting from the demographic dividend will begin to close.
A young girl child at an Early Education community center of PK2, Ecole des
Tout-Petits, Djibouti.
© UNICEF/UN0198955/Noorani
The most favourable period for the region will be betweennow and 2040 when the dependency ratio is
50 dependents for every 100 persons of working age

3 2 M E N A G E N E R AT I O N 2 0 3 0
FIG. 8 Composition of the total dependency ratio (child dependency ratio and old-age dependency ratio) for the MENA region, 1950-2100
FIG. 9 Population of MENA by age and sex, 2015 (darker) and 2050 (lighter)
Source: UNICEF analysis based on United Nations, Department of Economic and Social Affairs, Population Division, World Population Prospects: The 2017 Revision (UN WPP), United Nations, New York, 2017. Note: Total dependency refers to the number of dependents (children under 15 years and older persons aged 65 and over) for 100 persons of working-age (15-64 years).
Rapid growth of the proportion of the elderly population will increase the median age in the region by almost three months per year, from 26 years in 2015 to 34 years in 2050
All MENA countries are experiencing a shift from a younger to an older population age structure (see Figure 9 below) and will have the opportunity of benefitting from a demographic dividend, as long as appropriate policies are in place. However, this window of opportunity differs from one country to another, depending on the pace of their fertility decline and increase in life expectancy (see Figure 10 on next page).
Source: UNICEF analysis based on United Nations, Department of Economic and Social Affairs, Population Division, World Population Prospects: The 2017 Revision (UN WPP), United Nations, New York, 2017.
100
80
60
40
20
0
1950
25 25
1975
20 20
2000
15 15
2025
10 10
2050
5 5
2075
0
2100
65+ years
0−14 years
Dep
ende
ncy
ratio
0–45–9
10–14
15–19
20–24
25–29
30–34
35–39
40–44
45–49
50–54
55–59
60–64
65–69
70–74
75–79
80–84
85–89
90–94
95–99
100+
Female
Male
2015 2050
Population (in millions)
2018
2030
2050

M E N A G E N E R AT I O N 2 0 3 0 3 3
FIG. 10 Countries in the Middle East and North Africa by demographic type35 (1990-2085) Figure 10 displays countries in MENA by demographic type in the years 1990 to 2085. Countries are categorised based on the methodology developed by the World Bank Group in their Global Monitoring Report 2015/201636 but adapted to cover a larger period. The demographic type of a country is determined by two factors: 1) whether the working age population is growing or shrinking; and 2) the total fertility rate. As both can be projected into the future, countries’ progression through a demographic types can be predicted. Note, this representation is smoothed for short-term reversals and should be taken only as an approximate but nevertheless useful indication for the window of opportunity for a demographic dividend.
In 2015, the median age of the region’s population was 26 years. Four countries had a median age of under 20 years: Sudan (18.9 years), Yemen (19.2 years), the State of Palestine and Iraq (both 19.4 years). Although all countries will see some population ageing, these four countries will still be relatively youthful in 2050, with median ages between 25 and 29 years. In contrast, more than half of the population in Tunisia, Bahrain, Qatar, Kuwait, and the UAE was already over 30 years by 2015. By 2050, the median age of their population will be approximately 40 years.37 See Figure 11 for country examples and Annex 3, Figure B2 for graphs for each country in Middle East and North Africa, 1950-2050.38
35 For more details on the demographic typology see Box 2 in this report. 36 World Bank Group. 2016. Global Monitoring Report 2015/2016: Development Goals in an Era of Demographic Change. World Bank, Washington, D.C.37 United Nations Department of Economic and Social Affairs, Population Division, 2017. World Population Prospects: The 2017 Revision. 38 UNDESA Population Division, World Population Prospects, 2017 update (medium variant).
Countries sorted from top to bottom by type (from post- to pre-dividend) and Total Fertility Rate (increasing) in 2018
Source: UNICEF analysis based on World Bank 2016 (GMR 2015/2016) and United Nations (UNPD WPP 2017)

3 4 M E N A G E N E R AT I O N 2 0 3 0
FIG. 11 Population by age and sex for selected countries in MENA in different demographic stages, 2015 (darker) and 2050 (lighter)
Sudan, 2015 and 2050 (pre-dividend) Jordan, 2015 and 2050 (early-dividend)
Libya, 2015 and 2050 (early-dividend) Tunisia, 2015 and 2050 (late-dividend)
100+95-9990-9485-8980-8475-7970-7465-6960-6455-5950-5445-4940-4435-3930-3425-2920-2415-1910-14
5-90-4
100+95-9990-9485-8980-8475-7970-7465-6960-6455-5950-5445-4940-4435-3930-3425-2920-2415-1910-14
5-90-4
100+95-9990-9485-8980-8475-7970-7465-6960-6455-5950-5445-4940-4435-3930-3425-2920-2415-1910-14
5-90-4
100+95-9990-9485-8980-8475-7970-7465-6960-6455-5950-5445-4940-4435-3930-3425-2920-2415-1910-14
5-90-4
Female
Female
Female
Female
Male
Male
Male
Male
2015
2015
2015
2015
2050
2050
2050
2050

M E N A G E N E R AT I O N 2 0 3 0 3 5
Youth and gender in the labour market
Between now and approximately 2030, the MENA region will see an increasing number of youth (15-24 years) added to its population each year (see Figure 12)
2018 will see an increase of approximately 120,000 youth on the previous year, 2021 an increase of approximately 1 million and 2025 an increase of approximately 2 million from previous years. The highest annual increases are projected for 2027 and 2028, when the youth population will increase by 2.4 million each year. The number of youth in MENA will continue to increase until 2036, though the rate of increase will slow down after 2028.
Accommodating this increasing number of adolescents and youth in the education systems and integrating them into the labour market will present significant challenges to the countries of the region. The creation of new jobs – new skilled jobs in particular – and the nurture of a skilled labour force for those jobs therefore need to be high priorities for decision makers.
FIG. 12 Annual increase of youth population (15-24 years) in MENA region, 2015-2050
Source: UNICEF analysis based on United Nations, Department of Economic and Social Affairs, Population Division, World Population Prospects: The 2017 Revision (UN WPP), United Nations, New York, 2017.
3.0
2.5
2.0
1.5
1.0
0.5
0.0
-0.5
-1.02016 2018 2020 2022 2024 2026 2028 2030 2032 2034 2036 2038 2040 2042 2044 2046 2048 2050
Cha
nge
of p
opul
atio
n 15
-24
year
s (m
illio
ns)

3 6 M E N A G E N E R AT I O N 2 0 3 0
In all but three of the MENA countries the labour force participation rate of young women is less than half that of young men
Even if adolescents and youth in MENA finish higher levels of education, many economies in the region are currently unable to provide enough opportunities for them in the labour market. Seventeen of the 20 MENA countries (for example, 85 per cent) have youth (age 15-24) labour force participation rates lower than the global average of 45 per cent (see Figure 13).
In more than half of the countries only 1 in 3 or fewer are actively engaged in the labour market; in Jordan it is only 1 in 4 and in Saudi Arabia only 1 in 5.
As explained above, though a favourable age structure, for example, increasing work age population as a proportion of the whole – is one prerequisite for reaping a demographic dividend, it is insufficient if a sizable part of that population – youth in general and women in particular (see Figure 14) – is excluded from the work force. Participation of these groups in the labour force is essential if the economic dividend is to be realised.
For young women the situation is even worse; in all but three MENA countries their labour force participation rate is less than half that of young men (see Figure 14). Only Kuwait and Djibouti show a female to male labour force participation ratio at or above the global average, with 0.7 and 0. 8 respectively.
FIG. 13 Youth labour force participation rate and demographic type by country, 2015
FIG. 14 Female to male labour force participation ratio and demographic type by country, 2015
Source: UNICEF analysis based on labour force participation rate by sex and age - ILO modelled estimates, 2015. Note: Demographic type refers to the categorisation of countries as pre-, early-, late- or post-dividend, according to their dependency ratio and fertility rates (see Box 2 above).
0. 00 0. 110 0. 90. 220 0. 80. 330 0. 770 0. 440 0. 660 0. 550
Iraq
IraqState of Palestine
State of Palestine
Sudan
Sudan
Syria
Syria
Yemen
Yemen
Bahrain
Bahrain
EgyptEgypt
Oman
Oman
Jordan
Jordan
Qatar
Qatar
Algeria
Algeria
UAE
UAE Kuwait
Kuwait
Saudi Arabia
Saudi Arabia
Djibouti
Djibouti
Early
Late
Late
Late
Late
Late
Late
Late
Late
Late
Late
Late
Late
Early
Early
Early
Early
Early
Early
Early
Early
Morocco
Morocco
LibyaLibya
Tunisia
Tunisia
Iran
Iran
Lebanon
Lebanon
WorldWorld
Early
Early
Early
Early
Early
Early
Early
Early
Early
Early
Pre
Pre Early
Pre
Pre
Pre
Pre
Pre
Pre
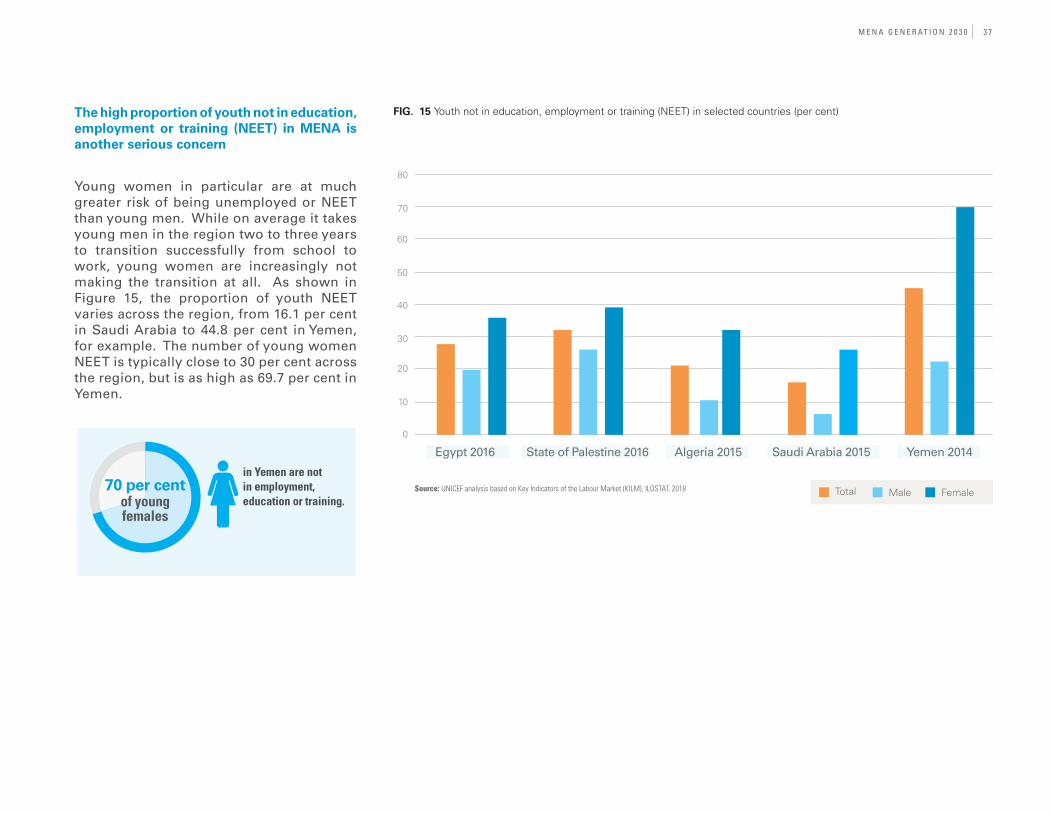
M E N A G E N E R AT I O N 2 0 3 0 3 7
The high proportion of youth not in education, employment or training (NEET) in MENA is another serious concern
Young women in particular are at much greater risk of being unemployed or NEET than young men. While on average it takes young men in the region two to three years to transition successfully from school to work, young women are increasingly not making the transition at all. As shown in Figure 15, the proportion of youth NEET varies across the region, from 16.1 per cent in Saudi Arabia to 44.8 per cent in Yemen, for example. The number of young women NEET is typically close to 30 per cent across the region, but is as high as 69.7 per cent in Yemen.
in Yemen are not in employment, education or training.
FIG. 15 Youth not in education, employment or training (NEET) in selected countries (per cent)
Source: UNICEF analysis based on Key Indicators of the Labour Market (KILM), ILOSTAT, 2018
Egypt 2016 State of Palestine 2016 Saudi Arabia 2015Algeria 2015 Yemen 2014
Total Male Female
80
70
60
50
40
30
20
10
0
70 per centof youngfemales

3 8 M E N A G E N E R AT I O N 2 0 3 0
B A R R I E R S T O T H E D I V I D E N D I N M E N A A N D I M P L I C AT I O N S F O R S E R V I C E P R O V I S I O N
C h a p t e r 3
A group of young boys play in an old sacred building in the village of Tamarout, High Atlas Mountains, Morocco.
© UNICEF/UN0210242/Noorani

M E N A G E N E R AT I O N 2 0 3 0 3 9

4 0 M E N A G E N E R AT I O N 2 0 3 0
By mid-century, 271 million children and adolescents and youth (0-24 years) will live in the MENA region. Along with their descendants, they have the potential to transform the region, breaking longstanding cycles of poverty and inequality. But such transformation requires investment in essential services including education, health and protection, in addition to addressing obstacles to civic engagement and the transition to employment.
This section explores the barriers to meeting the pre-conditions for taking advantage of a demographic dividend in MENA, including barriers related to political and social stability, inclusive and equitable economic and social policies, and expanded employment opportunities. Key barriers in each category are outlined below, followed by implications for scaling up service provision in the areas of health, education and school-to-work transition.
Barriers related to political and social stability
Conflict and violence
The cost of conflict in the MENA region is
39 UNDP, 2016. Arab Human Development Report 2016. 40 Ibid. 41 No Lost Generation and partners, 2017. Translating Research into Scaled Up Action: Evidence Symposium on Adolescents and Youth in MENA (summary report). 42 Ibid. 43 Fragile and conflicted-affected States refer to the World Bank ‘Harmonised List of Fragile Situations FY18’. 44 Collective violence and legal intervention: Injuries to civilians and military personnel caused by war and civil insurrection, or injuries inflicted by the police, other law-enforcement agents and on-duty military personnel in the course of arresting or attempting to arrest lawbreakers, suppressing disturbances, maintaining order and other legal action. Because deaths due to legal intervention are rare in most countries/regions, this cause of death is frequently referred to as ‘collective violence’ in this report for readability. 45 UNICEF, 2017. A Familiar Face: Violence in the Lives of Children and Adolescents. 46 No Lost Generation and partners, 2017. Ibid. 47 Save the Children, 2017. Adolescents and conflict in four countries in MENA. 48 UNICEF, 2017. A Familiar Face: Violence in the Lives of Children and Adolescents.
enormous, evidenced by the region accounting for 57.5 per cent of the world’s refugees, 47 per cent of the world’s internally displaced people and 68.5 per cent of the world’s conflict-related deaths.39 The region is one of the most dangerous places in the world for adolescents and youth to live; with huge numbers experiencing violence, often by those entrusted with taking care of them. This includes violence at school, both in the classroom and in the playground.40
Levels of collective violence have grown exponentially in countries affected by conflict. The middle and high-middle income countries in the region also have some of the highest rates of violence in homes and schools in the world.41 Conflict results in a number of intersecting vulnerabilities and violations of rights for many adolescents and youth in MENA,42 limiting their opportunities and undermining social stability.
Some of the most significant conflict and violence-related barriers to the empowerment and meaningful engagement of adolescents and youth in MENA include:
Vulnerability to death and injury – Almost 37 per cent of MENA’s youth (15-24 years) live in fragile and conflict-affected states.43 While only about 6 per cent of the world’s adolescents live in the Middle East and North
Africa, 70 per cent of adolescents who died in 2015 due to collective violence44 were living in this region – with mortality rates having risen dramatically since 2011.45 For adolescent boys, Syria and Iraq were among the top ten most deadly places in 2015, having the world’s highest mortality rates for collective violence and homicide.46 Gender-based violence is exacerbated by conflict, such as that in Iraq, where the targeting of young women with rape, enslavement and other forms of violence was regularly documented by the Office for the Coordination of Humanitarian Affairs OCHA in 2017.
Violence at home and school – Adolescent girls and boys report the use of physical and psychological violence at home by caregivers and other relatives. Girls report both feeling trapped at home, for the sake of their reputation, and experiencing physical and psychological violence perpetrated by male relatives.47 In 13 of the 16 MENA countries with data available on bullying, more than 1 in 4 adolescents aged 13 to 15 reported being bullied at school at least once in the past two months (rising to more than 50 per cent in Egypt, the State of Palestine and Algeria). Corporal punishment by teachers in school remains legal in Iran, Iraq, Lebanon, Morocco, Qatar and Syria, with only partial prohibitions in the State of Palestine.48
3 . B A R R I E R S T O T H E D I V I D E N D I N M E N A A N D I M P L I C AT I O N S F O R S E R V I C E P R O V I S I O N
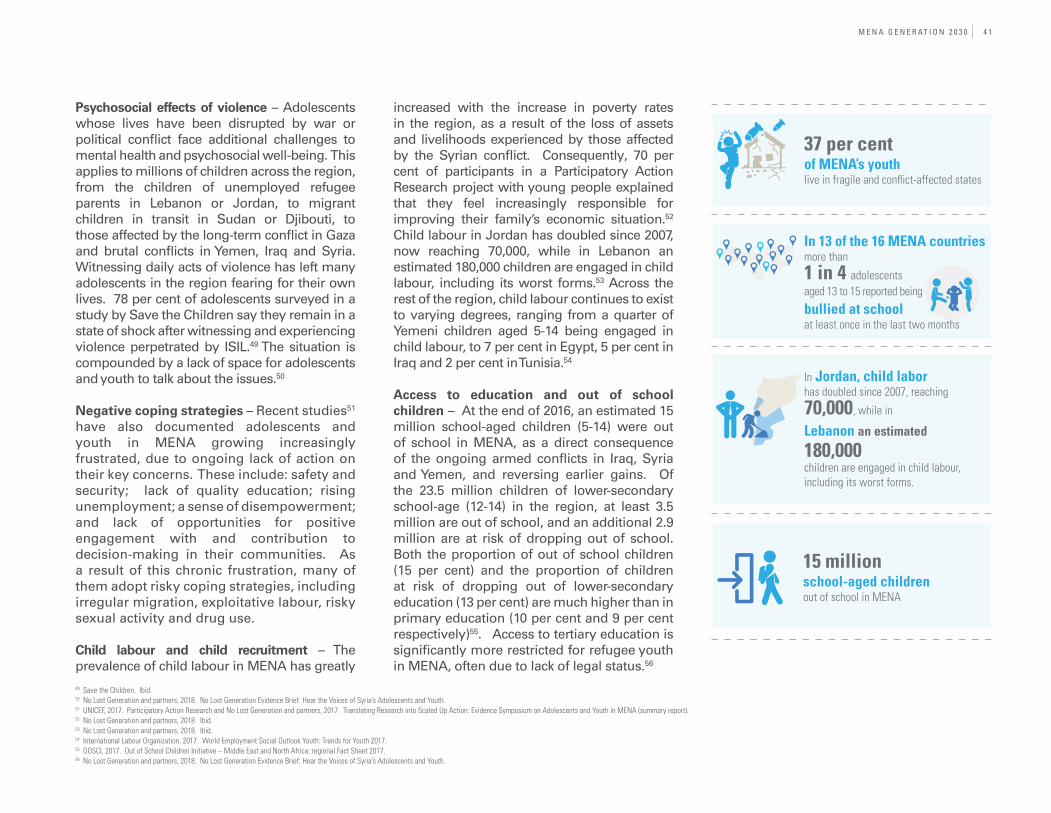
M E N A G E N E R AT I O N 2 0 3 0 4 1
49 Save the Children. Ibid. 50 No Lost Generation and partners, 2018. No Lost Generation Evidence Brief: Hear the Voices of Syria’s Adolescents and Youth. 51 UNICEF, 2017. Participatory Action Research and No Lost Generation and partners, 2017. Translating Research into Scaled Up Action: Evidence Symposium on Adolescents and Youth in MENA (summary report). 52 No Lost Generation and partners, 2018. Ibid. 53 No Lost Generation and partners, 2018. Ibid. 54 International Labour Organization, 2017. World Employment Social Outlook Youth: Trends for Youth 2017. 55 OOSCI, 2017. Out of School Children Initiative – Middle East and North Africa: regional Fact Sheet 2017.56 No Lost Generation and partners, 2018. No Lost Generation Evidence Brief: Hear the Voices of Syria’s Adolescents and Youth.
Psychosocial effects of violence – Adolescents whose lives have been disrupted by war or political conflict face additional challenges to mental health and psychosocial well-being. This applies to millions of children across the region, from the children of unemployed refugee parents in Lebanon or Jordan, to migrant children in transit in Sudan or Djibouti, to those affected by the long-term conflict in Gaza and brutal conflicts in Yemen, Iraq and Syria. Witnessing daily acts of violence has left many adolescents in the region fearing for their own lives. 78 per cent of adolescents surveyed in a study by Save the Children say they remain in a state of shock after witnessing and experiencing violence perpetrated by ISIL.49 The situation is compounded by a lack of space for adolescents and youth to talk about the issues.50
Negative coping strategies – Recent studies51 have also documented adolescents and youth in MENA growing increasingly frustrated, due to ongoing lack of action on their key concerns. These include: safety and security; lack of quality education; rising unemployment; a sense of disempowerment; and lack of opportunities for positive engagement with and contribution to decision-making in their communities. As a result of this chronic frustration, many of them adopt risky coping strategies, including irregular migration, exploitative labour, risky sexual activity and drug use. Child labour and child recruitment – The prevalence of child labour in MENA has greatly
increased with the increase in poverty rates in the region, as a result of the loss of assets and livelihoods experienced by those affected by the Syrian conflict. Consequently, 70 per cent of participants in a Participatory Action Research project with young people explained that they feel increasingly responsible for improving their family’s economic situation.52 Child labour in Jordan has doubled since 2007, now reaching 70,000, while in Lebanon an estimated 180,000 children are engaged in child labour, including its worst forms.53 Across the rest of the region, child labour continues to exist to varying degrees, ranging from a quarter of Yemeni children aged 5-14 being engaged in child labour, to 7 per cent in Egypt, 5 per cent in Iraq and 2 per cent in Tunisia.54
Access to education and out of school children – At the end of 2016, an estimated 15 million school-aged children (5-14) were out of school in MENA, as a direct consequence of the ongoing armed conflicts in Iraq, Syria and Yemen, and reversing earlier gains. Of the 23.5 million children of lower-secondary school-age (12-14) in the region, at least 3.5 million are out of school, and an additional 2.9 million are at risk of dropping out of school. Both the proportion of out of school children (15 per cent) and the proportion of children at risk of dropping out of lower-secondary education (13 per cent) are much higher than in primary education (10 per cent and 9 per cent respectively)55. Access to tertiary education is significantly more restricted for refugee youth in MENA, often due to lack of legal status.56
37 per cent of MENA’s youth live in fragile and confl ict-affected states
In 13 of the 16 MENA countries more than 1 in 4 adolescents aged 13 to 15 reported being bullied at schoolat least once in the last two months
In Jordan, child labor has doubled since 2007, reaching 70,000, while in
Lebanon an estimated 180,000children are engaged in child labour, including its worst forms.
15 million school-aged children out of school in MENA

4 2 M E N A G E N E R AT I O N 2 0 3 0
57 UNICEF, 2017. Adolescent and Youth Engagement Strategic Framework. 58 No Lost Generation and partners, 2017. Translating Research into Scaled Up Action: Evidence Symposium on Adolescents and Youth in MENA (summary report). 59 Mercy Corps, 2012. Civic Engagement of Youth in the Middle East and North Africa: An Analysis of Key Drivers and Outcomes. 60 UNICEF EMS data (Jordan, the State of Palestine and Syria).61 No Lost Generation and partners, 2017. Translating Research into Scaled Up Action: Adolescent and Youth Engagement in MENA.62 Ibid. 63 Ibid. 64 No Lost Generation and partners, 2018. Ibid. 65 No Lost Generation and partners, 2017. Translating Research into Scaled Up Action: Adolescent and Youth Engagement in MENA.66 UNICEF mapping of adolescent and youth civic and economic engagement.67 UNICEF, 2016. Good Practices in Adolescent and Youth Programming, UNICEF, AUB on behalf of the UN Inter Agency Adolescent and Youth Group. 68 No Lost Generation and partners, 2017. Translating Research into Scaled Up Action: Evidence Symposium on Adolescents and Youth in MENA (summary report). 69 UNICEF, 2018. Child Poverty in the Arab States: Analytical Report of Eleven countries.
There are limited opportunities for them to collaborate and develop a sense of shared responsibility62 and few spaces where they can create and enjoy their own world.
As a result, adolescents and youth in MENA feel disillusioned, with girls and young women, refugees, those with disabilities and the poor being particularly marginalised and underrepresented.63 Disenfranchisement is a recurring theme among young Syrians, for example, who feel disempowered and unable to control their situation or to end the war and violence that surrounds them.64
Specific barriers to youth engagement in the MENA context include:65
Patriarchal systems which hinder engagement and participation
Lack of attention paid to the voices of youth at a household, community and local governance level
Inequities and challenges within school systems
Intersecting vulnerabilities and violations of rights
Lack of safe spaces for expression and recreation
Some progress has been made, with 1 million adolescents and youth being involved in civic engagement programmes.66 Examples of good practice have demonstrated that when adolescent and youth engagement is facilitated well, it has lasting effects on social and political participation throughout the life cycle.67
But adolescent and youth engagement in MENA is still very limited, particularly among girls and young women, and there are few long-term programmes in the region.68 Sustained efforts on the part of national, local and international organisations and adolescents themselves are required to create safe spaces for expression.
Overall, a significant shift is needed towards an approach that pays attention to adolescents’ and youth’s voices and encourages their participation, nurturing their potential as agents of change and society’s most promising asset for peacebuilding, social cohesion and economic growth.69
Lack of engagement
Adolescent and youth engagement is defined as the rights-based inclusion of adolescents and youth in areas that affect their lives and their communities, including dialogue, decision-making processes and programmes.57
Adolescent- and youth-led civic engagement interventions are those that support adolescents and youth to make a difference in their communities.58 Such engagement and participation at individual, household and community level can have a positive impact on trust, accountability, job opportunities and attitudes towards domestic violence.59
Engagement with parents, teachers and the community helps to change the perception of adolescents and youth as troublesome to valuing them as an asset to the community.60
However, civic engagement levels among the adolescents and youth of the region are the lowest in the world, with only 9 per cent of youth across Arab countries volunteering with a civic organisation in any given month, compared with 14 per cent in the next lowest region (sub-Saharan Africa). Adolescents’ and youth’s sense of citizenship is compromised by violence, social norms and other factors.61
→
→
→
→
→
M E N A G E N E R AT I O N 2 0 3 0 4 3
70 No Lost Generation and partners, 2017. Translating Research into Scaled Up Action: Adolescent and Youth Engagement in MENA. 71 Ibid. 72 UNICEF, 2018. Child Poverty in the Arab States: Analytical Report of Eleven countries. 73 Egypt, Algeria, Jordan, the State of Palestine, Tunisia, Iraq, Morocco, Comoros, Mauritania, Sudan and Yemen.74 No Lost Generation and partners, 2017. Translating Research into Scaled Up Action: Adolescent and Youth Engagement in MENA.
Poverty-related deprivations include:
Health and nutrition – Findings included both widespread malnutrition and 44 per cent of children experiencing some form of health deprivation.
Protection – Several of the deprivations experienced by children and adolescents and youth point to lack of access to social protection systems. These systems should guarantee access to a full range of services, protecting families, children and adolescents and youth from material poverty and deprivation in multiple dimensions.
Education – The poorest children are at least 3.6 times less likely to attend school and 5 times less likely to complete primary school than the richest children. This uneven access to education is reflected across the MENA region as a whole, with deficits in rural areas and marginalised communities.74
Employment – Youth from the poorest households generally have little access to adequate education and skills development opportunities. In addition, young people increasingly find themselves with casual work or work in an informal sector where protections are limited and low productivity jobs offer few opportunities to build new skills. One in every four (25 per cent) working youth in North Africa and 28 per cent of working youth in the Arab states is living in moderate or extreme poverty.
Barriers related to inclusive and equitable economic and social policy
Most countries in MENA continue to marginalise the most vulnerable adolescents and youth, particularly those who are young women, poor, refugees70 or who have disabilities, impacting their ability to realise their full potential. This inequity prevails across the region and is at the heart of many of the challenges encountered by adolescents and youth.71 Key aspects of the current exclusion and inequity in the region include:
Poverty-based exclusion and inequity
Multidimensional poverty, both at the individual and household level, is a reality in the MENA region as it is worldwide.72 The recent Child Poverty in the Arab States report, though based on 11 countries73 and not representative of the region as a whole, took into account 78 per cent of the under -18 population in the relevant countries (approximately 118 million). It considered seven dimensions of the well-being of children and adolescents and youth, including: water, sanitation, housing, nutrition, health, education and information.
Of those 118 million under-18-year-olds, approximately 53 million (nearly half) experience moderate poverty, while 29. 3 million (1 in 4 on average) experience acute poverty. Many families face overlapping deprivations, hindering the ability of their children and adolescents and youth to reach their full potential; in Sudan, for example, 1 in 2 children experience moderate deprivation in 4 or more dimensions simultaneously. There are significant inequalities in child deprivation between and within countries, with the most significant influencing factors being: the area in which children and adolescents and youth live (those in rural areas being 5 times more likely to be acutely deprived of sanitation, for example), the education level of the household and wealth.

4 4 M E N A G E N E R AT I O N 2 0 3 0
75 UNICEF, 2018. Child Poverty in the Arab States: Analytical Report of Eleven countries. 76 No Lost Generation and partners, 2017. Translating Research into Scaled Up Action: Evidence Symposium on Adolescents and Youth in MENA (summary report). 77 No Lost Generation and partners, 2017. Translating Research into Scaled Up Action: Evidence Symposium on Adolescents and Youth in MENA (summary report). 78 ASDA’A Bursan-Marsteller, 2017. Arab Youth Survey. 79 UNICEF, 2017. Child Marriage Study in Middle East & North Africa. 80 UNICEF, 2017. A Familiar Face: Violence in the Lives of Children and Adolescents. 81 No Lost Generation and partners, 2017. Translating Research into Scaled Up Action: Evidence Symposium on Adolescents and Youth in MENA (summary report). 82 Ibid. 83 No Lost Generation and partners, 2018. No Lost Generation Evidence Brief: Hear the Voices of Syria’s Adolescents and Youth. 84 Ibid. 85 No Lost Generation and partners, 2018. We Made a Promise: Ensuring Learning Pathways and Protection for Syrian Children and Youth.
For the demographic transition to result in a dividend in these countries, investments must be made to ensure that children, adolescents and youth have access to a full range of health services, adequate nutrition, education and social protection benefits to alleviate the impact of material deprivation. Between 2000 and 2015 there have been improvements in the basic level of child well-being in most countries, especially Jordan, Egypt and the State of Palestine, but ongoing challenges remain.75
An integrated approach is needed, focusing on meeting the needs of children who face multiple deprivations as its first priority. This will enable children and adolescents and youth to grow up into adults who are fully equipped to make an optimal contribution to society and the economy, accelerating poverty reduction and progress towards the Sustainable Development Goals (SDGs).
Gender-based exclusion and inequity
Though gender norms and beliefs are dynamic over the individual’s life course, their influences peak during adolescence.76
Gender-based barriers to engagement affect girls and young women in MENA negatively, as conservative norms and the associated discrimination in homes, educational institutions and the workplace result in their being barred from full participation in civic, social and economic platforms.
There is evidence that the negative impact of these norms is worsening:
Girls are more likely than boys never to enter school; and the higher the level of education the more likely girls are to be excluded. The out-of-school rate for primary education is 11 per cent for girls, compared to 9 per cent for boys; and in lower-secondary education, it is 18 per cent for girls, compared to 12 per cent for boys.
Girls who take initiatives regarding their own empowerment often face a backlash, or in extreme cases, honour killing.77
In 2017, 90 per cent of young women and 73 per cent of young men responding to the Arab Youth Survey suggested that their leaders should do more to improve the personal freedoms and human rights of women.78
Specific barriers to the empowerment of girls and young women in the region include:
Gender-based violence – Gender-based violence, including intimate partner violence, is a harsh reality of life for many young women in MENA. 18 per cent of girls in the region are married before the age of 1879 and among girls who have ever been married in Jordan, for example, more than 1 in 10 report having experienced forced sex by a partner or husband.80 Across the region as a whole, adolescent girls report violence, both physical and psychological, as being consistently perpetrated against them by male relatives.81 Almost half of female homicide victims (47 per cent) are killed by family members or intimate partners, compared to about 6 per cent of males.82 The crisis in Syria has increased the vulnerability of adolescent girls to gender-based violence.83
Child marriage – The high prevalence of child marriage remains an obstacle to girls’ development in a number of countries in the region. Though the overall rate of child marriage in MENA has been decreasing for decades, currently one in five girls in the region are married before the age of 18 and the rate is increasing in conflict-affected settings as a response to instability.84 The crisis in Syria, for example, has led to child marriage being used as a coping mechanism by families facing economic pressure and also as a protection measure for girls in the face of insecurity.85 The practice is also particularly prevalent in Sudan and Yemen, where one in three girls are married before the age of 18 (see Figure 16).
Out-of-school rate
Out-of-school rate
Primary education
Secondary education
11%for girls
18%for girls
9%for boys
12%for boys
→
→
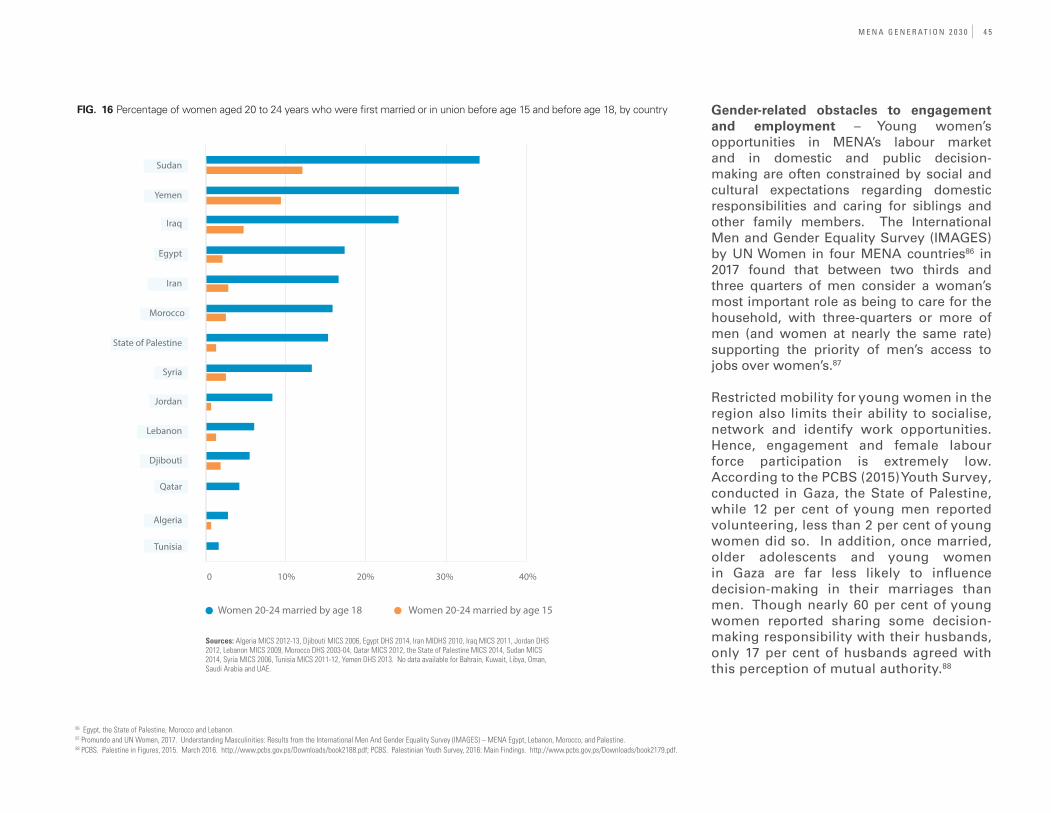
M E N A G E N E R AT I O N 2 0 3 0 4 5
FIG. 16 Percentage of women aged 20 to 24 years who were first married or in union before age 15 and before age 18, by country
Sources: Algeria MICS 2012-13, Djibouti MICS 2006, Egypt DHS 2014, Iran MIDHS 2010, Iraq MICS 2011, Jordan DHS 2012, Lebanon MICS 2009, Morocco DHS 2003-04, Qatar MICS 2012, the State of Palestine MICS 2014, Sudan MICS 2014, Syria MICS 2006, Tunisia MICS 2011-12, Yemen DHS 2013. No data available for Bahrain, Kuwait, Libya, Oman, Saudi Arabia and UAE.
Women 20-24 married by age 18 Women 20-24 married by age 15
Iran
Egypt
Lebanon
Algeria
Yemen
Morocco
Iraq
Jordan
Djibouti
Tunisia
Qatar
Sudan
0 10% 20% 30% 40%
Gender-related obstacles to engagement and employment – Young women’s opportunities in MENA’s labour market and in domestic and public decision-making are often constrained by social and cultural expectations regarding domestic responsibilities and caring for siblings and other family members. The International Men and Gender Equality Survey (IMAGES) by UN Women in four MENA countries86 in 2017 found that between two thirds and three quarters of men consider a woman’s most important role as being to care for the household, with three-quarters or more of men (and women at nearly the same rate) supporting the priority of men’s access to jobs over women’s.87
Restricted mobility for young women in the region also limits their ability to socialise, network and identify work opportunities. Hence, engagement and female labour force participation is extremely low. According to the PCBS (2015) Youth Survey, conducted in Gaza, the State of Palestine, while 12 per cent of young men reported volunteering, less than 2 per cent of young women did so. In addition, once married, older adolescents and young women in Gaza are far less likely to influence decision-making in their marriages than men. Though nearly 60 per cent of young women reported sharing some decision-making responsibility with their husbands, only 17 per cent of husbands agreed with this perception of mutual authority.88
State of Palestine
Syria
86 Egypt, the State of Palestine, Morocco and Lebanon.87 Promundo and UN Women, 2017. Understanding Masculinities: Results from the International Men And Gender Equality Survey (IMAGES) – MENA Egypt, Lebanon, Morocco, and Palestine. 88 PCBS. Palestine in Figures, 2015. March 2016. http://www.pcbs.gov.ps/Downloads/book2188.pdf; PCBS. Palestinian Youth Survey, 2016: Main Findings. http://www.pcbs.gov.ps/Downloads/book2179.pdf.

4 6 M E N A G E N E R AT I O N 2 0 3 0
Gender-related obstacles in the workplace, including discriminatory work practices and remuneration, sexual harassment and lack of policies supporting working mothers are all further disincentives to workplace engagement for the region’s young women.89 These obstacles have serious consequences for the young women themselves and the region as a whole; a 2015 study by McKinsey and Company calculated that if women in MENA enjoyed the same economic opportunities as men, the region would gain US$2.7 trillion by 2025, boosting GDP by 47 per cent.90
Marginalisation of refugee children, adolescents and youth
MENA’s refugee children, adolescents and youth are also particularly at risk of exclusion, for a wide range of reasons. These include discrimination and violence in schools, issues of quality and certification of their schools, decimation of family assets and livelihoods, limited freedom of movement, restrictive labour laws, a higher incidence of disability and lack of documentation.91 Refugee families are also exposed to high levels of psychosocial distress and, as one example of this, poor conditions in camps are often cited as demoralising by children and adolescents alike.92
Although host countries continue to make a significant contribution by opening their national education systems to refugee children and
removing barriers to access, about 35 per cent of school-aged Syrian refugees in neighbouring host countries are still out of school. In addition, refugee children are suffering from cumulative psychosocial distress resulting from individual and collective experiences of war, violence, family separation and displacement, combined with new sources of stress in their countries of refuge, all of which have an impact on their ability to learn. After years in exile and with savings depleted, there is growing evidence of an increased recourse to both child labour and child marriage as negative coping strategies amongst refugees from Syria.93
The impact of refugees on host country labour markets and wages are difficult to ascertain. Economies in the host countries were grappling with high unemployment rates, even prior to the influx of refugees. About 50 per cent of Syrian refugees are of working age, with many of them working in the informal sector, due to lower education levels and/or lack of work permits. Youth are much more likely to compete occupationally with Syrian refugees in the labour market and to be concentrated in the sectors (tourism and trade) whose growth is most impacted by the crisis.94
Marginalisation of children and youth with disabilities
Access to health, protection, education, civic participation and employment are even more
Box 3: Children with disabilities in Syria
The experience of children with disabilities (both conflict-related and non-conflict-related) is often one of marginalisation and disempowerment. Many live isolated lives and struggle against stigma, discrimination and an environment that does not accommodate their needs and excludes them from social participation.
An estimated 3.3 million children inside Syria are exposed to explosive hazards
Lack of access to proper medical and psychological care has prolonged or worsened injuries and disabling conditions among children
Children with disabilities are exposed to higher risks of violence and face difficulties accessing basic services including education
Families of children with disabilities in a conflict or crisis often lack the means or ability to provide their children with the assistive equipment they need
→
89 Promundo and UN Women, 2017. Understanding Masculinities: Results from the International Men And Gender Equality Survey (IMAGES) – MENA Egypt, Lebanon, Morocco, and Palestine. 90 Mckinsey Global Institute report : The Power of Parity ,How Advancing Women’s Equality can add $12 Trillion to Global Growth -Sep 2015. 91 No Lost Generation and partners, 2018. We made a Promise – Ensuring Learning Pathways and Protection for Syrian Children and Youth; Supporting the Future of Syria and the region – Brussels II Conference April 2018.92 UNICEF, 2017. Participatory Action Research. 93 No Lost Generation and partners, 2018. Ibid. 94 The World Bank (2017): MENA Economic Monitor – Refugee Crisis in MENA Meeting the Development Challenge.
→
→
→
limited for MENA’s children, adolescents and youth living with disabilities. They face discrimination both inside Syria, for example, (see Box 3), where their number has increased significantly in recent years due to the conflict, and across the region as a whole.
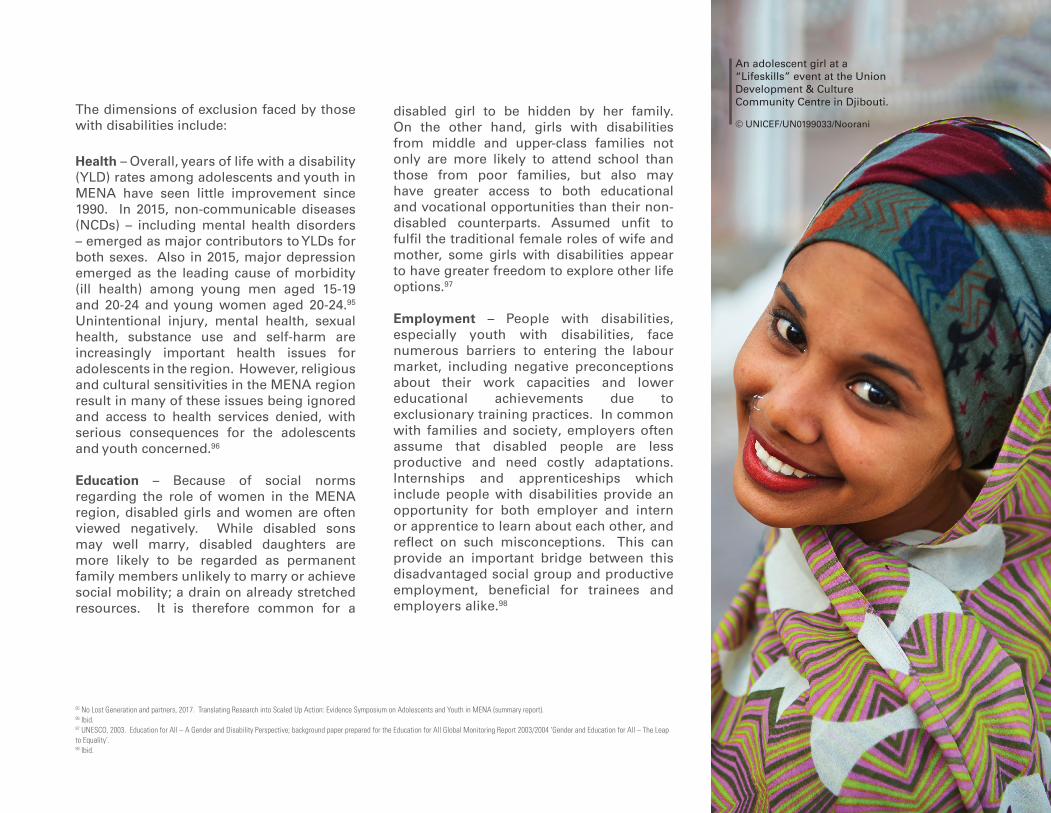
M E N A G E N E R AT I O N 2 0 3 0 4 7
The dimensions of exclusion faced by those with disabilities include:
Health – Overall, years of life with a disability (YLD) rates among adolescents and youth in MENA have seen little improvement since 1990. In 2015, non-communicable diseases (NCDs) – including mental health disorders – emerged as major contributors to YLDs for both sexes. Also in 2015, major depression emerged as the leading cause of morbidity (ill health) among young men aged 15-19 and 20-24 and young women aged 20-24.95
Unintentional injury, mental health, sexual health, substance use and self-harm are increasingly important health issues for adolescents in the region. However, religious and cultural sensitivities in the MENA region result in many of these issues being ignored and access to health services denied, with serious consequences for the adolescents and youth concerned.96
Education – Because of social norms regarding the role of women in the MENA region, disabled girls and women are often viewed negatively. While disabled sons may well marry, disabled daughters are more likely to be regarded as permanent family members unlikely to marry or achieve social mobility; a drain on already stretched resources. It is therefore common for a
disabled girl to be hidden by her family. On the other hand, girls with disabilities from middle and upper-class families not only are more likely to attend school than those from poor families, but also may have greater access to both educational and vocational opportunities than their non-disabled counterparts. Assumed unfit to fulfil the traditional female roles of wife and mother, some girls with disabilities appear to have greater freedom to explore other life options.97
Employment – People with disabilities, especially youth with disabilities, face numerous barriers to entering the labour market, including negative preconceptions about their work capacities and lower educational achievements due to exclusionary training practices. In common with families and society, employers often assume that disabled people are less productive and need costly adaptations. Internships and apprenticeships which include people with disabilities provide an opportunity for both employer and intern or apprentice to learn about each other, and reflect on such misconceptions. This can provide an important bridge between this disadvantaged social group and productive employment, beneficial for trainees and employers alike.98
95 No Lost Generation and partners, 2017. Translating Research into Scaled Up Action: Evidence Symposium on Adolescents and Youth in MENA (summary report). 96 Ibid. 97 UNESCO, 2003. Education for All – A Gender and Disability Perspective; background paper prepared for the Education for All Global Monitoring Report 2003/2004 ‘Gender and Education for All – The Leap to Equality’.98 Ibid.
An adolescent girl at a “Lifeskills” event at the Union Development & Culture Community Centre in Djibouti.
© UNICEF/UN0199033/Noorani
4 8 M E N A G E N E R AT I O N 2 0 3 0
99 No Lost Generation and partners, 2017. Ibid. 100 International Labour Organization – Department of Statistics (ILO-STAT), 2017. Modelled Estimates, November 2017 http://www.ilo.org/ilostat.101 No Lost Generation and partners, 2018. No Lost Generation Evidence Brief: Hear the Voices of Syria’s Adolescents and Youth. 102 Save the Children and UNICEF, 2018. Evidence Brief: Violence Against Adolescents and Youth in MENA.103 ASDA’A Bursan-Marsteller, 2017. Arab Youth Survey. 104 UNICEF, 2017.Reimagining Life Skills and Citizenship Education in the Middle East and North Africa: a Four-Dimensional and Systems Approach to 21st Century Skills, available at www.lsce-MENA.org.105 UNICEF, 2017.Ibid. 106 ASDA’A Bursan-Marsteller, 2017. Ibid. 107 IEA (2015): TIMSS International Results in Mathematics 2015; IEA (2015): TIMSS International Results in Science 2015; IEA (2016): PIRLS Progress in International Reading Literacy Study 2016.108 TIMSS 2003 to 2015 – Mathematics test scores: Jordan -38 points, Egypt -14 points, Morocco -3 points; TIMSS 2003 to 2015 – Science test scores: Egypt -50 points, Jordan -49 points, Morocco -3 points, Saudi Arabia -2 points.109 World Economic Forum, 2017. The Global Competitiveness Repot 2017-2018 – Economic Profiles.
Barriers related to expanded employment opportunities
Youth unemployment (15-24 years) in the region is currently the highest in the world and is a challenge both for those unable to complete formal education and for those with relevant secondary or tertiary qualifications.99
As of 2018, an estimated 29.3 per cent of adolescents and youth in North Africa and 22.2 per cent in the Arab states are unemployed. For female youth, the unemployment rate is even higher, being 40.3 per cent in North Africa and 36.5 per cent in the Arab States.100 Unemployment is also particularly high among Syrian refugees in host countries, at 60.8 per cent in Jordan, for example.101
Unemployment puts many adolescents and youth at risk of exploitation and makes them more likely to engage in risky behaviour, in an attempt to achieve financial independence
or contribute much needed cash to their families.102 Yet in 2017 only half of the youth who responded to the Arab Youth Survey were confident that their government was dealing with this issue.103 Specific barriers to employment opportunities in MENA include:
Poor quality education
Supply side barriers to the provision of the kind of education and learning outcomes needed to empower MENA’s children and youth as personally empowered, active and effective lifelong learners, workers and citizens - as per the vision set out in the region’s Life Skills and Citizenship Education (LSCE) initiative104 - include:
Centralised systems – Centralised education systems with poor governance still prevail across MENA. Current reform programmes fall short of addressing structural challenges related to teacher status, professional development and qualifications, as well as approaches to teaching, learning and assessment, school governance and accountability. In addition, spending on education (15 per cent of national budgets on average) is not focused on enabling the equity of access and efficient use of resources required for MENA’s learners to make significant progress. Most expenditure goes on salaries (more than 90 per cent), which are managed centrally.
Outdated methodology and curricula – Traditional teacher-centred and knowledge-based approaches to learning and
outdated curricula are failing to facilitate the skills development that characterises quality education and is essential for lifelong learning, employability, personal empowerment and active citizenship.105 Consequently, the Arab Youth Survey in 2017, for example, found that 66 per cent of youth in the Levant feel that the education system is not preparing them for the future.106
Some MENA countries, including Tunisia and Egypt, have adopted reforms aimed at introducing more student-centred learning and competency-based curricula, but there is little evidence of a significant shift away from traditional models of teaching and learning in the region as a whole.
Poor learning outcomes – In international assessments107 of learning outcomes, participating countries in MENA perform at the bottom; in some countries more than half of the children in school do not meet the lowest benchmark. With a few exceptions,108 learning achievements in the region have actually declined during the past 12 years. Most of the MENA countries participating in global competitiveness rankings are also listed quite low, with regard to quality of primary education and the education system as a whole, both of which are regarded as key indicators of economic competitiveness.109

M E N A G E N E R AT I O N 2 0 3 0 4 9
110 No Lost Generation and partners, 2017. Translating Research into Scaled Up Action: Evidence Symposium on Adolescents and Youth in MENA (summary report). 111 UNICEF, 2017. Reimagining Life Skills and Citizenship Education in the Middle East and North Africa: a Four-Dimensional and Systems Approach to 21st Century Skills. Conceptual andProgrammatic Framework. 112 No Lost Generation and partners, 2017. Translating Research into Scaled Up Action: Adolescent and Youth Engagement in MENA. 113 ETF, 2015. The Challenge of Youth Employability in Arab Mediterranean countries: The Role of Active Labour Markets Programmes.
Mismatch between skills and labour market requirements
The mismatch between the skills required by the labour market and those of the learners in MENA’s current education systems is a major contributing factor to unemployment, and is as much a problem in higher education as in primary and secondary.110 Those learners in the region who do make it into the marketplace are often ill-equipped for its demands, with employers reporting a widespread shortage of crucial life skills such as creativity, critical thinking, problem-solving and communication.111 One reason for this is the lack of social support for, or opportunities to gain, work experience before leaving school.112
There is also a high degree of dissatisfaction among employers concerning the level of preparedness of Technical and Vocational Education and Training (TVET) graduates.113
Lack of available jobs
While MENA’s adolescents and youth are finding that their skills do not match those demanded by the market, the market is in turn failing to generate enough jobs to accommodate school leavers. Jobs in the formal private sector are particularly difficult
On 13 October 2016, at the UNICEF child friendly space, Lebanon, 11-year-old Fati-ma Al-loz, a refugee from Syria, plays a traditional drum.
© UNICEF/UN043565/Lister

5 0 M E N A G E N E R AT I O N 2 0 3 0
114 No Lost Generation and partners, 2017. Ibid. 115 Tzannatos, Z. et al, 2014. Labour Demand and Social Dialogue: Two Binding Constraints for Decent Work for Youth in the Arab region. Employment Working Paper no. 164. International Labour Office, Employment and Labour Market Policies Branch, ILO in UNICEF 2017 Reimagining Life Skills and Citizenship Education in the Middle East and North Africa: A Four-Dimensional and Systems Approach to 21st Century Skills, available at www. lsce-MENA.org.116 World Health Organization, 2016. Health Workforce Requirements for Universal Health Coverage and the Sustainable Development Goals.
for adolescents and youth to access.114 An inverse correlation between educational attainment and employment exists in many MENA countries. Overall, each additional year of schooling adds only around 5.4 per cent to earnings, compared to the world average of 7 per cent. The corresponding ‘graduation unemployment’ is eroding both perceptions of, and the incentive to participate in, secondary and post-secondary education, particularly for girls in the region.115
Implications for basic service provision
Implications for the scaling up of essential service provision in MENA, in light of the demographic projections and current barriers to benefiting from the demographic dividend highlighted above, include the following (illustrative examples only):
Example – Health service provision
The gap analysis of health service provision aims to clarify the extent of investment in human capital required in the health sector to catalyse a demographic dividend for all of MENA, in light of the demographic projections outlined in chapters 2 and 3. The data provides insights into the strength of
the health system, particularly in relation to international standards.
The World Health Organization (WHO) has identified a ‘Sustainable Development Goals index threshold’ of 4.45 doctors, nurses and midwives per 1000 people, to ensure a health workforce of sufficient density to attain the targets of the SDGs.116 This standard enables focused assessment of the extent to which a health system is robust enough to withstand shocks and deliver results. The gap analysis of health systems to follow compares current numbers of the health workforce in MENA with the numbers needed in 2030 in light of both the projected changes in population size and the WHO SDG index threshold.
The trend in the number of health service providers is projected on the basis of the data available for the years 2000-2015, using fixed effects linear regression. Fixed effects estimation allows us to estimate the trend in health service providers for each country until 2030, assuming that the country-specific effects correlate with the population size. However, it is important to note that these projections are based solely on past trends, and that situations of war and conflict will alter the eventual reality on the ground significantly. This is particularly relevant for countries such as Libya, Iraq and Syria, all of which are experiencing protracted crises.
The number of projected health service providers in 2030 is then compared with the number of health service providers needed in 2030 to meet the WHO minimum standard based on the projected population in 2030, to quantify the gap in health service provision expected by 2030 (see Figure 17).
There is considerable divergence between MENA countries in terms of the strength of their health systems. Eleven out of 19 countries (the State of Palestine is excluded from the analysis due to the lack of available data) had met the minimum WHO standard for health service provision outlined above by 2015, with the highest density of health service providers being in Qatar (9.4 per 1,000 inhabitants) and Libya (8.0).
However, in 2015 only 27.5 per cent of the region’s population lived in countries which met the WHO standard, and the population weighted average number of health service providers per 1000 people in the region as a whole was only 3.7, for example, well below the recommended level of 4.45 skilled health personnel per 1,000 inhabitants.
In absolute terms, across the MENA region as a whole, about 1.7 million health service providers (doctors, nurses and midwives) were available for a total population of around 450 million in 2015. If growth trends in health personnel from the period 2000-2015
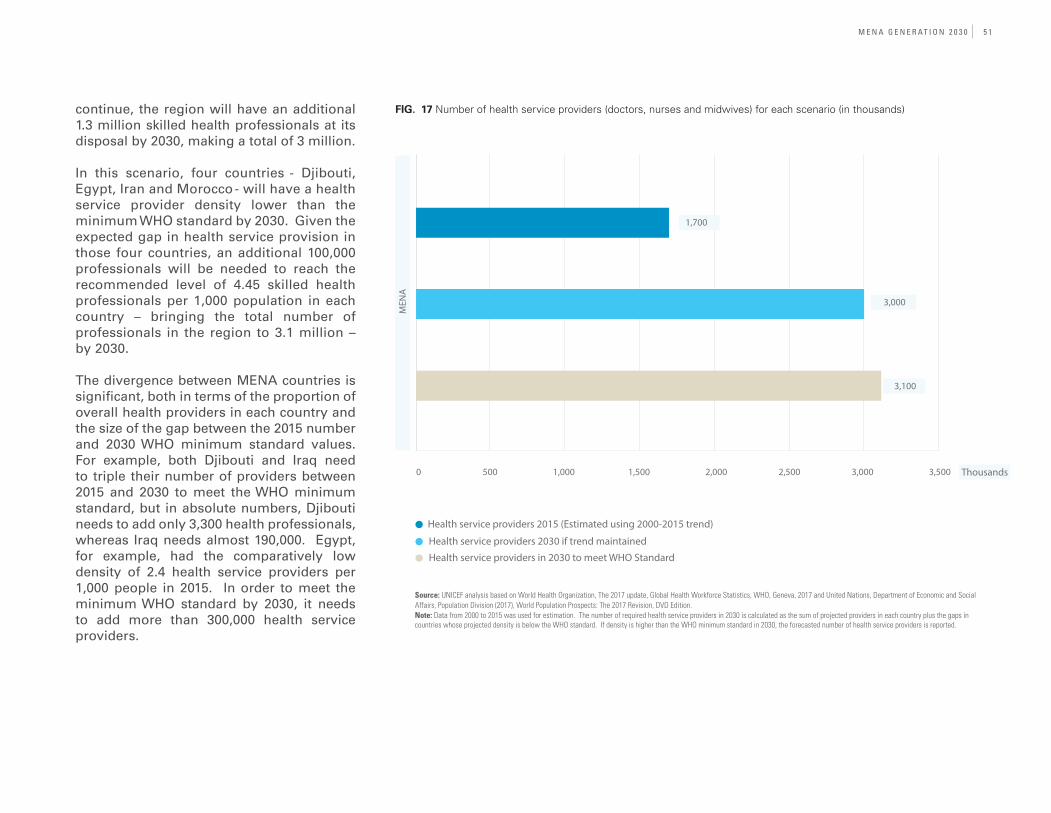
M E N A G E N E R AT I O N 2 0 3 0 5 1
FIG. 17 Number of health service providers (doctors, nurses and midwives) for each scenario (in thousands)
Source: UNICEF analysis based on World Health Organization, The 2017 update, Global Health Workforce Statistics, WHO, Geneva, 2017 and United Nations, Department of Economic and Social Affairs, Population Division (2017), World Population Prospects: The 2017 Revision, DVD Edition. Note: Data from 2000 to 2015 was used for estimation. The number of required health service providers in 2030 is calculated as the sum of projected providers in each country plus the gaps in countries whose projected density is below the WHO standard. If density is higher than the WHO minimum standard in 2030, the forecasted number of health service providers is reported.
continue, the region will have an additional 1.3 million skilled health professionals at its disposal by 2030, making a total of 3 million.
In this scenario, four countries - Djibouti, Egypt, Iran and Morocco - will have a health service provider density lower than the minimum WHO standard by 2030. Given the expected gap in health service provision in those four countries, an additional 100,000 professionals will be needed to reach the recommended level of 4.45 skilled health professionals per 1,000 population in each country – bringing the total number of professionals in the region to 3.1 million – by 2030.
The divergence between MENA countries is significant, both in terms of the proportion of overall health providers in each country and the size of the gap between the 2015 number and 2030 WHO minimum standard values. For example, both Djibouti and Iraq need to triple their number of providers between 2015 and 2030 to meet the WHO minimum standard, but in absolute numbers, Djibouti needs to add only 3,300 health professionals, whereas Iraq needs almost 190,000. Egypt, for example, had the comparatively low density of 2.4 health service providers per 1,000 people in 2015. In order to meet the minimum WHO standard by 2030, it needs to add more than 300,000 health service providers.
0 500 1,000 1,500 2,000 2,500 3,000 3,500
1,700
MEN
A
3,000
3,100
Thousands
Health service providers 2015 (Estimated using 2000-2015 trend)
Health service providers 2030 if trend maintainedHealth service providers in 2030 to meet WHO Standard

5 2 M E N A G E N E R AT I O N 2 0 3 0
TABLE 3 Estimated number of health service providers (doctors, nurses and midwives) for each scenario by country
Country or Area Health service providers in 2015 (estimated using
2000-2015 trend)
WHO threshold met, 2015 Health service providers 2030 if trend maintained
Health service providers in 2030 if all countries meet
WHO StandardAlgeria 179,600 Yes 277,643 277,643Bahrain 7,405 Yes 14,430 14,430Djibouti 1,722 No 3,971 5,041Egypt 222,877 No 507,323 532,868Iran 256,562 No 360,656 395,442Iraq 106,135 No 294,346 294,346Jordan 65,596 Yes 87,096 87,096Kuwait 30,192 Yes 40,465 40,465Lebanon 37,375 Yes 32,085 32,085Libya 49,893 Yes 62,023 62,023Morocco 76,005 No 142,498 181,888Oman 31,137 Yes 49,733 49,733State of Palestine* Qatar 23,313 No 31,532 31,532Saudi Arabia 224,889 No 311,679 311,679Sudan 129,660 Yes 307,055 307,055Syria 63,368 Yes 149,614 149,614Tunisia 53,114 No 70,289 70,289UAE 55,789 No 76,605 76,605Yemen 65,686 Yes 174,120 174,120MENA 1,680,318 No 2,993,163 3,093,952
* The State of Palestine is excluded from the analysis due to the lack of available data.Source: UNICEF analysis based on World Health Organization, The 2017 update, Global Health Workforce Statistics, WHO, Geneva, 2017 and United Nations, Department of Economic and Social Affairs, Population Division (2017), World Population Prospects: The 2017 Revision, DVD Edition.Note: Data from 2000 to 2015 was used for estimation. If density is higher than the WHO minimum standard in 2030, the forecasted number of health service providers is reported.

M E N A G E N E R AT I O N 2 0 3 0 5 3
117 School-age population is usually defined as being from age of 5 to 17 for primary, lower-secondary and upper-secondary school level (excluding pre-primary school-age). However, these population data are calculated based on each country-specific definition of entrance age and duration and hence vary between countries. 118 Please note that the education level specific age group is calculated by country, based on the country-specific definition of entrance age and duration, and hence varies between countries. Please see Annex 1, Tables 1-4.
FIG. 18 Proportional increase in school-age population between 2015 and 2030, by education level and country demographic stageExample – Education service provision
Increase in and composition of the school -age population (aged 5-17)
By 2030, the countries in MENA will face a 23 per cent increase in school-age population (children aged 5-17),117 resulting in the need for approximately 25 million additional students to be accommodated in the education systems. This will put an additional burden on providing quality education for all: new schools and classrooms need to be built, new teachers trained and recruited, and teaching and learning (including curriculum content and methods) need to respond to the needs of a fast-changing world.
However, while the school-age population in the region is increasing overall, this increase is happening at different speeds for different age groups, affecting the level of investment needed for each education level. For example, during the period 2015 to 2030, the projected increase in school-age population is higher for adolescents at lower- and upper-secondary education level than for children at pre-primary or primary level118 (see Figure 18).
The pre-primary school-age population is projected to increase by approximately 6 per cent for the MENA region as a whole, while the primary school-age population is projected to increase by about 15 per cent. The projected increases in the lower-secondary and upper-secondary school-age populations are significantly higher, at 29 per cent and 35 per cent respectively.
However, sustaining access to secondary education will require a continued focus on basic education, including paying attention to early childhood learning and pre-primary education, as many of the underlying problems adolescents and youth face find their roots in the early years.
40
30
20
10
0
-10
Pre-Primary Education
Lower-secondary Education
Upper-secondary Education
Primary Education
Pre-dividend Countries
MENA Region
Early-dividend Countries
Late-dividend Countries
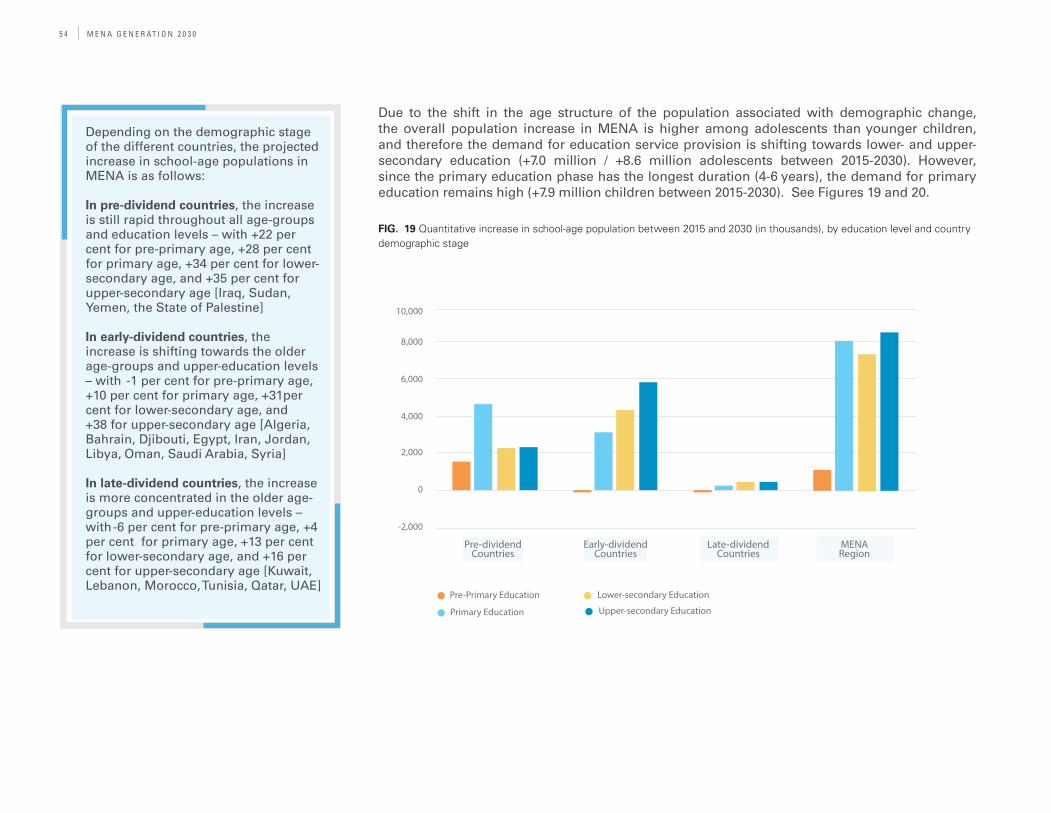
5 4 M E N A G E N E R AT I O N 2 0 3 0
Depending on the demographic stage of the different countries, the projected increase in school-age populations in MENA is as follows:
In pre-dividend countries, the increase is still rapid throughout all age-groups and education levels – with +22 per cent for pre-primary age, +28 per cent for primary age, +34 per cent for lower- secondary age, and +35 per cent for upper-secondary age [Iraq, Sudan, Yemen, the State of Palestine]
In early-dividend countries, the increase is shifting towards the older age-groups and upper-education levels – with -1 per cent for pre-primary age, +10 per cent for primary age, +31per cent for lower-secondary age, and +38 for upper-secondary age [Algeria, Bahrain, Djibouti, Egypt, Iran, Jordan, Libya, Oman, Saudi Arabia, Syria]
In late-dividend countries, the increase is more concentrated in the older age-groups and upper-education levels – with -6 per cent for pre-primary age, +4 per cent for primary age, +13 per cent for lower-secondary age, and +16 per cent for upper-secondary age [Kuwait, Lebanon, Morocco, Tunisia, Qatar, UAE]
Due to the shift in the age structure of the population associated with demographic change, the overall population increase in MENA is higher among adolescents than younger children, and therefore the demand for education service provision is shifting towards lower- and upper-secondary education (+7.0 million / +8.6 million adolescents between 2015-2030). However, since the primary education phase has the longest duration (4-6 years), the demand for primary education remains high (+7.9 million children between 2015-2030). See Figures 19 and 20.
FIG. 19 Quantitative increase in school-age population between 2015 and 2030 (in thousands), by education level and country demographic stage
10,000
8,000
6,000
4,000
2,000
0
-2,000
Pre-dividend Countries
Late-dividend Countries
MENA Region
Early-dividend Countries
Pre-Primary Education
Primary Education
Lower-secondary Education
Upper-secondary Education
Early-dividend Countries:

M E N A G E N E R AT I O N 2 0 3 0 5 5
The overall increase in school-age population will be highest in Egypt (+7.6 million), Iraq (+4.9 million), Sudan (+3.5 million), Algeria (+2.7 million) and Yemen (+2.1 million). The overall size of the school-age population in 2030 will then be highest in Egypt (33 million), followed by Iraq (17 million), Sudan (16 million), Iran (15 million) and Yemen (12 million). For country-specific data, see Annex 1, Tables A1 to A4.
FIG. 20 Quantitative increase in school-age population between 2015 and 2030 (in thousands), by country
Pre-dividend Countries:
Early-dividend Countries:
Late-dividend Countries:2030 Pre-Primary Education
2030 Lower-Secondary Education
2030 Primary Education
2030 Upper-Secondary Education
2015
Increase in out-of-school children (5-17 years)119
While progress has been made in providing education for all at primary level, the proportion and number of children (5-17 years) out-of-school or not attending lower- and upper-secondary school in MENA is still quite high. In 2015 about 17 per cent of lower-secondary age children were out of school in the MENA region, and up to 35 per cent of upper-secondary age children were not attending school. In addition, more than half of pre-primary age children still do not have access to pre-primary schools, nurseries or kindergartens. This is of particular importance, as early stimulation and learning lay the cognitive foundation for a child’s future learning and development.120
If the countries in the MENA region do not address this enormous influx of children and adolescents into the education systems effectively, the number of children aged 5-17 out of school may increase by about 27 per cent by 2030121 (see Figure 21). Overall, this adds up to 5 million additional children being out of school in the region. Due to the rapid increase in school-age population, especially among lower- and upper-secondary age adolescents, the progress made so far towards education for all may be reversed.
119 Data used below are calculated assuming that the out-of-school children rates remain the same in 2030 as in 2015, or the latest available data before 2015, except UAE where only the 2016 data for lower- and upper-secondary education is available. Note that the term out-of-school is applied to upper-secondary school-age children to echo the Sustainable Development Goal 4 that encourages school attendance for youth. However, it is acknowledged that in the short term other learning pathways should also be encouraged, given that for many countries upper-secondary schooling is not compulsory and upper -secondary school-age children are allowed to work legally.120 These rates have been calculated based on the number of school-age population and the number of out-of-school children available through UIS. However, they might not conform to the official out-of-school children rates reported by UIS, due to different ways of calculating or adjusting the data. 121 School-age population is usually defined as from age 5 to 17 for primary, lower-secondary and upper-secondary school level (excluding pre-primary school-age) – however, these population data are calculated based on each country-specific definition of entrance age and duration, and hence vary between countries.
Iran
Yemen
Algeria
Bahrain
State of Palestine
Djibouti
Egypt
Sudan
Jordan
Libya
Oman
Tunisia
Lebanon
Kuwait
Qatar
UAE
Morocco
Iraq
Saudi Arabia
Syria
-5,000 0 5,000 10,000 15,000 20,000 25,000 30,000 35,000

5 6 M E N A G E N E R AT I O N 2 0 3 0
FIG. 21 Proportional increase in out-of-school children between 2015 and 2030, by education level and country demographic stage
Assuming that the out-of-school children rate – defined as, the percentage of the total school-age population out of school, by education level/ age-group – from 2015 remains the same until 2030, the projected increase in the number of out-of-school children is highest among adoles-cents and therefore the lower- and upper-secondary education levels will continue to be most affected.
While the number of out-of-school children of pre-primary age will remain more or less the same for the MENA region, those of primary age will increase by approximately 19 per cent. The increase is even higher for adolescents who are out of lower-secondary school, at 25 per cent, with the number of adolescents not attending upper-secondary school increasing by as much as 32 per cent.
Depending on the demographic stage of the different countries, the projected increase in out-of-school children and adolescents is as follows:
In pre-dividend countries, the increase is still rapid throughout all age groups and education levels – with +12 per cent for pre-primary age, +26 per cent for primary age, +33 per cent for lower-secondary age, and +36 per cent for upper-secondary age [Iraq, Sudan, Yemen, the State of Palestine]
In early-dividend countries, the increase is shifting towards the older age groups and upper education levels – with -2.5 per cent for pre-primary age, +6.5 per cent for primary age, +20 per cent for lower-secondary age, and +35 per cent for upper-secondary age [Algeria, Bahrain, Djibouti, Egypt, Iran, Jordan, Libya, Oman, Saudi Arabia, Syria]
In late-dividend countries, the increase concentrates further in the older age-groups and upper education levels – with -3.5 per cent for pre-primary age, -2.9 per cent for primary age, +4.5 per cent for lower-secondary age, and +14 per cent for upper-secondary age [Kuwait, Lebanon, Morocco, Tunisia, Qatar, UAE]
40
30
20
10
0
-10
Pre-primary Education
Lower-secondary Education
Upper-secondary Education
Primary Education
Pre-dividend Countries
MENA Region
Early-dividend Countries
Late-dividend Countries
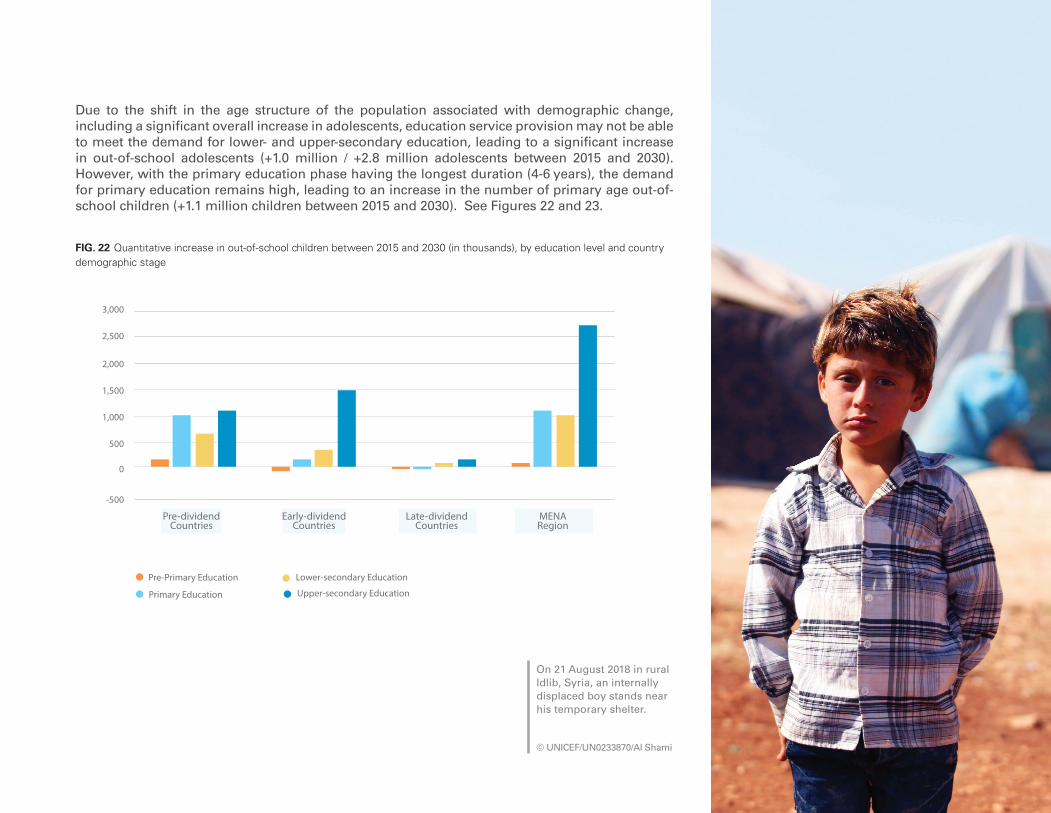
M E N A G E N E R AT I O N 2 0 3 0 5 7
Due to the shift in the age structure of the population associated with demographic change, including a significant overall increase in adolescents, education service provision may not be able to meet the demand for lower- and upper-secondary education, leading to a significant increase in out-of-school adolescents (+1.0 million / +2.8 million adolescents between 2015 and 2030). However, with the primary education phase having the longest duration (4-6 years), the demand for primary education remains high, leading to an increase in the number of primary age out-of-school children (+1.1 million children between 2015 and 2030). See Figures 22 and 23.
FIG. 22 Quantitative increase in out-of-school children between 2015 and 2030 (in thousands), by education level and country demographic stage
3,000
2,500
2,000
1,500
1,000
500
0
-500
Pre-dividend Countries
Late-dividend Countries
MENA Region
Early-dividend Countries
Pre-Primary Education
Primary Education
Lower-secondary Education
Upper-secondary Education
On 21 August 2018 in rural Idlib, Syria, an internally displaced boy stands near his temporary shelter.
© UNICEF/UN0233870/Al Shami

5 8 M E N A G E N E R AT I O N 2 0 3 0
Summary of implications for education service provision
By 2030, the countries in the MENA region
will face an increase of 25 million (+23 per cent) additional students to be accommodated in the education system.
This will put an additional burden on providing quality education for all. The projected increase is highest among the adolescent population, at lower- and upper-secondary education level. However, sustaining access to secondary education will require a continuous focus on basic education, including due attention for early childhood learning and pre-primary education, as many of the underlying problems adolescents and youth are facing find their roots in the early years.
If the countries in the MENA region do not address this enormous influx of children and adolescents into the education system in an adequate manner, an additional 5 million children (+27 per cent) may be out of school. Assuming that the out-of-school children rate remains the same throughout the period till 2030, the projected increase in the number of out-of-school children will be highest among adolescents at lower- and upper-secondary level. Many of the accomplishments towards education for all achieved so far may be reversed.
FIG. 23 Quantitative increase in out-of-school children between 2015 and 2030 (in thousands), by country
Pre-dividend Countries:
Early-dividend Countries:
Late-dividend Countries:2030 Pre-Primary Education
2030 Lower-secondary Education
2030 Primary Education
2030 Upper-secondary Education
2015
Iran
Yemen
Algeria
Bahrain
State of Palestine
Djibouti
Egypt
Sudan
Jordan
Libya
Oman
Tunisia
Lebanon
Kuwait
Qatar
UAE
Morocco
Iraq
Saudi Arabia
Syria
-500 0 500 1,500 2,500 3,500 4,500 5,500
The increase in out-of-school children is projected to be highest in Sudan (+1.1 million), Egypt (+1.0 million), Iraq (+1.0 million), Yemen (+0.7 million) and Algeria (+0.3 million). The overall number of out-of-school children in 2030 will then be highest in Sudan (5.4 million), Egypt (4.4 million), Yemen (3.7 million), Iraq (3.3 million), and Syria (3.0 million). For country-specific data, see Annex 1, Tables A5 to A8.
M E N A G E N E R AT I O N 2 0 3 0 5 9
Depending on the demographic stage of the different countries in the region, the increase in school-age population and potential increase in out-of-school children is as follows:
In pre-dividend countries, the increase is still rapid throughout all age groups and education levels. Ensuring both access to education and the good quality of pre-primary and primary education is crucial for meeting the learning needs of the increasing number of young children, as well as building the foundation for the transition to lower- and upper-secondary education. [Iraq, Sudan, Yemen, the State of Palestine]
In early-dividend countries, the increase is highest among older age groups and hence upper education levels, while slowing down for younger age groups and lower education levels. The focus needs to shift beyond primary education towards addressing gaps and weaknesses in lower- and upper-secondary education. [Algeria, Bahrain, Djibouti, Egypt, Iran, Jordan, Libya, Oman, Saudi Arabia, Syria]
In late-dividend countries, the increase is comparably low throughout all age-groups and education levels. Countries could usefully focus on school-to-work transition mechanisms and youth labour policies, to take advantage of the demographic dividend. [Kuwait, Lebanon, Morocco, Tunisia, Qatar, UAE]
However, while this analysis focuses on the increasing pressure on existing education systems from the demand side, investment in education needs to take into account the current education service provision and supply side factors.
Example – School-to-work transition
Increase in and composition of the youth labour force (15-24 years)
To realise the window of opportunity for accelerated economic growth and development, expanded employment opportunities are required. As the school-age population increases, especially among the older age groups of adolescents, the need for the economy to create jobs for those entering the labour market increases. At the same time, it is crucial for education systems to nurture the skills required by the changing economy, if student transition to the labour market is to be successful.
By 2030, the countries in MENA face a 27 per cent increase in the labour force (15-64 years) compared to 2015, and hence 39 million new entrants into the labour market, assuming the labour force participation rate for both
men and women follows the trend projected by the International Labour Organization (ILO). This will put an additional burden on the region’s economies to create new jobs; about 2.6 million per year.
Many of the jobs of the future do not yet exist, due to the rapid evolution of technology and its impact on social and economic life. Some will be lost to automation and others, many of which we cannot yet imagine, will emerge in their place. According to projections, 50 per cent to 85 per cent of the jobs today’s learners will be doing in 2030 have not yet been created, meaning adolescents and youth need to acquire a different skill set to secure them.122 While specific technical skills can be learned in the workplace, MENA’s national systems increasingly need to invest in a broader set of life skills to provide the foundation for life-long learning, making youth employable in the context of the fourth industrial revolution.
Assuming the youth labour force participation rate follows ILO’s projection, the youth labour force (15-24 years) will increase by about 12 per cent by 2030 (compared to 2015), leading to an additional 2.8 million youth in the labour force.123 (See Figures 24 and 25).
122 Education Commission, 2017: The Learning Generation – Investing in Education for a changing World; Institute for the Future for Dell Technologies, 2017: The Next Era of Human / Machine Partnership – Emerging Technologies’ Impact on Society and Work in 2030.123 Note that the reason for the much smaller number of 2. 8 million additional youth labour force, compared to the 39 million additional jobs needed as mentioned above, is that the fi rst number refers to the age group 15-24 years only, while the latter refers to the entire labour force aged 15-64 and is largely the result of successive young cohorts entering the labour force over the 15 year period between 2015 and 2030 and moving through the age groups.

6 0 M E N A G E N E R AT I O N 2 0 3 0
Depending on the demographic phase of the different countries, the projected increase in the youth labour force is as follows:
In pre-dividend countries, the increase is rapid at +31 per cent reflecting an additional 2.1 million youth in the labour force by 2030 compared to 2015 [Iraq, Sudan, Yemen, the State of Palestine]
In early-dividend countries, the increase is slower at +8 per cent reflecting an additional 1.1 million youth in the labour force by 2030 compared to 2015 [Algeria, Bahrain, Djibouti, Egypt, Iran, Jordan, Libya, Oman, Saudi Arabia, Syria]
In late-dividend countries, the increase is reversed at -7 per cent reflecting a 0.3 million reduction in youth in the labour force by 2030 compared to 2015 [Kuwait, Lebanon, Morocco, Tunisia, Qatar, UAE]
FIG. 24 Quantitative increase in the youth labour force between 2015 and 2030 (in thousands), by country demographic stage
0 5,000 10,000 15,000 20,000 25,000 30,000
2015
2030 Increase
Pre-dividend Countries
Late-dividend Countries
MENA Region
Early-dividend Countries

M E N A G E N E R AT I O N 2 0 3 0 6 1
FIG. 25 Quantitative increase in the youth labour force between 2015 and 2030 (in thousands), by country
The increase in the youth labour force will be highest in Egypt (+1.3 million), Iraq (+1.3 million), Sudan (+0.6 million), Syria (+0.3 million), and the State of Palestine (+0.1 million). The overall number of youth in the workforce in 2030 will then be highest in Egypt (6.5 million), Iraq (3.7 million), Sudan (2.7 million), Iran (2.7 million), and Morocco (1.9 million). However, in some countries the youth labour force is projected to decrease, such as Iran (-0.6 million), Morocco (-0.2 million), and Lebanon (-0.2 million). For country-specific data, see Annex 2, Tables A9 to A11.
Pre-dividend Countries:
Early-dividend Countries:
Late-dividend Countries:
Iran
Yemen
Algeria
Bahrain
State of Palestine
Djibouti
Egypt
Sudan
Jordan
Libya
Oman
Tunisia
Lebanon
Kuwait
Qatar
UAE
Morocco
Iraq
Saudi Arabia
Syria
0 1,000 2,000 3,000 4,000 5,000 6,000 7,000
2015
2030 Increase
Syrian refugee boy playing soccer in Azraq refugee camp in Jordan.
© UNICEF/Jordan/2017/Rich
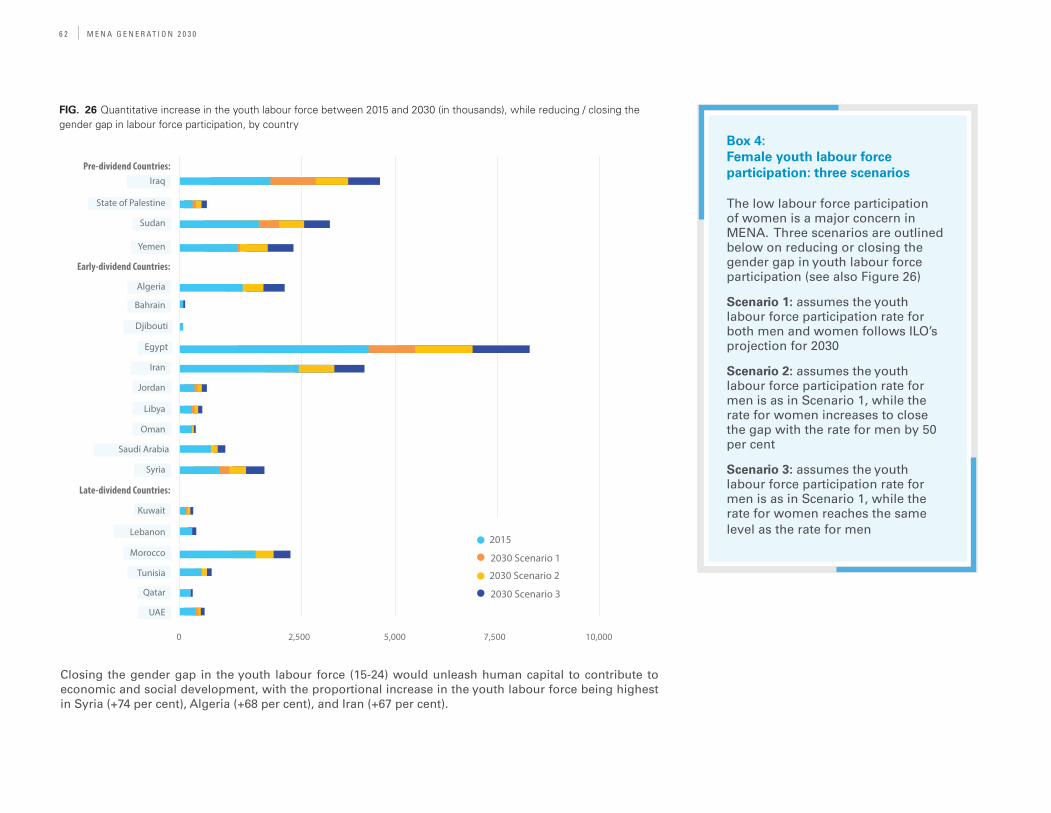
6 2 M E N A G E N E R AT I O N 2 0 3 0
FIG. 26 Quantitative increase in the youth labour force between 2015 and 2030 (in thousands), while reducing / closing the gender gap in labour force participation, by country
Closing the gender gap in the youth labour force (15-24) would unleash human capital to contribute to economic and social development, with the proportional increase in the youth labour force being highest in Syria (+74 per cent), Algeria (+68 per cent), and Iran (+67 per cent).
Pre-dividend Countries:
Early-dividend Countries:
Late-dividend Countries:
Iran
Yemen
Algeria
Bahrain
State of Palestine
Djibouti
Egypt
Sudan
Jordan
Libya
Oman
Tunisia
Lebanon
Kuwait
Qatar
UAE
Morocco
Iraq
Saudi Arabia
Syria
0 2,500 5,000 7,500 10,000
2015
2030 Scenario 2
2030 Scenario 1
2030 Scenario 3
Box 4: Female youth labour force participation: three scenarios
The low labour force participation of women is a major concern in MENA. Three scenarios are outlined below on reducing or closing the gender gap in youth labour force participation (see also Figure 26)
Scenario 1: assumes the youth labour force participation rate for both men and women follows ILO’s projection for 2030
Scenario 2: assumes the youth labour force participation rate for men is as in Scenario 1, while the rate for women increases to close the gap with the rate for men by 50 per cent
Scenario 3: assumes the youth labour force participation rate for men is as in Scenario 1, while the rate for women reaches the same level as the rate for men

M E N A G E N E R AT I O N 2 0 3 0 6 3
124 Data used below are calculated assuming that the youth unemployment rates remain the same in 2030 as in 2015. Total youth unemployed have been calculated by adding up male unemployed and female unemployed. 125 Oman (47 per cent), Libya (45 per cent), the State of Palestine (40 per cent), Tunisia (35 per cent), Egypt (35 per cent), Jordan (33 per cent).126 Syria (83 per cent), Oman (78 per cent), and Libya (63 per cent), the State of Palestine (60 per cent), Saudi Arabia (57 per cent), Jordan (56 per cent). Note that these high unemployment rates are independent from the already low female labour force participation in the MENA region, since the unemployment rate relates the number of unemployed to the labour force (employed and unemployed) and not to the total population.
Increase in unemployed youth (15-24 years)124
Youth unemployment rates (15-24 years) in MENA are currently the highest in the world. In three countries youth unemployment is 40 per cent or higher, and in a further three above 30 per cent.125 The situation is even worse among women, with female youth unemployment reaching more than 60 per cent in three countries and more than 50 percent in another three.126
The projected increase in numbers of adolescents and youth in MENA by 2030 will lead to an increasing number of students hoping to make the transition from school to work. This increases the pressure on the economy to absorb these aspiring labour market entrants and means it is crucial that education systems in the region nurture the skills required to enter employment or self-employment and contribute to a rapidly changing economy.
If the countries of MENA fail to address both the supply of a qualified workforce, through education systems adjusting to labour market requirements, and the demand of the economy, by creating new jobs for these new labour force entrants, unemployment among the region’s youth will increase even further. Assuming that the youth unemployment rates of 2015 remain the same until 2030, the total number of unemployed youth aged 15-24 may increase by 11 per cent by 2030. See Figures 27 and 28.
FIG. 27 Quantitative increase in unemployed youth between 2015 and 2030 (in thousands), by country demographic stage
2015
2030 Increase
Pre-dividend Countries
Late-dividend Countries
MENA region
Early-dividend Countries
0 1,000 2,000 3,000 4,000 5,000 6,000 7,000 8,000

6 4 M E N A G E N E R AT I O N 2 0 3 0
FIG. 28 Quantitative increase in unemployed youth between 2015 and 2030 (in thousands), by country
Pre-dividend Countries:
Early-dividend Countries:
Late-dividend Countries:
Iran
Yemen
Algeria
Bahrain
State of Palestine
Djibouti
Egypt
Sudan
Jordan
Libya
Oman
Tunisia
Lebanon
Kuwait
Qatar
UAE
Morocco
Iraq
Saudi Arabia
Syria
0 500 1,000 1,500 2,000 2,500
2015
2030 Increase
The increase in unemployed youth is projected to be highest in Egypt (+0.4 million), Iraq (+0.3 million), Sudan (+0.1 million), Syria (+0.07 million), and the State of Palestine (+0.05 million). The overall number of unemployed youth is projected to be highest in Egypt (2.2 million), Sudan (0.7 million), Iran (0.7 million), Iraq (0.7 million), and Algeria (0.5 million). However, in some countries the number of unemployed youth is projected to decrease, such as Iran (-0.2 million), Morocco (-0.04 million) and Lebanon (-0.03 million). For country-specific data, see Annex 2, Table A12.
Depending on the demographic phase of the different countries, the projected increase in youth unemployment is as follows:
In pre-dividend countries, the increase is rapid at +30 per cent reflecting an additional 450,000 unemployed youth. In Iraq, for example, the increase in unemployed youth may reach +59 per cent and in the State of Palestine +35 per cent [Iraq, Sudan, Yemen, the State of Palestine]
In early-dividend countries, the increase is slower at +8 per cent reflecting an additional 350,000 unemployed youth. In Bahrain, for example, the increase in unemployed youth may reach +30 per cent and in Egypt +22 per cent. However, in Iran youth unemployment may decrease by -20 per cent [Algeria, Bahrain, Djibouti, Egypt, Iran, Jordan, Libya, Oman, Saudi Arabia, Syria]
In late-dividend countries, the increase is reversed with -8 per cent reflecting 60,000 fewer unemployed youth. However, in Kuwait youth unemployment may increase by +47 per cent, in Qatar by +44 per cent and in Lebanon -51 per cent [Kuwait, Lebanon, Morocco, Tunisia, Qatar, UAE]
M E N A G E N E R AT I O N 2 0 3 0 6 5
127 ILO, 2017. World Employment and Social Outlook – Trends 2017.
Summary of implications for school-to-work transition
By 2030, the countries in the MENA region will face an increase of 39 million (+27 per cent) new entrants to the labour force, to be accommodated in the national and regional economy.
In addition, half of the jobs of the future do not yet exist, due to rapid technological change and its impact on economic and social life. Jobs that today’s learners will be doing in 2030 have not been created yet, meaning children, adolescents and youth need to acquire a different set of skills to secure those jobs. Education systems therefore need to nurture the skills demanded by the changing economy, to enable successful transition to the labour market.
Assuming the youth labour force participation follows ILO’s projection, the youth labour force (15-24 years) will increase by 2.8 million (+12 per cent) to 26.6 million between 2015 to 2030. Increasing the labour force participation rate of young women by reducing the gender gap by half by 2030 would lead to an additional 7.1 million youth in the labour force (33.7 million in total). Closing the gender gap completely by 2030 and assuming the same labour force participation rate for young women as for young men, the youth labour force would increase to a total of 40.7 million by 2030 – from 23.7 million in 2015.
Youth unemployment rates (15-24 years) in the MENA region are currently the highest globally. Even without taking into account existing
economic challenges, rapid technological change and their impact on economies, the labour force and skills, unemployment among youth is projected to increase even further, by 735,000 (+11 per cent) between 2015 and 2030. Countries in the MENA region need to address both the supply of a qualified work force, through education systems adjusting to labour market needs, and the demand on the part of the economy for these new entrants, by creating new jobs.
This analysis does not take into account the disastrous impact of conflict, fragility and the high number of refugees in MENA. As such, future labour market and social developments will depend on these countries’ ability to integrate refugees into society.127 While the region still lacks political stability, economic revival beyond natural resources and equal opportunities for all, education needs to go beyond a focus on income generation and simultaneously foster respect, empathy, resilience and trust.
Youth labour force will increase by
2.8 million to 26.6 million between 2015 and 2030.
+12%
Depending on the demographic stage of the different countries in the region, the increase in the labour force and potential increase in youth unemployment is as follows:
In pre-dividend countries, the increase is extremely rapid for both the labour force and youth unemployment rates that are already very high. Good quality education, anticipating the rapidly changing skills demanded by the labour market may function as a push strategy to foster economic development and prosperity. However, all four countries are currently in a devastating stage of fragility and conflict and therefore economic slowdown. [Iraq, Sudan, Yemen, the State of Palestine]
In early-dividend countries, the overall increase is already slower; while the labour force is still increasing, the projected increase in youth unemployment is not as high, due to the variation in youth unemployment rates between countries. However, most of these countries are either at war, split
by conflict, or affected by a significant influx of refugees and migrants. In a few countries, good education systems providing the skills demanded by a changing labour market may work as an economic push strategy. [Algeria, Bahrain, Djibouti, Egypt, Iran, Jordan, Libya, Oman, Saudi Arabia, Syria]
In late-dividend countries, the increase is quite slow or already in reverse; while the labour force is still growing, most graduates are projected to be absorbed by the labour market. However, to take full advantage of this demographic dividend, labour policies should foster decent jobs for all adolescents and youth. [Kuwait, Lebanon, Morocco, Tunisia, Qatar, UAE]

6 6 M E N A G E N E R AT I O N 2 0 3 0
R E A P I N G T H E D I V I D E N D I N M E N A : P R I O R I T Y P O L I C Y A C T I O N S
C h a p t e r 4
An adolescent boy with his brother (left) and their mother in their house in Sahab, Jordan.
© UNICEF/UN0249977/Rich

M E N A G E N E R AT I O N 2 0 3 0 6 7

6 8 M E N A G E N E R AT I O N 2 0 3 0
128 No Lost Generation and partners, 2017. Translating Research into Scaled Up Action: Evidence Symposium on Adolescents and Youth in MENA (summary report).
Children, adolescents and youth in the MENA region have the potential to become agents of change for a more prosperous future, by playing their part in reaping the demographic dividend. But for this to happen, they must be perceived as a source of potential solutions.128
Decisive action by policy makers is essential if adolescents and youth in the Middle East and North Africa are to reach their full potential, contribute to problem-solving and help the region benefit from the demographic dividend.
Different countries, different challenges and opportunities
The analysis in this report has shown that the MENA region has significant potential to turn the demographic transition that its countries are experiencing into increased prosperity for its people. Countries are at different stages of the demographic transition and immediate priorities for policy action vary.
Pre-dividend countries: Iraq, Sudan, Yemen, the State of Palestine
At this early stage of the transition, these countries still have time to pursue a range of policy measures to ensure that the adolescents and youth entering the labour market over the next ten to fifteen years are healthy, well-nourished, protected and well-educated. This will enable them to turn demographic change into shared wealth. Pre-dividend countries have time to make the required macro-economic, fiscal, regulatory and labour-market policy changes that will maximise employment opportunities. However, all four pre-dividend countries in the region face fragility, conflict and humanitarian crises of varying complexity and duration. Unless they find a way to restore peace and stability, this will restrict their opportunities for the potential demographic dividend to materialise.
The most urgent policy priorities for the MENA countries of each of the dividend categories can be summarised as follows:
Pre-dividend: ensuring that children, adolescents and youth are healthy and well-nourished, protected and well-educated.
Early-dividend: equipping adolescents and youth with the skills they need to make an effective transition from school to work.
Late-dividend: empowering those of working age via initiatives targeting labour force participation and employment generation.
Early-dividend countries: Algeria, Bahrain, Djibouti, Egypt, Iran, Jordan, Libya, Oman, Saudi Arabia, Syria
As the demographic transition in these countries is already more advanced, policy options are more constrained. In these countries, policy measures aimed at maximising the demographic dividend need to focus more on adolescents and youth and their transition from school to work, as well as on those of working age. This does not negate the importance of investing in early childhood and basic education in the first decade of life, which remains critical from many perspectives. In this category, two countries are experiencing conflict and humanitarian crises (Syria and Libya) and two others face the consequences of a large-scale influx of refugees, to different extents (Jordan and Egypt). These circumstances constrain these four countries in comparison with others in this group in taking the policy measures needed for their populations to benefit from a demographic dividend.
Late-dividend countries: Kuwait, Lebanon, Morocco, Tunisia, Qatar, UAE
These countries already have a large share of their population in the working age category and are already well into the period in which they can reap the economic benefits of the demographic
4 . R E A P I N G T H E D I V I D E N D I N M E N A : P R I O R I T Y P O L I C Y A C T I O N S
M E N A G E N E R AT I O N 2 0 3 0 6 9
transition. Therefore, policy measures aiming to boost the demographic dividend in late-dividend countries need to focus mainly on people already in the working-age category and address labour force participation; employment generation; the business environment; and productivity gains through enhancing human capital in the existing labour force. Investing in childhood remains an absolute priority, but will have limited impact on these countries in terms of boosting their economic gains from the demographic transition.
Boosting the demographic dividend by investing in basic services
Health and nutrition for early development
A labour force cannot be effective unless it is healthy and well-nourished, so investment in the provision of health services for all of the region’s children, adolescents and youth is essential. According to projections, the increase of approximately 100,000 health workers required in the region by 2030 – over and above the projected growth based on the 2000-2015 trend – has major policy and financial implications for governments.
Some of the region’s countries with the highest projected health workforce needs by 2030 are also those with high newborn mortality rates. They will require urgent action on health workforce management to reduce newborn mortality. As part of health sector reforms in the region, the training and deployment of health workers to geographic regions with the most significant gaps in service provision will become crucial if recent gains in mortality reduction are to be sustained.
Future research to inform health-related policy-making should explore the connections between health sector needs and the epidemiological transition in the burden of disease that will accompany the demographic changes across the region. An increase in the elderly population, for example, is likely to increase the need for health workers who can respond to new patterns of disease, including more old age-related ailments, cardiovascular
diseases and the need for longer-term home care for the elderly. This will also have implications for future financing needs for the health sectors in many countries, as the burden of disease is likely to shift to those requiring longer-term and more expensive care.
Education for lifelong learning
In addition to being healthy and well-nourished, a labour force that is well-educated, with the right combination of technical and life skills required by the labour market, is an absolute requirement for any country aiming to realise a demographic dividend. Investing in education is critical. The analysis in this report points out that the region will see an addition of about 25 million school-age children (+23 per cent) by 2030. But given concerns about the quality of education systems in the region, the investment required is not simply to keep pace with the rising numbers of school-age children. Transformational investments in both access to and quality of education are needed.
The adolescents and youth of tomorrow (2030) are just entering pre-primary and primary education today. Investing in early childhood and basic education is therefore important, as many problems children experience later in their learning trajectory are linked to a lack of early opportunities to
To ensure the current and future health of MENA’s children, adolescents and youth, health policies are required that:
All countries: aim to increase the number of health workers and decrease under-five mortality rates, especially among the most vulnerable
In addition, investments in quality education - prioritising skills for a fast-changing world - are required at all educational stages throughout MENA, giving particular attention to:
Pre-dividend: investing in quality early childhood and basic education
Early-dividend: investing in quality secondary education and skills development

7 0 M E N A G E N E R AT I O N 2 0 3 0
produces effective labour market entrants, learning approaches prioritising life skills and citizenship education129 are critical.
National systems are therefore urged to invest increasingly in a broader set of life skills that provide the foundation for further learning and training, so that youth are employable. Investments in the quality of education are vital in all countries of the region, but in order to boost the chances of an economic dividend, they are most likely to pay off at secondary level in early-dividend countries.
A mix of policies increasing the demand for labour and promoting employment for all youth, including the most vulnerable, are needed in MENA, including:
Pre-dividend: investment in education access and quality (as above), combined with policies promoting youth employment
Early-dividend: policies focusing on skills development and vocational training, internships, job placements and employer incentives
Late-dividend: policies focusing on the labour demand side
All countries: social protection measures to support the most vulnerable adolescents and youth, including transformative measures to facilitate their eventual transition to employment
Facilitating the school-to-work transition for all
learn. Over half of pre-primary age children in the region do not have access to pre-primary schools, nurseries or kindergartens, though this age category will experience the lowest growth of all school-age categories in the region (6 per cent to 2030). Investment in early childhood education remains essential across the region, but in terms of realising the demographic dividend, this area of investment is most relevant in the four pre-dividend countries.
To ensure that young labour market entrants are equipped with relevant knowledge and skills, the quality of education throughout the pre-primary, primary and secondary stages needs to be improved. This is a significant challenge, given the projected increase in students in primary (by 15 per cent), lower-secondary (by 29 per cent) and upper-secondary education (by 35 per cent). Resources are needed, both for the expansion in access and for the improved quality required. This may prompt a more fundamental re-assessment of the education system in some of the countries that will see the most dramatic changes in their school- age population.
Successful performance in school, work and life depends on a wide range of skills, attitudes and values that go beyond traditional literacy, numeracy and vocational skills. The nature of work is evolving fast, due to technological change. Broader skills around learning, employment, personal empowerment and active citizenship are increasingly important. To ensure that the education system
Financing the necessary investments
Equipping the region’s adolescents and youth for the roles they will play in realising the demographic dividend will require significant investment in education, health and social protection. But many countries in the region already run large budget deficits and have considerable levels of debt, tightening the fiscal space for the policy measures described in this chapter.
While further borrowing is risky and external assistance to the region is dwindling, two ways of increasing fiscal space are open to all governments in the region. The first concerns reprioritising public expenditure on children, adolescents and youth, making sure that the level of budget allocations is adequate and leads to the desired results, particularly for the most vulnerable.
129 www.lsce-MENA.org.130 ESCWA (2017). Rethinking Fiscal Policy for the Arab region.
Taxation as a proportion of GDP is generally low in the region, with weak tax laws and poor enforcement of existing laws, widespread tax evasion and discretionary tax exemptions. There is scope for drastically increasing direct, progressive taxation on income and wealth. This will enable governments to play a more determined redistributive role, channelling public resources towards those facing exclusion and being left behind.130
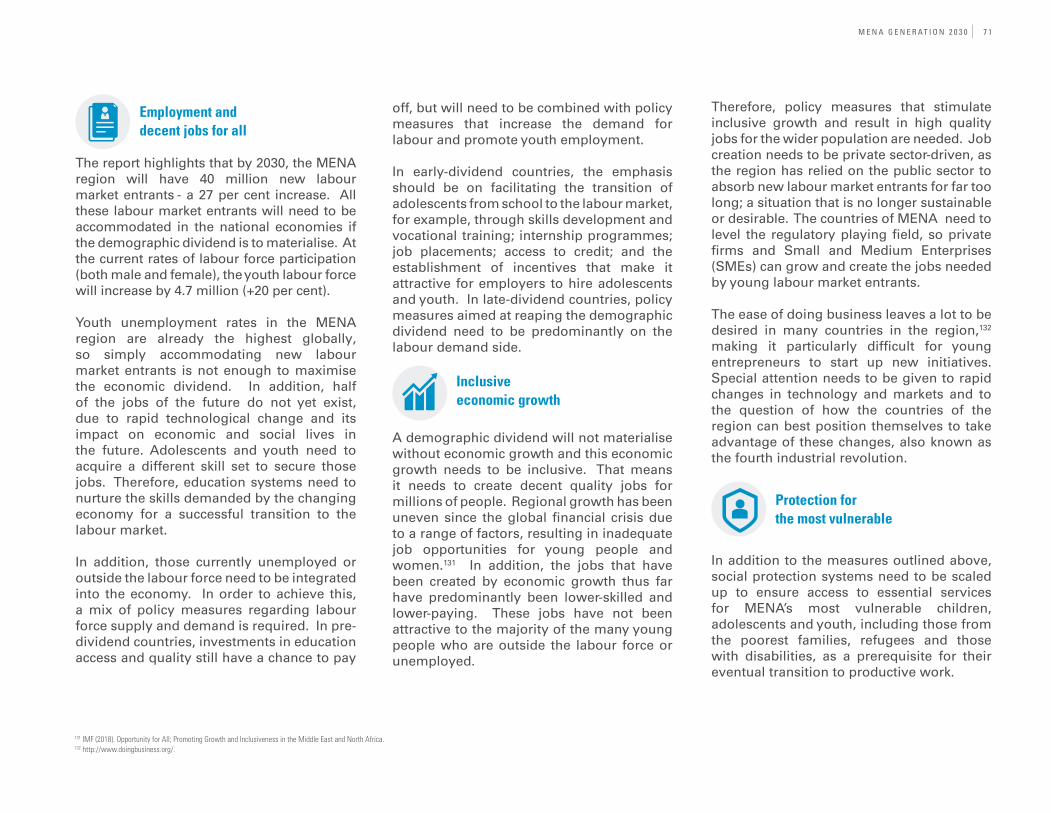
M E N A G E N E R AT I O N 2 0 3 0 7 1
Employment and decent jobs for all
The report highlights that by 2030, the MENA region will have 40 million new labour market entrants - a 27 per cent increase. All these labour market entrants will need to be accommodated in the national economies if the demographic dividend is to materialise. At the current rates of labour force participation (both male and female), the youth labour force will increase by 4.7 million (+20 per cent).
Youth unemployment rates in the MENA region are already the highest globally, so simply accommodating new labour market entrants is not enough to maximise the economic dividend. In addition, half of the jobs of the future do not yet exist, due to rapid technological change and its impact on economic and social lives in the future. Adolescents and youth need to acquire a different skill set to secure those jobs. Therefore, education systems need to nurture the skills demanded by the changing economy for a successful transition to the labour market.
In addition, those currently unemployed or outside the labour force need to be integrated into the economy. In order to achieve this, a mix of policy measures regarding labour force supply and demand is required. In pre-dividend countries, investments in education access and quality still have a chance to pay
off, but will need to be combined with policy measures that increase the demand for labour and promote youth employment.
In early-dividend countries, the emphasis should be on facilitating the transition of adolescents from school to the labour market, for example, through skills development and vocational training; internship programmes; job placements; access to credit; and the establishment of incentives that make it attractive for employers to hire adolescents and youth. In late-dividend countries, policy measures aimed at reaping the demographic dividend need to be predominantly on the labour demand side.
Inclusive economic growth
A demographic dividend will not materialise without economic growth and this economic growth needs to be inclusive. That means it needs to create decent quality jobs for millions of people. Regional growth has been uneven since the global financial crisis due to a range of factors, resulting in inadequate job opportunities for young people and women.131 In addition, the jobs that have been created by economic growth thus far have predominantly been lower-skilled and lower-paying. These jobs have not been attractive to the majority of the many young people who are outside the labour force or unemployed.
Therefore, policy measures that stimulate inclusive growth and result in high quality jobs for the wider population are needed. Job creation needs to be private sector-driven, as the region has relied on the public sector to absorb new labour market entrants for far too long; a situation that is no longer sustainable or desirable. The countries of MENA need to level the regulatory playing field, so private firms and Small and Medium Enterprises (SMEs) can grow and create the jobs needed by young labour market entrants.
The ease of doing business leaves a lot to be desired in many countries in the region,132
making it particularly difficult for young entrepreneurs to start up new initiatives. Special attention needs to be given to rapid changes in technology and markets and to the question of how the countries of the region can best position themselves to take advantage of these changes, also known as the fourth industrial revolution.
Protection for the most vulnerable
In addition to the measures outlined above, social protection systems need to be scaled up to ensure access to essential services for MENA’s most vulnerable children, adolescents and youth, including those from the poorest families, refugees and those with disabilities, as a prerequisite for their eventual transition to productive work.
131 IMF (2018). Opportunity for All; Promoting Growth and Inclusiveness in the Middle East and North Africa.132 http://www.doingbusiness.org/.

7 2 M E N A G E N E R AT I O N 2 0 3 0
conflict-afflicted countries in the pre-dividend and early-dividend categories were to find a peace settlement, this would enable them to benefit twice: from a peace dividend as well as a demographic dividend, for example, a double dividend.
If, on top of this, these countries were to unlock the economic potential of women and girls, they could even experience a triple dividend (see following page).
Engagement and participation
In addition to working for peace at the political level, it is crucial for all countries in the MENA region, and especially those afflicted by conflict, to invest in the participation of their adolescents and youth, ensuring their engagement in decision-making, civic engagement opportunities, and access to citizenship and life skills education. This will foster a new generation that shares the responsibility to reject conflict, discrimination and violence. The region currently has the lowest youth civic engagement level in the world, with young people’s lack of trust in their governments to address their concerns and abuse of power (among other factors) motivating people to take to the streets.
If the engagement of adolescents and youth as potential problem-solvers and change-
Examples of transformative protection measures MENA’s governments could explore, in collaboration with their international partners, include:
Employment guarantee schemes – providing adolescents and youth with the right to claim a set number of days of paid employment from government
Access to microcredit – a powerful tool to engage adolescents and youth in micro, small and medium enterprises
Tax incentives – for entrepreneurs hiring adolescents and youth and for adolescents and youth who establish themselves as entrepreneurs
Negotiated preferential market access – for products made by adolescents and youth
economic burden of population expansion has the potential to undermine attempts to eradicate poverty through economic growth, possibly resulting in rising poverty and marginalisation. Without equitable investment, prioritising the poorest and most disadvantaged children, adolescents and youth, MENA will continue to experience ever-widening disparities, with serious implications for human rights and political stability, as well as employment and economic growth.
A double dividend? The economic benefi ts of peace
Political and social stability is an essential prerequisite if the countries in the region are to benefit from the potential window of accelerated economic growth offered by the dividend. However, the early-dividend countries in the region struggle with fragility, conflict and humanitarian crises, which hamper their ability to take the policy measures required to reap the demographic dividend. This is particularly damaging as these are the countries where the demographic transition is still at a stage where the potential of policy measures is optimal.
It is well-known that wars and smaller-scale conflicts are generally followed by a boom period of economic growth, spurred by post-war reconstruction, the return of investment and (often) the return of human capital. If the
Social protection schemes can be categorised as: protective (preventing destitution and ensuring access to basic services); preventive (preventing poverty as a result of a shock); and promotive or transformative (providing greater access to economic opportunities, boosting livelihoods or bringing about significant productivity gains). In the MENA region, the majority of current social protection programmes are protective or preventive. However, transformative social protection measures can play a major role in facilitating young people’s entry into the labour market.
Unless investment in MENA’s children, adolescents and youth is prioritised, the

M E N A G E N E R AT I O N 2 0 3 0 7 3
The recommended policy priorities for empowerment of women in MENA are:
Pre-dividend: ensuring full participation of girls in education and the economic empowerment of women
Early-dividend: ensuring full participation of girls in education and the economic empowerment of women
Late-dividend: increasing labour force participation by women, including equal pay and flexible work arrangements
All countries: ensuring protection from gender-based violence, child marriage, exploitation and abuse for all young women in MENA
makers committed to peace, tolerance, democracy and shared responsibility for the region’s disparities and deprivations is not facilitated, instability will remain.
A triple dividend? Unlocking the potential of girls and women
Fostering women’s and girls’ participation lies at the heart of achieving a demographic dividend, as it spurs productivity, diversity and growth. As noted in this report, the
labour force participation rate of women in the region is remarkably low, and for those young women who are in the labour force, the unemployment rate is high. This means that the region is forgoing an important share of its human capital and constraining its economic growth. As the report indicates, closing the gender gap in labour force participation would more than double the youth labour force in seven countries of the region. The resulting economic growth potential is vast.
Countries in the pre-dividend and early-dividend stages can benefit greatly from policy measures aimed at ensuring full participation of girls in education and the economic empowerment of women. In this way, they will also realise a double dividend, as increasing female labour force participation and lowering female unemployment will further reduce dependency ratios. In conflict-afflicted countries that achieve peace, as discussed above, as well as gender equity this would amount to a triple dividend.
Even countries in the late-dividend stage can still take active policy measures to increase female labour force participation, such as active employment generation initiatives for women; flexible work arrangements; promotion of financial inclusion and access to finance for women; measures that promote equal pay for men and women;
introduction or expansion of parental leave provisions; tax incentives; and provisions of affordable child care.
Protection for young women
However, in addition to providing gender-sensitive education and employment services, unlocking the potential of the region’s girls and young women requires policy measures to protect them from violence, exploitation and abuse and help them access culturally sensitive reproductive health services. Urgent action to address gender-based violence and child marriage - a determining factor in sustaining elevated rates of adolescent pregnancy, high fertility rates and exclusion from education and the labour market - is therefore required throughout the region.

7 4 M E N A G E N E R AT I O N 2 0 3 0
The time to act is now
If the countries in the MENA region fail to invest in their children, adolescents and youth to prepare them for productive adult life, do not absorb young labour market entrants, do not restore peace and continue to see high levels of gender inequality and marginalisation of the most vulnerable, the unique opportunity of the demographic dividend will slip through their fingers. A large proportion of the region’s working-age population will be either outside the labour force or unemployed. They are likely to be dissillusioned and will put a considerable demand on public resources.
If this bleak prospect is to be avoided and the demographic transition is to be turned into a boost for prosperity in the region, the time to act is now.
The potential for double or even triple dividends in the countries of MENA can therefore be summarised as follows:
Pre/early-dividend: peace settlements in conflict-affected countries would enable a double dividend
All countries: unlocking the economic potential of women and girls would enable a double dividend (in late or even post-dividend countries) or even a triple dividend (in pre/ early-dividend countries, if combined with achieving peace, as described above)
In addition and to enable MENA’s adolescents and youth to play their part in facilitating peace, tolerance and democracy in the region, policies are required that:
All countries: facilitate adolescents’ and youth’s engagement and enable them to become active problem-solvers and changemakers
M E N A G E N E R AT I O N 2 0 3 0 7 5
Adolescent girls take a selfie with their smartphone at a “Lifeskills” event at the Union Development & Culture Community Centre in Djibouti.
© UNICEF/UN0199074/Noorani

7 6 M E N A G E N E R AT I O N 2 0 3 0
B A R R I E R S T O T H E D I V I D E N D I N M E N A A N D I M P L I C AT I O N S F O R S E R V I C E P R O V I S I O N
A n n e x e s
On 9 May 2018 in Aden, Yemen, a group of children have just been vaccinated against cholera. Several children display their vaccination cards.
© UNICEF/UN0209183/Bafaqeh
M E N A G E N E R AT I O N 2 0 3 0 7 7
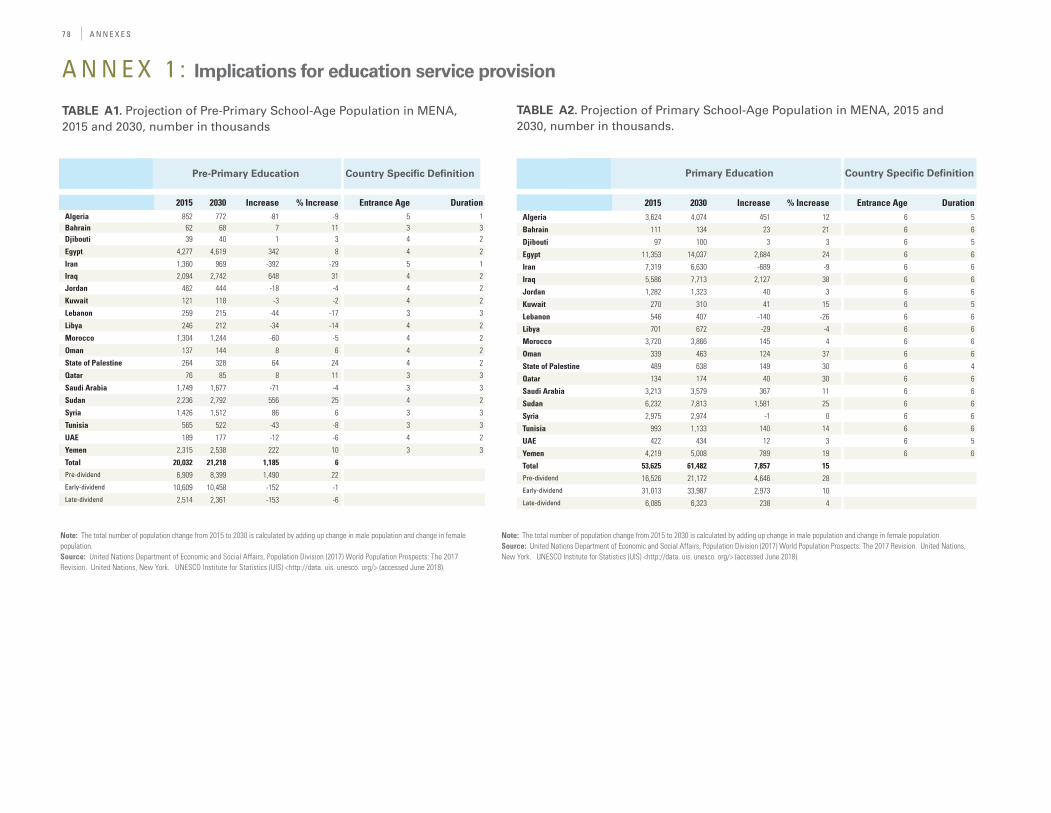
7 8 A N N E X E S
2015 2030 Increase % Increase Entrance Age DurationAlgeria 852 772 -81 -9 5 1Bahrain 62 68 7 11 3 3Djibouti 39 40 1 3 4 2Egypt 4,277 4,619 342 8 4 2Iran 1,360 969 -392 -29 5 1Iraq 2,094 2,742 648 31 4 2Jordan 462 444 -18 -4 4 2Kuwait 121 118 -3 -2 4 2Lebanon 259 215 -44 -17 3 3Libya 246 212 -34 -14 4 2Morocco 1,304 1,244 -60 -5 4 2Oman 137 144 8 6 4 2State of Palestine 264 328 64 24 4 2Qatar 76 85 8 11 3 3Saudi Arabia 1,749 1,677 -71 -4 3 3Sudan 2,236 2,792 556 25 4 2Syria 1,426 1,512 86 6 3 3Tunisia 565 522 -43 -8 3 3UAE 189 177 -12 -6 4 2Yemen 2,315 2,538 222 10 3 3Total 20,032 21,218 1,185 6Pre-dividend 6,909 8,399 1,490 22Early-dividend 10,609 10,458 -152 -1Late-dividend 2,514 2,361 -153 -6
A N N E X 1 : Implications for education service provision
Pre-Primary Education Country Specific Definition
TABLE A1. Projection of Pre-Primary School-Age Population in MENA, 2015 and 2030, number in thousands
Note: The total number of population change from 2015 to 2030 is calculated by adding up change in male population and change in female population. Source: United Nations Department of Economic and Social Affairs, Population Division (2017) World Population Prospects: The 2017 Revision. United Nations, New York. UNESCO Institute for Statistics (UIS) <http://data. uis. unesco. org/> (accessed June 2018).
Note: The total number of population change from 2015 to 2030 is calculated by adding up change in male population and change in female population. Source: United Nations Department of Economic and Social Affairs, Population Division (2017) World Population Prospects: The 2017 Revision. United Nations, New York. UNESCO Institute for Statistics (UIS) <http://data. uis. unesco. org/> (accessed June 2018).
2015 2030 Increase % Increase Entrance Age DurationAlgeria 3,624 4,074 451 12 6 5Bahrain 111 134 23 21 6 6Djibouti 97 100 3 3 6 5Egypt 11,353 14,037 2,684 24 6 6Iran 7,319 6,630 -689 -9 6 6Iraq 5,586 7,713 2,127 38 6 6Jordan 1,282 1,323 40 3 6 6Kuwait 270 310 41 15 6 5Lebanon 546 407 -140 -26 6 6Libya 701 672 -29 -4 6 6Morocco 3,720 3,866 145 4 6 6Oman 339 463 124 37 6 6State of Palestine 489 638 149 30 6 4Qatar 134 174 40 30 6 6Saudi Arabia 3,213 3,579 367 11 6 6Sudan 6,232 7,813 1,581 25 6 6Syria 2,975 2,974 -1 0 6 6Tunisia 993 1,133 140 14 6 6UAE 422 434 12 3 6 5Yemen 4,219 5,008 789 19 6 6Total 53,625 61,482 7,857 15Pre-dividend 16,526 21,172 4,646 28Early-dividend 31,013 33,987 2,973 10Late-dividend 6,085 6,323 238 4
Primary Education Country Specific Definition
TABLE A2. Projection of Primary School-Age Population in MENA, 2015 and 2030, number in thousands.

A N N E X E S 7 9
2015 2030 Increase % Increase Entrance Age DurationAlgeria 2,285 3,520 1,235 54 11 4Bahrain 49 65 16 33 12 3Djibouti 79 79 0 0 11 4Egypt 5,259 7,250 1,991 38 12 3Iran 2,127 2,529 402 19 12 2Iraq 2,464 3,579 1,115 45 12 3Jordan 777 875 98 13 12 4Kuwait 182 263 81 44 11 4Lebanon 311 186 -125 -40 12 3Libya 330 358 28 8 12 3Morocco 1,803 2,003 200 11 12 3Oman 141 241 99 70 12 3State of Palestine 661 896 235 36 10 6Qatar 56 87 30 54 12 3Saudi Arabia 1,456 1,806 350 24 12 3Sudan 1,914 2,433 519 27 12 2Syria 1,438 1,485 46 3 12 3Tunisia 473 604 131 28 12 3UAE 276 358 81 30 11 4Yemen 1,928 2,446 517 27 12 3Total 24,010 31,060 7,050 29Pre-dividend 6,967 9,353 2,386 34Early-dividend 13,941 18,207 4,266 31Late-dividend 3,101 3,500 398 13
Lower-secondary Education Country Specific Definition
Note: The total number of population change from 2015 to 2030 is calculated by adding up change in male population and change in female population. Source: United Nations Department of Economic and Social Affairs, Population Division (2017) World Population Prospects: The 2017 Revision. United Nations, New York. UNESCO Institute for Statistics (UIS) <http://data. uis. unesco. org/> (accessed June 2018).
TABLE A3. Projection of Lower-secondary School-Age Population in MENA, 2015 and 2030, number in thousands.
Note: The total number of population change from 2015 to 2030 is calculated by adding up change in male population and change in female population. Source: United Nations Department of Economic and Social Affairs, Population Division (2017) World Population Prospects: The 2017 Revision. United Nations, New York. UNESCO Institute for Statistics (UIS) <http://data. uis. unesco. org/> (accessed June 2018).
2015 2030 Increase % Increase Entrance Age DurationAlgeria 1,752 2,819 1,067 61 15 3Bahrain 43 62 19 44 15 3Djibouti 59 59 0 1 15 3Egypt 4,917 7,530 2,613 53 15 3Iran 4,224 5,423 1,199 28 14 4Iraq 2,338 3,397 1,060 45 15 3Jordan 373 436 64 17 16 2Kuwait 132 190 57 43 15 3Lebanon 329 188 -141 -43 15 3Libya 323 375 52 16 15 3Morocco 1,765 2,047 282 16 15 3Oman 133 238 105 78 15 3State of Palestine 214 277 63 30 16 2Qatar 50 84 34 68 15 3Saudi Arabia 1,396 1,689 293 21 15 3Sudan 2,690 3,501 812 30 14 3Syria 1,359 1,530 170 13 15 3Tunisia 655 824 169 26 15 4UAE 185 283 98 53 15 3Yemen 1,828 2,377 549 30 15 3Total 24,762 33,328 8,566 35Pre-dividend 7,069 9,552 2,484 35Early-dividend 14,578 20,161 5,582 38Late-dividend 3,115 3,615 500 16
Upper-secondary Education Country Specific Definition
TABLE A4. Projection of Upper-secondary School-Age Population in MENA, 2015 and 2030, number in thousands.

8 0 A N N E X E S
Note: 1. Out-of-school children are calculated based on out-of-school rate for children of the respective educational level. For countries with no administrative data, household survey data are used as reported by UIS (values in italics). 2. Numbers are calculated using out-of-school rate of 2015 or latest available data before 2015. We keep the 2015 out-of-school rate constant for the 2030 calculation. UAE is an exception where only 2016 data for lower-secondary school-age is available. Source: UNICEF calculation of school-age population in MENA , 2015 and 2030. UNESCO Institute for Statistics (UIS) <http://data. uis. unesco. org/> (accessed June 2018).
2015 2030 Change % ChangeAlgeria NA NA NA NABahrain 4 4 0 13Djibouti 18 19 1 4Egypt 1,254 1,385 132 11Iran 722 514 -208 -29Iraq NA NA NA NAJordan NA NA NA NAKuwait 10 10 0 -1Lebanon 5 5 -1 -16Libya NA NA NA NAMorocco 308 298 -10 -3Oman 12 14 1 9State of Palestine 46 58 12 25Qatar 2 3 0 14Saudi Arabia 359 355 -4 -1Sudan NA NA NA NASyria 298 309 11 4Tunisia NA NA NA NAUAE 11 10 -1 -6Yemen 723 807 84 12Total 3772 3789 17 0Pre-dividend 769 865 96 12Early-dividend 2,666 2,599 -67 -3Late-dividend 337 325 -12 -3
2015 2030 Change % ChangeAlgeria 27 30 3 12Bahrain 2 3 0 21Djibouti 43 44 1 3Egypt 372 460 88 24Iran 43 39 -4 -9Iraq 548 757 209 38Jordan NA NA NA NAKuwait 6 7 1 13Lebanon 89 66 -23 -26Libya NA NA NA NAMorocco 242 252 9 4Oman 8 10 3 37State of Palestine 38 49 11 30Qatar 5 6 1 30Saudi Arabia 82 91 9 11Sudan 2,717 3,406 689 25Syria 975 974 0 0Tunisia 4 4 1 14UAE 17 17 0 3Yemen 634 752 119 19Total 5,851 6,969 1,118 19Pre-dividend 3,936 4,964 1,028 26Early-dividend 1,551 1,652 101 6Late-dividend 363 353 -10 -3
Pre-Primary Education Primary Education
Note: 1. Out-of-school children of last year of pre-primary school-age is calculated based on rate of out-of-school children, one year before the official primary entry age, and total number of school-aged children at the last year of official pre-primary school-age (children age 5). 2. Numbers are calculated using out-of-school rate of 2015 or latest available data before 2015. We keep the 2015 out-of-school rate constant for the 2030 calculation. Source: UNICEF calculation of school-age population in MENA , 2015 and 2030. UNESCO Institute for Statistics (UIS) <http://data. uis. unesco. org/> (accessed June 2018).
TABLE A5. Projection of Number of (the last year) Pre-Primary Out-of-School Children, 2015 and 2030, number in thousands
TABLE A6. Projection of Number of Primary Out-of-School Children, 2015 and 2030, number in thousands
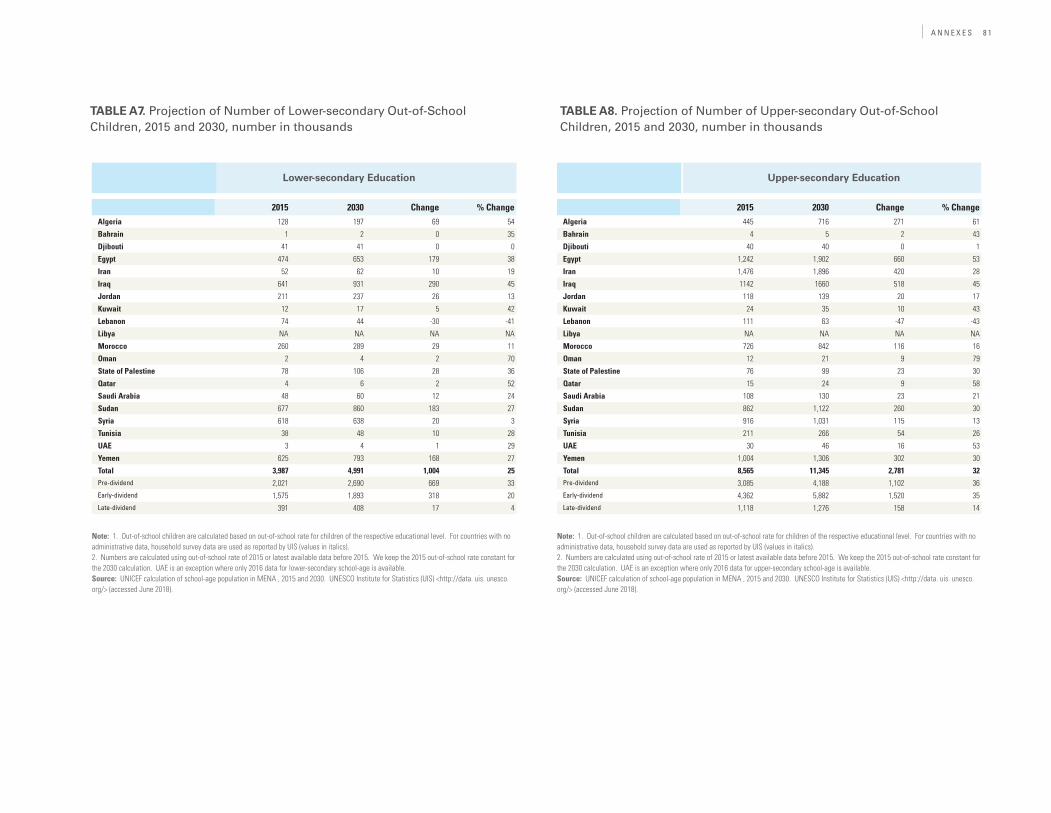
A N N E X E S 8 1
Note: 1. Out-of-school children are calculated based on out-of-school rate for children of the respective educational level. For countries with no administrative data, household survey data are used as reported by UIS (values in italics). 2. Numbers are calculated using out-of-school rate of 2015 or latest available data before 2015. We keep the 2015 out-of-school rate constant for the 2030 calculation. UAE is an exception where only 2016 data for upper-secondary school-age is available. Source: UNICEF calculation of school-age population in MENA , 2015 and 2030. UNESCO Institute for Statistics (UIS) <http://data. uis. unesco. org/> (accessed June 2018).
2015 2030 Change % ChangeAlgeria 128 197 69 54Bahrain 1 2 0 35Djibouti 41 41 0 0Egypt 474 653 179 38Iran 52 62 10 19Iraq 641 931 290 45Jordan 211 237 26 13Kuwait 12 17 5 42Lebanon 74 44 -30 -41Libya NA NA NA NAMorocco 260 289 29 11Oman 2 4 2 70State of Palestine 78 106 28 36Qatar 4 6 2 52Saudi Arabia 48 60 12 24Sudan 677 860 183 27Syria 618 638 20 3Tunisia 38 48 10 28UAE 3 4 1 29Yemen 625 793 168 27Total 3,987 4,991 1,004 25Pre-dividend 2,021 2,690 669 33Early-dividend 1,575 1,893 318 20Late-dividend 391 408 17 4
2015 2030 Change % ChangeAlgeria 445 716 271 61Bahrain 4 5 2 43Djibouti 40 40 0 1Egypt 1,242 1,902 660 53Iran 1,476 1,896 420 28Iraq 1142 1660 518 45Jordan 118 139 20 17Kuwait 24 35 10 43Lebanon 111 63 -47 -43Libya NA NA NA NAMorocco 726 842 116 16Oman 12 21 9 79State of Palestine 76 99 23 30Qatar 15 24 9 58Saudi Arabia 108 130 23 21Sudan 862 1,122 260 30Syria 916 1,031 115 13Tunisia 211 266 54 26UAE 30 46 16 53Yemen 1,004 1,306 302 30Total 8,565 11,345 2,781 32Pre-dividend 3,085 4,188 1,102 36Early-dividend 4,362 5,882 1,520 35Late-dividend 1,118 1,276 158 14
Lower-secondary Education Upper-secondary Education
Note: 1. Out-of-school children are calculated based on out-of-school rate for children of the respective educational level. For countries with no administrative data, household survey data are used as reported by UIS (values in italics). 2. Numbers are calculated using out-of-school rate of 2015 or latest available data before 2015. We keep the 2015 out-of-school rate constant for the 2030 calculation. UAE is an exception where only 2016 data for lower-secondary school-age is available. Source: UNICEF calculation of school-age population in MENA , 2015 and 2030. UNESCO Institute for Statistics (UIS) <http://data. uis. unesco. org/> (accessed June 2018).
TABLE A7. Projection of Number of Lower-secondary Out-of-School Children, 2015 and 2030, number in thousands
TABLE A8. Projection of Number of Upper-secondary Out-of-School Children, 2015 and 2030, number in thousands

8 2 A N N E X E S
A N N E X 2 : Implications for school-to-work transition
TABLE A9. Projections of the Size of the Youth Labour Force in MENA, 2015 and 2030, in thousands – Scenario 1: Assuming the youth labour force participation rate for both, men and women, follows ILO’s projection for 2030
2015 2030 Change % ChangeAlgeria 1,724 1,710 -15 -1Bahrain 79 95 16 20Djibouti 74 67 -7 -10Egypt 5,212 6,525 1,314 25Iran 3,286 2,667 -619 -19Iraq 2,455 3,734 1,280 52Jordan 403 444 42 10Kuwait 151 231 80 53Lebanon 340 169 -172 -50Libya 361 407 46 13Morocco 2,077 1,901 -176 -8Oman 273 313 39 14State of Palestine 330 441 111 33Qatar 245 211 -34 -14Saudi Arabia 848 845 -4 0Sudan 2,160 2,731 572 26Syria 1,071 1,319 248 23Tunisia 607 547 -61 -10UAE 456 556 100 22Yemen 1,581 1,669 89 6Total 23,736 26,585 2,848 12Pre-dividend 6,526 8,576 2,051 31Early-dividend 13,334 14,394 1,060 8Late-dividend 3,877 3,615 -262 -7
2015 2030 Change % ChangeAlgeria 1,724 2,290 565 33Bahrain 79 103 24 30Djibouti 74 67 -8 -10Egypt 5,212 8,080 2,868 55Iran 3,286 3,565 278 8Iraq 2,455 4,588 2,133 87Jordan 403 563 160 40Kuwait 151 257 105 70Lebanon 340 202 -138 -41Libya 361 489 128 35Morocco 2,077 2,385 308 15Oman 273 363 89 33State of Palestine 330 571 241 73Qatar 245 223 -22 -9Saudi Arabia 848 1,023 175 21Sudan 2,160 3,421 1,261 58Syria 1,071 1,809 738 69Tunisia 607 652 45 7UAE 456 595 139 30Yemen 1,581 2,405 824 52Total 23,736 33,650 9,914 42Pre-dividend 6,526 10,984 4,459 68Early-dividend 13,334 18,352 5,018 38Late-dividend 3,877 4,314 437 11
Scenario 1 Scenario 2
Source: UNICEF analysis based on United Nations Department of Economic and Social Affairs, Population Division (2017) World Population Prospects: The 2017 Revision. United Nations, New York; and International Labour Organization, ILO modelled estimates, <http://www. ilo. org/ilostat>, accessed 1 June 2018.
Source: UNICEF analysis based on United Nations Department of Economic and Social Affairs, Population Division (2017) World Population Prospects: The 2017 Revision. United Nations, New York; and International Labour Organization, ILO modelled estimates, <http://www.ilo.org/ilostat>, accessed 1 June 2018.
TABLE A10. Projections of the Size of the Youth Labour Force in MENA, 2015 and 2030, in thousands – Scenario 2: Assuming for men as scenario 1, while women’s youth labour force participation rate is increased to halve the gap to men’s rate

A N N E X E S 8 3
2015 2030 Change % ChangeAlgeria 1,724 2,870 1,146 66Bahrain 79 111 32 40Djibouti 74 66 -8 -11Egypt 5,212 9,635 4,423 85Iran 3,286 4,462 1,175 36Iraq 2,455 5,441 2,986 122Jordan 403 682 279 69Kuwait 151 282 131 87Lebanon 340 235 -105 -31Libya 361 570 209 58Morocco 2,077 2,869 792 38Oman 273 413 139 51State of Palestine 330 701 371 112Qatar 245 234 -11 -4Saudi Arabia 848 1,202 354 42Sudan 2,160 4,110 1,950 90Syria 1,071 2,299 1,228 115Tunisia 607 758 150 25UAE 456 634 178 39Yemen 1,581 3,141 1,560 99Total 23,736 40,716 16,979 72Pre-dividend 6,526 13,393 6,867 105Early-dividend 13,334 22,311 8,977 67Late-dividend 3,877 5,012 1,136 29
2015 per cent 2015 % Male % Female 2030 Change % ChangeAlgeria 515 30 27 45 504 -11 -2Bahrain 4 5 3 12 5 1 30Djibouti 9 11 11 12 8 -1 -14Egypt 1,818 35 31 42 2,227 409 23Iran 846 26 22 42 669 -177 -21Iraq 412 17 14 29 658 246 60Jordan 134 33 28 56 152 18 13Kuwait 28 18 13 27 41 13 48Lebanon 54 16 16 15 27 -27 -51Libya 161 45 38 63 182 21 13Morocco 430 21 21 20 394 -36 -8Oman 128 47 38 78 146 18 14State of Palestine 133 40 36 60 180 47 35Qatar 1 1 0 2 1 0 44Saudi Arabia 246 29 20 57 249 3 1Sudan 596 28 25 35 743 147 25Syria 371 35 27 83 436 65 17Tunisia 213 35 35 36 192 -21 -10UAE 29 6 5 11 38 9 31Yemen 374 24 23 33 387 13 3Total 6,502 7,239 737 11Pre-dividend 1,515 1,967 452 30Early-dividend 4,232 4,579 347 8Late-dividend 755 693 -62 -8
Scenario 3
Source: UNICEF analysis based on United Nations Department of Economic and Social Affairs, Population Division (2017) World Population Prospects: The 2017 Revision. United Nations, New York; and International Labour Organization, ILO modelled estimates, <http://www. ilo. org/ilostat>, accessed 1 June 2018.
Note: Projections based on 2015 male and female unemployment rate being constant until 2030. Total unemployed calculated by adding up male unemployed and female unemployed. Source: UNICEF analysis based on United Nations Department of Economic and Social Affairs, Population Division (2017) World Population Prospects: The 2017 Revision. United Nations, New York; and International Labour Organization, ILO modelled estimates, <http://www. ilo. org/ilostat>, accessed 27 June 2018.
TABLE A11. Projections of the Size of the Youth Labour Force in MENA, 2015 and 2030, in thousands – Scenario 3: Assuming for men as scenario 1, while women’s youth labour force participation rate reaches the same level as men’s rate
TABLE A12. Youth unemployment rate and number unemployed, MENA, 2015 and 2030, number in thousands

8 4 A N N E X E S
A N N E X 3 : Additional country-specific data
All numbers in Annex 3 based on United Nations Department of Economic and Social Affairs, Population Division (2017) World Population Prospects: The 2017 Revision. United Nations, New York.
2000 2015 2018 2030 2050Algeria 31,184 39,872 42,008 48,822 57,437Bahrain 665 1,372 1,567 2,013 2,327Djibouti 718 927 971 1,133 1,308Egypt 69,906 93,778 99,376 119,746 153,433Iran 66,132 79,360 82,012 88,863 93,553Iraq 23,565 36,116 39,340 53,298 81,490Jordan 5,103 9,159 9,904 11,122 14,188Kuwait 2,051 3,936 4,197 4,874 5,644Lebanon 3,235 5,851 6,094 5,369 5,412Libya 5,356 6,235 6,471 7,342 8,124Morocco 28,850 34,803 36,192 40,874 45,660Oman 2,268 4,200 4,830 5,897 6,757State of Palestine 3,223 4,663 5,053 6,739 9,704Qatar 592 2,482 2,695 3,232 3,773Saudi Arabia 20,764 31,557 33,554 39,480 45,056Sudan 27,251 38,648 41,512 54,842 80,386Syria 16,411 18,735 18,284 26,608 34,021Tunisia 9,699 11,274 11,659 12,842 13,884UAE 3,155 9,154 9,542 11,055 13,164Yemen 17,875 26,916 28,915 36,815 48,304Total 338,002 459,038 484,175 580,966 723,624
2000 2015 2018 2030 2050Algeria 8,341 10,731 10,903 12,315 13,004Bahrain 162 315 341 416 434Djibouti 174 253 268 312 334Egypt 17,205 23,787 24,876 30,217 37,129Iran 17,596 23,594 23,785 24,422 18,528Iraq 5,604 8,818 9,565 13,020 20,127Jordan 1,235 2,353 2,544 2,856 3,491Kuwait 504 1,088 1,103 1,122 1,197Lebanon 885 1,630 1,714 1,396 1,043Libya 1,411 1,790 1,834 1,941 1,877Morocco 7,768 9,326 9,527 10,228 10,156Oman 498 866 944 1,163 1,254State of Palestine 704 1,155 1,256 1,711 2,438Qatar 117 396 430 542 584Saudi Arabia 4,708 8,057 8,405 9,060 9,542Sudan 6,318 9,256 10,062 13,819 20,741Syria 4,081 4,498 4,501 7,090 8,537Tunisia 2,653 3,071 3,062 3,128 2,971UAE 581 1,647 1,756 2,111 2,336Yemen 3 764 6,674 7,285 9,955 12,944Total 84,309 119,303 124,159 146,822 168,668
TABLE A13. Total population, thousands TABLE A14. Women of reproductive age (15-49 years), thousands

A N N E X E S 8 5
2000 2015 2018 2030 2050Algeria 610 949 898 730 783Bahrain 15 21 22 23 20Djibouti 22 22 22 21 18Egypt 1,773 2,541 2,467 2,422 2,598Iran 1,239 1,355 1,250 874 866Iraq 839 1,212 1,271 1,517 1,933Jordan 159 243 247 228 223Kuwait 44 65 65 60 65Lebanon 62 86 92 68 50Libya 116 127 121 102 97Morocco 642 709 688 610 555Oman 56 81 81 66 68State of Palestine 121 150 157 173 194Qatar 12 25 26 26 29Saudi Arabia 554 626 629 526 513Sudan 1,083 1,290 1,339 1,577 1,841Syria 509 427 390 512 471Tunisia 168 210 203 164 167UAE 53 92 88 95 106Yemen 707 867 880 884 815Total 8,784 11,098 10,934 10,678 11,434
2000 2015 2018 2030 2050Algeria 49 30 27 17 10Bahrain 14 8 8 6 4Djibouti 109 79 76 63 46Egypt 42 22 20 14 9Iran 35 15 14 9 5Iraq 44 35 32 22 14Jordan 28 18 17 12 8Kuwait 14 10 9 7 5Lebanon 19 10 10 8 5Libya 33 27 25 18 12Morocco 50 29 25 14 8Oman 22 10 9 6 4State of Palestine 31 22 21 16 11Qatar 13 8 7 6 4Saudi Arabia 24 14 13 9 6Sudan 105 70 66 51 32Syria 23 20 18 11 8 Tunisia 29 19 17 11 8UAE 12 7 6 5 3Yemen 100 59 55 42 27
TABLE A15. Births, thousands TABLE A16. Under-five mortality (deaths under age 5 per 1,000 live births)
2000 2015 2018 2030 2050Algeria 17,780 18,039 18,460 20,472 18,639Bahrain 310 467 502 581 561Djibouti 441 487 491 493 465Egypt 39,817 47,418 49,585 57,099 62,684Iran 38,802 31,365 30,589 29,108 22,577Iraq 15,057 21,788 23,470 30,132 41,109Jordan 3,098 5,058 5,355 5,381 5,584Kuwait 915 1,269 1,411 1,580 1,610Lebanon 1,543 2,543 2,478 1,616 1,369Libya 3,022 2,864 2,875 2,864 2,475Morocco 15,707 15,672 15,734 15,919 14,277Oman 1,327 1,548 1,728 1,929 1,698State of Palestine 2,169 2,885 3,041 3,682 4,437Qatar 234 706 762 802 789Saudi Arabia 11,706 13,085 13,152 14,121 12,822Sudan 17,355 23,806 25,260 30,955 40,000Syria 10,389 10,849 10,458 12,587 12,540Tunisia 4,834 4,424 4,454 4,616 4,087UAE 1,320 2,196 2,432 2,627 2,782Yemen 12,285 16,838 17,509 19,943 20,659Total 198,111 223,307 229,745 256,507 271,163
2000 2015 2018 2030 2050Algeria 3,088 4,664 4,579 3,684 3,930Bahrain 74 106 108 114 100Djibouti 103 101 102 101 89Egypt 8,273 12,374 12,642 11,686 12,994Iran 6,409 6,899 6,582 4,488 4,592Iraq 3,841 5,603 5,944 7,148 9,316Jordan 747 1,202 1,240 1,117 1,119Kuwait 227 311 324 297 326Lebanon 305 461 479 348 245Libya 569 630 610 515 488Morocco 3,079 3,457 3,454 3,056 2,793Oman 283 384 408 340 340State of Palestine 585 699 738 837 952Qatar 55 127 134 137 144Saudi Arabia 2,702 2,960 3,024 2,702 2,560Sudan 4,665 5,859 6,105 7,306 8,799Syria 2,432 2,238 1,887 2,527 2,387Tunisia 840 1,024 1,036 839 839UAE 267 471 451 457 529Yemen 3,151 4,017 4,139 4,254 4,055Total 41,695 53,587 53,986 51,951 56,598
Table A17. Children and youth (0-24 years) Table A18. Children (0-4years), thousands
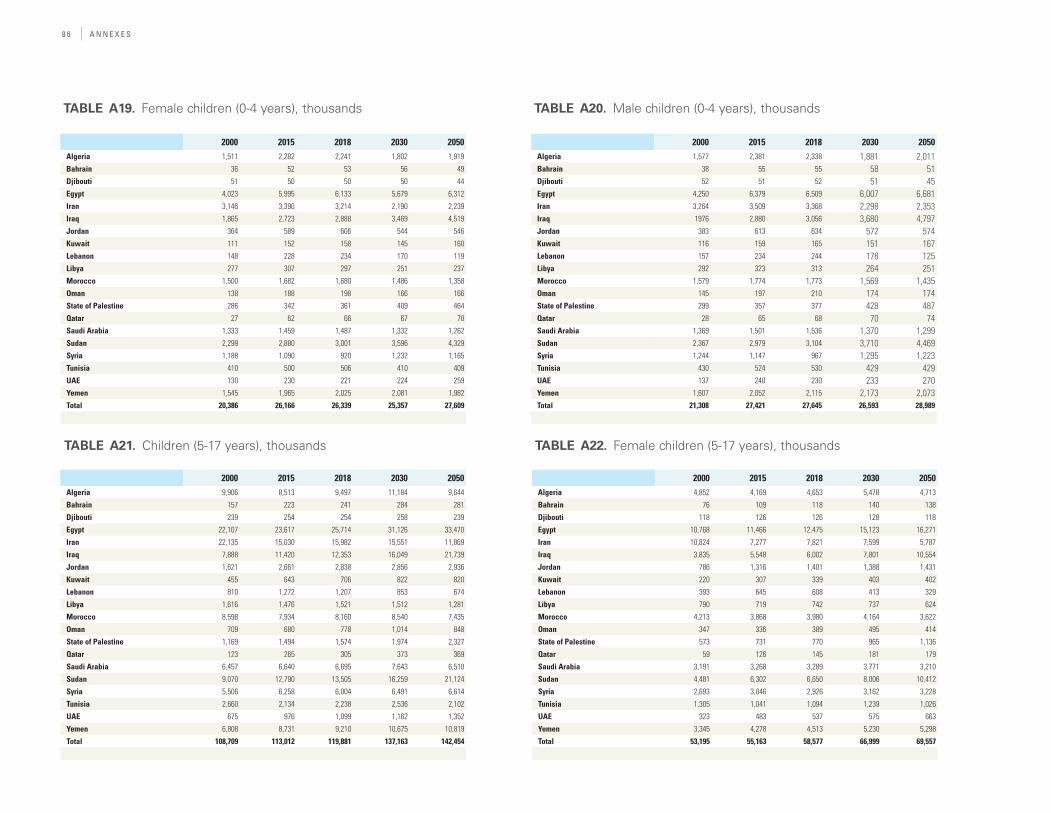
8 6 A N N E X E S
2000 2015 2018 2030 2050Algeria 1,511 2,282 2,241 1,802 1,919Bahrain 36 52 53 56 49Djibouti 51 50 50 50 44Egypt 4,023 5,995 6,133 5,679 6,312Iran 3,146 3,390 3,214 2,190 2,239Iraq 1,865 2,723 2,888 3,469 4,519Jordan 364 589 606 544 546Kuwait 111 152 158 145 160Lebanon 148 228 234 170 119Libya 277 307 297 251 237Morocco 1,500 1,682 1,680 1,486 1,358Oman 138 188 198 166 166State of Palestine 286 342 361 409 464Qatar 27 62 66 67 70Saudi Arabia 1,333 1,459 1,487 1,332 1,262Sudan 2,299 2,880 3,001 3,596 4,329Syria 1,188 1,090 920 1,232 1,165Tunisia 410 500 506 410 409UAE 130 230 221 224 259Yemen 1,545 1,965 2,025 2,081 1,982Total 20,386 26,166 26,339 25,357 27,609
2000 2015 2018 2030 2050Algeria 1,577 2,381 2,338 1,881 2,011Bahrain 38 55 55 58 51Djibouti 52 51 52 51 45Egypt 4,250 6,379 6,509 6,007 6,681Iran 3,264 3,509 3,368 2,298 2,353Iraq 1976 2,880 3,056 3,680 4,797Jordan 383 613 634 572 574Kuwait 116 159 165 151 167Lebanon 157 234 244 178 125Libya 292 323 313 264 251Morocco 1,579 1,774 1,773 1,569 1,435Oman 145 197 210 174 174State of Palestine 299 357 377 428 487Qatar 28 65 68 70 74Saudi Arabia 1,369 1,501 1,536 1,370 1,299Sudan 2,367 2,979 3,104 3,710 4,469Syria 1,244 1,147 967 1,295 1,223Tunisia 430 524 530 429 429UAE 137 240 230 233 270Yemen 1,607 2,052 2,115 2,173 2,073Total 21,308 27,421 27,645 26,593 28,989
TABLE A19. Female children (0-4 years), thousands TABLE A20. Male children (0-4 years), thousands
2000 2015 2018 2030 2050Algeria 9,906 8,513 9,497 11,184 9,644Bahrain 157 223 241 284 281Djibouti 239 254 254 258 239Egypt 22,107 23,617 25,714 31,126 33,470Iran 22,135 15,030 15,982 15,551 11,869Iraq 7,888 11,420 12,353 16,049 21,739Jordan 1,621 2,661 2,838 2,856 2,936Kuwait 455 643 706 822 820Lebanon 810 1,272 1,207 853 674Libya 1,616 1,476 1,521 1,512 1,281Morocco 8,598 7,934 8,160 8,540 7,435Oman 709 680 778 1,014 848State of Palestine 1,169 1,494 1,574 1,974 2,327Qatar 123 265 305 373 369Saudi Arabia 6,457 6,640 6,695 7,643 6,510Sudan 9,070 12,790 13,505 16,259 21,124Syria 5,506 6,258 6,004 6,491 6,614Tunisia 2,660 2,134 2,238 2,536 2,102UAE 675 976 1,099 1,162 1,352Yemen 6,808 8,731 9,210 10,675 10,819Total 108,709 113,012 119,881 137,163 142,454
2000 2015 2018 2030 2050Algeria 4,852 4,169 4,653 5,478 4,713Bahrain 76 109 118 140 138Djibouti 118 126 126 128 118Egypt 10,768 11,466 12,475 15,123 16,271Iran 10,824 7,277 7,821 7,599 5,787Iraq 3,835 5,548 6,002 7,801 10,554Jordan 786 1,316 1,401 1,388 1,431Kuwait 220 307 339 403 402Lebanon 393 645 608 413 329Libya 790 719 742 737 624Morocco 4,213 3,868 3,980 4,164 3,622Oman 347 336 389 495 414State of Palestine 573 731 770 965 1,136Qatar 59 126 145 181 179Saudi Arabia 3,191 3,268 3,289 3,771 3,210Sudan 4,481 6,302 6,650 8,006 10,412Syria 2,693 3,046 2,926 3,162 3,228Tunisia 1,305 1,041 1,094 1,239 1,026UAE 323 483 537 575 663Yemen 3,345 4,278 4,513 5,230 5,298Total 53,195 55,163 58,577 66,999 69,557
TABLE A21. Children (5-17 years), thousands TABLE A22. Female children (5-17 years), thousands

A N N E X E S 8 7
2000 2015 2018 2030 2050Algeria 5,054 4,344 4,844 5,705 4,931Bahrain 81 114 123 144 143Djibouti 121 129 128 131 121Egypt 11,339 12,151 13,238 16,002 17,199Iran 11,312 7,753 8,161 7,952 6,082Iraq 4,053 5,872 6,351 8,248 11,185Jordan 835 1,345 1,437 1,467 1,505Kuwait 235 336 367 419 418Lebanon 416 626 599 440 346Libya 826 756 779 774 657Morocco 4,384 4,066 4,180 4,376 3,813Oman 362 345 388 520 434State of Palestine 596 763 804 1,009 1,191Qatar 64 140 159 192 190Saudi Arabia 3,266 3,371 3,405 3,872 3,299Sudan 4,588 6,488 6,855 8,253 10,712Syria 2,813 3,212 3,078 3,329 3,386Tunisia 1,354 1,092 1,145 1,298 1,076UAE 352 493 562 587 689Yemen 3,463 4,453 4,697 5,445 5,521Total 55,514 57,849 61,301 70,164 72,897
2000 2015 2018 2030 2050Algeria 7,690 5,924 6,244 8,987 7,211Bahrain 109 158 170 216 225Djibouti 171 196 195 197 188Egypt 16,636 17,041 17,785 24,196 25,125Iran 17,848 10,928 11,245 13,063 8,832Iraq 5,574 8,019 8,616 11,597 15,918Jordan 1,185 1,918 2,042 2,174 2,242Kuwait 333 450 501 643 620Lebanon 624 1,061 986 625 555Libya 1,259 1,093 1,118 1,212 984Morocco 6,580 5,982 6,007 6,680 5,744Oman 519 480 529 796 646State of Palestine 765 1,083 1,124 1,438 1,741Qatar 88 200 230 292 289Saudi Arabia 4,458 4,818 4,803 5,801 5,013Sudan 6,237 9,060 9,668 11,782 15,689Syria 4,092 4,586 4,589 5,028 5,143Tunisia 2,115 1,618 1,605 2,010 1,588UAE 475 682 809 950 1,036Yemen 4,559 6,297 6,584 7,998 8,349Total 81,317 81,594 84,851 105,685 107,138
TABLE A23. Male children (5-17 years), thousands TABLE A24. Adolescents (10-19 years), thousands
2000 2015 2018 2030 2050Algeria 3,770 2,910 3,059 4,403 3,526Bahrain 53 76 83 106 110Djibouti 85 97 97 97 93Egypt 8,109 8,289 8,643 11,754 12,221Iran 8,724 5,210 5,432 6,399 4,307Iraq 2,712 3,900 4,188 5,642 7,732Jordan 573 950 1,011 1,057 1,093Kuwait 162 214 236 314 304Lebanon 303 543 501 301 271Libya 616 533 546 591 480Morocco 3,238 2,917 2,932 3,261 2,802Oman 255 235 264 384 315State of Palestine 375 531 551 703 850Qatar 42 83 99 137 137Saudi Arabia 2,209 2,369 2,353 2,861 2,473Sudan 3,085 4,469 4,766 5,802 7,739Syria 2,003 2,222 2,234 2,449 2,510Tunisia 1,043 789 784 982 775UAE 222 333 380 465 503Yemen 2,242 3,088 3,230 3,921 4,092Total 39,821 39,758 41,387 51,629 52,333
2000 2015 2018 2030 2050Algeria 3,920 3,032 3,185 4,584 3,685Bahrain 56 82 87 110 115Djibouti 86 99 99 99 95Egypt 8,528 8,752 9,142 12,443 12,904Iran 9,124 5,718 5,813 6,665 4,525Iraq 2,862 4,119 4,428 5,955 8,187Jordan 612 969 1,031 1,117 1,149Kuwait 171 236 265 328 317Lebanon 321 518 485 324 285Libya 643 560 572 620 504Morocco 3,341 3,065 3,075 3,419 2,942Oman 264 245 264 413 331State of Palestine 390 553 574 734 891Qatar 47 117 131 155 152Saudi Arabia 2,249 2,449 2,450 2,941 2,540Sudan 3,153 4,591 4,902 5,980 7,950Syria 2,089 2,364 2,355 2,579 2,632Tunisia 1,071 829 822 1,028 813UAE 253 349 429 485 533Yemen 2,317 3,210 3,354 4,077 4,256Total 41,497 41,857 43,462 54,056 54,806
Table A25. Female adolescents (10-19 years), thousands Table A26. Male adolescents (10-19 years), thousands
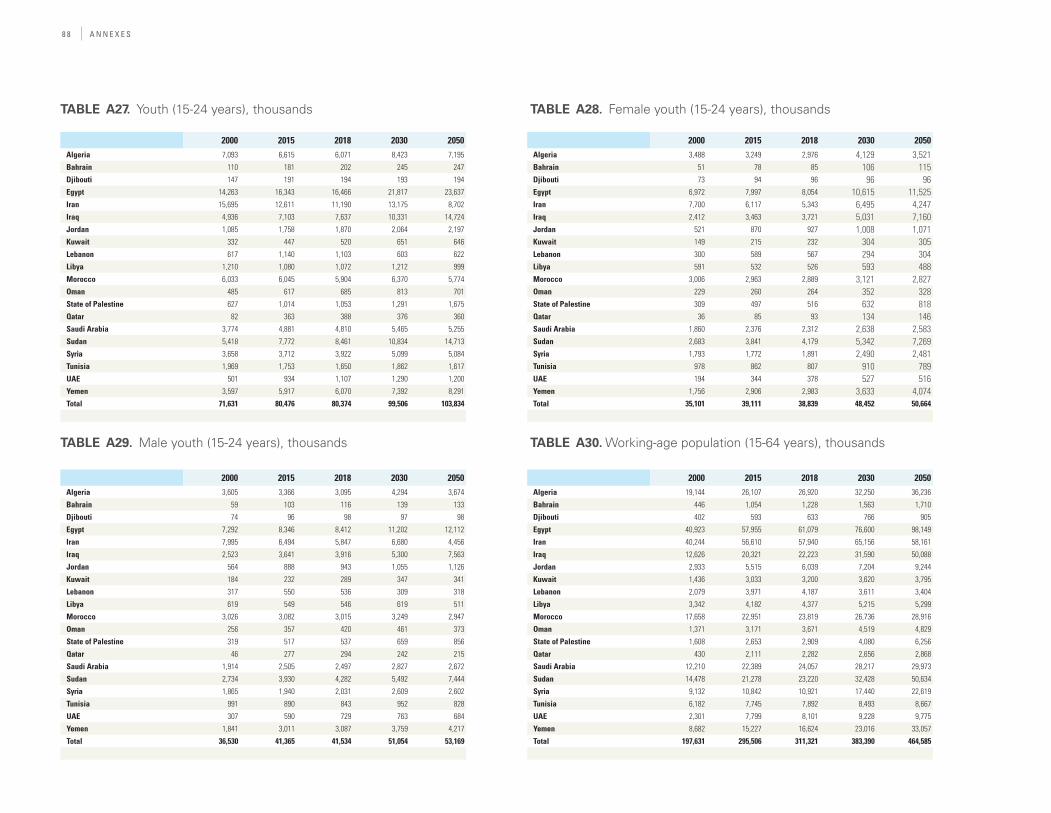
8 8 A N N E X E S
2000 2015 2018 2030 2050Algeria 7,093 6,615 6,071 8,423 7,195Bahrain 110 181 202 245 247Djibouti 147 191 194 193 194Egypt 14,263 16,343 16,466 21,817 23,637Iran 15,695 12,611 11,190 13,175 8,702Iraq 4,936 7,103 7,637 10,331 14,724Jordan 1,085 1,758 1,870 2,064 2,197Kuwait 332 447 520 651 646Lebanon 617 1,140 1,103 603 622Libya 1,210 1,080 1,072 1,212 999Morocco 6,033 6,045 5,904 6,370 5,774Oman 485 617 685 813 701State of Palestine 627 1,014 1,053 1,291 1,675Qatar 82 363 388 376 360Saudi Arabia 3,774 4,881 4,810 5,465 5,255Sudan 5,418 7,772 8,461 10,834 14,713Syria 3,658 3,712 3,922 5,099 5,084Tunisia 1,969 1,753 1,650 1,862 1,617UAE 501 934 1,107 1,290 1,200Yemen 3,597 5,917 6,070 7,392 8,291Total 71,631 80,476 80,374 99,506 103,834
2000 2015 2018 2030 2050Algeria 3,488 3,249 2,976 4,129 3,521Bahrain 51 78 85 106 115Djibouti 73 94 96 96 96Egypt 6,972 7,997 8,054 10,615 11,525Iran 7,700 6,117 5,343 6,495 4,247Iraq 2,412 3,463 3,721 5,031 7,160Jordan 521 870 927 1,008 1,071Kuwait 149 215 232 304 305Lebanon 300 589 567 294 304Libya 591 532 526 593 488Morocco 3,006 2,963 2,889 3,121 2,827Oman 229 260 264 352 328State of Palestine 309 497 516 632 818Qatar 36 85 93 134 146Saudi Arabia 1,860 2,376 2,312 2,638 2,583Sudan 2,683 3,841 4,179 5,342 7,269Syria 1,793 1,772 1,891 2,490 2,481Tunisia 978 862 807 910 789UAE 194 344 378 527 516Yemen 1,756 2,906 2,983 3,633 4,074Total 35,101 39,111 38,839 48,452 50,664
TABLE A27. Youth (15-24 years), thousands TABLE A28. Female youth (15-24 years), thousands
2000 2015 2018 2030 2050Algeria 3,605 3,366 3,095 4,294 3,674Bahrain 59 103 116 139 133Djibouti 74 96 98 97 98Egypt 7,292 8,346 8,412 11,202 12,112Iran 7,995 6,494 5,847 6,680 4,456Iraq 2,523 3,641 3,916 5,300 7,563Jordan 564 888 943 1,055 1,126Kuwait 184 232 289 347 341Lebanon 317 550 536 309 318Libya 619 549 546 619 511Morocco 3,026 3,082 3,015 3,249 2,947Oman 256 357 420 461 373State of Palestine 319 517 537 659 856Qatar 46 277 294 242 215Saudi Arabia 1,914 2,505 2,497 2,827 2,672Sudan 2,734 3,930 4,282 5,492 7,444Syria 1,865 1,940 2,031 2,609 2,602Tunisia 991 890 843 952 828UAE 307 590 729 763 684Yemen 1,841 3,011 3,087 3,759 4,217Total 36,530 41,365 41,534 51,054 53,169
2000 2015 2018 2030 2050Algeria 19,144 26,107 26,920 32,250 36,236Bahrain 446 1,054 1,228 1,563 1,710Djibouti 402 593 633 766 905Egypt 40,923 57,955 61,079 76,600 98,149Iran 40,244 56,610 57,940 65,156 58,161Iraq 12,626 20,321 22,223 31,590 50,088Jordan 2,933 5,515 6,039 7,204 9,244Kuwait 1,436 3,033 3,200 3,620 3,795Lebanon 2,079 3,971 4,187 3,611 3,404Libya 3,342 4,182 4,377 5,215 5,299Morocco 17,658 22,951 23,819 26,736 28,916Oman 1,371 3,171 3,671 4,519 4,829State of Palestine 1,608 2,653 2,909 4,080 6,256Qatar 430 2,111 2,282 2,656 2,868Saudi Arabia 12,210 22,389 24,057 28,217 29,973Sudan 14,478 21,278 23,220 32,428 50,634Syria 9,132 10,842 10,921 17,440 22,619Tunisia 6,182 7,745 7,892 8,493 8,667UAE 2,301 7,799 8,101 9,228 9,775Yemen 8,682 15,227 16,624 23,016 33,057Total 197,631 295,506 311,321 383,390 464,585
TABLE A29. Male youth (15-24 years), thousands TABLE A30. Working-age population (15-64 years), thousands
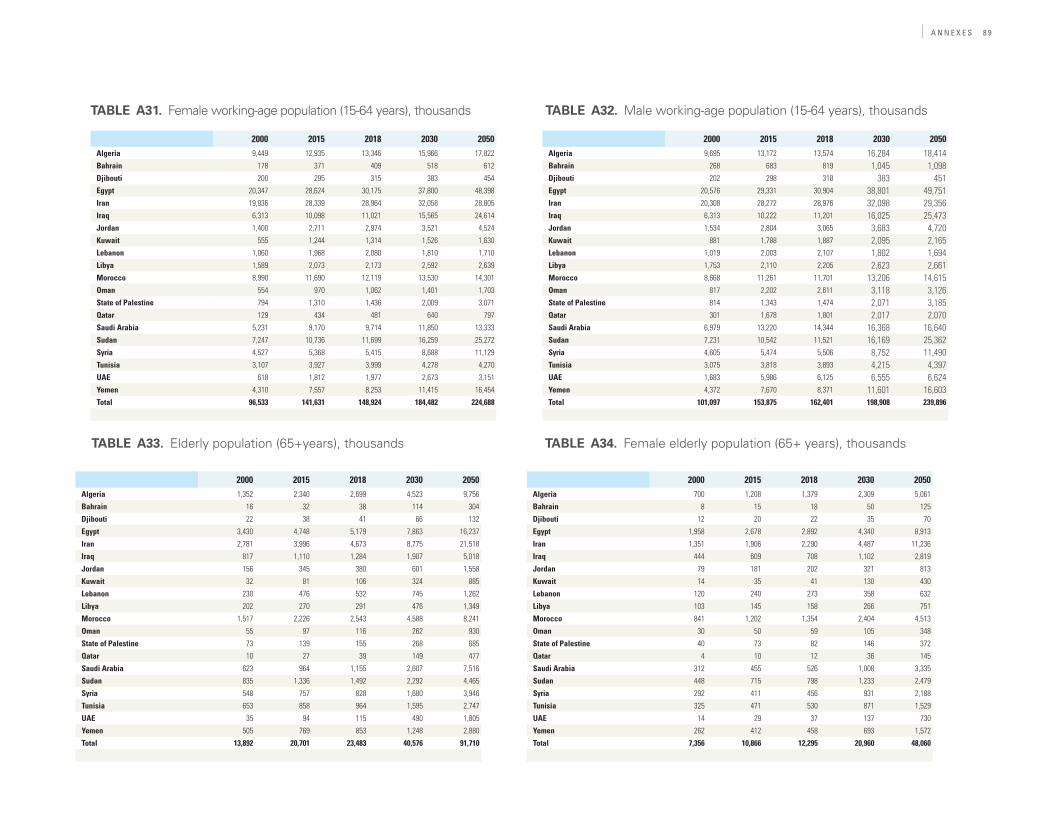
A N N E X E S 8 9
2000 2015 2018 2030 2050Algeria 9,449 12,935 13,346 15,966 17,822Bahrain 178 371 409 518 612Djibouti 200 295 315 383 454Egypt 20,347 28,624 30,175 37,800 48,398Iran 19,936 28,339 28,964 32,058 28,805Iraq 6,313 10,098 11,021 15,565 24,614Jordan 1,400 2,711 2,974 3,521 4,524Kuwait 555 1,244 1,314 1,526 1,630Lebanon 1,060 1,968 2,080 1,810 1,710Libya 1,589 2,073 2,173 2,592 2,639Morocco 8,990 11,690 12,119 13,530 14,301Oman 554 970 1,062 1,401 1,703State of Palestine 794 1,310 1,436 2,009 3,071Qatar 129 434 481 640 797Saudi Arabia 5,231 9,170 9,714 11,850 13,333Sudan 7,247 10,736 11,699 16,259 25,272Syria 4,527 5,368 5,415 8,688 11,129Tunisia 3,107 3,927 3,999 4,278 4,270UAE 618 1,812 1,977 2,673 3,151Yemen 4,310 7,557 8,253 11,415 16,454Total 96,533 141,631 148,924 184,482 224,688
2000 2015 2018 2030 2050Algeria 9,695 13,172 13,574 16,284 18,414Bahrain 268 683 819 1,045 1,098Djibouti 202 298 318 383 451Egypt 20,576 29,331 30,904 38,801 49,751Iran 20,308 28,272 28,976 32,098 29,356Iraq 6,313 10,222 11,201 16,025 25,473Jordan 1,534 2,804 3,065 3,683 4,720Kuwait 881 1,788 1,887 2,095 2,165Lebanon 1,019 2,003 2,107 1,802 1,694Libya 1,753 2,110 2,205 2,623 2,661Morocco 8,668 11,261 11,701 13,206 14,615Oman 817 2,202 2,611 3,118 3,126State of Palestine 814 1,343 1,474 2,071 3,185Qatar 301 1,678 1,801 2,017 2,070Saudi Arabia 6,979 13,220 14,344 16,368 16,640Sudan 7,231 10,542 11,521 16,169 25,362Syria 4,605 5,474 5,506 8,752 11,490Tunisia 3,075 3,818 3,893 4,215 4,397UAE 1,683 5,986 6,125 6,555 6,624Yemen 4,372 7,670 8,371 11,601 16,603Total 101,097 153,875 162,401 198,908 239,896
TABLE A31. Female working-age population (15-64 years), thousands TABLE A32. Male working-age population (15-64 years), thousands
2000 2015 2018 2030 2050Algeria 1,352 2,340 2,699 4,523 9,756Bahrain 16 32 38 114 304Djibouti 22 38 41 66 132Egypt 3,430 4,748 5,179 7,863 16,237Iran 2,781 3,996 4,673 8,775 21,518Iraq 817 1,110 1,284 1,907 5,018Jordan 156 345 380 601 1,558Kuwait 32 81 106 324 885Lebanon 230 476 532 745 1,262Libya 202 270 291 476 1,349Morocco 1,517 2,226 2,543 4,588 8,241Oman 55 97 116 262 930State of Palestine 73 139 155 268 685Qatar 10 27 39 149 477Saudi Arabia 623 964 1,155 2,607 7,516Sudan 835 1,336 1,492 2,292 4,465Syria 548 757 828 1,680 3,946Tunisia 653 858 964 1,595 2,747UAE 35 94 115 490 1,805Yemen 505 769 853 1,248 2,880Total 13,892 20,701 23,483 40,576 91,710
2000 2015 2018 2030 2050Algeria 700 1,208 1,379 2,309 5,061Bahrain 8 15 18 50 125Djibouti 12 20 22 35 70Egypt 1,958 2,678 2,892 4,340 8,913Iran 1,351 1,906 2,290 4,487 11,236Iraq 444 609 708 1,102 2,819Jordan 79 181 202 321 813Kuwait 14 35 41 130 430Lebanon 120 240 273 358 632Libya 103 145 158 266 751Morocco 841 1,202 1,354 2,404 4,513Oman 30 50 59 105 348State of Palestine 40 73 82 146 372Qatar 4 10 12 36 145Saudi Arabia 312 455 526 1,008 3,335Sudan 448 715 798 1,233 2,479Syria 292 411 456 931 2,188Tunisia 325 471 530 871 1,529UAE 14 29 37 137 730Yemen 262 412 458 693 1,572Total 7,356 10,866 12,295 20,960 48,060
TABLE A33. Elderly population (65+years), thousands TABLE A34. Female elderly population (65+ years), thousands

9 0 A N N E X E S
2000 2015 2018 2030 2050Algeria 652 1,132 1,320 2,214 4,695Bahrain 8 17 20 64 179Djibouti 10 18 19 32 62Egypt 1,472 2,070 2,287 3,524 7,325Iran 1,430 2,089 2,383 4,289 10,282Iraq 373 501 575 805 2,198Jordan 78 163 179 281 745Kuwait 18 47 64 195 455Lebanon 110 237 259 387 629Libya 99 124 133 210 598Morocco 676 1,024 1,189 2,185 3,728Oman 25 47 56 158 582State of Palestine 33 66 73 122 313Qatar 6 17 27 113 332Saudi Arabia 311 509 630 1,598 4,181Sudan 387 620 694 1,060 1,986Syria 256 346 372 749 1,758Tunisia 327 386 434 725 1,218UAE. 21 64 78 353 1,076Yemen 244 357 395 555 1,308Total 6,536 9,836 11,188 19,616 43,650
2000 2015 2018 2030 2050Algeria 3,316 3,596 3,233 3,799 3,647Bahrain 58 106 122 139 132Djibouti 71 94 95 95 98Egypt 6,482 8,206 7,951 9,593 11,445Iran 6,905 7,120 5,937 6,332 4,412Iraq 2,318 3,299 3,603 4,801 7,061Jordan 505 836 896 984 1,087Kuwait 167 229 281 335 340Lebanon 304 583 575 293 327Libya 593 544 531 588 507Morocco 2,762 3,087 2,960 3,003 2,898Oman 238 382 430 416 378State of Palestine 287 484 515 607 821Qatar 40 261 268 228 213Saudi Arabia 1,799 2,542 2,522 2,689 2,727Sudan 2,501 3,545 3,902 5,186 7,086Syria 1,691 1,553 1,718 2,539 2,515Tunisia 928 925 859 846 829UAE 292 605 700 785 687Yemen 1,572 2,897 2,944 3,496 4,120Total 32,829 40,894 40,040 46,754 51,330
TABLE A35. Male elderly population (65+ years), thousands TABLE A36. Population aged 20-24, thousands
2000 2015 2018 2030 2050Algeria 1,633 1,771 1,587 1,864 1,786Bahrain 26 42 47 55 58Djibouti 35 46 47 47 49Egypt 3,176 4,029 3,909 4,682 5,592Iran 3,405 3,520 2,848 3,132 2,154Iraq 1,138 1,610 1,758 2,338 3,437Jordan 242 414 444 483 530Kuwait 72 111 121 150 155Lebanon 148 303 297 145 160Libya 289 269 261 289 248Morocco 1,387 1,520 1,451 1,476 1,422Oman 107 146 140 163 170State of Palestine 141 237 252 297 401Qatar 16 50 50 67 77Saudi Arabia 875 1,226 1,196 1,269 1,335Sudan 1,240 1,755 1,929 2,560 3,505Syria 830 733 820 1,243 1,228Tunisia 462 459 421 414 405UAE 98 185 199 280 269Yemen 760 1,425 1,448 1,722 2,027Total 16,080 19,851 19,226 22,676 25,008
2000 2015 2018 2030 2050Algeria 1,682 1,825 1,647 1,936 1,861Bahrain 33 64 75 84 74Djibouti 35 47 48 48 49Egypt 3,306 4,177 4,042 4,911 5,853Iran 3,501 3,600 3,088 3,200 2,258Iraq 1,181 1,689 1,845 2,463 3,624Jordan 264 422 452 501 557Kuwait 95 118 160 185 185Lebanon 156 279 278 148 167Libya 304 274 269 300 259Morocco 1,375 1,567 1,509 1,527 1,476Oman 130 236 290 252 207State of Palestine 146 246 262 309 420Qatar 24 211 218 161 136Saudi Arabia 925 1,316 1,326 1,420 1,391Sudan 1,261 1,791 1,973 2,626 3,582Syria 861 820 897 1,297 1,288Tunisia 466 466 438 433 424UAE 194 420 502 505 418Yemen 813 1,473 1,496 1,774 2,093Total 16,752 21,041 20,814 24,080 26,322
TABLE A37. Female population aged 20-24, thousands TABLE A38. Male population aged 20-24, thousands

A N N E X E S 9 1
FIG. B1 Composition of the total dependency ratio (child dependency ratio and old-age dependency ratio) for countries in the MENA region, 1950-2100
BahrainUAE

9 2 A N N E X E S
AlgeriaDjibouti

A N N E X E S 9 3
IranEgypt
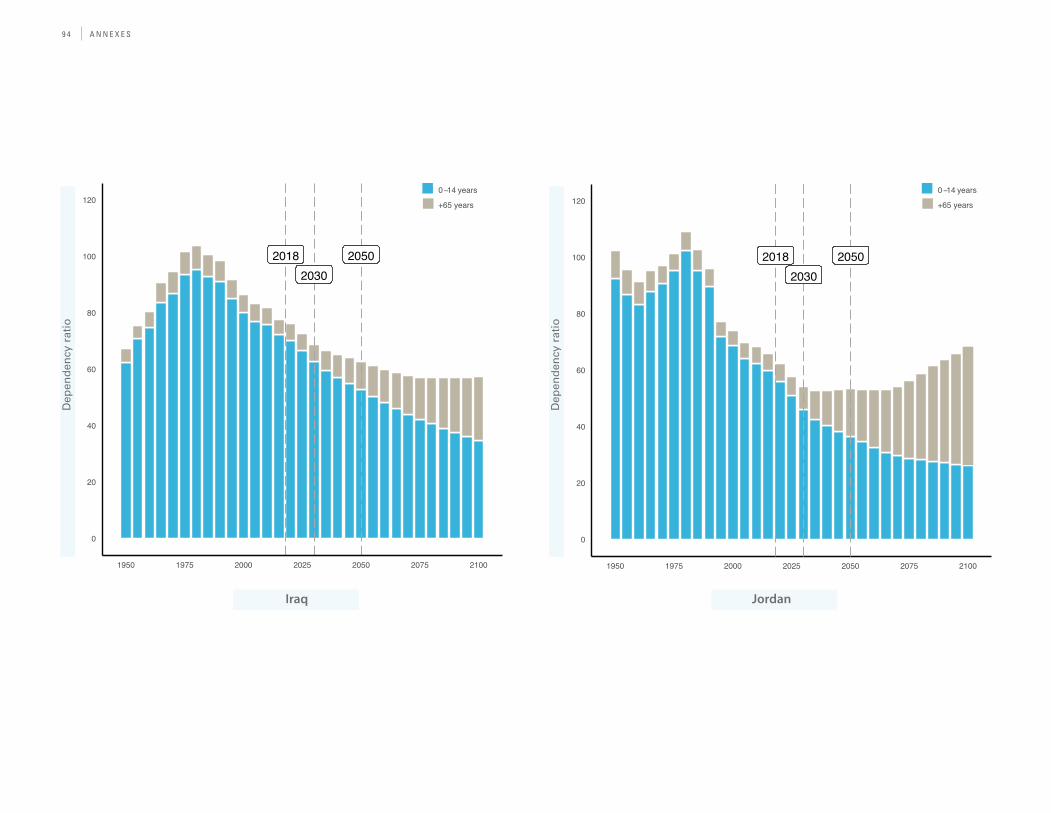
9 4 A N N E X E S
JordanIraq

A N N E X E S 9 5
LebanonKuwait

9 6 A N N E X E S
MoroccoLibya

A N N E X E S 9 7
State of PalestineOman

9 8 A N N E X E S
Saudi ArabiaQatar

A N N E X E S 9 9
SyriaSudan

1 0 0 A N N E X E S
YemenTunisia

A N N E X E S 1 0 1
FIG.B2 Population by age and sex of MENA countries, 2015 and 2050 (in millions)
100+
95-99
90-94
85-89
80-84
75-79
70-74
65-69
60-64
55-59
50-54
45-49
40-44
35-39
30-34
25-29
20-24
15-19
10-14
5-9
0-4
100+
95-99
90-94
85-89
80-84
75-79
70-74
65-69
60-64
55-59
50-54
45-49
40-44
35-39
30-34
25-29
20-24
15-19
10-14
5-9
0-4
FemaleFemale
MaleMale
20152015 20502050

1 0 2 A N N E X E S
100+
95-99
90-94
85-89
80-84
75-79
70-74
65-69
60-64
55-59
50-54
45-49
40-44
35-39
30-34
25-29
20-24
15-19
10-14
5-9
0-4
100+
95-99
90-94
85-89
80-84
75-79
70-74
65-69
60-64
55-59
50-54
45-49
40-44
35-39
30-34
25-29
20-24
15-19
10-14
5-9
0-4
100+
95-99
90-94
85-89
80-84
75-79
70-74
65-69
60-64
55-59
50-54
45-49
40-44
35-39
30-34
25-29
20-24
15-19
10-14
5-9
0-4
100+
95-99
90-94
85-89
80-84
75-79
70-74
65-69
60-64
55-59
50-54
45-49
40-44
35-39
30-34
25-29
20-24
15-19
10-14
5-9
0-4
0.1 0.01 0.010.02 0.020.03 0.030.04 0.040.05 0.050.1
Female
Female
Female
Female
Male
Male
Male
Male
2015
2015
2015
2015
2050
2050
2050
2050

A N N E X E S 1 0 3
100+
95-99
90-94
85-89
80-84
75-79
70-74
65-69
60-64
55-59
50-54
45-49
40-44
35-39
30-34
25-29
20-24
15-19
10-14
5-9
0-4
100+
95-99
90-94
85-89
80-84
75-79
70-74
65-69
60-64
55-59
50-54
45-49
40-44
35-39
30-34
25-29
20-24
15-19
10-14
5-9
0-4
100+
95-99
90-94
85-89
80-84
75-79
70-74
65-69
60-64
55-59
50-54
45-49
40-44
35-39
30-34
25-29
20-24
15-19
10-14
5-9
0-4
100+
95-99
90-94
85-89
80-84
75-79
70-74
65-69
60-64
55-59
50-54
45-49
40-44
35-39
30-34
25-29
20-24
15-19
10-14
5-9
0-4
0.01 0.010.02 0.020.03 0.03
Female
Female
Female
Female
Male
Male
Male
Male
2015
2015
2015
2015
2050
2050
2050
2050

1 0 4 A N N E X E S
100+
95-99
90-94
85-89
80-84
75-79
70-74
65-69
60-64
55-59
50-54
45-49
40-44
35-39
30-34
25-29
20-24
15-19
10-14
5-9
0-4
100+
95-99
90-94
85-89
80-84
75-79
70-74
65-69
60-64
55-59
50-54
45-49
40-44
35-39
30-34
25-29
20-24
15-19
10-14
5-9
0-4
100+
95-99
90-94
85-89
80-84
75-79
70-74
65-69
60-64
55-59
50-54
45-49
40-44
35-39
30-34
25-29
20-24
15-19
10-14
5-9
0-4
100+
95-99
90-94
85-89
80-84
75-79
70-74
65-69
60-64
55-59
50-54
45-49
40-44
35-39
30-34
25-29
20-24
15-19
10-14
5-9
0-4
0.01 0.010.02 0.020.03 0.03 0.01 0.010.02 0.020.03 0.03
Female
Female
Female
Female
Male
Male
Male
Male
2015
2015
2015
2015
2050
2050
2050
2050

A N N E X E S 1 0 5
100+
95-99
90-94
85-89
80-84
75-79
70-74
65-69
60-64
55-59
50-54
45-49
40-44
35-39
30-34
25-29
20-24
15-19
10-14
5-9
0-4
100+
95-99
90-94
85-89
80-84
75-79
70-74
65-69
60-64
55-59
50-54
45-49
40-44
35-39
30-34
25-29
20-24
15-19
10-14
5-9
0-4
100+
95-99
90-94
85-89
80-84
75-79
70-74
65-69
60-64
55-59
50-54
45-49
40-44
35-39
30-34
25-29
20-24
15-19
10-14
5-9
0-4
100+
95-99
90-94
85-89
80-84
75-79
70-74
65-69
60-64
55-59
50-54
45-49
40-44
35-39
30-34
25-29
20-24
15-19
10-14
5-9
0-4
0.01 0.010.02 0.020.030.04 0.03 0.04
Female
Female
Female
Female
Male
Male
Male
Male
2015
2015
2015
2015
2050
2050
2050
2050

1 0 6 A N N E X E S
100+
95-99
90-94
85-89
80-84
75-79
70-74
65-69
60-64
55-59
50-54
45-49
40-44
35-39
30-34
25-29
20-24
15-19
10-14
5-9
0-4
100+
95-99
90-94
85-89
80-84
75-79
70-74
65-69
60-64
55-59
50-54
45-49
40-44
35-39
30-34
25-29
20-24
15-19
10-14
5-9
0-4
100+
95-99
90-94
85-89
80-84
75-79
70-74
65-69
60-64
55-59
50-54
45-49
40-44
35-39
30-34
25-29
20-24
15-19
10-14
5-9
0-4
FemaleFemale
Female
MaleMale
Male
20152015
2015
20502050
2050


1 0 8 A N N E X E S
Published by UNICEF Division of Data, Research and Policy3 United Nations PlazaNew York, NY 10017, USA
www. unicef. org
© United Nations Children’s Fund (UNICEF)September 2017
Cover photo: A Syrian refugee girl in an informal tented settlement in Jordan.
© UNICEF/UN0229230/Herwig
This report represents a significant creative and technical collaboration between colleagues from UNICEF Headquarters and the Regional Office for the Middle East and North Africa.
United Nations Children’s Fund (UNICEF)Regional Office for the Middle East and North Africa16 Abdel Qader Al-Abed StreetP. O. Box 1551Amman 11821 Jordan
Tel: +962-550-2400www.unicef.org/[email protected]
www.facebook.com/UNICEFmenawww.twitter.com/UNICEFmenawww.instagram.com/unicef_mena