The Determinants of Economic Growth in the MENA Region
50
Revised July 2005 The Determinants of Economic Growth in the MENA Region* * Forthcoming in J. Nugent and H. Pesaran ( eds.), Explaining Growth in the MENA Region, (North Holland/Elsevier Contributions to Economic Analysis) ** Professor of Economics, American University of Beirut, Lebanon. *** International Consultant; formerly Director, Economic Development Division, U.N. ESCWA-, Beirut, Lebanon **** Arab Fund for Economic and Social Development, Kuwait. By Samir Makdisi**, Zeki Fattah*** and Imed Limam****
Transcript of The Determinants of Economic Growth in the MENA Region

Revised July 2005
The Determinants of Economic Growth in the
MENA Region*
* Forthcoming in J. Nugent and H. Pesaran ( eds.), Explaining Growth in the MENA Region, (North Holland/Elsevier Contributions to Economic Analysis) ** Professor of Economics, American University of Beirut, Lebanon. *** International Consultant; formerly Director, Economic Development Division, U.N. ESCWA-, Beirut, Lebanon **** Arab Fund for Economic and Social Development, Kuwait.
By
Samir Makdisi**, Zeki Fattah*** and Imed Limam****
Determinants of Growth in the MENA Countries*
ABSTRACT
The overall growth performance of the MENA region over the period 1960-2000 has been both mixed and characterized by a higher degree of volatility compared with other regions in the world. In comparing the growth pattern of the MENA region within an international perspective, we have found that: capital is less efficient; trade openness less beneficial to growth; and the impact of adverse external shocks more pronounced. In addition, Total Factor Productivity Growth (TFPG) in the MENA region, was not an important source of growth in comparison with other regions owing to among other things, the lower quality of its institutions, modest stock of human capital and its educational system that focused on preparing students for public sector employment. Within the MENA region, non-oil and diversified economies have fared much better than oil-exporting countries both in terms of output growth and TFPG. Finally, the degree of exposure to internal and external shocks, the extent of economic diversification and international competitiveness, were found to be important factors explaining variations in growth performance within the MENA region.
* The authors would like to thank Bill Easterly, Dani Rodrik, Jong-Wha Lee, Seppo Honkapohja, two
anonymous referees and others for their comments on earlier drafts of the paper including those present during the World Bank sponsored Workshop on the Global Development Network held in Prague during the period June 9-11, 2000.
?
1. Introduction
Over the last two decades or so, growth performance of the MENA region as a whole
has been disappointing and mixed relative to that of the rest of developing countries.1 The
meager growth performance in the region has not kept pace with the high growth rates of its
labor force and hence did not address the most important development challenge of the region
namely its high level of unemployment. In comparison with other regions in the world,
growth rates in MENA countries have been remarkably volatile and at times lower than that
of the poor-performing regions such as Sub-Saharan Africa (SSA).
This growth pattern is believed to be inextricably linked to several characteristics of
most of the countries in the region notably, their heavy dependence on oil; weak economic
base; high population growth; low rates of returns on investment in physical and human
capital; low level of integration in the world economy; under-development of market
institutions and, with very few exceptions, the omnipresence of the State.
The relative better growth performance of MENA countries in the 1960’s, 1970’s and
the first half of the 1980’s is largely attributed to favorable external environment in the form
of high energy prices. This situation has been reversed in the second half of the 1980’s and
early 1990’s resulting in sharp declines in domestic investment, savings and growth. Oil is
justifiably perceived by many as the most important source of growth in the MENA region2.
Indeed available date indicate that per capita income in Arab oil producing countries has
consistently been higher than in non oil Arab countries by many folds through out the period
under consideration. The margin of difference was even greater when comparing per capita
1 Unless otherwise mentioned, the definition of MENA followed in this paper includes: Algeria, Bahrain,
Comoros, Djibouti, Egypt, Iran, Iraq, Jordan, Kuwait, Lebanon, Libya, Mauritania, Morocco, Oman, Qatar, Saudi Arabia, Somalia, Sudan, Syria, Tunisia, Turkey, United Arab Emirates, and Yemen. Among these the oil-exporters are: Algeria, Bahrain, Iran, Iraq, Kuwait, Libya, Oman, Qatar, Saudi Arabia and United Arab Emirates.
2 MENA countries currently sit on more than the third of proven world oil reserves and account for more than 30% of actual world production
?
investment. The per capita investment in non-oil producing countries amounted, on average,
to only 20 per cent of that in oil producing countries. However, other factors have also played
an important role in shaping the growth picture of the region
The external environment is not likely to be as favorable as it had been since the early
1970’s and until the mid 1980’s. Analyzing what have been the main determinants of the
recent growth performance is a first step toward identifying what needs to be done to make
growth more sustainable.
This paper will attempt to use the broader framework provided by the recent empirical
growth literature to measure the relative contribution of the main sources of growth in the
MENA region. While subsets of the MENA countries (especially oil versus non-oil countries)
are economically heterogeneous, the region’s growth is analyzed within an aggregate
framework that puts it into international perspectives and in comparison with other regions.
Section 2 gives an overview of the growth performance of the countries of the region
during the period 1960-2000. Section 3 puts MENA growth performance into an international
perspective by showing how the region performance has been affected by the main
determinants of economic growth in comparison with the rest of the world, and estimating the
relative contribution of the different factors of production to this growth in MENA versus
non-MENA countries. Section 4 analyzes the growth performance of the MENA countries
from a regional perspective by explaining variations in the growth rates for the countries of
the region included in the sample. Section 5 concludes.
2. Growth Record of the MENA Region
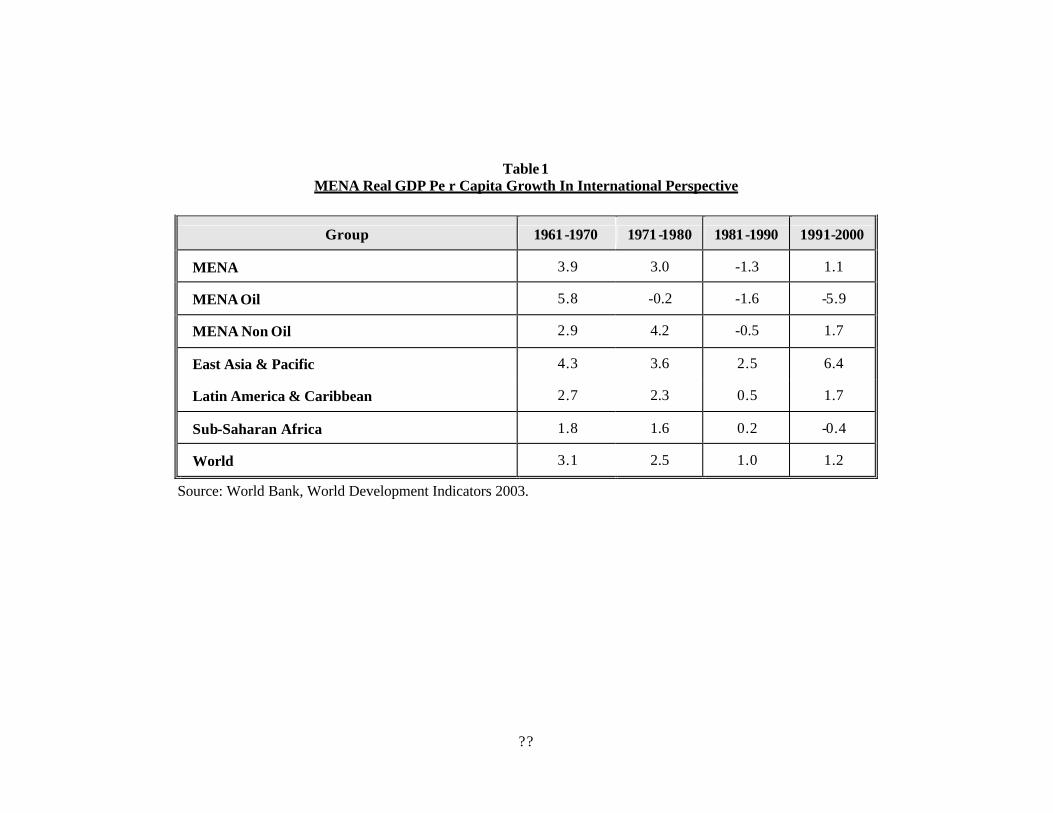
Over the period 1960-2000, MENA growth has followed the growth pattern of the
World economy. As shown in Table 1, after a period of relatively high growth rates during
the 1960’s and 1970’s, growth has slowed down during the 1980’s and 1990’s. However, the
impact of the worldwide recession in the early 1980’s has been more pronounced for MENA
?
countries whose growth performance has not only been below world average but also weaker
than that of the low-performing SSA.
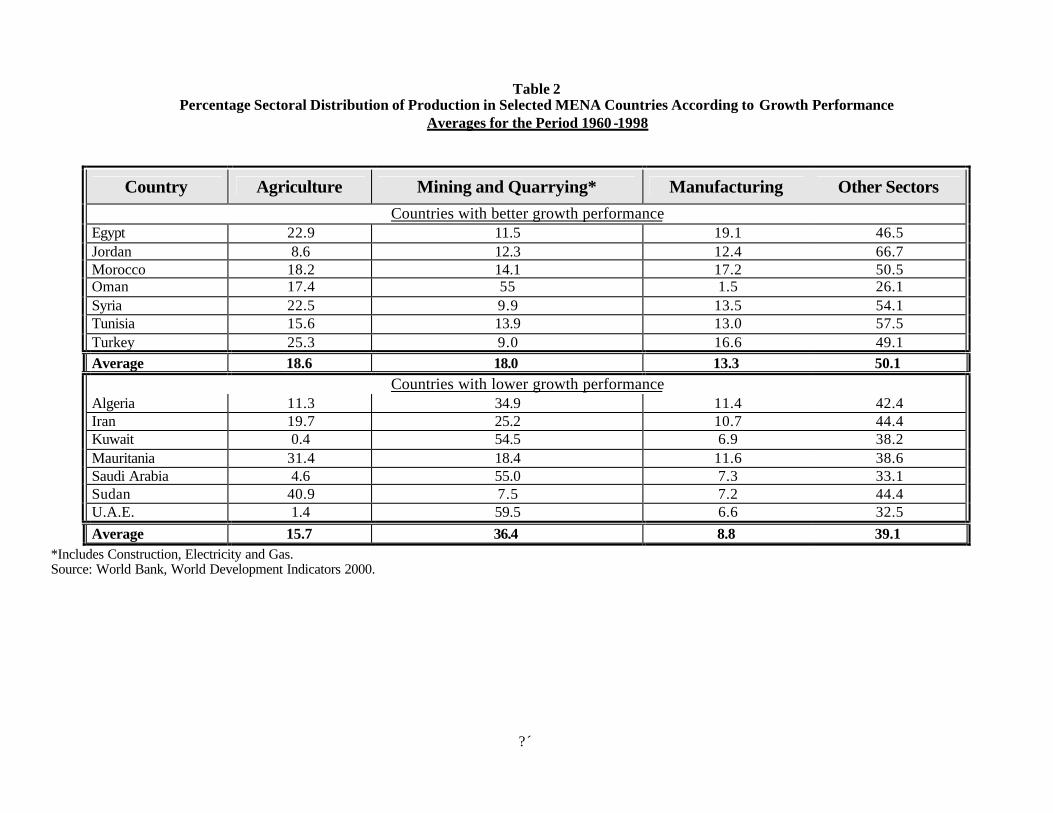
Table 2 exhibits the sectoral distribution of production of selected MENA countries
according to their average growth performance over the period 1960-1998. The numbers
show that countries, which better growth performance, tend to be more diversified than the
other countries, with relatively larger manufacturing and service sectors. In contrast,
countries with weaker growth performance have either large agriculture or mining and
quarrying sectors.
This can explain why the more diversified countries tend to be more resilient to
shocks and hence capable of achieving sustainable growth rates. Another possible
explanation of the anemic growth rates recorded by the less-diversified countries is that most
of the growth under-achievers are major oil-exporting countries with an already high level of
GDP a high proportion of which is essentially resource rent. Under the circumstances it
would be difficult for these countries to grow rapidly even when there is a rapid productivity
growth in the non-resource sectors.3
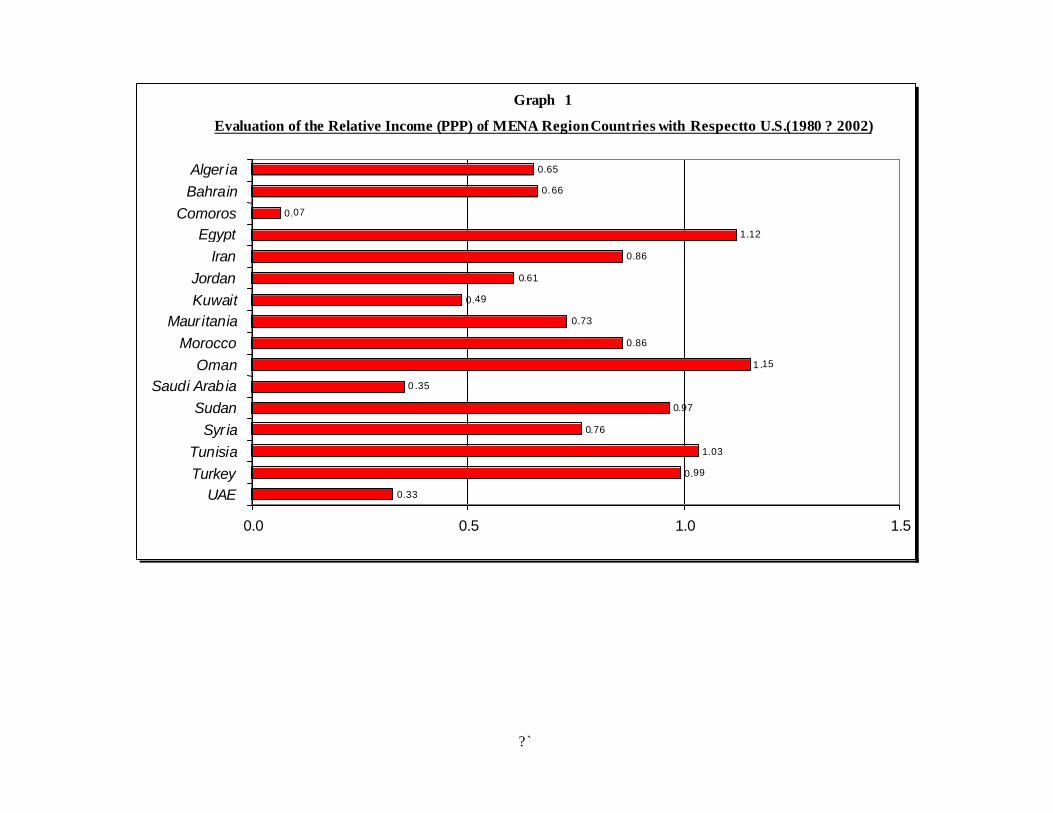
The MENA countries have failed during the last two decades to catch up with the
developed world. Graph 1, shows that the ratio, RIUS, of the 2002 relative per-capita
income, in PPP terms, with respect to the United States to that of 1980 was below unity for
almost all the countries in the region pointing to the widening income gap with respect to the
United States.4 The only exceptions were Egypt, Oman and Tunisia that have had a relatively
better growth performance over the last two decades.
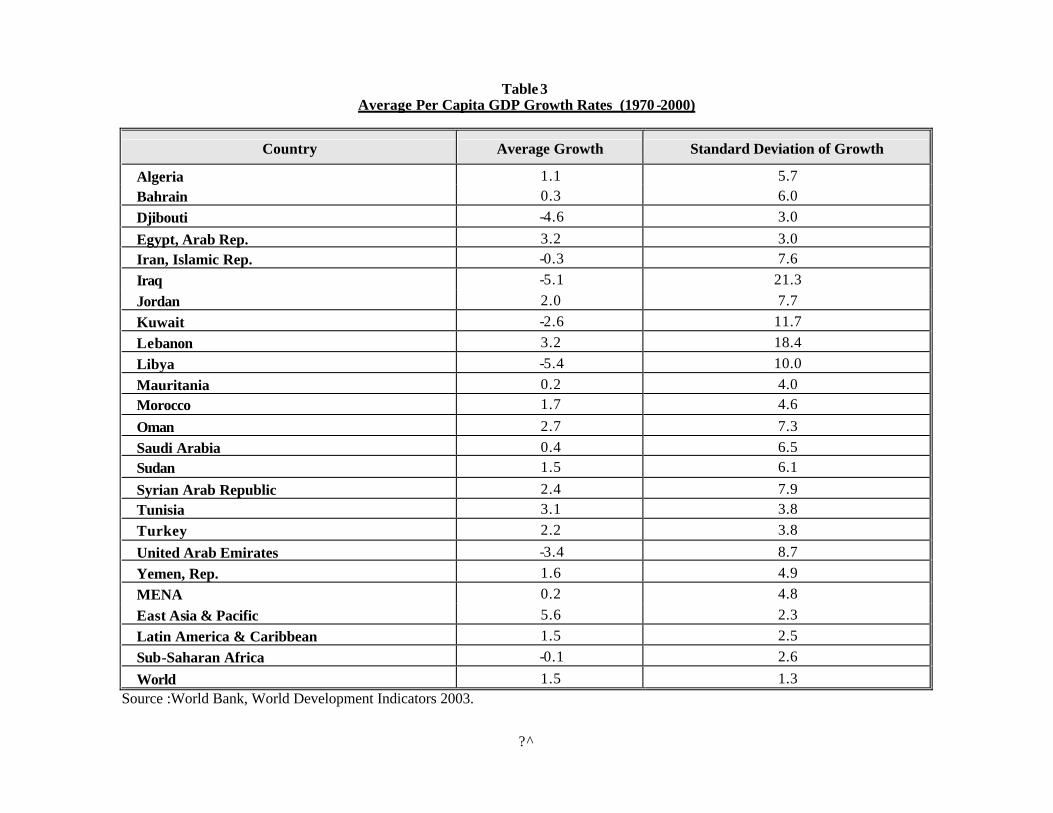
Another salient feature of the recent growth performance of MENA countries is its
high volatility. Table 3 shows that during the period 1970-2000, the average per capita GDP
growth rate of MENA countries has been characterized by a high variability in comparison
with other regions and with the world average. The average growth variability as measured
3 We owe this point to an anonymous referee.
4 For any country i, this ratio is computed as follows: US
i
US
ii
GNIGNI
GNIGNIRIUS
8080:
0202= . The idea of using
such a ratio is borrowed from Nunnenkamp (2004).
?
by the standard deviation of the real per capita GDP growth rate for the MENA region is
almost four times that of the world and twice that of the low performing SSA region. Starting
from the second half of 1980’s, although the variability of growth rates has declined
somewhat for the MENA region as a whole, it remained higher than the world average.
This high variability in the growth performance of the MENA region may be
explained by several factors including the lack of economic diversification that increases
vulnerability to external shocks. This especially applies to the oil-exporting countries that are
frequently subject to the vagaries of international oil market, as well as to countries that rely
heavily on agriculture and whose performance is frequently affected by unfavorable weather
conditions. Politic al instability and the perennial regional conflict may further explain the
very high variability of the growth performance in a number of countries in the region.
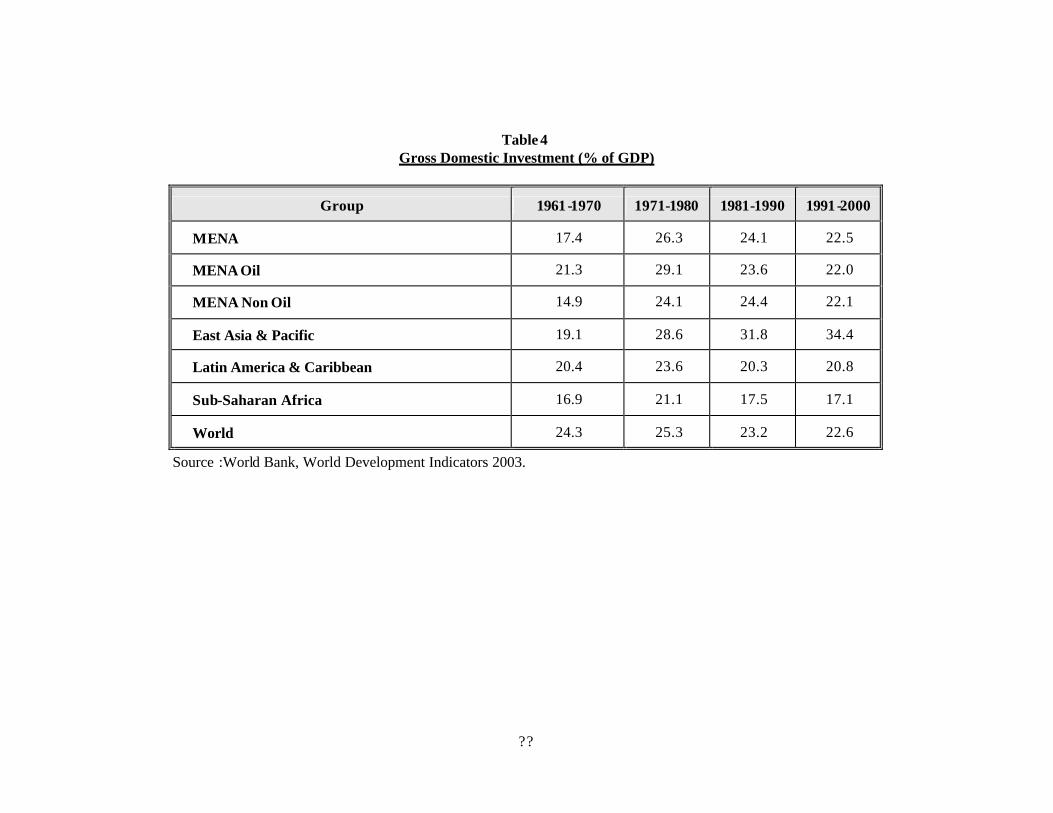
Tables 4, shows that the pattern of investment has also followed the growth pattern
described above. Investment has declined sharply during the 1980’s and 1990’s. Oil countries
have borne the brunt of this adjustment with substantial declines in investment ratios. Non-oil
countries have maintained, over the same period, fairly stable investment rates above the
level of their low saving ratios.
Many studies link the performance of the MENA region to the wide fluctuations in its
terms of trade. For instance, comparing terms of trade fluctuations across a number of regions
for the period 1980-1995, Gamo et al. (1997, p. 14) have found that oil-exporting countries in
the region have the highest terms of trade variability. In addition, terms of trade variability of
MENA non-oil exporting countries were also found to be higher than that of developing
countries as a group. This pattern may be attributed to the excessive reliance of MENA
countries on volatile oil receipts which account for a large part of their total export revenues.
Even non-oil MENA countries have been subject to fluctuation in their own terms of trade,
being exporters of primary products themselves. Oil price fluctuation has also indirectly
affected these countries through its impact on the flows of workers ‘remittances, investment
`
and financial assistance flows from oil-exporting countries. All these factors combined show
a priori that the MENA region is remarkably vulnerable to external shocks.
3. MENA Economic Growth in a Global Context
In this section we will put MENA’s growth performance into international perspective
by first using a cross-country regression framework to analyze the main determinants of
growth in the MENA region as compared with the rest of the world; and second by using an
accounting framework to identify the relative contribution of the different factors of
production to the growth of the countries of the region in comparison with other
developing countries.
a. Cross-Country Regression
The absence of guidance from growth theory as to which variables to include, makes
the choice among the great number of possible correlates of growth a difficult one. However,
our selection will be guided by variables that proved more “robust” than others in recent
literature.5 Therefore, we attempted to identify a small set of regressors that would account
for most of the variation in cross-country per capita GDP growth. In addition, we focused on
variables of relevance to the MENA region’s recent growth performance. With the above in
mind, the set of chosen variables include initial conditions, human capital, investment ratio,
external shocks, macroeconomic performance, openness, natural resource abundance, and
output volatility. We take them up in turn.
Concerning initial conditions, recent empirical growth literature provides ample
evidence about the existence of conditional income convergence across countries.
Conditional on the rate of investment and other relevant variables, a poor country would tend
to grow relatively faster because the marginal productivity of capital is relatively higher.
5 There is a lot a spuriousness associated with the Barro-type (Barro, 1991) cross-country regression
framework. However, it could be used as a suggestive tool to measure the relative contribution of the many sources of growth across countries and regions.

´
This convergence is evidenced by the negative relationship between the growth rate of
per capita GDP and the initial level of GDP per capita after controlling for other relevant
variables such as measures of government policies, institutions, politics and variables related
to the character of national population. We will take the 1960 level of real GDP per capita,
Y60, as a measure of initial income.
Countries with higher initial stock of human capital and knowledge have also been
found to be able to forge ahead through higher grow th rates. The simple inclusion of a
measure of human capital in a Barro-type regression equation, however, overlooks the dual
role played by the latter. Human capital not only affects growth as an additional factor of
production, together with physical capital and labor, but also the efficiency with which these
factors are combined.
Benhabib and Spiegel (1994), have found evidence that human capital affected Total
Factor Productivity Growth (TFPG) through its impact on the capacity of a country to
innovate and the capability of using and adapting foreign technology. Arguably, human
capital also encourages the accumulation of other factors of production. In our analysis, a
measure of human capital will be used to explain both growth as well as TFPG. As a proxy
for the level of human capital, we will take the 1960 primary school enrollment
ratio, PESENR60.
^
The investment ratio, INVY, is included as a regressor since it has been found by
many studies, including that of Levine and Renelt (1992), to have a positive and robust
correlation with growth rates. Since it is generally assumed that positive external shocks are
associated with higher growth and vice versa, we have included for each country in the
sample the GDP per capita growth of its trading partners weighted by trade shares, GPART.
Other conventional proxies for external shocks such as the percentage change in the terms of
trade and its variability have not resulted in statistically significant impact on growth.
Macroeconomic performance plays an important role for growth sustainability.
Fischer (1993) has shown that growth is negatively associated with inflation, large budget
deficits and distorted foreign exchange markets. Among the three measures, we favor
inflation for several reasons. First, internationally comparable data on budget deficits are
scattered and not available for a large number of MENA countries. On the other hand, the
widely used black market premium rate (BMP) as a measure of distortion in foreign exchange
market is neither a good proxy for the level of distortions in the economy nor an appropriate
measure of the adequacy of macroeconomic policies. For instance, the low BMP rates in
Egypt or the Arabian Gulf countries reflect more the abundance of foreign exchange more
than the absence of distortions in the economy or the presence of stable macroeconomic
environment. In addition, the high BMP in many countries of the MENA region tend to
reflect the impact of wars and socio-political instability characterizing these countries.
Openness has been used extensively in the literature as a major determinant of growth
performance. Openness affects growth positively to the extent that it magnifies the benefits of
international knowledge spillover and technological diffusion as well as enforces cost
discipline through import competition and the drive to export. The ratio of trade to GDP as a
measure of openness may not always be the most appropriate measure to use, especially in
the case of the MENA oil producing countries whose natural resource abundance is generally
associated with high trade ratios. In addition, countries could exhibit high trade ratios while
simultaneously maintaining highly restrictive trade regimes. Therefore, the trade ratio is not
necessarily a good proxy for openness.
? ?
Following the work of Sachs and Warner (1995), we adopt the definition of openness,
SOPEN, reported in Sachs and Warner (1997a). Openness purports to the fraction of years
during the period 1970-1990 in which the country is rated as open according to the following
criteria: (a) Non-tariff barriers covering less than 40 percent or more of traded goods, (b)
average tariff rates below 40 percent, (c) a BMP of less than 20 percent, (d) no extreme
controls in the form of taxes, quotas or state monopolies on exports and (e) the country is not
considered a socialist country. A value of SOPEN=1 means the country has remained open
to trade during the entire period, while a value SOPEN=0 means the country remained
completely closed.
Among the recently introduced variables into the empirical growth literature is natural
resource abundance.6 Sachs and Warner (1997a,b), for instance, have found compelling
evidence that countries with high initial ratio of natural resource exports tend to grow slowly
in subsequent periods. Earlier findings of development literature about the disappointing
performance of resource-abundant countries have motivated their study on the link between
natural resources and economic growth.
Natural resource abundance may affect growth performance negatively by causing
overvaluation of the national currency thereby impeding the growth of non-oil exports.7
Resource-rich countries are also associated with wasteful consumption and public investment
pattern, and provide incentives for rent-seeking and other unproductive activities. In addition,
it is widely observed that natural resource availability has tended to forestall reform. Finally,
the secular decline of world prices of natural resources and their high volatility translate into
high uncertainty which, in turn, impacts negatively growth.
6 Natural resources are defined as primary agriculture, fuels and minerals. 7 Radelet et al. (1997), p. 8.
? ?
The idea of incorporating natural resource abundance as a correlate of economic
growth is of great appeal given the high endowment of MENA countries in natural resources
notably, oil. However, despite the fact that they could be a curse for long term growth, natural
resources may also contribute positively to growth. Oil export revenues have contributed to
the improvement of welfare and helped finance investment in infrastructure and human
capital in most MENA countries. In fact, many of the MENA oil-producing countries such as
Kuwait, Bahrain, Qatar and the United Arab Emirates, are ranked by the 1999 Human
Development Report, among the top 45 countries in the world in terms of the United Nations’
Human Development Index.
The ultimate impact of natural resources on growth is therefore an empirical question.
In order to measure this impact, we will use the share of exports of primary products in GNP,
SXP. This variable is measured for the year 1970 and is borrowed from Sachs and
Warner (1997a).
A final growth agent that is not very frequently used in the recent empirical growth
literature is the role of output volatility in explaining output growth. Volatility to the extent
that it properly reflects uncertainty, should be negatively linked to growth. Uncertainty could
affect growth through many channels. For instance, under irreversibility and large sunk costs,
uncertainty delays investment decisions and affects output growth. Ramey and Ramey (1995)
have found empirical evidence on the negative link between output growth and its volatility.
Binder and Pesaran (1999) have provided a theoretical rationale for this link based on the
statistical properties of stochastic versions of conventional growth models.
In the context of the MENA region, inclusion of a volatility variable is justified on the
ground that volatility of output growth is a salient feature of the region. The factors
responsible for this volatility include inter alia fluctuations in world oil prices, weather
conditions, fluctuation in workers’ remittances, capital flows, not to mention the prevailing
? ?
political instability and the involvement of many countries in civil wars and in the regional
conflict. In order to measure volatility, we will use the standard deviation of per capita
growth rates, STDG, over time for each country in the sample.
Cross-Country Regression Results
In order to give an order of magnitude to the contribution of the above agents of
growth, we regress the average growth rate of real per capita GDP on the variables described
above. All variables, unless otherwise mentioned, are averaged over the period 1960-1998 or
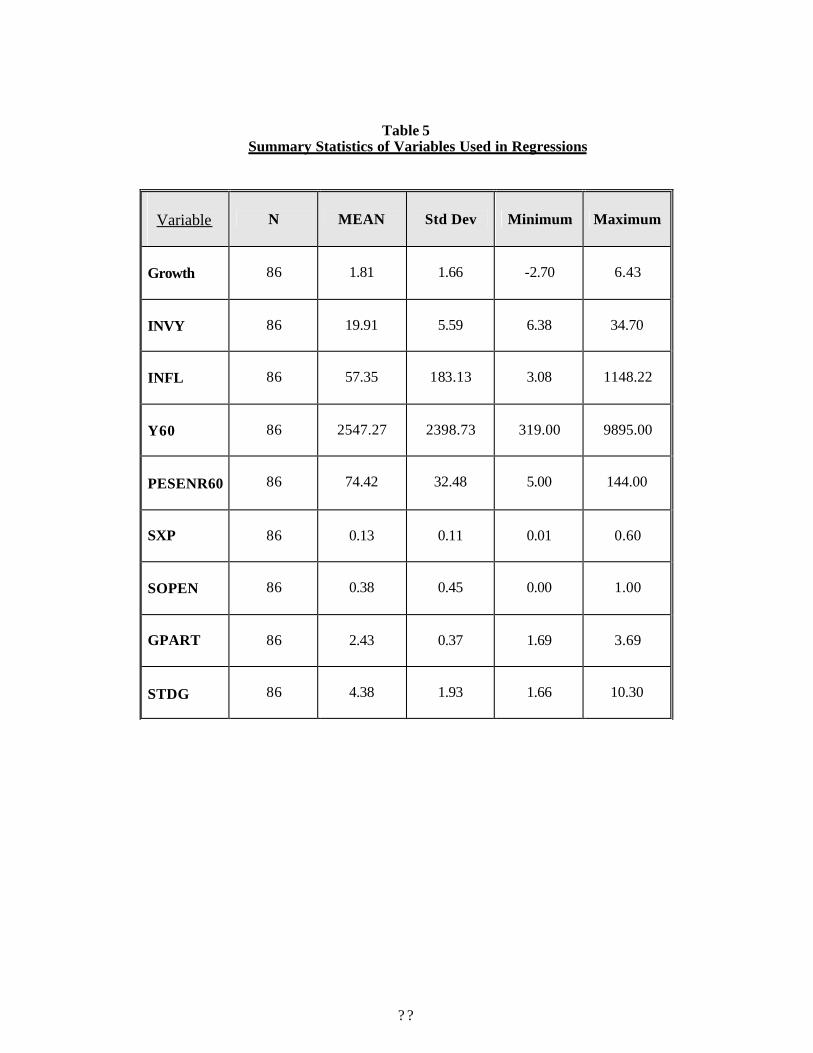
any sub-period within it, in case of unavailable data. Most of the variables used in this paper,
unless indicated otherwise, come from the World Bank Global Research Project (GRP)
database and World Development Indicators. The sample is made of 86 countries of which 8
are form the MENA region: Algeria, Egypt, Jordan, Morocco, Saudi Arabia, Syria, Tunisia
and Turkey. The rest of MENA countries could not be included in the regression analysis for
lack of relevant data. Table 5 gives summary statistics of the variables used in the
regression analysis.
Table 6 reports the regression results of our model using both ordinary least squares
(OLS) and instrumental variables (IV) methods in order to account for the likely endogeneity
of some of the regressors. The first column in Table 6 gives the OLS estimates assuming
homogeneity across countries in the response of growth to its main determinants. With
respect to the recent empirical literature, our results confirm the relative importance of the
investment ratio (INVY), macroeconomic performance (INFL), initial level of income (Y60),
human capital (PESENR60), natural resource abundance (SXP) and the degree of openness
(SOPEN) in affecting long-term growth performance.
The respective coefficients of these variables were found to have the expected signs
and were statistically significant. Some of the variables portraying the impact of external
shocks (GPART), and volatility (STDG), were found to be insignificant for the
whole sample.
? ?
We have computed standardized coefficients obtained by regressing standardized
values of the dependent variable on the standardized values of the included explanatory
variables. The standardized coefficients thus computed depict the effects of a one standard
deviation change in each of the explanatory variables on growth and allow comparing the
relative predictive importance of each one of these variables.
Investment and initial level of income turned out to be the most influential with
standardized coefficients of +0.38 and -0.38, respectively. The initial enrollment rate is the
next important variable in terms of magnitude with a coefficient of 0.34. The standardized
coefficients of the rest of variables were respectively, 0.30 for openness, 0.20 for
inflation, 0.15 for natural resource endowment, 0.10 for growth of trade partners and 0.05 for
growth variability.
To account for the possible endogeneity of some of the regressors that may have
affected OLS estimates notably the investment ratio, column 2 of Table 6 provides the IV
parameter estimates. The IV regression uses,trade ratio (X+M)/GDP; debt ratio, share of
Government consumption in GDP and share of manufactures in exports as instruments. The
choice of these instruments was guided by two criteria: their lack of correlation with the
disturbance term of the regression equation and their high correlation with the explana tory
variables.
The quality of the instruments was checked by testing for their validity using the
procedure described in Gourieroux and Monfort (1996, pp.616-618). The Chi-square statistic
of the residual based-test shows that the null hypothesis of the validity of instruments could
not be rejected at the 10% significance level.8 However, given that the use of instruments
with incomplete data reduces the sample size from 86 to 63, and given the close similarity of
8 The computed Chi-square value was 0.91 below the tabulated value of 1.64.
? ?
OLS and IV estimation results, we will only use the OLS method to further extend the
analysis of MENA growth performance.
It is to be noted that the previous OLS results were reproduced after eliminating
observations that do not fit well with the model in terms of unusual response or unusual
prediction. These outlier observations were detected using standardized and studentized
residuals. An observation is eliminated if it has either a large standardized or studentized
residual. Using these criteria, 9 of the 86 observations in the sample could be classified as
unusual.9 Upon the reestimation of the OLS equation without the unusual observations, the
parameter estimates remained fairly the same in terms of magnitude, sign and significance.
The only exception was inflation whose parameter became less significant but remained
rightly signed even after the elimination of outliers. This confirms the fact that inflation hurts
growth especially at unusually high rates.
In an attempt to disentangle the regional from the global growth characteristics, we
have allowed for differentiated growth impacts of relevant variables depending on whether
the country under study is from the MENA region. These variables pertain to some of the
factors that are often presented to explain the lower growth performance of the MENA
region: the lack of capital efficiency, lack if integration in the world economy and
vulnerability to external shocks. More specifically, the MENA region is allowed to have
different slope coefficients from any non-MENA region in the sample with respect to the
three variables: INVY, SOPEN and GPART. In order to do that, we have included interaction
terms between these three variables and a dummy variable, MENA, taking a value of one if
the country is from the MENA region and zero otherwise. The third column of Table 6 gives
the previous OLS results with MENA-specific coefficients. A separate dummy variable for
the MENA region was also included in the last regression to see whether the included
variables account for a fairly reasonable
9 These include the observations coreesponding to China, Congo Democratic Republic, Jamaica, Jordan, South Korea, Nicaragua, Pakistan, Saudi Arabia and Uganda.
? ?
In contrast with previous OLS results related to the whole sample, the MENA-specific
interaction terms reported in column 3 of Table 6, seem to suggest that MENA region differs
significantly from the rest of the world in the three variables believed to affect their
performance. Interestingly, the MENA region has been found to be more vulnerable to
uncertainty caused by changes in trade partners’ income. This result notwithstanding, one
should bear in mind that the influence of the above sources of uncertainty and the impact of
external shocks may vary from one country to another.
To give further evidence on the vulnerability of the MENA region to external shocks,
we have tried different measures of terms of trade change. However, all of these measures
turned out to be statistically insignificant. The ambiguous impact of terms of trade on long-
term growth has been reported in several instances in the literature.10 There are several
plausible explanations for that. The terms of trade variable has been obtained, given the
requirements of our cross-country analysis, by computing its average growth over the entire
period 1960-1998. Therefore, the impact of terms of trade as an exogenous shock could be
diluted owing to the operated smoothing. In order to take this shortcoming into account, we
have used the standard deviation of the terms of trade of each country over the entire period
as an alternative. The new variable turned out to be insignificant as well.
The impact of terms of trade on economic growth could be proportional to the
dependence of any country on a limited number of exported commodities. In other words, a
diversified economy is less likely to be affected by terms of trade decline given that the
impact will be limited to a relatively small number of sectors. In contrast, deterioration in the
terms of trade will be felt throughout the economy in case of high export concentration or
excessive dependence on a limited number of export commodities such as oil.
10 For instance, Gamo et al. (1997, p. 27) reported a similar result for the case of several countries in the region.

? ?
Finally, the ambiguous effect of terms of trade on growth could be due to the
asymmetry of this effect. A persistent improvement in terms of trade might lead to an
improvement in income and expenditure, while deterioration does not necessarily lead to a
proportional reduction in these variables. The 2000 World Bank report on Global Economic
Prospects, reports several cases in point from the MENA region.11 For instance, following the
1998 slump in oil prices, Bahrain, Oman and Saudi Arabia used foreign reserves and
accumulated foreign assets to alleviate the pressure on fiscal deficits and trade balances. In
contrast, other oil exporters such as Algeria and Yemen with more binding financial
constraints had to adjust through expenditure cuts and exchange rate devaluation. This
asymmetry in policy reaction might have affected growth performance in many MENA
countries by increasing uncertainty.
Our results also show that the investment coefficient for the MENA region is
statistically different from and much lower than that of the whole sample. This result is.
prima facie, at odds with the fact that MENA countries have persistently maintained high
investment ratios that were for the most part above world averages.12 The negative MENA-
specific investment coefficient is largely attributed to the endemic problem of capital
inefficiency in the region.
Many have presented plausible explanations for the low efficiency of capital in the
MENA region. Page (1998) suggests that this low efficiency of capital is due to the dominant
role of the public sector and the nature of capital inflows in the region destined mainly to
finance public investments and low-productivity projects in non-tradable sector such as
housing. He also points out that protectionism and lack of integration in world economy
precluded these countries from boosting their efficiency and competitiveness. Others, such as
El-Badawi (1999), argue that the low efficiency of capital may be attributed to the fact that
most of the countries in the region provide an inadequate business environment and
institutional support for investment and private sector development.
11 World Bank (2000, pp. 142-143). 12 Refer to table 3 in the paper.
? `
Openness does not seem to play an important role in the MENA region as for the
whole sample. The lower impact of openness on growth in the MENA region may be
explained by the prolonged application of high tariffs in support of import-substitution
strategies in many MENA countries during the 1960’s and 1970’s. Excluding the Arab Gulf
states that maintain relatively low tariff rates, the average un-weighted tariff rate in the
MENA countries is high relative to most regions of the world. Protection remains high even
in the most advanced reformers in the region including Egypt, Morocco and Tunisia. Indeed,
trade protection in the non-oil MENA countries generally remains higher than in the low
income-countries. In addition, the rate of reduction in trade barriers has been lower
compared to other regions (Srinivasan, 2002)
Finally lack of statistical significance of the MENA dummy shows that the general
factors and the MENA-specific factors mentioned above, provide a fairly good explanation of
the region’s growth performance.
b. Growth Accounting in International Perspective
To put MENA growth performance in further international perspective, we use the
growth accounting framework to see whether factor accumulation, or factor productivity,
have accounted for most of the growth differential between MENA and the other regions in
the sample.
Growth can be the result of the growth of inputs such as capital and labor, or the
increase in the efficiency of these inputs namely their productivity. The debate over the share
of inputs as compared with that of their total productivity is still very lively. The empirical
evidence is mixed. Many such as Mankiw et al. (1992), argue that the share of physical and
human capital together with population growth account for as much as 80 percent of
international variation in per capita income. Young (1995) on the other hand, argues that
what is often labeled as the “Asian miracle,” is the outcome of a temporary rapid factor
? ´
accumulation. Those holding a different view claim that TFP is the key to economic growth
and that factor accumulation play only a less important role.13
The share of capital in total income needed in a typical growth accounting exercise
could be imposed a priori, computed from national income accounts or estimated. Each one
of these approaches has its own caveats. Imposing a uniform value, typically between 0.3
and 0.4, is not realistic since this value varies a great deal across a wide spectrum countries.
Computation of this value from national accounts, on the other hand, is too data demanding
especially in light of the availability of internationally comparable data on capital stock and
labor that would readily permit the direct estimation of the capital share. In this paper, we
have chosen the estimation approach.
In order to carry out the accounting exercise, we have used a two-factor,
homogeneous of degree one, Cobb-Douglas production function in per capita form. Capital
shares required to measure the relative contribution of factor accumulation and productivity
were estimated using the following regression equation:
The slope coefficient in the above equation represents the capital share in output, Y
represents real output, K the capital stock and L labor. Y is measured by real GDP and is
obtained from World Bank database. The capital stock data are taken from Nehru and
Dhareshwar (1994), and L is approximated by total labor force and taken from the World
Bank world development indicators. Real GDP and capital stock series are based on 1987
constant prices.
13 See for instance, Klenow and Rodriguez-Clare (1997).
itititiiitit LKLogLYLog εαλ +∆+=∆ )/()/(

? ^
The sample we used comprises 92 countries and data cover the period 1960-1997. The
list of countries included in our sample was determined on the basis of the availability of
capital stock data in Nehru and Dhareshwar (1994) that used the perpetual inventory method
to obtain capital stock series for the period 1950-1990 assuming a fixed annual depreciation
rate of 4 percent.14 In this paper, we have completed the capital series from 1991 until 1997
with fixed investment figures from the World Bank database using the same methodology
and assumption.
In order to account for the possible impact of the noise generated by the high
variability of yearly data, we have estimated two versions of the above equation. A short-term
version using original data for the output per worker and capital per worker, and a long-term
version obtained by smoothing the short-term variation of the same variables using three-year
moving averages.
Table 8 provides the regional averages of capital shares using the two specifications
indicated above. Looking at Table 8, several remarks are in order. First, our estimates of the
world average capital share were found to be above the commonly assumed values of 0.3 or
0.4. This finding is in line with estimation results provided, for instance, in Senhadji (1999)
and Nehru and Dhareshwar (1994) that have found capital shares above 0.5. Recently, Keller
and Nabli (2002), reported an estimated value for the capital share of 0.49 based on a sample
of 95 economies. Bisat et al. (1997) have previously found that the average capital share in
many countries of the MENA region is well above 0.5 and about 0.7 for some oil-producing
countries.
Secondly, high-performing East Asian countries hold the lowest capital shares in the
group. And thirdly, Latin American and industrialized countries have the highest capital
shares. These findings have an implication for the computation of TFPG. Instead of
imposing a uniform value for the share of capital over the entire sample of countries, we have
14 The MENA countries included in the sample are: Algeria, Egypt, Iran, Iraq, Jordan, Kuwait, Libya,
Morocco, Sudan, Tunisia and Turkey.

? ?
made the less restrictive hypothesis of assuming region-specific values based on the
estimation results.
Table 9 provides estimates of the relative contribution of capital, labor and TFPG to
economic growth of the MENA countries included in the sample in comparison with other
regions.
Overall, the results show the predominance of capital contribution over that of labor
and TFPG, in growth performance during the period 1960-1997. The MENA region as a
whole, has experienced the lowest contribution of TFP to economic growth in comparison
with the rest of the regions. For the eleven MENA countries included in the sample, only the
diversified economies of Egypt, Morocco, Tunisia and Turkey managed to have positive
TFPG. Out of the seven remaining MENA countries in the sample that had negative TFPG,
five were oil-exporting countries. Although, the use of oil GDP in the computation of TFPG
may be problematic owing to its large and persistent fluctuation (Bisat et al., 1997, p.17) ,
lack of ample available data on employment and capital stock in the oil sector did not enable
us to compute TFPG after excluding oil.
In order to assess the relative contribution of the variables accounting for inter-
regional TFPG performance, we have regressed TFPG on relevant variables based on
recently established results in the literature.15 We conducted these regressions using values
for capital shares ranging from 0.3 to 0.7. Each hypothetical value for capital share was
applied uniformly over the different countries in the sample. This was done to see whether
different values of the capital share affect the impact of the regressors on TFPG.
The included regressors were the quality of institutions, ICRG16; inflation rate, INFL;
the initial income, Y60; the initial enrollment rate in primary school, PESENR60, and the
15 Only 6 MENA countries were included in the analysis given the lack of data. They were: Algeria, Egypt,
Jordan, Morocco, Tunisia and Turkey. 16 Our measure of institutions, ICRG, is a composite of four indicators (a) Government repudiation of
contracts, (b) Risk of Expropriation, (c) Rule of Law and (d) Bureaucratic quality. This measure is
? ?
adopted measure of natural resource abundance, SXP. Other conventional variables such as
openness, growth in terms of trade and political stability have been tried but were dropped for
lack of statistical significance. Regional dummies were also included in order to account for
inter-regional differences.
Table 10 reveals that for lower values of the capital share, the parameter estimates
tend to be significant and of the expected signs. Institutions and the stock of human capital, as
approximated by the initial enrollment rate, affect positively TFPG. The negative sign
attached to the initial income, points to the existence of catching up effect at the TFPG level.
Inflation was also found to affect negatively TFPG. Finally, the natural resource curse was
found to apply at the productivity level too. In other words, natural resource abundance
affects negatively TFPG.
At higher values of the capital share, the explanatory power of the model drops. This
is due to the fact that at higher values of the capital shares, capital accounts for a higher
portion of overall economic growth as well as TFPG. Hence, the other variables become less
relevant. However, it should be mentioned that the only two variables that remained
significant for different values of the capital share, were initial income and human capital.
This result is widely in line with the recent empirical findings on TFPG.17 While initial level
of income affects the potential of catching up notably through higher productivity; human
capital affects TFP by determining the capacity of a country to innovate and the speed of
technological diffusion.
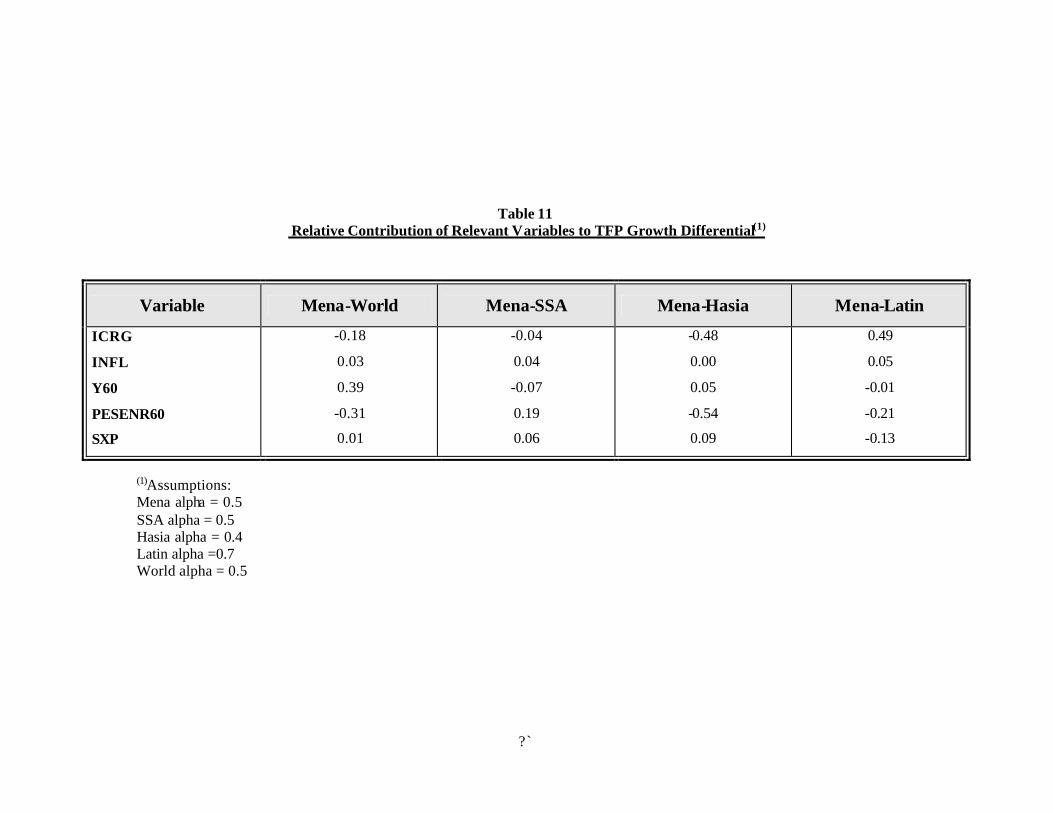
In order to put MENA countries’ TFPG performance into global perspective, we have
computed the contribution to TFPG of the relevant variables for different values of the capital
share. Table 11 reports the results after applying different regional values for the capital
computed for the decade of the 1980’s and is borrowed from Easterly and Levine (1997). Knack and Keefer (1995) were the first to introduce these institutional variables into growth empirics.
17 See for instance the findings of Senhadji (1999) and Benhabib and Spiegel (1994).
? ?
share. Based on our estimation, we have applied the value of 0.5 to the MENA, Sub-Saharan
regions as well as to the whole sample. The values applied for other regions were
respectively, 0.4 for East Asia and 0.7 for Latin America.
Overall, the results exhibited in Tables 11, point to the overriding importance of the
quality of institutions and the stock of human capital in explaining the lower productivity
performance of the MENA countries in comparison with the high performing East Asian
countries and with the rest of the world in general.
More specifically, Table 11 shows that human capital, as approximated by initial
enrollment ratios, accounts for the MENA region’s TFPG under-performance with respect to
East Asia and Latin America. Despite the net improvement in many educational educators in
the MENA countries, illiteracy ratios remain very high and the educational attainment of the
labor force very low in comparison with other regions in the world.
For the year 2000, UNESCO predicts that the illiteracy ratio in the MENA region
will be around 31 percent for adults above 15 years compared to 26 percent in the group of
developing countries and 13 percent in the East Asia and Pacific region. These statistics are
even more alarming given the high gender gap in terms of literacy and in comparison with
other regions in the world. The average illiteracy rate among females in the MENA region for
the year 2000 is expected to be around 40 percent almost double the average illiteracy rate for
males.18 Illiteracy among women is linked to poor health and low education attainment
among children, and hence the low quality of human capital.
The recent statistics published by Barro and Lee (2000) provide further evidence of
the relative weaker educational attainment of the labor force in the MENA region in
comparison with other regions in the world. For instance, they estimated that the average
years of schooling for the population aged 15 and over, for the year 2000, for the high
performing MENA countries such as Egypt, Jordan, Syria, Tunisia and Turkey will be, 5.51, 18 These statistics are derived from the UNESCO Statistical Yearbook (1999).

? ?
6.91, 5.77, 5.02, and 5.29; respectively. These rates do not compare favorably with, 8.83 for
Argentina, 7.55 for Chile, 10.84 in Korea, 7.05 for Singapore and 8.76 in Taiwan.19
Using panel data for six countries in the MENA region, El-Erian et al. (1998, p. 11)
have found that the rapid expansion in education did not result in higher productivity or more
rapid economic growth.20 They argue that the weak link they have found between education
and growth may be due the low quality of education that focuses more on repetition of
definitions, knowledge of facts and concepts and less on developing critical thinking and
problem-solving capacity. In addition, the educational system had been focused on preparing
students for public sector employment. This outcome is largely attributed to distorted
educational choices in these countries caused by the higher wages prevailing in the dominant
public sector that are set without consideration for alternative employment opportunities in
other sectors.
ERF (2000, p. 6) reports that for the early 1990’s, the average share of civilian
Government employment in the MENA region is about 17.5 percent compared with less than
9 percent for the developing countries as a group. In addition, the share of central
Government wages in GDP is at 10 percent; almost double that of the world average. As
rightly argued by the report, this situation has resulted in the prevalence of acute job
redundancies and increasing unemployment rates in the region owing to the glaring mismatch
between the outcomes of the educational system and the requirements of the rapidly changing
labor market.
To explain the lower quality of education, Ridha (1998) argues that in most countries
of the region education systems are over-politicized to the extent that they deviate from the
objectives they are supposed to achieve. The educational tools and practices such as the
curriculum, textbooks and teaching methods are often manipulated to reach political ends.
19 These updated statistics are available on the following web site: http://www2.cid.harvard.edu/ciddata/. The data set could also be accessed through the web page of Jong-Wha Lee: http://web.korea.ac.kr/~jwlee. 20 The countries included in their studies are: Algeria, Egypt, Jordan, Kuwait, Syria and Tunisia.
? ?
Another argument advanced by Pritchett (2001) can possibly explain the weak link
between education and productivity growth in the MENA countries. He argues that in a
perverse institutional environment such as the one prevailing in many MENA countries,
education and accumulated capital could be used in wasteful and counterproductive activities.
In addition, the fact that most of these countries are natural resource-abundant, provides
further incentives for the proliferation of rent seeking activities.
The second important factor explaining the underperformance of the MENA region in
terms of TFPG is the quality of its institutions. Institutions can be defined as the regular and
patterned forms of social behavior and interaction among human beings established by formal
and informal rules.21 Institutions matter for growth and productivity because they affect
incentives of actors. For they affect the behavior of people in a society and very often lock
their behavior within a regularized pattern, institutions may produce path dependence that
could explain prolonged periods of poor economic performance and hence the inability of
poor countries to catch up.
Many published indicators for the quality of institutions show that the MENA region
lags most of the regions in the world. The average value of the variable used in our paper to
depict the overall quality of institutions, ICRG, for MENA countries was 4.31. This score is
below that of the world average, 5.59, and the high performing East Asian countries, 6.37. A
recent report by the World Bank (2002) using a composite index of governance that includes
several relevant indicators of the quality of institutions such as the quality of administration
and accountability, shows that the MENA region ranks at the bottom when compared with
countries with the same level of income.
21 North (1990).
? ?
A similar conclusion can be reached based on the results of a study by Kaufmann et
al. (2002) to estimate six dimensions of governance that represent reasonable indicators for
the quality of institutions. In comparing the score of the different regions in the world for the
year 2000, we have found that MENA lags behind most of the regions in terms of voice and
accountability, that is the ability of citizens to participate in decision making and hold
accountable public officials; and regulatory quality that has to do with regulations governing
the business sector, Government intervention, quality of legislation, investment environment
and tax effectiveness.
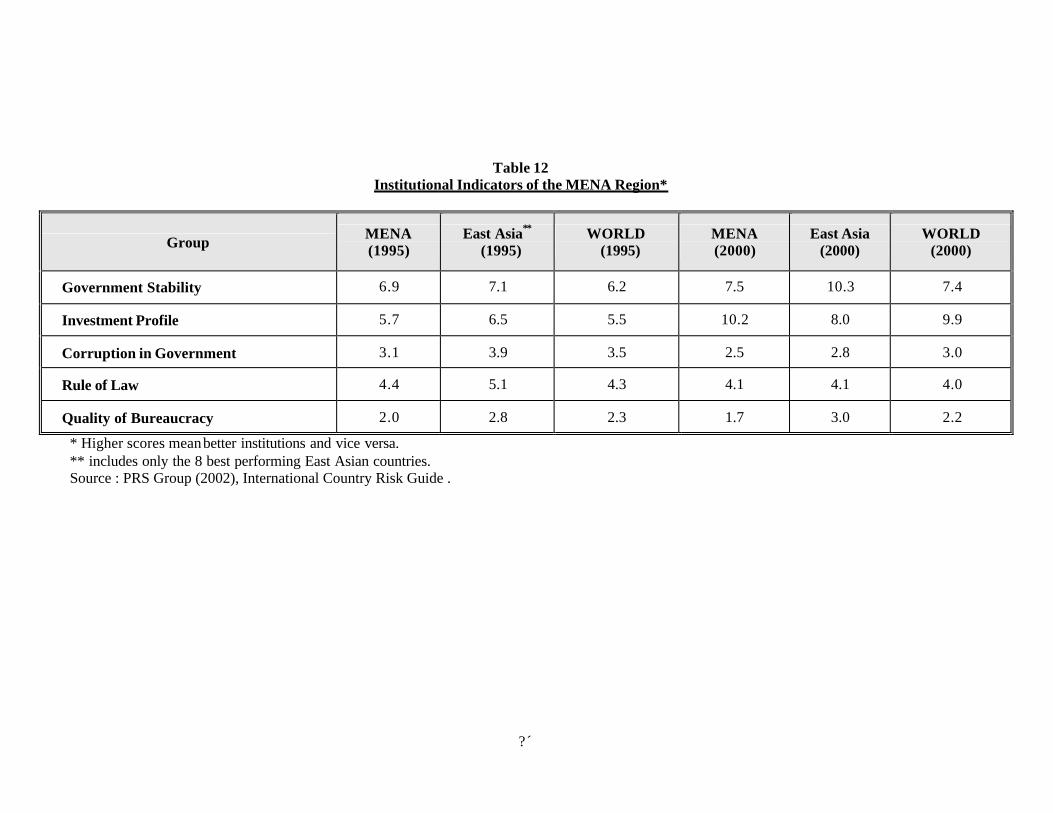
Table 12 shows the average scores for five institutional indicators published by the
Political Risk Services: Government stability, investment profile, Corruption in Government,
rule of law and quality of bureaucracy. Despite the fact that MENA countries have better
scores than world averages for three out of the five reported indicators, the indicators of
corruption and bureaucracy remain, however, below world averages and much lower than
those of the high performing East Asian countries.
Empirical work has shown that governance and institutions affect the quality of policy
which has a direct bearing on investment and business climate (Knack and Keefer, ,1995 and
1997). As regards MENA countries, reducing bureaucratic ineffectiveness, red tape,
corruption, excessive Government intrusion, and improving the deplorable state of
Government services; remain, in this regard, major challenging tasks for the MENA region.
? ?
4. Explaining Intra-Regional MENA Growth Performance
In the previous section, MENA countries’ growth performance has been compared
with other reference regions. In this section, we will dwell on the relative performance of
individual MENA countries with respect to the region’s average performance.
As shown previously in Table 3, there is a considerable variation in the growth
performance of MENA countries during. It was also shown that growth in oil-exporting
countries was subject to a higher variability than that of non-oil exporting countries. In
addition, the average growth performance of the oil exporting countries has been below that
of non-oil exporting countries. The MENA countries that were able to achieve an average
real per capita GDP growth rate over 2 percent a year, during the period 1960-1998 were,
except for Oman, non-oil exporting countries. The best growth performers were Egypt,
Jordan, Morocco, Oman, Syria, Tunisia and Turkey. Oman’s average growth rate was the
highest followed by that of Egypt and Tunisia.
Interestingly enough, only countries with relatively high growth rates have managed
to achieve positive TFPG over the last three decades or so. Oil-exporting countries have, in
general, had negative TFPG. These facts are corroborated by our own estimates and those of
the few studies, which have provided estimates for TFP growth rates for countries in the
MENA region such as, Keller and Nabli (2002), Bisat et al. (1997) and Nehru and
Dhareshwar (1994).
In addition, MENA growth over-achievers had in general the lowest growth
variability among the sample group except, Oman. The higher variability of the latter can be
attributed to the fact that it is an oil-exporter and therefore subject to the effect of oil
price fluctuation.
? `
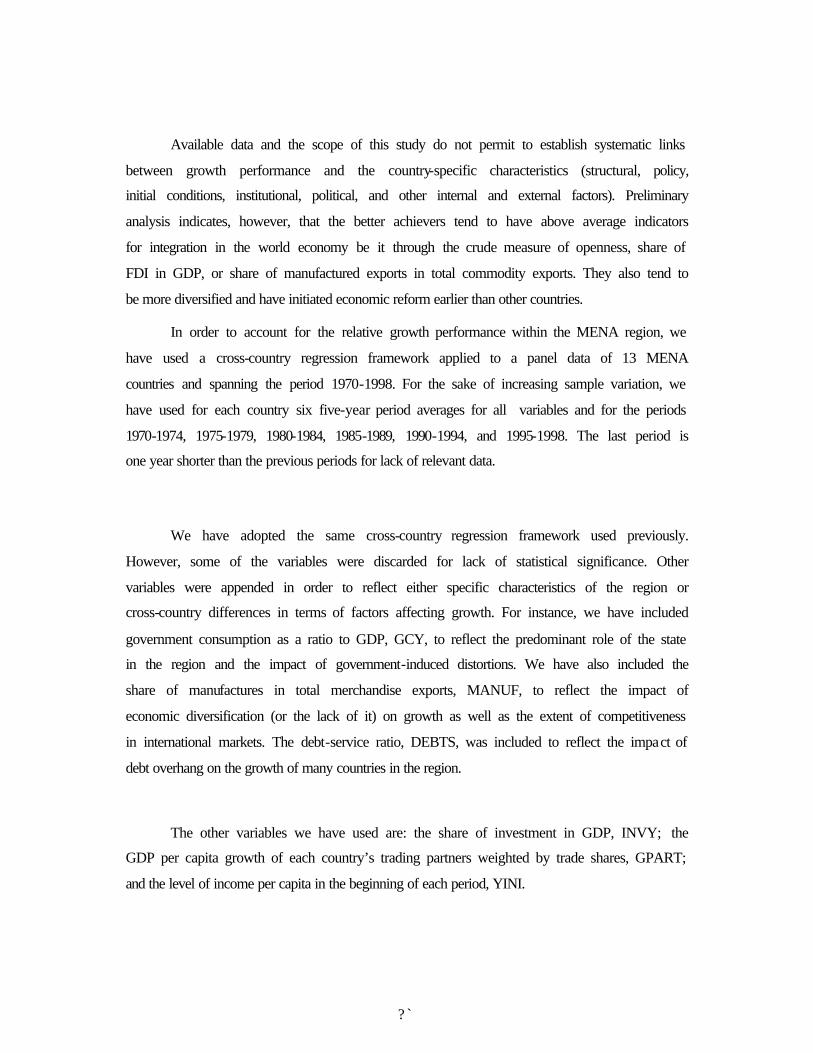
Available data and the scope of this study do not permit to establish systematic links
between growth performance and the country-specific characteristics (structural, policy,
initial conditions, institutional, political, and other internal and external factors). Preliminary
analysis indicates, however, that the better achievers tend to have above average indicators
for integration in the world economy be it through the crude measure of openness, share of
FDI in GDP, or share of manufactured exports in total commodity exports. They also tend to
be more diversified and have initiated economic reform earlier than other countries.
In order to account for the relative growth performance within the MENA region, we
have used a cross-country regression framework applied to a panel data of 13 MENA
countries and spanning the period 1970-1998. For the sake of increasing sample variation, we
have used for each country six five-year period averages for all variables and for the periods
1970-1974, 1975-1979, 1980-1984, 1985-1989, 1990-1994, and 1995-1998. The last period is
one year shorter than the previous periods for lack of relevant data.
We have adopted the same cross-country regression framework used previously.
However, some of the variables were discarded for lack of statistical significance. Other
variables were appended in order to reflect either specific characteristics of the region or
cross-country differences in terms of factors affecting growth. For instance, we have included
government consumption as a ratio to GDP, GCY, to reflect the predominant role of the state
in the region and the impact of government-induced distortions. We have also included the
share of manufactures in total merchandise exports, MANUF, to reflect the impact of
economic diversification (or the lack of it) on growth as well as the extent of competitiveness
in international markets. The debt-service ratio, DEBTS, was included to reflect the impact of
debt overhang on the growth of many countries in the region.
The other variables we have used are: the share of investment in GDP, INVY; the
GDP per capita growth of each country’s trading partners weighted by trade shares, GPART;
and the level of income per capita in the beginning of each period, YINI.
? ´
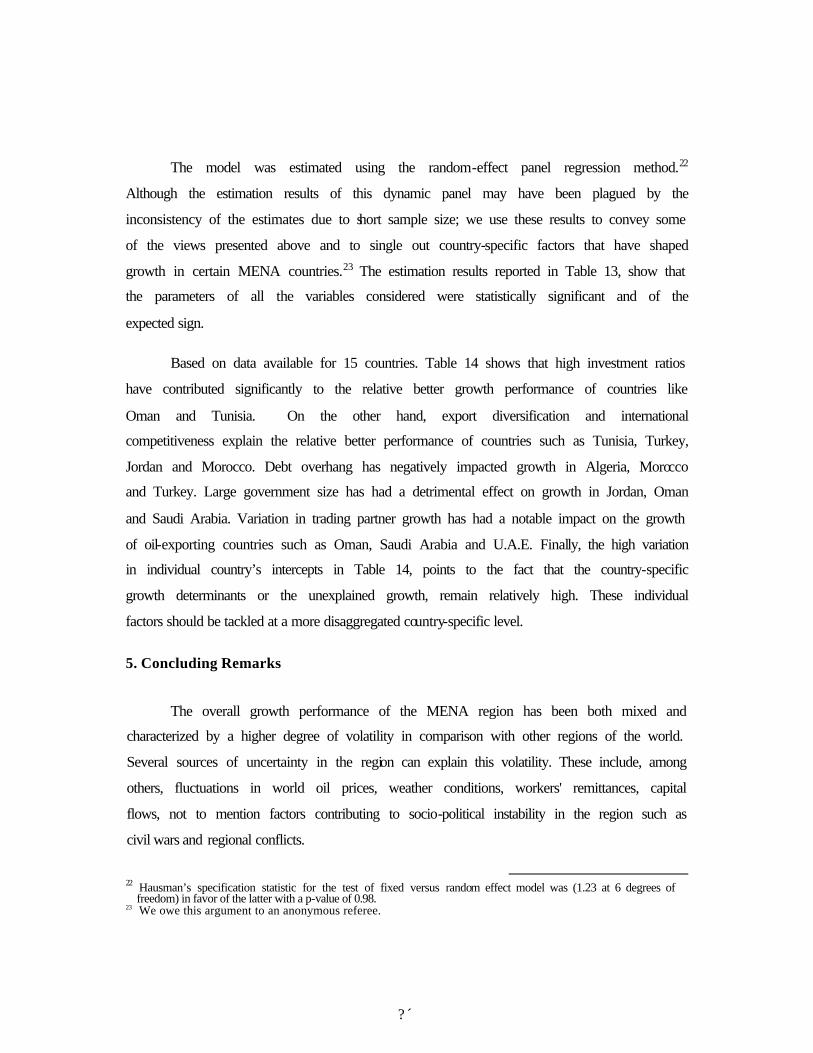
The model was estimated using the random-effect panel regression method.22
Although the estimation results of this dynamic panel may have been plagued by the
inconsistency of the estimates due to short sample size; we use these results to convey some
of the views presented above and to single out country-specific factors that have shaped
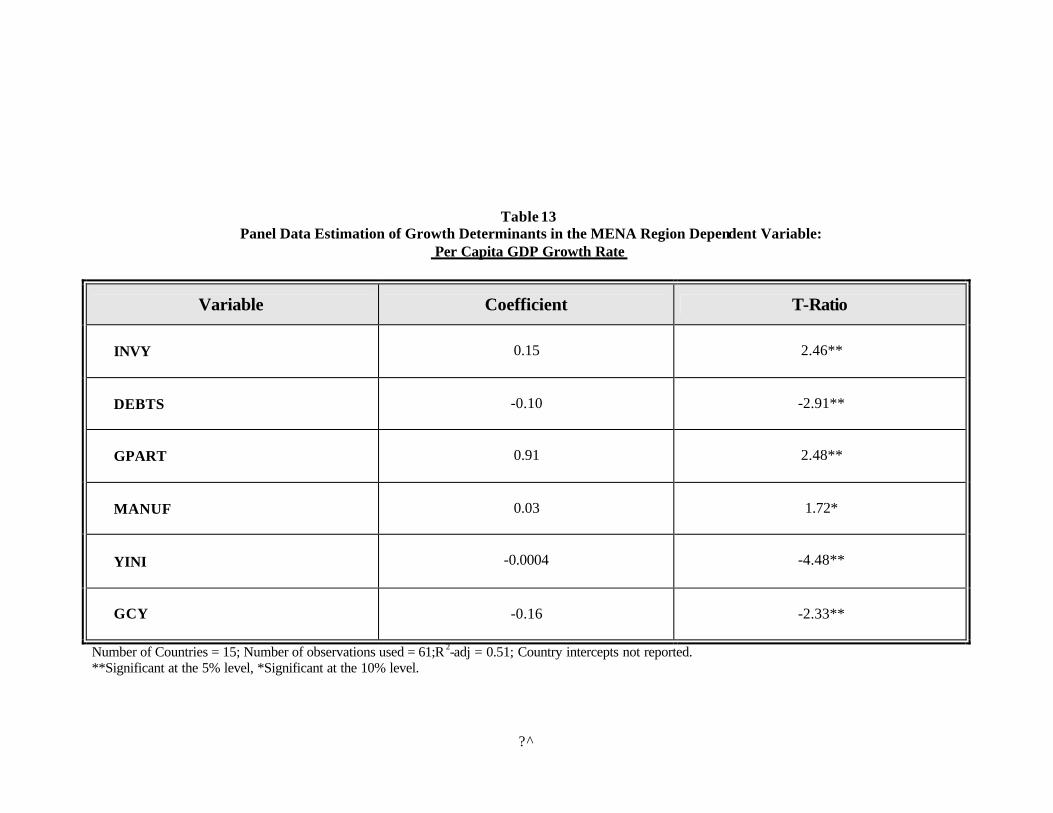
growth in certain MENA countries.23 The estimation results reported in Table 13, show that
the parameters of all the variables considered were statistically significant and of the
expected sign.
Based on data available for 15 countries. Table 14 shows that high investment ratios
have contributed significantly to the relative better growth performance of countries like
Oman and Tunisia. On the other hand, export diversification and international
competitiveness explain the relative better performance of countries such as Tunisia, Turkey,
Jordan and Morocco. Debt overhang has negatively impacted growth in Algeria, Morocco
and Turkey. Large government size has had a detrimental effect on growth in Jordan, Oman
and Saudi Arabia. Variation in trading partner growth has had a notable impact on the growth
of oil-exporting countries such as Oman, Saudi Arabia and U.A.E. Finally, the high variation
in individual country’s intercepts in Table 14, points to the fact that the country-specific
growth determinants or the unexplained growth, remain relatively high. These individual
factors should be tackled at a more disaggregated country-specific level.
5. Concluding Remarks
The overall growth performance of the MENA region has been both mixed and
characterized by a higher degree of volatility in comparison with other regions of the world.
Several sources of uncertainty in the region can explain this volatility. These include, among
others, fluctuations in world oil prices, weather conditions, workers' remittances, capital
flows, not to mention factors contributing to socio-political instability in the region such as
civil wars and regional conflicts.
22 Hausman’s specification statistic for the test of fixed versus random effect model was (1.23 at 6 degrees of
freedom) in favor of the latter with a p-value of 0.98. 23 We owe this argument to an anonymous referee.

? ^
In analyzing the growth pattern of the MENA region within an international
perspective, we have found that: capital is less efficient; trade openness less beneficial to
growth; and the impact of adverse external shocks more pronounced. In addition and in
comparison with other regions, TFPG was the least important source of growth in MENA.
Among the MENA countries included in the sample, only Egypt, Morocco, Tunisia
and Turkey had positive TFPG. The quality of institutions and human capital accounted for
the lower performance of the MENA countries in terms of TFPG and in comparison with the
other regions of the world. MENA still lags the rest of the world in terms of the quality of its
bureaucracy and a business environment that provides weak incentives for investment and
depresses its return.
Human capital was also found to contribute to the relative under-performance of the
MENA region. Educational attainment of the labor force remains relatively low in
comparison with other regions and illiteracy rates, especially among women, continue to be
relatively high. The dominance of the public sector in the economy together with guaranteed
employment of university graduates in most of the MENA countries may have had negative
impact on productivity.
The degree of exposure to internal and external shocks, extent of economic
diversification and international competitiveness were also found to be relevant factors in
explaining variations in growth performance within the MENA region.
In view of the aggregate nature of our study and in light of the above findings, several
relevant issues deserve further analysis within a country specific context. Future research on
the region needs to shed important additional lights on the determinants of growth in each of
the countries concerned. Among the areas that deserve further investigation are the within
regional variation in the role of human and physical capital, the influence of the State,

? ?
institutions and the relative impact of external and internal shocks as they relate to economic
growth. This analysis would contribute to our understanding of the growth process in MENA
countries. It is equally useful to show, for instance, how economic policy, institutions,
politics and other country characteristics affect the way factors of productions are used
and combined.
It would also be desirable to analyze the impact of the sectoral decomposition of
growth in MENA countries. Such a decomposition is useful for identifying the sectors that
have been successful in achieving better growth performance, expanding investment and
employment and raising productivity and earnings. This decomposition should also help
explain why certain sectors have been more successful than others.
Last but not least, is the urgent need for policy makers and researchers alike to find
ways to deal with the major challenges in the region namely, improving resilience to external
and internal shocks, diversifying economic activity and reducing excessive reliance on
natural resources, improving the business environment and quality of institutions for higher
and more productive investment in physical and human capital and devising an adequate
incentive structure for a more job-creating growth.
? ?
References
Barro, R. (1991), “Economic Grow th in a Cross-Section of Countries,” Quarterly Journal of Economics, 104, pp. 407-433.
Barro, R. and J.W. Lee (2000), “International Data on Educational Attainment: Updates and Implications,” Working Paper No. 42 , Center for International Development at Harvard University, April.
Benhabib, J. and M. Spiegel (1994), “The Role of Human Capital in Economic Development: Evidence from Aggregate Cross-Country Data,” Journal of Monetary Economics 34, pp. 143-173.
Binder, M. and M.H. Pesaran (1999), “Stochastic Growth Models and Their Econometric Implications,” Journal of Economic Growth 4, pp. 139-183.
Bisat, A. El-Erian M.A. and T. Helbling (1997), “Growth Investment, and Saving in the Arab Economies,” IMF working paper WP/97/85.
Easterly, W. and R. Levine (1997), “Africa’s Growth Tragedy: Policies and Ethnic Divisions,” Quarterly Journal of Economics 112(4), pp. 1203-1250.
Economic Research Forum (ERF) for the Arab Countries, Iran and Turkey (1996), Economic Trends in the MENA region.
Economic Research Forum (ERF) for the Arab Countries, Iran and Turkey (2000), Economic Trends in the MENA region.
El Badawi, I. (1999), “Can Reforming Countries Perform an Asian Miracle?: Role of Institutions and Governance on Private Investment,” in Limam I. (ed) “Institutional Reform and Development in the MENA Region,” published by Arab Planning Institute and Economic Research Forum for the Arab Countries, Iran and Turkey.
El-Erian, M., Helbling T. and J. Page (1998), “Education, Human Capital Development and Growth in the Arab Economies,” paper presented in the Joint Arab Monetary Fund, Arab Fund for Economic and Social Development Seminar on “Human Resource Development and Economic Growth”, Abu Dhabi, United Arab Emirates, 17-18 May, 1998.
Fischer, S. (1993), “The Role of Macroeconomic Factors in Growth,” Journal of Monetary Economics 32 (3), pp. 485-512.
Gamo, P. A., Fedelino A. and S.P. Horvitz (1997), “Globalization and Growth Prospects in Arab Countries,” IMF working paper WP/79/127 .

? ?
Gourieroux, C. and A. Monfort (1996), Statistique et Modèles Econométriques, Vol. 2, Economica , 2d edition, Paris.
Kaufman, D. , Kraay, A. and Zoido-Lobaton (2002), “Governance Matters II: Updated Indicators for 2000/2001,” available through internet at: http://www.worldbank.org.
Keller, J. and M.K. Nabli (2002), “The Macroeconomics of Labor Markets Outcomes in MENA over the 1990s: How Growth Has Failed to Keep Pace with a Burgeoning Labor Market” World Bank, available through internet at http://www.worldbank.org/mdf/mdf4/papers/keller-nabli.pdf.
Klenow, P. J. and A. R. Clare (1997), “The Neoclassical Revival in Growth Economics: Has it Gone Too Far?” In NBER: Macroeconomics Annual 1997, MIT Press.
Knack, S. and Keefer,P. (1995), “Institutions and Economic Performance: Cross-Country Test Using Alternative Institutional Measures,” Economies and Politics 7(3), pp. 207-227.
Knack ,S and Keefer, P.(1997) “Does Social Capital Have an Economic Payoff: A Cross Country Investigation”, Quarterly Journal of Economics , V.112 . No.4 November 1997, pp.1251-1288.
Levine , R. and D. Renelt (1992), “A Sensitivity Analysis of Cross-Country Growth Regressions,” American Economic Review 82(4), pp. 942-963.
Mankiw, N. G., Romer D., and D. N. Weil (1992), “A Contribution to the Empirics of Economic Growth,” Quarterly Journal of Economics 107 (2), pp. 407-437.
Nehru, V. and Dhareshwar A. (1994), “New Estimates of Total Factor Productivity Growth for Developing and Industrial Countries,” Policy Research Working Paper # 1313, the World Bank.
North, D. C. (1990), Institutions, Institutional Change and Economic Performance, Cambridge University Press.
Nunnenkamp, P. (2004), “Why Economic Growth Has Been Weak in Arab Countries: The
Role of Exogenous Shocks, Economic Policy Failure and Institutional Deficiencies,” Journal of Development and Economic Policy 7(2), pp. 1-18.
Page, J. (1998), From Boom to Bust- and Back? The Crisis of Growth in the Middle East and North Africa, in Nemat Shafik (ed), “Prospects for Middle Eastern and North African Economies: From Boom to Bust and Back?” Published by the Economic Research Forum for Arab Countries, Iran and Turkey.

? ?
Political Risk Services Group (PRS), International Country Risk Guide, New York.
Pritchett, L. (2001), “Where Has All the education Gone?,” World Bank Economic Review 15(3), pp. 367-391.
Radelet, S., J. Sachs and Lee J.W. (1997), Economic Growth in Asia, Harvard Institute for International Development.
Ramey, G. and V. Ramey (1995), “Cross-Country Evidence on the Link Between Volatility and Growth,” American Economic Review 85, pp.1138-1151.
Ridha, M. J. (1998), “Charting the Future Education and Change in the Arab Countries: A platform for the 21st Century,” paper presented in the Joint Arab Monetary Fund, Arab Fund for Economic and Social Development Seminar on “Human Resource Development and Economic Growth,” Abu Dhabi, United Arab Emirates, 17-18 May, 1998.
Sachs, J. D. and A. M. Warner (1997a), “Natural Resource Abundance and Economic Growth,” Center for International Development and Harvard Institute for International Development.
Sachs, J. D. and A. M. Warner (1997b), “Sources of Slow Growth in African Economies,” Journal of African Economies 6(3), October, pp. 335-376.
Sachs, J. D. and A. M. Warner (1995), “Economic Reform and the Process of Global Integration,” Brookings papers on Economic Activity, 10-1-118.
Senhadji, A. (1999), “Sources of Economic Growth: An Extensive Growth Accounting Exercise,” IMF Working Paper WP/99/77.
Srinivasan, T. G. (2002), “Globalization in MENA: A Long Term Perspective,” paper presented for the fourth Mediterranean Development Forum, Amman, Jordan- October 6-9, 2002.
UNCTAD (1999), Handbook of International Trade and Development Statistics 1996-1997.
UNESCO, Statistical Yearbook, several issues.
United Nations (1999), Human Development Report 1999.
World Bank (2002), “Better Governance for Development in the Middle East and North Africa,” available through internet at http://www.worldbank.org.
World Bank (2000), Global Economic Prospects and the Developing Countries 2000 , World Bank Publication.

? ?
World Bank, World Development Indicators CD-ROM, several issues.
World Bank: Global Research Project Database (GRP).
Young, A. (1995), “The Tyranny of Numbers: Confronting the statistical Realities of the East Asian Growth Experience,” Quarterly Journal of Economics 110 (3), pp. 641-680.

??
APPENDIX
??
Table 1 MENA Real GDP Pe r Capita Growth In International Perspective
Group 1961-1970 1971-1980 1981-1990 1991-2000
MENA 3.9 3.0 -1.3 1.1
MENA Oil 5.8 -0.2 -1.6 -5.9
MENA Non Oil 2.9 4.2 -0.5 1.7
East Asia & Pacific 4.3 3.6 2.5 6.4
Latin America & Caribbean 2.7 2.3 0.5 1.7
Sub-Saharan Africa 1.8 1.6 0.2 -0.4
World 3.1 2.5 1.0 1.2
Source: World Bank, World Development Indicators 2003.
?`
Graph 1
Evaluation of the Relative Income (PPP) of MENA Region Countries with Respect to U.S.(1980 ? 2002)
0 . 65 0 . 66
0 . 07 1 . 12
0 . 86 0 . 61
0 . 49 0 . 73
0 . 86 1 . 15
0 . 35 0 . 97
0 . 76 1 . 03
0 . 99 0 . 33
0.0 0.5 1.0 1.5
Alger ia Bahrain
Comoros Egypt
Iran Jordan Kuwait
Mauritania Morocco
Oman Saudi Arabia
Sudan Syria
Tunisia Turkey
UAE
?´
Table 2 Percentage Sectoral Distribution of Production in Selected MENA Countries According to Growth Performance
Averages for the Period 1960 -1998
Country Agriculture Mining and Quarrying* Manufacturing Other Sectors Countries with better growth performance
Egypt 22.9 11.5 19.1 46.5 Jordan 8.6 12.3 12.4 66.7 Morocco 18.2 14.1 17.2 50.5 Oman 17.4 55 1.5 26.1 Syria 22.5 9.9 13.5 54.1 Tunisia 15.6 13.9 13.0 57.5 Turkey 25.3 9.0 16.6 49.1 Average 18.6 18.0 13.3 50.1
Countries with lower growth performance Algeria 11.3 34.9 11.4 42.4 Iran 19.7 25.2 10.7 44.4 Kuwait 0.4 54.5 6.9 38.2 Mauritania 31.4 18.4 11.6 38.6 Saudi Arabia 4.6 55.0 7.3 33.1 Sudan 40.9 7.5 7.2 44.4 U.A.E. 1.4 59.5 6.6 32.5 Average 15.7 36.4 8.8 39.1
*Includes Construction, Electricity and Gas. Source: World Bank, World Development Indicators 2000.
?^
Table 3 Average Per Capita GDP Growth Rates (1970 -2000)
Country Average Growth Standard Deviation of Growth
Algeria 1.1 5.7 Bahrain 0.3 6.0 Djibouti -4.6 3.0
Egypt, Arab Rep. 3.2 3.0 Iran, Islamic Rep. -0.3 7.6 Iraq -5.1 21.3 Jordan 2.0 7.7 Kuwait -2.6 11.7 Lebanon 3.2 18.4 Libya -5.4 10.0 Mauritania 0.2 4.0 Morocco 1.7 4.6
Oman 2.7 7.3 Saudi Arabia 0.4 6.5 Sudan 1.5 6.1
Syrian Arab Republic 2.4 7.9 Tunisia 3.1 3.8 Turkey 2.2 3.8
United Arab Emirates -3.4 8.7 Yemen, Rep. 1.6 4.9 MENA 0.2 4.8 East Asia & Pacific 5.6 2.3 Latin America & Caribbean 1.5 2.5 Sub-Saharan Africa -0.1 2.6
World 1.5 1.3 Source :World Bank, World Development Indicators 2003.
??
Table 4 Gross Domestic Investment (% of GDP)
Group 1961-1970 1971-1980 1981-1990 1991-2000
MENA 17.4 26.3 24.1 22.5
MENA Oil 21.3 29.1 23.6 22.0
MENA Non Oil 14.9 24.1 24.4 22.1
East Asia & Pacific 19.1 28.6 31.8 34.4
Latin America & Caribbean 20.4 23.6 20.3 20.8
Sub-Saharan Africa 16.9 21.1 17.5 17.1
World 24.3 25.3 23.2 22.6
Source :World Bank, World Development Indicators 2003.
? ?
Table 5 Summary Statistics of Variables Used in Regressions
Variable
N MEAN Std Dev Minimum Maximum
Growth
86 1.81 1.66 -2.70 6.43
INVY
86 19.91 5.59 6.38 34.70
INFL
86 57.35 183.13 3.08 1148.22
Y60
86 2547.27 2398.73 319.00 9895.00
PESENR60
86 74.42 32.48 5.00 144.00
SXP
86 0.13 0.11 0.01 0.60
SOPEN
86 0.38 0.45 0.00 1.00
GPART
86 2.43 0.37 1.69 3.69
STDG
86 4.38 1.93 1.66 10.30

? ?
Table 6 Cross- Country Growth Regression Results
Dependent Variable: Real Per Capita GDP Growth�
Variable OLS Instrumental Variables
OLS with Interaction
Common:
Constant -1.970 (-2.162*)
-1.751 (-1.710)
-1.805 (-2.000*)
INVY 0.111 (3.854*)
0.116 (3.289*)
0.132 (3.913*)
INFL -0.002 (-2.313*)
-0.002 (-2.197*)
-0.002 (-2.353*)
Y60 -0.0003 (-4.401*)
-0.0002 (-1.656)
-0.0003 (-4.749*)
PESENR60 0.017 (3.446*)
0.019 (2.824*)
0.017 (3.510*)
SXP -2.268 (-1.916)
-3.586 (-2.642*)
-2.779 (-2.396*)
SOPEN 1.100 (2.974*)
1.016 (1.683)
1.230 (3.458*)
GPART 0.450 (1.313)
0.441 (1.066)
0.190 (0.564)
STDG -0.040 (-0.568)
-0.833 (-1.117)
-0.009 (-0.137)
MENA Specific:
INVY•MENA -0.208 (-4.369*)
SOPEN•MENA -0.922 (-2.063*)
GPART•MENA 2.294 (3.511*)
MENA -0.359 (-0.190*)
N 86 63 86
R2-Adj 0.65 0.59 0.69
� All Standard- errors are heteroskedasticity-consistent.
• T-ratios are in parentheses. * Significant at the 5% Level.

??
Table 7
Trade Protection Indicators for MENA (Most recent year in late 1990s)
NTB Coverage (%)
Standard Deviation (%)
Weighted Average (%)
Simple Average (%) Country/ Region
0.0 15.8 18.9 21.6 Jordan 15.8 16.7 17.3 24.2 Algeria 32.8 12.8 28.8 29.9 Tunisia 5.5 31.2 25.8 35.7 Morocco
28.8 130.6 13.7 28.1 Egypt 13.1 1.2 4.7 4.7 Oman 15.6 2.7 10.3 12.0 Saudi Arabia 15.9 30.1 17.1 22.3 Middle East and North Africa
CCoo mmppaarraattoorrss:: § By Income Group
5.5 10.9 12.6 15.5 Low Income Countries 13.4 15.0 12.5 15.3 Lower Middle-Income Countries 14.7 12.3 11.6 13.8 Upper Middle- Income Countries 15.6 7.0 3.4 4.3 High Income Countries
§ By Region 10.9 11.0 6.7 9.8 Europe and Central Asia 9.9 16.8 8.7 13.1 East Asia
17.1 8.5 11.9 13.1 Latin America 4.5 13.3 14.2 17.7 Sub-Saharan Africa 8.2 11.7 18.8 19.7 South Asia
Source: Srinivasan (2002).
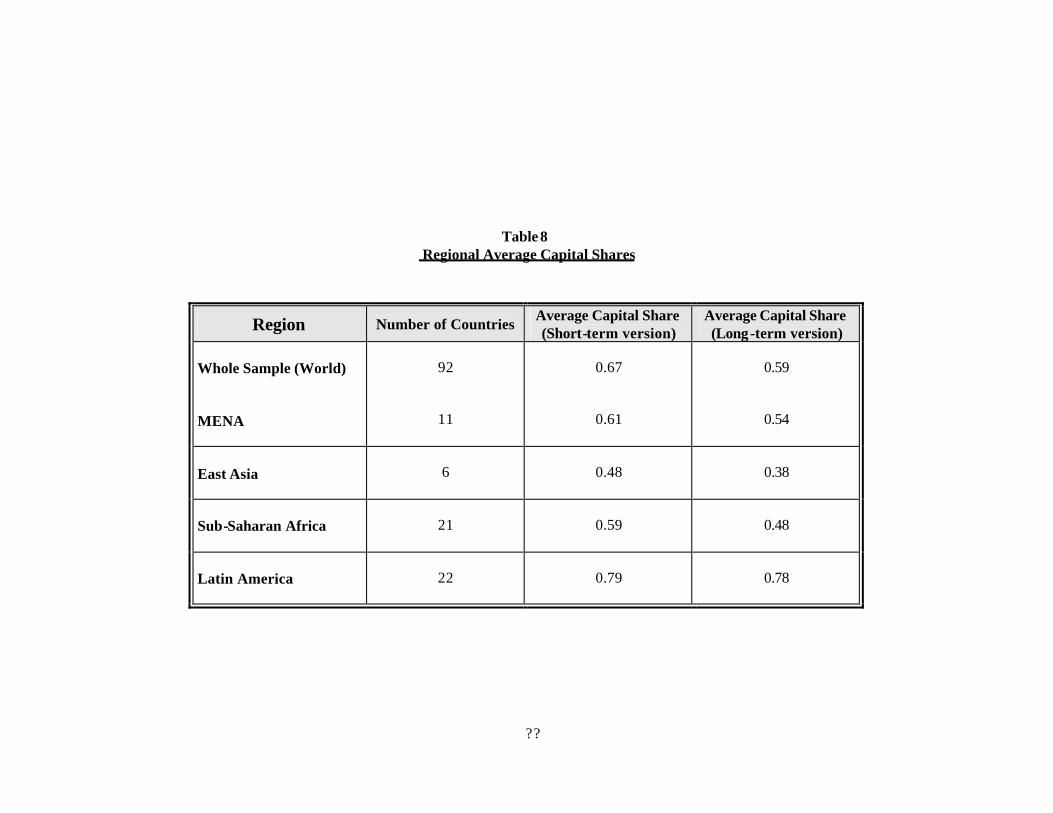
Table 8 Regional Average Capital Shares
Region Number of Countries Average Capital Share (Short-term version)
Average Capital Share (Long-term version)
Whole Sample (World)
92 0.67 0.59
MENA
11 0.61 0.54
East Asia
6 0.48 0.38
Sub-Saharan Africa
21 0.59 0.48
Latin America
22 0.79 0.78
??

Table 9 )1997-1960(GDP Growth Rate Decomposition
Growth Capital Labor TFP
Algeria 0.031 0.034 0.006 -0.009
Egypt 0.057 0.035 0.011 0.011
Iran 0.046 0.049 0.010 -0.013
Iraq 0.023 0.020 0.020 -0.016
Jordan 0.052 0.116 -0.013 -0.051
Kuwait 0.022 -0.015 0.056 -0.052
Libya 0.058 0.165 -0.011 -0.095
Morocco 0.049 0.025 0.013 0.011
Sudan 0.030 0.028 0.014 -0.020
Tunisia 0.051 0.028 0.012 0.010
Turkey 0.050 0.040 0.007 0.003
MENA 0.043 0.048 0.011 -0.020
SSA 0.028 0.020 0.011 -0.003
HASIA 0.066 0.044 0.015 0.008
LATIN 0.034 0.035 0.005 -0.006
World 0.037 0.032 0.007 -0.003
??
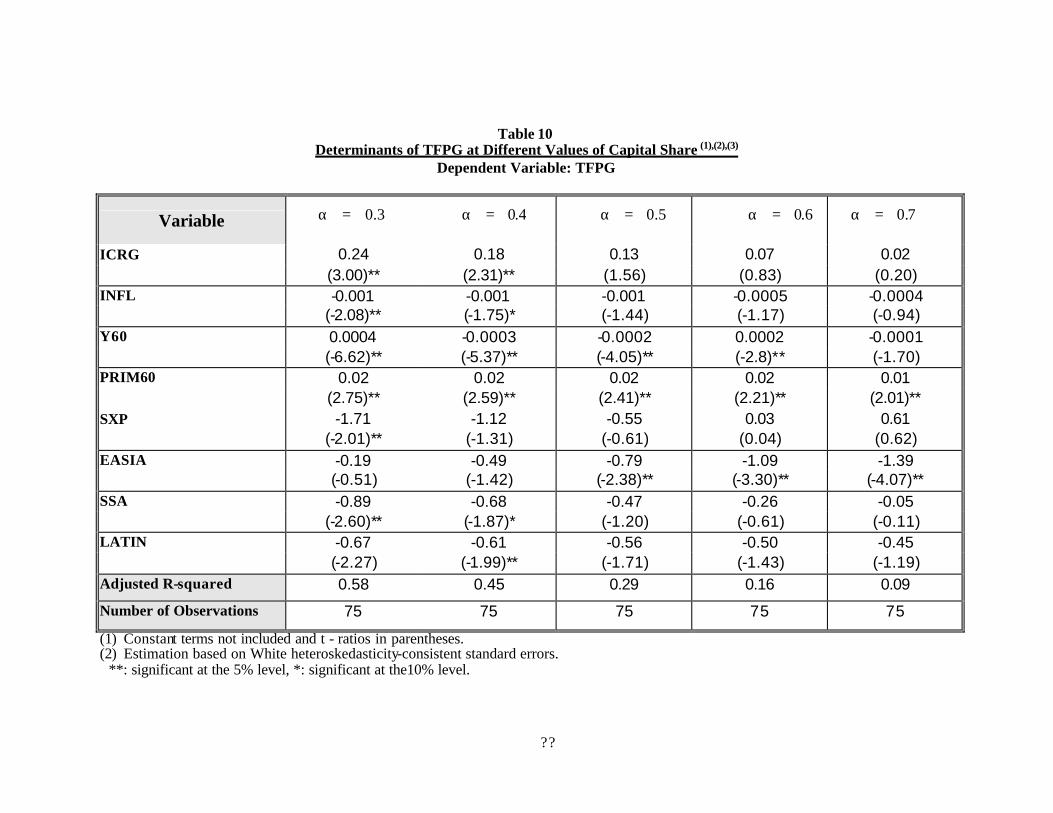
Table 10 Determinants of TFPG at Different Values of Capital Share (1),(2),(3)
Dependent Variable: TFPG
Variable
ICRG 0.24 0.18 0.13 0.07 0.02 (3.00)** (2.31)** (1.56) (0.83) (0.20) INFL -0.001 -0.001 -0.001 -0.0005 -0.0004
(-2.08)** (-1.75)* (-1.44) (-1.17) (-0.94) Y60 0.0004 -0.0003 -0.0002 0.0002 -0.0001
(-6.62)** (-5.37)** (-4.05)** (-2.8)** (-1.70) PRIM60 0.02 0.02 0.02 0.02 0.01
(2.75)** (2.59)** (2.41)** (2.21)** (2.01)** SXP -1.71 -1.12 -0.55 0.03 0.61
(-2.01)** (-1.31) (-0.61) (0.04) (0.62) EASIA -0.19 -0.49 -0.79 -1.09 -1.39
(-0.51) (-1.42) (-2.38)** (-3.30)** (-4.07)** SSA -0.89 -0.68 -0.47 -0.26 -0.05
(-2.60)** (-1.87)* (-1.20) (-0.61) (-0.11) LATIN -0.67 -0.61 -0.56 -0.50 -0.45
(-2.27) (-1.99)** (-1.71) (-1.43) (-1.19) Adjusted R-squared 0.58 0.45 0.29 0.16 0.09
Number of Observations 75 75 75 75 75
(1) Constant terms not included and t - ratios in parentheses. (2) Estimation based on White heteroskedasticity-consistent standard errors.
(3) **: significant at the 5% level, *: significant at the10% level.
3.0=α 4.0=α 5.0=α 6.0=α 7.0=α
??
?`
Table 11 Relative Contribution of Relevant Variables to TFP Growth Differential(1)
Variable Mena-World Mena-SSA Mena-Hasia Mena-Latin
ICRG
INFL
Y60
PESENR60
SXP
-0.18
0.03
0.39
-0.31
0.01
-0.04
0.04
-0.07
0.19
0.06
-0.48
0.00
0.05
-0.54
0.09
0.49
0.05
-0.01
-0.21
-0.13
(1)Assumptions: Mena alpha = 0.5 SSA alpha = 0.5 Hasia alpha = 0.4 Latin alpha =0.7 World alpha = 0.5
?´
Table 12 Institutional Indicators of the MENA Region*
Group MENA (1995)
East Asia**
(1995) WORLD (1995)
MENA (2000)
East Asia (2000)
WORLD (2000)
Government Stability 6.9 7.1 6.2 7.5 10.3 7.4
Investment Profile 5.7 6.5 5.5 10.2 8.0 9.9
Corruption in Government 3.1 3.9 3.5 2.5 2.8 3.0
Rule of Law 4.4 5.1 4.3 4.1 4.1 4.0
Quality of Bureaucracy 2.0 2.8 2.3 1.7 3.0 2.2
* Higher scores mean better institutions and vice versa. ** includes only the 8 best performing East Asian countries. Source : PRS Group (2002), International Country Risk Guide .
?^
Table 13 Panel Data Estimation of Growth Determinants in the MENA Region Dependent Variable:
Per Capita GDP Growth Rate
Variable Coefficient T-Ratio
INVY
0.15 2.46**
DEBTS
-0.10 -2.91**
GPART
0.91 2.48**
MANUF
0.03 1.72*
YINI
-0.0004 -4.48**
GCY
-0.16 -2.33**
Number of Countries = 15; Number of observations used = 61;R 2-adj = 0.51; Country intercepts not reported. **Significant at the 5% level, *Significant at the 10% level.

??
Table 14 Relative Contribution of Relevant Variables to Growth Differential in Selected MENA Countries
Country Predicted Growth
INVY DEBTS GPART MANUF YINI GCY Individual effect
Algeria 0.36 4.88 -4.38 1,65 0.07 -0.98 -2.44 1. 54 Bahrain -1.21 3.94 0.00 0.36 0.27 -3.74 -3.41 1.36 Egypt 2.93 3.27 -1.76 1.90 0.91 -0.60 -2.60 1.81 Iran -0.03 3.72 -0.27 1.50 0.08 -1.69 -3.13 -0.23 Jordan 2.19 4.52 -1.56 1.52 1.40 -1.10 -4.23 1.64 Morocco 1.66 3.56 -3.02 1.45 1.34 -0.71 -2.72 1.76 Oman 3.15 4.16 -0.35 2.64 0.55 -2.46 -4.23 2.85 Saudi Arabia 0.02 3.18 0.00 2.37 1.15 -3.37 -4.09 1.77 Sudan 0.45 1.96 -1.75 1.35 0.04 -0.30 -1.93 1.09 Syria 1.67 3.47 -1.36 1.52 0.67 -1.58 -2.60 1.54 Tunisia 3.09 4.11 -1.91 1.55 1.85 -0.98 -2.45 0.92 Turkey 2.33 2.95 -2.58 1.39 1.58 -1.13 -1.65 1.78 U.A.E. -3.09 4.23 0.00 2.28 0.99 -9.25 -2.55 1.22