Female Labor Force Participation in Five Selected Mena ...
34
DISCUSSION PAPER SERIES IZA DP No. 13814 Moundir Lassassi Aysit Tansel Female Labor Force Participation in Five Selected Mena Countries: An Age-Period- Cohort Analysis (Algeria, Egypt, Jordan, Palestine and Tunisia) OCTOBER 2020
-
Upload
khangminh22 -
Category
Documents
-
view
3 -
download
0
Transcript of Female Labor Force Participation in Five Selected Mena ...

DISCUSSION PAPER SERIES
IZA DP No. 13814
Moundir LassassiAysit Tansel
Female Labor Force Participation in Five Selected Mena Countries: An Age-Period-Cohort Analysis (Algeria, Egypt, Jordan, Palestine and Tunisia)
OCTOBER 2020

Any opinions expressed in this paper are those of the author(s) and not those of IZA. Research published in this series may include views on policy, but IZA takes no institutional policy positions. The IZA research network is committed to the IZA Guiding Principles of Research Integrity.The IZA Institute of Labor Economics is an independent economic research institute that conducts research in labor economics and offers evidence-based policy advice on labor market issues. Supported by the Deutsche Post Foundation, IZA runs the world’s largest network of economists, whose research aims to provide answers to the global labor market challenges of our time. Our key objective is to build bridges between academic research, policymakers and society.IZA Discussion Papers often represent preliminary work and are circulated to encourage discussion. Citation of such a paper should account for its provisional character. A revised version may be available directly from the author.
Schaumburg-Lippe-Straße 5–953113 Bonn, Germany
Phone: +49-228-3894-0Email: [email protected] www.iza.org
IZA – Institute of Labor Economics
DISCUSSION PAPER SERIES
ISSN: 2365-9793
IZA DP No. 13814
Female Labor Force Participation in Five Selected Mena Countries: An Age-Period-Cohort Analysis (Algeria, Egypt, Jordan, Palestine and Tunisia)
OCTOBER 2020
Moundir LassassiCenter for Research in Applied Economics for Development and ERF
Aysit TanselMiddle East Technical University, IZA and ERF

ABSTRACT
IZA DP No. 13814 OCTOBER 2020
Female Labor Force Participation in Five Selected Mena Countries: An Age-Period-Cohort Analysis (Algeria, Egypt, Jordan, Palestine and Tunisia)*
This paper considers the female labor force participation (FLFP) behavior over the past decade
in five MENA countries namely, Algeria, Egypt, Jordan, Palestine and Tunisia. Low FLFP rates
in these countries, as it is in other MENA countries, are well documented. We conduct
synthetic panel analysis using age-period-cohort (APC) methodology and decompose FLFP
rates into age, period and cohort effects. We present our results with Hanoch-Honig/
Deaton-Paxson normalization and maximum entropy estimation approaches to the APC
methodology in order to observe robustness of our results. We first study the aggregate
FLFP and note the differentials in age, period and cohort effects across the countries we
consider.The analysis is carried also out by rural/urban regional differentiation, marital status
and educational attainment. Implications of our results for possible government policies to
increase FLFP rates are discussed.
JEL Classification: C23, C25, D1, J21
Keywords: female labor force participation, synthetic panel analysis, life-cycle profiles, period effects, cohort effects, MENA countries
Corresponding author:Aysit TanselDepartment of EconomicsMiddle East Technical University06800 AnkaraTurkey
E-mail: [email protected]
* An earlier version of this paper was presented at the Economic Research Forum (ERF) Annual Conference in
Kuwait, in March 2019. We have benefited from the comments of the ERF referees and of the participants at this
conference.

2
1. Introduction
Female labor force participation (FLFP) is at the center of policy discussions around the world in
particular in the MENA region. The very low levels of FLFP in the MENA region have been well
established. Recent data illustrates that the MENA region continues rank the lowest in the world in
terms of women’s participation in the labor force (Global Gender Gap Index 2019). Thirteen of the
bottom 20 countries out of the 145 countries covered by the report are MENA countries.
A rich literature examines the determinants of FLFP in MENA countries. The most common factors
discussed in the literature are “conservative gender norms”, “Islamic culture” and “social norms” in
the region (Clark, Ramsey and Adler 1991; Ingelhart and Norris 2003; Haghighat-Sordellini E, 2009;
Diwan and Vartanova, 2017). These factors are conveniently referred to as social norms hypothesis of
low FLFP. The traditional values define men’s role as bread winner and women’s as home maker.
Some authors analyze the role of demographic characteristics such as age, education and fertility and
family composition such as marital status on FLFP. Marriage is thus a transition, which, for women,
adds substantial domestic responsibilities that can make it difficult for them to engage in market work
(Assaad& El-Hamidi, 2009; Assaad, Krafft & Selwaness 2017; Tansel, 1994;2001; Al-Qudsi, 1998;
Assaad et al. 2020).
A major gap in the empirical literature on FLFP in MENA has been in research on the dynamics of
FLFP. There are no studies of FLFP by cohort analysis in the MENA countries except a recent one in
Turkey. Most of the empirical literature on the dynamics of FLFP focused on the case of developed
and Latin America countries (Crespo, 2007; Deborah 2001; Yang, 2010; Baudelot, and Gollac, 1995;
Bourdallé and Cases, 1996; Herault, N. and G.R.J.Kalb, 2020). Tunalı, Dayıoğlu and Kırdar (2019),
study the aggregate labor force participation behavior of women over a 25-year period in Turkey using
a synthetic birth cohort analysis. They find robust age-profiles for a typical woman over her life-cycle.
The M-shape attributable to child-bearing related concerns is detected in rural areas and for low-
educated women in urban areas.
In this paper we study the aggregate labor force participation behavior of women using a synthetic
birth cohort analysis. We provide new evidence of the dynamics of FLFP across the life course, over
time and cohorts in five MENA countries namely, Algeria, Egypt, Jordan, Palestine and Tunisia. The
pseudo-panels we employ provide a unique dataset of ‘archetypical’ individuals that can be followed
over time and used to assess how changes in the cohort-level employment conditions affect their labor
force participation by exploiting both the temporal and cross-sectional variability. The unique feature
of the cohort analysis is that we follow a cohort of individuals over time. This enables us to
decompose the participation rates into life-cycle effects, business cycle variations and generational
effects. This is often referred to as Age-Period-Cohort (APC) methodology. First, examination of the
life-cycle patterns shows the movements of women of various age groups such as the young and

3
elderly. Age effects may include life-cycle decisions such as the timing of education, children and
retirement. Second, period effects may include business cycle effects or the effect of policy changes on
the female labor force participation. The study of business cycle effects may help to observe the
sectors of the economy with pro-cyclical or counter-cyclical employment patterns and test the “added
worker effect” vs “discouraged worker effect” theories. Finally, cohort effects may include the effects
of improved educational attainment and lower fertility rates of younger cohorts and changed social
norms. Examination of generational patterns may help identify the long-run trends in participation
abstracting from the age and business cycle effects. This enables answering questions about the
structural changes in the economy. These aspects have not been examined before for the MENA
countries. We first examine the aggregate participation behavior of women. We further stratify the
sample into rural/urban residence, marital status and educational attainment in order to examine the
differentials in participation behavior of these groups of women.
We ask the following questions. Can we observe concordant evidence of U-shaped hypothesis in
female labor participation in the MENA countries in the APC analysis? A related question is how
does the so called “MENA paradox” resolved? Is there an M-shape age profile in the participation
behavior? How does the participation behavior by rural/urban residence and of the never married and
ever married women differ? What are the differentials in participation behavior by educational
attainment?
The outline of this paper is as follows. After the introduction, Section 2 presents a brief review of the
literature on FLFP in the MENA region and identifies the gaps in the literature. Section 3 discusses the
data used and the methodology followed. Sections 4 provides background information on labor
markets in the countries we consider. Section 5 presents the results of the APC decomposition with
three subsections. The first subsection examines the age effects which are stratified by rural/urban
residence, marital status and educational attainment. The second and third subsections focus on time
and cohort effects by the same stratification. Section 6 concludes.
2. Brief Review of Literature
FLFP has been studied extensively in the developed and developing countries including several
MENA countries. Most of these studies focus on the determinants of participation using cross-
sectional data or time-series data. The current study uses recent comparable cross-sectional surveys to
perform cohort analysis over a decade in five MENA countries namely Algeria, Egypt, Jordan,
Palestine and Tunisia.
Recently in many countries it is observed that rising education levels increase FLFP rates as it is
shown by Tansel (1994) in Turkey. There have been significant gains in education in all of the five
countries considered in this study. However, in most countries the FLFP remained stagnant. For a
4
detailed study of this observation in the case of Algeria, Egypt, Jordan and Tunisia consider Assaad et
al. (2020). They attribute the stagnant FLFP rates in MENA despite the rapid increase in educational
attainment to the decline in public sector employment in Algeria, Egypt, Jordan and Tunisia, the
countries which we also consider (we additionally consider Palestine). The decline in public sector
opportunities for the educated women was not made up forby an increase in the formal private sector
employment.
Several studies confirm that FLFP rate varies by the stage of economic development of a country.
Boserup (1970) proposed the notion of U-shaped pattern for FLFP rates over the development process.
Goldin (1995) and Mammen and Paxson (2000) and others verified this shape for FLFP rates.
Psacharopoulos and Tzannatos (1989) and Cagatay Ozler (1995) provided evidence on this in the
international context. Mammen and Paxson (2000) find in India and Thailand that FLFP is lower in
urban areas than in rural areas and tertiary educated women have significantly higher FLFP rates as it
is the case in many countries like Turkey (Tansel, 1994). In this study we also perform analysis for the
countries we consider in order to find out their position on the U-shaped pattern.
Recent research has also investigated the effect of macroeconomic crisis on FLFP. One aspect of this
is known as the added worker effect. This defines an increase in FLFP in the face of economic
downturns. Evidence on this remains scanty in the MENA region. A recent study on Canada is by
Tansel and Ozdemir (2018). Dasgupta and Goldar (2005) in India find that when real wages decline or
when men become unemployed due to economic crisis, FLFP increase from low income families.
Lack of income and unemployment insurance system cause women to increase their participation in
order to sustain their household’s level of income and consumption.
APC methodology have a variety of applications in different areas. Applications to female labor
supply relations in developed countries include Blundell, Duncan and Meghir (1998), Pencavel (1998)
and Devereux (2007). There are several studies in developing countries also. Duval-Hernandez and
Romano (2009) conducted an APC analysis of labor participation in Mexico. They decomposed FLFP
rate into age, period and cohort effects. Life-cycle patterns of FLFP rate exhibit the usual inverted U-
shape. The FLFP is found to be countercyclical suggesting possible added worker effect. Long-run
generational effects exhibit a rising participation rate. Warunsiri and McNown (2010) investigate labor
supply behavior of women in Thailand using APC methodology handling the individual heterogeneity,
wage endogeneity, sample selection and data aggregation. They disaggregate by age, period and cohort
effects by educational attainment, marital status, and by place of residence. Tunali, Kirdar and
Dayioglu (2019) provide APC analysis of FLFP in Turkey. They consider the differences in behavior
by different education levels and rural/urban region. They find M-shaped life-cycle profile for urban
women and also for low-educated women.

5
3. The Data and the Methodology
The regression model for labor force participation, by individual i, aged a, belonging to cohort c in
period p can be written as: 𝑌𝑖𝑎𝑝𝑐 = 𝛼𝑎𝐴𝑎𝑝+ 𝛽𝑝𝑃𝑝+ 𝛾𝑐C𝑐+ 𝜀𝑖𝑎𝑝𝑐
Where a =1,....,n , p =1,.....,m, c =1,.....,(p−a) and c = p−a. A, P and C denote dummies for age, period,
and cohort. Aa is set to one if person i is aged a at the end of year p. Cc is a dummy set equal to one if
person i was born in year c and Pp is a dummy set equal to one if labor force participation is recorded
in year p. Then, Y is the labor force participation, a binary variable which is equal to one if individual i
born in year c at age a in year p participates, and zero otherwise.
We compiled and harmonized micro data from official labor force surveys in the five countries we
consider, spanning the period from 2000 to 2014. The longest series of surveys is available for Egypt
and Palestine where we have a continuous series of Labor Force Surveys from 2000 to 2014 (Central
Agency for Public Mobilization and Statistics, and Palestinian Central Bureau of Statistics). For
Jordan we have data from the Employment and Unemployment Survey for 2000-2003 and 2005-2014
(Department of Statistics). For Algeria, we have data from 2001 to 2007 and 2010 (National Office of
Statistics). Finally, for Tunisia, we have data from 2005 to 2008 and 2010 to 2013 (National Institute
of Statistics). For Egypt, Jordan and Palestine the data comes from the ERF website. For Algeria and
Tunisia the data come from the Statistics Office, ONS and INS respectively.
We use the annual rounds of Household Labor Force Surveys (HLFS) to obtain a pooled cross-section
dataset for individuals aged 15-64 except for Algeria where it is biannual. Our pooled dataset is not a
panel data set. That is, it does not follow the same individual over time. However, we can track cohorts
of individuals with cohorts defines according to year of birth. As described in detail below, we
construct synthetic cohorts by categorizing individuals using their age-period identifiers and fellow
them. Since each cross-section is representative of the population, we can learn about changes in
behavior by examining the participation rates of successive cohorts at the same phase in their life-
cycle. The surveys include information on age, gender, education, marital status, labor force
participation and other socioeconomic factors.
We decompose the changes in female labor supply into age, period and cohort effects by using
synthetic cohort analysis, namely, the APC methodology. This method is used recently by economists
to investigate various research questions such as savings growth and aging in Taiwan (Deaton and
Paxson, 1994) and FLFP in the UK (Browning et al., 2012. See also references in the review of
literature).The main analysis consists of estimating a series of cohort-based models to analyze
determinants of FLFP in five MENA countries. Therefore, we will be able to examine the effects of
demographic and socio economic factors on FLFP.This analysis consists of following the same cohort
over time.The model captures age, period and cohort effects as indicators of (unobserved)
determinants of participation behavior. We use these effects and observed determinants to construct

6
trends of labor supply.Different age groups are at different stages relating to education, work and
retirement. Different cohorts are exposed to different events such as recession. Birth cohorts born in
different time periods that encounter different historical and social conditions as they age would
conceivably have diverse developmental paths.
The major challenge of estimating separate age, period, and cohort effects is the “identification
problem” induced by the exact linear dependency among age, period, and cohort indicators. Namely,
cohort = period – age. Different solutions to the model identification problem have ignited continuous
debates on whether any solutions exist or which solutions are better. In executing the APC
decomposition methodology we work with two approaches: The first one is due to Hanoch and Honig
(1985) and Deaton and Paxon (1994) and the second one is called Maximum Entropy (ME) approach
due to Browning, Crawford and Knoef (2012). Hanoch-Honig/Deaton-Paxson approach is the most
popular one in economics. It imposes arbitrary restriction to achieve identification. Since each
approach makes different assumptions to get around the perfect collinearity between age, period, and
cohort indicators, we use both of these approaches to be able to evaluate the robustness of our
estimation results.1
Individuals are averaged within each cohort. This could handle the problem of heterogeneity bias.
Antman and Mc Kenzie (2007) suggest that this could also solve the problem of individual
measurement error.We first present the analysis of aggregate FLFP. Then, we conduct separate
analyses by place of residence (urban vs rural), marital status and level of education.
3.1. Hanoch-Honig/Deaton-Paxson normalization
The Hanoch-Honig/Deaton-Paxson normalization approach imposes an arbitrary restriction to achieve
identification. It was first introduced in Hanoch and Honig (1985), and was further discussed by
Deaton and Paxson (1994). The basic idea of the Hanoch-Honig/Deaton-Paxson normalization is to
impose one extra parametric restriction so that the APC model becomes just identified. First, the
variables are de-trended, and then the restriction that time effect dummies are orthogonal to a trend and
sum to zero is imposed. The coefficients for age, period, and cohort can then be estimated by using
OLS.
3.2. Maximum entropy estimation
The maximum Entropiy approach is explainedin detail by Karto (2015).The maximum entropy
approach does not impose an arbitrary restriction to achieve identification and is not an OLS estimator.
It was first used to solve the APC model by Browning et al. (2012). This is an information-based
1Tunali et al. (2019) use three approaches to the APC decomposition namely, Hanoch-Honig/Deaton-Paxsonestimmation,
Intrinsic Estimation and Maximum Entropy estimationin their study on Turkey. They documented that the difference
between approaches is due to the fact that changing linear trend is attributable to different components of the APC method.Abrahamsen (2015) considers the limitations of different approaches and concludesthat the Maximum Entropy approach seems to be the most reliable.

7
approach where the maximum entropy is used as a principle to address the identification problem. It is
based on the belief that there is not enough information in the data to provide one unique solution.
Instead of finding one unique solution, the maximum entropy principle provides a framework that can
formalize the uncertainty in the model and estimate the most likely solution (Browning et al. (2012)).
The maximum entropy principle tells us to seek the probability density function such that certain
constraints and use the density satisfying the constraints with the largest entropy (Conrad (2004)).
4. Background on labor markets in the countries considered
The economies of the countries studied differ in terms of their natural resources and structure.
However they tend to share the fact that the recent economic growth is not sufficient to generate
enough jobs. Recent social movements popularly referred to as ‘Arab Spring’ have shown the fragility
of the situation on the labor market in all five countries except Palestine.
Table 1: Labor Market Indicators by Country, 2016 (%)
Algeria Egypt Jordan Palestine Tunisia
Male Female Total Male Female Total Male Female Total Male Female Total Male Female Total
Population (103) 20133 19738 39872 47409 46369 93778 4641 4518 9159 2413 2336 4749 5570 5703 11274
0 - 14 years 29 28.3 28.7 33.8 32.5 33.1 36.1 36 36 39.5 39.1 39.3 24.5 22.9 23.7
15 - 29 years 26.2 25.9 26.1 26.6 26.3 26.4 27.4 27.6 27.5 30.1 29.8 29.9 24.9 24.1 24.5
30 - 64 years 39.3 39.6 39.4 35.3 35.5 35.4 33 32.4 32.7 28.0 27.7 27.9 43.6 44.8 44.2
65 and over 5.6 6.2 5.9 4.4 5.8 5.1 3.5 4 3.8 2.5 3.3 2.9 6.9 8.3 7.6
Labor force
participation rate
66.6 16.6 41.8 73.6 22.4 47.8 60 12.6 36.4 71.9 19.1 45.8 70.8 24.4 47
Labor force
participation rate
Youth 15-24
years
41.2
8.2
25.1
42.3
20.2
31.5
38.1
7.6
23.2
52.9
11.6
32.7
46.6
22.1
34.6
Unemployment
rate
8.1 20 10.5 7.7 24 12 10.1 20.7 11.9 22.5 39.2 25.9 12.6 23.5 15.5
Unemployment
rate - Youth 15 -
24 years
22.3
49.9
26.7
26
59
34
26.4
53.3
30.6
36.4
60.8
40.7
34
33.5
35.5
NEET* 10.8 32.1 21.2 18.9 35.2 26.8 15.2 34.8 24.6 26.4 38.1 32.1 21.2 29.9 25.4
* Share of youth not in education, employment or training.
Source: Official labor force survey - World Bank.
The share of 15 to 24 years-olds in the population has varied between 24 and 30 percent. In Tunisia the
proportion is around 24%. This proportion is 30% in the case of Palestine. These indicate that the
countries we consider have a youthful population. For the population aged between 30 and 64, the
largest share is observed in the case of Tunisia (44.2%) and Algeria (39.4%). The share of those
younger than 15 is also substantial particularly for Palestine (around 40%).

8
Female labor force participation is very low in the MENA region. Comparing the five countries,
Jordan and Algeria have the lowest female participation rates of 12.6% and 16.6% respectively. On the
other hand, the highest rates are observed in Tunisia (24.4%) and Egypt (22.4%). Youth find more
difficulty in entering the labor market as it is the case in many countries. However, the situation is
more complex for young females. In fact, the participation rate in the labor force is particularly low for
young females with 8.2% in Algeria, 7.6% in Jordan and 11.6% in Palestine.
The highest unemployment rate is observed in Palestine with 26%, followed by Tunisia with 15.5%
both in 2016. In Algeria, Egypt and Jordan, the unemployment rate is 11.5%. The youth, in particular
female youth have high unemployment rates. This rate has reached 60.8% in Palestine, 59% in Egypt
and 53.3% in Jordan.
Around one in four young people (15-24 years old) are excluded from school, from labor market and
from training (NEET). The highest NEET rates are observed in Palestine with 32.1% followed by
Egypt with 26.8% and Tunisia with 25.4%. This proportion is more important for females. The highest
rate is recorded in Palestine with 38.1%.
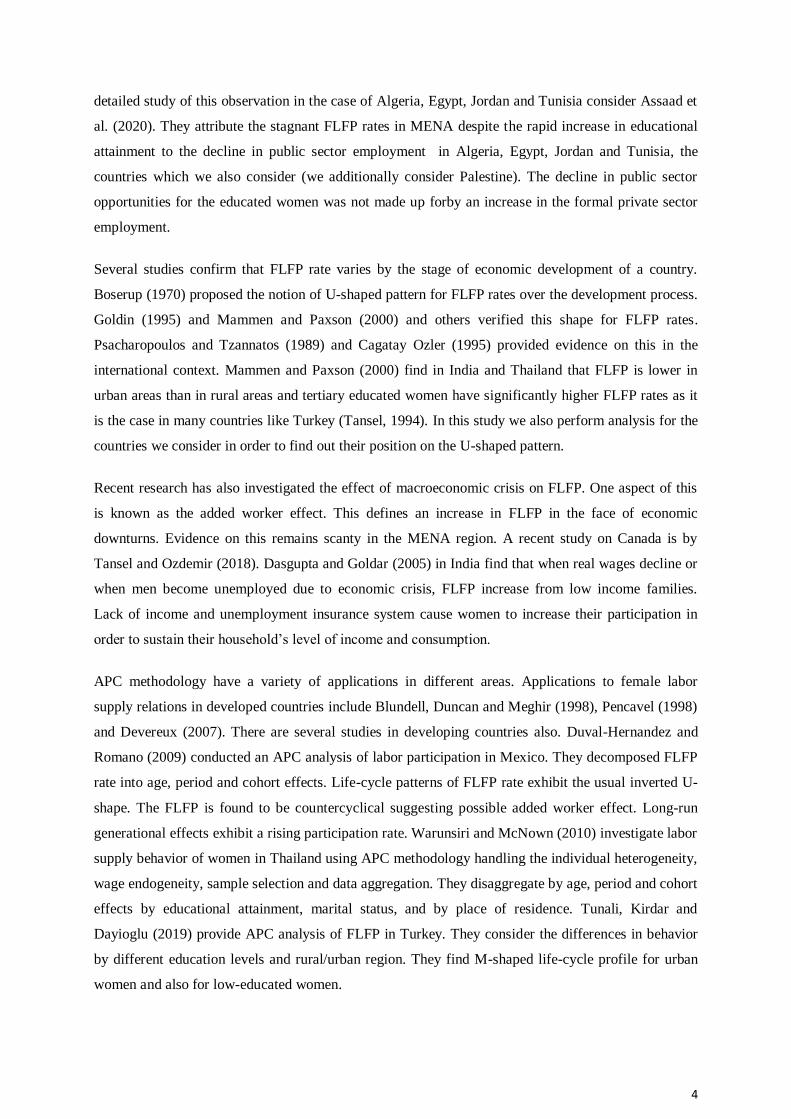
Figure 1:Trends in Female Participation Rates, by Country, 2000-2017
0
5
10
15
20
25
30
2000 2001 2002 2003 2004 2005 2006 2007 2008 2009 2010 2011 2012 2013 2014 2015 2016 2017
La
bo
r F
orc
e P
art
icip
ati
on
Ra
te (
%)
Algeria Egypt Jordan Palestine Tunisia
Source: Computed by the authors based on data from World Bank.
The changing demographic dynamics such as declining fertility coupled with increasing female
education levels is expected to contribute to increasing female LFPR. However, the failure of the
economy to integrate females into the labor market becomes quite disturbing.
Figure 1 shows female LFPR in the five MENA countries we consider. Despite a long-standing pattern
linking women’s economic participation with education, rapidly rising education levels among women
in MENA countries has not been translated into higher levels of their LFPR. The figure shows that
Tunisia has the highest while Jordan has the lowest participation rate. In all countries the participation

9
rates are rather flat except for Palestine where it has increased relatively over time albeit from very low
initial rates such as rising from 10% in 2000 to around 19% in 2017.
5. Empirical Results
5.1. Descriptive Evidence
Table 2 shows that we are able to observe 15 same cohorts in all five countries (those born between
1938 and 1985) in all of our cross sections.
Table 2: Cohorts Followed
Algeria Egypt Jordan Palestine Tunisia
BirthYear 1936 - 1995 1936 - 2001 1936 - 2001 1936 - 1999 1941 - 1998
Cohort [1938- 1941] [1954-1957] [1950- 1953] [1946- 1949] [1942- 1945]
[1958- 1961] [1974-1977] [1970- 1973] [1966- 1969] [1962- 1965]
[1978- 1981] [1994- 1997] [1990- 1993] [1986- 1989] [1982- 1985]
Figure 2 illustrates that the female participation in the labor force have an inverted-U shape over the
life-cycle. It is observed that the participation rates of the young cohorts and of the old cohorts remain
low, whereas substantially higher participation rates are observed for those in the peak age group
which exhibits a relatively flat profile between the ages 35 to 50. The participation rate and its
determinants vary systematically by the age of the females. The low participation of younger age
groups may be due to the increasing enrolments in education at those ages.
In Figure 2 we note the following differences among the five countries. First, in Algeria, Egypt and
Palestine the period when participation rate is stable is more prolonged compared to others countries.
Second, in Algeria, Tunisia and Jordan, the curves overlap, this means that women’s participation in
the labor market has not really changed across cohorts. On the other hand, in the case of Egypt and
Palestine, there is a gap between the curves, which implies a change in the women’s participation
behavior across cohorts. Third for the oldest generations, the participation rate of women is higher in
the case of Egypt. Indeed, as an example for the cohorts born between 1942 and 1945, the participation
rate of women in Egypt is 14%, compared to 8.7% for Palestine, 6.1% for Tunisia, 6% for Algeria and
5.8% for Jordan. On the other hand, for the youngest cohorts, the participation rate is highest in
Tunisia with 41.7% for the cohorts born between 1978 and 1981. In Algeria this rate is 19.8 %, in
Egypt it is 34.1%, about 30% in Jordan and 20.4% in Palestine for the same generations (1978-1981).
Appendix Figure A3 reproduces Figure 2 for women living in rural and urban areas. Two patterns are
worth underscoring. First, in the case of Algeria, Jordan and Palestine, the fluctuations in female
participation rates are more pronounced in the rural areas than in urban areas. This signifies a change
in activity behavior for women residing in rural areas over the cohorts. Second, in all countries, we

10
observe that the oldest cohorts of women in rural areas are less likely to participate in the labor market
compared to those living in urban areas.
Appendix Figure A4 reproduces Figure 2 for women according to marital status (never married vs ever
married). Marriage has been highlighted in the literature as an important factor in explaining female
labor force participation. Marital status affects FLFP in two key respects. First, after marriage, women
typically take on the role of care-giver in the family, which significantly alters the allocation of their
time, especially after childbirth. Second, marriage broadly changes a woman’s social position and
status. A married woman joins the labor force only when social norms and the stigma attached to
market labor conforms to family restrictions. Several observations emerge. First, with the exception of
cohorts at the two extremes (the youngest and the oldest ones) we can observe for all countries that
participation rates are higher for never married women compared to the ever married women. Second,
participation rate fluctuations are more pronounced for never married women, which implies that the
change in the labor market behavior is more frequent for them. Finally, for women who has been
married we can notice that the curves are superimposed, which implies less changes in women's
behavior. Fertility behavior of women is also very important with regard to their labor force
participation decision as children influence the opportunity cost of market work. The lower fertility
rates of younger cohorts of women and the negative correlation between children and labor force
participation imply a higher participation rate for younger women. Appendix Figure A6 shows that the
fertility rates in Algeria and Tunisia are lower compared to Egypt, Jordan and Palestine. The peak
fertility rate is recorded for women aged from 25 to 29 for all five countries, but with a higher rate for
the case of Palestine and Jordan.
Appendix Figure A5 reproduces the Figure 2 for women according to their level of education. A
cohort is defined by year of birth, gender, and education level. The educational categories considered
are illiterate, below secondary, secondary and university. The analysis is based on individuals aged
between 25 and 64 in order to fully span the life-cycle of labor participation. The lower age limit of 25
is selected because by this age most women complete their education. This guarantees that the cohort
analysis tracks the same population groups over time. Educational attainment is highlighted in the
literature as an important factor in explaining female labor force participation. The empirical papers
find that female participation rates increase substantially with education. We observe that for the
lowest levels of education (illiterate and below secondary) the participation rates are very low for all
cohorts in all countries. However, for the secondary and university levels, we observe rather high
female participation rates. Moreover, the participation rate is higher for the younger cohorts compared
to older ones. This result is due to the improvement of the educational attainment in particular in the
countries we consider and in general in the MENA region. Recently, the gap in educational attainment
between men and women is reduced in the MENA region.

11
Figure 2: Female Participation Rates by Country – Cohort
Algeria Egypt Jordan
02
04
06
08
01
00
15 20 25 30 35 40 45 50 55 60 65age
act11 1936-1937
1938-1941 1942-1945
1946-1949 1950-1953
1954-1957 1958-1961
1962-1965 1966-1969
1970-1973 1974-1977
1978-1981 1982-1985
1986-1989 1990-1993
02
04
06
08
01
00
15 20 25 30 35 40 45 50 55 60 65age
act11 1936-1937
1938-1941 1942-1945
1946-1949 1950-1953
1954-1957 1958-1961
1962-1965 1966-1969
1970-1973 1974-1977
1978-1981 1982-1985
1986-1989 1990-1993
02
04
06
08
01
00
15 20 25 30 35 40 45 50 55 60 65age
act11 1936-1937
1938-1941 1942-1945
1946-1949 1950-1953
1954-1957 1958-1961
1962-1965 1966-1969
1970-1973 1974-1977
1978-1981 1982-1985
1986-1989 1990-1993
Palestine Tunisia
02
04
06
08
01
00
15 20 25 30 35 40 45 50 55 60 65age
act11 1936-1937 1938-1941
1942-1945 1946-1949 1950-1953
1954-1957 1958-1961 1962-1965
1966-1969 1970-1973 1974-1977
1978-1981 1982-1985 1986-1989
1990-1993
02
04
06
08
01
00
15 20 25 30 35 40 45 50 55 60 65age
act11 1942-1945
1946-1949 1950-1953
1954-1957 1958-1961
1962-1965 1966-1969
1970-1973 1974-1977
1978-1981 1982-1985
1986-1989 1990-1993
Source: Computed by the authors.

12
5.2. Decomposition Results
In this section, we present the decomposition results of the FLFP rates using the APC method
disentangling age, time and cohort effects for the aggregate participation and also with stratifications
by urban vs rural residence, marital status and education levels.
The analysis with marital status and the urban vs. rural residence is conducted on women aged
between 15 and 64. In contrast, the analysis with education levels is limited to women aged between
25 and 64 in order to ensure that they have completed their education. For the cohort profiles we can
fellow those born between 1938 and 1985 in all of our cross sections.
We use the Hanoch-Honig/Deaton-Paxson and Maximum Entropy estimation approaches.2Using two
different approaches to identification problem allow us to address robustness of our results.3 The
predicted participation rates are plotted against the age, period and cohort values in Figures 3-9. The
95 percent confidence intervals are also provided in these figures. The results for the two methods are
mostly consistent with each other demonstrating the robustness of our estimations.
5.2.1. Age Effects
Figure3 displays the estimated age, year, and cohort profiles of the aggregate predicted labor force
participation rate, which are quite consistent with the two different methods except for Algeria (in the
in rural residence with Hanoch-Honig/Deaton-Paxson approach and rural residence with Maximum
Entropy approach). The Figure 3 illustrates the age profile over the life-cycle of the labor force
participation net of business cycle and cohort effects. The profiles have a standard inverted-U shape.
For all countries, participation is high and stable until around age 50 when workers start retiring with
some differences among the countries. The time for stability of the participation rate is more important
in Egypt, Palestine and Algeria. However, the participation rate in Jordan and especially in Tunisia
decline before age 50. When we decompose by urban vs rural areas, we can see that the participation
rate is similar in the rural and urban areas in all the countries considered. However, we find that
participation rate decreases in the rural areas at earlier ages compared to the urban areas.This result is
contrary to the results in most countries. We think that this anomaly is related to our definition of the
rural areas. Our definition of rural areas is not just based on agricultural activities.4 Most definitions of
rural areas include only agricultural activities. They are not likely to be covered by retirement with
2Hanoch-Honig/Deaton-Paxson approach and Maximum Entropy approachto the APC method are both estimated using the
codes provided by Browning et al. (2012) at https://www.ifs.org.uk/publications/5998. 3Tunali et al. (2019) employ three different approaches while conducting the APC decomposition. They are Hanoch-Honig/Deaton-Paxson normalization, intrinsic estimation and maximum entropy estimation approaches to the APC methodology. They note that if the linear trend in the cross-section age profile is stable over time, the results from all three approaches are consistent with one another. 4 For the definition of urban versus rural in addition to the size of the population, other criteria are taken into account,
including economic characteristics (proportion of agricultural employment) and the presence of infrastructure (schools, health
center, cultural center, maternity center) at the community level. The structure of the labor market is different between the two areas (urban vs. rural) as well as employment opportunities.

13
pension. Therefore, they enter the labor force early (low education) and exit later (lack of pension).
For instance, evidence in Turkey indicates that not only the participation rate is higher in rural areas
but also entry into labor force starts earlier and exit from the labor force is at a later age than in urban
areas (Tunali et al. 2019). In the case of Egypt, in urban areas age profiles display a slight M-shape.
This M-shape suggests that some women are temporarily exit the labor force for childbearing purposes
and return later. M-shape of age profile is also observed in Turkey (Tansel, 2001) in particular, in rural
areas and among low-educated women (Tunali et al. 2019).
Appendix Figure A4 shows the age profile of the predicted participation rates by marital status. We
observe a slight M-shape for married women in Egypt. The profiles have a standard inverted-U shape
for both the never married and the ever married women. The participation rate is higher for the never
married women for all categories of age. This is expected because never married women lack the
support of a husband’s income. Further, they have a stronger income effect than the substitution effect
of leisure for work. Assaadd and El-Hamidi (2009) and Hendy (2015) discuss that in Egypt women in
the public sector continue to work after marriage but women in the private sector quit their jobs upon
marriage. Assaad et al. (2017) discuss the impact of Marriage on Women’s employment in MENA.
Appendix Figure A5 shows the age profile of the predicted participation rates by education levels. For
the illiterate women the participation rate is relatively stagnant. We observe an M-shape for women
with secondary education in Egypt and slight M-shape for women with secondary education in Jordan.
We observe similar results for the education level below secondary where the participation rates are
stagnant in all countries except in Palestine and Tunisia where they decline in old ages. For secondary
and university level, we observe the inverted-U shape in Palestine and Tunisia.
5.2.2. Year Effects with Cyclical Components
We discuss in this section year effects with cyclical fluctuations in the participation rates. Figure 6
shows the year effects in the predicted participation rates by rural/urban residence and marital status
Figure 7 shows the same by educational attainment. In order to emphasize the cyclical variations rather
than the absolute divergence in overall levels, all of the components are presented as deviations from
their means. In Algeria, in all specifications (rural/urban residence, marital status or level of
education), we observe important fluctuations in participation rates. This is probably due to the fact
that labor force surveys in Algeria are biannual surveys and do not capture well women’s work
especially in the rural areas. In Egypt and Palestine, we observe an increase in participation rates over
time. In both Jordan and Tunisia, the participation rates are stagnant over the period of observation
(2000 – 2014). These results may indicate that Egypt and Palestine maybe on the increasing portion of
the U-shape whereas Jordan and Tunisia are at the bottom of it. Figure 6 shows an increase in the
participation rate for both never married and ever married women in all countries except in Algeria

14
and Tunisia where the participation rate is stagnant. Figure 7 shows the predicted participation rate by
education level. We observe an increase in the participation rate at the university level only in Jordan.
For the other countries the participation rate is stagnant at this educational level. However, the year
effect indicates recent decline in the participation rate of women at the university level in Egypt. This
result is corroborated in other studies as well. Participation rates among educated females in Egypt in
the 2000’s fell. This was attributed to declining public employment opportunities of the educated
women when the guaranteed employment scheme has ceased in the 1990’s. This caused educated
women to drop out of the labor force rather than take up informal employment which is not socially
acceptable (Assaad and E-Hamidi, 2009; Assaad, 2014; Tansel et al., 2020). Assaad et al. (2020) make
the similar conclusions as the reasons for the stagnant FLFPs in Algeria, Egypt, Jordan and Tunisia in
the face of substantial increase in educational attainments.
5.2.3. Cohort Effects
Figure 8 shows the cohort effects in the predicted participation rates by rural/urban residence and
marital status. Figure 9 shows the same by educational attainment. Figure 8 indicates that the
participation has remained stable over generations in Jordan, Tunisia, and Egypt with the exception of
a small decline in Palestine among the new generations. In the urban areas the participation rates are
stable over generations except in Tunisia where the participation rates increase, however in the rural
areas the participation rates decline significantly. Considering marital status, the results show that in
Egypt participation rate decreases for the never married women across cohorts but, increases for the
ever married women. The participation rate is low for the younger generations of never married and
higher for younger generations of ever married women in the case of Egypt. Considering the education
levels we find that the participation rate has remained stable over generations for illiterates and for
those with education below secondary and secondary level in all countries. However, for the university
level, in Jordan the participation rate is lower for the younger generations compared to the older ones
indicating a significant decline across cohorts. There is a strong upward trend in the cohort profile at
the university level in Palestine with the maximum entropy estimator. We also observe slight decline
in Algeria whereas it remains more or less constant across cohorts in the other countries.
5.2.4.U-Shaped Hypothesis and Added Worker Effect
We have not been able to observe the added worker effect which is women increasing labor supply
in the face of economic crisis or economic downturn in any one of the countries we study over the
time period we considered.
The U-shaped hypothesis is validated by in many countriesusing time-series, cross-country or panel
data. There are several studies that consider the validity of the U-shaped FLFP rate in the MENA
region. One possible explanation for the low FLFP rates in the MENA region compared to its level of
economic development is that most MENA countries are at the bottom of the turning point from

15
declining to rising FLFP rates of the U-shape (Tansel, 2001; Verme, 2014; Chapman 2015).5This
phenomenon, is referred to as ‘‘gender equality paradox” (Assaad et al. (2020); World Bank, 2013)
and Verme (2014) terms this as “anomaly of the MENA region”. The MENA region experienced
sustained growth recently with substantial gains in female education and drop in fertility all of which
are conducive to an increase in the FLFP rates but, did not materialize in the MENA region. Tsani et
al. (2013) consider South Mediterrnean countries and examine impact of women’s participation on
GDP. They find that removing region specific barriers has a large impact on FLFP rates which in turn
has a large impact on GDP growth. Verme (2014) has conducted an extensive study of the U-shape
hypothesis in the MENA region for the period 1990-2010. Verme suggests that high ratio of
female/male unemployment rate in the MENA than elsewhere in the world suggests that low labor
demand is behind the low FLFP rates. In the experience of most developed countries service sector has
attracted women to work. The increase in the manufacturing and service sector output was one of the
factors that gave rise to the increasing portion of the U-shape. He first finds an U-shape with non-
parametric approach for the MENA region which turns into an inverted U-shape with the parametric
approach. His individual country investigations indicate a U-shape for Algeria and Egypt but,
insignificant U-shape for Jordan and Tunisia and inverted U-shape for some other countries.Verme
concludes that lack of support for the U-shape hypothesis in the MENA countries is due to two factors.
One is the lack of expansion of manufacturing and service sectors and the other is the exit of women
from labor market upon marriage due to social norms. We have also investigated U-shape hypothesis
for the countries we considered using time series data for the period 1990-2018. We found a U-shape
for Algeria, Egypt, Jordan and Palestine but insignificant result for Tunisia. These results are not
reported but are available upon request. Another recent studyon the U-shape hypothesis in the MENA
is by Chapman (2015). She uses a panel data on 20 MENA countries over the period 1990-2012 with
OLS and fixed effect estimation. She finds a U-shaped relationship between female participation rates
and economic growth in the MENA region however concludes that the region is in a transition towards
the bottom of U-shaped curve.
In our discussion of the year effects (Section 5.2.2) we noted that the year effects results of the APC
method we employed show an increase in the female participation rates over time in Egypt and
Palestine but stagnant rates in Jordan and Tunisia. These results indicate that Egypt and Palestine may
be on the move to the upward portion of the U-shape while Jordan and Tunisia could be at the bottom
of the U-shape.
5Tunali et al. (2019) find in Turkey that since 2016-2018 FLFP rate has moved to the increasing portion of the U-shape curve.

16
Figure 3: Decomposition Results: Aggregate Female Participation Behavior by Country
Hanoch-Honig/Deaton-Paxson normalization Maximum entropy approach
A) Age Effects B) Year Effects C) Cohort Effects A) Age Effects B) Year Effects C) Cohort Effects
Alg
eria
Eg
yp
t
Jo
rd
an
Pale
stin
e
Tu
nis
ia

17
Figure 4: Decomposition Results by Country: Age Effects by Rural/Urban Residence and Marital Status
Hanoch-Honig/Deaton-Paxson normalization Maximum entropy approach
Urban Residence Rural Residence Never Married- Ever Married Urban Residence Rural Residence Never Married Ever Married
Alg
eria
Eg
yp
t
Jo
rd
an
Pale
stin
e
Tu
nis
ia

18
Figure 5: Decomposition Results by Country: Age Effects by Educational Attainment
Hanoch-Honig/Deaton-Paxson normalization Maximum entropy approach
Illiterate Below Secondary Secondary University Illiterate Below Secondar] Secondary University
Alg
eria
Eg
yp
t
Jo
rd
an
Pale
stin
e
Tu
nis
ia

19
Figure 6: Decomposition Results by Country: Year Effects by Rural/Urban Residence and Marital Status
Hanoch-Honig/Deaton-Paxson normalization Maximum entropy approach
Urban Residence Rural Residence Never Married Ever Married Urban Residence Rural Residence Never Married Ever Married
Alg
eria
Eg
yp
t
Jo
rd
an
Pale
stin
e
Tu
nis
ia

20
Figure 7: Decomposition Results by Country: Year Effects by Educational Attainment
Hanoch-Honig/Deaton-Paxson normalization Maximum entropy approach
Illiterate Below Secondary Secondary University Illiterate Below Secondary Secondary University
Alg
eria
Eg
yp
t
Jo
rd
an
Pale
stin
e
Tu
nis
ia

21
Figure 8: Decomposition Results by Country: Cohort Effects by Rural/Urban Residence and Marital Status
Hanoch-Honig/Deaton-Paxson normalization Maximum entropy approach
Urban Residence Rural Residence Never Married Ever Married Urban Residence Rural Never Married Ever Married
Alg
eria
Eg
yp
t
Jo
rd
an
Pale
stin
e
Tu
nis
ia

22
Figure 9: Decomposition Results by Country: Cohort Effects by Educational Attainment
Hanoch-Honig/Deaton-Paxson normalization Maximum entropy approach
Illiterate Below Secondary Secondary University Illiterate Below Secondary Secondary University
Alg
eria
Eg
yp
t
Jo
rd
an
Pale
stin
e
Tu
nis
ia

23
6. Conclusion
This is the first study that explores various characteristics of FLFP rates using synthetic panel data
using the APC method for five MENA countries namely, Algeria, Egypt, Jordan, Palestine and
Tunisia. Previous researchers used time series or cross-section data to study the FLFP rates in MENA.
Our motivation comes from the fact that FLFP rates in MENA region is one of the lowest in the world.
This is not expected considering the recent developments in economic growth, educational attainment
and fertility behavior of women. Therefore, this is commonly referred to as “MENA Paradox” or
“MENA Anomaly”.We employed two different approaches to overcome the lack of identification
problem in the APC method and obtained mostly similar results between the two approaches. We
have split the sample by rural/urban residence, marital status and educational attainment in order to
observe peculiarities in these subsamples.
The findings of this paper about FLFP are useful in several respects. They are particularly important
for understanding the constraints and drivers of low FLFP rates in the MENA region, and in designing
policies to increase women’s participation. This paper helps to develop stylized facts about the labor
markets of the MENA countries considered. A comparative policy perspective across countries is
particularly important for the policy makers to develop policies to increase female participation in the
economy which is of utmost importance for the MENA to realize its developmental potentials.
With regards to the age effects, we observe the following results. 1) The profiles have a standard
inverted-U shape, with low participation rates for the young and the old. The young enter the labor
force increasingly at later ages, as expected because of increasing proportion of enrollments in
education. 2) Participation is high and stable until around age 50 when women start retiring with some
differences among the countries. The time for stability of the participation rate is more important in
Egypt, Palestine and Algeria. However, in Jordan and especially Tunisia the participation rate declines
before age 50. 3) The participation rate is higher for never married than for the ever married women
for all categories of age. 4) For women with level of education below secondary the participation rate
is relatively stagnant except in Palestine and Tunisia where the participation rates decline for the
elderly. For the secondary and university levels of education, we observe the inverted-U shape in
Palestine and Tunisia. However, in Algeria, Egypt and Jordan the participation rates decline over the
age groups. 5) In the rural areas women exit the labor force at the advanced ages earlier than in urban
areas. This is contrary to what observed in the literature. In Egypt in urban areas the age profiles
display a slight M-shape which suggests that some women are temporarily exit the labor force for
childbearing purposes. The policy implication of this is to implement child care support in Egypt.
Further implementing child care support could increase FLFP rates in the other countries also.
Providing safe work environments for women in Egypt is discussed in the literature. Increasing access
to child care, increasing availability of part time jobs and job flexibilization, parental leaves could be

24
considered to increase women’s participation. Turkey introduced employment subsidies for women in
2009 which are found to produce temporary effects (Balkan et al., 2014).
With regards to the time effects including cyclical components we find the following results. 1) In
Algeria, in all decompositions such as by area of residence, marital status and level of education, we
observe important fluctuations in the participation rates. This may be due to the biannual labor force
surveys we used for Algeria. They may not capture women’s work well especially in rural areas. 2) In
Egypt and Palestine, the participation rates increase over time. In Jordan and Tunisia, the participation
rates are stagnant over the period of observation. 3) The participation rates increase over time in the
urban areas in all countries with less fluctuation compared to the rural areas. 4) For university level
education the participation rate increases over time only in Jordan while it remains stagnant in all other
countries.With regard to the time effects we can conclude that Algeria Jordan and Tunisia are at the
bottom of the U-shape while Egypt and Palestine may already passed into the increasing phase of the
U-shape of the FLFP rate over time. Possible reasons for these observations are discussed.
With regards to the cohort effects we make the following observations: 1) the participation has
remained stable over generations in Jordan, Tunisia, and Egypt with a slight decline in Palestine
among the new generations. 2) The participation rates are stable across generations in urban areas
however, it declines significantly in all countries. 3) The participation rate decreases for the never
married women in all countries. While it increases for the ever married women in all countries. The
latter observation suggests a weakening of the social norms hypothesis in the MENA region, because
we expect that the social norms hypothesis is more relevant for the ever married than for the never
married women.6 4) The participation has remained stable across generations for all education levels
less than university in all countries with some exceptions. There is a slight increase in the participation
rate across cohorts for the below secondary in Tunisia which suggest weakening of the social norms
hypothesis in this country as we expect the social norms hypothesis to be relevant for the low educated
women. For the secondary educated women there are slight decreases across cohorts in Algeria and
Egypt. However, at the university level, in Jordan the participation rate declines across generations
with university educated younger cohorts of women participating less compared to the older cohorts.
Policy makers in these countries should pay attention to the decline at these education levels in these
countries. Since educational attainments are expected to increase in the MENA countries the
participation rates will increase with increasing educational attainments.
The methodology adopted in this paper illustrates the advantages of performing a cohort analysis to
disentangle long-run trends in labor force participation of women. The conclusions could be applicable
to the other MENA countries as well as other developing countries.
6Tunaliet al. (2019) propose that social norms impede participation of low educated women. However, for Turkey they find that participation of low educated women has increased recently indicating wearing off of the social norms hypothesis.

25
References
Abrahamsen, C.K. (2015) “Labor Supply over the life Cycles: An Age –Period-Cohort Analysis,” Master of
Philosophy Thesis in Economics, Department of Economics, University of Oslo. Al-Qudsi S. (1998) “Labor Participation of Arab Women: Estimates of the Fertility to Labor Supply Link,”
Journal of Applied Economics, Vol. 30: 931-941.
Antman, F. and D. McKenzie (2007) “Poverty Traps and Nonlinear Income Dynamics with Measurement Error
and Individual heterogeneity,” Journal of Development Studies, Vol. 43, No 6:1057-1083.
Assaad, R. (2014) “Making Sense of Arab Labor Markets: The Enduring Legacy of Dualism,” IZA Journal of
Labor & Development, 3(1), 6. Assaad, R., and El-Hamidi, F. (2009) « Women in the Egyptian Labor Market: An Analysis of Developments,
1988-2006, » In: R. Assaad (ed.) The Egyptian Labor MarketRevisited,Cairo, Egypt: The American University in CairoPress (pp. 117–156).
Assaad, R., C. Krafft and I. Selwaness (2017) “The Impact of Early Marriage on Women's Employment in the
Middle East and North Africa,” Cairo, Egypt: Economic Research Forum (ERF)Working Paper No.1086. Assaad, R., R. Hendy, M. Lassassi and S.Yassin (2020) “Explaining the MENA Paradox: Rising Educational
Attainment, Yet Stagnant Female Labor Force Participation, Demographic Research - Volume 43-2020. Balkan, B., Baskaya, Y.S. and Tümen, S. (2014) “Evaluating the Impact of the Post-2008 EmploymentSubsidy
Program in Turkey,” Working Paper no. 1414, Ankara : Research and Monetary Policy Department, Central
Bank of the Republic of Turkey.
Baudelot, C., Gollac, M. (1995) “Le salaire du trentenaire : question d’âge ou de génération, ” Économie et
Statistique, n˚ 304-305, pp. 17-36.
Blundell, R., A. Duncan and C. Meghir (1998) “Estimating Labor Supply Responses Using Tax reforms,” Econometrica, Vol 66, No 4: 827-861.
Boserup, E. (1970) Women’s Role in Economic Development, New York: St. Martin’s Press: 283.
Bourdallé G., Cases C. (1996) “Les taux d’activité des 25-60 ans : les effets de l’âge et de la génération,
Économie et Statistiques, no 300, pp. 83-93.
Browning, M., I Crawford and M. Knoef (2012) “The Age-Period-Cohort Problem: Set Identification and Point
Identification,” Institute for Fiscal Studies, CEMMAP Working Paper, CWP02/12.
Cagatay, N. and S. Ozler (1995) “Feminization of the Labor Force: The Effects of Long Term Development and
Structural Adjustment,” World Development, Vol 23, No 11:1883-1894.
Chapman, K. A. (2015) "Economic Development and Female Labor Force participation in the Middle East and
North Africa; a Test of the U-Shape Hypothesis," Gettysburg Economic Review Vol.8, No 1: 3- 15.
Clark, R., Ramsbey, T. W., Adler, E. S., (1991). Culture, gender, and labor force participation: A crossnational study. Gender and Society 5 (1), 47-66.
Conrad, k. (2004). "Probability distributions and maximum entropy", Entropy, 6(452):10, 2004.
Crespo S, (2007) "Diversité des formes de transition travail-retraite dans une cohorte de Canadiens âgés de 50 à
64 ans", Cahiers québécois de démographie, vol. 36, n° 1, p. 49-83.
Dasgupta, P. and B. Goldar (2005) “Female Labor Supply in Rural India: An Econometric Analysis,” Enclave,
India: Institute of Economic Growth, Delhi University.
Deaton, A. and C. Paxson (1994) “Saving, Growth and Aging in Taiwan,” in: D. Wise (ed.) Studies in the
Economics of Aging, Chicago: NBER and University of Chicago Press: 331–357.
Deborah S, (2001) “Démographie et marché du travail,” statistique Canada N°75-001.
Devereux, P. (2007) “Small-Sample Bias in Synthetic Cohort Models of Labor Supply,” Journal of Applied
Econometrics, Vol 22, No 4:839-848.
Diwan, I. and I. Vartanova (2017) “The Effect of Patriarchal Culture on Women’s Labor Force Participation ,” Cairi, Egypt: Economic Research Forum (ERF) Working Paper No. 1110.
Duval-Hernández, R. and P.O. Romano (2009) “A Cohort Analysis of Labor Participation in Mexico, 1987-
2009,” Institute of Labor Economics (IZA) Discussion Paper No. 4371.
Goldin, C. (1995) “The U-Shaped Female Labor Force Function in Economic Development and Economic
History,” in: T.P. Schultz (ed.) Investment in Women’s Human Capital and Economic Development,
Chicago: University of Chicago Press: 61-90.
Haghighat-Sordellini E, (2009) “Determinants of Female Labor Force Participation: A Focus on Muslim
Countries,” International Review of Sociology, Vol. 19, No 1: 103-125.
Hanoch, G. and M. Honig (1985) “’True’ Age profiles of Earnings: Adjusting for Censoring and forPeriod and
Cohort Effects,” Review of Economics and Statistics, Vol. 67, No 3: 383-394.
Herault, N. and G.R.J.Kalb (2020) « Understanding the Rising Trend in Female Labour Force Participation, »Life Course Centre Working Paper No. 2020-12, Available at
SSRN: https://ssrn.com/abstract=3636580.

26
Hendy, R. (2015) « Women’s Participation in the Egyptian Labor Market 1998-2012, » in R. Assaad and C.
Krafft (eds.), The Egyptian Labor Market in an Era of Revolution, Oxford: Oxford UniversityPress (pp.
147–161).
Ingelhart, R., Norris P. (2003) Gender Equality and Cultural Change Around the World, Cambridge University
Press, 14 avr. 2003 - 226 pages. Karto C. A. (2015). Labor Supply over the Life Cycle - An Age-Period-Cohort analysis, Universiteteti
Oslo,(pp.25-26). Mammen, K. and M. Paxson (2000) “Women’s Work and Economic Development,” Journal of Economic
Perspectives, Vol. 14, No 4: 141-164.
Pencavel, J. (1998) “The Market Work Behavior and Wages for Women, 1975-1994,” Journal of Human
Resources, Vol. 33, No 4: 771-804.
Psacharopoulos, G. and Z. Tzannatos (1989) “Female Labor Force Participation: An International Perspective,”
The World Bank Research Observer, Vol. 4, No 2: 187-201.
Tansel, A. (1994) “Wage Employment and Earnings and Returns to Schooling for Men and Women in Turkey,”
Economics of Education Review, 13: 305-320.
Tansel, A. (2001) “Economic Development and Female Labor Force Participation in Turkey: Time Series
Evidence and Cross Province Estimates,” Cairo, Egypt: Economic Research Forum (ERF) Working Paper
No: 200124.
Tansel, Aysit and Zeynel Abidin Özdemir (2018) "Unemployment Invariance Hypothesis, Added and Discouraged Worker Effects in Canada," International Journal of Manpower, Vol. 39, No 7: 929-936.
Tansel, A., H. I. Keskin and Z. A. Özdemir (2020)“ Public-Private Sector Wage Gap by Gender in Egypt:
Evidence from Quantile Regression on Panel Data, 1998–2018, » World Development, Vol. 135 :
November, 2020.
Tsani S., L.Paroussos, C. Fragiadakis, I Charalambidis and P. Capros (2013) " Female Labor Force Participation
and Economic Growth in the South Mediterranean Countries,'" Economic Letters, Vol. 20, No2 : 323-328.
Tunali, I., M.G. Kirdar and M. Dayioglu (2019) “Female Labor Force Participation in Turkey: A Synthetic
Cohort (Panel) Analysis, 1988-2013,” Cairo, Egypt: Economic Research Forum (ERF) Working Paper No.
1378.
Verme, P. (2014) " Economic Development and Female Labor Participation in the Middle East and North Africa:
A test of the U-Shape Hypothesis," Policy Research Working Paper No, 6927. The World Bank. World Bank (2013). Opening Doors Gender Equality and Development. Washington, DC: Middle East and
NorthAfricaRegion. The World Bank.
World Bank. World Bank Open Data, https://data.worldbank.org.
World Economic Forum (2018). The global gender gap report 2018. Geneva: World Economic Forum. Yang, Y. (2010) “Cohort Analysis in Social Research: What’s New?” Presentation at the Upper Midwest
Workshop on Population Studies, University of Minnesota.

27
APPENDIX TABLES AND FIGURES
Table A1: Changes in FLFP for a given cohort by country
Cohorts Algeria Egypt Jordan Palestine Tunisia
1942 – 1945 6 14 5.8 8.7 6.1
1958 – 1961 16.5 41.6 22.6 18 28.8
1970 – 1973 20.3 37.3 32.9 19.9 41
1978 – 1981 19.8 34.1 29.5 20.4 41.7
Source: Computed by the authors.

28
Figure A1: Structure of the Labor Market, Women (ages 15-64)
Never Married Ever Married Never Married Ever Married
Eg
yp
t
Tu
nis
ia
Alg
eria
Jo
rd
an
Pale
stin
e

29
Figure A2: Employment Share by Type of Employment, Women (ages 15-64)
Never Married Ever Married Never Married Ever Married
Eg
yp
t
Tu
nis
ia
Alg
eria
Jo
rd
an
Pale
stin
e

30
Figure A3: Female Participation Rates by Country & Urban vs Rural – Cohort
Rural Urban Rural Urban
Alg
eria
02
04
06
08
01
00
15 20 25 30 35 40 45 50 55 60 65age
act11 1936-1938
1939-1942 1943-1946
1947-1950 1951-1954
1955-1958 1959-1962
1963-1966 1967-1970
1971-1974 1975-1978
1979-1982 1983-1986
1987-1990 1991-1994
02
04
06
08
01
00
15 20 25 30 35 40 45 50 55 60 65age
act11 1936-1938
1939-1942 1943-1946
1947-1950 1951-1954
1955-1958 1959-1962
1963-1966 1967-1970
1971-1974 1975-1978
1979-1982 1983-1986
1987-1990 1991-1994
Eg
yp
t 02
04
06
08
01
00
15 20 25 30 35 40 45 50 55 60 65age
act11 1936-1937
1938-1941 1942-1945
1946-1949 1950-1953
1954-1957 1958-1961
1962-1965 1966-1969
1970-1973 1974-1977
1978-1981 1982-1985
1986-1989 1990-1993
02
04
06
08
01
00
15 20 25 30 35 40 45 50 55 60 65age
act11 1936-1937
1938-1941 1942-1945
1946-1949 1950-1953
1954-1957 1958-1961
1962-1965 1966-1969
1970-1973 1974-1977
1978-1981 1982-1985
1986-1989 1990-1993
Jo
rd
an
02
04
06
08
01
00
15 20 25 30 35 40 45 50 55 60 65age
act11 1936-1937
1938-1941 1942-1945
1946-1949 1950-1953
1954-1957 1958-1961
1962-1965 1966-1969
1970-1973 1974-1977
1978-1981 1982-1985
1986-1989 1990-1993
02
04
06
08
01
00
15 20 25 30 35 40 45 50 55 60 65age
act11 1936-1937
1938-1941 1942-1945
1946-1949 1950-1953
1954-1957 1958-1961
1962-1965 1966-1969
1970-1973 1974-1977
1978-1981 1982-1985
1986-1989 1990-1993
Pa
lest
ine
02
04
06
08
01
00
15 20 25 30 35 40 45 50 55 60 65age
act11 1936-1937 1938-1941
1942-1945 1946-1949 1950-1953
1954-1957 1958-1961 1962-1965
1966-1969 1970-1973 1974-1977
1978-1981 1982-1985 1986-1989
1990-1993
Tu
nis
ia
02
04
06
08
01
00
15 20 25 30 35 40 45 50 55 60 65age
act11 1941-1942
1943-1946 1947-1950
1951-1954 1955-1958
1959-1962 1963-1966
1967-1970 1971-1974
1975-1978 1979-1982
1983-1986 1987-1990
1991-1994 1995-1998
02
04
06
08
01
00
15 20 25 30 35 40 45 50 55 60 65age
act11 1941-1942
1943-1946 1947-1950
1951-1954 1955-1958
1959-1962 1963-1966
1967-1970 1971-1974
1975-1978 1979-1982
1983-1986 1987-1990
1991-1994 1995-1998
Source: Computed by the authors.

31
Figure A4: Female Participation Rates by Marital Status & Country
Never Married Ever Married Never Married Ever Married
Alg
eria
02
04
06
08
01
00
15 20 25 30 35 40 45 50 55 60 65age
act11 1936-1938
1939-1942 1943-1946
1947-1950 1951-1954
1955-1958 1959-1962
1963-1966 1967-1970
1971-1974 1975-1978
1979-1982 1983-1986
1987-1990 1991-1994
02
04
06
08
01
00
15 20 25 30 35 40 45 50 55 60 65age
act11 1936-1938
1939-1942 1943-1946
1947-1950 1951-1954
1955-1958 1959-1962
1963-1966 1967-1970
1971-1974 1975-1978
1979-1982 1983-1986
1987-1990 1991-1994
Jord
an
02
04
06
08
01
00
15 20 25 30 35 40 45 50 55 60 65age
act11 1936-1937
1938-1941 1942-1945
1946-1949 1950-1953
1954-1957 1958-1961
1962-1965 1966-1969
1970-1973 1974-1977
1978-1981 1982-1985
1986-1989 1990-1993
02
04
06
08
01
00
15 20 25 30 35 40 45 50 55 60 65age
act11 1936-1937
1938-1941 1942-1945
1946-1949 1950-1953
1954-1957 1958-1961
1962-1965 1966-1969
1970-1973 1974-1977
1978-1981 1982-1985
1986-1989 1990-1993
Egyp
te 0
2040
6080
100
15 20 25 30 35 40 45 50 55 60 65age
act11 1936-1937
1938-1941 1942-1945
1946-1949 1950-1953
1954-1957 1958-1961
1962-1965 1966-1969
1970-1973 1974-1977
1978-1981 1982-1985
1986-1989 1990-1993
020
4060
8010
015 20 25 30 35 40 45 50 55 60 65
age
act11 1936-1937
1938-1941 1942-1945
1946-1949 1950-1953
1954-1957 1958-1961
1962-1965 1966-1969
1970-1973 1974-1977
1978-1981 1982-1985
1986-1989 1990-1993
Pa
lest
ine
02
04
06
08
01
00
15 20 25 30 35 40 45 50 55 60 65age
act11 1936-1937
1938-1941 1942-1945
1946-1949 1950-1953
1954-1957 1958-1961
1962-1965 1966-1969
1970-1973 1974-1977
1978-1981 1982-1985
1986-1989 1990-1993
02
04
06
08
01
00
15 20 25 30 35 40 45 50 55 60 65age
act11 1936-1937
1938-1941 1942-1945
1946-1949 1950-1953
1954-1957 1958-1961
1962-1965 1966-1969
1970-1973 1974-1977
1978-1981 1982-1985
1986-1989 1990-1993
Tu
nis
ia
020
4060
8010
0
15 20 25 30 35 40 45 50 55 60 65age
act11 1941-1942
1943-1946 1947-1950
1951-1954 1955-1958
1959-1962 1963-1966
1967-1970 1971-1974
1975-1978 1979-1982
1983-1986 1987-1990
1991-1994 1995-1998
020
4060
8010
0
15 20 25 30 35 40 45 50 55 60 65age
act11 1941-1942
1943-1946 1947-1950
1951-1954 1955-1958
1959-1962 1963-1966
1967-1970 1971-1974
1975-1978 1979-1982
1983-1986 1987-1990
1991-1994 1995-1998
Source: Computed by the authors.

32
Figure A5: Female Participation Rates by Country & Education Level - Cohort
Illiterate Below Secondary Secondary University
Alg
eria
02
04
06
08
01
00
15 20 25 30 35 40 45 50 55 60 65age
act11 1936-1938
1939-1942 1943-1946
1947-1950 1951-1954
1955-1958 1959-1962
1963-1966 1967-1970
1971-1974 1975-1978
1979-1982 1983-1986
1987-1990 1991-1994
02
04
06
08
01
00
15 20 25 30 35 40 45 50 55 60 65age
act11 1936-1938
1939-1942 1943-1946
1947-1950 1951-1954
1955-1958 1959-1962
1963-1966 1967-1970
1971-1974 1975-1978
1979-1982 1983-1986
1987-1990 1991-1994
02
04
06
08
01
00
15 20 25 30 35 40 45 50 55 60 65age
act11 1936-1938
1939-1942 1943-1946
1947-1950 1951-1954
1955-1958 1959-1962
1963-1966 1967-1970
1971-1974 1975-1978
1979-1982 1983-1986
1987-1990 1991-1994
02
04
06
08
01
00
15 20 25 30 35 40 45 50 55 60 65age
act11 1936-1938
1939-1942 1943-1946
1947-1950 1951-1954
1955-1958 1959-1962
1963-1966 1967-1970
1971-1974 1975-1978
1979-1982 1983-1986
1987-1990 1991-1994
Eg
yp
t
02
04
06
08
01
00
15 20 25 30 35 40 45 50 55 60 65age
act11 1936-1937
1938-1941 1942-1945
1946-1949 1950-1953
1954-1957 1958-1961
1962-1965 1966-1969
1970-1973 1974-1977
1978-1981 1982-1985
1986-1989 1990-1993
02
04
06
08
01
00
15 20 25 30 35 40 45 50 55 60 65age
act11 1936-1937
1938-1941 1942-1945
1946-1949 1950-1953
1954-1957 1958-1961
1962-1965 1966-1969
1970-1973 1974-1977
1978-1981 1982-1985
1986-1989 1990-1993
0
20
40
60
80
100
15 20 25 30 35 40 45 50 55 60 65age
act11 1936-1937
1938-1941 1942-1945
1946-1949 1950-1953
1954-1957 1958-1961
1962-1965 1966-1969
1970-1973 1974-1977
1978-1981 1982-1985
1986-1989 1990-1993
02
04
06
08
01
00
15 20 25 30 35 40 45 50 55 60 65age
act11 1936-1937
1938-1941 1942-1945
1946-1949 1950-1953
1954-1957 1958-1961
1962-1965 1966-1969
1970-1973 1974-1977
1978-1981 1982-1985
1986-1989 1990-1993
Jord
an
02
04
06
08
01
00
15 20 25 30 35 40 45 50 55 60 65age
act11 1936-1937
1938-1941 1942-1945
1946-1949 1950-1953
1954-1957 1958-1961
1962-1965 1966-1969
1970-1973 1974-1977
1978-1981 1982-1985
1986-1989 1990-1993
02
04
06
08
01
00
15 20 25 30 35 40 45 50 55 60 65age
act11 1936-1937
1938-1941 1942-1945
1946-1949 1950-1953
1954-1957 1958-1961
1962-1965 1966-1969
1970-1973 1974-1977
1978-1981 1982-1985
1986-1989 1990-1993
02
04
06
08
01
00
15 20 25 30 35 40 45 50 55 60 65age
act11 1936-1937
1938-1941 1942-1945
1946-1949 1950-1953
1954-1957 1958-1961
1962-1965 1966-1969
1970-1973 1974-1977
1978-1981 1982-1985
1986-1989 1990-1993
02
04
06
08
01
00
15 20 25 30 35 40 45 50 55 60 65age
act11 1936-1937
1938-1941 1942-1945
1946-1949 1950-1953
1954-1957 1958-1961
1962-1965 1966-1969
1970-1973 1974-1977
1978-1981 1982-1985
1986-1989 1990-1993
Pale
stin
e
02
04
06
08
01
00
15 20 25 30 35 40 45 50 55 60 65age
act11 1936-1937
1938-1941 1942-1945
1946-1949 1950-1953
1954-1957 1958-1961
1962-1965 1966-1969
1970-1973 1974-1977
1978-1981 1982-1985
1986-1989 1990-1993
02
04
06
08
01
00
15 20 25 30 35 40 45 50 55 60 65age
act11 1936-1937
1938-1941 1942-1945
1946-1949 1950-1953
1954-1957 1958-1961
1962-1965 1966-1969
1970-1973 1974-1977
1978-1981 1982-1985
1986-1989 1990-1993
02
04
06
08
01
00
15 20 25 30 35 40 45 50 55 60 65age
act11 1936-1937
1938-1941 1942-1945
1946-1949 1950-1953
1954-1957 1958-1961
1962-1965 1966-1969
1970-1973 1974-1977
1978-1981 1982-1985
1986-1989 1990-1993
02
04
06
08
01
00
15 20 25 30 35 40 45 50 55 60 65age
act11 1936-1937
1938-1941 1942-1945
1946-1949 1950-1953
1954-1957 1958-1961
1962-1965 1966-1969
1970-1973 1974-1977
1978-1981 1982-1985
1986-1989 1990-1993
Tu
nis
ia
02
04
06
08
01
00
15 20 25 30 35 40 45 50 55 60 65age
act11 1941-1942
1943-1946 1947-1950
1951-1954 1955-1958
1959-1962 1963-1966
1967-1970 1971-1974
1975-1978 1979-1982
1983-1986 1987-1990
1991-1994 1995-1998
02
04
06
08
01
00
15 20 25 30 35 40 45 50 55 60 65age
act11 1941-1942
1943-1946 1947-1950
1951-1954 1955-1958
1959-1962 1963-1966
1967-1970 1971-1974
1975-1978 1979-1982
1983-1986 1987-1990
1991-1994 1995-1998
02
04
06
08
01
00
15 20 25 30 35 40 45 50 55 60 65age
act11 1941-1942
1943-1946 1947-1950
1951-1954 1955-1958
1959-1962 1963-1966
1967-1970 1971-1974
1975-1978 1979-1982
1983-1986 1987-1990
1991-1994 1995-1998
02
04
06
08
01
00
15 20 25 30 35 40 45 50 55 60 65age
act11 1941-1942
1943-1946 1947-1950
1951-1954 1955-1958
1959-1962 1963-1966
1967-1970 1971-1974
1975-1978 1979-1982
1983-1986 1987-1990
1991-1994 1995-1998
Source: Computed by the authors.