Interim financial statements, nine months 2006/07 - Coloplast
23
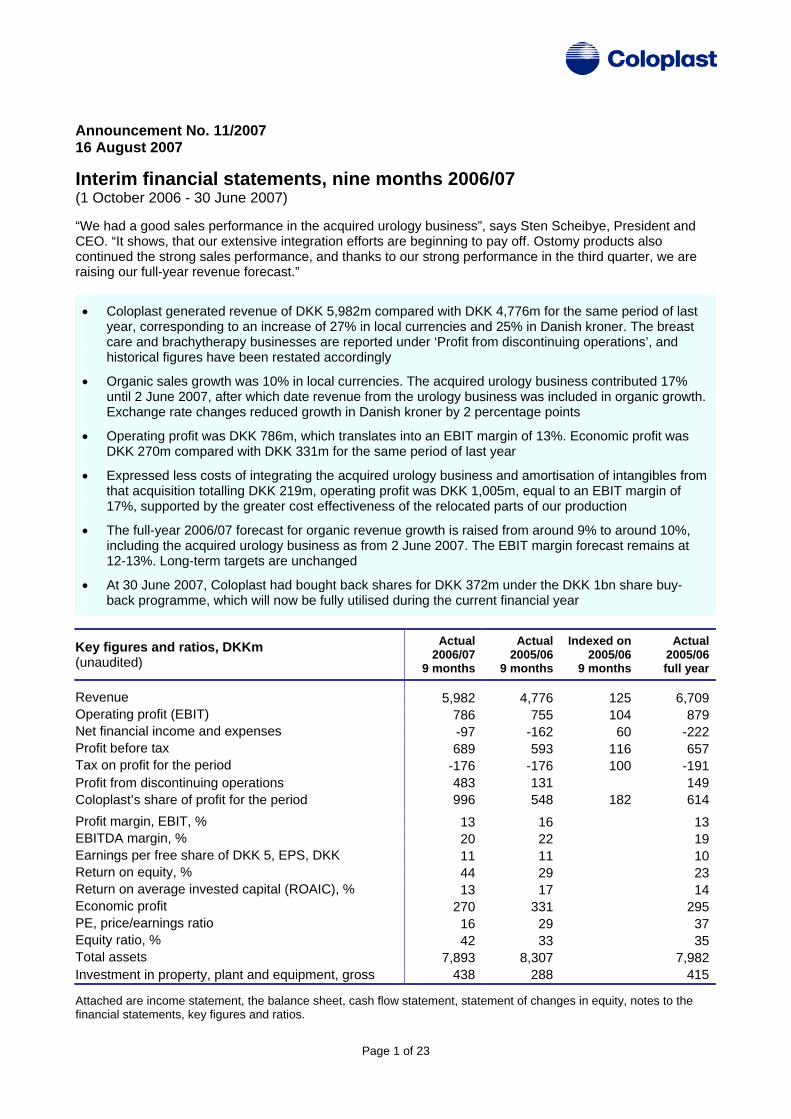
Page 1 of 23 Announcement No. 11/2007 16 August 2007 Interim financial statements, nine months 2006/07 (1 October 2006 - 30 June 2007) “We had a good sales performance in the acquired urology business”, says Sten Scheibye, President and CEO. “It shows, that our extensive integration efforts are beginning to pay off. Ostomy products also continued the strong sales performance, and thanks to our strong performance in the third quarter, we are raising our full-year revenue forecast.” • Coloplast generated revenue of DKK 5,982m compared with DKK 4,776m for the same period of last year, corresponding to an increase of 27% in local currencies and 25% in Danish kroner. The breast care and brachytherapy businesses are reported under ‘Profit from discontinuing operations’, and historical figures have been restated accordingly • Organic sales growth was 10% in local currencies. The acquired urology business contributed 17% until 2 June 2007, after which date revenue from the urology business was included in organic growth. Exchange rate changes reduced growth in Danish kroner by 2 percentage points • Operating profit was DKK 786m, which translates into an EBIT margin of 13%. Economic profit was DKK 270m compared with DKK 331m for the same period of last year • Expressed less costs of integrating the acquired urology business and amortisation of intangibles from that acquisition totalling DKK 219m, operating profit was DKK 1,005m, equal to an EBIT margin of 17%, supported by the greater cost effectiveness of the relocated parts of our production • The full-year 2006/07 forecast for organic revenue growth is raised from around 9% to around 10%, including the acquired urology business as from 2 June 2007. The EBIT margin forecast remains at 12-13%. Long-term targets are unchanged • At 30 June 2007, Coloplast had bought back shares for DKK 372m under the DKK 1bn share buy- back programme, which will now be fully utilised during the current financial year Key figures and ratios, DKKm (unaudited) Actual 2006/07 9 months Actual 2005/06 9 months Indexed on 2005/06 9 months Actual 2005/06 full year Revenue 5,982 4,776 125 6,709 Operating profit (EBIT) 786 755 104 879 Net financial income and expenses -97 -162 60 -222 Profit before tax 689 593 116 657 Tax on profit for the period -176 -176 100 -191 Profit from discontinuing operations 483 131 149 Coloplast’s share of profit for the period 996 548 182 614 Profit margin, EBIT, % 13 16 13 EBITDA margin, % 20 22 19 Earnings per free share of DKK 5, EPS, DKK 11 11 10 Return on equity, % 44 29 23 Return on average invested capital (ROAIC), % 13 17 14 Economic profit 270 331 295 PE, price/earnings ratio 16 29 37 Equity ratio, % 42 33 35 Total assets 7,893 8,307 7,982 Investment in property, plant and equipment, gross 438 288 415 Attached are income statement, the balance sheet, cash flow statement, statement of changes in equity, notes to the financial statements, key figures and ratios.
-
Upload
khangminh22 -
Category
Documents
-
view
0 -
download
0
Transcript of Interim financial statements, nine months 2006/07 - Coloplast
Page 1 of 23
Announcement No. 11/2007 16 August 2007
Interim financial statements, nine months 2006/07 (1 October 2006 - 30 June 2007) “We had a good sales performance in the acquired urology business”, says Sten Scheibye, President and CEO. “It shows, that our extensive integration efforts are beginning to pay off. Ostomy products also continued the strong sales performance, and thanks to our strong performance in the third quarter, we are raising our full-year revenue forecast.”
• Coloplast generated revenue of DKK 5,982m compared with DKK 4,776m for the same period of last year, corresponding to an increase of 27% in local currencies and 25% in Danish kroner. The breast care and brachytherapy businesses are reported under ‘Profit from discontinuing operations’, and historical figures have been restated accordingly
• Organic sales growth was 10% in local currencies. The acquired urology business contributed 17% until 2 June 2007, after which date revenue from the urology business was included in organic growth. Exchange rate changes reduced growth in Danish kroner by 2 percentage points
• Operating profit was DKK 786m, which translates into an EBIT margin of 13%. Economic profit was DKK 270m compared with DKK 331m for the same period of last year
• Expressed less costs of integrating the acquired urology business and amortisation of intangibles from that acquisition totalling DKK 219m, operating profit was DKK 1,005m, equal to an EBIT margin of 17%, supported by the greater cost effectiveness of the relocated parts of our production
• The full-year 2006/07 forecast for organic revenue growth is raised from around 9% to around 10%, including the acquired urology business as from 2 June 2007. The EBIT margin forecast remains at 12-13%. Long-term targets are unchanged
• At 30 June 2007, Coloplast had bought back shares for DKK 372m under the DKK 1bn share buy-back programme, which will now be fully utilised during the current financial year
Key figures and ratios, DKKm (unaudited)
Actual 2006/07
9 months
Actual 2005/06
9 months
Indexed on 2005/06
9 months
Actual 2005/06 full year
Revenue 5,982 4,776 125 6,709Operating profit (EBIT) 786 755 104 879Net financial income and expenses -97 -162 60 -222Profit before tax 689 593 116 657Tax on profit for the period -176 -176 100 -191Profit from discontinuing operations 483 131 149Coloplast’s share of profit for the period 996 548 182 614Profit margin, EBIT, % 13 16 13EBITDA margin, % 20 22 19Earnings per free share of DKK 5, EPS, DKK 11 11 10Return on equity, % 44 29 23Return on average invested capital (ROAIC), % 13 17 14Economic profit 270 331 295PE, price/earnings ratio 16 29 37Equity ratio, % 42 33 35Total assets 7,893 8,307 7,982Investment in property, plant and equipment, gross 438 288 415
Attached are income statement, the balance sheet, cash flow statement, statement of changes in equity, notes to the financial statements, key figures and ratios.
Income statement and balance sheet
Discontinuing operations
The divestment of the breaand the divestment of the brachyther
Acquired operations
rganic revenue growth of 0% in local currencies
perating margin of nderlying business at 7%
able 1: Effects from cquisitions and structuring
evenue outgrowing djusted cost of sales
st care business was completed on 31 March 2007 apy business was finalised on 8 June
007. In addition, we have received final settlement of the divestment of
ome
ion of the urology usiness was finalised on 2 June 2006.
,982m, compared with DKK 4,776m in e year-e rlier period, a 27% improvement in local currencies and a 25%
nt in Danish kroner. A main driver of revenue was the acquisition of
e which was satisfactory. The existing Coloplast business also
rew by 10% in the 9M reporting period.
ble-digit growth rates, whereas ales of wound and skin care products improved by only 6% during the 9M
g profit was DKK 786m corresponding to an EBIT margin of 13% gainst 16% the year before. The decline was due to effects from acquisitions
19m. Adjusted for this factor, the operating profit of the
r
mount is included in the DKK 90m restructuring provisions made for the
mount included amortisation of intangible assets of the acquired urology usiness of DKK 96m as well as integration costs of DKK 25m and
by aided by
O1 Ou1 Tare Ra
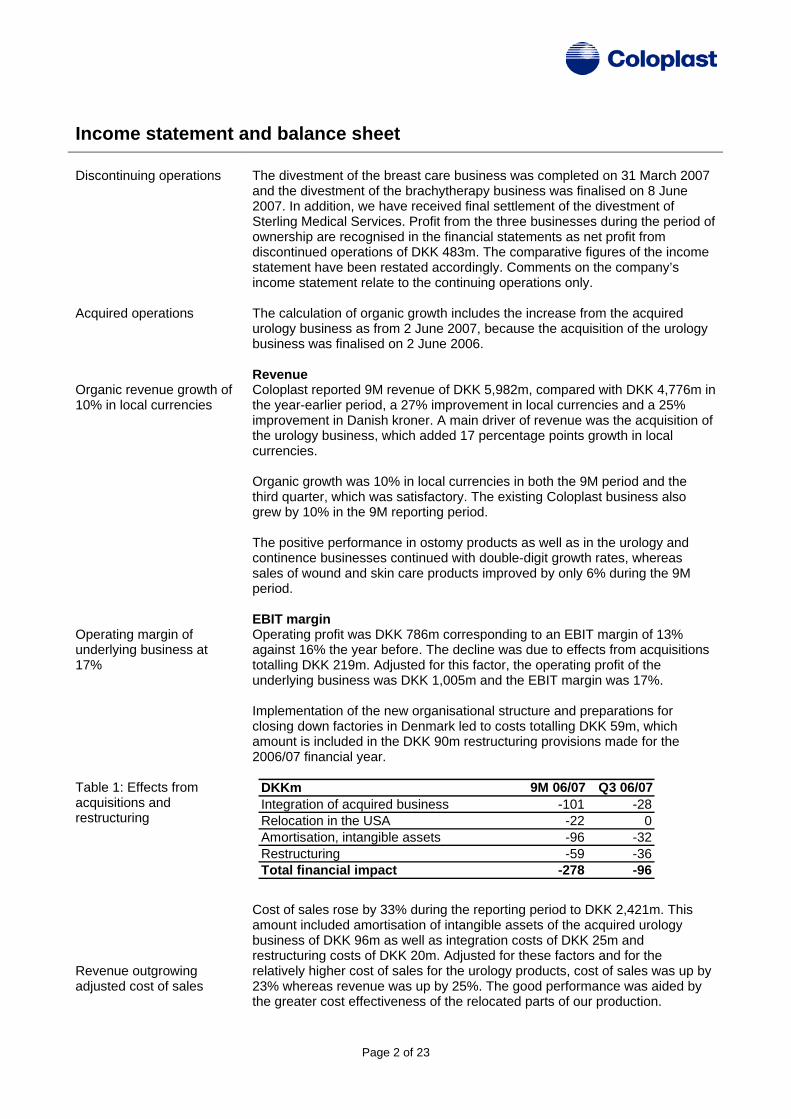
2Sterling Medical Services. Profit from the three businesses during the period of ownership are recognised in the financial statements as net profit from discontinued operations of DKK 483m. The comparative figures of the incstatement have been restated accordingly. Comments on the company’s income statement relate to the continuing operations only. The calculation of organic growth includes the increase from the acquired urology business as from 2 June 2007, because the acquisitb Revenue Coloplast reported 9M revenue of DKK 5th aimprovemethe urology business, which added 17 percentage points growth in local currencies. Organic growth was 10% in local currencies in both the 9M period and ththird quarter,g The positive performance in ostomy products as well as in the urology and continence businesses continued with dousperiod. EBIT margin Operatinatotalling DKK 2underlying business was DKK 1,005m and the EBIT margin was 17%. Implementation of the new organisational structure and preparations foclosing down factories in Denmark led to costs totalling DKK 59m, which a2006/07 financial year. Cost of sales rose by 33% during the reporting period to DKK 2,421m. This abrestructuring costs of DKK 20m. Adjusted for these factors and for the relatively higher cost of sales for the urology products, cost of sales was up23% whereas revenue was up by 25%. The good performance was the greater cost effectiveness of the relocated parts of our production.
DKKm 9M 06/07 Q3 06/07Integration of acquired business -101 -28Relocation in the USA -22 0Amortisation, intangible assets -96 -32Restructuring -59 -36Total financial impact -278 -96
Page 2 of 23
Selling and distribution costs were up by 30% to DKK 1,906m, including DKK 76m in integration costs. Adjusted for these items, the increase was 25%.
dministrative expenses rose by 29% to DKK 699m including DKK 22m for
Coloplast’s share of 9M profit was DKK 996m
xchange rate changes duced revenue by DKK
7m
ax rate was 26%
ed perations. This was a 23% increase over last year’s figure of DKK 417m.
ued operations during the 9M reporting period was DKK
nse of DKK 97m, s compared with DKK 162m last year. Exchange rate adjustments were an
alue
ed net revenue by DKK 67m. This was ffset in earnings by the lower costs in USD-terms, which also absorbed the
.
orporate income tax rate from 28% to 25% lowered the effective tax rate by rther 2
tment of e breast care business unit. Non-current assets fell by DKK 280m to DKK
rrent assets rose by DKK 191m to DKK 3,055m, because of
r than the sales growth rate.
Economic profit fell due to cquisitions
ecline was attributable to integration costs and an increase in average
e to acquisitions. Economic profit was lifted by one-off
m, invested
apital used in the calculation of economic profit. The calculation of EP is
Arelocation in the USA and DKK 39m in restructuring costs. Adjusted for these items, the increase was 18%. R&D costs were up by 33% to DKK 218m. Financial results Coloplast’s share of 9M profit was DKK 513m before profit from discontinu
Ere6 T
oProfit from discontin483m, bringing Coloplast’s share of 9M profit to DKK 996m. Financial items, which include interest, exchange rate and fair value adjustments as well as bank charges amounted to a net expeaincome of DKK 25m against an expense of DKK 36m last year. Fair vadjustments of previously granted options were an income of DKK 2m against an expense of DKK 49m last year. Changes in the DKK-exchange rates of Coloplast’s invoicing currencies, mainly against the US Dollar, reducohigher cost of sales caused by the appreciation of the Hungarian Florint. Accordingly, exchange rate changes had a largely neutral net effect on EBIT The effective tax rate was 26%, equal to a tax expense of DKK 176m, compared with 30% (DKK 176m) last year. The reduction of the Danish cabout two percentage points. To this should be added the effect of a fupercentage point reduction from a one-off adjustment of deferred tax provisions, which is also a result of the amended Danish tax rules. Balance sheet Total assets fell by DKK 89m to DKK 7,893m as a result of the divesth4,838m, while cuthe higher inventory levels needed to secure our supply capacity while production is being relocated from Denmark. The equity ratio was 42%. Trade receivables rose by DKK 59m in the 9Mperiod, equal to a 4% increase which was lowe
a
Economic profit Economic profit was DKK 270m, as compared with DKK 331m last year. Thedinvested capital duincome after tax of DKK 88m from the divestment of business areas. The one-off income of DKK 88m is after deduction of goodwill of DKK 395which has previously been charged against equity, but included in the cbased on a weighted average cost of capital (WACC) of 6.9% and an averageinvested capital of DKK 7.9bn.
Page 3 of 23
Cash flow statement
ree cash flow of DKK ash flows
flow was DKK 887m. Net of DKK 783m relating to the was DKK
he relocation of production to Hungary and China is progressing to plan. ce
ash flows from operations were DKK 513m and dividend payments to 84m
vestments in property, plant and equipment during the reporting period on-
he factory at Kokkedal, Denmark has been sold effective 1 January 2009 at a
F887m
CThe free cashacquisition and divestment of business operations, the free cash flow104m, compared with DKK 443m last year. TInventory levels have been temporarily increased due to the accelerated paof relocation and the closure of factories in Denmark. Cshareholders in respect of the 2005/06 financial year amounted to DKK 1Total cash and cash equivalents were minus DKK 15 million at 30 June 2007. Inamounted to DKK 438m, of which DKK 366m represented investment in ncurrent assets under construction, mainly for the plants in Nyirbator, Hungary,and Zhuhai, China, as well as for production equipment for manufacturing new products. Tcapital gain of DKK 40m, which amount will be recognised in the first quarter of the 2008/09 financial year.
he share buy-back
an ed
apital structure and share buy-back programme or below the 2.0–3.5
ue to the share buy-back programme, the holding of treasury shares qual to
s a consequence of a strong cash flow following the divestiture of the breast
he
he Board of Directors intends to propose to the shareholders in general The
of
Outlook and long-term objectives
evenue growth forecast
utlook for 2006/07 ue growth is now at around 22-23% in local currencies,
he forecast for organic growth is upgraded from around 9% to around 10%,
continence products and in ostomy products.
Tprogramme to be completed faster thpreviously communicat
CThe net debt was 1.7 times EBITDA at 30 June 2007, target range. Coloplast has initiated a share buy-back programme involving the purchase of Coloplast shares for DKK 1bn. As per 30 June 2007, we hadbought back shares under the programme worth DKK 372m. Dincreased by 808,190 during the reporting period to 2,698,989 shares, e6.1% of the Class B share capital. Acare business unit and the brachytherapy activities it has been decided to accelerate the completion of the share buy-back programme to the end of tfinancial year 2006/07 and not as previously announced during 2008. Tmeeting that shares bought back under the new programme be cancelled.share buy-back programme was launched within the scope of the existing authority granted by the shareholders in general meeting for the repurchaseup to 10% of the company’s share capital.
Rupgraded to about 10%
OThe forecast for revenup from the previous forecast of around 22%. Tincluding growth in the urology business as from 2 June 2007. The upgrade isbased on the consistently positive performance in sales of urology and
Page 4 of 23
EBIT margin of 12-13%
able 2: Expected full-year nancial impact of
BITDA margin of 18-19%.
vestment level affected y the building of new
ax rate of 26%
ew reimbursement rates r continence care
. The integration of the urology usiness, restructuring initiatives and amortisation of intangible assets from
ar after the full integration f the acquired urology business and integration costs totalling approximately
gross investments in property, plant and equipment (buildings, achinery and operating equipment) are expected to amount to approximately
nstead of 30% as reviously estimated. This includes the permanent effect of around two
income /07
s new set of lower nationwide reimbursement rates implemented for
s in the German market took effect on 1 January 2007. care
troduced additional amendments to its healthcare regulations ffective 1 April 2007. The main change to previous practise is that German
mplemented, the changes are not xpected to impact our business results in the current financial year. Any
m
to increase e cooperation with the sick funds as well as with the service providers
2006/07 2005/06Integration of acquired business -130 -70Relocation in the USA -30 -60Amortisation of intangible assets -130 -50Restructuring -90 0Market value adjustment, inventories 0 -100Synergies 20 0Total financial impact -360 -280
Tfiacquisitions and restructuring E Inbfactories T Nfoproducts implemented in Germany
The EBIT margin is still expected to be 12-13%bbusiness acquired are still expected to reduce operating profit by approximately DKK 360m and to affect the EBIT margin by some 4-5 percentage points. DKKm The EBITDA margin is still expected to be 18-19%. We still anticipate synergies of DKK 75-100m per yeoDKK 230m. For 2006/07 mDKK 600m. Investments in the new factories in China and Hungary are expected to account for approximately DKK 200m. The effective tax rate is expected to be about 26% ippercentage points resulting from the reduction of the Danish corporatetax rate from 28% to 25%. To this should be added the effect in the 2006financial year of a further 2 percentage point reduction from a one-off adjustment of deferred tax provisions, which is also a result of the amended Danish tax rules. Healthcare reformAcontinence care productThe change has lowered the reimbursement rates for our continence products by an average of about 10% compared with prices before 1 January 2007. We maintain our estimate that the new prices will reduce Coloplast’s 2006/07 revenue by DKK 20-25m. Our financial guidance allows for this reduction. Germany inesick funds are now in a better position to apply competitive tendering whenselecting providers of medical devices. As the amended legislation is still being iepossible future impact will depend on the extent to which the German sick funds apply competitive tendering rather than the existing fixed price systeand on our ability to act under the changed market conditions. Coloplast is strengthening the German organisation with the aimthsupplying the sick funds. The good relationships with the health care
Page 5 of 23
UK health care reform
ostponed until 2008
ong-term targets nchanged
alth has announced that the current review of the rrangements under Part IX of the Drug Tariff for the provision of stoma and
vel of responses, the Department of Health decided to review the original
ion process lasts 1½ – 3 months and Coloplast therefore does not xpect any changes before 2008, which is in line with our latest update on the
the K healthcare system, the extension announcement had no effect on our full-
ts he business targets for 2012 are unchanged:
five years towards 2012 based on the financial results in 2004/05
• Maj fl ates of important currencies, ignificant changes in the healthcare sector or major changes in the global
argets o
Business areas
able 3: Revenue growth y business area
evenue growth of 10%
The Group’s results are reported as a single entity. However, details are also
rovided on revenue and growth rates in local currencies for the quarterly
stomy care ross revenue generated by Coloplast’s ostomy care products was DKK
red with DKK 2,114m during the year-earlier period. This The
p Lu
professionals will continue. The British Department of Heaincontinence appliances and related services to Primary Care is expected to lead to a new consultation process with a revised proposal in September 2007. The last round of consultations closed on 2 April 2007 and due to the high leproposal. A consultateBritish health care reform in stock exchange no. 8/2007, 23 May 2007. As our forecasts for 2006/07 do not reflect any potential amendments toUyear estimates. Long-term targeT
• To double economic profit at least every
• Revenue of at least DKK 14bn An EBIT margin of at least 18%
or uctuations in the DKK-exchange rseconomy may impact Coloplast’s potential for achieving the long-term tand for meeting the full-year forecasts. In addition, such fluctuations may alsimpact the company’s accounting values.
Tb R
preporting period for Coloplast’s products in each of the three business areas as well as the category “Other”, which comprises revenue generated by theGroup from selling competitor products and from bonuses, discounts, etc. * Growth rates are stated in local currencies OG2,303m compaequalled 10% growth in local currencies and was in line with expectations.Q3 growth rate was 12%, which was satisfactory.
DKKm 9M 06/07 9M Growth* Q3 06/07 Q3 Growth*Ostomy Care 2303 10% 804 12%Urology & Continence 2376 63% 813 43%Wound & Skin Care 939 6% 323 4%Other 364 31% 129 43%Group revenue 5982 27% 2069 22%
Page 6 of 23
SenSura sales continue to utperform expectations
rganic growth of 11%
ood sales performance y acquired products
ors to sales growth, and ales of Assura ostomy bags were also satisfactory, especially open bags
r
e USA and in most European arkets, including France and the UK. In Germany, Coloplast’s homecare
are ross revenue from Coloplast’s urology and continence care products
ocal currencies to DKK 2,376m, 52 th for
ganic
ignificant growth drivers were sales of catheters and urine bags. hese two product areas account for half of the sales generated in this
ired business performed well in the third quarter, and the 006/07 forecasts include an increase in overall sales from business acquired
ne 2007, the first month in which oloplast also controlled the activities in the year-earlier period. In the North
ology business is progressing to plan, and the current ey initiatives involve the planned strengthening of sales growth.
Revenue growth of 6% ross revenue from Coloplast’s wound and skin care products increased by
rrencies to DKK 939m, up from DKK 905m in 9M
m ressings as well as sales of skin care products, but the sales growth was not
ain – Ibu were still short of expectations. The product has been ell received by customers, but building a new market for an entirely new and
pecial effort towards selected customer groups in prioritised markets. We 2-
o O Gb
Easiflex ostomy products were again major contributswith the Hide-away outlet. SenSura has now been launched on 17 markets, with the USA and Canada as the most recent additions, and sales of this product continue to outperform expectations. SenSura is launched in all majomarkets by the end of the financial year. Healthy revenue growth was reported in thmcompany HSC reported sales growth and the company continued to strengthen its position in the distribution market by expanding its portfolio ofproducts and services. Urology and continence cGincreased by 63% measured in lpercentage points being generated by acquired business. Organic growthe 9M reporting period was 11% in local currencies, while the Q3 orgrowth including the urology business as from 2 June 2007 in local currencieswas 12%. The most sTbusiness area. Sales in the acqu2relative to the 2005/06 financial year. Sales grew in line with the market in JuCAmerican market, growth was especially driven by sales of continence products and implants. The integration of the urk Wound and Skin Care
G6% measured in local cu2005/06. Q3 revenue growth however was only 4% in local currencies. Revenue growth was driven by sales of Coloplast’s advanced Biatain foadsatisfactory. Sales of Biatwinnovative wound care product has proven more challenging than expected. The growth of this business area has prompted a new strategy involving a sestimate that the new strategy will restore double-digit growth rates within 124 months.
Page 7 of 23
Geographical markets
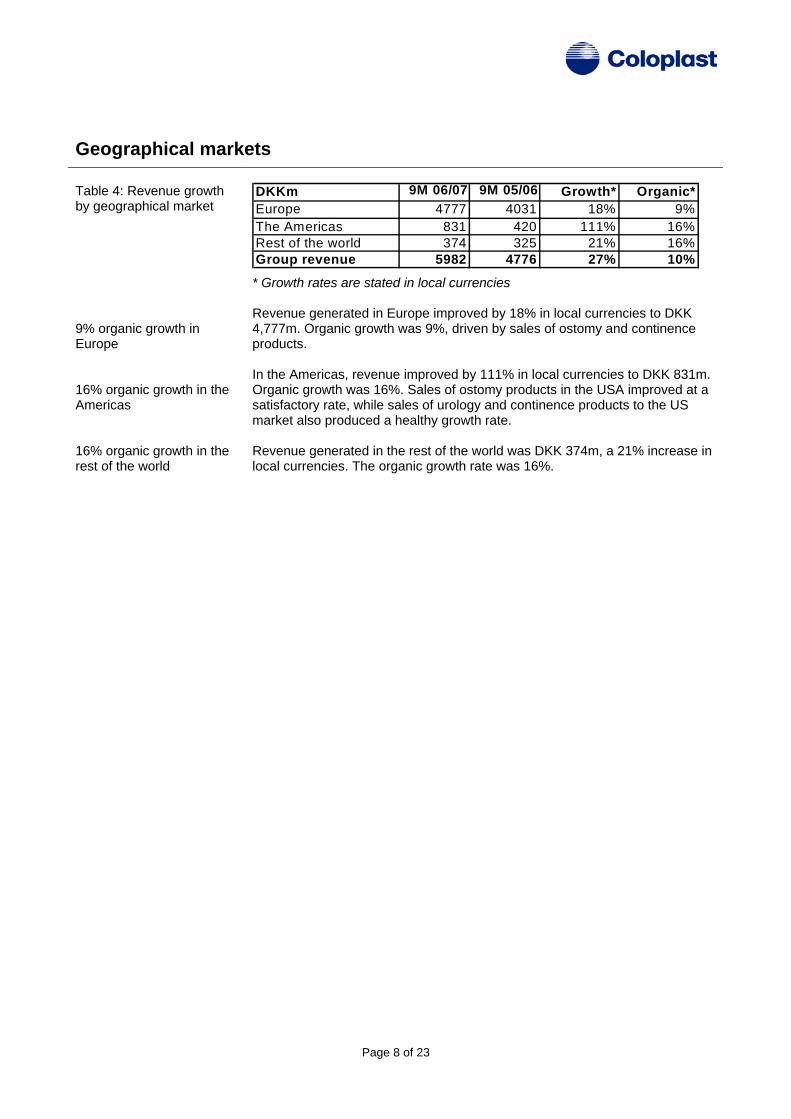
Table 4: Revenue growth by geographical market 9% organic growth in Europe 16% organic growth in the Americas 16% organic growth in the rest of the world
* Growth rates are stated in local currencies Revenue generated in Europe improved by 18% in local currencies to DKK 4,777m. Organic growth was 9%, driven by sales of ostomy and continence products. In the Americas, revenue improved by 111% in local currencies to DKK 831m. Organic growth was 16%. Sales of ostomy products in the USA improved at a satisfactory rate, while sales of urology and continence products to the US market also produced a healthy growth rate. Revenue generated in the rest of the world was DKK 374m, a 21% increase in local currencies. The organic growth rate was 16%.
DKKm 9M 06/07 9M 05/06 Growth* Organic*Europe 4777 4031 18% 9%
he Americas 831 420 111% 16%est of the world 374 325 21% 16%roup revenue 5982 4776 27% 10%
TRG
Page 8 of 23
Management statement The Board of Directors and the Executive Management have considered and approved the interim financial statements of Coloplast A/S for the nine months to 30 June 2007. The financial statements, which are unaudited, have been prepared in accordance with the requirements of the International Financial Reporting Standards and additional Danish disclosure requirements for the interim financial statements of listed companies. We believe that the financial statements give a true and fair view of the Group’s assets and liabilities, financial position and profit for the period under review. Executive Management Sten Scheibye President, CEO
Lene Skole Executive Vice President, CFO
Lars Rasmussen Executive Vice President, COO
Board of Directors Michael Pram Rasmussen Chairman
Niels Peter Louis-Hansen Deputy Chairman
Thomas Barfod
Håkan Björklund
Mads Boritz Grøn
Per Magid
Torsten Erik Rasmussen
Ingrid Wiik
Knud Øllgaard
This announcement includes information about Management’s expectations for future developments. Being based on assumptions that embody uncertainty and risks including, but not restricted to, changes in relevant legislation and treatment methods as well as the financial markets, actual results may turn out to differ from those expected.
Page 9 of 23
Further information Investors and analysts Lene Skole Executive Vice President, CFO Tel. +45 4911 1665 E-mail: [email protected] Jørgen Fischer Ravn Head of Investor Relations Tel. +45 3085 1308 E-mail: [email protected] Press and the media Jens Tovborg Jensen Head of Media Relations Tel. +45 3085 1922 E-mail: [email protected] This announcement is available in a Danish and an English-language version. In the event of any discrepancies, the Danish version shall prevail.
Page 10 of 23
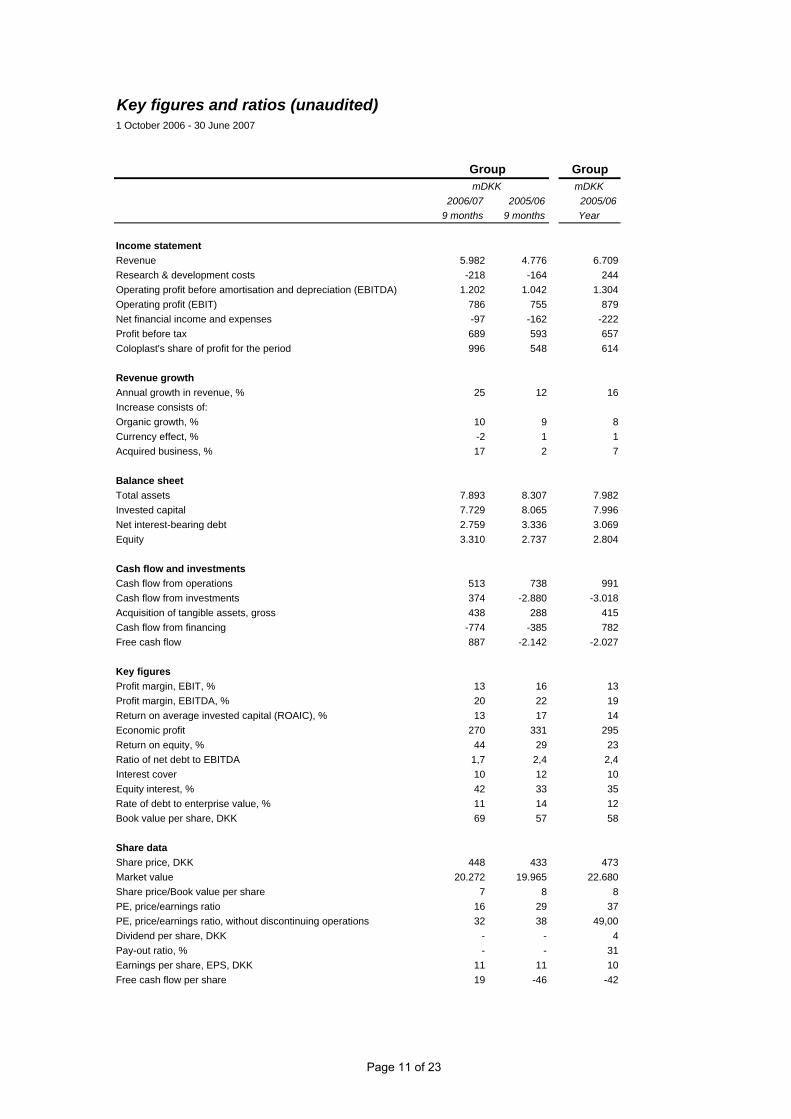
Key figures and ratios (unaudited)1 October 2006 - 30 June 2007
GroupmDKK
2006/07 2005/06 2005/069 months 9 months Year
Income statementRevenue 5.982 4.776 6.709Research & development costs -218 -164 244Operating profit before amortisation and depreciation (EBITDA) 1.202 1.042 1.304Operating profit (EBIT) 786 755 879Net financial income and expenses -97 -162 -222Profit before tax 689 593 657Coloplast's share of profit for the period 996 548 614
Revenue growthAnnual growth in revenue, % 25 12 16Increase consists of:Organic growth, % 10 9 8Currency effect, % -2 1 1Acquired business, % 17 2 7
Balance sheetTotal assets 7.893 8.307 7.982Invested capital 7.729 8.065 7.996Net interest-bearing debt 2.759 3.336 3.069Equity 3.310 2.737 2.804
Cash flow and investmentsCash flow from operations 513 738 991Cash flow from investments 374 -2.880 -3.018Acquisition of tangible assets, gross 438 288 415Cash flow from financing -774 -385 782Free cash flow 887 -2.142 -2.027
Key figuresProfit margin, EBIT, % 13 16 13Profit margin, EBITDA, % 20 22 19Return on average invested capital (ROAIC), % 13 17 14Economic profit 270 331 295Return on equity, % 44 29 23Ratio of net debt to EBITDA 1,7 2,4 2,4Interest cover 10 12 10Equity interest, % 42 33 35Rate of debt to enterprise value, % 11 14 12Book value per share, DKK 69 57 58
Share dataShare price, DKK 448 433 473Market value 20.272 19.965 22.680Share price/Book value per share 7 8 8PE, price/earnings ratio 16 29 37PE, price/earnings ratio, without discontinuing operations 32 38 49,00Dividend per share, DKK - - 4Pay-out ratio, % - - 31Earnings per share, EPS, DKK 11 11 10Free cash flow per share 19 -46 -42
GroupmDKK
Page 11 of 23
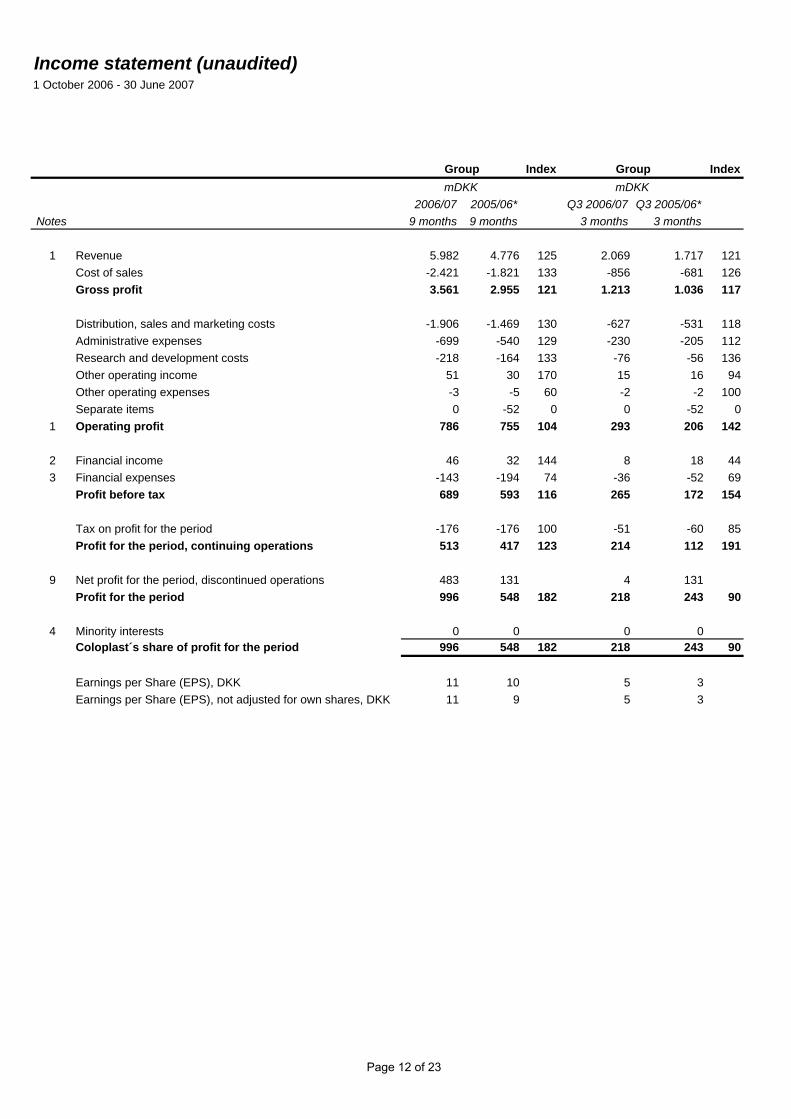
Income statement (unaudited)1 October 2006 - 30 June 2007
Group Index Group Index
2006/07 2005/06* Q3 2006/07 Q3 2005/06*Notes 9 months 9 months 3 months 3 months
1 Revenue 5.982 4.776 125 2.069 1.717 121Cost of sales -2.421 -1.821 133 -856 -681 126Gross profit 3.561 2.955 121 1.213 1.036 117
Distribution, sales and marketing costs -1.906 -1.469 130 -627 -531 118Administrative expenses -699 -540 129 -230 -205 112Research and development costs -218 -164 133 -76 -56 136Other operating income 51 30 170 15 16 94Other operating expenses -3 -5 60 -2 -2 100Separate items 0 -52 0 0 -52 0
1 Operating profit 786 755 104 293 206 142
2 Financial income 46 32 144 8 18 443 Financial expenses -143 -194 74 -36 -52 69
Profit before tax 689 593 116 265 172 154
Tax on profit for the period -176 -176 100 -51 -60 85Profit for the period, continuing operations 513 417 123 214 112 191
9 Net profit for the period, discontinued operations 483 131 4 131Profit for the period 996 548 182 218 243 90
4 Minority interests 0 0 0 0 Coloplast´s share of profit for the period 996 548 182 218 243 90
Earnings per Share (EPS), DKK 11 10 5 3Earnings per Share (EPS), not adjusted for own shares, DKK 11 9 5 3
mDKK mDKK
Page 12 of 23
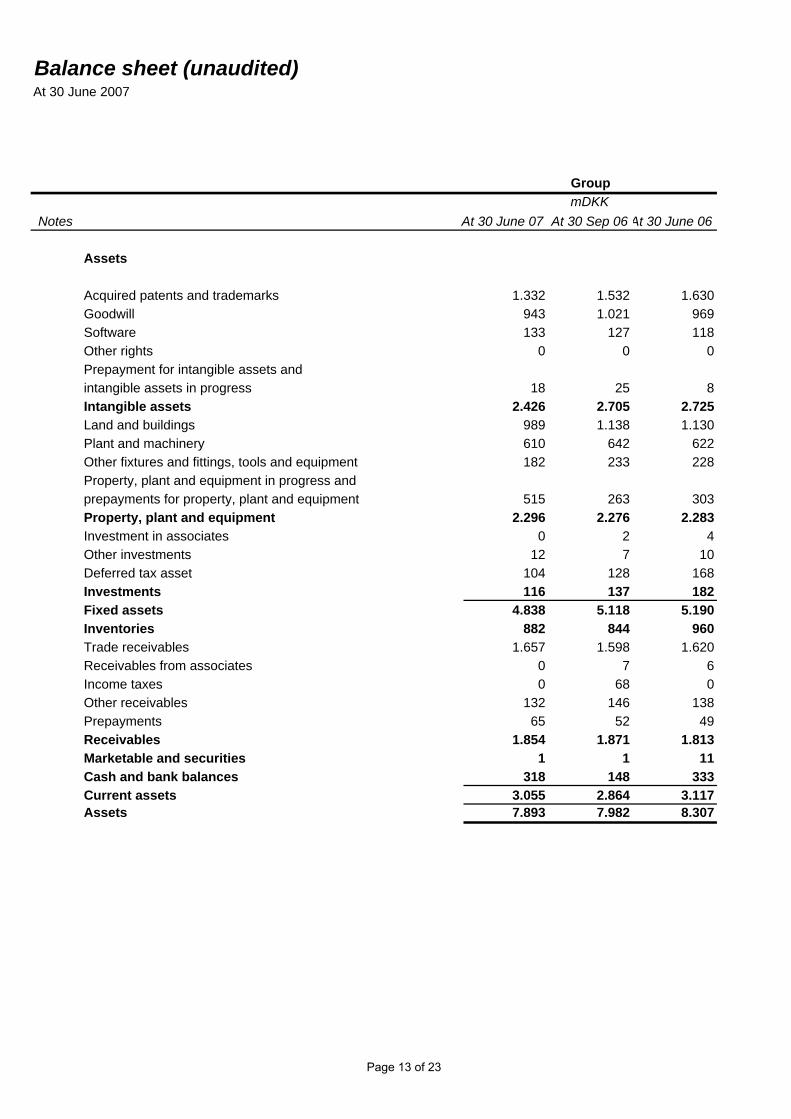
Balance sheet (unaudited)At 30 June 2007
GroupmDKK
Notes At 30 June 07 At 30 Sep 06 At 30 June 06
Assets
Acquired patents and trademarks 1.332 1.532 1.630Goodwill 943 1.021 969Software 133 127 118Other rights 0 0 0Prepayment for intangible assets andintangible assets in progress 18 25 8Intangible assets 2.426 2.705 2.725Land and buildings 989 1.138 1.130Plant and machinery 610 642 622Other fixtures and fittings, tools and equipment 182 233 228Property, plant and equipment in progress andprepayments for property, plant and equipment 515 263 303Property, plant and equipment 2.296 2.276 2.283Investment in associates 0 2 4Other investments 12 7 10Deferred tax asset 104 128 168Investments 116 137 182Fixed assets 4.838 5.118 5.190Inventories 882 844 960Trade receivables 1.657 1.598 1.620Receivables from associates 0 7 6Income taxes 0 68 0Other receivables 132 146 138Prepayments 65 52 49Receivables 1.854 1.871 1.813Marketable and securities 1 1 11Cash and bank balances 318 148 333Current assets 3.055 2.864 3.117Assets 7.893 7.982 8.307
Page 13 of 23
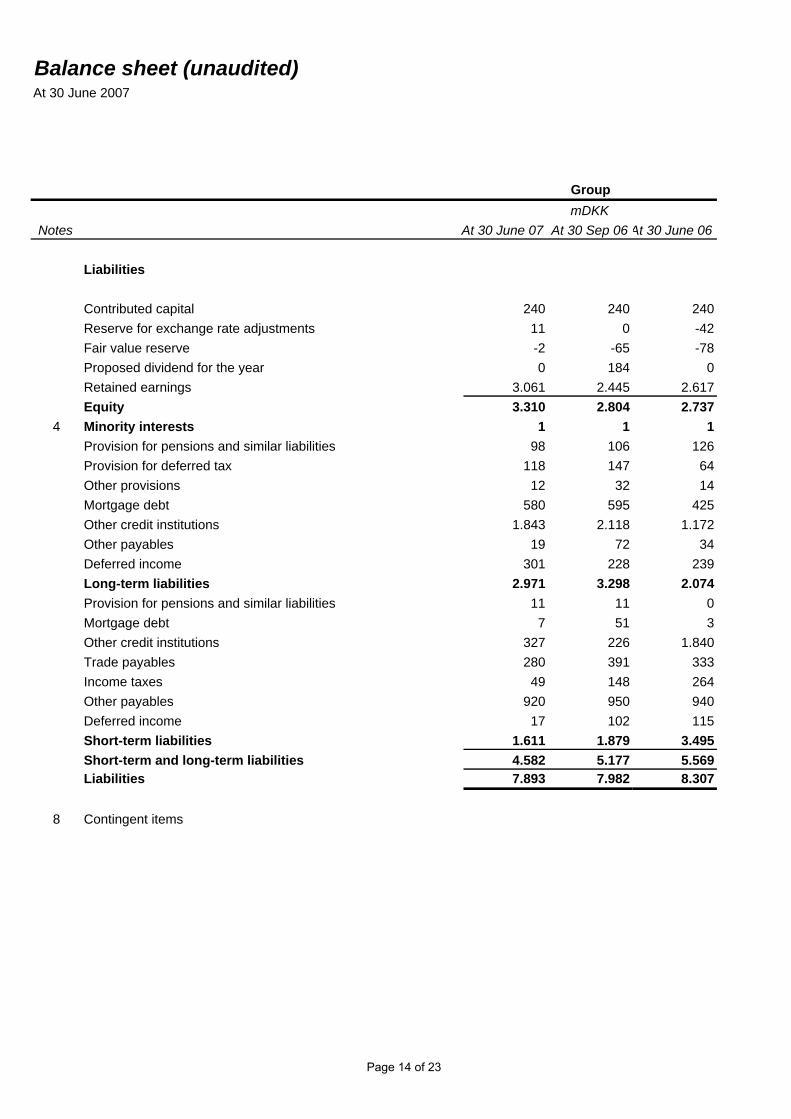
Balance sheet (unaudited)At 30 June 2007
GroupmDKK
Notes At 30 June 07 At 30 Sep 06 At 30 June 06
Liabilities
Contributed capital 240 240 240Reserve for exchange rate adjustments 11 0 -42Fair value reserve -2 -65 -78Proposed dividend for the year 0 184 0Retained earnings 3.061 2.445 2.617Equity 3.310 2.804 2.737
4 Minority interests 1 1 1Provision for pensions and similar liabilities 98 106 126Provision for deferred tax 118 147 64Other provisions 12 32 14Mortgage debt 580 595 425Other credit institutions 1.843 2.118 1.172Other payables 19 72 34Deferred income 301 228 239Long-term liabilities 2.971 3.298 2.074Provision for pensions and similar liabilities 11 11 0Mortgage debt 7 51 3Other credit institutions 327 226 1.840Trade payables 280 391 333Income taxes 49 148 264Other payables 920 950 940Deferred income 17 102 115Short-term liabilities 1.611 1.879 3.495Short-term and long-term liabilities 4.582 5.177 5.569Liabilities 7.893 7.982 8.307
8 Contingent items
Page 14 of 23
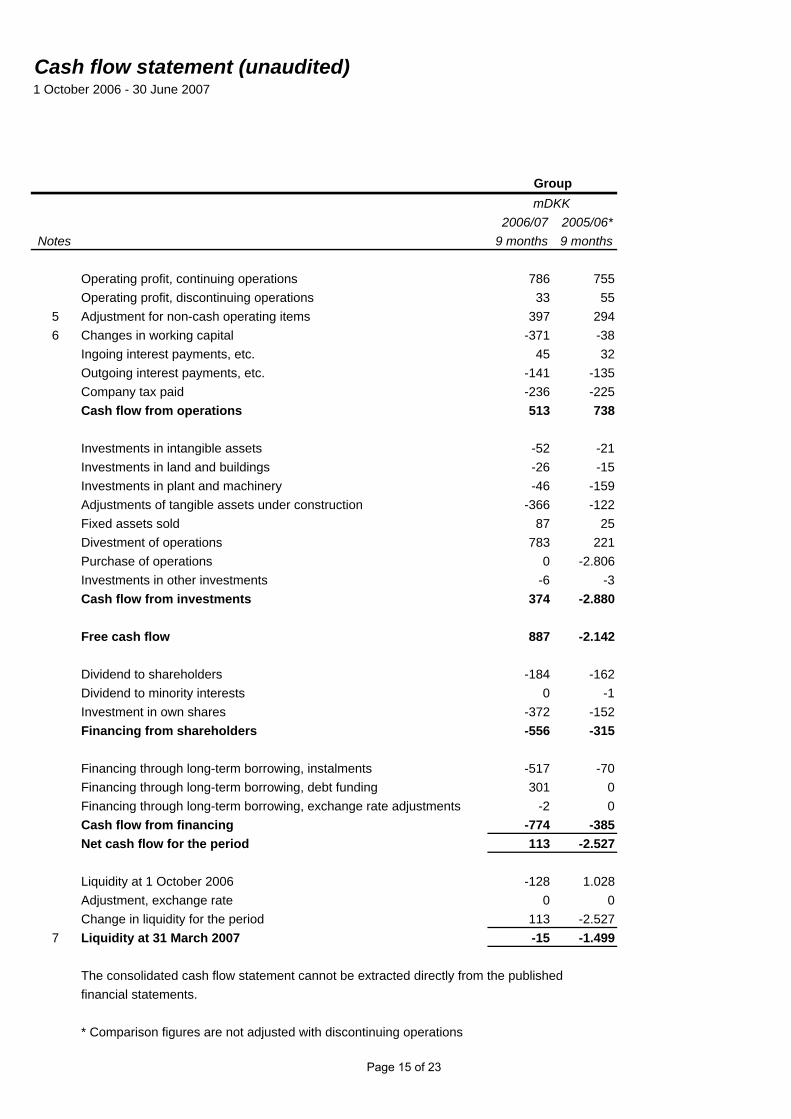
Cash flow statement (unaudited)1 October 2006 - 30 June 2007
GroupmDKK
2006/07 2005/06*Notes 9 months 9 months
Operating profit, continuing operations 786 755Operating profit, discontinuing operations 33 55
5 Adjustment for non-cash operating items 397 2946 Changes in working capital -371 -38
Ingoing interest payments, etc. 45 32Outgoing interest payments, etc. -141 -135Company tax paid -236 -225Cash flow from operations 513 738
Investments in intangible assets -52 -21Investments in land and buildings -26 -15Investments in plant and machinery -46 -159Adjustments of tangible assets under construction -366 -122Fixed assets sold 87 25Divestment of operations 783 221Purchase of operations 0 -2.806Investments in other investments -6 -3Cash flow from investments 374 -2.880
Free cash flow 887 -2.142
Dividend to shareholders -184 -162Dividend to minority interests 0 -1Investment in own shares -372 -152Financing from shareholders -556 -315
Financing through long-term borrowing, instalments -517 -70Financing through long-term borrowing, debt funding 301 0Financing through long-term borrowing, exchange rate adjustments -2 0Cash flow from financing -774 -385Net cash flow for the period 113 -2.527
Liquidity at 1 October 2006 -128 1.028Adjustment, exchange rate 0 0Change in liquidity for the period 113 -2.527
7 Liquidity at 31 March 2007 -15 -1.499
The consolidated cash flow statement cannot be extracted directly from the published financial statements.
* Comparison figures are not adjusted with discontinuing operations
Page 15 of 23
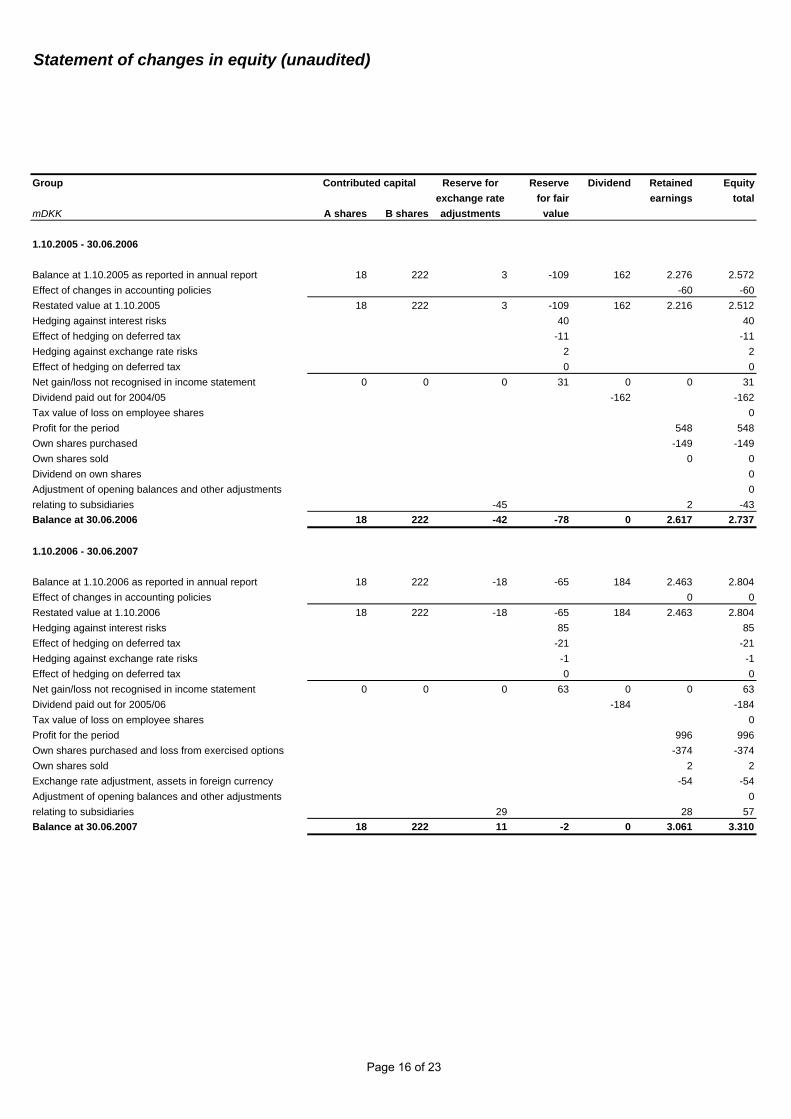
Statement of changes in equity (unaudited)
Group Contributed capital Reserve for Reserve Dividend Retained Equityexchange rate for fair earnings total
mDKK A shares B shares adjustments value
1.10.2005 - 30.06.2006
Balance at 1.10.2005 as reported in annual report 18 222 3 -109 162 2.276 2.572Effect of changes in accounting policies -60 -60Restated value at 1.10.2005 18 222 3 -109 162 2.216 2.512Hedging against interest risks 40 40Effect of hedging on deferred tax -11 -11Hedging against exchange rate risks 2 2Effect of hedging on deferred tax 0 0Net gain/loss not recognised in income statement 0 0 0 31 0 0 31Dividend paid out for 2004/05 -162 -162Tax value of loss on employee shares 0Profit for the period 548 548Own shares purchased -149 -149Own shares sold 0 0Dividend on own shares 0Adjustment of opening balances and other adjustments 0relating to subsidiaries -45 2 -43Balance at 30.06.2006 18 222 -42 -78 0 2.617 2.737
1.10.2006 - 30.06.2007
Balance at 1.10.2006 as reported in annual report 18 222 -18 -65 184 2.463 2.804Effect of changes in accounting policies 0 0Restated value at 1.10.2006 18 222 -18 -65 184 2.463 2.804Hedging against interest risks 85 85Effect of hedging on deferred tax -21 -21Hedging against exchange rate risks -1 -1Effect of hedging on deferred tax 0 0Net gain/loss not recognised in income statement 0 0 0 63 0 0 63Dividend paid out for 2005/06 -184 -184Tax value of loss on employee shares 0Profit for the period 996 996Own shares purchased and loss from exercised options -374 -374Own shares sold 2 2Exchange rate adjustment, assets in foreign currency -54 -54Adjustment of opening balances and other adjustments 0relating to subsidiaries 29 28 57Balance at 30.06.2007 18 222 11 -2 0 3.061 3.310
Page 16 of 23
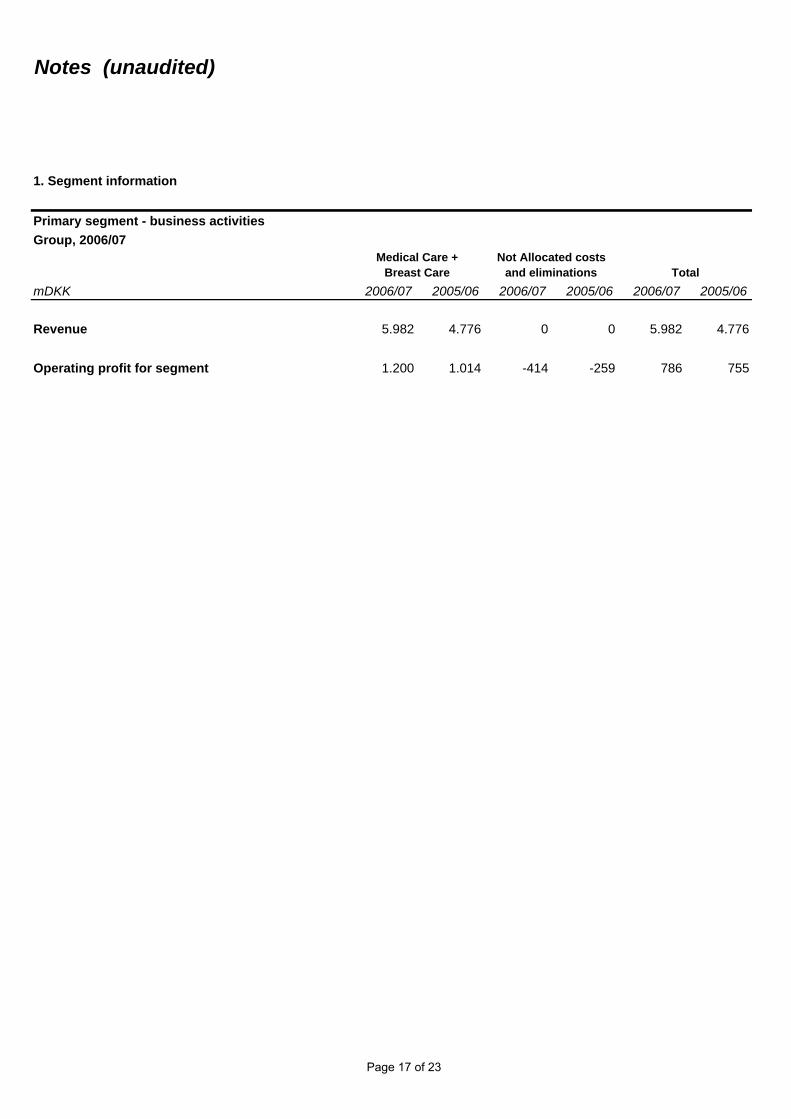
Notes (unaudited)
1. Segment information
Primary segment - business activitiesGroup, 2006/07
mDKK 2006/07 2005/06 2006/07 2005/06 2006/07 2005/06
Revenue 5.982 4.776 0 0 5.982 4.776
Operating profit for segment 1.200 1.014 -414 -259 786 755
Not Allocated costs and eliminations
Medical Care + Breast Care Total
Page 17 of 23

Notes (unaudited)
GroupmDKK
2006/07 2005/06
2. Financial incomeInterest income 19 23Fair-value adjustments from share options 2 0Exchange-rate adjustments 25 0Fair-value adjustments transferred from equity 0 9Total 46 32
3. Financial expensesInterest expense 136 105Fair-value adjustments from share options 0 49Fair-value adjustments transferred from equity 0 0Exchange-rate adjustments 0 36Other financial expenses 7 4Total 143 194
4. Minority interestsMinority interests at 1.10.2006 1 2Acquisitions 0 0Share of net profit from subsidiaries 0 0Dividend paid 0 -1Minority interests at 31.03.2007 1 1
5. Adjustment for non-cash operating itemsDepreciation 416 295Gain on sale of fixed assets 0 1Change in provisions -19 -2Total 397 294
6. Changes in working capitalInventories -136 38Trade receivables -148 -177Other receivables -10 -1Trade and other payables -77 102Total -371 -38
Page 18 of 23
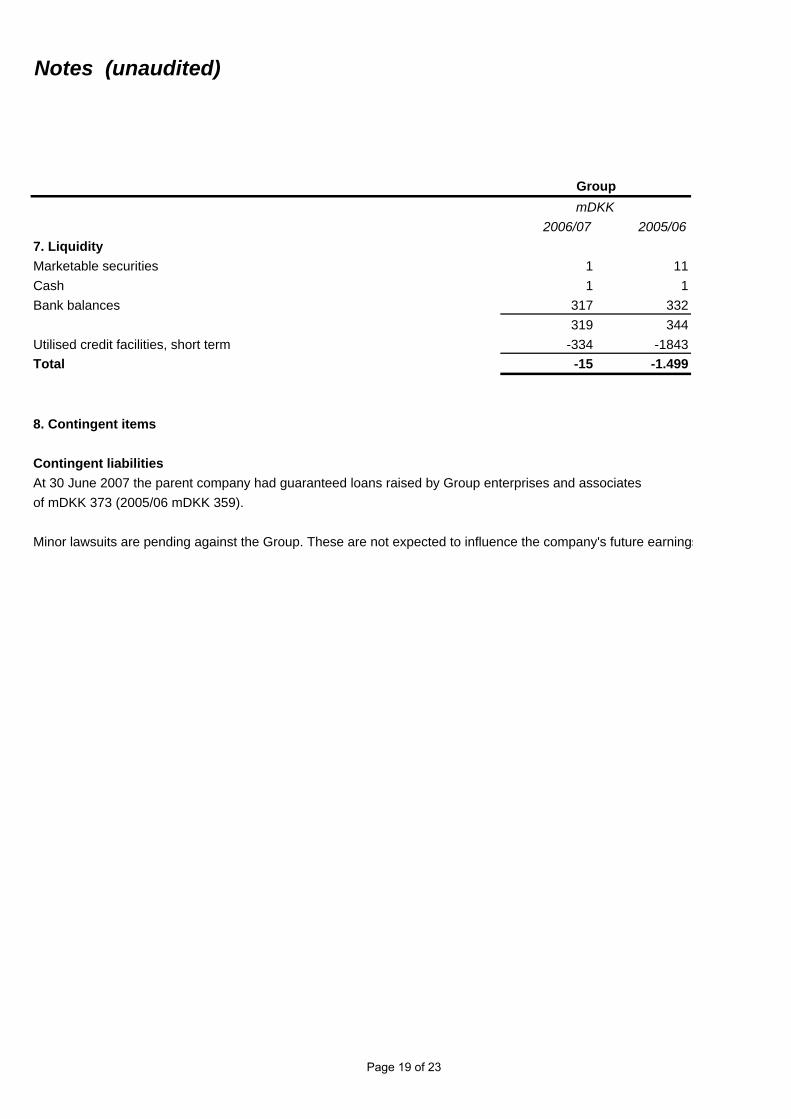
Notes (unaudited)
GroupmDKK
2006/07 2005/067. LiquidityMarketable securities 1 11Cash 1 1Bank balances 317 332
319 344Utilised credit facilities, short term -334 -1843Total -15 -1.499
8. Contingent items
Contingent liabilitiesAt 30 June 2007 the parent company had guaranteed loans raised by Group enterprises and associates of mDKK 373 (2005/06 mDKK 359).
Minor lawsuits are pending against the Group. These are not expected to influence the company's future earnings
Page 19 of 23
Notes (unaudited)
GroupmDKK
2006/07 2005/06
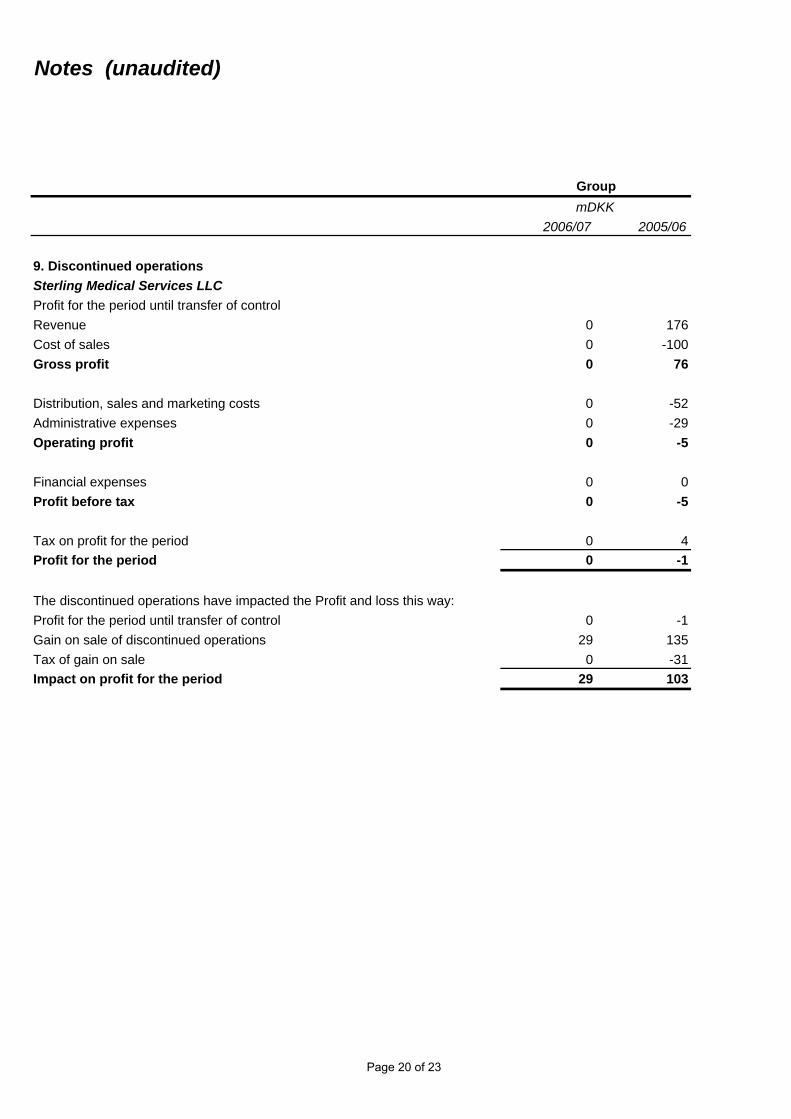
9. Discontinued operationsSterling Medical Services LLCProfit for the period until transfer of controlRevenue 0 176Cost of sales 0 -100Gross profit 0 76
Distribution, sales and marketing costs 0 -52Administrative expenses 0 -29Operating profit 0 -5
Financial expenses 0 0Profit before tax 0 -5
Tax on profit for the period 0 4Profit for the period 0 -1
The discontinued operations have impacted the Profit and loss this way: Profit for the period until transfer of control 0 -1Gain on sale of discontinued operations 29 135Tax of gain on sale 0 -31Impact on profit for the period 29 103
Page 20 of 23
Notes (unaudited)
GroupmDKK
2006/07 2005/06
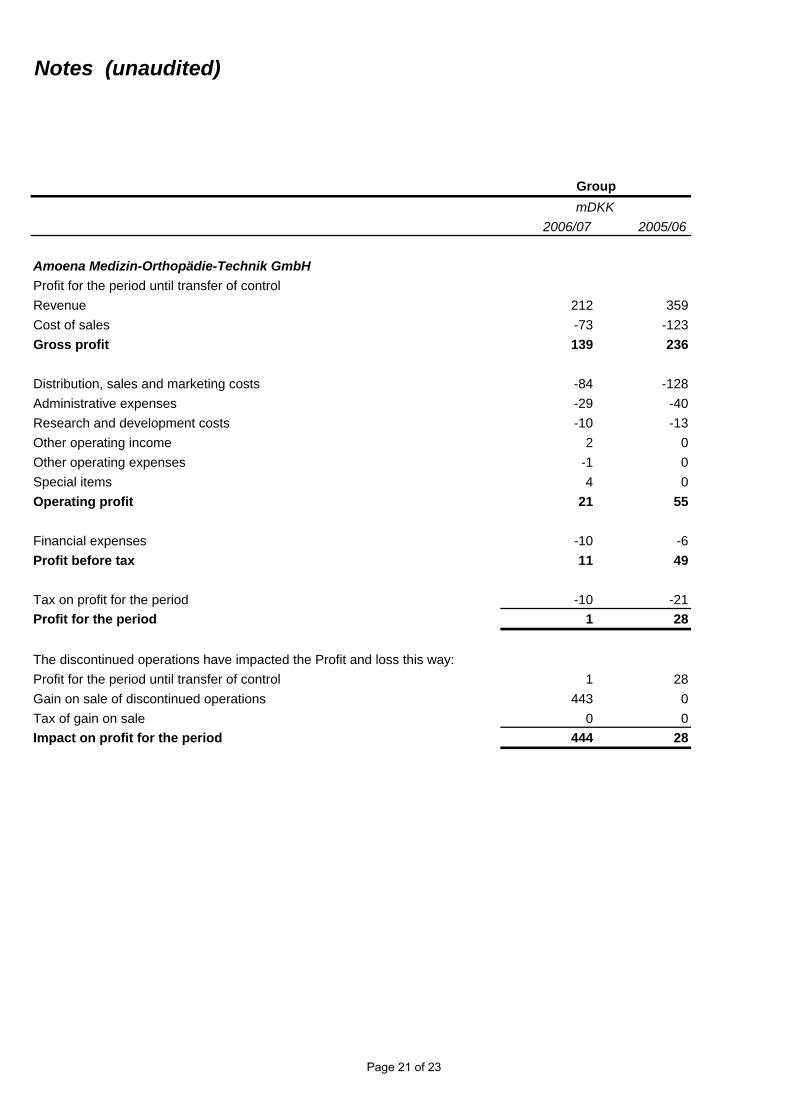
Amoena Medizin-Orthopädie-Technik GmbH Profit for the period until transfer of controlRevenue 212 359Cost of sales -73 -123Gross profit 139 236
Distribution, sales and marketing costs -84 -128Administrative expenses -29 -40Research and development costs -10 -13Other operating income 2 0Other operating expenses -1 0Special items 4 0Operating profit 21 55
Financial expenses -10 -6Profit before tax 11 49
Tax on profit for the period -10 -21Profit for the period 1 28
The discontinued operations have impacted the Profit and loss this way: Profit for the period until transfer of control 1 28Gain on sale of discontinued operations 443 0Tax of gain on sale 0 0Impact on profit for the period 444 28
Page 21 of 23
Notes (unaudited)
GroupmDKK
2006/07 2005/06
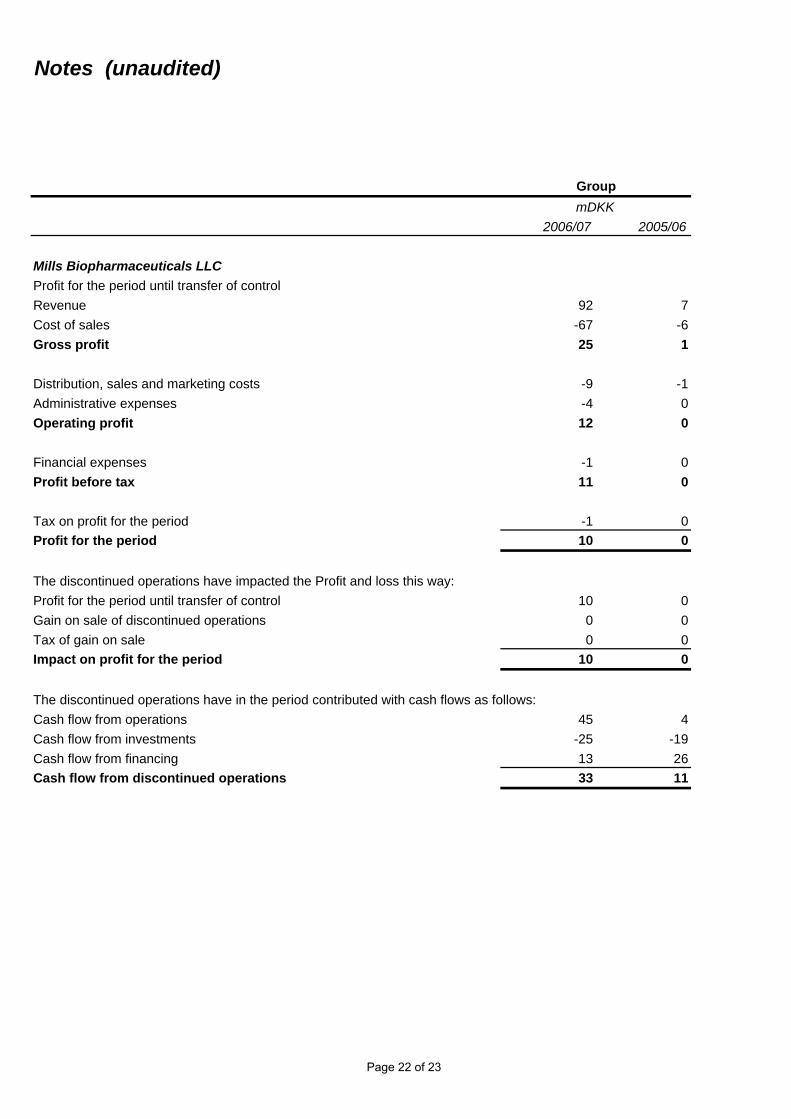
Mills Biopharmaceuticals LLCProfit for the period until transfer of controlRevenue 92 7Cost of sales -67 -6Gross profit 25 1
Distribution, sales and marketing costs -9 -1Administrative expenses -4 0Operating profit 12 0
Financial expenses -1 0Profit before tax 11 0
Tax on profit for the period -1 0Profit for the period 10 0
The discontinued operations have impacted the Profit and loss this way: Profit for the period until transfer of control 10 0Gain on sale of discontinued operations 0 0Tax of gain on sale 0 0Impact on profit for the period 10 0
The discontinued operations have in the period contributed with cash flows as follows:Cash flow from operations 45 4Cash flow from investments -25 -19Cash flow from financing 13 26Cash flow from discontinued operations 33 11
Page 22 of 23
Income statement, quarterly (unaudited)
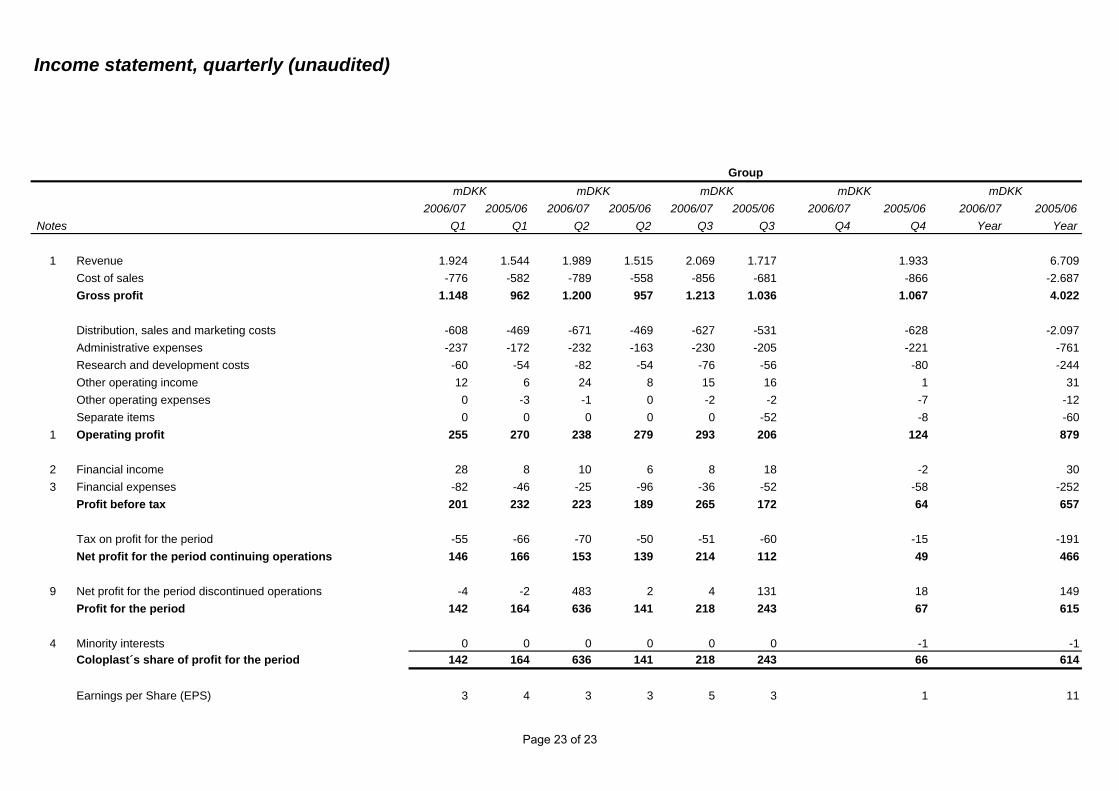
2006/07 2005/06 2006/07 2005/06 2006/07 2005/06 2006/07 2005/06 2006/07 2005/06Notes Q1 Q1 Q2 Q2 Q3 Q3 Q4 Q4 Year Year
1 Revenue 1.924 1.544 1.989 1.515 2.069 1.717 1.933 6.709Cost of sales -776 -582 -789 -558 -856 -681 -866 -2.687Gross profit 1.148 962 1.200 957 1.213 1.036 1.067 4.022
Distribution, sales and marketing costs -608 -469 -671 -469 -627 -531 -628 -2.097Administrative expenses -237 -172 -232 -163 -230 -205 -221 -761Research and development costs -60 -54 -82 -54 -76 -56 -80 -244Other operating income 12 6 24 8 15 16 1 31Other operating expenses 0 -3 -1 0 -2 -2 -7 -12Separate items 0 0 0 0 0 -52 -8 -60
1 Operating profit 255 270 238 279 293 206 124 879
2 Financial income 28 8 10 6 8 18 -2 303 Financial expenses -82 -46 -25 -96 -36 -52 -58 -252
Profit before tax 201 232 223 189 265 172 64 657
Tax on profit for the period -55 -66 -70 -50 -51 -60 -15 -191Net profit for the period continuing operations 146 166 153 139 214 112 49 466
9 Net profit for the period discontinued operations -4 -2 483 2 4 131 18 149Profit for the period 142 164 636 141 218 243 67 615
4 Minority interests 0 0 0 0 0 0 -1 -1Coloplast´s share of profit for the period 142 164 636 141 218 243 66 614
Earnings per Share (EPS) 3 4 3 3 5 3 1 11
mDKKGroup
mDKKmDKK mDKK mDKK
Page 23 of 23