Infoblox NetMRI 7.4.4 Administrator Guide
458
Infoblox NetMRI 7.4.4 Administrator Guide
-
Upload
khangminh22 -
Category
Documents
-
view
0 -
download
0
Transcript of Infoblox NetMRI 7.4.4 Administrator Guide

Infoblox NetMRI 7.4.4 Administrator Guide

Infoblox NetMRI 7.4.4 Administrator Guide
Copyright ©2020, Infoblox, Inc. All rights reserved. Page 2
ContentsPart 1 Introducing and Configuring NetMRI .................................................................................................. 11
Preface .......................................................................................................................................................11
Document Overview ...................................................................................................................................11
Documentation Conventions .................................................................................................................. 11
Navigation ..............................................................................................................................................12
Related Documentation............................................................................................................................. 12
Customer Care .......................................................................................................................................... 12
User Accounts ........................................................................................................................................12
Software Upgrades.................................................................................................................................12
Technical Support...................................................................................................................................13
Introduction................................................................................................................................................ 13
What's New ............................................................................................................................................13
Integrating with NetMRI..........................................................................................................................13
About NetMRI.........................................................................................................................................14
Icons and Popup Windows.....................................................................................................................21
Working with Table Information ..............................................................................................................24
Using FindIT for Limited-Access Applications ........................................................................................27
NetMRI Licensing ...................................................................................................................................28
NetMRI Security Settings .......................................................................................................................29
Configuring a NetMRI Appliance for IPv6...............................................................................................33
Running the Setup Wizard .....................................................................................................................34
Setting the Date and Period ...................................................................................................................40
Using the IP Address Context Menu ......................................................................................................41
Quick Start..............................................................................................................................................41
Viewing NetMRI Setup Information ........................................................................................................43
About Automatic Failover .......................................................................................................................... 44
Deploying Automatic Failover for New Appliances ................................................................................44
Specifying Automatic Failover Settings .................................................................................................45
Migrating Existing Systems as Failover Pairs .......................................................................................46
Configuring a Failover Pair.....................................................................................................................48
Reconfiguring the Operation Center HA Pair .........................................................................................48
Manually Initiating Failover....................................................................................................................50
Monitoring Automatic Failover ................................................................................................................51

Infoblox NetMRI 7.4.4 Administrator Guide
Copyright ©2020, Infoblox, Inc. All rights reserved. Page 3
Viewing Failover Settings ......................................................................................................................51
Running Network Discovery ...................................................................................................................... 53
About Network Discovery .......................................................................................................................54
Configuring Network Views ....................................................................................................................57
Configuring Scan Interfaces ...................................................................................................................61
Configuring Network Discovery Settings ................................................................................................64
Running Network Discovery on Routed and Switched Networks...........................................................77
Viewing and Managing Discovery Results .............................................................................................79
Data Collection Techniques....................................................................................................................... 86
Defining Group Data Collection Settings................................................................................................86
Adding and Editing Device Credentials ..................................................................................................90
Debugging Issues in Discovery and Data Collection .............................................................................97
Running Discovery Diagnostics..............................................................................................................98
Discovery Settings Import Formats ........................................................................................................98
Executing NIOS IPAM Sync .................................................................................................................100
Creating Admin and User Accounts..........................................................................................................110
User Administration in NetMRI ............................................................................................................. 110
Understanding Users and Roles .......................................................................................................... 112
Creating User Accounts........................................................................................................................ 113
Defining and Editing Roles ................................................................................................................... 115
Privilege Descriptions........................................................................................................................... 116
Viewing the User Audit Log .................................................................................................................. 118
Advanced User Administration Settings ............................................................................................... 119
NetMRI User Authentication and Authorization ....................................................................................... 120
Configuring NetMRI External Authentication ........................................................................................120
Defining Authentication Services..........................................................................................................121
Authenticating Users Using AD (Active Directory)................................................................................121
Authenticating Users Using LDAP........................................................................................................123
Authenticating Users Using RADIUS ...................................................................................................126
Authenticating Users Using TACACS+ (T+) .........................................................................................128
Authenticating Users Using SAML .......................................................................................................129
Authenticating Users Using OCSP.......................................................................................................131
Part 2 Switch Port Manager ........................................................................................................................133
Switch Port Management ........................................................................................................................ 133
Quick Start: Deploying Switch Port Management ................................................................................134

Infoblox NetMRI 7.4.4 Administrator Guide
Copyright ©2020, Infoblox, Inc. All rights reserved. Page 4
Using the Switch Port Management Console.......................................................................................134
Understanding SPM Polling .................................................................................................................137
Performing On-Demand Switch Port Polling ........................................................................................138
Filtering Switch Port Information ..........................................................................................................139
Device Actions in Switch Port Management.........................................................................................139
Managing Interfaces Through Switch Port Management .....................................................................142
Tracking and Managing End Hosts ......................................................................................................145
Changing Advanced SPM Settings ......................................................................................................148
Part 3 Device and Network Exploration.......................................................................................................149
Evaluating Issues in NetMRI ................................................................................................................... 149
Issues and the Network Scorecard ......................................................................................................150
Viewing Issue Summaries ....................................................................................................................153
Issue Analysis in NetMRI......................................................................................................................158
Performing Issue Suppression .............................................................................................................159
Introducing Network Explorer .................................................................................................................. 160
Viewing Network Inventory...................................................................................................................161
Summarizing Networks ........................................................................................................................164
Using the Topology Viewer ...................................................................................................................167
Other Network View Operations...........................................................................................................181
Using the Interface Viewer ...................................................................................................................182
Editing the Port List ..............................................................................................................................184
Viewing Device Collection Status.........................................................................................................184
Using the Interface Live Viewer............................................................................................................185
Devices and Interfaces............................................................................................................................ 186
The Device Shortcut Menu...................................................................................................................186
Introducing Device Groups...................................................................................................................191
Creating Device Groups .......................................................................................................................194
Understanding Device Group Membership Criteria .............................................................................201
Creating Interface Groups ....................................................................................................................203
Gathering Performance Data from Interface Groups ...........................................................................204
Expressions in Group Definitions .........................................................................................................205
Inspecting Devices in the Network .......................................................................................................... 209
The Device Viewer ...............................................................................................................................209
Viewing Device Issues, Configurations, and Changes.........................................................................210
Checking a Device's Policy Compliance .............................................................................................. 211

Infoblox NetMRI 7.4.4 Administrator Guide
Copyright ©2020, Infoblox, Inc. All rights reserved. Page 5
Device Identification .............................................................................................................................212
Checking Device Locations ..................................................................................................................212
Viewing Component Inventory .............................................................................................................212
Viewing Open Services on a Device ....................................................................................................212
Viewing CDP Neighbors .......................................................................................................................212
Viewing Link-Layer Discovery Protocol Neighbors...............................................................................213
Viewing Layer 2 Neighbors ..................................................................................................................213
Checking Custom Data Settings for the Device Viewer .......................................................................214
Checking Connected Device Histories .................................................................................................214
Inspecting Device Interfaces ................................................................................................................214
Viewing the Device’s Address Table.....................................................................................................215
Inspecting Routers in The Device Viewer ............................................................................................216
Inspecting Ethernet Switches and VLANs............................................................................................221
Inspecting Wireless Infrastructure ........................................................................................................224
Viewing and Changing General Settings for a Device .........................................................................225
Changing Device Settings ....................................................................................................................226
Collecting Troubleshooting Data ..........................................................................................................228
Viewing Device Event Logs..................................................................................................................228
Checking Device Support and Collection Times ..................................................................................228
Issues, Changes, and Network Analysis ................................................................................................. 229
About the Network Scorecard ..............................................................................................................229
Viewing Issues in the Network .............................................................................................................230
Viewing Changes in the Network .........................................................................................................231
Introducing Policy Compliance .............................................................................................................232
Viewing the Performance of Network Devices .....................................................................................233
Viewing Network Device Summaries and Histories .............................................................................234
Viewing Device Environmental Data ....................................................................................................236
Part 4 Automation Change Manager Scripting and Job Management ........................................................237
Configuration Management ..................................................................................................................... 237
Using the Config Explorer ....................................................................................................................... 238
Set a Baseline Configuration File .........................................................................................................239
Test a Configuration File Against a Policy ............................................................................................239
Compare Configuration Files on a Single Device ................................................................................239
Compare Configuration Files for Two Devices .....................................................................................240
Export Configuration Files ....................................................................................................................240

Infoblox NetMRI 7.4.4 Administrator Guide
Copyright ©2020, Infoblox, Inc. All rights reserved. Page 6
Checking for Syntax Errors ..................................................................................................................240
Defining Config Management Settings.................................................................................................... 240
Bulk Exporting Configuration Files .......................................................................................................... 242
Comparing Two Configuration Files ........................................................................................................ 243
Using the Configuration Manager to Compare Config Files.................................................................243
Using the Device Viewer to Compare Config Files ..............................................................................243
Change Management in the Comparing Configuration Files Window .................................................243
Rolling Back to an Earlier Configuration.................................................................................................. 244
Using Searches in Config Management.................................................................................................. 245
Working with Search Results ...............................................................................................................246
Running Jobs Based on Search Results..............................................................................................247
Viewing Config Histories ......................................................................................................................... 247
Job Management and Automation Change Manager.............................................................................. 248
Automation Change Manager (ACM) ...................................................................................................248
Creating and Scheduling Jobs .............................................................................................................249
Working with Configuration Templates .................................................................................................251
Defining Lists for ACM, Perl, Python, and CCS Script Reference........................................................255
Triggering Jobs Through Events ..........................................................................................................257
Checklist for Running The Automation Change Manager System .......................................................260
Deployment for Bare Metal Provisioning, Pt. 1.....................................................................................263
Deployment for Bare Metal Provisioning, Pt. 2.....................................................................................265
Activating Rogue DHCP Server Remediation ......................................................................................266
Viewing the Job History and the Job Viewer ........................................................................................268
Using Perl Or Python Libraries.............................................................................................................269
Job Scripting............................................................................................................................................ 271
Perl/Python Scripting............................................................................................................................272
Creating New Scripts (CCS, Perl, and Python) ....................................................................................272
Perl Scripting in NetMRI .......................................................................................................................274
Anatomy of a Perl Script.......................................................................................................................274
Python Scripting in NetMRI ..................................................................................................................283
Anatomy of a Python Script..................................................................................................................284
Using the NetMRI Sandbox..................................................................................................................287
Setting up a Remote Sandbox .............................................................................................................289
Installing Custom Perl Modules............................................................................................................291
Installing Custom Python Modules .......................................................................................................292

Infoblox NetMRI 7.4.4 Administrator Guide
Copyright ©2020, Infoblox, Inc. All rights reserved. Page 7
Setting Job Execution Credentials .......................................................................................................292
Scripting Well-Known Variables (Perl, Python, and CCS)....................................................................293
Part 5 Network Compliance.........................................................................................................................296
Policy Design Center............................................................................................................................... 296
How Policies Work ...............................................................................................................................296
A General Approach to Policy Development ........................................................................................297
Using the Raw XML Editor ...................................................................................................................298
Regular Expressions in Policy Rules....................................................................................................316
Creating and Managing Rules..............................................................................................................318
Creating and Managing Policies...........................................................................................................321
Deploying Policies ................................................................................................................................323
Additional Rule Examples ....................................................................................................................324
Using the Rule Logic Builder ................................................................................................................326
Using the Simple Rule Editor ...............................................................................................................327
Using the CPD Editor ...........................................................................................................................328
Reports and Report Management ........................................................................................................... 331
Opening the Report Manager...............................................................................................................331
Scheduling and Running Reports.........................................................................................................332
NetMRI Standard Reports ....................................................................................................................334
Running and Scheduling Switch Port Manager Reports ......................................................................336
Defining Custom Reports .....................................................................................................................338
Part 6 Events, Tools and Data Support .......................................................................................................341
Event Notifications and System Health Monitoring ................................................................................. 341
Subscribing to Notifications ..................................................................................................................... 341
Defining an Issue Notification...............................................................................................................343
Defining a Change Notification.............................................................................................................344
Filtering Change Notifications from User Accounts ..............................................................................345
Defining a Job Notification....................................................................................................................345
Defining a System Alert Subscription ...................................................................................................346
Notification Content and Formatting........................................................................................................ 347
Email Formatting Guidelines for Individual Notifications ......................................................................348
Notification Variables............................................................................................................................... 348
Setting Notification Defaults .................................................................................................................... 351
Defining Global Notification Email Settings ..........................................................................................351
Defining Global Notification Syslog Settings ........................................................................................352

Infoblox NetMRI 7.4.4 Administrator Guide
Copyright ©2020, Infoblox, Inc. All rights reserved. Page 8
Defining Global Notification SNMP Trap Settings ................................................................................353
Checking Sent Notifications .................................................................................................................... 353
Managing and Tracking System Health................................................................................................... 353
Operations Center System Health Listings ..........................................................................................354
System Health Color Coding ................................................................................................................354
Categories of Health Status .................................................................................................................354
Details on Software Alerts ....................................................................................................................356
Details on Network Alerts .....................................................................................................................356
Details on Platform Capacity Alerts ......................................................................................................356
Details on Hardware Alerts...................................................................................................................357
Details on Storage Alerts......................................................................................................................358
Details on Processing Alerts.................................................................................................................359
Details on Operation Center Collector Alerts........................................................................................360
Details on Configuration Alerts .............................................................................................................361
System Messages ................................................................................................................................... 361
Configuring Syslog Forwarding ............................................................................................................... 361
Understanding Platform Limits, Licensing Limits and Effective Limits .................................................... 362
Upgraded NetMRI Appliances and Platform Limits ..............................................................................363
Operations Center Device Limits..........................................................................................................363
Enforcing Platform Limits .....................................................................................................................363
Tools ........................................................................................................................................................ 364
API Documentation ..............................................................................................................................364
Ping/Traceroute ....................................................................................................................................364
SNMP Walk ..........................................................................................................................................365
SNMP Credential Test ..........................................................................................................................365
Cisco Command Tool ...........................................................................................................................366
CLI Credential Test ...............................................................................................................................366
Discovery Diagnostics ..........................................................................................................................366
NetMRI Database Management.............................................................................................................. 367
Database Statistics...............................................................................................................................367
Archiving the NetMRI Database ...........................................................................................................367
Restoring Databases............................................................................................................................368
Database Archiving Functions..............................................................................................................369
Remote Config Archive.........................................................................................................................370
Performing Database Maintenance......................................................................................................370

Infoblox NetMRI 7.4.4 Administrator Guide
Copyright ©2020, Infoblox, Inc. All rights reserved. Page 9
Sending Technical Support Bundles to Infoblox ...................................................................................371
Data Retention .....................................................................................................................................373
Storage Management...........................................................................................................................374
Extending Network Device & Data Support............................................................................................. 374
Operations with MIB Files ....................................................................................................................374
Working With Device Support Bundles ................................................................................................375
Automating Device Support Request Data Collection..........................................................................378
Defining and Using Custom Fields .......................................................................................................381
Verifying Field Content In Device Viewer & Interface Viewer...............................................................385
Administrative Shell ................................................................................................................................. 386
Access Using the Command Line SSH client ......................................................................................386
Shell Commands ..................................................................................................................................387
Installing and Deploying the NetMRI Operations Center ........................................................................ 407
Operations Center Appliances and Requirements ...............................................................................408
Access Using the Command Line SSH client ......................................................................................409
Operational and Deployment Best Practices........................................................................................409
Planning an Operations Center Deployment........................................................................................ 411
Installing Operations Center Platforms.................................................................................................412
Installing the Operations Center Controller ..........................................................................................413
Configuring Network Interfaces for Operations Center ........................................................................422
Operations Center Disaster Recovery Procedure................................................................................424
Checking NetMRI Collectors Operation ...............................................................................................428
Part 7 Appendices .......................................................................................................................................430
Manually Updating NetMRI Software ...................................................................................................... 430
Update Distribution...............................................................................................................................430
Pre-Update Planning ............................................................................................................................431
Updating From Update Files ................................................................................................................431
FAQs and Other Information ................................................................................................................... 432
Frequently Asked Questions ................................................................................................................433
System Security ...................................................................................................................................435
General Settings Section......................................................................................................................436
NetMRI Advanced Settings ..................................................................................................................436
Checking Hardware Status Messages .................................................................................................439
Auto Update .........................................................................................................................................439
Replacing a Banner Logo.....................................................................................................................439

Infoblox NetMRI 7.4.4 Administrator Guide
Copyright ©2020, Infoblox, Inc. All rights reserved. Page 10
Shutting Down the Server ....................................................................................................................440
NetMRI Update History ........................................................................................................................440
File Transfer Operations.......................................................................................................................441
Client Workstation File Transfer Using WinSCP ..................................................................................441
Client Workstation File Transfer Using FTP and SCP..........................................................................441
NetMRI Syslog Messages List .............................................................................................................442
Infrastructure Devices List....................................................................................................................... 454
Open Source Components...................................................................................................................... 455

Infoblox NetMRI 7.4.4 Administrator Guide Part 1 Introducing and Configuring NetMRI
Copyright ©2020, Infoblox, Inc. All rights reserved. Page 11
••••••
••
•••••
•
••
•
Part 1 Introducing and Configuring NetMRIThis section introduces you to NetMRI and gives a guided tour of the software, installation, and key features.
Vital aspects of a NetMRI deployment include understanding NetMRI's unique Discovery feature set, defining administrative user accounts, and setting up security.
This section includes the following chapters:
IntroductionAbout Automatic FailoverRunning Network DiscoveryData Collection TechniquesCreating Admin and User AccountsNetMRI User Authentication and Authorization
PrefaceThis preface describes the document conventions of this guide, and describes how to find product information, including accessing Infoblox Technical Support. It includes the following sections:
Document OverviewDocumentation Conventions
Related DocumentationCustomer CareUser AccountsSoftware UpgradesTechnical Support
Document OverviewThis guide describes how to configure and manage NetMRI appliances using Release 7.3.2. For updated documentation, visit our Support site at the following location: https://support.infoblox.com.
Documentation ConventionsThe text in this guide follows the following style conventions.
Style Usage
bold Indicates anything that you input in the user interface, by clicking, choosing, selecting, typing, or by pressing on the keyboard.Indicates field names in the user interface.Indicates variable and argument names in SNMP, Perl, and other languages.
input Signifies command line entries that you type, contents of text files, and operating system screen text.

Infoblox NetMRI 7.4.4 Administrator Guide Part 1 Introducing and Configuring NetMRI
Copyright ©2020, Infoblox, Inc. All rights reserved. Page 12
•
•
••••••
Style Usage
variable Signifies variables typed into the user interface that you need to modify specifically for your configuration. These can be command line variables, file names, and keyboard characters.Indicates the names of the wizards, editors, and dialog boxes in Grid Manager, such as the Add Network wizard or the DHCP Network editor.
NavigationInfoblox technical documentation uses an arrow " –> " to represent navigation through the user interface. For example, to edit a fixed address, the description is as follows:
From the Data Management tab, select the DHCP tab –> Networks tab –> Networks –> network –> fixed_addresscheck box, and then click the Edit icon.
Related DocumentationOther Infoblox NetMRI appliance documentation includes the following:
Infoblox NetMRI CCS Scripting GuideInfoblox NetMRI API GuideInfoblox Installation Guide for the NetMRI NT-4000 ApplianceInfoblox Installation Guide for the NetMRI 1102-A ApplianceInfoblox Installation Guide for the NetMRI NT-2200 AppliancesInfoblox Installation Guide for the NetMRI NT-1400 Appliances
To provide feedback on any Infoblox technical documents, please e-mail [email protected].
Customer CareThis section addresses user accounts, software upgrades, licenses and warranties, and technical support.
User AccountsThe Infoblox appliance ships with a default user name and password. Change the default admin account password immediately after the system is installed to safeguard its use. Make sure that the NetMRI appliance has at least one administrator account with superuser privileges at all times, and keep a record of your account information in a safe place. If you lose the admin account password, and did not already create another superuser account, the system will need to be reset to factory defaults, causing you to lose all existing data on the NIOS appliance. You can create new administrator accounts, with or without superuser privileges. For more information, see the Creating Admin and UserAccounts section of this Guide.
Software UpgradesSoftware upgrades are available according to the Terms of Sale for your system. Infoblox notifies you when an upgrade is available. Register immediately with Infoblox Technical Support at http://www.infoblox.com/en/support/product-registration.html to fully utilize your Technical Support.

Infoblox NetMRI 7.4.4 Administrator Guide Part 1 Introducing and Configuring NetMRI
Copyright ©2020, Infoblox, Inc. All rights reserved. Page 13
•
•
•
•
••
•
•
•
Technical SupportInfoblox Technical Support provides assistance via the Web, e-mail, and telephone. The Infoblox Support web site at http://www.infoblox.com/en/support/support-center-login.html provides access to product documentation and release notes, but requires the user ID and password you receive when you register your product online at: http://www.infoblox.com/en/support/product-registration.html.
IntroductionInfoblox NetMRI™ is a network automation and management software that automatically analyzes and detects network configuration vulnerabilities, changes, and health issues. NetMRI collects configuration and performance data for nodes throughout the network. NetMRI then analyzes that data to generate information for network managers to address problems and improve network reliability and performance.
NetMRI offers a set of specialized network management products to provide solutions to specific requirements in managed networks based on a few licensing options. For more information about licensing, see NetMRI Licensing.
What's NewThe following features and enhancements are new for this release of NetMRI:
Performance Dashboard: Provides visibility into important metrics of the NetMRI performance and health. For more information, see Performance Dashboard.Repartitioning of NetMRI virtual machines: New installations of NetMRI VMs allow distributing and extending storage on the disk. For more information, see Storage Management.Common Access Card authentication support: Allows the verification of client CA certificates for users with the Common Access Card. For more information, see Authenticating Users Using OCSP.Ability for users to log in to NetMRI via their organization's SSO using the SAML authentication service. For more information, see Authenticating Users Using SAML.SNMP version 3 support for encyption protocols aes-192 and aes-256. For more information, see SNMP Walk.Ability to specify multiple domain name suffixes for deriving device name from its FQDN. For more information, see Configuring Scan Interfaces.Discovery diagnostics: The Discovery Diagnostic window now displays the DeviceUniqueKey parameter that the Infoblox Technical Support uses for troubleshooting.Errors related to sending jumbo frames are excluded from the triggers of some network alert messages. For more information, see Categories of Health Status.NetMRI Advisor integration with Topology Viewer: Visualize which devices are impacted by a CVE or a lifecycle event on the topology maps. For more information, see Filtering Devices in the Topology Graph.
Additionally, the current release provides a number of bug fixes. For more information, refer to the Release Notes on the Infoblox Support Site.
Integrating with NetMRINetMRI collects, organizes and displays information in an array of customizable tables, graphs, and reports covering virtually every aspect of network operations. Infoblox dedicates its efforts to allow its customers to make effective use of this data, as easily as possible. Infoblox provides several ways to integrate with NetMRI, with varying degrees of simplicity, flexibility, and power.
Infoblox recommends that NetMRI deployments conform to data center security SAS 70 guidelines.

Infoblox NetMRI 7.4.4 Administrator Guide Part 1 Introducing and Configuring NetMRI
Copyright ©2020, Infoblox, Inc. All rights reserved. Page 14
••
User Interface ExportsNetMRI information and result displays can be exported as CSV files, Microsoft Excel spreadsheets, and PDF documents. Before developing a program to extract data from the NetMRI database using the API, determine whether it is easier to obtain the needed information through the GUI.
NotificationsWhen significant events occur, notifications allow external users and systems to receive an e-mail, Syslog, or SNMP traps from NetMRI. This method of integration is the simplest for most one-way, system-to-system solutions. You can use the NetMRI user interface to configure the notifications of interest, filter out those that are not important, and set delivery time-windows and destinations. See the NetMRI online Help topics under Event Notifications and System Health Monitoring for more details.
NetMRI Application Programming InterfaceThe NetMRI Application Programming Interface (API) enables external programs to retrieve information about devices, interfaces, VLANs, and other network entities from the NetMRI database. It also enables programs to retrieve information about neighbor relationships between devices, and send commands to NetMRI. This is the most powerful method of integrating with NetMRI, and the most difficult. API integration requires knowledge of Perl or other programming languages. For more information, see the NetMRI API Developer's Guide under Additional Documentation in the Online Help and the NetMRI API under Tools –> Network –> API Documentation.
About NetMRIBeyond monitoring traffic flow and generating alarms every time thresholds are passed, NetMRI periodically analyzes the contents of all router and switch tables to detect device-level problems, such as router and VLAN instability.
Beyond reporting that a given serial link has an excessive error rate, NetMRI analyzes the configuration of the interfaces on both sides of the link to determine what is causing the excessive error rate. NetMRI also tracks changes in status and configuration for all managed devices and displays the Detected Changes and Most Changed Devices listings in an accessible dashboard view.
NetMRI is a network management interface to analyze and monitor devices and enterprise networks, their protocols and their configurations from a convenient Web browser window. The primary browser pages are called the NetMRI Dashboards. The Dashboards are your home pages for managing devices on the network. The Dashboards provide easy access to tasks and to the status of the networks.
NetMRI provides a layered system of tabs to access and operate features of the software. The top layer of the NetMRI tabbed interface provides the six key functional areas of the software, consisting of the following pages.
The NetMRI DashboardsThe Dashboard tab provides information summaries, nerwork analytics, and system healh data. It includes the following sub-tabs:
General DashboardPerformance Dashboard
General Dashboard
The Dashboard tab provides three high-level summaries of information and network analytics, selectable from the Select Dashboard menu at the top of the page. See the following:

Infoblox NetMRI 7.4.4 Administrator Guide Part 1 Introducing and Configuring NetMRI
Copyright ©2020, Infoblox, Inc. All rights reserved. Page 15
•
•
•
•
•
•
•
•
•
•
•
•••
••
•
Timeline Status Summary: This dashboard displays the Network Scorecard (seen here), a numeric metric that provides an at-a-glance overall assessment of the current state of the network. The Timeline Status Summary also provides graphs showing most-changed devices, a policy compliance breakdown, and historical graphs of percent policy compliance, issue variation, and changes:
Policy Compliance: This chart shows the daily percentage of all managed devices, as a pie chart, that match against Policy Compliance Rules from the defined Policy Compliance criteria in the NetMRI system. The Percent Policy Compliance bar chart shows the same daily data as a progression from one day to the next.Issue Variation: This chart lists the following data points for the overall daily issue status in the NetMRI system or the Operations Center: The daily Overall Score in yellow, the total issue count and Delta (change in number of Issues; this value can be positive or negative for the time period measurement) in blue; and the number of Added and Deleted Issues in blue. A yellow trendline shows the Overall Score trend over the chart's time period. Green dots at the bottom of the chart are the activity indicators for the measurement time period, showing the number of added or deleted issues. Clicking the trendline opens the Network Analysis -> Issues page, showing the corresponding Overall Score History stacked bar chart.Changes: This shows a bar chart and trendline for specified time increments, with the bar chart indicating the total number of changes, breaking out the administrative and hardware changes for the time period, and the trendline showing the average rate of changes across the entire chart time period.
Issue Summary: This dashboard replicates the Network Scorecard, shows a Top Issue Types bar chart and a Top Affected Devices bar chart, and displays historical graphs of issue type and instance trends.
Top Issue Types and Top Affected Devices: These show an overview of Issues that appear most frequently in the managed network, and the devices exhibiting the largest number of Issues.New Issue Types: This table lists all new Issues of specific types that appear for the current time period (corresponds to the #New column in the main Network Analysis –> Issues page).New Issue Instances: This table provides the number of devices affected by each Issue type (this value corresponds to the #Affected value in the main Issues page).Type Issue Trend: This area chart combines sections for severity Info (blue), severity Warning (yellow) and severity Error (red), each of which are links to the main Issues page showing a table only for the issues of the chosen severity type.Type Instance Trend: This area chart combines sections for severity Info (blue), severity Warning (yellow) and severity Error (red), each of which are links to the main Issues page showing a table only for the issues of the chosen severity type.
Change Summary: This dashboard shows most-changed types, most-changed models, most-changed devices, number of changes detected over time, and most-active change makers.
The main Dashboard page and Network Analysis –> Issues pages display the Network Scorecard, which is a quick-glance guide to the overall status of all Issues in the managed network.
See About the Network Scorecard for more information about this tool.
To select among the dashboard types, open the Select Dashboard list, then click the desired type.To change the date or period for information displayed in the Dashboard, see Setting the Date and Period.To change the scope of information displayed in the Dashboard, select an item in the Select Device Groups pane on the right.
To view supporting data, hover the cursor over various elements in graphs and charts.To zoom in the Timeline Status Summary graphs, drag to select the section you want to see zoomed in. When you release the mouse button, all three graphs will zoom in.To zoom out the Timeline Status Summary graphs (after zooming in), click Show All below the center graph.
In the Timeline Status Summary dashboard, the zero value in the Issue Variations chart's Y-axis corresponds to the average number of issues for the shown time period.
Note
The Select Device Group pane on the Dashboard tab displays only extended device groups, i.e. groups that allow for calculations.

Infoblox NetMRI 7.4.4 Administrator Guide Part 1 Introducing and Configuring NetMRI
Copyright ©2020, Infoblox, Inc. All rights reserved. Page 16
•••••••
••
Performance Dashboard
The Performance Dashboard displays charts with important metrics of the NetMRI performance and health. Using this information, you can more flexibly assign resources to your NetMRI VM to accommodate device count scaling.
You can choose from the following dashboards on the Performance tab:
SystemCapacityAPIPolicy AnalysisJobsCollection & ConsolidationDatabase
To open a dashboard, click the dashboards menu in the top right of the Performance tab and select the required one. Also see Dashboard Display Options.
When a dashboard displays its chart(s), hover over a chart name to see its description in the tooltip.
You can use a calendar in the top left to view metrics statistics for a selected day, week, or month. The selection can also include 7-day and 30-day periods.
Also see Performance Data Retention and Backup.
Dashboard Display Options
There are two dashboard categories to display:
BasicAdvanced
To display only basic dashboard categories, go to Settings icon -> General Settings -> Performance Dashboard -> Show Advanced Categories and set the value to "false". Setting the value to "true" enables displaying both categories.
On OC deployments, you can select the unit for which to display dashboards – OC or any of its collectors. To do so, click OC in the top right of the Performance tab and select the required unit.
The following table summarizes available display options:
Dashboard Dashboard Category
Standalone Deployment
OC Deployment
OC Collector
System Basic + + +
Capacity + + +
API + + +
Policy Analysis + – +
Jobs + – +
Collection & Consolidation Advanced + + +

Infoblox NetMRI 7.4.4 Administrator Guide Part 1 Introducing and Configuring NetMRI
Copyright ©2020, Infoblox, Inc. All rights reserved. Page 17
Dashboard Dashboard Category
Standalone Deployment
OC Deployment
OC Collector
Database + + +
For display options of specific charts pertaining to a dashboard, see the next sections.
System Dashboard
The following table describes the charts available in the System dashboard:
Section Chart Description
Basic Configuration
Basic Configuration Configuration of the machine running NetMRI. Data is collected at startup and if the configuration has changed from a previous startup, it is marked with a different color.
CPU Utilization
Load Average Per Core
Load average per core during 5-minute period.
CPU Load Per NetMRI Component
CPU utilization by each NetMRI component. Data is collected every 5 minutes. This chart is displayed as pie chart and timeline.
Memory Utilization
Memory Utilization RAM utilization. Data is collected every 5 minutes.
Swap Utilization Swap file utilization. Data is collected every 5 minutes.
Memory Consumption Per NetMRI Component
RAM utilization by each NetMRI component. Data is collected every 5 minutes. This chart is displayed as pie chart and timeline.
Storage Total IOWait Total time spent by the CPU waiting for IO operations to complete. Data is collected every 30 minutes.
Read/Write Operations
Number of read/write operations per device. Data is collected every 30 minutes.
Storage Capacity Total amount of free space by disk partitions. Data is collected every 30 minutes.
Capacity Dashboard
The following table describes the charts available in the Capacity dashboard:
Chart Description
Discovered Devices Number of devices discovered by NetMRI, including end hosts. The chart also displays maximum recommended number of discovered devices if known for the platform. Data is collected every 30 minutes.
Licensed Devices Number of licensed devices and license limit. The chart also displays the maximum number of devices that can be licensed in the platform (hard limit for hardware appliances and soft limits for VMs). Data is collected every 30 minutes.
Basic Device Groups Number of basic device groups and the maximum number allowed. Data is collected every 10 minutes.

Infoblox NetMRI 7.4.4 Administrator Guide Part 1 Introducing and Configuring NetMRI
Copyright ©2020, Infoblox, Inc. All rights reserved. Page 18
Chart Description
Extended Device Groups
Number of extended device groups. Data is collected every 10 minutes.
Interfaces Total number of interfaces of all licensed infrastructure devices and their maximum recommended number if known. Data is collected every 30 minutes.
Policy Rules Per Device
Ratio of the number of applied policy rules to the number of licensed devices. Data is collected every 3 hours.
API Dashboard
The following table describes the charts available in the API dashboard:
Chart Description
API Call Duration Average and maximum duration of API calls to NetMRI. Data is collected every hour.
API Calls Per Second Average number of API calls per second. Data is collected every hour.
API Users Number of distinct user logins engaged in API calls. Data is collected every hour.
API Error Rate Ratio of the number of API call errors to the total number of API calls. Data is collected every hour.
Policy Analysis Dashboard
The following table describes the charts available in the Policy Analysis dashboard:
Section Chart Description
Policy Average Policy Evaluation Time
Average time during which one device configuration is evaluated against one policy. Data is collected every 3 hours.
Evaluated Policies Number of deployed policies that were evaluated during monitoring interval (3 hours).
Total Policy Evaluation Time
Total time elapsed for all policies evaluation during monitoring interval (3 hours).
Rules Average Rule Evaluation Time
Average time during which one device configuration is evaluated against one policy rule. Data is collected every 3 hours.
Evaluated Rules Number of deployed policy rules that were evaluated against device configuration during monitoring interval (3 hours).
Jobs Dashboard
The following table describes the chart available in the Jobs dashboard:
Chart Description
Devices Targeted By Jobs Number of licensed devices involved in the execution of automated jobs. Data is collected every 10 minutes.
Collection & Consolidation Dashboard
The following table describes the charts available in the Collection & Consolidation dashboard:

Infoblox NetMRI 7.4.4 Administrator Guide Part 1 Introducing and Configuring NetMRI
Copyright ©2020, Infoblox, Inc. All rights reserved. Page 19
•••
Chart Standalone Deployment
OC Deployment
Description
OC Collecto
r
Normalized Collection Intervals
+ – + Normalized interval of data collection from device – real collection interval divided by ideal collection interval. The higher the value, the less frequent the polling. Data is collected every 60 minutes.
Config Changes + – + Number of changes in the configurations of licensed devices. Data is collected every 60 minutes.
Consolidation Time
+ + + Average processing time of collected data with warning and critical thresholds available in tooltip. Data is collected every 10 minutes.
Consolidation Subscription Queue
– + – The queue length of subscriptions from collectors awaiting consolidation. Data is collected every 10 minutes.
Consolidation Subscription Delay
– + – Wait time for data consolidation received from collectors. Data is collected every 10 minutes.
Consolidation Delay
– – + Time delay between the data acquisition and consolidation for OC. Data is collected every 10 minutes.
Backpressure Status
– – + Collector’s mode when it collects less data to reduce load on an overcharged OC. Data is collected every 10 minutes.
Database DashboardThe following table describes the charts available in the Database dashboard:
Chart Description
Table Sizes Per Category
Total size of all database tables grouped by specific data retention categories. Data is collected every 60 minutes.
Concurrency Average number of threads simultaneously working with the database. Measurements are taken every 20 seconds, grouped per hour and averaged.
Slow Queries Number of queries with duration over 5 seconds, per hour. Data is collected every 60 minutes.
Throughput Number of database queries per hour. Data is collected every 60 minutes.
Performance Data Retention and Backup
The following rules apply to the performance dashboard data retention:
Data is stored in weekly historical partitions.Data is archived after one month.Data is deleted after 18 months.
You can change data retention times in Settings icon -> Database Settings -> Data Retention -> Performance Dashboard Data.

Infoblox NetMRI 7.4.4 Administrator Guide Part 1 Introducing and Configuring NetMRI
Copyright ©2020, Infoblox, Inc. All rights reserved. Page 20
•
•
•
•
•
•
••
•
•
•
••
To archive the performance data during a database backup, go to Settings icon -> General Settings -> Advanced Settings -> Performance Dashboard and set the Add Performance tables to the backup option to "yes".
Network AnalysisNetwork Analysis also features the Network Scorecard on its front page. Information is organized in four tabs within the Network Analysis page:
Issues: This tab summarizes current network status, showing the same scorecard that appears on the main Dashboard, a flexible Network History chart, and an overview of current problems and possible problems in the network.Changes: This tab summarizes all recent changes made to the network, and provides features to change the information displayed in the summary table.Policy Compliance: This tab summarizes the results of Policies developed in the Policy Compliance features for device groups and active devices in the network.Performance: This tab summarizes active device operations in charts and tables.
Network ExplorerThe Network Explorer tab displays everything NetMRI learns about the network. Network Explorer is a good starting point for inspecting the results of a Network Discovery process, viewing the topology of the discovered network, viewing the operational state of individual network devices (through a feature called the Device Viewer), and obtaining views of how the network is behaving in different locations in the topology.
See the following tabs within the Network Explorer tab that offer different ways to examine network data:
Inventory: This tab provides basic information about devices, interfaces, operating systems and models in the network.Summaries: This tab lists routes (for all routing protocols), subnetworks, Route Targets, Network Views, VRFs (Virtual Routing and Forwarding instances), VLANs, HSRPs/VRRPs, and TCP/UDP port usage in the network.Topology: This tab provides an interactive viewer for exploring your network's structure.Discovery: This tab provides detailed information about NetMRI's discovery processes, including the ability to affect Discovery settings for individual devices, perform/repeat Discovery on a single device, set licensing for a managed device, and remove a device from NetMRI management. For more information on device-related Discovery functions, see Viewing Device Discovery Status and Re-Discovering a Device.
Configuration ManagementConfiguration Management provides a powerful set of features for managing, normalizing, and editing configurations for all devices managed by NetMRI, including the following:
Config Archive: This tab lists all devices in each Device Group, and is the front end for browsing, viewing, and editing configuration files from any active device, or comparing between two devices in the managed network. Configuration files drive the operation of higher-end routers, switches, firewalls and other device types across the network. You can read, edit, and compare similar-device configuration files across the network. Config Search: This tab lets you search devices in the network for a particular configuration string, an IP address, or other specific device specification such as a MAC address, device model or other phenomena, using many different types of search criteria and even regular expressions.Job Management: This tab enables creation, scheduling, approval, and execution of Job Management scripts in the Perl and CCS languages, and the definition of custom issues to extend the library of issue types that NetMRI uses for reporting and monitoring of adverse events in the network. Job Management is used to automate common network administration tasks, and efficiently enforce normalization and best-practices configuration across the managed network. A critical feature set classified under Job Management is the Automation Change Manager (ACM), that leverages NetMRI's scripting capabilities to support a set of Infoblox NIOS network automation utilities. Subcategories of Job Management include the following tabbed pages:
Scripts: This tab lists all scripts in the NetMRI system.Library: This tab provides a location for CCS and Perl subroutines that can be called by other scripts.

Infoblox NetMRI 7.4.4 Administrator Guide Part 1 Introducing and Configuring NetMRI
Copyright ©2020, Infoblox, Inc. All rights reserved. Page 21
•
•••••
•
•
•
•
•
•
•
•
•
••
•
•
•
•
•
•
Config Templates: This tab, a location for templates containing configuration snippets and variables for easier job automation.Lists: This tab, a second library page, for lists of spreadsheet-type list data for use in automation jobs.Scheduled Jobs: This tab shows the current list of scheduled automation jobs.Triggered Jobs: This tab shows the current list of recently triggered jobs.Job History: This tab shows the complete history of automation jobs run in the NetMRI managed network.Custom Issues: This tab that allows the definition of custom issues based on job execution.
Policy Design Center: This allows you to create rules and policies, and deploy policies on the network. Policy is a tool for ensuring all devices in the network meet minimum standards of readiness and security. Rules are the building blocks that form a policy. You deploy policies against devices and groups of devices. See Policy Design Center for more details.
Summary: This tab provides features for quick creation of Policy Rules, build a new Policy or schedule and deploy Policies.Rules: This tab allows you to explore the entire library of Policy Rules and provides the ability to create, edit, copy, import, and export Rules.Policies: This tab provides general Policy management features, such as editing, printing, and import/export, and to test Policies against devices, configuration files, and configuration templates.Policy Deployment: This tab allows admins to enable policies against individual devices or device groups.
ReportsThe Reports page provides features that allow you to run publishable reports from providing device information in a report, to reports across device groups or types of devices, to network-wide reports indicating trends across the network.
Reports Gallery: This tab lists standard and custom reports that are available in the current instance of NetMRI, and provides the interface to run and create new reports. Related Report types are gathered into categories where similar data sets can be compared and analyzed. See Scheduling and Running Reports for further details.Scheduled Reports: This tab lists reports that are currently scheduled to run from the NetMRI appliance, and allows the editing of scheduled reports to change their timing and configuration. See Scheduling and Running Reports for further details.Report Manager: This tab provides listings of all Active and Inactive Reports for the current NetMRI appliance, and enables monitoring of currently running and active reports. See Opening the Report Manager for more information.
Icons and Popup WindowsNetMRI uses a set of popup windows to organize software configuration settings and provide detailed viewing for devices and networks. Clicking certain icons or links will bring up separate browser windows. Popup windows you will frequently work with include the following:
Tools: Provides a set of networking tools for inspecting and testing parts of the managed network. The following tools are included:
Ping/Traceroute: Use this tool for verifying basic connectivity.SNMP Walk: Use this tool for retrieving SNMP variable information from a device on the network. For more details, see SNMP Walk.SNMP Credential Test: Use this tool for verifying whether a set of community string credentials will work for a given device. For more details, see SNMP Credential Test.Cisco Command: Use this tool for issuing a configuration command to a Cisco device. For more details, see Cisco Command Tool.CLI Credential Test: Use this tool for testing admin login credentials. For more details, see CLI Credential Test.Discovery Diagnostics: Use this tool for enabling troubleshooting by Infoblox Technical Support. For more details, see Discovery Diagnostics.
Settings: Provides several categories of important NetMRI software configuration settings governing how the appliance operates. The following settings are included:
User Admin: Use this to define administrator accounts for the NetMRI appliance.

Infoblox NetMRI 7.4.4 Administrator Guide Part 1 Introducing and Configuring NetMRI
Copyright ©2020, Infoblox, Inc. All rights reserved. Page 22
•
•
•
•
•
•
•
•
•
••
Setup: This is a crucial block of settings for information collection. See Creating Admin and User Accounts for more details.Issue Analysis: Use this to configure Issue Group settings and define the suppression of issues. For more details, see Evaluating Issues in NetMRI.Notifications: Use this to define user event notifications. For more details, see Event Notifications and System Health Monitoring.Settings: Use this for a diverse block of NetMRI-specific configuration elements including license management, system security protocols, and Custom Fields definition.Database Settings: Use this for copying, restoring and archiving. For more details, see NetMRI Database Management.
Define and Configure Network Editor: Enables the assignment of unassigned VRFs to network views, and the reassignment of VRFs to different views.Device Viewer: The Device Viewer is a popup window that provides many details about any single router, switch, firewall, or other devices, including interface configurations, device identification and location, functioning network services, neighboring devices in the network, and other information. For more details, see The Device Viewer.Interface Viewer: Provides information on individual interface connectivity, performance, and configuration settings. Network Viewer: Lists VRFs that route traffic for the currently selected network, and VRFs imported from other VRF-aware devices that route traffic for the virtual network.Issue Viewer: Shows detailed information about device Issues detected by NetMRI.Job Viewer: Provides execution and error information about job scripts written and ran through NetMRI.
The following table provides explanations about the various icons you will encounter in the NetMRI graphical user interface, including icons that appear in many tables in the system.
Table sample
Copy: Copies a selected record.
Edit: Click here to edit a record in a table.
Schedule: Where applicable, schedules the item in the table for execution.
Run Now/Actions: Where applicable, Run Now immediately executes the directives in the current table record. The Actions icon contexts provide features to execute against individual records in data tables throughout the entire NetMRI system.
Test Policy: Where applicable, tests the currently selected Policy.
CSV Export: Where applicable, export the contents of the current record to a tab-delimited file suitable for viewing in Excel.
Delete: Deletes a selected record from a NetMRI table.

Infoblox NetMRI 7.4.4 Administrator Guide Part 1 Introducing and Configuring NetMRI
Copyright ©2020, Infoblox, Inc. All rights reserved. Page 23
Add: Adds a new record to a table of NetMRI items.
Tools: Opens a set of networking utilities for network admins to perform troubleshooting and device communication tasks, such as Ping, Traceroute, SNMP Walks, and other operations.
Background Task indicator bar: Indicates that NetMRI is performing a background task. Appears on the NetMRI toolbar and disappears when the task completes.
Settings: An important icon providing a hierarchical list of configuration settings such as User Admin, Issue Analysis configuration, general Setup, Notifications setup, Database setup, and other fundamental areas that define how NetMRI operates.
General online Help: Provides the entire online Help information window without specificity to the currently displayed feature page in NetMRI.
Context-sensitive online Help: Provides online help from which the currently displayed UI page can show Help for that feature in a separate popup window.
Refresh Grid: Allows refreshing of a complete table list or 'grid' of information. NetMRI collects the same body of related information for the table, including any possible changes that may have occurred since the table was last compiled.
Arrows: These are used to move the view horizontally and vertically in the Topology Viewer under Network Explorer.
Zoom In and Zoom Out: Tools to magnify or shrink the view in the Topology Viewer under Network Explorer.
Fit Content: A tool to resize a large map or a small view of a map to fit the entire graphic pane in the Topology Viewer under Network Explorer.
Edit: Allows you to add or delete nodes and edges in the Topology Viewer under Network Explorer.
Add Node: Allows you to add a new node in the Topology Viewer under Network Explorer.
Add Edge: Allows you to add an edge in the Topology Viewer under Network Explorer.
Delete Selected: Deletes a selected node or edge in the Topology Viewer under Network Explorer.

Infoblox NetMRI 7.4.4 Administrator Guide Part 1 Introducing and Configuring NetMRI
Copyright ©2020, Infoblox, Inc. All rights reserved. Page 24
•
••••••
1.2.
1.2.
1.2.3.
••
•
•
Reload: Reloads the graph in the Topology Viewer under Network Explorer after some changes are made.
Working with Table Information
Most NetMRI tables are highly customizable. You can perform the following functions with the tables:
Select multiple table rows for modification or deletion, select multiple pages from a table, and select all rows/table records for any table.Sort, reorder, and resize columns, and show/hide columns.Refresh to display changed data.Filter tables to sift through quantities of data and locate desired data records.Create and apply views, so you can quickly recreate a particular table layout.In tables listing issues, you can filter by issue activity type.Perform a quick search in a table, and jump from IP address hyperlinks to frequently-accessed destinations.
Sorting Table DataTo sort rows based on the contents of a column (method 1):
Click the column heading.Click the heading again to sort in the other direction. The sorted column will have an arrow indicating sort direction.
To sort rows based on the contents of a column (method 2):
Hover over the heading for the column to sort, then click the down arrow at the right end of the column heading.In the drop-down menu, click Sort Ascending or Sort Descending, as desired. You can sort one column at a time.
To hide or show columns, perform the following:
Hover over any column heading, then click the down arrow at the right end of the column heading.In the drop-down menu, hover over Columns.In the Columns submenu you can perform the following:
To hide a column, uncheck the chosen column.To show a column, click the checkbox for the chosen column. At least one column must remain visible in any table.To resize a column, in the table heading row, hover over the column border, then drag the border left or right.To reorder a column, in the table heading row, drag the column heading. (Blue arrows indicate where the column is inserted.)
Selecting Table DataIn a table, NetMRI displays data on multiple pages when the number of items to be displayed exceeds the maximum number of items that can appear on one page. Use the navigational buttons at the bottom of the table to page through the display.
You can select multiple rows in a table. For example, in a Windows browser, you can perform the following to select multiple rows:
Table rows in NetMRI frequently provide sets of icons for editing, exporting, and deleting relevant table records, among other functions. For a closer look at record editing functions in NetMRI tables, see the Icons and Popup Windows topic.

Infoblox NetMRI 7.4.4 Administrator Guide Part 1 Introducing and Configuring NetMRI
Copyright ©2020, Infoblox, Inc. All rights reserved. Page 25
•••
1.2.
3.4.5.6.
1.2.
Click the check boxes adjacent to each other to select contiguous rows.Click the check boxes for any row, separated by any number of rows, to select multiple non-contiguous rows.Click the check box in the Select column of the table header to select all rows on a page, as shown in the figure.
When you click the check box in the Select column of the table header, in a table that contains multiple pages, only the rows on the current page are selected. All selected rows are greyed out on the table page, denoting their selection. After you select all rows on a page, you can deselect a specific row by clearing the check box for the row. The remaining table rows remain selected.
For some tables, the Select check box is to the left of an Action icon. When you select multiple rows of a table, the Action icons are disabled and the Delete button activates. The Delete list option is the only available option after selecting multiple rows. Doing so enables you to delete all selected records from the table. Exercise caution when performing this action, as you may unintentionally delete rows of data that you did not wish to select. Note that NetMRI user accounts with read-only privileges will not be able to perform this action.
Filtering Table DataUse a filter to restrict a table to items of most interest. Filtering operates on specific table columns using operators (such as "=" and "<" for numbers, and "doesn't contain" and "starts with" for strings) and values you specify. You can simultaneously filter multiple columns using terms unique to each column.
To filter a table, perform the following:
Click the Filters button above the column headings. The Filters dialog box appears.Open the Select a new field list, and click the name of the column you want to filter. This creates a new row in the dialog box.In the new row, open the Operator field, then click the desired operator.In the Value field, type the value for the filter (values are case-sensitive).To see how the filter affects the table, click Apply.Click OK. The table is now filtered according to your specifications.
Filter terms can include regular expressions. Any characters between two forward slashes ("/") are interpreted as a regular expression.
To edit or delete a filter, perform the following:
Click Filter.In the Filters dialog, click the Delete button for the term you want to delete. Note that there is no confirmation.
3. To see how the change affects the table, click Apply.
4. Click OK.
Saving Table ViewsYou can save customized table views for future use. A table view saves the current state of a table, including column show/hide state, column order, column size, sort order, and filter (but not quick searches).
The table will not preserve selected rows when you navigate to the next page in the table and then return to the current page.
To fully remove a filter and return the table to its unfiltered state, you must delete all filter terms.
All NetMRI users share the same views. New views, for example, are available to all users, and deleting a view makes it unavailable to all users.

Infoblox NetMRI 7.4.4 Administrator Guide Part 1 Introducing and Configuring NetMRI
Copyright ©2020, Infoblox, Inc. All rights reserved. Page 26
1.2.
3.4.5.6.
1.•
•
1.2.
•
•
•••
To save a table view, perform the following:
Set up the table the way you want by applying a filter and/or showing/hiding columns.Click the Views button (above the column headings), then click Add view in the drop-down menu. The Add View dialog appears.Enter a name for the view (required).Enter a description of the view (optional).To designate this view as the default for the table, click the Default check box.Click OK. The view is now listed in the Views menu.
To apply a view, click Views, then choose the desired view in the drop-down menu.
To edit or delete table views, complete the following:
Click the Views button, then click Manage view in the drop-down menu. The Manage View dialog appears.To modify a table view, click the view, then click the Modify button. In the Modify View dialog box, change the view parameters (name, description and whether it is the default), then click OK.To delete a table view, click the view, then click the Delete button (there is no confirmation).
Issue Table FilteringIssues tables allow filtering by the issue activity type.
To filter the issues table by activity type, perform the following:
Click the Display menu (above the column headers).In the submenu, click the activity type you want to see in the table. See the following types:
All: Displays all issues that existed during the selected time period. This is an important view for real-time analysis because if an issue existed at one point in the day, but was later automatically cleared by NetMRI, it will be listed by selecting All.Current (default): Displays all issues open for the selected time period, or all issues open at the end of the selected time period if before today.New: Displays all new issues during the selected time period.Cleared: Displays all issues that have cleared instances during the selected time period.Suppressed: Displays all issues that have suppressed instances during the selected time period.
Quick Searching Within a TableQuick searching enables you to reduce the number of rows in a table by typing a few characters. NetMRI displays the rows for which it finds a match in any column. Quick searching is dynamic, so you can change the search term and immediately see the results.
To perform a quick search, in the Quick Search field, type at least three characters of the search term (or enter one or two characters), then press ENTER.
To clear quick search results, delete the entry from the Quick Search field.
NetMRI provides an alternative search tool called FindIT, which allows users with limited access rights to search for information on the system. For more information, see Using FindIT for Limited-Access Applications.
If you apply a view, then modify the table (e.g., rearrange columns), the changes are not saved for that view. To save the changes, you must create a new view.
You can enter regular expressions in the Quick Search field. Any characters between two forward slashes ("/") are interpreted as a regular expression.
Infoblox NetMRI 7.4.4 Administrator Guide Part 1 Introducing and Configuring NetMRI
Copyright ©2020, Infoblox, Inc. All rights reserved. Page 27
1.2.
•••
1.
••••••••••
Exporting NetMRI Table DataYou can export data from any NetMRI table displaying the CSV Export icon. Exported data is in standard comma-separated values (CSV) format. You can view exported data in a text editor or a spreadsheet program such as MS Excel.
To export data, perform the following:
Click the CSV Export icon.In the resulting dialog, open the file or save it to disk.
MS Excel can display the first 65,536 rows of data in a large data set.
Using FindIT for Limited-Access ApplicationsNetMRI FindIT is a search engine for retrieving information about network components. FindIT also provides a special limited-access operational role to users who need to use NetMRI to search for devices across the managed network, such as printers and end host computers.
FindIT displays a single field for entering a search term. Unlike Web searches, results returned by NetMRI FindIT are divided into two categories—exact matches and close matches—to narrow the search.
The FindIT search field appears in the upper right corner of the main NetMRI browser window, to the right of your user name and the Logout hyperlink.
Performing a FindIT Search To maintain simplicity, FindIT does not accept multiple search terms or enable definition of complex search mnemonics. For instance, you cannot enter two MAC addresses, or an IP address and a device type, in the same search term. You can enter punctuation and special characters in search terms (such as a "." in an IP address), and if meaningful in the context of the search, FindIT will also use them as part of the term.
Also note the following about the FindIt tool:
FindIT only searches for and finds things that are inventoried in NetMRI.FindIT does not search forwarding tables.FindIT does not only search ARP tables when the advanced search criteria is modified to request that.
To perform a FindIT search, complete the following:
In the FindIT search field, enter all or part of any of the following:
Device nameIP addressNetwork ViewMAC addressModelSoftware versionVendor nameModel nameDevice typeInterface identification
NetMRI FindIT is particularly useful for people who are not regular NetMRI users. They can examine basic component data without having to request information from the network or IT personnel. These users can access FindIT using a special login dedicated to that function (this login does not allow access to any other system functions). If a user has only the FindIT privilege, they will see a dedicated FindIT page when they log in, that provides no other access to NetMRI software functions.

Infoblox NetMRI 7.4.4 Administrator Guide Part 1 Introducing and Configuring NetMRI
Copyright ©2020, Infoblox, Inc. All rights reserved. Page 28
••
•
1.2.3.
1.2.3.
1.2.
2. Press ENTER, or click the Submit Search button. Search results appear in a new page.
NetMRI LicensingAny and all NetMRI appliances and virtual appliance platforms can be licensed to run any NetMRI features. Starting with NetMRI 7.2.1, you can apply a new license or modify the existing license on a NetMRI physical appliance through the license generate administrative shell command. To use this command on a NetMRI virtual appliance, contact Infoblox Technical Support at http://support.infoblox.com. Infoblox Technical Support will generate a license file for you or enable the license generate command so you can generate a license on your own.
When applying the license file using the license generate command, you can choose to deploy the NetMRI appliance in the standalone or Operations Center mode. For more information, see license generate command.
On the License Management page (Settings icon –> General Settings –> License Management), you can review your license configuration and upload the customer license or evaluation license file. The Current License Configuration panel displays your license type, expiration date, and license ID. You can use the license show and show license commands to review your license configuration.
Infoblox offers the following NetMRI licensing types:
Full NetMRI: The complete NetMRI package that includes all features from Automation Change Manager.SPM2: Includes all features for the switch port management, except for Configuration Management, Policy Compliance and Performance features, Dashboard, and reports related to disabled features. For more information, see Switch Port Management.Automation Change Manager: A superset of Switch Port Manager that includes support for the Automation Task Pack functions in NIOS, but excludes a few major features, such as Policy Management and Performance Management. For more information, see Job Management and Automation Change Manager.
Using Evaluation LicensesYou can obtain a single 60-day evaluation license for the NetMRI license type that is not currently under a purchased license, and if you have not already received a temporary license. For example, you may be currently running the Switch Port Manager as an original purchaser and wish to look at either Automation Change Manager (ACM) or the complete NetMRI package, you can obtain an evaluation license for ACM or Full NetMRI.
To obtain an Evaluation License file, perform the following:
Go to Settings –> General Settings –> License Management. In the Evaluation License File Generation section, note the serial number.Go to http://support.infoblox.com and complete the license registration form by using the noted serial number. The registration site generates an Evaluation License file, which is valid for 60 days. Download the license file to your workstation.
To install the Customer License or Evaluation License file through the NetMRI GUI, perform the following:
Go to Settings –> General Settings –> License Management. In the License Installation section, click Choose File, then locate and select the license file.Click OK.
To install the Evaluation License file using the administrative shell command, perform the following:
Open a command line session through SSH to the NetMRI system.Enter the command set temp_license. See the following example:
> set temp_license1. Add Switch Port Manager license2. Add Automation Change Manager license
The customer name in a license must be specified in the ASCII encoding regardless of whether you generated the license on your own or obtained it from the Infoblox Support Team.

Infoblox NetMRI 7.4.4 Administrator Guide Part 1 Introducing and Configuring NetMRI
Copyright ©2020, Infoblox, Inc. All rights reserved. Page 29
1.2.
3.
3. Add NetMRI licenseSelect license (1-3) or q to quit: 2This action will generate a temporary 60-day Automation Change Manager license.Are you sure you want to do this? (y or n): yAutomation Change Manager temporary license installed.Expiration: 2017-10-27Temporary license installed
Adding Network Devices to the License Count
NetMRI applies all detected and managed devices to the appliance's license count. After new systems are installed in the network, you can Discover the device and add it to the NetMRI license count.
To license a network device in NetMRI, perform the following:
Under Network Explorer, click the respective hyperlink for a device. The Device Viewer appears.Under the Device Viewer's Settings & Status –> Management Status pane, click License. Choose Automatic, Licensed, or Unlicensed.
Click OK after choosing your option for the selected device.
NetMRI gives priority to explicitly licensed devices in determining which devices to manage. Unlicensed devices continue to be managed by NetMRI, but their data sets are limited to basic discovery data.
NetMRI Security SettingsUse the Security page (Settings icon –> General Settings section –> Security) to configure certificates and define HTTPS, SNMP, and SSH settings. The settings you define here ensure that communications between NetMRI and managed network devices conform to best-practice security protocols. You must upload X.509 certificates in PEM format. Also, certain authentication and authorization services, such as LDAP, allow the use of certificates between the
To economize on Switch Port Management device licensing, or on any licensing, be aware that some device types don't warrant the allocation of license units from NetMRI. Examples include smart hubs and many PC clients in the network. NetMRI will discover these devices and include them in topologies, but such network devices don't necessarily require frequent change management; thus, simple discovery is sufficient for such devices and licensing is not required.

Infoblox NetMRI 7.4.4 Administrator Guide Part 1 Introducing and Configuring NetMRI
Copyright ©2020, Infoblox, Inc. All rights reserved. Page 30
••
1.
2.3.4.
5.
requesting client (NetMRI) and the server to protect connections from passing user login information and client-server exchanges in the clear.
The following four tabs appear on the Security page:
NetMRI HTTPS Settings
In the NetMRI HTTPS Settings tab, you can perform the following:
Install an HTTPS certificate. For information, see Installing HTTPS Certificate.Enable or disable HTTP and HTTPS protocols. For information, see Running the NetMRI GUI in HTTP Mode.
When HTTPS is enabled, you can select one or more CipherSuites to be supported. A Cipher Suite is a combination of a transport protocol (e.g., TLS), an encryption algorithm (e.g., AES128), and an authentication algorithm (e.g., SHA). Most web browsers support a wide range of Cipher Suites. The list of default combinations provided by NetMRI are generally sufficient for most environments. High assurance environments should select only the Cipher Suites that are defined in their specific network security policy.
SSH Settings
Use the SSH Settings tab to configure the SSH protocols and ciphers used by NetMRI when connecting to network devices for configuration file collection and Configuration Command Script execution (i.e., Client mode); and the SSH protocols and ciphers supported by NetMRI when accepting connections to the Administrative Shell (i.e., Server mode). In both cases, you can selectively enable or disable the SSH v1 and SSH v2 protocols, and specify the ciphers to be supported by each protocol. For information, see Configuring Global SSH Settings.
SSH v1 does not support cipher selection in Server mode because the NetMRI SSH server automatically negotiates the cipher based on the request from the SSH v1 client.
SNMP Settings
Use the SNMP Settings tab to specify the version and community/password for accessing the NetMRI SNMP agent. By default, SNMP v1 and SNMP v2c are enabled with a default community string. High assurance environments may disable those protocols and enable SNMP v3, providing an appropriate passphrase. The NetMRI SNMP Agent is automatically configured and restarted when the settings are updated. For information, see Configuring Global SNMP Settings.
The SNMP Settings form applies only to the SNMP agent, not the SNMP protocols used by NetMRI to access network devices. When accessing network devices, NetMRI attempts SNMP v2c first, then tries SNMP v1.
CA Certificates
The CA Certificates tab provides importing and management of X.509 certificates from trusted Certificate Authorities for operations such as Active Directory and LDAP server authentication. For information, see Installing CA Certificate.
Also, see About CA Certificates for Cisco APIC for APIC-specific information.
Installing HTTPS CertificateThis process involves two tasks: Generating the CSR and sending it to the CA, and importing the new certificate from the CA.
To install an HTTPS certificate, perform the following:
Using SSH or SCP, connect to the NetMRI Administrative Shell and enter the following command:configure certificatesWhen prompted to select the certificate type, select https.When prompted for an action, choose 1. Generate CSR.When prompted to enter information for the CSR, the only required field is Common Name. You must enter the IP address or hostname of the NetMRI appliance. All other fields are optional.When the appliance generates the CSR, copy the text, as shown in the example, and paste it into the Certificate Request page of the site from which you are requesting a certificate.
-----BEGIN CERTIFICATE REQUEST-----
MIIC5zCCAc8CAQAwZDELMAkGA1UEBhMCR0IxEjAQBgNVBAgTCUJlcmtzaGlyZTEQ

Infoblox NetMRI 7.4.4 Administrator Guide Part 1 Introducing and Configuring NetMRI
Copyright ©2020, Infoblox, Inc. All rights reserved. Page 31
1.2.3.
1.2.3.4.
MA4GA1UEBxMHTmV3YnVyeTEXMBUGA1UEChMOTXkgQ29tcGFueSBMdGQxFjAUBgNV
BAMTDTE3Mi4yMy4yNy4xOTEwggEiMA0GCSqGSIb3DQEBAQUAA4IBDwAwggEKAoIB
AQDCUvDcvohVWY7tWJo/9D1Olkc9u/nXCpzdhkB1t+hPnY4b1uInhLvcJATqM6u4
kmPIqxCLFfuR3x2RYaiWiayHQP0VxUlz46UNeTPiHM8xdpX1yrclBLMfvBypZW4C
ptKgKhrn1bUV4v8qilGCkPUUICS82jSdFcSVp6pSnkfKIst+pecoX9C5jkIH/p7E
t1xXkJ2HUl92+S59o/Y0/B3V+MrBh9fy/enormcMX9dfjqJHK8FCSjezYw8TFO5V
Dz0Wf31vtQ7WD50aALDJX1gmwna0WdtDyEd2lp2XV/zFvg6eo6W+q9Wbfq+dewBA
FXXudk8ZEVICQOeRS4lRrF/jAgMBAAGgPjA8BgkqhkiG9w0BCQ4xLzAtMAkGA1Ud----END CERTIFICATE REQUEST-----
When you receive the CA-signed certificate, upload it to the appliance and activate it. Note that the certificate must be in PEM format and the file must have a .crt extension.
6. In the Settings icon –> General Settings –> Security page, click the NetMRI HTTPS Settings tab.
7. In the HTTP Certificate section, click Upload. A message dialog appears stating the following:
The NetMRI HTTP and HTTPS server settings are about to be updated and the web server restarted. If the NetMRI web server becomes inaccessible as a result of these changes, login to the NetMRI admin shell using SSH and run the command configure http to update the web server settings. Do you wish to proceed?
8. Click Yes to proceed.
9. In the Upload dialog box, click Browse. For the .PEM-format certificate file, select the respective file, and then click Upload. The HTTPS Certificate section updates with the new information.
Running the NetMRI GUI in HTTP ModeNetMRI allows operation in both Hypertext Transfer Protocol Secure (HTTPS) mode and in HTTP. By default, both modes are enabled. However, Infoblox recommends disabling the HTTP mode.
To enable or disable the HTTP and HTTPS modes, perform the following:
Go to Settings –> General Settings –> Security.Click the Net MRI HTTPS Settings tab.Select Enable HTTP for the Net MRI Interface, Enable HTTPS for the NetMRI Interface, or both.
4. Close the Settings window.
Configuring Global SNMP SettingsYou can define the default SNMP protocol settings that are used by NetMRI. To configure SNMP settings for the appliance, complete the following:
Go to the Settings icon –> General Settings –> Security page and click the SNMP Settings tab.Enable or disable Version 1/2c. If enabled, enter a Community String.Enable or disable Version 3. If enabled, enter an SNMPv3 Passphrase.Click Update.
Use caution when saving your settings for UI browser operation. Settings on this page affect the operation of the Web server that is built into NetMRI, requiring a restart of the NetMRI web service. In case of a mistake (accidentally disabling both HTTP and HTTPS, for example), you may not be able to access the web interface after committing settings. To address this, use a terminal program, using the admin account, to connect to the NetMRI admin shell and run the configure http command, which is the command-line version of the feature set presented in the NetMRI HTTPS Settings tab.

Infoblox NetMRI 7.4.4 Administrator Guide Part 1 Introducing and Configuring NetMRI
Copyright ©2020, Infoblox, Inc. All rights reserved. Page 32
1.2.
••
••
1.2.3.4.5.
1.2.3.4.5.
1.
2.3.4.5.
Configuring Global SSH SettingsYou can define the default SSH protocol settings that are used by NetMRI. To configure SSH settings for the appliance, complete the following:
Go to the Settings icon –> General Settings –> Security page and click the SSH Settings tab.Configure settings to be used when NetMRI connects to network devices for configuration collection or Configuration Command Script execution (you must enable at least one protocol).
Enable or disable SSH v1 Client Status. If enabled, select an SSH v1 Client Cipher.Enable or disable SSHv 2 Client Status. If enabled, click, CTRL+click or SHIFT+click to select SSH v2 Client Ciphers.
3. Configure settings to be used by NetMRI when accepting connections to the Admin Shell (you must enable at least one protocol).
Enable or disable SSH v1 Server Status.Enable or disable SSH v2 Server Status. If enabled, click, CTRL+click or SHIFT+click to select SSH v2 Server Ciphers.
4. Click Update.
Subsequent attempts to access the NetMRI Admin Shell must comply with the new settings.
Installing CA CertificateTo install a CA certificate, perform the following:
Go to the Settings icon –> General Settings –> Security page and click the CA Certificates tab.Click Import.In the pop-up window, enter a logical name for the new certificate.Click Browse to locate the certificate file.Click Import to import the CA certificate to NetMRI. The certificate is added to the appliance. The newly imported CA Certificate will appear in the table in the CA Certificates tab after the import is complete.
About CA Certificates for Cisco APICNetMRI accepts CA certificates and certificate chains. Therefore, you can upload both root and intermediate (one-file certificate chain) certificates. Next, are recommendations and best practices for having valid APIC certificates authenticated via HTTPS in NetMRI.
For a Root CA certificate, ensure the following on the APIC side:
You have selected the Root CA certificate as the default Certificate Authority.You have issued a Key Ring certificate request signed by this Certificate Authority.The APIC Key Ring certificate has been created.In the APIC GUI, select Fabric -> Fabric Policies -> Pod Policies -> Policies -> Management Access -> default.Make sure that the Admin Key Ring and Oper Key Ring correspond to the one created in step 3. Now you can upload the Root CA certificate in the NetMRI security settings.
For an Intermediate CA certificate, ensure the following on the APIC side:
You have selected the certificate chain as the default Certificate Authority. This certificate chain must include at least one Intermediate or Root CA certificate.You have issued a Key Ring certificate request signed by this Certificate Authority.The APIC Key Ring certificate has been created.In the APIC GUI, select Fabric -> Fabric Policies -> Pod Policies -> Policies -> Management Access -> default.Make sure that the Admin Key Ring and Oper Key Ring correspond to the one created in step 3. Now you can upload the certificate chain in the NetMRI security settings.
Recommended best practices:

Infoblox NetMRI 7.4.4 Administrator Guide Part 1 Introducing and Configuring NetMRI
Copyright ©2020, Infoblox, Inc. All rights reserved. Page 33
••
•
••
1.
2.
3.
4.
5.
Make sure that the CA marker is set to "True" in the CA certificate. You can check it in OpenSSL.Make sure that the Subject (CN) of the APIC Key Ring certificate is a fully qualified domain name or a distinguished name of the requesting device.When NetMRI tries to establish a connection to the APIC using SSL, it compares the APIC hostname value with the value specified in the APIC Key Ring certificate CN (common name). If they do not match, the certificate verification fails. If you want to specify something different than FQDN, for example, an IP address, for the APIC Key Ring certificate CN, include an additional Subject Alternative Name marker in X509v3 extensions:X509v3 Subject Alternative Name: IP Address:[ip-addr]orX509v3 Subject Alternative Name: DNS:FQDNor both of themX509v3 Subject Alternative Name: DNS:FQDN, IP Address:ip-addrwhere ip-addr is a valid IP address of the APIC device, and FQDN is a valid fully qualified domain name.Make sure to include the following markers in the APIC Key Ring certificate:X509v3 extensions:X509v3 Basic Constraints: CA:FALSENetscape Cert Type: SSL Server...X509v3 Key Usage: criticalDigital Signature, Key EnciphermentX509v3 Extended Key Usage: TLS Web Server AuthenticationCertificate date must be valid.APIC and NetMRI time settings must be valid and accurate.
Configuring a NetMRI Appliance for IPv6Users can manage NetMRI on an IPv6 network. The NetMRI Management port has its own factory default link-local IPv6 address that is unique on its connected subnet. The default IPv6 address derives from the Ethernet MAC address of the NetMRI Management port.
NetMRI operates equally well in IPv4 and IPv6 networks, and reports and manages all devices running dual-stack IPv4 and IPv6 protocols.
You must use a Windows 7 system or better to configure NetMRI to run on an IPv6 network, because Windows 7 natively supports IPv6.
To configure a new NetMRI appliance to be managed through IPv6, perform the following:
Reboot Windows 7, ensure that it is enabled for IPv6 networking, and connect it to the management (MGMT) port of the NetMRI appliance, using a standard Ethernet cable.
On the Windows 7 system, open a command line window and run ipconfig.Check the listing in the Local Area Connection section of the ipconfig listing, and make a note of the interface number associated with the PC's IPv6 Link Local address. The value will have an fe80: Prefix and end with a %* designator, such as fe80:505:ac3b:49b7:dc38%15. The value 15 in this example is the interface number.
In a Windows command line, run the following command: netsh interface ipv6 show neighbor
Find the Interface *: Local Area Connection section (the *** corresponds to the interface number for your PC system's IPv6 address). No entry should be present in this category for any address starting with the fe80: prefix.
In the Windows PC's command line, run a multicast IPv6 ping to all nodes on the subnet where the Management port is running. This executes a multicast IPv6 ping to the NetMRI management port connected to the PC.

Infoblox NetMRI 7.4.4 Administrator Guide Part 1 Introducing and Configuring NetMRI
Copyright ©2020, Infoblox, Inc. All rights reserved. Page 34
6.
7.
8.
9.
In the Windows command prompt, run the following command: ping -6 -n 5 ff02::1
Allow the command to complete whether or not responses occur.
In the Windows PC's command line, run the following command a second time:netsh interface ipv6 show neighbor
The NetMRI Management port IPv6 link-local address should now appear in the neighbor table under theInterface xx: Local Area Connection section, similar to the following:fe80::230:48ff:febc:97da 00-30-48-bc-97-da ReachableThis is the link-local address of the NetMRI appliance's management port.
Open an SSH client session to the NetMRI CLI at the IPv6 address shown in Step 6 along with the interface number. Log in with the factory default username/password admin/admin.Next, you assign a globally routable static IPv6 address on the management port.
In the NetMRI CLI, enter the command: configure server
Step through the command sequence, and enter a new IPv6 address for the management interface in the IPv6 Address (optional) field when it is requested. The address should begin with 2001: Prefix and conform to the IPv6 prefix for the network. Also enter the Primary DNS Server Address, the default gateway, and the Primary DNS Domain. See the following example:
IPv4 Address (optional) [172.23.27.40]:IPv4 Subnet Mask (optional) [255.255.255.0]:IPv6 Address (optional): 2001:db8:a2:2c0:ee22::40IPv6 Prefix (optional): 64IPv4 Default Gateway (optional) []:IPv6 Default Gateway (optional) []:2001:db8:a2:2c0:ee22::1IPv4 Default Gateway (optional) []:IPv6 Default Gateway (optional) []:Primary DNS Server [172.23.27.236]: 2001:db8:a2:2c0::236Primary DNS Domain [qanet.com]: customer.com
10. Save the new settings.
11. Shut down the NetMRI unit and physically install it in the global network. The unit is now reachable on its global static IPv6 address for further CLI configuration and UI access.
Running the Setup Wizard
The Setup Wizard (Settings icon –> Setup –> Setup Wizard) provides a multistep process for installing and configuring NetMRI. As shown in the table below, steps in the Wizard depend on whether it is run during installation or from Settings, and whether you choose to use Auto Discovery.
Setup Wizard: Admin Setup
Infoblox recommends reading the topics in About Network Discovery before running the Setup Wizard for the first time.
This step is present during initial NetMRI setup. It does not appear after NetMRI is successfully configured and the wizard subsequently accessed via the Settings icon –> Setup –> Setup Wizard.

Infoblox NetMRI 7.4.4 Administrator Guide Part 1 Introducing and Configuring NetMRI
Copyright ©2020, Infoblox, Inc. All rights reserved. Page 35
1.
2.
1.
2.
1.2.
The primary administrative account is used by the NetMRI administrator to create user accounts and configure NetMRI. This account's user name and password are also required to access the administrative shell (a command line interface). Other NetMRI users do not have the special privileges available to the administrator. The administrator account is the "superuser" account in the NetMRI appliance.
The primary administrative account's user name is "admin" and cannot be changed. Since this user name is easy to guess, it is essential to assign a strong password to prevent unauthorized users from impersonating the administrator.
Enter and confirm the password for the NetMRI administrative account. Requirements for the password are listed at the bottom of the screen.Click Next.
Setup Wizard: License Install
A license is required to use NetMRI for production or evaluation purposes. Each license is keyed to a specific NetMRI serial number and specifies the maximum number of devices and interfaces that NetMRI can monitor, as well as which software modules are enabled.
You can apply a new license file or modify the existing license using the license generate command. When you receive the file, save it in a location you can access from the Setup Wizard.
Browse to the location of the NetMRI license file, then select the license file. The license file ends with the extension .gpg.Click Next.
Setup Wizard: Welcome
With automatic discovery, NetMRI attempts to discover devices on the network using SNMP and terminal command-line discovery methods. Less configuration is required by using automatic discovery, but it may take longer to completely discover all the devices you expect to be detected and managed.
Disabling discovery means that NetMRI will manage devices that are manually entered during configuration. Devices known to exist, but not explicitly configured, are not included in any reports or topology data. Configuring NetMRI with discovery disabled may take longer depending on the number of devices in the network.
After this step, you specify Discovery Ranges, where you specify the devices, networks, and subnetworks that NetMRI communicates with when executing Discovery.
Enable or disable auto discovery.Click Next.
Setup Wizard: Discovery Ranges
This step is present during initial NetMRI setup. It does not appear after successfully configuring NetMRI and running the setup wizard via Settings icon –> Setup –> Setup Wizard, or installing the license using the Admin Shell. Subsequent license installations can be carried out by going to Settings icon –> Setup –> Settings Summary and clicking the Install link above License Configuration.
Infoblox recommends enabling automatic discovery during the Setup Wizard.
You can add new IP address ranges and seed routers at any time after initial NetMRI setup. IPv4 and IPv6 are supported. For more in-depth information, see the Configuring Discovery Ranges topic.

Infoblox NetMRI 7.4.4 Administrator Guide Part 1 Introducing and Configuring NetMRI
Copyright ©2020, Infoblox, Inc. All rights reserved. Page 36
••
•
••
1.•
••
•
••
1.•
Discovery ranges define the scope of the network that NetMRI explores by defining CIDR address blocks, IP address ranges and IP address wildcards. NetMRI limits its network exploration to the set of ranges defined in this tab. You can also exclude values and ranges from the Discovery process and hence from monitoring by NetMRI.
A CIDR address block is defined by a network address and bit mask (for example 192.168.1.0/24).An IP address range defines a start and ending IP address. For instance, you could define 192.168.1.0 as the start of the IP range and 192.168.1.255 as the end of the IP range.An IP address wildcard pattern defines a single IP address range using a wildcard character or range for a specific set of octets. For example, you could define either 192.168.1.* or 192.168.1.0-255 as the IP address wildcard pattern. An IP address wildcard pattern can substitute an asterisk or range for any single octet in the definition.A desired set of values can also be imported from a *.CSV file.Every discovery range must be associated with a network view. For more information, see Configuring Network Views.
Ranges included in discovery indicate that any device found matching that range is discovered and managed by NetMRI. Ranges excluded for discovery indicate that any device found matching that range is excluded from discovery. Ranges marked Exclude from Management indicate that any device found matching that range is discovered, but NetMRI will not manage/collect data from the device.
Specify IP address ranges to include or exclude during discovery.Click New, select CIDR, IP Range, or IP Pattern and enter the new values according to your selection. Use the CIDR selection to enter an IP prefix with its CIDR mask value, or an IP range with a beginning and ending range of IP addresses. IP Pattern lets you enter a value with a wildcard (* or -) character. Many users will prefer to use the CIDR option.To use a ping sweep for the discovery range, check the Enable Discovery Ping Sweep check box.Ensure that the Network 1 network view is selected from the Network View drop-down list. This network view is automatically created when you run configureserver to perform initial setup on the appliance. You can rename this network view at a later time on the Settings icon –> Setup –>Network Views page.
2. Select the Discovery Mode. For the first network you discover, use the Include in Discovery selection.
3. Click Add.
To edit an item, select an entry and click Edit. Change the value in the Network field above the table, including the subnet mask if necessary (the mask value is a dropdown menu), and then click Save.To delete an item, select an entry, click Delete, and then confirm the deletion.To import discovery setting data, click Import. In the dialog, click Browse to select the CSV file, then click Import. See Discovery Settings Import Formats for information on import file syntax.
4. Click Next.
Setup Wizard: Static IPsYou can specify individual IPs that you explicitly want NetMRI to manage. Adding values to this Wizard step prioritizes the specified addresses over other IPs or subnets specified for Discovery. Static IP entry supports IPv6 and IPv4 values.
Specify IP addresses that you want NetMRI to manage.Click New, enter the new IP address in the IP Address field (subnet is not necessary), and choose the Discovery Mode. For the first network you discover, use the Include in Discovery selection.
If you want to select another network view, ensure the view you select is associated with a scan interface. If the
view you pick is not associated with a scan interface, it will show a caution ( ) icon by its name. The Network 1 network view is automatically associated with the SCAN1 port.
See Running Network Discovery for more information on the NetMRI Discovery process.

Infoblox NetMRI 7.4.4 Administrator Guide Part 1 Introducing and Configuring NetMRI
Copyright ©2020, Infoblox, Inc. All rights reserved. Page 37
•
2.•
••
1.
•
•
•••
Ensure that the network view chosen in the Wizard step Setup Wizard: Discovery Ranges is selected from the Network View drop-down list. For example, you may use the Network 1 network view.
Click Add.To edit an item, select an entry and click Edit. Change the value in the IP Address field above the table or change the Discovery Mode (by default it is set to Include in Discovery), then click Save.To delete an item, select an entry, click Delete, then confirm the deletion. To import discovery setting data, click Import. In the dialog, click Browse to select the CSV file, then click Import. See Discovery Settings Import Formats for information on import file syntax.
3. Click Next.
Setup Wizard: CLI Credentials
NetMRI attempts site-specific username/passwords, in priority order, when first logging into a device via an SSH or telnet CLI connection. When NetMRI determines a password, it saves it as information specific to the device. Lacking a site-specific password, the system will try vendor default credentials in priority order, and use site-specific username/password combinations when trying to determine the new login credentials for a device. They will not be used for vendor default credential checks.
Enter the CLI credentials used by the devices specified in the Discovery Ranges and Static IPs steps. NetMRI will automatically determine which credentials are associated with each device.
To add an item, click New, enter the values for the Priority, Password Type (User or Enable), Username, and Password fields, and then click Add.To edit an item, select the item, click Edit, change the values for the Priority, Password Type, Username, and Password fields, and then click Save.To test an item, select the item, then click Test. In the test dialog, select the Hostname or IP, and then click Start.To delete an item, select the item, click Delete, and then confirm the deletion.To import credential data, click Import. In the dialog, click Browse to select the CSV file, then click Import. See the Adding and Editing Device Credentials topic for import file syntax.
2. Click Next.
Setup Wizard: SNMPv1/2 Credentials
NetMRI uses SNMP read-only community strings to collect data for analysis. The system is pre-configured with several commonly used community strings taken from the list of default community strings configured by the device vendor at delivery time. If the community strings provided during NetMRI installation do not work for a given device, the system tries well-known vendor defaults. If a default community string works for the device, NetMRI begins normal SNMP processing and the "Weak Community String" issue is fired to alert to this condition.
For more information about credential definitions, see Adding and Editing Device Credentials and its subsections.
NetMRI needs the ENABLE password to access configuration files on some devices and to run the Configuration Command Scripts and Perl scripts. To ensure easier identification of NetMRI actions, we recommend the creation of a username and password on your network equipment specifically for NetMRI.
Discovery of VRF configurations and VRF-aware devices requires CLI credentials.
For more information about credential definitions and NetMRI, see Adding and Editing Device Credentials and its subsections.

Infoblox NetMRI 7.4.4 Administrator Guide Part 1 Introducing and Configuring NetMRI
Copyright ©2020, Infoblox, Inc. All rights reserved. Page 38
1.
•••
••
1.
•
••
••
If you are using the optional Compliance Module, the Default Credentials Report shows all vendor default community strings that were able to return SNMP data for a device.
Manually entered community strings are used first, in priority order, then the default community strings are tried in priority order if the Use Vendor Default Community Strings option is enabled in Settings icon –> Setup –> Collection and Groups –> Global tab –> Network Polling panel. Here, you can disable the use of the vendor default community strings for determination of which strings NetMRI can use. This is typically done in installations having tight security setups that have removed all vendor defaults from their installation. Note that this option does not prevent the vendor default from running.
Enter the SNMP v1/2 credentials used by any devices specified in the Discovery Ranges and Static IPs steps. NetMRI will automatically determine credentials associated with each device.
To add an item, click New, fill in the Priority and Community fields above the table, then click Add.To edit an item, select the item, click Edit, change the fields above the table, then click Save.To test an item, select the item, then click Test. In the test dialog, select the Hostname or IP, then click Start.To delete an item, select the item, click Delete, then confirm the deletion.To import credential data, click Import. In the dialog, click Browse to select the CSV file, then click Import. See the Discovery Settings Import Formats topic for import file syntax.
2. Click Next.
Setup Wizard: SNMPv3 Credentials (Rare)NetMRI may use SNMPv3 encrypted community strings to collect data for analysis if SNMPv3 credentials exist for any devices in the network. If SNMPv3 strings are provided for devices, v3 credentials are used before any SNMPv2 credentials.
You can also define SNMPv3 credentials within NetMRI Settings at a later time.
Enter the SNMP v3 credentials used by any devices specified in the Discovery Ranges and Static IPs steps. NetMRI will automatically determine which credentials are associated with each device.
To add an item, click New, fill in the Priority and Community fields above the table along with the required Authentication and Privacy protocols and passwords, then click Add.To edit an item, select the item, click Edit, change the fields above the table, then click Save.To test an item, select the item, then click Test. In the test dialog, select the Hostname or IP, then click Start.To delete an item, select the item, click Delete, then confirm the deletion.To import credential data, click Import. In the dialog, click Browse to select the CSV file, then click Import. See the Adding and Editing Device Credentials topic for import file syntax.
2. Click Next.
Setup Wizard: Seed Routers
NetMRI uses seed routers to quickly perform network discovery. Seed routers are also given priority (like static IP definitions) for determining which devices are counted toward NetMRI's license limits.
For VRF-aware Juniper devices, to ensure device reachability for VRF configurations, prefix a second community string using the "@" character, such as @snmpnet, along with the normal community string (for example, snmpnet) you define for the device. For more information, see Vendor-Specific Requirements for Virtual Device Discovery.
Definition of seed routers is highly recommended for IPv4 networks and is required for IPv6 networks. For more in-depth information, see the Adding Seed Routers topic.

Infoblox NetMRI 7.4.4 Administrator Guide Part 1 Introducing and Configuring NetMRI
Copyright ©2020, Infoblox, Inc. All rights reserved. Page 39
1.••
2.••••
3.
1.•
••
1.
2.
1.
The table lists each defined seed router with its discovery status (as defined in the Network Explorer –> Discovery tab). By reviewing the discovery status for each seed router you can determine whether NetMRI should be able to discover the network successfully, or if there are possible configuration errors preventing network discovery, without having to wait to see what NetMRI finds.
Enter IP addresses for seed routers.Click New, enter the value in the Seed Router IP Address field, then click Add.Ensure that the network view chosen in the Wizard step Setup Wizard: Discovery Ranges is selected from the Network View drop-down list. For example, you may use the Network 1 network view.
Click Add or Add & Discover.To edit an item, select the item, click Edit, change the fields above the table, then click Save.To force immediate discovery, click Add & Discover.To delete an item, select the item, click Delete, then confirm the deletion.To import discovery setting data, click Import. In the dialog, click Browse to select the CSV file, then click Import. See Discovery Settings Import Formats for information on import file syntax. The imported file data are applied as a set of one or more Seed Routers. Ensure that the values are correct before importing.
Click Next.
Setup Wizard: Device Type HintsDevice hints help NetMRI's discovery engine locate specific types of network devices using IP address patterns and DNS name patterns. For instance, if most routers are found at an IP address ending with ".10", specifying "*.*.*.10", and associating the Router device type for an IP address hint, allows NetMRI to prioritize any discovered devices matching that hint, higher in its credential collection queue to help speed discovery. This hint is considered when NetMRI attempts to determine a device's type. You can also specify the device type itself — router, switch, switch-router, firewall, and numerous other choices.
Valid IP address patterns are either the numeric values of the octet, or an asterisk for any number of octets in the IP address. For device name matches, valid DNS characters and the asterisk character are valid definitions. For instance, rtr will match any device name with "rtr" in its definition.
Device hints are optional and used in helping to speed network discovery and to assist with the determination of device types absent other discovery data.
Enter information for device type hints, if necessary.To add an item, click New, select the type in the Device Type dropdown list, enter the required value in the IP Address field, then click Add.To edit an item, select the item, click Edit, change the fields above the table, then click Save.To delete an item, select the item, click Delete, then confirm the deletion.
2. Click Next.
Setup Wizard: Device Interrogation TechniquesThis Wizard step defines the methods by which NetMRI polls network devices for information. Those protocols are based upon three methods: CLI, SNMP, and ARP.
Select desired interrogation options (descriptions are provided in the Wizard step, and in the Defining Group Data Collection Settings topic). Enable any options you consider applicable for your network.Click Next.
Setup Wizard: Configuration CollectionThis Wizard step defines the methods by which NetMRI obtains information such as routing tables, ARP tables, and device configuration files.
Select desired configuration collection options (descriptions are provided in the Wizard step). Under most circumstances, it should not be necessary to modify settings in this step.

Infoblox NetMRI 7.4.4 Administrator Guide Part 1 Introducing and Configuring NetMRI
Copyright ©2020, Infoblox, Inc. All rights reserved. Page 40
2.
1.
2.
1.2.
3.•••••
4.
5.
6.
Click Next.
Setup Wizard: SummaryThe final step of the Setup Wizard summarizes the steps you have taken during setup.
Study the summary information in this final Wizard page before finishing the setup. For any item flagged as a possible configuration problem, click the Edit link to go directly to the corresponding step in the wizard to make changes. After making changes, return to the Summary step.Click Finish.
Setting the Date and PeriodIn many tabs and pages, you can constrain data and graphs to a specific date and period. This is useful in many contexts that provide a lot of information, such as Network Analysis –> Issues or in Switch Port Management.
After you set the date and/or period, it is applied to all tabs and pages displaying the Select Date/Period icon. To specify a date or a time period for a data set, complete the following:
Choose a Device Group on the right menu, and choose a menu item from the left side of the page.Click the Time Selector in the left end of the title bar. The calendar drop-down menu appears showing the current calendar month.In the calendar drop-down menu, choose a Period. Choices include the following:
Daily: Select a single date in the currently shown calendar month.Weekly: Sunday to Saturday, seven day period containing the selected date.Monthly: Entire calendar month containing the selected date.7-Day: Seven days ending with the selected date.30-Day: Thirty days ending with the selected date.
In the gray title bar of the calendar, click the left or right selector to choose the calendar month that contains the date or time period you want.Calendar dates shown in green represent an immediately available data set to display in a NetMRI table. The most current data in any table (such as the most recent 7 days for the Daily selection) is always available by default and appears highlighted in green. Older data appears in white on the calendar but is selectable by the user. Dates in white require the user to wait while NetMRI generates the requested data as a background task. After generation, the requested date appears in green, indicating the data is instantly available by reloading the page. Any date in the past or in the future that appears in gray and cannot be selected, represents information that is unavailable to the current NetMRI system.In the calendar, click the desired date. The table will automatically refresh to display the new date.
Dates that appear in white in the calendar reflect locally stored data that is available but not cached for immediate viewing on the NetMRI appliance. In such cases, you will see the following message:
Data for the requested date is currently offline. Do you want to generate the data now?
Clicking Yes directs NetMRI to retrieve and display the data from the internal database. During data retrieval, the toolbar displays a progress bar indicating that a background task is taking place. Other tasks can be carried out in NetMRI while fetching data from the database.
Note
The selected device group, date, and period appear to the right of the Time Selector icon.

Infoblox NetMRI 7.4.4 Administrator Guide Part 1 Introducing and Configuring NetMRI
Copyright ©2020, Infoblox, Inc. All rights reserved. Page 41
•
•
••
•
•
•
•
•
•
•
•
•
•
Some data tables, such as Network Insight –> Inventory, display only in Daily increments.
Using the IP Address Context MenuRight-clicking any IP address in a NetMRI list or table, such as in the Discovery page or a Devices list, pops up a context menu for quick access to more functions. The menu contains the following commands:
Device Viewer: Opens the Device Viewer to the default Network Analysis –> Issues tab, which lists issues for the device.Config Explorer: Opens the Device Viewer to the Device Viewer –> Config Management –> Config Archive tab, which lists configuration files collected from the device.View Running Config: Opens a window to display the configuration currently running on the device.Changes: Opens the Device Viewer to the Device Viewer –> Network Analysis –> Changes tab, which lists detected changes to the device's configuration file.Issue List: Opens the Device Viewer to the Device Viewer –> Network Analysis –> Issues tab, which lists issues for the device.Policy Compliance: Opens the Device Viewer to the Device Viewer –> Network Analysis –> Policy Compliance, which lists policies run against the device, and the outcomes of those policies. For more details, see Introducing Policy Compliance.Topology Viewer: This submenu allows viewing of devices in the context of various topologies: L2 n Hop, L3 n Hop, L3 Path Viewer (most likely path), and L2/L3 Path Viewer (most likely path).Schedule Job: Opens the Edit Job dialog for specifying a job to run on the current device. Note that you can also include other devices and groups.Execute Command: Opens the Run Configuration Command Script dialog, where you can specify and submit a command to run on the device.Open Telnet/SSH Session: Opens a new terminal session for the selected device through NetMRI using either SSH or Telnet.
Quick StartThe following quick start guide lists common NetMRI tasks. Check the items below for quick introductions to many of NetMRI's key features.
Task Procedure
View the Network Scorecard and general information about network health
Network Analysis –> Issues tab.
To change the scope, choose a group name in the Select Device Groups panel.To view a description of an issue, hover over a hyperlink in the Title column in the table.To view issue details, click a hyperlink in the Title column in the table.To view devices having issues, choose the Issues by Device tab below the table.
Note
The Interface Viewer uses a different Time Selector menu that provides separate Date and Period menus. Users can check the status of an individual device over time. For more information, see Using the Interface Viewer.

Infoblox NetMRI 7.4.4 Administrator Guide Part 1 Introducing and Configuring NetMRI
Copyright ©2020, Infoblox, Inc. All rights reserved. Page 42
•
•
•
•
•
•
•
Task Procedure
Set interfaces to administratively Up or administratively Down
Set VLAN assignment for a switch interface
Interface Viewer –> Settings –> Port Control Settings. Click Edit for each setting.
The interface viewer can be found in several different ways, examples include Network Explorer –> Inventory –> Interface Config or Network Explorer –> Inventory –> Unused Down Ports and clicking an interface link.
View network performance data Network Analysis –> Performance –> History section (left panel).
Check the list of scan interfaces Settings –> Setup –> Scan Interfaces.
View network events Network Analysis –> Events tab.
List all devices in the network Network Explorer –>Inventory –> Devices section (left panel) –> Devices.
View all Ethernet switchports managed in the network Network Explorer –> Switch Port Management –> Interfaces –> Interfaces Present.
View a variety of information about NetMRI appliance setup The Settings Summary (Settings icon –> Setup –> Settings Summary) provides a variety of information about the NetMRI appliance:
NetMRI Configuration: This panel displays the current NetMRI version, model, serial number and license limit settings, and information about Platform, Licensed and Effective limits for the current appliance.Network Configuration: This panel displays the NetMRIsettings as configured during installation.MGMT Interface Configuration: This panel displays the configuration settings for NetMRI's management interface.SCAN Interface Configuration: This panel displays the configuration settings for NetMRI's data collection interface.Collector Settings: This panel displays the status of each collector. Some collectors may be disabled if the required license is not installed. Enable collectors at Settings icon –> Setup –> Collection and Groups.Module Settings: This panel displays the status of the available NetMRI modules. Enabling any disabled module requires an updated NetMRI license.License Configuration: This panel identifies the current license information and provides a hyperlink to a page for updating your NetMRI license.
View low-level details about a specific device Click any IP address hyperlink to open the Device Viewer.
List all interfaces in the network Network Explorer –> Inventory –> Interfaces section (left panel) –> Interface Config.

Infoblox NetMRI 7.4.4 Administrator Guide Part 1 Introducing and Configuring NetMRI
Copyright ©2020, Infoblox, Inc. All rights reserved. Page 43
•
••
Task Procedure
View information about routes, subnets, VLANs, HSRPs/VRRPs, and ports in the network
Network Explorer –> Summaries tab, and then select a category in the left panel.
To change the scope, click a group name in the Select Device Groups panel.To see details, click a hyperlink in the left panel.To dig even deeper, click a hyperlink in the center panel.
View Imported and Exported Route Targets The Route Targets accordion in the left panel in Network Explorer –> Summaries.
Check Network Views and their members Settings –> Setup –> Network Views, and click the network view name.
Check the list of VRFs and view their information The VRFs accordion in the left panel in Network Explorer –> Summaries. For VRFs in a specific network, click Settings –> Setup –> Network Views, and then click the network view name.
View a graphical map of the network Network Explorer –> Topology tab, and then select a category in the left panel.
Compare configuration files between devices on the network Config Management –> Config Archive tab, select a device in the left panel, select two configuration files in the right panel, then click Compare.
To compare configuration files for two devices, click Compare Second Device, select one configuration file for each device, and then click Compare.
Write scripts and run jobs Config Management –> Job Management tab.
Quickly find data Type an IP address, MAC address, device name, vendor, model, software version, or interface identification in the FindIT field (in the upper right corner of the main NetMRI page), then press ENTER.
To view more information about a found item, go to the respective results page and hover over the plus sign.
Perform diagnostic tests Click Tools on the right-hand side of the main navigation area to open the NetMRI Tools window. Then select a diagnostic tool in the right panel. Or you can click Tools at the top of the Device Viewer or Interface Viewer.
Perform administrative functions, such as manage user accounts, and change program settings
Click Settings on the right-hand side of the main navigation area to open the General Settings window. Select an operation in the right panel.
Get help Click the Help icon on the right-hand side at of the navigation page to launch the help system. Or you can click Page Help in the title bar of any page to directly access help for that page.
Viewing NetMRI Setup Information

Infoblox NetMRI 7.4.4 Administrator Guide Part 1 Introducing and Configuring NetMRI
Copyright ©2020, Infoblox, Inc. All rights reserved. Page 44
••
•
•
•
•
•
•
•••••
••
You can check the overall system settings for the current NetMRI appliance anytime. Click the Settings icon and then Settings –> Setup –> Settings Summary to get a quick look at many basic aspects of the system–license limits and configuration, basic network configuration, settings for configuration data collection, and other functional areas through which NetMRI does its work.
NetMRI Configuration: This panel shows the NetMRI version, model, serial number, and license limit settings.Network Configuration: This panel displays the NetMRI network domain settings as configured during step one of the installation process.MGMT Interface Configuration: This panel displays the configuration settings for the NetMRI management interface.Device and Interface Counts: This panel displays the current number of network devices and interfaces that NetMRI discovers up to the current time through its data collection across the network. Note the Total Interfaces and Up Interfaces counters, along with Frequently Polled Interfaces, and any possible differences between Network Devices Seen and Managed Network Devices.Collector Settings: This panel displays the status of each collector used for gathering information about the networks that NetMRI analyzes and monitors. Some collectors may be disabled if the required license is not installed. Enable collectors at Settings –> Setup –> Collection and Groups.Module Settings: This panel displays the current NetMRI software version. The possible versions are the following: Switch Port Manager, Automation Change Manager, and full NetMRI.License Configuration: This panel identifies the current license information and provides a hyperlink to a page for updating your NetMRI license.
Many of these settings are defined through the Setup Wizard.
About Automatic FailoverYou can create a NetMRI failover pair using two NetMRI appliances, in which one acts as the primary appliance and the other as the secondary appliance. A failover pair provides a backup or redundant operational mode between the primary and secondary appliances so you can greatly reduce service downtime when one of them is out of service. You can configure two Operation Center (OC) appliances, collector appliances, or standalone appliances to form a failover pair.
In a failover pair, the primary appliance actively discovers and manages network devices and serves the Web UI and the CLI over the shared VIP address while the secondary appliance constantly keeps its database synchronized with the primary. Although you can access a failover pair using either the VIP address of the failover pair or the management IP address of the primary appliance, using the management IP is not recommended because, during a failover, the roles of the primary and secondary appliances reverse and the management IP becomes unreachable. Accessing the failover pair using the VIP address ensures that you are contacting the active primary appliance. Note that during a failover, all active connections between the NetMRI appliances and the network devices are disrupted and all ongoing processes fail. Also, all active Web UI and CLI sessions are disrupted during a failover and all users with active sessions must reconnect and log in again after the secondary appliance assumes the role of the primary appliance.
Note the following about the automatic failover feature:
Failover pair is supported only on NetMRI NT-1400, NT-2200, and NT-4000 (G8 only) appliances. It is not supported on NetMRI virtual appliances.Failover is supported in NetMRI 7.1.1 and later releases.Collector failover is supported in NetMRI 7.1.2 and later releases.Both the primary and secondary must be of the same appliance model and same software version number.The management IP address of both the primary and secondary must be on the same subnet.The VIP address, shared by the primary and secondary, must be on the same subnet as the management IP address.
Deploying Automatic Failover for New AppliancesThe following are the pre-requisites for deploying automatic failover for new appliances:
Configure two supported NetMRI appliances with licenses installed.Both the appliances must be of the same appliance model and same software version number.

Infoblox NetMRI 7.4.4 Administrator Guide Part 1 Introducing and Configuring NetMRI
Copyright ©2020, Infoblox, Inc. All rights reserved. Page 45
•
•
•
1.
2.
••
•
•
1.
2.
•
Provision three IP addresses on the same subnet: A VIP address and two management IP addresses for the appliances.If you are using the direct replication method to connect both appliances, you need an Ethernet cable to connect the systems directly through their HA Ports.If you are using the network replication method to connect the appliances, you must connect the systems over a local network and two replication IP addresses must be acquired on the same subnet. You must also select a TCP port for the replication traffic.
You can deploy two new Operation Centers (OC), collector appliances, or standalone appliances to form a failover pair, as follows:
Set up and configure two new NetMRI appliances as separate systems. Ensure that the appliances are running NetMRI 7.1.1 or later. For collector failover configuration, make sure that the appliances are running NetMRI 7.1.2 or later.Connect both the systems using one of the following methods:
Direct replication: Connect the systems directly through their HA ports.Network replication: Connect the HA port of both systems to a network using an Ethernet cable.
Infoblox recommends that you connect the systems using the direct replication method.
3. Run the Setup Wizard on both appliances, set the admin password, and then install the license. The admin password must be the same on both systems. For more information, see Running the Setup Wizard.
At this point of time, it is not necessary to complete the entire configuration wizard on both systems. You can complete the configuration only on the primary system.
4. Configure the failover settings on the Operation Center and collectors, as described in Specifying Automatic Failover Settings.
5. For an Operation Center and collector failover, complete the following:
Log in to the Admin Shell on the Operation Center and run the configure tunserver command. Enter the VIP address of the Operation Center when prompted for the IP address of the Operation Center server.To register collector on the Operation Center set up, log in to the Admin Shell on each Collector and run the register tunclient command. Enter the VIP address of the Operation Center when prompted for the IP address of the Operation Center.
Specifying Automatic Failover SettingsTo specify automatic failover configuration settings:
Go to the Settings -> Setup -> Failover Configuration tab.The Failover Configuration page appears, listing all device interfaces that are used by the system.In the Failover Configuration page, complete the following:
Virtual IP address: Enter the VIP address.
Note
Infoblox recommends that you use the direct replication method for the best reliability and performance. The network replication method will have higher latency and a greater chance of connection breakage, and thus lower reliability and performance.
Note
After specifying the failover configuration settings and completing the enable operation, the systems start synchronizing data. This process might take up to one hour, depending on the appliance model.

Infoblox NetMRI 7.4.4 Administrator Guide Part 1 Introducing and Configuring NetMRI
Copyright ©2020, Infoblox, Inc. All rights reserved. Page 46
•
••
•••••
•
•
•
••
••••••
Connection Mode: Select the connection mode from the drop-down list. You can select Direct if the systems are connected directly through the HA port, or select Network if the HA port of both the systems are connected to a network. Infoblox recommends that you use the Direct connection mode.Virtual Hostname: Enter the hostname for the system.Port: Enter the TCP port for replication traffic, if you are using Network connection mode. You must enter a port number great than 1024.
In the Replication Nodes section, enter the following for both Primary and Secondary.
Role: Displays the role of the appliance, either PRIMARY or SECONDARY.Management IP: Enter the management IP address of the system.Hostname: Enter the hostname of the system.Replication IP: Enter the IP address used for replication traffic, if you are using Network connection mode.Subnet: Enter the subnet mask of the replication IP, if you are using Network connection mode. Note that the subnet mask must be the same for both primary and secondary appliances.
3. Click Update to update the settings and replicate data on both the primary and secondary appliances.
4. Click Enable to start connecting the systems.
The secondary system synchronizes data with the primary system. This process might take about one hour, depending on the appliance model.
Migrating Existing Systems as Failover PairsYou can migrate two existing Operation Centers (OC) or standalone appliances to form a failover pair. Ensure that both appliances are running versions NetMRI 7.1.1 or later. To form a collector failover, migrate the existing collector to NetMRI 7.1.2 or later releases.
The following are the pre-requisites for migrating existing systems as a failover pair:
Two supported NetMRI appliances with licenses installed. You can choose an existing appliance and a second appliance of the same model.For an HA pair, provision three IP addresses: One for the primary appliance, another one for the secondary appliance, and a virtual IP address shared between the failover pair.If you are using the network replication method to connect the appliances, you must connect the systems over a local network and two replication IPs must be acquired on the same subnet. You must also select a TCP port for the replication traffic.
The example further in this section describes the migration of an Operation Center with two collectors to an HA Operation Center with two HA collectors. It uses the following conventions:
A — Nodes of the existing devices.B — Nodes to be added to existing devices as paired.
The steps required to migrate existing systems as failover pairs depend on whether your appliances use the old or new partition scheme. If your appliances use the old partition scheme, you need to additionally prepare them. To determine what partition scheme an appliance has, run the show diskusage command from the Admin Shell and search for the “/drbd0” substring. If the substring is present, the appliance runs with the new scheme.
To migrate existing systems to form a failover pair, perform the steps described in the following sections:
Preparing Secondary Appliances (Old Partition Scheme)Preparing the Existing Operation Center Node (Old Partition Scheme)Preparing the Existing Collectors Nodes (Old Partition Scheme)Configuring a Failover PairReconfiguring the Operation Center HA PairReconfiguring the Collector HA Pair

Infoblox NetMRI 7.4.4 Administrator Guide Part 1 Introducing and Configuring NetMRI
Copyright ©2020, Infoblox, Inc. All rights reserved. Page 47
1.
2.3.4.
5.
6.
1.
2.
3.
••
4.5.6.
7.
8.9.
Preparing Secondary Appliances (Old Partition Scheme)To prepare a secondary (B) device, complete the following:
Install NetMRI with the same version as on node A. If you are using a device that you used earlier, update it to the node A version.If the device was already used, run the reset command on node B.Run the repartition command on node B.Run the config server command on node B.
Install the license on node B. The license must have the same type, device limit, and expiration date as node A.
Reset the admin password in the GUI to match the other system or make UI setup through the Setup Wizard.
You now have the new node with the new partition scheme prepared to participate in the HA pair.
Preparing the Existing Operation Center Node (Old Partition Scheme)To prepare the existing OC node, complete the following:
Follow the steps to prepare node B for HA OC as described in the section above, Preparing Secondary Appliances (Old Partition Scheme).On node A, disable SNMP collection. Go to Settings -> Setup -> Collection and Groups -> Global -> Network Polling and deselect the SNMP Collection check box.Generate a database archive of node A and restore it on node B. For more information, see NetMRI Database Management.
If data is restored successfully, proceed to the next step.If the restore failed due to disk space exhaustion, try reducing data retention settings on your existing NetMRI system to reduce the archive size. It might take up to 24 hours for reduced data retention settings to take effect. For more information, see Data Retention or contact Infoblox Support for further assistance.
Run the configure server command on node B.Run the config tunserver command with the new server IP (IP of node B).Re-enable SNMP collection after restoring the archive on node B. Go to Settings -> Setup -> Collection and Groups -> Global -> Network Polling and select the SNMP Collection check box.Log in to the Admin Shell on node A, enter the reset system command, and then enter the repartition command.After repartitioning is complete, run the configure server command on node A.Install the license.
Note
For the new partition scheme, configure three nodes—one with an OC license and two others with Stand Alone licenses—with the same version and licenses, and reset the admin password in the GUI to match the other system. Then proceed with the last three steps from the list above.
Note
The management port should be in the same network, time zone, etc. as in node A. If you are using scan ports, connect the scan ports of the second node to the network in the same way as in the existing device. For more information, see Failover and Scan Interfaces.
Note
In the case of an Operation Center, run config server again after the license installation without modifying any parameters.

Infoblox NetMRI 7.4.4 Administrator Guide Part 1 Introducing and Configuring NetMRI
Copyright ©2020, Infoblox, Inc. All rights reserved. Page 48
10.
1.
2.
3.4.5.6.7.8.
•••
1.2.
3.4.
5.
1.2.
Reset the admin password in the GUI to match the other system.
The two nodes are now ready for failover configuration where primary will be node B with all OC data, but without connected collectors at this point.
Preparing the Existing Collectors Nodes (Old Partition Scheme)To prepare the existing collectors nodes, complete the following:
Follow the steps to prepare node B for HA Collector as described in the section above, Preparing Secondary Appliances (Old Partition Scheme).Log in to the Admin Shell on the existing node, enter the reset system command, and then enter the repartition command.After repartitioning is complete, run the configure server command.Install the license that should be identical.Reset the admin password in the GUI to match the other system.Log in to the Admin Shell on node A, enter the config tunclient command and connect it to the node B OC.You now have two nodes ready for failover configuration where any of them can be primary.If you want to make node B primary, complete the following:
Log in to the UI of node B (primary) OC and go to Settings -> Setup -> Tunnels and Collectors.Choose the existing collector (A), select Collector Replacement, and insert the Serial Number of node B.Log in to the Admin Shell on node B, enter the config tunclient command and connect it to node B OC (primary).
As the result, you have a new partitioned system (OC (B) and two 2 collectors (A and B)) with prepared secondary devices. Now you can configure a failover pair.
Configuring a Failover PairTo configure a failover pair from the prepared appliances, complete the following:
Log in to the Operation Center UI as admin.Go to Settings -> Setup -> Failover Configuration. Here you can see the HA status of your devices scheme (OC and 2 collectors).Choose OC -> Edit and configure the Operation Center HA pair. Wait until it is finished and the status is OK.Choose the first collector -> Edit and configure the first collector HA pair. Wait until it is finished and the status is OK.Choose the second collector -> Edit and configure the second collector HA pair. Wait until it is finished and the status is OK.
Now you obtained a NetMRI scheme with HA appliances.
Reconfiguring the Operation Center HA PairTo reconfigure the Operation Center HA pair, complete the following:
Log in to the Operation Center CLI as admin.Run the reset tunserver command:oc (primary)> reset tunserverNotice: This operation will clear all Tunnel CA, server, and clientconfiguration and shut down the Tunnel service.
Note
If the failover status is not OK (e.g. Standalone/Replication Down/Not Synced), wait about an hour and try to make a resynchronization from the secondary device.

Infoblox NetMRI 7.4.4 Administrator Guide Part 1 Introducing and Configuring NetMRI
Copyright ©2020, Infoblox, Inc. All rights reserved. Page 49
3.
1.2.
Continue? (y/n) [n]: y
+++ Stopping OpenVPN Server ... OK+++ Configuring OpenVPN Service ... OK+++ Clearing Server Config ...OK+++ Clearing CA Config ... OK
Launching "failover tunserver reset" on "172.19.2.59"...
The server needs to be restarted for these changes to take effect.Do you wish to restart the server now? (y/n) [y]: y
+++ Restarting Server ... OK
Run the configure tunserver command and configure it with OC VIP address (Server Public Virtual Name or VIP address):oc (primary)> config tunserver+++ Configuring CA SettingsCA key expiry in days [5475]:CA key size in bits [2048]:+++ Configuring Server SettingsServer key expiry in days [5475]:Server key size in bits [2048]:Server Public Virtual Name or VIP address [172.19.2.66]: <- By default it will be already oc VIPSelect tunnnel IP protocol. 'udp' recommended for better performance.Protocol (udp, udp6, tcp) [udp]:Tunnel network /24 base [169.254.50.0]:Block cipher:0. None (RSA auth)1. Blowfish-CBC2. AES-128-CBC3. Triple DES4. AES-256-CBCEnter Choice [2]:Use compression [y]:
Use these settings? (y/n) [n]: y
+++ Initializing CA (may take a minute) ...+++ Creating Server Params and Keypair ...Generating DH parameters, 2048 bit long safe prime, generator 2This is going to take a long time
As the result, the Operation Center obtained the new server IP address (failover VIP).
Reconfiguring the Collector HA PairTo reconfigure the collector HA pair, complete the following:
Log in to the collector CLI as admin.Run the reset tunclient command:col2 (primary)> reset tunclient
Launching "show version" on "172.19.2.62"...Notice: This operation will clear all Tunnel clientconfiguration and shut down the local Tunnel service.

Infoblox NetMRI 7.4.4 Administrator Guide Part 1 Introducing and Configuring NetMRI
Copyright ©2020, Infoblox, Inc. All rights reserved. Page 50
3.
4.
1.2.3.
Continue? (y/n) [n]: y+++ Stopping OpenVPN Service ... OK+++ Configuring OpenVPN Service ... OK+++ Clearing Client Config ... OK+++ Adjusting ACLs ... OK
Launching "failover tunclient reset" on "172.19.2.62"...
Run the configure tunclient command and configure it with OC VIP address (Server Public Virtual Name or VIP address):col2(primary)> config tunclient
NOTICE: The inactivity timeout is being disabled temporarily while this command is run.
Launching "show version" on "172.19.2.62"...NOTICE: The time zone on this system is US/Pacific.This MUST match the Operation Center time zone for registration to be successful.If the time zones are not equal, you must first use "configure server" to setthe collector time zone to match.
PLEASE NOTE: Changing the time zone WILL REQUIRE A SYSTEM REBOOT.Do you want to continue registration? (y/n) [n]: y+++ Configuring Tunnel Registration SettingsRegistration Server/IP [e.g., example.com]: 172.19.2.66Registration protocol (http|https) [https]:Registration username: adminRegistration password:
Register this system? (y/n) [y]:y.......This is going to take a long time (really long, about 40 + minutes)
Repeat the above steps for each collector.
The NetMRI system (OC and two collectors) is now migrated as a failover pair.
Manually Initiating FailoverIf you want to swap roles between the members of a failover pair, you can manually initiate a failover. Within about five minutes after initiating a manual failover, the secondary system assumes the primary role and takes ownership of the VIP address. Note that a manually initiated failover causes a temporary service disruption.
To initiate a manual failover using the GUI, complete the following:
Log in to the primary system using your username and password.Go to the Settings -> Setup -> Failover Configuration tab.In the Failover Configuration page, click Become Secondary.
Note
If devices were discovered from both collectors, e.g. when a device has a few interfaces, these devices are displayed in grey without a sim link to the device viewer on the collector which did not discover first. After the system is migrated, the following issue is observed for one of the collectors (second): In Network Explorer -> Discovery, the devices listed on the left from the initial collection and discovered by both collectors cannot be discovered or deleted using the Discover Now or Delete button. However, you can discover them from Settings-> Discovery Settings - > Seed Routers/CIDR.

Infoblox NetMRI 7.4.4 Administrator Guide Part 1 Introducing and Configuring NetMRI
Copyright ©2020, Infoblox, Inc. All rights reserved. Page 51
•
•
1.
2.
•
•
•
•
•
••••••••••••
To initiate a manual failover using the NetMRI Admin Shell, perform one of the following:
Log in to the Admin Shell on the primary system and enter the failover role secondary command, and then click Enter.Log in to the Admin Shell on the secondary system and enter the failover role primary command, and then click Enter.
Monitoring Automatic FailoverTo monitor the current status of the failover pair, complete the following:
Go to the Settings -> Setup -> Failover Configuration tab.The Failover Configuration page appears, listing all device interfaces that are used by the system.In the Failover Configuration page, the Status field displays the current status of the failover pair. The current status can be one of the following:
OK (green): Indicates that the failover pair is connected and synchronized. If the primary fails, the secondary automatically takes over the primary role.Syncing (yellow): Indicates that the failover pair is connected and the primary and secondary are synchronizing data. If the primary fails during synchronization, the secondary system cannot automatically take over as the primary system.Replication Down (red): Indicates that the failover pair is disconnected on the HA port but reachable on the MGMT port. This may be due to a cable mishap or when the secondary goes offline.Peer Down (red): Indicates that the secondary has lost connection with the primary on both HA and MGMT ports.
You can click the status link and view details about the failover status.
Viewing Failover SettingsTo view configuration details of the Operation Center (OC) and Collector pair:
Go to the Settings -> Setup -> Failover Configuration tab.
The Failover Configuration page appears, listing all device interfaces that are used by the system.
Actions: You can click Edit or Status using the Action icon.Virtual IP: Displays the virtual IP address.Virtual Host Name: Displays the virtual hostname.Connection: Displays the connection mode.First MGMT IP: Displays the management IP address of the primary.Second MGMT IP: Displays the management IP address of the secondary.First MGMT Hostname: Displays the management hostname of the primary.Second MGMT Hostname: Displays the management hostname of the secondary.First Replication IP: Displays the IP address of the replication traffic of the primary.Second Replication IP: Displays the IP address of the replication traffic of the secondary.Port: Displays the port number for replication traffic.Status: Displays the connection status. For more information, see Monitoring Automatic Failover.
Note
For an OC collector set up, the first row of the Failover Configuration page displays the OC pair information and other rows display the collector pair information.

Infoblox NetMRI 7.4.4 Administrator Guide Part 1 Introducing and Configuring NetMRI
Copyright ©2020, Infoblox, Inc. All rights reserved. Page 52
1.2.
Failover and Scan InterfacesIn a failover pair, although the scan interfaces are enabled only on the primary system, the scan interface configurations are replicated on both the systems. When the primary fails, the secondary activates its scan interfaces (physical and virtual) using the same IP configurations. Both the primary and the secondary can access the network using the same scan interface configurations. After a failover, the NetMRI appliance continues to interact with the devices using the same scan interfaces.
If no scan interfaces are configured on both failover systems, then the NetMRI appliances interact with network devices using the management port. The physical management port configuration is not replicated between the systems. After a failover, the NetMRI appliance interacts with the devices using the management port of the local system. Therefore, you have to configure the management IPs and infrastructure ACLs on both systems.
Software UpgradesTo upgrade a failover pair, you need to perform a software upgrade only on the primary system. The primary system upgrades locally, and then automatically upgrades the secondary. Note that during the upgrade of both systems, the failover capability is suspended. After upgrading the secondary system, both systems automatically connect and synchronize data.
Resolving Split Brain IssuesGenerally speaking, "Split Brain" is a term used to describe the undesirable state in which both members of a failover pair act as primary at the same time. This is a rare situation which can occur when both the systems are up and running, but the systems completely disconnect from one another on both the MGMT and HA ports at the same time due to a network outage or a cable mishap. Split brain can also occur due to an error in the failover software. In this case, the secondary system assumes that the primary system has failed and takes on the primary role. The primary system, which does not have any contact with the secondary system continues to perform as the primary system. Having two primary systems introduces issues such as VIP contention and duplication of data.
To detect a split brain issue, complete the following:
When the "Lost connectivity via peer replication link" alert occurs, run failover status on both members.Check the failover status: If the failover is enabled and both nodes are in the primary mode, you have the split brain situation.
For example:
NM85 (primary)> failover status
Failover enabled: Yes
Connection state: WFConnection
Replication Role [Local|Remote]: Primary | Unknown
Disk state [Local|Remote]: UpToDate | DUnknown
I/O status: Running
Network data [Sent|Received]: 0 KB | 0 KB
Local disk data [Read|Write]: 141621 KB | 476576 KB
Currently out of sync: 74964 KB
NM84 (secondary)> failover status
Failover enabled: Yes
Connection state: WFConnection
Infoblox NetMRI 7.4.4 Administrator Guide Part 1 Introducing and Configuring NetMRI
Copyright ©2020, Infoblox, Inc. All rights reserved. Page 53
1.
2.3.
1.2.3.
Replication Role [Local|Remote]: Primary | Unknown
Disk state [Local|Remote]: UpToDate | DUnknown
I/O status: Running
Network data [Sent|Received]: 0 KB | 0 KB
Local disk data [Read|Write]: 524661 KB | 743072 KB
Currently out of sync: 70760 KB
You can resolve a split brain issue by choosing one of the systems to retain data (the survivor) and the other system to discard data (the victim), and then force the victim into the secondary role. While choosing the survivor and the victim, you should look at each system and select the system which has the most complete data as the survivor. If you are unsure, select the original primary as the survivor, and the secondary as the victim. Typically, the data in both the systems are similar, since both systems have access to the same network, and they collect data from the same pool of devices, and both perform the same tasks. The data prior to the split brain state are identical in each system because the data is replicated when the systems were still connected. Only the data collected during the split brain state differs. The longer the systems are in a split brain state, the more the systems will diverge.
To resolve a split brain issue using the GUI, complete the following:
Connect to the management IP address of the victim system and log in to the system using your username and password.Go to the Settings -> Setup -> Failover Configuration tab.In the Failover Configuration page, click Become Secondary.
To resolve a Split Brain issue using the NetMRI Admin Shell, complete the following:
Use a terminal program to connect to the management IP address of the victim system.Log in to the Admin Shell using your username and password.At the Admin Shell prompt, enter the failover role secondary command, and then click Enter.
Running Network DiscoveryA primary application for NetMRI is discovering the network and all its infrastructure devices.
NetMRI’s discovery features perform a crucial task, which is to locate and categorize all devices on a previously unmanaged network. By providing a high-level view of all devices in a network with which NetMRI can communicate, discovery enables managers to begin controlling a complex network topology, and drill down to individual devices to diagnose communication problems encountered during discovery.
You can define basic discovery settings during system setup (discussed in detail in Running the Setup Wizard), or manually perform discovery using a series of straightforward steps. The following section Discovery with a New NetMRI Deployment describes how to manually configure and run discovery.
If you are migrating your NetMRI platform to the current release, see Discovery with an Existing NetMRI Platform.
Note
Infrastructure devices are devices that form the network infrastructure. See Infrastructure Devices List for currently supported devices.

Infoblox NetMRI 7.4.4 Administrator Guide Part 1 Introducing and Configuring NetMRI
Copyright ©2020, Infoblox, Inc. All rights reserved. Page 54
•
•
•
•
•
•
•
•••
•
About Network DiscoveryWhen network discovery starts after the Wizard setup or platform upgrade, it runs continuously as a background task, staying up to date with device and network changes as they happen. You can watch the progress of discovery as NetMRI learns your network, and adjust discovery settings to control what it finds and how it collects data.
To perform network discovery, you use several fundamental tools: Network Views, Scan Interfaces, Discovery Settings, and SNMP/CLI credentials.
Network Views: NetMRI uses network views to create separate management domains for your networks and devices, including VRF-based virtual networks. You manage every network, including virtual networks, through a separate network view. For more information, see Configuring Network Views.Scan Interfaces: You configure scan interfaces to physically or logically connect to multiple networks, enabling discovery and management in different network domains. Every scan interface you create maps to a network view. For more information, see Configuring Scan Interfaces.Discovery Settings: You specify the IP prefixes, also called discovery ranges, to define the IP address space that is managed on each network. Another key setting is called a seed router, which is a gateway routing device considered to help speed discovery across more network spaces. For more information, see Configuring Network Discovery Settings.SNMP and CLI Credentials: NetMRI requires SNMP for most discovery tasks. Many discovery and data collection tasks, including VRF discovery, also require the use of CLI and Enable password credentials to access device configurations. You collect and add these values to NetMRI through a Credentials page. For more information, see Adding and Editing Device Credentials.
Discovery with an Existing NetMRI PlatformWhen existing customers update a NetMRI deployment to the current release, a number of changes appear in the deployment.
Your currently managed network, with its current discovery settings, is managed through a new network view named after the previously defined network name. No further configuration is necessary for continued network management but changes can be made at any time. For more information, see Configuring Network Views.Existing discovery settings, such as CIDR discovery ranges, are automatically assigned to the network view used for the managed network.Your SCAN port for your appliance (or appliances, in the case of Operations Center deployments using Collectors) will automatically be assigned to the network view that is used for your present managed network. This port will be named LAN1. For more information, see Configuring Scan Interfaces.Depending on your appliance, a second LAN2 port is made available for further network connections.Your MGMT port will continue to operate as the appliance's Web management interface.All active Ethernet interfaces on your appliance(s), including the MGMT port, support Ethernet 802.1Q encapsulation for virtual scan interfaces. For more information, see Configuring Virtual Scan Interfaces.If VRF-aware devices exist on your managed network, System Health banner messages will notify you about unassigned VRFs. To enable full network discovery and control for each virtual network, these networks need to be mapped to virtual scan interfaces. For more information, see Mapping Virtual Networks to Network Views and Configuring Virtual Scan Interfaces.
Existing Operations Center deployments will see the following changes:
Note
You can change discovery settings at any time either through the Setup Wizard (Settings icon –> Setup –>Setup Wizard) or through individual Settings pages (such as Settings icon –> Setup –> Discovery Settings).
You can also flexibly define discovery blackouts at the network, discovery range, device group, and device level to prevent discovery protocols and traffic from occupying network bandwidth at inopportune times, such as latency-sensitive trading or video applications operating during daytime hours. For information, see Configuring Network Discovery Settings and Defining Blackout Periods.

Infoblox NetMRI 7.4.4 Administrator Guide Part 1 Introducing and Configuring NetMRI
Copyright ©2020, Infoblox, Inc. All rights reserved. Page 55
•
•
•
•
•
1.
2.
3.
4.
5.
6.
7.
•
For an OC deployment managing a single large network, you will see multiple entries in the pages under Settings icon –> Setup –> Discovery Settings for selectable network views. The entire network is assigned to a single network view. However, each network view entry is identified through the association of each Collector. This allows you to edit discovery settings for each Collector in the same network view.Multi-Network Operations Center deployments automatically assign each managed network to a new Network View. Each network view is named based upon the original network name.Multi-Network Operations Center deployments automatically define a new set of device groups for each managed network, along with the standard set of device groups. These network-specific device groups are named using the original network name as a prefix.During the upgrade, a Multi-Network OC deployment creates a series of new network views, each of which corresponds to the networks managed under the prior software release. Each device listed in Network Explorer tables provides a link under a new Network View column, which opens the Network Viewer window. This window lists all devices that are members of the network view.In Multi-Network Operations Center deployments, discovery settings for each network, such as CIDR discovery ranges and seed routers, are automatically associated to the network views for each managed network, that use each of the respective discovery settings.
The following section, Discovery with a New NetMRI Deployment, describes the sequence of high-level tasks you perform to configure and run discovery on your network.
Discovery with a New NetMRI DeploymentComplete the following procedure to perform your first network discovery:
If necessary, install your NetMRI appliance or appliances. For more information, see the Infoblox Installation Guide for your NetMRI appliances. Ensure that you have the full feature licensing and device licensing entitlements for your deployment. For more information, see Understanding Platform Limits, Licensing Limits, and Effective Limits. If you are upgrading your NetMRI installation, check the installation instructions in the Release Notes for your software (and see the section below, Discovery with an Existing NetMRI Platform.Also, read the section Preparing for NetMRI VRF Access for information on checking and configuring VRF-aware devices to which NetMRI will connect for managing virtual networks.Configure your first network views for network management.For new installations, NetMRI automatically provides an initial network view, named Network 1, as part of the initial setup. For the initial discovery of the network, you may only need this first network view. For more information, see Configuring Network Views.You combine network views with scan interfaces to separate and manage networks. For new installations, the Network 1 network view is automatically bound to your appliance's LAN1 port. This may be the only interface you need for initial network discovery. This interface connects to the router through which NetMRI begins to discover the network. For more information, see Configuring Scan Interfaces.Configure your discovery settings. They include discovery IP address ranges, possible static IP addresses of devices you explicitly want to discover in your networks, a seed router for network discovery and possible device hints to improve odds of finding devices. The seed router might be, for example, the router to which NetMRI first connects for discovery of the network. For more information, see the sections Configuring Discovery Ranges, Specifying Static IPs, Adding Seed Routers, Configuring CISCO APIC, and Adding Device Hints.Add the necessary device SNMP credentials, and CLI admin login and Enable password credentials. For more information, see Adding and Editing Device Credentials and its various sections. You can also add and test credentials for individual devices; for more information, see Adding and Testing SNMP Credentials for a Device.Associate discovery settings to network views. Add your discovery settings from Step 4 to the network views and begin to discover the network. Initial discovery of your networks begins automatically after the discovery ranges and other discovery settings, such as a seed router, are added to the network view, which also must have a scan interface connection. For more information, see Discovery Using Network Views.Watch data collection. Network data collection and virtual network detection take place during your initial network discovery, which begins automatically when the network connection is established from NetMRI, to the network to be discovered. Perform the following to view discovered information about your network:
View summaries of discovery events: Click the All Devices device group in the right panel, and open the Network Explorer –> Discovery page to see a table of all devices being discovered by NetMRI. For more information about the features on this page, see Viewing and managing Discovery Results.

Infoblox NetMRI 7.4.4 Administrator Guide Part 1 Introducing and Configuring NetMRI
Copyright ©2020, Infoblox, Inc. All rights reserved. Page 56
•
•
8.
View a list of devices your appliance has recently discovered: Click the All Devices device group in the right panel, and open the Network Explorer –> Inventory page to see tables of all member devices. For more information about the features on this page, see Viewing Network Inventory.View summaries of recently discovered network phenomena: Includes summary information of routed networks, VLANs, route targets, and virtual networks (VRFs). For more information about the features on this page, see Summarizing Network Topologies.
Map virtual networks. If your network has virtual networks, NetMRI automatically discovers them on the devices where they are configured, and alerts you through System Health banner messages at the top of the screen to map those VRF-aware devices to the network views where they belong. By mapping each virtual network to network views, you provide more information to the discovery process. For more information, see Mapping Virtual Networks to Network Views.
9. As NetMRI polls devices deeper into the network, it may find more VRF-based virtual networks. These networks need to be mapped to virtual scan interfaces to enable full network discovery and control for each virtual network. For more information, see Mapping Virtual Networks to Network Views, Configuring Virtual Scan Interfaces, and Configuring VRF-Aware Device Interfaces.
The following table summarizes both migrated and new installations (steps 6-9 are common to both procedures):
Step # Migration/Upgrade New Installation
1 Upgrade your software using normal Admin Shell utility. Install new appliance(s) and perform system configuration through the Setup Wizard.
2 Currently managed network(s) are converted to new network views using the same network name.
Configure network views (if required) for multiple network management.
3 Scan ports are associated with the network views created from the previously defined Networks.
Configure NetMRI scan interfaces (if required) for multiple network management.
4 All existing discovery settings are automatically associated to their network view(s).
Configure discovery ranges/seed routers/static IPs and associate to network view(s) where needed.
5 Existing SNMP/CLI credentials configurations remain unchanged.
Configure SNMP/CLI credentials.
6 Discover through network views.
7 Automatic VRF detection/data collection/System Health notifications.
8 Map discovered VRFs to new network views.
9 Configure VRF-aware device interfaces (if necessary).
Note
CLI credentials to devices are required to determine if devices are VRF-aware and to collect VRF-related data.

Infoblox NetMRI 7.4.4 Administrator Guide Part 1 Introducing and Configuring NetMRI
Copyright ©2020, Infoblox, Inc. All rights reserved. Page 57
1.2.
•
•
3.
4.
•
••
•••
Preparing for NetMRI VRF AccessFor effective use of NetMRI to connect to and manage virtual networks, complete all steps listed in this section before configuring NetMRI. The information in this section applies specifically to the non-Infoblox network devices (e.g., Cisco and Juniper) that route virtual networks:
Identify the VRFs/virtual networks you want NetMRI to access and manage.Identify the single VRF-aware Switch/Router on the managed network, that is aware of all of the desired VRFs. NetMRI will need to access the VRFs through this device.
A VRF-aware device may not exist on the network that is aware of all of the VRFs. If it is not possible to consolidate all VRFs into a single trunked port, you can physically connect NetMRI to multiple places on the network. NetMRI has up to 3 physical scan interfaces available, labeled MGMT, LAN1, and LAN2, that may differ slightly per platform. For more information, see Configuring Scan Interfaces.You also must identify a minimal set of VRF-Aware devices that collectively are aware of all the VRFs you wish NetMRI to manage.
Reserve a valid routable IP address on each VRF. These IPs will be configured on NetMRI virtual scan interfaces that will connect to each virtual network. Prepare an IP, subnet mask, and gateway for each VRF.You must configure at least one network device to provide access to the virtual networks for NetMRI. NetMRI can connect to multiple VRFs on the same physical interface, using virtual scan interfaces, each associated with an encapsulated 802.1q tag. To access each VRF, complete the following:
The interface NetMRI connects to, should be configured to transport via an 802.1q encapsulated traffic (trunked port).Each tag carried by the trunked port should be associated with a single VRF on the device.If the device NetMRI is connected to is not VRF aware, and then the 802.1q configurations will be in the form of VLANs, with one VLAN for each VRF. In this case, the device must trunk the VLANs to another device that is VRF aware, and can be configured to associate each 802.1q tag to a VRF.
In general, connecting NetMRI directly to a VRF-aware device requires less network device configuration.
5. When connecting NetMRI to a trunk port, for each 802.1q tag in the trunk, create a Virtual Scan Interface by right clicking the physical scan interface in Settings –> Scan Interfaces. Specify the tag, IP, gateway, network mask, and other needed settings. You can also associate it with an existing Network View, or you may create a new Network View for the virtual scan interface. For more information, see Configuring Network Views.
Configuring Network ViewsYou can define network views to separately manage network domains that have the following characteristics:
Physically isolated and completely independent.Logically separated networks for convenient management.Virtual networks implemented with technologies such as a VRF.
You combine network views with scan interfaces to separate and manage networks. This prevents ambiguities that can occur through route leakage and possible overlapping IP address spaces, and provides further information to help in network and device discovery.
Network views provide a useful concept of isolation. Using network views, NetMRI enables you to manage networks that may have overlapping IP prefixes or address ranges, preventing addressing conflicts between separately managed networks. You can manage every network in complete isolation from other networks.
When you create discovery ranges, you can also directly associate them with a network view. For more information, see Configuring Discovery Ranges. When you also associate a virtual scan interface with that network view, the discovery range automatically becomes the range of IP addresses that are scanned and discovered on that scan interface.

Infoblox NetMRI 7.4.4 Administrator Guide Part 1 Introducing and Configuring NetMRI
Copyright ©2020, Infoblox, Inc. All rights reserved. Page 58
•
•
1.2.3.
4.
For Operations Center deployments, you can create the same network view on different appliances. Each appliance uses its own scan interface to access the same network view.
Default Network ViewsMost users and deployments will see a single network view, which differs in name based upon whether you are performing a new installation or an upgrade to the current release.
New Installation: Initial setup for a new NetMRI appliance automatically creates a default network view, named Network 1, as a part of the procedure. This network view is automatically assigned to the appliance's LAN1 port before you perform discovery of the network. If the LAN1 port is not active, the MGMT port is associated with the Network 1 view.Upgraded installations: The managed network's network name is automatically used to identify the network view used for managing the network. This value may be changed, but changes are not necessary. The network name value is found in the Settings icon –> Setup –> Settings Summary –> Network Configuration section. It is titled Database Name in the current release and Network Name in the prior release. For Multi-Network Operations Center deployments, the same principle applies.
Creating Network Views for the Global Network
When you perform the initial setup of a NetMRI appliance using the configure server, the appliance automatically uses the default network view, named Network 1, for the first discovery. You can also create more 'unassigned' network views for use with other physical scan interfaces and other networks. To create network views for the global network, complete the following:
Choose Settings icon –> Setup –> Network Views.Click the Add icon [+] to add a new view entry.Enter a Name and Description for the new view. Press the Tab key to navigate from the Name to Description fields.Click the Add icon [+] again if you wish to create another view, or close the Network Views settings page.
The new unassigned network view will appear with a caution icon ( ) in other dialog boxes, such as a discovery range configuration. This indicates the network view is not associated with a scan interface. For more information, see Configuring Physical Scan Interfaces and Configuring Virtual Scan Interfaces.
For information on creating network views for virtual networks, see Mapping Virtual Networks to Network Views.
Note
If you delete a network view at a later time, all discovery ranges and static IPs that are associated with the network view will be deleted. For more information, see Discovery Using Network Views.
Note
If you delete a network view from the Settings icon –> Setup –> Network Views page, all discovery ranges and static IPs that are associated with the network view will be deleted from their respective pages under Settings icon –> Setup –> Discovery Settings.
Note
If you create unassigned network views, and the view is not assigned to a scan interface, any discovery settings for the view will not be processed and discovery will not take place for the network view.

Infoblox NetMRI 7.4.4 Administrator Guide Part 1 Introducing and Configuring NetMRI
Copyright ©2020, Infoblox, Inc. All rights reserved. Page 59
1.
2.
3.
•
•
Mapping Virtual Networks to Network ViewsUser action is required to clearly associate each discovered virtual network with its correct network view in the Network View Editor. This provides additional context to collected data and enables NetMRI to fully discover and model the network topology. If you define any new network views in this step, you will also need to configure scan interfaces based on the steps in Configuring Scan Interfaces. If a network view does not have an assigned scan interface, discovery will not take place on that network.
If you do not wish to perform extensive management of VRF-based virtual networks in your deployment and receive a System Health banner alert reporting unassigned VRFs, do not ignore the alert. Simply map all the discovered VRF-based virtual networks to your existing network view (VRF examples include (Default) IOS (for Cisco IOS), default (for Cisco Nexus), or master (for JunOS), which are the global VRFs that may be present in some networks). Doing so automatically instructs NetMRI to use collected VRF data for further discovery.
To add a discovered VRF to a network view, perform the following:
Go to the Settings icon –> Setup –> Network Views.The Network Views settings page appears, listing all currently defined views.Hover over the Action icon for the chosen network view and select Assign. The Define and Configure Networks editor appears in a popup window.To see all currently discovered VRFs, click Search VRF Names.All discovered VRF instances in all devices are listed alphabetically. Unassigned VRFs appear in white in the left panel, and assigned VRFs are highlighted in gray. If you see more VRF entries then you can easily navigate, check the Show unassigned VRF Only check box.
4. To see all VRFs listed as discovered on each device, click Display VRFs per Device. All VRFs are listed under their respective device names.
5. To see all VRF instances that are associated with any Network View, click Display VRFs per Virtual Network. All VRFs are listed under their respective virtual networks. The same network view can manage all VRFs in a single virtual network.
6. To set an entire virtual network to the selected network view, check the check box for all discovered VRF routers in the list that are identified by a specific VRF Name (such as red or blue). In this case, each instance of the same VRF in the list shows its own unique Device Name.
For each discovered virtual network, you will see one or more devices that are running VRF instances in that virtual network.To easily select an entire virtual network for the network view, select the Display VRFs per Virtual Network option. Then, check all the device check boxes listed for that network.
7. In the right panel of the editor, select the network view from the Network View drop down to which you want to assign the virtual network.
8. Click Add (–>) to add the selected VRFs to the network view. To remove a VRF from the view, select it from the right panel and click Remove (<–).
9. Click Save or Save and Close to commit the changes. Clicking Save keeps the Define and Configure Networkswindow open.
Note
In NetMRI, the SysAdmin Role has access to the Network View editor.
Note
Each network view must have a discovery range associated with it. For more information, see Configuring Discovery Ranges.

Infoblox NetMRI 7.4.4 Administrator Guide Part 1 Introducing and Configuring NetMRI
Copyright ©2020, Infoblox, Inc. All rights reserved. Page 60
•
•
Your changes are saved into the network view. To begin seeing the practical effects of this action, go to Network Explorer –> Summaries and open the VRFs accordion panel. Click View All VRFs in the panel if necessary, and click a network view link in the Network View column in the center panel.
Discovery Using Network ViewsWhen the network views are configured with their associated discovery settings and scan interface, NetMRI automatically starts discovery across the connected network. After a few moments, newly discovered devices will begin to appear in the main Discovery pages under Network Explorer –> Discovery. Click device group names on the right-hand panel to see categories of devices discovered by NetMRI.
If NetMRI identifies a device inside any network view as using Cisco IOS, NXOS, or Juniper JunOS, it attempts to collect possible VRF configuration data on the device by using the device's CLI. If the CLI is not accessible, (or the device does not have VRF configurations), NetMRI treats the device as not configured for VRF. Full detection of VRF configurations on VRF-aware devices requires CLI credentials, including Enable password access. After discovery, you map VRFs to network views associated with virtual scan interfaces and discovery settings, to allow ARP and routing data collected inside the network view to be leveraged for further discovery.
After NetMRI discovers VRF-based virtual networks in your deployment, a System Health banner alert appears at the top of the screen. Click its link to view details about the alert, which appears in the Settings icon –> Notifications –> System Health page. For more information, see Managing and Tracking System Health.
Using the Network Viewer WindowAnywhere you can view device information, such as under Network Explorer –> Inventory, the devices table shows a column titled Network View. Each managed device belongs to a network view, and the Network View column shows the device's membership.
Each entry under the Network View column links to the Network Viewer window. It shows the complete list of devices that are members of the network view, broken into the following two categories:
Associated VRFs: The complete list, which are all of the VRF instances that route traffic for the current network, including the selected device's local VRF.Imported VRFs: The list of imported VRFs, which are all VRF instances imported based on routing policy from other VRF-aware devices that route traffic in the virtual network. The Route Distinguisher values identify the VRF instance to help specify how routes will be shared between different VRF networks.
Some device types do not use Route Distinguisher values (also known as Route Targets) for VRF configuration and the value will be blank as a result.
You can assign other VRF instances to the current network by clicking the Assign button over the Associated VRFs list, which opens the network editor. For more information, see Mapping Virtual Networks to Network Views.
Note
A network view can contain different VRFs from the same router. This allows for route leaking between virtual networks.

Infoblox NetMRI 7.4.4 Administrator Guide Part 1 Introducing and Configuring NetMRI
Copyright ©2020, Infoblox, Inc. All rights reserved. Page 61
1.
2.3.
••
Deleting Network Views
If you delete a network view from the Settings icon –> Setup –> Network Views page, all discovery ranges and static IPs that are associated with the network view will also be deleted from their respective pages under Settings icon –> Setup –> Discovery Settings.
When you delete a network view from NetMRI, all VRFs (virtual networks) that are a part of the Network View will become unassigned. When this occurs, a System Health warning message banner appears at the top of the screen. You can then reassign the unassigned VRF to another network view.
The scan interface that is associated with a deleted network view also becomes an unassigned interface. To delete a network view, perform the following:
Click the Settings icon –> Setup –> Network Views. The Network Views settings page appears, listing all currently defined views.Hover over the Action icon for the chosen view and select Delete. A confirmation message appears.Click Yes to delete the network view. Its previously assigned network becomes unassigned.
At least one network view will always be active in the system. Attempts to delete the last remaining network view, regardless of name, will be prevented by NetMRI.
Configuring Scan InterfacesFor each network view, NetMRI requires connections to each network that you discover, manage and control. Scan Interfaces are the ports on NetMRI appliances and virtual appliances that perform this function. Physical scan interfaces are actual Ethernet ports.
The following are two types of scan interfaces:
Physical scan ports: An entire Ethernet interface in the appliance discovers and manages a network.Virtual scan interfaces: These use 802.1Q VLAN tagging between NetMRI and the connecting device, to exchange traffic for multiple networks across a single physical interface. To use virtual scan interfaces, connect one of NetMRI's physical scan interfaces to a device interface configured to route the desired networks with 802.1Q VLAN tags.
You can configure scan interfaces in Settings icon –> Setup –> Scan Interfaces. Scan Interfaces settings page lists all device interfaces that may be used by the appliance. Depending on the hardware and system type, the page displays one or more interfaces named MGMT and/or LANn (where n is the physical port number). If your system is an Operations Center, the collector name is shown alongside the interfaces. If any virtual scan interfaces are defined, they have names like LAN2.111.
If your network uses several domain name suffixes, you may want to derive device names from their FQDNs. You can do so by adding multiple search domains in a scan interface configuration. You can add up to 10 search domains.
For more information on configuring physical and virtual scan interfaces, see the next sections.
Configuring Physical Scan InterfacesYour NetMRI appliance's physical scan interface configuration varies depending on your appliance's physical configuration, and even whether the appliance is a VM.
Note
Exercise caution when deleting network views. After the network view is deleted, devices formerly within a deleted network view will not be immediately reachable by NetMRI. NetMRI will attempt to find an alternate IP address for such devices, perhaps from other virtual networks. If other reachable IP addresses for those devices are found, they will continue to be polled from the new location. If they are not located, their records will expire from the managed or discovered device databases.

Infoblox NetMRI 7.4.4 Administrator Guide Part 1 Introducing and Configuring NetMRI
Copyright ©2020, Infoblox, Inc. All rights reserved. Page 62
1.2.3.
•••
•••
4.••••••
5.6.7.8.
1.
2.3.
•••
••
On physical ports, you can add virtual scan interfaces. You can assign a network view to a physical port on your appliance, such as LAN1. Doing so does not prevent the same port from supporting virtual scan interfaces, each of which supports its own network view. For more information, see Configuring Virtual Scan Interfaces.
To configure a physical scan interface, complete the following:
Go to Settings icon –> Setup –> Scan Interfaces.Hover over the Action icon for any of the physical ports and select Edit from the menu.In Network View, choose one of the following:
Select Existing: Choose a network view from the list of existing ones that are defined on the system:Select the view from the drop-down list.Selecting Unassigned as the Network View leaves the interface in a disabled state.
Create New: Create a new network view:Enter the name for the new network view.Enter a comment describing the view. These values can be edited at a later time.
Enter IPv4 or IPv6 information, or both:IPv4 Address: The IPv4 address for the scan interface.IPv4 Subnet Mask: The IPv4 subnet mask for the scan interface.IPv4 Default Gateway: The IPv4 default gateway for the scan interface.IPv6 Address: The IPv6 address for the scan interface.IPv6 Subnet Mask: The IPv6 subnet mask for the scan interface.IPv6 Default Gateway: The IPv6 default gateway for the scan interface.
In Primary DNS Server, specify the primary DNS server for the scan interface.In Secondary DNS Server, specify the primary DNS server for the scan interface.In Search Domains, specify valid hostnames separated by commas.Click Save.
Configuring Virtual Scan InterfacesYou can define virtual scan interfaces and assign network views to them, and choose not to apply a network view to the physical LAN port hosting those virtual scan interfaces (LAN1, for example).
You can create a virtual scan interface with a tagging value, but not immediately assign it to a network view. The virtual scan interface is effectively disabled and you can assign its network view at a later time. You can also assign it to an existing network view or create a new one.
To configure a virtual scan interface, complete the following:
Go to Settings icon –> Setup –> Scan Interfaces.The Scan Interfaces page appears, listing all device interfaces that may be used by the appliance. Depending on the hardware and system type, you will see one or more interfaces named MGMT and/or LANn (where n is the physical port number). If virtual scan interfaces are defined, they bear names such as LAN2.111.Hover over the Action icon for any of the physical ports and select Add Virtual Scan Interface from the menu.In Network View, choose one of the following:
Select Existing: Choose a network view from the list of existing ones that are defined on the system.Select the view from the dropdown list.Selecting Unassigned as the Network View leaves the interface in a disabled state.
Create New: Creates a new network view.Enter the name for the new network view.
Note
Though the MGMT port allows the same scanning discovery and device control capabilities as other appliance physical port types, Infoblox recommends limiting managing enterprise networks through the MGMT port, using it only for management access to the appliance's web, CLI, and tunnel interfaces, so those functions cannot be compromised by end-user traffic.
You cannot assign scan interfaces from MGMT ports on appliances in an Operations Center.
Infoblox NetMRI 7.4.4 Administrator Guide Part 1 Introducing and Configuring NetMRI
Copyright ©2020, Infoblox, Inc. All rights reserved. Page 63
•4.5.
••••••
6.7.8.9.
•
•
•
•
•
••
Enter a comment describing the view. These values can be edited at a later time.In the Tag field, enter the 802.1Q tag value defined on the facing device that transits the trunk port or router port.Enter IPv4 or IPv6 information, or both:
IPv4 Address: The IPv4 address for the scan interface.IPv4 Subnet Mask: The IPv4 subnet mask for the scan interface.IPv4 Default Gateway: The IPv4 default gateway for the scan interface.IPv6 Address: The IPv6 address for the scan interface.IPv6 Subnet Mask: The IPv6 subnet mask for the scan interface.IPv6 Default Gateway: The IPv6 default gateway for the scan interface.
In Primary DNS Server, specify the primary DNS server for the scan interface.In Secondary DNS Server, specify the primary DNS server for the scan interface.In Search Domains, specify valid hostnames separated by commas.Click Save.
You can also edit or delete virtual scan interfaces.
Configuring VRF-Aware Device InterfacesTo give NetMRI access to the routed domain for a mapped VRF, the user must connect NetMRI to one of the interfaces, on the VRF-aware device, that belongs to that virtual network. The user needs to provide visibility on their virtual network to the scan interface that is discovering it.
If the VRF-aware device is directly connected to NetMRI: If the mapped NetMRI scan interface is a physical SCAN interface, the user must use or configure a physical interface on the target VRF-aware device to communicate with NetMRI without using 802.1Q encapsulation.
If the mapped scan-interface is a logical sub-interface using 802.1Q encapsulation, the user configures the directly connected physical interface of the VRF-aware device, and subdivides it using a logical subinterface with the same 802.1Q encapsulation. The user may otherwise use a VLAN interface with the same 802.1Q encapsulation and allow its traffic through the physical SCAN interface.
If the VRF-aware device is not directly connected to NetMRI: No additional configuration is required for these devices. NetMRI can reach different VRFs from the moment these resources are routed by a VRF mapped into a Network View which is accessible from a scan interface mapped on that same Network View.
You may apply different techniques, such as using VLANs all the way down to the desired VRF to discover, or using intermediate devices that are members of the routed domain of that VRF.
Special Considerations for Managing VRF Virtual NetworksWhen you define discovery settings and perform management of virtual routing and forwarding networks, the following considerations exist that you should be aware of:
If you limit the context of the SNMP community string in an individual VRF to the context of only that VRF, NetMRI will not be able to determine that the device it has discovered inside that VRF is the same device it has found inside other virtual networks. This will result in extra, un-correlated devices in the network.NetMRI will become aware of some devices inside of virtual networks from the route and ARP tables of routers that it manages. Without network connectivity into those virtual networks through a virtual scan interface, NetMRI cannot discover all the devices or manage them. To create the necessary connectivity, you need to configure a NetMRI scan interface to be part of the VRF.NetMRI will collect and parse the ARP and routing information from within a VRF context, but this data will not be used for further discovery unless the VRF virtual network is associated to a network view mapped on a scan interface.Global VRFs are labeled as default(IOS) for IOS, default for Nexus and master for JunOS.For discovery and periodic polling on Juniper devices through an interface that is not in the Juniper default VRF (master), the query must use a special "default@credential" format. This setting assumes that users do not have management interfaces in a VRF. Your defined SNMP credentials for VRF-aware Juniper devices must use syntax similar to "@vrfsnmp." Enter these values for SNMP credentials under Settings icon –> Setup –

Infoblox NetMRI 7.4.4 Administrator Guide Part 1 Introducing and Configuring NetMRI
Copyright ©2020, Infoblox, Inc. All rights reserved. Page 64
•
••
•
•
••
> Credentials –> SNMP v1/v2c tab. Note that when querying VRF-aware Juniper devices via an interface that is in the default VRF, a plain community string can be used without the "@" character.When configuring NetMRI to discover networks where route-leaking is employed (the practice of sharing routes between two or more networks, such as VRFs), discovery ranges for each network views should only be defined to include IPs known as belonging to that network view. In other words, any given Device IP should only fall within the discovery ranges of one network view. If discovery ranges are defined such that a Device can be discovered by two different network views, the device may also be discovered via an unexpected network view.
Configuring Network Discovery SettingsEffective discovery of IP networks requires the following elements:
Valid CIDR or IP address ranges. For more information, see Configuring Discovery Ranges.Blackout settings for a defined range to ensure that discovery traffic takes place during policy-mandated time periods. For more information, see Defining Blackout Periods.Static IP addresses that define devices with high priority of discovery. For more information, see Specifying Static IPs.At least one seed router that can be the router to which NetMRI first connects. For more details, see Adding Seed Routers.SDN and SD-WAN discovery settings. For more information, see Configuring Discovery for SDN and SD-WAN.Credentials to access network devices for data collection. For more information, see Adding and Editing Device Credentials in the "Data Collection Techniques" section.
The Discovery Settings page (Settings icon –> Setup section –> Discovery Settings) defines the scope of the networks that NetMRI explores using CIDR (Classless Inter-Domain Routing) address blocks, IP address ranges, IP address wildcards, static IP addresses, and seed router definitions.
NetMRI applies discovery settings equally to IPv4 and IPv6 networks, with the polling protocols specified in Settings icon –> Setup –> Collection and Groups –> Network Polling.
To perform your first network discovery, go to Settings icon –> Setup –> Setup Wizard. When you use the Setup Wizard, the Wizard guides you through the process of performing discovery on the network. When specifying your first discovery ranges, you also select the network view to use for the discovered network. This step is required and is further explained in the topic Configuring Network Views.
Configuring Discovery Ranges
Note
Use caution when entering address ranges, particularly if you are using IPv6 values. If you have a default route to the Internet and you enter an address range incorrectly, you may receive a call from your ISP asking about a network scanner running from your network.
Note
For IPv6 network discovery, the use of discovery range definitions for all networks is required to ensure that you discover all the required hosts and network infrastructure. Also, consider using RFC 4193 local IPv6 network addresses (also called unique local IPv6 unicast). These values are globally routable within the enterprise but are independent of the ISP and allow for filtering at network boundaries. They are not globally routable prefixes. Their local IPv6 unicode address begins with FC00:/7. Examples of this type are used in this section. Globally routable prefixes begin with the 2000:/ or 2001:/ and are not used as examples in this document.

Infoblox NetMRI 7.4.4 Administrator Guide Part 1 Introducing and Configuring NetMRI
Copyright ©2020, Infoblox, Inc. All rights reserved. Page 65
•
•
•
1.
2.3.4.
•••
The Ranges tab defines the scope of the networks that NetMRI explores by defining CIDR address blocks, IP address ranges and IP address wildcards, and discovery blackout settings. The appliance limits its network exploration to the set of ranges defined in this tab.
CIDR: A CIDR address block is defined by a network address and bit mask (for example 192.168.1.0/24).An IPv6 example: FC00:56:aa12:ea23:a5:ac10:100/119. Any IPv6 CIDR values must include the IP address ranges that you want to discover.
IP Range: An IP address range defines a starting and ending IP address. For instance, in IPv4 you could define 192.168.1.0 as the start of the IP range and 192.168.1.255 as the end of the IP range. You cannot configure IP address range values for IPv6 networks.IP Pattern: An IP address wildcard pattern defines IP address range using a wildcard character or range for a specific set of octets. A single wildcard can be an octet range specified by a dash (e.g., 10-254) or an asterisk (*) when the whole range for an octet is specified (0-255 for IPv4 and 0000-ffff for IPv6). For example, you can define either 192.*.1.* or 192.168.1-255.5 as the IP address wildcard pattern. An IP wildcard pattern will be rejected if it contains more than 65536 CIDRs. It is recommended to keep the total number of CIDRs under 1000, specifying more may affect performance.
The ranges table displays each defined range, its type (CIDR, IP Range, or IP Pattern), and its use in the discovery process. Ranges excluded for discovery indicate that any network device found matching that range is excluded from discovery by the appliance. See Range Examples for more information.
Creating Discovery Ranges
Every discovery range you create must be associated with a network view. If no network views are specifically defined in your deployment, your discovery ranges will automatically be assigned to the automatically created network view Network 1. For the first discovery of the network, this network view is automatically assigned to the SCAN1 port when you set up the appliance using the configure server command.
If more than one network view exists, you can choose the network view with which the discovery range will be associated, by clicking the Network View drop-down menu. If only one network exists in NetMRI, this setting does not appear. The chosen network view, must also be associated with a scan interface, otherwise discovery do not take place. Unassigned network views that do not have an assigned scan interface or virtual scan interface appear with a caution
icon ( ) in discovery ranges configuration. For more details, see Configuring Network Views.
Network views can contain multiple discovery ranges. So when you create other ranges, you can assign the same network view to each. However, you can assign each discovery range to only one network view. Also, ensure that the ranges you assign to each network view make sense. Selecting the network view in an Operations Center environment also involves other details. For more information, see Defining Discovery Ranges on Operations Center Collectors.
You can define discovery ranges that will be excluded from management. This is useful for devices you may not want to manage, but want to know about for inventory purposes. End Host network segments are a good example.
To create a discovery range, complete the following:
Obtain or calculate the network range values. You can define a Network address (expressed as CIDR: in effect, a subnet prefix), an IP range, or an IP pattern.Choose Settings icon –> Setup –> Discovery Settings –> Ranges.Click New.Choose an appropriate way to specify the range:
CIDR: Enter the IP Prefix value and its CIDR subnet value in the drop-down.IP Range: Specify an IP range using a beginning and ending value.IP Pattern: Specify a wildcard pattern for matching IP addresses.
Note
For discovery ranges, configuring Discovery Blackouts requires the use of the Admin account.

Infoblox NetMRI 7.4.4 Administrator Guide Part 1 Introducing and Configuring NetMRI
Copyright ©2020, Infoblox, Inc. All rights reserved. Page 66
5.•
•
•
•
••••
•••
••••
For Discovery Mode, select one of the following:Include in Discovery: Any device found matching that range is discovered and managed by NetMRI.Discovery gives the highest precedence to devices found in an Include in Discovery range, ensuring they will be the first to appear in information tables in the appliance.
Exclude from Discovery: Instructs NetMRI to ignore the specified values and do not discover them through any of the specified protocols. Ranges set to an Exclude from Discovery setting are simply excluded, given the lowest precedence, and will not be discovered.Exclude from Management: Indicates that NetMRI discovers any device found matching that range, but NetMRI will not manage or collect data from the device. Network devices found in an Exclude from Management range are given moderate precedence and will, over time, appear in information tables applicable to unmanaged devices. End host network segments are an example.
5. To use a discovery ping sweep for discovery on IPv4 networks, check the Enable Discovery Ping Sweep check box. This implies a probe that uses a range of packet types to detect the presence of a system on each IP in the specified range, with ICMP Echo, ICMP Timestamp, TCP SYN to port 80, and TCP SYN to ports 161, 162, 22, and 23 (for the SNMP, SNMPTRAP, SSH, and TELNET services correspondingly). A ping sweep is not available for IPv6 network values. For more information on ping sweeps, see Defining Group Data Collection Settings.
6. Select the Enable Discovery Blackout check box and click its Scheduling icon.
7. Define your schedule as follows:
In the Recurrence Pattern dropdown, choose how often you want to execute the blackout period. You can select Once, Daily, Weekly, or Monthly.
If you choose Once:Choose an Execution Time from the drop-down list.Enter the date of the blackout in the Day_of_ field.Specify the Duration: 10 or more Minutes, Hours, or Days.
If you choose Daily, click either Every Day or Every Weekday.Choose an Execution Time from the drop-down list.Specify the Duration: 10 or more Minutes, Hours, or Days.
If you choose Weekly, complete the following:Choose an Execution Time from the drop-down list.Check the check boxes for one or more days from Sunday through Saturday.Specify the Duration: 10 or more Minutes, Hours, or Days.
Note
If you are discovering end host subnetworks for Switch Port Management, choose the Exclude From Management option for the end host discovery ranges.
Note
An advanced setting, Discovery Status Precedence (Settings icon –> NetMRI Settings –> Advanced Settings –> Discovery group –> Discovery Status Precedence), governs the global setting for exclusion ranges. Changing this Advanced setting to Longest Prefix Match enables an exclusion range to contain smaller IP ranges that can be matched against to allow discovery — for example, you can exclude a /23 network, but Include a /24 prefix within the EXCLUDE range, because the /24 is a longer prefix.
Note
The discovery ping sweep feature differs from the Smart Subnet ping sweep in the following ways: the discovery ping sweep will run only against the specified range, the sweep will run regardless of the range size, and the sweep will run regardless of the number of discovered devices within the specified range.

Infoblox NetMRI 7.4.4 Administrator Guide Part 1 Introducing and Configuring NetMRI
Copyright ©2020, Infoblox, Inc. All rights reserved. Page 67
•••
•
•
•
If you choose Monthly, complete the following:Choose an Execution Time from the drop-down list.Day __ of every __ month(s): Specify for the discovery blackout to be executed on day-of-month X of every Y month. Month numbering starts with January. You can see some examples below.Day 5 of every 1 month(s): means the blackout is executed on the 5th of the current and each next month.Day 5 of every 2 month(s): means the blackout is executed on the 5th of January, March, May, July and so on. Specify the Duration: 10 or more Minutes, Hours, or Days.
8. Select the Enable Change Blackout check box and click its Scheduling icon. Follow the instructions for the Enable Discovery Blackout setting in the previous step.
9. Click Add to place the new discovery range into the Range table.
Creating Blackouts for Individual Devices
To support discovery blackouts for individual devices, obtain the Management IP address for the device in question, and assign that IP address to a /32 or /128 discovery range. Define the discovery blackouts settings as you would for any other discovery range. This practice may be handy, for example, for strategic routers and switches that cannot incur excessive latency for transaction traffic. However, this approach means that you cannot create change blackouts for individual devices.
Defining Discovery Ranges on Operations Center Collectors
If you have an Operations Center with at least two Collector instances, you can assign different discovery ranges to different Collectors, or assign a range to all collectors in an OC for the same purpose. The Filter by Collector drop-down menu provides a listing of all Collectors and their respective device limits, which are associated with the licensing limits for each Collector appliance. You also choose the Network View, which lists all network views with their collector appliance names in brackets.
For an OC deployment managing a single large network, you choose the network view entry from the Network View list. You will see multiple entries in the pages under Settings icon –> Setup –> Discovery Settings for the Network View list. The entire network is assigned to a single network view. However, each network view entry is identified through the association of each Collector. This allows you to edit discovery settings for each Collector in the same network view.Examples:
Network 1 (NM35) Network 1 (NM36) Here each Collector, NM35 and NM36, is associated with the same network view.
For an OC deployment managing multiple networks, choose the desired Collector from the Filter by Collector list. Then, select the network view under the Network View list.
The licensing limits correspond to those described in the topic Understanding Platform Limits, Licensing Limits and Effective Limits. Each Collector entry listed in the Filter by Collector drop-down menu in the lists the following information:
Device Limit Shows the maximum device license count for the Collector–the maximum number of devices the Collector is licensed to manage. This value does not apply to discovered device counts, which can be higher. The value in this column corresponds to an Effective Device Limit for the Collector.
Note
For more information about discovery blackouts and change blackouts, see Defining Blackout Periods.

Infoblox NetMRI 7.4.4 Administrator Guide Part 1 Introducing and Configuring NetMRI
Copyright ©2020, Infoblox, Inc. All rights reserved. Page 68
1.
2.3.4.
•••
5.••
•
Devices Licensed The number of currently used device licenses for the listed Collector. The difference between this value and the Device Limit, if any, represents the number of unused device licenses remaining available to the Collector.
To assign a discovery range to an Operations Center Collector, complete the following:
Obtain or calculate the network range values. You can define a Network address (in effect, a subnet prefix), an IP range, or an IP pattern.Choose Settings icon –> Setup –> Discovery Settings –> Ranges.Click New.Choose an appropriate way to specify the range:
CIDR: Enter the IP Prefix value and its CIDR subnet value in the drop-down.IP Range: Specify an IP range using a beginning and ending value.IP Pattern: Specify a wildcard pattern for matching IP addresses.
For Discovery Mode, select one of the following:Include in discovery: Any device found matching that range is discovered and managed by NetMRI.Exclude from discovery: Ignore the specified values and do not discover them through any of the specified protocols.Exclude from management: Indicates that NetMRI discovers any device found matching that range, but NetMRI will not manage or collect data from the device.
8. To use a discovery ping sweep (an ICMP ping that is broadcast to all addresses in a subnet) during discovery on IPv4 networks, click the Enable Discovery Ping Sweep check box. Ping sweep is not available for IPv6 network values. For more information on ping sweeps, see Defining Group Data Collection Settings.
9. From the Filter by Collector drop-down menu, choose the Collector from the list or select All. Ensure that the chosen Collector has enough space in its license allocation to accommodate the number of devices you expect the Collector to manage in the discovery range.
If the discovery range you wish to assign to the Collector is designated as Exclude from Management, the range can be of greater scope.
10. From the Network View drop-down menu, choose the network view to which the range will be assigned. If the network view is divided among two or more Collectors as described above, select the desired network view entry based on the associated Collector name.
11. Click Add. The new range appears in the ranges table.
Defining Blackout Periods
Discovery processes can occupy significant resources within the network when discovery is taking place. You can avoid possible interference with latency-sensitive network applications by creating time periods when NetMRI will not communicate with devices or networks for discovery. These time periods are called discovery blackout periods. You can create discovery blackout periods for each discovery range you define in NetMRI. Discovery blackout periods are
Note
Discovery ranges associated with network views unassigned to a scan interface are not used for discovery.
Note
If you are discovering end host subnetworks for Switch Port Management, choose the Exclude from management option for the end host discovery ranges.
Note
Only Admin users can configure Discovery Blackout and Change Blackout periods.

Infoblox NetMRI 7.4.4 Administrator Guide Part 1 Introducing and Configuring NetMRI
Copyright ©2020, Infoblox, Inc. All rights reserved. Page 69
•••••
•
•••
1.2.
•
••••
•••
••••
•••
optional and can be enabled and configured, or disabled, at any time. All communications are stopped with a given device, including but not limited to the following:
SNMPSSHTelnetPingTraceroute
A second blackout type, change blackout, allows NetMRI to enforce blackouts for CLI interaction, scheduled or run-now job executions, Telnet/SSH proxy and port control UI features. Change blackouts will allow read-only discovery, device changes detection and device analysis for Issues without permitting any CLI communication or configuration changes. Change blackouts typically disallow operations such as enabling or disabling interfaces on devices.
Discovery blackouts and change blackouts can be applied to the following:
Globally across the entire NetMRI deployment. For more information, see the next section, "Configuring a Global Discovery Blackout or Change Blackout".Discovery IP ranges. For more information, see Configuring Discovery Ranges.Strategic individual devices. For more information, see Creating Blackouts for Individual Devices.Device Groups. For more information, see Creating Device Groups.
Discovery tasks may already be running when a blackout period takes effect. Current tasks will not be interrupted and will complete within their time. NetMRI will not activate new discovery tasks on the chosen network, device group or individual device during the blackout period.
Configuring a Global Discovery Blackout or Change Blackout
You can separately configure discovery blackouts and change blackouts. No dependencies exist between blackout types. You may configure either type without defining new settings for the other type. At the Global level, discovery blackouts and change blackouts apply across all network views, discovery ranges, device groups, and devices unless otherwise disabled at the range or device group level.
Complete the following:
Choose Settings icon –> Setup –> Collection and Groups.On the Global page (which appears by default), check the Enable Discovery Blackout check box and click its Scheduling icon. The Discovery Blackout Scheduling gadgets appear.
In the Recurrence Pattern drop-down, choose how often you want to execute the blackout period. You can select Once, Daily, Weekly, or Monthly.If you choose Once, complete the following:
Choose an Execution Time from the drop-down list.Enter the date of the blackout, in the Day_of_ field.Specify the Duration: 10 or more Minutes, Hours, or Days.
If you choose Daily, click either Every Day or Every Weekday.Choose an Execution Time from the drop-down list.Specify the Duration: 10 or more Minutes, Hours, or Days.
If you choose Weekly, complete the following:Choose an Execution Time from the drop-down list.Check the check boxes for one or more days from Sunday through Saturday.Specify the Duration: 10 or more Minutes, Hours, or Days.
If you choose Monthly, complete the following:Choose an Execution Time from the drop-down list.Day __ of every __ month(s): Specify for the discovery blackout to be executed on day-of-month X of every Y month. Month numbering starts with January. You can see some examples below.Day 5 of every 1 month(s): means the blackout is executed on the 5th of the current and each next
Note
A common use case for discovery blackout windows and/or change blackout windows is to enforce them during normal working hours, such as 8AM to 5PM.

Infoblox NetMRI 7.4.4 Administrator Guide Part 1 Introducing and Configuring NetMRI
Copyright ©2020, Infoblox, Inc. All rights reserved. Page 70
•3.
4.
•
•
1.2.3.
••
•
4.5.
•
•
month.Day 5 of every 2 month(s): means the blackout is executed on the 5th of January, March, May, July, and so on.Specify the Duration: 10 or more Minutes, Hours, or Days.
If necessary, select the Enable Change Blackout check box and click its Scheduling icon. The Discovery Blackout Scheduling gadgets appear. Follow the steps above to define the change blackout schedule.Click Save to save your changes.
Specifying Static IPsThe Static IPs tab can specify IPv4 and IPv6 devices that must have a high priority of discovery and data collection by the appliance. Devices matching IP addresses listed in this tab are given priority over other discovered devices, for data collection and for priority in counting toward any device found matching the license limits. The process is similar to a seed router, except that in the latter, we assume the specified device is a router, and specifying it as such accelerates discovery and data collection on that device. A device specified through a static IP can also be excluded from discovery or management. Static IPs and prefixes can also be written in an Excel file to import into the appliance.
Devices in the Static IPs list also will be immediately rediscovered by NetMRI even after you delete the device and its discovered data by other means. If you remove a device from the network that may be in the Static IPs list, ensure that you also delete the device from this page to prevent attempts at rediscovering the device.
For an OC deployment managing a single large network, choose the network view entry from the Network View list. You will see multiple entries in the pages under Settings icon –> Setup –> Discovery Settings for the Network View list. The entire network is assigned to a single network view. However, each network view entry is identified through the association of each Collector. This allows you to edit discovery settings for each Collector in the same network view.
Examples:
Network 1 (NM35) Network 1 (NM36) Here each Collector, NM35 and NM36, is associated with the same network view.
For an OC deployment managing multiple networks, choose the desired Collector from the Filter by Collector list. Then, select the network view under the Network View list.
It is also possible that a statically defined device in the Static IPs tab is in an Exclude or Ignore range in the Settings icon –> Setup –> Discovery Settings –> Ranges tab. In all such cases, the range is excluded or ignored but a statically defined device found matching an IP address within that range will be discovered and managed.
To create a new static IP entry, complete the following:
Choose Settings icon –> Setup –> Discovery Settings –> Static IPs and click New.Enter the IP address for the static device . The value can be IPv4 or IPv6.Select the desired Discovery Mode. Specify the Discovery Mode as:
Include in Discovery: NetMRI will discover and manage any device found matching that range.Exclude from Discovery: Ignore the specified values and do not discover them through any of the specified protocols.Exclude from Management: NetMRI will discover any device found matching that range, but will not manage or collect data from the device.
(For Operations Center only) From the Filter by Collector: drop-down menu, choose the Collector from the list.Choose the network view with which the static IP will be associated, by clicking the Network View drop-down menu. This step is required.
If this is part of the first discovery of the network, and no other network views are configured, the Network View selector does not appear, and the default Network 1 network view is automatically assigned. Otherwise, choose the network view from the list.Or(For Operations Center only) From the Network View drop-down menu, choose the network view to which the static IP for discovery will be assigned. If the network view is divided among two or more Collectors, choose the desired network view based upon the associated Collector name.

Infoblox NetMRI 7.4.4 Administrator Guide Part 1 Introducing and Configuring NetMRI
Copyright ©2020, Infoblox, Inc. All rights reserved. Page 71
•
•
•
1.2.3.4.
6. Click Add to place the new static IP address into the table.
To import discovery setting data, click Import. In the dialog, click Browse to select the CSV file, and then click Import.
See Credential Import Formats for import file syntax.
Adding Device Hints
The Device Hints tab provides hints to NetMRI's discovery engine for locating specific types of network devices (for discovery purposes, chiefly routers and switch-routers) by using IP address patterns and DNS name patterns. For instance, if most routers are found at an IP address ending with ".1", specifying "*.*.*.1" and associating the Router device type for an IP address hint allows the appliance to prioritize discovered devices matching that hint higher in its credential collection queue to help speed discovery. NetMRI considers this hint when it attempts to determine a device type for a discovered device.
Use a single asterisk (*) to wildcard an entire IPv4 octet (192.168.1.*). The " * " wildcard is not applicable for IPv6 hint rules. The double colon ("::") is used for IPv6 hint values.Valid IP address patterns are either the numeric values of the octet or an asterisk for any number of octets in the IP address. For device name matches, valid DNS characters and the asterisk character are valid definitions. For instance, rtr will match any device name with "rtr" in its definition.Device hints are optional and are used only to speed network discovery and to assist with the determination of device types absent other discovery data.
To create a new router hint, perform the following:
Choose Settings icon –> Setup –> Discovery Settings –> Device Hints and click New.Select the Device Type from the dropdown list. Typically, this should be Router or Switch-Router.Enter the IP address pattern or DNS pattern needed for device detection.Click Add to place the new hint into the table.
Device Hints apply across the entire system and are not associated with network views.
IPv6 Hint Details
For IPv6, router hints are formatted to start with a double-colon designator ("::") and followed by the host-side identifier for the hint. IPv6 router rules can be up to 48 bits in length, applying only to networks where the rule fits. The shorter the hint, the broader the rule.
Such rules apply to Router or Switch-Router devices to be used during discovery.
For IPv6 networks, the process entails discovering routes and then sending probes, using those hints, into those networks to discover the intermediate hops leading to them. Discovery performance can be improved if a site uses static IPv6 addresses for routers, such as
<any 64-bit network prefix>:<first 56 bits of host IP>:10
These values can be added as hints. Further examples are as follows:
Note
When exporting discovery settings from an Operations Center (using CSV Export), the Collector will not be present in the exported data.
Note
Any device hint applies only to Router or Switch-Router device types during discovery. You can apply other hints to any supported device type to ensure detection and management by NetMRI.

Infoblox NetMRI 7.4.4 Administrator Guide Part 1 Introducing and Configuring NetMRI
Copyright ©2020, Infoblox, Inc. All rights reserved. Page 72
•
Discovered/Found Route Hint Resulting Discovery Target
FC00:db8:a2:b01::/64 ::1 FC00:db8:a2:b01::1
FC00:2345:3400:1678::/64 ::2022:0:1 FC00:2345:3400:1678::2022:0:1
FC00:2224:1353::/48 ::2:0:10 FC00:2224:1353::2:0:10
Adding Seed RoutersYou can define Seed Routers for NetMRI to speed up network discovery. The definition of seed routers is highly recommended for IPv4 networks and is required for IPv6 networks. Seed routers are also given priority (like static IP definitions) for determining which devices are counted toward NetMRI's license limits.
For discovery of any IPv6 network, at least one well-connected IPv6 router (preferably with routes to all other networks to be managed by NetMRI) must be placed in the Seed Router list. In some cases, seed routers may not have the full routing tables or be unable to provide full information for some reason. The general rule of thumb is that more seed routers are better, but the connectivity of the seed router(s) also helps determine how many seed routers you need. Avoid having more seed entries than necessary. Also, note that seed routers are included in the CIDRs count that should not exceed 1000 per the recommendation in the Infoblox Discovery Best Practices Guide.
The Seed Router table lists each defined seed router with its discovery status (as defined in the Network Explorer –> Discovery page). By reviewing the discovery status for each seed router, you can determine whether NetMRI should be able to discover the network successfully, or if there are possible configuration errors preventing network discovery without having to wait to see what NetMRI finds.
For an OC deployment managing a single large network, seed routers can be assigned to each Collector. Choose the network view-collector entry from the Network View list. You will see multiple entries in the pages under Settings icon –> Setup –> Discovery Settings for the Network View list. The entire network is assigned to a single network view. However, each network view entry is identified through the association of each Collector. This allows you to edit discovery settings for each Collector in the same network view.
Note
For /48 through /125 routes, NetMRI automatically attempts to discover any routers at <network address>::1 along with any subnet probes or additional hints as noted. For /126 and /127 routers, the first and last addresses are probed automatically. /128 prefixes are automatic direct discoveries.
Note
For effective use of seed routers, you must also provide admin credentials to NetMRI to allow it to pull the key routing and connectivity information, including the IPv6 routing table and the local Neighbor Discovery Cache, from the device. NetMRI uses the standard IPv6 counterparts to standard communications protocols, including SSH and SNMP.
Note
If you have disabled discovery, or discovery is disabled because the NetMRI license is for evaluation, you can define static IP addresses and then only the Static IPs tab is available. If discovery is disabled, NetMRI restricts the number of static IPs to the device limit for which the system is licensed.

Infoblox NetMRI 7.4.4 Administrator Guide Part 1 Introducing and Configuring NetMRI
Copyright ©2020, Infoblox, Inc. All rights reserved. Page 73
•
1.2.3.4.
•
•
•
••
Examples:
Network 1 (NM35) Network 1 (NM36) Here each Collector, NM35 and NM36, is associated to the same network view.
For an OC deployment managing multiple networks, you choose the desired Collector from the Filter by Collector list. Then, select the network view under the Network View list. Also bear in mind that any single Collector can have multiple network views.
You can enter IPv6 seed router values in a different fashion from a conventional IPv4 router address, because the address value is longer and is formatted differently. You can use the same data entry field for adding a new seed router whether the entry is an IPv4 or IPv6 address.
Seed router values have other considerations when working with IPv6. Collected IPv6 routing information uses link-local unicast (indicated with the FE80: prefix) addresses as the next hops from a current device, but globally advertised routes (or local IPv6 unicast routes that are known throughout the enterprise network) will not automatically be available. Because NetMRI uses routing protocol advertisements and other elements to determine global addresses of next hops for further discovery, the lack of global routing advertisements in IPv6 limits the detection of IPv6 router addresses.
As a result, one or more globally accessible IPv6 router addresses must be added as seed routers (whether local unicast or global unicast is dependent on the network). Ideally, the seed router would have routes to all other locations in the network. Otherwise, you will need more than one seed router value to discover the full network. Do not enter link-local router addresses as seed routers, because link-local addresses have no significance for devices such as NetMRI that are not locally attached to that link.
After NetMRI discovers the routers and collects their routing tables, it uses that information to communicate with and discover adjacent routers, and other devices local to the seed router and otherwise discovered in that part of the topology–including any routers in defined Ranges–to discover the next series of hops in the IPv6 network. The process continues until all IPv6 devices are discovered, including endpoints.
To add new router values into the Seed Routers table, perform the following:
Choose Settings icon –> Setup –> Discovery Settings –> Seed Routers and click New.Enter the new value into the Seed Router IP Address field.(For Operations Center only) From the Filter by Collector: dropdown menu, choose the Collector from the list.Choose the network view with which the seed router will be associated, by clicking the Network View drop-down menu. This step is required.
If this is part of the first discovery of the network, and no other network views are configured, the Network View selector does not appear, and the default Network 1 network view is automatically assigned. Otherwise, choose another network view from the list.
Or
(For Operations Center only) From the Network View drop-down menu, choose the network view to which the seed router for discovery will be assigned. If a network view is divided among two or more Collectors, choose the desired network view based upon the associated Collector name.
5. Once the new value is entered into the Seed Routers table, click Add and Discover to immediately begin the discovery process, or click Add to place the router value into the table for later discovery.
Configuring Discovery for SDN and SD-WANNetMRI allows you to collect and manage data from SDN and SD-WAN environments. Currently, you can discover Cisco ACI and Cisco Meraki.
To do so, go to Settings icon –> Setup –> Discovery Settings –> SDN. You can do the following on this tab:
New: Add a new Cisco APIC or Cisco Meraki configuration. See Adding and Configuring Cisco ACI Discoveryand Adding and Configuring Cisco Meraki Discovery.Edit: Modify information about a selected configuration.Delete: Remove a selected configuration from the list.

Infoblox NetMRI 7.4.4 Administrator Guide Part 1 Introducing and Configuring NetMRI
Copyright ©2020, Infoblox, Inc. All rights reserved. Page 74
•
•••
•
••
1.
2.3.4.5.
••
•
•
••
•
Import: Import a CSV file containing Cisco ACI or Cisco Meraki information. For information about syntax formats, see Discovery Settings Import Formats.Show/Hide Credentials: Display or hide the user name and password credentials of added configurations.Discover Now: Start the discovery process immediately for a selected configuration.(For Operations Center only) Filter by Collector: Filter the added SDN configurations by Collectors that perform SDN discovery. Collector filter also displays respective device limits and licensing limits.
You can also define general SDN and SD-WAN settings as described in Configuring SDN and SD-WAN Polling Settings.
After executing SDN and SD-WAN discovery, you can see the results in Network Explorer -> Discovery. For more information, see Viewing and Managing Discovery Results.
Adding and Configuring Cisco ACI Discovery
Enabling discovery of Cisco ACI devices provides visibility into your Cisco ACI infrastructure. This allows you to view and manage discovered IP addresses of Cisco ACI fabric members such as APIC controllers and fabric switches with their attached end points.
For each configured Cisco ACI, NetMRI discovers the following information:
APIC Controller (managed device): Collects basic information on ACI fabric devices such as device model, vendor name, OS information, IP address, and the system name.ACI specific endpoint information such as EPG, Bridge Domain, and Tenant.General Endpoint (devices) information such as name, IP address, VRFs, and physical connection (fabric port).
NetMRI categorizes leaf and spine switches, API controller as network devices, and end points as end hosts.
To add and configure a Cisco ACI fabric discovery, complete the following:
Make sure that you enabled SDN and SD-WAN polling in Settings icon –> Setup –> SDN/SD-WAN Polling. For more information, see Configuring SDN and SD-WAN Polling Settings.Choose Settings icon –> Setup –> Discovery Settings –> SDN.Click New. In SDN Type, select Cisco ACI.Complete the following:
Fabric Name: Specify a short and unique name for the current Cisco ACI configuration.Addresses: Click Add and enter the hostname or IP address of the Cisco APIC controller. If your fabric includes more than one controller, click Add again to add more addresses.Network View: Select the network view to identify the corresponding network interface for connectivity with the Cisco ACI. In parentheses next to the network view name is displayed the name of the associated collector. The network view and collector are assigned to discover devices from the ACI fabric.Protocol: Select HTTP or HTTPS.If you select HTTPS, you must use a Root CA or Intermediate CA certificate to allow communication with the Cisco APIC as described below. If your ACI fabric includes multiple controllers, use a combined PEM certificate. To do so, copy the ASCII data from all of the certificates into a single file.CA Certificate: Perform one of the following:
Select a previously imported CA certificate. To learn how to import a CA certificate in NetMRI, see Installing CA Certificate.Click Import CA Certificate and select a CA certificate directly from your machine.For how to prepare a CA certificate, see About CA Certificates for Cisco APIC. The APIC controller address must match either the certificate subject or one of subject alternative names.
Note
The APIC tab in the discovery settings was renamed to SDN. You can find all previously configured Cisco ACIs in this tab that is described below.

Infoblox NetMRI 7.4.4 Administrator Guide Part 1 Introducing and Configuring NetMRI
Copyright ©2020, Infoblox, Inc. All rights reserved. Page 75
•••
6.
7.
•••••
1.
2.3.4.5.
••
••
••
6.
7.
Username: The login name for the Cisco ACI.Password: The login password.Use Global Proxy Settings: Select if you want to use a Proxy server for connectivity with the Cisco ACI. For more information, see Configuring Proxy Settings for SDN Discovery.
Click Test Connection to check if the fabric is reachable and the provided credentials are correct. The connection test results are also written to the syslog.Click Add or Add & Discover.
Adding and Configuring Cisco Meraki Discovery
Enabling discovery of Cisco Meraki provides visibility into your Cisco Meraki SD-WAN elements, for example:
Wireless access pointsSwitchesRoutersCamerasPhones
NetMRI classifies Meraki cameras and phones as end hosts and other Meraki devices as network devices.
To add and configure Cisco Meraki discovery, complete the following:
Make sure that you enable SDN and SD-WAN polling in Settings icon –> Setup –> SDN/SD-WAN Polling. For more information, see Configuring SDN and SD-WAN Polling Settings.Choose Settings icon –> Setup –> Discovery Settings –> SDN.Click New.In SDN Type, select Cisco Meraki.Complete the following:
Config Name: Specify a short and unique name for the current Cisco Meraki configuration.Network Interface: Select the interface that will be used to access the device. In parentheses next to the interface name is displayed the name of the associated collector. As Cisco Meraki infrastructure may have overlapping IP addresses in different network views, you should explicitly specify a network interface exposed to the internet.Protocol: HTTPS by default.Address: Enter the hostname or IP address of the Cisco Meraki Dashboard API. By default it is api.meraki.com.API Key: Access key required to use Cisco APIs.Use Global Proxy Settings: Select if you want to use a Proxy server for connectivity with the Cisco Meraki device. For more information, see Configuring Proxy Settings for SDN Discovery.
Click Test Connection to check if the device is reachable and the provided credentials are correct. The connection test results are also written to the syslog.Click Add or Add & Discover.
Configuring SDN and SD-WAN Polling Settings
Under the Settings icon –> Setup –> SDN/SD-WAN Polling, you can enable or disable the SDN and SD-WAN polling globally and define network view mapping rules for Cisco Meraki. If SDN and SD-WAN polling is disabled, only traditional network devices are polled.
You can also modify the end host collection interval for SDN and SD-WAN. Controlling the polling setting and end host data collection allows you to reduce the load on your system if required.
Note
NetMRI does not save configs from Meraki devices. As device components, it collects only chassis. For interfaces collected from Meraki devices, NetMRI displays only the enabled or disabled interface status in the Admin Status and Operational Status fields.
NetMRI uses Meraki API version 0.4.

Infoblox NetMRI 7.4.4 Administrator Guide Part 1 Introducing and Configuring NetMRI
Copyright ©2020, Infoblox, Inc. All rights reserved. Page 76
•••
1.2.3.
4.•
•
•
5.a.b.
••
6.
••
1.
2.3.4.5.
••••
6.
For Cisco Meraki devices, you can select between different modes for mapping Meraki networks to NIOS network views. This mapping mechanism is required as your Meraki infrastructure may have overlapping IP ranges that can be supported under different network views. The mapping rules include the following:
Mapping to the predefined SDN network viewAutomatic mappingCustom mapping
To configure SDN/SD-WAN polling settings, complete the following:
Choose Settings icon –> Setup –> SDN/SD-WAN Polling.Select Enable SDN/SD-WAN polling.Default SDN Network View: The network view that will be assigned to discovered Cisco Meraki devices for which the automatic network view mapping is disabled. You enable or disable automatic mapping in the Advanced panel. For more information, see the step below.In Network View Mapping, select one of the following:
Disable automatic mapping and use predefined SDN Network View: Select to map collected SDN/SD-WAN devices to the default SDN network view defined in the previous step.Automatically create network views for unmapped networks: Select to automatically map collected networks to their network views using NetMRI internal rules. Network views that do not exist are created automatically. The mapped networks are displayed in the table that is not editable.Enable network view mapping defined below: This is custom mapping. Select this to manually map collected networks to the appropriate network views. To change a network view entry, double-click it in the table.
If necessary, override the global data collection interval that will be applied to the SDN/SD-WAN host polling:Go to the Settings icon –> Setup –> Collection and Groups –> Switch Port Management.Specify one of the following:
Periodic Collection: Specify the N minutes or hours when the collection should occur.Scheduled Collection: Schedule recurrent collection based on hourly, daily, weekly, or monthly time periods. Click one of the tabs, Once, Hourly, Daily, Weekly, or Monthly to choose a recurrence pattern.
Click Save.
Configuring Proxy Settings for SDN Discovery
Based on your NetMRI deployment type, you can define Proxy settings in the following ways:
Standalone: you can define one proxy server for the standalone appliance.Operation Center with collectors: you can define a separate Proxy server for each collector.
To configure a Proxy server, complete the following:
When creating a new or editing an existing SDN configuration in Settings icon –> Setup –> Proxy Settings, select Use Global Proxy Settings.In the Setup panel, select Proxy Settings.In the Proxy For drop-down list, select a specific collector.Select Use Proxy Server.Complete the following:
Name or IP Address: An FQDN or IP address of the Proxy.Port: The port number of the Proxy.Username: The username that NetMRI will use to log in to the Proxy.Password: The password that NetMRI will use to log in to the Proxy.
Click Save.
Note
A network name in the mapping table is made up by combining the Cisco Meraki organization and network name. The Source column displays the fabric name or config name that you previously defined for the SDN or SD-WAN configuration. The network view name is made of the network and source values.

Infoblox NetMRI 7.4.4 Administrator Guide Part 1 Introducing and Configuring NetMRI
Copyright ©2020, Infoblox, Inc. All rights reserved. Page 77
•••••••
••
1.2.
3.
Running Network Discovery on Routed and Switched NetworksAfter you establish your scan interface's connection to their network, discovery automatically begins polling the IP addresses in the network view (based on discovery settings) and begins to report what it finds to the Discovery tables under Network Explorer –> Discovery.
NetMRI automatically collects discovery data from pure L3 routing devices every 180 minutes. This setting cannot be changed.
Discovery identifies contacted devices by their IP address and hostname, and IP addresses are gathered under a few categories: Classified, Reached, and Identified, which is the complete aggregate of all discovered IPs. Classified and Reached IPs are subsets of the Identified classification. These values appear in a simple bar graph at the bottom of the Discovery page.
For all networks, NetMRI discovers and stores the following information:
Globally routable interface IP addresses.VRRP/HSRP virtual IP address (if applicable).Associated VLANs.BGP AS and neighbor adjacencies (if applicable).Cisco VoIP endpoint devices.GLBP virtual IP (if applicable).VRF configurations, including their respective private network information. NetMRI notifies the user through a System Health alert when it discovers VRF configurations. The alert advises you to assign the VRFs to a network view.IPv6 networks and subnet masks.IPv6 Link-local interface IP addresses.
Controlling Switched Network DiscoveryYou can manually control the frequency of discovery polling of switched Ethernet networks. To fully discover them, you must define these settings. NetMRI's Switch Port Manager feature governs how L2 and L2/L3 Ethernet switching devices are polled for discovery and data collection. To enable automatic polling through ARP for switched devices (network devices that belong to the Switching and Switch-Router device groups), perform the following:
Go to Settings icon –> Setup –> Collection and Groups –> Switch Port Management side tab.Set the Periodic Polling time interval. This defines the ARP polling interval for repeated data collection. The default value is 1 Hour.Go to the Advanced Settings page (Settings icon –> General Settings –> Advanced Settings –> Discovery group –> Poll ARP with SPM) and choose the True option. The setting is set to False by default.
Note
A device is considered an active device for management if NetMRI can poll and monitor the device using the SNMP protocol.
Note
Network polling settings can also be defined for managing a more or less continuous discovery process during NetMRI operation. Do this under Settings –> Collection and Groups which provides a second group of important settings for governing automatic discovery behavior.
Note
For more details on switch port management settings, see Global Switch Port Management Polling Settings.

Infoblox NetMRI 7.4.4 Administrator Guide Part 1 Introducing and Configuring NetMRI
Copyright ©2020, Infoblox, Inc. All rights reserved. Page 78
1.2.3.
4.
Running Discovery on a Single DeviceTo refresh discovery for a single device, or force discovery for a single device, perform the following:
In the Device Viewer –> Settings & Status –> Management Status -> Discover Now. A pop-up dialog appears, displaying the command-line and SNMP directives that NetMRI immediately sends to the selected device. NetMRI executes the processes required against the device to complete discovery. These include SNMP credential collection, SNMP data collection, device group assignment, and CLI credential collection. Scroll through this listing to view specific details on what types of information are being obtained by NetMRI for the selected device. Some time may be required to finish the process.
To force a device to the top of the discovery queue, click Discover Next (below the table).
To remove a device from NetMRI Management, click Unmanage and confirm the operation. Unmanaged devices remain discovered, but the appliance will not collect data from them. NetMRI will not obtain details, (such as vendor, model, and operating system version) because SNMP access is required to complete those processes.
To delete the device from NetMRI's database, perform the following:
Click Delete (below the table).In the Delete dialog, select Exclude from discovery (this is optional).If the device has duplicates, you can also select Delete devices instances on other collectors. For more information, see Deduplication of Devices Discovered by Multiple Collectors.Click Yes to confirm the deletion.
Vendor-Specific Requirements for Virtual Device DiscoveryNetMRI discovers Cisco-based virtual device contexts through the Cisco command-line interface. Telnet and/or SSH access must be enabled on the Virtual Host, and the credentials for the contexts must be known to NetMRI.
NetMRI discovers Juniper-based virtual device contexts through SNMP. Juniper's term for virtual routers/switches is Logical System. For uniformity, NetMRI labels all Juniper-based Logical Systems as Virtual Devices. SNMP must be enabled on the Juniper virtual host and access granted for the NetMRI appliance to all virtual devices/Logical Systems.
A Juniper command sequence illustrates how to enable the Juniper device's SNMP access using a community string snmppub on a virtual device/Logical System named M5VdcTest1:
community @snmppub {
authorization read-only; routing-instance M5VdcTest1/default {
clients { 0.0.0.0/0; } } } routing-instance-access {
access-list { *; } }
Note
If the device continues to appear in collected data, NetMRI will re-list it unless you choose to exclude the device from discovery when it is deleted.

Infoblox NetMRI 7.4.4 Administrator Guide Part 1 Introducing and Configuring NetMRI
Copyright ©2020, Infoblox, Inc. All rights reserved. Page 79
••••
•
•••••
•
In all cases, the Juniper Virtual Host (i.e. the device hosting the virtual instances) acts as a proxy to the virtual devices for all SNMP communication. Direct SNMP access to Juniper Virtual Devices is not permitted. This is largely transparent in NetMRI. If connectivity to the Virtual Host is lost, SNMP collection of the Virtual Devices is not possible and the VDCs will appear on the Devices Not Present page.
Both the virtual hosts and their virtual devices must be discovered by NetMRI as independent network devices before it will identify them as Virtual Hosts and Virtual Devices.
You may see a specific report Issue type during discovery of virtual hosts and virtual devices. The issue will usually appear as unknown community string. This may report against Cisco devices for which VDC discovery is CLI-only. Should this issue appear, you can repress it for further VDC discovery procedures. See the Performing Issue Suppression topic for more information. Other Issues that may appear during indirect discovery include Down Device and Config Bad Password. These issues may need to be dealt with on a case-by-case basis or may be repressed as needed once it becomes clear that the virtual devices can be successfully managed after discovery.
Indirect DiscoveryNetMRI supports indirect partial discovery of otherwise unreachable virtual device contexts. A minimal subset of information is gathered by NetMRI, consisting of the following:
Device typeUptimeVendorModel
Cisco devices supporting CLI access through the physical host will also allow the collection of the configuration files.
This information is entered into the NetMRI database. Full discovery of any virtual device context requires SNMP access. On Cisco virtual devices for Cisco ASA, Pix, ACE load balancers, and Nexus switches, SNMP access is available only to each virtual device context. As noted SNMP access to Juniper virtual device contexts is done indirectly through the SNMP activation on the virtual host, acting as a proxy for the VDCs.
Viewing and Managing Discovery ResultsThe Discovery tab (Network Explorer –> Discovery) provides detailed information about NetMRI's discovery processes through a special Discovery drop-down menu. To open the menu, click the down arrow on the Discovery tab.
Use this tab and menu to perform the following:
View discovery and data collection processes in real time. IP addresses are listed as they are discovered from any source.View discovery milestones and status, which provide a context for fixing problems.Monitor IP address processing to gauge overall progress.Correlate device IP addresses with management IP addresses.Search all known IP addresses.View and control credential guessing queues. You can see where a device falls in the sequence, and prioritize it if desired.Tell NetMRI to immediately perform the full discovery process on a device. Results are displayed when received.
Note
All IP addresses of the virtual hosts and virtual devices must be in NetMRI's discovery IP ranges.
Note
If virtual devices on a specific virtual host do not provide direct access through SNMP, you will see a warning message on the virtual device's Device Viewer, nothing that CLI interaction is the only supported communication mode.

Infoblox NetMRI 7.4.4 Administrator Guide Part 1 Introducing and Configuring NetMRI
Copyright ©2020, Infoblox, Inc. All rights reserved. Page 80
••
•••
•
••
Administer devices to view and change licensed/unlicensed/unmanaged status."Unmanage" a discovered device, set the licensing status for a device, delete a device from the list, and other operations.
The following views are available via the Discovery menu:
Recent Activity Lists all known IP addresses discovered by NetMRI.
License Management Provides data similar to Recent Activity, sorting the list according to priority in the algorithm for determining where a device fits in the device license scheme. This view helps determine why a given device is or is not licensed, where it is on the list to change the NetMRI license (if necessary) or to adjust a setting so a given device is given license priority.
Problems Provides data similar to Recent Activity, but filtered to devices reporting discovery errors.
Non-Detected IPs Provides data similar to Recent Activity, but filtered to devices that NetMRI has not been able to communicate with.
SSH Queue, Telnet Queue, and SNMP Queue
Shows whether a given device is in the processing queue for determining credentials. Data about each device in the queue includes the time of the prior attempt, time the device is going to be attempted again, and status. SNMP discovery is the key to complete device discovery. Until a device has fully discovered SNMP credentials, data collection and analysis cannot continue.
The area at the bottom of the Discovery tab provides the following summary data for the selected collector:
Network Devices: The number of devices discovered.Licensed Devices: The number of licensed devices discovered.IP Addresses:
Classified: The number of IP addresses the appliance has fully discovered with SNMP collection and assigned to a device group.Reached: The number of IP addresses NetMRI has touched.Identified: The number of IP addresses known to exist on the network.
For more information about interpreting discovery data that the previous views display, see the next section Interpreting Discovery Table Data.
Sometimes a device may be discovered by more than one collector. In that case, a deduplication procedure occurs and the device is marked with a special icon in the UI. For more information, see Deduplication of Devices Discovered by Multiple Collectors.
Also, see Saving Table Views on how to save customized views of discovery results.
Interpreting Discovery Table DataThe Recent Activity, License Management, Problems, and Non-Detected IPs tables organize information in the following columns:
E (Existing Status) The listed IP address exists in the network. All devices will receive this status to indicate where NetMRI first discovered the address.
Note
Operations Center only: Data displayed in a view is limited to the Collector selected in the Filter by Collector field in the right side of the header.

Infoblox NetMRI 7.4.4 Administrator Guide Part 1 Introducing and Configuring NetMRI
Copyright ©2020, Infoblox, Inc. All rights reserved. Page 81
P (Fingerprint Status) If NetMRI is configured to use fingerprinting, device fingerprint status is listed in this column.
R (Reached Status) Shows whether NetMRI has sent a packet to the device and received a reply, establishing that the device is reachable. Devices are typically tested for reachability through SNMP and the CLI, usually with an ICMP Ping operation.
S (SNMP Credentials Status) Indicates the status of the SNMP credential guessing process.
SC (SNMP Collection Status) Shows the status of SNMP data collection for the device. Success indicates that a device successfully allows data collection through SNMP. If this is not successful, check the S field to see whether the correct credential is given.
C (CLI Credentials Status) Displays the status of the CLI credential guessing process.
CC (Config Collection Status) Indicates whether a device supports command-line connectivity and whether the configuration collection is successful. If this is not successful, check the C field to see whether the correct credential is given.
G (Device Group Status) Shows the status of the device group generation process. Success indicates that a device has been assigned to at least one group.
DB (Discovery Blackout Status) Indicates whether or not the selected device is in a Discovery Blackout period. Two states are possible, In Blackout and Not in Blackout.
CB (Change Blackout Status) Indicates whether or not the selected device is in a Change Blackout period. Two states are possible, In Blackout and Not in Blackout.
Status Licensed devices are listed as such. Unlicensed devices are non-network devices or devices for which NetMRI license limits have been exceeded. Unmanaged devices are those which NetMRI will discover, but not manage.
Type Lists the device type as determined by NetMRI.
Last Timestamp Date and time the data in the device records were updated or verified as unchanged.
Last Action The last action performed by NetMRI upon device after discovery takes place. For example, Device Groups: Successfully assigned to device groups indicates that the device was successfully discovered and added to a device group.
Last Seen The date and time when the device was last seen on the network. For example, reading the IP address in the ARP table from a router.
First Seen Date and time when the listed device was first detected by the NetMRI appliance.
You can pass the mouse over the E, P, R, S, SC, C, CC, and G columns to display an explanatory tooltip.
The following status icons appear in the tables:
Infoblox NetMRI 7.4.4 Administrator Guide Part 1 Introducing and Configuring NetMRI
Copyright ©2020, Infoblox, Inc. All rights reserved. Page 82
•••
Passed: The device passed the process.Failed: The device failed the process.Not Applicable: The process is not applicable to the device.
A pink row in the table indicates that there is at least one failed process for the device.
To see the action that generated a status, along with action’s timestamp and source, hover over a status icon.
Each of the column categories provides a reason or an explanation of how a discovery phenomenon took place upon each device. Consider the E (Exists) column, for example. Possible explanations for why a device was found to exist in the network include the following:
Exists: Device exists / Source: SNMP Exists: Device exists / Source: NIOS
Exists: Device exists / Source: Net-SNMP Exists: Device exists / Source: NetMRI
Exists: Device exists / Source: CIDR Table Exists: Device exists / Source: Seed
Exists: Device exists / Source: CDP Exists: Device exists / Source: Wireless Controller
Exists: Device exists / Source: Route Table Exists: Device exists / Source: IP Phone
Exists: Device exists / Source: ARP Table Exists: Device exists / Source: Call Server
Exists: Device exists / Source: Path Exists: Device exists / Source: VPN Table
Exists: Device exists / Source: CDP Table Exists: Device exists / Source: Wireless AP
Exists: Device exists / Source: LLDP Exists: Device exists / Source: Subnet Scan
Exists: Device exists / Source: HSRP Exists: Device exists / Source: Discover Now
Exists: Device exists / Source: VRRP
To expand all IP addresses of a device and the corresponding interfaces to which they are assigned, click the arrow to the left of the device IP address.
Deduplication of Devices Discovered by Multiple CollectorsWhen a device is discovered by more than one collector, NetMRI deduplicates the device to prevent unnecessary load on the device as well as data conflicts. Initially, the collector that first discovered the device is set as the temporary management collector. Next, NetMRI selects the permanent management collector for said device.
Also, if a device is discovered through different network views and different IP addresses, it is not deduplicated. If a device is discovered through different IP addresses but through one network view, it is deduplicated.
Deduplicated devices are marked by special icons next to their IP address. This means the following:
Icon Tooltip Message Description
This device has duplicates on other collectors. Two or more collectors, including the current one, discovered the device, i.e. the device has "duplicates" on multiple collectors. The current collector is set as the management collector for the device. The other collectors do not poll the device any more to avoid unnecessary load.
This device is managed by another collector. The current collector discovered the device along with other collectors. Another collector, not the current one, was assigned as the managing one. The device shows “Unlicensed” in the License Status column as the current collector does not manage it.
Infoblox NetMRI 7.4.4 Administrator Guide Part 1 Introducing and Configuring NetMRI
Copyright ©2020, Infoblox, Inc. All rights reserved. Page 83
1.
2.
3.
4.
a.b.c.d.
5.
1.2.
As to how NetMRI assigns the management collector for a device, see Algorithm for Assigning Management Collector.
The management collector is assigned to a device using the algorithm only once. However, you can change the management collector manually in the Device Viewer. To open the Device Viewer, click the device IP address. The Management Status page of the Device Viewer opens, showing the current device status on the management collector. To learn how to change the management collector, see Manually Changing Management Collector.
For devices that did not undergo deduplication, load balancing is performed automatically between collectors. NetMRI determines the less loaded collector in terms of devices and "moves" extra devices from other collectors to this collector. For information, see Deduplication and Load Balancing Settings.
Algorithm for Assigning Management Collector
NetMRI Operation Center assigns the management collector for a device using an algorithm. It runs every hour against devices served by a temporary management collector.
The algorithm is as follows:
If the user manually assigned the management collector for the device, it is used as such.
If not, the following sequence applies to select it automatically:
If the current collector guessed CLI credentials for the device, it is assigned as the management collector. The algorithm finishes.Else, a search is performed among the other collectors that discovered the device for the one that guessed CLI credentials. If such collector is found, it is assigned as the management collector. The algorithm finishes.If no such collector is found and the timeout for choosing the collector has not yet elapsed, the collector selection is postponed for an hour. This continues until a collector with device CLI credentials is found.If no collector with device CLI credentials is found and the timeout for choosing the collector has elapsed, the IP addresses of all those collectors are sorted in the following order of priority:
Software Loopback interface with the lowest if Index and IP address with the lowest numeric value.Interface name of "mgmt" with lowest ifIndex and IP address with the lowest number value.ethernet-csmacd interface with lowest ifIndex and IP address with the lowest numeric value.Interface with lowest ifIndex and IP address with the lowest numeric value.
The highest priority IP address is selected and the corresponding collector is assigned as the management collector for the device.
You can change the timeout for choosing the collector in Deduplication and Load Balancing Settings.
Manually Changing Management Collector
To manually change the management collector for a device, complete the following:
Click the device IP address to open the Device Viewer.Under Settings & Status, click General Settings.
Note
If in discovery settings, you delete a range containing a device that has a "duplicate" on another collector, the device becomes licensed again on the other collector.
Note
Despite the device deduplication functionality, Infoblox recommends defining your discovery settings in a way that collectors scan networks by discovery ranges that do not overlap nor are duplicates.

Infoblox NetMRI 7.4.4 Administrator Guide Part 1 Introducing and Configuring NetMRI
Copyright ©2020, Infoblox, Inc. All rights reserved. Page 84
3.
4.
1.2.3.
•
•
•
•
•••
In the Management Address drop-down list, select the desired collector.
Click Update.
After you manually set the management collector for the device, the automatic collector selection algorithm does not apply anymore.
Deduplication and Load Balancing Settings
To define settings for deduplication and load balancing of devices on collectors, complete the following:
Click Settings icon -> General Settings -> Advanced Settings.In the settings list, navigate to the Deduplication settings group.Click the gear icon for each setting in the group and select Edit. You can edit the following settings:
Enable the load balancer: Enables the load balancing feature for moving devices from highly-loaded collectors to less loaded collectors. The load balancer runs on the weekly maintenance schedule.Minimum capacity utilization: Sets the minimum percentage of devices, from collector's total capacity in terms of managed devices, at which moving devices from such collectors is allowed. For example, if a collector that can manage 1000 devices currently manages less than 40% percent of devices, NetMRI will not move devices from that collector to other collectors as its load is regarded as low.Minimum capacity utilization difference: Sets the minimum difference, in percentage, the current device's utilization by collectors, and at which devices can be moved to the less loaded collector. For example, if a collector has a 47% load in terms of devices and another one has a 45% load, it does not make sense to move devices from the first one to the second.Timeout for choosing the collector: Sets the maximum allowable time, in hours, for choosing the best management collector for the device.
Performing Discovery Operations on Multiple DevicesIn the Network Explorer –> Discovery table, NetMRI displays data on multiple pages when the number of items to be displayed exceeds the maximum number of items that can appear on one page. Use the navigational buttons at the bottom of the table to page through the display.
You can select multiple rows in a table. For example, in a Windows browser, you can form the following to select multiple rows:
Click check boxes adjacent to each other to select contiguous rows.Click check boxes for any row, separated by any number of rows, to select multiple non-contiguous rows.Click the check box in the Select column of the table header to select all rows on a page, as shown in the figure.
When you click the check box in the Select column of the table header, in a table that contains multiple pages, only the rows on the current page are selected. All selected rows are greyed out on the table page, denoting their selection. After you select all rows on a page, you can deselect a specific row by clearing the check box for the row. Then, the remaining table rows remain selected.
For Discovery tasks, you can perform the following:
Note
Sometimes the Management Address drop-down list is not available. This is due to the fact that unassigned VRFs are present in the network the device belongs to. If that happens, click the system health statuses message at the top of the window. In the System Health window that appears, click either Unassigned VRF or Network Editor link and assign VRFs for such device. After that, the Management Address drop-down list becomes available in the Device Viewer.

Infoblox NetMRI 7.4.4 Administrator Guide Part 1 Introducing and Configuring NetMRI
Copyright ©2020, Infoblox, Inc. All rights reserved. Page 85
•
••
•••
••
••
Click Discover Next to execute Discovery protocols on the selected devices. A prompt appears: Are you sure you want to discover the selected 23 device(s) next?Click License to change the license status of all selected devices. For more information, see NetMRI Licensing.Click Unmanage to remove the selected devices from management by NetMRI. A prompt appears: Are you sure you want to stop managing the selected xx devices? The chosen devices will be removed from their licensing and NetMRI will add the license allocation to its availability pool.
Viewing Device Discovery Status and Re-Discovering a DeviceTo view discovery status for any device, open the Device Viewer by navigating to Network Explorer -> Discovery and clicking a device link, or Device Viewer -> Settings & Status –> Management Status. You will see the Management Status for the device. This is an important block of information that immediately describes the effectiveness of communications to the device by NetMRI.
This page provides a subset of the same information listed on the Discovery page, showing the E (Exists), P (Port Scanned), R (Reached), S (SNMP), SC (SNMP Collection), C (Config Credential), CC (Config Collection), and G (Groups) data results for a single device, each with their respective explanation.
The Exists field indicates the listed device has been successfully discovered by the network. The R field stands for Reached. A device can be discovered by any method but not necessarily be reachable. Devices are typically tested for reachability through SNMP and the CLI, usually with an ICMP Ping operation. S and SC are the status indicators for SNMP Credentials and SNMP Collection, respectively.
Corresponding C (CLI Credentials) and CC (Config Collection) indicators also show whether a device supports command-line connectivity and whether configuration collection is successful. Finally, G indicates whether NetMRI successfully assigns the device to a device group.
At times, a device may need a discovery refresh because of significant configuration changes or because it has just been installed. You can choose to run discovery against any individual device at any time.
Click Discover Next to set the device to be the first one discovered in the device group's next discover cycle.Click Discover Now to immediately re-discover the device listed in the Device Viewer.Click License to change the licensing status of the current device. The default state for device licensing is Automatic (NetMRI uses global licensing guidelines to determine whether a device should occupy a license entitlement). For switches and firewall devices, you can choose to explicitly license the device by selecting Licensed and checking the check box for either category.If the device is licensed and you wish to revoke it, or override the global licensing behavior, select Unlicensed.To revoke the current device's Managed status, click Unmanage. The device will be removed from managed status under NetMRI and automatically be Excluded from management. The device will continue to be discovered, however.To remove the device completely from the NetMRI database, click Delete.You can export the device management data to an Excel-compatible .CSV spreadsheet. To do so, click Export. NetMRI creates the file and places it in your browser's Downloads directory.
Overriding Device Names and Types in the Device ViewerDuring device discovery, NetMRI determines the Management IP address, device name, and device type and displays those values in several locations in the UI, including the Network Explorer –> Discovery page and the Config Explorer (Configuration Management –> Config Explorer). Once those values are discovered, should any of those values change at some point in network operation, NetMRI detects those changes and modifies the appropriate values in its database.
If the system admin changes the Name or Type of device in the Device Viewer's General Settings page (Device Viewer –> Settings & Status –> General Settings), re-discovery of that device's settings will no longer be active. For more information, see Viewing and Changing General Settings for a Device.

Infoblox NetMRI 7.4.4 Administrator Guide Part 1 Introducing and Configuring NetMRI
Copyright ©2020, Infoblox, Inc. All rights reserved. Page 86
•
•
•
•••
•
To revert to the auto-discovery of changes to that device's identifying information in the network, you can delete the device from the Discovered Devices list in the Network Explorer –> Discovery tab. The device is removed from the table. You will need to wait for NetMRI to re-discover the device on the network, and then refresh or re-open the Network Explorer –> Discovery tab to view the updated information. Click the device group name in the right panel if you need to locate the updated device in its expected group.
Data Collection TechniquesNetMRI discovery depends on a collection of under-the-hood features to ensure that polling and addition of devices in the network proceed smoothly and accurately. This chapter describes the three following critical tasks.
Defining Data Collection and Device Groups: You must define important settings for network polling. This topic involves the processes of data collection and polling of devices across the network, including polling of switched Ethernet devices. The definition of device and interface groups is discussed in other topics later in this Guide. For more information, see Defining Group Data Collection Settings.
Managing SNMP and CLI Credentials: Credentials are a critical component for discovery and Configuration Management. You can define global default values for admin account logins, enable passwords, and also define admin account logins and enable passwords on individual devices. The topic Adding and Editing Device Credentials provides more information.Debugging and Managing Collection Results: When data collection and polling stops for any reason, NetMRI provides methods for determining the cause of the failure and ways to fix it. See Debugging Issues in Discovery and Data Collection and Running Discovery Diagnostics for more information.
Defining Group Data Collection Settings
Group data collection settings (Settings icon –> Setup –> Collection and Groups) settings define global NetMRI settings for discovery and configuration management:
Polling networks during the discovery process and collecting configuration files from network devices.Editing group rankings, adding or deleting groups.Setting groups' discovery data collection settings.
Global tab settings in the Network Polling panel (Settings icon –> Setup –> Collection and Groups –> Global tab –> Network Polling side tab) provide system-level control over NetMRI's SNMP and discovery data collection operations.
Port Scanning: If enabled, NetMRI probes the TCP and UDP ports listed at Settings icon –> Setup –> Port List, to determine whether they are open. See the results of this scanning action at Network Explorer –> Summaries –> Ports for the entire network, and Device Viewer –> Device/Network Explorer –> Open Services for an individual network device.If Port Scanning is disabled, NetMRI attempts no port probes other than SNMP on any device.
Note
For more information about Device Viewer functions, see Inspecting Devices in the Network and its subsections.
Note
See Creating Device Groups for information on the Groups tab and its associated functions.
Note
Global data collection settings in this panel can be overridden by Device Group and Interface Group settings specified in the Groups tab portion of this page.

Infoblox NetMRI 7.4.4 Administrator Guide Part 1 Introducing and Configuring NetMRI
Copyright ©2020, Infoblox, Inc. All rights reserved. Page 87
•
•
••
•
•
Fingerprinting: (Available in full NetMRI license) If enabled, NetMRI attempts to identify each network device based on the response characteristics of its TCP stack. This information is used to determine the device type. In the absence of SNMP access, fingerprinting is usually the only way to identify non-network devices. If disabled, devices accessible via SNMP are identified correctly; all other devices are assigned a device type of Unknown.Fingerprinting is disabled by default for network polling. You must enable fingerprinting to use the Automation Change Manager's Rogue DHCP Detection feature.
SNMP Collection: If enabled, all data collectors start after this page is saved. If you disable SNMP collection in this tab (i.e., globally), data already collected by NetMRI remains available for viewing; no new data is added and no existing data is removed; this also disables group and device SNMP collection.
SNMP Collection is disabled, for example, when NetMRI is used for offline assessments. By disabling SNMP Collection before removing NetMRI from the network, data can be examined later without any data expiring. SNMP collection can also be enabled/disabled for groups and devices.Performance Collection: If enabled, performance data such as CPU and memory statistics are collected.Use Vendor Community Strings: If enabled, NetMRI uses vendor default community strings when determining a device's community string. If disabled, NetMRI uses community strings with an Origination of User.NetBIOS Scanning: Global setting to enable NetMRI to collect the NetBIOS name for endpoint devices in the network. Device groups also enable NetBIOS scanning. The device group setting is dependent on the global setting; without enabling the NetBIOS Scanning check box, scanning at the device group will not take place. This feature can be enabled only by users with SysAdmin privileges. This feature is globally disabled by default (and also for device groups) to prevent unexpected scanning of the network by a new collector.Smart Subnet Ping Sweep (IPv4 only): Check box to enable subnet Ping sweeps on IPv4 networks, using a range of packets to detect the presence of a system on each IP in the specified range, using ports that are generally open across the network. Performs probes across ICMP Echo, ICMP Timestamp, TCP SYN to port 80, and TCP SYN to port 443. Subnet ping sweeps are used as a last resort in the discovery process. A subnet ping sweep is performed if NetMRI is unable to identify any network devices in a given subnet. Subnet ping sweeps are performed no more than once per day, and will stop on a given subnet once NetMRI discovers a network device and is able to collect data.
Smart Subnet ping sweep is most useful for complete discovery of end-host network segments. Ping sweeps are a tool to aid in discovery, but most discovery operations take place through ARP tables and routing tables collected from infrastructure devices. Avoid using ping sweeps on a large number of discovery ranges, or discovery ranges that are too large (more than a /22 in size) as devices discovered through this method may expire from NetMRI's database before they are refreshed by another discovery cycle.
Note
If you enable Configuration Collection (see below), NetMRI attempts Telnet and SSH access only on network devices.
Note
Smart subnet ping sweeps should not be attempted on subnets larger than /22. Ping sweeps are not used on IPv6 networks because of the dramatically greater scale of network addresses in the IPv6 realm. Smart subnet ping sweeps also have several differences from the discovery ping sweeps that can be enabled under Discovery Settings, which can be found under Settings icon –> Setup –> Discovery Settings.

Infoblox NetMRI 7.4.4 Administrator Guide Part 1 Introducing and Configuring NetMRI
Copyright ©2020, Infoblox, Inc. All rights reserved. Page 88
•
•
•
•
•
•
•
•
•
Refresh device caches before collecting switch port data: Check box to enable refreshing of ARP caches on switches and switch-routers in the managed network before NetMRI performs polling of switch ports. Enabling this feature will not produce an automatic ping sweep of the managed network. The benefit of this feature is that it enables more accurate detection of all endpoint devices on switches. Without ARP refresh, some endpoint devices may not be detected. This feature is globally disabled by default. With this setting globally enabled, individual device groups can also be set to enable or disable this feature.
ARP Collection Priority: (Available in full NetMRI license) Defines the collection method for collecting ARP databases from devices. When set to CLI with SNMP Fallback, NetMRI collects ARP data from devices with the CLI when NetMRI has the appropriate access credentials for the active network device. This mode of collection works only for Cisco devices, and will fall back to SNMP if CLI access does not work. SNMP data collection is used for active devices from all other vendors.Route Collection Priority: (Available in full NetMRI product license) This setting controls which collection method is attempted first when collecting route tables. Should the Route Collection Priority setting be set to SNMP(default), you will also need to pay attention to the Route Limit setting under Advanced Settings (see NetMRI Advanced Settings). If NetMRI encounters a routing table with a table of entries beyond the Route Limit setting, SNMP collection for the current device will be stopped and CLI collection for the routing table will be tried instead. When set to CLI with SNMP Fallback, NetMRI will try to use CLI commands to collect route tables from devices instead of immediately using SNMP. The CLI option may reduce data collection performance problems for routers with large route tables.
Configuration Collection SettingsThe Collection and Groups feature set also specifies the protocols allowed for configuration collection. You specify the Collectors of network data for NetMRI through the Config Management section of the Global page (Settings icon –>Setup –> Collection and Groups –> Global –> Config Management).
The protocols are listed as check boxes under Config Management:
Config Collection: If enabled, the current NetMRI virtual is able to collect configuration data from network devices using enabled protocols.Config Locked: Devices with collected information that show changes during subsequent config collections can be reported as showing "Unauthorized Changes".Use Telnet Protocol: NetMRI opens Telnet terminal sessions with devices that support this option and reads the configurations. Individual devices can make use of Telnet login credentials.Use SSH Protocol: NetMRI opens SSH terminal sessions with devices that support this option and reads the configurations. Individual devices can make use of SSH login credentials.Use HTTP Protocol: NetMRI opens HTTP browser sessions with devices that support this option and reads the configurations. Individual devices can make use of HTTP login credentials.Use Vendor Default Credentials: Enables NetMRI to use its library of vendor-default credentials as part of the process of collecting configuration data.
Note
See the section Global Switch Port Management Polling Settings for more information on global settings for switch port polling.
Note
Disabling the Config Collection check box will disable configuration data collection for the current NetMRI appliance.

Infoblox NetMRI 7.4.4 Administrator Guide Part 1 Introducing and Configuring NetMRI
Copyright ©2020, Infoblox, Inc. All rights reserved. Page 89
•
•
•
•
•
••
Script Execution: If enabled, Configuration Command Scripts or Perl scripts can be executed by NetMRI users with the correct privileges.Vendor Default Credential Collection: If enabled, NetMRI will automatically check for default vendor credentials at the interval specified in Frequency (Daily or Weekly). Checking for vendor default credentials ensures that the network meets compliance standards.
Global Switch Port Management Polling Settings
NetMRI carries out Switch Port Management polling after discovering the relevant devices and adds them to a Switch Port Management device license count. NetMRI offers several polling options from the Settings icon –> Setup –> Collection and Groups –> Switch Port Management side tab:
Port Control Preference: You can specify SNMP or CLI as the polling protocol preferred by Switch Port Manager as the primary method of information gathering.Periodic Polling: Define regular polling time periods.
Choose a polling interval of 30 or more Minutes or in between 1 and 24 Hours.Scheduled Polling: Schedule recurrent polling based on hourly, daily, weekly or monthly time periods. Choosing this option, an Add New Schedule editor appears; click the Edit icon to make scheduling changes.
Choose a Recurrence Pattern of Once, Hourly, Daily, Weekly, or Monthly. in all cases you must choose an Execution Time.Completely disable NetMRI from performing switch port polling by selecting Disable Switch Port Polling.Click the Poll Now button to immediately begin polling all switch and switch-router devices in the managed network.
See Switch Port Management for more information on the use of switch device polling and related topics.
Note
See Adding and Editing Device Credentials for more information on adding logins for specific devices in the Device Viewer.
Note
The topics under Configuration Management provide more information about configuration collection and related operations.
Note
For NetMRI appliances with a Switch Port Management license, polling offers some flexibility. For NetMRI installations, switchport connectivity polling rates remain at the default rate of 90 minutes, but this value can be changed. In all cases, you are limited to no fewer than 30 minutes per polling cycle.
Note
See Creating Device Groups for information on the Groups tab and its associated functions.

Infoblox NetMRI 7.4.4 Administrator Guide Part 1 Introducing and Configuring NetMRI
Copyright ©2020, Infoblox, Inc. All rights reserved. Page 90
1.
2.3.4.
5.
Adding and Editing Device Credentials
The Device Viewer offers dedicated CLI Credentials and SNMP Credentials pages (Settings icon –> Setup –> CLI Credentials and Settings icon –> Setup –> SNMP Credentials) to globally manage and test CLI and SNMP credentials. See About SNMP Credentials, About CLI Credentials, and Credential Import Formats for further details about credential definition.
For all device credential tables, the Select check box is to the far left of the page. When you select multiple rows of a table, a whole page, or multiple pages of either data type, you can click Delete to remove multiple entries from the table. You cannot edit multiple rows of data. The Delete option is the only available option after selecting multiple rows.
Doing so enables you to delete all selected records from the table. Exercise caution when performing this action, as you may unintentionally delete rows of data that you did not wish to select.
Adding and Testing SNMP Credentials for a DeviceThe Device Viewer allows you to enter login credentials for a device in the network and test them. The device must already be recognized in NetMRI through discovery. Credentials can be specified for SNMP and for CLI.
To establish SNMP device credentials at the device level, perform the following:
Go to Network Explorer –> Inventory –> Devices and click a device IP, or to Network Explorer –> Discovery and click a device IP. The chosen device's Device Viewer appears.Click Settings and Status –> SNMP Credentials to open the page for creating SNMP login credentials.Click the Edit button to enable changes to the current settings for device-specific SNMP information.Click either Use SNMP v1/2c or Use SNMP v3. The options are mutually exclusive. If using SNMP v1/2c, enter the community string for the device.If using SNMP v3, enter the required authentication and privacy passwords and choose their encryption protocols from the Auth. Protocol and Privacy Protocol drop-downs.Click Test to try out the new credential. You can also click Show Password to verify that you've entered the correct values.
For SNMP credentials, NetMRI tests against device-related OIDs such as sysUptime and sysDescr. The test is considered passed if these items are successfully polled. For SNMPv1/v2c tests, SNMP version 1 is used during the test.
A test example is shown below:
Test Starting
+++ Checking SNMPv1/v2c [public] ................. Credential passed
Discovered working credential for device after testing 1 credentials
Test Completed
Note
SNMP and/or CLI Credentials can be specified within the Device Viewer for individual devices. Should such a credential not work for a given device, or if command-line access is lost for a given device, NetMRI will always re-guess credentials from the global credential list, including vendor defaults if available. See the sections Adding and Testing SNMP Credentials for a Device and Adding and Testing CLI Credentials for a Device for more information.
Note
When you click Show Password, the table of credentials for the selected device will display a new Passwordcolumn.

Infoblox NetMRI 7.4.4 Administrator Guide Part 1 Introducing and Configuring NetMRI
Copyright ©2020, Infoblox, Inc. All rights reserved. Page 91
1.
2.3.
4.
6. Click Save to commit the changes.
Saved credentials can be deleted by clicking the Delete icon in the table row.
The lower panel is a history that lists all credentials attempted during the last credential guessing attempt for the given device. This data resets each time credentials are guessed for a device. The table indicates the time of each guess and the result of that attempt. If a device is manually configured with a credential, NetMRI updates the history once it attempts to use that credential for data collection.
Adding and Testing CLI Credentials for a DeviceTo establish CLI device credentials at the device level, complete the following:
Go to Network Explorer –> Inventory –> Devices and click a device IP, or to Network Explorer –> Discovery and click a device IP. The chosen device's Device Viewer appears.Click Settings and Status –> CLI Credentials to open the page for creating CLI login credentials.For CLI Credentials, you may supply up to three different login tuples for SSH, Telnet, and for the HTTP protocol. You can also add Enable passwords. Enter the Username/Password (SSH Username and SSH Password, for example) for any or all three as required for the selected device.Click Test to try out the new credential. You can also click Show Password to verify that you have entered the correct values.
For CLI credentials, NetMRI attempts to log in to the device using both telnet and SSH with the credentials configured for each, including empty credentials. The test passes if the login is successful. The HTTP protocol is not used during the test.
A test example is shown below, indicating that no SSH credential is provided but a successful telnet login tuple was provided:
Test Starting
+++ SSH: Trying [] [] [] ........................... FAILED
+++ Telnet: Trying [qagroup] [qalogin] [] .......... OK
+++ Telnet: Credentials Successful [qagroup] [qalogin] []
+++ Discovered working credential for device after testing 1 credentials
Test Completed
5. Click Save to commit the changes.
Saved credentials can be deleted by clicking the Delete icon in the table row.
The lower panel is a history that lists all credentials attempted during the last credential guessing attempt for the given device. This data resets each time credentials are guessed for a device. The table indicates the time of each guess and the result of that attempt. If a device is manually configured with a credential, NetMRI updates the history once it attempts to use that credential for data collection.
Retrieving Configs
A Get Configs button appears in the CLI Credentials page of the Device Viewer, to fetch the current configuration files from the device. After clicking Get Configs, a message appears in the Device Viewer:
A request to retrieve the configs has been dispatched. If a change from the previous retrieval is detected, the new configs will appear shortly. Otherwise, the Last Collected timestamps of the previous retrieval are updated to reflect the current time, indicating that no change was detected.
This feature can be verified under Configuration Management –> Archive tab, and clicking the table row for the device. This brings up the Config Explorer for the selected device. A Get Config button is also provided in this location.

Infoblox NetMRI 7.4.4 Administrator Guide Part 1 Introducing and Configuring NetMRI
Copyright ©2020, Infoblox, Inc. All rights reserved. Page 92
•
•
About SNMP CredentialsNetMRI uses SNMP read-only community strings to collect data for its analysis. NetMRI is pre-configured with several commonly used community strings taken from the list of default community strings configured by the device vendor. If the community strings provided during installation do not work for a given device, the system tries well-known vendor defaults. When NetMRI guesses SNMP credentials for a device, it starts with the most secure user-provided credentials (SNMP v3) and works down to the least secure (SNMP v1/v2) credentials when deciding how to access the device. In all cases, NetMRI follows the specified priority order.
If a default community string works for the device, NetMRI begins normal SNMP processing and the "Weak Community String" issue fires to alert you to this condition. You will see all vendor default community strings that were able to return SNMP data for a device in the Default Credentials Report.
Manually entered community strings are used first, in priority order, then the default community strings are tried in priority order if the Use Vendor Default Community Strings option is enabled in the Settings icon –> Setup section –> Collection and Groups –> Global tab –> Network Polling panel. That option allows you to disable the use of the vendor default community strings for determination of which strings NetMRI can use. This is typically done in installations having tight security setups that have removed all vendor defaults from their installation. Note that this option does not prevent the vendor default from running.
NetMRI can periodically check for vendor default community strings. Checking for vendor default community strings can help ensure that the network meets compliance standards. You can add vendor-specific default community strings that may not be listed. NetMRI will only check for default vendor community strings when the Vendor Default Credential Collection option is enabled in the Settings icon –> Setup –> Collection and Groups –> Global tab –> Config Management panel.
SNMP Collection LogicThe following figure shows how SNMP collection settings control collection at the network, group, and device levels.
Features for enabling and disabling SNMP collection are available in the following locations:
For the network: In the Network Polling panel (Settings icon –> Setup section –> Collection and Groups –> Globaltab).For groups: In the Device Groups side tab (Settings icon –> Setup section Collection and Groups page –> Groups tab –> Device Groups side tab).

Infoblox NetMRI 7.4.4 Administrator Guide Part 1 Introducing and Configuring NetMRI
Copyright ©2020, Infoblox, Inc. All rights reserved. Page 93
•
•••
1.
2.••
3.4.
•••
••
•
For devices: In the Device Viewer's General Settings page (Device Viewer –> Settings & Status section –> General Settings page).
SNMP Data Collection and Licensing Effects
NetMRI guesses the SNMP credentials of all known network devices that are licensed or unlicensed in the included discovery ranges, and collects each SystemInfo table. The device host name and device type get resolved based on information from the SystemInfo table, enabling the identification of unlicensed network devices in NetMRI. If the device is unlicensed, SNMP collection stops at that point, excluding other data collection, such as Routing, ARP, and interfaces.
Choosing SNMP Protocol PreferencesNetMRI provides finer control for SNMP protocols used in device discovery and device management. NetMRI allows for discovery of devices using any of the three protocols SNMPv1, SNMPv2c, or SNMPv3.
Community string collection can be performed using SNMPv1 and/or SNMPv2c only. In previous releases, SNMPv1 was the required default. You may choose to define the default SNMP data collection protocol as the following:
SNMPv1 only.SNMPv2c only.SNMPv2c as the default with SNMPv1 as a fallback for devices that support only SNMPv1.
NetMRI automatically discovers and manages devices that support only the SNMPv1 protocol, regardless of setting. To define how NetMRI applies its SNMPv1 and SNMPv2 support for data collection, two Advanced Settings can be changed.
Go to Settings icon –> General Settings –> Advanced Settings –> Data Collection category. The SNMPv1 Data Collection Fallback setting prevents NetMRI from attempting to collect from a device that has a spurious or incorrect SNMPv2c credential, and will 'fall back' to SNMPv1 for collection.Click the Actions icon and choose Edit.
If you want SNMPv1 to be allowed for data collection, choose enabled for data collection;If you want SNMPv2c to be the specific data collection protocol, choose disabled for data collection.
Click OK to commit settings.Go to Settings icon –> General Settings –> Advanced Settings –> Discovery category. The SNMPv1/SNMPv2c Discovery Version setting allows a choice between three options:
Use SNMPv1 for credential discovery.Use SNMPv2c for credential discovery.Use both SNMPv1/SNMPv2c for credential discovery.
Should you choose the third option, Use both SNMPv1/SNMPv2c for credential discovery, NetMRI continues to use SNMPv1 for credential discovery on devices that support only SNMPv1, and uses SNMPv2c whenever it is supported by target devices. Using the Use both SNMPv1/SNMPv2c option imposes some time delay for credential collection, in cases where non-working/incorrect credentials are attempted during data collection.
5. Click the Actions icon and choose Edit.
For exclusive use of SNMPv1, choose the Use SNMPv1 for credential discovery option.For exclusive use of SNMPv2c without fallback to SNMPv1, choose the Use SNMPv2c for credential discovery option.For default use of SNMPv2c with fallback to SNMPv1 for devices that support that protocol, choose the Use both SNMPv1 and SNMPv2c for credential discovery option.
6. Click OK to save your settings.
SNMPv3 Credentials for Discovery and ManagementAccounts using SNMPv3 can use a suite of authentication and privacy protocols. If NetMRI will use SNMPv3 to collect data from devices supporting the protocol, you can define specific user credentials with combinations of authentication and encyption protocol, and the unique keys for each protocol.

Infoblox NetMRI 7.4.4 Administrator Guide Part 1 Introducing and Configuring NetMRI
Copyright ©2020, Infoblox, Inc. All rights reserved. Page 94
•••••
•••
1.2.3.
4.5.6.7.8.
Currently, the SNMPv3 engine supports the following encryption protocols:
aes-128aes-192aes-256des3des
NetMRI also supports multiple entries for the same username string, enabling NetMRI to check similar SNMPv3 credentials that use different authentication and security protocols.
SNMPv3 allows for the use of two secret keys for every credential–one for authentication, and another for encryption. NetMRI allows flexible application of keys–authentication but no encryption, for example. You can define users in one of three ways:
SNMPv3 user, with no authentication or privacy credentials.SNMPv3 user, with authentication but no privacy credentials.SNMPv3 user, with both authentication and privacy credentials.
You can test any SNMP credential against any currently discovered or cataloged device. You can also import sets of SNMPv3 credentials from a Microsoft Excel Comma Separated Values (.CSV) data file. The topic Credential Import Formats describes, with examples, the required data structure.
To add SNMPv3 credentials, complete the following:
Open Settings icon –> Credentials –> SNMPv3.Click New. To define the order of lookup, enter a new Priority value. The lower the value, the higher the priority of the user credential.Enter the Authentication Password and choose the Authentication Protocol.Enter the Privacy Password and choose the Privacy Protocol.Click Save.To test a credential, click Test. Choose the Hostname or IP and click Start.To import a set of credentials, click Import. The .CSV file should be a set of tab-separated values matching the categories for the SNMPv3 credentials table. You do not need the column headers as the first row in the file, which can be created in a text editor or exported from Microsoft Excel.

Infoblox NetMRI 7.4.4 Administrator Guide Part 1 Introducing and Configuring NetMRI
Copyright ©2020, Infoblox, Inc. All rights reserved. Page 95
About CLI CredentialsThe CLI tab (Settings icon –> Setup –> Credentials –> CLI tab) lists site-specific username and password combinations that NetMRI uses when attempting to access a device using telnet or SSH. After a device is discovered, NetMRI uses these for configuration collection, CCS scripts, and other purposes.
The CLI Vendor Defaults tab (Settings icon –> Setup –> Credentials –> CLI Vendor Defaults tab) lists well-known (and therefore weak) username and password combinations. These credentials are a subset of the published vendor default username/passwords used when the device is shipped by the manufacturer.
Add other vendor default passwords listed in the Default Credentials Report. If the Vendor Default Credential Collectoroption (Settings icon –> Setup –> Collection and Groups –> Global tab –> Config Management panel) is enabled and a vendor default username/password combination successfully logs into a device, an issue is generated.
NetMRI will try site-specific username/passwords, in priority order, when first logging in to a device via a CLI connection (SSH or telnet). Once NetMRI determines a password, it will save it as information specific to the device. If there is no site-specific password, the system will try the vendor default credentials in priority order. NetMRI will always use site-specific username/password combinations when trying to determine the new login credentials for a device, and they will not be used for vendor default credential checks.
Credential Import FormatsThe syntax for credential data files imported through corresponding tabs in the Settings icon –> Setup –> Credentialspage, and in the Setup Wizard's Setup Wizard: CLI Credentials, Setup Wizard: SNMPv1/2 Credentials, and Setup Wizard: SNMPv3 Credentials (Rare) steps, are described in this section.
For credential import, NetMRI accepts files exported from a credential settings table, ignoring any priority values in imported files. To specify a different collector in the import file, remove the UnitID column and update the Collector field. When importing credentials on an Operations Center, if no collector is specified in the import file, the credentials are applied to all collectors.
SNMP Credentials:
<community string>
SNMP Vendor Defaults:
<community string> <tab> <vendor name>
SNMPv3
SNMPv3 noAuthNoPriv credentials:
<snmpv3 user>
SNMPv3 authNoPriv credentials:
<snmpv3 user> <tab> <auth protocol> <tab> <auth password>
The authentication protocol is MD5 or SHA.
SNMPv3 authPriv credentials:
Note
For CLI access to managed devices, NetMRI needs the ENABLE password to access configuration files on some devices, but does not need it for any other reason. Therefore, Infoblox recommends you create a username and password specifically for NetMRI, and restrict the commands that can be executed by that account to those required to display the configuration information.

Infoblox NetMRI 7.4.4 Administrator Guide Part 1 Introducing and Configuring NetMRI
Copyright ©2020, Infoblox, Inc. All rights reserved. Page 96
•
•
<snmpv3 user> <tab> <auth protocol> <tab> <auth password> <tab> <priv protocol> <tab> <privacy password>
The privacy protocol is 3des, aes-128, aes-192, aes-256, or des.
An example, with the second user being an authNoPriv credentials user:
dpadure md5 test 3des test
rgrace sha 1authoEL2r#*$
johnson md5 test 3des test
All values are separated by hard tabs in the CSV file, which may be edited using a text editor.
CLI Credentials<username> <tab> <password>
<username> can be empty for a line password credential.
or:
ENABLE <tab> <password>
Used for privileged mode passwords.
or:
<username>
For username only scenarios.
or:
<tab> <password>
For password-only scenarios.
CLI Vendor Default Credentials<username> <tab> <password> <tab> <vendor>
username can be empty for a line password credential.
password can be empty.
ENABLE <tab> <password> <tab> <vendor>
Used for privileged mode passwords.
Expected Discovery ResultsOutcomes of credential attempts are displayed in the following two columns:
Successful: This column shows the number of devices where NetMRI attempted the credential and found that the credential worked.Invalid: This column shows the number of devices that have the given credential configured but is not currently working. This is not the number of times the given credential was guessed but failed.

Infoblox NetMRI 7.4.4 Administrator Guide Part 1 Introducing and Configuring NetMRI
Copyright ©2020, Infoblox, Inc. All rights reserved. Page 97
To display a list of devices for which a given credential was successful or valid, click a link in the Successful or Invalidcolumn. The list is limited to 500 devices.
Debugging Issues in Discovery and Data Collection
The CC column in the Network Explorer –> Discovery table reveals important debugging information for configuration collection issues. The most important discovery and Config Collection issues are listed in this topic, along with where in NetMRI to fix them.
Config CollectionWarning icons in the CC column indicate possible configuration data collection problems. Other locations that report
related messages include Device Viewer –> Settings & Status –> Management Status and Settings icon –> Setup –> Discovery Settings –> Seed Router. Specific messages are described below.
Config Not Changed The configuration for the device has not changed since the previous polling of the device. No problem is indicated here unless you have pushed a changed configuration to the device. Even in those cases, allow some more time for the device to synchronize with NetMRI. If you expect changes to be reflected in device polling. go to Device Viewer –> Configuration Management –> Config Explorer and check the Running Config Saved? status line. If the answer is No, ensure the changes in the device's running-config are saved according to the device's configuration data saving requirements.
CLI Credentials Unknown
NetMRI cannot obtain the device configuration due to not having the correct CLI username/password tuple, and credential guessing did not work for the device. Go to the Device Viewer –> Settings & Status –> CLI Credentials page for that device. Click Edit and enter the necessary values for the SSH and/or Telnet login tuple and the Enable Password if necessary. Each attempt at connection and collection is listed in the table. Note that the C column, for CLI Credentials Status, may show an Error, usually listed as Failed to authenticate: Invalid Username and/or password.
Configuration Collection Disabled Globally
This message appears for devices that support configuration collection, but the collection was skipped because Config Collection is globally disabled in NetMRI. The same message appears in the Device Viewer –> Settings & Status –> Management Status page. Go to Settings icon –> Setup –> Collection and Groups –> Groups –> Config Management side tab, and enable the Config Collection checkbox. Also, ensure the proper protocols (SSH, Telnet, HTTP) are enabled for config collection.
Configuration Collection Enabled Globally, All Protocol Options Disabled
This message appears for devices that support configuration collection, but the collection was skipped because Config Collection is globally enabled in NetMRI but no data collection protocols were enabled. The same message appears in the Device Viewer –> Settings & Status –> Management Status page. Go to Settings icon –> Setup –> Collection and Groups –> Groups –> Config Management side tab, and enable the Config Collection checkbox. Ensure the proper protocols (SSH, Telnet, and/or HTTP) are enabled for config collection.
Configuration Collection Disabled at Device Group level
The device showing this message currently has config collection disabled for the Device Group to which the device belongs. Go to Settings icon –> Setup –> Collection and Groups –> Groups, click the Action icon and choose Edit for the selected Device Group. In the Group Settings tab, enable the Config Collection checkbox.
Note
Operations Center only: Before changing settings in this page, use the Filter by Collector field in the right side of the header to select a Collector.
Note
The Juniper devise discovery polling intervals occur hourly because such devices do not support the ccmHistory SNMP MIB object, which is limited to Cisco devices.

Infoblox NetMRI 7.4.4 Administrator Guide Part 1 Introducing and Configuring NetMRI
Copyright ©2020, Infoblox, Inc. All rights reserved. Page 98
1.
2.3.4.5.
Not Included by Discovery Settings
The message indicates that although the device has been detected by NetMRI, it is not included in any IP Ranges or as a Static IP with the Exclude from Discovery Settings option, is not reachable through Device Hints, or is not detectable as a Seed Router.
The device in question may also be explicitly excluded from management by previously clicking the Unmanage button in Device Viewer –> Settings & Status –> Management Status page. Go to Settings icon –> Setup –> Discovery Settings and change the appropriate settings in any of the four categories. This message appears only during a manual Get Configoperation.
Not LIcensed The message indicates that the device has not been added automatically to the full NetMRI license for the appliance reporting the Issue. Go to the Device Viewer –> Settings & Status –> Management Status page and click the License button. In the License Status dialog, choose the settings necessary to change the licensing status for the device. This message appears only during a manual Get Config operation.
Running Discovery Diagnostics
The Discovery Diagnostics tool (Tools –> Device –> Discovery Diagnostics) helps Infoblox Technical Support to diagnose discovery and data problems for a given device.
To run discovery diagnostics, complete the following:
If NetMRI doesn't know the community string for the device, enter it in the Community String field.
Normally, leave the Force Tests option set to Off. If NetMRI can't run the tests to provide the data needed, this option can be set to On to force the appliance to run all tests. Select the On option when directed by Infoblox Technical Support.Click OK.When the test is finished, "Processing Completed" appears above the log.Click TEXT to save the log.Send the log to Infoblox Technical Support.
Discovery Settings Import FormatsThe following sections detail the syntax for CIDR address block data files imported through corresponding tabs in the Discovery Settings page (see Configuring Network Discovery Settings) and in the Setup Wizard's Discovery Ranges, Static IPs, and Seed Routers steps (see Running the Setup Wizard for more information). It also includes syntax guidelines for importing CISCO APIC information.
NetMRI will import a file previously exported from a discovery settings grid. Export files must have a header line, and each column is comma-separated.
Note
Output from this tool is typically used for Infoblox Technical Support. The tool should only be run after you have been instructed to do so by Infoblox Technical Support.
Note
If NetMRI knows the community string for the device, it is used for the test. If you enter a community string, it is used in addition to the one known to NetMRI.

Infoblox NetMRI 7.4.4 Administrator Guide Part 1 Introducing and Configuring NetMRI
Copyright ©2020, Infoblox, Inc. All rights reserved. Page 99
Range ExamplesSpecifying a range includes up to five fields, separated by tabs or spaces:
<range_value> <range_type> <discovery_status> <ping_sweep_ind> <Virtual_Network_Name>
Values in each field:
<range_value> ipv4 or ipv6 prefix
<range_type> CIDR|RANGE|WILDCARD (constant)
<discovery_status> INCLUDE|IGNORE|EXCLUDE (constant)
<ping_sweep_ind> TRUE|FALSE (constant)
<Virtual_Network_Name> Virtual network name
In all examples, the CIDR, RANGE and WILDCARD keywords are optional.
INCLUDE, IGNORE and EXCLUDE are optional. If not specified, INCLUDE is assumed.
Examples:
10.1.1.1/24 CIDR EXCLUDE FALSE GREEN
10.1.1.1/24 INCLUDE TRUE GREEN
fe80:0:0:0:0:0:ac10:100/113 INCLUDE
fe80::ac10:1ff/128 EXCLUDE
10.1.1.1-10.1.1.255 RANGE EXCLUDE
172.16.1.1-172.16.1.255 EXCLUDE
fe80:0:0:0:0:0:ac10:100/113-fe80:0:0:0:0:0:ac10:1ff/128 RANGE EXCLUDE
fe80::ac10:100/113-fe80::ac10:1ff/128 RANGE EXCLUDE
Further examples:
10.1.1.* WILDCARD EXCLUDE 10.1.1.* EXCLUDE
Static IP ExamplesSpecifying an IP for discovery includes three fields, separated by tabs or spaces:
<range_value> <discovery_status> <Virtual_Network_Name>
Values in each field:
<range_value> ipv4 or ipv6 address
<discovery_status> INCLUDE|IGNORE|EXCLUDE (constant)
<Virtual_Network_Name> Virtual network name
INCLUDE, IGNORE and EXCLUDE are optional. If not specified, INCLUDE is assumed.Examples:
172.16.222.237 IGNORE Red 2001:db8:0:ef0:13::10 INCLUDE Green

Infoblox NetMRI 7.4.4 Administrator Guide Part 1 Introducing and Configuring NetMRI
Copyright ©2020, Infoblox, Inc. All rights reserved. Page 100
Seed Router ExamplesSpecifying a seed router for discovery includes two fields, separated by tabs or spaces:
<range_value> <Virtual_Network_Name>
Values in each field:
<range_value> ipv4 or ipv6 address
<Virtual_Network_Name> Virtual network name
Examples:
172.16.222.1 Red 2001:db8:0:ef0:13::1 Green
CISCO APIC ExamplesSpecifying an APIC for discovery includes five fields, separated by tabs or spaces:
<controller_address> <Virtual_Network_Name> <protocol> <apic_username> <apic_password>
Values in each field:
<controller_address> APIC address (ipv4, ipv6, or hostname)
<Virtual_Network_Name> Virtual network name
<protocol> HTTP or HTTPS protocol for connection
<apic_username> User name for APIC
<apic_password> Password for APIC
Examples:
172.16.10.1 Network1 https apic_user apic_password
Executing NIOS IPAM SyncInfoblox NIOS software, running on Infoblox appliances, delivers core network services—including DNS, DNSSEC, DHCP, IPAM, HTTP, FTP, TFTP, NTP and others—that are important to the operation of all IP-based networks. IP address management (IPAM) functionality is built in to Infoblox NIOS software and includes a comprehensive suite of functions that support address allocation, management, and reporting.
You can configure a NetMRI instance to synchronize with the NIOS IPAM database and populate it with the NetMRI IP network discovery data. During a synchronization, device data (IP addresses and other data), subnets/DHCP networks, or both are exported from NetMRI to NIOS through a CSV file. You can run a synchronization immediately or schedule for future times.
NetMRI tracks the last time it has successfully communicated with a device via NMAP (used for fingerprinting), SNMP, and telnet/SSH/HTTP. This timestamp information appears in the Network Explorer –> Discovery page in NetMRI. To provide the most accurate possible timestamp, the protocols used to generate the timestamps also includes ICMP Ping

Infoblox NetMRI 7.4.4 Administrator Guide Part 1 Introducing and Configuring NetMRI
Copyright ©2020, Infoblox, Inc. All rights reserved. Page 101
•
•
••
•••
1.
2.
3.
4.
5.
and NetBIOS communications protocols. Ping and NetBIOS data results are not directly displayed in the Network Explorer –> Discovery page. NetMRI uses the maximum timestamp for a given device (i.e. across all protocols) to populate the timestamp value that is sent to NIOS.
For how to configure a synchronization, see Configuring IPAM Sync. This section also lists IPAM Sync data fields that are exported from NetMRI to NIOS.
For how to execute a configured NIOS IPAM Sync, see Synchronizing Between NetMRI and NIOS Appliances.
Keep in mind the following to get consistent results of synchronization between NetMRI and NIOS:
Network Views: Be aware of overlapping subnets and IP addresses. If you execute IPAM Sync several times, do not export different NetMRI network views to the same NIOS network view. Otherwise, some discovered data may be lost.Device reachability: Once a device became unreachable, it remains visible in NetMRI for some time, but it will not be exported to NIOS. If you see the device in NetMRI, but not in NIOS, check the device interfaces and reachability. Some of the interfaces may become disconnected. Additionally, check if the corresponding device subnet is displayed in the list of subnets in NetMRI.
Also, see the following sections for additional information about NIOS IPAM Sync:
Overlay/Overwrite LogicDelivering NetMRI Discovered Data to IPAM
Configuring IPAM SyncThis section describes the following:
How to add an IPAM Sync configuration.How to edit an IPAM Sync configuration.How to delete an IPAM Sync configuration.
To add a sync configuration, complete the following:
In Settings –> Setup –> NIOS IPAM Sync –> Add Sync Configuration.The Sync configuration wizard opens.In Step 1 of the Wizard, enter the NIOS Grid Master IP address or host name, with user name and password. For standalone NIOS deployments, enter the IP address or host name of the NIOS device. The default login credentials are admin/infoblox.Click Next.
In Step 2, in NS1 Network View, select default as the view to which to export data. This information is obtained from the Infoblox Grid Master.In NetMRI Network View, select the required view.
Note
NetMRI supports synchronization of IPv6 subnet and address information between NetMRI and target NIOS systems, to automatically define networks in IPAM. Some subnetworks may not be reported to NIOS during IPAM Sync owing to their addressing being part of MPLS VPNs.
Note
Make sure the NIOS system is reachable before attempting a connection, and ensure you have the correct admin account and password. The specified username and password also must provide access to the Infoblox DMAPI (Data and Management API). Any NIOS administrator account can be set to allow API access from within NIOS with an Allowed Interfaces setting of API. Consult the Infoblox API Documentation guide for the version of NIOS in the current operation for more details, and consult the NIOS Administration Guide for the procedure on defining API interface access for an admin account.

Infoblox NetMRI 7.4.4 Administrator Guide Part 1 Introducing and Configuring NetMRI
Copyright ©2020, Infoblox, Inc. All rights reserved. Page 102
6.
7.8.
9.
10.
In Time restriction, select Include all data, regardless of polling time.
In versions prior to 7.3.1, NetMRI sent data collected from devices that were successfully polled within the last two hours. This restriction was removed in version 7.3.1. You can request to export all data regardless of last successful device polling time or data from devices successfully polled in the last several hours.Activate Synchronize Device Information if devices (IP addresses) are to be included in the synchronization.If you enabled the synchronization of device information and you want to include end host IP addresses into NIOS IPAM Sync, select Include addresses from ARP tables. By default, only routers IP addresses are included into NIOS IPAM Sync. Selecting this option allows you to export IP addresses of end hosts from ARP tables of discovered devices to NIOS IP Map, along with routers IP addresses. These end hosts are listed in a separate tab in NetMRI: Network Explorer -> Switch Port Management -> End Hosts -> End Host Present. If the discovery engine does not recognize a device as infrastructure or network device, it is treated as end host. Data displayed for end hosts collected from ARP tables includes the IP address, MAC address, and Last Discovered and First Discovered stamps.
To add internal subnets as networks in NIOS, activate the Add IPAM networks for subnets within NetMRI discovery ranges option. This will export subnets discovered by NetMRI and classified as internal (i.e., within the defined discovery ranges). To export all internal subnets, select the All option. To limit the exported internal subnets, select the Restrict to subnet s within the following summary routes option, and enter a list of summary routes. Separate each route with a comma, or put each on a new line. Subnets within a listed summary route are exported. For example, to export only the subnets in a class A 10 network, enter 10.0.0.0/8.To add external subnets as networks in NIOS, activate the Add IPAM networks for subnets outside of NetMRI discovery ranges option. This will export subnets discovered by NetMRI and classified as external (i.e., outside the defined CIDR blocks). To export all external subnets, select the All option. To limit the exported external subnets,
Note
Retrieving end hosts IPs based on ARP entries does not guarantee accurate results as the lifetime of ARP tables entries on network devices is very limited (e.g., up to 5 minutes officially, 10 minutes in real life for Cisco IOS-based devices) and the amount of tables entries is relatively small.

Infoblox NetMRI 7.4.4 Administrator Guide Part 1 Introducing and Configuring NetMRI
Copyright ©2020, Infoblox, Inc. All rights reserved. Page 103
11.12.
13.14.15.16.
1.
2.
1.2.
1.2.
select the Restrict to subnets within the following summary routes option, and enter a list of summary routes as described above for internal subnets.Click Next.In Step 3, if you want to schedule synchronization, select Schedule Enabled. This is optional. If you do not schedule a synchronization, you can execute a synchronization at any time. For information, see the next section.Select a Recurrence Pattern, Execution Time, and day (this is the starting day for repetitive synchronizations).Click Next.In Step 4, review the sync configuration. Click < Previous if you need to change any settings.Click Finish.
Now you can run the configured synchronization between NetMRI and NIOS. For more information, see the next section, Synchronizing Between NetMRI and NIOS Appliance.
To edit a sync configuration, perform the following:
In Settings –> Setup –> NIOS IPAM Sync, select Edit in the Actions column for the required sync configuration. This displays a summary of the current configuration.Click Edit.The Sync configuration wizard is started. See the procedure for adding a sync configuration above for the wizard steps.
To delete a sync configuration, complete the following:
In Settings –> Setup –> NIOS IPAM Sync, select Delete in the Actions column for the required sync configuration.Confirm the deletion.
Synchronizing Between NetMRI and NIOS AppliancePrerequisite: make sure that you added and configured an IPAM synchronization as described in the previous section.
To run a synchronization between NetMRI and a NIOS appliance, complete the following:
In Settings –> Setup –> NIOS IPAM Sync, select Sync in the Actions column for the required sync configuration. Click Yes to confirm.The CSV import of discovered data to NIOS is performed. The IPv4 and IPv6 networks are added to the NIOS appliance database.
Open the NIOS GUI and verify that all the data are imported in to NIOS.
The following table lists the data fields in the CSV file used for IPAM Sync:
Data Field in IPAM Sync Export File NetMRI Model->Attribute Field Description
General Device Data
discovered_name Device -> DeviceName DNS name of the IP address.
ip_address Device -> DeviceIPDotted A valid IPv4 address. Required.
mac_address Device -> DeviceMAC A valid mac address. Must be lowercase. Optional.
last_discovered_timestamp Device -> DeviceTimestamp Timestamp of last time the discoverer has seen the device. A UTC timestamp. Required.
first_discovered_timestamp Device -> DeviceFirstOccurrence Timestamp of the first time the discoverer has seen the device. A UTC timestamp. Optional.
Infoblox NetMRI 7.4.4 Administrator Guide Part 1 Introducing and Configuring NetMRI
Copyright ©2020, Infoblox, Inc. All rights reserved. Page 104
Data Field in IPAM Sync Export File NetMRI Model->Attribute Field Description
netbios_name N/A The NetBIOS name of device. String type. Maximum size is 15 characters. Optional.
os Device -> DeviceVersion The OS of the IP address. String Type. Maximum size is 256 characters. Optional.
device_model Device -> DeviceModel The model of device.
device_vendor Device -> DeviceVendor The vendor of device.
device_location Device -> DeviceSysLocation The location of device.
device_contact Device -> DeviceSysContact The contact of device.
oui Device -> DeviceOUI The OUI of device.
discoverer N/A Always "NetMRI".
Attached Device Data (only for endhosts)
network_component_type Device -> DeviceType The type of component connected to the IP address. Eg Switch, Router, Other. Optional. String type. Max size 32.
network_component_name Device -> DeviceName Name of component connected to the IP address. Optional. String type. Max size 64.
network_component_ description Device -> DeviceSysDesc Description of component connected to the IP address. Optional. String type. Max size 256.
network_component_ip Device -> DeviceIPDotted IP address of component connected to the IP address. Optional. String type. IPv4 address format.
network_component_model Device -> DeviceModel The model of component connected to the IP address.
network_component_vendor Device -> DeviceVendor Vendor of component connected to the IP address.
network_component_location Device -> DeviceSysLocation Type of component connected to the IP address.
network_component_contact Device -> DeviceSysContact Contact of component connected to the IP address.
network_component_port_ number Interface -> SwitchPortNumber Port number on the component connected to the IP address. Optional. Unsigned integer type. Range 0 - 9999.
network_component_port_ name Interface -> ifName Port name on the component connected to the IP address. Optional. String type. Max size 64.
network_component_port _description Interface -> ifDescr Description of the Port on the component connected to the IP address. Optional. String type. Max size 256.
Port Data

Infoblox NetMRI 7.4.4 Administrator Guide Part 1 Introducing and Configuring NetMRI
Copyright ©2020, Infoblox, Inc. All rights reserved. Page 105
•
Data Field in IPAM Sync Export File NetMRI Model->Attribute Field Description
port_vlan_name Vlan -> VlanName Name of the Vlan on the Port. Optional. String type. Max size 64.
port_vlan_number Vlan -> VlanIndex Port Vlan Number. Optional. Unsigned integer type. Range 0 - 9999.
port_speed Interface -> ifSpeed Speed settings on the switch port. Optional. String type. Valid values are 10M, 100M, 1G, 10G, 100G, and Unknown.
port_duplex Interface -> ifDuplex Duplex settings on the switch port. Optional. String type. Valid values are Full and Half.
port_status Interface -> ifAdminStatus Administratively up or down. Optional. String type. Valid values are Up, Down, and Unknown.
port_link_status Interface -> ifAdminStatus Connected or not. Optional. String type. Valid values are: Connected, Not Connected, and Unknown.
Cisco ACI Data
tenant N/A ACI tenant.
bridge_domain N/A ACI bridge domain.
endpoint_groups N/A ACI endpoint groups.
VRF and BGP Data
vrf_name Interface -> vrf_name VRF name of the IP address.
vrf_description Interface -> vrf_description VRF description of the IP address.
vrf_rd Interface -> vrf_rd VRF route distinguisher of the IP address.
bgp_as N/A BGP autonomous system number of device.
Wireless Access Point Data
ap_name N/A Name of wireless access point.
ap_ip_address N/A IP address of wireless access point.
ap_ssid N/A SSID of wireless access point.
Overlay/Overwrite LogicThe following overlay/overwrite logic applies to IPAM Sync:
Network sync: Newly-imported subnets are imported as “managed”.

Infoblox NetMRI 7.4.4 Administrator Guide Part 1 Introducing and Configuring NetMRI
Copyright ©2020, Infoblox, Inc. All rights reserved. Page 106
•
••
•
•
•
••
If the imported subnet conflicts with an existing subnet, it is not accepted. The imported subnet can go into a container as long as there is no conflict.If the subnet already exists, no changes are made.If the subnet is in IPAM but not in NetMRI, it is left in IPAM.
IP address sync: New IP addresses are added and marked as “unmanaged”. If an IP address already exists, the field values is overwritten during the import.
Before NetMRI 7.1.4 and NIOS 8.1, if the IP address exists in IPAM but it is not in the import file, it is left in IPAM.As of NetMRI 7.1.4 and NIOS 8.1, if the IP address exists in IPAM but it is not in the import file, its discovered data is cleared out. You can control the time that the IP address stays in the NetMRI database after it is no longer discovered under NetMRI. To do so, go to Setup -> General Settings -> Advanced Settings.
Viewing IPAM Sync Discovered Data in NetMRI and NIOSIn NIOS, you can view the data discovered by NetMRI and synchronized using IPAM Sync as follows:
IP addresses data: IPAM –> select a network –> IP List.Networks data: IPAM –> Networks.
The following table helps to locate IPAM Sync discovered data in the NetMRI UI.
UI Name of Discovered Data Field Data Field Description Place in NetMRI UI
General Device Data
IP Address The IP address of discovered network device or end host interface.
Network Explorer -> Discovery
Last Discovered The timestamp when the IP address was last discovered.
First Discovered The timestamp when the IP address was first discovered.
Discovered MAC Address The discovered MAC address for the network device or end host. The discovery acquires the MAC address for hosts that are located on the same network as the Grid member that is running the discovery.
Interface Viewer
Discoverer Specifies whether the IP address was discovered by NetMRI or Network Insight discovery process. Equals to “NetMRI” of “Network Insight” correspondingly.
N/A
OS Guess for OS by network discovery. OS info is collected from device by SNMP. Depending on device SNMP settings, this field can be populated with OS version or remain empty (mostly for end hosts) -- in last case Device Type will contain OS name. In NIOS 8.4 and newer versions fingerprint scan result will be displayed as OS of end hosts.
Device Viewer
Discovered Name The name of the network device or end host associated with the discovered IP address.
Device Model Model name of the device in the vendor terminology.
Device Vendor The vendor name of the discovered device.

Infoblox NetMRI 7.4.4 Administrator Guide Part 1 Introducing and Configuring NetMRI
Copyright ©2020, Infoblox, Inc. All rights reserved. Page 107
UI Name of Discovered Data Field Data Field Description Place in NetMRI UI
Device Location The physical location of the network device or endhost.
Device Viewer -> Device/Network Explorer -> Device Identification
Device Contact The contact details for the network device or endhost.
NetBIOS Name The name returned in the NetBIOS reply or the name you manually register for the discovered host.
Switch Port Management -> End hosts
Device Type(s) Identifies the device type. Network Explorer -> Discovery
Device Viewer
Device Management IP Management IP address of the device if the device has more than one IP.
Device Viewer -> Settings & Status -> General Settings
Interface Port Name System name of the interface the IP associates with.
Device Viewer -> Interfaces
Interface Port Type Hardware type of the interface the IP associates with.
Device Viewer -> Interfaces
Open Port(s) Open ports of the device. Sample format is "TCP: 21,22,25,80 UDP: 137,139". Limited to max total 1000 ports. Data is collected by Nmap and refreshes every 24 hours. Port scanning must be enabled.
N/A
Device OUI The OUI of device. N/A
Attached Device Data
Attached Device Vendor The vendor name of the switch port connected to the discovered device.
For an attached device: Device Viewer
Attached Device Address The IP address of the switch that is connected to the network device or endhost.
Attached Device Name If a reverse lookup was successful for the IP address associated with this switch, the host name is displayed here.
Attached Device Type Identifies the switch that is connected to the discovered device.
Attached Device Model If a reverse lookup was successful for the IP address associated with this switch, the device model is displayed here.
Attached Device Description A textual description of the switch that is connected to the discovered device.
For an attached device: Device Viewer -> Device/Network Explorer -> Device Identification
Attached Device Location The physical location of the network device to which the discovered host is connected, as detected from the device during discovery.
Attached Device Contact The contact details of the network device to which the endhost is connected, as detected from the device during discovery.

Infoblox NetMRI 7.4.4 Administrator Guide Part 1 Introducing and Configuring NetMRI
Copyright ©2020, Infoblox, Inc. All rights reserved. Page 108
UI Name of Discovered Data Field Data Field Description Place in NetMRI UI
Attached Device Port Description A textual description of the switch port that is connected to the discovered device.
For an attached device: Device Viewer -> Interface -> Configuration
Attached Device Port Name The name of the switch port connected to the discovered device.
Attached Device Port The number of the switch port connected to the discovered device.
Attached Device Port ID Identificator of the switch port that is connected to the discovered device.
Port Data
Port Type Hardware type of the interface with which the IP is associated.
Port Duplex Duplex settings of the port ofn the network component. Possible values: Full, Half.
Interface Viewer
Port Link Link Status of the port on the network component. Possible values: Connected, Not Connected, Unknown.
Port Speed Speed settings of the port of the network component. Possible values: 100G, 100M, 10G, 10M, 1G, Unknown.
Port Status Status of the port of the network component. Possible values: Down, Unknown, Up.
VLAN Name Name of the VLAN of the network component port.
Device Viewer -> Interfaces -> Configuration
VLAN ID Number of the VLAN of the network component port.
Cisco ACI Data
Tenant Discovered tenant. Device Viewer -> ACI
Bridge domain Discovered bridge domain.
EPG List of comma-separated discovered endpoint groups.
VRF and BGP Data
VRF Name VRF name of IP address. Device Viewer -> Router -> VRF table
VRF Description VRF description of IP address.
VRF RD VRF route distinguisher of IP address.
BGP AS BGP autonomous system number of device. Device Viewer -> Router -> BGP
Wireless Access Point Data
AP Name Discovered name of Wireless Access Point. Device Viewer -> Wireless

Infoblox NetMRI 7.4.4 Administrator Guide Part 1 Introducing and Configuring NetMRI
Copyright ©2020, Infoblox, Inc. All rights reserved. Page 109
•••
•••
••••••••
••
UI Name of Discovered Data Field Data Field Description Place in NetMRI UI
AP IP address Discovered IP address of Wireless Access Point.
SSID Service set identifier (SSID) associated with Wireless Access Point.
Fields related to Cisco ACI data (tenant, bridge_domain, endpoint_groups) are specific for SDN elements and controllers.
Fields Wireless Access Point Name, IP, and SSID are related to the wireless access points to which a device is connected.
Attached device information usually means neighbor switch or router to which a given device is directly connected.
Only IP Address, MAC Address, Last Discovered, and First Discovered fields are filled for end hosts collected from ARP tables.
VRF information is specified for corresponding interfaces of infrastructure devices.
Supporting Cisco Discovery ServiceNetMRI automatically supports an Infoblox utility, Cisco Discovery Service, that enables network administrators to provide Cisco-validated reporting and analysis. NetMRI operates as a Cisco Discovery Service-enabled system supporting discovery of network systems for analysis and management. You can use the CDS Integration Tool as part of a new NetMRI installation, or use the tool to extract further insight and value from an existing deployment. Cisco Gold Partner status is required for effective use of the software utility.
NetMRI supports CDS API version 2.0 and uses a NetMRI device or virtual machine to inspect all aspects of a network's Cisco infrastructure to collect the following information:
The customer's inventory of Cisco network infrastructure devices.Partner identification.Customer identification.
NetMRI uses secure network connections, including HTTPS, to protect information for transit to the Cisco CDS. Acting as the intermediary, the NetMRI also registers the Infoblox Partner + Customer combination with the Cisco Discovery Service.
The Cisco Discovery Service provides complete information about a network facility's Cisco network infrastructure devices, including the following:
NetMRI Asset Inventory: a list of all devices discovered by NetMRI.Chassis Inventory: a list of all Cisco devices located in the network.ISO 27002 reports on compliance with best practices guidelines for Sarbanes-Oxley, HIPAA, and GLBA compliance.End-of-life milestones and migration recommendations thereof.Identification of customer equipment producing PSIRT (Product Security Incident Response Team) alerts.Identification of customer equipment with either valid or expired contracts.Identification of customer equipment with Cisco Field Notices.Payment Card Industry (PCI) compliance reports against the PCI data security standard.Select Issue details from NetMRI.Overall network health assessment.Port Saturation Summary: report on switch port consumption.
Cisco Discovery Service uses a Release 6.3.1 (or better) NetMRI system to inspect the desired network and compile the information base after discovery. Compatible NetMRI appliances include the following:
Virtual NetMRI Appliance (VMWareTM compatible).NetMRI 1102-A Appliance.

Infoblox NetMRI 7.4.4 Administrator Guide Part 1 Introducing and Configuring NetMRI
Copyright ©2020, Infoblox, Inc. All rights reserved. Page 110
•
•
••
•
•
•
•
NetMRI NT-4000 Appliance.
The CDS is not operated by standard NetMRI administrators and is not configured for use in NetMRI. For more information about the usage of CDS, contact your Infoblox representative.
Creating Admin and User AccountsEffective use of NetMRI requires an efficient and logical plan for user accounts. User account administration is a straightforward but fundamentally important part of a NetMRI rollout.
The two administrative concepts that are involved for NetMRI users include the user accounts themselves, and each account's associated Role.
You can define and authenticate your admin users remotely, where all users and their accounts are authenticated and authorized for their roles and privileges through an external server such as RADIUS or LDAP. This chapter describes how to set up local authentication services in NetMRI. For remote configurations, see NetMRI User Authentication and Authorization. You can also define and authenticate all of your admin users locally, where all user accounts and their assigned roles and privileges are defined in the NetMRI system.
User Administration in NetMRIYou define user administration functions in the Settings window (Settings icon –> User Admin section), performing the following tasks:
Create, edit, and delete user accounts. Each user account is assigned one or more Device Groups over which they have some administrative functions.Define two primary types of users: local user and remote user.
Local users have their entire login credentials, user Roles, and device group permissions defined locally on the NetMRI appliance.Remote users have Roles assignments and device group permissions defined in Authentication Service Properties, and those assignments and permissions are granted remotely through an external service.
Create, edit, and delete user Roles. You assign Roles to each individual user account and define the privileges and tasks, and specific networks and network devices on which the NetMRI user can operate. A user account is ineffective without an assigned Role. A user account can use one or more Roles.Each Role is comprised of a set of access Privileges, which are the types of tasks that the user can carry out in their assigned Role.Review the Audit Log. The Audit Log provides records of all actions taken by all NetMRI users, showing the timestamp, event type and associated descriptive messages.
Several advanced User Administration settings are located in the Advanced Settings section. For more information, see Advanced User Administration Settings.
User administration provides support from external authentication servers. Because NetMRI supports both external
Note
For external authentication and authorization services, NetMRI receives the login requests from the user and forwards them to the Authentication/Authorization server, which performs the actual transaction. In this chapter, you configure authentication based only in the local appliance.
Note
Device groups are a NetMRI organizational unit that gathers devices in related groups—routers in a Routersgroup, Ethernet switches in a Switches group, and so on. For related information on device groups, see Devices and Interfaces.

Infoblox NetMRI 7.4.4 Administrator Guide Part 1 Introducing and Configuring NetMRI
Copyright ©2020, Infoblox, Inc. All rights reserved. Page 111
•
•
•
•
•
•
•••
•
authentication and authorization features through remote groups, mirroring the Roles and Privileges provided in local NetMRI user provisioning, you can leverage remote AAA server configurations (from TACACS+, LDAP, Active Directory, and RADIUS) without having to directly provision significant numbers of users on NetMRI.
Advantages of Remote Authentication and Authorization for UsersWhen a new user is authenticated and authorized through one of the remote services described in NetMRI User Authentication and Authorization, NetMRI automatically creates the new account locally and learns the Roles and device group assignments from the remote service. If there happens to be an established local user account, and the account login is authenticated and authorized by an external service, NetMRI will update its local profile to reflect the Roles and device group assignments granted by the last external authorization.
User Roles and privileges are learned from the remote group assignment that is defined on the Authentication Service.Passwords, whether encrypted or plaintext, are not stored on the NetMRI appliance, and are consistently checked against the external server.On occasions when no external service is available, the user will be asked to use local login credentials. This requires enabling of the Local authentication service.
For more information on remote authentication and authorization of NetMRI users, see NetMRI User Authentication and Authorization and its subsections.
Managing User DataFor the Users and Roles pages, the Select check box is to the left of an Action icon. When you select multiple rows of a table, a whole page, or multiple pages of either data type, you can choose Delete from the Action menu for any selected row. You cannot edit multiple rows of data. The Delete option is the only available option after selecting multiple rows.
Doing so enables you to delete all selected records from the table. Exercise caution when performing this action, as you may unintentionally delete rows of data that you did not wish to select.
While it is possible to select the entire table's worth of data in the Users page (Settings icon –> User Admin –> Users), the admin user account can never be deleted; the default set of NetMRI Roles (Settings icon –> User Admin –> Roles) also may not be deleted (though they are otherwise editable) and the Delete option is ghosted for each of them in the Action menu. In all cases, NetMRI user accounts with read-only privileges will not be able to perform this action.
You can use a feature called Force Local Authentication for any user account in your appliance:
Administrators can enable the Force Local Authentication check box for local user accounts to provide a specific profile to users that also exist on a remote authentication/authorization service. In the user configuration, you enable the Force Local Authorization option and its read-only Last Login value will show the external service name. Locally created user accounts automatically enable this option, which can be disabled at any time. If the user is learned by NetMRI through a remote authentication/authorization service, this option is automatically disabled.When a user is learned by NetMRI through a remote authentication/authorization service, the administration cannot then re-create the user account. You may activate the Force Local Authentication check box for an externally learned account and redefine its password and other user details. The Local authentication service also must be placed first in the Authentication Services list. Taking these steps, you can ensure that an account is verified and authorized locally, without using the same login defined on the external service. An alternative is to define a different local login credential for the user.The Force Local Authentication setting is automatically enabled for all new locally created users.
You can change local user accounts settings at any time:
You can change the local user password.You can disable a user account at any time.You can change assigned Roles and device groups for an account, but changes will persist only when the account is locally authenticated and authorized, with the Local authentication service taking the highest Priority setting and the Force Local Authentication check box enabled for the account.You can define CLI credentials, notes, and Email settings for all users in the User database.

Infoblox NetMRI 7.4.4 Administrator Guide Part 1 Introducing and Configuring NetMRI
Copyright ©2020, Infoblox, Inc. All rights reserved. Page 112
Understanding Users and Roles
User accounts are the standard identities of all users of the NetMRI appliance.
You assign roles to each user account, after assigning the privileges that each user account is allowed to perform. User accounts are granular to individuals, while roles apply across different accounts.
NetMRI provides a set of pre-defined Roles with specific privileges in NetMRI, as follows:
AnalysisAdmin Specializes in creating and managing NetMRI Issues. Assigned privileges include Issues: Modify Parameters, Issues: Modify Suppression Parameters, Issues: Modify Priority, Issues, Define Notifications, and View: Non Sensitive.
ChangeEngineer: High Allowed to write, schedule and execute job scripts of any degree of risk sensitivity. Privileges include Switch Port Admin, Scripts: Author, Scripts: Level1 (low risk), Scripts, Level 2 (medium risk), Scripts, Level 3 (high risk), View: Audit Log, View: Sensitive, and View: Non-Sensitive. This role also can launch SSH and Telnet sessions using NetMRI's Telnet/SSH Proxy feature, using User Credentials (Terminal: Open Session). This Role can also modify CLI credentials (Terminal: Modify Credentials). The Collection: Poll On Demand privilege provides the ability to perform on-demand polling of individual network devices.
Change Engineer: Medium Allowed to write, schedule and execute job scripts. Privileges include Switch Port Admin, Scripts: Author, Scripts: Level 1, (low risk); Scripts, Level 2 (medium risk), View: Sensitive, and View: Non-Sensitive. This role can launch SSH and Telnet sessions using NetMRIs Telnet/SSH Proxy feature (Terminal: Open Session), using NetMRI default credentials. By default, this role cannot modify CLI credentials. The Collection: Poll On Demand role provides the ability to perform on-demand polling of individual network devices
Change Engineer: Low Allowed to write, schedule and execute job scripts with a low sensitivity to risk. Privileges include Switch Port Admin, Scripts: Author, Scripts: Level 1 (low risk), View: Sensitive, and View: Non-Sensitive. Users with this role cannot launch SSH or Telnet sessions and those options will not appear in the device shortcut menu (right-clicking on a device's IP address, a VLAN IP and other elements in the NetMRI UI). By default, users with this role also cannot modify CLI credentials.
Config Admin Read-only account that is allowed to view all sensitive data in NetMRI. Privileges include View: Audit Log, View: Sensitive, and View: Non-Sensitive.
Default View Role Read-only account that is allowed to view only non-sensitive data. Privileges include View: Non-Sensitive.
Event Admin Event system administrator. Privileges include Events: Admin which enables the creation of new Event Symptoms, and View: Non-Sensitive.
FindIT Allows access only to the NetMRI FindIT tool.
Note
Privileges play a key part in roles configuration. Each of the pre-defined roles uses a specific collection of Privileges, which are pre-defined administrative functions that cannot be edited or changed. You can delete Privileges from a defined Role and create new Roles with custom sets of Privileges. Also, see PrivilegeDescriptions for details on the Privileges comprising user Roles.

Infoblox NetMRI 7.4.4 Administrator Guide Part 1 Introducing and Configuring NetMRI
Copyright ©2020, Infoblox, Inc. All rights reserved. Page 113
•••••
•
•
•
GroupManager Creates and manages interface groups, device groups, and related result sets. Privileges include Groups: Create, Groups: Delete, Groups: Result Sets, View: Non-Sensitive. and View: Sensitive.
Policy Manager Creates and manages Policies for one or more Groups in NetMRI to standardize and lock down configurations for networked devices such as routers, switches, and firewalls. Privileges include Policy: Deploy, Policy: Create, Edit and Delete, View: Audit Log, View: Non-Sensitive, and View: Sensitive.
Report Admin Role to allow the creation and editing of Report features in NetMRI. Associated privileges include Reports: Report Manager, View: Non-Sensitive, and View: Sensitive.
Switch Port Administrator Switch port administrator. Privileges include Switch Port Admin which enables changes to switch port configurations such as VLAN assignment and port activation, and View: Non-Sensitive.
SysAdmin The global administrator account Role for NetMRI. Includes the System Administrator privilege and View: Audit Log. SysAdmins can manage, add and remove scan interfaces and map them to networks, manage, add, and remove network views.
UserAdmin Create and edit NetMRI user accounts and Roles, and assign privileges. Includes View: Audit Log, View: Non-Sensitive, User Administrator, Reset Passwords, and Issues: Define Notifications.
You can create custom Roles, with custom sets of privileges to suit the needs of your organization. You can add and remove privileges and user accounts from each of the pre-defined Roles in the NetMRI appliance. See Defining and Editing Roles for more information.
The 17 default Roles built into the system cannot be deleted from the appliance. Custom Roles can be deleted and edited.
Creating User Accounts
You create, edit, and delete user accounts in the Users page (Settings icon –> User Admin section –> Users). By default, the admin account is the single user account built into the appliance. You cannot remove this account.
In the Users window, each user account lists the following:
User Name: The network identity of the user.First Name and Last Name: The configured first name and surname for the user.Last Login: The time and date of the last login.Last Authentication: Shows the authentication service that granted the last login.Last Authorization: This field is updated at each user login. Possible values are as follows:
Remote: When the user logs in using their remote password, and their Force Local Authorization setting is set to False for their user account. The user is granted the roles defined from the remote group assignment in the authentication service properties.Local: In cases where the user simply logs in using their local appliance password or, when the user logs in to the remote authentication service using their remote password, and the Disable Authorizationcheckbox is enabled for that service is disabled for their account.Forced Local: When the user logs-in using their remote password and their Force Local Authorizationsetting is set to False in their User properties. The user is granted the local roles and access to their device groups.

Infoblox NetMRI 7.4.4 Administrator Guide Part 1 Introducing and Configuring NetMRI
Copyright ©2020, Infoblox, Inc. All rights reserved. Page 114
••
1.2.
••
3.4.5.6.
7.8.
1.2.
1.2.
1.
For remotely authenticated users, including new accounts learned from logins to a configured remote service, the field will show No and the service will show the service name.
Roles: The role(s) assigned to the account.Account Status (active or disabled): An admin can disable a user account by enabling its Account Disabled check box. When you do so, the user will receive a User Disabled or Locked message upon the subsequent login.
When scheduling or running a job (see Creating and Scheduling Jobs for more information), if user credentials are required and the Use the requester's stored CLI credentials or Use the approver's stored CLI credentials job options are selected, then the CLI credentials associated with the given user account are used to login to the network devices that are part of the job. Admins can modify command-line execution credentials for each created user account through the CLI Credentials tab. For more information, see the corresponding procedure further in this section.
To create a new user account, complete the following:
Click Add User (below the table).In the Add New User dialog –>User Details tab, enter values for the First Name, Last Name, Username, and Password fields. Fill in optional fields as needed.
If you want the new account to be disabled by default, check the Account Disabled check box.If you want the user to be authenticated and authorized by the NetMRI appliance for their roles and device group assignments, check the Force Local Authorization check box. This enables the user to have a locally defined login that is separate from the remote one on the AAA server. Leaving this check box clear enables the user account to be subjected to authorization through a remote AAA server.
Click Save. The Roles and CLI Credentials tabs activate, allowing you to assign Roles to the account.In the Roles tab, click Add.In the Add Role to User <username> dialog, choose a role from the drop-down list.In the Device Groups list, click to choose the device group(s) the user is allowed to access. Click All (the first item in the list) to allow the user account to access all device groups.Click OK. The new Role settings are saved for the user account.In the Add New User dialog, click the Close button.
To edit an existing user account, complete the following:
Click the Edit icon for the account.In the Edit User dialog, make the necessary changes, and then click the Close button.
To delete a user account, complete the following:
Click the Delete icon for the account.Confirm the deletion.
To define command-line credentials for a user account, complete the following:
In the Edit User dialog, click the CLI Credentials tab for the user account. This tab allows CLI credentials (username, password, and Enable password for devices) to be associated with specific user accounts.
Note
The Actions for each account in the Users list represent the actions that the admin user can take on that user account (Edit, Delete, etc.).
Note
User account names are case-sensitive. You can use some non-alphanumeric characters for naming, including bracket characters, such as @!#$%^&*()[]{}. Punctuation characters (,.;'"), the equal sign =, vertical bar |, and spacebar characters are disallowed.
If you use TACACS+ authentication and authorization with NetMRI, you should keep in mind that TACACS user names are case-insensitive. Therefore, the case must not be the only difference between NetMRI and TACACS user names.

Infoblox NetMRI 7.4.4 Administrator Guide Part 1 Introducing and Configuring NetMRI
Copyright ©2020, Infoblox, Inc. All rights reserved. Page 115
2.
3.4.
1.2.3.4.
1.2.3.4.
If desired, enable the User CLI Credentials Enabled check box. The admin account can log in to network devices using the CLI credentials associated with the given account, instead of the admin credentials associated with devices during their Discovery.Enter the user's Username and Password values, and confirm the password.Enter the admin account's Enable Password and confirm it.
Defining and Editing Roles
A role defines what a user can do within NetMRI. Each role consists of a set of privileges, each of which specifies a distinct permitted activity. The Roles page (Settings icon –> User Admin –> Roles) enables an administrator to create, edit, and delete roles.
To create a new role, complete the following:
Click Add (below the table).In the Add Role dialog –> Users tab, enter a descriptive name in the Name field.In the Description field, describe the role.Click Save. This adds the new role to the Roles table. Users and Privileges tabs appear.
5. In the Users tab, click Add. The Add User for <Username> Role dialog appears, displaying a Users drop-down list and the list of Device Groups in the appliance.
6. In the Add User for <Username> Role dialog –> User drop-down list, choose one or more users for the role.
7. In the Device Group table, select the device group check boxes to be associated with this role.
8. Click OK.
9. As needed, repeat steps 5 through 8 for other accounts.
To specify privileges for the role, perform the following:
In the Edit Role –> Privileges tab, click Add.In the Add Privileges dialog, select the Privileges check boxes (see list below) to be associated with the role.Click OK.In the Edit Role dialog, click Save & Close.
Editing RolesTo edit a role, perform the following:
Note
Roles are also limited by a chosen user's permitted access to device groups. Device groups accessible to a user are specified in the user's account.
Note
You can assign one or more user accounts or privileges to the new role. It is not necessary to assign users to the role (this can be done in the user account), but privileges must be assigned for the new pole to be meaningful.
Note
A role containing optional user/device group definitions can be assigned only to users listed in the Role Userstab. To allow a role to be assigned to any user, delete user/device group definitions in this tab.

Infoblox NetMRI 7.4.4 Administrator Guide Part 1 Introducing and Configuring NetMRI
Copyright ©2020, Infoblox, Inc. All rights reserved. Page 116
1.2.3.4.
1.2.
1.2.
Click the Edit button for the role.In the Edit Role dialog, as needed, edit the Name and/or Description.Add or delete users/device groups in the Users tab and add or delete privileges in the Privileges tab.Click Save.
To copy a role, perform the following:
Click the Copy button for the role.Confirm the copy.
The copied role appears in the list as "<previous name Copy>." To delete a role, complete the following:
Click the Delete button for the role.Confirm the deletion.
Privilege DescriptionsThe following NetMRI system privileges can be assigned to Roles:
Privilege Description
Configure Networks A system privilege applied to SysAdmin roles. Allows adding of new networks, changing Network View mappings and mapping local VRFs to networks.
Switch Port Admin A system privilege applied to Switch Port Administrator Roles. This Privilege allows the Role to perform the following tasks:
Modify port descriptions (Interface Viewer –> Settings –> Port Control Settings).
Set a switch port to Administratively UP or Administratively Down (Interface Viewer –> Settings –> Port Control Settings).
Change a port's VLAN assignment (Interface Viewer –> Settings –> Port Control Settings).
Specify ports to exclude from Switch Port Management page views (Interface Viewer -> Settings –> General Settings).
View system feedback for their most recent action.
Collection: Poll On Demand Users with this privilege can perform on-demand polling of individual network devices for the admin account using this privilege.
View: Non Sensitive Ability to view all non-sensitive information in NetMRI, such as Issues, Changes, audit logs and device states through the Device Viewer. Users with these privileges cannot carry out the following:
Setup tasks beyond Setup Summaries (Settings –> Setup –> Settings Summary).
License management and many other NetMRI Settings configurations (Settings –> Setup –> General Settings).
Database settings beyond viewing statistics Settings –> Setup –> Database Settings). View: Non-Sensitive also cannot view or modify device configuration files, CLI and SNMP credentials, or NetMRI user accounts.
Users with View: Non Sensitive privileges can schedule and run reports.
View: Sensitive Ability to view all sensitive information in NetMRI, including policy compliance configurations, device configurations in Configuration Management, configuration of user accounts, and Setup, Licensing and Database tasks otherwise not accessible by View: Non Sensitive privileges.

Infoblox NetMRI 7.4.4 Administrator Guide Part 1 Introducing and Configuring NetMRI
Copyright ©2020, Infoblox, Inc. All rights reserved. Page 117
Privilege Description
View: NetMRI System Info Ability to view NetMRI appliance settings.
Custom Data: Input Data A privilege allowing non-Admin user accounts to edit and enter information in custom data fields previously created by the Admin account. Example: for network devices, custom fields are useful for recording important contextual data such as asset tag numbers and physical location — information that NetMRI does not gather on its own. By default, the Admin account is the only account with permissions to edit such data fields. For more information, see Defining and Using Custom Fields and Enabling Custom Data Field Editing for Non-Admin Users.
System Administrator Allows user complete access to the NetMRI appliance.
Reset Passwords Privilege that allows a user to change passwords other than their own.
User Administration Privilege that allows a user to create users, and assign roles and privileges.
Issues: Modify Parameters Privilege that allows a user to define and change analysis parameters, including analysis schedules.
Issues: Modify Suppression Parameters Privilege that allows a user to modify issue suppression parameters.
Issues: Modify Priority Privilege that allows a user to set priority of issues.
Issues: Define Notifications Privilege that allows a user to define notifications for the issues
Scripts: Level 1 Execute and schedule packaged scripts and commands designated level 1 (low risk)
Scripts: Level 2 Execute and schedule medium-risk packaged scripts and commands.
Scripts: level 3 Execute and schedule high-risk packaged scripts and commands.
Scripts: Author Author scripts and packaged commands, and save them for re-use by others.
Policy: Create, Edit, and Delete Create, edit, and delete policies and policy rules.
Policy: Deploy Ability to assign the device groups against which a policy is checked.
Events: Admin Ability to create event symptoms.
Groups: Create Ability to create and edit device and/or interface groups in NetMRI.

Infoblox NetMRI 7.4.4 Administrator Guide Part 1 Introducing and Configuring NetMRI
Copyright ©2020, Infoblox, Inc. All rights reserved. Page 118
Privilege Description
Groups: Result Sets Ability to create and edit result sets.
Groups: Delete Ability to remove the device and/or interface groups.
Terminal: Modify Credentials Allow the user to modify their own CLI credentials. This privilege restricts/allows users with the given role to change their own CLI credentials (Settings –> User Admin –> edit User –> CLI Credentials). By default, this tab is disabled for user accounts without this privilege. NetMRI roles that have this privilege by default include SysAdmin, UserAdmin, and ChangeEngineer High. For roles other than those noted, this privilege is manually assigned.
Terminal: Open SessionAllow users to activate Telnet/SSH sessions from the right-click menu. Should a user account not have this privilege, a popup message appears explaining that they do not have sufficient privileges to use this feature. NetMRI roles with this privilege include SysAdmin, UserAdmin, ChangeEngineer High, and ChangeEngineer Medium. For roles other than those noted, this privilege is assigned manually.
Terminal: Use NetMRI Creds Allow the user to log in to devices using the default login/enable credential associated to the device within NetMRI. These are not vendor default credentials. If a terminal session is opened and the user has the appropriate privileges, the terminal shell queries the device credentials based on status and connection type and attempts a login using those if they are available; if not, a username and password are requested from the user.
Tools: All Allows access to all available Network Tools in NetMRI.
Tools: Ping/Traceroute Allows access to the NetMRI Ping/Traceroute Tool.
Tools: Path Diagnostics Allows access to the NetMRI Path Diagnostic Tool.
Tools: SNMP Walk Allows access to the NetMRI SNMP Walk Tool.
Tools: Cisco Cmd Tool Allows access to the NetMRI Cisco Command Tool.
Tools: Discovery Diag Allows access to the NetMRI Discovery Diagnostics Tool.
Tools: FindIT Allows access to the NetMRI FindIT Tool.
Viewing the User Audit LogThe Audit Log (Settings icon –> User Admin –> Audit Log) lists all actions taken by user accounts that result in changes to NetMRI or any of the data sets the account manages. Log entries include the timestamp in which the action was taken, the User name, a description of the action, and field change details when applicable.
Note
Privileges cannot be edited or deleted, and new Privileges cannot be created.

Infoblox NetMRI 7.4.4 Administrator Guide Part 1 Introducing and Configuring NetMRI
Copyright ©2020, Infoblox, Inc. All rights reserved. Page 119
Log entries are initially ordered by time, with the most recent at the top of the list. The table can be reordered to, for example, consolidate a particular user's actions. Alternatively, use quick searching to isolate specific log entries.
Managing User Audit Logs for SSH Connection Attempts to DevicesAs an aid to track what NetMRI or its users are doing on the network, you can also view the audit logs for all events in which NetMRI or its users attempt to use SSH or Telnet sessions to network devices. The amount of data collected for such events can substantially impact the size of the collected event database, so you can switch this feature on and off when needed and change the duration of these events being held in the database. Connection events that are covered by this log category include SSH/Telnet connections for Config Collection, Credential Collection, terminal emulation, and Job Engine Run connections. Unknown connections may also be recorded, which will be events such as API calls.
To view and change these settings, go to Settings icon –> General Settings –> Advanced Settings –> Notificationcategory –> Log All CLI Sessions. The default value is On. You can also choose the No Commands Logged option, which retains the session events but prevents any sensitive CLI data from being recorded.
An associated Advanced Setting, Prune CLI Session Duration, enables you to regularly prune the amount of CLI session data by setting the retention time for keeping that data in the Device Audit Log. The default setting is 7 days.
Advanced User Administration SettingsSeveral important global NetMRI user account settings are located in the Advanced Settings section. To access them, go to Settings icon –> General Settings –> Advanced Settings, and then use the Next Page button to get to the User Administration category. Advanced User Administration settings determine the following:
Password Expiration The number of days that a password is valid before requiring a new password for each account. The default is 90 days. Setting this value to zero sets any password to never expire.
For passwords to existing accounts, this setting only applies after a password is changed. For new account passwords, this setting applies immediately.
Consecutive Failed Login Limit The number of successive failed login attempts allowed for any user account before the account is locked out. The default is zero—which allows an indefinite number of login attempts. Infoblox recommends setting Consecutive Failed Login Limit to a non-zero value. Ties to the Lockout Duration feature (below).
Lockout Duration Determines the length of time that elapses before NetMRI accounts that experienced a failed series of logins can attempt once again to log in to the appliance. The default is zero, which indicates that there is no lockout time period. Infoblox recommends a value of 15 minutes or more.
Password Length Determines the minimum permissible length of a password for admin accounts in NetMRI. Default minimum value is 8 characters.
Password Numeric Determines whether passwords are required to have at least one numeric character in their composition. Default is On.
Password Non Alpha-Numeric Determines whether passwords are required to have at least one non-alpha-numeric character (&^%$#@!~) in their composition. Default is *Off.

Infoblox NetMRI 7.4.4 Administrator Guide Part 1 Introducing and Configuring NetMRI
Copyright ©2020, Infoblox, Inc. All rights reserved. Page 120
Password Mixed-Case Determines whether passwords are required to have mixed upper/lower-case composition. Default is Off.
Hide the system banners from non-admin users Hides the System Health and Capacity Limit banners from non-admin users.
NetMRI User Authentication and AuthorizationNetMRI uses internal and external authentication systems to control user authentication for performing all administrative tasks. For a simple rollout, you can use the NetMRI local authentication database, which is called the local authentication service, where all user accounts and login information are contained within the appliance. You can also link NetMRI to an external Active Directory, RADIUS, TACACS+, LDAP, SAML, or OCSP authentication server or server group in the enterprise network to perform user authentication and authorization for NetMRI tasks, using the same user roles and privileges defined on the local NetMRI system. Doing so requires creating new authentication services in NetMRI.
Use the Authentication Services Settings page (Settings icon –> General Settings –> Authentication Services) to configure authentication server settings.
Configuring NetMRI External Authentication
If you define one or more authentication servers under Authentication Services Settings, NetMRI uses the account information from those servers in the order given by priority to accept or reject a given username and password. The only exception is the admin account, which is always validated using the Local Database. NetMRI can be accessed by the system administrator even when authentication servers are down or cannot be accessed by the appliance.
You can disable the local authentication service, in which case only the primary Admin account will be locally authenticated. You can also change the priority level of the Local service, which affects the order in which the local service will be activated for authentication requests. For some applications, retaining the Local service as the highest priority is recommended.
You can also enable multiple server groups of different types to authenticate and authorize users. Each server group, whether LDAP, AD, RADIUS, TACACS+, SAML, or OCSP, and the mapping between the remote user groups with the local NetMRI roles, is referred to as an authentication service. You configure each authentication service to use a group of one or more authentication servers.
For NetMRI user accounts, you define roles and privileges locally in the NetMRI appliance. All user account roles and privileges remain local to the NetMRI appliance and are not directly defined on the RADIUS, TACACS+, LDAP, AD, SAML, or OCSP server. For information about user Roles and Privileges, see Creating Admin and User Accounts. The external server is used for authentication of the user account. Authorization functions are tied to the assignments between the remote user group names and the NetMRI Roles in the desired NetMRI device groups.
The following figure illustrates the authentication and authorization process for users authenticated by remote servers. In the example, two authentication services are configured, a RADIUS service and an Active Directory service. When admin logs in with a user name and password, NetMRI uses the service configured with the highest Priority setting to authenticate the admin. If authentication fails, NetMRI tries the next highest-priority service, and so on. For each service, it tries each authentication server in the order given by their priority, until successful or all services fail, including the local authentication service. If all services fail to authenticate the login attempt, NetMRI denies access and generates an error notification.
If authentication succeeds, NetMRI tries to match the user's group names received from the remote server to those assigned to the local roles and device groups defined in the authentication service properties. If it finds a match, the
Note
The root Admin account is authenticated only through the NetMRI local authentication database. Other administrator accounts can be authenticated and authorized against an external server.

Infoblox NetMRI 7.4.4 Administrator Guide Part 1 Introducing and Configuring NetMRI
Copyright ©2020, Infoblox, Inc. All rights reserved. Page 121
•
•
•
•
•
••
•
••
•
•
•
NetMRI appliance applies the privileges of these roles in the specified device groups to the authenticated user. If the appliance does not find a match, it denies access.
Defining Authentication ServicesIn all cases, configuring authentication protocols for the NetMRI appliance requires creating one or more authentication services from the Settings icon –> General Settings –> Authentication Services page:
Local: The appliance's local user account authentication database, containing user login verification, Role and privilege assignments and device group assignments. The Local service is the default and cannot be removed from the system. If no other services are available, users will be requested to login using local credentials, which must also be configured by the administrator on the NetMRI appliance. For many deployments, the Local service should always be kept as the highest-priority service.Active Directory: Allows NetMRI to use an Active Directory server or servers for external admin account verification and remote group authorization.LDAP: Enables NetMRI to use a Lightweight Directory Access Protocol server or servers for external admin account verification and remote group authorization.RADIUS: Allows NetMRI to use a RADIUS server or servers for external admin account verification and remote group authorization.TACACS+: Allows NetMRI to use a TACACS+ server or servers for external admin account verification and remote group authorization.SAML: Enables NetMRI to use a SAML server to authenticate users with their organization's single-sign-on.OCSP: Allows the verification of client CA certificates.
The following information is in the Authentication Services table:
Priority: The priority in the services list by which the service will be used by NetMRI. By default, the Local service retains the priority level of 1, placing it first in the Services list.Name: The name of the service, defined by the administrator.Service: The authentication service type, which may be Local, Active Directory, LDAP, RADIUS, TACACS+, SAML, or OCSP.Status: This field will show Active or Disabled. Services are disabled or enabled by user choice or automatically if no authentication server is defined for the service.Authorization: This field will show Active or Disabled. The authorization capability is disabled or enabled by user choice, or is disabled automatically if the service does not have a remote group assigned to the local Roles that are defined on NetMRI. When authorization is disabled, the user must be defined locally and associated with Roles and device groups on the appliance, but their login credentials will be checked by the remote server.Description: A description for the service, defined by the administrator.
The following sections describe each authentication and authorization services configuration.
Authenticating Users Using AD (Active Directory)Active Directory™ (AD) is a Microsoft-proprietary distributed directory service based upon LDAP, that is a repository for user information. The NetMRI appliance can authenticate user accounts by verifying user names and passwords against
Note
When a new user is authenticated and authorized through one of the remote services, NetMRI automatically creates the new account locally on the appliance and learns the Roles and device group assignments from the remote service. If there happens to be an established local user account, and the account login is authenticated and authorized by an external service, NetMRI will update its local profile to reflect the Roles and device group assignments granted by the last external authorization.
An admin can use an account's Force Local Authentication setting to prevent a user account from being authenticated and authorized by an external service. This requires the Local authentication service to be the highest-priority service. For information, see User Administration in NetMRI and its subsections.

Infoblox NetMRI 7.4.4 Administrator Guide Part 1 Introducing and Configuring NetMRI
Copyright ©2020, Infoblox, Inc. All rights reserved. Page 122
••••••
1.2.3.4.
5.
6.7.8.
1.a.b.c.
d.
e.
f.
g.h.
an Active Directory server. NetMRI can use the AD authentication service to query the AD domain controller for the user's group membership information. NetMRI then matches the group names from the domain controller with the group names in its authentication service properties. It authorizes services and grants the administrative roles and privileges, for the remote user groups assigned to its local roles and the specified device groups.
The Active Directory schema is predefined for User and Group entries, which means that in NetMRI, you only need to specify the Domain of the AD server, along with its IP address.
Active Directory Service ConfigurationConfiguring AD services requires knowledge of the following key values:
The Active Directory Domain.Whether to use anonymous or verified (Authenticated) Authentication between NetMRI and the AD server.An SSL certificate from the AD server if one is required.The IP address of the AD server.The port number (normally, you will retain the default).The names of the remote groups on the AD server containing the users intended to log in to the NetMRI appliance.
To configure an Active Directory authentication service for NetMRI, complete the following:
Go to the Settings icon –> NetMRI Settings section –> Authentication Services page.Click New to add a new authentication service. The Add Authentication Service dialog opens.Enter the Name and Description.Set the Priority and Timeout of the AD service. The Priority value, in which higher values provide a lower priority for service execution ("3" provides a lower priority than "1") should be set to 1 if the AD service is planned to be the first of two or more authentication options.Choose Active Directory as the Service Type. The Service Specific Information pane updates to show the required AD settings.Enter the AD Domain value for the new AD service (example: engineering.corp100.com).Click Save.If desired, click Disable service (this completely disables the service, but does not change or delete any settings) or Disable authorization. This disables the new service from performing any group searches but allows basic authentication of user accounts from the Active Directory server, and requires the user accounts being defined locally on the appliance.
To configure the authentication service's Active Directory servers, complete the following:
Click the Servers tab.Click Add to add Active Directory servers to the service. The Add Authentication Server dialog opens.Enter the Host/IP Address.Choose the Encryption Type: None or SSL. For information, see Using a Certificate File for an LDAP or AD Service. In the Encryption field, if you select SSL, the Authentication Port field changes its value to match the SSL protocol.If using SSL, choose the certificate from the Certificate drop-down list. The certificate can be loaded into NetMRI from the server that issued it.
Choose the Priority for the new server in the authentication service. In this context, the priority value determines the order of which servers in the services are queried by NetMRI.If necessary, enter the Port value. AD's default TCP application with SSL encryption port is 636, and 389 for non-encrypted communication.Click Save to save your configuration.Click Cancel to close the dialog.
Note
When configuring authentication using Active Directory with SSL encryption, a fully qualified domain name (FQDN) is required for the Server Name or IP address field in the Add Active Directory Server dialog.

Infoblox NetMRI 7.4.4 Administrator Guide Part 1 Introducing and Configuring NetMRI
Copyright ©2020, Infoblox, Inc. All rights reserved. Page 123
1.a.b.c.
d.e.
2.
1.2.3.
4.
••••
•••
1.2.3.
To assign the AD service's remote groups with NetMRI's local roles, complete the following:
Click the Remote Groups tab.In the Remote Group field, enter the name of an AD server's remote group.Choose the Role for the new remote group. For more information, see Defining and Editing Roles.Check the check boxes for the device groups you want to allow for the remote group. Note that the SysAdmin role applies to all device groups. Other roles allow selection of individual device groups.Click OK to complete the configuration.When finished with the remote group configuration, click Save and then Close. Note that you can add multiple Roles for the remote group.
Click Test to test the server settings. Enter a valid username and password. A successful test returns the list of groups to which the test user belongs.
Importing the AD Server Certificate
If the Active Directory server authentication uses SSL, upload the Active Directory server's CA certificate to NetMRI. See the following for directions:
Open the Settings icon –> General Settings –> Security page and click the CA Certificates tab.Click Import.In the pop-up window, enter a descriptive name for the certificate and click Browse to locate the Active Directory server's CA certificate.Click Import to import the CA certificate to NetMRI.
Authenticating Users Using LDAPLDAP (Lightweight Directory Access Protocol) is an internet protocol for accessing distributed directory services. NetMRI can authenticate and authorize admin accounts by verifying user names and passwords against the directory in LDAP. The directory service is an information storage model where all information is a collection of entries arranged in a hierarchical tree-like structure called a Directory Information Tree (DIT). Each entry in the directory consists of a set of attributes that each describe an information type, such as a network domain, country, company, organization, person, and so on. All entries have a globally unique Distinguished Name (DN) that typically represents a path to that entry in the directory tree. You use values called Base DNs in your LDAP service configuration to navigate the directory structure and locate your user accounts for authentication and authorization.
NetMRI queries the LDAP server for the user account's group membership information. The appliance matches the remote group names from the LDAP server with the group names in its local database. NetMRI then authorizes services and grants the admin privileges, based upon the matching admin group on the appliance.
LDAP Authentication Service ConfigurationConfiguring LDAP authentication services requires knowledge of the following key values:
Base distinguished name (Base DN)The User attribute.The Group attribute.Whether to use anonymous or verified (Authenticated) authentication between NetMRI and the LDAP service.Bind User DN and Bind Password (if known; otherwise anonymous).The Search Level (One Level, Base, or Subtree. Subtree is the default).The names of the remote groups on the LDAP server containing the users intended to log in to the NetMRI appliance.
To configure an LDAP authentication service for NetMRI, complete the following:
Go to the Settings icon –> NetMRI Settings section –> Authentication Services page.Enter the Name and Description.Set the Priority and Timeout of the LDAP service.

Infoblox NetMRI 7.4.4 Administrator Guide Part 1 Introducing and Configuring NetMRI
Copyright ©2020, Infoblox, Inc. All rights reserved. Page 124
4.
5.
6.
7.
•••
1.a.b.c.
d.
e.
f.g.
h.i.
Choose LDAP as the Service Type. The Service Specific Information pane updates to show the required LDAP settings.Enter the Base DN value for the new LDAP service (example: ou=management, dc=corp100, dc=com). Users' definitions may be split between two or more Base DNs, so be aware of how the directory service is structured.Enter the User Attribute. This will typically be cn for 'common name,' which is one of the components of the LDAP Distinguished Name attribute.Enter the Group Attribute, which will typically be specified as memberOf for NetMRI. This defines the group membership in the LDAP tree for individual user accounts in LDAP.
Example:
jsmith, People, corp100.com
dn: cn=jsmith,ou=People,dc=corp100,dc=com
memberOf:cn=management,ou=Group,dc=corp100,dc=com
You must use the memberOf overlay or a similarly behaving overlay to define the membership.
8. Choose the Search Level, which determines how far the LDAP service searches in the directory tree. The Subtree value is the default and can be retained for most applications. Other options are as follows:
One Level: Searches the directory entries immediately below the base object.Base: Searches only the base object.Subtree: Search the whole directory tree below and including the base object. This is the default.
9. Choose the Authentication, which can either be Anonymous or Authenticated. For more information, see Server Authentication: Anonymous vs. Authenticated.
a. If the setting is Authenticated, enter the Bind User DN (this is a core value defined on the LDAP server).
b. Enter the Bind Password, which is associated with the Bind user for the server.
10. Click Save.
11. If desired, click Disable service (this completely disables the service but does not change or delete any settings) or Disable authorization (this disables the new service from performing any group searches but allows basic authentication of user accounts from the LDAP server).
To configure the authentication service's LDAP servers, complete the following:
Click the Servers tab.Click Add to add LDAP servers to the service. The Add Authentication Server dialog opens.Enter the Host/IP Address.Choose the Encryption Type: None or SSL. For more information, see Using a Certificate File for an LDAP or ADService.If using SSL, choose the certificate from the Certificate drop-down list. The certificate must be loaded into NetMRI.Choose the Priority for the new server in the authentication service. In this context, the priority value determines the order of which servers in the services are queried by NetMRI.If necessary, enter the Port value. LDAP's default TCP application port is 389.If necessary, choose the LDAP version. The default is V3. You may choose V2 if the LDAP server supports only that version.Click Save to save your configuration.Click Cancel to close the dialog.
To assign the LDAP service's remote groups with NetMRI's local roles, perform the following:
Note
Many LDAP services may not allow the use of the Bind User DN and Bind Password values, requiring the use of anonymous authentication for LDAP queries.

Infoblox NetMRI 7.4.4 Administrator Guide Part 1 Introducing and Configuring NetMRI
Copyright ©2020, Infoblox, Inc. All rights reserved. Page 125
a.
b.c.
d.e.
2.
1. Click the Remote Groups tab.
In the Remote Group field, enter the name of a new remote group for the authentication service. In these steps, you are mapping this group name to the NetMRI Role(s) and device group(s).Choose the Role for the new remote group. For more information, see Defining and Editing Roles.Check the check boxes for the device groups you want to allow for the remote group. Note that the SysAdmin role applies to all device groups. Other roles allow selection of individual device groups.Click OK to complete the configuration.When finished with the remote group configuration, click Save and then Close. Note that you can add multiple Roles for the remote group.
Click Test to test the server settings. Enter a valid username and password. A successful test returns the list of groups to which the test user belongs.
Using a Certificate File for an LDAP or AD Service
When you test the connection to the server, your NetMRI-to-LDAP server connections (or for Active Directory connections) allow for loading a current SSL certificate from a .PEM file. See the section NetMRI Security Settings for the process of adding SSL certificates to NetMRI. This certificate automatically appears in the authentication server’s Certificate drop-down menu after being loaded into NetMRI.
An LDAP connection test shows the following:
Username: ******Password:******Process Started2015-05-01 17:41:59 ------------------------------------------------------2015-05-01 17:41:59 +++ BEGIN testing access to authentication servers +++2015-05-01 17:41:59 +++ LDAP connection: username='jsmith', address='ldaps://172.16.23.2', port='636', certPath='/var/local/netmri/certs/ca_repo/1430516467.501615.pem', version ='', timeout='5' +++2015-05-01 17:41:59 Anonymous bind2015-05-01 17:41:59 Authentication successful.2015-05-01 17:41:59 Authenticate user 'cn=jsmith,ou=People,dc=corp100,dc=com' with 'inet6 => Y'...2015-05-01 17:41:59 Authentication successful.2015-05-01 17:41:59 Groups: ['administrators', 'dev']2015-05-01 17:41:59 +++ END testing access to authentication servers +++2015-05-01 17:41:59 ------------------------------------------------------Authentication Test Completed
If you set the Encryption menu to None, this option remains unavailable, and authentication tests will show a blank certPath value in the test output.
Server Authentication: Anonymous vs. Authenticated
Should you have a provisioned Bind User DN (Distinguished Name) and Bind Password needed for the LDAP service, perhaps for a power user, or in cases where anonymous access is not granted by policy, you can use those values to provide another level of security between NetMRI and the servers comprising the LDAP service.
An anonymous bind takes place as follows:
2015-05-01 17:41:59 Anonymous bind 2015-05-01 17:41:59 Authentication successful.
An authenticated bind, using the correct Bind User DN and Bind Password appears as follows:
2015-05-01 18:23:06 Authenticate 'cn=root,dc=infoblox,dc=com' 2015-05-01 18:23:06 Authentication successful.

Infoblox NetMRI 7.4.4 Administrator Guide Part 1 Introducing and Configuring NetMRI
Copyright ©2020, Infoblox, Inc. All rights reserved. Page 126
••••••
1.2.3.4.5.
6.
a.b.c.d.e.f.
a.
b.c.
d.
Authenticating Users Using RADIUSRADIUS (Remote Authentication Dial-In User Service) provides authentication, accounting, and authorization functions, through a communications stream between clients and a dedicated server. NetMRI directly supports authentication and authorization using FreeRADIUS. Other widely used RADIUS implementations include GNU RADIUS and Microsoft IAS. RADIUS provides all user authentication in a single centralized database. After users are verified, they have access to any NetMRI administrative function permitted for their account.
RADIUS Service ConfigurationConfiguring the RADIUS Service requires knowledge of the following key values:
The Infoblox Vendor ID, 7779.The specific Vendor Attribute, 10.The IP address of the RADIUS server.The shared secret for authenticating the NetMRI appliance on the RADIUS server.The port number. Normally, you will retain the default value of 1812.The names of the remote groups on the RADIUS server containing the users intended to log in to the NetMRI appliance.
To configure a RADIUS authentication service for NetMRI, perform the following:
Go to the Settings icon –> NetMRI Settings section –> Authentication Services page.Click New to add a new authentication service. The Add Authentication Service dialog opens.Enter the Name and Description.Set the Priority and Timeout of the new RADIUS service.Choose RADIUS as the Service Type. The Service Specific Information pane updates to show the required RADIUS settings.Retain the defaults for the Infoblox Vendor ID (set to 7779) and the Vendor Attribute ID (set to 10). These values are required for operation with any RADIUS server. These values may be set differently but must also be defined in the RADIUS dictionary file.
To configure the authentication service's RADIUS servers, do the following:
1. Click the Servers tab.
Click Add to add RADIUS servers to the service. The Add Authentication Server dialog opens.Enter the Host/IPAddress.Choose the SharedSecret for the RADIUS server.If necessary, enter the Port value. RADIUS's default UDP application port is 1812.Click Save to save your configuration.Click Cancel to close the dialog.
To assign the RADIUS service's remote groups with NetMRI's local roles, perform the following:
1. Click the Remote Groups tab.
In the Remote Group field, enter the name of a new remote group for the authentication service. In these steps, you are mapping this group name to the NetMRI Role(s) and device group(s).Choose the Role for the new remote group. For more information, see Defining and Editing Roles.Check the check boxes for the device groups you want to allow for the remote group. Note that the SysAdmin role applies to all device groups. Other roles allow selection of individual device groups.Click OK to complete the configuration.
Note
You can change the Infoblox Vendor ID and Vendor Attribute values in your configuration, but ensure that you declare the same value in the external dictionary file on the RADIUS server. Infoblox recommends retaining the default values.

Infoblox NetMRI 7.4.4 Administrator Guide Part 1 Introducing and Configuring NetMRI
Copyright ©2020, Infoblox, Inc. All rights reserved. Page 127
e.
2.
•••
When finished with the remote group configuration, click Save and then Close. Note that you can add multiple Roles for the remote group.
Click Test to test the server settings. Enter a valid username and password. A successful test returns the list of groups to which the test user belongs.
Configuration of RADIUS Server Attributes, Users, and Group DefinitionsThe RADIUS server or servers require the following additional configurations to inter-operate with NetMRI:
Set up an entry on the RADIUS server to allow NetMRI to access the RADIUS server.Edits to the Dictionary file.A new RADIUS attribute to identify the group names.
When you configure your RADIUS server files to support the Infoblox attributes, you can use modifiable RADIUS service parameters to support Infoblox features. On a basic level, the Infoblox Vendor ID (7779) and Vendor Attribute ID (10) values reflected in the following example should not be changed. Other RADIUS service parameters and attributes are described in this section. All examples use FreeRADIUS syntax, but many other RADIUS server types follow similar principles.
You must configure the RADIUS server to allow the NetMRI connection. To do so, the administrator adds the appliance IP address to the configuration, and defines a shared secret. in the case of FreeRADIUS, you add an entry in the /etc/raddb/clients.conf file. The following example shows IPv4 and IPv6 entries:
#Allow NetMRI
client 172.16.1.23/24 {
secret = #$*&@#$!
shortname = netmri
}
client 2001::db8:56ff:feb8:875c/96 {
secret = #$*&@#$! shortname = ipv6_netmri
}
The FreeRADIUS server uses a primary dictionary file in its main /etc/raddb directory. A reference to an external dictionary file, such as dictionary.infoblox, should be added as follows:
$INCLUDE dictionary.infoblox
You can declare the custom attribute using any name, but references must be consistent in the rest of the server configuration files that you create.
To support the custom dictionary, create a new text file named dictionary.infoblox in the /etc/raddb directory, containing the following Vendor ID value and attribute ID number:
# Add a new vendor and specific attribute to store the group value, and add into the answering Access-Accept packet VENDOR infoblox 7779 ATTRIBUTE NA-group-info 10 string infoblox
This declaration in the new dictionary file supports the default values that are reflected in the Add Authentication Service dialog in NetMRI when you configure a new RADIUS service. As previously noted, you can use whichever values you want, but those values must be correctly applied throughout the configuration.
Finally, for a query from the NetMRI appliance about a valid user/password, the Radius administrator must ensure that a response will contain the 'na-group-info' attribute with the list of groups' names of which the user is a member.

Infoblox NetMRI 7.4.4 Administrator Guide Part 1 Introducing and Configuring NetMRI
Copyright ©2020, Infoblox, Inc. All rights reserved. Page 128
•••••
1.2.3.4.5.
6.
Authenticating Users Using TACACS+ (T+)You can configure NetMRI to authenticate admins against TACACS+ (Terminal Access Controller Access-Control System Plus, or T+) servers. TACACS+ provides separate authentication, authorization, and accounting services. NetMRI provides support only for authentication and authorization capabilities. To ensure reliable delivery, T+ uses TCP as its transport protocol, and to ensure confidentiality, all protocol exchanges between the T+ server and its clients are encrypted. In this section, we assume that AAA administrators understand the details of TACACS+ configuration, and present simpler examples in this section.
To support TACACS+ authentication and authorization through NetMRI, you configure a custom service, infoblox, on the T+ server, and then define the user names and group names in the infoblox service's custom attribute na-group. These services and attributes can be named differently according to preference. We use these values by convention in this document.
Ensure that you apply each user group to the custom service infoblox (or however you choose to name the custom service). On NetMRI, you add the remote groups with the same names to the authentication service. When the TACACS+ server responds to an authentication and authorization request relayed from NetMRI and the response includes the na-group custom attribute, NetMRI matches the group name with the group in the authentication service and automatically assigns the admin to that group.
If you use T+ only for authentication, the user accounts must all be defined in NetMRI with the User IDs matching the declared values on the T+ server. These accounts must be locally configured on NetMRI with the roles assigned to their specified device groups.
If you use T+ for both authentication and authorization, and the configurations are done in the T+ server configuration file, the successfully authenticated and authorized users will be dynamically created in NetMRI with the roles defined through the configurations in the Authentication Service configured in NetMRI.
TACACS+ (T+) Service ConfigurationUser authentication support in TACACS+ requires each user account to be defined in NetMRI with their defined User ID matching their declared value on the TACACS+ server.
For authorization settings, the T+ configuration file contains the group definitions and the relationships of each user account to those groups.
Configuring the TACACS+ Service requires knowledge of the following key values:
The na-group-info group attribute value defined for NetMRI in the TACACS+ configuration.The IP address of the TACACS+ server.The shared secret for authenticating the NetMRI appliance on the TACACS+ server.The port number. Normally, you will retain the default value 49.The names of the remote groups on the LDAP server containing the users intended to log in to the NetMRI appliance.
On NetMRI, for the TACACS+ authentication service, you define remote groups with the same names (test_admin_group, for example – the group names could be any preferred text string), and the roles these users can have in the specified device groups. When the TACACS+ server responds to an authentication and authorization request relayed from NetMRI, the response includes the group name. If NetMRI does not find a matching remote group in the authentication service, it will not allow the user to log in and will try the following service in its authentication services list.
To configure a TACACS+ authentication service for NetMRI, complete the following:
Ensure that all user accounts are defined with their necessary roles in NetMRI.Go to the Settings icon –> NetMRI Settings section –> Authentication Services page.Enter the Name and Description.Set the Priority and Timeout values.Choose TACACS+ as the Service Type. The Service Specific Information panel updates to show the required TACACS+ settings.Enter the Service Name and Group attribute.

Infoblox NetMRI 7.4.4 Administrator Guide Part 1 Introducing and Configuring NetMRI
Copyright ©2020, Infoblox, Inc. All rights reserved. Page 129
7.
a.
a.b.c.d.
e.f.
g.
a.
b.c.
d.e.
2.
Test NetMRI user account settings by entering the UserName and Password and clicking Test. A successful test returns the list of user roles defined in NetMRI for the test user.
If the test user name or password is incorrect, access is rejected. Access will also be rejected if no NetMRI Role is defined for the test user, on the NetMRI system.
8. You can select to use TACACS+ only for authentication. In such cases, check the Disable authorization check box.
If you wish to disable the current service check the Disable service check box.
To configure the authentication service's TACACS+ servers, complete the following:
1. Click the Servers tab.
Click Add to add TACACS+ servers to the service. The Add Authentication Server dialog opens.Enter the Host/IP Address.Choose the Shared Secret for the server.Choose the Priority for the new server in the authentication service. In this context, the priority value determines the order of which servers in the service are queried by NetMRI. A lower value number denotes a higher priority. "1" is the highest possible priority. Only one server should have a "1" priority.If necessary, enter the Port value. The TACACS+ default application port is 49.Click Save to save your configuration.Click Cancel to close the dialog.
To assign the TACACS+ service's remote groups with NetMRI's local roles, complete the following:
1. Click the Remote Groups tab.
In the Remote Group field, enter the name of a new remote group for the authentication service. In these steps, you are mapping this group name to the NetMRI Role(s) and device group(s).Choose the Role for the new remote group. For more information, see Defining and Editing Roles.Check the check boxes for the device groups you want to allow for the remote group. Note that the SysAdmin role applies to all device groups. Other roles allow selection of individual device groups.Click OK to complete the configuration.When finished with the remote group configuration, click Save and then Close. Note that you can add multiple Roles for the remote group.
Click Test to test the server settings. Enter a valid username and password. A successful test returns the list of groups to which the test user belongs.
Subsequent login attempts are authenticated using the defined authentication servers, except for the admin user account.
Authenticating Users Using SAMLNetMRI uses the SAML (Security Assertion Markup Language) 2.0 authentication type for Single-Sign-On. SAML provides a standard vendor-independent grammar and protocol for transferring information about a user from one web server to another, independent of the server DNS domains. By enabling SAML, user management is delegated to an external application, thus relieving IT administrators the complexity of maintaining user accounts in all the applications (also known as Service Providers) being used by the organization. Instead, IT administrators need to maintain one account in the Identity Provider (IDP) which can be used across Service Providers (SPs). IDP is the application server that maintains the user accounts of the entire organization. IT administrators can manage users access rights at one place. User can login to the IDP directly and once logged in, they can be transferred towards the
Note
If the authentication server or its shared secret is incorrect, the message "Unable to get access information" will appear.

Infoblox NetMRI 7.4.4 Administrator Guide Part 1 Introducing and Configuring NetMRI
Copyright ©2020, Infoblox, Inc. All rights reserved. Page 130
•••••
••
•
•
1.2.3.
4.5.6.7.
•
•••
8.
9.10.
1.2.3.
4.5.
required SP without being prompted for the user ID and password. SAML helps NetMRI delegate Identity Management to a third-party SSO application (IDP) and thereby eases administrative efforts.
NetMRI supports the following Identity Providers:
Azure SSOOktaPing IdentityShibboleth SSOOthers
You can see the buttons with your configured SAML authentication service or services on the NetMRI login form under Authenticate via SSO. Clicking on a button redirects you to the Identity Provider authentication page. After successfully authenticating on the Identity Provider side, you automatically return to NetMRI. NetMRI creates user data and links the user to the role via the remote groups mapping described in the next section.
SAML Authentication ConfigurationFor SAML authentication, you configure the service and remote groups. No need to configure servers, as all needed server information is included in the service configuration.
Prerequisites for configuring SAML authentication:
Ports 443 (HTTPS) and 80 (HTTP) must be allowed on the firewall to allow NetMRI to communicate with IDP.A valid SSL certificate and key stored on your SAML server. They are used to communicate to the Identity Provider server. You can download the cerficate and key files from the NetMRI SAML server onto your local machine.The URL to the IDP metatada that includes SAML server information, user groups data, and other necessary details. You can obtain the metadata URL from your IT administrator.The names of the remote groups on the SAML server containing the users intended to log in to the NetMRI appliance. You can obtain the remote groups list from your IDP.
To configure a SAML authentication service, complete the following:
Go to the Settings icon –> General Settings –> Authentication Services.Click New (the plus icon). The Add Authentication Service dialog opens.Name: Enter a meaningful name for the SAML authentication service. This name will appear on the NetMRI login form. For example, Okta, Azure SSO, etc.Description: Enter a textual description for the SAML authentication service.Priority and Timeout: These settings do not apply with the SAML authentication type.Service Type: Choose SAML.In Service Specific Information, specify the following:
Entity ID: Specify the unique identifier (typically, a URI) of this particular SAML system entity. This ID used to identify the entity in various protocol exchanges.SSO Metadata Url: Specify the URL to the metadata file on your IDP SAML server.Certificate: Choose the certificate file.Key: Choose the key file.
Disable service: By default, this setting is turned on. When you turn it off, the configured service becomes available on the NetMRI login form.Disable authorization: By default, this setting is turned on until remote groups are specified.Click Save.
You can now proceed to configuring remote groups as described in the next procedure.
To map the SAML service’s remote groups to NetMRI local roles, complete the following:
In the Add Authentication Service dialog, click the Remote Groups tab.Click New (the plus icon). The Add Remote Group dialog opens.In the Remote Group field, enter the name of a new remote users group for the SAML authentication service. The name must match the group name in the SAML server metadata. Here you map this group name to the NetMRI role(s) and device group(s).Description: Enter a textual description for the remote group.Click Save.

Infoblox NetMRI 7.4.4 Administrator Guide Part 1 Introducing and Configuring NetMRI
Copyright ©2020, Infoblox, Inc. All rights reserved. Page 131
6.7.
8.9.
••
•••
1.2.3.4.5.6.7.
8.
1.2.3.4.5.
6.7.8.
Click Add Role and select a role from the drop-down list. For more information, see Defining and Editing Roles.In device groups: Select the check boxes for the device groups you want to allow for the remote group. Note that the SysAdmin role applies to all device groups. Other roles allow selection of individual device groups.Click OK to complete the configuration.When finished with the remote group configuration, click Save and then Close. Note that you can add multiple roles for the remote group.
Authenticating Users Using OCSPOCSP (Online Certificate Status Protocol) is an Internet protocol used for obtaining the revocation status of an X.509 digital certificate. The OCSP authentication type allows the verification of user certificates in order to increase security. You can use this authentication type for Common Access Cards (CAC).
You can configure the NetMRI OCSP authentication service to work in two ways:
Check user certicifate for validity.Check user certicifate for validity and revocation.
For more information, see the next section. You can also configure the OCSP service using the cac command from the Admin Shell.
OCSP Authentication ConfigurationFor OCSP authentication, you configure the service and authorization servers. This service does not use remote groups. You can add only one OCSP service instance.
Prerequisites for configuring OCSP authentication:
The IP address of the OCSP server.The OCSP server port must be allowed.A valid pre-uploaded CA certificate for the OCSP server. You upload certificates to NetMRI in Settings icon –> General Settings –> Security –> CA Certificates. For more information see NetMRI Security Settings.
To configure an OCSP authentication service, complete the following:
Go to the Settings icon –> General Settings –> Authentication Services.Click New (the plus icon). The Add Authentication Service dialog opens.Name: Enter a meaningful name for the OCSP authentication service.Description: Enter a textual description for the OCSP authentication service.Timeout: Specify the server response timeout.Service Type: Choose OCSP.Disable service: By default, this setting is turned on. When you turn it off, the configured service becomes available on the NetMRI login form. NetMRI validates that the user certificate is compliant with the CA certificate. It also performs a certificate revocation check using the OCSP server.Click Save.
You can now proceed to configuring servers as described in the next procedure.
To configure the OCSP authentication service's servers, complete the following:
In the Edit Authentication Service dialog, click the Servers tab.Click New (the plus icon). The Add OCSP responder dialog appears.Enter the Host/IP Address.Certificate: Select a previously uploaded root CA certificate from the OCSP responder.Priority: Choose the priority for the new server in the authentication service. In this context, the priority value determines the order of which servers in the service are queried by NetMRI. A lower value number denotes a higher priority. "1" is the highest possible priority. Only one server should have a "1" priority.Port: Specify OCSP server port.Disable server: By default, this setting is turned off. NetMRI checks the user certificate for validity.Click Save.

Infoblox NetMRI 7.4.4 Administrator Guide Part 1 Introducing and Configuring NetMRI
Copyright ©2020, Infoblox, Inc. All rights reserved. Page 132
9.
10.
Test: Click to test connection to the authentication servers.
Click Close.
Note
To additionally check the certificate for revocation, make sure to turn off the Disable service option in the Add Authentication Service dialog described in the previous procedure.

Infoblox NetMRI 7.4.4 Administrator Guide Part 2 Switch Port Manager
Copyright ©2020, Infoblox, Inc. All rights reserved. Page 133
•
•
•
Part 2 Switch Port ManagerThis section describes Switch Port Management, a feature set that provides network administrators with a global view of the enterprise switched Ethernet network, while also enabling drilling down to individual interfaces and endpoint devices. This section includes the following chapter:
Switch Port Management
Switch Port Management also relies on Discovery functionality to acquire a complete inventory of the L2/L3-switched enterprise network. The following chapter provides a complete discussion of how to use Network Discovery:
Running Network Discovery
Switch Port Management also uses several key reports in NetMRI's Reporting feature set, described in the following chapter:
Reports and Report Management
Switch Port ManagementThe Switch Port Management (SPM) features in NetMRI allow at-a-glance management of all switched access interfaces in the network. IT departments routinely under-estimate (and over-estimate) port utilization and capacity requirements. In a large, switched spanning-tree network, some switches can go under-utilized while other switches in the network absorb unacceptably high loads. Switch port utilization trends are difficult to identify. Is switch port utilization static, increasing, or decreasing? Where are usage trends increasing? Decreasing? If certain switches support hosts that frequently leave their network segment (on business trips, for example) only to return within a week or two, how does the network manager control those temporarily vacated ports so that they remain available for their returning hosts?
Users often confront issues such as rogue/unknown devices on their switched networks, devices that frequently shift between switch segments, and a general lack of ability to track who connects when and where. Lacking adequate capacity planning, users sometimes resort to investing in expensive switch capacity "just to be safe."
NetMRI's Switch Port Management (SPM) page (Network Explorer –> Switch Port Management) solves all of these issues. SPM enables both big-picture and highly focused views of an entire switched Ethernet network, from the overall network layer to individual devices and interfaces. Extending throughout the entire switched network, all endpoints are detected, tabulated and monitored by NetMRI.
NetMRI can perform near-real-time polling of any part of the switched Ethernet network from the distribution level to any LAN switch. Network polling settings can be customized for any device group and administrators can execute a poll of a device group or the entire switched network at any time.
In a large-scale switched network, it can also be difficult to perform basic troubleshooting–locating the affected devices and analyzing their switch-port configuration. Through specialized reports, Switch Port Management gives administrators an integrated tool by which they can quickly learn the switch port settings of the interface to which any given device connects, including line speed, duplex, link status, VLAN ID, and other information.

Infoblox NetMRI 7.4.4 Administrator Guide Part 2 Switch Port Manager
Copyright ©2020, Infoblox, Inc. All rights reserved. Page 134
1.
•
•
•
•2.
3.
4.
5.
6.
Quick Start: Deploying Switch Port ManagementThe following procedure gives an overview of the deployment process for Switch Port Management.
After performing the initial setup and defining your Discovery settings, you must define your global switchport polling settings. Go to Settings icon –> Setup –> Collection and Groups –> Global and click the Switchport Manager side tab to define your switch polling settings. Several primary polling options are offered:
Periodic Polling: Define regular polling time periods. Choose a polling interval of 1 or more Minutes or Hours. This is the default polling behavior for NetMRI. The default polling interval is 60 minutes.Scheduled Polling: Schedule recurrent polling based on hourly, daily, weekly, or monthly time periods. Click Add New Schedule and select a Recurrence Pattern of Once, Hourly, Daily, Weekly, or Monthly. In all cases, you must choose an Execution Time.On-demand polling: Click Poll Now to immediately begin polling all switch and switch-router devices in the managed network. See Understanding SPM Polling for more information.Completely disable switch port polling.
After defining global polling settings, you can define more specific polling settings at the Device Group level. See Device Actions in Switch Port Management for more information.After some time, polled switch performance and configuration data appear in the NetMRI UI.Go to Network Explorer –> Switch Port Management.The left-side menu provides three categories: Devices, Interfaces, and End Hosts.Click any menu item on the left for more information about the switched devices in the network. See Using the Switch Port Management Console for more information.For port control, you can set any switched interface to administratively Up or administratively Down by right-clicking the switch interface link and selecting Set Admin Status. The NetMRI Sandbox with the built-in Port Activation Perl script is required for this operation. See "Using the NetMRI Sandbox" in Job Scripting for more information.You can also assign or change a VLAN assignment for a switch port by right-clicking the switch interface link and selecting Edit VLAN Membership.
Using the Switch Port Management Console
Note
The switches and switch-routers have already been discovered by NetMRI. Switch Port Management polls switches for a detailed collection of information on switch port connectivity, the status of ports, and end devices. For information, see Running the Setup Wizard, Configuring Network Discovery Settings, and Running Network Discovery on Routed and Switched Networks.
NetMRI gives explicitly licensed devices priority in determining which devices to manage. Unlicensed devices continue to be managed by the appliance, but the appliance periodically collects only basic discovery data. See Other Network View Operations for more information.
Note
When you execute port control tasks such as Set Admin Status for an SPM port, NetMRI displays a separate window showing the execution state of the command. In some cases, completion may take some time. NetMRI automatically polls the device at regular intervals to check the status and notifies the user when the command completes.

Infoblox NetMRI 7.4.4 Administrator Guide Part 2 Switch Port Manager
Copyright ©2020, Infoblox, Inc. All rights reserved. Page 135
•
•
•
•
••
Two hierarchical lists appear in the Switch Port Management page, the Select Device Groups list on the right and the Devices, Interfaces, and End Hostscategories on the left. To begin using the Switch Port Management console, select any device group on the right-hand list. Each device group represents a data set from a selected group of network devices. Consider that some device groups (Routing, for example) have systems with ports that will not be managed or cataloged by Switch Port Management.
After selecting a device group on the right, choose either Devices, Interfaces, or End Hosts on the left. Then choose a menu option from the exploded list. For example, Devices has five menu items.
Note that The All Devicescategory is also a device group,
and you can get a complete view of the switched network by selecting it.
The Capacity Summary – Ports appears at the top of the Switch Port Management page, indicating several basic pieces of information:
Total Ports: The number of switched Ethernet ports, in the selected Device Group, that are being managed by Switch Port Management. If All Devices is chosen, this counter represents all managed switching ports.Free Ports: The count of ports most recently polled that show a link state of Down, having lost connectivity.Free Ports %: The percentage of all managed switch ports in the chosen Device Group showing Down link state.Available Ports: The count of ports that remained in a link state of Down for more than the prescribed time period. When a port is considered Available, it is deemed available for other network resources.
Available Ports %: The percentage of all managed switch ports appearing as Available.PoE Ports: The count of Cisco switched Ethernet ports running the Power over Ethernet switching protocol for IP telephony applications.
Choosing Devices Present shows the total of all switches' contributions to each of the six capacity categories. Choosing any other device group rewrites the Capacity Summary – Ports pane to reflect the subset of values for the selected device group.
Beneath the Capacity Summary – Ports panel, the Devices Present table appears displaying the data sets for all devices in the chosen data group. Each table row reflects a data set record obtained from LAN switching devices from a process called polling. The Devices Present table designation is for all devices in the chosen data set–not for all devices in the network.
Performing Actions in Switch Port ManagementAll tables in the Switch Port Management console provide an Actions column on the far left. This column is populated with a gear icon, called the Action icon, for each table record.
Clicking the Action icon for any table record in SPM displays a dropdown menu with different options based upon the network entity type listed in the respective tables.
Note
The number of Available ports will always be less than or equal to the number of Free ports. Trunk, routed, and unlicensed ports also are not included in the SPM port counts.

Infoblox NetMRI 7.4.4 Administrator Guide Part 2 Switch Port Manager
Copyright ©2020, Infoblox, Inc. All rights reserved. Page 136
•
•
•
The Devices, Interfaces, and End Hosts data categories provide different Action menus based on the table selection. The following sections describe switch port Actions menu options for each category.
Setting Measurement Time Windows
Switch Port Management (SPM) Date/Period menus enable flexible measurement and reporting for any device, interface or end host. You can effectively go backward in time to view data sets for any device, interface, or end host phenomena.
For any page in SPM, clicking the icon on the top left of the table displays the Select Date/Period menu. The Select Date/Period menu fixes the current SPM page to a specific date or range of dates, going backward from the current date, using a drop-down calendar.
Calendar dates shown in green represent an immediately available data set to display in a Switch Port Management table. The most current data in any SPM table (such as the most recent 7 days for the Daily selection) is always available by default and appears highlighted in green. Older data requires the user to wait while NetMRI generates the requested data as a background task. After generation, the requested date appears in green, indicating the data is instantly available by reloading the page. Any date in the past or in the future appearing in grey that cannot be selected represents information that is unavailable to the current NetMRI system.
Consider the Device category, with the default time measurement set to Daily.
As an example, you decide to look at the list of network switches that have changed in their status or their configuration over the previous 30 days from the current date. Choose Devices –> Changed Devices, click the Select Date/Periodicon, and choose the time period (Daily, Weekly, Monthly, 7-Day, or 30-Day). The time window shown in the currently selected page changes to the new value, and the current page changes in a number of ways:
The Capacity Summary – Ports pane adjusts to reflect the different data sample, and the Total Ports, Free Ports, and other counters may change to reflect new values.The chosen time window applies to any further selected pages in Switch Port Management until you change the settings again for the same page or for a different page.The chosen time window also applies to any other tables and information charts under Network Explorer, Network Analysis, or the Dashboard until you change the value chosen under the Select Date/Period.
You can shift time windows across the calendar. Select a date three weeks previous to the current. Then, choose Period–> 7-Day. The current table redraws to show the currently selected data set. Then, use the Select Date/Period menu to select day three months in the past. The 7-day time window shifts to the new position, with the selected date as the last day in the time window.

Infoblox NetMRI 7.4.4 Administrator Guide Part 2 Switch Port Manager
Copyright ©2020, Infoblox, Inc. All rights reserved. Page 137
••
Understanding SPM Polling
Network device polling is the key mechanism for building Switch Port Management (SPM)'s switching information, and the polling features provide considerable flexibility. You use polling at the Device Group level to check for changes to any active device in that group. You can define polling time periods for individual device groups so that administrators have near-real-time capabilities for monitoring large-scale switched networks, or specific parts thereof, and quickly detect and address problems.
In all cases, a polling schedule indicates the start of a polling cycle. Any given network device may not be polled at the specific time when the scheduled polling cycle begins. This is particularly likely when many devices are being polled during the cycle. The duration of a polling cycle may take some time.
NetMRI provides several polling and discovery optimizations under Advanced Settings. For more information, see Changing Advanced SPM Settings for details.
Device Group PollingYou can find the default global switch port management polling settings for all device groups (Basic and Extended) under the Settings icon –> Setup –> Collection and Groups –> Global tab.
You can also apply specific switch port management polling settings to the Extended device groups. These settings, located under the Settings icon –> Setup –> Collection and Groups –> Groups tab, take precedence over the settings defined in the Global tab.
Network polling automatically takes place every 60 minutes. You can lower this setting to a minimum value of 30 minutes.
Periodic Polling
By default, Switch Port Management polls all known Ethernet switching devices every 60 minutes. This feature is called periodic polling. Polling performance relies on many factors, including the size of the network, link speeds, the number of ports in the switched networks, and other factors. If the appliance cannot complete polling within the specified time period, NetMRI performs the following:
Logs a warning that it has not completed polling within the specified period.Completes the polling in progress and logs how long it took to finish.
Periodic polling settings can be adjusted globally and within each device group. Periodic polling provides for the following rates: 30/45/60/90 minutes, then every hour up to and including 24 hours.
NetMRI always logs the elapsed polling time period for any network device regardless of the installed license for the current instance.
Note
Switch Port Management (and its polling functions) operates only with devices detected as Switches or Switch-Routers in NetMRI. For more information, see Performing On-Demand Switch Port Polling.
Note
The Settings icon –> Setup –> Collection and Groups –> Global tab provides the appliance-wide settings for polling all Switch and Switch-Router devices in the network.
Note
Periodic polling executes at a minimum time period of 30 minutes between polling cycles.

Infoblox NetMRI 7.4.4 Administrator Guide Part 2 Switch Port Manager
Copyright ©2020, Infoblox, Inc. All rights reserved. Page 138
•
•
Scheduled PollingUse scheduled polling in place of periodic polling. You define specific days and times for the polling schedule. Device groups also can support multiple polling schedules.
You may exclude device groups from Switch Port Management. The switches within the chosen group will not appear in the Devices page, and their switch ports will not count against the SPM interface license count, or in the Capacity Summary – Ports pane. Switch Port Management will not poll excluded device groups.
Device polling combines with NetMRI's configuration management features (the ability, for example, to quickly pull up and edit a given LAN or distribution switch's configuration files) to provide a workflow to quickly respond to issues in the switched network.
Multiple polling schedules can be applied per device group. For example, a user can schedule polling to run every Sunday at 3AM and 6PM.
Understanding Performance Information GatheringInfoblox recommends regular collection of interface performance statistics for Switch Port Management-managed systems, differing from the irregular or lengthy time periods used by the automatic collection of switch-forwarding data in the full NetMRI configuration. For information on switched interface management, see Managing Interfaces Through Switch Port Management.
Performance polling can be executed immediately, on demand, with limitations. If someone manually attempts to poll a device group when another poll of the entire network is already running, NetMRI notifies the user that another polling session is already in progress and will not execute the manual request until the current session completes.
Infoblox advises regular performance polling because interface-level performance statistics are provided to the appliance as counter values. NetMRI tracks differences in performance counter values from poll to poll and uses the deltas to calculate the true interface performance statistics over that time period. A regular time period provides greater granularity to the performance data and minimizes the changes of counter roll-overs.
For switch port management, interface performance statistics collection applies only to ports in Switch and Switch-Routerdevices.
Performing On-Demand Switch Port PollingSwitch Port Management (SPM) allows on-demand polling for device groups and for the entire managed network. A key use case is to check for changes to switches or switch ports in the network. In most cases, polling globally across the entire network should be discouraged in favor of polling across a single device group. When a polling session takes place, NetMRI commits a record of each polled network entity to the Device History, to the Interface History in the Interface Viewer, and to the Device History of any end devices involved in the group poll.
On-demand polling of switching devices can be executed for the entire switched network or by smaller Device Groups. See the following:
On the global level, begin polling all switches in the network by choosing Settings –> Setup –> Collection and Groups –> Switch Port Management side tab and then click Poll Now. Note that no other polling operations are allowed by NetMRI when this process is being carried out.At the device group level, initiate polling for a subset of devices in the managed network by going to the Settings icon –> Setup –> Collection and Groups –> Groups tab, select a group, click Edit in the table row, choose the Switch Port Management tab, and then click Poll Now.
The Device History and Interface History record all polling events for the chosen entities.
Note
Different data collection methods cannot collect polled information from a device at the same time.

Infoblox NetMRI 7.4.4 Administrator Guide Part 2 Switch Port Manager
Copyright ©2020, Infoblox, Inc. All rights reserved. Page 139
1.2.3.
4.
5.
6.
7.
•
•
•
•
NetMRI users can view interface performance statistics In the Switch Port Management page view after the appliance collects all switch forwarding data.
Filtering Switch Port InformationDevice, Interface and End Host tables can contain huge numbers of records and can be overwhelming to search through. Switch Port Management provides filtering to efficiently cope with the array of data. Using the Filters capability, you can select any data field type displayed in any table, specify a threshold value, and search out the required data. Using this method, you can use any relevant, common-sense networking criteria to single out subsets of records.
Display the Switch Port Management table you wish to filter. For example, choose Devices Present.Click Filters just above the top of the table.In the Select a New Field drop-down list, choose the table field by which to filter. For example, in a long device list, you might choose Avail Ports %.Choose an Operator. For example, you might want to check for all switches that have 20% or less of their ports available. In this case, the <= operator is appropriate.In the Value field of the Filters dialog, enter the numeric value. This is the numeric threshold by which the data is filtered. The result is a filter by which all records with a count of less than 20% will not appear in the filtered table.Click Apply to test the filter. The table will refresh in the background. If you wind up with results you do not expect, check your use of the correct operator or change the numeric threshold.The Capacity Summary – Ports page also redraws to show the matching counts for the filter.Click the trashcan (Delete) icon for the filter row to delete a filter. Of course, you can apply more than one filter at a time to the table.
Filter criteria change according to the chosen table information. Devices, Interfaces, and End Hosts all present a different set of table fields by which you can filter their respective bodies of information.
Device Actions in Switch Port ManagementIn Switch Port Management (SPM), devices denote network switches and switch-routers only. End hosts are counted as a separate category. The Devices pages provide the views of all the distribution and LAN switches and switch-routers in the managed network.
The Action column on the far left of any Device-related table (such as Devices Present), provides the following functions for switching device management from the NetMRI console:
View Device History: Choosing this option displays the Device Viewer in a separate browser window. The device window automatically displays the Device History, with the most recent History record at the top. In the Device History view, the First Seen time stamp is the first time the device's MAC address was discovered.The Last Seen timestamp represents the most recent time that NetMRI communicated with the device (often the most recent polling event). The device Name is the configured name of the switching device. The device's IP address is also shown, along with the DNS Name if any. A standard Description (taken directly from the device) is given along with the Poll Duration. If the Poll Duration shows a value of "1" the polling process completed in the normal time period.
Open Telnet Session: Uses the Telnet/SSH proxy built-in to NetMRI to start a Telnet session with the selected device.Open SSH Session: Uses the Telnet/SSH proxy built-in to NetMRI to start an SSH session with the selected device.
Note
SPM tracks MAC addresses and their associated IP and switch port history. SPM separately maintains an active record of all MACs ever seen by the NetMRI system, along with their associated connectivity information.
Unique identities for all detected End Hosts are established by their respective MAC addresses.

Infoblox NetMRI 7.4.4 Administrator Guide Part 2 Switch Port Manager
Copyright ©2020, Infoblox, Inc. All rights reserved. Page 140
•
•
•
•
•
•
•••
•••
•
•
•
•
••••••
Topology Viewer: Through a second-level dropdown menu, gives quick access to Layer 2 and Layer 3 views of the network topology surrounding the chosen device. If the selected device is classified as a Switch, only the L2nHop and L2/L3PathViewer topology views are available.
L2 nHop: Shows the devices that can be reached from a starting device through a given number of Level 2 (actually a hybrid of L1 and L2) connections.L3 nHop: Shows devices that can be reached from a starting device through a given number of routed Level 3 connections.L3 Path Viewer: Shows the most likely path traffic would take, ignoring Layer 2 connectivity and concentrating on L3 reachability and the "best" path for communication between Layer 3 devices.L2/L3 Path Viewer: Shows the most likely path traffic would take between two devices, including both Layer 2 and Layer 3 connectivity.
For more information, see Using the Topology Viewer.
Viewing All Devices in the Switched NetworkThe Devices Present link (Network Explorer –> Switch Port Management –> Devices –> Devices Present) is the top-level view in Switch Port Management. It provides the complete list of switches and switch routers that are being managed by NetMRI. The Capacity Summary– Ports pane appears at the top of the table, showing the network totals for Free Ports and Available Ports.
The Devices Present table breaks down this information into each switch's share of network capacity as follows:
Action icon: Provides the Action menu with View Device History, Open Telnet Session, Open SSH Session, and Topology Viewer options.Device Name: The configured name of the device.IP Address: The host IP address of the network device (live link to the Device Viewer).Total Ports: The number of switched Ethernet ports, in the selected Device Group, that are being managed by Switch Port Management (if All Devices is chosen, this counter represents all LAN switching ports).Used Trunks: The number of trunk ports used in the switched Ethernet ports.Used Access: The number of access ports used in the switched Ethernet ports.Free Ports: The count of free ports which are available for use and also contains most recently used ports (hyperlink to Ports Present page).Available Ports: The count of ports that remained unused for more than the prescribed time period. The port is available, it can be deemed available for other network resources (hyperlink to Ports Present page).Available Ports %: The percentage of all managed switch ports appearing as Available (hyperlink to Ports Presentpage).PoE Ports: Count of Cisco switched Ethernet ports running the Power over Ethernet switching protocol for IP telephony applications.
Data columns related to interfaces on each device (Free Ports, Available Ports, Available Ports %) provide hyperlinks to the Ports Present table. You can immediately see the operating status and admin status of every port that appears as Free in a given switch.
Viewing Device Vendor Model InformationThe Device/Vendor Model page displays a different subset of Switch Port Management data, focusing on equipment vendor, product model, device serial number, and other information as follows:
Action icon: Provides the Action menu with View Device History, Open Telnet Session, Open SSH Session, and Topology Viewer options.Device Name: The configured name of the device.IP Address: The host IP address of the network device (live link to the Device Viewer).Vendor: The equipment manufacturer.Model: The vendor model number of each device in the network.Serial Number: The manufacturer serial number for each device.Description: The device description is typically burned into the software ROM of each device.

Infoblox NetMRI 7.4.4 Administrator Guide Part 2 Switch Port Manager
Copyright ©2020, Infoblox, Inc. All rights reserved. Page 141
•
•
•
•
••
•••
•
••
•
••••
•
Last Seen: The timestamp of the last successful poll of the device, or the last time the device was seen on the network by other means such as through a device's ARP table. You can also choose to display the First Seendata column, which is the timestamp of the moment when the device was first detected by the appliance.Last Changed: The timestamp when the last changes were performed on the device. Clicking on the IP address hyperlink for any device in the table displays the Device Viewer.
Viewing the List of Newly Discovered DevicesThe New Devices table lists the subset of switching network devices that have been discovered by NetMRI during the displayed measurement period. By default, the table is sorted in ascending order by the Device Name. These devices are not yet considered to be actively managed by NetMRI.
The default data set includes the following:
Action icon: Provides the Action menu with View Device History, Open Telnet Session, Open SSH Session, and Topology Viewer options.Device Name: The configured name of the device. By default, this column sorts the New Devices page in ascending order.IP Address: The host IP address of the network device (live link to the Device Viewer).Total Ports: The number of switched Ethernet ports for each device most recently discovered by NetMRI and cataloged in Switch Port Management.Used Trunks: The number of trunk ports used in the switched Ethernet ports.Used Access: The number of access ports used in the switched Ethernet ports.Free Ports: The count of ports most recently polled that show a link state of Down when the device was discovered, having previously lost connectivity.Available Ports: The count of ports that remained in a link state of Down for more than the prescribed time period; when a port is considered Available, it can be deemed available for other network resources.Available Ports %: The percentage of all managed switch ports appearing as Available.PoE Ports: Count of Cisco switched Ethernet ports running the Power over Ethernet switching protocol for IP telephony applications.
Devices are removed from New Devices and join Devices Present at the conclusion of the next polling process.
Viewing the List of Changed DevicesThe Changed Devices page lists any network devices that have changed in some fashion within the most recent polling time period. All newly discovered devices appear in this table. Devices may move from one VLAN to another VLAN and also appear here. If a device is previously administratively Up but is taken down for any reason, it also appears here. The devices listed here represent a smaller subset of the total of network devices, and the Capacity Summary – Ports panel changes values to match.
Default data sets shown in the table include the following:
Action icon: Provides the Action menu with View Device History, Open Telnet Session, Open SSH Session, and Topology Viewer options.Device Name: The configured name of the network device.IP Address: The host IP address of the network device (live link to the Device Viewer).DNS Name: The DNS-resolved host name, if any, of the network device.Last Seen: The timestamp of the last time the device was detected or seen on the network by any means, such as through a device's ARP table.Last Changed: The timestamp of the last change performed on the device. This column is the default sorting for the Changed Devices table, listing in descending order from the most recent to least recent.
Clicking on the IP address hyperlink for any device in the table displays the Device Viewer.

Infoblox NetMRI 7.4.4 Administrator Guide Part 2 Switch Port Manager
Copyright ©2020, Infoblox, Inc. All rights reserved. Page 142
•
•
•
••
•
•
••
Viewing the List of Unreachable DevicesThe Devices Not Present page lists the subset of active switch and switch-router devices, excluding end hosts, with which Switch Port Management has lost communication over the last measurement time period. The device is off the network for some reason, such as having been turned off or rebooted or having settings changed so that it is out of Discovery range.
The default Devices Not Present page consists of the following data set:
Action icon: Provides the Action menu with View Device History, Open Telnet Session, Open SSH Session, and Topology Viewer options.Device Name: The configured name of the device. By default, this column sorts the Devices Not Present page in ascending order.IP Address: The host IP address of the network device. This is a live link to the Device Viewer, which automatically displays the Issues page.DNS Name: The DNS-resolved host name, if any, of the network device.Last Seen: The timestamp of the last successful poll of the device, or the last time the device was seen on the network by other means such as through a device's ARP table.Last Changed: The timestamp of the last change performed on the device.
A second page under End Hosts, End Hosts Not Present, lists any end host devices that have lost communication with the network.
Managing Interfaces Through Switch Port ManagementThe Actions column of any Interface-related table (Ports Present, Link Changes, and Hub Locator) provides a View Interface History function for LAN interface management from the Interface Viewer.
All ports that appear in tables described in this section are a subset of all ports discovered and managed by NetMRI. Interface tables outside of the Switch Port Management feature set will include such items as trunk ports and routed ports from routers and switch routers as cataloged and described by NetMRI.
View Interface History displays the Interface Viewer in a separate browser window, which automatically displays the History page, with the most recent records at the top.
In the interface history, the First Seen and Last Seen timestamps indicate the first occasion when the network switch was polled by Switch Port Management, and the last occasion when the device was polled or otherwise detected on the network.
The history also shows the Device Name, along with the Interface identifier and a brief description, its MAC address, operating and administrative status, the Line Speed, and Duplex settings if known and supported.
Several SPM port control settings are also available from the Actions menu. Choosing a menu option displays a dialog for the port configuration change. You can configure the following:
Set Admin Status: Set the port to administratively Up or administratively Down. The NetMRI Sandbox with the built-in Port Activation Perl script is required for this operation. See "Using the NetMRI Sandbox" in Job Scriptingfor more information. Edit Description: A text label describing the port in the If Description column.Edit VLAN Membership: This allows you to assign data and voice VLANs to an interface in order to separate data and voice traffic. You can assign VLANs of one type or both types, or disable any VLAN assignments.
To assign a VLAN, select the VLAN ID and name, and click Save. The assigned VLANs are added to the table. To
Note
SPM port counts in interface tables include only access ports. Trunk ports and routed ports are not counted against access interface counts or against the NetMRI license. Routed ports on switch-router devices will not appear in any Switch Port Management interface counts.

Infoblox NetMRI 7.4.4 Administrator Guide Part 2 Switch Port Manager
Copyright ©2020, Infoblox, Inc. All rights reserved. Page 143
•
•••••
•
•••
••
disable existing VLAN assignments, select No Data VLAN or No Voice VLAN, and click Save. All VLANs of the corresponding type are removed from the table.
You can trace the path of an L3 switched VLAN using the Topology Viewer. For more information, see VLAN Tracing.
For more information, see Using the Interface Viewer.
Viewing Interface StatusThe Ports Present table provides the list of switched access interfaces for the entire network, the aggregate interface list for any chosen device group and the list of interfaces for any chosen LAN switch or distribution switch.
The Ports Present table data defaults include the following:
Action icon: Provides the Action menu with View Interface History, Set Admin Status, Edit Description, and EditVLAN Membership options.Device Name: The Ethernet switching device to which the interface is associated (live link to the Device Viewer).Interface: The switched port identifier (live link to the Interface Viewer, displays the History of the port).VRF Name: The name of the VRF instance.Interface Description: Functional description of the LAN switched port type.Interface Type: The standard interface type supported by the port. For switched Ethernet, this value will typically be ethernet-csmacd.Interface MAC: The 48-bit hardware address for each port in the Link Changes list (live link to the Interface Viewer, displays the history of the port).Trunk Status: The switched interface's trunk status.If Oper Status: The switched interface's operating status.If Admin Status: The switched interface's Admin status (whether the port is administratively enabled by the operator).Speed: The line speed of each listed interface.#End Hosts: The number of detected End Hosts bound to each listed interface, if any (live link to the End HostsPresent page).
Pay special attention to the # End Hosts column. As with any data column, you can sort by this value, upwards or downwards. Choosing Sort Descending brings all switch interfaces with connected hosts to the top of the table, with the interfaces having the highest number of connected hosts at the top. For any switched interface, clicking the numeric hyperlink in the # End Hosts column will close the Ports Present table and display the End Hosts Present table listing only the end hosts associated with the specific interface. You can readily identify each connected host by their respective host names, host IP address, VLAN name, and other information.
Note
As NetMRI does not retrieve the VLAN type information from your devices and, therefore, does not display it the Edit Interface VLAN Membership dialog, you may want to use meaningful names for VLANs to distinguish between data and voice types.
Note
If the operating status of an interface is shown as “down” in the If Oper Status column, the VLAN information for this interface may be incomplete.
Note
Sort the Ports Present table by the # End Hosts column to more easily show the switch ports with the highest number of connected hosts.

Infoblox NetMRI 7.4.4 Administrator Guide Part 2 Switch Port Manager
Copyright ©2020, Infoblox, Inc. All rights reserved. Page 144
•
•
••
•
••
•••
•
•
••
•
•••
••
Viewing the List of Links that Change StateThe Link Changes page provides a list of interfaces that have most recently changed state. Data column defaults include the following (you may need to scroll across to see all data samples):
Action icon: Provides the Action menu with View Device History, Set Admin Status, Edit Description, and Topology Viewer options.Device Name: The Ethernet switching device to which the interface is associated (live link to the Device Viewer). The Link Changes table is sorted by this column in ascending order.Interface: The switched port identifier (live link to the Interface Viewer, displays the History of the port).Interface Type: The standard interface type supported by the port. For switched Ethernet, this value will typically be ethernet-csmacd.Interface MAC: The 48-bit hardware address for each port in the Link Changes list (live link to the Interface Viewer, displays the History of the port).If Oper Status: The switched interface's operating status.If Admin Status: The switched interface's Admin status (whether the port is administratively enabled by the operator).Line Speed: The line speed of each listed interface.First Seen: The timestamp indicating when Switch Port Management first polled the device.Last Seen: The timestamp indicating the last occasion when Switch Port Management detected the device in another device's ARP table, or otherwise saw the device on the network.
Viewing the Hub LocatorThe Hub Locator table lists all switched interfaces in the network that operate as Smart Hubs, with more than one end host connected to the switch port. Consider the table in Switch Port Management, with its sortable # End Hosts column. When you perform the sort, all interfaces that show a count of more than one connected host in the # End Hosts column will appear at the top. These interfaces with their higher End Host counts will also be separated into the Hub Locatortable.
Action icon: Provides the Action menu with View Device History, Set Admin Status, Edit Description, and Topology Viewer options.Device Name: The Ethernet switching device to which the interface is associated (live link to the Device Viewer, displaying the Issues page).Interface: The switched port identifier (live link to the Interface Viewer, displays the History of the port).Interface Type: The standard interface type supported by the port. For switched Ethernet, this value will typically be ethernet-csmacd.Interface MAC: The 48-bit hardware address for each port in the Link Changes list (live link to the Interface Viewer, displays the History of the port).If Oper Status: The switched interface's operating status.If Admin Status: The switch port's Admin status (if the port is administratively enabled by the operator).# End Hosts: The number of detected End Hosts bound to the hub interface (live link to the End Hosts Presentpage). The Hub Locator table is sorted in descending order by this column.First Seen: The timestamp indicating when Switch Port Management first polled the device.Last Seen: The timestamp indicating the last occasion when Switch Port Management detected the device on the network.
Note
In many cases, the collection of end hosts for each located hub are clients bound to a VLAN.

Infoblox NetMRI 7.4.4 Administrator Guide Part 2 Switch Port Manager
Copyright ©2020, Infoblox, Inc. All rights reserved. Page 145
•
•
•
••
•
••••
••••
Tracking and Managing End HostsIn the Switch Port Management page, the End Devices category displays all end host devices associated with LAN switches in the selected device group, and filters them into several functional categories.
Performing End Host ActionsThe Action column on the far left of any Interface-related table (Interfaces Present, Link Changes, and Hub Locator) provides the following functions for end host device management from the NetMRI console.
End Host History: Displays the Device History page of the Device Viewer. For an end host, meaningful values include the Host IP Address, the switch or switch-router Device Name, the interface the host is bound to (Interface), and the VLAN Name to which the host is also bound.Interface History: Displays the Interface Viewer in a separate browser window, which automatically displays the History page, with the most recent records at the top.Device History: Provides the recent connectivity history for the current end host. In this context, the Device Viewer treats end hosts, such as VMs, servers, or host PCs, generically.You can set the Admin Status (Set Admin Status) for the selected switch interface.You can edit the description that appears in the interface table for the selected interface (Edit Description), and change its VLAN assignment (Edit VLAN Membership).
For more information, see Using the Interface Viewer.
Viewing All Current End HostsThe End Hosts Present table provides a complete list of all end host devices detected and successfully probed by the NetMRI appliance. You can begin by choosing Actions from the icon on the left of each table record. Other data displayed include the following:
Action icon: Provides the Action menu with End Host History, Interface History, and Device History options, changing the Admin Status for an end host interface, and editing the description and VLAN assignment.Host IP address: Provides a live link to the Device Viewer.Host Name: DNS host name (if any), provides live link to the Device Viewer.Host MAC: 48-bit hardware address of the host system.Last Seen: The timestamp of the last successful detection of the end host connected to the given switch interface. You can also choose to display the First Seen data column, which is the timestamp of the moment when the end host was first detected as a host connected to its current LAN switch interface.Device Name: The LAN switching device to which the host is currently associated (live link to the Device Viewer).Interface: The LAN switched interface to which the end host connects (live link to the Interface Viewer).If Oper Status: The LAN switched interface's operating status (live link to the Interface Viewer).VLAN Name: The active VLAN to which the end host is currently bound (live link to the VLAN Viewer).
For more insight into end host history, click the Device History icon at the top of the table for any end host page, and choose Period and a time span: Daily, Weekly, Monthly, 7-Day, or 30-Day. The host history adjusts its data set to reflect the different sampling, and in many cases showing a larger sampling of events in which the device was polled by For more insight into end host history, and changes were detected, such as connectivity, an end host disconnecting, an end host changing to another VLAN, and other events.
Note
To optimally configure Switch Port Management for end host detection, ensure that all end host subnetworks that you want to be managed are included in NetMRI's Discovery IP ranges. The discovered end hosts must also be excluded from the management by NetMRI. This can be done by specifying the IP ranges for the end host network segments in Step 2 of the Setup Wizard or by opening Settings icon –> Setup –> Discovery Settings following initial NetMRI setup. For more information, see the Configuring Discovery Ranges.

Infoblox NetMRI 7.4.4 Administrator Guide Part 2 Switch Port Manager
Copyright ©2020, Infoblox, Inc. All rights reserved. Page 146
••••
••••
End Host Exceptions
Virtual Machines acting as De Facto end hosts in the network, including VMs that directly communicate through a switch port, and VMs communicating through a 'virtual switch,' which in turn communicates through a switch port, will not appear in End Host-related tables and pages. NetMRI will discover such VMs but they are not visible in End Hosts tables. Virtual switches are also not supported by NetMRI. Virtual machine-based hosts appear in the Network Explorer –> Inventorypage under Connected End Hosts, but their entries will not show switching infrastructure.
Viewing the List of Newly Discovered HostsThe New End Hosts page filters the list of Devices Present to show the devices and hosts that were found by NetMRI. By default, it shows the same set of data columns shown by the End Hosts Present table. Many more data fields can be displayed in the table (click the down arrow on the right end of any table column header, choose Columns, and enable check boxes for any new columns to display). For the VLAN ID, select the VLAN data field from the dropdown menu in any column.
Host IP address: Provides a live link to the Device Viewer.Host Name: DNS host name (if any), provides a live link to the Device Viewer.Host MAC: 48-bit hardware address of the end host's Ethernet port.Last Seen: The timestamp of the last successful detection of the end host connected to the given switch interface. You can also choose to display the First Seen data column, which is the timestamp of the moment when the end host was first detected by NetMRI as a host connected to its current LAN switch interface.Device Name: The LAN switching device to which the host is currently associated (live link to the Device Viewer).Interface: The LAN switched interface to which the end host connects (live link to the Interface Viewer).If Oper Status: The LAN switched interface's operating status (live link to the Interface Viewer).VLAN Name: The active VLAN to which the end host is currently bound (live link to the VLAN Viewer).
Viewing the List of Hosts that Change StateThe End Hosts Not Present page lists the end devices or hosts that are discovered to be disconnected or otherwise become unreachable on the network when the last polling took place. By default, it shows the same set of data columns shown by the End Hosts Present table. Many more data fields can be displayed in the table (click the down arrow on the right end of any table column header, choose Columns, and enable check boxes for any new columns to display). For the VLAN ID, select the VLAN data field from the drop-down menu in any column.
Note
In earlier releases, NetMRI did not detect and report neighbor relationships between switch trunk ports and non-trunked downstream switch ports. This could present issues for discovery and inventory of ESXi and Hyper-V VM host servers and any other end host neighbors of trunk ports. In Release 6.9 onwards, when NetMRI detects no switch downstream from those trunk ports, the system correctly reports all end host neighbors of switched trunk ports in Network Explorer End Host and Connected End Host tables, Device Viewer/Interface Viewer neighbor tables, and in the Topology feature.

Infoblox NetMRI 7.4.4 Administrator Guide Part 2 Switch Port Manager
Copyright ©2020, Infoblox, Inc. All rights reserved. Page 147
•
••••
••••
•
••••
••••
Action icon: Provides the Action menu with End Host History, Interface History, and Device History options, changing the Admin Status for an end host interface, and editing the description and VLAN assignment.Host IP address: IP address of the end host, provides a live link to the Device Viewer.Host Name: DNS host name (if any), provides a live link to the Device Viewer.Host MAC: 48-bit hardware address of the end host's Ethernet port.Last Seen: The timestamp of the most recent detection of the end host connected to the given switch interface. You can also choose to display the First Seen data column, which is the timestamp of the moment when the end host was first detected by NetMRI as a host connected to its current LAN switch interface.Device Name: The LAN switching device to which the host is currently associated (live link to the Device Viewer).Interface: The LAN switched interface to which the end host connects (live link to the Interface Viewer).If Oper Status: The LAN switched interface's operating status (live link to the Interface Viewer).VLAN Name: The active VLAN to which the end host is currently bound (live link to the VLAN Viewer).
Viewing and Interpreting VLAN ChangesThe VLAN Changes page lists all devices that switched from one VLAN to a different VLAN during the user-configured time period.
Action icon: provides the Action menu with End Host History, Interface History and Device History options, changing the Admin Status for an end host interface, and editing the description and VLAN assignment.Host IP address: The IP address of the end host, provides live link to the Device Viewer.Host Name: The DNS host name (if any), provides live link to the Device Viewer.Host MAC: 48-bit hardware address of the end host's Ethernet port.Last Seen: The timestamp of the most recent detection of the end host connected to the given VLAN. (You can also choose to display the First Seen data column, which is the timestamp of the moment when the end host was first detected by NetMRI as a host connected to its current LAN switch interface.Device Name: The LAN switching device to which the host is currently associated (live link to the Device Viewer).Interface: The LAN switched interface to which the end host connects (live link to the Interface Viewer).If Oper Status: The LAN switched interface's operating status (live link to the Interface Viewer).VLAN Name: The active VLAN to which the end host is currently bound (live link to the VLAN Viewer).
Using the VLAN ViewerThe VLAN Viewer is a pop-up browser window that provides table rows listing several basic characteristics of a selected virtual LAN interface, including all switches that terminate the VLAN.
Most of the key information about a VLAN appears in the top section of the Viewer, including the Root Bridge, the root bridge priority and ID, and its configured Max Age, Hello Time, and Bridge FWD Delay values.
Important table data columns include the Priority field, the Bridge Address, and a Timers field showing the status of spanning tree timers for VLAN switching.
Note
See Viewing Active VLANs and VLAN Configuration for more details about VLAN settings displayed in the Device Viewer and the VLAN Viewer.

Infoblox NetMRI 7.4.4 Administrator Guide Part 2 Switch Port Manager
Copyright ©2020, Infoblox, Inc. All rights reserved. Page 148
1.2.
3.
4.
5.
6.
Changing Advanced SPM SettingsSwitch Port Management provides for a set period of days after an SPM port is free and unused before it is specifically defined as Available. When a port is first disconnected from all other devices, it is in a Down link state, and appears in the Free category. After a certain time period elapses (the duration of which is based on the business policies of the IT department), the port is counted against the Available category and removed from the Free category, because its link state has been down for longer than the specified time period.
The ARP Cache Refresh Period defines the time period between ARP refreshes by NetMRI across all switch ports. Before any other switchport polling operations take place (including device group or global polling operations initiated by the NetMRI user), another ARP refresh is carried out by the appliance regardless of the time interval. To modify advanced SPM settings, perform the following:
Go to Settings icon –> General Settings –> Advanced Settings.Under the Switch Port Management category –> Free to Available Ports option, click Edit to change the amount of time, in days, a port must remain Free before it becomes administratively Available for new connectivity.Under the Switch Port Management category –> ARP Cache Refresh Period option, click Edit to change the time in seconds between ARP refreshes on switch ports managed by the appliance. The default is 300 seconds, because switch forwarding tables are frequently purged from LAN switching devices. The default on Cisco switches is five minutes/300 seconds. NetMRI primarily uses ARP Cache refreshes to improve the accuracy of end-device discovery. Without this feature, some endpoints may not be discovered and cataloged.The ARP Cache Refresh Ignore Discovery Ranges Advanced Setting helps to optimize the discovery of end hosts by disabling pinging of any devices outside of specified discovery ranges. By default, this feature is set to False, which means that devices outside the configured discovery ranges may be pinged by NetMRI. Set this value to True to restrict pinging to end hosts within defined IP ranges.Switch Port Management can use the ARP Cache Refresh Device History to allow pinging of devices listed in older tables compiled from previous polling days, prior to the most recently compiled End Host data tables. The default value is 14 days and the minimum value is one day.Click OK when finished.
For the Free to Available Ports value, the new setting is reflected as the hyperlink in the Available Ports and Available Ports % counters in the Capacity Summary – Ports panel under Switch Port Management.
Notes on ARP, Switch Data Collection, and End HostsNetMRI uses ARP cache refresh to control LAN switches from which switch-forwarding data is collected.
When ARP cache refresh is enabled for a LAN switch, before further collection of switch-forwarding data, NetMRI pings all known IP addresses known to exist as members of the device's switch-forwarding table, by relating previously gathered switch-forwarding data MAC addresses to determine their IP addresses. Since this requires a prior SPM poll, the first poll of any switch by SPM after the device is added to the license will not perform an ARP cache refresh.
For subsequent polling events, NetMRI performs ARP cache refresh by sending a UDP packet on Port 80 to each IP address in the switch's forwarding table, without waiting for return messages. This has the effect of re-populating the switches' forwarding table. NetMRI sends nothing to the switches themselves, the refresh is performed against all the end hosts and other devices connected to each LAN or distribution switch.
The appliance also tracks the time period required to collect switch-forwarding data and compare the result to the last ARP refresh. Once a timeout period is exceeded, NetMRI will re-perform the refresh on the switch, and repeat as necessary as data is collected from the device.
The appliance automatically performs an ARP cache refresh immediately before a new switch port polling session.
Note
For Switch Port Management, the default transition time between an SPM port's Free status and its change to Available is 14 days.

Infoblox NetMRI 7.4.4 Administrator Guide Part 3 Device and Network Exploration
Copyright ©2020, Infoblox, Inc. All rights reserved. Page 149
•
•
••
•
•
•
•
•
Part 3 Device and Network ExplorationThis section provides information on all NetMRI feature sets for exploring the routed and switched enterprise network, its protocols, and the devices that inhabit that network. The first topic in this section concerns the concept of Issues, which quantify and define problems that arise across the network.
Evaluating Issues in NetMRI
NetMRI's Network Explorer page provides the complete current inventory of devices in the managed network. It allows you to summarize and also view details of all routes, subnetworks, VLANs, and other global elements of the network. Also, the Discovery status of all devices, and the ability to view and drill down through the network topology.
Introducing Network Explorer
Interacting with devices and groups of similar devices, along with interfaces and groups of similar interface types, are among the key explorations, troubleshooting and inspection features on NetMRI. The Interface Viewer and the Device Viewer are two key features for breaking out and inspecting any single network connection or network device.
Devices and InterfacesInspecting Devices in the Network
Network Analysis is the gateway to key features such as the current list of issues, the system Dashboard, viewing performance characteristics in the network, down to the Device level, viewing change histories, and creating compliance policies. The focus here is on performance monitoring and change monitoring.
Issues, Changes, and Network Analysis
Evaluating Issues in NetMRINetMRI uses the concept of Issues to quantify and report problems and events across the network.
The main Network Analysis –> Issues page provides both the Network Scorecard and the Select Device Groups right pane. To quickly narrow down possible sources of the largest numbers of Issues, simply click a device group in the page. The Scorecard and the Issues table refresh to show only the Issues contents for the chosen device group. As an example, one device group, such as Network Management, might have an Overall Score of 10.0, indicating no problems, while the Routing device group might have an Overall Score of 8.8, indicating a substantial number of Issues in that layer of the network.
The system classifies Issues in three severity levels, along with a fourth scripting-related classification as follows:
Errors: These are important issues that may affect the smooth operation of the network. Generally, such Issues are clear signs that something is wrong.Warnings: These are intermediate level problems that should be addressed after the errors have been corrected. A warning may not be a real problem, depending on the design and operation of the network.Info: These issues are provided for information, and typically alert you to minor things that may or may not indicate a problem.CCS: These issues are directly related to the execution of a CCS script. CCS uses the Issues page for notification after a script executes. An example is Invalid User Account, which lists the non-Admin user accounts for a selected device or device group.
Issues are so important in NetMRI that a specific administrator user account is defined to manage them. For more information, see Understanding Users and Roles.
Note
The Select Device Group pane on the Network Analysis tab displays only extended device groups, i.e. groups that allow for calculations.

Infoblox NetMRI 7.4.4 Administrator Guide Part 3 Device and Network Exploration
Copyright ©2020, Infoblox, Inc. All rights reserved. Page 150
The Issues pages are probably the most frequently used of all NetMRI features, designed to quickly and conveniently monitor the overall health of the network. In the Network Analysis –> Issues tab, the Network Scorecard shows the results of the daily analysis process and all issues generated for the latest time period. You can also filter issues.
NetMRI performs analysis of collected data during specified periods or in real-time. For issues processed during an analysis period, the system analyzes all network data collected since the last analysis process, looking for anything that might indicate an issue. For real-time analysis, NetMRI checks for issues while it collects data from the device. If an issue is found, it is raised immediately. As a result of analysis activity, NetMRI generates a collection of issues that summarize the type of problem discovered and all the devices or interfaces associated with that issue. Issues are automatically closed every night just before the new analysis processing is performed. If the same problem persists, NetMRI generates a new issue.
Also see Issues, Changes, and Network Analysis.
Issues and the Network Scorecard
The Network Scorecard (Network Analysis tab –> Issuestab) provides a high-level performance metric for the managed network. NetMRI measures the network's daily stability and correctness and calculates the normalized Scorecard value based on a statistical analysis of all issues discovered for that day. Counts of the three primary Issue types (Info, Warning, and Error) also are shown.
The Network Scorecard shows the scorecard value for the current day and a two-color graph showing the stability and correctness values over the selected time period, which by default is the last day's measurement.
Stability and correctness values are two data sets that cumulatively add up to the Overall Score in the Scorecard. Each data set has a maximum value of 5.0.
Stability issues are caused by events such as excessive spanning tree topology changes, unstable links, congestion, and excessive CPU/memory utilization. Correctness issues are derived from configuration or design errors such as duplicate VLAN ID/name pairs or inconsistent routing protocol timers. Stability and correctness are measured across a variety of functional areas of the network.
Note
NetMRI evaluates over 250 discrete Issues, plus custom Issues defined by the admin user. You can find a description of all Issues supported by NetMRI by opening the Comprehensive Issue List under Additional Documentation in online Help. Issues are listed alphabetically.
Note
The Network Scorecard appears in both the Dashboard and in the Network Analysis –> Issues page.

Infoblox NetMRI 7.4.4 Administrator Guide Part 3 Device and Network Exploration
Copyright ©2020, Infoblox, Inc. All rights reserved. Page 151
•••
•
The Network Scorecard table shows correctness and stability values by component area (hover over an indicator rectangle to see the numerical values). Stability and correctness "penalties" associated with each issue depend on the type and severity of the issue. Stability and correctness penalties for all components of the network combine to create the overall Network Scorecard value, expressed as the Overall Score in the upper right corner of the Scorecard.
The value in the Network Scorecard indicates trends, for the entire network, for a selected device group or for one of nine distinct Issue types. To make historical comparisons, the scorecard value is plotted in the Scorecard History chart. The scorecard value varies somewhat from day to day, but the desired trend over time should be rising, not falling. After two or three weeks of operation, the variability of the scorecard value should become evident.
Viewing the Issue List
The Issues page provides several different views based on the type of data you wish to view. Click the down-arrow menu for Issues and select from Issues by Type with Scorecard, Issues by Type, Issues by Device with Historic Chart, or Issues by Device. The Issues by Type page displays the currently active Issues list in a table sorted by priority — Errors, Warnings, and then Info. Issues by Device is helpful when you want to isolate issues appearing on a specific device.
The Issues by Device with Historic Chart view provides an adjustable view of Issue trends for any selected device group. The time period resides on the horizontal X-axis, and the measurement, in the number of issues, is on the vertical Y-axis. Click the Time Selector drop-down menu to change the X-axis time period for the Historic chart.
The Historic chart displays up to four data sets as follows:
Adds: Indicates the quantity of new Issues for each time period.Same: indicates Issues the time period that remains from the preceding time period.Cleared: Indicates Issues that have been cleared from the system due to administrative remediation or other causes.Suppressed: Shows the relative quantity of Issues that have been suppressed due to admin configuration of Issues that may be deemed to produce excessive notifications in each time period. Issues count for each time an increment appear as stacked bars in the chart. Move the mouse over any colored bar section to view the count for that Issue type.
To see a longer description of any issue, hover over the hyperlink in the Title column. Columns that are displayed by default include the following:
Severity Shows the severity level of the Issue: Error, Warning, or Info.
Last Seen The timestamp of the last occurrence of the Issue.
Title A hotlink showing the title of the Issue, such as Config Difference. Hover the mouse over the Title link for an Issue to see a longer description.
Note
Select a device group in the right panel of the Issues page. The Network Scorecard adjusts to show the score and the Issues for the respective device group.

Infoblox NetMRI 7.4.4 Administrator Guide Part 3 Device and Network Exploration
Copyright ©2020, Infoblox, Inc. All rights reserved. Page 152
••
•
•
Status The current state of the Issue. In most cases, an Issue will appear as Current indicating that the Issue is currently affecting devices in the network.
Component The category to which the Issue belongs. The Network Scorecard also provides a set of nine links (Configuration, Routing, VLANs, Devices, Security, VoIP, Interfaces, Subnets, and Wireless) that allow separating of the Issues list into selected categories.
# Affected To simplify the list, issues that involve more than one device, interface or VLAN are combined into a single issue that lists all the affected network components. The number of network devices affected by a given issue is shown in the # Affected column.
#New The number of new instances for the Issue in the current time period.
#Cleared The number of instances of the Issue type that have been cleared due to remediation or other actions taken in the network.
#Suppressed Instances of the Issue that have been suppressed due to admin configuration. Suppression is often done to prevent excessive numbers of a particular Issue from displaying.
Data columns that can be chosen for the Issues display but that are hidden by default include the following:
No Change The number of devices reporting the Issue that did not undergo a configuration or status change.
Stability The statistical amount by which the number of reported Stability-related Issues of the specific type affects the Overall Score. Values reflected here will be equal to or less than zero.
Correctness The statistical amount by which the number of reported Correctness-related Issues of the specific type affects the overall score. Values reflected here will be equal to or less than zero.
First Seen A timestamp showing when the Issue first appeared in the network.
The data set shown in the Issues page can be filtered in the following ways:
Clicking one of the Component links at the bottom of the Scorecard.Clicking the Filters button at the top right of the Issues list, and choosing the columns and values to match against.Click the Display button and choose one of the drop-down menu options: All, Current, New, Cleared, or Suppressed.Use the Search box at the top left of the Issues table to search for a characteristic phrase or word that appears as part of an issue title.
Other methods for filtering and reorganizing Issues data are discussed in Using the Issue Viewer.
The Device Viewer also provides a substantial Issues page, which reports Issues specifically for a single device. SeeViewing Device Issues, Configurations and Changes for more information.

Infoblox NetMRI 7.4.4 Administrator Guide Part 3 Device and Network Exploration
Copyright ©2020, Infoblox, Inc. All rights reserved. Page 153
•
••
•
••••
Viewing Issue Summaries
The Issues page (Network Analysis tab –> Performance tab –> History section –> Issues) summarizes the number and severity of issues, and shows historical trends over the last 30 days. The Issue Summary panel shows the total count of Error, Warning, and Info issues for the current day, and the change in counts from the previous day. The Issue Diff Summary panel breaks down issues by change type (adds, same, drops). Generally, most networks will have at least a couple of issues generated each day.
Issue Summary: The table lists the total number of issues by severity for the reporting period, and differences from the previous reporting period.Issue History: The chart shows the number of issues for the 30 days before the selected date.Issue Diff Summary: The table shows the number of differences by difference type for the reporting period, and the difference from the previous reporting period.Issue Diff History: The chart shows the number of differences for the 30 days before the selected date.
Click the export CSV icon at the top left of the Issues table to open the current Issues list in a spreadsheet-formatted file.
Viewing Details of an IssueView an issue's details by clicking the issue title hyperlink. The Issues Viewer opens in a separate browser window, which lists the network components affected by the issue along with any relevant details. Many Issue details appear in this window that does not appear in the main Issue table or in summaries. You use the Issue Viewer toolbar to suppress or unsuppress an Issue, schedule a job to address an Issue type, send an email summary, and other operations.
Click a component's IP address hyperlink to open the corresponding Device Viewer for that network component.
The Issue Viewer provides a History chart for the specific issue instance, indicating the number of components affected by the issue over the past 30 days. The chart measurement timeline can be adjusted to the standard Daily, Weekly, Monthly, 7-Day, and 30-Day increments. Click the Time Selector drop-down menu to change the X-axis time period for the Issue Viewer. Similar Issue information is also found for individual devices, under Device Viewer –> Network Analysis–> Issues. The History chart is useful for determining how often this issue occurs and how much of the network is affected.
Issue details include how the issue has changed since the last run, as follows:
Adds: New instances of the issue, discovered by NetMRI.Same: Instances still present since the last NetMRI polling cycle.Drops: Instances no longer present, determined as such during the last NetMRI polling cycle.Suppressed: Instances that are suppressed, presumably to prevent excessive Issue notifications from display in the user interface.
For more instructions on working in this window, see Using the Issue Viewer.
Note
In the main Issues page (Network Analysis –> Issues), click the Issue link in the Title column. The Issue Viewer appears in a separate browser window. Consider that the data fields displayed for the Issue Viewer will provide more detail for an individual Issue then the main page.

Infoblox NetMRI 7.4.4 Administrator Guide Part 3 Device and Network Exploration
Copyright ©2020, Infoblox, Inc. All rights reserved. Page 154
••
•
Defining Issue ThresholdsYou can control the thresholds NetMRI uses on certain device and interface related issues. Through the use of Device Groups and Interface Groups, you can modify the thresholds for any one of these issues to control when the issue is raised. This capability means that the same issue can be raised for different devices, but each device can have a different threshold for the issue.
Set thresholds using the Criteria property available in the Settings icon –> Issue Analysis –> Issue Group Settings –> Device Groups side tab and Interface Groups side tab.Click the Comprehensive Issue List under Additional Documentation in Online Help for more detailed Issue listings to assist in decisions on which issues to isolate to specific device groups or interface groups.
Managing Issue NotificationsIssues generated by NetMRI are strong indicators of potentially serious problems with the network. As such, you may want to be informed whenever certain issues are generated. The Issue Notification feature is provided for such purposes, allowing you to request one or more notifications to be sent via various protocols to various destinations. All notification messages can be fully customized and multiple delivery protocols are supported.
Issue notifications are listed and created, in the Settings icon –> Notifications section –> Subscriptions page. Notifications can be sent in one of three ways:
E-mail: E-mail notifications can be sent to one or more network personnel.Syslog message: Syslog messages enable integration with other network management tools, and allow NetMRI issues to be logged with other network activities. A syslog notification is a single formatted text line sent to a syslog server using UDP (usually to port 514).SNMP traps: SNMP notifications are sent as SNMP traps, which are fixed formatted SNMP messages defined by a corresponding SNMP MIB. In this case, the MIB defines the format of the notification trap because NetMRI is generating the trap.
The Settings icon –> Notifications section –> Defaults page enables users with appropriate privileges to define the settings used for all new notifications. Generally, the formatting defaults provided by NetMRI are sufficient, but the default servers and destinations are network-specific.
Using the Issue ViewerThe Issue Viewer appears in a new window when you click any issue hyperlink. By default, the Issue Viewer displays all issues of the selected type in a table, that occur across all NetMRI-managed devices. You can also filter the issue instances that appear in this window. Below the table, two important tabs appear.
The History tab provides a chart showing recent activity for the issue. The Issue Viewer is not device-specific: it is Issue-specific, which means that all devices that exhibit the issue may be listed in the Viewer, in the Components Affected by Issue table. The instance shown to the left lists a single device, but this will not be the case for many Issue instances.
Note
Specific Issue types can be set to fire only on specific device groups and on specific interface groups.
Note
A valid SMTP Server name or IP address must be entered before anyone can create an e-mail notification.
Further, the SMTP Server must be configured to accept incoming e-mail messages from NetMRI for them to be relayed to the appropriate destinations.

Infoblox NetMRI 7.4.4 Administrator Guide Part 3 Device and Network Exploration
Copyright ©2020, Infoblox, Inc. All rights reserved. Page 155
••••
1.2.
•
•
•••
1.2.3.4.5.6.7.
8.
Devices are listed by their IP address and device name. The Issue Viewer's Components Affected by Issue table also shows a set of data columns crafted to match data reporting for the specific Issue.
History displays the stacked bar chart showing the following four data sets:
Adds: Shows new instances of the specific Viewer issue.Same: Reflects issue instances still present since their first appearance.Drops: Shows instances no longer present.Suppressed: Shows instances that are suppressed.
The time span for the History chart can be adjusted as for other chart instances.
The Description tab explains the issue. The Description is taken from the Comprehensive Issue List.
To filter issues displayed in the Issue Viewer, go to the In list in the page header, and select the Device Group. All instances of the specific Issue across all related devices in the Group will be listed in the Issue Viewer.
To filter the issue instances table by activity type, complete the following:
Open the Display menu (above the column headers).In the drop-down menu, click the activity type you want to see in the table. Choices include:
All: Displays all instances during the selected time period. For example, if a device goes down, then comes back up, then fails again. All shows both Device Down instances, while Current only shows a single Device Down instance.Current (default): Displays all issue instances open for today, or all issue instances open at the end of a given time period if before today.New: Displays all new instances during the selected time period.Cleared: Displays all instances that have cleared instances during the selected time period.Suppressed: Displays all Issue instances that have been suppressed during the selected time period.
To suppress an issue type for a device, click the check box for that device, and then click Suppress Issues below the table.
To unsuppress an issue type for a device, uncheck the check box for that device, and then click Unsuppress Issuesbelow the table.
To schedule a job (i.e., run a script) for a device, perform the following:
Click the check box for the device.Click Schedule Job below the table. The Edit Job dialog appears.Enter a Job Name.Select a Script Name.Enter a Description (optional).Click Edit Schedule..., then specify the job schedule.To run the job against other devices or device groups, click the Edit Groups/Devices... button, then select other devices and/or device groups.Click Save. The job is listed at Config Management –> Job Management –> Job History tab.
Note
In the following instructions, you can check multiple check boxes to simultaneously perform the action on multiple devices.
Note
Some Issues may be suppressed according to organization policy. For example, NetMRI automatically reports the OSPF Authentication Disabled issue when appropriate. Some organizations may choose not to run authentication on particular dynamic routing protocols such as OSPF. In such cases, issue suppression is warranted. In other cases, you may see frequent warnings for particular events that are deemed trivial, and wish to prevent most instances from appearing. For more information, see Performing Issue Suppression.

Infoblox NetMRI 7.4.4 Administrator Guide Part 3 Device and Network Exploration
Copyright ©2020, Infoblox, Inc. All rights reserved. Page 156
1.2.3.4.
1.2.
3.4.
5.6.
7.
1.2.
To execute a command or commands on a device, perform the following:
Click the check box for the device.Click Execute Command below the table.In the Run Configuration Command Script dialog, enter one or more valid configuration commands.Click OK.
To send a notification about this issue, click the Notifications button.
Creating Custom Issues
Create and manage custom issues from the Config Management tab –> Job Management –> Custom Issues page.
Perl and CCS Scripts can reference custom issues to bring attention to conditions discovered during script processing. Check the Comprehensive Issue List under Additional Documentation in online Help for more detailed Issue listings. It is possible that an Issue already exists for script reporting purposes.
To create a new custom issue, complete the following:
At the top right of the page, click New. The Add Command Script Issue window opens.Enter a unique Issue ID. Spaces are not permitted within this field. Underline characters are permissible. This value appears in the Issue ID column of the Custom Issues table.Enter a Name for the issue.Enter a Description for the issue. This text will appear in a pop-up when the cursor hovers over the issue's name where it appears in a table.Select a Component to which this issue applies.Specify an optional penalty by enabling Correctness and/or Stability. If enabled, this issue is included in analysis calculations for the specified Component.In the Detail Columns field, specify the name(s) and type(s) of columns that will appear in the details table for the issue.
Enter one column name and type per line, delimited by a comma. For example, Host, integer. Do not insert any spacebar characters between the column name and type, or you will receive an invalid type message from NetMRI. Column names are referenced by the script (via the Issue-Details attribute) to specify the information to include in the details table. Valid types are string and integer.
To copy a custom issue, complete the following:
In the Actions column, click the icon and choose Copy from the menu.In the Copy Custom Issue dialog, enter a unique custom ID (spaces not permitted) for the copy, then click OK. To edit a custom issue, go to the Actions column, click the icon and choose Edit from the menu.
To delete a custom issue, go to the Actions column, click the icon and choose Delete from the menu then confirm the deletion.
Note
You can automate the notification process in the Settings icon –> Notifications section –> Subscriptions page.
Note
NetMRI automatically clears all custom Issue instances from the Network Analysis –> Issues page precisely 24 hours after each of the Issues appear, as the result for the executed jobs or scripts run by the administrator. Following the erasure of the Issue instance, the Issue associated with the job will appear again only when the job executes.

Infoblox NetMRI 7.4.4 Administrator Guide Part 3 Device and Network Exploration
Copyright ©2020, Infoblox, Inc. All rights reserved. Page 157
1.2.
••
••
••
Adding a Device Viewer Hyperlink to a Custom IssueIn the Detail Columns field of the Add Command Script Issue dialog (see above), enter IP Address, string.In the Issue-Details section of the CCS script, add "IP Address" $ipaddress (including the quotation marks). The resulting CCS issue contains the IP address with a hyperlink to the Device Viewer.
Creating Custom Issue Help filesCustom issue help files provide NetMRI users with organization-specific information for individual issues. All issue help files associated with an issue are accessed via hyperlinks in the See Also section of the Issues Viewer. Multiple help files can be associated with an issue.
Help files can be stored in any format (for example, .pdf, .doc, .txt, .jpg, etc.) that can be rendered by the web browser. Also, help files can be written in any language supported by NetMRI, enabling the user to view them in the language defined for the console.
Custom Issue Help File StorageIssue help files are stored in the Backup/IssueHelp directory as a collection of subdirectories, with each subdirectory devoted to a single issue. This allows multiple help files to be associated with each issue, and allows help files to be written in multiple languages.
The subdirectory name associated with each issue consists of the issue title with all non-alphanumeric characters removed. For example, the help files associated with the "Cisco Running Config Not Saved" issue would be stored in the CiscoRunningConfigNotSaved subdirectory, while the help associated with the "Bad Telnet / SSH Password" issue would be stored in the BadTelnetSSHPassword subdirectory.
All the help files stored in the subdirectory associated with a given issue are displayed as hyperlinks in the list. Each hyperlink label is derived from the name of the issue help file it references, and includes any spaces and special symbols.
Issue help file names must conform to the Unix file name convention, which does not allow certain characters, notably "/".
Help File Multi-language SupportMultiple languages are supported for Issue help files in the two following ways:
Translation of hyperlink labels based on the current language.Display of help file based on the current language.
This enables help file authors to install different sets of help files for different languages when a system is deployed, while allowing users to choose their preferred language when accessing the system.
By default, the issue help file name is used as the hyperlink label displayed in the Issue Viewer. To display a different hyperlink label, one or more link translation files can be stored in the IssueHelp\LINKS directory. A link translation file maps an issue help file name to a hyperlink label.
Example: Suppose there are two help files associated with the "Cisco Running Config Not Saved" issue:
01Information.txt02SavingConfig.doc
The link translation file for English, en_US.txt, contains these entries:
01Information=Additional Information About Saved Configurations02SavingConfig=Procedure for Saving Cisco Configuration
The link translation file for Traditional Chinese, zh_TW.txt, contains these entries:

Infoblox NetMRI 7.4.4 Administrator Guide Part 3 Device and Network Exploration
Copyright ©2020, Infoblox, Inc. All rights reserved. Page 158
••
1.
2.
•
01Information=02SavingConfig=
In these examples, the file names are pre-pended by an index number, which specifies the order in which the hyperlinks are displayed in the See Also list.
The link translation files define how the issue help file names should be displayed in the hyperlink labels based on the user's current language selection. NetMRI will automatically use the appropriate link translation file if one is defined. If NetMRI doesn't find a link translation file, the issue help file name is shown as the hyperlink label.
Issue help files and the issue link translation files in this example are organized in the following manner: NetMRI uses the contents of the zh_TW directory if that is the language selected by the user. If no subdirectory exists for the current language, then the files in the CiscoRunningConfigNotSaved directory are used.
Installing Custom Issue Help FilesThe InstallHelpFiles command performs a series of checks to ensure that the issue help directory names are properly formatted, that all link translation files are properly formatted and that there is an entry for each issue help file in the corresponding link translation file.
Copy the issue help files into the proper directories in the NetMRI Administrative Shell account. The Administrative account can be accessed using any SSH-based client application, such as WinSSH, WinSCP, PuTTY, etc.Execute the InstallHelpFiles command in the Administrative Shell account. This verifies the correctness of the files, installs them in the NetMRI runtime environment, and restarts the NetMRI server.
After successful installation and server restart, hyperlinks to the help files will automatically appear in all corresponding issue details displays, and the help files are displayed when a user clicks those hyperlinks.
Issue Analysis in NetMRIPages in the Issue Analysis section (Settings icon –> Issue Analysis) enable you to cross-check issues for device groups and interface groups, review issue suppression status, adjust reporting threshold values, and suppress issues that NetMRI can safely ignore.
Issue Group SettingsThe Issue Group Settings page (Settings icon –> Issue Analysis –> Issue Group Settings) shows the relationships between issues, device groups, and interface groups. Group settings for Issue reporting or Issue suppression can be organized in three ways: By Issue, By Device Groups, and/or By Interface Groups. These three groups are represented in the side tabs under Settings icon –> Issue Analysis –> Issue Group Settings.
By Issue: Issue reporting is organized into functional categories such as Configuration, Devices, Routing, and Security. Individual Issues can be singled out within each category in the Group Settings for Issue panel.
Note
Even when displaying in English, you may want to define an English link translation file (en_US.txt) so that the hyperlink labels can be specified independently of the file names used.
Note
You may need to maximize the Settings window to get a full view of the Group Settings for Issue panel for individual Issue settings.

Infoblox NetMRI 7.4.4 Administrator Guide Part 3 Device and Network Exploration
Copyright ©2020, Infoblox, Inc. All rights reserved. Page 159
•
•
1.2.
3.
1.2.3.
By Device Groups: Issue reporting is organized into the defined Device Groups in the NetMRI system. By default, all issue types are associated with all device groups. Suppression of issues within specific groups has some utility here; Many Issue types do not appear on certain device types and do not need to be suppressed.
Nested device groups will inherit all of the Issue processing settings of their parent. Each nested device group can override its Issue Group settings locally. You may need to pay attention to Issue settings for device groups with a highly specific focus, such as suppressing Cisco-specific Issues that are inherited by a device group dedicated to Juniper routers.By Interface Groups: Issue reporting is organized per network interface group. As with Device Groups, Issue suppression can be a granular and time-consuming activity.
To determine groups associated with an issue, complete the following:
Click the by Issue side tab.In the Issues panel, expand the tree and choose the issue of interest. Associated groups are listed in the GroupSettings for Issue table.To edit a group's settings for that issue: Click Edit for the group.
To determine the issues associated with a group, complete the following:
Click the by Device Groups or by Interface Groups side tab as appropriate.In the left panel, click the group name. Associated issues are listed in the Issue Settings for Group table.To edit an issue's settings for that group, click Edit for the issue.
Performing Issue SuppressionIssue suppression enables users with Issues: Modify Suppression Parameters privileges to indicate which issues should be ignored by NetMRI for purposes of reporting and scorecard generation. Suppressed issues are still analyzed internally (because the associated analysis may be looking for multiple issues), but they are not displayed (by default) or used to compute scorecard values.
Issue suppression status is listed at Settings icon –> Issue Analysis section –> Suppression. The table in this page lists all issues defined in the system, and the analysis and penalties associated with that issue. The check box at the left end of each row indicates suppression status. If checked, the issue is suppressed.
To suppress an issue, click the check box for that issue. Settings are committed automatically.
To see a full description of an issue and review suppressed instances, click the hyperlink in the Issue Name column. To view analysis task details, click the hyperlink in the Analysis Task Name column.
Details of Issue Suppression
Note
It is possible to suppress all issues, which ensures a perfect score. Infoblox does not recommend this practice. Click the Component column header to sort Issue Names by their respective categories.
Note
Group-based Issue Suppression settings recognize Device Group priority settings. NetMRI suppresses an Issue for any device if the Issue Suppression is enabled for the highest-ranking device group to which the device belongs. For example, consider a device that belongs to two device groups, Firewalls and Routing. Under Settings –> Issue Analysis –> By Device Groups, you will see that Firewalls is the highest-ranking device group. Should a particular Issue be suppressed in that device group, all devices participating in that group will have that Issue suppressed, regardless of the suppression settings in any lower-ranked device group to which the device(s) belong.

Infoblox NetMRI 7.4.4 Administrator Guide Part 3 Device and Network Exploration
Copyright ©2020, Infoblox, Inc. All rights reserved. Page 160
•
•
•
•
•
•
•
Suppressed issues continue to be analyzed internally, because the associated analysis may be looking for multiple issues. Although, they are not automatically displayed or used to compute scorecard values.
NetMRI supports two styles of issue suppression: full and partial.
Fully suppressed issues will not appear in any issue list, nor will they be used in any network or group scorecard calculation. A specific issue can be suppressed in the Settings icon –> Issue Analysis section –> Suppressionpage.Doing so suppresses reporting for that issue throughout the NetMRI system.Partially suppressed issues are suppressed on specific devices using check boxes in the Issue Viewer. issues can be partially suppressed through Device Groups and Interface Groups at Settings icon –> Setup section –> Collection and Groups –> Groups tab. For groups, issue instances can be suppressed before issues are even raised for a device or interface, because group settings are dynamic and dictate which issues should be suppressed.
Partially suppressed issues appear in issue lists and are used in all Scorecard calculations containing at least one unsuppressed issue detail. If all issue details are suppressed, then the issue will not appear in issue lists and will not be included in Scorecard calculations.
Partially suppressed issues can be used to temporarily ignore known problems that won’t be fixed for some time, while still tracking the problem. The issue instances are still recorded in the database and can be seen at any time by un-suppressing that instance, at which point it will appear in all past and future issues.
Introducing Network ExplorerThe Network Explorer tab displays everything NetMRI learns about the network. Network Explorer is a good starting point for inspecting the results of a Network Discovery process, viewing the topology of the discovered network, and obtaining information about how the network is behaving in each network segment.
The following tabs within Network Explorer offer different ways to examine network data:
Inventory: This tab provides basic information about all active devices, interfaces, operating systems and models in the network, including virtual devices, which are instances of virtual routers, virtual switches, and other types that are supported by selected devices from some networked system vendors. For more information, see Viewing Network Inventory.Summaries: This tab lists routes, subnets, VLANs, HSRPs/VRRPs, route targets, network views, VRFs, and ports in the network. For more information, see Summarizing Networks.Topology: This tab provides an interactive viewer in which you can visually explore your network's topology and interconnectivity. For more information, see Using the Topology Viewer.Discovery: This tab provides detailed information about NetMRI's discovery processes, including the ability to affect Discovery settings for individual devices, perform/repeat Discovery on a single device, set licensing for a managed device, and remove a device from NetMRI management. For more information on device-related Discovery functions, see Viewing Device Discovery Status and Re-Discovering a Device. Switch Port Management: This is a key feature set for compiling, monitoring, and controlling the devices, ports, and end hosts throughout an enterprise's switched Ethernet network. For more information, see Switch Port Management.
Note
Scorecard values are only computed once, so any issues that are either fully or partially suppressed “at the time the scorecard is generated” are taken into consideration. If an issue is subsequently suppressed, either fully or partially, the old scorecard values will not be retroactively updated.

Infoblox NetMRI 7.4.4 Administrator Guide Part 3 Device and Network Exploration
Copyright ©2020, Infoblox, Inc. All rights reserved. Page 161
•
•
•
•
•
1.2.
Viewing Network InventoryAfter Discovery runs its course, the Inventory tab shows the complete list of network devices with which NetMRI successfully communicates. The network Inventory includes the following classifications:
Devices: The broadest information category, includes five distinct subcategories to allow for more-specific exploration: Infrastructure Devices, Device Components, Connected End Hosts (client systems connected to access ports on switches, for example), Connected IP Phones, and All Devices. For more information, see Viewing Devices.Virtual Devices: All network infrastructure devices discovered by NetMRI that possess virtualization capabilities. Each device in this category hosts one or more virtual device contexts, which are virtual machine-based switches, firewalls, and routers housed by each virtual host. For more information, see Viewing Virtual Device Contexts.Interfaces: A listing of all network interfaces, divided into four functional categories: Interface Config, Unused Down Ports, Unused Up Ports, and Recently Changed Ports. For more information, see Viewing Network Interfaces.OSs: Counts of operating systems and OS versions from all devices discovered and cataloged by NetMRI. For more information, see Viewing Network Operating Systems.Models: Counts of all hardware models discovered and cataloged by NetMRI. For more information, see Viewing Network Device Models.
The Inventory tab (Network Explorer –> Inventory tab) provides basic information about four key categories of network elements managed by NetMRI: Devices, interfaces, operating systems, and device models discovered in the network. From here, you drill down to features such as the Device Viewer to inspect details about individual devices and their current states.
To list inventoried items, complete the following:
Select a device group in the right panel.Select the desired inventory category in the left panel.
During discovery, the devices count listed in the Select Device Groups panel may differ from the number of devices displayed in the center table. The table displays current data about the discovery process, but the Select Device Groups panel is only updated periodically.
Network Explorer supports the use of custom data fields for adding additional data to tables of information about network inventory. For more information, see Defining and Using Custom Fields.
Note
If you know exactly what you are seeking, try typing a few characters in the FindIT search box (upper right corner of the main NetMRI page).
Note
During discovery, the devices count listed in the Select Device Groups panel may differ from the number of devices displayed in the center table. The table displays current data about the discovery process, but the Select Device Groups panel is only updated periodically.
Note
Network Explorer supports the use of custom data fields for adding additional data to tables of information about network inventory. For more information, see Defining and Using Custom Fields.

Infoblox NetMRI 7.4.4 Administrator Guide Part 3 Device and Network Exploration
Copyright ©2020, Infoblox, Inc. All rights reserved. Page 162
•••
•
Viewing DevicesThe Devices section lists network devices, device components, connected end hosts, and connected IP phones found on the network ("connected" means connected to a device in the selected group).
All Devices tables show common elements, including the device IP Address, the Network View to which the device management IP address is associated, the Vendor, Device Name, and Device Model.
To view detailed data for a device, click the IP address hyperlink in the center panel. The Device Viewer appears, listing any current Issues associated with the selected device.
The Device Viewer is not limited to this information. Seven categories of detailed information are provided by the Device Viewer for the displayed network entity. For more information, see Inspecting Devices in the Network.
Viewing Date-Based Data SetsSome Network Explorer –> Inventory pages (Connected End Hosts, Connected IP Phones, Interface Config) provide Date/Period menus that enable flexible measurement and reporting for any device, interface or end host. You can go backward in time to view data sets for any device, interface, or end host phenomena.
Calendar dates shown in green represent an immediately available data set to display in a Network Explorer –> Inventorytable. The most current date in the chosen Inventory page (such as the most recent 7 days for the Daily selection) is always available by default and appears highlighted in green. Older data may require a wait for the user while NetMRI generates the requested data. After generation, the requested date appears in green, indicating the data is available.
Viewing Virtual Device Contexts
NetMRI supports discovery and management of Cisco and Juniper device types that offer virtualization. Similar to servers that run VMware to run multiple instances of operating systems and data services in the same physical host, some Cisco and Juniper device types support multiple instances within the same device, each running the complete suite of protocols, configurations, and operating system. NetMRI calls these instances virtual device contexts (VDCs). NetMRI detects devices that support virtual device contexts and provides the same management and cataloging features that apply to conventional switches, routers, and firewalls.
The Inventory page –> VirtualDevices menu item provides a list of all VDC–supporting devices that are discovered and cataloged by NetMRI. It displays the following values:
IP Address: The IP for the virtual device.Device Name: The name detected for the virtual device.Collector (for OC systems only): The Collector appliance in the Operations Center that detected and manages the virtual device.Network View: The network view for which the detected virtual device is a member.
Each individual virtual device context appears in the Device Viewer, in the Network Explorer –> Inventory page, and in other locations of the NetMRI UI. NetMRI treats virtual device contexts identically to conventional routers, switches and firewall appliances, including the ability to send commands, schedule and execute jobs, display running configurations, view change histories and issues reported from the virtual device, apply compliance policies, run traces and SNMP walks, and many other operations.
Note
NetMRI must have reachability to all virtual device contexts hosted by virtual hosts to discover and catalog them. During data collection for VDCs, NetMRI determines the existence of virtual hosts. The device hosting the virtual contexts–the virtual router, virtual switch, or other device context types–via command-line access on Cisco devices and through SNMP on Juniper devices.

Infoblox NetMRI 7.4.4 Administrator Guide Part 3 Device and Network Exploration
Copyright ©2020, Infoblox, Inc. All rights reserved. Page 163
•••••
NetMRI supports detection and management of the following virtual device context-provisioning devices:
Cisco Nexus 7000 Series multiservice switches (NX-OS).Cisco Pix 525, 535 Security Appliances (Cisco 8.0 and up).Cisco ASA 5500 Series Security Appliances.Cisco ACE load balancers.Juniper M5/M10 Routers (JunOS 10.0 and up).
By default, the Virtual Devices list shows the IP Address for each virtual host, their provisioned Device Name, and the Count of virtual device contexts for each Virtual Host managed by NetMRI. Click the respective IP address for any item in the Virtual devices list and the list of virtual device instances appears in the right panel.
The Virtual Host Details panel describes the basic information for the router, switch or firewall that is hosting the virtual device contexts, including its Network View, MAC Address ID, Model, assigned device name, OS version, the device type (Firewall, Switch, Router), and Context Name if any.
The Virtual Host Details panel also shows the context list, which are the actual virtual routers or other instance types that are being run by the hosting system. Each context is shown by its assigned IP address.
The panel also lists its assigned Device Name for each context (separately defined from the name of the hosting device) and the associated Context Name.
Click any IP address in the table and the Device Viewer popup window appears for that virtual device context.
You can also right-click on any virtual device instance to display the shortcut menu. Open the Device Viewer for any context, open the Config Explorer, view the current running configuration for the context, open its associated Issues List, execute a command, select a Telnet or SSH command-line session, and other operations.
Check the Virtual Asset Inventory report (under Reports –> Standard Reports) for more information on the virtual hosts and their respective VDCs.
Virtual Hosts can act as a proxy for access. If NetMRI is unable to connect to a Virtual Device directly, or the credentials are not known, NetMRI attempts to access the Virtual Device via the Virtual Host. CLI-based operations against a Virtual Device can be successful when connectivity is blocked to the Virtual Device, but not blocked to the Virtual Host. CLI operations include Job execution, Config Collection, and in-browser CLI connections.
Topology Maps and Virtual Device ContextsThe network topologies for virtual hosts (i.e. the Cisco Nexus 7000 switch, Cisco ASA firewall, Juniper router, etc.) will often bear no connectivity relationship or topology resemblance to the network topologies for the virtual device contexts maintained by the virtual host.
Cisco's ASA firewalls use the term "Admin Context" to describe a top-level container that can run one or more virtual devices (VDCs). The ASA firewall's Admin Context is termed a virtual host in the NetMRI system, and it provides the management interfaces (SSH or Telnet) into the more-detailed virtual devices. An ASA firewall can run more than one Admin Context/Virtual Host.
The Cisco ASA uses the term "Customer Context" as a label for all virtual firewalls with their own discrete configurations and allocated interfaces. These entities are labeled as Virtual Device Contexts in the NetMRI system. These virtual "devices" support their own distinct topologies that can differ significantly from the hosting ASA firewall.
You can use the Topology Viewer (Network Explorer –> Topology) to look at the links between the Virtual Hosts and other devices in the network. Drilling further down, you use the Topology Viewer to examine the network linkages for the virtual device contexts themselves. Their topologies will often bear no relationship to the topologies of the virtual hosts upon which they are running. For more information, see Using the Topology Viewer.
Note
Click the View All Virtual Devices link at the top of the Virtual Devices list to display the virtual hosts and all of their associated virtual device contexts in the Inventory.

Infoblox NetMRI 7.4.4 Administrator Guide Part 3 Device and Network Exploration
Copyright ©2020, Infoblox, Inc. All rights reserved. Page 164
••
•
•
•
•
•
••
•
Viewing Network InterfacesThe Interfaces page (Network Explorer –> Inventory –> Interfaces) lists interfaces found on the network, and provides configuration data for each. All interface tables can show associated information including IP configuration, associated device name, VRF Name (if any), VLAN and trunking status, line speed (where applicable), and a Network View column.
Interface Config: Shows all interfaces being tracked by the appliance.Unused Down Ports: All interfaces marked administratively "down" (user configured as "off") and operationally "down" (not physically connected). This helps determine whether devices are not needed or if connections can be consolidated to eliminate unneeded hardware. For example, if there is a switch with twelve ports and two allocated, and another switch possessing eight ports with five ports fully allocated, it may be possible to move all the connections on the eight-port switch to the twelve-port switch and then eliminate the eight-port switch.Unused Up Ports: All interfaces that are administratively marked "up" and operationally "down." The list can help to quickly identify bad device configurations (unused ports should not be administratively "up"), failed or unplugged network cables, and badly allocated devices.Recently Changed Ports: All interfaces that had status changes within the last hour. On a stable network interface, status should not change often, so the list should small or empty. If there are known connectivity problems, this list helps isolate possible problem sources.
Clicking any link in the Interface column displays the Interface Viewer for the chosen device port, with features for viewing interface settings and performance metrics, and a Settings icon –> Port Control Settings feature for setting an interface to administratively Up or Down, changing a VLAN assignment, or rewriting the port description.
Clicking any link in the Network View column opens the Network Viewer window.
To view detailed data for an interface, click the interface hyperlink in the center panel. The Interface Viewer appears.
Viewing Network Operating SystemsThe OSs section lists operating systems running on devices in the network, including routers, switches, load balancers, Infoblox NIOS systems, and other devices from numerous vendors discovered on the network.
To list devices running a given operating system, click the operating system in the left panel. All discovered devices running that particular operating system appear in the right panel of the Inventory page.To view detailed data for a device from the OSs page, click the IP address hyperlink in the center panel. The Device Viewer appears, listing any current Issues associated with the selected device.
The Device Viewer is not limited to this information. Seven categories of detailed information are provided by the Device Viewer for the displayed network entity. For more information, see Inspecting Devices in the Network.
Viewing Network Device ModelsThe Models section lists model names of devices in the network.
To list devices of a given model, click the model name in the left panel.To view detailed data for a device from the Models page, click the IP address hyperlink in the center panel.
The Device Viewer opens, listing any current Issues associated with the selected device.
The Device Viewer is not limited to this information. Seven categories of detailed information are provided by the Device Viewer for the displayed network entity. For more information, see Inspecting Devices in the Network.
Summarizing NetworksThe Summaries tab (Network Explorer –> Summaries) lists routes, subnets, VLANs, Route Targets, HSRPs/VRRP groups, ports, NIOS grids, network views, and VRFs (virtual routing and forwarding instances) in the network.
To list inventoried items, click the desired category in the left panel.

Infoblox NetMRI 7.4.4 Administrator Guide Part 3 Device and Network Exploration
Copyright ©2020, Infoblox, Inc. All rights reserved. Page 165
•
•
•
•
•••
•
•
To restrict the center panel table to a specific device group, click the group name in the Select Device Groupspanel (on the right side of the window).To view details about any item in the left panel, click the row for that item. Details appear in the center panel.
Summarizing Network Routes and Subnets
The Routes section lists routes reported by all devices in the network, from each of their interfaces, during the last network polling cycle by NetMRI. Routes are listed by the protocol (proto), the route's IP, the VRF Name containing the interface, its VRF route distinguisher, and the Count. The count is the number of devices reporting that particular route during the last polling period. All IPv4 and IPv6 routes are listed for all router and switch-router devices.
To list devices comprising the route, click a route in the left panel. The center panel refreshes to show the device reporting the route, the route's interface from which it was reported, the Network View for the management IP of the device reporting the route, and the route's Next Hop. The list also shows each device's Route Distinguisher. This feature can be helpful in tracing a path.To view detailed data for a device, click the IP address hyperlink in the center panel. The Device Viewer opens.
The Subnets section lists subnets found in the network, the Network View for the management IP of the device reporting the subnets, and its VRF Name (if any). The list of subnets is compiled from all router and switch-router devices discovered and cataloged by NetMRI, including any virtual device contexts (VDC).
For subnets, the Count is the number of devices discovered as part of the subnet during the last polling period.To list all devices in the subnet, click a subnet in the left panel.To view detailed data for any device in a subnet, click the IP address hyperlink in the right panel. The Device Viewer opens, listing any current Issues associated with the selected device.
The Device Viewer is not limited to this information. Seven categories of detailed information are provided by the Device Viewer for the displayed network entity. For more information, see Inspecting Devices in the Network.
Summarizing VLANs, Ports, Virtual Groups, and NIOS Grids
The VLANs section lists VLANs found in the network.
To list devices supporting a VLAN, click a VLAN name in the left panel. The VLAN Viewer appears, listing the devices by IP address that are associated with the VLAN.
The main page also displays the VLAN Root Details listing for the selected VLAN, and the table of devices associated with the VLAN, listing by IP address. Clicking an IP address in the VLANs table also brings up the Device Viewer.
Also, check the Topology Viewer (Network Explorer –> Topology) to see a graphic presentation of the VLAN path.
Note
Click the View All Routes link to list all VLANs in the center panel. Then apply a filter, such as an IP address, to isolate them for a device. This effectively allows you to view the routing table for a device in NetMRI.
Note
Click the View All VLANs link to list all VLANs in the center panel. Then apply a filter to isolate them for a device. Similar links are used for the Ports and NIOS Grids accordions.
Note
Reserved VLANs are not displayed. They are included in the API.

Infoblox NetMRI 7.4.4 Administrator Guide Part 3 Device and Network Exploration
Copyright ©2020, Infoblox, Inc. All rights reserved. Page 166
•
•
The Ports section lists ports found in the network. This table is a superset of all the ports listed in the Switch Port Manager page. If your license is active only for Switch Port Manager, the switch ports discovered and polled by NetMRI are the only ports listed here.
To list devices using a given port number, click the port number in the left panel.
The NIOS Grids section lists any Infoblox NIOS Grid Masters found in the network.
To list a Grid Master's members, click the Grid Master in the left panel. All associated Grid member appliances appear in the center panel.
Summarizing HSRP/VRRP GroupsYou can list all HSRP/VRRP Groups managed by NetMRI, or the HSRP/VRRP groups that are associated with a particular device group.
The HSRPs/VRRP Groups section lists Hot Standby Router Protocol (HSRP) groups and Virtual Router Redundancy Protocol (VRRP) groups found in the network, starting with the Virtual IP address of the group. Types are labeled in the Type column as HSRP or VRRP. The protocols are used for fault-tolerant default gateway configuration across two or more devices in case the primary gateway router becomes inaccessible.
To view details for an HSRP or VRRP, click a group in the left panel. The corresponding viewer opens in a popup window. The devices participating in the group are listed in the viewer.
Summarizing Route Targets
VRFs use route targets to specify how routes will be shared between different VRF networks. The typical format of a Route Target is two numeric values separated by colons. For example,27000:100.
The Route Targets summary in the left panel shows the list of Import and Export route targets that are defined in VRF-aware devices in the managed networks. The VRF RD (route distinguisher) values are listed in a separate column, and you can click on the link for each VRF's network view, which opens the Network Viewer window. This window also lists all devices forming the VRF network.
Selecting a route target causes the center panel to display all the instances where it is being used, along with details of the device and the VRF. This is helpful to understand how VRFs and particularly VRF-Lite are configured across the network.
Summarizing Network ViewsTo view the complete list of network views, click the View all Network Views link at the top of the list. You can list all network views containing networks managed by NetMRI, or the network views that are associated with a particular device group. Each network view listed in the left panel provides a link to the Network View window.
The Count value indicates the number of interfaces sharing the same network view. Each instance is differentiated by the interface name.
If you have a significant number of network views, you can apply a filter by clicking the Filters button at the top of the table, choosing the Network View option from the Select a New Field selector, and entering the name of the network view.
Note
Click the View All Route Targets link to list all route targets in the center panel. Then apply a filter to isolate them for a device or a network view.

Infoblox NetMRI 7.4.4 Administrator Guide Part 3 Device and Network Exploration
Copyright ©2020, Infoblox, Inc. All rights reserved. Page 167
•••
•••
•
•
•
•
•
•
•
•••••••
Network Views represent each network that is managed and monitored by NetMRI. For more information about network views and how to use and configure them, see Configuring Network Views and its subsections.
Summarizing VRFsAfter virtual routing and forwarding (VRF) networks are discovered and mapped to network views, you can use the VRFs summary to view the complete list of VRF instances throughout the managed network. You can sort the VRF information by any data column to see the relationships between VRF instances in virtual networks.
To view the complete list of VRF instances, click the View all VRFs link at the top of the list. By default, the VRFs are listed by VRF name. Data columns include the following:
VRF Name: Displays the name of the VRF instance.VRF Description: Displays a description if the VRF instance is configured with a description on the device.Route Distinguisher: VRFs use route distinguishers to distinguish one set of routes (one VRF) from another. The route distinguisher is a unique number pre-pended to each route within a VRF to identify it as belonging to that particular VRF. The discovered route distinguisher value is listed here if a virtual network instance uses this value. For more information, see Summarizing Route Targets.Device Name: The discovered name of the device hosting the VRF instance.IP Address: The IP address of the managed VRF-hosting device. This value is a hotlink to the Device Viewer.Network View: The network view of the managed VRF-hosting device. This value is a hotlink to the Network Viewer window.VRF Network View: The network view to which the VRF is assigned. This value is a hotlink to the Network Viewer window. Note that this value may differ from the Network View identifier.
If you have a significant number of virtual routing and forwarding networks, you can apply a filter by clicking the Filtersbutton at the top of the table, choosing the VRF Name option from the Select a New Field selector, and entering the name of the VRF. You can also filter by network view in the same way, or combine the two filters to isolate all VRF instances in a specific network view.
Using the Topology Viewer
The Topology Viewer (Network Explorer –> Topology) enables you to visualize the network in a graph from the following viewpoints:
Aggregate Network Topology: This shows the general Layer 2 paths of the network. For more information, see Aggregate Network Topology.L2 nHop Network Topology: This shows the Layer 2 switching paths of the network. For more information, see L2 nHop Network Topology.L3 nHop Network Topology: This shows the Layer 3 switching/routing paths of the network. For more information, see L3 nHop Network Topology.L2/L3 Most Likely Path Network: This indicates the spanning tree paths preferred by switched network traffic in the network. For more information, see L2/L3 Most Likely Path Network Topology.L3 Most Likely Path Network Topology: This indicates the routed paths preferred by most packet flows in the network. For more information, see L3 Most Likely Path Network Topology.VLAN Network Topology: This maps the paths of VLANs throughout the network. For more information, see VLAN Network Topology.
To learn how to work with the topology graph in the Topology Viewer, see the following sections:
Filtering Devices in the Topology GraphSearching for DevicesViewing Device DataManipulating the Topology GraphSaving and Deleting Custom ViewsExporting the GraphConfiguring Topology Viewer Settings

Infoblox NetMRI 7.4.4 Administrator Guide Part 3 Device and Network Exploration
Copyright ©2020, Infoblox, Inc. All rights reserved. Page 168
•
•
••
1.2.
Aggregate Network TopologyThe following predefined aggregate views are available in the Topology Viewer:
Aggregate: Shows L2 network devices and their respective connections, in aggregate or a choice from several individual layer 2 link types. The Aggregate view is the default. It is loaded first when you open the Topology Viewer. You can change which view to load first in the Topology Viewer settings. For more information, see Other Properties.Link Discovery Protocols: Shows L2 devices using Link Layer Discovery Protocol (LLDP) or Cisco Discovery Protocol (CDP), and their interconnections.Serial Links: Shows L2 devices connected by serial links.Switch Forwarding: Shows L2 devices using switch forwarding.
To display an aggregate network topology, select the required view in the views list:
In addition to the predefined aggregate views, you can save custom views. You cannot save predefined views, unlike custom ones. For more information, see Saving and Deleting Custom Views.
L2 nHop Network TopologyL2 nHop topology shows devices that can be reached from a selected starting device through a chosen number of Level 2 (actually a hybrid of L1 and L2) connections.
To display an L2 nHop network topology, complete the following:
Locate the starting device in the graph.Right-click the device and select L2 nHop.
Note
For optimum performance during interactive editing of large network graphs, it is recommended to enable hardware acceleration in the browser. It is also beneficial to make sure the client device’s GPU drivers are up-to-date, as this will often increase performance within the viewer.

Infoblox NetMRI 7.4.4 Administrator Guide Part 3 Device and Network Exploration
Copyright ©2020, Infoblox, Inc. All rights reserved. Page 169
3.
4.5.
1.2.3.4.
•••••
5.
1.2.3.4.
In the window that appears, specify the Hop Count (the view will show devices reachable in this number of hops or less).
Select a view. In other words, a connection type, such as CDP, Serial Links, Switch Forwarding, or Aggregate.Click OK.The resulting graph is displayed in a separate window. The starting device is highlighted. Devices that cannot be reached or that are farther away than the specified hop count are not shown in the resulting view.
Cisco Nexus switches and their virtual device contexts (VDCs) will appear in this view.
L3 nHop Network TopologyL3 nHop topology shows all active devices that can be reached from a selected starting device in the network, through a chosen number of routed Level 3 connections.
To display an L3 nHop network topology, complete the following:
Locate the starting device in the graph.Right-click the device and select L3 n Hop.In the window that appears, specify the Hop Count.In the Protocol field, specify one of the following:
AllBGPIGRPLocalOSPF
Click OK.
The resulting graph is displayed in a separate window. The starting device is highlighted. Devices that cannot be reached, or that are farther away than the hop count, are not shown in the resulting view.
Juniper M5 and M10 routers that are running virtual device contexts will have their VDCs appear in this list, appearing as any other router.
L2_L3 Most Likely Path Network TopologyL2/L3 Most Likely Path topology shows the most likely path that traffic would take between two devices, including both Layer 2 and Layer 3 connectivity.
To display an L2/L3 most likely path topology, complete the following:
Locate the starting device in the graph.Right-click the device and select L2/L3 Most Likely Path.In the window that appears, select the source network view from the Network View dropdown menu.Select the target device.The resulting graph is displayed in a separate window. The starting device is highlighted.
Note
Setting Hop Count to All stops hops at L3 devices.
Note
L3 connections are directional. A hop to a neighboring router and back is considered two hops. If you set the hop count to one, you will not see any return hops to the starting device.

Infoblox NetMRI 7.4.4 Administrator Guide Part 3 Device and Network Exploration
Copyright ©2020, Infoblox, Inc. All rights reserved. Page 170
1.2.3.4.
1.2.
•
L3 Most Likely Path Network TopologyL3 Most Likely Path shows the most likely path that routable Layer 3 traffic would take between a source device and a target device, ignoring Layer 2 connectivity between Layer 3 devices.
To display an L3 most likely path topology, complete the following:
Locate the starting device in the graph.Right-click the device and select L3 Most Likely Path.In the window that appears, select the source network view from the Network View dropdown menu. Select the target device.The resulting graph is displayed in a separate window. The starting device is highlighted.
VLAN Network TopologyA VLAN topology shows the spanning tree that a given VLAN uses on the network. Only VLANs with a spanning tree root that is managed by NetMRI can be viewed in the appliance. VLANs can have identical names as long as the root bridge is different.
To display a VLAN topology, complete the following:
In the categories folders, click Vlans.Select the VLAN you are interested in.
In the resulting topology chart, the root bridge is displayed at the top and the leaf nodes are displayed below. Active and disabled links are indicated in the graph. The farther the distance from the root bridge, the higher the cost in the L3 VLAN path. Spanning tree port blocking is indicated by a gray X at the end of a connection. If a port shows an error, it is indicated by a red X.
Filtering Devices in the Topology GraphYou can filter the topology graph to highlight devices under specific categories. To filter, use the following folders located under the view selector:
NetMRI: Displays the current NetMRI configuration in terms of Operation Centers and Collectors.
Note
Pre-defined topologies are synchronized on schedule, but some Topology Viewer functionalities are based on information obtained through NetMRI API in real-time. This may lead to some discrepancy in the display of VLAN graphs, as Topology Viewer gets VLAN data in real-time, but draws them based on L2 topology data previously synchronized to the database.

Infoblox NetMRI 7.4.4 Administrator Guide Part 3 Device and Network Exploration
Copyright ©2020, Infoblox, Inc. All rights reserved. Page 171
•
•••••••
1.•••••
2.
•••
Data Sources: Highlights devices in networks assigned to a selected collector.
Locations: Highlights all nodes with a selected SNMP location.Types: Highlights all devices with a selected type.Groups: Highlights all devices from a specific device group.Vendors: Highlights all devices with a specified vendor.Models: Highlights all devices with a selected model.VLANs: Highlights all nodes that are part of a specific VLAN.Advisor Data: Highlights nodes that are impacted by a CVE or a lifecycle event. For information about the severity ratings of security advisories, see Tuning Vulnerability Thresholds in the NetMRI Advisor Operator and Administrator Guide.
Searching for DevicesYou can search for devices by a number of parameters. The search is done in real time and works on partial matches. To enable or disable search filters in the Topology Viewer Settings, complete the following:
Click Device Name and select any of the following:Device NameOS VersionNetworkIPMAC
In the text box, enter the term to be searched. Any nodes matching this value are highlighted.
For more information, see Configuring Topology Viewer Settings.
Viewing Device DataYou can view the following device data in the Topology Viewer:
To view basic data about a device, hover the mouse over the device.To view detailed data about a device, click the device. The Device Viewer opens.To view basic data about the link between two devices, hover over the link.

Infoblox NetMRI 7.4.4 Administrator Guide Part 3 Device and Network Exploration
Copyright ©2020, Infoblox, Inc. All rights reserved. Page 172
•
••••••••••
•
•••••
••••••••
To generate a new graph with a device as the starting point, right-click the device and select L2 nHop, L3 nHop, L2/L3 Most Likely Path, or L3 Most Likely Path.
Right-clicking on a node provides additional options for viewing and managing the node. From this menu, you can open various node pages for quick access to specific settings. See the following options:
Device Viewer: Opens the NetMRI device viewer page.Config Explorer: Opens the Configuration Explorer page for the device.View Running Config: Opens the current running configuration for the device.Changes: Shows any changes made to the device.Issues list: Displays all issues found with the device.Policy Compliance: Displays the status of any policies on the device.Schedule Job: Opens the job scheduling tool.Execute Command: Opens the script execution page within NetMRI.Show End Hosts: Displays or hides the end hosts.Show Edge Devices: Shows edge devices in a separate window. You can add edge devices to the graph from this window and save the edge devices view. For more information, see the Sync Threshold for Large Graphsproperty in Topology Synchronization Properties.L2 nHop: Highlights all nodes within a set amount of hops. These nodes are highlighted in red, with their edges highlighted in dashed red lines.L3 nHop: Displays the L3 nHop Network Topology map in a separate window.L2/L3 Most Likely Path: Displays the L2/L3 Most Likely Path Network Topology map in a separate window.L3 Most Likely Path: Displays the L3 Most Likely Path Network Topology map in a separate window.Edit: Allows you to edit node properties. It is only available for custom nodes.Edit label: When you right-click on an edge and select the Edit label command, this allows you to edit the IF label of the edge.
Manipulating the Topology GraphThe Topology Viewer can display devices of various types. Devices of different types (called nodes in the topology graph) are represented with different icons in the graph. The connections between devices are called edges. You can only see devices within groups that you have access to. Admin users can see all device groups and all views.
You can drag and drop nodes and edges around the graph for your convenience.
You can perform the following in the Topology Graph:
Dragging and Dropping, Pinning, and Unpinning NodesFreezing the Topology LayoutCreating and Deleting Custom Nodes and EdgesEditing Custom Nodes and EdgesChanging Node IconZooming and Fitting ContentGrouping NodesEditing Custom Fields for Custom Nodes and Edges
For mouse and keyboard controls used to manipulate the graph, see Mouse and Keyboard Commands for Graph Operations. For a description of icons used to manipulate the Topology Graph, see Icons and Popup Windows.
For more information, see Available Custom Device Types.
Dragging and Dropping, Pinning, and Unpinning Nodes
You can adjust the layout of the topology using the mouse to drag and pin nodes in place.
Note
Graph choices depend on what can be viewed from the selected device.

Infoblox NetMRI 7.4.4 Administrator Guide Part 3 Device and Network Exploration
Copyright ©2020, Infoblox, Inc. All rights reserved. Page 173
•
•
1.
2.
1.2.3.
•
•••••••••••
4.5.
1.2.
To pin a node, double-click it. A pinned node is marked by the dashes located at the cardinal points of the node. Moving a node while pinned prevents other nodes from pulling it into a computed layout.To unpin the node, double-click it again.
Freezing the Topology LayoutThe Topology Viewer uses a physics engine that pulls nodes together and arranges them in a computed layout. However, it may be convenient to freeze the entire topology layout and arrange nodes individually. This also helps avoid performance issues with big topologies.
For the pre-defined topology views, the layout is always frozen. For custom views, you can choose to freeze or unfreeze the layout.
To freeze the topology layout in a custom view, complete the following:
Select Freeze Layout above the graph.This disables the physics that pulls nodes together.Drag and arrange nodes into any layout you choose.
By deselecting Freeze Layout, the node's positions are unfrozen and recalculated based on other settings. Deselecting Freeze Layout is disabled for the default views.
Creating and Deleting Custom Nodes and Edges
The Topology Viewer allows you to create custom nodes and edges in the graph. You can customize these nodes and edges to represent real examples of network devices and connections or hypothetical ones.
To create a node, complete the following:
In the graph, click Edit -> Add Node.Click anywhere in the topology graph.In the Node Properties window that appears, specify the required properties. The Topology Viewer uses these properties for searching, filtering, and grouping in the graph.
Id: The identifier of the device. The value is assigned by the Topology Viewer automatically and is not editable.Name: The name of the device.Vendor: The vendor name of the device.Model: The model of the device.Version: The OS/firmware version of the device.Location: The physical location of the device.Type: The type of the device. For more information, see Available Custom Device Types.Network: The network in which the device resides.OC: The Operation Center containing the Collector that discovered the device.Collector: The Collector that discovered the device.IP: The IP address of the device.MAC: The MAC address of the device.
Connect the node to another node in the graph using an edge. See the next procedure for creating an edge.Click Save.
To create an edge, complete the following:
In the graph, click Edit -> Add Edge.Click one node, and then click another.
Note
You can pin and unpin nodes only when the topology layout is not frozen. For more information, see Freezing the Topology Layout.

Infoblox NetMRI 7.4.4 Administrator Guide Part 3 Device and Network Exploration
Copyright ©2020, Infoblox, Inc. All rights reserved. Page 174
3.
•••••••
4.
1.2.
1.2.3.
4.
1.2.3.4.
••
•
1.2.
•••
3.
In the Edge Properties window that appears, specify the required properties for both nodes. The Topology Viewer uses these properties for searching and filtering in the graph.
Id: The identifier of the device.Name: The name of the device.IF Name: The name of the interface.IF Description: The description of the interface.IF Index: The index of the interface.IF Type: The type of the interface.Network Name: The name of the network in which the device resides.
Click Save.
To delete a custom node or edge, complete the following:
Select a node or edge with the mouse.Click Delete Selected.
Editing Custom Nodes and Edges
You can edit the properties of custom nodes and edges in custom views.
To edit a node or edge, complete the following:
Right-click a node or an edge.Click Edit.Edit any of the node or edge properties. For more information, see Creating and Deleting Custom Nodes and Edges.Click Save.
Changing Device Icon for Custom Node
You can change the icon for a custom node by editing the type of the node.
To change a node icon, complete the following:
Right-click a custom node.Click Edit.In the Node Properties window, select a node type.Click Save.
Zooming and Fitting Content
For convenience, you can move the topology graph around, zoom it in and out, and fit its content to your screen.
To zoom into the graph, use either the + or – buttons on the bottom right, or use the mouse wheel.To move the graph, use either the arrows in the bottom, or click on an empty area in the graph and drag the screen around.To fit the graph to screen, click Fit Content in the bottom right, above the zoom-in button.
Grouping Nodes
Nodes can be clustered together by a specific parameter for easier management of large quantities of related devices.
In the Topology Viewer, go to Settings -> Other Properties.In Cluster By, select one of the following:
LocationConnectionsOutliers
Click Save.

Infoblox NetMRI 7.4.4 Administrator Guide Part 3 Device and Network Exploration
Copyright ©2020, Infoblox, Inc. All rights reserved. Page 175
1.2.3.4.
•
•
•
•
••
••
Editing Custom Fields for Custom Nodes and Edges
Custom nodes and edges can have custom fields to store extra information for them.
To edit a custom field, complete the following:
Right-click a custom node or an edge, and select Custom Fields.In the Name field, type a desired name for the field.In the Value field, type a desired value.Click Save.
To delete a custom field, complete the following:
Under the Custom Fields section, click the Trash Bin Icon next to the field to be deleted.
Mouse and Keyboard Commands for Graph Operations
The following table lists the mouse and keyboard commands that you can use for topology graph operations.
Mouse and Keyboard Command Graph Operation
Left-click Selects an individual node or edge.
Ctrl + left-click Selects multiple nodes or edges.
Shift + left-click + drag Box select.
Left-click + drag on a node Moves the node.
Left-click on white space Deselects all.
Left-click + drag on white space Moves the entire graph.
Mouse wheel Zooms the view in and out.
Mouse hover Displays node or edge information. For more information, see Creating and Deleting Custom Nodes and Edges.
Right-click on a node or an edge Displays device or edge tools menu. For more information, see Viewing Device Data.
Right-click on the graph or white space Provides access to the following commands:
Add to View: Adds the newly-created and selected node to a custom view.Invert Selection: Changes the selected items to non-selected and vice versa.Hide Non-Selected: When an item is selected, hides the non-selected items.Show Hidden: Restores the display of the hidden items.Save as PNG: Saves the view in the PNG format.
Left double-click on a node Pins and unpins a node when in the unfrozen layout.
Available Custom Device Types
The following list contains the device types that the Topology Viewer can display:
Application SwitchBridge

Infoblox NetMRI 7.4.4 Administrator Guide Part 3 Device and Network Exploration
Copyright ©2020, Infoblox, Inc. All rights reserved. Page 176
•••••••••••••••••••••••••••••
Call ServerCircuit SwitchClusterCloudCMTSComm ServerConsole ServerCopierCSU/DSUDigital UnixEncryptorExternalFaxFirewallFreeBSDGatewayGLBPHP-UXHubIBM AIXIBM AS/400IBM OS/390IP PhoneIPSIRIXKVM SwitchLED DisplayLinuxLoad Balancer

Infoblox NetMRI 7.4.4 Administrator Guide Part 3 Device and Network Exploration
Copyright ©2020, Infoblox, Inc. All rights reserved. Page 177
••••••••••••••••••••••••••••••
1.
2.
Mac OSNetBSDNetMRINetwareNetwork ProbeNextstep/OpenstepNIOSNMSOpenBSDPower ControllerPrinterProxyRADIUS ServerRouterSDN ControllerSDN ElementSecurity ManagerSolarisStorage ApplianceSwitchSwitch-RouterTeleCommunicationsunknownvNIOSVoice MailVOIP GatewayVPNWindowsWireless APWOC
Saving and Deleting Custom ViewsYou can only save and delete custom topology views. You can save the whole view or a part of it if you select it in the graph.
To save a view, complete the following:
Make the necessary changes to a pre-defined view. Alternatively, you can save a pre-defined view to a custom one and then make necessary changes.In the views list, type a name for the custom view.

Infoblox NetMRI 7.4.4 Administrator Guide Part 3 Device and Network Exploration
Copyright ©2020, Infoblox, Inc. All rights reserved. Page 178
3.
4.
1.2.3.
1.2.3.
••••••
Click Save View.The custom view is added to the views list.Click the Reload button.
To delete a view, complete the following:
Select the required view from the views list.Click Delete.Click Yes to confirm.
Exporting the GraphYou can export the topology graph to an .SVG file, allowing for external editing of the topology in programs like Microsoft Visio.
To export the graph to SVG format, complete the following:
Select Export above the graph.Give the file a name, and choose a location to download the file to.Click Save.
Configuring Topology Viewer SettingsYou can configure the following in the Topology Viewer Settings:
VLAN TracingSelected Edge PropertiesNode and Edge PropertiesUI PropertiesOther PropertiesTopology Synchronization Properties
VLAN Tracing
VLAN tracing allows you to see what nodes are connected in a specified VLAN. If multiple VLANs are selected, they are given separate colors to tell them apart.
Note
After you change any settings, click the Reload button for the changes to apply to the current graph.

Infoblox NetMRI 7.4.4 Administrator Guide Part 3 Device and Network Exploration
Copyright ©2020, Infoblox, Inc. All rights reserved. Page 179
1.2.
••
•••••
••
In Settings -> VLAN Tracing, select one or more VLANs to be identified.Click Trace. This outlines the selected VLANs with a color scheme to help match them. Overlapping VLANs are indicated by dashed lines. You can also identify VLANs via mouse-over.
To clear VLANs highlighting, click Clear and then Save.
To remove a VLAN from the list of traced ones, click the X icon for each VLAN.
To remove all VLANS from the list of traced ones, click the X icon on the far right of the field.
Selected Edge Properties
You can configure the following properties here:
Width: The width of the selected edges.Color: The color of the selected edges.
Node and Edge Properties
You can configure the following properties here:
Selected Node Shadow Color: The shadow color of selected nodes.Node Label Color: The color of node labels.Node Minimum Scale: The minimum scale for the nodes.Show FQDN for Nodes: Enables the display of node labels as FQDNs.List of Domain Names to Filter from Node Names: Filters out domain names specified in the field from node names. It applies if the Show FQDN for Nodes setting is set to false. For example, if you specify “domain.com” in this field, then the graph will show “node1” for a node originally named “node1.domain.com”.Show 'null' Values in Node Tooltips: Allows showing “null” values in node popup upon mouse-over.Enable Smooth Edges: Enables displaying edges as curved lines, as opposed to straight lines. This makes the graph more visually appealing and is useful to visually separate edges that start and end at the same device. The image below is an example of smooth edges.

Infoblox NetMRI 7.4.4 Administrator Guide Part 3 Device and Network Exploration
Copyright ©2020, Infoblox, Inc. All rights reserved. Page 180
••
••
•
•
•••••••
Edge Roundness: Allows modifying the edge roundness for smooth edges.Edge Style: Enables various appearance styles for smooth edges (e.g. continuous, discrete, curved clock-wise, curved counter clock-wise, etc.).
UI Properties
You can configure the following properties here:
Initially Show Sidebar: Specify whether to show or hide the sidebar with device filters.Show Policies Indicator: Adds an indicator icon next to nodes that have policy notices. To see policies information, mouse over the device.Show Issues Indicator: Adds an indicator icon next to nodes that have issue notices. To see issues information, mouse over the device.Show Changes Indicator: Adds an indicator icon next to nodes that have changes. To see changes information, mouse over the device.
Search Options: Configure the search options for device search in the graph. These include the following:Device NameOS VersionNetworkIPMACLocation
Note
To see details for policies, issues, or changes, right-click the device and select the corresponding item.

Infoblox NetMRI 7.4.4 Administrator Guide Part 3 Device and Network Exploration
Copyright ©2020, Infoblox, Inc. All rights reserved. Page 181
•••
••
•
••
•
1.2.3.4.
1.2.3.4.
ModelVendorType
Other Properties
You can configure the following properties here:
Initially Load This View: Specify which view to load first when opening the Topology Viewer.Cluster By: Allows you to group nodes by a specific parameter, such as location, connections, or outliers.
Topology Synchronization Properties
You can configure the following properties here:
Topology Synchronization: Enables the synchronization between the NetMRI databases and the Topology Viewer database. Based on this, the Topology Viewer build graphs and stores them in its database. When you open the Topology Viewer, it renders this data for you.Run Topology Synchronization every: Allows you to specify a schedule for topology synchronization.Sync Threshold for Large Graphs: Sets a threshold for the number of devices to be displayed on a large graph. If the node count in the Aggregate view is higher than this threshold, the graph does not display edge devices. Edge devices are nodes that have the end point count equal to zero or null. This setting does not include end hosts.Edge Smoothing Threshold: This setting applies only when the Enable Smooth Edges option is turned on. It sets the maximum number of devices to be displayed in the graph. This allows avoiding performance issues related to edge smoothing in very large network topologies.
Other Network View Operations
To force devices to the top of a queue, complete the following:
Click the check box for the device(s), then click Discover Next (below the table).Click the check box for the device(s).Click License (below the table).In the License Status dialog, select the desired license status (Automatic, Licensed, or Unlicensed), and then click OK.
NetMRI gives explicitly licensed devices priority in determining which devices to manage. Unlicensed devices continue to be managed by the appliance, but only basic discovery data is periodically collected from them.
To force immediate discovery of devices, click the check box for the device(s), and then click Discover Now (above the table). NetMRI will execute the processes required against a device to complete discovery. These include SNMP credential collection, SNMP data collection, device group assignment, and CLI credential collection.
To delete devices from NetMRI's database, complete the following:
Click the check box for the device(s).Click Delete (below the table).(Optional) In the Delete dialog, select Exclude from discovery (see below).Click Yes to confirm the deletion.
Note
It may take several minutes for NetMRI to reflect the new status when changing the license status of a device in the network.

Infoblox NetMRI 7.4.4 Administrator Guide Part 3 Device and Network Exploration
Copyright ©2020, Infoblox, Inc. All rights reserved. Page 182
1.2.3.
If a device continues to appear in collected data, NetMRI will re-list the device unless you choose to exclude the device from discovery when it is deleted.
To un-manage devices, complete the following:
Click the check box for the device(s).Click Unmanage (below the table).Confirm the operation.
Unmanaged devices remain discovered, but NetMRI will not collect data from them. The appliance will not obtain details—such as vendor, model, and operating system version—because SNMP access is required to complete those processes.
Using the Interface Viewer
The InterfaceViewer (accessed by clicking any hyperlinked interface identifier in the Interface column of the Interface Configuration list (located in NetworkExplorer–>Inventory–>Interfaces–>InterfaceConfig), displays low-level interface data and network phenomena affecting the selected interface during a specified time period. The top panel lists basic information about the chosen interface, including the Type, Speed, Status (Up or Down, along with the date the interface was discovered to be changed in state), the host device's NetworkView, the DeviceIP, its interface MACAddress, the InterfaceIP (if any), and Ethernet PortFast and Encapsulation settings where applicable (this value appears only when the interface is using 802.1Q tagging).
If a physical interface also contains logical subinterfaces that are locally assigned to VRFs, the Encapsulation field will appear in the top panel of the Interface Viewer window, also listing the protocol.
When an interface is locally assigned to a Network View, the Local VRF field appears in the top panel of the Interface Viewer window.
By default, the Interface Viewer displays any neighboring interface information for the selected interface. The assumption is that the selected interface is actually administratively On and active on the network. Otherwise, the Interface Viewer shows a blank page.
The Interface Viewer also provides a list of Access Control Lists that are bound to the current interface. To change the date or period for data displayed in the Interface Viewer, see Setting the Date and Period.
Note
Switch Port Management provides a more global view of the network's complement of switched interfaces. For more information, see Switch Port Management.
Note
Click the icon at the top of the Interface Viewer to open the Device Viewer for the device hosting the current interface, or the Live Interface viewer for the currently selected interface. Also, to search for interfaces in the On position, type the word "on" into the search box in the Interface Config page before attempting to access the Interface Viewer.

Infoblox NetMRI 7.4.4 Administrator Guide Part 3 Device and Network Exploration
Copyright ©2020, Infoblox, Inc. All rights reserved. Page 183
•
•
•
•
••
Viewing Neighboring InterfacesThe Neighbors page (Interface Viewer –> Interface –> Neighbors) lists the MAC addresses, associated VRF Name, and Neighbor VRF Name (if any), the Network View, IP addresses, interfaces and other data for neighbors of the currently displayed interface. If you select an interface that is administratively On and is active in the network, the Interface Neighbor information automatically appears. Otherwise the neighbor information remains blank.
Associated information provided includes the VLAN and/or trunk interface, the neighbor's MAC address, the neighbor type, and the Neighbor Assurance value.
Viewing Network Performance MeasurementsUnder Performance in the Interface Viewer, the Summary page (Interface Viewer –> Performance –> Summary) lists high-level statistics for inbound and outbound traffic for the selected interface. A table appears in the Interface Viewer, showing Counts, Rates, and Percentages for Inbound and Outbound Octets, Packets, Unicast packets, Non-Unicast packets, Multicast packets, Broadcast packets, Discards, Errors, Changes, Alignment Errors, FCS Errors, and Late Collisions. These statistics cover the entire selected interface, cumulative for all subinterfaces if any.
The Rates page (Interface Viewer –> Performance –> Rates) shows inbound and outbound throughput and related rates for the interface, including Packet Rate, Broadcast Rate, Discard Rate, and Error Rate.The Percents page (Interface Viewer –> Performance –> Percents) shows inbound and outbound traffic statistics expressed as a percentage of total throughput, including % Utilization, Broadcast Percent, Discard Percent, and Error Percent.The Counts page (Interface Viewer –> Performance –> Counts) displays inbound and outbound traffic statistics expressed as counts, including columns of statistics for Octet Count, Packet Count, Broadcast Count, Discard Count, and Error Count.The Charts page (Interface Viewer –> Performance –> Charts) provides charts that show throughput, broadcasts/second, errors/second, and discards/second. Use the Measure list at the top of the page to select Rate or Percent for the charts' vertical axes.
Changing Performance Data Collection SettingsThe General Settings page (Interface Viewer –> Settings –> General Settings) enables you to apply or override the parent group's performance data collection setting, under the Performance Statistics Collection setting (group settings are defined in the Settings icon –> Setup section –> Collection and Groups page –> Groups tab –> Interface Groups side tab).
To ensure collection of all performance data for the specific device, choose the Enabled option.
Choose the Use Default option if you want performance information collection to only use the parent Interface Group's settings.
Interface performance data covers a broad selection of network phenomena, including but not limited to the following: Port throughput, bandwidth utilization, packet errors percentage, broadcast packet percentage, and packet discard percentage.
A second option, Switch Port Management Control, enables or disables the current interface from management by Switch Port Manager.
Viewing Interface HistoriesInterface histories consist primarily of First Seen and Last Seen values, indicating the date and time when the interface was first seen by the appliance, and the date and time when the appliance last polled the device and interface. Other information fields in the Interface History table include, but are not limited to, the following:
Device Name: The name of the device hosting the interface.IF MAC: The MAC address of the interface.

Infoblox NetMRI 7.4.4 Administrator Guide Part 3 Device and Network Exploration
Copyright ©2020, Infoblox, Inc. All rights reserved. Page 184
••
•••
1.2.3.4.
••••••
••
If Oper Status: Shows whether the interface is operationally Up or Down.If Admin Status: Shows whether the interface is administratively Up or Down.
Port Control SettingsNetMRI allows administrators to control basic operational settings for managed routers and switches. The following three functions are available in the Port Control page (Interface Viewer –> Settings –> Port Control Settings):
Admin Status: Set the port to administratively Up or administratively Down.Interface Description: A text label describing the port.VLAN ID/Name: Change the VLAN assignment for a switch interface. Click Edit for any feature.For Admin Status, ports can be set to Up or Down from the drop-down menu.
For VLAN ID/Name, the feature will work for switch or switch-router ports that support VLAN assignment. Choose the VLAN ID from the VLAN ID drop-down list (new values are not entered in this location) and the VLAN Name from the VLAN Name drop-down list. A port can be set to disable any VLAN assignment by enabling the No VLANcheckbox.
In all cases, click Save to commit settings.
Editing the Port ListPorts listed in the Port List page (Settings icon –> Setup –> Port List) are probed when Port Scanning is enabled at Settings icon –> Setup section –> Collection and Groups –> Global tab –>Network Polling panel.
To add a port to the list, complete the following:
In the Add Port panel, select the port's Protocol: TCP or UDP.Type the Port number.Type the port's Service.Click Add.
To delete a port from the list, click the Delete button for the port.
Viewing Device Collection StatusThe Device Collection Status page (Settings icon –> Setup –> Device Collection Status) shows internal processing information about device collection. This page is used primarily for technical support purposes.
You can see the following information here:
Property Group: A group of data that NetMRI collects from specific device type and vendor at a given frequency.Device Type: Vendor: Objects: Frequency: Threshold:
A property group is a collection of data that NetMRI collects from a given device type and vendor at a given frequency. The collections of data can include one of the following:
SNMP variables – for network devices.API calls – for SDN devices. SDN data is collected from controllers.
You cannot see the collection of data in a property group.

Infoblox NetMRI 7.4.4 Administrator Guide Part 3 Device and Network Exploration
Copyright ©2020, Infoblox, Inc. All rights reserved. Page 185
••
••••••
••
••
•
•••
•
••
Using the Interface Live ViewerThe Interface Live Viewer allows you to view and track traffic and event trends for any chosen network interface, and save chart data and images for the results. the Interface Live Viewer displays near-real-time graphs for the following interface properties:
Throughput in / utilization inThroughput out / utilization out
Throughput/Utilization graphs depend on the Display Mode setting; choosing Rate displays throughput, choosing Percent displays utilization.
Broadcast inBroadcast outErrors inErrors outDiscards inDiscards out
To access the Interface Live Viewer, complete the following:
1. Right-click any interface hyperlink, then click Interface Live Viewer in the pop-up menu.Or, in the Interface Viewer, click the Viewer Tools icon, and then click Live Viewer... in the drop-down menu.Or, in the Interface Viewer –> Performance section –> Charts page (which displays static data), click the Live Viewer link next to the Measure field.
Within the graph, you can perform the following:
To see underlying data at a specific time, hover over that time in the graph.To hide or show a line, click the box to the left of the name in the legend below the graph.
If too many lines make it difficult to interpret the graph, hide lines having less value by clicking the colored check-box for any data type, at the bottom of the chart window.
To hide or show data callouts within the graph, complete the following:
In the graph, click the line for which you want to hide/show data.Or in the legend, click the respective name (underlined = data callout displayed, name not underlined = data callout hidden) in the Interface Live Viewer's control bar (above the graph).To change the time period shown in the graph, select the time in the Display Window drop-down list.
The display window of 5 or 15 minutes is based on an ideal polling frequency as defined in the Live Interface Poll Frequency setting (Settings icon –> General Settings –> Advanced Settings). The display window depends on the following factors:
The load on the device being polled.The load on the appliance polling the device.The network round trip time between the device and NetMRI.
Note that the actual display window time may be longer than the value selected in the Display Window drop-down list.
To view historical data, click Show History at the left end of the control bar. In the Show Historical Data dialog box, specify the day and time for the historical data's starting point. Historical data is always shown in a 15 minute window.To pause the display (this does not pause the underlying data collection), click the Pause button.To resume playing the display (after pausing), click the Play button.
Note
If the display remains paused after 24 hours, the data collection will stop.

Infoblox NetMRI 7.4.4 Administrator Guide Part 3 Device and Network Exploration
Copyright ©2020, Infoblox, Inc. All rights reserved. Page 186
•••
•
•
•••
•
To change the vertical axis units, select the desired units in the Display Mode drop-down list.To export data used to create the graph, click the CSV Export button.To export the graph as an image, click the Image Export button.
Interface Live Viewer settingsTwo settings for the Interface Live Viewer are provided in the Settings icon –> General Settings –> Advanced Settingspage under Data Collection:
Live Interface Poll Frequency: Sets the SNMP polling frequency (5 seconds to 60 seconds in 5 second increments).Live Interface Poller Limit: Sets the maximum number of interface pollers that can run simultaneously (1 to 10).
The polling engine continues to run for 15 cycles (where one cycle = Live Interface Poll Frequency) after the Interface Live Viewer window is closed. If you reopen the Interface Live Viewer before the 16th cycle, you will see live data collected during that time. If reopened after the 15th cycle, the Interface Live Viewer will start displaying a fresh data set.
Devices and InterfacesWhen NetMRI performs Discovery on devices in the network for the first time, they are organized into Device Groups and Interface Groups, using common-sense networking terms.
Device Groups and Interface Groups are the primary organizational units in NetMRI. You can create device groups in a nested structure, with some device groups subordinate to other device groups. You can apply device group membership criteria in the same ways with nested device groups as for device groups from earlier releases of NetMRI, which used a flat data structure and enforced all device groups as existing on the same peer level. You can now create a hierarchical list of device groups, comprised of top-level groups, with child device groups subordinate to them, and with child device groups further subordinate to their parent groups. For more information, see Creating Device Groups.
NetMRI uses device groups to organize device discovery results, generate separate scorecards, filter issues and to manage polling and processing for each device in the network. Device groups also offer control of Switch Port Management processes, including the ability to immediately carry out Switch Port polling in a device group.
Device groups can also be used for suppression of Issue reporting across sets of devices, and to modify the thresholds used by NetMRI for raising chosen issues. The use of Device Group suppression removes the need for manually suppressing undesirable issue instances and allows for instances that have yet to be raised to be suppressed before they are raised.
You can create device groups to organize devices according to business needs. Devices can belong to more than one group, and different sets of groups can be used for different purposes.
For example, you might create a collection of groups named North, South, East, and West that organize devices geographically, while creating another set of groups named Accounting, Sales and Engineering that organize devices along departmental lines. This allows you to manage devices across different dimensions, using similar mechanisms. With the groups described above, for instance, you can generate separate scorecards for all devices in the West or all devices used by Engineering. You decide on the organization, and NetMRI properly sorts everything.
The Device Shortcut MenuAnywhere an IP address appears as a hyperlink in the NetMRI appliance, you can right-click that hyperlink to open a useful shortcut menu.
Device Viewer: Opens the Device Viewer for the selected device associated with the hyperlink.Config Explorer: Opens the Config Explorer for the device associated with the hyperlink.View Running Config: Queries the chosen device and displays the contents of its currently running configuration file.Changes: Displays the device's Network Analysis –> Changes page in the Device Viewer.

Infoblox NetMRI 7.4.4 Administrator Guide Part 3 Device and Network Exploration
Copyright ©2020, Infoblox, Inc. All rights reserved. Page 187
•
•
•
•
•
••
Issue List: Displays the chosen device's Network Analysis –> Issues page in the Device Viewer. For more information, see Evaluating Issues in NetMRI.Policy Compliance: Opens the chosen device's Network Analysis –> Policy Compliance page in the Device Viewer, which shows the status of any Policies deployed against the chosen device.Topology Viewer: Opens the NetMRI Topology Viewer with the selected device as the central device shown in the map.Schedule Job: Opens the Job Details window, to set up a job script to run against the chosen device. For more information, see Job Management and Automation Change Manager. Execute Command: Similar to Schedule Job, this option opens an Ad Hoc Command function to allow entry of a single command string to the chosen device. The command syntax needs to be compatible with the selected device like JunOS for Juniper, IOS or CatOS for Cisco, and so on.Open Telnet Session: Activates the Telnet/SSH proxy to start a new Telnet session with the chosen device.Open SSH Session: Activates the Telnet/SSH proxy to start a new SSH session with the chosen device.
Telnet and SSH Proxy OperationThe NetMRI appliance functions as a Telnet and SSH session proxy for users to communicate by command line with devices on the network, including devices that the system sees and can reach, but does not manage. This functionality extends to Telnet or SSH sessions with NetMRI devices themselves.
The Telnet/SSH proxy also provides full VT100 emulation for systems and devices that need it. NetMRI provides a hard limit of ten concurrent SSH or Telnet sessions from any NetMRI instance to other devices. For example, if one user has seven Telnet sessions open on a NetMRI instance, all other users are limited to a total of three additional terminal sessions.
For any Telnet or SSH session, administrative users can define user CLI credentials for other NetMRI user accounts. The location for configuring is Settings icon –> User Admin –> edit User –> CLI Credentials tab. Accounts that can modify CLI credentials for themselves and other users include SysAdmin, UserAdmin and ChangeEngineer High. Without User CLI credentials, other users can still log in to devices using their own device-specific credentials. This is particularly handy for devices that are not directly managed by NetMRI, such as Linux systems, but for which a user has a specific account. Some devices that are detected and/or managed by NetMRI may not provide the same level of Telnet or SSH as NetMRI. This is an advantage of the Telnet/SSH proxy.
Some NetMRI user accounts, such as ChangeEngineer Low, will not be able to start terminal configuration sessions using the Telnet/SSH proxy. System credentials can also be used for Telnet/SSH sessions. For more information, see Creating Admin and User Accounts.
All session activity is logged. For more information, see User Audit Logs.
Note
Operations Center Only: The Telnet/SSH proxy works transparently in the OC as a two-tiered proxy to communicate to devices reachable by the individual collectors. The proxy is two-tiered because the OC cannot talk directly to devices–only Collectors can do so. Telnet/SSH operation is transparent and behaves normally when initiating sessions from the OC appliance.
Note
The default admin account cannot use the Telnet/SSH proxy feature through CLI. Create another account to use this feature. Alternatively, you can connect to the device through the web UI, for example, using Anyterm SSH console, to be able to use this feature.
Note
All Telnet/SSH proxy sessions have an inactivity timeout of five minutes. This value cannot be changed. NetMRI allows only one session to a device from the same NetMRI instance.

Infoblox NetMRI 7.4.4 Administrator Guide Part 3 Device and Network Exploration
Copyright ©2020, Infoblox, Inc. All rights reserved. Page 188
1.2.
••
1.2.3.
To open a Telnet or SSH session with a device, perform the following:
Right-click on the IP address hyperlink for a device. The shortcut menu appears.From the menu, select Telnet Session or SSH session based on your preferences.
Using CLI ProxyIn addition to using Telnet and SSH sessions as proxies, you can connect to network devices using the CLI proxy. This feature allows users with valid privileges to proxy a connection to network devices through NetMRI. Superusers can grant the following privileges to control user access to the CLI proxy feature:
Terminal: Open Session: This permits users to connect to network devices.Terminal: User System Creds: This permits users to use the credentials stored on NetMRI to access network devices.
For information about specifying privileges, see Defining and Editing Roles.To connect to specific devices, users must also have permissions to the corresponding device groups to which the devices belong. Authorized users can use any SSH client to gain proxy connection using their NetMRI credentials, without the need to acquire the credentials for individual devices. With valid privileges, users can use the Connect command to connect to the devices from any SSH client. For information about the command, see Using the Connect Command. The CLI proxy feature connects only through the management interface on the NetMRI appliance. This helps eliminate the need to gain access to the user's computer through various networks, VRFs, and VLANs. Note that all connections and commands issued to any network devices through the CLI proxy are audited and logged. For information about audit logs, see User Audit Logs.
Using the Connect CommandUse the Connect command to connect to network devices from any SSH client. Users only need a connection to the NetMRI Management interface to connect to any managed devices. Users can connect to devices in groups to which they have valid permissions. You can view the audit logs for all events when the users use the Connect command to access network devices.
Example
Netmriuser > connect {device ip | device name} <Network View>
where <Network View> is the name of the network view.
Connecting to Managed Devices through the CLI Proxy
To connect to a managed device via the CLI proxy, complete the following:
Connect to the NetMRI Management IP address using an SSH client of your choice.Log in using the same username and password you would use to log in to the NetMRI Web interface.Connect to a device using the Connect command. Example: connect 10.0.1.24. If there are multi-network deployments, you must specify the name of the network view in the Connect command. Example: Connect 10.0.1.24 "Network 1".
Connecting Automatically to Managed Devices
You can configure an SSH connection to automatically connect to a managed device using SSH environment variables. Using this feature, you can save shortcuts to the devices to which you frequently connect.
Note
Before typing, click in the browser-based Telnet or SSH session window after you open a session.

Infoblox NetMRI 7.4.4 Administrator Guide Part 3 Device and Network Exploration
Copyright ©2020, Infoblox, Inc. All rights reserved. Page 189
•
•
1.2.3.
•
•••
You can use the following environment variables to set up the automatic connection:
CLI_PROXY_HOST: The IP address or hostname of the device you want to automatically connect to after you log in to NetMRI.CLI_PROXY_NET: The name of the network view in which the device resides. This is required only for multiple network deployments.
The following example illustrates how to use these environment variables through PuTTy:
Start a PuTTy session.In the PuTTy Configuration window, go to the Connection –> Data –> Category section.As illustrated in Figure 14.1, perform the following in the Environment variables section:
Enter CLI_PROXY_HOST 210.20.20.5.
Figure 14.1 Configuring Environment Variables in PuTTy Session
5. Click Open.
User Audit Logs
Audit logs are an important tool for tracking the following event types:
Configuration collection logging after discovery.CLI Credential guessing and CLI sessions through the Telnet/SSH proxy.Connections and commands issued to devices through the CLI proxy.
When you display a single audit log entry, a complete screen dump of the entire session is shown in text format. Session audit logs are kept by the appliance for a rolling 30-day time window. Audit logs are available at two levels: system-wide
Note
If the contents of an audit log are of interest and must be kept for a longer term, save the log contents into a separate text file, as the log will drop off of the system 30 days after it appears. Audit logs are unique to each device.

Infoblox NetMRI 7.4.4 Administrator Guide Part 3 Device and Network Exploration
Copyright ©2020, Infoblox, Inc. All rights reserved. Page 190
•
••
••
•
•
•
•
•
•
•
(under Settings), and for individual devices (in the Device Viewer). Error events you see here are normally associated with credential guessing operations by NetMRI and user-initiated SSH/Telnet sessions to individual devices.
For CLI Credential guessing and Telnet/SSH session attempts, you will see messages for the following phenomena:
Invalid Credentials: In which a connection attempt is made through Telnet/SSH, and the login tuple is used but the distant end rejects it. This occurs after NetMRI successfully communicates with the device, and the initial attempts with username/password combinations fail.Connection Closed by Foreign Host: This is usually due to enforced telnet or SSH session timeout on the device.Timeout Waiting for Device: NetMRI's discovery polling or data collection timed out due to lack of response from the device.*No Route to Host: The device is now not reachable.Bad Secrets for Enable Mode: An incorrect Enable password was sent by NetMRI and the device rejects the attempt to enter Enable mode.
For configuration collection logging, you may see messages of the following types:
Config collection disabled globally: The current instance of NetMRI has disabled all Config Collection features (go to the Settings icon –> Setup –> Collection and Groups –> Config Management side tab to check and enable collection settings).Config collection disabled globally for all protocols: The current instance of NetMRI has enabled Config Collection but none of the protocols for gathering data (telnet, SSH, HTTP) are enabled (go to Settings icon –> Setup –> Collection and Groups –> Config Management side tab to check and enable collection settings).Not Included by Discovery Settings: The device in question is not part of any IP range, is not specified as a static IP, and does not match any device Hints and is not a seed router. (go to Settings icon –> Setup –> Discovery Settings to check values for each of the four setting types. This message appears only for attempts to get configurations from the device.Not Licensed: Device is not licensed under NetMRI. This message appears only for attempts to get configurations from the device.Config collection disabled at device group level: NetMRI has disabled Config Collection features for a specific Device Group (go to Settings icon –> Setup –> Collection and Groups –> Groups –> Device Groups side tab to check and enable collection settings for a Device Group).History Indicates Config not Changed: No configuration changes have occurred since the previous fetching of configuration data. This message appears only for regular device polling operations on managed devices.CLI credentials unknown: All attempts at guessing or logging in to a device after discovery are unsuccessful.
To view a device's user audit log, go to Device Viewer –> Settings & Status –> User Audit Log. The audit log appears as a cumulative list for all Telnet/SSH sessions for the individual network device or end host for the last 30 days.
Using the Device Audit Log
The Device Audit Log (Device Viewer –> Settings & Status –> Device Audit Log) provides a device-specific list of events related to the device's management by NetMRI. You can expect to see messages such as LicenseAdd, indicating when the device was added to NetMRI management into a Device Group for purposes of Switch Port Management or other licensing requirements. You may see DiscoveryDelete in a case where a device with a particular management port IP address was removed from NetMRI management due to another device being managed through the same IP.
A second Device Audit Log, in Settings icon –> Notifications –> Device Audit Log, provides a listing for all Discovery and Licensing messages for all devices managed by NetMRI.
When devices are removed from the license count for NetMRI or ACM, related event messages will appear.
Note
The System Administrator and View Audit Log privileges are required in order to view the Device Audit Log.

Infoblox NetMRI 7.4.4 Administrator Guide Part 3 Device and Network Exploration
Copyright ©2020, Infoblox, Inc. All rights reserved. Page 191
•
•
•••
•
••••
••
•
Introducing Device GroupsDevice groups are a fundamental organizing tool in NetMRI. You use device groups to gather devices with similar attributes and similar categories together, to perform device management tasks, or because you want to organize a set of devices into a group to perform specific processing tasks, or to prevent processing tasks from being performed.
NetMRI ships with pre-defined device groups. They group discovered devices based on their types and assurance levels. For more information, see Default Device Groups.
All device groups are divided into two types:
Basic device groups, which provide only basic categorization and processing features to limit processing loads on member devices. They are most useful for large collections of network devices that you know will not be actively managed, such as end-user network segments at the terminating end of Ethernet circuits.Extended device groups, which provide the full set of NetMRI device processing features on member devices. They provide network scores for the NetMRI Dashboard and enable management through user Roles and Privileges. Extended device groups also may impose a higher computation load on the appliance.
For more information, see Controlling NetMRI with Device Groups.
Default Device GroupsDefault device groups serve as good examples of how selection criteria and process settings can be defined to organize your network devices, but you should learn how to create your own device groups to gain all of the benefits of the device groups feature.
The default set of device groups in NetMRI appears as a hierarchical list and includes the following:
Network Management: Any devices, including NetMRI appliances, that perform network management tasks.Security Control: All firewall, VPN concentrator, and security management devices.Network w/o SNMP: Devices that are discovered, but also discovered to lack support for SNMP protocols. This device group is required for NetMRI operation and cannot be deleted by the administrator.NIOS: Device group that contains Infoblox NIOS appliances supporting the Grid Manager environment for DNS, DHCP, IPAM, and other features, if any are present in the network.Routing: L3 routing devices that perform no switching or VLAN support.Switch-Routers: L2/L3 switches that support routing protocols and VLANs.Switches: L2 switches that do not support VLANs.UNKNOWN: Includes devices that are not identified, perhaps because NetMRI does not provide device support for the devices. Newly found devices first appear in the UNKNOWN group, with SNMP collection and port scanning enabled to learn more about them. If more is learned, devices disappear from this group and appear in higher-level groups, where their process settings change accordingly. This device group is required for NetMRI operation and cannot be deleted by the administrator.Network Management: All NetMRI appliances and other devices used for network management tasks.Network Pending: All devices discovered and in processing by NetMRI, but not yet managed by NetMRI. This device group is required for NetMRI operation and cannot be deleted by the administrator.NAME ONLY: All discovered devices for which only their name is determined by NetMRI's discovery feature based on DNS. If more is learned, such as their SNMP community, devices disappear from this group and appear in higher-level groups, where their process settings change accordingly. This device group is required for NetMRI operation and cannot be deleted by the administrator.
Default device groups can be used as-is, edited to suit your needs, or removed completely if you have admin rights to do so.
Note
Use caution when deleting default device groups. The Routing, Switching, NIOS, Optimizers, Security, and many other groups are groups built-in with NetMRI and should never be removed without first having developed new groups with the desired functionality to take their place.

Infoblox NetMRI 7.4.4 Administrator Guide Part 3 Device and Network Exploration
Copyright ©2020, Infoblox, Inc. All rights reserved. Page 192
•
••
•
•
••••
•
••
••
•
Using the Device Group SelectorThe main Dashboard, Network Analysis, and Network Explorer pages show the Device Group Selector control on the right. Simply click a device group name in the selector to filter the contents of the main display pane. To edit a device group, right-click any device group name and select Edit Device Group, or click the Edit Device Group icon.
All top-level device groups can act as top-level device groups for nested device groups. Nested device groups can only contain devices from the parent device group. You can nest child device groups up to five levels deep in the tree. By default, child device groups automatically appear in the tree but can be hidden by clicking the (-) symbol next to the parent group.
Controlling NetMRI with Device GroupsBasic device groups limit their processing options to a minimum. Basic device groups do not contribute to NetMRI Network Scorecard calculations and significantly reduce back-end processing. You can define group membership criteria. For more information, see Understanding Device Group Membership Criteria.
Extended device groups provide a substantial collection of settings to determine how an extended device group processes its information. Along with defining group membership criteria, a number of options help determine the level and types of processing performed by an extended device group:
Include non-network devices: Enables collecting end host network segments into a basic device group to avoid expending system processing cycles on network devices that do not require them.Rank: For more information, see Ranking Device Groups.Polling Frequency: Allows you to modify the default polling frequency for all devices or for specific device groups. For more information, see Creating Extended Device Groups.Switch Port data collection: Enable this only for device groups with L2/L3 Ethernet switching devices as members. This allows you to enforce custom periodic or scheduled polling settings for specific groups. For more information, see Device Groups and Switch Port Management.Collect performance and environmental data: Enable or disable device performance and environmental information. For more information, see Changing Performance Data Collection Settings.Probe for open ports: Allows NetMRI to probe for open TCP/UDP ports on member devices.Identify device using fingerprinting: For more information, see Defining Group Data Collection Settings.Probe for NetBIOS name: For more information, see Defining Group Data Collection Settings.Analyze for Issues: For more information, see Evaluating Issues in NetMRI and Viewing Device Issues, Configurations, and Changes.Test for default credentials: Allows NetMRI to test all devices in the group for the presence of vendor default SNMP credentials, which are a potential element for security breaches, but are also used for assistance in collecting device configurations. Credential default testing is also a compliance measure.Collect config files: For more information, see beginning with Configuration Management.Regard configurations as 'Locked': Disallows editing of any collection configuration files for members of the device group.Allow script execution: Allows the execution of Perl and CCS scripts on group member devices.Enable Discovery Blackout: Define time periods when NetMRI will not communicate with devices or networks for discovery.Enable Change Blackout: Define blackouts for CLI interaction, scheduled or run-now job executions, Telnet/SSH proxy, and port control UI features for all devices in the group. For more information, see Defining Blackout Periods.
All settings are further described in the topic Creating Device Groups.
You can convert basic device groups to extended device groups, and also the reverse, at any time.

Infoblox NetMRI 7.4.4 Administrator Guide Part 3 Device and Network Exploration
Copyright ©2020, Infoblox, Inc. All rights reserved. Page 193
1.
2.
•
•
•
•
Some types of network devices warrant more processing by NetMRI, such as the collection of performance and environmental data, open ports probing, NetBIOS name probing, collecting of configuration files, analyzing for issues, and other device processing features. Some device types can be quickly excluded from complex processing tasks by simply assigning them to a basic device group. Many end-host networks may fall into this category.
Device Groups and Switch Port ManagementThrough device groups, switch port management enables you to monitor and analyze the complement of Ethernet trunks and switch ports in their network. Switch port information gathering, or polling, is the key tool for doing this. Device groups can specify unique switch port management polling settings. Polling settings that are located under Settings icon –> Setup –> Collection and Groups –> Groups tab take precedence over the global settings defined in Settings icon –> Setup –> Collection and Groups –> Global –> Switch Port Management.
To poll a device group or create custom settings for polling, perform the following:
In the Device Group Selector, right-click the Switching device group and select Edit Device Group. The Edit Device Group dialog opens. The Switching device group is an extended device group that provides several features designed for Ethernet switching devices management.Open the Switch port data Collection dropdown. Select from the following options:
Use Global Settings: Enforces the use of global periodic or scheduled polling settings for the current device group. For more information see Global Switch Port Management Polling Settings.Specify polling Interval: Defines custom regular polling time periods for the group. Choose a polling interval of 1 or more Minutes or Hours, or click Poll Now to poll all devices that are members of the device droup.Specify schedule: Select an existing custom group schedule or click Add New Schedule to create a new custom schedule for recurrent polling of the group. Select a Recurrence Pattern of Once, Hourly, Daily, Weekly, or Monthly. In all cases, you must choose an Execution Time. Click Add when finished defining the new schedule. To delete a schedule from the list, click the trashcan icon in the Actions column.Disable: Disables device switch port data collection for the selected device group. Disabling switch port data collection prevents NetMRI from collecting VLAN and switch forwarding data. This can affect neighbor topology for the switch and any connected devices to the switch possibly resulting in NetMRI not being able to accurately locate devices on the network. Disabling switch port data collection also prevents analysis of any VLAN-related issues for a disabled switch.
3. Click Save & Close or Save & New.
The settings you define here apply only to the chosen device group.
Ranking Device GroupsFor device groups, NetMRI uses the Rank setting to determine how and when each device is processed after it is discovered on the network. Also, device groups use Rank as a way of determining the actions to take on a device that is a member of more than one group. If a device is a member of two groups, one that is enabled for config collection, and in another that is not, the group with the highest rank determines if the configs should be collected for that device. Ranking for child device groups in the device group tree is hierarchical. Child groups ranking is always higher than the ranking of its parent. Group Ranking is also used as the default sort order for all group-related tables, with the highest rank shown first.
The default groups organize devices essentially into "network" and "non-network" devices, based on their type and assurance level. Network devices usually have SNMP and Config collection and analysis enabled, while non-network devices do not. This reduces unnecessary data collection and processing loads, allowing the appliance to work more efficiently for devices that matter most.
Note
For efficient system operation, NetMRI provides a limit of 250 Extended device groups and 250 Basic device groups. Use Extended groups sparingly to avoid significant load on the system.

Infoblox NetMRI 7.4.4 Administrator Guide Part 3 Device and Network Exploration
Copyright ©2020, Infoblox, Inc. All rights reserved. Page 194
••••
•••
•••
By selectively enabling and disabling data collection, you can fine-tune NetMRI performance, or ensure that NetMRI processes the most important devices when a Device Limit or Interface Limit, based on licensing, is exceeded. In such cases, the Rank associated with each group is used to determine which devices are within the limits (devices with the highest rank) and which are outside the limits (devices with a lower rank). In this way, the most important devices, as indicated by the group rank, are processed while others are not.
The Group Processing HierarchyNetMRI controls processing within device groups by a hierarchical collection of settings in the following order:
Global settings for network polling and configuration managementDevice group settingsDevice settingsInterface group settings
If you disable a specific process (such as SNMP collection) at a higher level, then all lower level settings are ignored. This allows administrators to quickly disable all processing of a given type, such as SNMP, without being forced to change individual settings.
Filtering by Device GroupWhen the Select Device Group panel is available (in the right panel), you can filter the contents of the center panel by device group.
To filter by device group, within the Select Device Groups panel, click the desired device group.To remove device group filtering, within the Select Device Groups panel, click All Devices.To edit device groups, click the Edit Device Groups button to the right of the Select Device Group heading.
The Collection and Groups page opens, showing the Groups –> Device Groups tab (also reachable by Settings icon –> Setup –> Collection and Groups –> Groups tab).
Creating Device GroupsYou can create and manage device groups in Settings icon –> Setup –> Collection and Groups –> Groups –> Device Groups side tab.
Both Basic and Extended groups can be created as either top-level, sibling, or child groups. NetMRI automatically assigns a parent group ID to the group you create. You can drag and drop a group in the tree for the desired position. For more information, see the following sections:
Creating a Top-Level or Sibling Device GroupCreating a Child Device GroupCreating Extended Device Groups
The table in the Device Groups side tab lists all device groups, with default sorting by Rank. Each row shows group configuration settings. Parent groups appear as folder icons indicating that child device groups exist beneath them in the tree. The device groups table provides a series of columns showing the status of various discovery and monitoring features that are enabled or disabled for each group.
Note
In the device groups tree, the Rank is displayed only for Extended groups.
Note
The number in parentheses after a device group name is the number of devices in the group.

Infoblox NetMRI 7.4.4 Administrator Guide Part 3 Device and Network Exploration
Copyright ©2020, Infoblox, Inc. All rights reserved. Page 195
When you hover over an icon or column heading in the table, a tooltip appears. For example, when you hover over an information icon in the MC (Membership criteria) column, it displays the complete text of the membership criteria regular expression. Any feature column that is cleared, without a checkmark, indicates that the given feature is not enabled for the device group.
Individual devices of certain types can override group-level settings. For information about device-level settings, see Interpreting Discovery Table Data.
The complete list of data points provided for every device group at all nested levels includes the following:
ARP (Refresh device caches) Indicates whether member devices in the group will have their ARP caches refreshed before collecting discovery data. NetMRI uses ARP cache refresh to control LAN switches from which switch-forwarding data is collected. For more information, see Notes on ARP, Switch Data Collection, and End Hosts.
SNMP Indicates whether the device group is set to enable SNMP data collection for member devices. SNMP collection can also be enabled/disabled for groups and devices.
PS (Port Scan) Indicates whether members of the device group will be scanned for open protocol ports. If enabled, NetMRI probes the TCP and UDP ports listed at Settings icon –> Setup –> Port List, to determine whether they are open. For more information, see Defining Group Data Collection Settings.
FP (Fingerprint) Indicates the device group setting to use the Identify device using fingerprinting setting for member devices. (This setting is dependent on the Probe for Open ports feature.) A polling technique to identify each network device based on the response characteristics of its TCP stack. This information is used to determine the device type. In the absence of SNMP access, fingerprinting is usually the only way to identify non-network devices. For more information, see Defining Group Data Collection Settings.
C (Collect configs) Indicates the device group setting to allow config file collection for all members in the group (Collect config files).
CCS (CCS scripting) Indicates the device group setting to allow CCS script file execution for all members in the group (Allow Script Execution).
PP (Privileged Polling) Indicates whether the option CLI polling in privileged mode (i.e. privileged exec (enable) mode) is enabled for the group the device belongs to. You can override this setting for an individual device in the Device Viewer.
DC (Default Credentials) Indicates the device group setting for Test for Default Credentials, used to scan for the presence of vendor default credentials for all members in the group.
A (Issue Analysis) Indicates the device group setting to allow Issue analysis for all members in the group (Analyze for Issues). For more information about Issue analysis, see Viewing Issues in the Network.
CL (Config Lock) Indicates the device group setting to collect config data but to consider all member device configs a locked and not to be changed through NetMRI (Regard configurations as 'locked'). For more information, see Defining Group Data Collection Settings.
UGPF (Use Global Polling Frequency) Indicates whether the device group uses the global polling frequency value. For more information, see Setting Polling Frequency for a Device Group.
PF (Polling Frequency) Indicates whether the device group uses a custom polling frequency value. For more information, see Setting Polling Frequency for a Device Group.

Infoblox NetMRI 7.4.4 Administrator Guide Part 3 Device and Network Exploration
Copyright ©2020, Infoblox, Inc. All rights reserved. Page 196
1.2.
••
3.
4.
5.
6.
7.
NB (NetBIOS Scan) Device polling method to collect the NetBIOS name for endpoint devices in the network. Device groups also enable NetBIOS scanning. For more information, see Defining Group Data Collection Settings.
DB (Discovery Blackout) Indicates the device group setting to impose discovery blackouts. For more information, see Defining Blackout Periods.
CB (Change Blackout) Indicates the device group setting to impose configuration change blackouts. For more information, see Defining Blackout Periods.
SPMC (SPM Collection)
Indicates the device group setting to allow switch port data collection (Switch port data Collection). For more information, see Device Groups and Switch Port Management.
SPMS (Polling Schedule) Indicates whether the device group provides a polling interval or scheduling for switch port data collection. This setting is dependent on an enabled Switch port data Collection setting for the device group.
MC (Membership Criteria) Hovering the mouse over the check box in this column shows the complete regular expression for the selected device group. For more information, see Understanding Device Group Membership Criteria.
Creating a Top-Level or Sibling Device GroupBy default, a new top-level device group is inserted at the bottom of the list, denoting a lower ranking. Creating a sibling group allows you to insert a device group into a specific position in the list of device groups, defining different ranking for the new group. You can insert the new sibling group immediately above or below the selected upper-level group.
To create a top-level device group, complete the following:
Open the Settings icon –> Setup –> Collection and Groups –> Groups.Do one of the following:
To add a top-level device group, click Add in the bottom right corner of the groups window.To add a sibling group, right-click a top-level group and select Add –> Sibling Above or Sibling Below from the shortcut menu.The Add Device Group dialog appears.
In the Parent ID field, NetMRI automatically sets the ID of the parent group. It is "0" for a top-level or sibling group.Enter a Name for the new group. The group name is shown in all group-related displays and reports, so the group name should be meaningful without being too long.Enter a Membership Criteria regular expression. See Understanding Device Group Membership Criteria for details.For Type, select either Basic or Extended. By default, Basic is selected. For more information about extended device groups, see Creating Extended Device Groups.Click Save & Close or Save & New.
Creating a Child Device GroupChild device groups should only contain devices belonging to their parent group. Creating a child device group of the top-level group “Routing” and using a device group criteria regular expression to filter other devices (e.g., firewalls) will result in an empty device group.
The group membership criteria statements built into each device group, respectively:
$Assurance > 75 and $vendor eq "Cisco" and $type in ["Router","Switch-Router"]

Infoblox NetMRI 7.4.4 Administrator Guide Part 3 Device and Network Exploration
Copyright ©2020, Infoblox, Inc. All rights reserved. Page 197
1.2.
3.
4.5.
6.
7.
1.2.3.
4.
5.
6.
7.8.
9.
10.
$Assurance > 75 and $vendor eq "Juniper" and $type in ["Router","Switch-Router"]
To create a new child device group, complete the following:
Open the Settings icon –> Setup –> Collection and Groups –> Groups.Right-click a device group and select Add –> Child from the shortcut menu. The Add Device Group dialog appears.Select either Basic or Extended. By default, Basic is selected. For more information about extended device groups, see Creating Extended Device Groups.In the Parent ID field, NetMRI automatically sets the ID of the parent group.Enter a Name for the new child group. The group name is shown in all group-related displays and reports, so the group name should be meaningful without being too long.Enter a Membership Criteria regular expression. For more information, see Understanding Device Group Membership Criteria.Click Save & Close or Save & New.
Creating Extended Device GroupsTo create an Extended device group, complete the following:
Open the Settings icon –> Setup –> Collection and Groups –> Groups.Click Add to create a top-level, sibling, or child extended group.In the Parent ID field, NetMRI automatically sets the ID of the parent group. It is "0" for a top-level or sibling group.Enter a Name for the group. The group name is shown in all group-related displays and reports, so the group name should be meaningful without being too long.Define a Membership Criteria regular expression.
If you want the device group to include collections of discovered non-network devices, select Include non-network devices. Leaving this setting unselected prevents non-network devices from occupying valuable licensing space.Next to Type, click Extended.Rank: Displays the Ranking value as the default sort order. For more information, see Ranking Device Groups. Ranking value is used as the default sort order for all group-related tables, with the highest rank shown first. Rank is also used to determine the individual device settings controlling processing for each device.Polling Frequency: Allows you to slow down or speed up the device polling frequency. For more information, see the following section, Setting Polling Frequency for a Device Group.For Switch Port data Collection, choose from the following:
Note
When you create a child device group for an existing device group, the existing group changes its icon to a folder icon. That folder icon does not change the essential properties of the parent device group–the parent keeps all of its qualifying devices.
Note
Nested device groups also operate with Issue Analysis. For information, see Issue Analysis in NetMRI and its subsections. Nested device groups inherit their Issue settings from their parent device groups, and may need editing to suppress Issues that are not relevant to them.
Note
Infoblox recommends using regular expressions for refining the membership in device groups. The topic Understanding Device Group Membership Criteria provides the information you need to understand and define regular expressions for device groups.

Infoblox NetMRI 7.4.4 Administrator Guide Part 3 Device and Network Exploration
Copyright ©2020, Infoblox, Inc. All rights reserved. Page 198
•
•
•
••
11.
•
•
•
•
•
•
•
•
•
••
Use Global Settings: Select this to enable the device group to inherit global settings for switch port data collections. You can find the global settings in Settings icon –> Setup –> Collection and Groups –> Global–> Switch Port Management. For more information, see Global Switch Port Management Polling Settings.Specify Polling Interval: Overrides the global polling interval with a custom polling interval for the current device group. You can define an interval of 1-60 Minutes or 1-24 Hours in the fields that appear.Specify Schedule: Overrides the global scheduled polling setting with a custom schedule for the current device group. Existing schedules may appear in the list or, click Add New Schedule to create a new polling schedule instance. Choose a Recurrence Pattern of Once, Hourly, Daily, Weekly, or Monthly. In all cases, you must choose an Execution Time and select at least one day of the week check box.Poll Now: Click to execute switch port polling on the device group right after it is created.Disable: Completely disables switch port polling for the device group.
Activate the processing options for the new Extended group:
Collect performance and environmental data Enable or disable device performance and environmental information for all member devices in the group. For more information, see Changing Performance Data Collection Settings.CLI polling in privileged mode: Enable or disable CLI polling in privileged exec mode for the device group. You can override this setting for individual devices in the Device Viewer.Probe for open ports: If enabled, TCP and UDP ports listed at Settings icon –> Setup section –> Port Listare probed to determine whether they are open.
Analyze device using fingerprinting: If enabled, fingerprinting attempts to identify each device based on the response characteristics of the TCP stack being used.
Probe for NetBIOS name: Setting to enable NetMRI to collect the NetBIOS names for endpoint device members in the device group. For more information, see Defining Group Data Collection Settings. It is globally disabled by default to prevent unexpected scanning of the network by a new Operations Center Collector.Analyze for Issues: NetMRI evaluates over 250 discrete Issues, plus custom Issues defined by the admin user. Issues are discovered and reported by NetMRI based on globally set schedules. Disabling this feature for a device group disallows the group from being selectable in the Device Group Selector panel in the main Network Analysis –> Issues page. For more information, see Evaluating Issues in NetMRI, and Viewing Device Issues, Configurations and Changes.Test for default credentials: Allows NetMRI to test all devices in the group for the presence of vendor default SNMP credentials, which are a potential element for security breaches, but are also used for assistance in collecting device configurations. Credential default testing is also a compliance measure.Collect config files: When enabled, this check box allows NetMRI to collect all present configuration files for devices in the device group. To participate in the Configuration Management feature set, which allows you to view and compare differences between running-config and saved-config configuration files, edit, and manage config files on devices. For more information, see Configuration Management.
Regard configurations as 'Locked': Disallows editing of any collection configuration files for members of the device group.
Allow script execution: Allows the execution of Perl and CCS scripts on member devices.Refresh device caches before collecting switch port data: Check box to enable refreshing of ARP caches on switches and switch-routers in the managed network before NetMRI performs polling of switch ports.Enabling this feature will not produce an automatic ping sweep of the managed network. For more information on ping sweep, see Defining Group Data Collection Settings. The benefit of this feature is that it enables more accurate detection of all endpoint devices on switches. Without ARP refresh, some endpoint devices may not be detected. This feature is globally disabled by default. With this setting globally enabled, individual device groups can also be set to enable or disable this feature.
For more detailed descriptions of these options, see Global –> Network Polling and Config Management.
12. Select the Enable Discovery Blackout check box and click its Scheduling icon. The scheduling options appear.
Note
The polling frequency modifier described in the previous step does not affect settings for switch port data collection frequency.

Infoblox NetMRI 7.4.4 Administrator Guide Part 3 Device and Network Exploration
Copyright ©2020, Infoblox, Inc. All rights reserved. Page 199
a.
b.•••
••
•••
••
•
In the Recurrence Pattern dropdown, choose how often you want to execute the blackout period. You can select Once, Daily, Weekly, or Monthly.If you choose Once:
Choose an Execution Time from the drop-down list.Enter the date of the blackout, in the Day_of_ field.Specify the Duration: 10 or more Minutes, Hours, or Days.
c. If you choose Daily, click either Every Day or Every Weekday:
Choose an Execution Time from the drop-down list.Specify the Duration: 10 or more Minutes, Hours, or Days.
d. If you choose Weekly, complete the following:
Choose an Execution Time from the drop-down list.Check the check boxes for one or more days from Sunday through Saturday.Specify the Duration: 10 or more Minutes, Hours, or Days.
e. If you choose Monthly, complete the following:
Choose an Execution Time from the drop-down list.Schedule the day of the month: A discovery blackout can be executed monthly on a specific day, or blackout instances can be executed more than one month apart on a specific day, in the Day ofevery month(s) field.Specify the Duration: 10 or more Minutes, Hours, or Days.
13. If necessary, select the Enable Change Blackout check box and click its Scheduling icon. The scheduling options appear. Follow steps 12a through 12e to define the change blackout schedule.
14. Click Save & Close or Save & New.
Setting Polling Frequency for a Device GroupYou can set global or individual polling frequency for an extended device group. You do so by specifying a polling frequency modifier. This is a coefficient by which the default NetMRI setting is multiplied. The higher the coefficient, the more frequently devices in the current group are polled.
Note
For more information about discovery blackouts and change blackouts, see Defining Blackout Periods.
Note
Some devices in your network may have a locked Config Change setting (Device Viewer –> Settings & Status –> General Settings), which means that NetMRI will be disallowed from changing configurations on the device. In these cases, a device-level Enable Change Blackout setting is unnecessary. Similarly, each NetMRI device group has a Regard configurations as 'locked' setting. If a device group uses this setting, the Enable ChangeBlackout setting is unnecessary. If a device group does not enforce a change blackout, but a device in that group enables the Regard configurations as 'locked' setting, the device setting takes precedence.
Note
Setting a custom polling frequency may affect performance. High modifier coefficient results in polling performed more frequently, so the NetMRI unit may be more busy than usual.

Infoblox NetMRI 7.4.4 Administrator Guide Part 3 Device and Network Exploration
Copyright ©2020, Infoblox, Inc. All rights reserved. Page 200
•••
1.2.3.
•
•
4.
1.
1.
2.
1.2.
The default NetMRI polling frequency is located in Settings icon –> Setup –> Device Collection Status. The global polling frequency modifier is located in Settings icon –> General Settings –> Advanced Settings –> Data Collection –> Polling Frequency Modifier.
You can set values between 0.5 and 2 for the global or group-level polling frequency modifier. Interpret the values as follows:
0.5: Makes polling twice slower.1: Means same polling frequency as the default setting.2: Makes polling twice faster.
As NetMRI recalculates polling frequency every 10 minutes, the new polling frequency is applied to the group not later than 10 minutes after you specified it.
The polling frequency modifier affects SNMP credentials guessing. For example, by default it happens once a day. With the polling frequency modifier, you can make it happen twice a day or once in two days. This setting does not affect the frequency of CLI credentials guessing or config collection.
To set polling frequency for a device group, complete the following:
Open the Settings icon –> Setup –> Collection and Groups –> Groups.Click Add for a new group or open an existing extended device group for editing.In Polling Frequency, select one of the following:
Use Global Settings: Select this to enable the device group to inherit the global polling frequency modifier setting.Specify Polling Frequency: Allows you to set individual polling frequency for the current device group. If you select Specify Polling Frequency, the Polling Frequency Modifier field appears.
In the Polling Frequency Modifier field, specify the coefficient that modifies the device group polling frequency relative to the default NetMRI setting.
Additional Device Group OperationsTo view a list of device group members (devices that are included in the device group), complete the following:
Click the Action icon for the group, and choose View Members from the shortcut menu. A new browser popup window appears, displaying the list of member devices. Clicking the IP address for any device brings up the Device Viewer.
To copy a group (to use as the basis for a new group), complete the following:
Click the Action icon for the group, and choose Copy from the shortcut menu. The new group is initially named "Copy x of <original name>".Edit the new group's name and settings.
To delete a group, complete the following:
Click the Action icon for the group, and choose Delete from the shortcut menu.Confirm the deletion.
Device Groups Action MenuThe Device Groups page provides the complete list of top-level device groups, populated with a series of gear icons. Clicking each icon displays a shortcut Actions menu offering group editing features: for device groups, features include the following:
Note
Currently, the polling frequency modifier does not apply to SDN devices as they use a different polling engine.

Infoblox NetMRI 7.4.4 Administrator Guide Part 3 Device and Network Exploration
Copyright ©2020, Infoblox, Inc. All rights reserved. Page 201
•
••
Add: This option enables the creation of new device groups at the same level in the group hierarchy as the current group (Sibling Above and Sibling Below) and provides the Child Below option, which allows you to create a nested device group that is subordinate to the group you've currently selected.View Members: Lists the devices within the group, displaying the list in a separate window.Copy, Edit, and Delete: These perform their respective functions on the selected device group. The Edit feature provides all the standard device group editing capabilities, including changing blackout periods, data collection settings, membership criteria, and Rank settings.
NetMRI ships with pre-defined device group definitions. These groups are based on device types and assurance levels (the probability that from the same has correctly identified a given device) and are primarily used to see what has been discovered on the network. Default device groups can be used as-is, edited to suit your needs, or removed completely (provided you have admin rights to do so.
Use caution when deleting device groups. The Routing, Switching, NIOS, Optimizers, Security, and many other groups are groups built-in with NetMRI and should never be removed without first having developed new groups with the desired functionality to take their place.
Default device groups serve as good examples of how selection criteria and process settings can be defined to organize your network devices, but you should learn how to create your own device groups to gain all of the benefits of the device groups feature.
Understanding Device Group Membership Criteria
Group membership criteria expressions are simple logical expressions used to determine if a given device or interface should be included in a Device Group or Interface Group based on the properties associated with that device or interface. In other NetMRI contexts, such as Security Management, this process is also called filtering. A device group uses its filtering settings, called membership criteria, to determine which devices discovered by NetMRI will belong to that group.
If the device matches more than one group criteria, it is assigned the rank of the highest matching group and all of the settings for that group.
Device Groups also determine how its member devices will be interacted with by NetMRI. For example, if SNMP Collection or Config Collection are disabled for the highest ranking group containing a given device, then no SNMP data collection or Configuration file collection is performed for that device (beyond the initial collection needed to detect its existence). You use the same processes and settings to define Interface Groups (described in Creating Interface Groups.) The process for Device Groups is straightforward.
An example of a regular expression comprising the membership criteria for a Device Group:
$Assurance > 75 and $Type in ["Router","Switch-Router"]
This regular expression is used to define the Routing device group. Note the use of Boolean logic and the enclosure of two NetMRI device group types (Router and Switch-Router) in square brackets. Two unique NetMRI variables, $Assurance and $Type, are used as the filtering criteria to define what belongs in the group. Typically, at least two variables must be used to create accurate filtering for a Device Group definition. The $Assurance value is the value attached to every device by NetMRI after it is discovered, to certify the device type is determined correctly. Consider an expression for a custom Device Group definition:
$Assurance > 75 and $vendor eq "Juniper" and $type eq "Firewall" and $Access eq "on"
The more specific the expression, the more effective and specific that membership can be in the Device Group. The values to be matched against must, of course, be recognized by NetMRI.
Group membership criteria are also used to define the Device-Filter and Section-Filter directives in Configuration Policy Definition (CPD) files, and Script-Filter directives in Configuration Command Script (CCS) automation scripts. In these cases, if a device matches, then the CPD file or CCS script is used to analyze that device. You can create
Note
One way to understand how you define membership criteria for device groups is to look at existing Extended device groups in the system, including Routing, Switching, and Security.
Infoblox NetMRI 7.4.4 Administrator Guide Part 3 Device and Network Exploration
Copyright ©2020, Infoblox, Inc. All rights reserved. Page 202
••
•
•
•
custom files or scripts to define new criteria. You do not need to use CPD files or CCS scripts to create new Device Groups or Interface Groups.
For Interface Groups, the processes are similar, with some useful differences in how the regular expressions are defined to filter out interfaces reported in the device configuration.
$Type in ["Switch","Switch-Router"] and $ifType like /ether/ and $ifAdminStatus eq "up"
The Switch Port interface group uses the same variables to filter member ship. The $ifType like /ether/ variable expression indicates how an expression can be interpreted to add Ethernet ports of varying types to the Group. the argument like allows a loose match against any port with the partial phrase ether in its identification. Considering the possibility of separating only 10/100 interfaces into a distinct group, you would use a more-specific expression such as:
$ifType like /FastEthernet/
Device Group Criteria and Device Custom FieldsDevice Groups offer the flexibility to specify custom fields data as matching information against custom fields identification values defined on individual devices. You specify custom fields information in device groups through the Device Group Criteria. Doing so, you can craft device groups that match specific types of information, such as Business Units, operational function, and so on. Based on the information in the section Defining and Using Custom Fields, you can create device custom fields (“device” is a specific type of custom field that you can create and use for data matching) that are referenced by specific device groups for collection of devices into logically-named groups in NetMRI for asset manageability.
Supporting custom fields in device groups requires some specific Device Group Criteria syntax. Because a custom field can use the same nomenclature as a standard device attribute (for example, the Custom Fields feature does not prevent you from creating a custom field named “Type,” “Vendor” or “Model”), the device group criteria uses a convention to prevent conflicts. To do so, you prefix every Device Group Criteria reference to a device custom field with a syntax constant:
$custom_
Consider the creation of a device custom field called “business_unit.” For information on how to create custom fields in NetMRI, see Defining and Using Custom Fields. Editing the Device Group Criteria field for a device group called “Consumer Banking Group” to support a device custom field, the typical syntax is as follows:
$Assurance > 65 and $Type in ["Router","Switch-Router",”Switch”,”Firewall”] and $custom_business_unit = "Consumer Banking"
You prepend the constant $custom_ to the value “business_unit” to create the expression $custom_business_unit = “Consumer Banking”. Doing so in the Device Group Criteria ensures that any device that possesses a matching field value will match the “Consumer Banking Group” device group.
Device Group and Interface Group Criteria for NetworksBecause devices are managed as part of one or more network views, you can define device groups or interface groups with criteria based on network membership.
You use the $Network variable in both Device Groups and Interface Groups:If the variable is applied to a device, it returns the name of the network view to which the device's Management IP belongs.If the variable applies to a device's interface, it returns the name of the network view to which the interface IP address belongs.
Example: $Network = "blue"
The hasnetwork operator returns a value of true if at least one device interface is part of the specified network views list:
Syntax example: hasnetwork[”blue”,”red”,”green”]

Infoblox NetMRI 7.4.4 Administrator Guide Part 3 Device and Network Exploration
Copyright ©2020, Infoblox, Inc. All rights reserved. Page 203
•
•
•
1.2.3.
4.
Device Group/Interface Group Membership and Issue SuppressionChange issue thresholds and suppress issues for device groups in the Settings icon –> Issue Analysis –> Issue Group Settings icon –> by Device Groups and by Interface Groups side tabs. After selecting a group in the left panel, the Issue Settings for Group table lists all issues for the group and shows the current thresholds (if any) in the Criteria column, and whether any listed issue is suppressed.
Consult the topics Issue Group Settings and Performing Issue Suppression for more information.
Creating Interface GroupsAfter Discovery, you can organize all interfaces discovered on the network into collections of named groups. Similar to device groups, interface groups can be used to organize interfaces for results analysis, troubleshooting or to manage interface data collection. Interface group membership is determined periodically and stored in the database. Interface Groups have considerably narrower use in NetMRI compared to Device Groups.
NetMRI ships with a set of common-sense default interface groups that automatically organize common interfaces, such as switched Ethernet ports, VLANs and Ethernet trunk interfaces. Interface groups can be modified or copied, pasted and edited to create new ones, or you can create entirely new groups (provided you have admin rights to do so).
Interface Groups Action MenuThe Interface Groups page provides an Actions column, populated with a series of gear icons. Clicking each icon displays a shortcut Actions menu offering group editing features: for interface groups, View Members lists the interfaces within the group. Copy, Edit, and Delete perform their respective functions on the selected group.
Use caution when deleting interface groups; the Admin Down, Trunk Ports, Active Router Interfaces, and Switch Portsgroups are built-in groups with NetMRI and should not be removed without first having developed new groups with the desired functionality to take their place.
You create and configure interface groups in the Interface Groups page (settings icon –> Setup –> Collection and Groups–> Groups tab –> Interface Groups side tab). The benefits of using interface groups include the following:
Collect performance data at specific time intervals for particular port types (trunk ports, VLANs of a specific switch, router interfaces of a specific type, or any other arbitrary designation).Use regular expressions to strictly define the interfaces that qualify to be part of the group, ensuring accurate group membership.Obtain flow connection information.
The table in the Interface Groups side tab lists all interface groups, with default sorting by Rank. Each row shows group configuration settings, with a green check indicating that the option is enabled, and a red X indicating that the option is disabled.
Rank determines the process settings for individual interfaces that belong to multiple interface groups. An interface is assigned the process setting associated with the highest ranking group that includes the interface as a member.
To create an interface group, perform the following:
Go to Settings icon –> Setup –> Collection & Groups –> Interface Groups side tab.Click the Add Group button (below the Interface Groups table). The Add Interface Group dialog appears.Type a Name for the interface group. The group name is shown in all group-related displays and reports, so it should be meaningful without being too long.Enter a Rank for the interface group. For more information, see Ranking Device Groups for details.
Note
Interfaces can be a member of one or more interface groups.

Infoblox NetMRI 7.4.4 Administrator Guide Part 3 Device and Network Exploration
Copyright ©2020, Infoblox, Inc. All rights reserved. Page 204
5.
6.
••
1.
1.
2.
1.2.
•
Type a Membership Criteria expression. For more information, see Understanding Device Group Membership Criteria.Activate the processing options for the group.Performance Statistics Collection: If enabled, NetMRI collects performance data for interfaces in the group. If disabled, the appliance gathers minimal data for interfaces in the group. This setting can be overridden for an individual interface in the Interface Viewer –> Settings icon –> General Settings page.Frequency: Select the performance statistics collection interval. The default is set as Daily.
7. Click the Save & Close button.
or
Click the Save & New button to save/close the current group definition and start a new group definition.
To view a list of group members, click the View Members button for the group.To edit a group, click the Edit button for the group.
To view a list of interface group members, complete the following:
Click the Action icon for the group, and choose View Members from the shortcut menu. A new browser popup window appears, displaying the list of member interfaces. Clicking the Device IP for any device brings up the Device Viewer. Each interface listing provides a link for its respective Interface Viewer and its VLAN Viewer, where applicable.
To copy a group (to use as the basis for a new group), complete the following:
Click the Action icon for the group, and choose Copy from the shortcut menu. The new group is initially named "Copy x of <original name".Edit the new group's name and settings.
To delete a group, complete the following:
Click the Action icon for the group, and choose Delete from the shortcut menu.Confirm the deletion.
Exercise caution when deleting groups, because any associated group settings such as filtering and other attributes will also be deleted. For related information, see Expressions in Group Definitions.
Gathering Performance Data from Interface GroupsPerformance data consists of utilization rates, error rates and broadcast levels for the interfaces that are gathered into an interface group. You can also view the same performance data for each interface in the interface viewer.
Performance data includes configured speed, throughput, percent utilization, percent errors, percent broadcasts, and percent discards. Additional information can be displayed through selections from the Columns drop-down list available via column header menus.
By default, performance data collection is disabled for most interface groups. NetMRI provides two ways to enable performance data collection:
To enable performance data collection for an interface group: In the Settings icon –> Setup section –> Collection and Groups page –> Groups tab –> Interface Groups side tab, hover the mouse over the Action icon and choose Edit, and activate the Performance Statistics Collection checkbox.
Note
You can set the Frequency to be more frequent than the default Daily setting.

Infoblox NetMRI 7.4.4 Administrator Guide Part 3 Device and Network Exploration
Copyright ©2020, Infoblox, Inc. All rights reserved. Page 205
•
By default, collection takes place daily. For some interfaces, you may need to collect performance data more frequently. To do so, select a different setting from the Frequency dropdown. Values include Daily (the default), and incremental values from 15 minutes to 2 minutes.
To enable performance data collection for a specific interface: Open the interface in the Interface Viewer. In the Settings section –> General Settings page, enable Performance Statistics Collection by selecting Enabled from the dropdown menu and clicking Update. This setting overrides the parent interface group's setting.
Performance data collection uses interface groups to determine the data types to be collected and stored for each monitored interface. Because collection runs continuously, it needs to be informed when interface group definitions have been changed. Notification is done automatically if one or more group definitions have been changed since the last group generation process was performed (either scheduled or manual). If a definition changes while collection is taking place, the changes will not take effect until the next collection run.
At that point, interface data collection resumes collecting limited data for all interfaces to determine which should be further processed, based on the new definitions.
Use interface groups for suppression of certain interface related issues and to modify thresholds for their appearance. Interface group issue suppression removes the need to manually suppress undesirable issue instances and allows for instances that have yet to be raised — and to be suppressed — to be suppressed before they are even raised. You can review interface group issue suppression settings at the Settings icon –> Issue Analysis section –> Issue Group Settingspage.
Expressions in Group DefinitionsGroup membership expressions consist of one or more logical sub-expressions (e.g., equals, like, in), acting on a set of variables (e.g., $Name, $Type) evaluated by boolean operators (e.g., and, or, =>, <=). You can specify any logical membership criteria using sub-expression combinations. Some variables are defined only for certain types of criteria expressions.
Device VariablesNetMRI defines the following device variables that are usable in Device Group, Interface Group, Device-Filter, and Section-Filter criteria expressions:
$ID unique NetMRI ID for device$IPAddress IP address of the device (e.g., 192.168.1.33)$Name name of the device (e.g., rtr1.netcodia.com)$Network name of the Network View for the device's management IP address$Type type of the device (e.g., Router, Switch, etc.)$Assurance assurance level for the device type$Vendor vendor of the device (e.g., Cisco)$Model model of the device$Version software version of the device$Community SNMP community of the device
Note
You can use more-frequent data collection only on a select number of interfaces. Up to 10% of the total interfaces up to the Interface Limit in the managed network, based on the NetMRI license.
Note
Infoblox recommends that interface group definitions be changed only when necessary, or when data collection is disabled. This reduces the workload on the appliance.

Infoblox NetMRI 7.4.4 Administrator Guide Part 3 Device and Network Exploration
Copyright ©2020, Infoblox, Inc. All rights reserved. Page 206
$sysName SNMP system name (CPD only)$sysDescr SNMP system description (CPD only)$sysLocation SNMP system location$sysName SNMP system name$sysDescr SNMP system description$sysContact SNMP system contact
Interface VariablesThe following variables are defined for interfaces and supported in Interface Group criteria expressions:
$ifIndex unique SNMP numeric index for the interface$ifDescr interface description defined by user$ifName interface name$ifType interface type defined by SNMP$ifMtu interface MTU$ifPhysAddress interface MAC address (if any)$ifSpeed interface speed$ifAdminStatus interface administrative status ("up"/"down")$ifOperStatus interface operational status ("up"/"down")$ifTrunkStatus interface trunk status ("on"/"off")$Network returns the name of the network view to which the interface IP address belongs.
Comparison OperatorsThe following comparison operators are supported in all criteria expressions:
=, ==, !=, <, , <=, =
numeric comparison (The value on either side of the operator should be an integer, float or IP address.)
eq, ne, gt, lt, ge, le
string comparison (The value on either side of the operator should be a string.)
=~, !~, like, not like
regular expression (A non-string value on the left side of operator is converted to a string before comparison.)
in, not in
determines if a given value is contained in a list of values (The values inside of the list should be the same type as the value on the left side of the operator.)
memberOf, not memberOf
determines if the device or interface is a member of one or more other Device Groups and/or Interface Groups.
hasnetwork
determines if the device or interface is a member of a specific Network View.
Examples:
$ID = 30
$Vendor eq "Cisco"
$Version like /^12.1.*/
Note
All device variables and interface variables are case-insensitive.

Infoblox NetMRI 7.4.4 Administrator Guide Part 3 Device and Network Exploration
Copyright ©2020, Infoblox, Inc. All rights reserved. Page 207
$Model in ["cat4506", "3725"]
$IPAddress in [10.1.3.56, 10.2.0.0/16]
memberOf ["Router Group", "Switch Group"]
$Vendor eq "Cisco" and ($Model eq "catalyst2912XL" or $Model eq "cat3548XL")
To perform a case-insensitive match, use the regular expression modifier /i.
Example:
$Name like /core/i
The $Model and $IPAddress values work for creating device groups but cannot be used for building Rules with device attributes under Configuration Management –> Policy Design Center –> Rule.
$Model in ["cat4506", "3725"]
$IPAddress in [10.1.3.56, 10.2.0.0/16]
For Rules in the Policy Design Center, simply use a comma-separated format.
Logical OperatorsThe following logical operators can be used to combine sub-expressions:
and, &, && boolean AND or, |, || boolean OR (, ) grouping
Examples:
$Vendor eq "Cisco" and $Type eq "Router"
($Vendor eq "Juniper" and $Type eq "Router")
or ($Vendor eq "Cisco" and $Type in ["Router", "Switch"])
memberOf ["Routing Group”"] and $IPAddress in [10.1.0.0/16, 10.2.3.45]
Regular Expressions UsageNetMRI uses regular expressions similar to those supported by Cisco, JavaScript and Unix programming languages. Regular expressions supported for table filtering consist of a sequence of special symbols, modifiers and normal characters. NetMRI interprets the following single characters and expressions as follows:
^ Matches the beginning of the string
$ Matches the end of the string
. Matches any single character
[...] A set of matching characters such as [aeiouA-Z]
[^...] A set of non-matching characters
(...) A sub-pattern to be modified or remembered
(...|...) A set of alternate sub-patterns
\w Matches any word character; same as [a-zA-Z0-9]
\W Matches any non-word character; same as [^a-zA-Z0-9_]
\s Matches any whitespace character; same as [ \t\n\r\f\v]
\S Matches any non-whitespace character; same as [^ \t\n\r\f\v]
\d Matches any digit; same as [0-9]

Infoblox NetMRI 7.4.4 Administrator Guide Part 3 Device and Network Exploration
Copyright ©2020, Infoblox, Inc. All rights reserved. Page 208
\D Matches any non-digit; same as [^0-9]
To match any of the special characters above, enter the backslash (\) escape character immediately before them. Avoid spurious or excessive matches. To match all IP addresses starting with an initial octet of 10, use /10\./ as the pattern, not /10./ which matches 10., 100, 101, 102, etc. (remember, dot is a special symbol).
Examples:
$Vendor like /Cis.*/
$Type like /.*Switch.*/
$IPAddress like /10\.*[/]16/
Using Expression ModifiersWith the special symbols above, the following characters are treated as modifiers that can be used to match against a previous sub-pattern zero, one, or more times:
{N} Match the sub-pattern exactly N times
{N,} Match the sub-pattern N or more times
{N,M} Match at least N times and no more than M times
? Match the sub-pattern 0 or 1 times; same as {0,1}
* Match the sub-pattern 0 or more times; same as {0,}
+ Match the sub-pattern 1 or more times; same as {1,}
Modifiers can be used to reduce the size of the expression and to specify optional parts of the expression. They are useful when combined with parentheses to designate sub-patterns.
The pattern
/Se(rial)?\d+/\d+/
matches any serial interface designator, either in the short form (Se0/0) or the long form (Serial12/45).
Examples:
$Vendor like /Cis(co)?/ $
ifType like /Se(rial)?\d+[/]\d+/
You use regular expressions to match values selected from a larger database of values. For economy of effort, it is sometimes easier to specify “just enough” of a pattern to obtain the match. For example, though a valid IPv4 address is formatted as “A.B.C.D” where A, B, C, and D range from 0 to 255, an expression:
/^(\d{1-3}\.){3}254$/
ensures that the first three octets are in fact defined as numbers with dots in between, but is unnecessary to find all addresses ending with “.254” when a simpler expression
/\.254$/
which checks for the desired suffix will succeed.
Note
A common mistake occurs by using the Unix wildcard syntax (*) instead of the regular expression syntax (.*) to match any sequence of characters.

Infoblox NetMRI 7.4.4 Administrator Guide Part 3 Device and Network Exploration
Copyright ©2020, Infoblox, Inc. All rights reserved. Page 209
•••••••
••
•
Inspecting Devices in the NetworkNetMRI collects large quantities of low-level device data that can be viewed at any time. During troubleshooting, experienced admins can use low-level device information to help solve problems. The tool for viewing any device's diverse array of information is called the Device Viewer.
To open the Device Viewer for any device, click the device's hyperlink anywhere it appears in NetMRI displays.
To view different kinds of information in the Device Viewer, click the desired item in the right-side panel. Corresponding information appears in the main panel. Information in the Device Viewer depends on the device type.
The Device ViewerAll devices discovered by NetMRI can be inspected using the Device Viewer, including LAN switches, routers of any type, security infrastructure, servers, and virtual devices hosted by selected Cisco and Juniper systems.
When NetMRI successfully accesses a network device by SNMP, the top portion of the main Device Viewer panel shows the following information:
Network View: Listed at the end of the header identifying the device.Device Type: As detected by the appliance.O/S Version: The network operating system as reported by the device.Up Time: Time since the device was last booted.Last Communication: Date and time that NetMRI last communicated with the device, by any protocol.Vendor and Model: The vendor and product name/model of the device.SNMP Status: Indicates the state of local SNMP collection for this device. Enabled = NetMRI collects SNMP data from the device. For more information, see Defining Group Data Collection Settings.MAC Address: The MAC ID of the device.Discovery Blackout: Shows whether the device is currently in a discovery blackout. The three possible values that appear here are N/A which indicates that no blackout is scheduled for the current device, In Effect indicates that the device is currently in a discovery blackout period, and Scheduled indicates that a discovery blackout is scheduled for the current device but is not currently in a blackout, and operations may be performed on it.Change Blackout: Shows whether the device is currently in a change blackout. The three possible values that appear here are N/A which indicates that no blackout is scheduled for the current device, In Effect indicates that the device is currently in a change blackout period, and Scheduled indicates that a change blackout is scheduled for the current device but is not currently in a change blackout, and operations may be performed on it.
The Device Actions Menu
Note
Since they are simple browser pop-up windows, multiple Device Viewers can be open simultaneously.
Note
You can define individual devices' SNMP and CLI credentials in the Device Viewer. For more information, seeAdding and Testing SNMP Credentials for a Device and Adding and Testing CLI Credentials for a Device.

Infoblox NetMRI 7.4.4 Administrator Guide Part 3 Device and Network Exploration
Copyright ©2020, Infoblox, Inc. All rights reserved. Page 210
•
•
••
••••
••••
All Device Viewer windows provide a special Device Actions icon at the top. Click this icon for a menu offering useful tools for viewing related information about the chosen device.
Tools: Run Ping/Traceroute, SNMP Walk, Cisco Command (where appropriate), or run Discovery Diagnostic against the selected device.Topology Viewer: Display the topology in which the selected device resides, based on L2 or L3 characteristics of the network. The Topology appears in a separate popup window.
The Device Viewer organizes information about the currently displayed device in the following sections of its accordion menu (some of these sections may only appear for certain device types):
Network Analysis: section provides.Device/Network Explorer: This section provides networking information associated with the current device, including Device Identification, Device Location, Component Inventory, Open Services, CDP Neighbors, L2/L3 neighboring interfaces (Neighbors), Custom Data, LLDP neighbors, and Device History, which lists the Discovery history for the device.Interfaces: Provides configuration information, the address table, and performance statistics.Router: Provides router-specific information.Switch: Provides switch-specific information.Settings & Status: Displays device general settings, management status, SNMP credentials, CLI credentials, configuration file collection settings, logs, and device support information.
Viewing Device Issues, Configurations, and Changes
The Device Viewer's Issues page (Device Viewer –> Network Analysis –> Issues) lists issues associated with the selected device in the network.
The Detected Changes chart provides an adjustable view of Issue trends for the current device. The time period resides on the horizontal X-axis, and the measurement, in the number of issues, is on the vertical Y-axis. Click the Time Selector drop-down menu to change the X-axis time period for the Historic chart.
The Detected Changes chart displays up to the following four data sets: Adds, indicating the quantity of new Issues for each time period, Same, indicating Issues the time period that remain from the preceding time period; Cleared, indicating Issues that have been cleared from the system due to administrative remediation or other causes; and Suppressed, which shows the relative quantity of Issues that have been suppressed due to admin configuration of Issues that may be deemed to produce excessive notifications in each time period. Issue counts for each time increment appear as stacked bars in the chart. Move the mouse over any colored bar section to view the count for that Issue type.
Adds: New issues.Same: Issues still present.Drops: Issues no longer present.Supp: Suppressed issues.
Note
To check the license status of any device (whether the device shown in the Device Viewer counts against the license limits for the NetMRI appliance), go to the Device Support page (Device Viewer –> Settings & Status –>Device Support).
Note
You can define individual devices' SNMP and CLI credentials in the Device Viewer. For more information, see Adding and Testing SNMP Credentials for a Device and Adding and Testing CLI Credentials for a Device.

Infoblox NetMRI 7.4.4 Administrator Guide Part 3 Device and Network Exploration
Copyright ©2020, Infoblox, Inc. All rights reserved. Page 211
1.2.
a.
b.c.d.
e.
1.2.3.4.
1.2.
You can also perform the following:
To change the date covered by the display, click the date hyperlink in the upper left corner.
To change the period covered by the display, open the Period list (in the header) and click the desired period.
To view a description of an issue, hover over the issue hyperlink. A description appears in a tooltip.
To view additional issue details, click the issue hyperlink. The Issue Viewer opens for the specific issue and device.
To filter the issues table by activity type:
Click the Display Mode button (above the column headers).In the submenu, click the activity type you want to see in the table. The choices are as follows:
All: Displays all issues that existed during the selected time period. This is an important view for real-time analysis because if an issue existed at one point in the day, but was later automatically cleared by NetMRI, it will only be listed by selecting All.Active(Default): Displays all currently active issues for the selected time period.Current: Displays all issues present at the end of each day for the selected time period.Dropped: Displays all issues that were resolved during the selected time period, and that were not open at the end of that period. Suppressed: Displays all issues you have chosen to suppress.
Checking a Device's Policy ComplianceThe Policy Compliance page (Device Viewer –> Network Analysis –> Policy Compliance) lists policies run against the device, and the outcomes of those policies. If no policies execute against the device during the time period set by the Date/Period drop-down menu in the Policy Compliance title bar, the page is blank.
Also, see Policy Design Center for more information on NetMRI's Policy Compliance feature set.
Checking Basic Device InformationThe Device Viewer's Device/Network Explorer section (Device Viewer –> Device/Network Explorer) shows a substantial body of critical information about a selected device relative to other network elements. Device/Network Explorer conveys many details about the relative location of the device in the network, and aspects of its operating state. The "location" of the device is described by its SNMP identity, with many other pieces of information about the network switch, router, or other entity.
Before device identification, NetMRI verifies SNMP, Telnet, and SSH ports by access to these ports during normal operation. Any device that supports the tcpConnState SNMP table and is accessible are polled for additional open TCP ports.
Active port scanning can be enabled at the Settings icon –> Setup –> Collection and Groups –> Global tab.
To enter new custom data for the device currently shown in the Device Viewer, complete the following:
Click New. The Add new custom field data dialog appears.Open the Name field and select a field by name.Enter a corresponding Value.Click Save & Close.
To edit custom data, complete the following:
Click the Edit button for the field.Change the data value.
Note
Additional information can be displayed using the Columns option available via column header menus.

Infoblox NetMRI 7.4.4 Administrator Guide Part 3 Device and Network Exploration
Copyright ©2020, Infoblox, Inc. All rights reserved. Page 212
3. Click the Save & Close button.
To delete data, click the Delete button, then confirm the deletion.
Device IdentificationThe Identification page (Device Viewer –> Device/Network Explorer –> Device Identification) displays identification information — gathered from a variety of collectors — for the device currently displayed in the Device Viewer. This page lists the identification discovery sources used to determine the device (normally SNMP), a listing of the discovered SNMP Data, and the operating system. Identification information is used to initially determine the type of device being accessed. Since identification information from different sources (listed in the Identification Discovery Sources table) is sometimes conflicting or incorrect, it is possible that a device type or name will initially be incorrect. Over time, as more detailed data is gathered from the device, the device type and/or name are corrected.
The SNMP Data table lists SNMP and OS information, if available, about the device.
The O/S History table lists all the OS versions discovered by NetMRI over time, for the specific device.
Checking Device LocationsThe Device Location page (Device Viewer –> Device/Network Explorer –> Device Location) shows the location of a selected device relative to other network elements. Connectivity information is listed across Switchport, Subnet, Network Views, and VLAN tabs. Device Location shows all switch ports adjacent to the selected device where applicable, the subnetworks to which the device connects (in the Subnets tab) and VLANs (in the VLANs tab) containing the device.
In the Network Views tab, the device’s local interfaces are listed with their respective Network View membership and their VRF Network Name if applicable to the device.
Viewing Component InventoryThe Component Inventory page (Device Viewer –> Device/Network Explorer –> Component Inventory) lists all hardware information for the device, if SNMP data is available. Specific data depends on the vendor platform, and may include hardware revision, firmware revision, model number, and serial number. The page lists all installed interfaces and the chassis for the device. The chassis listing also provides the network device’s serial number and model number. Additional information can be displayed using the Columns option available via column header menus.
Viewing Open Services on a DeviceThe Open Services page (Device Viewer –> Device/Network Explorer –> Open Services) lists all TCP and UDP ports that are currently open on the device. This feature not only gives you a picture of what the selected device is doing – but it can also give you a quick view of possible security holes in the device’s basic configuration. Based on the device type, NetMRI will expect certain services to be configured on the device, and those values will appear in the Expected Servicecolumn as the protocol name. Devices will often show services such as telnet, BootP, or SNMP as a service. Services that are detected as being actively used on the device appear in the Verified Service column.
Should a Listen Address value appear as 0.0.0.0, it indicates that the service is configured to run on all ports on the device.
Many devices that operate as switches or routers will not run any additional services, and will show no records on this page.
Viewing CDP NeighborsThe CDP Neighbors page (Device Viewer –> Device/Network Explorer –> CDP Neighbors) lists information from any Cisco devices that support and transmit announcements from the proprietary data-link-layer Cisco Discovery Protocol (CDP). The table lists all remote devices that have exchanged information with the current device using CDP

Infoblox NetMRI 7.4.4 Administrator Guide Part 3 Device and Network Exploration
Copyright ©2020, Infoblox, Inc. All rights reserved. Page 213
••••••
•
•
••••
•
••
announcements, including the local interface ID receiving CDP announcements, the neighbor's IP address, the neighboring device's DNS name and interface ID, the reported neighbor's "platform", which is the model of the CDP-supporting switch or router, and the Neighbor Capabilities, which indicates the basic functions of each CDP-neighboring device.
You can also select additional columns of information for detected CDP neighbors, including the following:
VRF: The local interface's VRF, if applicable.Neighbor VRF: The VRF belonging to the neighboring interface.Network View: The network view belonging to the local interface.Neighbor Network View: The network view to which the neighboring interface belongs, if applicable.Neighbor Version: This shows the complete IOS software version for each reported neighbor.Neighbor ifindex: This is a Cisco-defined value for SNMP used as a unique identifying number associated with physical and logical interfaces.Neighbor MAC: This shows the physical-layer MAC address of each CDP-reporting neighboring interface.
Many device vendors do not support CDP. In those cases, they usually support the IEEE standard Link-Layer Discovery Protocol.
Viewing Link-Layer Discovery Protocol NeighborsThe LLDP Neighbors page (Device Viewer –> Device/Network Explorer –> LLDP Neighbors) supports all devices running the LLDP protocol. The table lists all remote devices that are LLDP neighbors of the current device, listed against all local interfaces that report LLDP neighbors, and provides collected information regarding those devices from LLDP, including their identity, capabilities, and their own respective neighbors.
You can also select additional columns of information for detected LLDP neighbors, including the following:
VRF: The network view belonging to the local interface that is connected to the discovered neighbor. This membership relation is inherited from the 'Network View' assignment of the local VRF in charge of this interface traffic.Network View: The network view belonging to the local interface.Neighbor Network View: The network view to which the neighboring interface belongs, if applicable.Neighbor Version: Shows the complete IOS software version.Neighbor ifindex: A standards-defined value for SNMP used as a unique identifying number associated with physical and logical interfaces, in this case for the LLDP protocol.Neighbor MAC: Shows the physical-layer MAC address of each LLDP-reporting neighboring interface.
Viewing Layer 2 NeighborsThe Neighbors page (Device Viewer –> Device/Network Explorer –> Neighbors) lists devices that NetMRI determines to be adjacent to the device at Level 2. This feature does not describe neighboring devices at Level 3.
Layer 2 neighbors can report a substantial body of information. Typically, only the VLAN ID, VLAN Name, Neighbor (in its resolved DNS name), and the Neighbor Interface ID are reported. You can display many more data columns, including (but not limited to) the following:
VRF Name: The listed name of the local interface's VRF network, if applicable.Neighbor VRF Name: The listed name of the neighboring interface's VRF, if applicable.
Note
This menu item will not appear in the Device Viewer for non-Cisco devices.
Note
This menu item will not appear in the Device Viewer for devices that do not support the LLDP protocol.

Infoblox NetMRI 7.4.4 Administrator Guide Part 3 Device and Network Exploration
Copyright ©2020, Infoblox, Inc. All rights reserved. Page 214
•
••••••••
•
••
•••••
Neighbor Network View: The listed name of the neighboring device's network view, if the device is in a different network view.Network View: The network view to which the device belongs.Root Bridge Address: This is the MAC address ID of the root bridge in the spanning tree.Interface MAC and Neighbor MAC: These are MAC addresses of the listed local and neighboring interfaces.Neighbor Type: These are typically Switch or Switch-Router in NetMRI.Device Assurance: The probability that NetMRI has correctly identified the type of a given device.Ifindex: The local interface index value into the SNMP table (ifTable).Interface Type: Typically appears as ethernet-csmacd on switched-Ethernet networks.Neighbor Location: A plain-language notation of the physical location of the device associated with the neighboring interface.Neighbor ifindex: The index value into the SNMP table (ifTable) that the L2 neighbor is associated with.
Checking Custom Data Settings for the Device ViewerThe Custom Data page (Device Viewer –> Device/Network Explorer –> Custom Data) displays any configured custom data fields that are used to provide additional information for user visibility in the Device Viewer. Custom data fields are represented by new columns that can be selected for display in a table.
Custom data also appears in tables available in the Network Explorer –> Inventory page. Define custom data in the Settings icon –> General Settings –> Custom Fields page.
See Defining and Using Custom Fields and Verifying Field Content In Device Viewer & Interface Viewer for more information on the use of custom fields in the Device Viewer.
Checking Connected Device HistoriesFor Ethernet switches and L2/L3 switch-routers, NetMRI provides the device management history for the device currently shown in the Device Viewer. The key values are the First Seen and Last Seen values, which show the date and time when the device was first discovered and polled by NetMRI and the timestamp for the most recent device polling occurrence.
In rare cases you may see this option in the Device Viewer for a Firewall. By default, the Device History table shows eight columns of data, including the following:
First Seen: The timestamp for the first occasion where the device was successfully discovered by NetMRI.Last Seen: The timestamp indicating when the device was last polled by NetMRI. If the device is still connected, this field will reflect current timestamp values from the last network polling by the appliance.Device Name: The configured device name.IP Address: The IP address of the device.DNS Name: The DNS name for the device.Description: The description that was collected for the device.Poll Duration: The period of time in seconds required for the most recent polling cycle for the device. This value may change from poll cycle to poll cycle.
Other fields can be selected for appearance in the table.
Inspecting Device Interfaces
Note
The Switch Port Management feature set makes heavy use of the Interface Viewer for checking interface configurations and status. The information in the Device Viewer –> Interfaces page, discussed in this section, is only a subset of the information available in the Interface Viewer.

Infoblox NetMRI 7.4.4 Administrator Guide Part 3 Device and Network Exploration
Copyright ©2020, Infoblox, Inc. All rights reserved. Page 215
•••
•
••
•
The Interfaces section (Device Viewer –> Interfaces) provides a survey of key discovered data for all interfaces of the chosen networking device. Each interface link in the table provides a shortcut menu with several useful port management features as follows:
Interface Viewer: Opens an Interface Viewer window for the selected port.Interface Live Viewer: Opens the Interface Live Viewer for the selected port.Set Admin Status: Allows the NetMRI user, if they have the correct privileges, to set the chosen port to administratively Up or administratively Down without requiring a command-line connection to do so.Edit Description: Edit the interface description field of the chosen interface in the table.Edit VLAN Membership: Change the VLAN assignment for the chosen port, without requiring an SSH or Telnet connection to the device.
Viewing Interface Configuration for a DeviceThe Device Viewer –> Interfaces –> Configuration page lists all the interfaces supported by the device and their basic port configurations. By default, the table lists the VRF Name for the interface (if any), the configured speed, administrative state, duplex settings, admin state, and operational state, and the timestamp for the last configuration change. Additional information can be displayed using the Columns option available via column header menus.
The Configuration page conveys a substantial quantity of information about the list of interfaces for a device, much of which is hidden by default. Useful data points include the following:
VRF Name: The virtual network to which the interface belongs.Network View: The NetMRI Network View to which the interface belongs.
If the administrative and operational states for an interface are inconsistent, data in that row are displayed in red.
To view comprehensive data for an interface, click a hyperlink in the Interface column. This displays the Interface Viewer in a separate window.
Viewing the Device’s Address TableThe Device Viewer –> Interfaces –> Address Table page lists the ARP table records captured by NetMRI during device discovery and polling. ARP tables consist of the IP addresses and MAC addresses assigned to the interfaces supported by the device. Effectively, this page shows the ARP table for the selected router or switch device. It also shows the VRF Name for each interface (if any). If the device is running IPv6, the records from the device’s Neighbor Discovery Protocol processes are shown.
Should you display this page for a firewall device, you will see a list of the Inside, Outside, and DMZ interfaces for the firewall, appearing as the standard interface information for the device, including the Interface name, Description, IP Address, and MAC Address.
Should you display this page for a switch, the Interfaces table also lists the VLAN assignment for each port.
To view comprehensive data for an interface, click a hyperlink in the Interface column.
Viewing Performance Ratings for an InterfaceThe Device Viewer –> Interfaces –> Performance page shows performance statistics, including utilization rates, error rates, and broadcast levels for each of the interfaces supported by the device. You can also access performance charts for any interface on the chosen device. The table also lists each interface's VRF membership, where applicable.
Note
Virtual network information shown in this table reflects the same data gathered from a device’s (IOS example) show ip vrf interface command.

Infoblox NetMRI 7.4.4 Administrator Guide Part 3 Device and Network Exploration
Copyright ©2020, Infoblox, Inc. All rights reserved. Page 216
•
•
•••
••
•••
By default, the table lists configured speed, throughput, percent utilization, percent errors, percent broadcasts, and percent discards, but additional information can be displayed using the Columns option available via column header menus.
To view comprehensive data for an interface, click a hyperlink in the Interface column. The Interface Viewer appears, where you can browse through all detected information for the interface.To view historical performance charts, click a hyperlink in the Thruput, %Util, %Errors, or %Bcasts columns. The Interface Viewer appears, displaying the series of performance charts for the interface selected when you clicked the link. %Util indicates the utilization level for the port. %Bcasts indicates the level of broadcast traffic on the port.
Inspecting Firewall Vendor License Status in the Device ViewerYou can check licensing status for NetMRI–managed firewall devices in the Device Viewer. The License page (Device Viewer –> Firewall –> License) applies only to Firewall devices and the information provided is derived from the vendor license information for the device itself (e.g. licensing purchased from Cisco), not for any licensing in NetMRI.
Inspecting Routers in The Device ViewerThe Router section (Device Viewer –> Router section) provides protocol and connectivity information for the router or switch/router currently displayed in the Device Viewer, including the complete routing table, information on any dynamic routing protocols the device is running, ARP (IPv4) and Neighbor Discovery records (IPv6). All tables in this category apply for devices supporting both IPv4 and IPv6.
Viewing the Device's VRF TableFor devices with routing capability that are locally configured to support virtual routing and forwarding (VRF) instances, the VRF Table page provides the complete list of present VRF instances in the device. The VRF Table panel lists the VRF instance with columns in the following order:
VRF Name: The listed name of each discovered VRF instance in the device.Network View: The network view to which the VRF instance is associated.VRF RD: VRFs use route distinguishers to distinguish one set of routes (one VRF) from another. The route distinguisher is a unique number pre-pended to each route within a VRF to identify it as belonging to that particular VRF. The discovered route distinguisher value is listed here if a virtual network uses this value. For related information, see Summarizing Route Targets.VRF Description: Displays the description if the VRF instance is configured with a description on the device.Route Limit: If configured for the VRF, shows the maximum number of allowed routes permitted for the VRF instance.Warning Limit: If configured, shows the warning threshold to prevent exceeding the Route Limit count.Current Count: The current number of routes in the VRF instance.Timestamp: The date and time during which the device's VRF instances were last polled by NetMRI. By default, rows are sorted ascending alphabetically based on VRF names.
Viewing the Device's ARP/ND TableThe ARP/ND Table page displays the MAC address-to-IP address (ARP table) mappings most recently retrieved from the device, applied specifically to IPv4 devices. If the device supports IPv6, Neighbor Discovery mappings, including link-local values, also appear here (hence the ND in the table name). If the device is dual-stack, both sets of values appear. If the IP address matches a device that has already been discovered, the corresponding hyperlink can be used to open the Device Viewer for that device.
A column titled Network View lists the network view in which each local interface is participating. NetMRI hides this column by default. This value appears only for VRF-aware devices. If a device's interface is not attached to a VRF interface, its data is routed through the global routing table for the device and lists the global network view used for that network.

Infoblox NetMRI 7.4.4 Administrator Guide Part 3 Device and Network Exploration
Copyright ©2020, Infoblox, Inc. All rights reserved. Page 217
••
•
•••
•
Another column, VRF Name, lists the local virtual routing and forwarding (VRF) instance in the router to which the interface is bound.
Most device categories, such as Router, Switch, AppServer, and others will provide ARP/ND table views for their respective device viewers.
Viewing a Device's Routing Table
The Route Table page shows the routing information most recently retrieved from the device, including hyperlinks to corresponding interfaces and "next hop" devices. If the device supports IPv6, this table view also shows the current router's neighbors' link-local addresses as next hops in the table.
A column titled Network View lists the network view in which each of the device's local interfaces is participating. NetMRI hides this column by default. If a device's interface is not attached to a VRF interface, its data is routed through the global routing table for the device and lists the global network view used for that network.
Another column, VRF Name, lists the local virtual routing and forwarding (VRF) instance in the router to which the interface is bound, if any.
At the top of the Route Table page, the Routing Problems and Unreachables table provides a number of specific issue counts related to the device: No Route Discards, Routing Discards, ICMP Redirect Messages, ICMP Destination Unreachable Messages, ICMP Redirects Sent, and ICMP Time Exceeded Messages.
Viewing EIGRP Neighbor InformationThe EIGRP page is available for routers supporting the Enhanced Interior Gateway Routing Protocol. This table displays state information about any known EIGRP peers, including the following information:
Local Interface: Each listed interface participating in the EIGRP protocol.Network View: Lists the NetMRI network view assigned to each local device interface connecting to the discovered EIGRP neighbor.Neighbor IP Address: The adjacent neighbor for each EIGRP interface in the router, for which the current router keeps state information.Neighbor Name: The configured name for each neighboring router.Neighbor Uptime: The time period for which the neighbor adjacency has been active.EIGRP Retransmit Count: The aggregate number of times the current device has sent retransmissions to the specific neighbor (usually Hellos or updates), because it is not getting EIGRP acknowledgments back. High numbers indicate a network problem between the current device and its neighbor.EIGRP Retry Count: The aggregate number of times the current device has attempted retries to establish an adjacency to the neighbor. High counts here indicate a significant network issue.
Note
For IPv6 routing table information, next hops are specified as link-local IP addresses. If the next hop's link-local address is also known to NetMRI, the address field appears as a hyperlink to the Device Viewer page for that device, enabling viewing of all link-local and global addresses for the next hop.
Note
If the next hop for a device is the same as the destination address, for example, ip route 1.1.1.1 255.255.255.255 1.1.1.1, the route is not added to the Route Table.

Infoblox NetMRI 7.4.4 Administrator Guide Part 3 Device and Network Exploration
Copyright ©2020, Infoblox, Inc. All rights reserved. Page 218
••
•
••
•
•
•
••
••
•••
•
•
••
Viewing the OSPF Neighbor Table
The OSPF page lists the characteristics for the selected device if it is running the Open Shortest Path First protocol, a popular internal gateway routing protocol. The Device Viewer OSPF page divides into these two tables:
OSPF Area Table: Listing the OSPF administrative Areas to which the router belongs.OSPF Neighbor Table: Listing all routers and router interfaces to which the current router has established OSPF adjacencies and exchanged link-state databases.
The OSPF Area Table panel displays the following relevant data columns:
Area: The OSPF administrative networks to which the router belongs. In many circumstances, an OSPF router may belong to two or more Areas, including the Area0 backbone.AreaID: The dotted-quad version of each OSPF area ID.Authentication Type: The authentication protocol, if any, employed by the OSPF router in that specific Area. OSPF authentication operates on a point-to-point basis, usually using MD5 hashing.AS External Type: Indicates whether the area in which the router is participating is a standard Area or a Stub area.Border Router Count: Indicates the number of OSPF area border routers in each local area. Such routers are typically area border routers (ABRs) or Autonomous System border routers (ASBR).Route Table Calcs: The number of incidences where the router has been forced to run the Dijkstra algorithm on the network, to calculate the SPF database for the Area. Ideally, the value in this field should read zero or close to zero, indicating that no recalculations have been necessary since the router joined the OSPF Area. If a router experiences issues or an unstable link (flapping), higher numbers of recalcs are an indicator.Autonomous System Count: The number of ASes in which each Area in the Area Table operates.Link-State Advertisements: The number of link-state advertisements (LSAs) the router has sent to other neighbors during the course of information exchanging with other OSPF routers.Link-State Checksum: The checksum value listed in the device's router link-state advertisement header.Network View: Shows the NetMRI network view containing the local VRF or VRFs associated with the listed OSPF area.
The OSPF Neighbor Table displays the following information:
Neighbor Name: The discovered name of the OSPF neighbor router.Neighbor IP Address: The IP address of the adjacent neighboring interface.Network View: Lists the NetMRI network view associated to the device's interface that connects to its discovered OSPF neighbor. Clicking the link opens the Network View Viewer window, which lists the AssociatedVRFs and the ImportedVRFs for the network view.Neighbor Router ID: The configured Router ID for the neighboring OSPF router (different value from the neighboring interface).Neighbor State: In a functioning OSPF adjacency, this value will show as Full.
Viewing a Device's BGP ConfigurationThe BGP page lists the basic characteristics for routers in which Border Gateway Protocol is active. The table displays information about all known BGP4 neighbors for the current device. IPv4 and IPv6 versions of BGP are supported. If the router does not support BGP, this page will remain blank. Any neighbor interfaces that have established adjacencies with the currently selected router will appear in this table.
The BGP Neighbor Table displays the following information by default (other fields can be added to the table):
Local Addr: Local IP address of the individual ports of the current device.Network View: Lists the NetMRI network view associated with the device's interface that connects to its discovered BGP neighbor. Clicking the link opens the Network View Viewer window, which lists the Associated VRFs and the Imported VRFs for the network view.
Note
NetMRI fully supports the collection of IPv6 dynamic routing protocol data, including OSPF, and BGP.

Infoblox NetMRI 7.4.4 Administrator Guide Part 3 Device and Network Exploration
Copyright ©2020, Infoblox, Inc. All rights reserved. Page 219
••
••••
•
•
•••
Local Port: The Interface ID.Neighbor Addr: The neighboring interface running BGP4, that has established an adjacency with the listed local port.Neighbor Port: The neighboring port's interface ID.Neighbor AS: The Autonomous System (AS) to which the neighboring interface belongs.Neighbor Name: The name of the router host for the neighboring interface.RP Peer Device Type: Route Processor peer device type (if applicable), indicates the peer route processor type if line card-based forwarding table synchronization is supported. Possible values include RSP for a Cisco 7500-class router and GRP (gigabit router processor) in a Cisco 12000-class router line card.Connection State: Reflects the current BGP connection state of the BGP peer when the network was last polled by NetMRI. Typically, the state of a full BGP peer is Established. Seeing anything but an Established state in this field may indicate issues. Other possible states include Idle, Connect, Active, OpenSent, and OpenConfirm. BGP sessions begin in an Idle state when the device initializes the resource it needs for the upcoming session. It then transitions to state Connect while the peers establish their TCP connection for BGP. Once the TCP connection is established between the peer interfaces the routing protocol moves to the OpenSent state. If the TCP connection fails, the peers enter the Active state. OpenSent indicates that the device has received an Open message from the peer, and then determines the AS to which the neighbor belongs. OpenConfirm indicates that the device is waiting for a Keepalive response from the other end. If it gets one, the BGP connection switches to the Established state.Last State Change: The timestamp for the last detected occasion that the current device changed its BGP state on the current interface in the table.
Viewing a Device's Hot-Standby Routing Protocol (HSRP) StatusThe HSRP page lists the characteristics for all Cisco routers supporting the Hot Standby Routing Protocol and Virtual Router Redundancy Protocol, which are typically used for Cisco VPN concentrators. Tables in this page list all HSRP groups supported by the device, and additional details for each group.
Viewing a Device's Quality of Service Status and SettingsNetMRI performs data collection and analysis of router operational data that provide visibility into the operation of Quality of Service (QoS) classification and routing of network traffic. The Cisco Class-Based Quality of Service (CBQos) functionality is typically used to identify and rank packets according to their importance to the organization and queue them in a way that guarantees a specific quality of service as packets transit the network.
The QoS page and its tables apply only to QoS information for Cisco routers, displaying the number of packets and drops per Quality of Service queue during the time period (above the table) selected for the page. The QoS page divides into the three following tabs:
QoS Table: Shows the broad picture of QoS operation in the chosen device.QoS Daily Table: Daily performance records of the current router's QoS configuration.Raw QoS Data: Raw packet counts for each of the queues for the currently selected router.
Proper QoS operation depends on two factors. First, the configuration must be done correctly across many devices. Any difference in configuration may result in packets not being properly queued, resulting in high latency, jitter or packet loss, particularly on congested links.
The second factor involves monitoring the operational characteristics of QoS. Operational characteristics include elements such as packet volume per queue and packet drops per queue. These are reflected in the QoS Table and QoS Daily Table. The operational data can indicate network misconfigurations and data flow changes that no longer match assumptions made during the network's design.
QoS AnalysisNetMRI automatically identifies routers configured with QoS and collects operational data on each configured queue. There are no configuration options within NetMRI that affect the identification of queues and collection of operational data. The analysis identifies operational signatures of potential problems such as oversubscribed interfaces.

Infoblox NetMRI 7.4.4 Administrator Guide Part 3 Device and Network Exploration
Copyright ©2020, Infoblox, Inc. All rights reserved. Page 220
QoS Queue Dropped PacketsAny QoS queue that is dropping packets is identified. The relative priority of the queue determines the severity level of the issue that is generated in the Issue List. The table below shows the severity generated for each queue's Per-Hop Behavior (PHB) and DSCP value that are commonly associated with applications. Drops in high priority queues will generate Error issues, while medium priority queues generate Warning issues. The lowest priority queues, including the scavenger queue, generate Info issues.
? Classification ?
Application PHB DSCP Issue Severity
Link Layer keepalives CS7 56 Error
Routing CS6 48 Error
Voice EF 46 Error
CS5 40 Error
AF43 38 Info
AF42 36 Warning
Interactive Video AF41 34 Error
Streaming Video CS4 32 Error
AF33 30 Info
AF32 28 Warning
Mission Critical AF31 26 Error
Call Signaling CS3 24 Error
AF23 22 Info
AF22 20 Info
Transactional Data AF21 18 Warning

Infoblox NetMRI 7.4.4 Administrator Guide Part 3 Device and Network Exploration
Copyright ©2020, Infoblox, Inc. All rights reserved. Page 221
•••
? Classification ?
Application PHB DSCP Issue Severity
Network Management CS2 16 Warning
AF13 14 Info
AF12 12 Info
Bulk Data AF11 10 Info
Scavenger CS1 8 Info
Best Effort 0 0 Info
When a high priority queue drops packets, it indicates that insufficient bandwidth may be allocated to that queue. Sometimes this occurs because the queue definition is based on network traffic volume assumptions that no longer apply. For example, a queue configured to handle four simultaneous voice calls may be dropping packets because more than four simultaneous calls are being handled.
Conversely, when many (or all) queues are dropping packets, the entire link may be oversubscribed and the only valid remediation is to add more bandwidth. In this scenario, the high priority queues use nearly all the bandwidth and will still drop packets because the offered load is greater than the available bandwidth. Because there is little remaining bandwidth, low priority queues will also drop packets.
When a QoS queue drop is detected during the analysis of the collected data, an issue appears on the issue list. Clicking on the issue hyperlink opens the issue in the Issue Viewer, where information is displayed about each queue that experienced the drops. The Issue Viewer provides several hyperlinks to access related information.
To open the Device Viewer, click a hyperlink in the IP Address column.To open the Interface Viewer, click a hyperlink in the Interface column.To open the Quality of Service Viewer, click a hyperlink in the Policy Name column.
The Quality of Service Viewer provides charts showing dropped packets (quantity and percentage) versus time.
Inspecting Ethernet Switches and VLANsNetMRI divides Ethernet switch information into a separate Switch section (Device Viewer –> Switch) to provide discrete information for the switch currently shown in the Device Viewer.
The Switch pages provide a substantial amount of information, divided into five categories: VLAN, VLAN Trunks, VLAN Changes, Port Config, and Forwarding. Consult the topics below for more information.
Viewing Active VLANs and VLAN ConfigurationThe device viewer's VLANs page (Device Viewer –> Switch –> VLANs) provides a summary table for all of the VLANs provisioned in the selected switch.
The Active VLANs (Device Viewer –> Switch –> VLANs –> Active VLANs) table provides some important information for checking the switch's VLAN configuration and its status in the network.

Infoblox NetMRI 7.4.4 Administrator Guide Part 3 Device and Network Exploration
Copyright ©2020, Infoblox, Inc. All rights reserved. Page 222
The Active VLANs table lists all VLANs being supported by the device, including the root bridge for each VLAN and elements such as the Root Priority, Switch Priority, Root Cost, and the Spanning Tree Protocol. Root Bridge Priority values are used in the election process of a root bridge for a particular VLAN.
A root bridge is selected by setting a switch's root priority value to a lower value in comparison to other switches. The root bridge priority value defaults to 32768 for most platforms and the maximum value is 65535; the minimum value is 0. The bridge priority value is combined with the MAC address ID for the switch to determine the spanning-tree root bridge for the network. This resulting value propagates through the switched network in Bridge Protocol Data Units (BPDUs) from the root bridge, to ensure that the devices in the switched network agree on the identity of the root bridge.
Should all switches in the network retain the same value, an election takes place in which the switch with the lowest MAC address becomes the root bridge. Many older Ethernet switches may have lower Ethernet MAC address values and may thus be automatically elected as the root bridge for many VLANS in the network, even though the switch will not have the processing or memory to handle the load. To ensure the 'correct' switch is elected as the root, the best practice is to set the desired core switch's bridge priority to a relatively low value such as 8000; then, a second root bridge is chosen as a backup root and its priority set to a slightly higher value.
Listed in the Active VLANs page, the switch priority of a VLAN is the value defined in the local switches' configuration as the candidate value for election as the root.
The root cost value in the table is the cumulative cost of all links in the current VLAN leading to the root bridge. VLANIDs that show a value of 0 are not participating in the spanning tree.
The Spanning Tree Protocol column reports the version of the spanning tree protocol being run on each switch interface. A normal value for this column is ieee8021d.
VLAN Configuration PageThe VLAN Configuration table (Device Viewer –> Switch –> VLANs –> VLAN Configuration) lists configuration information for each VLAN supported by the device. Configuration settings for each VLAN include the three key STP timers Hello Time, Max Age and Fwd Delay for both the local bridge (on each VLAN, these are called Current values) and its root bridge (called Bridge values). For the current switch's VLANs, the Current Hello Time shows the time intervals between the transmission of configuration bridge PDUs (BPDUs), which flow outward from the root bridge as notifications of its root status to the other switches in the spanning tree.
The Current Max Age is the time period that an installed root's BPDU is stored by the selected switch. The Cisco default value is 20 seconds. The Current Fwd Delay value is the time period, in seconds that the current device spends in the Listening and Learning states. Among other things, it indicates how long the bridging table ages before the device switches from Forwarding mode to Listening mode. Fwd Delay also affects how quickly the switch responds to a change in topology.
The Bridge Hello Time, Bridge Max Age, and Bridge Fwd Delay values are the corresponding values dictated by the root bridge through its BPDUs to all the other bridges in the switched network, including to the current device. Most deployments require careful consideration before changing spanning tree protocol timing values, and such values should normally be modified only at the root bridge.
The figure above illustrates the principles. The root bridge advertises its Bridge Max Age = 2000, Bridge Hello Time = 200, and Bridge Fwd Delay = 1500 in the BPDUs it sends to the other switches in the network through VLAN 60. Those values are in turn used by the other switches in the network to configure their respective Max Age, Hello Time, and Fwd Delay settings (all labeled as Current in the table). In the current switch, those three STP timer values are set to the same values because they are determined by the three values communicated through the root bridge BPDUs.
Note
For Cisco devices, the root switch on the spanning tree network may be found by entering a show spanning-tree command on the switches participating in each VLAN. You can use the Open Telnet Session or Open SSH Session features in NetMRI to connect to managed devices.

Infoblox NetMRI 7.4.4 Administrator Guide Part 3 Device and Network Exploration
Copyright ©2020, Infoblox, Inc. All rights reserved. Page 223
•••
••
Viewing VLAN Trunk StatesThe VLAN Trunking Protocol (VTP) is a Cisco-proprietary method for communicating VLAN information across switch ports between Catalyst switches. Other solutions to the same problem include the non-proprietary 802.1Q. NetMRI supports and reports upon both varieties of VLAN trunking depending upon the switch vendor.
The VLAN Trunks page (Device Viewer –> Switch –> VLAN Trunks) presents all ports on the current switch that have 802.1Q or VTP configured in some way, whether the protocol in operation or is simply enabled. The complete list of interfaces in the current switch device appears, showing both the Dynamic State (on, off, or auto) and the Dynamic Status of each port (trunking or notTrunking). Should a port be set as a VLAN trunk, its Dynamic Status will show trunking. The VLAN Trunks page also lists links for each Peer switch and Peer Interface.
Clicking the link for the trunking interface in the VLAN Trunks list displays the Interface Viewer. Its VLAN Name listing appears as TRUNKING, along with the peer switch name, the neighbor MAC address (not the MAC for the neighboring interface), and the neighboring port ID.
Viewing VLAN ChangesThe VLAN Changes page (Device Viewer –> Switch –> VLAN Changes) presents a zoomable bar chart reflecting the frequency of VLAN topology changes in the network. You can perform basic troubleshooting of problems in the spanning tree network, as VLAN changes usually occur as a result of topology changes in the network, as for example when a switch port goes down and the spanning tree has to reconverge around a different set of designated ports. To display the history for a specific VLAN, open the VLAN list (in the header), then click the VLAN name. Clicking a bar object in the chart displays the event log describing the change.
Click and drag the mouse across any part of the chart to zoom into a data set. To zoom back out, click Show All in the chart.
Viewing Switch Port ConfigurationThe Port Config page (Device Viewer –> Switch –> Port Config) lists all the ports on the chosen switch, the VLAN provisioned for each port, and basic information such as the port state, the Port Fast state, and the administrative and operational state of each switch port (Up or Down). Non-normal data appears in red. The port state can show one of five different values, as follows:
Forwarding: The port is sending and receiving user data.Learning: The switch is building the bridging table.Listening: Tthe switch port is sending and receiving bridging PDUs in an effort to determine the active switching topology.Blocking: Where the port is only allowed to receive bridging PDUs but otherwise passes no user traffic.Disabled: The port is administratively down.
In a stable spanning tree network, only Blocking and Forwarding states will typically be seen. The Forwarding state is the only state in which the switch port transmits user data PDUs.
The Interface column provides links to the Interface viewer for every switch port. The VLAN ID and VLAN Name columns column provides links to the VLAN viewer, in which you see the list of devices participating in the VLAN.
Viewing Switch Port Forwarding StatusThis page provides a quick view of the forwarding configuration for all switch ports in the current device. The Forwardingpage lists the VLAN ID, local interface IDs, MAC address, IP address, neighboring device name, and device type, and the neighboring interface ID for each switchport in the current device. Each Local Interface and neighboring Interfacelisting is a link to the Interface Viewer for the port.

Infoblox NetMRI 7.4.4 Administrator Guide Part 3 Device and Network Exploration
Copyright ©2020, Infoblox, Inc. All rights reserved. Page 224
••
•••
•
•••
•
•••
•
•
•
Inspecting Wireless InfrastructureThe Wireless section (Device Viewer –> Wireless section) provides information about a wireless access point when displayed in the Device Viewer. This accordion menu appears in the Device Viewer only when a wireless access point device is detected and added to the managed complement of devices.
Viewing Wireless Access Point ConfigurationThe Config page displays information about the selected wireless access point device. Information includes the following:
Timestamp: The date and time when the device was last queried by NetMRI.Interface: Lists the interface for the device. As an example, for Cisco devices, you will typically see interfaces such as Do0 for dot11radio 0. This item is also a link to the Interface Viewer.Station ID: If configured, the numeric value station ID number for the device defaults to 0.Service set ID (SSID): The natural-language service set identifier.Role: Indicates the role in the radio network defined for the device, if any (uses the Cisco station-rolecommand). Possible values include Root Bridge (roleRoot), Non-Root Bridge, Root Bridge with Wireless Clients, Non-Root Bridge with Wireless Clients, and Universal Workgroup Bridge.WEP Enabled: Indicates whether the WEP protocol is enabled for use on the device. WEP uses static encryption keys and is generally considered to be obsoleted by the newer WPA (Wi-Fi Protected Access) protocol.WEP Allowed: Indicates whether WEP authentication is allowed on the device.WEP Errors: The count of WEP errors detected by the wireless device.Key Len 1-4: The specified WEP key lengths, if any.
For devices running Aironet or Cisco IOS based software, the page displays information about the auxiliary SSID configuration and algorithms used on the device.
Viewing Access Points SSIDs (Service Set Identifiers)The SSIDs page lists the service set identifiers defined on the current wireless access point device. The SSID is a unique identifier that wireless networking devices use to establish and maintain wireless connectivity. Multiple access points on a network or subnetwork may use the same SSIDs. As an example, Cisco Aironet devices support up to 16 SSIDs and support different configuration settings for each SSID. All SSIDs are simultaneously active, depending on configuration, wireless client devices can associate to the access point using any SSID.
Data points include the following:
Interface: Lists the interface for the device. As an example, for Cisco devices, you will typically see interfaces such as Do0 for dot11radio 0. This item is also a link to the Interface Viewer.SSID Index: The index value for the listed service set ID.SSID: The natural-language service set identifier.Max Stations: A radio setting defining the maximum number of connected client stations for the wireless device. The default setting is 255.MIC Algorithm: A WEP encryption setting that prevents certain attacks on WEP-encrypted packets. If none is used, this value reads micNone.Permute Algorithm: Lists the WEP permute algorithm configured for each SSID. This setting defines how the WEP encryption key is permuted between key renewal periods for stations associated with the radio interface.Broadcast SSID: Also called Guest Mode in Cisco IOS. The default guest SSID is identified in Aironet devices as tsunami. Any access point will have either a single guest-mode SSID or none. This data point identifies the guest SSID advertised by the access point beacon for guest use, if any.
Viewing Access Points Authentication SettingsThe Authentication page lists the current wireless access point’s authentication settings groups. Each group has at least one unique setting to distinguish it. Data points include the following:

Infoblox NetMRI 7.4.4 Administrator Guide Part 3 Device and Network Exploration
Copyright ©2020, Infoblox, Inc. All rights reserved. Page 225
•
•
•
••
•
•
•
••
••
•
•
•
•••
Interface: Lists the interface for the device. As an example, for Cisco devices you will typically see interfaces such as Do0 for dot11radio 0. This item is also a link to the Interface Viewer.Auth Enabled: Shows whether authentication is required in the authentication configuration group. This field will show a value of Yes or No.EAP Required: Indicates whether the access point requires the Extensible Authentication Protocol to provide dynamic WEP keys to wireless devices. This field will show a value of Yes or No.EAP Method: If enabled, possible EAP values include Open or Shared Key authentication.MAC Auth Required: Indicates whether the AP uses MAC Address authentication, using the wireless client's MAC address to verify with an authentication server whether the MAC is allowed on the network. This field will show a value of Yes or No.MAC Auth Method: If enabled, this indicates whether EAP authentication is required for MAC address authentication or if a MAC address list is being used. An access point configured for EAP authentication forces all client devices that associate to it, to perform EAP authentication.Default VLAN: Cisco Aironet wireless access points use three VLANs: VLAN 2, VLAN 20, and VLAN 30. One is set as the 'native' VLAN, one as the SSID administrative VLAN, and one as the SSID guest VLAN. The value shown here is the discovered listing for the default native VLAN on the radio interface.Auth Algorithm: The discovered SSID authentication algorithm that is configured for each settings group.
Viewing and Changing General Settings for a Device
The Device Viewer provides a General Settings page (Device Viewer –> Settings & Status –> General Settings) in which you can perform the following:
Enable/disable SNMP data gathering for the device.Under SNMP Status, select Enabled to enable SNMP collection for the current device, and select Disabled to disable SNMP collection.
Enable SNMP debugging as a troubleshooting aid.Under SNMP Debug, select Enabled to enable SNMP debugging for the device. For more information, see Collecting Troubleshooting Data.
Override the device Name and Type determined automatically by the appliance. This triggers rediscovery. For more information, see Overriding Device Names and Types in the Device Viewer.Override the config change setting specified in the Device Group to define config collection for the device as Locked or Unlocked.Set the Reboot Time, in YYYY-mm-dd hh:mm:ss format, for devices up longer than 497 days.
The Device Group Membership section lists the device groups of which the device is a member.
The Device Group Settings section lists the settings for the highest ranking device group that includes the device as a member, and a number of scanning and discovery-related statuses specific to the device, including the following:
SNMP Collection: Whether SNMP collection is enabled or disabled.Port Scanning: Whether TCP/UDP port scanning is enabled or disabled.Finger Printing: Whether finger printing is enabled or disabled.
Note
After a device is discovered by NetMRI, its detected Name, Device Type (Switch, Router, Switch-Router, etc...), or its management IP address can be edited by hand in this section. Doing so will remove the device from auto-discovery. To re-enable auto-discovery for that device, go to the Network Explorer –> Discovery page and delete the device from the table. NetMRI will then re-discover the device after its defined time period between Discovery passes elapses.
Note
The General Settings page can be accessed only by users with the Admin role.

Infoblox NetMRI 7.4.4 Administrator Guide Part 3 Device and Network Exploration
Copyright ©2020, Infoblox, Inc. All rights reserved. Page 226
•••••••••
•
•
•
•
NetBIOS Scanning: Whether NetBIOS Name scanning is enabled or disabled.ARP Cache Refresh: Whether ARP cache refresh is enabled or disabled.Config Collection: Whether configuration file collection is enabled or disabled.CCS Collection: Whether CCS scripting data collection is enabled or disabled.Vendor Default Collection: Whether vendor default SNMP credentials collection is enabled or disabled.Analysis: Whether the device allows analysis functions from NetMRI.Config Change: Whether configuration file editing is enabled or disabled.Switch Port Mgmt: Whether Switch Port Manager is enabled or disabled for the device.Privileged Polling: Whether CLI polling in privileged exec (enable) mode is enabled or disabled for the device.
In all cases, a state of N/A indicates either the device has not been fully discovered and cannot currently support the feature, or the feature does not apply to the device.
Changing Device SettingsTo rename a device, type a new name in the Name field, and then click the Update Device button. You can also define the network through which the device will be managed by NetMRI, change its discovered device type, and change the device's data collection settings.
For VRF-aware devices, you can change the Management IP address for the device by choosing it from the Management Address dropdown menu. The menu lists all IP addresses for the device, each shown with their associated network view and the collector by which the device was discovered. By default, the current management IP for the device is selected in the list. The listed management IPs fall within the discovery ranges of the Collector appliance or standalone appliance that manages the device. You can change the management collector for the device by selecting the IP address on the required collector. For more information, see Manually Changing Management Collector.
By choosing a different Management Address, the associated NetMRI appliance uses the scan interface on which the Management IP is defined. This feature is useful for devices that participate in multiple network views, as it enables the administrator to define which network view the device is managed through. In many cases, the Management Address list shows only a single network view such as the default Network 1. In these cases, all available addresses exist only in the single network view.
For VRF-ignorant devices, this page shows a Management Network View drop-down menu. The list shows all network views for the device's associated Collector or standalone NetMRI appliance, that each has an assigned scan interface. You may see multiple network views. In cases of this type, possible route-leaking may be taking place from other VRF-aware devices that makes it possible for the current device to be managed from within two or more VRFs; though the device is VRF-ignorant, you can choose the network for which you consider the device to be a member for management purposes.
If the NetMRI appliance manages only one network, the Management Network View drop-down will not appear.When the selected device in the Device Viewer is configured to allow only one of its interfaces as its Management address, the Management Address drop-down will not appear. Therefore, it is possible for a device to show neither menu, or to show both.
NetMRI attempts to determine the device Type when the device is first discovered. If this determination is incorrect, you can override the device type as described above. To change the device type determined by NetMRI, open the Type list, click the correct device type, and then click the Update Device button.
Note
You can define individual devices' SNMP and CLI credentials. For more information, see Adding and Testing SNMP Credentials for a Device and Adding and Testing CLI Credentials for a Device.

Infoblox NetMRI 7.4.4 Administrator Guide Part 3 Device and Network Exploration
Copyright ©2020, Infoblox, Inc. All rights reserved. Page 227
•
•
If a device matching the new type already exists for this IP address, NetMRI deletes the current device and no further action is allowed in the current Device Viewer window.
To stop collecting SNMP data from the device, set the SNMP Status option to Disabled, and then click Update Device.
You can disable SNMP data collection if a specific device has a memory leak in its SNMP process, or if you do not need detailed information about the device. If disabled, existing network data (if any) remains available for analysis and reporting, and no additional monitoring data is added until this option is enabled.If SNMP Status is enabled for a device, SNMP collection will also be determined by collection settings for groups and for the entire network.
To use SNMP debugging as a troubleshooting aid, select Enable for SNMP Debug.
To enable or disable the option CLI polling in privileged mode (i.e. Enable mode) for this device in particular, select the necessary option for Privileged Polling. This setting overrides the device group's CLI polling in privileged mode setting. You can also specify to use the Group Default setting here.
To show or hide passwords, in the Show Passwords field, select Yes (to show) or No (to obscure).
To change the community string, type the correct string in the RO Community field, and then click Update Device.
NetMRI automatically attempts to determine the SNMP community string for each discovered device, and periodically checks the community string to determine whether the string has changed.
To specify the SNMP version understood by the device, choose the correct SNMP Version option, and then click Update Device.
To specify whether a configuration change is authorized for the device, select the appropriate Config Change option, and then click Update Device.
By default, Config Change is set to Group Default (i.e., configuration authorization is inherited from the group settings). If the device's Config Change setting should differ from the group, select Locked or Unlocked, as appropriate.
To enter the correct reboot time, type the time (in YYYY-mm-dd hh:min:ss syntax) in the Reboot Time field, and then click Update Device.
The SNMP sysUpTime counter wraps back to zero at about 497 days, making it difficult to determine exactly how long the device has been operating. Use the Reboot Time field to record the true uptime, as described above.
To remove the device from the network database, click Delete Device, and then click OK in the confirmation window. This deletes the device and closes the Device Viewer window.
Note
The Type list shows only the device types known to NetMRI. If no appropriate type exists in the list for the current device, please contact Infoblox Technical Support so they can add that type to the automatic discovery process.
Note
If the SNMP community string cannot be determined, enter it in the RO Community field as described above, or add it in the Settings icon –> Setup –> Credentials page.
Note
When a network device is not responding, NetMRI generates an issue indicating the device is down. If the device has actually been removed from the network, or its address has been changed, remove the device from the network database as described above.

Infoblox NetMRI 7.4.4 Administrator Guide Part 3 Device and Network Exploration
Copyright ©2020, Infoblox, Inc. All rights reserved. Page 228
1.2.3.4.5.
••
•
•
If a non-network device (e.g., workstation, printer) does not appear in the network-wide ARP table during a given day and NetMRI cannot contact during that day, the device is automatically removed from the database. Further, any device (regardless of type) is removed from the database if the appliance has not been able to contact it for seven days in a row.
Collecting Troubleshooting DataOn rare occasions, Infoblox Technical Support may ask you to collect information about SNMP communications between NetMRI and a device. You will then be directed to send the SNMP log to Infoblox for analysis.
Open the Device Viewer and go to Settings & Status –> General Settings.Set the SNMP Debug option to Enabled, then click the Update Device button.Allow NetMRI to run for a time (typically an hour or two) specified by Infoblox Technical Support.As directed, send the SNMP log to Infoblox for analysis.Set the SNMP Debug option to Disabled, and then click the Update button.
Viewing a Device's Management StatusThe Management Status page (Device Viewer –> Settings & Status –> Management Status) displays the same visual indicators as shown for the device in the Network Explorer –> Discovery page. Each discovery indicator shows a related status message.
Device credentials are a critical element in ensuring a device can be managed. You can add SNMP and CLI credentials to any individual discovered device. For more information, see Adding and Testing SNMP Credentials for a Device and Adding and Testing CLI Credentials for a Device.
Viewing Device Event LogsNetMRI provides an intelligent interface to the selected device's event logs. Event logs are collected only for interactions that the device has with NetMRI.
The Logs page (Device Viewer –> Settings & Status –> Logs) displays logs documenting interactions NetMRI has had with the device.
To download the log, click the Text hyperlink above the left corner.
After a moment, the browser will show a dialog requesting to download an archive file for the logs from the selected device. The archive contains a concatenated text file, with the logs from the last few days of device operation.
Device credentials are a critical element in ensuring a device can be managed. You can add SNMP and CLI credentials to any individual discovered device. For more information, see Adding and Testing SNMP Credentials for a Device and Adding and Testing CLI Credentials for a Device.
Checking Device Support and Collection TimesYou can verify data collection activity in the Device Viewer. The Device Support page (Device Viewer –> Settings & Status –> Device Support) contains three tabs:
Device License Status: The tab which provides the following two columns of information:Licensed: Indicates whether the selected device is counted toward the limit allowed by the NetMRI license. A No listing indicates that NetMRI has discovered more network devices than the license allows.Network Device: Indicates whether the device is considered one of the device types that are fully analyzed and eligible to be counted as a licensed device.
Data Collection: This tab lists times at which the most recent collection from various data sources was completed. The sources from which device support information is collected are listed under the Data Source column, and include the device's routing table (ipRouteTable), environment monitoring (DeviceEnvMon), and numerous other data sources as applicable to the specific device type. The End Time for the last data collection is also listed.

Infoblox NetMRI 7.4.4 Administrator Guide Part 3 Device and Network Exploration
Copyright ©2020, Infoblox, Inc. All rights reserved. Page 229
•
•
•
•
•
•
•
Device Support: This tab lists various types of information supported for collection on the current device. The Value column is an indicator of NetMRI knowing that a given device supports the given type of data collection (SNMP, for example). A No value indicates that a type of data collection is not supported for the given device. The value shown here does not prevent NetMRI from collecting the given data. NetMRI may still attempt to collect the given data.
You manage data collection settings through Device Group configuration (see Creating Device Groups for information about group settings for data collection). For example, a simple Cisco router does not support VLANs, and its listing shows No under the Supported column, and a Last Collected: Never message in the Value column. In this case, NetMRI will not attempt to collect VLAN data as the device is not classified as a Switch. When NetMRI encounters a device that it classifies as a Switch but hasn't previously supported, the system will attempt VLAN data collection from the device. The Supported column will reflect No but the Last Collected value may reflect that data collection was possible.
Device credentials are a critical element in ensuring management for a device. You can add SNMP and CLI credentials to any individual discovered device. For more information, see Adding and Testing SNMP Credentials for a Device and Adding and Testing CLI Credentials for a Device.
Issues, Changes, and Network AnalysisNetMRI gathers a wide range of data from network devices over time, then analyzes and summarizes the data for network health monitoring. When you need to troubleshoot a problem, you can drill down to examine device and interface details.
The Network Analysis tab features the Network Scorecard, a metric which, at a glance, provides an overall assessment of the current state of the network, and enables convenient monitoring of many aspects of the overall health of the network. Information is organized in the following tabs under the Network Analysis tab:
Issues: This tab summarizes network status. For more information, see Viewing Issues in the Network and Issues and the Network Scorecard.Changes: This tab summarizes changes made to the network. It is a window into the various changes in configuration for the devices in the network. For more information, see Viewing Changes in the Network.Policy Compliance: This tab summarizes policy compliance for device groups and devices. For more information, see Introducing Policy Compliance.Performance: This tab summarizes device operations in charts and tables. For more information, see Viewing the Performance of Network Devices.
About the Network ScorecardThe Scorecard appears both on the Dashboard tab and on the Network Analysis tab -> Issues.
NetMRI analyzes the network's stability and correctness and calculates a normalized Scorecard value based on all the issues generated for that day. The Network Scorecard provides the high-level performance metric for the managed network. The Network Scorecard shows the Overall Score value for the current day, the constituent stability and correctness values, and the historical trend over the selected time period.
Stability and correctness are measured across a variety of functional areas across the network. The stability and correctness penalties associated with each issue depend on the type and severity of the issue.Nine clickable issue categories — Configuration, Devices, Interfaces, Routing, Security, Subnets, VLANs, VoIP, and Wireless — display the list of issues appearing throughout the network for that category. If the bottom pane shows nothing for the category, that indicates no issues for that category currently exist in the network.
Stability issues are caused by events like excessive spanning tree topology changes, unstable links, congestion, or excessive CPU/memory utilization.Correctness issues are derived from configuration or design errors, such as duplicate VLAN ID/name pairs or inconsistent routing protocol timers.
The Network Scorecard table summarizes the correctness and stability by component area. You can hover over the colored rectangles to see the specific values. The stability and correctness penalties for all components are combined to create the overall scorecard value, the Overall Score number in the Network Scorecard.

Infoblox NetMRI 7.4.4 Administrator Guide Part 3 Device and Network Exploration
Copyright ©2020, Infoblox, Inc. All rights reserved. Page 230
•
••
•
•
•
•
•
•
1.2.
•
•
The exact value of the Network Scorecard value itself is not very important. Rather, it is the relative change in the scorecard value over time that is important. Consequently, the scorecard value is plotted in the Scorecard History chart to make historical comparisons easy. The scorecard value will vary from day to day, but the desired trend over time should be rising, not falling. After two or three weeks of operation, the variability of your network's scorecard value should become evident.
The table at the bottom of the Index tab lists the issues used to generate the Network Scorecard and Network History.
Viewing Issues in the NetworkThe Network Analysis -> Issues tab provides an overview of network status that includes the Network Scorecard, Network History chart, and the issues data driving them. The Issue page defaults to showing the Scorecard with the table of cumulative Issues appearing across the network.
Select any device group to refresh the chart with any data set. You can reformat the Issue page by choosing one of the following four options:
Issues By Type with Scorecard: Shows the Scorecard with its nine categories and the Issues table in the lower panel.Issues by Type: The Issues table by each reported Issue type, with sorting and filtering options.Issues by Device with Historic Chart: Lists issues by device, including each device's cumulative Severity level, its IP address and network view, and its cumulative Issue statistics. Click the IP address to view the Issues page for each device. Doing so allows drilling down to more-specific issue information on the device.Issues by Device: The Issues table, listing cumulative issues status by each device.
You can also perform the following:
To determine the current scope, date, and period, the Scope represents the part of the managed network where issues are currently being reported. To check the scope, look at the header just above the Issues panel. For example, if the current scope is Entire Network, the header will read All Devices.To change the scope, select an item in the Select Device Groups pane on the right.
To change the date or period covered in the analysis, click the selector icon next to the scope, choose Date or Period, and select the required options.To view issues by device, click the Issues by Device tab below the data table. Access multiple pages using the controls below the right side of the table.To view issues by issue type, click the Issues by Type tab below the issues data table. Access multiple pages using the controls under the table.
To filter the issues table by activity type, complete the following:
Open the Display menu (above the column headers).In the drop-down menu, click the activity type you want to see in the table. Choose from the following types:
All: Displays all instances of all issues during the selected time period. For example, if a device goes down, then comes back up, then fails again, All shows both Device Down instances (Current, on the other hand, would only show a single Device Down instance).Current (default): Displays all issues open for today, or all issues open at the end of a given time period if before today.
Note
The Select Device Group pane on the Network Analysis tab displays only extended device groups, i.e. groups that allow for calculations.
Note
Click any device hyperlink to open the Device Viewer for that device. Right-click any device hyperlink to open a menu of actions you can perform for that device. Also, click any Issue hyperlink to open the Issue Viewer for that issue.

Infoblox NetMRI 7.4.4 Administrator Guide Part 3 Device and Network Exploration
Copyright ©2020, Infoblox, Inc. All rights reserved. Page 231
•••
•
•
•••
•
•
New: Displays all issues having new instances during the selected time period.Cleared: Displays all issues that have cleared instances during the selected time period.Suppressed: Displays all issues that have suppressed instances during the selected time period.
Also see Evaluating Issues in NetMRI for more detailed information on issues, their significance and how to manage notifications, issue triggering thresholds, how to create custom issues, and other features.
Viewing Changes in the NetworkThe Changes tab (Network Analysis –> Changes) summarizes changes made to the network. The main Changes table shows more specific information about each detected change. The two following charts appear in the bottom half of the Changes page:
Detected Changes: The history chart displays the number of authorized and unauthorized changes made to the device group. You can choose the change types that are displayed by clicking the Change Type menu below the chart. Choose from Admin, All, External, Hardware, or Software.Most Changed Devices/Most Active Change Makers: This chart lists the top ten changed devices or network admins acting as the most frequent change makers (selectable below the chart). To view the most active Change Makers or most frequently changed devices, select Changed Devices or Change Makers from the View list under the chart.
Taking Actions in Change ManagementAction icons in the table provide access to change traces and the configuration difference viewer. Each listing in the table represents a change incident on a device. A single device can have more than one Change listed here. Each table row provides an Action icon, from which you can view detailed comparisons of before-and-after versions of configuration changes.
You can also perform the following:
To change the date and period, see Setting the Date and Period.To filter by device group, click the desired hyperlink in the Select Device Groups panel to the right.To view change traces, in the Actions column for the desired device, click the icon and choose View Change Details. A Change Details dialog appears, listing the date and time for each related change (Trace Time), and the change Type.To view a device's Running Configuration changes, in the Actions column for the desired device, click the icon and choose View Running Configuration Difference. A separate Configuration Difference window appears, titled Comparing Configuration Files. This window shows the device's running-configuration file, and the changes to the config file associated with the current change instance. It is quite possible that the changes you see in the instance you have selected may already have been fully committed to the system by being saved to the startup-configuration for the device.To view a device's Startup Configuration changes, in the Actions column for the desired device, click the icon and choose View Saved Configuration Difference. These are the changes to a device's startup-configurationshown in this particular change instance, after the admin has performed a wr mem or a copy running-config startup-config command (in Cisco syntax. Other devices may differ in syntax but not in principle).
Custom fields can be defined for additions to tables. These custom fields are not shown in the Changes table by default. The custom fields must be defined in NetMRI before using them in other data tables. See the Defining and Using Custom Fields topic for more information.
To display custom field columns in the Network Analysis –> Changes table, complete the following:
Note
Each table row in the Network Analysis –> Changes table represents a change to a device's configuration, not the device itself. A single device may have several individual changes listed in the table. Related data presentation that makes this clear is seen in the Most Changed Devices chart.

Infoblox NetMRI 7.4.4 Administrator Guide Part 3 Device and Network Exploration
Copyright ©2020, Infoblox, Inc. All rights reserved. Page 232
1.2.3.
1.2.
•
•
•
•
•
•
Hover over any column heading in the table, then click the down arrow at the right end of the column heading.In the drop-down menu, hover over Columns.In the Columns submenu, check the custom field column(s) you want to appear in the table.
To enter or revise custom field data for a change, complete the following:
In the Actions column for the desired device, click the icon and choose Custom Fields.In the Custom Fields dialog, fill in data as needed, and then click the Save button.
Introducing Policy ComplianceThe Policy Compliance tab (Network Analysis –> Policy Compliance) summarizes policy compliance for device groups and devices. Policy Compliance provides a series of rule-based configuration standards to ensure devices conform to broad security requirements when they operate in the network. Note that the Compliance pie chart on the Dashboard page shows the percentage of devices that matched Policy Rules for the current day's time period.
A basic example involves the idea that you should never allow a device with the default admin/admin login tuple to be placed in the production enterprise network. Therefore, you use a Policy Rule mandating this. Policy Compliance also goes much deeper. NetMRI provides Policies based on IAVA and DISA guidelines (and others) to normalize and harden devices against intrusion and unauthorized usage. The guidelines and precepts governing Policies are extensive enough to be beyond the scope of this Admin Guide. The best way to get acquainted with the details of Policy Compliance is to read the descriptions of Rules within individual Policies. Go to Network Analysis –> Policy Compliance –> Policies, select a Policy, and open the tree of Rules in the right panel.
NetMRI's standard model is to deploy policies across an entire Device Group. You can use the standard Policies built into NetMRI. Infoblox recommends using the built-in Policies to develop new ones customized for your network's requirements.
When a Policy Rule is violated, the Rule violation is detected by NetMRI and an Issue message displays in the Network Analysis –> Issues page. In most circumstances, an Error message (the highest Issue severity) is thrown by a Policy violation.
To view a summary for a policy as applied to a device group, hover over the status icon.
To view policy compliance by device group, click All Devices in the Select Device Groups panel to the right of the table. The table will show a summary of policy compliance for each device group.
To view policy compliance details for a group, click a status icon for the group. The resulting table lists devices in the group and shows the status for each rule run against them.To view policy compliance details for one rule against one device: Click the status icon. A pop-up window will display information about the rule as it applies to that device.To return to the policy compliance by the device table for the selected group, click the Return to Policy Viewhyperlink in the upper right corner.
To view policy compliance for individual devices, click a device group in the Select Device Groups panel, or — when the table lists the entire network— click a name in the Device Group column. The table will show per-device policy compliance for devices in the selected group.
To view policy compliance details for a device, click a status icon. A pop-up window will display extensive information about the policy as it applies to that device.To view policy compliance for individual policies, open the Policies list (above the right side of the table), and then click the policy you want to see.To view compliance for all policies, open the Policies list (above the right side of the table), and then click All. You can also click the Return to Policy View hyperlink.

Infoblox NetMRI 7.4.4 Administrator Guide Part 3 Device and Network Exploration
Copyright ©2020, Infoblox, Inc. All rights reserved. Page 233
•
•
•
•
•
Viewing the Performance of Network DevicesNetMRI provides a set of handy tools under Network Analysis for checking the hardware status of devices throughout the network.
Choose any Performance menu item from the Performance tab (Network Analysis –> Performance) and then choose from the Select Device Groups menu on the right. The Performance section summarizes network device performance in a set of charts and tables, including the following:
Performance: This section covers CPU utilization, free memory, uptimes, and interface performance states for all monitored devices.History: This section provides historical information about the number of devices on the network, HSRPs/VRRPs, issues, reboots, routes, subnets, and VLANs.Environment: This section lists devices that monitor environmental conditions.
All charts provide the ability to set a minimum (Min) and a maximum (Max) displayed values to isolate value ranges.
Viewing CPU Utilization LevelsGo to Network Analysis –> Performance –> Performance –> CPUs to view the distribution of CPU utilization over the reporting period for all devices on the network, or for any device group, for which that data is accessible via SNMP. Viewing CPU performance levels enables you to determine whether particular devices or groups of devices are being stressed by excessive workloads. Each level of CPU usage on the X-axis of the chart represents a level of used CPU cycles, from the lowest values to the highest values from left to right. The maximum is 100%. All devices from the selected device group falling into specific levels of CPU utilization are grouped into those values on the X-axis.
Сlick Graph or Table at the bottom of this page for alternate views of the information. Modify the graph using the Metric, Min Utilization, and Max Utilization lists in the upper right corner.
Viewing Memory Utilization LevelsGo to Network Analysis –> Performance –> Performance –> Free Memory to view the distribution of free memory on devices in operation over the current reporting period, for all devices on the network or for a chosen device group, for which that data is accessible via SNMP. Each level of memory usage on the X-axis of the chart represents a level of free memory, from the lowest values to the highest values from left to right. All devices falling into specific levels of free memory are grouped into those values on the X-axis.
Devices with low free memory levels can indicate an inefficient or poorly matched configuration such as a router whose routing table or routing information base (RIB) is too large, or possible memory leaks.
Click Graph or Table at the bottom of this page for alternate views of the information. Modify the graph using the Metric, Min, and Max lists in the upper right corner. For example, if Metric is set to Minimum, the distribution shows the lowest free memory value reached for each device during the selected time period.
Viewing Uptime PerformanceGo to Network Analysis –> Performance –> Performance –> Uptimes to view the distribution of uptimes as of the given date for all routers and switches on the network or for a chosen device group for which that data is accessible via SNMP. Uptimes enables you to evaluate device reliability.

Infoblox NetMRI 7.4.4 Administrator Guide Part 3 Device and Network Exploration
Copyright ©2020, Infoblox, Inc. All rights reserved. Page 234
•
•
•
•
•
•
•
•
•
Click Graph or Table at the bottom of this page for alternate views of the information. Modify the graph using the Min Days and Max Days lists in the upper right corner.
Viewing Interface Utilization LevelsGo to Network Analysis –> Performance –> Performance –> Interfaces to view the distribution of interface utilization on the specified day, for the entire network or for a chosen device group for which that data is accessible via SNMP (interfaces having zero throughput are excluded). This process can help identify interfaces having excessive utilization or errors, or that are being under-utilized, and can be used for other troubleshooting purposes.
Click Graph or Table at the bottom of this page for alternate views of the information. Modify the graph using the Metric, Min, and Max lists in the upper right corner.
Viewing Network Device Summaries and HistoriesGo to Network Analysis –> Performance –> History to begin viewing aspects of the historical behavior of all network devices on the managed network.
To work effectively with the charts on this page, choose any menu option on the left (History –> Routes, for example), and then choose a device group from the menu on the right. The data set that is shown in any Performance, History, or Environment page will change to show the data specific to the chosen device group.
Devices: This page summarizes the total number of devices found on the network for the reporting period, and those found for each of the last 30 days. Data sets can be shown for individual device groups. The summaries come in the form of bar charts and in data tables listing the basic data sets comprising the device types and the states the devices were in when discovered. For more information, see Device History Summaries.HSRPs/VRRPs: Shows the number of distinct HSRP and VRRP groups found on the network during the 30 days before the selected date. For more information, see HSRP/VRRP Summaries.Issues: Summarizes the number of issues by severity and difference type. For more information, see Viewing Issue Summaries.
Reboots: Shows the number of reboots detected for router and switch devices for the 30 days before the selected date. Frequent reboots, or large numbers of reboots, could indicate a problem. See the Troubleshooting Device Reboots topic for more information on this feature.Routes: Shows the number of routes discovered on the network during the 30 days before the selected date. For more information, see Summarizing Routes.Subnets: Shows the number of subnets found on the network during the 30 days before the selected date. For more information, see Summarizing Subnetworks.VLANs: Shows the number of distinct VLANs found on the network during the 30 days before the selected date. Investigate changes in the number of VLANs. For more information, see Summarizing VLANs.
Note
Set Max Days to 720 to see the number of most-reliable devices on the network.
Note
Most networks have at least a couple of issues generated each day. If the trend stays relatively constant or decreases over time, things are normal.

Infoblox NetMRI 7.4.4 Administrator Guide Part 3 Device and Network Exploration
Copyright ©2020, Infoblox, Inc. All rights reserved. Page 235
•
•
•
•
1.2.
a.
b.
c.
•
•
Device History SummariesDevice page summaries come in the form of bar charts and in data tables, that list the basic data sets comprising the device types and the states the devices were in when discovered.
Device Types: This table shows the current number of devices (as of one minute after midnight on the selected date) and the difference from the previous day.
Device Type History: This chart shows the total number of devices found each day for the 30 days before the selected date.
Device States: This table shows the number of devices that are Down (seen before the previous day, but not on the previous day) and New (first seen the day before the selected date).
Device State History: This chart shows the relative number of Down, New, and Old devices found each day for the 30 days before the selected date.
HSRP/VRRP SummariesDevices running Cisco Hot Standby Routing Protocol (HSRP) and/or Virtual Router Redundancy Protocol (VRRP), primarily for purposes of VPN concentration, are summarized on the HSRP/VRRP page (Network Analysis tab –> Performance tab –> History section –> HSRPs/VRRPs). HSRP/VRRP groups are counted by the appliance and summarized by daily count in a bar chart. Any change in the number of HSRP or VRRP groups may indicate a configuration change.
Troubleshooting Device RebootsNavigate to the Network Analysis tab –> Performance tab –> History section –> Reboots page to see which devices are experiencing reboots.
Click the device hyperlink in the IP Address column. The Device Viewer opens for that device.In the Device Viewer, perform the following:
Examine Device –> Performance charts. The Reboots chart shows how many times the device has rebooted (click the date hyperlink to change the date). The CPU Statistics and Free Memory charts show the general state of the device before each reboot.A sawtoothed Free Memory chart that decreases to zero before every reboot, indicates a memory leak. Consider upgrading the device's OS.If CPU utilization is above 90%, the device is struggling to keep up with the workload. That might be caused by a run-away process or too much network traffic.
Summarizing RoutesThe Routes page (Network Analysis tab –> Performance tab –> History section –> Routes) page provides a basic picture of the routing environment for the managed network, and for specific device groups. Click a device group in the Select Device Group panel to display information for the routing tables associated only with that device group.
Types: This table shows the number of routes as of 1 minute after midnight on the selected date, and the difference from the previous day (in the Diff column, which applies only in the current time period). Internal and External route designations are based on the CIDR list used during the discovery process.
Route Type History: This chart shows the number of routes over the 30 days before the selected date.
Note
A device may be listed as Down in NetMRI when it may be running but unreachable for some reason. Also, if NetMRI is down for an extended period, it will report all devices as Down because there is no record of reaching them during that time.

Infoblox NetMRI 7.4.4 Administrator Guide Part 3 Device and Network Exploration
Copyright ©2020, Infoblox, Inc. All rights reserved. Page 236
•
•
•
•
Protocols: This table shows the number of routes for each protocol type in the canonical network routing table discovered on the network. Discovered and tabulated route types include all the standard protocols, including BGP, Cisco IGRP, ICMP, IS-IS, Local, OSPF, Other, RIP, and Static routes.
Route Protocol History: This chart shows the number of routes for each protocol during the 30 days before the selected date. You can scrutinize significant shifts over time by choosing different dates and time periods through the date picker.
Summarizing SubnetworksSubnetworks are classified as two main types, Internal and External.
Subnet Types: This table shows the number of subnets as of one minute after midnight on the selected date, and the difference from the previous day.
Subnet Type History: This chart shows the number of subnets during the 30 days before the selected date. Clicking a device group shows a subset of the total. Any subnets associated with a switch-routerdevice type are counted against the total number of subnets for the selected Routing device group.
Summarizing VLANsThe VLANs page (Network Analysis tab –> Performance tab –> History section –> VLANs) is a network-wide or device-group-specific view of the collection of distinct VLANs in the discovered network. The table shows the total of active VLAN networks in the L3-switched environment. For more information, see Inspecting Ethernet Switches and VLANs.
Viewing Device Environmental DataThe Environment Summary table (Network Analysis tab –> Performance tab –> Environment section –> Environment) provides a large collection of environmental data for all collected devices on the network, showing the status for device components such as power supplies, system fans, and chassis temperature. Each device also lists its associated Network View. Clicking the Network View name opens the Network View editor window. By default, this table is sorted by IP address, which you can sort by column by clicking a respective column header.
Also, clicking the right end of any column heading will show a Sort Ascending and Sort Descending option along with a Columns option. Hovering over Columns enables you to add or remove columns of data from the Environment Summary table.
The Environment Summary table lists power supply, fan, and temperature data for devices that monitor these environmental conditions.

Infoblox NetMRI 7.4.4 Administrator Guide Part 4 Automation Change Manager Scripting and Job Management
Copyright ©2020, Infoblox, Inc. All rights reserved. Page 237
•••
•
•
•
•
•
Part 4 Automation Change Manager Scripting and Job ManagementThe Automation Change Manager is a software module that helps automate and normalize the configurations of all supported routing and switching devices across the managed network. Effective job automation requires the use of automation scripting, for which two different languages are provided, Perl and the proprietary CCS high-level scripting language. This section includes the following chapters:
Configuration ManagementJob Management and Automation Change ManagerJob Scripting
Change and configuration reporting and customized reporting are also supported by Automation Change Manager, which is described in the following chapter:
Reports and Report Management
Configuration ManagementConfiguration management provides several of the most powerful and interactive features in the NetMRI software, including the ability to view, compare, and edit configurations for all devices in the network. You can also automate repetitive processes across any number of devices, correct discovered issues, and create Policies to verify network configurations. If you are used to having dozens of Telnet or SSH windows open on a desktop to inspect devices' configuration files, with no ability to compare or search, this feature set was made for you.
In NetMRI, this feature set is termed as Configuration Management.
Configuration Management features also allow viewing and editing of configuration files for any virtual device contexts detected and managed by NetMRI.
Config Management provides the following features:
Config Archive: This tab provides tools to browse, view, compare, and edit device configuration files across all devices and virtual devices in the managed network.Config Search: This tab allows you to search for specific configuration strings or expressions across any and all configuration files for any device in the managed network. For more information, see Using Searches in Config Management.Job Management: This tab allows you to create, schedule, approve, and run Job Management scripts, and define custom issues. Job Management is used by NetMRI to automate common network administration tasks. For more information, see Job Management and Automation Change Manager.Policy Design Center: This tab allows you to create rules and policies, and deploy policies on the network. NetMRI supports Policy Design and Policy Management. Rules are the building blocks that form a Policy. For more information, see Policy Design Center.

Infoblox NetMRI 7.4.4 Administrator Guide Part 4 Automation Change Manager Scripting and Job Management
Copyright ©2020, Infoblox, Inc. All rights reserved. Page 238
••
•
Elements of configuration management apply across numerous parts of NetMRI, including the Device Viewer, which provides its Configuration Management section for viewing and editing specific config files and viewing their history, and the Settings window, which provides a set of global settings for configuration management.
NetMRI also filters 'collection noise,' by removing artifacts from the configuration collection process, filtering elements such as command prompts, line breaks and page breaks, and extraneous header/footer information during configuration data collection. This process occurs automatically without user intervention.
You can also filter and ignore configuration changes executed by automated systems, or changes executed through a NetMRI Automated Change Management (ACM) process, using a designated login, which the admin may wish NetMRI to ignore while the job executes. For more information, see Filtering Change Notifications from User Accounts.
Using the Config ExplorerThe Config Explorer page (Device Viewer –> Configuration Management –> Config Explorer) lists the configuration files NetMRI collects and archives from each discovered device. The table in the left pane lists devices based on a selected Device Group. The grouping scheme collects all switches, routers and other devices found in the network, including all virtual device contexts supported by respective devices such as Cisco ASA firewalls and Cisco Nexus 7000 switches.
Virtual device contexts are treated in the same fashion as normal non-virtual devices, enabling viewing of configuration files for any virtual device context.
Config Explorer opens showing the Entire Network device group in the left panel. Choose any device group from the Device Group drop-down list. Choosing any device from the list in the left panel lists all configuration files for the selected device that are collected by NetMRI. Currently active running and saved configurations are identified as Current.
NetMRI identifies earlier revisions of configuration files on any device as Archived.The left panel lists devices for the chosen device group, by IP address, Device Name, and Device Type (Router, Switch).The right panel of the Config Archive page lists all configuration files present in the file system of the chosen device.
In the right panel, NetMRI provides all listed configuration files. To view the content of a configuration file, hover over its Actions icon and select View Configuration File. In the window that opens, you can select and copy the file text. You can also export a configuration file. For more information, see Export Configuration Files.
A flag icon in the BL column indicates that a file is a baseline configuration. The flag marks one configuration file from each device's collection as a baseline file — a verified configuration backup that can be reinstalled to correct problems. You can designate any device configuration file as the baseline file.
You can view and compare configuration files for any network router, switch, firewall, or other network device or pair of devices.
If NetMRI detects a configuration change via Syslog, the configuration entry identifies the user(s) that made the change in the Edited By column. More than one user may make changes before NetMRI collects the configuration. Changes
Note
You can define change blackouts for device groups and for networks. Change blackouts allow for read-only discovery and data collection from devices involved in the blackout, but prevents any status or configuration changes to them. For more information, see Defining Blackout Periods.
Note
The operations on config files are carried out against the configs that are stored on NetMRI. Once you make changes to a configuration file, those changes must then be committed to the device.

Infoblox NetMRI 7.4.4 Administrator Guide Part 4 Automation Change Manager Scripting and Job Management
Copyright ©2020, Infoblox, Inc. All rights reserved. Page 239
1.2.
3.
1.2.
1.2.3.
1.2.3.4.
1.2.3.
detected by mechanisms other than Syslog (e.g., if Syslog messaging is not bound to the appliance) show the user as "Unknown" in the Edited By column.
The Last Collected timestamp indicates the time at which the running configuration was last pulled, while timestamps of saved configurations reflect the times at which the saved configurations were found to differ from the archived version.
To view a configuration file, complete the following:
In the left panel, select the device group. from the drop-down list.Choose a device from the table. A list of the configuration files residing in the current device appears in the right panel of the Archive page. One configuration file will always be flagged as the Baseline or BL configuration file (shown with a green flag). Watch the Status and Config Type values for each listed file. To perform a quick search, in the Search field, type at least three characters of the search term (or enter one or two characters, then click ENTER).Click the View Configuration File button in the Actions column.
To collect the latest configuration files for a device, complete the following:
In the left panel, select the device.Click Get Config. The list refreshes within a few minutes.
Set a Baseline Configuration FileTo designate a configuration file as the baseline, complete the following:
In the right panel, click the check box for the file you want to be the baseline.Click the Set Baseline button at the bottom of the page.Confirm the change.
Test a Configuration File Against a PolicyTo test a configuration file against one or more policies, complete the following:
In the Config Management –> Config Archive page, choose the Device Group if necessary.Select the NetMRI.Test against the policy.In the Policy Selector dialog, check the policies to test against, and then click Test.
Compare Configuration Files on a Single DeviceTo compare two configuration files for one device, complete the following:
In the Config Management –> Config Archive page, choose the Device Group if necessary.In the left panel, select the device.Click the check boxes for the two files you want to compare.
Note
Selecting the All Devices device group lists all devices with configuration files in the network, including all virtual device contexts, which are treated in the same fashion as any other devices, including the ability to view their config files.
Note
NetMRI lists only the latest 200 configuration files stored for a given device. Older configuration files are available via bulk export. For more information, see Bulk Exporting Configuration Files.

Infoblox NetMRI 7.4.4 Administrator Guide Part 4 Automation Change Manager Scripting and Job Management
Copyright ©2020, Infoblox, Inc. All rights reserved. Page 240
4.
1.2.3.4.5.6.7.8.
1.2.3.4.5.6.
Click the Compare button at the bottom of the page. The Comparing Configuration Files window opens, in which you can compare the files (see below).
Compare Configuration Files for Two DevicesTo compare configuration files for two devices, complete the following:
In the Config Management –> Config Archive page, choose the Device Group if necessary.In the left panel, select the device. Click the Compare Second Device button at the bottom of the page.In the top left panel, select the first device.In the top right panel, check the check box for the first device's configuration file.In the bottom left panel, select the second device.In the bottom right panel, check the check box for the second device's configuration.Click the Compare button at the bottom of the page. The Comparing Configuration Files window appears.
Export Configuration FilesTo export selected configuration files, complete the following:
In the Config Management –> Config Archive page, choose the Device Group if necessary.In the left panel, select the device. NetMRI.Select the files you want to export.Click Export in the lower right corner, then click Export Selected.Confirm the export. The system packages the file(s).Save the archive.
For more information, see Bulk Exporting Configuration Files.
Checking for Syntax ErrorsThe Errors page (Device Viewer –> Configuration Management section –> Errors) lists possible syntax errors in configuration files associated with the device. If no configuration file errors appear for the selected device, the Device Viewer shows a No Data To Display message.
To view an error log, in the Error list, click the log you want to view, and then click the View button.
Defining Config Management SettingsThis topic describes the data collection methods that NetMRI uses to acquire its database of configuration files. Those methods include SSH, Telnet, and SNMP, all of which should be enabled to ensure a complete collection.
Note
You can compare configuration files from two or more devices in the Configuration Management –> Config Archive tab.
Note
Configuration data collection settings (for Telnet, SSH, and SNMP) can also be defined through the Setup Wizard (Settings icon –> Setup –> Setup Wizard) in Step 9, Device Interrogation Techniques.

Infoblox NetMRI 7.4.4 Administrator Guide Part 4 Automation Change Manager Scripting and Job Management
Copyright ©2020, Infoblox, Inc. All rights reserved. Page 241
•
•
•
•
•
•
•
•
Under Settings, the Collection and Groups panel (Settings icon –> Setup –> Collection and Groups –> Global tab –> Config Management side tab) controls configuration collection for all devices in the network. Config Management settings define the protocols used for communicating with network devices.
Ensure established communications protocols (SSH, Telnet, SNMP) to all managed devices. If Use Telnet Protocol and Use SSH Protocol are both disabled, NetMRI cannot collect configuration files from any device.
The Collection and Groups panel consists of the following:
Config Collection: If enabled, configuration files are collected from network devices. All settings apply globally Config Locked. If enabled, configuration changes to network devices are not authorized.Use Telnet Protocol: If enabled, NetMRI automatically attempts to access a device via telnet when it is discovered, using the list of passwords in Settings icon –> Setup –> Credentials. If disabled, the system performs no telnet configuration collection, password guessing, or vendor default username/password checking for any monitored device.Use SSH Protocol: If enabled, NetMRI automatically attempts to access an SSH via telnet when it is discovered, using the list of passwords in Settings icon –> Setup –> Credentials. If disabled, the system performs no SSH configuration collection, password guessing, or vendor default username/password checking for any monitored device.
Use HTTP Protocol: NetMRI can use the HTTP protocol to access a discovered device for configuration collection. If disabled, the system performs no HTTP-based configuration collection, password guessing, or vendor default username/password checking for any device.Use Vendor Default Credentials: NetMRI can use passwords marked as Use Vendor when trying to determine a login to devices for configuration collection. If enabled, the passwords entered as Local Users in Settings icon –> Setup –> Credentials are attempted first, then those marked as Use Vendor. If disabled, the system attempts only username/passwords marked as Use Local (for organizations that do not want the additional traffic of the Vendor Default password set).Script Execution: If enabled, NetMRI users with the correct privileges can execute Configuration Command Scripts or Perl scripts.Vendor Default Credential Collection: If enabled, NetMRI will automatically check for default vendor credentials at the interval specified in Frequency. Checking for vendor default credentials ensures that the network meets compliance standards.
Frequency: If set to Weekly, NetMRI will check for vendor default credentials once per week. If set to Daily, the appliance will check for vendor default credentials once per day, at the Hour and Minute specified in the box below the Daily option.
Note
You can override settings in this panel at more granular levels, through Device Group and Interface Group communications settings specified in the Groups tab of this page.
Note
Many devices generate log messages for SSH access attempts coming from unknown IP addresses. To avoid confusion, add the IP address assigned to NetMRI to all appropriate access control lists and security logs.
Note
NetMRI comes pre-loaded with a list of vendor default community strings; you can add more at Settings icon –> Setup –> Credentials.

Infoblox NetMRI 7.4.4 Administrator Guide Part 4 Automation Change Manager Scripting and Job Management
Copyright ©2020, Infoblox, Inc. All rights reserved. Page 242
1.2.
3.
1.2.
3.4.
5.
Bulk Exporting Configuration FilesYou can export configuration files to a TAR archive (.TGZ) or Zip archive file. You can export an entire device group's collection of config files in an archive file format. This includes the All device group.
You can choose configuration file types, across an entire device group, for inclusion in the exported archive. Config files are treated the same regardless of the type of devices within the selected device group.
If, for example, Cisco and Juniper router devices are part of the selected device group, this operation will fetch and export the specified configuration file type from both router types along with any others supported by the appliance.
To export one or more listed configuration files, complete the following:
Click the check box for the file(s) you want to export.Click the Export button in the lower right corner, then choose Export Selected. The Export Configuration Datawindow appears.Select the Config Type for the type of device configuration file to be placed in the exported archive. The types are as follows:
Running and Saved Captures only the configurations that are verified by NetMRI as being both saved and currently running.
Running Only Exports only the "running configuration" files that the chosen devices loaded upon their last startup. For example, if Cisco IOS devices are part of the selected device group, this option selects the extant Cisco running-config configuration files for inclusion in the exported archive. For Juniper routers, this option selects all current configuration files represented in the file systems from Juniper devices in the group.
Saved Only Retrieve only Saved configuration files from all devices in the selected device group, regardless of device type.
Current Running Export only the configuration that is currently running in each of the devices within the device group. For example, the contents in a Cisco running-config configuration file may differ from the configuration that is actually running. Essentially, this option captures only what is currently running in the configuration in each device's memory, and does not reference any of the contents of the device's file system.
From the Device Group dropdown, select the desired Device Group from which configuration files are exported.To create a Change Revision file, choose Create Change Revision File. A CR.LOG text file is placed in the root folder of the archive, listing the diff operations carried out by NetMRI on the configuration files pulled from each device in the group. A separate directory of HTML-formatted diff files also is created in the archive, each of which provides a direct comparison of the changes, if any, that took place between two sequential versions of each configuration file in the export. Depending on the number of devices, creating Change Revision files can take some time to compile.
To prevent the creation of diff files, choose Don't Create.Confirm the export. The Export Configuration window displays an event listing for all of the configuration files it has accessed. NetMRI packages the files and displays a Successfully Packaged Configuration Data message.To save the archive on a local hard disk or another location, click Download File. A standard Windows browser dialog box appears to open or save the file.
Note
A Change Revision file is meaningful if you choose the Running and Saved or Saved Onlyconfigurations. For Saved Only, each diff file lists the changes to each configuration file chronologically, from most recent to oldest.
You obtain no diff results if you specify the Running Only or Current Running options with the Creating Change Revision Files option.

Infoblox NetMRI 7.4.4 Administrator Guide Part 4 Automation Change Manager Scripting and Job Management
Copyright ©2020, Infoblox, Inc. All rights reserved. Page 243
1.2.
3.4.
1.2.
3.
4.
5.
1.
2.
Comparing Two Configuration FilesNetMRI provides different ways to compare configuration files. You can open the device's config files from within the Config Management –> Config Archive page, or directly from the Device Viewer. We describe both methods in this section.
Using the Configuration Manager to Compare Config FilesTo compare two configuration files in the Configuration Manager, perform the following:
Navigate to Config Management –> Config Archive.Select a Device Group, and then select a device in the table beneath. The right panel of the Archive page displays the library of configuration files discovered in the device.Select two files by enabling their check boxes.Click the Compare button. A Comparing Configuration Files window appears, listing the chosen configuration files side-by-side.
You can compare configuration files between devices, from within the same device group or between any two devices anywhere in the network by selecting them.
Navigate to Config Management –> Config Archive.Choose a Device Group, and then choose a device in the table beneath. The right panel of the Archive page displays the library of configuration files discovered in the device.Click the Compare Second Device button. The Config Archive page splits horizontally to show a second Device Group drop-down, device table, and Config Archive panel.In the second Device Group dropdown, choose the group and choose the device. Then, on the right-hand panel, select the checkbox for the config file. For example, compare the Current Running config files for each chosen device.Click the Compare button. A Comparing Configuration Files window appears, listing the chosen configuration files side-by-side.
Using the Device Viewer to Compare Config Files
The Device Viewer also offers its own Config Explorer page (Device Viewer –> Configuration Management –> Config Explorer) which allows comparison of any stored revisions of a single device's running or archived configuration files.
To compare two configuration files in the Device Viewer, perform the following:
Navigate to Device Viewer –> Configuration Management –> Config Explorer for a particular device. In the table, select two files by enabling their check boxes.Click the Compare button. The Comparing Configuration Files window opens, where you can compare the files.
Change Management in the Comparing Configuration Files WindowWhen the Comparing Configuration Files window appears, each of the two panels provides a drop-down config file menu. The menu allows you to load any other configuration file from the chosen networked system, from all four categories: Running, Saved, Baseline, or Templates. Each of the menu options provides a submenu that lists each of the configuration files, based on their respective category. The Saved option, for example, shows all Current Saved and Archived Saved configuration files present in the device. Choosing one of these loads that file into the current panel.
Note
See the Using the Config Explorer topic for related information about using the Device Viewer to compare config files in a device.

Infoblox NetMRI 7.4.4 Administrator Guide Part 4 Automation Change Manager Scripting and Job Management
Copyright ©2020, Infoblox, Inc. All rights reserved. Page 244
••••
•
•
•••
••
The Templates option enables the loading of a Config Template from the NetMRI appliance. This can help you determine if and how a given configuration on a device deviates from the mandated template for the organization. For more information on developing config templates, see Working with Configuration Templates.
By default, config files are shown side-by-side in the Comparing Configuration Files window. You can change the appearance of the current window by using the View menu. Display configuration files in Side-by-Side, Inline, or Over/Under.
While many users will likely stay with the default, Inline is a useful option that directly matches the changes per line against the same line for both configuration files. The top line for each change comparison is from the left-side config while the lower line is from the right-side config.
The side-by-side view provides a scroll bar for each configuration file panel. You can display the entire file, or Changes Only which shows only the changes to each file in the Viewer. You can choose the number of surrounding lines of file text for the changes in each file.
Finally, choosing Swap Files switches the two files' visual position in the window.
Difference Highlighting and File ExportingThe Comparing Configuration Files window highlights differences between the configuration files as follows:
Blue indicates a change in either selected file.Red indicates a removal.Green indicates an addition.Gray shows where unchanged lines have been removed from the files to shorten them for easier viewing.
Actions in the Comparing Configuration Files window consist of Exporting either of the open files. Choosing this option uses the standard Web browser to save the text file into the default download directory on the local machine.
To replace one file with another file, click the icon, and then select the new file in the drop-down list. The current file is indicated by a dot to the left of its name.To find a specific text, type the text in the Find field, and then press Enter. Bold highlighting is applied to instances of the search string in both files.To change file orientation, choose View –> Side-by-Side, Inline, or Over/Under.To switch between viewing changes only and entire files, choose View –> Entire file or Changes Only.To change the number of lines visible around changes, choose View –> Number of lines to show aroundchanges.To swap file locations within the window, choose View –> Swap Files.To export a configuration file, open the Action menu and then click the name of the file you want to export.
Rolling Back to an Earlier Configuration
Note
If the differences between the two configuration files exceed 20,000 rows, the Comparing Configuration Fileswindow displays only the differences without the side-by-side comparison. You can download the entire diff file by using the CTRL + S command.
Note
The Config Rollback feature is supported only for Cisco IOS Switch, Router, and Switch-Router devices. Rolling back to an earlier configuration is potentially very disruptive, and should only be done if other measures cannot resolve a problem.

Infoblox NetMRI 7.4.4 Administrator Guide Part 4 Automation Change Manager Scripting and Job Management
Copyright ©2020, Infoblox, Inc. All rights reserved. Page 245
1.
2.3.4.5.
If necessary, authorized users can reinstall an earlier configuration file on a device. You might carry out a rollback, for example, if the device's current configuration file is corrupted. Users can perform rollbacks that are assigned the Scripts:Level3 privilege, such as the system administrator, and users that are assigned the role of ChangeEngineerHigh.
To roll back a configuration, NetMRI must reboot (reload) the device, which completely clears the active configuration from memory and restarts the device with the specified configuration. This will interrupt the device's service, and for critical devices, rollback should be performed during off hours.
A Config Rollback issue — indicating success or failure — is raised for the device.
After you initiate a rollback, NetMRI transfers the specified configuration file to the device, verifies that the file has been properly transferred and stored, then restarts the device. The appliance cannot validate that the configuration file you select is correct for the device in its current context.
Example: Consider a case where the enable password in the configuration file you are rolling back to, is different from the one currently in use on the device. After the rollback, NetMRI will not be able to log in to the device (which now has different credentials) to run scripts or collect configurations. You must manually update the device credentials within NetMRI. Similar issues may arise if the configuration you are rolling back to specifies different IP addresses, SNMP community strings, different authentication methods, etc.
To roll back to an earlier configuration file, perform the following:
Carefully analyze all aspects of performing the rollback, and consider less drastic alternatives. If rolling back is your last resort, follow the next steps.In the Config Explorer's left-hand panel, click the device to be rolled back.In the right-hand panel, select the file you want to install on the device.Click Rollback.In the Are You Sure? dialog, review the configuration file details. Click OK.
Using Searches in Config ManagementThe Config Search tab (Config Management tab –> Config Search) enables searching for configuration files by text content and other device parameters. Search listings enable the viewing and editing of configuration files and creating templates from configuration files.
Hundreds of configuration files exist across the data center or the enterprise. The Config Search allows you to search across all of them for a characteristic phrase or string of characters, such as "bgp as", "arp timeout", or any other string that may appear in any configuration file. The Config Search will list only the configurations that match the search string.
Note
If you are considering rollback for a partial configuration loss or corruption (for example, unauthorized adjustment of an ACL), a better approach is to use a task-specific CCS Script to restore just the relevant settings. Once the change has been verified, save the new configuration.
Note
After confirming the rollback, if you decide not to install the specified configuration file, abort the rollback by quickly canceling the job in the Config Management –> Job Management tab.
Note
Config searches are case-sensitive.

Infoblox NetMRI 7.4.4 Administrator Guide Part 4 Automation Change Manager Scripting and Job Management
Copyright ©2020, Infoblox, Inc. All rights reserved. Page 246
1.2.
3.••
4.•
•
•
5.
6.
7.
•
•
••
8.
1.2.
1.2.3.
1.2.
You can carry out searches against Running configurations, Running and Saved configs, or across All Current and Archived configurations. You also can export search results to an external file.
Searches may take a significant time to complete. In such cases, Config Search practices partial loading, in which after starting the search, following the Building Device List procedural message, Config Search begins to list the first matches found during the process. The results list continues to incrementally update until the search completes.
To perform a search and its various functions, complete the following:
Under Saved Searches, click New Search.In the Select Filters panel, click CTRL + click or SHIFT + click to choose the device group(s) in the Device Grouplist.Specify the Results Per Config. See the following choices:
First Occurrence: Searches and then displays only the first positive match.All Occurrences: 6Searches and displays all positive matches in each configuration file.
Specify the Scope. See the following choices:Current Running: Search through the current running configuration of the specified devices, as collected by NetMRI.Current Running and Saved: This performs the search through all configuration files for the device that is currently stored in NetMRI. This search may take considerably longer.All Current and Archived Changes: This confines the search to changes detected and archived by NetMRI.
In the Define Criteria panel, enter one or more search criteria: select a parameter, select an operator (Contains, Matches, Does Not Match, or RegEx), enter the matching string, and then click Add.Below the search criteria list, specify how to apply the search criteria. If you chose Custom Logic Builder..., enter the logic for combining the search criteria in the field to the right [for example, 1 and (2 or 3)].To control which columns appear in the results, click the Edit Result Fields button. The Edit Results Fields dialog appears.
Use the horizontal arrows to move the fields between the Available Fields and Selected Fields lists (fields in the Selected Fields list appear in the result). You can also double-click fields to move them between the lists.Use the vertical arrows, First button and Last button to rearrange fields in the Selected Fields list (the top-to-bottom order in the Selected Fields list translates into left-to-right order in the results).To preview the new column arrangement: Click Apply.Click OK.
Click Run.
To save the search currently specified in the Select Filters panel and Define Criteria panel, do the following:
Click Save.In the Save Search dialog, enter a name for the search, then click Save. The new Search instance appears in the Saved Searches panel. Clicking on a saved search opens the contents in the Select Filters and Define Criteriapanels.
To modify a saved search:
In the Saved Searches list, click the search to modify.In the Select Filters and Define Criteria panels, make the desired changes.Click Save.
To run a saved search:
In the Saved Searches list, click the search to run.Click Run.
Working with Search ResultsAfter a search finishes, you will often see more than one search result for a given device, depending on whether you select Current Running and Saved or All Current and Archived Changes.After executing a Search, click the IP address hotlink for any device to open its Device Viewer. Then, click Configuration Management –> Config Explorer. Then, click the Actions icon and choose View Configuration File for any config file that

Infoblox NetMRI 7.4.4 Administrator Guide Part 4 Automation Change Manager Scripting and Job Management
Copyright ©2020, Infoblox, Inc. All rights reserved. Page 247
1.
2.
3.
1.2.3.4.
5.6.7.8.
9.10.11.12.
13.
1.2.
3.4.
•
•
is present in the device.To test a configuration file against a policy: click the IP address hotlink for any device to open its Device Viewer. Then, click Configuration Management –> Config Explorer. Then, click the Actions icon and choose Test Against Policy for any config file.To set a configuration file baseline, do the following:
Select the checkbox for the config file in the search result list. Multiple config files may be displayed for any given device in the chosen Device Group, so make sure you select the correct file.Click the Set Baseline icon. A warning message appears, noting that changing the baseline from the current location will override any previous baseline definitions.Click Yes to designate the new baseline configuration.
Running Jobs Based on Search ResultsThe Config Search page also provides for running scripted jobs against configurations after a search result.For a much deeper discussion of jobs and running them against devices, see Job Management and Automation Change Manager in the NetMRI Administrator's Guide or in online Help.To run a job against one or more configuration files, do the following:
Click the check box for the file(s) where you want to run a job.Click the Schedule Job button at the bottom of the page. The Job Wizard opens.In the Fill out Job Details screen, type a Job Name.To allow the job to run: Click the Approved option if your admin account supports it; otherwise the job will have be approved by the Admin user.Type a Description of the job.In the Scripts list, select a script. If required by the script, enter data and/or select options.Click Next.In the Select Device Groups or Devices screen, click the Add icon to select specific device groups and/or devices to which this job applies.Click Next.In the Schedule when Job should run screen, specify the schedule for the job.Click Next.In the Review and save screen, review the job specifications. If changes are needed, click the < Previous button to return to an earlier screen.Click Save.
Track scheduled jobs in the Job History.
To execute a command on one or more configuration files, do the following:
Click the check box for the file(s) where you want to execute a command.Click the Execute Command button. The Ad Hoc Command Batch script opens in a new window for command string input.Enter the command(s).Click OK.
Viewing Config HistoriesThe Config History page (Device Viewer –> Configuration Management –> Config History) shows the configuration change history for the device. This feature allows you to essentially travel back in time for a selected device.
The Configuration table shows the times for the last reboot, last configuration change and last configuration saved.The Config Changes chart shows configuration activities and differences. For example, if the saved configuration was accessed twice and changed twice during the time period, four bars would appear in the chart — one for each access and one for each set of differences. Bar height indicates the number of configuration activities or the number of differences detected at each saved configuration change (i.e., the number of differences between the two most recent saved configurations).

Infoblox NetMRI 7.4.4 Administrator Guide Part 4 Automation Change Manager Scripting and Job Management
Copyright ©2020, Infoblox, Inc. All rights reserved. Page 248
•
•
•
•
•
•••
•••
To change the period covered in the page: Open the Time Selector list (at the top of the page) and click the desired period.
Job Management and Automation Change ManagerNetMRI's Job Management feature set (Config Management –> Job Management) enables automation of processes for monitoring and analyzing the network, and to perform routine maintenance. Job Management is also the enabling feature in the Automation Change Manager (ACM) system, which leverages support by the NetMRI appliance to automate tasks in the Infoblox NIOS grid network. Job Management and Job Automation operations involve the following NetMRI tools:
Scripts, used for automation tasks across numerous devices across the network, which execute Command Line Interface commands on network devices. You can write scripts in Infoblox’s proprietary CCS language, Perl, or in Python, using the standard Perl and Python API;Jobs, which are scheduled instances of scripts that run against selected devices or device groups. You can also use end-user credentials for specific jobs;Custom issues, which scripts can raise to point out conditions discovered during script processing. See the section Creating Custom Issues for more information on custom issues and their use in jobs.
Job automation ensures consistency across related devices in the managed network and saves valuable time. Because NetMRI supports Perl, Python, and its own proprietary CCS scripting language, change automation offers significant benefits:
Users can define generic configuration templates for large collections of like devices such as Cisco or Juniper routers and switches;Users can execute mass change rollouts through the downloading of template files, reducing the need to execute sequences of CLI commands, and enabling larger-scale automated changes across the network;Perl and Python support ensures an almost infinite capability for expansion of automation features;Apply complex script logic and looping through Perl/Python, with script logic modules and subroutines.Scripts can reference external tables and lists to populate variables when executing actions on devices.
Note: When using Perl/Python scripting for automation, isolate NetMRI appliance performance from errant or excessive consumption of resources by the script. Job Scripting describes many aspects of Perl-based job automation and Python-based job automation.
NetMRI provides a dedicated guest virtual machine (VM) environment under which Perl/Python scripts execute in isolation. The guest VM’s disk and memory resource allocations are strictly limited and cannot be adjusted from within the VM. Process scheduling functions in the appliance such as nice and ulimit also apply, because the guest VM is subject to standard scheduling rules.
The guest VM provides limited communication with the host NetMRI appliance and with other systems on the network. Network services that operate within the VM include OpenSSH and Samba (SMB) for communications and file sharing between the NetMRI host and the guest VM running the Perl/Python script.
Job scripting implementation is done through the NetMRI Job Wizard. Substantial planning and preparation may be needed before implementing jobs.
Automation Change Manager (ACM)The Automation Change Manager (ACM) uses NetMRI scripts and other job automation features to enable the Automation Tasks feature set in the Infoblox NIOSTM Dashboard. You add a NetMRI appliance into an Infoblox Grid network to enable the Automation Change Manager functionality. With the proper licensing installed on both the NetMRI appliance and the Infoblox grid master, the ACM automation tasks enable performance of the following tasks with a few mouse clicks:
Network Provisioning – Define new IPv4 and IPv6 networks;Port Activation – Enable interfaces on selected switches and routers;VLAN Reassignment – Reassign and reconfigure VLAN port assignments;

Infoblox NetMRI 7.4.4 Administrator Guide Part 4 Automation Change Manager Scripting and Job Management
Copyright ©2020, Infoblox, Inc. All rights reserved. Page 249
•
•
1.2.
3.
Bare Metal Provisioning – An automatically triggered task to detect and provision new switches and routers on the network. BMP is most useful for bringing up many new deployments of the same device model with very similar configurations;Rogue DHCP Server Remediation – An automatically triggered task to detect and remediate devices on the network that are attempting to act as DHCP servers without authorization.
Automation Change Manager leverages NetMRI's job automation scripts to expand the functionality of the Infoblox NIOS Tasks Dashboard. Numerous NetMRI job features, including lists and job triggers, support the ACM functionality. The following topics describe the elements used to build the ACM system.
Creating and Scheduling Jobs
A job schedules a script to run against selected devices. You schedule jobs to run once or on a regular basis, at times you specify. Create and manage scheduled jobs at Config Management –> Job Management –> Scheduled Jobs tab.
To run a script as a job immediately, see the section Running Scripts Immediately later in this topic.
You can import existing scripts using the Import icon on the Scripts tab. When you do so, ensure that your script uses the UTF-8 encoding.
To create and schedule a new Job, do the following:
At the top right of the page, click New. The Fill Out Job Details Wizard opens.Enter a Job Name.Click the Approved option if your user account allows it. (A job cannot be scheduled until approved. Another admin account may need to approve the scheduled job.)Type a Job Description of the job.
Note: Bulk push mode is supported only on Juniper and Cisco devices. Cisco downloads via TFTP, and Juniper configs download via the HTTP protocol.
4. Choose a job script or template from Scripts or Templates (selectable by tabs). If required by the script or template, enter data and/or select options. Any variables defined in the script will appear in a list to the right.
5. Choose the Push Mode option: Line by Line, Bulk or Text File. This determines the method by which the config file is written to devices that are part of the job.
For Push Mode, choosing LIne by Line sets the template config sequence to be pushed to the device involved in the Job, one line at a time; pushed in Bulk, the entire configuration is staged in NetMRI and then downloaded to the device.If any non-Cisco/Juniper device is part of the device group selected for the job, the job will revert to Line by Linemode.After choosing a script or template from their respective lists, you may see one or more input values that are required as part of the job. Templates may furnish default values, or you can enter desired values in the defined fields.
6. When finished, click Next.
If custom fields are defined for jobs, you will see the Fill out Custom Information screen. If none are defined, proceed to Step 7 below.
7. Fill in any other data associated with the job.
8. Click Next. The Select Device Groups or Devices page appears.
Click device groups and/or devices and click the –> icon to add the group to the right pane of the page.
9. Click Next. The Schedule when Job should run page appears.
Specify the schedule for the job, including the Recurrence Pattern (Once, Hourly, Daily, Weekly, or Monthly), and the Execution Time (specify in half-hour increments). The selected Recurrence Pattern determines additional schedule settings based on the selection.

Infoblox NetMRI 7.4.4 Administrator Guide Part 4 Automation Change Manager Scripting and Job Management
Copyright ©2020, Infoblox, Inc. All rights reserved. Page 250
1.2.
1.
2.3.4.
1.2.
3.
4.5.
6.
10. Click Next. The Enter User CLI Credentials page appears, for cases when user account CLI credentials are required for the job. If not, proceed to Step 10.
Choose Use the requester's stored CLI credentials, or Use the approver's stored CLI credentials;
–or–Choose Use these CLI credentials and enter and verify the Username and Password values and the equipment-associated Enable Password required for the account.
11. Click Next.
In the Review and save screen, review the job specifications. If changes are needed, click the < Previous button to return to an earlier screen.
12. Click Save.
Once a job is listed in the table, you can check its Status, Last Run and Result in the Job History tab.
Note: Creating a job produces a new instance of the specified script or template, and inserts into that instance a Script-Schedule line containing schedule details.
To create a copy of the scheduled job:
In the Actions column, click the icon and choose Copy from the menu.In the Name dialog, enter a name for the copy, then click OK.
To edit an existing job, do the following:
In the Actions column, click the icon and choose Edit from the menu. The Job Wizard opens to the Summary of Job screen.Click Edit. The Fill out Job Details screen appears.Edit the job as needed. Use the Next –> and <– Previous buttons to navigate the wizard.Navigate to the Review and Save screen, then click the Save button.
To delete a job: Click the Delete button, then confirm the deletion.
Running Scripts ImmediatelyTo run a script as a job immediately, do the following:
Go to Config Management –> Job Management –> Scripts tab.Hover the mouse over the Action menu for your desired script, and choose Run Now from the Action menu.The Script Run Now window appears. You can choose to run a script (the default) or a template as a job. Templates support a push mode; scripts do not.If any input is required by the selected script, enter it in the right panel and click Next. (Note that in this step, the selected script is highlighted in the left pane of the window, listed with all other scripts in the library.)If you have custom fields for data entry, add that information and click Next. If not, simply click Next.Select the Device Groups or Devices to run the job against from their respective tabs and click the (–>) button to add them to the job; and click Next.Click the > and < buttons to navigate pages of the Device Groups and Devices lists.In the Devices list, use the Device Groups dropdown menu to choose the device group for device selection.In the Devices list, use the Search box and type in a string of any length to search for a device name or an IP address. You can also search by the values shown in the Network View field.In the Review and Run page, review your settings. If necessary, use the <Previous button to return to previous steps to make changes; when finished, click Run Now to begin script or template execution.

Infoblox NetMRI 7.4.4 Administrator Guide Part 4 Automation Change Manager Scripting and Job Management
Copyright ©2020, Infoblox, Inc. All rights reserved. Page 251
Working with Configuration TemplatesIf you plan to work with categories of Cisco and Juniper switches and routers that are not part of the Automation Change Manager set, you create a new "canned" IOS or JunOS template in the Configurations Templates page. This is the foundational tool for adding device types to the Automation Change Manager (ACM).
Note: A new variable is available for use in script templates: the $NetMRI_ipaddress variable, whose data is formatted in standard dotted quad format. It sets a variable for the IP address of the device.
The Config Templates tab (Config Management –> Job Management tab –> Config Templates) provides an editing environment to develop standard configuration files. This feature is required for provisioning network devices using the Automation Change Manager's Bare Metal Provisioning (BMP) task, specifically for Cisco and Juniper routers and switches.
For all config templates, NetMRI provides an Action icon with several important editing functions: Copy (to copy a template into a new file); Edit (opening an editor window to make changes to an existing config template; Schedule (to schedule the config template job to run at a later time); Run Now (to run the Config Template job through the Job Wizard); Test Policy (test the template as a device-specific Policy; this requires all variables within the saved template file to be configured with specific values); Export (to immediately open the selected config file template in a text editor or save it out on your disk); and Delete (to delete the template from the table).
NetMRI does not validate templates; you can experiment within the limits of common sense and best practices for device configuration. Templates are a different job type, similar to scripts. The ACM Bare Metal Provisioning task operates using Config Templates as one of its core building blocks.
Note: The ACM Bare Metal Provisioning task is designed to execute on numerous instances of the exact same device type (50 Cisco 2821 routers, for example). You cannot execute a single BMP job on different device types. thus, you use only a single Config template for any BMP job.
You can access templates from CCS, Perl, and Python.
You can use templates to define variables and configuration file text. Vvariable definitions are optional, while configuration text is required as part of the template.
Note: Templates are a support feature of jobs in the NetMRI appliance. You apply them to jobs just as you would a script; ACM's Bare Metal Provisioning is an example of this principle. The same rules and restrictions that apply to scheduling, running and approving script jobs apply to running template jobs.
Use completed templates to create a new policy or test against a policy, schedule as a Job, create new templates, respond to a trigger event such as Bare Metal Provisioning, and other tasks. When scheduling a template as part of a Job, it is combined with a script as part of a new Job definition.
Should a Configuration Template be used to provision a Bare Metal Device, the name of the Config Template in NetMRI must be the same as for a corresponding List in Job Management. For example, a cisco_catalyst37xxstack configuration template appears in the Config Template page when the NetMRI appliance is enabled for the Automation Change Manager. The sample Cisco Catalyst 37xx IOS template reads as follows (edited to remove extra line feeds):
version 12.2 no service pad service timestamps debug datetime msec service timestamps log datetime msec no service password-encryption ! hostname $hostname enable password infoblox ! boot-start-marker boot-end-marker username admin privilege 15 password 0 infoblox no aaa new-model switch 1 provision ws-c3750-48p system mtu routing 1500 vtp domain cisco vtp mode transparent ip subnet-zero

Infoblox NetMRI 7.4.4 Administrator Guide Part 4 Automation Change Manager Scripting and Job Management
Copyright ©2020, Infoblox, Inc. All rights reserved. Page 252
1.2.3.4.5.
6.7.
1.2.
ip domain-name $domain_name no ip domain-lookup spanning-tree mode pvst spanning-tree extend system-id ! vlan internal allocation policy ascending $config_vlans $config_interfaces ! no ip classless ip default-gateway $gateway no ip http server no ip http secure-server ! logging $syslog snmp-server community infoblox RW ! control-plane ! line con 0 line vty 0 4 exec-timeout 300 0 logging synchronous login local transport input telnet ssh line vty 5 15 exec-timeout 300 0 logging synchronous login local transport input telnet ssh ! end
The template also provides a standard set of template variables for use by the BMP provisioning script:
$hostname string"" $config_vlans string"" $domain_name string"" $gatewaystring"" $syslog string"" $config_interfaces string""
Note the use of variables in the template. For example, consider the following command string in the Config Template:
ip domain-name $domain_name
And the corresponding statement in the Template Variables:
$domain_name string""
Note that the set of variables defined in the config templates are fixed. The values themselves are defined during job execution by the values in the columns in the TAE BMP Device Provisioning list or from the TAE BMP Site Settings list.To create a new template, do the following:
At the top right of the page, click New. The Config File Template dialog appears.Enter a Name for the template.Choose the Vendor and Device Type.Enter the Model and Version.Enter any Template Variables required for the new Config File Template. Consult the other Config Templates if you need examples.Paste in or write any configuration file text that is required for the template.Click Save & Close.
Admins may provide templates exported from another NetMRI appliance or from an archive.To import a template from an existing configuration file (you might wish to do this because you are creating a Config Template for a different type of device in your network), do the following:
At the top right of the page, click Import.Enter the path and file name, or click Browse... to locate the file.

Infoblox NetMRI 7.4.4 Administrator Guide Part 4 Automation Change Manager Scripting and Job Management
Copyright ©2020, Infoblox, Inc. All rights reserved. Page 253
3.
1.
2.3.
1.2.
1.2.3.
1.2.
3.
1.2.3.
1.
2.
Click Import.
To export the entire table of templates from the Config Template page, do the following:
At the top right of the page, click CSV Export. A dialog box appears, requesting Do you want to open or save this file? If you have Excel or another CSV file-compatible spreadsheet program, you can immediately open the complete table of templates by simply clicking Open.To save the table data as a new CSV-format file, click Save.Click Save in the Save As dialog after browsing folder paths and defining the file name. (Procedures may vary slightly based on the operating system.)
NetMRI does not export the templates — the table listing all the templates is exported to an externally readable file.
To copy a template, do the following:
Copy. The Copy Script dialog appears.Enter a name for the new template, then click OK.
To edit a template, do the following:
Edit. The Edit Template dialog appears.Edit the template as needed. Note the similarities between the Edit Template window and the Edit Job window.Click Save & Close.
To create a Policy from a template and to test a template as a Policy, do the following:
Edit. The Edit Template dialog appears.Delete or replace device specific terms with regular expressions. You will need to have significant understanding of regular expressions and Policy definition. See Policy Design Center for more information.Click Create Policy.All variables in a template must be replaced with specific values before the template is saved as a new Policy. We recommend using the Test Policy feature before saving the template out as a new Policy.
To test a template as a policy, do the following:
Test Policy. The Policy Selector dialog appears.Select the policy or policies to test against.Click Test.
The test results will open in a new window.
If any template variables do not have values declared against them, the appliance responds with an "All variables in the template must be replaced with values before testing as a policy" message.
To export a template: Export, then save the file.
To delete a template: Delete, then confirm the deletion.
Creating New Jobs From Config Templates
Note: Config templates also offer the ability to generate a text-based configuration file to enable configuration of an undiscovered device or devices of the same type. This feature provides an alternative path to configuring bare metal devices instead of using NetMRI's Bare Metal Provisioning feature. See the subsection Downloading a Config Template for more information.
To create a new Job from an existing config template, do the following:
Action Schedule or Run Now from the menu. The Job Wizard appears, showing the Fill Out Job Details page.The Fill Out Job Details page differs based on whether you wish to immediately run the job (Run Now) or to schedule it for a later occasion.Enter a Name and Job Description for the new job.

Infoblox NetMRI 7.4.4 Administrator Guide Part 4 Automation Change Manager Scripting and Job Management
Copyright ©2020, Infoblox, Inc. All rights reserved. Page 254
3.
•
•
1.
2.
3.
4.5.
•
•
•
Choose the Push Mode option: Line by Line, Bulk or Text File. This determines the method by which the config file is written to devices that are part of the job.For Push Mode, choosing LIne by Line sets the template config sequence to be pushed to the device involved in the Job, one line at a time; pushed in Bulk, the entire configuration is staged in NetMRI and then downloaded to the device.(Available only when you choose the Run Now menu option.) Choosing the Text File option runs the template job and sends its output to a text file, which is uploaded to the management computer. See the subsection Downloading a Config Template for more information.
Note: If any non-Cisco/Juniper device is part of the device group selected for the job, the job will revert to Line by Line mode.
4. Click the Templates tab, and select the template that will execute as part of the Job. Enter any required input values.
5. If this job requires approval and you have the permissions to do so, click the Approved check box. Otherwise, leave it blank for admin account approval.
6. At the bottom of the page, click Next.
7. Choose the Devices or Device Groups to be part of the new Job, and click Next.
8. Choose the Recurrence Pattern (Once, Hourly, Daily, Weekly, or Monthly) and the Execution Time (which is specified in half-hour increments). The chosen Recurrence Pattern determines additional schedule settings based on the selection.
9. Click Next.
10. (Optional) Enter the admin account's CLI credentials, or choose the options for Use the requester's stored CLI credentials or Use the approver's stored CLI credentials as needed. Click Next.
11. In the Review and Run page of the Template Run Now wizard, review the steps taken for the Job.
Review the Inputs field to ensure that all necessary input values have variables or data entries assigned to them through the template.Check the Devices field to make sure the correct devices are listed for the job.
12. (Line by Line or Bulk Mode only) Click Run Now if all settings are correct.
Once the new Job is ready and your changes are saved, you click Run Now to execute the template Job.
Downloading a Config TemplateTo download a device configuration file from a config template for use in configuration of an undiscovered network device, for editing, or for other purposes, do the following:
Click the Action icon and choose Run Now from the menu. The Job Wizard appears, showing the Fill Out Job Details page. The Fill Out Job Details page differs based on whether you wish to immediately run the job (Run Now) or to schedule it for a later occasion.Choose the Push Mode option: Text File. This tells the job engine that you are downloading a template's configuration file to a text file. No device configuration takes place if you choose this option.Click the Templates tab in the Fill Out Job Details page, and select the template for the Job. Enter any required input values.Click Next. The Select Device Groups or Devices page appears, showing a Devices tab.(Optional step) You may choose one or more devices to map the downloaded configuration text file.
If you choose no device, the downloaded template is merged with the input values you defined in Step 3.For configuring an undiscovered device using a config template, this is a perfectly acceptable option;Choosing a single device generates and downloads the configuration text file with a name comprised of the device IP and host name;Choosing multiple devices produces a Zip archive file with template files generated for each device using the same inputs.

Infoblox NetMRI 7.4.4 Administrator Guide Part 4 Automation Change Manager Scripting and Job Management
Copyright ©2020, Infoblox, Inc. All rights reserved. Page 255
•
•
•
•
6. After choosing the device to merge for the text file, if any, click Next.
7. In the Review and Run page of the Template Run Now wizard, review the steps taken for the Job.
Review the Inputs field to ensure that all necessary input values have variables or data entries assigned to them through the template.
8. (Text File Push Mode only) To download the template's configuration file to your hard disk, click the Download Configuration button. A configuration text file containing the inserted values or variables for the template is downloaded by your Web browser to your designated Downloads directory. Because the Push Mode is for a Text File, the job is complete at this step.
(Text File Push Mode only) If an input value in the Wizard page remains empty, and you've chosen a device to map and merge against, the Job wizard displays a Merge with Empty Values dialog to verify the operation; in which the existing values are to be rendered 'empty,' (e.g., replaced with no setting), kept as-is in the template, or to Cancel the job.Click Yes if the replacement of variables or data with empty values is intentional. The job executes and the new configuration text file downloads to the Downloads directory specified in your browser.Click No to run the job as it is now defined without empty values (you may have settings in the config template that you want to preserve for an undiscovered device). The job executes and the new configuration text file downloads to the Downloads directory specified in your browser.Click Cancel to return to the job wizard page.
When the Push Mode is for a text file, the Job does not execute against a device itself; instead, the configuration is downloaded from the template with the variables or value modifications added. You can then use the template to hand-configure the intended device.
About Template VariablesThe Config File Template window (Config Management –> Job Management –> Config Templates –> click New) provides a Template Variables field as part of creating a template. As previously noted, variables are optional in template definition, but knowing their format is useful.Defining variables for config templates uses the same format as for script variables, in which three entries are provided for each variable (the variable name, input type and input format) in the Template Variables field. A simple example is given below:
$usernamestring "User Name" $passwordstring "New Password"
You can use as many variables as needed in any template.
Note: Scripts use a standard variable called eval_type. This variable is not used in configuration templates.Otherwise, template variables are treated in the same fashion as defined in the CCS Supplement PDF, provided under the Additional Documentation section of the online Help.
Defining Lists for ACM, Perl, Python, and CCS Script ReferenceLists are a key component in the Automation Change Manager (ACM) feature set. The Lists page (Config Management –> Job Management –> Lists) allows the creation, editing, importing and exporting of lists to provide external lists of data to Perl/Python script variables, CCS script variables, and configuration template variables.
Lists are handy for dynamically looking up values to variables in Perl/Python and CCS scripts. CCS and Perl/Python can refer to/ look up values from lists during script execution. The lookup call enables a simple pass/fail test to detect the presence or absence of a value in a list. The call accepts the parameter list name, key column, key value, value column and a default. All values may be static or variable-based.
Lists are named CSV files imported into NetMRI. The most efficient way to use Lists is through importing of a CSV file. You can add new records to any list or create a new list entirely within NetMRI.) An advantage of using external lists, and of importing lists from .CSV files, is that NetMRI imports the column headers from .CSV files. These column headers then

Infoblox NetMRI 7.4.4 Administrator Guide Part 4 Automation Change Manager Scripting and Job Management
Copyright ©2020, Infoblox, Inc. All rights reserved. Page 256
1.2.3.
1.2.3.4.5.
1.
2.
3.
4.
1.
1.2.
•
•
•
appear in the list table in NetMRI. Users can edit the headers inside the Lists page by right-clicking any column header and choosing Edit Column.
Note: Individual NetMRI appliances are limited to 100 lists in the Lists page.
To import a list into the NetMRI Lists page, do the following:
On the Config Management –> Job Management –> Lists page, choose Import.Click Browse and locate the CSV file in the file selector. Click Open after selecting the file.Click Import to import the file into the Lists page.
To create a new list, do the following:
On the Config Management –> Job Management –> Lists page, choose Add.Enter a List Name.In the Description field, enter a meaningful description for the new list.Type or copy and paste the list text into the text entry field.Click Save at the bottom of the screen when you are finished.
To edit a list, do the following:
On the Config Management –> Job Management –> Lists page, select a list in the left pane. The right pane refreshes to show the contents of the list.Click the down arrow icon on a column header and choose Edit Column. The Column Name dialog box appears. Enter the new column name and click OK.Click Add Row at the bottom right to add a new row to the list table, or click a check box for a row and click Delete Row to modify the set of table rows in the list.Click Save when done.
To delete a list, do the following:
On the Config Management –> Job Management –> Lists page, select the list to remove and choose Delete.
To export a list, do the following:
On the Config Management –> Job Management –> Lists page, select the list to export and choose Export.The browser prompts to open the data as a new Excel .CSV file or to save the data as a new file.
Pre-Defined Lists for ACM OperationThe Automation Change Manager (ACM) relies on a series of lists in the Config Management –> Job Management –> Lists page for use in automated jobs. You can edit these lists when necessary. The installed ACM lists consist of the following:
ACM Allowed DHCP Servers – List of any DHCP servers in the enterprise network, that are not to be included in any Rogue DHCP server reports. Defines to NetMRI and to the NIOS system that "these are the established DHCP servers in the network; do not report against these devices." Any router or other device that is not on this list, which offers DHCP-based IP configuration to clients connecting to the network will cause an issue to be fired by the Automation Change Manager.ACM BMP Device Provisioning – Bare Metal Provisioning list, to identify each switch to be provisioned. New switches are identified by their MAC address, the management IP address and site settings, including a Site Settings Name which corresponds to a name in the ACM BMP Site Settings list. The MAC address is the hardware MAC address assigned to the device coming out of the factory, and which is usually stamped on the rear of the chassis or on the shipping box for the device. (This list is used in the topic Checklist for Running The Automation Change Manager System .)ACM BMP Site Settings – Bare Metal Provisioning list to define the default switch port configuration. Consider it a branch office list–to contain the standardized configuration templates for any new devices installed in a given branch office network. This list defines values such as the Management VLAN ID and its VLAN name, the port designated for management VLAN traffic, the domain name, Syslog and Network Time Protocol server information, and VLANs on the provisioned device to be configured on individual access ports or ranges of

Infoblox NetMRI 7.4.4 Administrator Guide Part 4 Automation Change Manager Scripting and Job Management
Copyright ©2020, Infoblox, Inc. All rights reserved. Page 257
•
•
1.2.3.4.
1.2.
access ports (VLAN1 Ports and VLAN2 Ports). (This list is used in the topic Checklist for Running The Automation Change Manager System .)ACM BMP Switch Model Interface Defs – Bare Metal Provisioning list defining the interfaces for the device types expected to be provisioned through the job. If the switch model to be provisioned is already in this table, no further information is needed here. The entries follow the standard slot/port designator formats for Cisco and Juniper devices such as Cisco 2950 and 3750 switches and Juniper EX2200 switches. You may need to create your own definitions within this list (or even new lists) to match switch port designators for provisioning other device types. (This list is used in the topic Checklist for Running The Automation Change Manager System .)ACM Script Settings – Defines the VLAN to which any rogue DHCP server, detected and isolated on the network, is placed for remedial action. By default, when this task executes, the isolation VLAN is defined as VLAN 99.
Defining Larger Provisioning ConfigurationsSwitch model interface definitions for the ACM BMP Switch Model Interface Defs list merit further description. A column titled Interfaces provides the location for specifying the ranges of ports for initial bare-metal configuration. A simple Cisco 2950 port configuration shows a port range for a single "slot:"
fa0/{1-24}
Use the curly brackets symbols to define the port range for a slot, as in {1-24}. The only other requirement is to know the basic syntax for specifying different port types on the devices. You can apply this syntax to serial ports, PVCs and other interfaces.To support switch models with larger configurations, such as a Catalyst 6500, you add multiple entries to the definition, separated by commas with no spaces:
fa1/0/{1-24},fa2/0/{1-24},fa3/0/{1-24},gi4/0{1-9},gi5/0{1-9}...
The list entry can contain as many values as required.Similar entries may be required in the ACM BMP Site Settings list for VLAN port assignments (the example below shows data fields for a defined VLAN1 ID, the VLAN1 Name, and the assigned VLAN1 Ports, which are not for the management VLAN but the first VLAN to be assigned to user traffic):
100 VLAN100 fa1/0/{1-4},fa1/0/{6-10}
In this case, for example, VLAN 100 on the switch to be provisioned is assigned to Fast Ethernet ports 1 through 4, and to a second port range 6 through 10.
Configuring a New List EntryIn some cases, a switch type may not be defined in the LIsts page. To define a new list entry:
Go to Config Management –> Job Management –> Lists.Select the ACM BMP Switch Model Interface Defs list in the left pane.Click Add Row.Under Vendor Model, enter the desired model name (Cisco or Juniper). Example: cisco_catalyst6500.
Note: The name cited here must match that for a Config Template.
Enter the slot/port values, including port ranges, separated by commas, in the Interfaces column.Click Save.
Triggering Jobs Through EventsNetMRI triggered jobs allow a script or template with predefined or custom variables to execute against a device when a "triggering source event" occurs. The Automation Change Manager triggered jobs to execute automated tasks from the connected Infoblox NIOS appliance.
Triggering sources consist of the following:

Infoblox NetMRI 7.4.4 Administrator Guide Part 4 Automation Change Manager Scripting and Job Management
Copyright ©2020, Infoblox, Inc. All rights reserved. Page 258
••
Policy rule violations;Custom and standard Issues.
You create and manage triggered jobs in the Config Management –> Job Management –> Triggered Jobs tab. You define triggered jobs using a Triggered Jobs Wizard. The table of jobs includes the following columns of information:
Actions Actions are View/Edit and Delete. Choosing View/Edit displays the Triggered Job Wizard showing the current job's Job Summary. Click the Edit button to make changes to the job.
Name The defined name for the triggered job.
Level The importance level of the job.
Enabled Define whether the job is enabled for execution.
Active Window The execution time period during which the job will run if executed.
Trigger Type The event that causes the job to execute: Issue, or Policy Rule violation.
Trigger Event A description of the trigger event, such as Rogue DHCP Server Detected.
Device Groups Jobs can also run against All device groups.
Action One of two possible actions can occur when the trigger event takes place: Run Job Immediately/Auto-Runor Schedule Job. The Run Job Immediately option also offers an Auto-approval checkbox, which is available only for the NetMRI admin user.
Created On and Updated On Date and time where the job was created, and the date and time where the job was last updated.
Last Run The last date and time where the job executed.
Job Type The type of job, defined as Script or Template based on the selection.
Created By and Updated By The NetMRI user account that created the job and that last edited the job.
Defining Triggered Jobs
Note: An example of a triggering event is: NetMRI discovers a new Cisco switch on the network. This event is embodied in a bit of data called a Trigger Source, which defines the nature of the event. Also see the following topic, Automation Change Manager (ACM) Triggering Sources , for more detail.
As part of triggered job definition, you specify the triggering event, the time periods over which you would like this trigger to be active, and the device and interface groups to whose members the trigger applies.For triggering events, a job's settings, such as script and variable input, define a template for new jobs to perform remedial actions, gather further information from the device, and other actions. The triggered job runs once per affected

Infoblox NetMRI 7.4.4 Administrator Guide Part 4 Automation Change Manager Scripting and Job Management
Copyright ©2020, Infoblox, Inc. All rights reserved. Page 259
1.2.3.
4.5.
6.
7.
8.
9.10.
11.12.13.
14.15.16.17.
•
•
device, when NetMRI detects an issue or policy rule violation on that device. If the condition clears, and subsequently occurs again, the triggered job runs again.
You can run a job immediately, automatically pre-approved, or schedule the job for up to a week in the future, in a pending-approval or pre-approved state.
To create a triggered job, do the following:
Click the New button at the top right of the page. The Triggered Job Wizard opens.In the Select Trigger screen, specify a policy rule or issue that will trigger the job by selecting a Trigger Source.In the left panel, select the policy rule or issue in the list. Details appear in the right panel, where you verify that you have selected the correct policy rule or issue. Enter all or part of the name at the top of the panel.Click Next.In the Trigger Filters screen, specify the conditions that must be satisfied for the job to run:In the Device Groups list, click, CTRL+click or SHIFT+click to select the group(s) that can trigger the job. In the Active Time Window list, select the time period during which the job will respond to triggers.In the Severity list (available only if the Trigger Source is Issue), select the level of event to be reported. Issues are raised at one of three severity levels - this filter represents which severity levels will trigger the event for the given issue.Click Next. The Define Job screen appears.Specify the action to be taken in response to the trigger:If you don't want the job to run, uncheck the Enabled option. (You might want to prevent a job from running during maintenance or when manually changing settings.)In the lower left panel, select the script or job template to be run.Specify a Job Name: Select Use Script Name, or select Use Custom Name and enter a name in the field. To Edit an existing Triggered Job: Enter all or part of the name near the top of the panel.In the lower right panel, review the script details. If the script provides user-definable variables, fill in or set them as needed (be sure to scroll down to see all variables).Click Next. The Schedule Job Execution screen appears.To specify when the job should be run, select either Trigger Action: Run Job Immediately (if selected, then click Next) or Schedule Job.In the To Run At list, select a time to run the job.In the The Following list, select a day where to run the job.Click Pre-Approved if the job will run based on your approval. Uncheck Pre-Approved if the job must be approved by another user before execution.Click Next.In the Review and Save screen, review the job specifications.To make changes, click < Previous to return to the page(s) needing to be revised.If the job specifications are correct, click Save. The job is listed in the Triggered Jobs tab.
Once a job is listed in the table, check its Status, Last Run and Result in the Scheduled Jobs tab.To view job details: Click Edit. The Triggered Job Wizard appears, listing a summary of the job. From this point, click Editif you wish to edit the job by choosing new trigger sources and other settings.To delete the job from execution: Click Delete, then confirm the deletion.
Automation Change Manager (ACM) Triggering SourcesOne category of triggering sources involves the Automation Change Manager. When the ACM license is installed into the NetMRI appliance, specific trigger source types are automatically detected by NetMRI and separately developed jobs are built in to the Triggered Jobs page. The three Triggered Jobs you see after installing the Automation Change Manager license include the following:
Provision Bare Metal Device (Issue-driven) The ACM Provision Bare Metal job executes auto-configuration of a new device on the network immediately after detection by NetMRI. This job requires approval by the administrator before execution. Also refers to the Perl script, Provision Bare Metal Device, for applying the config template to the new device.Locate Rogue DHCP Server (Issue-driven)When NetMRI detects any system running the DHCP protocol that is not on the list of approved DHCP servers or is not considered a sanctioned DHCP server by NIOS, NetMRI executes the job and compiles the information to

Infoblox NetMRI 7.4.4 Administrator Guide Part 4 Automation Change Manager Scripting and Job Management
Copyright ©2020, Infoblox, Inc. All rights reserved. Page 260
•
•
•
•
•
•
•
•
•
•
locate that rogue system on the network. Locate Rogue DHCP Server runs automatically and provides logs when it executes.Isolate Rogue DHCP Server (Issue-driven)After NetMRI detects and locates a rogue DHCP server, the discovered device is consigned to a designated isolation VLAN to be dealt with. This job requires approval by the administrator.
Two triggering sources support a single ACM task. The Locate Rogue DHCP Server and Isolate Rogue DHCP Serverjobs support the NIOS Dashboard Rogue DHCP Server Remediation task. Locate Rogue DHCP Server executes automatically in response to Automation Change Manager detection of a NIOS DHCPACK Syslog messages on the network. Isolate Rogue DHCP Server jobs require authorization by the administrator to execute.
Checklist for Running The Automation Change Manager System
Note: The NT-1400, NT-2200 and NT-4000 appliances, NetMRI 1102-A, and Virtual appliances with sufficient CPU and memory support the Automation Change Manager.
This procedure encompasses configurations from both NetMRI and Infoblox NIOS systems. A number of assumptions are made for purposes of brevity:
The user has the proper admin or superuser access to both the Automation Change Manager and to the NIOS system;The correct ACM license is installed on both the Automation Change Manager and on the NIOS Grid Master. A separate ACM license must be installed for both the NetMRI appliance, and for the NIOS appliance that will communicate with NetMRI.If the NetMRI appliance is based on a virtual machine, you must also set up a second VM as the NetMRI sandbox for job operation. See Using the NetMRI Sandbox and Setting up a Remote Sandbox for complete information on Sandbox setup and operation.
Note: To ensure that the proper license is installed in the NetMRI system, go to Settings icon –>Setup –> Settings Summary and read the Module Settings list. Automation Change Manager should read Enabled.
The administrator can use the Automation Change Manager with a NIOS Grid by meeting the prerequisites below.
Set the NIOS DHCP appliances to serve DHCP Options 66 for Cisco devices and DHCP Option 68 for Juniper devices. Each setting, if used, also requires entry of the IP address for NetMRI. This is further described in the topic Notes on DHCP Configuration for ACM Operation ;Set the NetMRI inactivity timeout (60 minutes by default; In NetMRI, go to Settings icon –>Setup –> Advanced Settings –> User Interface category –> Inactivity Timer), and set this value to a higher time duration than for any NIOS system (in NIOS, go to Grid –> Grid Properties);Register the NetMRI appliance with NIOS, with or without a certificate for secure HTTPS communication (for information, see ACM Registration and Certificate Usage Between NetMRI and NIOS);Obtain the factory MAC address for each of the new devices to be installed into the network, plus the initial IP address to be assigned to the devices;The admin account running ACM jobs on NIOS, and performing ACM setup on the NetMRI system, must be properly defined on both systems. The user name must be the same on both systems. Access privileges must be equivalent on both sides of the configuration; the account Roles/Privileges defined in NetMRI determine the ACM features to which the user has access in NIOS;
Note: The ACM system supports single sign-on between the NIOS and NetMRI appliances When you sign on to one appliance in ACM, the other appliance automatically recognizes the login. For information, see Creating a Single-Sign-On Admin Account.
Set the admin accounts to be notified when ACM Issues and events pop up. The best location to view event information is the Task Viewer in NIOS' Automation Tasks Dashboard. Triggering issues and events are reported on NetMRI's main Issues page in Network Analysis –> Issues. Additional configuration may be needed to ensure notifications are sent to the right people.

Infoblox NetMRI 7.4.4 Administrator Guide Part 4 Automation Change Manager Scripting and Job Management
Copyright ©2020, Infoblox, Inc. All rights reserved. Page 261
•
•
1.
2.3.
4.5.
•
•
You may need to define NetMRI Issue notifications in the Settings icon –> Notifications section –> Subscriptionspage. Notifications are sent in three ways: Syslog messages, e-mail and SNMP traps. For information, see Managing Issue Notifications , and Defining a Job Notification for specific configuration.All NIOS appliances running DHCP services must be configured to forward Syslog messages to NetMRI. This ensures the Automation Change Manager detects the correct events for triggering jobs (you perform this task in the topic Deployment for Bare Metal Provisioning, Pt. 1 ;Activate a TFTP server with configuration stub files and full configuration files for the device types to be supported. NetMRI has a built-in TFTP server that is always running by default and is accessible by the same methods as any TFTP server. For information, see Notes on TFTP Service for ACM Operation .
Creating a Single-Sign-On Admin AccountTo define the required ACM admin account on both NIOS and NetMRI, do the following:
In NetMRI, go to Settings icon –>General Settings –> Advanced Settings and go to the NIOS Administrationsection.Under NIOS User Name (on Page 2 of Advanced Settings), click the gear icon and choose Edit.Enter the user name of a NIOS admin account with privileges to validate DHCP servers located on the network by NetMRI. Click OK when finished.Under NIOS Password (on Page 2 of Advanced Settings), click the gear icon and choose Edit.Enter the password for the admin account you entered in Step 3, re-enter it to confirm; click OK when finished.
Notes on DHCP Configuration for ACM Operation
Note: Under some circumstances, the Rogue DHCP Server Detected issue may not trigger. NetMRI sends DHCP packets that will obtain responses from DHCP servers that can traverse networks through DHCP relays. Not all DHCP server will respond to DHCP packets sent by NetMRI for detection purposes. Also, some DHCP servers may be undetectable by NetMRI based on their position in the network; for example, DHCP servers that are connected to WAN interfaces and only send DHCP responses downstream will not respond to probes by NetMRI.
The Automation Change Manager acts on NIOS-generated DHCPACK syslog messages for triggering task execution. Part of NIOS configuration to support ACM consists of forwarding the syslog stream to NetMRI. This is typically done on a per-Grid-Member basis. DHCPACK syslog messages are sent whenever a DHCP lease is granted or renewed and contain the IP and MAC address of the end host. Upon receipt of a DHCPACK syslog message, if a network =device or end host is not known to NetMRI, a Discover-Now operation executes.
If the discovered device/end host is found to be running a DHCP server, NetMRI raises a Rogue DHCP Server Detectedissue and a series of events takes place, further described in the topic Activating Rogue DHCP Server Remediation.NIOS DHCP configuration intuitively supports custom DHCP options, which follow the RFC 2132 guidelines. DHCP configuration settings can quickly apply across the entire NIOS grid (in NIOS, Grid Manager –> DHCP –> Grid DHCP Properties), or to a specific DHCP range on a specific member. The same guideline applies if NetMRI operates with a standalone NIOS appliance running the DHCP service in the network. You can also create new DHCP ranges on any NIOS appliance running DHCP, to support Cisco and Juniper DHCP options for ACM bare-metal provisioning.For Cisco:
option tftp-server-name code 66 = text (Option 66, uses the IP address of the TFTP server or an FQDN);
For Juniper:
option mobile-ip-home-agent code 68 = array of ip-address (Option 68)
All NIOS appliances running DHCP service must also forward Syslog messages to NetMRI.
The Automation Change Manager also detects DHCPACK messages automatically through its own Syslog service, and uses them as the triggers for ACM tasks.
Note: For more details on configuring the DHCP service on NIOS systems, see the Infoblox NIOS Administrator Guide, Chapter 19, Infoblox DHCP Services and Chapter 20, Configuring DHCP Properties.

Infoblox NetMRI 7.4.4 Administrator Guide Part 4 Automation Change Manager Scripting and Job Management
Copyright ©2020, Infoblox, Inc. All rights reserved. Page 262
••
••
•
•
Notes on TFTP Service for ACM OperationA NIOS appliance can also operate as a TFTP server. The enterprise network may also have an existing public TFTP server. For more information on using a NIOS appliance as a TFTP server, see the Infoblox NIOS Administrator Guide, Chapter 8, File Distribution Services.
For initial bring-up of the bare-metal device, NetMRI's TFTP server directory contains a small Cisco or Juniper configuration file. The two files are called:
network_confg (Cisco)router.conf (Juniper)
Other files may also be present. You can also create your own.
Each file contains the organization's assigned device IP address and assigned credentials for the Enable and Telnet/SSH passwords and secret settings. A sample network_confg file includes the basic credentials for the Enable password and for telnet and SSH access, and enables SNMP:
username autoconfig privilege 15 password 0 autoconfig
snmp-server community autoconfig RO
line vty 0 4
exec-timeout 60 0
logging synchronous
login local
transport input telnet ssh
end
A sample Juniper file is in the topic Sample Juniper router.conf File.
If the administrator wants to deviate from the autoconfig string (i.e. for hostname, community string and/or CLI credentials), the following holds true:
The defined hostname must remain autoconfig;You can change the community string, and you should update the global community string guesser list with the desired community string;You can change CLI credentials, and you should update the global CLI credentials guesser list with the desired CLI credentials (i.e. username, password and enable password);The stub configuration files must be updated to reflect desired changes, and if using NetMRI's TFTP server, redeployed using the admin shell tftpsync command.
You can edit the configuration files to contain your own credentials and settings. Access configuration files by using the NetMRI administrative shell and entering an ls tftp command. When finished, run the NetMRI tftpsync command to move these files into the public TFTP server file system.
Note: NetMRI also runs a TFTP service by default and may be used for serving configuration files.
ACM Registration and Certificate Usage Between NetMRI and NIOS
Note: The ACM system supports single sign-on between the NIOS and NetMRI appliance. When you sign on to one appliance in ACM, the other appliance automatically recognizes the login.

Infoblox NetMRI 7.4.4 Administrator Guide Part 4 Automation Change Manager Scripting and Job Management
Copyright ©2020, Infoblox, Inc. All rights reserved. Page 263
1.
You can install a CA certificate to secure communications between the NetMRI appliance and the NIOS appliance. The best method is to export a certificate in NetMRI and import it to the NIOS appliance that performs the ACM Registration and runs the Tasks Dashboard.
Open the NetMRI Administrative Shell (connect by SSH to the appliance and enter the administrator name and password) and enter:
export certThe system copies a NetMRI self-signed certificate suitable for use with the NIOS host, netmri.crt, to the root directory of the NetMRI appliance.
2. Transport the file to a location accessible from your workstation's local file system.
3. Connect to the NIOS appliance as the administrator.
4. On the ACM Dashboard, click the gear icon and choose ACM Registration.
5. Enter the NetMRI appliance's IP address, and the admin account and password. If you are installing a certificate from NetMRI, proceed to Step 8.
6. If you do not wish to install a certificate, click Register. An ACM Registration message appears:
Connection cannot be validated without a certificate. This may lead to security issues unless connection to NetMRI is physically secured. Would you like to continue?
7. Click Yes if you wish to operate ACM without a certificate. Otherwise, do the following:
8. Click the Enable Certificate Validation checkbox.
9. Click the Select button to browse for the certificate file.
10. Select the certificate file and click Open. The certificate Info fields add the information from the imported certificate.
11. Click Register. NetMRI registers with the NIOS appliance and the certificate is added to secure HTTPS communications between the hosts.
Deployment for Bare Metal Provisioning, Pt. 1The Provision Bare Metal Device automated task enables automated installation of new switches and routers into the network.
Provision Bare Metal Device (which we will refer to as BMP, for Bare Metal Provisioning) is used in initial deployments of many instances of the exact same device model, that will all use very similar configurations. For example, a company named Genuine Parts has 5500 storefront locations that will each use a new Cisco 2812 router as their gateway. Each device uses the exact same configuration, excepting the IP address, interface description and VLAN ID. Bare Metal Provisioning is defined for specific cases of this type.
BMP jobs cannot be executed across multiple types of devices in the same Job (e.g. a few 2812 routers, several 3750 switches, a dozen 2960 switches in the same job) because the Lists for BMP are written for a single device type for each job execution, to account for different numbers, interface types and other parameters. The job script must be modified to support the changes to the List for each job execution.
The BMP process is quite different from simply plugging a new Cisco appliance, giving it an IP address through a terminal program, allowing NetMRI to discover it and then pushing a configuration to it. BMP automates the process for deployments of the same device across many individual locations.
The Automation task enables cost and convenience savings by detecting the default behavior of new devices on the network, pointing them to TFTP servers from which the new devices download and install standardized bare-metal configuration files.
Configuration for the Provision Bare Metal Device automated task is primarily done in the NetMRI user interface. The automated task is automatically triggered by detection of a network device requiring configuration.

Infoblox NetMRI 7.4.4 Administrator Guide Part 4 Automation Change Manager Scripting and Job Management
Copyright ©2020, Infoblox, Inc. All rights reserved. Page 264
1.
2.
3.a.b.
4.
5.
6.
7.a.b.c.
i.
a.
b.
c.d.e.
f.
a.
b.
c.d.
Ensure the DHCP Options configuration is defined for all NIOS DHCP servers/DHCP ranges that will inter-operate with the Automation Change Manager. For more information, See Notes on DHCP Configuration for ACM Operation .Configure the NIOS appliance to forward Syslog notifications to NetMRI; on the NIOS appliance, choose Grid –> Grid Manager –> Members –> Grid Properties. Choose UDP as the transport protocol.Ensure the NIOS appliance is running the NTP protocol:
From the Grid tab, select the Grid Manager tab -> Members tab -> Grid_member check box.Expand the Toolbar and click NTP -> NTP Member Config. If the Enable this Member as an NTP Servercheckbox is enabled, nothing else needs to be done and you continue to Step 4.
Ensure the TFTP server is up and running with the desired initial configuration files ready for download, and reachable within the network. For more information, see Notes on TFTP Service for ACM Operation .The required admin user accounts should receive the appropriate notifications when Bare Metal Provisioning jobs occur. Consult the topic Defining a Job Notification for more information.Ensure that the proper license is installed in the NetMRI appliance by going to Settings icon –>Setup –> Settings Summary; check the Module Settings list. Automation Change Manager should read Enabled. (If necessary, also ensure the proper license is already installed in the NIOS system.)Register NetMRI with the NIOS system. This is done in NIOS through the following:
From the Dashboards tab, select the Tasks tab.In the Automation Tasks pane, click the down arrow gadget and select ACM Registration.Under ACM Settings, do the following:
Enter the IP address or resolved host name of the Automation Change Manager system supporting the Automation task pack.
Note: Optionally, you can load a CA certificate from NetMRI to NIOS to secure communications between the two systems.
ii. Enter the ACM Admin Password.
d. Click Register to commit settings.
After registration, the ACM Registration menu item changes to read ACM Deregistration to support disconnection from the Automation Change Manager appliance.
8. To set NetMRI to receive Syslog from the NIOS appliances running DHCP, do the following on the NIOS system:
Choose the Grid tab – >Grid Manager –> Members. Any member in the NIOS network running DHCP shows a green box under the DHCP column, indicating the members of the network that act as DHCP servers.Click the checkbox for at least one of the members running DHCP. (You can select more than one to perform this action.)Choose Grid Properties, and then choose Monitoring.Enable the Log to External Syslog Servers checkbox.To define NetMRI to receive Syslog messages, click the Add icon of the External Syslog Servers table and enter the Address information in the new row. Choose UDP as the transport. (Other table row settings should normally be left at their defaults.)Click Save and Close.
Individual NIOS appliances may need to be restarted for the changes to take effect.
9. Set up the DHCP protocol in the NIOS appliances. On each NIOS system running DHCP that you expect to participate in auto-configuring network devices, set the DHCP ranges as follows.
For the NIOS Grid, do the following:
Choose the Grid tab –> Grid Manager –> Services. Select DHCP. All members in the NIOS network running DHCP show a green box under the DHCP column, indicating members acting as DHCP servers.Click the link for the member with a DHCP range you want to use for serving DHCP configuration to new devices through ACM. The Members Home page for the select appliance appears, displaying the list of DHCP ranges running on the appliance.Select the checkbox for the DHCP Range to modify and click Edit.Click IPv4 DHCP Options and scroll to Custom DHCP Options.
Infoblox NetMRI 7.4.4 Administrator Guide Part 4 Automation Change Manager Scripting and Job Management
Copyright ©2020, Infoblox, Inc. All rights reserved. Page 265
••
1.
2.
Example: for Cisco devices, choose option 66 and enter the FQDN, or the IP address of the TFTP server (which could be the NetMRI system, a NIOS appliance or another system).
e. Click Save and Close.
f. Follow the same steps for any other DHCP range as necessary.
10. In the NetMRI appliance, choose Settings icon –> General Settings –> Advanced Settings and make sure the following two settings are turned On:
Discovery Ignore Duplicate MACsDiscovery Truncate IP History
11. Choose Settings icon –> Setup –> Credentials –> CLI and add a new USER credential of admin/infoblox, with an ENABLE password of infoblox. These credentials are pushed to the bare metal device after it boots with its TFTP configuration.
12. Choose Settings icon –> Setup –> Credentials –> SNMPv1/2c and click the autoconfig community string (it defaults to Priority 16). Click Edit and change its Priority value to 1.
13. Also in the SNMPv1/2c page, click New and create a new community string infoblox. Assign it a Priority value of 2 and click Add.
14. Continue to the following topic, Deployment for Bare Metal Provisioning, Pt. 2
Deployment for Bare Metal Provisioning, Pt. 2NetMRI provides Config Templates to support Bare Metal Provisioning for several standard Cisco and Juniper device types.
If you plan to create any new config templates for different device models beyond the models built in to the Automation Change Manager release, do so now. Note that the set of variables defined in the config templates are fixed. They are set by the values in the columns in the TAE BMP Device Provisioning list or from the TAE BMP Site Settings list. For more information, see Working with Configuration Templates .In the TAE BMP Switch Model Interface Defs list: If the switch model to be provisioned is already in the table, no information needs to be entered about interface configuration. If you have new model information, add the Vendor Model Key value and interfaces values for the new device types from Juniper or Cisco. Click Save when done.
Note: The Vendor Model Key must be named identically to the config template referenced by the system. For example, the Config Template cisco_catalyst295024 matches the corresponding Vendor Model Key field in the list.
The TAE BMP Switch Model Interface Defs list maps the device model to the ports available on that type of device. The Model column is the name of the device model as reported by the device. The same model name is also used to select the configuration template to be used for the device.
3. In the TAE BMP Site Settings list: this list defines default configurations of switch ports. When you have a standard configuration for (example) Sales Branches, you set that configuration once in this list. Define any new list records you need for new site settings. New table rows may be added for this data set.Among other settings, ports are assigned to VLANs in this list. Other vital settings include the Site Name, domain name, Syslog and NTP server and the site code. You also use the {} brackets for port ranges in this table. Click Save when done with changes.
4. In the ACM BMP Device Provisioning list: Identify the device(s) to be provisioned, and enter the Factory MAC addresses, site-assigned management IP addresses, mask and gateway information, and the cross-reference to aBMP Site Settings list record (in the Site Settings Name field). If you have a significant number of values to enter, you can import them into the list. Click Save when done.
5. Using a terminal program, open a CLI session on the NetMRI appliance using the admin account, and enter the tftpsync command. The default device config files are copied to the tftpboot directory on the NetMRI appliance.
6. Go to the NIOS appliance and open the Tasks Dashboard.

Infoblox NetMRI 7.4.4 Administrator Guide Part 4 Automation Change Manager Scripting and Job Management
Copyright ©2020, Infoblox, Inc. All rights reserved. Page 266
•
•
•
•
•
•
•
7. Click the Settings icon for the Bare Metal Provisioning task. The NetMRI instance appears in a new browser tab, displaying the Job History page. You track job execution here or in the NIOS Task Dashboard's Task Viewer. For information, see Viewing the Job History and the Job Viewer.
Perl Scripts for Bare Metal ProvisioningA number of read-only scripts are included in the licensed Automation Change Manager package. The Provision Bare Metal Device script is referenced by the Provision Bare Metal Device triggered job. For information, see Triggering Jobs Through Events. This script runs whenever the template job is invoked by NetMRI's detection of a new network device. Explore this NetMRI page for more script examples that can provide ideas for development.
Activating Rogue DHCP Server RemediationAll DHCP servers on the network should be under administrative control. If any device offering DHCP leases to clients on the network is not properly administered, it violates many security guidelines and may cause configuration problems throughout the network. Some events may be unwitting or innocuous (an office worker installing a wireless access point in their cube to share a resource), or may be an attempt to hijack clients and steal information. To prevent such issues, the Rogue DHCP Server Remediation task performs detection, location and isolation of such devices.
The Rogue DHCP Server Remediation automated task does not provide NIOS-based settings; configuration for this task is done in the NetMRI user interface. The task is triggered by detection of a network device requiring remediation.
As noted in the Triggering Jobs Through Events topic, two Triggered Jobs are associated with rogue DHCP remediation:
Locate Rogue DHCP Server
When NetMRI detects any system running the DHCP protocol that is not on the list of approved DHCP servers and is not a NIOS-approved DHCP server, NetMRI executes this job and locates the rogue system on the network. The job runs automatically and provides logs when it executes.
Isolate Rogue DHCP Server
After any rogue DHCP server is detected and located by the Automation Change Manager, the device is isolated to a designated isolation VLAN for remediation. This job requires approval by the administrator to execute.
Rogue DHCP Server Checklist and ProcessConfiguration for the ACM Rogue DHCP Server Remediation task is straightforward.
Rogue DHCP remediation begins with preventing established, legitimate DHCP servers, such as NIOS appliances supporting the DHCP service, from being identified as a rogue server. You compile all legitimate DHCP servers on the network into the ACM Allowed DHCP Servers list (Config Management –> Job Management –> Lists);Because the Rogue DHCP jobs are issue-driven, a suspected rogue device may first need to be detected by NetMRI. Ensure fingerprinting is enabled in the NetMRI system (Settings – Setup –> Network Polling –> Fingerprinting checkbox);Also ensure that the required user accounts get the appropriate notifications when Rogue DHCP events occur. Consult the topic Defining a Job Notification for specific information.NetMRI also scans the standard DHCP TCP and UDP ports (check settings in (Settings – Setup –> Network Polling and enter "bootp" as the search string in the Port Scan List).The NIOS administrator account username and password should be added to Advanced Settings (Settings icon –>General Settings –> Advanced Settings –> page to the NIOS Administrator category).
To enable the NetMRI-to-NIOS communication, you also define the NIOS administrator User ID and password that NetMRI will use to check the configuration in NIOS. If this is not yet in place, see Creating a Single-Sign-On Admin Account.

Infoblox NetMRI 7.4.4 Administrator Guide Part 4 Automation Change Manager Scripting and Job Management
Copyright ©2020, Infoblox, Inc. All rights reserved. Page 267
•
••
1.
2.
3.4.
••••
Rogue DHCP Triggering Events
The following event causes the initial Rogue DHCP discovery process to start:
NetMRI detects a NIOS-generated DHCPACK Syslog message.
If this occurs, and ACM does not know the IP address/MAC address combination of the device from which the DHCP service advertisement originated, NetMRI executes discovery on the new device and executes a DHCP Service Test on the new entity.If NetMRI discovers the new device on its own, it can happen in one of two ways:
The admin initiates a Discover Now session;Automation Change Manager discovers the new device. In these cases, NetMRI immediately runs a DHCP Service Test.
If the DHCP service exists on the new device, and it is not in the ACM Allowed DHCP Servers list or a NIOS-sanctioned DHCP server, the new device is deemed rogue.A new Rogue DHCP Server Detected Issue is fired by the Automation Change Manager.Once this issue appears, the first of the two ACM Rogue DHCP Server jobs, Locate Rogue DHCP Server executes with no intervention by the admin.
In The Event of a Positive MatchSeveral possible outcomes ensue when the Locate Rogue DHCP Server job completes. The first outcome, described in this section, is a positive match (the rogue server is found):
The upstream switch port from which the DHCP messages originated is found, and that upstream port has only a single downstream MAC address connected to it. This downstream MAC address is the culprit.A Rogue DHCP Server Located Issue displays in NetMRI's main Issues table (Network Analysis –> Issues) and in the NIOS Task Viewer. Then, after approval, the Isolate Rogue DHCP Server task activates.Click the Issue name in the Title column; the Issue Viewer appears in a separate browser window. Details of the issue are substantial, including the specific Device IP address, the device MAC and type, the identity of the upstream switch and the upstream interface, and the Last Seen timestamp.Any previously configured notifications will arrive at the admin's Inbox or through other channels.Go to the NIOS system and open the Tasks Dashboard.Click the Settings icon for the Rogue DHCP Server Remediation task. The NetMRI instance appears in a new browser tab, displaying the Job History page. This is where you track job execution in NetMRI. (For information, see Viewing the Job History and the Job Viewer ). The page lists the Locate and Isolate jobs and their results. You can also open the Task Viewer in the NIOS Task Dashboard.
In The Event of a Negative Match (DHCP Server Cannot be Isolated)In some cases, the Locate Rogue DHCP Server job executes but isolation cannot be performed (effectively, the rogue server cannot be found). This can happen for one of four distinct reasons:
The device in question stopped advertising its DHCP service;The upstream IP/MAC switch port from which the original advertisement appeared could not be located;The upstream port originating the DHCP advertisement is a trunk port;The upstream switch port, after being 'read' by NetMRI, turns out to have multiple downstream MAC addresses
Should any of these four results take place, the Automation Change Manager sends a new Issue, Rogue DHCP Server Cannot be Isolated. The Issue report also provides the specific reason that the device wasn't isolated.
Rogue DHCP Issues and NotificationsWhether the match is positive or negative, triggering issues are reported on NetMRI's main Issues page in Network Analysis –> Issues and in the NIOS Task Viewer. NetMRI Issue notifications are created, in the Settings icon –>

Infoblox NetMRI 7.4.4 Administrator Guide Part 4 Automation Change Manager Scripting and Job Management
Copyright ©2020, Infoblox, Inc. All rights reserved. Page 268
•
•
•
••
•
1.2.
3.
4.5.
1.
Notifications section –> Subscriptions page. The system sends notifications in one of three ways: Syslog messages, e-mail and SNMP traps. For more information, see Managing Issue Notifications.
Viewing the Job History and the Job ViewerThe Job History tab (Config Management –> Job Management –> Job History tab) lists all running jobs, scheduled jobs, and jobs that finish with errors. Information displayed in the table includes job status, start and end times, and run count.
The Job History works with both CCS and Perl/Python scripts and displays information resulting from Automation Change Manager job runs.
Click the hyperlink in the Name column. The Job Viewer window opens for the selected job.
Click the hyperlink in the Script column. A browser pop-up window appears displaying the script text.
Using the Job ViewerThe Job Viewer (opened from a job instance hyperlink in the Job History tab) provides detailed information about a job.
The Details tab provides detailed information about the selected job, including start and end times for the job, the current Job status, and the IP addresses and names for any devices against which the job runs.To view job details for a device: Click the hyperlink in the Status column. The Job Details Viewers opens for the chosen job, automatically displaying the Process Log for the selected job (see Viewing Job Details for more information).Click the hyperlink in the IP Address column. The Device Viewer appears for the device associated with the chosen IP address (see Inspecting Devices in the Network for more details).
The Issues tab lists issues raised by the job.To view Issue details, click a hyperlink in the Title column.
The Files tab lists files created using the ARCHIVE keyword. You can view and download files from within this tab. (If the ARCHIVE keyword is not used in the script, this tab is empty.)Click the Cancel icon for that device.Turn auto-refresh On or Off from the Refresh dropdown.
Note: The Cancel icon will only appear in the Actions column for a device if the job is currently pending or running on that device. The Actions column is empty if the job has been completed for all devices.
Click Cancel All to cancel all running Jobs in the page.
You create Views by resizing columns, by dragging column headers into different orders in the Viewer, and by adding or removing individual columns in the window.
Save views by using the Views pull-down menu.
You filter Job Details based on an expected value or multiple that may appear in any Job Viewer column.
To filter job information, do the following:
In the Job Viewer, click Filters. The Filters dialog appears.In the Select a New Field dropdown, select the information field (End Time, Start Time, Action, Device Name, IP Address or Status). A new row appears in the requester.Enter a Value.You can also change the Operator under which each filter entry operates. The default operator is (=) but can be changed to !=, Contains, Does Not Contain, Starts With and Ends With for precise matching.To add additional fields for matching in the Job, click the Select a New Field dropdown again.Click Apply to activate the filter. Click OK when finished with the new filter. To stop and quit without committing any changes, click the Close gadget on the requester.
To reschedule jobs that yielded errors, do the following:
In the Job History, click the Name link for a Job that produced an error. The Job Viewer appears.

Infoblox NetMRI 7.4.4 Administrator Guide Part 4 Automation Change Manager Scripting and Job Management
Copyright ©2020, Infoblox, Inc. All rights reserved. Page 269
2.3.4.
5.
1.2.
3.4.
•
••
•
••
1.2.
1.2.3.
4.5.
6.
In the Details tab, click Reschedule Errors.In the Reschedule Errors requester, select a calendar Execution Date and Execution Time.Click Reschedule Errors to reschedule the job. After a moment, the appliance displays a message: Created new job specification from device list. The new job needs to be approved.Click OK to continue.
To re-run a section of a script that yielded an error, do the following:
Click the Rerun Errors button. The Run... Script dialog appears.In the Run... Script dialog, double-click items in the Hosts lists to add them to the Selected list. The Selected list represents the devices against which the job should be re-run.Click Run Now.Click OK to continue.
Viewing Job DetailsThe Job Details Viewer opens from any hyperlink in the Status column in the Job Viewer. A Connections dropdown appears in the top of the Job Details Viewer. For Perl/Python jobs that open simultaneous connections with multiple devices, each device in the job is listed here. Toggling through the devices shows the corresponding job details for the given device in the Job Details Viewer.
If a script includes the ability to run multiple sessions, you can see the sessions running under the JobDetailsViewer–>Connections drop-down list.The Script tab displays the full script run against the device;The StatusLog tab shows the results of various internal script operations. Some of the information here may be useful in troubleshooting a failure. A color-coded view of the information in this tab is available in the ProcessLogtab;The ProcessLog tab shows individual steps or actions in the job on the device, including which matches occurred and whether an issue was generated (if the script generates an issue). This analysis is limited to 500 lines of output; if more than 500 lines of output were created, you can view the entire analysis in the process.pdf file available in the Files tab;The SessionLog tab lists the session details, indicating all CLI events that occurred during the job;The Files tab provides links to download any files related to the job for this device. The all.zip file contains copies of all associated files for convenience in downloading.
Using Perl Or Python Libraries
Note: Read/write operations on Perl or Python scripts in the Libraries page are limited to user accounts with the Scripts:Level 3 privilege. All other users are limited to read-only operations. Libraries also do not have an associated run level.
You store Perl or Python subroutines in NetMRI's dedicated Libraries page. LIbraries provides standard Copy, Export, Edit and Delete options.
To import a new Perl or Python library file, do the following:
On the Config Management –> Job Management –> Library page, click the Import icon on the top right.In the file requester, click Browse to navigate to the location of the file on the local appliance, select the file, and click Import.
To create a new Perl or Python Library file, do the following:
On the Config Management –> Job Management –> Library page, click the New icon on the top right.Add a Name for the new script.Enter the desired Category for the new script. (The Category field allows you to define any category you wish; the Library of scripts is sortable by the Category column.)Enter a new Description for the script.Enter the new script in the large text field in the Add Script requester. A script previously written in a text editor can also be copied and pasted.Click Save or Save and Close to save your changes.

Infoblox NetMRI 7.4.4 Administrator Guide Part 4 Automation Change Manager Scripting and Job Management
Copyright ©2020, Infoblox, Inc. All rights reserved. Page 270
7.8.
Click Export to save your changes to n external file.Click Cancel to remove changes.
To copy an existing script: In the Actions column, click the icon and choose Copy from the menu. To edit an existing script: In the Actions column, click the icon and choose Edit from the menu.
To export an existing script: In the Actions column, click the icon and choose Export from the menu. The appliance exports a text file.
To delete an existing script: In the Actions column, click the icon and choose Delete from the menu.
Sample Juniper router.conf FileThe example below is a Juniper autoconfiguration file for a 48-port EX-class Ethernet switch. This example is edited for brevity. Juniper autoconfig files require the definition of all interfaces of the device, unlike Cisco. Any undeclared interfaces will otherwise be non-functional in the system.
Juniper devices do not retain their DHCP-leased address obtained during the initial bootup, after the initial configuration is applied. The DHCP configuration must also be included in the autoconfiguration file or the device will drop off the network.
system {
host-name autoconfig;
root-authentication {
encrypted-password "$1$0.3byxFX$2DXqXFT9alWJXHYgSjXqg."; ## SECRET-DATA
} login {
user autoconfig {
uid 2000; class super-user;
authentication {
encrypted-password "$1$9/yWTmgz$tLG9dq6ptGqkbnPpDwhfz."; ## AutoConfig
}
}
}
services {
ssh {
protocol-version v2;
}
telnet;
}
}
interfaces {
ge-0/0/0 {
unit 0 {
family ethernet-switching;
}

Infoblox NetMRI 7.4.4 Administrator Guide Part 4 Automation Change Manager Scripting and Job Management
Copyright ©2020, Infoblox, Inc. All rights reserved. Page 271
}
ge-0/0/1 {
unit 0 {
family ethernet-switching;
}
}
ge-0/0/2 {
unit 0 {
family ethernet-switching;
}
}
...
ge-0/0/47 {
unit 0 {
family ethernet-switching;
}
}
vlan {
unit 0 {
family inet {
dhcp;
}
}
}
}
snmp {
community autoconfig {
authorization read-only;
}
}
vlans {
default {
l3-interface vlan.0;
}
}
Job Scripting

Infoblox NetMRI 7.4.4 Administrator Guide Part 4 Automation Change Manager Scripting and Job Management
Copyright ©2020, Infoblox, Inc. All rights reserved. Page 272
•••
•
•
•
•
•
Note: NetMRI needs the ENABLE password to access configuration files on some devices and to run the Configuration Command Scripts and Perl/Python scripts. To ensure easier identification of NetMRI actions, we recommend creation of a username and password on your network equipment specifically for NetMRI.
Job scripting is a key capability for NetMRI and for the Automation Change Manager system. Job scripting allows use of two linguistic approaches to script job-based automation: a proprietary language, called CCS (Change Control Scripting), a standard-language Perl API, and a standard-language Python API. This chapter focuses on Perl/Python scripting.
Note: CCS is a ‘high-level’ scripting language, which walls off access to the internals of the operating system and prevents operations such as overwriting blocks of memory and other potentially harmful actions. CCS also does not use or access the NetMRI Sandbox, which is a separate VM-based resource for Perl/Python scripting. Perl/Python scripting offers low-level access to all NetMRI system internals and the ability to use any operating system function or API call to affect any aspect of system operation. To prevent serious mistakes when using Perl/Python scripts, a dedicated and isolated virtual machine environment is provided by NetMRI in which Perl/Python scripts are automatically executed on behalf of the user.
A separate document, the NetMRI CCS Scripting Guide (available in the Additional Documentation section of the NetMRI online help), describes CCS scripting syntax in detail with design patterns and example scripts.
Perl/Python Scripting
Note: When you save a Perl/Python script, NetMRI will test-compile the script. If the compile fails, the appliance will disallow saving of the script and display the compilation errors to the user.
As with CCS, you use Perl/Python for change automation and custom Issue analysis. Perl/Python scripting possesses far greater capabilities, providing access to all aspects of the Perl or Python programming language, including the Perl/Python API, at runtime. NetMRI’s Job Wizard also supports the use of Perl/Python scripts. You use your preferred text editor or IDE to write and debug the Perl or Python script before copying the text into the appropriate field in the Job Wizard.
Infoblox strongly recommends testing all Perl/Python scripts before running them in the appliance.
Perl/Python scripting can be leveraged for use in custom issues, change scripts and analysis scripts.
The Job Management tab provides a collection of scripting-related functions:
The Scripts tab provides creation, copying, editing, scheduling, and running of automation scripts;The Library tab provides a convenient location for storing and Perl/Python subroutines and modules;The Config Templates tab lists any configuration template files. Config templates are text files that contain CLI commands for a specific vendor, device type, equipment model or network operating system version. Config templates can serve as the basis for a job (described in this chapter);The Lists tab provides external lists of information to which jobs can refer when running scripts (Described in Defining Lists for ACM, Perl, Python, and CCS Script Reference;The Scheduled Jobs tab is where you create and schedule jobs, which run scripts against devices at a specified frequency. (Described in Creating and Scheduling Jobs);The Triggered Jobs tab enables you to specify events that will trigger associated jobs. (Described in TriggeringJobs Through Events);The Job History tab lists jobs that have been scheduled (or run immediately), and shows their status. (Described in Viewing the Job History and the Job Viewer);The Custom Issues tab enables you to create and edit custom issues referenced by scripts.
Creating New Scripts (CCS, Perl, and Python)Create and manage scripts at Configuration Management –> Job Management tab –> Scripts tab.

Infoblox NetMRI 7.4.4 Administrator Guide Part 4 Automation Change Manager Scripting and Job Management
Copyright ©2020, Infoblox, Inc. All rights reserved. Page 273
1.2.
•••••
3.
1.2.
1.2.3.4.5.6.7.
8.9.
10.11.
12.
1.2.
Note: You must have the Scripts: Author and Scripts: Level 3 privileges in a system administrator account to create and save scripts.
To create a script: At the top right of the page, click New. The Add New Script dialog appears.In the Add New Script dialog: type a Name for the script.
Specify a Run Level. Run Level controls who can run the script.Specify an optional Category in which the script should be placed. (Use categories to organize scripts.Type a Description of the script.Select the Language of the script: CCS, Perl, or Python.Type or paste in the script in the lowest field in the dialog.
Click Save & Close or Save.
Run Level Risk User privilege required to run script
Low Low Scripts: Level 1
Medium Medium Scripts: Level 2
High High Scripts: Level 3
Note: Users are assigned roles/privileges to edit and run scripts based on risk. A user with Scripts: Level 1 privilege, for example, can run scripts having a Run Level of Low, but not those having a Run Level of Medium or High. A user with Scripts: Level 2 can run scripts having a Run Level of Low or Medium, but not High, and so forth. An organization might assign Scripts: Level 1 privileges to tier one NOC operators. Further, the organization might designate some scripts that perform simple tasks (such as running a "show" command to collect more data) as Run Level Low. As a result, their tier one NOC team members can have limited access to some devices, but are prevented from making radical changes.
To copy a script: Copy.In the Copy Script dialog, type a name for the script, then click OK. To edit a script: Edit.
To schedule a script for execution: Schedule. The Job Wizard opens.In the Fill out Job Details screen, type a Job Name.To allow a job to run: enable the Approved option. (A job cannot be scheduled unless it is approved.)Type a Description of the job.In the Scripts list, select a script. If required by the script, enter data and/or select options.Click Next.In the Select Device Groups o rDevices screen, click the Add icon to select specific device groups and/or devices to which this job applies.Click Next.In the Schedule when Job should run screen, specify the schedule for the job.Click Next.In the Review and save screen, review the job specifications. If changes are needed, click the < Previous button to return to an earlier screen.Click Save.
Track scheduled jobs in the Job History tab.
Note: You can also schedule a script in the Scheduled Jobs tab.
To run a script: Run Now.The Batch Status window displays the results of running the script.
To view batch details: Click a hyperlink in the Name column. The Job Viewer opens.

Infoblox NetMRI 7.4.4 Administrator Guide Part 4 Automation Change Manager Scripting and Job Management
Copyright ©2020, Infoblox, Inc. All rights reserved. Page 274
•
•••
•
•
•
•
To view the entire script: Click a hyperlink in the Script column.To delete a script: Delete, then confirm the deletion.
Note: Any single NetMRI instance can run a maximum of ten (10) active CLI sessions to network devices. This imposes a practical limit to the number of concurrent sessions that a script can run through CLI sessions to other devices in the network. This limit applies per NetMRI instance or per collector; for example, if you are running an Operations Center with three collectors, the Operations Center can run a script against up to 30 network devices at once.
Perl Scripting in NetMRI
Note: The Infoblox 1102-A and NT-4000 platforms support Perl scripting, as do all legacy appliances with 8 GB of RAM. Perl scripting is not available on other legacy platforms. The virtual machine version of NetMRI also supports Perl scripting and the Sandbox virtual environment. On platforms where Perl scripting is not available, all related features are hidden and/or disabled via the GUI and administrative shell.
Note: To achieve optimum performance on legacy NetMRI platforms, a BIOS change is necessary. If you have one of these platforms and the BIOS change has not been made, a message to that effect appears when attempting to save a Perl script. Contact Infoblox technical support to obtain the document describing the BIOS change process for these platforms.
Security and risk management are common concerns with Perl scripting, and precautions should be taken to ensure that a complex Perl script doesn't cause issues in the appliance. Risk levels, tied to CLI credentials, can be applied to scripts in NetMRI. This enables more granular permissions to be applied to specific scripts. A NetMRI user will need to provide a different set of end-user permissions to run specific jobs.Other features in Perl support include the following:
Access to the Perl exit function from within a script. If the Perl script exits with a zero exit code, the script ceases operation and NetMRI sets the job status to OK. If the Perl script exits with a non-zero exit code it causes the script to cease operation and NetMRI sets the job status to Error;Ability to mark problem commands and perform try/catch exception handling;A logging function, available in the infoblox_job.pl file;A LIbraries page (see Using Perl or Python Libraries for more information) containing blocks of Perl code to be referenced by other Perl scripts. The Libraries page supports creation, editing, deletion, and import and export of snippets of Perl code;Refer to lists of data to fill variables and find matches during job batch processing, extract information and parse the returned data (see the section Defining Lists for ACM, Perl, Python, and CCS Script Reference for more information);Use of standard NetMRI variables and data model objects in scripting logic. NetMRI automatically associates variables with target devices during runtime. Users can define input and internal variables that can be mapped to the NetMRI data model. The data model also provides access to device and interface attributes;Users can open multiple, simultaneous, device connections from within scripts, enabling change coordination between multiple devices in sequence or in parallel, based on common elements such as VLAN membership or neighbor topology. The feature is helpful in advanced use cases: for example, a script opens a connection to a network device, encounters a configuration element, and opens new connections to other, similar devices for comparison and determines the action to take on the current device;Regular expression processing, without restrictions on data structure types where regular expressions can be used, including script input variables, device output, data from external files, lists and NetMRI data model information.
Anatomy of a Perl Script

Infoblox NetMRI 7.4.4 Administrator Guide Part 4 Automation Change Manager Scripting and Job Management
Copyright ©2020, Infoblox, Inc. All rights reserved. Page 275
•••
•••
•••
••
Note: Well-known variables for Perl and CCS scripting are listed in the topic Scripting Well-Known Variables (Perl, Python, and CCS).
Perl scripts use a script header similar to a CCS script, contained within a well-known comment block. The script header block influences a number of runtime behaviors, including:
Script-Timeout
Specifies the per-command timeout for the entire script in seconds.
Type: IntegerRequired: NoDefault if not specified: 60
Script-Login
Specifies whether the job engine should automatically establish a connection with the target device.
Type: BooleanRequired: NoDefault if not specified: true
Script-Variables
Specifies inputs needed by the script.
Type: Tuple (ordered list of elements)Required: NoDefault if not specified: None
Script-Filter
Specifies the device types processed by the script.
Type: StringRequired: Yes
A Perl Script header block must be defined inside of Perl comments within a "well known" comment section (between BEGIN-SCRIPT-BLOCK and a # END-SCRIPT-BLOCK). The following example demonstrates the difference between a CCS and Perl Script header block that specifies a Script-Filter that applies to all Cisco IOS devices.
As a comparison, a CCS implementation is straightforward:
Script-Filter:$Vendor == "Cisco" and $sysDesc like /IOS/
You can filter by the network view:
Script-Filter:$network == "blue"
A comparable Perl implementation is as follows:
BEGIN-SCRIPT-BLOCK
Script-Filter:$Vendor == "Cisco" and $sysDesc like /IOS/
END-SCRIPT-BLOCK
Perl scripts run inside the sandbox, using the Perl API to communicate with the Device Interaction Server (DIS) on NetMRI. The DIS proxies CLI requests/responses to/from network devices on behalf of the Perl scripts. Before commands can be sent to a network device, a Perl script must first establish a DIS session (see v2 API object DisSession). After a session has been established, a CLI connection with the target device must be established for the given session (see v2 API object CliConnection). The majority of the time, a Perl script will follow this same initialization sequence. First, establish the API session, establish the DIS session, then establish a CLI connection with the target device. For this reason, Infoblox_Job.pm, a pre-installed Perl library, is provided in the appliance (see ConfigurationManagement –> Job Management –> Library –> Infoblox_Job).

Infoblox NetMRI 7.4.4 Administrator Guide Part 4 Automation Change Manager Scripting and Job Management
Copyright ©2020, Infoblox, Inc. All rights reserved. Page 276
•
•
•
•
•
About NetMRI_Easy.pmNetMRI_Easy.pm provides an interface to the NetMRI API from perl scripts run on the NetMRI appliance. NetMRI_Easy.pm offers all of the features of infoblox_jobs.pm, with some safeguards and object -oriented interfaces that are unavailable when infoblox_jobs.pm is used.NetMRI_Easy.pm is designed to be imported as a library into NetMRI and used by Perl scripts executed in the Sandbox environment.NetMRI_Easy.pm is also a compatibility layer, allowing writing of Perl scripts that function unaltered with the newer 2.5 NetMRI Perl API, using scripts originally developed for the NetMRI Perl Core API 1.1. The following subsections describe the Perl functions encompassed by NetMRI_Easy.pm:
Constructor
The new NetMRI_Easy constructor options include the following:
my $easy = new NetMRI_Easy(api_version => 2, nios_api => 1 );
The Constructor for NetMRI_Easy takes a hash reference for options.
api_version => $version
Specifies which API version to use. See NetMRI::API for details.
nios_api => 1
Load the Infoblox API before connecting to the API. Using this option is the same as
use NetMRI::Util;
use_infoblox_api($main::nios_ipaddress);
NetMRI_Easy ensures that the Infoblox API is loaded before LWP::UserAgent. This is necessary because the Infoblox API requires a different version of LWP::UserAgent, and will fail if modules are loaded in the wrong order.
nios_ipaddress => $ip_address
IP address of the NIOS device to download the Infoblox API and connect to when using the nios_session method. This option is necessary when connecting to a NIOS that is not registered with NetMRI.
nios_username => $username
Username to use when connecting to the NIOS device. This option is necessary when connecting to a NIOS appliance that is not registered with the NetMRI, or to connect with different credentials.
nios_password => $secret
Password to use when connecting to the NIOS device. This option is necessary when connecting to a NIOS appliance that has not been registered with NetMRI, or to connect with different credentials.
NetMRI_Easy Attributes
$easy->job_id
Job ID of the Perl script running on the NetMRI appliance.
$easy->device_id
ID of the target device against which the script is running.

Infoblox NetMRI 7.4.4 Administrator Guide Part 4 Automation Change Manager Scripting and Job Management
Copyright ©2020, Infoblox, Inc. All rights reserved. Page 277
$easy->batch_id
Batch id of the Perl script running on the NetMRI appliance.
$easy->username
The NetMRI username.
$easy->dis_session_id
Returns the DIS session id used to interact with the target device. The DIS session is opened automatically when needed, and closes automatically when the NetMRI_Easy object goes out of scope (typically when the Perl script terminates on the NetMRI appliance).
$easy->device
Returns the NetMRI::API::Remote::Device (new Perl API) or NetMRI::API::Device (old Perl API) for the target device.$easy->device is a shortcut for the following:
$easy->broker->device->show(DeviceID => $self->device_id )->device;
The device is cached and fetched only once.
NetMRI_Easy Methods
$easy->set_variable( $variable_name, $value )
Set a server-side variable. This is useful when retrieving a template via get_template and the template contains variables that are not defined by the Script-Variables for the current job. This is because template merging (i.e. variable substitution) is performed on the server-side.
Example
$easy->set_variable(Username => $some_username);
This method requires a CLI connection to the device. NetMRI must have credentials for the device against which the NetMRI_Easy script is running.
$easy->send_command( $command )
Send a command to the target device.
Example
my $output = $easy->send_command("show version");
This method requires a CLI connection to the device. NetMRI must have credentials for the device against which the NetMRI_Easy script is running.
$easy->send_command( $command, $new_prompt)
Send a command to the target device. You can use the new_prompt parameter to override the device prompt when the command executed in the $command parameter to change the prompt on the device.
Example
my $output = $easy->send_command("conf t", "mydevice(config-if)#");

Infoblox NetMRI 7.4.4 Administrator Guide Part 4 Automation Change Manager Scripting and Job Management
Copyright ©2020, Infoblox, Inc. All rights reserved. Page 278
This method requires a CLI connection to the device. NetMRI must have credentials for the device against which the NetMRI_Easy script is running.
$easy->get_template( $template_name )
Retrieve a template. For the given template, retrieve the content and perform any necessary variable substitutions.
Example
my $contents = $easy->get_template("Cisco Router");
This method requires a CLI connection to the device. NetMRI must have credentials for the device against which the NetMRI_Easy script is running.
$easy->get_list_value( $list_name, $key_column, $value_column, $default )
Look up a value in a list. For the given list name, finds the first row containing the given key value in the given key column and returns the value contained in the given value column. If the look up fails, the given default is returned.$default is returned if no value is found. If $default is not specified, then empty string " " is used as the default.This method requires a CLI connection to the device. NetMRI must have credentials for the device against which the NetMRI_Easy script is running.
$easy->generate_issue( $issue_type_id, $severity, %parameters )
Generate an issue. For the given issue type id, generate an issue of the given severity using the name/value pairs defined in the given parameters as the issue details.$issue_type_id
String issue type id
$severity
severity is one of "error", "warning" or "info"
%parameters
hash reference containing the issue details.
Example
my $issue_id = $easy->generate_issue("Invalid Accounts", "warning", "IP Address" => '1.2.3.4', "Username"=> 'admin', );
$easy->log_message($severity, $message)
Log a message of the given severity (one of 'debug', 'error', 'warning' or 'info'). The message is written to the custom.log file.This method requires a CLI connection to the device and that NetMRI have credentials for the device against which the NetMRI_Easy script is running.
$easy->broker->broker_name
Get the broker object of the corresponding API controller. Similar to device or cli_connection. Broker objects can be used to query and modify objects on the NetMRI appliance.
$easy->device_session( $device_id )
Create an instance of NetMRI_Easy associated with this job, but with a different device. Enables sending of commands to an additional device.

Infoblox NetMRI 7.4.4 Administrator Guide Part 4 Automation Change Manager Scripting and Job Management
Copyright ©2020, Infoblox, Inc. All rights reserved. Page 279
Example
my $easy2 = $easy->device_session( 25 ); my $command_out = $easy2->send_command('show version'); $easy2->log_message('info', 'send command show version');
This method may be called to create as many device sessions as needed.
$easy->write_payload( @list )
Encode a message in JSON format in the status log; the message can be retrieved using the read_payload method on NetMRI::API::Remote::Job once the job has completed.
$easy->nios_session
Open a session with NIOS. You must pass nios_api => 1 into the constructor to NetMRI_Easy to use this method, the Infoblox Perl API must be loaded before the Perl API.
NetMRI_Easy GlobalsThis module internally relies on global variables provided by NetMRI.
$main::http_username $main::http_password $main::api_url $main::job_id $main::device_id $main::batch_id $main::nios_ipaddress $main::nios_username $main::nios_password
Dependency on these variables is limited to the constructor for NetMRI_Easy. NetMRI_Easy provides attribute accessors for most of these values.
Diagnostics
Missing Credentials for Device
Several methods open a CLI connection with the device against which NetMRI_Easy runs, thus requiring CLI credentials for that device. If the NetMRI instance running the script is missing those credentials, you may see an error of the form
**Error / NetMRI dis-sessions/dis-error % No auth credentials found for device 18[ http://u.x.y.z/api/3.3/cli_connections/open.json
The URL stated is the URL for the NetMRI Core API method that failed. The cited IP address is the IP address of the NetMRI instance.
Note: Job_id in the Perl sandbox is the JobDetailID as used by the NetMRI API. Batch_id is the Job ID used by the NetMRI API.

Infoblox NetMRI 7.4.4 Administrator Guide Part 4 Automation Change Manager Scripting and Job Management
Copyright ©2020, Infoblox, Inc. All rights reserved. Page 280
Infoblox_job.pm and Associated FunctionsIncluding Infoblox_Job.pm in a Perl script will manage the initialization sequence for the job manager. Infoblox_Job.pm abstracts many of the details of the NetMRI v2 PAPI for common Perl script tasks and exposes them through standard Perl functions. These functions are as follows:
# Name : open_session
# Description : Open a session with the DIS (Device Interaction Server) for the current job. The DIS proxies CLI requests between clients (e.g. Perl scripts) and network devices. A single DIS session can handle connections to multiple network devices.
# Arguments : None
# Returns : None
#Example: : open_session();
#Name : close_session
#Description : Close the current DIS session.
#Arguments : None
#Returns : None
#Example: : close_session();
#Name : log_message
#Description : Log a message of the given severity. The message is written to the custom.log file.
#Arguments : severity (string, required - valids =
# debug, error, warning, info)
# The severity.
# message (string, required)
# The message.
#Returns : None
#Example: : log_message(
# "debug",
# "Hello World!"
# );
# Name : open_connection
# Description : Open a connection with the target device via the DIS for the current DIS session.
# Arguments : None
# Returns : None
# Example: : open_connection();

Infoblox NetMRI 7.4.4 Administrator Guide Part 4 Automation Change Manager Scripting and Job Management
Copyright ©2020, Infoblox, Inc. All rights reserved. Page 281
# Name : close_connection
# Description : Close the connection with the target device for the current DIS session.
# Arguments : None
# Returns : None
# Example: : close_connection();
# Name : set_variable
# Description : Set a server-side variable. This is useful when retrieving a template via get_template and the template contains variables that are not defined by the Script-Variables for the current job. This is because template merging (i.e. variable substitution) is performed on the server-side.
# Arguments : command (string, required)
# The set variable command.
# Returns : None
# Example: : set_variable("\$Username = \"$some_username\"");
# Name : send_command
# Description : Send a command to the target device.
# Arguments : command (string, required)
# The command to be sent to the target device.
#
# debug (boolean, optional - default = "off")
# Debug mode. If enabled, the command will not be sent to the
# target device, but what would have been sent will appear in the logs.
# Returns : (string)
# 1. The output from the command (debug == "off").
# 2. "" (debug == "on").
# Example: : my $output = send_command("show version");
# Name : get_template
# Description : Retrieve a template. For the given template, retrieve the content and perform any necessary variable substutions.
# Arguments : template (string, required)
# The name of the template to be retrieved.
#
# stage (boolean, optional - default = "off")

Infoblox NetMRI 7.4.4 Administrator Guide Part 4 Automation Change Manager Scripting and Job Management
Copyright ©2020, Infoblox, Inc. All rights reserved. Page 282
# Stage mode. If enabled, the template is staged on NetMRI in a location that is anonymously available via TFTP and HTTP. The staged file is removed when the script has exited.
# Returns : (string)
# 1. The template contents (stage == "off").
# 2. The path to the template contents (stage == "on").
# Example: : my $contents = get_template("Cisco Router");
# Name : get_list_value
# Description : Lookup a value in a list. For the given list name, finds the first row containing the given key value in the given key column and returns the value contained in the given value column. If the lookup fails, the given default is returned.
# Arguments : list_name (string, required)
# The list name.
#
# key_column (string, required)
# The key column.
#
# key_value (string, required)
# The key value.
#
# value_column (string, required)
# The value column.
#
# default (string, optional - default = "")
# The default.
#
# Returns : (string)
# The result of the lookup.
# Example: : my $enable_password = get_list_value(
# "Enable Passwords",
# "IP Address",
# $ipaddress,
# "Password",
# "NOT FOUND"
# );
# Name : generate_issue
# Description : Generate an issue. For the given issue type id, generate an issue of the given severity using the name/value pairs defined in the given params as the issue details.

Infoblox NetMRI 7.4.4 Administrator Guide Part 4 Automation Change Manager Scripting and Job Management
Copyright ©2020, Infoblox, Inc. All rights reserved. Page 283
# Arguments : issue_type_id (string, required)
# The issue type id.
#
# severity (string, required - valids = error, warning, info)
# The severity.
#
# params (hash reference, required)
# The issue details.
# Returns : (number)
# The assigned issue id.
# Example: : my $issue_id = generate_issue(
# "Invalid Accounts",
# "warning", {
# "IP Address"=> $ipaddress,
# "Username"=> $some_username
# });
When including Infoblox_Job.pm in your Perl scripts, you do not have to explicitly call log_message(), open_session(), open_connection(), close_session() or close_connection(). Infoblox_Job.pm contains code that executes upon being included. Therefore, the second line of your Perl script can begin to access the other functions defined in Infoblox_Jon.pm. As an example:
require "Infoblox_Job.pm"; my $output = send_command("show version");
More About Infoblox_Job.pmAlthough the majority of Perl scripts will include Infoblox_Job.pm, a Perl script may do other tasks beyond communicating with the target device. For example, a Perl script can transmit acquired target device information (which is available via well-known variables in the script) with a trouble ticketing system that resides elsewhere on the network. In this case, though including Infoblox_Job.pm is permitted, doing so would be unnecessary (why establish a CLI connection with the target device when no CLI actions are taken?).The standard Infoblox_Job.pm initialization sequence and functions establish a DIS session and a CLI connection with the target device. A DIS session can support multiple CLI connections. You may develop more advanced use cases in which Perl scripts establish simultaneous connections to multiple network devices in addition to the target device. In this scenario, the Perl script must obtain the DeviceIDs for the non-target network devices and directly use the v2 API functionality to communicate with them (i.e. basically do the equivalent of open_connection(), send_command(), and so on).
Python Scripting in NetMRI
Note: The Infoblox 1102-A and NT-4000 platforms support Python scripting, as do all legacy appliances with 8 GB of RAM. Python scripting is not available on other legacy platforms. The virtual machine version of NetMRI also supports Python scripting and the Sandbox virtual environment. On platforms where Python scripting is not available, all related features are hidden and/or disabled via the GUI and administrative shell. To achieve optimum performance on legacy NetMRI platforms, a BIOS change is necessary. If you have one of these platforms and the BIOS change has not been

Infoblox NetMRI 7.4.4 Administrator Guide Part 4 Automation Change Manager Scripting and Job Management
Copyright ©2020, Infoblox, Inc. All rights reserved. Page 284
•
•••
•
•
•
•
•••
•
made, a message to that effect appears when attempting to save a Python script. Contact Infoblox technical support to obtain the document describing the BIOS change process for these platforms.
Security and risk management are common concerns with Python scripting, and precautions should be taken to ensure that a complex Python script doesn’t cause issues in the appliance. Risk levels, tied to CLI credentials, can be applied to scripts in NetMRI. This enables more granular permissions to be applied to specific scripts. A NetMRI user will need to provide a different set of end-user permissions to run specific jobs.
Other features in Python support include the following:
Access to the Python exit function from within a script. If the Python script exits with a zero exit code, the script ceases operation and NetMRI sets the job status to OK. If the Python script exits with a non-zero exit code it causes the script to cease operation and NetMRI sets the job status to Error;Ability to mark problem commands and perform try/catch exception handling;A logging function, available in the infoblox_job.pl file;A Libraries page (see Using Perl or Python Libraries for more information) containing blocks of Python code to be referenced by other Python scripts. The Libraries page supports creation, editing, deletion, and import and export of snippets of Python code;Refer to lists of data to fill variables and find matches during job batch processing, extract information and parse the returned data (see the section Defining Lists for ACM, Perl, Python, and CCS Script Reference for more information);Use of standard NetMRI variables and data model objects in scripting logic. NetMRI automatically associates variables with target devices during runtime. Users can define input and internal variables that can be mapped to the NetMRI data model. The data model also provides access to device and interface attributes;Users can open multiple, simultaneous, device connections from within scripts, enabling change coordination between multiple devices in sequence or in parallel, based on common elements such as VLAN membership or neighbor topology. The feature is helpful in advanced use cases: for example, a script opens a connection to a network device, encounters a configuration element, and opens new connections to other, similar devices for comparison and determines the action to take on the current device;Regular expression processing, without restrictions on data structure types where regular expressions can be used, including script input variables, device output, data from external files, lists and NetMRI data model information.
Anatomy of a Python Script
Note: Well-known variables for Python scripting are listed in the topic Scripting Well-Known Variables (Perl, Python, and CCS).
Python scripts use a script header similar to a CCS script, contained within a well-known comment block.
The script header block influences a number of runtime behaviors, including:
Script-TimeoutSpecifies the per-command timeout for the entire script in seconds.
Type: IntegerRequired: NoDefault if not specified: 60
Script-LoginSpecifies whether the job engine should automatically establish a connection with the target device.
Type: Boolean
Infoblox NetMRI 7.4.4 Administrator Guide Part 4 Automation Change Manager Scripting and Job Management
Copyright ©2020, Infoblox, Inc. All rights reserved. Page 285
••
••••
••
Required: NoDefault if not specified: true
Script-VariablesSpecifies inputs needed by the script.Type: Tuple (ordered list of elements)Required: NoDefault if not specified: None
Script-FilterSpecifies the device types processed by the script.
Type: StringRequired: Yes
A Python Script header block must be defined inside of comments within a "well known" comment section (between # BEGIN-SCRIPT-BLOCK and a # END-SCRIPT-BLOCK). The following example demonstrates the difference between a CCS and Python Script header block that specifies a Script-Filter that applies to all Cisco IOS devices.
As a comparison, a CCS implementation is straightforward:
Script-Filter: $Vendor == "Cisco" and $sysDesc like /IOS/
You can filter by the network view:
Script-Filter: $network == "blue"
A comparable Python implementation is as follows:
# BEGIN-SCRIPT-BLOCK
# Script-Filter: $Vendor == "Cisco" and $sysDesc like /IOS/
# END-SCRIPT-BLOCK
Python scripts run inside the sandbox, using the Pyrthon API to communicate with the Device Interaction Server (DIS) on NetMRI. The DIS proxies CLI requests/responses to/from network devices on behalf of the Python scripts. Before commands can be sent to a network device, a Python script must first establish a DIS session (see v2 API object DisSession). After a session has been established, a CLI connection with the target device must be established for the given session (see v2 API object CliConnection). The majority of the time, a Python script will follow this same initialization sequence. First, establish the API session, establish the DIS session, then establish a CLI connection with the target device. For this reason, netmri_easy.py, a pre-installed Python library, is provided in the appliance (see Configuration Management –> Job Management –> Library –> netmri_easy).
About netmri_easy.pyThe netmri_easy.py provides an interface to the NetMRI API from python scripts run on the NetMRI appliance.
netmri_easy.py is designed to be imported as a library into NetMRI and used by Python scripts executed in the Sandbox environment.
The following subsections describe the Python functions encompassed by netmri_easy.py:.
Constructor
The NetMRIEasy constructor options include the following:
easy = NetMRIEasy( **params );
The Constructor for NetMRI_Easy takes a kwargs for options:

Infoblox NetMRI 7.4.4 Administrator Guide Part 4 Automation Change Manager Scripting and Job Management
Copyright ©2020, Infoblox, Inc. All rights reserved. Page 286
host - api host. Provided by NetMRI
username - host username. Provided by NetMRI
password - host password. Provided by NetMRI
job_id - Job id. Provided by NetMRI
bacth_id - bacth id. Provided by NetMRI
device_id - device id. Provided by NetMRI
Methods
easy.set_variable( variable_name, variable_value )
Set a server-side variable. This is useful when retrieving a template via get_template and the template contains variables that are not defined by the Script-Variables for the current job. This is because template merging (i.e. variable substitution) is performed on the server-side.
Example
easy.set_variable('username', 'test_username')
This method requires a CLI connection to the device, NetMRI must have credentials for the device the NetMRIEasy script is run against.
easy.send_command( command )
Send a command to the target device.
Example
output = easy.send_command("show version")
This method requires a CLI connection to the device and that the NetMRI have credentials for the device the NetMRIEasy script is run against.
easy->get_template( $template_name )
Retrieve a template. For the given template, retrieve the content and perform any necessary variable substitutions.
Example
contents = easy.get_template("Cisco Router")
This method requires a CLI connection to the device and that the NetMRI have credentials for the device the NetMRIEasy script is run against.
easy.get_list_value(list_name, key_column, key_value, value_column, default)
Look up a value in a list. For the given list name, finds the first row containing the given key value in the given key column and returns the value contained in the given value column. If the look up fails, the given default is returned.
The default is returned if no value is found. If default is not specified, then empty string " " is used as the default. This method requires a CLI connection to the device, NetMRI must have credentials for the device the NetMRIEasy script is run against.

Infoblox NetMRI 7.4.4 Administrator Guide Part 4 Automation Change Manager Scripting and Job Management
Copyright ©2020, Infoblox, Inc. All rights reserved. Page 287
easy.generate_issue(severity, issue_type_id, **kwargs)
Generate an issue. For the given issue type id, generate an issue of the given severity using the name/value pairs defined in the given parameters as the issue details.
severity
severity is one of "error", "warning" or "info"
issue_type_id
String issue type id
kwargs
arguments containing the issue details.
Example
issue_id = easy.generate_issue("info", "IOSBanLoginUpdateSuccess", **{
"Name":'Sample Name',
"Host":'1.2.3.4'
})
easy.log_message(severity, message)
Log a message of the given severity (one of 'debug', 'error', 'warning' or 'info'). The message is written to the custom.log file.
This method requires a CLI connection to the device and that NetMRI have credentials for the device the NetMRIEasy script is run against.
easy.broker(broker_name)
Get the broker object of the corresponding API controller. Similar to device or cli_connection. Broker objects can be used to query and modify objects on the NetMRI appliance.
Using the NetMRI Sandbox
Note: You use the admin shell interact with the sandbox VM in NetMRI. The sandbox is rigorously isolated from the rest of the system, but allows root access to its internals, utilities and services. A shared disk partition is also created for use between the sandbox VM and the broader system.
As previously noted in this chapter, NetMRI provides a dedicated virtual machine environment, called the Sandbox, where Perl scripts are automatically run on behalf of the user. Perl also provides access to operating system internals, interacting with appliance services, performing data I/O operations, and reading from and writing to blocks of appliance memory.
The sandbox runs an instance of the same operating system kernel as the NetMRI appliance, which is a standard Unix variant, with the normal operating system utilities and file system. You can install Perl modules from CPAN into the sandbox environment and use them for scripting. You can install any Perl distributions, executables and modules into the sandbox environment. The NetMRI sandbox environment provides a Perl interpreter and supporting modules to support script execution.
The NetMRI Sandbox is available in two forms. Physical appliances with 8 GB of RAM or more automatically run the sandbox as a virtual machine inside of NetMRI. In this configuration, the sandbox is referred to as a local sandbox. All other platforms, including virtual platforms, cannot run a local sandbox. To take advantage of Perl scripting functionality,

Infoblox NetMRI 7.4.4 Administrator Guide Part 4 Automation Change Manager Scripting and Job Management
Copyright ©2020, Infoblox, Inc. All rights reserved. Page 288
1.
2.
these platforms support a separate sandbox VM configuration, which must be set up and registered with NetMRI. In this configuration, this is referred to as a remote sandbox.
NetMRI appliances with 8GB or more of RAM can also use a remote sandbox to increase available resources to the local sandbox (e.g. CPU, memory, disk, etc) to solve more complex use cases. In those cases, the sandbox resources are governed by the hypervisor.
You download the Sandbox VM image from Infoblox Support.
Platforms supporting a local sandbox automatically perform the necessary setup and configuration steps; platforms that need a remote sandbox require a manual setup and configuration process. The topic Setting up a Remote Sandbox describes remote sandbox setup and configuration.
Note: A remote sandbox VM is not automatically upgraded when NetMRI is upgraded. If you deploy a remote sandbox and later upgrade NetMRI, the remote sandbox continues to report and run its originally deployed version. When you upgrade between major versions, for example, from 7.3.3 to 7.4.1, you must download a new Sandbox VM file from Infoblox and then redeploy the remote sandbox. When you upgrade between minor versions, for example, from 7.4.1 to 7.4.2, you do not need to redeploy the sandbox. An exception to this is the upgrade to the 7.4.3 minor version which requires the remote sandbox redeployment. Backup any customizations made to the remote sandbox (installed Perlscripts, libraries, configuration, etc...) before redeployment.
To access the Sandbox for a NetMRI appliance or VM instance, do the following:
Access the administrative shell using an admin account, following the instructions in the Administrative Shelltopic.Enter the sandboxlogin command at the shell prompt.
Type exit and press Enter at any time to close the sandbox and return to the Administrative prompt.
Sandbox CommandsThe sandbox command has seven arguments. All commands are not always available in the NetMRI administrative shell. Commands that appear in the shell depend on current configuration. The following table describes each command and its availability for each platform:
sandbox [configure|login|register|deregister|restart|reset|show]
sandbox configure Administrative shell command for configuration of the local sandbox IP settings for a NetMRI appliance. By default, the local sandbox inherits its IP configuration from its appliance host. This command will rarely be used unless the organizational policies require a different IP configuration for the local sandbox instance.
Available only for local sandbox instances
sandbox login Log in to the sandbox VM environment. By default, superuser privileges are provided in the Sandbox environment. You use the sbuser account by default and the system places you in the local directory for that account.
Available for local and remote sandbox instances
sandbox restart Restarts the sandbox VM's operating system. Useful in cases where a script is stuck in a loop or otherwise cannot be ended, or the operating system undergoes an upgrade and requires a restart. For remote sandbox instances, you can log in to the VM and issue a reboot command; or reset the VM from the hypervisor.
Available only for local sandbox instances

Infoblox NetMRI 7.4.4 Administrator Guide Part 4 Automation Change Manager Scripting and Job Management
Copyright ©2020, Infoblox, Inc. All rights reserved. Page 289
1.2.
sandbox reset Completely restores and rebuilds the entire local sandbox VM's file system to its default configuration. Considered "the nuclear option" when a Perl script accidentally renders unusable some part of the VM's environment. The larger NetMRI file system, operating system and functional operations will remain unaffected by a sandbox resetdirective or by any operations from an errant Perl script in the VM. The system erases any previously installed Perl modules or software utilities; the shared partition remains unaffected by this directive. To reset a remote sandbox instance, you redeploy a downloaded sandbox VM image.
Available only for local sandbox instances
sandbox register NetMRI administrative shell command that configures NetMRI to communicate with a new remote sandbox VM. Execute this command after installing the remote sandbox VM image into the VMware® server and setting up the remote sandbox. When executing this command you are prompted to enter the IP address of the remote sandbox to be registered. You will also be prompted twice to enter the password for the sbuser account on the remote sandbox (NetMRI prompts twice for the password to make sure no errors are made entering the password).
sandbox register is available only when a remote sandbox is not currently registered.
sandbox deregister NetMRI administrative shell command that disassociates the remote sandbox from the system.
Available when a remote sandbox is currently registered
sandbox show NetMRI administrative shell command to show the status and basic configuration of the local sandbox or the remote sandbox. Sandbox show displays the network IP address and its Mode: Local, Remote or N/A. N/A indicates that the platform is not capable of supporting a local sandbox and that no remote sandbox has been registered. A remote sandbox must be registered to take advantage of Perl scripting on platforms that do not support a local sandbox.
Always available
Given the power and flexibility of the Perl language, Infoblox recommends treating this functionality with the caution and expertise it deserves. Knowledgeable Perl users may install and use different Perl software modules, database management software and other utilities and write scripts that consume unacceptable amounts of appliance CPU cycles and available memory. If any Perl script runs out of control, the only file system affected is that within the sandbox instance; the NetMRI appliance remains unaffected. You may need to run a sandbox restart or even a sandbox resetcommand to halt an errant Perl script on a local sandbox.The NetMRI appliance strictly limits system disk and memory resource allocations for its local Sandbox instance, and those resources are not extensible from within the Sandbox. If the Sandbox is set up as a remote VM instance, the hypervisor determines memory and other resource allocations.
Note: Type exit and press <enter> to close the Sandbox and return to the administrative prompt.
Setting up a Remote Sandbox
Note: The instructions in this section are for the VMware VSphere® platform.
To configure the Remote Sandbox, do the following:
Open the administrative shell.Download the Sandbox VM file from Infoblox using any scp program (such as WinSCP). If you chose the OVF file type, the downloaded file contains an OVF file, a VMDK file, an MF file, a README file and a LICENSE file. The OVF file is what you will need to import into your VMware hypervisor. The MF file

Infoblox NetMRI 7.4.4 Administrator Guide Part 4 Automation Change Manager Scripting and Job Management
Copyright ©2020, Infoblox, Inc. All rights reserved. Page 290
3.
•••
1.2.3.4.5.6.7.
contains checksums of the OVF and VMDK files to verify that the exported files are correct before importing. The README file contains detailed instructions for deployment of the remote sandbox.The standard VMX and VMDK files along with a README file and a LICENSE file, may also be deployed into VMware Workstation. You import the VMX file into the VMware hypervisor. The README file contains detailed instructions for deployment of the remote sandbox.Load the files into the hypervisor.For example, In VSphere, choose File –> Deploy OVF Template and select the file from the correct folder.After the file loads, give the virtual machine a new name, choose where the VM is deployed, and choose its datastore.
Note: The remote sandbox (VM) uses DHCP upon initial startup to acquire its IP configuration. You may change this value to static IP subnet and mask values through the Setup utility (see Step 7 below). Change the remote sandbox network configuration using the VMware console; avoid changing the sandbox configuration directly through an SSH connection. This prevents dropped SSH connections when the default DHCP configuration is changed to a potentially different static address in the Setup program.
4. After the Sandbox VM is installed, boot it up through the ESX hypervisor. The Sandbox VM will display its command prompt.
5. After initial startup, log in to the remote sandbox using the sbuser account with the default password sbuser. These changes should be performed through the VMware console.
6. Enter the following in the Sandbox command line through the VMware console:
./Setup
7. Follow the steps in the Setup script to perform initial configuration of the Sandbox VM.
Define the network configuration for the Sandbox;Set up a management port;Define a more secure password for the admin sbuser account.
By default, when you log in you are placed in the /sbuser folder.
When you finish running the Setup script, return to the administrative shell in the NetMRI instance.
8. In the NetMRI administrative shell, run the following command:
sandbox register
This establishes the Sandbox VM's network connectivity with NetMRI.
9. Enter the IP address just configured in Steps 7–8 for the Sandbox VM and press Enter. Setup is complete.
Note: In a NetMRI Operations Center environment with multiple VM-based NetMRI collectors running in hypervisors, you can download a single copy of the Sandbox VM from Infoblox and populate the OC and each of the collectors with a new Sandbox VM from that copy. In a "pure" VM Operations Center environment, in which the Operations Center and all Collectors are VMs, one remote sandbox must be deployed and configured for each Collector virtual appliance.
VMware Workstation InstallationTo install the Sandbox VM into a VMware Workstation hypervisor, do the following (these instruction may differ based on the VMware Workstation version):
Start VMware Workstation.Choose File –> Import or Export... The Import Virtual Appliance Wizard appears.Click Next and then click Next again in the wizard.Choose Virtual Appliance from the dropdown and click Next.Click on the File System radio button and click 'Browse...'.Select the .vmx file that was previously unpacked from the exported ZIP file, and click Open.Click Next and then click Next again in the wizard.

Infoblox NetMRI 7.4.4 Administrator Guide Part 4 Automation Change Manager Scripting and Job Management
Copyright ©2020, Infoblox, Inc. All rights reserved. Page 291
8.9.
10.11.12.13.
14.15.16.
•••
••
Choose Other Virtual Machine and click Next.Enter a name and location for the Virtual Machine and click Next.Click Next.Click Next again (the network must be bridged for the VM-based NetMRI Sandbox).Click Next.Verify that your settings are correct and click Finish.After 20-30 minutes (depending on your hardware and network speed), the NetMRI Sandbox Virtual Appliance will complete import to the VMware host.Select the NetMRI Sandbox Virtual Appliance you imported and instruct it to Power On.Open the console for the Sandbox VM.Enter the following in the Sandbox command line:
./Setup
17. Follow the steps in the Setup script to perform initial configuration of the Sandbox VM.
Defining the network configuration for the Sandbox;Setting up a management port;Define a more secure password for the admin sbuser account. (The default password is sbuser.)
By default, when you log in you are placed in the /sbuser folder.
When you finish running the Setup script, return to the shell in the NetMRI instance.
18. In the virtual NetMRI's administrative shell, run the following command:
sandbox register
As noted, this establishes the Sandbox VM's network connectivity with the NetMRI VM.
19. Enter the IP address just configured in Step 17 for the Sandbox VM and press Enter. Setup is complete.
Installing Custom Perl Modules
Note: The Administrative Shell's /Backup/Sandbox directory provides the common location through which the NetMRI file system and the Sandbox operating system share files. Data files placed on the common location are shared between the Sandbox and NetMRI using the Samba protocol.
Custom Perl script modules can be installed into the NetMRI sandbox environment for use by Perl scripts. This can be accomplished in a number of ways; recommended procedures include the following:
The standard Perl module installation: unpack the tarball, and run a sequence of make commands;Using the cpan command-line utility. (Note: a full discussion of cpan usage is beyond the scope of this document.)
To install a Perl module using standard Perl module installation procedures, do the following:Upload the Perl module in Tarball form to the sandbox environment by using SCP to send the file into the administrator shell's /Backup/Sandbox directory (below is an example):
scp SomePerlModule.tar.gz [email protected]:/Backup/Sandbox
In the administrative shell, the /Backup/Sandbox directory maps to the /mnt/host/data/userdata directory inside the sandbox. After the file has been successfully uploaded to the sandbox, login to the sandbox via the administrative shell.
sandbox login
Once inside the sandbox, use the standard Perl module installation procedure to install the Perl module located at/mnt/host/data/userdata. As an example:
cd /mnt/host/data/userdata
tar xzf SomePerlModule.tar.gz
make

Infoblox NetMRI 7.4.4 Administrator Guide Part 4 Automation Change Manager Scripting and Job Management
Copyright ©2020, Infoblox, Inc. All rights reserved. Page 292
•
•
make test
make install
To install a Perl module, log in to the sandbox using the sandbox login command from the administrative shell as noted above. You use the cpan command-line utility, which is part of the sandbox operating system, to install the desired Perl module. Explanation of the features and capabilities of the cpan utility is beyond the scope of this document; find more information by reading the man page inside the sandbox (run man cpan in the shell).
Installing Custom Python ModulesYou can run Python custom scripts under Python 3. To install custom Python modules, first install pip into the sandbox:
#wget https://bootstrap.pypa.io/3.4/get-pip.py
#python3 get-pip.py
After that, use the standard pip utility:
#pip install package_name
If there is no Internet connection on the sandbox, use SCP to send the file into the /Backup/Sandbox directory in the administrative shell:
scp get-pip.py [email protected]:/Backup/Sandbox
In the administrative shell, the /Backup/Sandbox directory maps to the /mnt/host/data/userdata directory inside the sandbox. After the file is successfully uploaded to the sandbox, log in to the sandbox via the administrative shell:
sandbox login
Once inside the sandbox, use the standard installation procedure to install the script or modules located at /mnt/host/data/userdata:
#cd /mnt/host/data/userdata
#python3 get-pip.py
#pip install package_name
Setting Job Execution CredentialsNetMRI admins can determine whether creators of configuration management jobs can self-approve their Perl/CCS script jobs, or require a NetMRI super admin to approve jobs execution. For a quick refresher on administrator accounts and the Roles they inhabit, see Understanding Users and Roles, as user accounts have a close relationship to job execution.You can define the minimum script run level at which the appliance requires user-provided CLI credentials when scheduling or running a job.
Note: Through job execution credentials, the user-provided CLI credentials are used to log in to the network devices that are part of the job (in lieu of the CLI credentials associated with the network devices at discovery).
NetMRI provides Configuration Management settings (under Settings icon –> General Settings –> Advanced Settings) to enforce organization policies for securely executing script jobs:
Job Self Approval — Controls the ability of the script creator to approve the jobs they create and execute in the appliance. This setting is global to all users and can be set to True or False;Job Requires User Credentials — Defines the global minimum script "risk level" at which user-provided CLI credentials are required to execute a script job. Risk levels are stated as None (the default), Low, Medium and High.
Correlation between NetMRI account types, their Roles and privileges, and script execution privileges is as follows:

Infoblox NetMRI 7.4.4 Administrator Guide Part 4 Automation Change Manager Scripting and Job Management
Copyright ©2020, Infoblox, Inc. All rights reserved. Page 293
•••
1.
2.
3.
Risk Level: None None means the user will never be asked to provide alternate CLI credentials and the CLI credentials associated with the network devices at discovery are used.
Risk Level: Low Corresponds to admin accounts using the Change Engineer:Low Role associated with Scripts:Author and Scripts:Level1 (low risk) privileges
Risk Level: Medium Corresponds to admin accounts using the Change Engineer:Medium Role associated with Scripts:Author, Scripts:Level1 (low risk) and Scripts:Level2 (medium risk) privileges
Risk Level: High Corresponds to admin accounts using the Change Engineer:High Role associated with Scripts:Author, Scripts:Level1 (low risk), Scripts:Level2 (medium risk) and Scripts, Level3 (high or unknown risk) privileges
Note: By default, execution privileges are set to None. If the Job Requires User Credentials advanced setting is changed from "None" to a higher setting, you must update scheduled jobs to take advantage of this feature.
If the Job Requires User Credentials run level is greater than or equal to the run level of the target script, the admin user scheduling and/or running the job is prompted to provide CLI credentials from the following options:
Use the requester's stored CLI credentials;Use the approver's stored CLI credentials;Manually specify new CLI credentials.
If the Job Requires User Credentials run level is less than the run level of the target script, the admin user scheduling and/or running the job is not prompted to provide CLI credentials; the job uses the CLI credentials associated with the network devices at Discovery.
Note: See Creating User Accounts for more information on setting up admins with properly defined user names, passwords and Enable passwords.
To set job approval settings for all NetMRI admin accounts, do the following:
On the Settings icon –> General Settings –> Advanced Settings page, under the Configuration Management category, click the Edit icon for Job Self Approval.To allow all user accounts to self-approve running automated jobs that use CCS and Perl scripts, choose True. Otherwise, choose False.Click OK to commit the setting.
To require NetMRI admin accounts to use CLI credentials when executing scripts of a specific risk level, do the following:
1. On the Settings icon –> General Settings –> Advanced Settings page, under the Configuration Management category, click the Edit icon for Job Requires User Credentials.
Scripting Well-Known Variables (Perl, Python, and CCS)$assurance = "99"; $community = "mysnmp"; $contextname = ""; $id = "21"; $ipaddress = "10.10.110.5"; $model = "871"; $name = "QAlabrtr11"; $syscontact = "QAEast's lab; Floor 2"; $sysdescr = "Cisco IOS Software, C870 Software (C870-ADVIPSERVICESK9-M), Version 12.3(8)YI2, RELEASE SOFTWARE (fc1)Synched to technology version 12.3(10.3)T2 Technical Support: http://

Infoblox NetMRI 7.4.4 Administrator Guide Part 4 Automation Change Manager Scripting and Job Management
Copyright ©2020, Infoblox, Inc. All rights reserved. Page 294
www.cisco.com/techsupport Copyright (c) 1986-2005 by Cisco Systems, Inc. Compil"; $syslocation = "QA lab right bottom soho router"; $sysname = "QAlabrtr11.example.com"; $type = "Router"; $vendor = "Cisco"; $version = "12.3(8)YI2";
Variables for Perl job support (Also available to CCS)$api_url = "http://192.168.1.1"; $device_id = "21"; $http_password = "adminpass"; $http_username = "admin"; $job_id = "197"; $script_login = "true";$script_timeout = "300";
Variables for Python job support api_url = "http://192.168.1.1"device_id = "21"http_password = "adminpass"http_username = "admin"job_id = "197"script_login = "true"script_timeout = "300"
Variables for Templates$NetMRI_ipaddress = "192.168.1.1";
Device Model Attributes$device_datasourceid = "0"; $device_deviceaddlinfo = ""; $device_deviceassurance = "99"; $device_deviceccscollection = "on"; $device_devicechangedcols = "DeviceRunningConfigLastChange,DeviceSavedConfigLastChange"; $device_devicecommunity = "mysnmp"; $device_deviceconfiglastchecked = "2011-03-28 13:07:49"; $device_deviceconfiglocked = "0"; $device_deviceconfiglocklastchange = ""; $device_deviceconfiglocklastchangeby = ""; $device_deviceconfigpolling = "on"; $device_deviceconfigtimestamp = "2011-03-17 11:01:15"; $device_devicecontextname = ""; $device_devicednsname = ""; $device_deviceendtime = ""; $device_devicefingerprint = "off"; $device_devicefirstoccurrence = "2011-03-10 11:58:27"; $device_deviceid = "21"; $device_deviceipdotted = "10.10.110.5"; $device_deviceipnumeric = "3691671045"; $device_devicelicensed = "1"; $device_devicemac = "00:15:C6:53:AB:07";

Infoblox NetMRI 7.4.4 Administrator Guide Part 4 Automation Change Manager Scripting and Job Management
Copyright ©2020, Infoblox, Inc. All rights reserved. Page 295
$device_devicemanagedind = "true"; $device_devicemodel = "871"; $device_devicename = "centlabrtr11"; $device_devicepolicyschedulemode = "change"; $device_deviceportscanning = "off"; $device_devicerank = "90"; $device_devicereboottime = "2010-07-20 11:14:39"; $device_devicerunningconfiglastchange = ""; $device_devicesaaversion = "2.2.0 Round Trip Time MIB"; $device_devicesavedconfiglastchange = "";$device_devicesnmpanalysis = "on"; $device_devicesnmppolling = "on"; $device_devicestandardscompliance = ""; $device_devicestarttime = "2011-03-28 13:31:32"; $device_devicesyscontact = "QAEast's lab; Floor 2"; $device_devicesysdescr = "Cisco IOS Software, C870 Software (C870-ADVIPSERVICESK9-M), Version 12.3(8)YI2, RELEASE SOFTWARE (fc1)Synched to technology version 12.3(10.3)T2 Technical Support: http://www.cisco.com/techsupport Copyright (c) 1986-2005 by Cisco Systems, Inc. Compil"; $device_devicesyslocation = "Central lab right bottom soho router"; $device_devicesysname = "centlabrtr11.example.com"; $device_devicetimestamp = "2011-03-28 13:31:32"; $device_devicetype = "Router"; $device_devicevendor = "Cisco"; $device_devicevendordefaultcollection = "off"; $device_deviceversion = "12.3(8)YI2"; $device_networkdeviceind = "true"; $device_routingind = "true"; $device_switchingind = "false"; $device_virtualind = "false";
Job Specification Model Attributes$job_specification_approved_by = "1";
$job_specification_approved_by_name = "admin";
$job_specification_approved_timestamp = "2011-03-28 13:35:18";
$job_specification_config_template_id = "";
$job_specification_created_at = "2011-03-28 13:35:19";
$job_specification_created_by = "admin";
$job_specification_description = "Run now job";
$job_specification_id = "181";
$job_specification_job_type = "script";
$job_specification_name = "Run Now [my script]";
$job_specification_schedule = "";
$job_specification_script_id = "64";
$job_specification_updated_at = "2011-03-28 13:35:19";

Infoblox NetMRI 7.4.4 Administrator Guide Part 5 Network Compliance
Copyright ©2020, Infoblox, Inc. All rights reserved. Page 296
•
•
•
•
•
Part 5 Network ComplianceThis section describes the key functionality for NetMRI's Policy Compliance feature set and the important Reporting feature. This section includes the following information about Policy Compliance and the creation of Policies:
Policy Design Center
The Policy Design Center also uses significant Reporting features, including ISO 27001 and PCI reports, which are described in the following:
Reports and Report Management
Compliance features also use the powerful Configuration Explorer feature set, which is described in the following:
Configuration Management
Policy Design CenterPolicies are used to verify network device configurations and to enforce consistency of configurations across the network. NetMRI can perform analysis when it detects device configuration changes, or on an ad hoc basis for past, present or future configuration files. Policies drive a key feature of NetMRI— called Policy Compliance.
A configuration Policy consists of one or more rules. Rules use different forms of XML-based regular expression pattern matching against configuration files — and tests of other data NetMRI has collected — to verify that the configuration of the device meets the rule(s). Each rule has a severity level, and can define a device filter to limit the types of devices to which it applies. You may freely re-use rules in different policies.
NetMRI provides a library containing numerous pre-packaged policies. As an example, DISA policies provide the top-level overview of the network's adherence to security and network infrastructure mandates from the Department of Defense. Because networks managed by NetMRI are normally enterprise or data center, Defense Information Systems Agency (DISA)-based Policy Compliance is advisory in nature; DISA guidelines provide a baseline framework for establishing a secure network. NetMRI bases many policies upon published DISA implementation guides. Other policy sets include the use of PCI 3.0 rules to help NetMRI users in commercial businesses to support a baseline of technical and operational security requirements for payment card transactions.
The main vehicle for creating and maintaining Policies is called the Policy Design Center.
Note: The Policy Design Center uses an XML Schema (XSD) to validate all rules before any rules are deployed and used for policy enforcement. This feature reduces chances of errors that lead to an "invalid" result for a rule evaluation. You can immediately download the schema XSD file by creating a new rule, choosing the Raw XML editor, and clicking Download XML Schema. You can also select any admin-defined XML rule from the left pane of the Config Management –> Policy Design Center –> Rules page, clicking the Edit button and then clicking Download XML Schema.
How Policies WorkPolicies are defined in the Policy Design Center, then deployed against specific device groups. As NetMRI collects configuration files, SNMP data and other data from devices, it validates through policies deployed against devices for which configuration changes are detected.
Results of policy-based analysis are listed in the Network Analysis –> Policy Compliance tab.
Policy analysis results are also available in two reports:
The Policy Compliance Summary report provides an overview of the compliance status for all policies and the network devices against which they are deployed.The Policy Compliance Details report lists all policies and policy rules, with the devices passing and failing, and the specific reasons for policy violations.

Infoblox NetMRI 7.4.4 Administrator Guide Part 5 Network Compliance
Copyright ©2020, Infoblox, Inc. All rights reserved. Page 297
•
•
•
•
•
•
1.2.
3.4.
Note: Although only the last running configuration collected from each network device is analyzed during routine policy checks, you can perform an ad hoc analysis of any archived configuration file (or even a future configuration file) for a device by using the test function at Config Management –> Policy Design Center side tab –> Policies.
When a configuration policy violation is detected during routine policy checks, an issue unique to that policy is generated. This issue lists all the devices that experienced policy failures, and provides hyperlinks to open the Device Viewer for individual devices. The Config Files section in the Device Viewer will help you determine which configuration files are causing the failures.
Policies TerminologyA configuration command is any line found in a device configuration file. Such commands comply with the syntax supported by the specific operating system version found in each device.A config file match is a logical test that can be performed on a device's configuration file and/or other collected device data. NetMRI provides several mechanisms for defining config file matches, as described in the following sections. A config file match may include a device filter to limit the devices to which the rule applies. A rule can be included in multiple policies.A rule consists of one or more configuration file command matches and/or device attribute checks. Policy rules provide significant capabilities, including searching of data tables (called lists when referred to by policy rules), which allows tighter integration of Perl and CCS scripts with policies.A policy consists of one or more rules. A policy may include a device filter to limit the devices to which the policy applies.A device filter specifies the devices to which a rule or policy applies. A filter can include one or more config file matches and or one or more device attribute checks. When a device's configuration is being analyzed, criteria in the device filter determine whether the policy should be enforced for that device. If the device matches the criteria, the configuration are verified against the rule or policy. Otherwise, the system performs no analysis for that device against the rule or policy.Policy deployment associates policies with device groups. Once deployed, a policy is checked for a device whenever a change is detected in that device's configuration. Deployed policies are checked for each applicable device at least one per day, even if no changes are detected for the device.
A General Approach to Policy DevelopmentDeveloping Policies is straightforward. In the Config Management –> Policy Design Center tab, you can take the following broad steps to create and use Policies:
In the Rules tab, create rules and assign device filters. You can also test rules in this tab.In the Policies tab, create the policy by selecting rules and assigning device filters. You can also test the policy in this tab.In the Policy Deployment tab, choose the device groups to run the policy against.After NetMRI performs the analysis, you can view the results in the Network Analysis –> Policy Compliance tab. After a policy is deployed it will take five to ten minutes to begin seeing results in this tab. You can also review results in the Policy Compliance Summary and Policy Compliance Details reports.
The following sections describe further details about policy development.
Built-In PoliciesNetMRI provides a set of sample policies for developing new policies based on organization, industry or government best practice guidelines or from local expertise. In all cases, you can refine the templates to suit your deployment.
The sample policies are read-only. This prevents any changes you make from being lost when Infoblox releases newer policy versions. Before making changes, copy policies or rules using the Copy button, then modify the copy. When you copy a policy, it still references the same rules as the original policy (copying a policy doesn't copy the rules it references). This allows you to copy the policy, then change only those rules that require them, or add new ones.

Infoblox NetMRI 7.4.4 Administrator Guide Part 5 Network Compliance
Copyright ©2020, Infoblox, Inc. All rights reserved. Page 298
•
•
•
•
Rule EditorsIf you wish to create custom rules, you can use different methods of editing to create them. You can use graphical blocks of rule logic to perform mixing-and-matching of rule components, or define rules through a full XML code editor backed by a dedicated XML schema. All rules are based on defining the device configuration strings, or entire sections of device configurations, that the rule will match against to perform policy operations.
Four rule editors are provided in the Rules tab:
Simple Rule Editor enables you to define a configuration file based rule by specifying certain configuration file lines that MUST be present, and by specifying other lines that MAY NOT be present. Several options define how the lines are processed. Normally, each line entered in this editor is considered to be a regular expression that is matched against the configuration file. If you select one of the BLOCK options, the entire contents of the text box are considered a single regular expression. (For more information, see Using the Simple Rule Editor .)CPD Editor enables you to specify rules in the legacy NetMRI CPD format. (For more information, see Using the CPD Editor . This editor is provided for compatibility with older releases; Infoblox recommends using other editor types.) For better performance and more understandable logic, use the ConfigBlockCheck element in the Raw XML editor in preference to the CPD editor. For more information, see Using Configuration Block Checks .Rule Logic Builder enables you to define individual logical tests, then combine them with AND, OR, parentheses and IF-THEN-ELSE logic. (For more information, see Using the Rule Logic Builder .)Raw XML Editor allows modification of a rule's XML representation. When the user saves a new rule in the Raw XML Editor, the XML schema for the policy engine validates the rule, and highlights any problems in the rule when the user attempts to save their work. The XML Editor is the most powerful rule creation tool but also the most technically demanding. (For more information, see Using the Raw XML Editor .)
Note: All four editors are available only for creating new policy rules or editing rules you previously created.
Once you save a new rule, and it was not created in the Raw XML Editor, you can change the rule's editor to the Raw XML Editor. If you create a rule from, for example, the Rule Logic Builder, will see the XML generated by the previous rule editor when you open it in the Raw XML editor. The reverse is not true: If you create a new rule in the Raw XML Editor, and decide to open it in another editor type, the results will not be the same and changes will be lost, because XML code is likely to differ from the output of the other editor types.
You can gain a better understanding of how to formulate rules by examining the example rules included with your appliance.
Using the Raw XML EditorThe Raw XML editor enables creation of more sophisticated Rule logic than is possible through other Editor types such as the Simple Rule Editor.Effective use of the Raw XML editor requires some basic programming knowledge, particularly for the XML language. You write Raw XML rules in a procedural programming language dubbed ScriptXML. In Script XML, all Raw XML policy rules consist of an XML tree with a root <PolicyRuleLogic> element:
<PolicyRuleLogic editor='raw-xml'> <next_element.../>
Several examples are given in the sections Using List Searches and Using Configuration Block Checks .The root PolicyRuleLogic element is considered a statement block, with all of its child elements representing statements. Each statement has a result value; the result value of the PolicyRuleLogic statement block is either the value of an executed Return statement, or the value of the last executed statement in the block.The value returned by a root PolicyRuleLogic element must be either a <PolicyRulePass> or <PolicyRuleFail>element. These are the two possible values output by any policy rule.Raw XML rules are primarily used for configuration file checks, and can contain numerous elements such as complex regular expressions, objects, variables and flow control directives. We describe all of these elements in this section.An example listed below shows the basic <PolicyRuleLogic> element in a definition that will always match:

Infoblox NetMRI 7.4.4 Administrator Guide Part 5 Network Compliance
Copyright ©2020, Infoblox, Inc. All rights reserved. Page 299
•
•
•
•
•
<PolicyRuleLogic editor='raw-xml'> <PolicyRulePass/> </PolicyRuleLogic>
A second <PolicyRuleLogic> element example matches all devices named "foo:
<PolicyRuleLogic editor='raw-xml'> <If> <Expr op='=='> <Expr field='DeviceName'/> <Expr value='foo'/> </Expr> <Then> <PolicyRulePass/> </Then> <Else> <PolicyRuleFail/> </Else> </If> </PolicyRuleLogic>
Note the use of subordinate elements <if>-<then>-<else> and <Expr op>.
Note: Several elements are defined as expression types, including <ConfigBlockCheck>, <ListSearch>, <Expr>, <ConfigFileCheck> and <CPDCheck>.
Note: If a global variable _message is set at the time of a PolicyRulePass or PolicyRuleFail that does not define a message, then that value will be used as the rule message.
Policy Rule XML CapabilitiesYou can perform the following operations and use the following features in policy rules:
Searches within Lists (defined in the Configuration Management –> Job Management –> Lists page) of comma-delimited values to enforce consistency and reduce the number of rules needed to perform similar tasks. Enables better integration of scripts and policies (for an example, see Using List Searches );Calling a Policy Rule from within another Rule –The new PolicyRuleCall element may be used to call one rule from within another. This enables improved re-use of rule logic, and works something like a function call. The caller may override the severity of the called rule;Configuration block checks – supplements or replaces the CPD functionality used in the CPD editor. It allows you to break a configuration file into blocks, and then perform analysis on each of those blocks. These may be nested as desired by the administrator writing the rule. For more information, see Using Configuration Block Checks ;Use expressions to perform logical and mathematical operations, and for reading variables. You use the Expr element to perform these and other actions (for more information, see Regular Expressions in Policy Rules and the section Using the Expression <Expr> Element );Support for arrays. Array indices begin at Zero. In XML rules, the Expr element can use the following operators to work with arrays:
array Convert child expressions into an array.
element-at Return the element at a specific array index.

Infoblox NetMRI 7.4.4 Administrator Guide Part 5 Network Compliance
Copyright ©2020, Infoblox, Inc. All rights reserved. Page 300
••
•
•
push Add one or more elements to the end of an array.
pop Remove and return the last element of an array.
unshift Add one or more elements to the beginning of an array.
shift Remove and return the element at the beginning of an array.
join Convert an array to a delimited string.
size Return the size of an array.
delete-at Remove an element at a location in the array, moving later elements inward. Returns the removed element.
insert-at Insert an element at a specified location in the array, moving later elements outward.
assign-at Sets the value of an element in a specified location in the array, overwriting the existing element.
in Determine if an array contains a specific value.
not-in Determine if an array does not contain a specific value.
Looping. The Raw XML Editor supports two types of looping, including:ForEach, which loops through an array, executing the Do code block once in each array element until the condition is met. It takes the form:
<ForEach> expression <Do> statements ... </Do> </ForEach>
While, which loops until a condition is met. It takes the form:
<While> expression <Do> statements ... </Do> </While>
A new Map element enables a transformation of all elements in an array, by executing a block of statements for each element in the array, returning a rewritten array as the result. It takes the form:
<Map> expression <Do>

Infoblox NetMRI 7.4.4 Administrator Guide Part 5 Network Compliance
Copyright ©2020, Infoblox, Inc. All rights reserved. Page 301
statements ... </Do> </Map>
The expression is evaluated as an array; for each element, a variable (using the default name _map_value) is automatically set and the rule executes the Do code block.Map and ForEach differ because the return value of ForEach is the value of the last executed statement in the Do block; the return value of the Map element is an array, with each entry being the return value of the Do block for the corresponding entry in the input array. For example, the following code block produces a variable called newarray that contains the values 1, 2, 3, and 4:
<Map output="newarray"> <Expr op="array"> <Expr value="0"/> <Expr value="1"/> <Expr value="2"/> <Expr value="3"/> </Expr> <Do> <Expr op="+"> <Expr variable="_map_value"/> <Expr value="1"/> </Expr> </Do> </Map>
An example of this type can be useful in combination with methods accessible on an object. The following code block produces an array of interface names:
<Map output="interface_names"> <Expr field="interfaces"/> <Do> <Expr object="_map_value" field="ifName"/> </Do> </Map>
Using List SearchesYou can search for values in a NetMRI list from inside a policy rule. This allows better integration of policies and scripting (for more information, see Job Scripting ). Using this feature, you can also manage a single list and avoid using large collections of similar rules.A basic list search appears as:
<ListSearch list-name="list-name" search-columns="search1, search2, ..." result-columns="result1,result2, ..." > expression for search1 expression for search2 ... expression for searchX </ListSearch>
List-name is the name of the list shown on the Configuration Management –> Job Management –> Lists page; search1, search2,... is a comma-delimited list of column names to search; result1, result2,... is a comma-delimited list of result columns to retrieve. (If any column names contain commas, you may use a delimiter attribute to change the comma to another character.)The rule evaluates each expression, and matches them with the search columns, in the defined order. Then, the rule creates variables, names them for the result columns and sets them to contain the values found in those columns. By default, the rule returns the first matching row; instead, you may use the result-mode attribute (set to all) to retrieve all matching rows. In that case, the variables will contain arrays of the values, with one entry per row.Consider a policy in which device names must begin with a three-letter site code followed by a hyphen "-" character.

Infoblox NetMRI 7.4.4 Administrator Guide Part 5 Network Compliance
Copyright ©2020, Infoblox, Inc. All rights reserved. Page 302
In NetMRI, you define a list titled Site Details with two columns: 'Site Code' and 'Location.' A sample list could appear as follows:
Site Code Location
dca Washington, DC
iad Herndon, VA
sjc San Jose, CA
The following rule is defined in the Raw XML Editor. The rule parses the site code from the device name, and the rule uses it to look up the ‘Location.’ The rule then uses it to check that the SNMP location ends with that city name:
<PolicyRuleLogic editor="raw-xml"
xmlns="http://www.infoblox.com/NetworkAutomation/1.0/ScriptXml">
<If>
<Expr op="matches">
<Expr field="DeviceName"/>
<Expr value="^([a-z]{3})-"/>
<!--This is the regex used to match against the Device Name field --!>
</Expr>
<Then>
<!--
The device name appears to be the correct format, so we look up the location via the parsed site code. Here, we rely on the fact that the return value of the ListSearch is the count of the matching rows, and that 0 is considered false.
We evaluate the ListSearch first; if no result is returned, the ConfigFileCheck will not execute due to the short-circuiting of the boolean expression (Expr). If a result is returned, the ListSearch call will set a variable named "Location" containing the result of the first match to "Site Code".
Then, we do a ConfigFileCheck to see if the config file contains exactly one line that starts with "snmp-server location" and ends with the location. To do this, we construct a result expression using the Location variable.
We can construct a more descriptive message for the PolicyRuleFail, that includes the current site code and location, as well as the intended location, but did not for simplicity here.
-->
<If>
<Expr op="and">
<ListSearch list-name="Site Details" search-columns="Site Code" result-columns="Location">
<Expr variable="_match_1"/>
</ListSearch>

Infoblox NetMRI 7.4.4 Administrator Guide Part 5 Network Compliance
Copyright ©2020, Infoblox, Inc. All rights reserved. Page 303
<ConfigFileCheck op="contains-one">
<Expr op="concat"><Expr value="^snmp-server location .*"/>
<Expr variable="Location"/></Expr>
</ConfigFileCheck>
</Expr>
<Then><PolicyRulePass/></Then>
<Else><PolicyRuleFail>The incorrect location, or none at all, is
configured.</PolicyRuleFail>
</Else>
</If>
</Then>
<Else>
<!--
The device name did not match the correct format, so fail the rule.
-->
<PolicyRuleFail>The device name does not begin with a three-letter site code.
</PolicyRuleFail>
</Else>
</If>
</PolicyRuleLogic>
Configuration File Check ElementsRaw XML rules can use method calls running_config_text and saved_config_text to directly analyze configuration files. They may also use the same constructs used by the Simple Rule and CPD Rule editors (the <ConfigFileCheck> and <CPDCheck> elements, respectively).<ConfigFileCheck> and <CPDCheck> elements also count as "expressions." They may be used anywhere an <Expr>element can be used. These elements can validate running configuration files and saved configuration files.
<ConfigFileCheck>
Contents of this element will be treated as one or more regular expressions, and validated against the configuration file. When a match is found, the variables "_message" and "_lineno" will be set, appropriate to the type of check being performed.The ConfigFileCheck element supports the following attributes:

Infoblox NetMRI 7.4.4 Administrator Guide Part 5 Network Compliance
Copyright ©2020, Infoblox, Inc. All rights reserved. Page 304
•
•
•
•
•
•
•
•
Attribute Description
object The name of a variable holding the device object to check. Generally this may be omitted, because the current object is known as part of the context.
regexp_mode Advanced or Basic. The default is Advanced mode. In basic mode, each line is simply treated as a complete regular expression. In advanced mode, if any line starts with '/', that line will be interpreted as /regex/options. That is, you must have an ending /, and can include regular expression options (zero or more of m, x, i) after the ending /. Lines not starting with / will behave the same as basic mode.
op Defines the type of config file check to perform. The contents (text node) of the <ConfigFileSearch>element will be interpreted depending upon the operator: Single-Line Operations – For these operators, the contents of the element will be split, and each line will be treated as a separate regular expression:
contains-one: the configuration file must contain exactly one line matching any of the regular expressions;contains-some: the configuration file must contain at least one line matching one or more of the regular expressions;contains-all: the configuration file must contain at least one line matching each of the regular expressions;contains-all-ordered: the configuration file must contain at least one line matching each of the regular expressions, in the same order as the regular expressions are listed;does-not-contain-any: the configuration file must contain no lines matching any of the regular expressions.
Block Operations – For these operators, the entire contents of the ConfigFileCheck are treated as a single multi-line regular expression:
contains-one-block: the configuration file must contain exactly one block matching the regular expression;contains-block: the configuration file must contain at least one block matching the regular expression;does-not-contain-block: the configuration file must contain no matches for the regular expressions.
Configuration Policy Definition Checks (<CPDCheck>)
Statements encapsulated in the <CPDCheck> element are treated by the RAW XML Editor as a simple configuration policy definition (CPD).Definition of CPDs is discussed further in the topic Using the CPD Editor .
Using Configuration Block ChecksConfiguration block checks allow you to specify sections of configuration files to perform matches against. A basic ConfigBlockCheck XML object looks like the following:
<ConfigBlockCheck boundary-method="boundary-method" block-start="regular expression" method-specific attributes> <statements...> </ConfigBlockCheck>
A configuration block always starts based upon a regular expression. Examples appear in the following subsections.Configuration block checks also support four different boundary-method values, each of which provides a mechanism to determine the end of the block. Some methods are simpler than others and have specific limitations. Two additional

Infoblox NetMRI 7.4.4 Administrator Guide Part 5 Network Compliance
Copyright ©2020, Infoblox, Inc. All rights reserved. Page 305
options (end-on-block-start and end-on-eof) apply to all four methods.Some additional attributes are used to work with configuration block check routines, including the following:
end-on-block-start Used for regular expression-based configuration block checks; set to true by default; prevents overrunning the intended end of a configuration block. May apply to any of the four boundary methods.
end-on-eof Defines the end of a block evaluation to occur at the end of a config file. May apply to any of the four boundary methods.
block-end Used with a regular expression, defines the end of a configuration block. Applies to the regexp boundary method.
indent-chars Define characters that will considered indentation characters. Applies to the indent boundary type.
open-delim The initial delimiter character for the desired configuration block boundary, such as "{". Applies to the balanced-delimiters boundary type.
close-delim The closing delimiter character for the desired configuration block boundary, such as "}". Applies to the balanced-delimiters boundary type.
line-count Define the number of lines in a block of code that comprises the boundary. Applies to the line count boundary type.
The four boundary-method types, which are used to determine the boundaries for a configuration block to check against, are described in the following subsections.
Boundary Type: Regular Expression (regexp) method
With this method, you specify another regular expression that is used to identify the end of the block, via the block-endattribute. An example of text from a configuration file:
line con 0 exec-timeout 60 0
line vty 0 4 access-class 155 in exec-timeout 15 0
authorization commands 15 AUTHO
accounting commands 15 ACCOU_TACACS
logging synchronous login authentication AUTHE_TACACS
line vty 5 15 access-class 155 in exec-timeout 15 0 authorization commands 15 AUTHO
accounting commands 15 ACCOU_TACACS
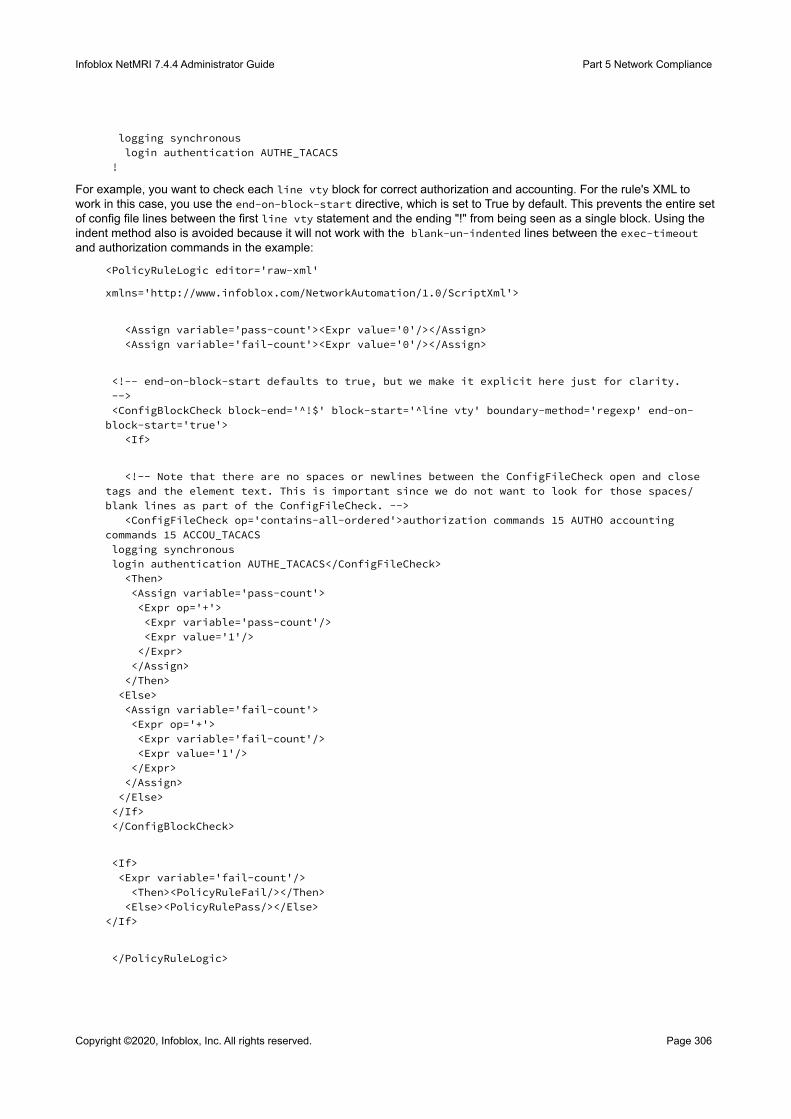
Infoblox NetMRI 7.4.4 Administrator Guide Part 5 Network Compliance
Copyright ©2020, Infoblox, Inc. All rights reserved. Page 306
logging synchronous login authentication AUTHE_TACACS !
For example, you want to check each line vty block for correct authorization and accounting. For the rule's XML to work in this case, you use the end-on-block-start directive, which is set to True by default. This prevents the entire set of config file lines between the first line vty statement and the ending "!" from being seen as a single block. Using the indent method also is avoided because it will not work with the blank-un-indented lines between the exec-timeoutand authorization commands in the example:
<PolicyRuleLogic editor='raw-xml'
xmlns='http://www.infoblox.com/NetworkAutomation/1.0/ScriptXml'>
<Assign variable='pass-count'><Expr value='0'/></Assign> <Assign variable='fail-count'><Expr value='0'/></Assign>
<!-- end-on-block-start defaults to true, but we make it explicit here just for clarity. --> <ConfigBlockCheck block-end='^!$' block-start='^line vty' boundary-method='regexp' end-on-block-start='true'> <If>
<!-- Note that there are no spaces or newlines between the ConfigFileCheck open and close tags and the element text. This is important since we do not want to look for those spaces/blank lines as part of the ConfigFileCheck. --> <ConfigFileCheck op='contains-all-ordered'>authorization commands 15 AUTHO accounting commands 15 ACCOU_TACACS logging synchronous login authentication AUTHE_TACACS</ConfigFileCheck> <Then> <Assign variable='pass-count'> <Expr op='+'> <Expr variable='pass-count'/> <Expr value='1'/> </Expr> </Assign> </Then> <Else> <Assign variable='fail-count'> <Expr op='+'> <Expr variable='fail-count'/> <Expr value='1'/> </Expr> </Assign> </Else> </If> </ConfigBlockCheck>
<If> <Expr variable='fail-count'/> <Then><PolicyRuleFail/></Then> <Else><PolicyRulePass/></Else> </If>
</PolicyRuleLogic>

Infoblox NetMRI 7.4.4 Administrator Guide Part 5 Network Compliance
Copyright ©2020, Infoblox, Inc. All rights reserved. Page 307
Boundary Type: Indent method
With this straightforward method, a config block is considered ended when the indent level falls to the same indentation level as the starting line of the config block. By default, spaces and tabs are considered indent characters; you may change that by using the indent-chars attribute. An example of text from a configuration file:
... vrf definition green
rd 100:1 route-target export 100:1 route-target import 100:1 ! address-family ipv4 exit-address-family ! vrf definition shared
rd 66:1 ! address-family ipv4
exit-address-family !
The following ConfigCheckBlock statement results in the specified statements being executed once for each vrf-definition block:
<ConfigBlockCheck boundary-method="indent" block-start="^vrf definition"> statements </ConfigBlockCheck>
See a later subsection, Configuration Block Check Nesting , for another example using this same configuration.
Boundary Type: Balanced Delimiters method
This boundary method determines the block end when a balanced closing delimiter character is found (for example, "{" and "}"). You specify open-delim and close-delim attributes in the XML rule, along with the regular expression to specify the string match. A sample section from a configuration file:
interfaces { ge-0/0/0 { description "TO P-C3750 Router G0/5";
vlan-tagging; unit 0 { vlan-id 120;
family inet { address 54.10.30.1/29; } } } ge-0/0/1 { description "TO CE1-2 Router G0/1";
unit 0 { family inet { address 88.125.40.1/30; } } } vlan {

Infoblox NetMRI 7.4.4 Administrator Guide Part 5 Network Compliance
Copyright ©2020, Infoblox, Inc. All rights reserved. Page 308
unit 0 { family inet { address 192.168.1.1/24; } } }
An associated ConfigBlockCheck could read as follows:
<ConfigBlockCheck boundary-method="balanced-delimiters" open-delim="{" close-delim="}" block-start="\s*ge-.*"> statements </ConfigBlockCheck>
The configuration block check executes against all instances for Gigabit Ethernet blocks ("\s*ge-.*").
Boundary Type: Line Count method
This boundary method simply specifies the number of lines that must be in the block. The result is a configuration block ending by finding the correct number of lines, and not from the start of the next block or an EOF. A line_count variable contains the value for the number of lines in the resulting block. Though the line count method may not be commonly used to break a config file into blocks, one possible use is to iterate through individual lines matching an expression, setting the appropriate block-start and using a line-count of 1. A sample section from a configuration file:
interface fc2/1
interface fc2/4
interface fc2/5
interface fc2/6 logging server 172.23.27.156 logging server 10.120.25.197 logging server 172.23.27.146
no logging monitor
The following will cause the statements to be executed once per "logging server" line:
<ConfigBlockCheck boundary-method="line-count" block-start="^logging server" line-count="1"> statements </ConfigBlockCheck>
Configuration Block Check Nesting
Configuration block checks support nesting. The ConfigBlockCheck has children statements, which include the possibility of other ConfigBlockCheck elements. Looking at the previous example of configuration text for the indentboundary method (see Boundary Type: Indent method), you can extend the example to process the "address-family" blocks within each VRF:
<ConfigBlockCheck boundary-method="indent" block-start="^vrf definition">
<!-- Figure out which RD this is -->
<Expr op="matches"><Expr variable="_block"/><Expr value="^\s*rd (.*)"/></Expr>
<Assign variable="rd"><Expr variable="_match_1"/></Assign>
<!--Here is the nested block check --!>
<ConfigBlockCheck boundary-method="regexp" block-start="^\s*address-family
(ipv[46])" block-end="^\s*exit-address-family">
<!-- statements that may do something (say, a list lookup), based on RD and address

Infoblox NetMRI 7.4.4 Administrator Guide Part 5 Network Compliance
Copyright ©2020, Infoblox, Inc. All rights reserved. Page 309
family IP version -->
</ConfigBlockCheck>
<!-- note that the _block variable is scoped - so at this point it is back to the "vrf
definition" block, even though within the ConfigBlockCheck statement above, _block
referred to the address-family block -->
</ConfigBlockCheck>
Using the Expression <Expr> ElementYou use an <Expr> element to define expressions when performing logical tests or assignments. If you use no attribute for the <Expr> element, the text string contents of the element are used as the value. Thus, the two following expressions are equivalent:
<Expr value="foo"/> <Expr>foo</Expr>
An <Expr> element may contain other expressions, and may represent its value as a constant, field lookup, or another operation. If no attributes are defined, the <Expr> contents (the element text) will be used as a String. An example appears in the section Expression Attributes and Matching.The <Expr> tag may have the following attributes.

Infoblox NetMRI 7.4.4 Administrator Guide Part 5 Network Compliance
Copyright ©2020, Infoblox, Inc. All rights reserved. Page 310
<Expr> Attribute Description
expression= Used for shorthand boolean expressions, has always been available for SetFilter and PolicyRuleLogic elements. The functionality also extends to the Expr element:
<Expr op="or"> <Expr op="and"> <Expr variable="foo"/> <Expr variable="bar"/> </Expr> <Expr op="and"> <Expr variable="x"/> <Expr variable="y"/> </Expr> </Expr> can now be written more succinctly as: <Expr expression="(1 and 2) or (3 and 4)"> <Expr label="1" variable="foo"/> <Expr label="2" variable="bar"/> <Expr label="3" variable="x"/> <Expr label="4" variable="y"/> </Expr>
type= Explicitly sets the return type of the expression. Possible values can be stated as the following:
bool, boolean (as in type="bool")
int, integer, number (as in type="int", type="integer")
float, double, decimal (as in type="double")
datetime (as in type="datetime")
ip (as in type="ip")
nil, null
To create a nil expression, use type="nil" or type="null" (which are equivalent).
value= Used to set the <Expr> value to a constant. When using this, it may be necessary to specify the type= attribute as well. For example, if the value is 'true', by default the value matches the String 'true'. In this example, to represent the actual Boolean true, you must specify the type as 'bool'.
object= The name of a variable holding an object to treat as the current object during evaluation of this expression. Generally this may be omitted as the current object is known as part of the context.
field= The name of an object attribute or instance method of the current object, such as a data field (device="Switch-Router") in NetMRI. You may chain these calls arbitrarily. For this example, the call would be field="device".

Infoblox NetMRI 7.4.4 Administrator Guide Part 5 Network Compliance
Copyright ©2020, Infoblox, Inc. All rights reserved. Page 311
<Expr> Attribute Description
method= The name of a method to call on the current object. The arguments to the method will include the values of any attribute types other than 'object', 'method', 'output' (these three types are omitted) in their defined order, followed by the values of any sub-expressions, in their listed order. Note that there are very few methods currently available that require parameters. Example:
<PolicyRuleLogic editor='raw-xml'> <Assign variable='parent'><Expr method='parent_device'/> </Assign> <If> <Expr op='=='> <Expr object='parent' field='DeviceModel'/> <Expr value='N7Kc7010'/> </Expr> <Then><PolicyRulePass/></Then> <Else><PolicyRuleFail/></Else> </If> </PolicyRuleLogic>
No parameters are returned to the <parent_device> method, which is used to match if and only if the device checked is a Nexus 7K switch-router.
variable= Allows the value of a regular expression to be the value of a named variable.
output= In previous releases, the output attribute was available in the SetFilter element to define the variable in which to store the resulting array; it is now available for all ScriptXML elements.
<Assign variable="foo"><Expr value="bar"/></Assign>
may now be written as
<Expr value="bar" output="foo"/>
Infoblox NetMRI 7.4.4 Administrator Guide Part 5 Network Compliance
Copyright ©2020, Infoblox, Inc. All rights reserved. Page 312
••••
•
•••
••••
•
•
••
•
•
•
<Expr> Attribute Description
op= Defines an Operator, that converts sub-expressions into a value. When comparing to objects of dissimilar type, the second object will be converted to the same type as the first object before comparison. Operator types include:
Logical Ands (and, &&),Logical ORs (or and ||), and not;Math operators (+, -, * and /);Comparison operators: equality (=, ==, eq), inequality of two sub-expressions (!=, <>, ne), numeric or case-sensitive Greater Than (>), numeric or case-sensitive Less Than (<), numeric or case-sensitive Greater Than or Equal to (>=), numeric or case-sensitive Less Than or Equal to(<).String operators (concat, contains, does-not-contain, matches, does-not-match): respectively, concatenation of strings; string containment (true if the second expression is contained within the first) or non-containment (true if the second expression is not contained within the first); a match or non-match between two sub-expressions. For the final four, the second expression of the comparison should be the regular expression.
For any operators using < or >, you may have to write them as < and > in the Raw XML Editor. Additional operators include the following:
~ (tilde) or bnot – Bitwise NOT (i.e. complement)& or band – Bitwise AND | or bor – Bitwise OR
^ or bxor – Bitwise XOR<< or lshift – Left shift>> or rshift – Right shift** – Modulus
op= (continued) Other operators include the following:
defined= Positive match if the current object is not nil, and all of the listed attributes or instance methods are not nil;in= An example: should the first expression be a field that returns an IP address, or is explicitly given type 'ip', then the second operator will be treated as a CIDR range, and this operator will return true if the IP is in the CIDR;not-in= The logical NOT of an operator;in-group= Positive match if the current object matches the group criteria of at least one group (device group, interface group) whose name is returned by any sub-expression;not-in-group= Positive match if the current object matches no group listed as a sub-expression.All applicable array operators may also be used (for more information, see Policy Rule XML Capabilities .
Note: Divisions by zero will result in an exception and an invalid Rule state. Previous releases returned a value of zero, which could lead to unintended consequences in rules.
Expression Attributes and MatchingTwo types of Raw XML Editor elements may have an "Expression" attribute:
PolicyRuleLogic

Infoblox NetMRI 7.4.4 Administrator Guide Part 5 Network Compliance
Copyright ©2020, Infoblox, Inc. All rights reserved. Page 313
• SetFilter
An expression attribute is a shorthand method of creating complex Boolean expressions based upon other elements. An expression attribute may consist of integers, parentheses, 'and', 'or', 'if', 'then', and 'else'. The numbers should refer to direct child elements, that in turn must include label attributes matching the numbers. For example, the following <PolicyRuleLogic> element shows three child elements 1, 2 and 3:
<PolicyRuleLogic expression='(1 and 2) or 3'> <Expr label='1' field='RoutingInd'/> <Expr label='2' field='SwitchingInd'/> <Expr label='3' op='='> <Expr field='DeviceType'/> <Expr value='Switch-Router'/> </Expr> </PolicyRuleLogic>
will pass any Device that has either both its RoutingInd AND SwitchingInd set to true (note the logical AND), or has a DeviceType of 'Switch-Router'. For <PolicyRuleLogic> elements, any device matching the criteria passes the rule, and devices that do not match it will fail the rule.
Variables UsageIn the Raw XML Editor, use the <Assign variable> element to define and set variables. This statement defines a new variable, if it is not already defined, and assigns the value, in the first child expression, to the variable. The primary supported attribute is 'variable' which names the variable to be assigned the value. Examples:
<PolicyRuleLogic editor='raw-xml'> <Assign variable='access-list'><Expr variable='_match_1'/></Assign> <Assign variable='access-class'><Expr op='concat'><Expr value='access-list '/><Expr variable='access-list'/></Expr></Assign> ...
You may define variables with a local scope. In the Assign element, specifying scope of parent sets the scoped variable to the parent of the Assign. This means all descendants of that element will read that variable instead of variables of the same name, that are defined at a higher scope. You may explicitly set a global variable with a scope of root. By default, (without a specified scope, or the scope specified to resolve), an assignment moves up the XML tree and sets the first variable it finds that has the specified name, creating one at the root level if none is found.
Note: When using the output attribute on elements, the scope is always equivalent to resolve.
Match Variable Arrays
To complement existing _match_* variables that are set for regular expression matches, an array _match_array is set that contains the values of numbered match variables. This enables more dynamic scripting.
Flow Control with If-Then-ElseYou use <If> elements to make logical branching decisions. It must have an <Expr> element for the conditional, followed by a <Then> element (which is statement block), and optionally by an arbitrary number of <ElseIf> statements and an <Else> statement.
<If> <Expr op='=='> <Expr field='parent_device.DeviceModel'/> <Expr value='N7Kc7010'/> </Expr> <Then><PolicyRulePass/></Then>

Infoblox NetMRI 7.4.4 Administrator Guide Part 5 Network Compliance
Copyright ©2020, Infoblox, Inc. All rights reserved. Page 314
<Else><PolicyRuleFail/></Else> </If>
In this example, the <Then> and <Else> elements are simple statement blocks, with no supported attributes. ElseIfelements should have an <Expr> for the conditional, followed by a <Then> statement block.
Objects UsageAs described, each statement results in a value. The object type affects the results of various operations. For example, dividing an integer by another integer always results in an integer, whereas dividing a floating-point number by an integer will result in a floating-point number.Some statements operate on the current object, including <PolicyRuleLogic>, <SetFilter>, <Expr> with a field attribute, <Expr> with in-group, not-in-group, and defined operators, and all the Config Check elements. In the case of the <PolicyRuleLogic>, the "current object" is the device against which the policy rule is evaluated.Object fields and methods are described in the API documentation, which may be found in the user interface in Tools –> Network –> API Documentation. The current object at the time of policy rule evaluation will always be an InfraDevice. In the API documentation, go to the API List link, scroll down to the Device section, and click Infrastructure Devices. On the page that results, click the InfraDevice link under Model.It is possible to change the current object for a statement, by setting the 'object' attribute to the name of a variable containing the new current object. This will apply only for that element. For example, this checks if the parent_device of the current device is a Nexus 7k:
<PolicyRuleLogic editor='raw-xml'> <Assign variable='parent'><Expr method='parent_device'/></Assign> <If> <Expr op='=='> <Expr object='parent' field='DeviceModel'/> <Expr value='N7Kc7010'/> </Expr> <Then><PolicyRulePass/></Then> <Else><PolicyRuleFail/></Else> </If> </PolicyRuleLogic>
You can also chain the names into the field attribute without declaring the variable first, using a period as the separator:
<PolicyRuleLogic editor='raw-xml'> <If> <Expr op='=='> <Expr field='parent_device.DeviceModel'/> <Expr value='N7Kc7010'/> </Expr> <Then><PolicyRulePass/></Then> <Else><PolicyRuleFail/></Else> </If> </PolicyRuleLogic>
In this case, each component in the change can be either a method call that takes no arguments, or a field.
<Return> ElementsA <Return> element is a statement block, and will stop execution of the policy rule, returning the value of the statement block as the value of the policy rule. In a policy rule, the <Return> should evaluate to a <PolicyRulePass> or <PolicyRuleFail> (see the section Pass/Fail Messages below).
<Return> <PolicyRulePass><Expr op='concat'><Expr value='VTY access-class '/><Expr variable='access-list'/><Expr value=' is set and defined'/></Expr></PolicyRulePass> </Return>

Infoblox NetMRI 7.4.4 Administrator Guide Part 5 Network Compliance
Copyright ©2020, Infoblox, Inc. All rights reserved. Page 315
<StatementBlock> ElementsThis element simply allows grouping of related statements.
Pass/Fail MessagesPolicy rules must result in a <PolicyRulePass> or <PolicyRuleFail>, or the policy rule will evaluate as 'invalid'. When using <PolicyRulePass> or <PolicyRuleFail>, you may send a custom message indicating the reason for passing or failing. A static message can be included by simply making it the text of the element:
<PolicyRulePass>This is the pass message.</PolicyRulePass>
You may also put expressions as child elements, enabling dynamic messages:
<PolicyRulePass> <Expr op='concat'> <Expr value='VTY access-class '/> <Expr variable='access-list'/> <Expr value=' is set and defined'/> </Expr> </PolicyRulePass>
Long-Form Example<PolicyRuleLogic editor='raw-xml'>
<Assign variable='device-config'><Expr method='running_config_text'/></Assign>
<If>
<Expr op='matches'>
<Expr variable='device-config'/>
<Expr value='/^line vty \d+ \d+\n(?:\s[^\n]+\n)*(?:\saccess-class (\S+) in\n)/m'/>
</Expr>
<Then>
<Assign variable='access-list'><Expr variable='_match_1'/></Assign>
<Assign variable='access-class'><Expr op='concat'><Expr value='access-list '/><Expr variable='access-list'/></Expr></Assign>
<If>
<Expr op='matches'>
<Expr variable='device-config'/>
<Expr variable='access-class'/>
</Expr>
<Then>
<Return>
<PolicyRulePass><Expr op='concat'><Expr value='VTY access-class '/><Expr variable='access-list'/><Expr value=' is set and defined'/></Expr></PolicyRulePass>

Infoblox NetMRI 7.4.4 Administrator Guide Part 5 Network Compliance
Copyright ©2020, Infoblox, Inc. All rights reserved. Page 316
</Return>
</Then>
<Else>
<Return>
<PolicyRuleFail><Expr op='concat'><Expr value='VTY access-class '/><Expr variable='access-list'/><Expr value=' is set but access-list is NOT defined'/></Expr></PolicyRuleFail>
</Return>
</Else>
</If>
</Then>
<Else>
<Return>
</Return>
</Else>
</If>
</PolicyRuleLogic>
Regular Expressions in Policy RulesNetMRI uses Ruby-style regular expressions, which are similar to perl regular expressions. When entering a regular expression in the Raw XML Editor, the Simple Rule Editor, or the Rule Logic Builder, starting the line with "/" allows you to use the "i" or "m" options for regular expressions. For example,
^banner motd my banner
will fail to match "banner motd MYBANNER" in the configuration file. For a case-sensitive match, enter instead
/^banner motd my banner/i
Config File MatchesFor the most part, config file matches look almost exactly like configuration commands, with the possible use of wildcards and regular expressions instead of hard-coded arguments. For example, the following config file match specifies an exact match that requires a specific ACL command to be included in the configuration file:
access-list 10 permit 10.76.4.11
This is the simplest and most common type of config file match, which is typically the result of a cut-and-paste from a correct configuration file.
Note: Config file matches are written using the actual syntax defined for the configuration file for a given type of device and software version. In some cases, the syntax is the same across multiple device types or software versions, but in other cases different syntax is required. The device filter defined for a rule determines which types of devices can be analyzed using that rule.
To allow a given config file match to match multiple configuration lines, rule authors can include regular expressions for one or more of the command arguments. For example, the following wildcard config file match:
access-list 10 permit 10.76.4.[0-9]+

Infoblox NetMRI 7.4.4 Administrator Guide Part 5 Network Compliance
Copyright ©2020, Infoblox, Inc. All rights reserved. Page 317
indicates that an ACL entry must exist for any host in the 10.76.4.0 subnet, instead of just the host at 10.76.4.11 as in the previous example.
The regular expression shown above matches more than just “10.76.4.x” because the “.” is a special symbol that matches any single character. In practice, this expression will still match what you want it to match because only dotted decimal notation will appear in this rule.
Multiple Wildcard TermsEach of the arguments (or tokens) defined in a given config file match can be either a fixed value (e.g., “10”) or a wildcard term (e.g., “[0-9]+”) to match multiple values. By combining multiple wildcard terms in the same config file match, very powerful (and sometimes complex) expressions can be specified. For example, consider the following config file match:
snmp-server communit.* [Pp]ublic (RO|RW)
This config file match would match any top-level command where the first token matches the fixed value snmp-server, the second token matches the wildcard term communit.*, the third token matches the wildcard term [Pp]ublic, and the fourth token matches the wildcard term (RO|RW). In other words, it matches any command that defines the read-only or read-write community to be “Public” or “public”.
Note: Although not strictly forbidden, it is generally prudent to use fixed values for the first token in every config file match to avoid unexpected results when a wildcard term matches a rule you didn’t expect it to match.
Multi-Line Config File Matches
Note: Information in this topic applies only to rules created in the CPD Editor (see Using the CPD Editor).
Many configuration commands can span multiple lines in a configuration file, where each indentation level indicates a different sub-command specification. Similarly, config file matches can be specified as a collection of one or more sub-matches that are applied to the corresponding sub-commands.
For example, the following multi-line config file match:
[Config File Must Contain]
interface Ethernet0\/0
description.*
indicates than an interface command must exist for the Ethernet0/0 interface and that a description must be defined for that interface. Because the description sub-match only specifies the first part of the sub-command, any description will match the sub-match, as long as one has been defined. That is, the rule author doesn’t care exactly what description is defined, only that some description is defined for that device.
As with single-line config file match, you may want to include a wildcard expression as part of the top-level match or sub-matches so that the config file match can be used across a range of commands. In such cases, the multi-line config file match is applied to any configuration command that matches the top-level config file match.
or example, the following multi-line config file match:
[Config File Must Contain]
interface Ethernet.*
description.*
indicates that all interface commands associated with any Ethernet interface must have an interface description defined, whereas the following multi-line config file match:
[Config File Must Contain]

Infoblox NetMRI 7.4.4 Administrator Guide Part 5 Network Compliance
Copyright ©2020, Infoblox, Inc. All rights reserved. Page 318
1.2.3.4.5.6.
7.
8.9.
10.
••
1.
interface.*
description.*
indicates that every interface, regardless of type, must have a defined interface description.
Creating and Managing RulesYou use the Rules tab (Config Management –> Policy Design Center –> Rules tab) to create and manage rules that are referenced in policies. Policies cannot operate without at least one Rule. All factory-defined rules in this page are read-only. You can also define your own custom rules, using your choice of editing tools.Rules provide substantial extensions in capabilities for XML rule creation. For more information, see the following subsection, Policy Rule XML Capabilities.Rule editing features are enabled only when creating a new rule. All other Rules are read-only and can be used only to create new Rules.Rules are the critical element in building all Policies. To build Rules effectively, Infoblox recommends detailed knowledge of the given networking technologies or protocols involved in defining the rule.Also see Additional Rule Examples for information showing how rules appear in practice.
Note: For a selected rule, check Used in these policies at the bottom of the center panel to see which policies reference the rule.
Creating New RulesTo create a new rule, you choose a severity level for the rule, define any remediation instructions as descriptive text for the rule, and select an editor type. Do the following:
In the Rules tab, click Add in the upper left corner. The Add Rule dialog appears.In the Add Rule dialog, enter the Short Name, Name and Author.Select a Severity.Enter a Description.(Optional) Enter Remediation instructions.Click Save.The new Rule appears in the left pane of the Rules page, and defaults to the Simple Rule editor.Select a rule editor in the upper right corner: see the respective topics for Using the Simple Rule Editor , Using the CPD Editor , Using the Rule Logic Builder or Using the Raw XML Editor for more information.Enter the config file matches using the selected editor.Click Save in the lower right corner.Test or validate the new rule (for more information, see Testing Policy Rules ).
Filtering for RulesA rule should not operate on all possible objects, or the rule would never finish executing in a policy or would yield results that don't match the intent of the rule. You use filters to ensure the following:
Ensure that a policy rule applies only to particular devices that you want the rule to match against;Ensure matches against characteristics such as Rank, Assurance level, device model and numerous other criteria.
To specify a filter for a rule, do the following:
Note: Configure rule and policy filters carefully. It is possible to inadvertently specify mutually exclusive filters such that a policy would not apply to any configuration file.
In the Rules panel, select the rule.

Infoblox NetMRI 7.4.4 Administrator Guide Part 5 Network Compliance
Copyright ©2020, Infoblox, Inc. All rights reserved. Page 319
2.
3.4.5.
6.7.8.9.
Click the Add device filter hyperlink. The Edit Filters dialog appears.To add a config file match filter:Click Add Device Attribute. The Edit Device Attribute dialog appears.(Optional) Enter a Note describing the filter element.Select a device filtering characteristic from the first dropdown (e.g. Assurance, Community, DNS Name, Model, Name or other characteristic (see Adding Device Attributes to a Rule Filter below).Select an operator from the list (e.g., =, =>, in, Contains, Does Not Contain or any other operator).Enter or paste in the text for the configuration file line(s) or the value to match against.If you want to use more than one filtering criterion, click Apply and New.Click OK when the new filter is complete.
When you create new rules, you can also add filters to them. After doing so, they are listed under the Device Filter for Rule section in the center pane. You can do so for any rule, whether it is a new one or a read-only rule bundled with the appliance.You can also choose a Config File Match for the rule filter. However, while the filter can check for a line or a series of lines in the config file (using Must Contain... or May Not Contain... statements for the matching), the match of this type is used only to determine whether the rule will apply to a given device.
Adding Device Attributes to a Rule Filter
A device attribute is any characteristic of a discovered device that is readable by NetMRI. You can select attributes for addition to a filter through the Rule Logic Builder. Attributes that can be used for rules filtering include the following:
Assurance The assurance level of the device type value (Router, Switch-Router, etc...)
Community An SNMP community string.
DNS Name The qualified DNS hostname for the device
First Occurrence The date/time that this device was first seen on the network.
Group The array of Device Groups to which the device belongs.
ID The Device ID of the management server for the device.
IP Address The management IP address of the device, in dotted (or colon-delimited for IPv6) format.
Network View The network view assigned to the device through NetMRI.
Model The discovered vendor's device model name.
Name The NetMRI name of the device; this will be either the same as DeviceSysName or DeviceDNSName, depending on your NetMRI configuration.
Rank The device group ranking level associated to the device as determined by NetMRI after discovery
Reboot Time The date/time this device was last rebooted.

Infoblox NetMRI 7.4.4 Administrator Guide Part 5 Network Compliance
Copyright ©2020, Infoblox, Inc. All rights reserved. Page 320
1.2.3.
a.b.c.
d.e.
1.2.3.
1.2.3.
1.2.3.4.5.6.
1.2.3.
SAA Version The SAA version running on this device. Used for Cisco VoIP support.
Sys Description The device sysDescr as reported by SNMP.
Sys Name Device system name as reported through SNMP.
Vendor The device vendor name.
Version The device OS version.
Testing Policy RulesRules created in the Raw XML Editor can be validated through the XML schema by simply clicking the Validate button. To test any non-XML rule, do the following:
In the Rules panel, select the rule to be tested.Click the Test Rule button in the lower right corner. The Test Rule dialog appears.In the Test Rule dialog, specify what you want to test against:
Click the Test Against Existing Device tab.Select a Device Group that contains the device of interest.Select the specific device by clicking on its table row. Note that the IP Address and Network View columns provide links to their respective viewer windows.To test against device attributes and/or a configuration file, do the following:Click the Test Against Attributes/Config File tab.Enter device attributes (if available) and/or click Browse... to select a configuration file.
Click Test. Results appear in the pop-up Test Results window. (You can click the Debug button to watch rule execution. For more information, see Debugging Rules.)
To import a rule, do the following:
Click Import in the upper left corner. The Import Rule dialog appears.Click the Browse... button, then locate and select the file.Click the Import button.
To export a rule, do the following:
In the Rules panel, select the rule to be exported.Click Export in the upper left cornerTake the appropriate action in the resulting dialog.
To copy a rule, do the following:
Click Copy in the upper left corner. The Copy Rule dialog appears.Enter the Short Name, Name and Author.Select a Severity.Edit the Description as needed.Edit the Remediation as needed.Click Save.
To delete a rule, do the following:
In the Rules panel, select the rule to be deleted.Click Delete in the upper left corner.Confirm the deletion.

Infoblox NetMRI 7.4.4 Administrator Guide Part 5 Network Compliance
Copyright ©2020, Infoblox, Inc. All rights reserved. Page 321
•••
1.2.3.
1.2.3.
a.
4.
1.2.3.4.5.6.7.
Debugging RulesWhen testing a rule, you may now enable debug mode by clicking the Debug button. This produces output that identifies each element, is executed by the system, and shows the return value from that element.For example, consider the following block of code:
<Expr op='concat'> <Expr value='First'/> <Expr value='Second'/> </Expr>
When evaluated in debug mode, it would result in the following output:
<Expr op='concat'> <Expr value='First'> </Expr> result value <First> <Expr value='Second'> </Expr> result value <Second> </Expr> result value <FirstSecond>
Creating and Managing PoliciesBuild and test policies in the Policies tab (Config Management tab –> Policy Design Center side tab –> Policies tab).
Note: Configure rule and policy filters carefully. It is possible to inadvertently specify mutually exclusive filters so that a policy will not apply to any configuration file.
A policy consists of the following:
Properties: name, short name, author's name and description.Rule(s): one or more rules selected from those available in the Rules tab.Device filter: limiting the policy to devices with attributes and/or config files containing certain commands.
Creating PoliciesTo create a policy, do the following:
Click Add in the upper left corner. The Add Policy dialog appears.Enter a Policy Name, Short Name, Author and Description.Click Save.
To add one or more rules to a policy, do the following:
In the Policies panel, select the policy.Click the Edit button in the lower right corner. The Select Rules dialog appears.In the Select Rules dialog:
Check the rules you want to include in the policy. Hover over a rule's name to see its full name, description and device filter.
Click Save.
To specify a filter for a policy, do the following:
In the Policies panel, select the policy.Click the Add a filter hyperlink. The Edit Filters dialog appears.To add a configuration file match filter:Click the Add Config File Match button. The Edit File Match dialog appears.(Optional) Enter a Note describing the filter element.Select an operator (e.g., Must Contain ALL of These Lines in Any Order).Enter the configuration file line(s).

Infoblox NetMRI 7.4.4 Administrator Guide Part 5 Network Compliance
Copyright ©2020, Infoblox, Inc. All rights reserved. Page 322
8.9.
10.11.12.13.14.15.16.
17.
1.2.3.
4.
1.2.3.
1.2.
1.2.
1.2.3.
1.2.3.
1.2.3.
Click OK.To add a device attribute filter:Click the Add Device Attribute button. The Edit Device Attribute dialog appears.(Optional) Enter a Note describing the filter element.Select an attribute (left dropdown list).Select an operator (center dropdown list).Enter a value (right field).Click OK.If you create two or more filter elements, you can modify the logic used to apply them in the Enforce This Rulefield. Click the icon to the right of the field for details.Click Save.
Testing and Importing PoliciesPolicies can be tested against devices within device groups, against device attributes and against a configuration file, and tested against a template. New policies can also be written in XML format and then imported into the NetMRI Policy system.
To test a policy, do the following:
In the Policies panel, select the policy to be tested.Click Test Policy in the lower right corner. The Test Policy dialog appears.In the Test Policy dialog, select a corresponding tab to specify what you want to test against. See the following procedures for each test tab.Click Test. Results appear in the pop-up Test Results window.
To test against a device group:
Click the Test Against Existing Device tab.Select a Device Group that contains the device of interest.Select the specific device.
To test against device attributes and/or a configuration file:
Click the Test Against Attributes/Config File tab.Enter device attributes (if available) and/or click Browse... to select a configuration file.
To test against a template:
Click the Test Against Template tab.Select the template you want to test against.
Importing and Exporting Policies
You can import policy XML files (as generated by exporting a policy) or legacy NetMRI CPD files. The latter is automatically converted to the newer format.
To import a Policy file, do the following:
Click Import in the upper left corner.In the Import Policy dialog, click Browse..., then locate and select the file.Click Import.
To export a policy:
In the Policies panel, select the policy to export.Click Export in the upper left corner.Take the appropriate action in the resulting dialog.
To copy a policy:
Click Copy in the upper left corner. The Copy Policy dialog appears.Enter a Policy Name, Short Name and Author.Edit the Description as needed.

Infoblox NetMRI 7.4.4 Administrator Guide Part 5 Network Compliance
Copyright ©2020, Infoblox, Inc. All rights reserved. Page 323
4.
1.2.3.
1.2.3.
1.2.3.4.
1.2.3.4.
•••
••
••••••••••
Click Save.
To delete a policy:
In the Policies panel, select the policy you want to delete.Click Delete in the upper left corner.Confirm the deletion.
To print a policy:
In the Policies panel, select the policy you want to print.Click Print in the upper left corner.In the Print dialog, specify print parameters, then click the Print button.
Deploying PoliciesDeploy policies in the Policy Deployment tab (Config Management –> Policy Design Center side tab –> Policy Deployment tab). In this tab, you associate policies with device groups (or vice versa). Policy deployments remain in effect until they are deactivated.
To specify a policy and deploy it against selected device groups:
Click the By Policy tab at the bottom left of the page.In the Policies panel, select the policy you want to deploy.In the main table, select the device group(s) you want to run the policy against.Click the Save button in the lower right corner.
To specify a device group and deploy selected policies against it:
Click the By Device Groups tab at the bottom left of the page.In the Select Device Groups panel, select the device group.In the main table, select the policy or policies you want to deploy for the device group.Click Save.
Note: To view policy details, click the plus sign at the left end of a policy row.
PCI 3.0 Rule TestingNetMRI policies support the Payment Card Industry (PCI) 3.0 standard. The defined policies for PCI, including PCI 3.0, consist of the following:
PCI DSS 1.2 IOSPCI DSS 2.0 IOSPCI 3.0 IOS/NX-OS
The PCI 3.0 policies support Cisco IOS and Cisco NX-OS devices. For policy execution, devices must be configured to conform to PCI 3.0 standards. NetMRI can use PCI 3.0 policies to test for the following:
Minimum password length: enforced to be at least 7 characters long.Password strength: Password should contain numeric and alphabetic characters or password strength validation should be enabledDisabled Small TCP and Small UDP servicesDisabled Finger, BOOTP, and Identd services on Cisco IOS devicesDisabled CDP, HTTP, NTP on Cisco IOS and Cisco Nexus devicesExec-timeout on console port and on VTY port should be set to 15 minutes or less on IOS and NexusEnable login on console port;Allow Enable passwords on console port;Two factor authorization is activated;Enable Logging timestamp;Disable MOP on all Ethernet interfaces;Disable Packet assembler/disassembler (PAD) on X.25 links on IOS.

Infoblox NetMRI 7.4.4 Administrator Guide Part 5 Network Compliance
Copyright ©2020, Infoblox, Inc. All rights reserved. Page 324
•••••••
Disable configuration autoloading for IOS devices;Disable source routing on IOS and Nexus;Inbound access class should be set on VTY ports;SSH only transport should be set on VTY ports for IOS;AAA authentication should be enabled for VTY ports on IOS;Secrets should be used for local users on IOS and Nexus;SNMP v1 and v2c should be disabled on IOS and Nexus.
Additional Rule ExamplesWith some practice, rules can be written by anyone experienced with the underlying configuration files being analyzed. This topic presents several examples of relatively simple, yet effective rules that ensure consistency and correctness across a range of devices.
Note: Rule examples are presented using the CPD Editor format (see Using the CPD Editor ).
The following example demonstrates how to ensure that all network engineers can access a given network device.
Rule: Access List ConfigurationDescription: These commands specify the hosts that are allowed to access the router’s management interface.
[Config File Must Contain]
access-list 10 permit 10.76.4.[0-9]+
access-list 10 permit 10.48.3.\d+
access-list 10 permit 10.76.15.45
access-list 101 permit ip 10.98.34.0.* any
[Config File Must Contain]
access-list.*
Rule: SNMP Community ConfigurationIf you are making sure that people can access the systems, do not forget about the management software.
Description: Ensures that all SNMP communities are set to the proper setting.
[Config File Must Contain]
snmp-server community r3adc5 RO
snmp-server community wr1t3c5 RW
[Config File May Not Contain]
snmp-server community.*
Rule: Banner ConfigurationThe following example shows how to consistently display a proper login banner on all network devices covered by this rule:
Description: Every system is supposed to display the following banner.
[Config File Must Contain]

Infoblox NetMRI 7.4.4 Administrator Guide Part 5 Network Compliance
Copyright ©2020, Infoblox, Inc. All rights reserved. Page 325
banner motd ^C
ALL UNAUTHORIZED ACCESS TO THIS SYSTEM WILL BE
PROSECUTED TO THE MAXIMUM EXTENT ALLOWED BY
U.S. FEDERAL AND MARYLAND STATE LAW.
^C
Rule: Clock SynchronizationClock synchronization problems can cause confusion when troubleshooting problems across the network. This rule detects when a network device is not pointing at the proper NTP servers.
Description: Time is money... treat it accordingly.
[Config File Must Contain]
ntp server 192.168.72.2
[Optional]
ntp server 192.168.72.[3-5]
[Config File May Not Contain]
ntp server.*
Rule: Interface DescriptionsUse the following rule to ensure that every interface has some sort of description defined for it. In this example, we also require the description for all ATM interfaces to include the circuit ID and the provider.
Description: All interfaces should have a description of some sort and ATM interfaces should include the Circuit ID and provider.
[Config File Must Contain]
interface.*
description.*
interface ATM.*
description (ATT|MCI|SBC)-[0-9][0-9][0-9]
Rule: Integrated Access ControlYou are free to organize rules as you see fit. The following example combines the access related rules from above into a single rule:
Description: Ensures that only authorized individual and hosts can access our network devices.
[Config File Must Contain]
access-list 10 permit 10.76.4.[0-9]+
access-list 10 permit 10.48.3.[0-9]+
access-list 11 permit 10.76.15.45
access-list 101 permit ip 10.98.34.0.* any
snmp-server community r3adc5 RO 10
snmp-server community wr1t3c5 RW 11

Infoblox NetMRI 7.4.4 Administrator Guide Part 5 Network Compliance
Copyright ©2020, Infoblox, Inc. All rights reserved. Page 326
•
•
1.2.
3.4.5.6.
••••••
7.
8.9.
banner motd ^C
ALL UNAUTHORIZED ACCESS TO THIS SYSTEM WILL BE
PROSECUTED TO THE MAXIMUM EXTENT ALLOWED BY
U.S. FEDERAL AND MARYLAND STATE LAW.
^C
[Config File May Not Contain]
access-list.*
snmp-server community.*
Some variables, specifically the $Model and $IPAddress values, cannot be used for building Rules with device attributes:
$Model in ["cat4506", "3725"]
$IPAddress in [10.1.3.56, 10.2.0.0/16]
For Rules in the Policy Design Center, simply use a comma-separated format.
Using the Rule Logic BuilderThe Rule Logic Builder provides an environment for creating rules by combining config file matches with logic to produce a result when the rule executes. Rule Logic consists of two primary building blocks:
Config File Match: a defined section of configuration file text of one or more lines, used during parsing of device configuration files to perform matching. Matching may be positive ('Must Contain') or negative ('May Not Contain');Device Attributes: these consist of three smaller elements, including device attributes (see Adding Device Attributes to a Rule Filter for a list of attributes), mathematical and logical operators, and a value to match against.
At the top of the Rule Logic Builder panel, you see an Enforce This Rule field. Here, you use Boolean AND and OR operators to enforce the logic trail employed by the rule. For example, consider a rule that has three elements: two Config File Matches and a device attribute as the third element.
You enter Config File Matches and Device Attributes one at a time, in any order, in the logic builder. You cannot rearrange them after they are added to the block list; each block provides an Action menu through which you edit or delete each block.
To create a new rule using the Rule Logic Builder:
Select the rule in the Rules panel.Select Rule Logic Builder in the Editor list in the upper right corner. (This list is inactive if you are editing an existing rule.)To add a config file match for a configuration command:Click Add Config File Match.(Optional) In the Edit File Match dialog, enter a Note describing the config file match.Open the list and select a must contain/may not contain option:
ALL of These Lines in Any OrderALL of These Lines in Specified OrderAT LEAST ONE of These LinesThis BLOCKThis BLOCK Only OnceONLY ONE of These Lines
In the text field, type or paste in the config file match line or block (see references below for additional information).Click OK.To add a device attribute check, click the Add Device Attribute button.

Infoblox NetMRI 7.4.4 Administrator Guide Part 5 Network Compliance
Copyright ©2020, Infoblox, Inc. All rights reserved. Page 327
a.
b.c.d.
10.11.
•••
•
•
1.2.3.4.
••••••
5.
6.••
7.
8.
Choose a device attribute from the left dropdown list (see Adding Device Attributes to a Rule Filter for a list of choices).Select an operator from the center dropdown list.Enter a value in the right field.Click OK or select Apply and New.
Click Add Config File Match or Add Device Attribute to add a new element to the block list.Click the Save button at the bottom of the page.
By default, config file matches are combined with logical ANDs; editing the Enforce This Rule field allows for Boolean ORs, NOTs and If-Then-Else logic. Hover the mouse over the Info icon to the right of the field for details.
To view config file match details, click the (+) icon at the left end of the row.To edit a config file match: hover the mouse over the Action icon for the element and choose Edit.To delete a config file match: hover the mouse over the Action icon for the element and choose Delete.
Note: When creating a rule to evaluate a block of config in a specified order, note that the “all of these lines in specified order” logic implies that each line is present and in that order, and there can be other lines in between. In this case the rule passes. If you do not want to allow other lines in between, use the “Contains This BLOCK” option. Also, in both the “Config File Must Contain” and “Config File May Not Contain” sections, each entered line is considered a regular expression to be matched against the configuration file. If you select one of the BLOCK options, the entire content of the field is considered a regular expression.
Using the Simple Rule EditorAs its name implies, the Simple Rule Editor provides an easy way to create and edit rules. It establishes a structure in which you can easily add config file matches corresponding to specific configuration commands.
In the Simple Rule Editor, a rule may consist of one or both of the following sections:
Config File Must Contain section lists config file matches that must be matched in some combination specified in the associated dropdown list (e.g., ALL of These Lines in Any Order or This BLOCK Only Once). You type in or paste in the sequence of configuration file directives to be matched against.Config File May Not Contain section lists config file matches that should not be matched as specified in the associated dropdown list (Any of These Lines or This BLOCK).
To add config file matches to a rule using the Simple Editor:
Select the rule in the Rules panel.Select Simple in the Editor list in the upper right corner. (This list is inactive if you are editing an existing rule.)Then, specify required config file matches:Open the Config File Must Contain list at the top of the upper panel, then select one of the following options:
ALL of These Lines in Any OrderALL of These Lines in Specified OrderAT LEAST ONE of These LinesThis BLOCKThis BLOCK Only OnceONLY ONE of These Lines
Type or paste the config file line(s) or block(s) in the large field in the upper panel. To specify invalid config file matches:Open the Config File May Not Contain list at the top of the lower panel, then select one of these options:
Any of These LinesThis BLOCK
Type or paste the config file line(s) or block(s) in the large field in the lower panel. (See references below for additional information.)In both the Config File Must Contain and Config File May Not Contain sections, each entered line is considered a regular expression to be matched against the configuration file. If you select one of the BLOCK options, the entire contents of the field are considered a regular expression.Click the Save button at the bottom of the page.

Infoblox NetMRI 7.4.4 Administrator Guide Part 5 Network Compliance
Copyright ©2020, Infoblox, Inc. All rights reserved. Page 328
••••••
Note: You can move the bar between the Must Contain and May Not Contain panels to adjust the space available in each panel.
Note: When creating a rule to evaluate a block of config in a specified order, note that the “all of these lines in specified order” logic implies that each line is present and in that order, and there can be other lines in between. In this case the rule passes. If you do not want to allow other lines in between, use the “Contains This BLOCK” option. Also, in both the “Config File Must Contain” and “Config File May Not Contain” sections, each entered line is considered a regular expression to be matched against the configuration file. If you select one of the BLOCK options, the entire content of the field is considered a regular expression.
Using the CPD Editor
Note: Infoblox recommends using alternative editing methods for creating new policy rules. The CPD editor is provided for compatibility with older releases of NetMRI.
The CPD Editor provides a legacy rule format using a more free-form rule development environment than the Simple Rule Editor. You use several simple text headers to create sections for the rule to match against; these headers also express the basic logic for the rule. Possible section headers include the following:
Required: a single line directive for a configuration.Required Block: a block of one or more lines of configuration text.Optional: An optional single line of configuration text for a follow-on match, if necessary.Optional Block: An optional block of configuration text for a follow-on match, if necessary.Invalid: a single line directive for a configuration, which if found is considered invalid.Invalid Block: a block of one or more lines of configuration text which if found is considered invalid.
In the CPD Editor, a rule can include any or all of the following sections:
Required: Config file match 1
Required Block:
Config file match 2
Config file match 3
Optional: Config file match 4 Optional Block:
Config file match 5
Config file match 6
Invalid: Config file match 7
Invalid Block:
Config file match 8
Config file match 9
General syntax. Although config file matches generally occupy a single line, for formatting purposes they can span multiple lines in the CPD Editor.

Infoblox NetMRI 7.4.4 Administrator Guide Part 5 Network Compliance
Copyright ©2020, Infoblox, Inc. All rights reserved. Page 329
1.2.3.
4.
•
•
•
Comments. In rules developed in the CPD Editor, any line in which the first non-whitespace character is a "#" is always considered a comment line. For example,
# This is a comment line
denotes a comment that is ignored when processing the file.
Note: As with any definition file, proper use of blank lines, indentation and comments can significantly improve rule readability.
To add config file matches to a rule using the CPD Editor:
Select the rule in the Rules panel.Select CPD in the Editor list in the upper right corner. (This list is inactive if editing an existing rule.)Type or paste the config file match line(s) and/or block(s) you want to include in the rule. (See references below for additional information.)Click Save at the bottom of the page.
The CPD Editor supports three types of block config file matches:
Required block. For a required block to be satisfied, the configuration file must have one block of lines matching its requirements.Optional block. Optional blocks are used to prevent a required block from matching commands that may or may not be defined in the configuration file.Invalid block. Invalid blocks are identified as many times as the invalid block is matched in the configuration file.
Required blocks are processed at the same time as required config file matches, followed by all optional blocks and optional config file matches, and finally all invalid block rules and invalid config file matches. Normally, config file matches are written in the order they are processed to avoid confusion, Organization is entirely up to the CPD author. One block of config file matches can be specified per block.
This is a valid example:
Required Block:
Config file match 1 of Block 1
Config file match 2 of Block 1
Config file match 3 of Block 1
Required:
Config file match 1
Config file match 2
Config file match 3
Required Block:
Config file match 1 of Block 2
Config file match 2 of Block 2
Config file match 3 of Block 2
This is an invalid example:
Required Block:
Config file match 1 of Block 1
Config file match 2 of Block 1

Infoblox NetMRI 7.4.4 Administrator Guide Part 5 Network Compliance
Copyright ©2020, Infoblox, Inc. All rights reserved. Page 330
Config file match 3 of Block 1
Config file match 1 of Block 2
Config file match 2 of Block 2
Config file match 3 of Block 2
Required:
Config file match 1
Config file match 2
Config file match 3
Rule blocks support indentation similar to what is described in Multi-Line Config File Matches.
Because a required block is satisfied by finding just one match in a configuration file, it is best to use the required block with the invalid block. This action takes advantage of the fact that the required blocks are processed first and any consecutive configuration lines that do not match the required blocks are then matched with the invalid block. Below is an example that uses this method.
Required Block:
interface [F|G].*
description T.*
switchport trunk encapsulation dot1q
switchport trunk native vlan 999
switchport mode trunk
Required Block:
interface [F|G].*
description M.*
switchport access vlan.*
switchport mode access
no logging event link-status
no mdix auto
spanning-tree portfast
Optional:
interface [F|G].*
switchport.*
shutdown
Invalid Block:
interface [F|G].*
.*

Infoblox NetMRI 7.4.4 Administrator Guide Part 5 Network Compliance
Copyright ©2020, Infoblox, Inc. All rights reserved. Page 331
•
•
•••••
•
••••••
Reports and Report ManagementReports are a critical tool for network management. You can run any report from NetMRI's bundled set of standard reports, and devise custom reports of your own to supplement the standard ones and add new functionality to the reporting system.
NetMRI's Report Manager provides quick visibility into all reporting tasks, scheduled reporting jobs, inactive jobs and completed jobs. Report Manager notifies you when NetMRI is producing a large, demanding report, and indicates the current progress level of the report. The Report Manager allows cancellation of reporting tasks that use unacceptable levels of appliance resources.
Note: The Report Manager provides warnings when available storage for completed Reports is below recommended levels.
Opening the Report ManagerThe Report Manager (Reports –> Report Manager tab) lists all Active and Inactive Reports for the current NetMRI appliance, and enables monitoring of currently running and active reports.
The Report Manager divides into two sections:
Active Reports, lists currently running and scheduled Report jobs. Click the Cancel button to stop currently running report jobs.Inactive Reports, lists all recently executed, cancelled and paused Report jobs. Click the Delete button to remove any entries in Inactive reports.
Two or more reports can simultaneously execute in the Active Reports queue. The Active Reports queue displays the following information:
Report Name: the name of the report selected for execution (sortable);Report Type: indicates whether the report is an on-demand or scheduled report (sortable);Priority: the numeric priority value of the Report job;Created By: The administrative account running the report (sortable);Status: Pending, Cancelled, or Running. Pending status occurs when an active job is in the queue but cannot be run at the moment due to the appliance limit on the number of concurrently running jobs;Last Action Timestamp: The timestamp indicating when the Report job started (sortable).
Inactive Reports show the following:
Report Name: the name of the report chosen for execution (sortable);Report Type: indicates whether the report is an on-demand or scheduled report (sortable);Size, B: the final size in bytes of the completed Report;Created By: The administrative account running the report (sortable);Status: Completed or Cancelled;Last Action Timestamp: The timestamp indicating when the (sortable).
To set the permissible value for concurrently running Reports: select Settings icon –> General Settings –> Advanced Settings and page to the Reports category. The default value is 2, supporting two Reports to run concurrently in the appliance. For most applications, Infoblox recommends keeping the default.
To start a report that is waiting in the Active Reports queue: select the desired report and click Run Next. The selected report will start when another Report is already running.
To stop execution of a currently running Report: select the Report in the Active Reports pane, and click Cancel. To delete a Report from the Inactive Reports pane: select the report, and click Delete.

Infoblox NetMRI 7.4.4 Administrator Guide Part 5 Network Compliance
Copyright ©2020, Infoblox, Inc. All rights reserved. Page 332
1.2.
3.
Note: The Inactive Reports page has an expiration of seven days, after which the oldest Inactive Reports in the list are deleted.
Changing Report Views
The Views drop-down list resides on the top right of the Report Manager panes. Its functionality is similar to other data tables in NetMRI. You can use this labor-saving feature to save the exact appearance and arrangement of the Report Manager tables. Views does not save the reports themselves or the results within the table — it saves the tabular arrangement, including all columns' sort settings, table filtering and any resizing of columns as a template that can be applied to the current data set. An Auto Refresh feature may be turned on or off in any Report View.
To turn off Auto Refresh for Active or Inactive Reports: click the Turn Auto Refresh Off button above either table.
Saving Report ViewsAfter arranging and sorting the Active Reports or Inactive Reports, save the arrangement in a View for future use without requiring subsequent resorting of report data columns.
To save a Report View: click the Views drop-down list.
To save either Reports table as an Excel-compatible .CSV file: click the CSV Export icon just above the Active Reports or Inactive Reports table.
To Manage Saved Views: click the Views drop-down list and choose Manage Views. A Manage Views dialog appears, listing the currently saved Views.
Note: Reporting is heavily resource-dependent. You can simultaneously execute two reports in NetMRI. Different users can also concurrently execute reports. The Report Manager allows tracking of all of these events and helps you evaluate whether any given report imposes an unacceptable load on the appliance.
Scheduling and Running Reports
Note: When scheduled reports run concurrently with on-demand reports in NetMRI, scheduled reports will take priority for completion in the appliance.
All standard reports allow running and scheduling. You can run any report at any time, and schedule them to run at chosen time intervals. Custom reports, which you create, also offer exporting, editing and deletion features.
Exporting, editing and deletion cannot be performed on the standard reports bundled with the appliance.
To schedule a report, complete the following:
In the Report Gallery, hover over the report to schedule.Under the report's thumbnail, click Schedule. A configuration window opens for the selected report ("Network History Report," for example).In the Device Groups list, click a group name or click several groups holding the Ctrl key.

Infoblox NetMRI 7.4.4 Administrator Guide Part 5 Network Compliance
Copyright ©2020, Infoblox, Inc. All rights reserved. Page 333
1.2.3.4.5.
6.7.
1.2.3.
••
Note: To run the report against a specific device, click the Devices tab. The following section, Running Reports Against Individual Devices discusses this in more detail.
4. Click Next.
5. Edit the Report Name as needed.
6. The To Emails field is pre-populated with a default e-mail address, which you can delete and change.
Note: You can add multiple e-mail addresses by separating multiple addresses with commas.
The To Users field is pre-populated with the e-mail addresses for all NetMRI users. You cannot edit this list.
7. Choose an Output Format (PDF, XLS, DOC or HTML in Email).
8. Choose a Recurrence Pattern (Once, Hourly, Daily, Weekly or Monthly).
9. Choose an Execution Time (the drop-down list spans a 24-hour time period, with half-hour increments).
10. Under Occurs Every [ ] Week On:, select the check boxes for each day of the week where the report will run. This value also defaults to one (1) week and can be changed.
11. Click Next.
12. Click Schedule. The job is listed in the Scheduled Reports tab.
You can edit scheduled reports at any time. Once the report executes, the admin accounts specified in the To Emails field receive a notification email with a file attachment in the specified format.
Running Reports Against Individual DevicesRunning reports against individual devices allows you to check specific firewalls, routers, switches or other network entities. For example, you can use the Chassis Inventory report to check a specific router for its installed collection of interface cards. Use the VLAN Interface Summary report against a specific Ethernet switch or subset of switches inside a Device Group.
In the Report Gallery, hover over the report to run.Under the report's thumbnail, click Run.Click the Devices tab.Choose a Date and Period from the respective drop-down lists.From the Device Group drop-down list, select the device group from which the desired device is chosen for the report. The list below is populated with the devices belonging to the group.Click the Add icon to add a chosen device to the Selected Devices list for the new report.Click Run.
Managing Scheduled ReportsTo copy a scheduled report job: Click the Copy button, enter a name for the report, then click OK.
To edit a scheduled report job, do the following:
Click Edit. The Report Scheduling Wizard opens.As needed, change report parameters.Review the scheduled report specifications, then click Schedule.
To run a scheduled report now: Click Run Now.To delete a scheduled report: Click Delete, then confirm the deletion.

Infoblox NetMRI 7.4.4 Administrator Guide Part 5 Network Compliance
Copyright ©2020, Infoblox, Inc. All rights reserved. Page 334
NetMRI Standard ReportsThe Report Gallery (Reports tab–> Report Gallery) lists the standard and custom reports that are available in the current NetMRI instance.
The gallery contains a series of thumbnails, each representing a report type. NetMRI bundles a pre-defined set of reports, gathered into a series of categories. Some categories will or will not appear depending on your license type.
Asset Reports for viewing the assets of the managed network, including the following: The Asset Inventory report lists the inventory of all devices of a specific device group or for the entire network. Asset Inventory includes operating system versions, device model name, IP address (Network View), and global device type such as Switch, Router, Firewall and others. If the device is not fully managed by NetMRI, some information for some devices may not appear. Devices also may not provide blocks of information due to configuration changes, not providing SNMP permissions, or other causes; The Chassis Inventory report lists all devices of the selected type and the network interface cards installed in each device; The Discovery Status report lists all devices' discovery status for the selected device group. reported Success or Failure status results include verification of its existence (Device Exists on the network), Fingerprinting, if applied, Reachable (is the device successfully reachable on the network?); SNMP Credentials; SNMP collection; CLI Credential; Config Collection; and Device Group (successful or unsuccessful assignment to:). Device results are listed by device IP address. The Managed Devices report lists all devices in a selected device group by name, network operating system version, and First Found and Last Seen dates; The Virtual Asset Inventory report queries all virtual devices detected in the network and provides a list of all virtual device instances and their following characteristics: their IP Address, the Context (the device in which they are resident) and their host MAC address; The VLAN Interface Summary report lists all VLANs detected on all network resources, including whether they are administratively and operationally Up or Down. The VRF Configuration Summary report lists all VRF-aware devices in the selected device group, including each device IP, the network view associated with the listed Interface IP address (if any), the interfaces and interface IPs participating in the VRF, the local VRF names and their route distinguisher values (if the device hosting VRFs uses them).
Change and Config Reports for change management and configuration management includes the following: Change Audit Summary describes the devices in the managed network that undergo configuration and status changes, devices exhibiting the most frequent changes and other equipment change characteristics; Config Change Audit Summary graphically shows the devices with recent configuration changes; Config Change Audit Details lists the configuration changes made to the devices in a selected device group, over the specified time period. Configuration Management Summary summarizes the selected device group's configuration management characteristics, including the dates for Last Checked, Last Running Change and Last Saved Change. It also lists the dates and times when device configurations were last changed and if the changes were committed.
Compliance A set of Policy Compliance reports includes the following: Default Credentials reports on all devices in the selected device group that are suspected or found to be running default Admin/Root passwords); ISO 27002 is a summary of audit finding requirements and whether all devices in the chosen device group or network pass basic SarbanesOxley, HIPAA and GLBA regulatory requirements; PCI documents Cisco IOS and, in some cases, NX-OS device compliance with certain network aspects of the Payment Card Industry Data Security Standard Versions 1.2, 2.0 and 3.0; The Policy Compliance Summary report provides an overview of the policy compliance status for any selected policies and the network devices against which they are deployed. Results are shown for Policy Compliance by Device and Policy Compliance by Rule. You can select one or more policies for the report. Policy Compliance Details (a more-detailed accounting of Policy Compliance violations on all network devices for which there is specific configuration information. See Policy Design Center for more information).

Infoblox NetMRI 7.4.4 Administrator Guide Part 5 Network Compliance
Copyright ©2020, Infoblox, Inc. All rights reserved. Page 335
1.2.3.4.
5.6.7.
1.2.3.
4.
5.6.7.
8.9.
10.
Health Health reports illustrate network Issues in broad or in detailed view: The Issue Details report provides an accounting of all issues currently taking place in a selected device group. All reported Issues are reported in Error, Warning or Info status; The Network Health report is most effectively applied to the Entire Network device group; it displays several charts and list summaries for all phenomena in the network. Network Health displays the current Network Scorecard and also shows the more-specific data sets that contribute to the Scorecard compilation. A data set shows the current count of Issues by severity level for the current time period and its difference from the previous day The report also shows the overall trend of Issue Differences for the reported network. (See Evaluating Issues in NetMRI for more information.); The Network History reports on a series of subcategories of cumulative network information, including Device History, Route History, Subnet History, VLAN History, HSRP/VRRP History and Configuration History. Network History reports may be run against device groups, but are most effective for the entire network. All Summary tables show Diff values based on the previous day's information.
Switch Port Management Switch Port Management reports provide information about the basic performance and usage rates of the switched Ethernet network: The MAC Address Summary report provides a survey of all MAC addresses detected in the network from both network assets and endpoints. In the Switch Port Management context, run the report against device groups such as Switches and Switch-Routers; The Port Saturation Snapshot report provides a pie chart showing port usage for all devices in the chosen device group, by Consumed and Available ports and port saturation statistics (Total Switches, Total Ports, % Consumed...) and a list of Top 10 Available Devices (switches with lowest usage); The Port Saturation Summary report defaults to a 30-day period, and measures Port Consumption, Port Allocation and Port Usage on a daily basis and places the daily tabulations on a series of bar charts. Port Usage differs from Port Consumption as it breaks down usage levels on switches based on usage frequency: Unused. Infrequent, Occasional, Moderate, Heavy and Constant. Other associated reports include New End Hosts, Link Changes, End Device Not Present and Slow Devices, which all relate to a specific aspect of monitoring a large-scale LAN switched network.
NetMRI bases its reports on information stored in the database after devices are discovered and collected from across the network. Reports can apply against any device group in the appliance, a single device in the database, or against the entire network. Depending on the size of the data set, a report can take a significant amount of time and occupy significant resources in the NetMRI appliance while generating the report.
Some reports are designed to run against the entire network but can also be run against subsets. Other reports, such as Port Saturation or Switch Port Management, are designed to run against more specialized network topologies.
To run a report, complete the following:
In the Report Gallery tab, hover over the report to run.Under the report's thumbnail, click the Run link. In the Device Groups list, click the group name or click several groups holding the Ctrl key.To select one or more devices from a device group for the report, click the Devices tab. Select a device group, and then click the plus icon for a specific device or devices. If available for the report you are running, choose the initial Date for the period covered by the report.From the Period drop-down list, choose the time period to be covered by the report.Click Run.
To schedule a report, complete the following:
In the Report Gallery tab, hover over the report to schedule.Under the report's thumbnail, click the Schedule link. The report scheduling wizard opens.In the Device Groups list, click the group name or click several groups holding the Ctrl key.To deselect a group, click the group name again.To select one or more devices from a device group for the report, click the Devices tab. Select a device group, and then click the plus icon for a specific device or devices.Click Next.Change the Report Name as needed.The To Emails field is pre-populated with a default e-mail address, which can be changed. You can enter multiple e-mail addresses (each address must be separated with commas).The To Users field is pre-populated with e-mail addresses for all NetMRI users. You cannot edit this list.Select an Output Format.Specify a Recurrence Pattern, then select scheduling options as shown for the recurrence pattern.

Infoblox NetMRI 7.4.4 Administrator Guide Part 5 Network Compliance
Copyright ©2020, Infoblox, Inc. All rights reserved. Page 336
11.12.13.
1.2.3.4.5.
6.7.
8.
Click Next.Review the scheduled report specifications. Click Previous to return to steps needing to be revised.If the specifications are correct, click Schedule. The job is listed in the Scheduled Reports tab.
Note: Reports can be exported as Adobe PDF or Microsoft Word-compatible files. Exporting also supports Excel-compatible files with the limitation that graphs are not exported.
Running and Scheduling Switch Port Manager Reports
MAC Address Summary ReportingThe MAC Address Summary report provides a survey of the complement of MACs in the switched network for the defined date range.
Two primary categories comprise the count: Infrastructure and End Station. NetMRI counts End Station MAC addresses by studying the ARP tables or forwarding tables of other networking devices. These end stations count towards the total count.
Port Saturation Summary ReportingThe Port Saturation Summary report analyzes the consumption and usage of ports during a specified time period. It answers such questions as:
"Am I running out of ports?" (port consumption)
"How many ports are available and how many are used?" (port allocation)
"How heavily are ports being used?" (port usage)
"Which switches are underused?" (top N)
"How are ports being used?" (port usage detail)
The Port Saturation Snapshot report displays port consumption and usage for a specific day. It answers such questions as:
"How many ports are available and how many are used?" (port allocation)
"Which switches are underused?" (top N)
"How are ports being used?" (port usage detail)
Note: Port Saturation reports may take a long time to generate, depending on the size of the network. As a result, Port Saturation reports are limited to 2000 items.
In the Report Gallery tab, hover over the Port Saturation report you want to run.Under the report's thumbnail, click the Run link. The Run Report Wizard opens.Specify the device group(s) to be covered by the report:In the Device Groups list, double-click the group name (or click the group, then click the button).In the Selected Device Groups list, double-click the group name.Or: click the Clear button to remove all groups from the Selected Device Groups list.Click Next.Specify the Date to be covered by the report (or for the Port Saturation Summary report, the last day of the period covered by the report).(For the Port Saturation Summary report only:) Specify the Period, Interval and Time Window for the report.

Infoblox NetMRI 7.4.4 Administrator Guide Part 5 Network Compliance
Copyright ©2020, Infoblox, Inc. All rights reserved. Page 337
1.2.3.4.
5.
6.7.
8.9.
10.11.12.13.14.
15.16.17.
18.
19.
Note: If you select a date or period that starts before the maximum data retention date (default is 90 days), the report will not show data for the time before the maximum data retention date.
9. In the Top N list, select the number of underused ports to be listed in the report.
10. In the Interface Groups list, click, SHIFT+click or CTRL+click to select the groups to be covered by the report.
11. Click Run.
To run Report Scheduling, do the following:
In the Report Gallery tab, hover over the Port Saturation report you want to schedule.Under the report's thumbnail, click the Schedule link. The Report Scheduling Wizard opens.Specify the device group(s) to be covered by the report:To select a group: In the Device Groups list, double-click the group name (or click the group, then click the button).To deselect a group: In the Selected Device Groups list, double-click the group name. Or: click the Clear button to remove all groups from the Selected Device Groups list.Click Next.Specify the Date to be covered by the report (or for the Port Saturation Summary report, the last day of the period covered by the report).Port Saturation Summary report only: Specify the Period, Interval and Time Window for the report.In the Top N list, select the number of ports to be covered by the report.In the Interface Groups list, click, SHIFT+click or CTRL+click to select the groups to be covered by the report.Deactivate the Hide Neighbor Details option (this will increase the time required to generate the report).Click Run. Step 3 of the Wizard appears.Change the Report Name as needed.The To Emails field is pre-populated with your default e-mail address. If needed, you can replace this with another e-mail address. You can also specify multiple e-mail addresses (separated with commas).The To Users field is pre-populated with e-mail addresses of all NetMRI users. This list cannot be edited.Select an Output Format.Specify a Recurrence Pattern, and select additional scheduling options as displayed for the recurrence pattern you selected.Review the scheduled report specifications. If you need to change anything, click < Previous to return to the step(s) needing to be revised.If the specifications are correct, click Schedule. The job is listed in the Scheduled Reports tab.
Port Saturation Report DefinitionsFor Port Saturation report definitions, data collected during a reporting time window is displayed as a single bar in the Port Saturation Summary report graphs. You can filter data in the time window by criteria such as business hours, off-hours, etc.
Port: A port is included in the Port Saturation Report if it meets the following criteria:
The device containing the port is a Switch or Switch-Router, and
The port supports Ethernet (i.e., serial ports are not included), and
The port is not a VLAN port, and
The port is not a trunk port.
Port Availability: A port is available (unused) if it has zero neighbors (usually corresponding to no bar in a graph) for the reporting time window.
% Available: The ratio of Available Ports to Total Ports for the reporting time window.
Port Consumption: A port is consumed (used) if it has one or more neighbors at any time during the reporting time window.
% Consumed: The ratio of Consumed Ports to Total Ports for the reporting time window.

Infoblox NetMRI 7.4.4 Administrator Guide Part 5 Network Compliance
Copyright ©2020, Infoblox, Inc. All rights reserved. Page 338
1.
a.
b.c.
d.
2.a.
b.
a.
b.
c.
Device Usage: The average of all port usages for those ports meeting criteria for port inclusion and belonging to the device during the reporting time window.
Defining Custom ReportsAdministrators can create custom reports to supplement the standard reports provided with NetMRI. After you create them, custom reports are listed in the Reports –> Report Gallery tab, and can be run immediately or scheduled by any user using the same procedures as standard reports.
To create a custom report, do the following:
In the Report Gallery tab, click the Add Custom Report button (in the upper right corner of the Gallery). The Custom Report Wizard appears.
Enter a Title for the report. The title will appear in the Report Gallery tab next to a generic custom report thumbnail.Enter a Description for the report.Select a Data Type. This determines which attributes are available in the next steps. A substantial list of data types is available, including data objects such as ARP Table Entries, Best-Origin Routes, CDP Neighbors, Certificate Repository, and dozens of other choices. (With the Data Type list open, you can hover the mouse over an item to see a description.) A single data type can be chosen for a report.Select a Gallery Category. Choices include the options in the Report Gallery, including Asset, Change & Config, Compliance, Health and Switch Port Management.
Click Next. In Step 2 of the Wizard, specify filters to be applied to the data. Do the following for each filter:In the left-most field at the top of the screen, select an attribute. The attributes (With the list open, hover over an item to see its description.)In the second field at the top, select an operator or a matching condition, depending on the attribute.
Note: Available operators (typically =, !=, <, >, <= and +>) depend on the chosen attribute.
c. In the right-most field at the top of the screen, enter the value to match or compare against (i.e., the argument for the operator). (If an attribute involves a date or date/time, the argument can be a relative date. See the Entering Relative Dates and Times topic.)
The "matches" or "does not match" operator requires a regular expression as the argument.
The "contains" or "does not contain" operator requires a string as the argument.
The "=" and "!=" operators require a numeric or true/false argument. For true, use any of the following: 1, yes, on or true. For false, use any of the following 0, no, off or false.
d. Click Add to add the term to the filter term list. (Click Delete to delete a term.)
e. In the left-most field at the bottom of the screen, select the logic for the filter term(s), such as When ALL of the Conditions are Met, which is a logical AND, When ANY of the Conditions are Met, which is a logical OR expression, or Customlogicbuilder....
Note: If you select Custom logic builder..., use term numbers, Boolean AND and OR operators and parentheses to specify the filtering logic. For example: 1 and (2 or 3).
3. Click Next. To specify the columns to appear in the report, select and order the columns:
To select a column: In the left list, double-click the attribute name (or click the attribute name, then click the button, or drag the attribute name into the right list).To de-select a column: In the right list, double-click the attribute name (or click the attribute name, then click the button, or drag the attribute name into the left list).To re-order a selected column: In the right list, drag a attribute name up or down (or click the attribute name, then click the or button).
4. Click Next. You then specify how the rows are sorted.

Infoblox NetMRI 7.4.4 Administrator Guide Part 5 Network Compliance
Copyright ©2020, Infoblox, Inc. All rights reserved. Page 339
a.
b.c.
a.b.c.
1.2.3.4.5.
1.2.
••
•••••
Note: Rows can be sorted using attributes not displayed in the report. You must specify at least the First Sort Column.
Open the First Sort Column list, then click the attribute to be sorted. (With the attribute list opened, hover over an item to see its description.)Select a direction.As needed, specify Second Sort Column and Third Sort Column.
5. Click Next. This is the final Wizard step.
Review the report specifications.If you need to change anything, click the <Previous button to return to the step(s) needing to be revised.If the specifications are correct, click Finish.
The custom report appears in the Report Gallery tab under the specified category. Test the report to make sure it operates.
Editing Custom ReportsTo edit a custom report, do the following:
In the Report Gallery tab, hover over the custom report you want to edit.Under the report's thumbnail, click the Edit link. The Custom Report Wizard opens.The wizard displays a summary of the custom report specifications. To edit the report, click the Edit button.Navigate through the wizard's steps and change fields as needed.In Step 5, click Finish.
To delete a custom report, do the following:
In the Report Gallery tab, hover over the custom report you want to delete.Under the report's thumbnail, click the Delete link.
Entering Relative Dates and TimesIn Step 2 of the Custom Report Wizard, you specify one or more attributes as report filters. If an attribute involves a date or date/time, its argument can be specified as a relative date. This enables arguments including the following:
now (which resolves to current time, i.e., time that the report executes)yesterday, today, tomorrow (which resolves to midnight of the respective day, where "today" is the day the report is executes)3 days ago10 days since 2010-01-15 (which resolves to 1/25/10)1 month after first day of year (which resolves to February 1)First day of the month 1 month from today (which resolves to the first day of next month)Last day of the month (which resolves to the last day of today's month)
A valid relative date argument string is a list of space-delimited <datestr>s, which are defined as:
<datestr> = CONSTANT | <relative>
where
CONSTANT = <date time> in the format yyyy-mm-dd HH:MM:SS, or <date> in the format yyyy-mm-dd (which resolves to midnight, i.e., 00:00:00, on that date)
<relative> = today | yesterday | tomorrow | now | <which> day <dateinterval> | [<number> <interval> <direction>] | starttime | endtime
(starttime resolves to midnight, i.e., 00:00:00, on the starting day of the period covered by the report, which is specified by the user when running or scheduling the report. endtime resolves to midnight, i.e., 00:00:00, on the day after the ending day of the period covered by the report, which is specified by the user when running or scheduling the report.)

Infoblox NetMRI 7.4.4 Administrator Guide Part 5 Network Compliance
Copyright ©2020, Infoblox, Inc. All rights reserved. Page 340
••
1.2.
1.2.3.4.5.
6.
<which> = first | last
<dateinterval> = year | month | week
<number> = an integer
<interval> = <dateinterval> | hour | minute | second
<direction> = ago | before | until | after | since | from
where ( ago = until = before ) and ( after = since = from )
Of and the are ignored throughout the string, but can be included to make the string more readable, and plural forms are correctly interpreted (e.g., days = day).
Importing and Exporting Custom ReportsYou can export and import custom reports as XML files to facilitate report distribution and sharing. Appropriate permissions are required:
To export custom reports, administrative permissions to run reports are required.To import custom reports, administrative permissions to create, edit and delete custom reports are required.
Note: During a NetMRI upgrade, if a standard report has the same name as an existing custom report, the custom report is renamed using the pattern "<report_name - N", where N is a random number. Currently scheduled versions of the report are also renamed.
Note: Chassis Inventory reports are limited to 2000 items.
To export a custom report, do the following:
In the Reports –> Report Gallery tab, hover over the custom report, then click the Export link.Open or save the custom report file.
To import a custom report, do the following:
In the Reports –> Report Gallery tab, click Import Custom Report.Click Browse... to select the custom report file.Open the Select Category list and designate the report category where the report will reside.Click Import.If the custom report has the same name as an existing custom report, you are prompted to rename the incoming report or overwrite the existing report.If the custom report has the same name as an existing report, you are prompted to rename the new report.

Infoblox NetMRI 7.4.4 Administrator Guide Part 6 Events, Tools and Data Support
Copyright ©2020, Infoblox, Inc. All rights reserved. Page 341
•••••
•
•
•
•
••
Part 6 Events, Tools and Data SupportThis section provides important information about a number of supporting features in NetMRI, including the Notifications feature set, which enables admins to tie individual NetMRI accounts to the types of notification messages they will receive and to set up handling of SNMP, Syslog and electronic mail notifications. Other important features in this section include basic networking tools; an introduction to the process of adding custom network device support to NetMRI; setting up the NetMRI database; and usage of the NetMRI command line. This section includes the following chapters:
Event Notifications and System Health MonitoringToolsNetMRI Database ManagementExtending Network Device & Data SupportAdministrative Shell
Event Notifications and System Health Monitoring
NetMRI provides a comprehensive notification facility to send messages triggered by changes, issues, job status and system alerts of various types. For example, issues generated by NetMRI are strong indicators of potentially serious problems within the network. You may want to be informed whenever certain issues are generated during a scheduled analysis period. Notification subscriptions enable you to request one or more notifications to be sent, via various protocols, to different destinations and raised only by specific device groups and interface groups. Notifications can be customized to support e-mail, SNMP trap and syslog delivery protocols.As with many other elements in NetMRI, a Notification is a type of job; a job that notifies administrators about things that are going on in the NetMRI system, notifying users about problems encountered in the network, by an appliance, or on an Operations Center.Create and manage notifications in these pages:
The Issues page (Network Analysis –> Issues) lists existing notifications, and enables users with appropriate privileges to add and edit notifications. (See Issues and the Network Scorecard for more information.)The Subscriptions page (Settings icon –> Notifications –> Subscriptions) defines which user accounts receive event notifications and the types of notifications they receive. (See Subscribing to Notifications for more information.)The Sent Notifications page lists sent notifications, and enables you to review their details. (See Checking SentNotifications for more information.)The Notification Defaults page (Settings icon –> Notifications–> Defaults) enables an administrator to specify certain default settings for e-mail, syslog and SNMP notification protocols. (See Setting Notification Defaults for more information.)The System Messages page lists the events generated by NetMRI.System Health provides deeper insight into possible Issues related to NetMRI appliance operation. (SeeManaging and Tracking System Health for more information.)
Subscribing to NotificationsThe Subscriptions page (Settings icon –> Notifications –> Subscriptions) lists defined notifications and provides features for editing and creating new ones. Users the appropriate privileges can add and edit notifications.For each e-mail notification subscription, NetMRI sends one e-mail —containing all the events specified in that notification subscription — to each of the specified addresses.
Note: The appliance might send multiple email notifications for certain specific issues, one email notification for each device component. Although, the subject of the email seems to be identical for each device component, the body of the email message provides details about the issue for the specific device component.
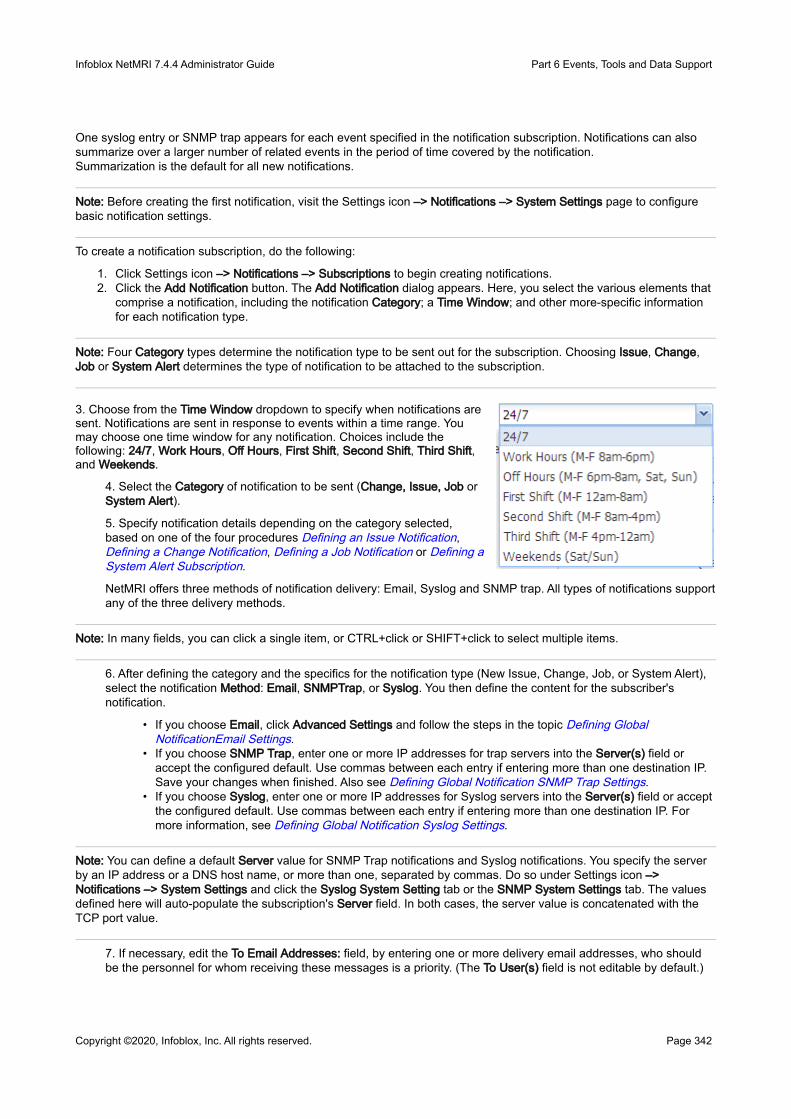
Infoblox NetMRI 7.4.4 Administrator Guide Part 6 Events, Tools and Data Support
Copyright ©2020, Infoblox, Inc. All rights reserved. Page 342
1.2.
•
•
•
One syslog entry or SNMP trap appears for each event specified in the notification subscription. Notifications can also summarize over a larger number of related events in the period of time covered by the notification.Summarization is the default for all new notifications.
Note: Before creating the first notification, visit the Settings icon –> Notifications –> System Settings page to configure basic notification settings.
To create a notification subscription, do the following:
Click Settings icon –> Notifications –> Subscriptions to begin creating notifications.Click the Add Notification button. The Add Notification dialog appears. Here, you select the various elements that comprise a notification, including the notification Category; a Time Window; and other more-specific information for each notification type.
Note: Four Category types determine the notification type to be sent out for the subscription. Choosing Issue, Change, Job or System Alert determines the type of notification to be attached to the subscription.
3. Choose from the Time Window dropdown to specify when notifications are sent. Notifications are sent in response to events within a time range. You may choose one time window for any notification. Choices include the following: 24/7, Work Hours, Off Hours, First Shift, Second Shift, Third Shift, and Weekends.
4. Select the Category of notification to be sent (Change, Issue, Job or System Alert).
5. Specify notification details depending on the category selected, based on one of the four procedures Defining an Issue Notification, Defining a Change Notification, Defining a Job Notification or Defining a System Alert Subscription.
NetMRI offers three methods of notification delivery: Email, Syslog and SNMP trap. All types of notifications support any of the three delivery methods.
Note: In many fields, you can click a single item, or CTRL+click or SHIFT+click to select multiple items.
6. After defining the category and the specifics for the notification type (New Issue, Change, Job, or System Alert), select the notification Method: Email, SNMPTrap, or Syslog. You then define the content for the subscriber's notification.
If you choose Email, click Advanced Settings and follow the steps in the topic Defining Global NotificationEmail Settings.If you choose SNMP Trap, enter one or more IP addresses for trap servers into the Server(s) field or accept the configured default. Use commas between each entry if entering more than one destination IP. Save your changes when finished. Also see Defining Global Notification SNMP Trap Settings.If you choose Syslog, enter one or more IP addresses for Syslog servers into the Server(s) field or accept the configured default. Use commas between each entry if entering more than one destination IP. For more information, see Defining Global Notification Syslog Settings.
Note: You can define a default Server value for SNMP Trap notifications and Syslog notifications. You specify the server by an IP address or a DNS host name, or more than one, separated by commas. Do so under Settings icon –> Notifications –> System Settings and click the Syslog System Setting tab or the SNMP System Settings tab. The values defined here will auto-populate the subscription's Server field. In both cases, the server value is concatenated with the TCP port value.
7. If necessary, edit the To Email Addresses: field, by entering one or more delivery email addresses, who should be the personnel for whom receiving these messages is a priority. (The To User(s) field is not editable by default.)

Infoblox NetMRI 7.4.4 Administrator Guide Part 6 Events, Tools and Data Support
Copyright ©2020, Infoblox, Inc. All rights reserved. Page 343
1.2.3.4.5.
6.
7.
8.9.
10.
8. By default, NetMRI enables the Summarize: checkbox to allow the recipients to obtain a summary of all related events within the notification time period. This summarization is based upon the Schedule over which the notifications are sent. Click EditSchedule to change the frequency: Once, Hourly, Daily, Weekly or Monthly, and choose the timing settings for the desired time period.
9. Click Save when finished.
10. Click Save to complete the notification. The Subscriptions table refreshes to show the new entry. To edit any notification: Click the Action icon and choose Edit.
To test any notification: Click the Action icon and choose Test.To delete any notification: Click the Action icon and choose Delete.
Note: In all cases, you have the option to Send Clearing Notifications, which is a checkbox on the top right of the Add Notification page. This indicates to the recipient that the issue previously reported on has been cleared. Clearing notifications have a severity of Info.
By default, NetMRI assigns New Issues notifications to All Device Groups and All Interface Groups. When you define New Issues notifications, you can choose the Device Groups and Interface Groups to which the notification applies.
You apply Change and Job notifications to one or more individual device groups. This allows for more granularity in how notifications are sent–a particular notification may only apply to Ethernet switched networks, and thus only be applied to the Switching device group.
When being generated and sent to recipients, Notifications can occupy significant system and network resources. For example, creating a new Subscription under the New Issues category with the setting All Issues without paying attention to scheduling or summarization, or a System Alert notification subscription with a large number of selected alert types, may create a substantial stream of notifications to the recipients in the subscription, and needlessly occupy processing and network resources in NetMRI. Avoid creating subscriptions that apply too broadly to various network phenomena or that are sent too frequently to too many recipients. Check for such issues in the System Messages page (Settings icon –> Notifications –> System Messages). For more information, see System Messages.
The following topics describe the four notification types in greater detail.
Defining an Issue NotificationNew Issue notifications let administrators know when problems are detected by NetMRI during network data collection. (For more information about Issues, see Evaluating Issues in NetMRI.)
To define a New Issue notification, do the following:
Click Settings icon –> Notifications –> Subscriptions to begin creating notifications.Click Add Notification.From the Category dropdown, choose Issue.Choose the Time Window over which the notification subscription will operate.If necessary, enable the Send Clearing Notifications option in the upper right corner. If activated, a notification is sent when an issue covered by the notification is cleared.Choose the Severity: Info, Warning or Error.Info, Warning and Error are the three standard NetMRI severity classifications.Choose the Issues to trigger the notification. Select multiple issues by holding the Ctrl key or the Shift key while selecting. Selecting All Issues automatically enables any issues to generate a notification.Choose one or more Device Groups for triggering notifications of specified issues.Choose one or more Interface Groups for triggering notifications of specified issues.Choose the Method by which admins will receive Job notifications: Email, SNMP Trap or by Syslog.For Email: select the To Users to receive the notification. (Administrators can send notifications to anyone. Non-administrative users can send notifications only to themselves.)Specify additional To email address(es) if needed. Separate multiple e-mail addresses by commas.
Note: Email notifications also require the correct SMTP servers to be configured in the appliance to support sending the notifications to their destinations. See the Setting Notification Defaults topic for more information.

Infoblox NetMRI 7.4.4 Administrator Guide Part 6 Events, Tools and Data Support
Copyright ©2020, Infoblox, Inc. All rights reserved. Page 344
••
1.2.3.4.
•••
•
•
•
•
•
If needed, click Edit Schedule to specify a schedule for the summary e-mail notification;
The Summarize check box sends a digest email of the system alerts for the selected category, providing a way to reduce email quantities sent to administrators’ inboxes. Deactivate the Summarize check box to receive all notifications for each individual system alert.
To manage notification email settings in more detail, click the Advanced Settings button to override default settings for sender information, message type, message subject, message content and details. See Notification Content and Formatting for information about placeholder variables.
Note: If you select Plain Text as the message body, the HTML formatting is erased in the notification email.
For SNMP Trap: override the default Server(s) by entering a new IP address.For Syslog: Optionally, Override the default Server(s) and Message. See the Notification Content and Formatting topic for information about placeholder variables.
11. Click Save.
Defining a Change NotificationChange notifications inform NetMRI administrators about configuration changes and device status changes that take place on the network.
NetMRI also provides the ability to prevent excessive Config Change notifications based on changes in volatile or transient configuration data changes that bear little or no significance in device operation or device management, such as admin password changes.
Filtering of such notifications occurs automatically without user intervention. You can also use an Advanced Setting to specify a list of user accounts that NetMRI can “ignore” when those users commit configuration changes that would otherwise be reported. (For information, see Filtering Change Notifications from User Accounts below.)
To define a Change notification, do the following:
Click Settings icon –> Notifications –> Subscriptions to begin creating notifications.Click Add Notification.From the Category dropdown, choose Change.In the Change Types section, select one out of six choices (or Ctrl+click to select more than one):
All: all types;Admin: changes to the actual configuration files on the device(s);External: changes to the devices in the notification that are carried out by an external source, such as a change to the DNS record on a device;Hardware: Notification of a change in a device’s hardware configuration, such as the removal or addition of a network module or line card;Software: notification of a change in the device’s software/OS version.
5.Choose the Method by which admins will receive Job notifications: Email, SNMP Trap or by Syslog.
For Email: select the To Users to receive the notification. (An administrator can send notifications to anyone. Non-administrative users can send notifications only to themselves.)Specify additional To email address(es) if needed. Separate multiple e-mail addresses by commas.
Note: Email notifications also require the correct SMTP servers to be configured in the appliance to support sending the notifications to their destinations. For information, see Setting Notification Defaults.
If necessary, click Edit Schedule to specify a schedule for the summary e-mail notification, or deactivate the Summarize check box to receive all notifications for each individual system alert.The Summarize check box sends a digest email of the system alerts for the selected category, providing a way to reduce email quantities sent to administrators’ inboxes.

Infoblox NetMRI 7.4.4 Administrator Guide Part 6 Events, Tools and Data Support
Copyright ©2020, Infoblox, Inc. All rights reserved. Page 345
•
••
1.2.3.
4.
1.2.3.4.5.6.
•
•
•
•
To manage notification email settings in more detail: click the Advanced Settings button to override default settings for sender information, message type, message subject, message content and details. For information, see Notification Content and Formatting.For SNMP Trap: override the default Server(s) by entering a new IP address.For Syslog: If necessary, override the default Server(s) and Message. See the Notification Content and Formatting topic for information about placeholder variables.
6.Click Save.
Filtering Change Notifications from User AccountsYou can filter and ignore configuration change notifications executed by automated systems operating with network infrastructure, or filter change notifications resulting from executions of a NetMRI Automated Change Management (ACM) process. These processes often use a designated login. NetMRI can use these logins as signals to filter out any and all Change Notifications while the job executes. This enables the appliance to ignore such messages for Configuration Management purposes.
Network devices affected by such tasks must be configured to send Syslog messages to the NetMRI appliance.
You configure an Advanced Setting to complete this configuration:
Click Settings icon –> General Settings –> Advanced Settings.In the Configuration Management category, Action Edit for the Config Syslog Change Filter Usernames setting.Enter a comma-delimited list of user names for the automated systems or admin user accounts, such as follows:rsmith,hpnode_1,hpnode_2,cab_admin,grey_gooseClick OK when complete.
Defining a Job NotificationJob notifications inform NetMRI administrators when a job they've created completes execution, requires approval or gets approved by their administrator. NetMRI generates notifications for both successful job executions and for job failure issues.To define a Job notification, do the following:
Click Settings icon –> Notifications –> Subscriptions to begin creating notifications.Click Add Notification.From the Category dropdown, choose Job.Choose the Job Status: All, Requiring Approval, Approved, or Completed.Choose one or more Device Groups that will trigger notifications of the specified issues.Choose the Method by which admins will receive Job notifications: Email, SNMP Trap or by Syslog.
For Email: select the To Users to receive the notification. (Administrators can send notifications to anyone.Non-administrative users can send notifications only to themselves.)Specify additional To email address(es) if needed. Separate multiple e-mail addresses by commas.
Note: Email notifications require the correct SMTP servers to be configured in the appliance to support sending the notifications to their destinations. See the Setting Notification Defaults topic for more information.
If necessary, click Edit Schedule to specify a schedule for the summary e-mail notification, or deactivate the Summarize check box to receive all notifications for each individual system alert.The Summarize check box sends a digest email of the system alerts for the selected category, providing a way to reduce email quantities sent to administrators' inboxes.To manage notification email settings in more detail: click the Advanced Settings button to override default settings for sender information, message type, message subject, message content and details. See Notification Content and Formatting for information about placeholder variables.
Note: If you select PlainText as the message body, the HTML formatting is erased in the notification email.

Infoblox NetMRI 7.4.4 Administrator Guide Part 6 Events, Tools and Data Support
Copyright ©2020, Infoblox, Inc. All rights reserved. Page 346
••
1.2.3.4.
•
••
•
•
•
•
••
For SNMP Trap: override the default Server(s) by entering a new IP address.For Syslog: If necessary, override the default Server(s) and Message. See the Notification Content andFormatting topic for information about placeholder variables.
7. Click Save.
Defining a System Alert SubscriptionAdmins can receive notifications for appliance alerts. Such alerts involve occurrences such as maintenance events, updates, reboots, system health issues, and general appliance errors. Alerts generate notifications; in turn, notifications can generate SNMP traps. (For information about system health alerts, see Managing and Tracking System Health.) To define a System Alert notification, do the following:
Click Settings icon –> Notifications –> Subscriptions to begin creating notifications.Click Add Notification.From the Category dropdown, choose System Alert.Choose the System Types: (you can select one or more types by CTRL-clicking them):
General alerts: All Event, User Logins, User Logout, NetMRI Maintenance, Update Information, or General Errors.IP phone issues: VoIP messages.System Health types: System Hardware Failure, Software Health Alert, Processing Health Alert, Storage Health Alert, Network Health Alert, Platform Capacity Health Alert, and Collector Connectivity Health Alert.
5. Choose the Method by which admins will receive Job notifications: Email, SNMP Trap or by Syslog.
For Email: select the ToUsers to receive the notification. (Administrators can send notifications to anyone.Non-administrative users can send notifications only to themselves.)Specify additional To email address(es) if needed. Separate multiple e-mail addresses by commas.
Note: Email notifications require correct SMTP servers to be configured in the appliance to send notifications to their destinations. See the Setting Notification Defaults topic for more information.
If necessary, click Edit Schedule to specify a schedule for the summary e-mail notification, or deactivate the Summarize check box to receive all notifications for each individual system alert.The Summarize check box sends a digest email of the system alerts for the selected category, providing a way to reduce email quantities sent to administrators' inboxes.To manage notification email settings in more detail: click Advanced Settings to override default settings for sender information, message type, message subject, message content and details. See Notification Content and Formatting and Email Formatting Guidelines for Individual Notifications for more information about placeholder notification variables and email formatting.
Note: If you select Plain Text as the message body, the HTML formatting is erased in the notification email.
For SNMP Trap: override the default Server(s) by entering a new IP address.For Syslog: If necessary, override the default Server(s) and Message.
6. Click Save.
Messages for System AlertsAlert subscriptions use the System Types list to define the events that generate notifications. As noted, the General alerts category consists of the following: All Event, User Logins, User Logout, NetMRI Maintenance, Update Information, or General Errors.The following table lists the alert messages provided by notifications using each alert category.

Infoblox NetMRI 7.4.4 Administrator Guide Part 6 Events, Tools and Data Support
Copyright ©2020, Infoblox, Inc. All rights reserved. Page 347
General Alert Categories Alert Messages
User Logins Failed login attempt for user User successfully logged in
User Lockout User locked out due to excessive failed logins
NetMRI Maintenance Background upgrade has aborted with <X> of <Y> tables processed
Background upgrade has completed with <Y> tables processed
Update Information NetMRI Update Installed NetMRI <X> Update(s) Available NetMRI Issue Upgrade Complete
General Errors Global config collection is disabled
Weekly maintenance is disabled
Infoblox Sync could not export data
Not polling interface performance data for X
Rapid polling interface limit exceeded
Rapid polling interface limit exceeded
Future ifLastChange for device X on interface Y(…)
Device reboot time may need to be adjusted
System Hardware Failure Hardware failure detected for X:Y (depends on data collected from sensors)
For information on System Health alerts, which are a separate category, see Managing and Tracking System Health.
Notification Content and FormattingYou can specify the content and formatting of issue, change, job and system alert notifications created in the Subscriptions page, and for the defaults specified in the Settings icon –> Notifications –> System Settings page.
Defaults for summary e-mail notifications cannot be edited; you can edit individual summary e-mail notifications. Afterwards, all summary notifications of that specific type reflect your changes for email formatting defaults.
You can change the content and format in the subject, message body and details field for other e-mail notifications. For Syslog notifications, you can change the content and format of the message.
NetMRI uses variables to represent specific data to be substituted at the time of notification. Variables are identified by a dollar sign, followed by the name of the variable. The Notification Variables topic describes all variables for use in notifications. When NetMRI builds a notification, it substitutes data derived from the specific Issue, Change, Job or Alert, for each variable in the Subject line and in the body of the message. If data is missing for a variable, the notification substitutes a blank for the missing data.
Example: The default Issues e-mail subject line contains three Notification Variables:
$SeverityName: $Title seen on $Identifier
For a firewall redundancy failure error, NetMRI rewrites the notification subject line using the variables:

Infoblox NetMRI 7.4.4 Administrator Guide Part 6 Events, Tools and Data Support
Copyright ©2020, Infoblox, Inc. All rights reserved. Page 348
•
•
•
Error: Firewall Redundancy Failure seen on Cisco (172.23.18.66)
Email Formatting Guidelines for Individual NotificationsFor e-mail notifications of all types, error messages are generated if NetMRI cannot connect to the SMTP server or deliver the test message.
Note: For SNMP or Syslog notifications, NetMRI will not be able to determine whether delivery was successful, so administrators need to check for delivery status on the remote recipient.
If you edit the email template for a new or existing notification, you will not affect the default template. Changes for a notification remain local to that notification.For any notification type (Change, Issue, Job or System Alert), click Advanced Settings to locate the message formatting tools.
Enter the From Address and From Name values that will roughly identify the sender of the notification. The default shows a standard "no reply" email address for sending notifications that are not intended to receive replies.Select the Mime Type which will be either HTML (the default) or Text. In both cases, NetMRI uses the notification variables to help format the message block for the email. If electing to use HTML, you can edit the HTML coding information provided in the standard email; or choose not to edit at all. The message is given in each email, including values presented through notification variables to identify the system phenomenon generating the notification. You can edit the sample HTML in place, copy and paste the sample HTML into a dedicated editor (pasting your changes back into the Message field), or paste in a completely different HTML form letter. Always keep notification variables in mind when editing this field, and exercise caution when removing or editing variables in the message block.In the Message block, exercise caution when developing HTML or plaintext emails. The variables used in both message types provide the useful information for every message, are dynamically updated by NetMRI when generating notifications, and should be preserved during editing. Test the notification messages based on the default formatting before making significant changes. You can click Restore Defaults at any time to recover the factory message formatting.
See Notification Variables and Setting Notification Defaults for more detail on variables for notification email content.
Notification VariablesUse notification variables to build the Subject line and message body of all notification types; email notifications are a prominent example. Notification variables consist of the following:
Variable Description Message Type
$Country Country for which NetMRI unit is configured. Summary, Non-Summary
$DeviceLimit Maximum number of devices the current NetMRI appliance is licensed to monitor.
Summary, Non-Summary
$EventDetails For summary: HTML: a formatted table for each issue or change type, listing individual instances of that issue or change type. Plain Text: a comma separated list of individual instances grouped by issue or change type. For non-summary: name/value pairs of additional information. This data derives from the original issue definition and take its data from the table of information previously defined for the issue.
Summary, Non-Summary

Infoblox NetMRI 7.4.4 Administrator Guide Part 6 Events, Tools and Data Support
Copyright ©2020, Infoblox, Inc. All rights reserved. Page 349
Variable Description Message Type
$EventSummary HTML: an event summary table.
Plain Text: a comma separated list.
For issues: lists severity, issue type, number of instances, and date/time.
For changes: lists change type, number of instances, and date/time.
Summary
$Identifier Object that triggered the event (see additional information below). Summary, Non-Summary
$InterfaceLimit Maximum number of interfaces this NetMRI instance is licensed to monitor.
Summary, Non-Summary
$JobName Name assigned to a job definition. Non-Summary
$JobDescription Descriptive text (if any) given to the job definition (so it may not match what is shown in NetMRI).
Non-Summary
$JobDevices List of devices selected by job author. Shown by device name if non-blank, then by device IP address. If job author has not selected any devices, the text "No individual devices selected" appears.
Non-Summary
$JobDeviceGroups List of devices, selected by job author, where the job runs. If the job author has not selected any device groups, the text "No device groups selected" appears.
Non-Summary
$JobScriptName Script that the job will run. Non-Summary
$JobScriptLevel Level of script specified in $JobScriptName. Non-Summary
$JobMessage Message provided by job notification (internally built by NetMRI):
"Job completed successfully." "Job canceled by user." "Job competed with skipped devices." (No message shown on not-yet-approved messages, because that information is already available)
Non-Summary
$JobStatus The job status at notification time. (This can change if the job reruns, either per schedule or rerun by the user.)
Non-Summary
$Model NetMRI appliance model number. Summary, Non-Summary
$NetworkName Name of the network monitored by NetMRI. Summary, Non-Summary

Infoblox NetMRI 7.4.4 Administrator Guide Part 6 Events, Tools and Data Support
Copyright ©2020, Infoblox, Inc. All rights reserved. Page 350
Variable Description Message Type
$RunDate Date when the notification was processed (see additional information below).
Summary, Non-Summary
$SerialNo NetMRI appliance serial number. Summary, Non-Summary
$ServerURL URL of server running NetMRI. An HTML notification will provide a link to the server.
Summary, Non-Summary
$ServerName Name of server running NetMRI. An HTML notification will provide a link to the server.
Summary, Non-Summary
$SeverityName The name of the severity Type for the reported notification. Three valid values are used by NetMRI: Error, Warning and Info.
Summary, Non-Summary
$TimeZone Time zone specified in NetMRI configuration. Summary, Non-Summary
$Title Provides brief information about the event; this variable can be useful as the e-mail subject. Does not state the concerned device. $Title is different for each notification category: "$IssueType" for issues.
"$ChangeType" for changes.
"Job $JobName not approved" for jobs not yet approved.
"$JobMessage $JobName" for all other completed jobs.
"$Title" for system alerts.
Summary, Non-Summary
$TotalCount Total number of processed events. Summary
$TypeCount Total number of unique Type IDs. Notifications have a Type ID, which is a string of up to 255 characters in length; numerous notifications with the same Type ID can be counted in the summary if a summary is sent.
Summary
$Version The NetMRI version number. Summary, Non-Summary
The $Identifier variable: NetMRI builds $Identifier to identify the object that triggered the event. If the name of the device can be determined, it will appear first. An IP address or MAC address follows in parentheses (see Alternative 1 below). If no name exists, the notification shows the IP or MAC address (see Alternative 2). For a VLAN, if the event does not deal with a specific device, the identifier uses the VLAN name (see Alternative 3). In all cases, if the message is formatted in HTML, NetMRI adds links in the body of the message to enable access to the object.
Alternative 1: <device name> (<device IP or MAC address)
Alternative 2: <device IP or MAC address>
Alternative 3: <VLAN name>

Infoblox NetMRI 7.4.4 Administrator Guide Part 6 Events, Tools and Data Support
Copyright ©2020, Infoblox, Inc. All rights reserved. Page 351
1.
2.
3.
4.5.
The $RunDate variable: $RunDate is useful as part of summary notifications, which run at set intervals (hourly, daily, monthly, etc.) and collect all events that happened since the last time NetMRI sent the notification. Because the gap is larger between Issue/Change Timestamps and the notification RunDate, $RunDate is more useful in the summary case.
Example: You set up a monthly notification on Interface Down issues. Suppose two of those issues fire on the 15th and the notification fires on the first of the next month. 14, 15, or 16 days elapse between the Issue Timestamp and when the notification was processed.
$RunDate is less useful for non-summary notifications, because notifications process every few minutes; there is a minimal difference between the Issue/Change Timestamp and the RunDate.
Setting Notification DefaultsUse the Settings icon –> Notifications –> System Settings page to set defaults for notification delivery methods, using three groups of settings: Email System Settings, Syslog System Settings and SNMP System Settings. These settings determine how and where notifications are sent to recipients, and what those notifications look like. All four notification types (Issue, Change, Job and Alert) support HTML and plain text emails.
Note: Individual notification settings supersede default settings.
Defining Global Notification Email SettingsIn the Email System Settings tab, you specify SMTP server details, sender authorizations, "from" name and address, subject, message format and message content. (Also see Notification Content and Formatting for more information on defining content for the Subject and Message fields.)The primary element of any Email notification is a template of HTML/CSS code that draws upon a series of NetMRI notification variables (described in the topic Notification Variables) to show the correct information in the email. Infoblox recommends using the default email formatting and customizing the actual output after evaluating the results from emails generated from the factory-defined template.To define email settings, do the following:
Go to the Settings icon –> Notifications –> System Settings page. The Email System Settings tab appears by default.Enter the From Name and From Address values that will identify the sender of the notification. The default shows a "no reply" email address which is standard form when sending notifications that are not intended to be replied to.Select the Format which will be either HTML (the default) or Text. In both cases, NetMRI uses the notification variables to help format the message block for the email. If electing to use HTML, you can edit the HTML coding information provided in the standard email; or choose not to edit at all. The message is given in each email, including values presented through notification variables to identify the system phenomenon generating the notification. You can edit the sample HTML in place, copy and paste the sample HTML into a dedicated editor (pasting the results back into the Message field), or paste in a completely different HTML form letter. Always keep notification variables in mind when editing this field, and exercise caution when removing or editing variables in the message block.Enter the Username and Password for the server's standard admin account.Choose the Category to which the current email settings will be applied.
Note: Depending on the selected category, the default contents of the Subject and Message fields will change. The Subject field formats differently based on the notification type. Issue, for example, uses three separate variables ($SeverityName; $Title and $Identifier) to structure the content of the subject line. You do not need to edit variables directly in the subject line.
6. If selecting System Alert as the Category, enter the subject line for the default email message settings.
7. Choose whether to format the Message as plain text or HTML.

Infoblox NetMRI 7.4.4 Administrator Guide Part 6 Events, Tools and Data Support
Copyright ©2020, Infoblox, Inc. All rights reserved. Page 352
•
•
1.2.3.
4.5.
6.
7.8.
9.
1.2.
8. (For Issue notifications only) Use the Details field to include the issue name (using the $Name variable) and value at the time the issue is raised (using the $Value variable). These variables are only valid in the Details field.
9. Click Save when finished.
If you make a mistake or want to remove all notification settings for another reason, click Restore Defaults. The Notification –> System Settings are erased—configured Notifications and subscriptions are preserved.
Note: The Category list and Format option control the information shown in the e-mail Subject, Message and Detailsfields. Eight combinations of Category and Format are possible, so be sure to review/change the formatted content for all combinations.
Typical usage:
For an HTML message, data is included as a row within a table, for example:
<TR><TD> optional_cell_style$Name</TD><TD> optional_cell_style$Value</TD></TR>.
For a plain text message, this field would contain just the variables: $Name, $Value.
A valid SMTP server name or IP address must be entered in this tab before e-mail notifications can be created via the Subscriptions page. The SMTP server must be configured to accept incoming e-mail messages from NetMRI to be relayed to the appropriate destinations.
Defining Global Notification Syslog Settings
Note: Syslog does not provide acknowledgment of message delivery.
To define notification settings for Syslog servers, do the following:
Go to the Settings icon –> Notifications –> System Settings page.Click the Syslog System Settings tab.Enter the Syslog server DNS name or IP address in the Syslog Server field. Use commas between each entry if entering more than one default destination IP or host name. These settings are unrelated to the Syslog Forwarding settings under the Settings icon –> Setup –> Syslog Forwarding page in NetMRI. When you create a new notification subscription, this server value auto-populates the Server field for all SNMP trap subscriptions.If necessary, enter the TCP Port over which the Syslog server is running. The default standard value is 514.Choose the service Facility over which notifications will be sent. In many cases the default, Local Use 0, may be used. You can use different facilities based on the urgency of the notification. This may change the network service over which the notification message is relayed.If necessary, select the Severity level for Errors (Severity:Error), Warnings (Severity:Warning) and Informational messages (Severity:Info) or retain the defaults.Choose the Category for which the current syslog message settings will be applied.In the Message field, enter the text message that will apply to each notification. Do so for each of the four categories if necessary. The Category list controls the data appearing in the Message field.Click Save when finished.
If you make a mistake or want to remove all notification settings for another reason, click Restore Defaults. Clicking Restore Defaults restores all settings (including currently hidden settings) in all three tabs in this page.
Changing the Syslog FacilityYou can change the Syslog facility to which NetMRI automatically forwards log messages. The default is 16–Local Use 0 and can be changed to any Syslog-compliant value. To do so, do the following:
Go to the Settings icon –> General Settings –> Advanced Settings page.Click the right arrow once, and click the Edit icon for the Syslog Facility setting under Notification. Syslog SystemSettings tab.
Infoblox NetMRI 7.4.4 Administrator Guide Part 6 Events, Tools and Data Support
Copyright ©2020, Infoblox, Inc. All rights reserved. Page 353
3.4.
1.2.3.
•
4.5.6.7.
•
••
•
••••••
•
From the Syslog Facility dropdown, select the new facility value.Click OK to save changes.
Defining Global Notification SNMP Trap SettingsSome event monitoring systems accept SNMP traps as input for reporting. NetMRI can send notifications as SNMP Traps to other monitoring systems that use them as an event reporting mechanism.To define NetMRI notification SNMP settings, do the following:
Go to the Settings icon –> Notifications –> System Settings page.Click the SNMP System Settings tab.Enter the SNMP server DNS name or IP address in the Syslog Server field. Use commas between each entry if entering more than one default destination IP or host name.
When you create a new notification subscription, this server value auto-populates the Server field for all SNMP trap subscriptions.
If necessary, enter the TCP Port over which the SNMP server is running. The default standard value is 162.Enter the SNMP Community string.Choose the TrapT ype: v1Trap, V2cTrap, or V2c Inform.Click Save when finished.
If you make a mistake or want to remove all notification settings for another reason, click RestoreDefaults. Clicking Restore Defaults restores all settings (including currently hidden settings) in all three tabs in this page.
Checking Sent NotificationsThe Sent Notifications page (Settings icon –> Notifications –> Sent Notifications) lists notifications that have been sent, sortable in ascending or descending order by Destination, Timestamp, Method, Category and Type.Any of the five columns can be removed from or restored to the table. When you arrange the table to a preferred setup, you can save it to a View by selecting Views –> Add View just above the table.
Managing and Tracking System HealthSystem Health is a NetMRI feature to provide a view of the system health of the NetMRI appliance. NetMRI provides two visual inputs to notify and assist the administrator in responding to issues in the NetMRI appliance:
Report message banners at the top of the NetMRI screen provide quick notification of problems.A Settings page, System Health, provides a more-detailed list of the problems affecting the system, including Controller and Collector appliances in an Operation Center environment (where applicable).
System Health input categories include the following:
Hardware – Appliance hardware, including fans and power supplies, internal and external (ambient) temperatures, and RAID array status;Software – The appliance's NetMRI software;Network – Connectivity on MGMT and SCAN interfaces, and reachability to external database archive systems;Storage – Available disk space, and Internal hard disk status.Platform Capacity – Warnings about exceeding support capacity for devices, interfaces and end hosts.Processing – Warnings about various causes of excessive demands on system resources.Collector Connectivity – Operations Center Collector network reachability. Does not apply to standalone NetMRI appliances.Configuration – Comprised of Unassigned VRF notifications, letting the administrator know that a discovered virtual routing and forwarding network (VRF) has been discovered and must be mapped to a network view.

Infoblox NetMRI 7.4.4 Administrator Guide Part 6 Events, Tools and Data Support
Copyright ©2020, Infoblox, Inc. All rights reserved. Page 354
••
•
•
Operations Center System Health ListingsSystem Health features for the NetMRI Operations Center environment will list all issues associated with the Operations Center appliance and for all of its associated Collectors.All reported issues are the same for all alerts described in the previous topics; the main difference is that the System Health feature applies globally to all appliances and virtual appliances within the distributed Operations Center environment.
Note: Every message listed in the System Health page provides an Alert Code, similar to the following:
SOFT001
If you need to communicate with Customer Support for an issue, ensure that you provide this code to the support representative.
In this section, you will find descriptions for all alerts in the System Health category, descriptions of possible causes for the issue, and potential fixes for each alert.
System Health Color CodingSystem Health alerts provide the following standard color coding in the System Health page under NetMRI Settings:
Green: indicates no issues currently present in the category.Yellow: Warning. Warning health alerts appear when an issues appears that poses potential for more severe problems in the future, or a configuration issue that should be addressed; for example, a disk utilization level of 70% in a NetMRI appliance, Operations Center, or a Collector in an Operations Center network will raise a Warning alert, as will a detected VRF network that is not yet mapped to a network view.Red: Critical. An issue that needs to be addressed as soon as possible. Critical alerts occur in cases where, for example, storage utilization is at 90% or higher, or a system fan fails or is removed from the appliance.Grey: Offline. Alerts colored Grey appear only for Operations Center Collectors that are offline due to expected causes, such as a Collector being taken offline for replacement or changes to configuration.
Banner System Health messages appear only in yellow (Warning) and red (Critical). Click directly on the banner text to display the System Health page with its alert listings.You may disallow the System Health banners from appearing to non-Admin NetMRI users, by opening the Settings – > General Settings –> Advanced Settings page and choosing the Hide the system banners from non-admin users setting. (It is on the last page of Advanced Settings, under User Administration.) Click the Action icon and choose Edit, choose Yes and click OK.
Categories of Health StatusSystem Health alerts also support notification subscriptions (see Subscribing to Notifications for more information). System Health notifications fall into the following general types: System Hardware Alert, Software Health Alert, Processing Health Alert, Storage Health Alert, Network Health Alert, Platform Capacity Health Alert, and Collector Connectivity Health Alert.Individual alert types gather under the seven basic System Health categories. The following table provides a summary of the System Health alerts.

Infoblox NetMRI 7.4.4 Administrator Guide Part 6 Events, Tools and Data Support
Copyright ©2020, Infoblox, Inc. All rights reserved. Page 355
Health Alert Category Alert Messages Description
Hardware (see Details on Hardware Alerts for more information)
RAID Drive <X> Failed.
RAID Array Failed.
Fan <X> Failed.
Power Supply <X> Failed.
High Ambient Temperature.
High Internal Temperature.
RAID Battery Failed.
RAID Array Failed.
This category applies only to hardware-based NetMRI systems and will not appear for virtual machine-based NetMRI instances. RAID messages apply only to appliances that directly support RAID, including the NT-2200 and NT-4000 models. NetMRI 1102-A models do not support hardware monitoring alerts. NT-1400 and NT-2200 systems do not report Ambient Temperatures. Double-clicking any hardware Issue that appears in this category opens the Settings –> Notifications –> Hardware Status page.
Network (see Details on Network Alerts for more information)
High rate of network errors on MGMT port.
Network link down on MGMT port.
High rate of network errors on SCAN port.
Network link down on SCAN port.
General network connectivity issues on the NetMRI appliance.
Errors related to sending jumbo frames are excluded from the triggers of the alert messages "NETW000: High number of network errors on management port" and "NETW001: High number of network errors on SCAN port".
Platform Capacity (see Details on Network Alerts for more information)
Number of interfaces <count> exceeds Platform Interface Limit of <limit>. Number of end hosts <count> exceeds Platform SPM End Host Limit of <limit>. Number of devices <count> exceeds Platform Total Device Limit of <limit>.
Reflects issues where the current level of discovered network devices, interfaces or end hosts is exceeding the platform limits for the appliance. Does not apply to licensed limits. Platform limit values can be located in the Settings icon –> Setup –> Settings Summary page.
Processing (see Details on Processing Alerts for more information)
Processing Capacity is being exceeded. Processing Alerts reflect Issues where the system processing capacity is being exceeded in the current system configuration.
Software (see Details on Software Alerts for more information)
A software problem was detected. A software problem was detected during Weekly Maintenance.
In all cases, contact Customer Support for assistance.
Storage (see Details on Storage Alerts for more information)
Low on disk space
Critically low on disk space
Cannot Connect to remote archive storage
Could not save archive to remote storage <hostname>
Disk <X> Failed.
Low on Disk Space indicates that System Health recommends preventive action to increase available disk space in the appliance. Critically Low on Disk Space indicates an impending failure due to insufficient disk space.
Collector Connectivity (see Details on Operation Center Collector Alerts for more information)
Connection to Collector <X> lost. Collector <X> Reset. Collector <X> is Rebooting.
Issues associated with collector reachability and connectivity in an Operation Center deployment.

Infoblox NetMRI 7.4.4 Administrator Guide Part 6 Events, Tools and Data Support
Copyright ©2020, Infoblox, Inc. All rights reserved. Page 356
Health Alert Category Alert Messages Description
Configuration (see Details on Configuration Alerts for more information)
New unassigned VRF discovered. Warning notification that a VRF network has been discovered and should be placed into a network view by the administrator.
Details on Software AlertsSystem Health monitors the overall health and operation of the NetMRI software. It is used for reporting potentially important software issues to Customer Support that might otherwise go unnoticed by the user. In all cases, software problem messages should be reported to Customer Support along with the issue code.
Alert Message User Action
Warning — A software problem was detected. Contact Support. Contact Customer Support.
Critical — A critical software problem was detected. Contact Customer Support.
Warning — A software problem was detected during Weekly Maintenance. Contact Customer Support.
Details on Network AlertsNetwork alerts apply to the MGMT and SCAN Ethernet interfaces on the NetMRI appliance.
Alert Message User Action
High number of network errors on MGMT port. Check the network connection for the appliance MGMT port, including the neighboring interface configuration.
Critical — Network link down on MGMT port. Check the network connection for the appliance MGMT port, including the neighboring interface configuration.
Warning — High rate of network errors on SCAN port. Check the network connection for the appliance SCAN port, including the neighboring interface configuration.
Critical — Network link down on SCAN port. Check the network connection for the appliance SCAN port, including the neighboring interface configuration.
Details on Platform Capacity AlertsPlatform Capacity alerts do not necessarily reflect a problem in the NetMRI system. Each NetMRI appliance has an advisory limit in the number of discovered interfaces, discovered devices and discovered end host devices that it is expected to support, based on disk space and system processing capabilities inherent in the appliance model. These values are called the Platform Capacity and are also reflected in the NetMRI Configuration values shown under the Settings icon –> Setup –> Settings Summary page.Unlike other System Alert categories, Platform Capacity warnings will always appear when all three of the advisory
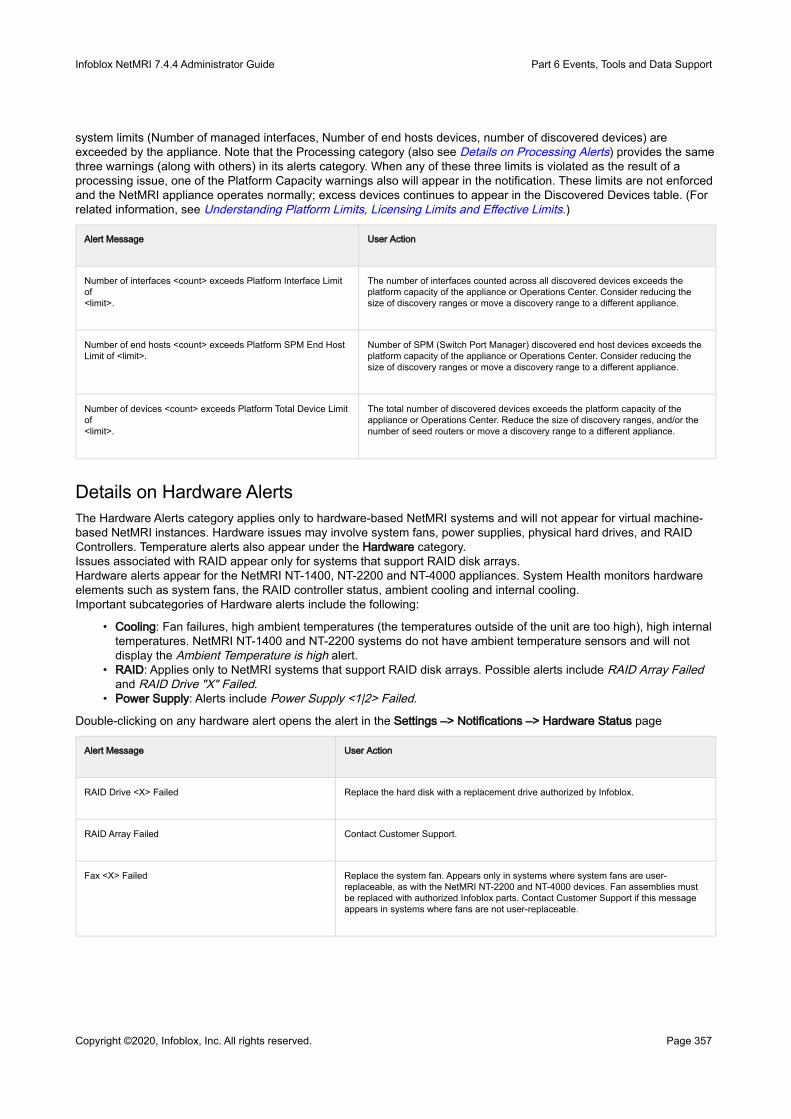
Infoblox NetMRI 7.4.4 Administrator Guide Part 6 Events, Tools and Data Support
Copyright ©2020, Infoblox, Inc. All rights reserved. Page 357
•
•
•
system limits (Number of managed interfaces, Number of end hosts devices, number of discovered devices) are exceeded by the appliance. Note that the Processing category (also see Details on Processing Alerts) provides the same three warnings (along with others) in its alerts category. When any of these three limits is violated as the result of a processing issue, one of the Platform Capacity warnings also will appear in the notification. These limits are not enforced and the NetMRI appliance operates normally; excess devices continues to appear in the Discovered Devices table. (For related information, see Understanding Platform Limits, Licensing Limits and Effective Limits.)
Alert Message User Action
Number of interfaces <count> exceeds Platform Interface Limit of <limit>.
The number of interfaces counted across all discovered devices exceeds the platform capacity of the appliance or Operations Center. Consider reducing the size of discovery ranges or move a discovery range to a different appliance.
Number of end hosts <count> exceeds Platform SPM End Host Limit of <limit>.
Number of SPM (Switch Port Manager) discovered end host devices exceeds the platform capacity of the appliance or Operations Center. Consider reducing the size of discovery ranges or move a discovery range to a different appliance.
Number of devices <count> exceeds Platform Total Device Limit of <limit>.
The total number of discovered devices exceeds the platform capacity of the appliance or Operations Center. Reduce the size of discovery ranges, and/or the number of seed routers or move a discovery range to a different appliance.
Details on Hardware AlertsThe Hardware Alerts category applies only to hardware-based NetMRI systems and will not appear for virtual machine-based NetMRI instances. Hardware issues may involve system fans, power supplies, physical hard drives, and RAID Controllers. Temperature alerts also appear under the Hardware category.Issues associated with RAID appear only for systems that support RAID disk arrays.Hardware alerts appear for the NetMRI NT-1400, NT-2200 and NT-4000 appliances. System Health monitors hardware elements such as system fans, the RAID controller status, ambient cooling and internal cooling.Important subcategories of Hardware alerts include the following:
Cooling: Fan failures, high ambient temperatures (the temperatures outside of the unit are too high), high internal temperatures. NetMRI NT-1400 and NT-2200 systems do not have ambient temperature sensors and will not display the Ambient Temperature is high alert.RAID: Applies only to NetMRI systems that support RAID disk arrays. Possible alerts include RAID Array Failedand RAID Drive "X" Failed.Power Supply: Alerts include Power Supply <1|2> Failed.
Double-clicking on any hardware alert opens the alert in the Settings –> Notifications –> Hardware Status page
Alert Message User Action
RAID Drive <X> Failed Replace the hard disk with a replacement drive authorized by Infoblox.
RAID Array Failed Contact Customer Support.
Fax <X> Failed Replace the system fan. Appears only in systems where system fans are user-replaceable, as with the NetMRI NT-2200 and NT-4000 devices. Fan assemblies must be replaced with authorized Infoblox parts. Contact Customer Support if this message appears in systems where fans are not user-replaceable.

Infoblox NetMRI 7.4.4 Administrator Guide Part 6 Events, Tools and Data Support
Copyright ©2020, Infoblox, Inc. All rights reserved. Page 358
Alert Message User Action
Power Supply <X> Failed Check Power Supply operation. Message appears only for systems in which a redundant 1+1 power supply configuration is available and running in the device in question. (For a single-power-supply system, the appliance simply shuts down.) The alerts also allow for the possibility that a power supply is unplugged.
Ambient temperature is high. Internal temperature is high. Both messages may appear for the same system, with internal temperature being affected by the ambient temperature. Reduce the ambient temperature where possible; if the Internal temperature remains high, look for a Fan Failed error message along with the Internal Temperature message. Contact Customer Support if an Internal Temperature is High issue persists when conditions are otherwise optimal.
Critical — RAID Battery failed. Contact Customer Support.
RAID Array Degraded. The RAID array is not fully operational due to a disk in the process of rebuilding or a disk being removed. If a disk has been removed in preparation for replacement, this issue will also appear, and will clear when the replacement is finished rebuilding. If you know that no disk replacement operation has been started with the appliance and this issue appears, contact Customer Support.
Details on Storage Alerts
Note: Disk space that is set aside for database archive creation is considered non-usable by the system.
The Storage health status provides a link to a special Storage Trend chart. To view it, click any link under the Storage category in the System Health page. Storage is particularly sensitive, for example, when NetMRI runs on a VMware VM and begins to run up against its disk storages limits, or on standalone NetMRI systems that run a single hard disk.
Alert Message User Action
A software problem was detected. Contact Support. Contact Customer Support.
Low on disk space Warning health Issue will appear when overall storage utilization exceeds levels considered safe for long-term operation, recommends preventive action to increase available disk space in the appliance. A Critical health Issue (Critically Low on Disk Space) will appear when overall storage utilization exceeds levels indicates an impending failure due to insufficient disk space. To begin addressing this issue, remove any unneeded files from the administrator home directories through the NetMRI administrative shell.
Cannot connect to remote archive storage Check reachability to the system providing the remote storage on the network.
Could not save archive to remote storage <hostname> Check the operating state and configuration for the system providing the remote storage on the network. NOTE: This alert can be suppressed in the System Health page when it is active, when the user considers that the issue has been solved. When the error occurs and is remedied by the administrator, NetMRI will not display the alert again unless the issue is found again during the next archiving attempt.

Infoblox NetMRI 7.4.4 Administrator Guide Part 6 Events, Tools and Data Support
Copyright ©2020, Infoblox, Inc. All rights reserved. Page 359
•••••
Alert Message User Action
Disk <X> Failed. Check the LEDs on the disk drives for the appliance and replace the disk drive. For information on the behavior of disk drive LEDs in your system, check the Infoblox Installation Guide for your appliance.
RAID Battery failed. Contact Customer Support.
Warning — RAID Array Degraded. Usually, in this case the RAID array is in a degraded state due to a disk in the process of rebuilding or a disk being removed. If a disk has been removed in preparation for replacement, this issue will also appear, and clears when the replacement is finished rebuilding. If you know that no disk replacement operation has been started with the appliance and this issue appears, contact Customer Support.
The Storage Trend chart provides a two-week sliding window with the 6-hour time measurement on the horizontal X axis. The total storage capacity is reflected on the vertical Y axis. The trend chart example to the right shows available disk storage for a two-day period, the number of increments in the chart increases up to a two-week period and then acts as a moving window across the timeline. The latest measurement date appears on the far right.As available disk space decreases, the trendline declines to the right and approaches the X axis. When the admin frees disk space in response to an alert, the chart line inclines upwards to the right.When a storage issue appears, System Health checks data retention settings. If any data retention categories occupy a significant amount of otherwise usable disk space, and are set beyond factory defaults, NetMRI will display a request to change the data retention settings in response to this alert.
Details on Processing AlertsProcessing alerts provide warning messages regarding excessive demand on system resources, including the following possible causes:
specifying too many jobs to simultaneously execute on an appliancerequesting too many reports to run in a given time period, or too many reports scheduled concurrentlyexceeding recommended limits on managed devices and interfacesattempts to discover too large a network.Too many deployed Policy rules.
Other warnings notify when a NetMRI appliance infringes its licensing limits.

Infoblox NetMRI 7.4.4 Administrator Guide Part 6 Events, Tools and Data Support
Copyright ©2020, Infoblox, Inc. All rights reserved. Page 360
•
•
•
•
•
•
Alert Message User Action
System Processing capacity is being exceeded. A number of causes may contribute to processing slowdowns on the appliance. Some processing warnings reflect higher quantities of various network entities than can be supported by the hardware platform:
Number of interfaces <count> exceeds the recommended capacity of <limit>. Solution: Consider reducing discovery ranges.Number of end hosts <count> exceeds the recommended capacity of <limit>. Solution: Consider reducing discovery ranges.Number of devices <count> exceeds the recommended capacity of <limit>. Solution: Consider reducing discovery ranges. If any one of these three processing warnings appear, a Platform Capacity message of the same type also appears. Other processing warnings include the following:Policy Rule deployment exceeds the recommended limit of <X>. Solution: Reduce the number of deployed Policy rules.Executed jobs exceed the recommended limit of <X> per 24 hours. Solution: Reduce the number of scripted Jobs that execute over a 24-hour period. The following messages are enforced on current platforms and will appear on appliances only when a) a Processing Capacity alert is present; b) that are over-provisioned with discovered devices beyond the licensed limit:Number of Licensed Devices exceeds licensed platform limit of <X> devices. Solution: un-license some network devices. Appliances cannot have more licenses in-use than the number of installed licenses; appliances can have more installed licenses than the maximum allowed if the appliances are grandfathered in from older deployments with higher licensed levels. These messages only appear if the number of licenses exceeds the maximum number of licenses allowed for the hardware platform. For more information, see Understanding Platform Limits, Licensing Limits and Effective Limits .
Details on Operation Center Collector AlertsCollector alerts apply only to Operations Center deployments with one or more Collector systems, whether VM-based or physical appliances.
Alert Message User Action
Connection to Collector <X> lost. The VPN between the Operations Center appliance and the collector is not working, preventing the OC from reaching the Collector. This alert appears if connectivity to the Collector is unexpectedly lost, due to a failed VPN, a flawed or failed physical network connection, or an issue with the Collector instance.
Collector <X> Reset. The Collector appliance or VM has sent a message that it is being Reset, to the administrator. This message appears when the VPN connection is administratively disconnected.

Infoblox NetMRI 7.4.4 Administrator Guide Part 6 Events, Tools and Data Support
Copyright ©2020, Infoblox, Inc. All rights reserved. Page 361
Alert Message User Action
Collector <X> is Rebooting. The Collector appliance or VM has sent a message that it is being rebooted, to the administrator. This message appears after a Connection Lost message for a grace period after an administrative reboot.
Details on Configuration AlertsAfter discovering unassigned VRFs, NetMRI displays a warning alert in the main page with a hyperlink to open the System Health page to view details. The Unassigned VRF message includes a hyperlink to launch the Network View Editor, which is required to assign unassigned VRFs to a network view. You can suppress Unassigned VRF System Health alerts.
Alert Message User Action
An unassigned VRF was detected. Open the Network View editor, create a new network view if necessary, and assign the discovered VRF instances to it.
Collector Time Zone must match the Operation Center Time Zone. Use the Admin Shell CLI on the collector to run the configure server command to adjust Time Zone settings.
System MessagesThe System Messages page (Settings icon –> Notifications –> System Messages) lists every system message logged by NetMRI. This is an important location to check on the quantity and nature of the notification messages that are being sent by the NetMRI appliance.All notifications are also listed in the System Messages table after they are sent.Any of the five columns can be removed from or restored to the table. When you arrange the table to a preferred setup, you can save it to a View by selecting Views –> Add View just above the table.You may also sort the System Messages table in ascending or descending order by any column.
Configuring Syslog ForwardingIn the Syslog Forwarding page (Settings icon –> Setup –> Syslog Forwarding) you can specify up to three hosts to receive forwarded syslog messages after they are relayed by NetMRI. This feature is not directly related to notifications through Syslog; notifications enable specification of a discrete Syslog server or servers to receive and handle notifications. The same Syslog server values can be used in both locations.Syslog forwarding enables NetMRI to specify up to three Syslogd-running servers that will receive Syslog messages from the appliance.
Note: Operations Center only: Before changing settings in this page, use the Filter by Collector field in the right side of the header to select a Collector.
The Syslog Forwarding page provides three entry fields: Host One, Host Two and Host Three.For each host, also select their respective Host One Network View, Host Two Network View, and Host Three Network View.

Infoblox NetMRI 7.4.4 Administrator Guide Part 6 Events, Tools and Data Support
Copyright ©2020, Infoblox, Inc. All rights reserved. Page 362
Specify a host using its IP_address or an IP_address:port tuple. If a port number is not specified, the port number defaults to 514.
Understanding Platform Limits, Licensing Limits and Effective LimitsThe Settings Summary provides a series of Device Limits counters that can be used to clearly understand when NetMRI licensing is fully utilized for a given physical appliance. This information helps you decide when network discovery and management might need to be distributed to other appliances, and when you can increase your license allocations on a NetMRI appliance to manage more network infrastructure devices.Three key values must be kept in mind for all NetMRI device capacities and device management limits: Platform limits, Licensed limits, and Effective limits.Platform Limit: The highest number of network infrastructure devices that can be fully managed by NetMRI. NetMRI can discover a much larger number of infrastructure devices than are called for in the Platform limit. The Platform limit denotes the expected maximum number of infrastructure devices that may be fully managed by the NetMRI physical appliance.Licensed Limit: The number of infrastructure devices that NetMRI is specifically entitled to manage through a purchased device license. If a manager wants to manage up to 500 infrastructure devices, they purchase a 500-device license. This value appears in the Licensed Device Limit fields in the Settings Summary page.Effective Limit: The current number of infrastructure devices manageable by NetMRI. This value usually, but not always, is the same as the Licensed limit.The Limit categories are applied against the License type installed in your appliance. The license types (Full NetMRI or Automation Change Management (ACM)), appear in the Settings Summary page listed for each separate license type. (See NetMRI Licensing for information on each licensing type.)
Note: Values of this type are reported for physical NetMRI appliances and do not apply to virtual-machine-based NetMRI instances.
The possible values that appear in the Settings Summary page's NetMRI Configuration section, depending on installed licenses, include the following:
Platform <NetMRI|ACM> Device Limit
The appliance's maximum possible managed infrastructure device capacity, based upon the Full NetMRI license type. Managed devices allow the carrying out of operations such as configuration collection and changes, change management, policy compliance, and other operations. The license type, which may be one of three choices (full NetMRI or Automation Change Manager (ACM)), provides the same three license capacity counts for any of the three licenses.
Licensed <NetMRI|ACM> Device Limit
The appliance's current device license entitlement limit - the maximum number of managed devices by the Full NetMRI, Automation Change Manager (ACM) feature license. This value changes according to the total number of purchased device licenses. In most cases, the Licensed limit will be lower than the Platform limit.
Effective <NetMRI|ACM> Device Limit
The current number of network devices that NetMRI is able to manage. In all cases where the Licensed limit is less than or equal to the Platform limit, the Effective limit is set to the same value as the Licensed limit. If the Licensed limit value is higher than the Platform limit, the Effective Device Limit is set to the same value as the Platform limit, even though the Licensed device entitlement is higher. Some NetMRI systems may have a pre-existing Full NetMRI license that exceeds the Platform Limit defined through an appliance upgraded to NetMRI 6.8 or higher. In these cases, the Effective limit is set to the Licensed Device Limit. This is termed Platform Overridden.
Platform SPM End Host Limit The maximum number of End Host devices under Switch Port Management that can be discovered by NetMRI without displaying a Number of devices <count> exceeds SPM End Host Limit of <limit> warning message. This number is not related to Platform Device Limits, Licensed Device Limits, or Effective Device Limits. A warning alert appears when the number of discovered end hosts exceeds this limit, but system functionality remains unaffected.

Infoblox NetMRI 7.4.4 Administrator Guide Part 6 Events, Tools and Data Support
Copyright ©2020, Infoblox, Inc. All rights reserved. Page 363
Platform Total Device Limit The maximum number of network infrastructure devices that can be discovered and listed in NetMRI's Discovery table without displaying a Number of devices <count> exceeds Platform Total Device Limit of <limit> warning. This number is not related to Platform Device Limits, Licensed Device Limits, or Effective Device Limits. A warning alert appears when the number of discovered devices exceeds this limit, but system functionality remains unaffected.
Platform Interface Limit The maximum number of device interfaces that can be discovered by NetMRI without displaying a Number of interfaces <count> exceeds Platform Interface Limit of <limit>warning. The warning alert appears when the number of discovered interfaces exceeds this limit, but system functionality remains unaffected.
Upgraded NetMRI Appliances and Platform LimitsSome NetMRI appliances may have relatively high device license limits, which are previously sold entitlements to manage a large quantity of network infrastructure devices. If a user then upgrades their system to the NetMRI Release6.8 or higher, their installed License may exceed the Platform Limit for the NetMRI or Automation Change Manager feature license. This event is called overriding the Platform Limit. This does not affect the appliance or its operation. After the upgrade installation, whether it is browser-based or performed in the command line, the following message appears:
The number of Licensed Devices in this License exceeds the capacity of this appliance for <managed devices>. The platform limit of <# platform capacity of managed devices> will be overridden with the [new license limit | existing limit] (<# new limit>). Please contact customer support if you feel this message is in error.
In such cases, the Effective limit exceeds the Platform limit for the given feature license. A Platform Overridden message, in red, appears in the Settings Summary page. The user can use all originally purchased device license entitlements.
Note: A warning banner appears on the NetMRI screen only when the number of discovered end hosts, discovered devices or discovered interfaces exceeds the Total Device Limit of the system.
Operations Center Device LimitsNetMRI Platform limits, Licensed limits, and Effective limits apply to all Collector appliances and instances in an Operations Center. On the Operations Center, the Settings icon –> Setup –> Tunnels and Collectors page separately lists each Collector's status and their associated device limits. For more information, see Checking NetMRI Collectors Operation.
Enforcing Platform LimitsPlatform limits have another aspect. For all hardware platforms, if an administrator attempts to install a device license that exceeds the Platform NetMRI Device Limit value as reflected in Settings Summary (or the Platform Limit that applies to any of their feature licenses), NetMRI disallows the installation of device licenses beyond that limit. The Effective device limit will match the Platform device limit, while the Licensed device limit remains higher than both, reflecting the purchased license level. You will not be able to use more device licenses than the Platform limit; the remainder will be unused. A Platform Limited message, in red, appears in the Settings Summary page.If this is the case for your system, contact Customer Support. As noted above, an upgraded NetMRI system that has a pre-existing Device License limit that is higher than the Platform limit will preserve the license limit, simply displaying a warning that the existing limit will override the Platform limit. This is not true, however, if you want to install a newly purchased device license that will exceed the Platform limit onto a NetMRI appliance.

Infoblox NetMRI 7.4.4 Administrator Guide Part 6 Events, Tools and Data Support
Copyright ©2020, Infoblox, Inc. All rights reserved. Page 364
•
••••••
1.
ToolsNetMRI software tools are organized into two categories.
Network tools (Tools icon –> Network):
API Documentation, providing access to an external API guide for developers and displaying model details.
Device tools (Tools icon –> Device):
Ping/Traceroute, for determining whether a specific host can be reached across the network.SNMP Walk, for retrieving SNMP MIB variables.SNMP Credential Test, for finding a successful SNMP user name and password combination for a device.Cisco Command Tool, for issuing Cisco commands to a specified device.CLI Credential Test, for finding a successful CLI user name and password combination for a device.Discovery Diagnostics, for diagnosing discovery and data problems for a device.
API DocumentationInstructions for using the API are provided in a separate document, "NetMRI API Developer's Guide," available in the "Additional Information" section of the NetMRI online help.
For the NetMRI Core API v3.3, the Tools –> Network –> API Documentation application page displays information about each model. Select API Data Structures, scroll down to the Models section, and then select an item in the list to display model details and attributes.
You can also access the API documentation by clicking /api/docs.
Ping/TracerouteUse the Ping tool (Tools –> Device –> Ping/Traceroute) to check communications to devices across the network. Ping can also be used as a speed test and to verify local network interface card operation.
Use the Traceroute tool to determine the route taken by packets across the network. To perform a ping or traceroute test, do the following:
Open the Hostname or IP list and select the target device.
Note: Type a few beginning characters of the host name or IP address to narrow the list.
2. Open the Network View list and choose the network view containing the IP.
3. In the Packet Size field, type the packet size.
4. Open the PacketCount list and select the desired packet count.
5. Open the Interval list and select the desired interval in seconds.
6. To perform a ping test, click Ping. To perform a traceroute test, click Traceroute.
7. When the test is finished, "Processing Completed" appears above the log.
8. To export the data to a text file: click Text above the log.
9. To run the test again: click Refresh.
10. To change test parameters: click Settings.

Infoblox NetMRI 7.4.4 Administrator Guide Part 6 Events, Tools and Data Support
Copyright ©2020, Infoblox, Inc. All rights reserved. Page 365
1.
2.3.4.
5.6.7.
•••••
8.
9.
1.2.3.4.
•••
SNMP WalkUse the SNMP Walk tool (Tools –> Device –> SNMP Walk) to retrieve all SNMP MIB variables below a given root OID from a device on the network. The SNMP Walk tool may retrieve a large amount of SNMP data from the selected device depending on the specified root OID.
For the list of supported encryption protocols, see "SNMPv3 Credentials for Discovery and Management" in Data Collection Techniques.
You can also define the SNMP Walk settings in the Administrative Shell. For more information, see snmpwalk command.
To perform an SNMP Walk, do the following:
Open the Hostname or IP list and select the target device from the dropdown menu. there may be many pages of values in the dropdown. You can also enter a new value.Open the Network View list and choose the network view containing the specified device.In the Port field, type the target port.In the Password field, enter the SNMP community string associated with the device (the default string for read-only operations is usually "public"). You may also leave the Password field blank (if a community string was previously discovered for the device or a default is used, then that string is used to automatically perform the walk).Select SNMP version 1, 2c or 3.If you selected version 1 or 2c, specify the Root OID.If you selected version 3, specify the following:
Authentication PasswordAuthentication ProtocolPrivacy PasswordPrivacy ProtocolRoot OID
In the Root OID field, type the starting point for the SNMP walk as a symbolic name or in dotted decimal notation. If a symbolic name is not recognized, try entering the dotted decimal notation instead.Click Start. SNMP Walk displays progress through an SNMP Polling popup window.
The bottom of the SNMP Polling text output reports the result of the polling cycle, displaying a Polling Finished Normallymessage on successful completion.
To export the data, select the polling text, right-click and choose Copy.
To run the test again, click Restart.
SNMP Credential TestUse the SNMP Credential Test tool (Tools –> Device –> SNMP Credential Test) to determine a successful SNMP community string for a device. For the selected device, the tool tries all the community strings listed in the Settings icon –> Setup –> Credentials page using the same order as NetMRI's internal guessers. Testing stops when a successful string is found or all strings have been tried.
Note: The SNMP Credentials Test can be run on any device, including those not known to NetMRI.
To run an SNMP credentials test, do the following:
In the Hostname or IP field, enter a host name or IP address, or open the list and select a device.Open the Network View list and choose the network view containing the specified device.Click OK.Then, do the following:
To stop the test: click Cancel.To save the results or view them in a text editor: click the Text link.To repeat the test on the save device: click Refresh.

Infoblox NetMRI 7.4.4 Administrator Guide Part 6 Events, Tools and Data Support
Copyright ©2020, Infoblox, Inc. All rights reserved. Page 366
•
1.2.
3.4.
5.6.7.8.
1.2.3.
••••
1.2.3.
To run the test on a different device: click Settings.
Cisco Command ToolUse the Cisco Command tool (Tools –> Device section –> Cisco Command) to issue Cisco commands to a specified device and view the results in the browser.
To issue a Cisco command, do the following:
In the Command field, type the command you want to send.Open the Hostname or IP list and select the target device. Type a few beginning characters of the host name or IP address to narrow the list.Open the Network View list and choose the network view containing the specified Cisco device.Specify a Login Mode: Automatic: Attempt to retrieve a valid user name, password and enable password for the specified device. If this information cannot be found, an error is generated.Manual: Select the Access Protocol (SSH or Telnet), then enter the Username, Password and Enable Passwordin the corresponding fields.Click Start. Results appear in an Executing Cisco Command popup window.To run the test again: click Restart in the Executing Cisco Command popup window.To run a new test: click Close.To export the data: Click Download Text.
CLI Credential TestUse the CLI Credential Test tool (Tools –> Device –> CLI Credential Test) to determine a successful CLI user name, password and enable password (if applicable) for a device. The CLI Credentials Test can be run only on devices known to NetMRI. For the selected device, the tool tries all the combinations listed in the Settings icon –> Setup –> Credentialspage using the same order as NetMRI's internal guessers. Testing stops when a successful combination is found or all combinations have been exhausted.
To run a CLI credentials test, do the following:
In the Hostname or IP field: Enter a host name or IP address, or open the list and select a device.Open the Network View list and choose the network view containing the specified device.Click OK.
To stop the test: click Cancel.To save the results or view them in a text editor: click the Text link.To repeat the test on the save device: click Refresh.To run the test on a different device: click Settings.
Discovery DiagnosticsThe Discovery Diagnostics tool (Tools –> Device –> Discovery Diagnostics) helps Infoblox Technical Support to diagnose discovery and data problems for a given device.
Note: Output from this tool is typically used only by Infoblox Technical Support. The tool should only be run after you have been instructed to do so by Infoblox Technical Support.
To run discovery diagnostics, do the following:
Open the Hostname or IP list and select the target device.Open the Network View list and choose the network view containing the specified device.If NetMRI doesn't know the community string for the device, enter it in the Community String field. If NetMRI knows the community string for the device, it is used for the test. If you enter a community string, it is used in addition to the one known to NetMRI.

Infoblox NetMRI 7.4.4 Administrator Guide Part 6 Events, Tools and Data Support
Copyright ©2020, Infoblox, Inc. All rights reserved. Page 367
4.
5.6.7.8.
1.2.3.
1.2.3.
•••••
•
Normally, leave the Force Tests option set to Off. (If the appliance can't run the tests to provide the data needed, this option can be set to On to force it to run all tests. Select the On option when directed by Infoblox Technical Support.)Click OK.When the test is finished, "Processing Completed" appears above the log.Click TEXT to save the log.Send the log to Infoblox Technical Support.
NetMRI Database ManagementPages in the Database Settings section (Settings icon –> Database Settings) provide a number of basic database management tools. Consult the topics below for further information.
Database StatisticsThe Database Statistics page (Settings icon –> Database Settings –> Database Statistics) tracks the overall size of the NetMRI Database, as a whole and split between data records and the database index. NetMRI is designed to intelligently prune the database as data ages, to prevent the database from outgrowing the amount of available disk space.
Archiving the NetMRI DatabaseUse the Archive Database tool (Settings icon –> Database Settings –> Archive Database) to manually generate a local archive of the current database. The database can also be automatically archived; see Remote Config Archive for more information.
To prevent loss of data in the event of an appliance hardware failure, make database archive copies on a regular basis and store them in a safe place. If no recent database archive exists and NetMRI has an unrecoverable error, then all data will be lost.
By default, NetMRI automatically generates a database archive file once every week. Depending on the size of the database, archiving may take a few minutes, because the entire database is copied to a disk file and compressed.
To archive the NetMRI Database locally, do the following:
Go to Settings icon –> Database Settings –> Archive Database.Choose Download archive file to the local system.Click Create Archive.
To create an archive file on a remote system, do the following:
Go to Settings icon –> Database Settings –> Archive Database.Choose Upload archive to a remote system.For each remote system, specify the following:
Hostname/IP AddressPortUsernamePasswordUse SSH keys: Select this to use SSH keys instead of passwords. For more information about SSH keys, see ssh-key commands.Directory
Note
Because the NetMRI data collection continues during archiving, plan both processes accordingly.

Infoblox NetMRI 7.4.4 Administrator Guide Part 6 Events, Tools and Data Support
Copyright ©2020, Infoblox, Inc. All rights reserved. Page 368
•
4.5.6.
7.
••
Include date in filename: Check to date-stamp the archive file name.
To test the configuration, click Test Connection.If the test is successful to the remote server, click Create Archive.In the Create Archive dialog box, click Show Details to view the process as it happens.During archiving, do not refresh the page or close the window. Such actions may generate an incomplete database archive file.When archiving is complete, a status message allows return to the original page, and provides a link to a generated MD5 Checksum file. This file is recommended should you need to restore from a database you have stored on your computer. Click the MD5 Checksum link and choose Save in the dialog.
Restoring Databases
You can restore the NetMRI network database from a previously-generated archive (that is stored on your local management computer) by using the Administrative Shell Restore command.
When the database is restored, the systems restores all previous configuration settings for the network along with all low-level data, all issues and all summary results. Results will show a gap of inactivity starting at the time that the database archive was made and ending at the time the restore was performed. From that point forward, NetMRI processing proceeds normally.
The restore command restores a sequence of archive files in the order given. The command’s syntax is:
restore <archiveFile1 [ <archiveFile2 ... ]
Additional restore options include:
https_certs: Only restores HTTPS certificates from archive.skip_scan_interfaces_config: Disables the restoration of scan interface configuration.
Because the archive command backs up only part of the data (see description above), you may need to restore multiple daily backup files to reconstruct a complete data set. Thus, the restore command enables you to specify multiple archive files (if you restored just the last file, you would reconstruct data for the last day or last 750MB, whichever is greater). As shown above, wildcards can be used to specify multiple archive files. If you list files separately, enter the oldest file first, then enter the rest in chronological order.
Note
To archive the database to another NetMRI appliance, enter admin as the Username and enter Backup as the Directory.
Note
Should you need to perform a database reset, you can run the reset database command from the Administrative Shell. This operation should only be performed when absolutely necessary. Performing a database reset retains the appliance’s user-defined configuration, settings and license entitlements. A database reset removes all discovered device data, including all previously discovered devices from user configured Discovery Ranges, and all data associated with devices in those ranges. A reset database command forces all devices and all previously collected information to be re-discovered and re-collected from scratch. Resetting the database preserves the appliance configuration.
Note
Restoring archives overwrites current data. Example: on December 15 you restore archives through December 1. Data for December 2 through 14 would be lost.

Infoblox NetMRI 7.4.4 Administrator Guide Part 6 Events, Tools and Data Support
Copyright ©2020, Infoblox, Inc. All rights reserved. Page 369
1.2.3.
••
4.•••••
••
5.
If previously enabled, data collection is automatically re-enabled when restoration is complete. Otherwise, you will need to manually enable data collection in the Settings icon –> Setup section –> Collection and Groups –> Global tab.After restoring the database, NetMRI resumes most normal operations.
Restoring Databases from a Non-Local NetMRI SourceUnder some circumstances, you may need to restore from a database file generated from another NetMRI instance to the current NetMRI system (from one NetMRI Collector system to another one, for example). in such cases, the NetMRI Database looks for a locally generated database to restore, using the file naming format of the current NetMRI instance.
If a database is present in the local archive directory that originates from a remote NetMRI using a different file naming format, the restore will fail to find the local DB that it is seeking by default, and also will not access the 'outside' database archive file you are trying to restore from, displaying an error message.
The restore CLI command supports the use of database archives originating from another system.The *.tgz database file must be transferred to the file system in the current NetMRI instance before execution. An example:
restore <filename>, where <filename> is the archived file name without the extension.tgz
Database Archiving FunctionsThe Scheduled Archive page (Settings icon –> Database Settings –> Scheduled Archive) controls automatic archiving and copying of the NetMRI network database. The database can also be manually archived; see Archiving the NetMRI Database for more information.
When enabled, the automatic process creates an archive of the NetMRI network database and copies it to one or two servers that support SCP, or to another NetMRI system.
To configure scheduled network database archiving, do the following:
Go to Settings icon –> Database Settings –> Archive Database.Choose Enable automatic database archiving.Select the Recurrence Pattern (Once, Daily, Weekly or Monthly).
Select the Minute to Start.For weekly archiving, select the Execution Time and select the day or days of the week.
For each remote system, specify the following:Hostname/IP AddressPortUsernamePasswordUse SSH keys: Select this to use SSH keys instead of passwords. For more information about SSH keys, see ssh-key commands.DirectoryInclude date in filename: Check to date-stamp the archive file name.
To test the configuration, click Test Connection.
Note
If you migrate from an older NetMRI appliance to a newer model, after restoring the database from the old appliance to the new one, discovery data collection will be disabled on the appliance. You must then enable data collection in the Settings icon –> Setup section –> Collection and Groups –> Global tab.
Note
To archive the database to another NetMRI appliance, enter admin as the Username and enter Backup as the Directory.

Infoblox NetMRI 7.4.4 Administrator Guide Part 6 Events, Tools and Data Support
Copyright ©2020, Infoblox, Inc. All rights reserved. Page 370
6.
1.2.3.4.5.6.
••••
••
7.8.
If the test is successful, click Update.
Monitoring Database Update Background TasksThe Remote Config Archive page (Settings icon –> Notifications –> Background Tasks) provides a read-only display to monitor selected NetMRI internal background tasks that may occupy significant periods of time, and are thus organized in the system to run in the background while NetMRI operates normally.
Key values to check here include the Progress % field, which indicates the amount by which each background task has completed, and the Created field, which indicates the creator of the task. In many cases, the value shown here will be "System."
Remote Config ArchiveThe Remote Config Archive page (Settings icon –> Database Settings –> Remote Config Archive) controls automatic archiving and copying of the NetMRI configurations. Also check Data Retention settings in the Data Retention topic, as they have significant influence on the time periods between data archiving events for specific data sets in NetMRI.
When enabled, this automatic process creates an archive of the configurations and copies it to one or two servers that support SCP.
To set up automatic configuration archiving, do the following:
Go to Settings icon –> Database Settings –> Archive Database.Select the archiving Frequency (Daily or Weekly).If you selected weekly archiving, then select the Day of Week.Select the Hour to Start and Minute to Start.Show Passwords: Select Yes or No.For each remote backup location, specify the following:
Backup DestinationUsernamePasswordUse SSH keys: Select this to use SSH keys instead of passwords. For more information about SSH keys, see ssh-key commands.Backup DirectoryInclude date in directory name: Check to date-stamp the archive directory name.
To test the configuration, click Test.If the test is successful, click Update.
Performing Database MaintenanceUse the Maintenance page (Settings icon –> Database Settings –> Maintenance) to change settings for weekly database maintenance. The maintenance task can be configured to start at any time during the week, to be coordinated with other maintenance activities performed by your organization.
Note
To archive the database to another NetMRI appliance, enter admin as the Username and enter Backup as the Backup Directory.

Infoblox NetMRI 7.4.4 Administrator Guide Part 6 Events, Tools and Data Support
Copyright ©2020, Infoblox, Inc. All rights reserved. Page 371
1.2.3.4.
Data collection is automatically suspended during maintenance. During that time, the NetMRI browser interface will also be disabled, displaying only a status message indicating that maintenance is being performed.When archiving completes at the end of each maintenance cycle, the NetMRI appliance reboots to restart all processes and then resumes data collection.
To configure weekly maintenance, do the following:
Set Status to Enabled or Disabled. If set to Disabled, go to step 4.Select a Day of Week.Select an Hour to Start.Click the Update button.
Sending Technical Support Bundles to InfobloxSupport bundles are used by Infoblox for troubleshooting and optimization purposes. Technical data is sent using a secure connection. Support bundles are maintained by Infoblox Technical Support staff solely for the stated purposes. Some support bundle data may contain login information in cleartext. Users may wish to open the support bundle Tar file to edit any sensitive information such as login tuples or IP addresses.
The Advanced Support Bundles page (Settings icon –> Database Settings –> Advanced Support Bundles) provides a convenient way to send technical data and debugging data to Infoblox for troubleshooting purposes and to improve NetMRI's analysis capabilities.
You may also target troubleshooting information to specific devices in the managed network, including the ability to perform an SNMP Walk and SNMP debugging, and to run a discovery diagnostic on the specified network device. You may specify one device or up to three device IP addresses for this task.
Support bundle data includes such things as NetMRI configuration and performance data, device identification database, and a significant collection of appliance debugging log files. Such data is used primarily when troubleshooting specific problems reported by customers. A support bundle may also be requested from time to time by Infoblox Technical Support staff to improve NetMRI's discovery and analysis capabilities, by searching for new device types and unusual processing situations. In all cases, send a support bundle only when requested to do so by Infoblox Technical Support staff. You may also receive instructions regarding the types of debugging logs to select for the support bundle.
The Advanced Support Page provides the following information about active and resolved cases:
Action Choose Delete or Resend from this menu.
Status Time The time of origination for the technical support case.
Case Number Infoblox Support case number. In YYDDMM-xxxxxx format. Infoblox Support assigns this value.
Note
Because NetMRI data collection and analysis is automatically disabled during archiving, and also restarts the appliance after archiving completes, the archive process should be performed during off hours whenever possible. Weekly maintenance can take several hours to complete, depending on the size of the database.
Note
Support bundle operations require the SysAdmin role.

Infoblox NetMRI 7.4.4 Administrator Guide Part 6 Events, Tools and Data Support
Copyright ©2020, Infoblox, Inc. All rights reserved. Page 372
1.2.3.4.
5.•
•
••
a.
b.
c.
••
Description Descriptive information about the support bundle.
Status A data field that indicates, for example, Sent or Pending. Pending listings also may show the time period that will elapse before NetMRI generates the bundle file and sends it or stores it.
File Name The file name defined by the Support Bundle feature for the bundle archive file. The file name reflects the case number and an arbitrary string of numbers.
File Size The size of the bundle archive. Note that the file may exceed hundreds of megabytes in size.
To create a support bundle, do the following:
Log in to NetMRI using the admin account.Navigate to Settings icon –> Database Settings –> Advanced Support Bundles.Click the New icon (+) at the top of the page.Enter the Support Case Number assigned to you from Infoblox Support. The value is defined in YYDDMM-xxxxxx format. The system prompts for correct data entry if a mistake is made.Choose the Log Set to Send option:
Standard: Choosing this option automatically enables all applicable debug log categories as part of the new bundle;Custom: Choosing this option enables all debugging and actions allowable for a support bundle, including Install/Upgrade, Discovery Info, and System Data, along with numerous categories of debugging log files.
6. After choosing and selecting the desired options, click one of the two options:
If you are finished with the request bundle, click Done;If you want to specify devices for troubleshooting in the support bundle, click Advanced(Device).
For specific device troubleshooting, enter one to three individual device IP addresses in the Device IP Address(es) fields.Select the Test Type: Run SNMP Walk, Enable SNMP Debugging, and/or Run Discovery Diagnostic. You may select any or all three.If you need to override the stored NetMRI SNMP credentials for the device(s) chosen for troubleshooting, check the Override Net MRI Credentials checkbox. Once you do so, you choose the SNMP Version: v1, v2 or v3. Enter the SNMP community string/passphrase (v1 and v2) or authentication and encryption (v3 only) protocols and passwords. Should you apply this change to more than one device IP address in the session (because you've entered two or three device IP addresses in the previous wizard step), ensure that the values you apply are correct for all devices; if the SNMP values are not the same, you may need to define a separate Device Support Bundle for each device.
7. Click one of the two following options:
If you are finished with the request bundle, click Done;If Infoblox Support requested inclusion of advanced debug flags for additional troubleshooting methods in the support bundle, click Advanced(Debug).
a. Check the checkboxes for any advanced debug flags requested by Infoblox Support.
8. Click Done at the bottom of the wizard page.
9. In the Summary page, enter the desired value in the Hours to wait before sending logs field.
Note
If you select the Config Logs Debug Log category, the current configuration files for all devices are included in the archive. Configuration files are a primary source of sensitive information, such as device admin user names, on the managed network.

Infoblox NetMRI 7.4.4 Administrator Guide Part 6 Events, Tools and Data Support
Copyright ©2020, Infoblox, Inc. All rights reserved. Page 373
•
•
1.
2.
3.
•
•••
•
•
••
•
••
10. Under Select method to send package, choose either:
Secure FTP (SFTP): automatically uploads the Bundle to Infoblox Tech Support. If you direct NetMRI to compile the Bundle and send it to Infoblox, you can in fact start the Bundle creation, log out from NetMRI and allow the process to complete, or carry out other tasks in the meantime.Manual Download: Compiles the Bundle into a tar.gz file and enables downloading it to your computer by clicking a link.
11. If the NetMRI admin wants email communication when the bundle is generated and sent or downloaded, check the Email notification to me when complete checkbox.
12. Click Start. During the process, the Support Bundles page refreshes until NetMRI completes the new Bundle. The Bundle listing appears in the Advanced Support Bundle table.
TroubleshootingIn rare cases, connections may not work to the Infoblox Technical Support server, which is currently bloxdrop.infoblox.com. Should you experience a failed upload to the Infoblox server after an automatic or manual Support Bundle creation, the table in the Support Bundle page will show a message to this effect in the Status column.
Use the NetMRI ping/traceroute tool via the browser interface (Tools–>Device–>Ping/Traceroute), or the ping command via the Administrative Shell, to verify that NetMRI can reach the Infoblox server bloxdrop.infoblox.com on the Internet.Use the NetMRI ping/traceroute tool via the browser interface, or the traceroute command via the Administrative Shell, to verify that the appliance can reach bloxdrop.infoblox.com on the Internet.Verify that your firewall rules allow NetMRI to make an outbound SSH connection (TCP port 22) to bloxdrop.infoblox.com.
Data RetentionUse the Data Retention page (Settings icon –> Database Settings –> Data Retention) to specify for how long NetMRI should archive or delete various types of data.
Delete After specifies the number of days after which data is eligible to be deleted from the appliance.Pay careful attention to the Delete After settings to ensure that your organization retains any bodies of information for periods of time mandated by organization policy. One Data Retention setting, Network Inventory History, governs a number of important data tables in Network Explorer, including the following:
Switch Port Management –> all Devices, Interfaces and End Hosts tables;Inventory – all Devices, Virtual Devices, Interfaces, OSs, and Models tables;All Discovery data.
Archive After specifies the number of days after which data is eligible to be moved to the archive. Archived data is still available, but reports will require more time to access it. Data can be archived in VM environments that have been configured for archive storage under the Settings icon –> Database Settings –> Storage Management page.
Other data retention categories include the following:
Change Record History – The data collection of device configuration changes detected and recorded by NetMRI, such as router and switch config changes and other change events (Network Analysis –> Changes page);Configuration History – Compilation of all device configurations detected and stored in the NetMRI system;Aggregated Interface Performance Data History – Contains records of all hourly and daily interface performance data aggregated by NetMRI from the ‘raw’ interface performance data compiled from every polling period;Raw Interface Performance Data History – Contains the complete “raw” collection of performance information for all interfaces managed by NetMRI that is compiled every polling period (every 15 minutes by default; this time increment depends on the system configuration);Issue Analysis and Status History – Compilation of all Issues information (Network Analysis –> Issues page);System Events and Notifications Logs – Compilation of all event logs and notifications from all managed devices. Data is included from the User Audit Log and the Device Audit Log in the Device Viewer for each managed device; this setting also applies to the dataEngine.log and discoveryServer.log files managed through Settings icon –>Settings & Status –> Logs.

Infoblox NetMRI 7.4.4 Administrator Guide Part 6 Events, Tools and Data Support
Copyright ©2020, Infoblox, Inc. All rights reserved. Page 374
1.2.3.4.
•••••••
To change data retention times for a type of data, do the following:
Click Edit.In the Set Data Retention dialog, enter a Delete After value (in days).If archive storage has been configured: Enter an Archive After value (in days).Click Save & Close.
Storage ManagementWhen you install NetMRI on your VM, by default about 80 Gb of storage is allocated to and distributed among a few virtual disk volumes. Each volume corresponds to a specific NetMRI component. You can extend the NetMRI storage per volume to optimize performance. For example, you may want to extend low-space volumes, use different peformance storage for different volumes, protect NetMRI critical services by dedicating volumes specifically to them, and so on.
The disk partitions include:
Application StorageBackup StorageDatabase StorageLog StorageOS StorageTemporary StorageUnused Storage
This list with size per partition is displayed in Settings icon –> Database Settings –> Storage Management.
To extend the NetMRI storage, use the provision disk command from the Administrative Shell. For information, see Shell Commands.
Extending Network Device & Data SupportVendor MIB files are widely available on the Internet as a free resource, from vendor support Web sites, provided with equipment documentation, or occasionally as part of a support contract. Combine the correct MIB file with a correctly written Device Support Bundle file (DSB) and custom network device types can be added to NetMRI for management and monitoring. This feature set is called Extensible Device Support (EDS). DSB files are written in the XML language. A full description of XML DSB files, the information they must contain, and how to write them, is provided in the Infoblox Device Support Guide under Additional Documentation.
Operations with MIB FilesNetMRI enables importing of device vendor MIB files, editing of MIB files, and general management of all MIB files in the appliance. In many cases, MIB files are bundled within the DSB, but MIBs can also be obtained elsewhere and added to the appliance. When a DSB is added to the appliance that requires one of these MIBs, and it is not bundled with the DSB, NetMRI will automatically search for the MIB in its database.
Caution
You cannot undo storage extension.
Warning
Do not detach hard disks that you already attached and added to the NetMRI storage. This may result in broken NetMRI appliance.

Infoblox NetMRI 7.4.4 Administrator Guide Part 6 Events, Tools and Data Support
Copyright ©2020, Infoblox, Inc. All rights reserved. Page 375
1.2.3.4.
All installed MIBs are listed in the MIB Manager page. To import a new MIB file, do the following:
Go to Settings icon –> Setup –> MIB Management.At the top of the table, click Import to open the Import file requester.Click Browse and navigate to the location where you have saved the MIB file.Select the MIB file and click Import. The file is added to the MIB table.
Note: System MIBs cannot be exported by the MIB manager. MIBs that have previously been installed by the operator may be exported.
Reloading MIBs into the NetMRI system can take several minutes. If a MIB or DSB is imported or removed, the procedure requires several minutes to complete.
Working With Device Support BundlesA Device Support Bundle (DSB) is a small collection of files designed specifically to enable installed to discover, communicate with and manage new types and models of network devices that may not be included in the substantial universe of device support already offered by NetMRI. Features in the appliance enable editing, validation, and testing against managed devices for Device Support Bundles that you create. (Make sure to refer to the Infoblox Device Support Guide document under Additional Documentation for more information on DSB creation.)
Note: The text-based DSB file containing the XML code for the bundle must be in native XML format. Use a text editor that directly supports saving in the .XML file format. A plain-text file. with the file extension .TXT, that contains XML code will not be visible to the import feature.
To begin working with installed's Device Support Bundles feature set, go to Settings icon –> Setup –> Device Support Bundles.
Note: Support bundle operations require the SysAdmin role.
The Device Support Bundles page appears, displaying a table of information for any existing device support bundles. The columns in this table indicate that a given DSB explicitly supports the given data elements (not all fields will necessarily be defined):
Actions Displays the Actions menu for the selected row in the DSB table.
Name Name of the device vendor.
Version Arbitrary version number for the bundle file.
Author Author of the DSB file.
Status Indicates the state of the DSB in the appliance. In most cases the value should read Installed. If you've created a new DSB in the DSB editor but have not yet installed it into the appliance (perhaps because you are in the process of editing it), this value will read New. If you have an installed DSB in the table, but you are in the process of modifying it, its status changes to Modified. Once this is done, you will need to re-install the DSB, or optionally discard the changes; in this case the status appears as Revert.
Valid Ind Will read Yes or No depending on whether a validation test has been run against the DSB.

Infoblox NetMRI 7.4.4 Administrator Guide Part 6 Events, Tools and Data Support
Copyright ©2020, Infoblox, Inc. All rights reserved. Page 376
1.2.
3.
1.2.3.
4.5.
Unit Tests Indicates whether any unit tests are part of the current DSB.
Neighbor Ind Neighbor Object ID information, where applicable, for the DSB type.
Inventory Ind Inventory Object ID information, where applicable, for the DSB type.
Environmental Ind Environmental Object ID information, where applicable, for the DSB type.
CPU Ind CPU ObjectID information for the DSB type.
Memory Ind SNMP System memory ObjectID information, where applicable, for the DSB type.
VLAN Ind SNMP VLAN ObjectID information, where applicable, for the DSB type.
Forwarding Ind SNMP forwarding ObjectID information, where applicable, for the DSB type.
Port Ind The communications port through which the device type in the bundle is reachable.
Config Ind Config information, where applicable, for the device support bundle.
No individual device support XML file is likely to have every definition, or have ObjectIDs (Oids) to represent them in the MIBs. When you load a DSB into the appliance, you may see a series of information messages indicating that some definitions are not present in the XML file. This does not indicate an error.
To create a new Device Support Bundle, do the following:
Go to Settings icon –> Setup –> Device Support Bundle.At the top of the table, click New to create a new Device Support Bundle from the UI. A prompt appears, requesting entry of a name for the new bundle.Enter the name and click OK or press Enter. The DSB Editor window appears. A new DSB is created out of a set of built-in templates. The DSB bundle XML file, in which you write your support file for the bundle, contains a series of XML tags that are documented in each of the development steps. Typically, a device support bundle also will include vendor MIB files, and CCS or Perl scripts to handle configuration file collection. Vendor MIB files may also be imported separately.See the supplementary document Infoblox Device Support Guide in Additional Documentation in the online Help for much more detail on XML DSB tags and writing DSB files, and Job Scripting for much more detail on Perl and CCS scripting.
To import a previously created Device Support Bundle, do the following:
Go to Settings icon –> Setup –> Device Support Bundle.Click Import to open the Import file requester.Click Browse and navigate to the location where you have saved the Zip file with the XML file and the directory containing the needed MIB files.Select the Zip file and click Import.An Import Status dialog box showing the import file output appears. The import may take several minutes to complete, and will display the results of each import function. Click Close when the process completes.

Infoblox NetMRI 7.4.4 Administrator Guide Part 6 Events, Tools and Data Support
Copyright ©2020, Infoblox, Inc. All rights reserved. Page 377
Actions in Device Support Bundle ListsEach table record in a Device Support Bundle list provides an Action icon. Clicking the icon displays a menu for operations working directly with Device Support Bundles in the GUI:
Edit – displays the DSB Editor window where you can directly edit the XML description and the CCS or Perl script associated with the bundle;
Validate – Validate the XML file associated with the DSB. A dialog opens and the process starts automatically (For more information, see Validating and Testing Imported Device Support Bundles);
Install – Install a new DSB into the appliance (applies only to DSBs created in the DSB Editor);
Test – Test the DSB against a recognized and managed device in the network (For more information, see Validating and Testing Imported Device Support Bundles);
Revert – While a DSB is being edited or modified, this menu option is enabled.
Delete – Remove the currently selected DSB row from the table;
Export – Export the selected DSB to the current management system as a Zip file.
Editing Device Support BundlesNetMRI's Device Support Bundles table provides a simple GUI-based DSB Editor for making on-the-fly changes to text files in the bundle. Clicking the Action icon in a table row and selecting Edit displays the editor, automatically showing the contents of the XML file for the bundle.
The XML is for the descriptor file containing all of the vital DSB descriptor tags for the device definition. It is not related to the MIB files that may or may not be bundled in the DSB. MIB files are usually bundled inside the tarball/Zip file comprising a DSB, that is imported into NetMRI. These MIBs do not have to be included in the bundle, but they are managed using the MIB Management page in Settings icon –> Setup –> Device Support Bundles. The DSB editor does not edit these files. You can use the DSB Editor to edit the XML configuration description and the CCS or Perl scripts for the bundle.
Supporting Custom Device TypesNew device types can be created and are fully compatible with the DSB engine. In the DSB Editor (Settings icon –> Setup –> Device Support Bundle), you can begin by editing the XML file for the new Type:
<?xml version="1.0" ?>
<dsb name="Acme" version="201101010000" author="ca" NetMRI="6.4.1">
<mibenterprise number="99999" vendor="Acme" />
<devicetype name="Vending Machine" rank="75" defaultGroup="true" networkType= "true" collectIntf="true" collectARP="true" collectRoute="false" />
<versionmap vendor="Acme" variable="sysDescr" var_match="/Acme Vending Machine Model: .+ Version: ([\\d\\.]+)/" var_replace="$1" triggered="whenUnknown" />
<modelmap vendor="Acme" variable="sysDescr" var_match="/Acme Vending Machine Model: (.+) Version:/" var_replace="$1" />
<devicemap identification="%Vending Machine%" sysServices="72" ipForwarding="not-forwarding" devicetype="Vending Machine" />
<cpu vendor="Acme" cpuOid="ssCpuIdle" cpuOidType="busyTable" performanceObject="HostResources" />
...

Infoblox NetMRI 7.4.4 Administrator Guide Part 6 Events, Tools and Data Support
Copyright ©2020, Infoblox, Inc. All rights reserved. Page 378
•••
1.2.3.
4.
1.2.3.4.5.
The example is reduced for brevity. The XML changes are reflected in the Device Viewer:
Further changes require editing of Perl or CCS files, and possible inclusion of MIB files.
Validating and Testing Imported Device Support Bundles
Note: If a device of the desired type is not currently discovered by NetMRI, the Test option in Device Support Bundles is disabled.
Users can test new or currently installed Device Support Bundles. Validation functions, which test the bundled files for syntax errors and for well-formed XML syntax, include the following:
Validate a DSB XML file against a pre-defined W3C XML schema;Validate a CCS file against syntax errors;Validate a Perl file against syntax errors.
In a separate operation, NetMRI also tests the DSB against a live device. In the GUI, NetMRI allows users to select a Device Support Bundle, and choose a live device to test against (this device must be discovered and managed by NetMRI). The test includes SNMP and CLI sessions against the real device depending on how respective support is specified in the Device Support Bundle.
A Device Support Bundle must be installed into NetMRI before it can be validated and tested. When finished, the appliance reports the validation and testing results to the user. Should either operation fail, the corresponding status is set in the Device Support Bundles table for the DSB.
Examples in this section assume a bundle is already installed. To validate a Device Support Bundle, do the following:
Go to Settings icon –> Setup –> Device Support Bundles.In the Actions column, click the Actions icon for the bundle you want to test.From the drop-down menu, choose Validate.Two validation tests are run: one against the XML, and one against the Perl or CCS script.Click Close when finished.
To test a Device Support Bundle, do the following:
In the Actions column, click the Actions icon for the bundle you want to test.From the drop-down menu, choose Test.In the Test DSB dialog, select the device against which you want to test the DSB.Click Test to begin.Click Close when finished. The test results will appear in the Device Support Bundles table.
Automating Device Support Request Data CollectionA wide variety of devices exist in enterprise networks. NetMRI offers the ability to create a complete and detailed Device Support Request package for network devices, or device OS versions, that are not directly supported by NetMRI.
Note: You may use a standalone NetMRI appliance or an Operations Center (OC) system to perform Device Support Request data collection. If you are using an OC, discovery and data collection is automatically delegated to the correct appliance.
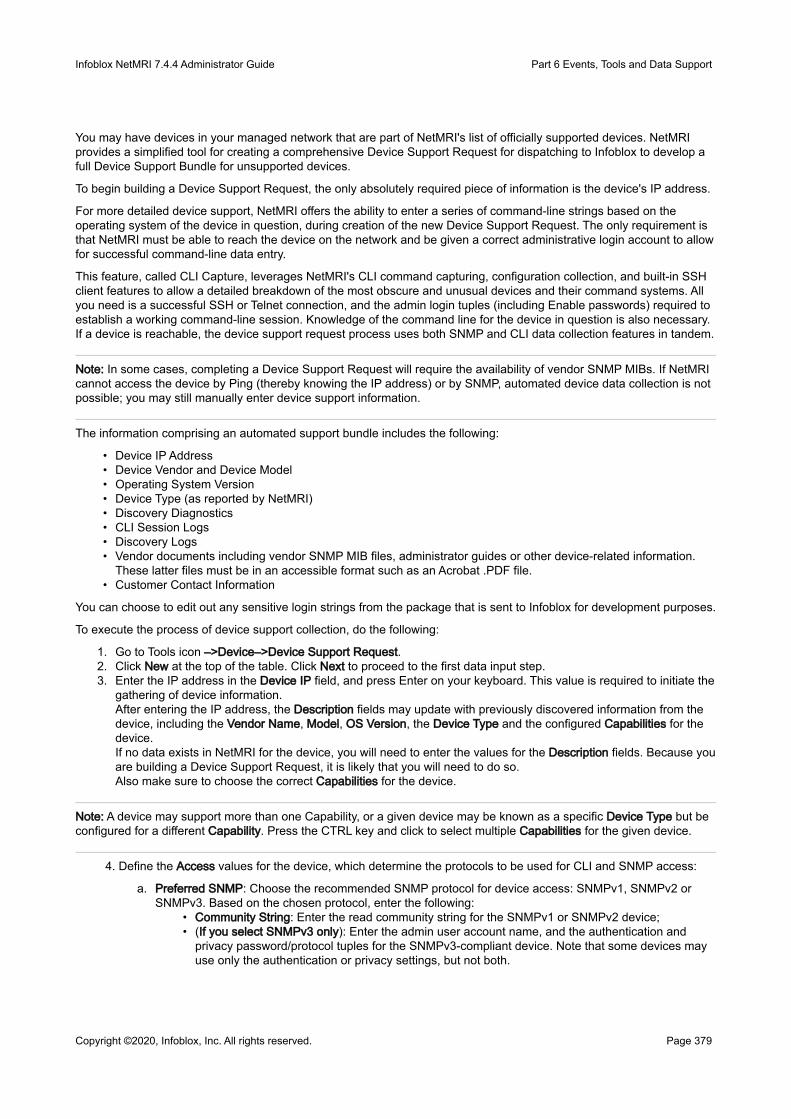
Infoblox NetMRI 7.4.4 Administrator Guide Part 6 Events, Tools and Data Support
Copyright ©2020, Infoblox, Inc. All rights reserved. Page 379
••••••••
•
1.2.3.
a.
••
You may have devices in your managed network that are part of NetMRI's list of officially supported devices. NetMRI provides a simplified tool for creating a comprehensive Device Support Request for dispatching to Infoblox to develop a full Device Support Bundle for unsupported devices.
To begin building a Device Support Request, the only absolutely required piece of information is the device's IP address.
For more detailed device support, NetMRI offers the ability to enter a series of command-line strings based on the operating system of the device in question, during creation of the new Device Support Request. The only requirement is that NetMRI must be able to reach the device on the network and be given a correct administrative login account to allow for successful command-line data entry.
This feature, called CLI Capture, leverages NetMRI's CLI command capturing, configuration collection, and built-in SSH client features to allow a detailed breakdown of the most obscure and unusual devices and their command systems. All you need is a successful SSH or Telnet connection, and the admin login tuples (including Enable passwords) required to establish a working command-line session. Knowledge of the command line for the device in question is also necessary.If a device is reachable, the device support request process uses both SNMP and CLI data collection features in tandem.
Note: In some cases, completing a Device Support Request will require the availability of vendor SNMP MIBs. If NetMRI cannot access the device by Ping (thereby knowing the IP address) or by SNMP, automated device data collection is not possible; you may still manually enter device support information.
The information comprising an automated support bundle includes the following:
Device IP AddressDevice Vendor and Device ModelOperating System VersionDevice Type (as reported by NetMRI)Discovery DiagnosticsCLI Session LogsDiscovery LogsVendor documents including vendor SNMP MIB files, administrator guides or other device-related information. These latter files must be in an accessible format such as an Acrobat .PDF file.Customer Contact Information
You can choose to edit out any sensitive login strings from the package that is sent to Infoblox for development purposes.
To execute the process of device support collection, do the following:
Go to Tools icon –>Device–>Device Support Request.Click New at the top of the table. Click Next to proceed to the first data input step.Enter the IP address in the Device IP field, and press Enter on your keyboard. This value is required to initiate the gathering of device information.After entering the IP address, the Description fields may update with previously discovered information from the device, including the Vendor Name, Model, OS Version, the Device Type and the configured Capabilities for the device.If no data exists in NetMRI for the device, you will need to enter the values for the Description fields. Because you are building a Device Support Request, it is likely that you will need to do so.Also make sure to choose the correct Capabilities for the device.
Note: A device may support more than one Capability, or a given device may be known as a specific Device Type but be configured for a different Capability. Press the CTRL key and click to select multiple Capabilities for the given device.
4. Define the Access values for the device, which determine the protocols to be used for CLI and SNMP access:
Preferred SNMP: Choose the recommended SNMP protocol for device access: SNMPv1, SNMPv2 or SNMPv3. Based on the chosen protocol, enter the following:
Community String: Enter the read community string for the SNMPv1 or SNMPv2 device;(If you select SNMPv3 only): Enter the admin user account name, and the authentication and privacy password/protocol tuples for the SNMPv3-compliant device. Note that some devices may use only the authentication or privacy settings, but not both.

Infoblox NetMRI 7.4.4 Administrator Guide Part 6 Events, Tools and Data Support
Copyright ©2020, Infoblox, Inc. All rights reserved. Page 380
b.
•••
••••
•
•••
•
•
••••
•
Preferred CLI: Choose SSH, Telnet, or Other. After you enter the login information and click Next to go to the next step, NetMRI tests the specified connection to the device to ensure reachability. Also note that if CLI is a data collection method, you may need to enter a sequence of command-line functions from the operating system of the device.
SSH: Add the admin User Name and Password.Telnet: Add the admin User Name and Password.Other: Choose this value if you expect to use SNMP as the primary means of device access. CLI access through SSH or Telnet will not be attempted if you choose this option.
If you do not select Other, you enter the device's CLI admin credentials in the terminal screen.
c. Methods to Support Infoblox Testing: Infoblox Support requires access to your device, using your chosen method, to verify the new device support information. Choose from the following:
VPN to Device.Access Through NetMRI.Loan of Device.Other (requires a directive by the user to make arrangements for the testing).
d. Contact Info: Enter customer contact information, preferred method of contact, and contact details.
Preferred Contact: Specify the preferred method of contact. Select E-mail to contact customer through email message or select Phone to contact customer by phone.Customer Name: Enter the customer name.Contact Name: Enter the name of the contact person.Email Address: Enter the email address. This field is displayed if you select E-mail as preferred method of contact. You can enter up to 50 characters.Phone Number: Enter the phone number. This field is displayed if you select Phone as preferred method of contact. You can enter up to 50 characters.
Note: The customer name will be included in the file name that is downloaded to the local machine or when it is uploaded to external servers through FTP and other methods.
5. Click Next. If you are using SNMP, you will receive a message as follows:
SNMP data for the device will be collected in background and this process may take time.
a. This message also indicates establishment of successful SNMP communication. CLI reachability is not tested. Click OK to proceed.
6. In Step 3 of the tool, CLI Capture, the page divides into two panes: a scrolling list of configuration tasks on the left that you perform for the device in question; and a terminal window on the right pane showing the SSH or Telnet interactive session to the device.
The list in the left pane provides a list of key tasks to perform a full configuration capture of important command-line processes in the device. This list of tasks changes according to the device type, and to the capabilities chosen by the user.
The first task, Configure Device to send Syslogs to NetMRI, is automatically selected. For many devices, some descriptions may not be relevant.Most, such as Display Device's IPv4 ARP information or Display Device's IPv4 Route information, are relatively straightforward. All commands are mandatory except for the ones that you explicitly skip by clicking Not Applicable and choosing from the following options:
Device does not support this function;Current configuration does not support this function;I'm not permitted to do this function;Other.
NetMRI collects the responses to each command as you enter them.
Log in to the device using the terminal window on the right pane. Enter each configuration command in the sequence listed on the left. After each command and its displayed results (assuming the results are

Infoblox NetMRI 7.4.4 Administrator Guide Part 6 Events, Tools and Data Support
Copyright ©2020, Infoblox, Inc. All rights reserved. Page 381
•
••
•
••
••
•
••
•
•
•
satisfactory), click the Done button. A green checkmark appears by the selected command and the Wizard selects the next list item.If a command is not relevant for the device type, or is not available, click Not Applicable to go to the next one, and enter that command in turn. Continue until you have finished entering all the commands that you will send in the Device Support Request package.
You can return to any listed command function to correct an error.
7. Click Next. Doing so compiles the command sequences into an encrypted data file. (This does not apply if you are using only SNMP.) In Step 4 of the tool, the Document Attachments phase, you upload any documents that may be available for the device in question. Clicking the Add sign allows loading for the following:
Device Admin Guide: Vendor documentation for the network device.Vendor MIBs: typically a text-format file that contains the complete listings of the vendor-defined SNMP Object IDs and other information required to interact with the device using an SNMP-compliant management system (such as, of course, Infoblox NetMRI).Device Change Syslog: Upload a text or word processing file listing a series of Syslog messages that appear when interacting with the device.Screenshot: Any screen capture graphics that may prove useful in support development.SNMP Logs: A text or word processing document listing the series of SNMP logs that appear when the device is probed by NetMRI through the SNMP protocol.
8. Click Next. The tool offers a chance to remove any sensitive account data (accounts and passwords, community strings) from the sent Support Request. Any credentials that you previously provided for the initial testing and device interaction can be removed in this step.
Click Show Strings to verify the contents of the values you enter.Click Add to add and enter more strings to the list that you want excluded from the Device Support Request.
9. Click Next. Step 6 of the tool provides a list of the items provided for the Device Support Request: Device Information, Document Attachments, CLI Command Capture, Change Detection Syslog, Discovery Test and SNMP Data Capture. Some items may show a status of Complete or Missing. Click on the Document Attachments or CLI Command Capture links to return to their respective tool pages.
If necessary, click the links in Step 6 to perform any of the following:
Rerun SNMP Walk: Execute another SNMP probe to the device using the credentials you supplied, to perform data collection.Rerun Discovery: Execute the NetMRI discovery process on the device to perform data collection.Refresh Status: Refresh the contents of the Step 6 tool page to verify if a particular task completes.
10. Click Next. Step 7 of the tool requires definition of the means of Device Support request delivery to Infoblox:
Secure Transfer to Infoblox: Chooses automatic secure file transfer to Infoblox Support. The Infoblox Support FTP server must be reachable by NetMRI. You can test connectivity and settings in the NetMRI command line using the steps in External server import/export using FTP .Email: Chooses automatic email attachment to Infoblox Support, with the option to enter other email addresses.Download to Local Machine: Save locally to allow the user to manually send the package file.
11. Click Next and click Finish. After a moment, the Device Support Request table reappears, displaying the status Finalizing Request. The Request entry will eventually refresh to show Complete status. If you choose Automatic Secure Transfer to Infoblox or Email, the bundle request file is sent to Infoblox Support. Otherwise, the Wizard saves the bundle request file to your hard drive.
You can click the Action icon for any Request entry, and choose Edit or Delete.
Defining and Using Custom FieldsThe Custom Fields page (Settings icon –> General Settings –> Custom Fields) enables you to define custom data fields for uncovering and recording any information about network devices, changes and jobs. For devices, custom fields are useful for recording important contextual data such as asset tag numbers and physical location — information that

Infoblox NetMRI 7.4.4 Administrator Guide Part 6 Events, Tools and Data Support
Copyright ©2020, Infoblox, Inc. All rights reserved. Page 382
•
•
•
•
•
••
•
•••
1.
2.3.
4.
5.
•
•
1.
2.3.4.
NetMRI does not gather on its own.Administrators can add extensible data in the following contexts, with examples suggested for each:
Interfaces — Creates Interface Custom Fields. Update and augment information on interfaces with usage codes, or allowing usage designation of interfaces for Tier 1 tracking;Components — Creates Components Custom Fields. Update information for components such as line cards with serial numbers that are collected by custom CLI interrogation or asset tag numbers;Jobs — Creates Job Custom Fields. Update job definitions with custom information, including trouble ticket values or simple 'notes';Devices — Creates Device Custom Fields. Custom data can apply to almost any phenomenon involving devices, such as provisional IPv6 values for devices whose kernels do not yet support IPv6; custom output messages, different identification fields, and other information. You may use device custom fields in device group definitions to help match discovered and managed devices against logically named device groups. For information on how do so, see Understanding Device Group Membership Criteria and its subsection Device Group Criteria and Device Custom Fields;Changes — Creates Change Custom Fields. Add new fields to help keep track of changes in the network.
The entire Custom Fields feature set enables association of NetMRI to other operational systems and operational data, for better integration into organizational processes for asset management and other purposes.
Note: For jobs and changes, custom fields can be used to record information such as ticket numbers.
Custom fields you define in this page can be populated with data in the following locations:
For devices: Device Viewer –> Device/Network Explorer section –> Custom Data.As noted, you can edit the Device Group Criteria field for any device group to enable the use of custom fields as matching criteria in devices;
For jobs: In the Job Wizard available via the New button; and the Edit button in Configuration Management –> Job Management –> Scheduled Jobs.For changes: In Network Analysis –> Changes.For Interfaces: Interface Viewer –> Interface –> Custom Data.For Components: Device Viewer –> Device/Network Explorer –> Component Inventory.
To create a custom data field, do the following:
In the upper left corner of the Settings icon –> General Settings –> Custom Fields page, open the Type menu and select a custom data type (Changes, Devices, Interfaces, Jobs or Components). For device group matching, for example, choose Devices.Click New. The Add custom field value dialog appears.Enter a new Name for the field.Open the Type list and select a field type (Date, Number or String) appropriate for the kind of data to be recorded in the field.To create more than one field, click Save. The new field is added to the table in the background. You can enter another custom field using steps 4 & 5.When finished, click Save & Close.
Consider the following regarding custom field names:
Do not use suffixes “_changed?”, “_change”, “_will_change!”, and “_was” in custom field names as such names cannot be created in NetMRI.If you use spaces and hyphens in custom field names, replace them by underscores in jobs or other places where they are used. This is due to internal NetMRI mapping of spaces and hyphens in custom field names to underscores. For example, if you define a custom field name as “external device” or “external-device”, specify it as “external_device” for a device group membership criteria, otherwise the field will not be accepted.
To edit a custom data field, do the following:
In the upper left corner of the Settings icon –> General Settings –> Custom Fields page, open the Type menu and select a custom data type: Changes, Devices, Interfaces, Jobs or Components.Click the Edit button for the field. The Edit custom field definition dialog appears.Change the Name and/or Type as needed.Click Save & Close.

Infoblox NetMRI 7.4.4 Administrator Guide Part 6 Events, Tools and Data Support
Copyright ©2020, Infoblox, Inc. All rights reserved. Page 383
1.
2.3.
1.
2.3.4.5.6.7.8.
To delete a custom data field, do the following:
Note: Deleting a custom field deletes all data stored in that field. Deleted data cannot be restored. The related custom fields will also be deleted from the contexts in which they are used.
In the upper left corner of the Settings icon –> General Settings –> Custom Fields page, open the Type menu and select a custom data type.Click the Delete button for the field.Confirm the deletion.
Importing Custom Field DataAs a labor-saving move, and a way to enforce a design and data standard for all custom data fields you wish to define in the appliance, you can create one or more device custom data fields in any of the six categories (Changes, Devices, Interfaces, Job News, Jobs or Components), or import bulk data to populate the fields for Devices, Interfaces or Components data types. Each record is comma-delimited. Place the data in a CSV file having the following syntax:
For Devices:
<VirtualNetworkName>,<DeviceIPAddress>,<CustomFieldName>,<CustomFieldValue> first_network,192.168.2.1,Numeric_ID,2
For Interfaces:
<VirtualNetworkName>,<DeviceIPAddress>,<InterfaceName>,<CustomFieldName>,<CustomFieldValue> first_network,192.168.2.1,eth3,Identifier,inbound_marketing
For Components:
<VirtualNetworkName>,<DeviceIPAddress>,<PhysicalName>,<CustomFieldName>,<CustomFieldValue> first_network,192.168.2.1,eth3,Identifier,inbound_marketing
For all custom field entries, the Virtual Network Name field is optional. When it is not defined, a search is performed for a device not included into any virtual network view.
Examples:
first_network,192.168.1.2,lo,integer_custom_field,2
second_network,192.168.1.3,eth0,string_custom_field,something_cool
To import bulk custom data of any type, do the following:
In the upper left corner of the Settings icon –> General Settings –> Custom Fields page, open the Type menu and choose Devices, Interfaces or Components depending on the application. These are the only three Custom Field categories that supportClick Import. The Import Custom Field Data dialog opens.Click Browse, then locate and select the bulk data CSV file.Click Import.Under Network Analysis –> Changes, view the table of recent changes to devices in the network.Move the mouse over any column in the table, and click the down arrow at the right end of the column heading.In the drop-down menu, hover over Columns.In the Columns submenu, check the custom field column(s) you want to appear in the table. The table will update to display the new column of data.
Also see Viewing Changes in the Network for more information about the Changes page in NetMRI.
Adding Custom Data Fields in Network Explorer Inventory PagesNetMRI enables custom information to be applied to the Inventory pages for any category within Network Explorer –> Inventory –> (Devices, Interfaces, OSs and Models.).

Infoblox NetMRI 7.4.4 Administrator Guide Part 6 Events, Tools and Data Support
Copyright ©2020, Infoblox, Inc. All rights reserved. Page 384
1.
2.
3.4.5.
1.
2.3.
4.
5.
6.7.8.
1.2.3.4.
For example, under Devices, all four categories of table information—Devices, Device Components, Connected End Hosts and Connected IP Phones — can display custom data to provide further insight into the state and details of a given device, host or other inventory component.
Some custom fields, depending on the information provided by them, may or may not be applicable to specific tables of information.
To add custom fields into tables within Network Explorer's Inventory pages, do the following:
Under Network Explorer –> Inventory, select any of the four categories of information (Devices, Interfaces, OSsor Models.)Choose any of the sub-categories of information and the corresponding table appears. For example, under Devices, choose Device Components (you are not limited to this choice).Move the mouse over any column in the table, and click the down arrow at the right end of the column heading.In the drop-down menu, hover over Columns.In the Columns submenu, check the custom field column(s) you want to appear in the table. The table will update to display the new column of data.
Adding Custom Data Fields in Job ManagementJob Management accommodates custom data fields to provide extremely flexible ways of reporting data and presenting different types of information beyond job defaults.
To define and use custom data fields in jobs, do the following:
In the upper left corner of the Settings icon –>GeneralSettings–>CustomFields page, open the Type menu and select the Jobs custom data type.Click New at the bottom right of the Custom Fields page.In the Add Custom Field dialog, select the Type (Date, Number or String) and enter the Name for the new data field. Save your work.To create more than one field, click Save. The new field is added to the table in the background. You can then enter another new field.When finished, click Save&Close.Custom fields can be displayed in the Scheduled Jobs page of Job Management (ConfigurationManagement–>JobManagement tab –>ScheduledJobs tab).Move the mouse over any column in the table, and click the down arrow at the right end of the column heading.In the drop-down menu, hover over Columns.In the Columns submenu, check the custom field column(s) you want to appear in the table. The table will update to display the new column of data.
Adding Custom Data Fields in Network AnalysisNetMRI tracks all configuration changes made to managed devices in the network. Custom fields are used to display new data types that are not present in the Change Summary dashboard.
To add custom fields onto the Changes page, do the following:
Under NetworkAnalysis–>Changes, view the table of recent changes to devices in the network.Move the mouse over any column in the table, and click the down arrow at the right end of the column heading.In the drop-down menu, hover over Columns.In the Columns submenu, check the custom field column(s) you want to appear in the table. The table will update to display the new column of data.
Also see Viewing Changes in the Network for more information about the Changes page in NetMRI.
Enabling Custom Data Field Editing for Non-Admin UsersYou may enable non-Admin users with limited privileges to edit custom field data within device groups, jobs, interfaces, network components or change events for which they have responsibility.

Infoblox NetMRI 7.4.4 Administrator Guide Part 6 Events, Tools and Data Support
Copyright ©2020, Infoblox, Inc. All rights reserved. Page 385
1.
1.2.
3.4.
5.6.7.
••
1.
This feature is useful, for example, when a non-Admin NetMRI user needs to add notes on a regular basis to device records in the groups that they administrate, or descriptive notes on interfaces they manage.
For purposes of this section, we assume previous definition of a non-Admin user account with the necessary Roles and device group assignments needed for the user. (For information, see Understanding Users and Roles and its sub-topics.)
To add custom field editing privileges to a non-Admin account, the admin user does the following:
(For Admin users) Ensure you have the needed non-Admin account in your user database.
Note: Check assigned Roles for the user in the Settings icon –> User Admin –> Users page.
2. Open the Role for the non-Admin user account from the Settings icon –> User Admin –> Roles page.
3. Begin editing the Role by clicking its Action gear icon and choosing Edit from the menu.
For example, a user 'jsmith' manages the Routing and Switching device groups, and possesses the Roles ConfigAdmin and Switch Port Administrator. For custom data editing, you add the Custom Data: Input Data privilege to one or more Roles for the non-Admin user.
4. Click the Privileges tab in the Edit Role dialog, and click Add.
5. Enable the checkbox for the Custom Data: Input Data privilege, and click OK.
6. Click Save & Close. NetMRI saves the new custom data privilege into the Role.The new Privilege automatically applies to any user accounts to which the Role is bound. (You will note that custom Roles can be defined in the Roles page.)
As an example, consider a case where an interface on a high-end distribution switch is dedicated to a particular department circuit, and you want the non-Admin user to add notes to its records. Do the following:
Have the non-Admin user log in to the NetMRI instance.Open the Network Explorer –> Inventory –> Interfaces –> Interface Config and click an Interface identifier. The Interface Viewer appears for the chosen port.Open the Interface –> Custom Data page.At the bottom of the page, click New. (This indicates that the non-Admin user can work with this data set.) The Add Custom Field dialog appears.From the Name: dropdown, choose the desired Custom Field to be added to the port information display.In the Value field, enter the notes or other information for the custom field.Click Save & Close.
The custom field is applied on a granular per-interface level. In the Device Viewer, you apply custom fields from the Device/Network Explorer –> Custom Data page.If a non-Admin user does not find an active Add button at the bottom of a feature set's Custom Data page (for example, in the Interface Viewer, in the Device Viewer, or for a Job), two possible issues may apply:
The Custom Data: Input Data Privilege has not been properly added to the user's Role;Custom Field definitions have not been defined by the holder of the admin account. As noted above, five types of custom fields may be defined: Changes, Devices, Components, Interfaces and Jobs. For more information, see Defining and Using Custom Fields and its subsections for details of all five custom field types available in the system.
The Device Viewer's Device/Network Explorer –> Custom Data page is not enabled for non-Admin users unless the admin creates a Custom Field for the type Devices; and adds the Custom Data: Input Data privilege to the user's Role.
For Jobs and Changes types, custom fields could be used to record data such as trouble ticket numbers. Admin users may define new Custom Fields in the Settings icon –> General Settings –> Custom Fields page.
Verifying Field Content In Device Viewer & Interface ViewerAfter any custom data fields have been created in the Settings icon –> General Settings –> Custom Fields page, you can verify them and begin using them in the appliance by doing the following:
In Network Explorer, click the IP address of a device. The Device Viewer opens.

Infoblox NetMRI 7.4.4 Administrator Guide Part 6 Events, Tools and Data Support
Copyright ©2020, Infoblox, Inc. All rights reserved. Page 386
2.
3.
4.
5.6.
7.
1.
2.3.4.5.
Under Device Viewer –> Device/Network Explorer–> Custom Data, check the list of custom fields in the device context. The Custom Data fields in this section will differ from those in other sections of the Device Viewer, such as Component Inventory. These fields are created under Settings icon –> General Settings –> Custom Fields –> and selecting the Devices type.In the Device Viewer –> Device/Network Explorer –> Component Inventory, select a row in the Component Inventory table for the selected device.Click the Edit Custom Fields button just above the Component Inventory table in the Device Viewer.The Edit Custom Fields dialog appears, displaying the list of one or more custom fields (defined under Settings) for this data set. Remember, these fields are defined under the Components type in Settings icon –> General Settings –> Custom Fields and all fields you define in this category will appear in the Edit Custom Fields dialog box only in this context.Enter the necessary values in the custom fields for the selected inventory row.Click Save & Close to save changes and return to the Component Inventory. Or, click Save to select another custom field and enter another value.Filter the table of inventory information by clicking Filters above the Component Inventory table, and select the desired fields/columns by which the table is filtered. Any custom fields you have created for this category will appear here.
To check Custom Data field configuration in the Interface Viewer and use custom fields therein, do the following:
Under Device Viewer –> Interfaces–> Configuration, click an entry in the Interface column. The Interface Viewer appears in a separate popup window.Under Interface–> Custom Data, click New. The Edit Custom Field Value dialog appears.Click the Name dropdown list. The custom data fields for the Interface context will appear in the dropdown.Select the desired custom field and enter the correct value for the field.Click Save & Close to save changes and return to the Interface Viewer. Or, click Save to select another custom field and enter another value.
To delete locally-used custom fields from the Interface Viewer, do the following: Custom Fields information can be deleted locally in the Interface Viewer context without removing the Custom Fields configuration from the entire system.Under Interface Viewer –> Interface –> Custom Data, click the Delete icon in the table for the field information you want to remove. Confirm the deletion. (You can add it back at any time, but any locally defined values are lost.)
Administrative ShellIn addition to the browser-based interface accessible via HTTP (port 80) and HTTPS (port 443), NetMRI supports a command line interface accessible via SSH (port 22). The Administrative Shell accepts a variety of commands that are useful for troubleshooting and maintenance.
For security purposes, you must access the Administrative Shell using the Secure Shell (SSH) client application on your workstation. By encrypting all session traffic, the SSH client prevents local network users from monitoring your administrative session.
Access Using the Command Line SSH clientInitially connecting to the Administrative Shell using the SSH command line client requires that you supply a username as one of the command line parameters, as shown in this example:
ssh –l admin <system>
where <system> is the hostname or IP address assigned to NetMRI. At that point, you are prompted for the admin account password, which is the same as that used for the browser interface.
Administrative Shell MenuAfter a successful login, the shell displays a list of commands.

Infoblox NetMRI 7.4.4 Administrator Guide Part 6 Events, Tools and Data Support
Copyright ©2020, Infoblox, Inc. All rights reserved. Page 387
To do this... Type this at the command prompt...
Display the list of commands ?
Display a description of a command <command>?
View previously executed commands UP-ARROW or DOWN-ARROW
Edit a previously executed command LEFT-ARROW, RIGHT-ARROW, BACKSPACE, DELETE
Shell CommandsThe administrative shell commands are listed in the following subsections. Many of these commands are self-explanatory and are similar to those provided by other network appliances.
acl commandThe acl command enables you to restrict users' access to NetMRI to a list of IP addresses or subnets, thereby reducing the likelihood of unauthorized access. By default, the appliance accepts user connections via HTTP (port 80), HTTPS (port 443), SSH (port 22) and SYSLOG (port 514). If an access control list is defined, any or all of these ports can be restricted to a specific list of IP addresses.
The following sub-commands are supported by the acl command:
list lists all ACL entriesflush clears all ACL entries (no access restrictions)accept accepts connections from a given CIDR block reject rejects connections from a given CIDR blockcommit saves the ACL and makes it active
The accept and reject commands accept the following arguments:
accept <CIDR 22 | 80 | 443 | 514 | ssh | http | https | syslog | amqps |all
reject <CIDR 22 | 80 | 443 | 514 | ssh | http | https | syslog | amqps | all
where <CIDR is formatted as A.B.C.D/NN. For example, the following commands:
flush
accept 192.168.12.0/24
all commit
would allow connections from any host in the specified subnet to any of the access ports supported by NetMRI. If you'd like to exclude specific hosts from a range of addresses, you should use one or more reject commands before the acceptcommand as in the following example:
flushreject 192.168.12.66/32 all
reject 192.168.12.99/32 all
accept 192.168.12.0/24 all commit
If at least one ACL entry is defined, all access attempts other than those specifically listed are rejected; if no ACL entries are defined, all access attempts are accepted.Typing acl ? at the prompt provides a brief list of all options:

Infoblox NetMRI 7.4.4 Administrator Guide Part 6 Events, Tools and Data Support
Copyright ©2020, Infoblox, Inc. All rights reserved. Page 388
•
•
rgrace64-212.inca.infoblox.com> acl ? ACL Commands ------------ ?- display this list
commit - save working ACLs and make active
exit - exit ACL mode
flush - clear all working ACL entries
list - list all working ACL entries
reload - clear working entries and reload from disk
The following commands add or remove entries to the ACL to either allow or reject access from given CIDRs. The order of ACL entries is important, with the first matching rule from top to bottom used to determine if a given host can access the system.
accept <CIDR> 22|80|443|514|ssh|http|https|syslog|amqps|all
reject <CIDR> 22|80|443|514|ssh|http|https|syslog|amqps|all
delete <CIDR> 22|80|443|514|ssh|http|https|syslog|amqps
where <CIDR> is formatted as A.B.C.D/NN or <IPv6 Address>/<Prefix>
Use "0.0.0.0/0" CIDR to refer to all IPv4 sources, or "::/0" CIDR for all IPv6 sources. The ACL list must be committed to take effect.
archive commandUse the archive command to manually back up the Event Collector index and related system data. The command’s syntax is the following:
archive [ <startDate [ <archiveName ]]
where
<startDate> may be yesterday (default), today or YYYY-MM-DD
<archiveName> names the file
Unlike the command of the same name in the Administrative Shell, this archive command only backs up part of the Event Collector data: at least all data from the start date until the current time. Because data is saved in chunks of about 750MB, an archive may include data from before the start date.
autoupdate commandThe autoupdate command is used to upgrade NetMRI software via the Internet, CD or upgrade file provided by Infoblox. See the section Manually Updating NetMRI Software for details. The command’s syntax is
autoupdate <filename> [auto | force-major]
Where:
auto command-line mode to set AutoUpdate to function automatically without user prompting. This mode does not allow automatic major updating.
Example:
autoupdate auto
force-major used in an autoupdate auto command to allow automatic updates in all circumstances, including major updates. Example:

Infoblox NetMRI 7.4.4 Administrator Guide Part 6 Events, Tools and Data Support
Copyright ©2020, Infoblox, Inc. All rights reserved. Page 389
autoupdate auto force-major
benchmark run commandThe benchmark run command executes the Infoblox Benchmark tool to test the hardware performance of your NetMRI VM.
Following is a sample output from this command:
SA-4-100> benchmark run
Do you want to run the benchmark on the next boot? (y or n): y
***************************************************************************
The benchmarking is a long-running process and can take up to 1 hour.
During this process system will respond only to pings, the CLI and UI
will be unavailable. Please be patient.
***************************************************************************
Do you want to reboot right now? (y or n): n
The benchmark tool will be launched on the next boot.
SA-4-100>
benchmark show commandThe benchmark show command displays the benchmark results for the NetMRI VM performance in terms of device count.
Following is a sample output from this command:
SA-4-100> benchmark show
Device Capacity (the benchmark was executed on 2020-03-09 03:07:47.939190)Current compatibility mode: Operations Center---------------------------+----------------------+------------------------Calculated Based On | Standalone/Collector | Operations Center---------------------------+----------------------+----+-------------------CPU (40 cores, 67883 MIPS) | 3650 | 18600Storage (30061 IOPS) | 5000+ | 20000+
RAM (205 Gb) | 5000+ | 20000+---------------------------+----------------------+------------------------Result | 3650 | 18600
cac commandThis command allows the configuration of the OCSP authentication service. It includes the following subcommands:
cac status: Prints out the CAC status: “Certificate authentication”, “OCSP”, "Configured CA".
cac enable: Enables the certificate validity check.
cac disable: Disables the certificate validity check.
cac ocsp-enable: Enables the certificate revocation check.

Infoblox NetMRI 7.4.4 Administrator Guide Part 6 Events, Tools and Data Support
Copyright ©2020, Infoblox, Inc. All rights reserved. Page 390
cac ocsp-disable: Disables the certificate revocation check.
configure commandConfigure is essentially the command line equivalent of the Settings icon –> General Settings –> Security page. The command’s syntax is
configure <setting> [show | reset]
where <setting> is
ssh configures SSH client and servers
http configures HTTP and HTTPS servers
snmp configures SNMP servers
auth configures authentication methods
and reset resets all protocols to the factory defaults.
The configure command supports the following sub-commands:
auth Define the external authentication service, if any, that NetMRI uses to authenticate user logins.
certificates Install an SSL certificate into the NetMRI system for HTTPS sessions.
discovery Define the basic device Discovery device expiration period, which is the time period that elapses before NetMRI automatically re-discovers any given device in its database. The default is seven (7) days;
http Determines whether the HTTP and HTTPS servers are activated in the NetMRI system. You can also enable or disable individual encryption protocols in the HTTPS suite. By default, NetMRI enables all protocol options. You must restart the services after making any changes, which consists of a full restart of NetMRI.
ip Define the NetMRI management IP address, which is the IP used to communicate with the appliance. Should you change this value, the system will require a restart and your current terminal session will lose connectivity. Exercise caution when using this command.
server Starts the configuration for standalone NetMRI and Operations Center Controllers and Collectors. During this configuration you specify network name, NetMRI server name, domain name, time server, time zone, NetMRI IP address and subnet mask, and several other basic operating parameters.
snmp Enable or disable support for specific SNMP protocol types, define the community string and the SNMP passphrase.
ssh Define basic settings for SSH client and NetMRI SSH server, including enabling or disabling of either communications protocol and the type or types of encryption protocols supported by each. Under most circumstances, the defaults should be retained unless organization policy requires specific settings. You must restart the services after making any changes.
debug commandEnables debugging logs from NetMRI processes to be displayed and compiled into a text file.

Infoblox NetMRI 7.4.4 Administrator Guide Part 6 Events, Tools and Data Support
Copyright ©2020, Infoblox, Inc. All rights reserved. Page 391
Note: Do not run the debug command from your system without instructions from Infoblox Support.
deregister commandAllows the deregistration of a Collector instance or appliance from the NetMRI Operations Center.
Example
netmrivm193> deregister
diagnostic commandUse diagnostic to execute diagnostic scripts provided by Infoblox Technical Support for troubleshooting or customization purposes. If a diagnostic script is required, it is provided by Infoblox as a digitally signed, compressed TAR file to be uploaded to the Administrative Shell directory (placed by the Admin account only in the admin/Backup folder) and executed using the following Admin Shell command:
diagnostic <filename>
where <filename> is the name of the diagnostic script file.
export cert commandSimple command to export the built-in appliance PKCS certificate to a file titled netmri.crt.
netmrivm193> export cert
Certificate has been exported to netmri.crt
netmrivm193>
installhelpfiles commandUse the installhelpfiles command to install custom help information to appear on a specified Issue Details page for a custom issue. Should no custom Issues information be found, the command will terminate with a No issue titles foundmessage. Consult the topic Creating Custom Issue Help files for more information.
license generate commandUse license generate command to obtain a new NetMRI license or modify an existing license on the physical appliance. To use this command on a NetMRI virtual appliance, contact Infoblox Technical Support at the following URL http://support.infoblox.com to generate a license file or to enable this command, so you can generate a license file on your own. You can modify the installed evaluation license file before rebooting the system.
You can choose to deploy the NetMRI appliance as a standalone appliance or the Operations Center. When you configure a standalone appliance, you can convert it to the Operations Center mode. Once you configure an appliance as the Operation Center, you cannot revert it to the standalone mode. You can choose to install the following license types: Full NetMRI, ACM (Automation Change Management), SPM2 (Switch Port Manager), or Keep existing. In addition, you can modify the device limit and license expiration date. The device limit indicates the number of devices the appliance is licensed to manage.

Infoblox NetMRI 7.4.4 Administrator Guide Part 6 Events, Tools and Data Support
Copyright ©2020, Infoblox, Inc. All rights reserved. Page 392
Example 1 Sample output when you continue to use an existing license
netmrivm193> licenseUsage: license show|log|generate|<LicenseFile>
netmrivm193> license generateDo you want to start license generate now? (y/n) [n]: yCurrent License:
License Type: Full NetMRI (Customer)License Source: N/ACustomer Name: FULLNMController role: StandaloneDevice Limit: 1000
Maintenance Expiration: 2020-03-09
Modules Info:
Full NetMRI: on, Expired: Never
Automation Change Manager: off, Expired: Expired
Switch Port Management: off, Expired: Expired
NetMRI without SPM: off, Expired: Expired
IPAM Insight (Discovery): off, Expired: Expired
Network Automation: off, Expired: Expired
Customer Name [FULLNM]:
Choose your controller role
1. Standalone2. OC
Enter choice [1]:1
Choose license
1. Full NetMRI2. ACM3. SPM24. Keep existing
Enter choice [4]: 4INFO: No specific platform file found for this model (Unknown). Using defaults.
Device Limit [1000]:
Maintenance expiration date [2020-03-09]:No changes in license are made
The NetMRI NT-1400 appliance is licensed as standalone even if the OC license is applied. For information about the NetMRI NT-1400 appliance, see Operations Center Appliances and Requirements.
For the Customer Name field, use only US-ASCII symbols.

Infoblox NetMRI 7.4.4 Administrator Guide Part 6 Events, Tools and Data Support
Copyright ©2020, Infoblox, Inc. All rights reserved. Page 393
Example 2 Sample output when you run this command on a NetMRI virtual appliance
SA193> license generate*** This option is disabled for Virtual Appliances. Please contact Customer Support to enable it or to generate a license file
Example 3 Sample output when you have configured an Operations Center environment
netmrivm193> license generateDo you want to start license generate now? (y/n) [n]: yCurrent License:License Type: Full NetMRI (Customer)License Source: N/ACustomer Name: FULLNMController role: OCDevice Limit: 1000Maintenance Expiration: 2020-02-20Modules Info:Full NetMRI: on, Expired: NeverAutomation Change Manager: off, Expired: ExpiredSwitch Port Management: off, Expired: ExpiredNetMRI without SPM: off, Expired: ExpiredIPAM Insight (Discovery): off, Expired: ExpiredNetwork Automation: off, Expired: Expired
Customer Name [FULLNM]:The Choose your controller role option will not be available when you have configured OCs.
Please ensure OC and collectors have the same license type and device limit on OC matches the sum of device limits on collectors
Choose license
1. Full NetMRI2. ACM3. SPM24. Keep existing
Enter choice [4]:INFO: No specific platform file found for this model (Unknown). Using defaults.
Device Limit [1000]:
Maintenance expiration date [2020-02-20]:No changes in license are made
Example 4 Sample output when you modify an existing license to SPM2 license
netmrivm193> license generateDo you want to start license generate now? (y/n) [n]: yCurrent License:
License Type: Full NetMRI (Customer)License Source: N/ACustomer Name: FULLNMController role: StandaloneDevice Limit: 1000Maintenance Expiration: 2020-05-20

Infoblox NetMRI 7.4.4 Administrator Guide Part 6 Events, Tools and Data Support
Copyright ©2020, Infoblox, Inc. All rights reserved. Page 394
Modules Info:Full NetMRI: on, Expired: NeverAutomation Change Manager: off, Expired: ExpiredSwitch Port Management: off, Expired: ExpiredNetMRI without SPM: off, Expired: ExpiredIPAM Insight (Discovery): off, Expired: ExpiredNetwork Automation: off, Expired: Expired
Customer Name [FULLNM]: Name
Choose your controller role
1. Standalone2. OC
Enter choice [1]:
Choose license
1. Full NetMRI2. ACM3. SPM24. Keep existing
Enter choice [4]: 3INFO: No specific platform file found for this model (Unknown). Using defaults.
Device Limit [1000]:
Maintenance expiration date [2020-05-20]:Apply license changes? (y/n) [n]: YApplying license...INFO: No specific platform file found for this model (Unknown). Using defaults.Setting up CAM moduleslicense is applied+++ NetMRI is being restarted ...
result of initial stop '/usr/bin/nohup: ignoring inputsystemctl stop skipjack.servicesystemctl stop httpd.service'result of stop kill 'systemctl stop skipjack.servicesystemctl stop httpd.service'netmrivm193>
License generation FULLNM to SPM
license show commandThe license show command displays your current NetMRI license configuration. You can also view your license features, controller mode, expiration date, and license type information.
netmrivm193> license showLicense Type: Full NetMRI (Customer)License Source: N/ACustomer Name: FULLNMController role: StandaloneDevice Limit: 1000Maintenance Expiration: 2020-03-09Modules Info:Full NetMRI: on, Expired: Never

Infoblox NetMRI 7.4.4 Administrator Guide Part 6 Events, Tools and Data Support
Copyright ©2020, Infoblox, Inc. All rights reserved. Page 395
Automation Change Manager: off, Expired: ExpiredSwitch Port Management: off, Expired: ExpiredNetMRI without SPM: off, Expired: ExpiredIPAM Insight (Discovery): off, Expired: ExpiredNetwork Automation: off, Expired: Expired
license log command
The license log command displays the license information and timestamps for all your NetMRI license activities. The following example shows sample output from the License Log command:
2017-08-01 23:41:49 [info] License Type: Full NetMRI (Temporary)2017-08-01 23:41:49 [info] License Source: set temp_license2017-08-01 23:41:49 [info] Customer Name: FULLNM2017-08-01 23:41:49 [info] Controller role: Standalone2017-08-01 23:41:49 [info] Device Limit: 10002017-08-01 23:41:49 [info] Maintenance Expiration: 2020-08-202017-08-01 23:41:49 [info] Modules Info:2017-08-01 23:41:49 [info] Full NetMRI: on, Expired: Never2017-08-01 23:41:49 [info] Automation Change Manager: on, Expired: 2017-10-272017-08-01 23:41:49 [info] Switch Port Management: on, Expired: 2017-10-272017-08-01 23:41:49 [info] NetMRI without SPM: off, Expired: Expired2017-08-01 23:41:49 [info] IPAM Insight (Discovery): off, Expired: Expired2017-08-01 23:41:49 [info] Network Automation: off, Expired: Expired
2017-08-02 22:17:38 [info] License Type: Full NetMRI (Customer)2017-08-02 22:17:38 [info] License Source: N/A2017-08-02 22:17:38 [info] Customer Name: FULLNM2017-08-02 22:17:38 [info] Controller role: Standalone2017-08-02 22:17:38 [info] Device Limit: 10002017-08-02 22:17:38 [info] Maintenance Expiration: 2020-07-202017-08-02 22:17:38 [info] Modules Info:2017-08-02 22:17:38 [info] Full NetMRI: on, Expired: Never2017-08-02 22:17:38 [info] Automation Change Manager: off, Expired: Expired2017-08-02 22:17:38 [info] Switch Port Management: off, Expired: Expired2017-08-02 22:17:38 [info] NetMRI without SPM: off, Expired: Expired2017-08-02 22:17:38 [info] IPAM Insight (Discovery): off, Expired: Expired2017-08-02 22:17:38 [info] Network Automation: off, Expired: Expired
maintenance command
Note Do not run the maintenance command from your system without instructions from Infoblox Support.
Use the maintenance command to manually execute the NetMRI database maintenance process. Normally, database maintenance is performed weekly to archive the network database and fix any problems in the database.
provision disk commandTo extend the NetMRI VM storage per volume, use the provision disk command.
The NetMRI volumes and their size are displayed in Settings icon -> Database Settings -> Storage Management. For more information, see Storage Management.
Example:

Infoblox NetMRI 7.4.4 Administrator Guide Part 6 Events, Tools and Data Support
Copyright ©2020, Infoblox, Inc. All rights reserved. Page 396
hostname> provision disk Do you want to provision disks? (y/n) [n]: yUnused disks found.You can select a disk to attach to NetMRI storage:Please select a disk to add to NetMRI storage (0 to exit provision):1 /dev/sdb (17612.8 MB)Enter disk number: 1
*** Adding '/dev/sdb' to NetMRI storage ***Creating partition: Device /dev/sdb1 has been successfully added to NetMRI storage.This machine has 23 gigabytes of unused space.Do you want to extend partitions? (y/n) [n]: yPlease select storage to provision (0 to exit provision):1 - Backup Storage2 - Database Storage3 - Log Storage4 - Application Storage5 - Temporary Storage6 - OS storage1 - 6 [1]> 3Space to add to Log Storage in gigabytes. (0 to exit provisioning): 16
Will add 16 GB to Log StorageAre you sure? This action cannot be undone. (y/n) [n]: yShutting down NetMRI: OKExtending 'log_storage' volume: OKResizing filesystem (this may take a while, please be patient): OK
*** Disk space successfully provisioned ***Starting NetMRI: OK
recalculate-spm commandA command to allow re-population of all Switch Port Manager data tables with information from one day to 30 days in the past. The function is similar to selecting a date for re-populating a single SPM table from the calendar selector in the top left corner of the UI, but the recalculate-spm command repopulates the entire set of SPM tables.
Note: Do not run the recalculate-spm command from your system without instructions from Infoblox Support.
corp100_west> recalculate-spm
Enter time period in days for SPM generation ( should be between 1 and 30 ): 1
corp100_west>
Caution
You cannot undo storage extension.
Warning
Do not detach hard disks that you already attached and added to the NetMRI storage. This may result in broken NetMRI appliance.

Infoblox NetMRI 7.4.4 Administrator Guide Part 6 Events, Tools and Data Support
Copyright ©2020, Infoblox, Inc. All rights reserved. Page 397
refreshgroups command
Note: Do not run the refreshgroups command from your system without instructions from Infoblox Support.
Refreshgroups directs NetMRI to rebuild all defined Interface Groups and Device Groups in the local appliance. The refreshed groups data appears in the NetMRI UI after a few moments.
Example
netmrivm193> refreshgroups
Requesting regeneration of 22 device groups...
App Servers...request sent.
App Servers w/o SNMP...request sent.
Development Lab Network...request sent.
IT Services...request sent.
IT Services w/o SNMP...request sent.
NAME ONLY...request sent.
Network Low-Level...request sent.
Network Management...request sent.
Network Pending...request sent.
Network w/o SNMP...request sent.
NIOS...request sent.
Optimizers...request sent.
Routing...request sent.
Security...request sent.
Switching...request sent.
UNKNOWN...request sent.
Video...request sent.
Voice...request sent.
Wireless...request sent.
Workstations...request sent.
Workstations w/o SNMP...request sent.
Requesting regeneration of 4 interface groups...
Active Router Interfaces...request sent.
Admin Down...request sent.
Switch Ports...request sent.
Trunk Ports...request sent.

Infoblox NetMRI 7.4.4 Administrator Guide Part 6 Events, Tools and Data Support
Copyright ©2020, Infoblox, Inc. All rights reserved. Page 398
••••
Depending on the size of the network, it may take a few minutes for the results to be reflected in the user interface. On an OC, it will take an extra minute or so as the calculations are done on the collectors and transferred up to the OC.
rdtclient command
Note: Do not run the rdtclient command in your system before obtaining instructions from Infoblox Support.
Use rdtclient to diagnose issues from any NetMRI Operations Center or standalone NetMRI appliance. The RDT (remote diagnostic tool) automates complex troubleshooting procedures through the use of the following:
Opening a NetMRI support case with Infoblox;Receipt of a token from Infoblox Support;Entry of this token into NetMRI through the rdtclient command, which triggers an automated action process;The action process collects the logs generated from the automated procedure and sends those logs to Infoblox through a temporary SSH encrypted tunnel.
The benefit from using rdtclient is that the NetMRI admin avoids being tied to troubleshooting tasks and can pursue normal activities while NetMRI executes the remote diagnostic. All communications, including possible support engineer interaction with the system, are carried out with strict security and procedural limitations.Before using rdtclient, establish a support case with Infoblox Support and receive the token string file and further instructions on command execution, including the action argument.
Example
netmrivm193> rdtclient
Usage: rdtclient [options] ([action] | [action] [token] )
-V, --version
-h, --help
-v, --verbose
-q, --quiet
Action can be in one of three categories: Registration, Tunnel Control, and Remote Transfers
Tunnel Control: (None enabled until after registration)
Remote Transfers/Actions: (None enabled until after registration)
Registration: (register)
Some of the above Actions require a token, provided by Infoblox:
(None enabled until after registration)
removedsb command
Note: Avoid running the removedsb command in your system before obtaining instructions from Infoblox Support.
Use removedsb to delete database archive files from the default directory /var/local/netmri/dsb in the local NetMRI appliance. This is generally a housekeeping command, but exercise caution when deleting database files.
remoteCopy commandUse remoteCopy to send files to another host system from the local NetMRI appliance.

Infoblox NetMRI 7.4.4 Administrator Guide Part 6 Events, Tools and Data Support
Copyright ©2020, Infoblox, Inc. All rights reserved. Page 399
•
•
1.2.3.
Example
netmrivm193> remoteCopy
Enter filename: netmri122.dat
Enter destination host: SC-L-RGRACE3
Enter destination directory: \dev\local\data\
Enter username: rgrace
Warning: Permanently added '10.120.32.193' (RSA) to the list of known hosts.
NetworkAutomation rgrace
ALL UNAUTHORIZED ACCESS TO THIS SYSTEM WILL BE PROSECUTED TO THE MAXIMUM EXTENT ALLOWED BY APPLICABLE LAWS. [email protected]'s password: ******** netmri122.dat 100% 704 221.7KB/s 00:00
removemib commandUse removemib to delete vendor SNMP MIB files from the MIB library in NetMRI. The removemib command automatically points to a location in the system, that contains all MIBs installed by admins into NetMRI. (For a list of installed MIBs, you can go to Settings icon –> Setup –> MIB Management.) Removemib is limited to MIBs that are installed by admins of the system; MIBs that are bundled with NetMRI cannot be deleted using this command. You should also know the file name for the MIB before deleting it. Files of this type are placed into the /var/local/netmri/dsb/mibmanager/source directory. If no MIB files are located in this folder, you will not be able to remove any other MIB files.
Example
netmrivm193> removemib A3Com-products-rev2-MIB
repair commandUse Repair to fix tables in the database that were corrupted by an improper shutdown. The repair command runs automatically during startup, but is provided here for troubleshooting purposes.
reset commandUse the reset command with due caution; changes imposed by resetting parts of the NetMRI system may result in loss of data that you do not intend to lose. Read this entire topic before proceeding.
The reset command has the following sub-commands:
system resets NetMRI to the factory default state, erasing all network database information, network database archive files, custom issue help files, ACL settings, user accounts, etc. After a reset system, reconfigure NetMRI using instructions in the Infoblox Deployment Guide for NetMRI and Operations Center.reset admin resets the administrator password to admin.
If the administrator password has been forgotten, neither the Administrative Shell nor the browser interface can be accessed. In this case, contact Infoblox Support for further assistance. If desired, the unit can still be manually reset from the console interface using the following steps:
Attach a keyboard and monitor to the appliance or connect through a terminal session to the serial port.Log in using the username reset. No password is needed for that account that can only perform a reset.Confirm the reset.

Infoblox NetMRI 7.4.4 Administrator Guide Part 6 Events, Tools and Data Support
Copyright ©2020, Infoblox, Inc. All rights reserved. Page 400
reset all_licenses Resets the current NetMRI instance's installed licenses. Reset all_licenses does not reset the NetMRI database, which allows portability of data from one product to another (from a virtual appliance to a physical appliance, for example).
reset cli Resets the assigned CLI credentials to every discovered device, forcing NetMRI to re-guess CLI credentials.
reset database Resets the NetMRI instance's database removing all collected device information, all license entitlements and any scripts, policies, or templates you created. Retains only user-defined configuration from "configure server" (i.e. IP address, host mask, gateway, database name, DNS and NTP server). This command purges all previously discovered network devices and all associated data for those devices.
reset snmp Resets the assigned SNMP credentials to every discovered device, forcing NetMRI to reguess SNMP credentials.
reset system Resets the NetMRI system in its entirety to factory defaults. Should you previously have run the configure server command, its settings will hold through a reset system command to ensure that the user retains network connectivity to the device.
reset tae Resets all Automation Change Manager registration settings for the current NetMRI instance.
reset tunclient Clears any existing tunnel client configuration in an Operations Center collector system. This command is present in all NetMRI standalone appliances but can be ignored if the appliance is not acting as a collector. This process is included in a reset system, but can be run manually if a new key pair is needed for the tunnel client, or if the tunnel client must be re-registered with another Operations Center Controller.
reset tunserver (Only available on Operations Center servers) Clears all VPN tunnel configuration information, including all keying material and client configurations. When run, any existing client configuration is invalidated. You must then run configure tunserver again, then re-register all tunnel clients to re-enable connectivity using the register command on each client. This process is included in a reset system, but can be run manually to reconfigure only the tunnel system, such as a CA key pair strength or expiration, server key pair, etc.
version Displays the software version of the current NetMRI instance.
virtual Displays statistics about virtual memory usage, including operating system memory, interrupts, paging and disk I/O.
restore commandWith the restore command, you can reconstruct previously backed up NetMRI data from the archive file.
The command’s syntax is:
restore <archiveFile>
Note: Restoring an archive overwrites current data.

Infoblox NetMRI 7.4.4 Administrator Guide Part 6 Events, Tools and Data Support
Copyright ©2020, Infoblox, Inc. All rights reserved. Page 401
•••
rm commandUse rm to delete files and file directories on the NetMRI file system. As with any command involving modification of files, exercise caution when using the rm command.
sandbox commandFor more information, see Using the NetMRI Sandbox .
set temp_license commandYou can set up and install a single 60-day evaluation license for any of the following NetMRI product licenses:
Automation Change ManagerFull NetMRIAdd Switch Port Manager
The appliance limits set temp_license to a single 60-day license. If you wish to extend the operation of a particular license, a new license must be purchased from Infoblox Customer Service.
Automation Change Manager may be licensed without the use of full NetMRI.
Example
LosAngeles> set temp_license
1. Add Switch Port Manager license
2. Add Automation Change Manager license
3. Add NetMRI license
Select license (1-3) or q to quit: 2
This action will generate a temporary 60-day Automation Change Manager license.
Are you sure you want to do this? (y or n): y
Automation Change Manager temporary license installed.
Expiration: 2017-10-27
Temporary license installed.
Example
LosAngeles> set temp_license 2. Add Automation Change Manager license 4. Add NetMRI license Select license (1-4) or q to quit: 3 This action will generate a temporary 60-day MODULE_FULL license.
Are you sure you want to do this? (y or n):
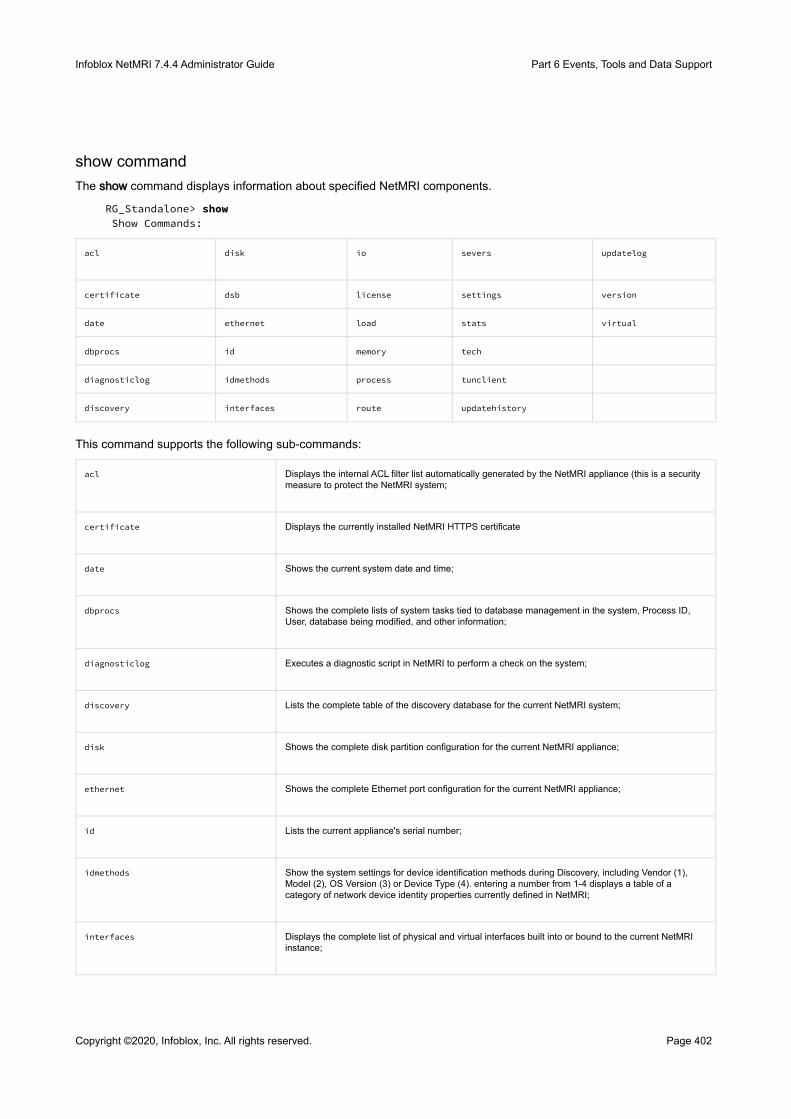
Infoblox NetMRI 7.4.4 Administrator Guide Part 6 Events, Tools and Data Support
Copyright ©2020, Infoblox, Inc. All rights reserved. Page 402
show commandThe show command displays information about specified NetMRI components.
RG_Standalone> show Show Commands:
acl disk io severs updatelog
certificate dsb license settings version
date ethernet load stats virtual
dbprocs id memory tech
diagnosticlog idmethods process tunclient
discovery interfaces route updatehistory
This command supports the following sub-commands:
acl Displays the internal ACL filter list automatically generated by the NetMRI appliance (this is a security measure to protect the NetMRI system;
certificate Displays the currently installed NetMRI HTTPS certificate
date Shows the current system date and time;
dbprocs Shows the complete lists of system tasks tied to database management in the system, Process ID, User, database being modified, and other information;
diagnosticlog Executes a diagnostic script in NetMRI to perform a check on the system;
discovery Lists the complete table of the discovery database for the current NetMRI system;
disk Shows the complete disk partition configuration for the current NetMRI appliance;
ethernet Shows the complete Ethernet port configuration for the current NetMRI appliance;
id Lists the current appliance's serial number;
idmethods Show the system settings for device identification methods during Discovery, including Vendor (1), Model (2), OS Version (3) or Device Type (4). entering a number from 1-4 displays a table of a category of network device identity properties currently defined in NetMRI;
interfaces Displays the complete list of physical and virtual interfaces built into or bound to the current NetMRI instance;

Infoblox NetMRI 7.4.4 Administrator Guide Part 6 Events, Tools and Data Support
Copyright ©2020, Infoblox, Inc. All rights reserved. Page 403
io Displays a quick assessment of the current system load and throughput. May be useful in troubleshooting;
license Shows the current licensing status for the NetMRI instance; also displays the current Platform Device Limit, License Device Limit and Effective Device Limit for all licenses installed in the system. Warning alerts also appear if any license limits are overridden for any cause.
memory Provides a listing of memory usage for the current NetMRI instance;
process Lists all the computing processes running in the current NetMRI instance;
route Displays the routing table for the current appliance (see the Sandbox command topic for more information);
servers Separately lists the server processes running in NetMRI, the amount of CPU cycles and memory each occupies and other information;
settings Lists the key configuration settings for the current NetMRI instance, including the management and scan port IPs and assigned names
stats Displays basic system statistics including the current date, average CPU usage, average level of free memory and the disk usage by the current system;
tech Displays a broad overview of information about the current NetMRI instance for use by technical support, including the system timestamp, discovery settings, network connections, port configuration and other elements;
tunclient Displays Collector VPN settings and connection status to the Operations Center Controller;
tunserver Displays Operations Center Controller's VPN settings and lists attached Controllers (applies only to OC Controllers);
updatehistory Lists the brief version of the update history for the current NetMRI instance;
updatelog Lists the verbose information about the current NetMRI instance's history of system software updates;
version Displays NetMRI version, serial number, network name and server name;
virtual Displays information about the appliance's virtual memory usage (swap file partitions, etc.) including memory, processes, interrupts, paging and block I/O. Similar to the Unix vmstat command.
show license commandThe show license command displays your current NetMRI license configuration. You can also view your license features, license type, expiration date, and license ID information.

Infoblox NetMRI 7.4.4 Administrator Guide Part 6 Events, Tools and Data Support
Copyright ©2020, Infoblox, Inc. All rights reserved. Page 404
netmrivm193> show license
License Information:--------------------------------Serial Number: VM-94AD-61B27License ID: VM-94AD-61B27-20170308-0124361License Expires: NeverLicense Type: CustomerMode: standaloneMaintenance Expires: 2020-03-09Licensed Device Limit: 1,000
License Features:Switch Port Manager Support: offSwitch Port Manager Expiration: N/AAutomation Change Manager Support: offAutomation Change Manager Expiration: N/ANetMRI Support: onNetMRI Expiration: Never
show route commandYou can use the show route command to display the routing table for the current appliance:
rgrace64-212.inca.infoblox.com> show route Kernel IP routing table
Destination
Gateway Genmask Flags MSS Window irtt
Iface
0.0.0.0 10.120.25.1
0.0.0.0 UG 0 0 0 eth0
10.0.0.0 10.120.25.1
255.0.0.0 UG 0 0 0 eth0
10.120.25.0
0.0.0.0 255.255.255.0 U 0 0 0 eth0
169.254.0.0
0.0.0.0 255.255.0.0 U 0 0 0 eth0
169.254.1.0
0.0.0.0 255.255.255.0 U 0 0 0 eth0
Kernel IPv6 routing table
Destination
Next Hop Flags Metric
Ref Use Iface
::1/128 :: U 256 0 0 lo

Infoblox NetMRI 7.4.4 Administrator Guide Part 6 Events, Tools and Data Support
Copyright ©2020, Infoblox, Inc. All rights reserved. Page 405
•••••
fe80::/64 :: U 256 0 0 eth0
::1/128 :: U 0 68 1 lo
fe80::250:56ff:fe94:98/128
:: U 0 0 1 lo
ff00::/8 :: U 256 0 0 eth0
snmpwalk commandObtain a tree of information from a network device using automatic SNMP GETNEXT commands. In NetMRI’s administrative shell version of the snmpwalk command, you can specify the SNMP version, the community string, and the desired Root Object ID (OID).
For SNMP v3, you can additionally specify the encryption protocol from the following:
aes-128aes-192aes-256des3des
The command’s syntax is:
snmpwalk 22
The command prompts for further information before executing (if only one network view exists in the NetMRI appliance, you will not be prompted to enter that value):
NetManager_West> snmpwalk 192.168.1.1
Enter Network View: West-Lab
Enter SNMP hostname or IP address []: 192.168.1.1
Enter SNMP version [2c]: 3
Enter SNMP Username []: user_name
SNMP Authentication [no]: yes
Enter SNMP Authentication Passphrase: auth_pwd
Enter SNMP Authentication Protocol [MD5]: SHA
SNMP Privacy [no]: yes
Enter SNMP Privacy Passphrase []: privacy_pwd
Enter SNMP Privacy Protocol [DES]: aes-256
Enter Root OID to start walk [system]: 1.3
Use legacy snmpwalk tool [n]:
+++ Executing snmpwalk ...
#######################################################################
# Generated by NetMRI Administrator SNMP Walk
# SerialNo : VM-C64E-FA34C

Infoblox NetMRI 7.4.4 Administrator Guide Part 6 Events, Tools and Data Support
Copyright ©2020, Infoblox, Inc. All rights reserved. Page 406
# SNMP Host: 192.168.1.1
# SNMP Root: 1.3
# StartTime: Mon Jul 20 15:02:16 EDT 2020
#######################################################################
2020-07-20 15:02:33 [warn] snmpwalk: No response from remote host '192.168.1.1'
#######################################################################
# EndTime: Mon Jul 20 15:02:33 EDT 2020
#######################################################################
+++ Results stored in snmpwalk-192-168-1-1.txt
Use SCP to connect to the NetMRI appliance to obtain the file. You can also view the file from the Administrative Shell using the cat [snmpwalk-192-168-1-1.txt] command.
ssh-key commands
ssh-key create
ssh-key delete
ssh-key export
NetMRI provides support for outside SCP applications to use SSH keys in lieu of passwords. You can manage SSH keys through a series of admin shell commands (ssh-keycreate, ssh-keyexport, and ssh-keydelete). You create SSH keys with a variety of key types and bit sizes using the ssh-keycreate command:
rgrace-dev> ssh-key create
Specify the type of key to create. The possible values are 'dsa' or 'rsa' for protocol version 2.
1. dsa
2. rsa
Enter choice [2]:
Specify the number of bits in the key to create. For RSA keys, the minimum size is 768 bits and the default is 2048 bits. Generally, 2048 bits is considered sufficient. DSA keys must be exactly 1024 bits as specified by FIPS 186-2.
1. 768
2. 1024
3. 2048
4. 4096
Enter choice [3]:
Selected Options:
Key Type : rsa
Bits : 2048

Infoblox NetMRI 7.4.4 Administrator Guide Part 6 Events, Tools and Data Support
Copyright ©2020, Infoblox, Inc. All rights reserved. Page 407
•
•
••
Create SSH keys using these options? (y or n):y
Successfully created SSH keys.
After creating SSH keys, you can enable the Use SSH Keys option in the Archive Database, Scheduled Archive and Remote Config Archive feature pages (available under Settings icon –> Database Settings).
When enabled, the SSH public key needs to be installed on the remote SCP servers for operations to be successful. To do so, you export the SSH public key from NetMRI in a variety of formats using the admin shell command ssh-key export. In an OC environment, SSH keys are created only on the Operations Center Controller; in that case, operations that use SSH keys only run on the Controller and not on the Collectors.
supportbundle commandUse the supportbundle command to specify the number of days you want NetMRI to collect logs for the support bundle. You can specify from one to 99 days. The default is 0, which means NetMRI collects all the logs without time restriction.
The following is the command syntax:
supportbundle create [c]
supportbundle delete nnn
supportbundle resend nnn
supportbundle list
where
[c] is the number of days you want NetMRI to collect logs for the support bundle. You can specify from 1 to 99 days. The default is 0, which means NetMRI collects all the logs without time restriction.nnn is the number of files in the support bundle list.
Installing and Deploying the NetMRI Operations Center
The NetMRI Operations Center provides a superset of NetMRI discovery and device management, that scales a distributed network management platform up to larger networks and larger deployments. You dedicate satellite NetMRI appliances, called collectors, to the tasks of device discovery and device management. You use a central Operations Center appliance to aggregate and view all data collected from the collector appliances, to view the operating state and manage configurations for all discovered network infrastructure devices and discovered IP networks, including routers, firewalls, load balancers, Ethernet L2/L3 switches, end hosts and end host networks, and much more. NetMRI Operations Center makes it easier to manage, control and secure the enterprise network.
Installation of Operations Center Controller appliances changes in Release 6.9. For initial appliance setup, you run the following sequence of Admin Shell commands on the Operations Center appliance from the NetMRI command line:
configure server license
configure server
configure tunserver
For each Collector appliance in your deployment, the command sequence is as follows:
configure server
license
register
See the following procedures to install and deploy your NetMRI Operations Center appliances:
1st Step: Configuring Basic Settings for the Operations Center Controller2nd Step: Installing the Operations Center License on the Controller

Infoblox NetMRI 7.4.4 Administrator Guide Part 6 Events, Tools and Data Support
Copyright ©2020, Infoblox, Inc. All rights reserved. Page 408
•••••
•
•
•
•
•
3rd Step: Running Configure Tunserver on the Controller4th Step: Installation for Operations Center Collectors5th Step: Installing the Operations Center Collector License(s)6th Step: Registering NetMRI CollectorsConfiguring Network Interfaces for Operations Center
Operations Center Appliances and RequirementsYou can use the NetMRI Operations Center on physical or virtual NetMRI appliances.
Infoblox offers NetMRI appliances in several models:
NetMRI-1102-A (Discontinued–NetMRI 1102-A appliances may operate as collectors only)
NetMRI-1102-A appliances are equipped with two Ethernet ports, labeled MGMT and SCAN. The MGMT port may be used singly as a dedicated management port for the appliance or may operate as the only active port, carrying both management and network monitoring traffic. By default, the appliance is configured to use the MGMT port for both system administration and network analysis functions.
NetMRI NT-4000
NT-4000 appliances are a next-generation 2U appliance that supports a larger CPU, memory and storage configuration, along with field-replaceable power supplies and disk drives in a RAID-10 array. The NT-4000 appliance may operate as an Operations Center and as a collector appliance. The appliance is equipped with two active Ethernet ports, labeled LAN1 and MGMT. MGMT connects the NT-4000 appliance to the management network and is used for managing the appliance. The LAN1 port is the primary connection to managed networks. (LAN1 may operate as the only active port, carrying both management and network monitoring traffic.) If activated, LAN2 also connects the appliance to managed networks.
NetMRI NT-1400
The NetMRI NT-1400 is designed for smaller enterprise deployments and for use as a collector for Operations Center deployments. The appliance is equipped with two active Ethernet ports, labeled LAN1 and MGMT. MGMT connects the NT-1400 appliance to the management network and is used for managing the appliance. The LAN1 port is the primary connection to managed networks. (LAN1 may operate as the only active port, carrying both management and network monitoring traffic.) If activated, LAN2 also connects the appliance to managed networks.
NetMRI NT-2200
The NetMRI NT-2200 appliances are higher-capacity and higher-speed appliances that may operate as both Operations Center appliances and as collectors. The appliance is equipped with two active Ethernet ports, labeled LAN1 and MGMT. MGMT connects the NT-2200 appliance to the management network and is used for managing the appliance. The LAN1 port is the primary connection to managed networks. (LAN1 may operate as the only active port, carrying both management and network monitoring traffic.) If activated, LAN2 also connects the appliance to managed networks.
NetMRI VM
A virtual machine version of NetMRI installed in a virtual infrastructure platform. You can use NetMRI VMs as collectors and as an Operations Center. A NetMRI VM performance should be sufficient to handle a required number of devices. For more information on how to ensure this, see Benchmarking for the Operations Center.
Note: In the Operations Center context, when an appliance acts as the Operations Center it uses only a single port, which is the MGMT port for the NT-1400, NT-2200 or NT-4000. Collectors may use multiple interfaces for network discovery and management, including 802.1q virtual scan interfaces. Typically, both the LAN1 and LAN2 ports are used in this manner on each Collector appliance. For more information, see Configuring Network Interfaces for Operations Center.
In this document, all hardware models are treated generically and referred to as a "NetMRI appliance." Any currently sold appliance model can operate as a NetMRI Operations Center central node.

Infoblox NetMRI 7.4.4 Administrator Guide Part 6 Events, Tools and Data Support
Copyright ©2020, Infoblox, Inc. All rights reserved. Page 409
1.•
•
•
••
•2.
•
•
•
Infoblox NetMRI appliances should always be supported by an uninterruptible power supply (UPS) to avoid data corruption problems in cases of power outage.
Benchmarking for the Operations CenterA NetMRI VM, whether a collector or an Operations Center, is hardware intensive and requires high performance. If you run or plan to run virtual machines in an Operations Center environment, make sure that your virtual machine hosts successfully conform to the required number of network devices. To do so, download the Infoblox Benchmark tool from the Infoblox Support site at https://support.infoblox.com. For more information, also download the Benchmarking Guide for NetMRI 7.4.2 from the same location.
For related VM best practices, see Virtual Machine Best Practices.
Access Using the Command Line SSH clientInitial connections to the NetMRI Administrative Shell using an SSH command line client to the IP address of the MGMT port require a username as one of the command line parameters, as shown in this example:
ssh –l admin <system>
where <system> is the hostname or IP address assigned to NetMRI. At that point, you are prompted for the admin account password, which is the same as that used for the browser interface.
Operational and Deployment Best PracticesWhen you set up and deploy an Operations Center and its associated collectors, follow some best-practices guidelines to ensure a smooth and effective rollout.
Keep device management levels below the licensed device limits on each collector appliance.Though you have greater flexibility for network connectivity through using network views, multiple scan interfaces and virtual scan interfaces, these features do not influence the licensing limits and capacities of your appliances.License limits should be defined to allow for organic and anticipated growth of the network. Consult with your Infoblox sales representative for a detailed assessment of your licensing needs.License limits are enforced on each collector appliance in an OC deployment. Your OC design should avoid having excessive numbers of licenses on collectors, which can overwhelm the Operations Center and prevent timely operation.New devices can 'bump' older previously-discovered devices from the license limit.Devices in higher-ranked device groups will be prioritized for licensing. (You can change device group rankings in Settings icon –> Setup –> Collection and Groups –> Groups tab.)Avoid using device licenses on devices in end-user network segments.
During setup of a new deployment, use the default network view when you define your first discovery ranges to initially discover the network.
An initial network view will be present in a new Operations Center deployment. Initial setup for a new Operations Center deployment automatically creates a default network view, named Network 1, as part of the procedure. This network view is automatically assigned to the Collector appliance's LAN1 port before you perform discovery of the network.When you create your initial discovery ranges, the Network 1 network view is automatically assigned to the LAN1 interface on the Collector. This network view represents the global routed network, which is the network that NetMRI will discover that is not reliant on virtual networks to route traffic.When you create your discovery ranges, static IP addresses and Seed Routers (in Settings icon –> Setup –> Discovery Settings –> Ranges/Static IPs/Seed Routers), each range provides a Network View drop-down menu. You select one network view for each discovery setting; however, a network view can work with multiple discovery ranges. A single network view can use all three discovery objects.You define network views (under Settings icon –> Setup –> Network Views) and can assign other networks to those views.

Infoblox NetMRI 7.4.4 Administrator Guide Part 6 Events, Tools and Data Support
Copyright ©2020, Infoblox, Inc. All rights reserved. Page 410
•
•
•
••
••
•
••
•
•
••
1.•
2.
•
For VRF discovery, you do not need to define discovery ranges in the initial rollout. NetMRI will discover VRF-aware devices in its first discovery of the global enterprise network. The system then displays a System Health alert notifying you that unassigned VRFs have been discovered.
3. Avoid using too many device groups. Target using 50 or fewer Extended device groups. Platform Limits also influence the number of device groups allowable in your system.
Device groups govern summary data aggregations and other device processing within each group. Device groups are defined in two varieties: Basic device groups, which offer minimal functionality and simply provide a basic categorization for discovered devices such as end hosts; and Extended device groups, which allow the enabling and disabling of specialized group features based upon the type of devices in the group. For more information, see the sections beginning with Device Groups and Switch Port Management and Creating Device Groups.You can define the required device groups for your deployment; delete those that you do not need. Also, avoid frequent group definition changes, additions and deletions.Keep the Unknown and Name Only device groups; do not delete these device groups.Also see Understanding Platform Limits for your Deployment.
4. Ensure reliable network connections between collectors and the Operations Center node.
Avoid disruption of network connections between the Operation Center and its associated collectors.Also ensure that DNS resolution is complete between all Collector appliances and the Operations Center Controller appliance. All Collectors should consistently be able to synchronize correctly with the Controller. (By itself, registering successfully with the Controller does not guarantee this, because registering is done solely by the Controller IP address. This could occur, for example, if a Collector is placed in the DMZ for an enterprise network.) You can use the show tunclient command on each Collector to verify DNS resolution of the Controller on the Collector. If you see RESOLVE: Cannot resolve host address messagesin the show tunclient command output, add an entry for the Operations Center Controller to the Collector's /etc/hosts file.
5. Use recommended methods to improve reporting performance for your Operations Center.
Filter down to the most important data, such as individual device groups, specific time windows and other Report settings.Schedule large, complex reports to run during off-hours.Avoid unnecessarily large reports. Example: Save out monthly reports instead of running multiple-month reports.Disable details for reports offering that function, if and when desirable and the details are not germane to the report.If you have simultaneously running reports, change the Concurrently Running Reports setting under Settings icon –>General Settings–>Advanced Settings page.
6. Manage Syslog Traffic.
When sending syslog to the appliance, limit the log level to reduce volume.You can find a description of the specific Syslogs that NetMRI processes at the example URL: https://your-netmri/netmri/api/change/syslog-config.tdf?contentType=text/xml.
Virtual Machine Best PracticesFollow the points below to ensure efficient VM-based Collector operation:
Disable or adjust VM performance monitoring systems for the product.Because Operations Center VMs tend to be extremely I/O intensive, with continuous 100% CPU utilization, vSphere performance monitoring should be reduced or disabled.
Avoid placing multiple NetMRI instances on the same host.
Operations Center/NetMRI instances present significant demands on I/O, particularly on virtual machine hosts. Avoid attempting to run Operations Center appliance instances on hosts with other VMs.
Avoid sharing storage with other virtual applications.

Infoblox NetMRI 7.4.4 Administrator Guide Part 6 Events, Tools and Data Support
Copyright ©2020, Infoblox, Inc. All rights reserved. Page 411
••
•
••
1.
•
•
•
•
•
•
•
•
•
Use dedicated local storage if at all possible.For network-based storage, assign dedicated spindles to the virtual machine.
3. In the host, use a high-quality RAID controller.
Operations Center and NetMRI virtual machines are sensitive to RAID controller quality, such as using software RAID or a RAID controller on the motherboard. Using these options is in fact worse than using no RAID at all.Infoblox recommends an enterprise-grade controller with a battery-backed write cache.Infoblox recommends use of RAID-10.
4. Enable Intel VT options in the BIOS of the host system.
Discovery Best PracticesFollow the points below to ensure effective discovery of the network:
For simplicity, perform discovery in phases.
Begin with a small set of devices and ensure your discovery ranges, defined credentials, and seed routers are all correct.Ensure that firewall gateways for any networks to be discovered allow discovery traffic through open TCP/UDP ports 161 and 162, to allow SNMP traffic.Ensure that your discovery ranges, static IPs and seed routers are associated with their correct network views. For initial discovery, your ranges and other discovery settings can simply be associated with the Network 1network view, which is automatically created during appliance setup and is bound to the SCAN1 port on your Collector appliance. For more information, see Configuring Network Views.Avoid defining large Discovery Ranges such as /8 or /16, and avoid defining more than 1000 ranges of any size. However, having a large discovery range and seed routers is a more effective discovery technique than using hundreds of small ranges. (You can change device group rankings in Settings icon –> Setup –> Discovery Settings). For more information, see Configuring Discovery Ranges.For discovery using ping sweeps, avoid attempting ping sweeps of greater than /22 subnets. Ping sweeps use protocols other than ICMP and can incur delays in refreshing previously discovered devices. For information on Smart Subnet ping sweep, see Defining Group Data Collection Settings.
Include End-Host devices and Ethernet segments in discovery ranges.
Use the Exclude From Management setting on end-host segment discovery ranges to prevent unnecessary SNMP credential discovery against end hosts (Settings icon –> Setup –> Discovery Settings –> Ranges tab –> Discovery Mode menu).
Use Smart Subnet Ping Sweep for complete end-host discovery. For information on Smart Subnet ping sweep, see Defining Group Data Collection Settings.
Planning an Operations Center DeploymentA number of factors help decide what your Operations Center deployment will look like:
Define your goals for the network management system.
Are you planning to manage only switched Ethernet networks? Manage all routed and switched networks? A mix of routing, switching, and security devices? Will you manage virtual routing and forwarding (VRF) networks?These factors bear upon the type of licensed feature set for the Operations Center, and how you will deploy it.
Estimate the size of the managed network.
Operations Center feature licensing is defined by the number of licensed devices (including but not limited to routers, switches, firewalls and servers). Each managed device occupies a device license under NetMRI. The size of the managed network helps define the level of licensing you will need for the Operation Center deployment.Managed devices have a different licensing scheme from discovered devices. You allocate licenses based upon the infrastructure devices in your network that you want to manage; because the number of endpoint hosts may be far greater than the number of infrastructure devices, endpoints should be considered as part of the discovered

Infoblox NetMRI 7.4.4 Administrator Guide Part 6 Events, Tools and Data Support
Copyright ©2020, Infoblox, Inc. All rights reserved. Page 412
•
•
devices category in most if not all cases. Discovered devices of this type should not be licensed unless considered necessary.Conversely, unlicensed infrastructure devices can lead to incomplete network analysis issues such as topology holes and large collections of undiscovered endpoints.
Determine how many Collector appliances you need, and how many device licenses should be provided on each Collector.
Your decision on how many Collectors you need in your deployment is generally determined by the size and the topology of your network. For large deployments, contact Infoblox Support.Licensing levels are enforced on each Collector and cumulatively add to the total number of licenses for the Operations Center. On the Controller, you also install a specially generated license generated by Infoblox, directly based upon the features and device counts licensed for all Collectors in the full OC deployment.Knowing to a fairly close margin what device counts each of your Collectors will manage, while allowing room for growth, helps determine how the Controller will be licensed.
What is the rate of growth for the managed network?
Plan for growth within the network when you define and set up the Operations Center deployment. A good rule of thumb is to plan for a minimum organic growth of 5% per year, but is entirely based upon the circumstances of each deployment and whatever future plans are in place for the managed network.
Understanding Platform Limits for your DeploymentNetMRI provides a detailed System Health feature set that helps enforce key evaluation elements such as Platform Limits, Licensing Limits and Effective Limits for a deployment. For more information, see the section Understanding Platform Limits, Licensing Limits and Effective Limits.NetMRI Platform limits, Licensed limits, and Effective limits apply to all collector appliances and instances in an Operations Center. On the Operations Center, the Settings icon –> Setup –> Tunnels and Collectors page separately lists each collector's status and their associated device limits. For more information, see Checking NetMRI Collectors Operation.
Installing Operations Center PlatformsTake the following procedures to install and configure an Operations Center:
1st Step: Configuring Basic Settings for the Operations Center Controller
2nd Step: Installing the Operations Center License on the Controller
3rd Step: Running Configure Tunserver on the Controller
4th Step: Installation for Operations Center Collectors
5th Step: Installing the Operations Center Collector License(s)
6th Step: Registering NetMRI Collectors
An Operations Center deployment consists of a controller appliance and one or more collector appliances. The Controller aggregates data and analyzes results from the collectors to provide a consolidated view of the enterprise network within one user interface, which is hosted by the controller.
Communication between the Controller and its associated Collectors takes place over a set of Secure Sockets Layer Virtual Private Networks (SSL VPN) across their designated management network. You monitor Operations Center VPN tunnels and basic collector communication from the Settings icon –> Setup –> Tunnels and Collectors page. Each VPN tunnel between the Operations Center and the associated Collectors appear in the list.
You begin installing an Operations Center platform by installing and configuring its Operations Center Controller, followed by installing and configuring its Collector appliances, whether physical or virtual.
After physically installing the Collector appliances, or deploying the virtual machines to their respective hosts, activating their instances under the hypervisor and installing their Infoblox NetMRI licenses, you need to run a brief series of NetMRI Admin Shell (CLI) commands to bring up each instance.

Infoblox NetMRI 7.4.4 Administrator Guide Part 6 Events, Tools and Data Support
Copyright ©2020, Infoblox, Inc. All rights reserved. Page 413
•
•
•••••••
••
1.2.
After finishing the basic Operations Center installation, you execute one of two different options:
Configure the controller to use factory defaults;See Configuring the Operations Center Controller with Factory Defaults;
Configure the controller to use data imported from an existing NetMRI appliance. See Importing Data From a Reference NetMRI Instance.
Installing the Operations Center ControllerPerform Operations Center Controller appliance installation before the Collector appliances are deployed for discovering their respective networks.
Use the MGMT interface IP address on the Controller to connect to the NetMRI UI.
Note: Scan port configurations reside on each Collector appliance. The Operations Center Controller does no discovery or device management of its own; when you run configure server on the controller, you do not configure scan interfaces.
1st Step: Configuring Basic Settings for the Operations Center ControllerYou will need the following information to begin setting up the Controller:
The Management IP address of the appliance (this IP will be assigned to the MGMT port of the appliance);A name for the global network to which NetMRI will initially connect and discover;The Default Gateway IP address for the management port;A designated controller name, if the default is not correct;The local domain name for the server network;Time zone and region information;DNS Server IP (and secondary DNS server IP if necessary);
There are two possibilities for basic IP configuration of the Controller:
Static IP addressing using the configure server command;The appliance acts as a DHCP client, and the default values appear when you run the configure servercommand.
In this procedure, we assume use of a static IP address configuration for the Controller.
Use a terminal program to connect to the management IP address of the Controller appliance.Log in using the default admin/admin username/password account.
Note: The values you enter in the configure server command are the default values that will appear in this series of steps. If your Operations Center is configured through DHCP, default values from that service appear here. Avoid overwriting DHCP-provided settings if this is the case.
3. At the Admin Shell prompt, enter configure server and press Enter.
admin-na206.corp100.com> configure server
4. Press Y to respond Yes to begin system setup.
Default values can be erased by pressing the spacebar and pressing Enter or by entering new values.
5. Enter the new Database Name and press Enter.
Database Name is a descriptive name for this deployment. It is used in reports titles, headers, etc.
Recommended: Begin name with uppercase letter.Database Name []: Corp100_west

Infoblox NetMRI 7.4.4 Administrator Guide Part 6 Events, Tools and Data Support
Copyright ©2020, Infoblox, Inc. All rights reserved. Page 414
6. For the first-time installation, you can choose to generate a new HTTPS certificate.
Do you want to generate a new HTTPS Certificate? (y/n) [n]: y
7. Enter the local domain name in which the controller resides. This value is used for truncating device names in NetMRI data sets throughout the system.
Domain Name 1 (e.g., example.com) []: corp100.comDomain Name 2 (optional) []:
8. Enter the time server IP address if one is available or is necessary:
Time Server [us.pool.ntp.org]:
9. Enter the time zone region by typing in the suggested numeric value from the list:
Time Zone Regions Choose your local region.
0. Africa 1. Antarctica 2. Arctic 3. Asia
4. Atlantic 5. Australia 6. Brazil 7. Canada
8. CET 9. Chile 10. EET 11. GMT
12. GMT-1 13. GMT+1 14. GMT-2 15. GMT+2
16. GMT-3 17. GMT+3 18. GMT-4 19. GMT+4
20. GMT-5 21. GMT+5 22. GMT-6 23. GMT+6
24. GMT-7 25. GMT+7 26. GMT-8 27. GMT+8
28. GMT-9 29. GMT+9 30. GMT-10 31. GMT+10
32. GMT-11 33. GMT+11 34. GMT-12 35. GMT+12
36. Europe 37. Hongkong 38. Iceland 39. Indian
40. Israel 41. Mexico 42. NZ 43. NZ-CHAT
44. Pacific 45. US 46. UTC 47. WET
Enter choice (0-47) [0]: 45
10. Enter the time zone location by typing in the suggested numeric value from the list:
Choose a location within your time zone.
0. Alaska 1. Aleutian 2. Arizona 3. Central

Infoblox NetMRI 7.4.4 Administrator Guide Part 6 Events, Tools and Data Support
Copyright ©2020, Infoblox, Inc. All rights reserved. Page 415
4. East-Indiana 5. Eastern 6. Hawaii 7. Indiana-Starke
8. Michigan 9. Mountain 10. Pacific 11. Samoa
Enter choice (0-11) [0]: 10
11.Follow the steps for configuring the management port IP settings:
+++ Configuring Management Port SettingsYou must configure an IPv4 or IPv6 address/mask on the management port.NetMRI can perform analysis from the management port or a separate scan port.
IP Address (optional) []: 10.120.25.212Subnet Mask (optional) []: 255.255.255.0IPv6 Address (optional):IPv6 Prefix (optional):
You must provide either an IPv4 gateway, an IPv6 gateway, or both.
IPv4 Default Gateway (optional) []: 10.120.25.1IPv6 Default Gateway (optional) []:
12.Enter n for No and press Enter to skip the step for configuring the SCAN port on the Controller appliance:
Do you want to configure the Scan Port? (y/n) [n]: <enter>You will not use the SCAN ports LAN1 and LAN2 on the Controller appliance in an OC deployment.
13.Enter the address(es) of the primary and secondary DNS server, if required:
DNS Server 1 (IP) []: 172.23.16.21DNS Server 2 (optional) []:
14.The setup utility lists the configuration settings and queries whether you wish to edit them.
Edit these settings? (y/n) [n]:
15.Finally, the setup utility requests that you commit your settings. Press Enter to accept the Y (yes) default.
Configure the system with these settings? (y/n) [y]:
Configuring system ...+++ Validating Interfaces ...+++++ eth0 ... OK+++++ eth1 ... OKThe controller appliance restarts.
16.Verify your settings by entering the following:
admin-na206.corp100.com> show settingsThis command lists the complete config settings for the Operations Center.
For the controller appliance, continue to the next topic, 2nd Step: Installing the Operations Center License on the Controller.
2nd Step: Installing the Operations Center License on the ControllerYou must install the cumulative feature license provided to you by Infoblox Sales & Support for the Controller to fully operate with all Collectors in the deployment. This license must contain the aggregate count of device licenses and feature entitlements that are provided for all Collectors expected to work with the OC Controller system.
When you receive the Controller appliance and physically install it, it does not automatically contain the licensed features and entitlements present on the Collectors, nor can those entitlements be transferred to the Controller. When you first set up the appliances that you are designating as Collectors in an OC deployment, they are simply operating as standalone

Infoblox NetMRI 7.4.4 Administrator Guide Part 6 Events, Tools and Data Support
Copyright ©2020, Infoblox, Inc. All rights reserved. Page 416
1.2.
3.
1.
2.
3.
1.2.3.
NetMRI appliances. Each are separately licensed. The Controller has its own cumulative license file. You install that license in this step, followed by step 2a, re-running configure server on the Controller appliance.
To install the Operations Center license for a NetMRI physical appliance, generate a license on your own using the license generate administrative shell command. For more information, see license generate command.
To install the Operations Center license for a NetMRI virtual appliance, do the following:
Obtain the Operations Center license through the Infoblox Support Portal at http://support.infoblox.com.Upload the license file provided through the Infoblox Support Portal into the admin account's /Backup directory using WinSCP or a similar program.Log into the admin shell, enter the license <NameOfLicenseFile> command, and press Enter.admin-na206.corp100.com> license <license_file_name.gpg>The server restarts without rebooting the appliance. The server resumes operation after several minutes of processing.
Step 2a: Re-Run Configure Server
After you install the license for your Controller, you must run the configure server command a second time.
After logging in to the Controller appliance, re-run the configure server command:admin-na206.corp100.com> configure serverPress Y to respond Yes to continue system setup. You step through the settings you defined in your first run of the configure server command by pressing Enter at each prompt. (You do not need to change any settings unless changes are required for administrative reasons.) When you come to the end of the configure server command sequence, enter N to commit the previously defined settings to the system.Configure the system with these settings? (y/n) [y]: nConfiguring system ...+++ Validating Interfaces ...+++++ eth0 ... OK+++++ eth1 ... OKThe controller appliance restarts.Continue to the next topic, 3rd Step: Running Configure Tunserver on the Controller.
3rd Step: Running Configure Tunserver on the ControllerThe configure tunserver command governs the core security settings for the Controller appliance, including certificate usage and the VPN tunnel server settings between the Controller and all collectors.
The command also offers the option to define a reference NetMRI appliance to use for importing the library of scripts, custom reports, custom jobs, policies and user account data from an existing appliance. For more information, see the following section, Importing Data From a Reference NetMRI Instance.
Use a terminal program to connect to the management IP address of the Controller appliance.Log in using the default admin/admin username/password account.Execute the following Admin Shell CLI commands on a newly installed or reset Operations Center appliance:
NetworkAutomation-VM-8DD4-66925> configure tunserver
+++ Configuring CA Settings
CA key expiry in days [5475]:
CA key size in bits [2048]:
+++ Configuring Server Settings
Server key expiry in days [5475]:
Server key size in bits [1024]:
Server Public Name or IP address: 10.120.32.167
Protocol (tcp, udp, udp6) [tcp]:

Infoblox NetMRI 7.4.4 Administrator Guide Part 6 Events, Tools and Data Support
Copyright ©2020, Infoblox, Inc. All rights reserved. Page 417
••••••
••
1.2.3.4.
Tunnel network base [5.0.0.0]:
Block cipher:
0. None (RSA auth)
1. Blowfish-CBC
2. AES-128-CBC
3. Triple DES
4. AES-256-CBC
Enter Choice [2]:
Use compression [y]:
You can optionally designate a NetMRI client system as a "reference" system
that will be used as a source of common settings.
Enter reference system serial number or RETURN to skip:
Use these settings? (y/n) [n]: y
The system will commit the settings and restart the software without rebooting the system.
To check operation of VPN tunnel connections with Collector appliances, go to Settings icon –> Setup –> Tunnels & Collectors on the Controller.
4th Step: Installation for Operations Center CollectorsScan port configurations reside on each Collector appliance. The Operations Center Controller does no discovery or device management of its own; when you run configure server on the controller, you do not configure the LAN1 port. The following procedure applies only to Collector appliances.
You will need the following information to begin setting up the Collector:
The Management IP address of the appliance (this IP will be assigned to the MGMT port of the appliance);The customer name for the network to which the appliance will initially connect and discover;The Default Gateway for the management port;The local domain name for the server network;Time zone and region information;DNS Server IP (and secondary DNS server IP if necessary);
There are two possibilities for basic IP configuration of each Collector:
Static IP addressing using the configure server command;Appliance uses DHCP, and the default values appear when you run the configure server command. In this procedure, we assume use of a static IP address on the management network for each Collector.
Use a terminal program to connect to the management IP address of the Collector appliance.Log in using the default admin/admin username/password account.At the Admin Shell command prompt, enter configure server and press Enter.Complete the following:
Note: If your Operations Center Collectors are configured through DHCP, default values from that service will appear here. Do not override DHCP settings while using the configure server command. In this procedure, we assume use of a static IP address on the management network for each Collector.
5. At the Admin Shell prompt, enter configure server and press Enter.
6. Press Y to respond Yes to begin system setup:
Do you want to start system setup now? (y/n) [n]: y

Infoblox NetMRI 7.4.4 Administrator Guide Part 6 Events, Tools and Data Support
Copyright ©2020, Infoblox, Inc. All rights reserved. Page 418
Default values, when available, are given within [].
You may clear defaults by typing a SPACE and pressing Enter.
+++ Configuring Network Identification Settings
7. Enter the new Database Name and press Enter.
Database Name is a descriptive name for this deployment. It is used in reports titles, headers, etc.Recommended: Begin name with uppercase letter.
Database Name []: Corp100_west
8. Enter the new Server Name and press Enter.
The Server Name identifies this system in SNMP and HTTPS server certificates.The installed HTTPS certificate contains the following subject:
subject= /CN=NetworkAutomation-2210201208100028/O=NetMRI
Server Name []: corp100_187
9. For the first-time installation, you can choose to generate a new HTTPS certificate.Do you want to generate a new HTTPS Certificate? (y/n) [n]: y10. Enter the local domain name in which the appliance resides. This value is used for truncating device names in NetMRI data sets throughout the system.Domain Name 1 (e.g., example.com) []: corp100.comDomain Name 2 (optional) []:11. Enter the time server IP address if one is available:Time Server [us.pool.ntp.org]:12 .Enter the time zone region by typing in the suggested numeric value from the list:Time Zone RegionsChoose your local region.
Time Zone Regions Choose your local region.
0. Africa 1. Antarctica 2. Arctic 3. Asia
4. Atlantic 5. Australia 6. Brazil 7. Canada
8. CET 9. Chile 10. EET 11. GMT
12. GMT-1 13. GMT+1 14. GMT-2 15. GMT+2
16. GMT-3 17. GMT+3 18. GMT-4 19. GMT+4
20. GMT-5 21. GMT+5 22. GMT-6 23. GMT+6
24. GMT-7 25. GMT+7 26. GMT-8 27. GMT+8

Infoblox NetMRI 7.4.4 Administrator Guide Part 6 Events, Tools and Data Support
Copyright ©2020, Infoblox, Inc. All rights reserved. Page 419
28. GMT-9 29. GMT+9 30. GMT-10 31. GMT+10
32. GMT-11 33. GMT+11 34. GMT-12 35. GMT+12
36. Europe 37. Hongkong 38. Iceland 39. Indian
40. Israel 41. Mexico 42. NZ 43. NZ-CHAT
44. Pacific 45. US 46. UTC 47. WET
Enter choice (0-47) [0]: 45
13. Enter the time zone location by typing in the suggested numeric value from the list:
Choose a location within your time zone.
0. Alaska 1. Aleutian 2. Arizona 3. Central
4. East-Indiana 5. Eastern 6. Hawaii 7. Indiana-Starke
8. Michigan 9. Mountain 10. Pacific 11. Samoa
Enter choice (0-11) [0]: 10
You continue by configuring the management port settings. You define the IPv4 and IPv6 addresses and subnet masks the default gateway IP address for the management port:
You must configure an IPv4 or IPv6 address/mask on the management port.
NetMRI can perform analysis from the management port or a separate scan port.
IPv4 Address (optional) []: 10.120.32.181
IPv4 Subnet Mask (optional) []: 255.255.255.0
IPv6 Address (optional):
IPv6 Prefix (optional):
IPv4 Default Gateway (optional) []: 10.120.32.1
IPv6 Default Gateway (optional) []:
Note: When registering a Collector to the OC, make sure that they both are in the same time zone. Use the configure server command to set the Collector time zone to match the OC (US/Eastern). Changing the time zone requires a system reboot.
14. Enter Y (yes) to perform the step for configuring the LAN1 port on the collector appliance:
Do you want to configure the Scan Port? (y/n) [n]: y
You must configure an IPv4 or IPv6 address/mask on the scan port.
IP Address (optional) []: 10.0.60.181
Subnet Mask (optional) [] 255.255.255.0 :

Infoblox NetMRI 7.4.4 Administrator Guide Part 6 Events, Tools and Data Support
Copyright ©2020, Infoblox, Inc. All rights reserved. Page 420
••
1.2.
3.
4.
IPv6 Address (optional):
IPv6 Prefix (optional):
You must provide either an IPv4 gateway, an IPv6 gateway, or both.
IPv4 Default Gateway (optional) [] 10.0.60.1 :
IPv6 Default Gateway (optional) []:
15. Enter the address(es) of the primary and secondary DNS server, if required:
DNS Servers are used to map hostnames to IP addresses.
You may enter up to 2 name servers below.
DNS Server 1 (IP) []: 172.23.16.21
DNS Server 2 (optional) []:
16. The setup utility lists the configuration settings and queries whether you wish to edit them.
Edit these settings? (y/n) [n]:
17. The setup utility requests that you commit your settings. Enter to accept the Y (yes) default.
Configure the system with these settings? (y/n) [y]:
Configuring system ...
+++ Validating Interfaces ...
+++++ eth0 ... OK
+++++ eth1 ... OK
The Collector appliance restarts.
You continue by installing the license for each Collector appliance. Continue to the next topic, 5th Step: Installing the Operations Center Collector License(s).
5th Step: Installing the Operations Center Collector License(s)You will need the following information to correctly license all Collectors in the deployment:
Each Collector appliance's required feature licenses (Full NetMRI, or Automation Change Management (ACM));The number of licensed devices that each Collector is expected to manage.
In an OC deployment, each NetMRI Collector license is provided from the Infoblox Support Portal. Once you bring the appliances up, they are simply operating as standalone NetMRI appliances.
Obtain an Operations Center license from Infoblox.Upload the license file provided by Infoblox into the admin account's /Backup directory using WinSCP or a similar program.Log into the admin shell and enter the license <NameOfLicenseFile> command, and press Enter. The NetMRI service restarts without rebooting the appliance. NetMRI resumes operation after several minutes of processing.Continue to the next section, 6th Step: Registering NetMRI Collectors.
6th Step: Registering NetMRI CollectorsTo complete the basic Operations Center deployment, you run the register command in the Admin Shell on each Collector to register them with the newly configured Operations Center.

Infoblox NetMRI 7.4.4 Administrator Guide Part 6 Events, Tools and Data Support
Copyright ©2020, Infoblox, Inc. All rights reserved. Page 421
1.2.3.
1.
a.b.c.
a.b.c.
Note: Managed device licenses are enforced on each of the collectors for the Operations Center, not on the central Operations Center node. The Operations Center node must contain a license encompassing the scope of all licenses between all Collectors.
Use a terminal program to connect to the management IP address of each Collector appliance.Log in using the default admin/admin username/password account.Execute the following Admin Shell CLI commands on a newly installed or reset Operations Center appliance:
admin-na206.corp100.com> registerNOTICE: The inactivity timeout is being disabled temporarily while this command is run.
+++ Configuring Tunnel Registration Settings
Registration Server/IP [e.g., example.com]: 10.1.21.2Registration protocol (http|https) [https]:Registration username: adminRegistration password:#$^%#*#$
Register this system? (y/n) [y]:y
4. Press Y to establish the secure communication link between the Collector and the Operations Center appliance.
You can migrate from a standalone NetMRI appliance to an Operations Center environment. This procedure is described in the following section, Importing Data From a Reference NetMRI Instance section.
Importing Data From a Reference NetMRI InstanceThe appliance designated as a Controller can import the library of scripts, custom reports, custom jobs, policies and user account data from an existing NetMRI appliance. The NetMRI appliance from which you are importing does not become the Controller itself.
Choose the NetMRI instance as a reference system from which data will be copied.
Only information from the reference NetMRI can be imported into the Operations Center. When adding multiple NetMRI instances to an Operations Center environment, the scripts, policies and settings may differ between NetMRI instances. Therefore, any of the deltas you want imported into the Operations Center must either be manually added to the reference NetMRI, or imported into the Operations Center after the reference NetMRI is restored on the Operations Center.
2. Configure the Controller:
Log in to the admin shell on the Operations Center Controller.At the command prompt, enter configure tunserver.When prompted to Enter the reference system serial number or RETURN to skip, type the serial number of the NetMRI reference system, then press ENTER.
Tip: In each prompt, defaults are shown in square brackets [ ]. To accept the default, simply press ENTER.
d. When prompted: Use these settings?, enter y.
e. When prompted to restart the Controller, enter y.
The complete package of scripts, policies and user data is downloaded by the Operations Center. You install the data in a following step.
3. Register the reference system with the Controller:
Log in to the admin shell on the reference system.At the command prompt, enter register.When prompted to Register this system?, enter y.

Infoblox NetMRI 7.4.4 Administrator Guide Part 6 Events, Tools and Data Support
Copyright ©2020, Infoblox, Inc. All rights reserved. Page 422
d.
a.b.c.d.
a.b.c.d.
1.2.3.4.
1.a.b.c.
2.
You are prompted to run restore-settings on the master server. Continue in step 4.
4. Define restore settings on the Controller: (This installs the uploaded reference data.)
If needed, log in to the admin shell on the Controller.At the command prompt, enter restore-settings.At the Continue with import? prompt, enter y. (This installs the reference data on the Controller.)When prompted to restart the Controller, enter y.
5. Re-register the reference unit with the Controller.
If needed, log in to the admin shell on the reference system.At the command prompt, enter register.When prompted to Register this system?, enter y.The appliance restarts. After restarting, the instance will be a collector in the Operations Center system.
Note: As part of the registration process, the admin password on each collector synchronizes with the password on the Operations Center Controller. After registration completes, the admin password for the collector may be different than the password you initially used to log in to the admin shell on that instance.
Note: After registration, the NetMRI GUI is not available on the reference NetMRI unit. All access to the unit takes place through the Controller.
Configuring the Operations Center Controller with Factory DefaultsThis procedure describes the straightforward process of setting up an Operations Center Controller with factory defaults. No configuration data or network and device information is imported from any NetMRI reference system.
Log in to the NetMRI admin shell.Enter configure tunserver.When prompted to Enter the reference system serial number or RETURN to skip, press ENTER.Proceed to build out the system, by following the procedures in the section Installing the Operations Center Controller.
Installing an Operations Center License onto an Existing NetMRI ApplianceInstalling an Operations Center license is a process that should only be done on appliances that are qualified to operate as such. Otherwise, the process is straightforward.
Convert the NetMRI appliance to an Operations Center Controller:Obtain an Operations Center license from Infoblox.Upload the license into the admin account's /Backup directory using WinSCP or a similar program.Log into the admin shell and enter the license <NameOfLicenseFile> command.
Log in to the admin shell and enter configure tunserver. Answer the prompts to set up the basic tunnel server settings, as described in the section 3rd Step: Running Configure Tunserver on the Controller.
Configuring Network Interfaces for Operations CenterNetMRI requires a connection to each network you wish to directly discover, manage or control. Scan Interfaces are the ports on NetMRI appliances and virtual appliances that perform this function. Physical scan interfaces are actual Ethernet ports on the appliance.
You can configure virtual scan interfaces on Collector appliances, that use 802.1Q VLAN tagging between NetMRI and its connecting device, to exchange traffic for multiple networks across a single physical interface. To use virtual scan

Infoblox NetMRI 7.4.4 Administrator Guide Part 6 Events, Tools and Data Support
Copyright ©2020, Infoblox, Inc. All rights reserved. Page 423
•
•
interfaces, you connect one of NetMRI's physical scan interfaces to a device interface configured to route the desired networks with 802.1Q VLAN tags.
You define physical scan interfaces and virtual scan interfaces on Operations Center Collectors. All scan interfaces of either type must be bound to a network view to enable network management across each interface.
Each network views also requires discovery settings to discover the network.
Network Views and Scan Interfaces
Note: You associate all network discovery settings, including discovery ranges, static IPs and seed routers, with each network view. For information about configuring your network views, see Configuring Network Views and Configuring Network Discovery Settings.
You use network views in combination with scan interfaces to separate and manage networks. If you plan to manage a number of networks of any kind (routed networks, virtual routing and forwarding (VRF) networks, and so on), network views, each tied to a scan interface, give you the flexibility to do so.
Network views provide the useful concept of isolation. Using network views, NetMRI enables you to manage networks that may have overlapping IP prefixes or address ranges, preventing addressing conflicts between separately managed networks. You manage every network in complete isolation from other networks.
In previous Operations Center software versions, a model termed the multi-tenancy multi-collector deployment enables either of the following:
Multiple collectors on a single network (for managing an exceptionally large network).
For an OC deployment of this type, you choose the network view-collector entry from the NetworkView list. You will see multiple entries in the pages under Settings icon –>Setup–>DiscoverySettings for the NetworkView list. The entire network is assigned to a single network view; however, each network view entry is identified through the association of each Collector. This allows you to edit discovery settings for each Collector in the same network view. Examples:
corp100_west (NM35)
copr100_west (NM36)
Here each Collector, NM35 and NM36, is associated to the same network view, but discovery settings can beedited separately.
Multiple networks, each assigned to one collector.
This is the Multi-Network model. Each Collector is assigned to its own separate network view, which is bound to the scan interface on each Collector. Any Collector can also manage through multiple network views, each of which is considered a separate routing domain
Through virtual scan interfaces and multiple scan ports, combined with network views, you may have multiple scan interfaces per collector, and therefore multiple networks per collector. This extends the multi-tenancy multi-collector model to allow each collector in the Operations Center to flexibly discover, catalogue and manage multiple networks.
Note: If you have multiple networks, particularly with overlapping IP address ranges, you can define virtual scan interfaces to tie NetMRI to each network without affecting the operation of those overlapping address spaces.
Configuring Scan Interfaces on CollectorsOn each Collector appliance, each network view can be associated with a single scan interface. Multiple Collectors can each access the same network view, each using separate discovery settings.
For information on configuring physical and virtual scan interfaces, see Configuring Scan Interfaces.

Infoblox NetMRI 7.4.4 Administrator Guide Part 6 Events, Tools and Data Support
Copyright ©2020, Infoblox, Inc. All rights reserved. Page 424
1.2.
•
••
•
•
Operations Center Disaster Recovery Procedure
Note: Ensure that the standby Operations Center appliance and/or all standby collectors use the same NetMRI software release as those in production before continuing with this procedure.
This topic describes how to perform a disaster recovery from a Primary Operations Center to a Standby Operations Center. When you perform a disaster recovery, you first restore the database archive on the Standby Operations Center, and then migrate all collectors from the Primary Operations Center to the Standby Operations Center
Note: To fully configure the Standby Operations Center, you will need a second product license for the disaster recovery system with the same licensing entitlements as the Primary Operations Center license. Contact your Infoblox sales representative for more information.
Complete the following to perform a disaster recovery:
Log in to the Standby Operations Center command line via SSH using the admin/admin system credentials.Execute the following Admin Shell CLI commands on a newly installed or reset Standby Operations Center instance:
Define the management port IP configuration for the Standby Operations Center:admin-na206.corp100.com> configure serverInstall the license for the Standby Operations Center:
For a physical appliance, generate a license by running the license generate command. For more information, see license generate command.For a virtual appliance, run admin-na206.corp100.com> license <license filename>.gpg.
Define server settings for the Standby Operations Center:admin-na206.corp100.com> configure server
Make a note of your settings for Step 6 of this Procedure.
Note: The configure server command also generates a new self-signed certificate for the Standby Operations Center. In cases where a CA-signed certificate is used in the original Operations Center, the HTTPS certificates need to be configured using the procedures described in the topic NetMRI Security Settings in the Admin Guide and in the online Help.
3. Verify your settings by entering the following commands:
admin-na206.corp100.com> show settingsList the complete config settings for the Standby Operations Center.admin-na206.corp100.com> show licenseShow the installed license for the Standby Operations Center.
4. Via SCP, manually transfer the Primary Operations Center database archive to the Standby Operations Center.
Note: You can also configure the database backup for the Primary as an automated transfer, using the Settings –> Database Settings –> Scheduled Archive screen on the Primary Operations Center to archive the OC database to the system designated as the Standby. The backup directory in this case should be set as "Backup"; for more information, see Database Archiving Functions in the Admin Guide and in the online Help.
Note: When using the automated database backup, you must first log in to the Standby Operations Center through your web browser, and set the admin password to a value different from the "admin" factory default.

Infoblox NetMRI 7.4.4 Administrator Guide Part 6 Events, Tools and Data Support
Copyright ©2020, Infoblox, Inc. All rights reserved. Page 425
In this case, after the Standby OC system is activated as the Primary, you must also go to the Settings –> Database Settings –> Scheduled Archive tab and define another remote system to back up the new OC's database archive.
If you schedule the transfer to occur within six hours of the start of weekly maintenance, no new archive will be created. Instead, the archive generated by weekly maintenance will be used. For large deployments with a lot of data, configuring backups to occur more frequently than the weekly interval may affect overall system performance.
5. Using the Admin Shell on the Standby Operations Center, restore the database archive on the Standby Operations Center. Restore time depends upon the size of the database, and may take several hours for a large system.
admin-na206.corp100.com> restore ExampleNet_4050201203200004-20130221-641
Note: The admin credentials (that default to admin/admin) are changed on the Standby Operations Center following the database restore operation. The Standby Operations Center will use the admin credentials that previously applied on the Primary Operations Center.
6. When the database restore task finishes on the Standby Operations Center, run configure server a second time to regenerate the Standby Operations Center's self-signed certificate for HTTPS access. Retain your settings previously defined in Step 2 of this Procedure.
7. In the Admin Shell on the Standby Operations Center, configure the VPN tunnel server on the Standby Operations Center using the same VPN subnet and other settings as on the Primary. When asked for the Server Public Name or IP address, be sure to enter the correct value for the Standby Operations Center. Do not configure a reference collector. The following listing is a sample capture for an entire session:
admin-na206.corp100.com> configure tunserver+++ Configuring CA Settings
CA key expiry in days [5475]:CA key size in bits [1024]:
+++ Configuring Server Settings
Server key expiry in days [5475]:Server key size in bits [1024]:
Server Public Name or IP address: 172.23.27.170 <new IP address for Standby>
Protocol (tcp, udp, udp6) [tcp]:Tunnel network base [5.0.0.0]:Block cipher:
0. None (RSA auth)
1. Blowfish-CBC
2. AES-128-CBC
3. Triple DES
4. AES-256-CBC
Enter Choice [2]:
Use compression [y]:
You can optionally designate a NetMRI client system as a "reference" system that will be used as a source of common settings.
Enter reference system serial number or RETURN to skip: <press Enter here>
Use these settings? (y/n) [n]: y
+++ Initializing CA (may take a minute) ...

Infoblox NetMRI 7.4.4 Administrator Guide Part 6 Events, Tools and Data Support
Copyright ©2020, Infoblox, Inc. All rights reserved. Page 426
+++ Creating Server Params and Keypair ...
Generating DH parameters, 1024 bit long safe prime, generator 2
This is going to take a long time
....++*++*++*
+++ Creating Server Config ...
Successfully configured Tunnel CA and Server
The server needs to be restarted for these changes to take effect.
Do you wish to restart the server now? (y/n) [y]: y
+++ Restarting Server ... OK
8. Check the Standby Operation Center’s VPN tunnel server settings, which are used for communications between the Operations Center and its collectors, before proceeding:
example-oc> show tunserver
CA configured: Yes
Server configured: Yes
ServerPublicName: 172.23.27.170
Proto: tcp
Port: 443
KeySize: 1024
Network: 5.0.0.0
Cipher: AES-128-CBC
Compression: Yes
Service running: Yes
Reference NetMRI SN: N/A
Reference NetMRI Import: Skipped
Client Sessions:
UnitSerialNo: 1200201202100020
UnitName: oc-170-coll-1
UnitIPAddress: 5.0.0.15
Network: ExampleNet
UnitID: 1
Status: Offline: Last seen 2013-02-21 03:01:01
...
9. Using a Web browser, log in to the Standby Operations Center. Note that the admin password for the Standby Operations Center system will now be set to the password of the Primary Operations Center.
10.In Settings –> Setup –> Collection and Groups, re-enable all data collectors needed for the configuration.
Note: You must re-enable SNMP collection on this page, as it is automatically disabled on a restore.

Infoblox NetMRI 7.4.4 Administrator Guide Part 6 Events, Tools and Data Support
Copyright ©2020, Infoblox, Inc. All rights reserved. Page 427
•
11. In Settings –> Setup –> Tunnels and Collectors, verify that all collectors are listed.
12. Register the collectors to the Standby Operations Center by executing the following commands on each of the collectors. You use these commands to specify the Standby Operations Center IP address and new admin credentials:
admin-collector111.corp100.com> reset tunclient admin-collector111.corp100.com> register
13. Verify Operations Center collector registration and communication by entering the following:
example-oc> show tunclientClient configured: YesServer: 172.23.27.182Proto: tcpPort: 443Cipher: AES-128-CBCCompression: OnTunnel Server IP: 5.0.0.1Tunnel Client IP: 5.0.0.10Server reachable: YesService running: YesLatest Service Log Entries:Apr 10 17:02:51 localhost openvpn[20804]: VERIFY KU OKApr 10 17:02:51 localhost openvpn[20804]: Validating certificate extended key usageApr 10 17:02:51 localhost openvpn[20804]: ++ Certificate has EKU (str) TLS Web Server Authentication, expects TLS Web Server AuthenticationApr 10 17:02:51 localhost openvpn[20804]: VERIFY EKU OKApr 10 17:02:51 localhost openvpn[20804]: VERIFY OK: depth=0, /C=US/ST=CA/L=Santa_Clara/O=Infoblox/OU=na_Operations_Center/CN=OC182/name=Tunnel-Server/[email protected] 10 17:02:51 localhost openvpn[20804]: Data Channel Encrypt: Cipher 'AES-128-CBC' initialized with 128 bit keyApr 10 17:02:51 localhost openvpn[20804]: Data Channel Encrypt: Using 160 bit message hash 'SHA1' for HMAC authenticationApr 10 17:02:51 localhost openvpn[20804]: Data Channel Decrypt: Cipher 'AES-128-CBC' initialized with 128 bit keyApr 10 17:02:51 localhost openvpn[20804]: Data Channel Decrypt: Using 160 bit message hash 'SHA1' for HMAC authenticationApr 10 17:02:51 localhost openvpn[20804]: Control Channel: TLSv1, cipher TLSv1/SSLv3 DHE-RSA-AES256-SHA, 1024 bit RSAexample-oc>
14. Log back in to the Standby Operations Center UI. In Settings –> Setup –> Tunnels and Collectors, verify that each of the registered collectors are online. The Operations Center will begin receiving data from collectors immediately after connection is established. Data processing and analysis will catch up in a time interval similar to how long the collectors were offline.
15. In Settings–> Database Settings –> Scheduled Archive, define the new archiving settings that you will need for the new Operations Center system, including enabling automatic archiving, defining the recurrence pattern, and defining the remote systems that will receive the periodic archives.
Replacing a CollectorPrerequisites:
Prepare a new collector (that is, the replacement collector) that will replace the existing one, including:
Configure the management port IP address on the replacement collector using the Admin Shell with SSH and the following command:new_collector_admin > configure server

Infoblox NetMRI 7.4.4 Administrator Guide Part 6 Events, Tools and Data Support
Copyright ©2020, Infoblox, Inc. All rights reserved. Page 428
•
1.2.3.4.5.
6.
7.
8.
Install the standalone license on the replacement collector. For more information, see 5th Step: Installing the Operations Center Collector License(s).
To replace a collector in an Operations Center environment, complete the following:
On the Operations Center, go to Settings –> Setup –>Tunnels and Collectors.For the collector to be replaced, click Actions –> Collector Replacement.Change the serial number of the existing collector to that of the replacement collector.Click OK.Log in to the existing collector and deregister it.old_collector_admin > deregister
Register the replacement collector to the Operations Center IP Address, and define the Operations Center Network to which the collector belongs.
new_collector_admin > configure tunclientNOTICE: The inactivity timeout is being disabled temporarily while this command is run.+++ Configuring Tunnel Registration SettingsRegistration Server/IP [example.com]: tunserver IP address or FQDNRegistration protocol (http|https) [https]:Registration username: tunserver loginRegistration password: tunserver password
After executing the configure tunclient command, the Operations Center automatically pushes all previous collector settings to the replacement collector and the collector begins its normal discovery tasks.
On the Operations Center, go to Settings –> Setup –> Scan Interfaces and change the scan IP address for that of the new collector.Verify that the replacement collector status is Connected: go to Settings –> Setup –> Tunnels and Collectors and check the Status column.
You can use SSH to log in the Operation Center's Admin Shell, to view a listing of the OC system and the collectors. The show tunserver command shows each collector's status in its listing.
Note: Collectors contain only a single day of data at any given time; database restoration is not supported on collectors.
Checking NetMRI Collectors Operation
Note: This information applies to NetMRI Operations Center installations only.
The Tunnels and Collectors page (Settings icon –> Setup –> Tunnels and Collectors) provides information about all collectors that are defined within a NetMRI Operations Center installation. A network consists of one or more Operations Center collectors. Each collector connects to the Operations Center through an encrypted tunnel.
The Status column in the table indicates a collector's status. For Operations Center collectors, the status you want to see is Connected.
You may change the data that appears in the Tunnels and Collectors table by choosing different columns of data. Useful information includes the following information:
VPN Address Lists the tunnel endpoint IP address assigned to each collector.
Network Name The name of the network for the Operations Center.

Infoblox NetMRI 7.4.4 Administrator Guide Part 6 Events, Tools and Data Support
Copyright ©2020, Infoblox, Inc. All rights reserved. Page 429
1.2.3.
1.2.3.
4.
Connected From This is the actual administrative IP address of the collector. Indicates the actual endpoint IP address and TCP port number across which the collector is tunneling (using its associated VPN endpoint).
Bytes Received and Bytes Sent Lists the total amount of data received by, and sent by, each collector during its entire active period in the OC.
Collectors also have Licensing limits, corresponding to those described in the topic Understanding Platform Limits,Licensing Limits and Effective Limits. The Tunnels and Collectors page lists the following information:
Device Limit Shows the maximum device license count for the collector–the number of devices the collector is licensed to manage. (This value does not apply to discovered device counts, which can be higher.) The value in this column corresponds to an Effective Device Limit for the collector.
Licensed Devices The number of consumed device licenses for the listed collector. The difference between this value and the Device Limit represents the number of device licenses remaining available to the collector appliance.
To view a collector's event logs, do the following:
Click the Actions icon and choose Log Messages.Click Yes to continue.When the log is available, it appears in a window.
To obtain and send technical data from any collector for troubleshooting purposes, do the following:
Click the Actions icon and choose Send Support Bundle.Choose a Transfer Mode: Download to Client Workstation or Send to Infoblox Support Site.Click, CTRL+click or SHIFT+click to select one or more Data Categories. Sending technical data requires at least one category selection.Click Start and confirm the operation.

Infoblox NetMRI 7.4.4 Administrator Guide Part 7 Appendices
Copyright ©2020, Infoblox, Inc. All rights reserved. Page 430
••••
•••
•••
Part 7 AppendicesThis section provides several more-specialized appendices and end matter for the NetMRI Administrator's Guide, including guidelines on manually updating your NetMRI system, information on the file formats used by NetMRI, and file management. This section includes the following chapters:
Manually Updating NetMRI SoftwareFAQs and Other InformationInfrastructure Devices ListOpen Source Components
Manually Updating NetMRI SoftwareNetMRI provides three options for updating the software manually:
By configuring NetMRI to automatically download and install the update.By downloading the update from the Infoblox Technical Support web site, then manually initiating the installation.By receiving an update file sent via e-mail, then manually initiating the installation.
The top of the NetMRI screen automatically notifies you when updates are available to the software. Updates come in two forms: Major Updates and Hotfixes. NetMRI automatically installs hotfix updates.
For manual installation, a NetMRI Administrator needs only to start the update process at a convenient time and provide any inputs requested. After that, the process is automatic, with no more inputs required.
See the following sections for manually updating the NetMRI software:
Update DistributionPre-Update PlanningUpdating From Update Files
Release Notes are available through the Infoblox Support site.
Update DistributionRegardless of how an update is performed, all updates are protected by digital signatures to ensure their authenticity. Any improper modification to the update information will cause the process to fail, thereby safeguarding the integrity of the NetMRI software.
Infoblox Technical Support announces software updates, including bug fixes, minor releases and major releases on the Infoblox Technical Support web site and posts messages to the NetMRI electronic mailing list. Announcements provide general information about the release, and the specific capabilities affected by the release. You can upgrade the appliance any time after an announcement.
When an update file for a major release is updated on an established update server, NetMRI automatically downloads the update.
Note
Check the Update History (Settings icon –> General Settings –> Update History) for information on all the updates that have taken place on the local NetMRI system.
To extend the image size and internal swap partition size for the local sandbox, manually execute the sandbox reset command after upgrading to 7.3.2. Any changes made to the sandbox (e.g. additional libraries installed, etc.) will be lost during this process.

Infoblox NetMRI 7.4.4 Administrator Guide Part 7 Appendices
Copyright ©2020, Infoblox, Inc. All rights reserved. Page 431
••
1.
2.
3.
1.2.
3.
Pre-Update PlanningBefore attempting a software update, you should determine the current software version for your NetMRI installation. You can do this in one of the following ways:
Go to the Settings icon –> Setup –> Settings Summary.Execute the show version command in the Administrative Shell.
In either case, the NetMRI Version, Serial Number and Server Name are shown, which are the key configuration information for the installation. If you have deployed multiple instances on your network, verify that you are connected to the appropriate one.
Downloading The SoftwareAny NetMRI appliance that is connected to the Internet can be updated automatically and securely from the Infoblox Technical Support web site.
Execute the following command in the Administrative Shell: AutoUpdateThe update process creates a TCP connection to the SSH (22) port on the Infoblox web site and retrieves a list of available updates, which is displayed for your review.Enter y to begin the update process. orEnter n, to abort the update process (you are returned to the shell prompt).
The AutoUpdate process can be executed any number of times without harm. If your NetMRI software is current, it will not make any changes.
Updating From Update FilesSoftware updates, including custom patches, are available from Infoblox as an update file that can transmitted in a variety of ways, including e-mail and FTP. Update files are digitally signed by Infoblox to ensure their authenticity and are also encrypted to protect the confidentiality of the data.
Copy the update file into the Backup directory of the Administrative Shell account .Execute the following Administrative Shell command to update NetMRI:AutoUpdate <updatefile.gpg>where <updatefile.gpg> is the name of the update file.The authenticity of the update file is validated and the file contents are decrypted and applied to the appliance software
Note
All NetMRI data collection, analysis and web-interface processing are automatically disabled during the software update process. Therefore, software updates should be performed during off-hours whenever possible. Keep in mind that the appliance does most analysis processing between midnight and 3:00 am, so it is best to run the AutoUpdate process outside that time period as well.
Note
Prior to performing an update, ensure that there is enough time for the update to complete before the NetMRI weekly maintenance starts. This avoids conflicts between the two processes.

Infoblox NetMRI 7.4.4 Administrator Guide Part 7 Appendices
Copyright ©2020, Infoblox, Inc. All rights reserved. Page 432
•••
•
•
•
•
About the AutoUpdate ProcessDuring the update process, each required software update is applied in appropriate order until all updates are applied. The exact steps performed for each update will vary from release to release depending on the type of processing required. In some cases, user input is required to assist in the update process, although this should be the exception.
Special update instructions may be included in the release documentation provided by Infoblox in rare situations when manual updates are required.
After the AutoUpdate process has completed, either successfully or unsuccessfully, you return to the NetMRI Administrative Shell prompt. If the update process was not successful, read the Troubleshooting section below for suggestions on how to proceed.
Troubleshooting UpdatesAll actions performed during the AutoUpdate process are recorded in a log file that can be viewed by entering the show updatelog command. If AutoUpdate fails for any reason, refer to the log file for details and then try each of the following troubleshooting procedures that apply to your situation. If you can't resolve the problem by following these steps, contact Infoblox Technical Support for further assistance.
Symptom: Unable to connect to NetMRI using the SSH client application.
Verify the NetMRI GUI is still accessible with a web browser.Verify the IP address or hostname is the same being used for SSH.Using a telnet client, connect to the NetMRI device IP address or hostname on port 22 (e.g., telnet 169.254.1.1 22). If a connection is established, check your SSH settings.
Symptom: Connection established but SSH password not accepted.
Passwords and usernames are case-sensitive. Verify that admin is lowercase and the password is the same case as when it was created.Change the password at Settings icon –> User Admin –> Users page via the browser interface, then use the new password to attempt to connect to NetMRI again.
Symptom: Unable to connect to Infoblox Technical Support server.
Use the NetMRI ping/traceroute tool via the browser interface (Tools–> Device –> Ping/Traceroute), or the ping command via the NetMRI Administrative Shell, to verify that NetMRI can reach any server on the Internet.
Symptom: Update stops when updating an OC with collectors one of which is offline.
Ensure that the collector (physical or virtual machine) is online.
FAQs and Other InformationConsult the following topics to address frequently asked questions about NetMRI operation, using the Cisco Discovery Service utility software, using the NetMRI AutoUpdate feature, viewing hardware status messages from NetMRI appliances, changing the banner logo and other information.
Note: For information on NetMRI licensing, including network device licensing, see NetMRI Licensing.

Infoblox NetMRI 7.4.4 Administrator Guide Part 7 Appendices
Copyright ©2020, Infoblox, Inc. All rights reserved. Page 433
Frequently Asked Questions
User InterfaceQ. How can I do more sophisticated searching and filtering in tables?A. Both the Quick Search field and the Filters dialog enable you to use regular expression syntax to specify search targets. Any characters enclosed between forward slashes (/*/) are treated as a regular expression.
Q. I returned to a page and data that was there has disappeared. What's going on?A. While you were away from that page, you may have changed the date or period in another page, or you may have constrained the data to a specific device group. Check the device group/date/period at the left end of the green header to see whether that's what you want. To change the device group, or to show data for the entire network, click the corresponding row in the Select Device Groups panel. To change the date or period, see Setting the Date and Period.
Q. I have an admin account in NetMRI but I can't get my CLI connections to work - my Telnet and SSH connections time out.A. Your admin account does not have CLI credentials enabled. To fix this, open Settings, go to User Admin –> Users, and click the Edit icon for the admin account. Click the CLI Credentials tab. Then, enable the User CLI Credentials Enabledcheck box, and enter the user name and password, with password confirmation. If you need an Enable password for accessing network devices through the CLI, enter that value and confirm that as well. Click Save and start a new terminal session to the NetMRI appliance.
Device GroupsQ. I added a new device to my network. Where do I find that device in NetMRI?A. NetMRI checks for new devices every 15 minutes. A new device is assigned to a device group based on the group membership criteria where the group is defined. If NetMRI can't assign a device to a defined group, it places it in the UNKNOWN or NAME-ONLY group.
Q. Why does a Managed Devices or Asset Inventory report run for the VirtualIP default device group return "No Results Found."A. Virtual IP devices are excluded from reports such as Managed Devices and Asset Inventory because they are not physical devices and they lack certain necessary OS and chassis information.
Q. Why do device group counts in the Select Device Groups panel appear to be out of sync with the counts at Network Explorer –> Inventory –> Devices section –> Devices?A. Device group membership counts are recalculated every 15 minutes. When the appliance is discovering many new devices, you might see a different count until you refresh your browser following that recalculation. If no new devices are being added to the network, you are unlikely to see a difference.
DiscoveryQ. How can I remove a device from NetMRI?A. A network device is removed if it is in the included CIDR blocks and hasn't been accessed by NetMRI in a 7-day period and it hasn't shown up anywhere on the network based on data collected in the past day. This 7-day period is adjusted with the Device Expiration Days setting in the Settings icon –> General Settings –> Advanced Settings page. Data sources checked to see if the device exists include ARP, routing, CDP and any /32 or /128 CIDR blocks. A discovery diagnostic of a device will show which devices are reporting this device in those tables for help in troubleshooting problems. Any device included in a CIDR block is removed after one day. Any non-network device, such as a PC, is removed from NetMRI if it isn't seen in any collected data in the previous 24 hour period.

Infoblox NetMRI 7.4.4 Administrator Guide Part 7 Appendices
Copyright ©2020, Infoblox, Inc. All rights reserved. Page 434
•
Q. What kinds of IPv6 networks do I need to add to my seed routers or discovery ranges?A. IPv6 standards define several new types of network prefixes, because the address value is longer and is formatted differently. Unique local IPv6 Unicast network prefixes begin with the designation FC00:/7. (These values are similar to the familiar 10.x.x.x, 172.16.x.x and 192.168.x.x IP prefixes.) Globally routable values begin with the 2000:/ or 2001:/prefixes but are not used as examples in this document because of the need to use private address spaces in documentation, to avoid possible conflicts with live networks.NetMRI discovery of IPv6 networks can make use of Hints and CIDR blocks for discovery.Do not use link-local or multicast addresses as a device hint, for a range, or a seed router. Unique local IPv6 unicast values are acceptable. As with the 10.x.x.x and other private IPv4 values, they are not globally routable and are safe for use in the local network. Also see the section Configuring Network Discovery Settings for more information.
Q. Some devices in my network only support SNMPv2c. Can I use SNMPv2c credentials as the default for discovery?A. Yes. See Choosing SNMP Protocol Preferences for more details.
Q. Can I define SNMPv3 credentials with both types of secret keys to conform to my organization's security policies?A. Yes. You can define SNMPv3 credentials with separate authentication and privacy key values. See SNMPv3 Credentials for Discovery and Management for more details.
Switch Port ManagementQ. I've installed a Switch Port license into NetMRI but none of my Ethernet switches are showing up in the Switch Port Management device tables. The switches appear in my Switch and Switch-Router device groups, but I get a "Polling Started for 0 Devices" message whenever I try to start polling the switches.A. You must add the switches in the device group(s) to the SPM license, whether it's an evaluation license or a paid-for SPM license. Installing the license does not automatically add the contents of the Switch and Switch-Router device groups to the licensed device count.
Configuration ManagementQ. What does the Get Config button in the Config Explorer actually do?A. The Get Config button schedules back-end processes to retrieve the current configuration files from the selected device. If there is no difference from the currently listed configuration files, then a new instance is not created in the configuration files list. Each listed instance implies a difference, and the timestamp defines when the file was first known to be changed. To determine when the file was last checked, open the "Current" "Running" configuration file. In the resulting window, the Last Update timestamp (in the header) indicates the last time checked.
User AdministrationQ. Why can't I specify device groups for the SysAdmin role?A. The SysAdmin role is not intended as an operator (i.e., restricted to certain network domains), but rather a system administrator with authority throughout the NetMRI appliance. For security and safety, you should only use this role when performing actions that require it.
SecurityQ. Can I disable HTTP access to NetMRI?A. By default, both HTTP and HTTPS modes are enabled. Infoblox recommends disabling the HTTP mode. Go to Settings icon –> General Settings –> Security – NetMRI HTTPS Settings to modify settings.
Q. What well-known ports does NetMRI use?A. Outbound ports:
22/ssh TCP for configuration collection

Infoblox NetMRI 7.4.4 Administrator Guide Part 7 Appendices
Copyright ©2020, Infoblox, Inc. All rights reserved. Page 435
•••••••
••••
•
•
•
23/telnet TCP for configuration collection25/smtp TCP for notifications161/snmp UDP for SNMP collection162/snmptrap UDP for notifications514/syslog UDP for Syslog notifications1433 TCP TCP for CDR collection (when the IP telephony module is licensed).any TCP or UDP port defined by Settings icon –> Setup section –> Port List and port scanning is enabled.
A. Inbound ports:
22/ssh TCP for administrative shell access80/http TCP for non-secured GUI access443/https TCP or secured GUI access514/syslog UDP for change detection
System SecurityThe NetMRI appliance is configured to prevent all non-essential servers and ports, and all user accounts are disabled except for the admin account, which is used for administrative purposes (see below for more information).
Symptom: Unable to connect to Infoblox Technical Support server.
Use the NetMRI ping/traceroute tool via the browser interface (Tools –> Device –> Ping/Traceroute), or the ping command via the NetMRI Administrative Shell, to verify that NetMRI can reach any server on the Internet.Use the NetMRI ping/traceroute tool via the browser interface, or the traceroute command via the Administrative Shell, to verify that NetMRI can reach techdata.infoblox.com on the Internet.Verify that your firewall rules allow NetMRI to make an outbound SSH connection (tcp port 22) to techdata.infoblox.com.
Technical Support monitors the CERT advisories for all components used in the appliance and evaluates all appropriate reports with regard to their usage in NetMRI. If a serious vulnerability is discovered, a custom patch is developed and provided to all existing customers via the NetMRI User Mailing list.
Network Connections
Service Protocol Port Purpose
SSH TCP 22 Administrative Shell
HTTP TCP 80 Graphical User Interface
HTTPS TCP 443 Secure Graphical User Interface
Syslog UDP 514 Real-time config change detection
The SSH port can be accessed using the administrator password specified by the operator during configuration. All services on the SSH port are provided through the OpenSSH v3.5p1 public domain server. The only commands that can be executed via the SSH port are those provided by the NetMRI Administrative Shell, and the user can access only a restricted directory on the server.
All other ports are supported by a Java-based application server that is inherently resilient to buffer overflow attacks and other common network-based attacks. The HTTP, HTTPS and SNMP ports support standard processing for those

Infoblox NetMRI 7.4.4 Administrator Guide Part 7 Appendices
Copyright ©2020, Infoblox, Inc. All rights reserved. Page 436
•••
••
•••
protocols. The HTTP and HTTPS ports can be accessed only by authorized users using a valid password, as specified by the administrator.
Access Control ListsNetMRI supports an Access Control List (ACL) via the NetMRI Administrator Shell that allows the operator to specify one or more CIDR blocks to restrict access to all the non-SNMP ports supported by the appliance. When combined with the existing authentication mechanisms, the ACL effectively safeguards the appliance against unauthorized access.
Protocol ConfigurationNetMRI allows system administrators to configure the HTTP, HTTPS, SNMP and SSH protocols used to connect to the appliance via the Console GUI and Admin Shell, and the protocols used by the appliance to connect to network devices when collecting data. Protocol configurations can be defined at the Settings icon –> General Settings –> Security page, or by executing the configure command in the NetMRI Administrative Shell.
General Settings SectionThe General Settings section (Settings icon –> General Settings group) provides access to server statistics and a variety of server settings. Pages in this section enable the following tasks:
Set and reset any of numerous advanced settings (for information, see NetMRI Advanced Settings)Configure authentication service settings (for information, see Defining Authentication Services)Configure NetMRI to automatically check for software updates, and optionally install updates (see the Auto Update topic)Substitute your own banner logo (for information, see Replacing a Banner Logo)Create custom fields for manually recording any device information (for information, see Defining and Using Custom Fields )Shut down the server (for information, see Shutting Down the Server)Manage NetMRI server security (for information, see NetMRI Security Settings)Review NetMRI patches and updates
NetMRI Advanced SettingsNetMRI Advanced Settings (located in Settings icon –> General Settings –> Advanced Settings) provides a multi-page grouping of configuration settings for many NetMRI features. Advanced Settings are designed so NetMRI users can run a fully functioning system without changing any defaults settings in this category.
To modify items in Advanced Settings, click the Action icon for any setting and choose Edit. To reset the Advanced Setting to its defaults, choose Reset.
Settings Group Description
Configuration Management The Job Self Approval setting allows or disables the ability of job authors to approve the jobs they create. Job Requires User Credentials defines when job script execution needs command-line credentials for the devices against which the job runs.
Concurrent Jobs, the number of maximum concurrent Config Management jobs, defaults at 20 and is available only on NT-4000 NetMRI platforms.

Infoblox NetMRI 7.4.4 Administrator Guide Part 7 Appendices
Copyright ©2020, Infoblox, Inc. All rights reserved. Page 437
Settings Group Description
Data Collection A group of settings to determine how NetMRI reacts to large data sets. ARP Aggregate Limitdetermines the largest ARP table collectible by NetMRI.
The Route Limit setting defines the threshold for NetMRI to switch to CLI data collection for collection of large routing tables (typically but not exclusively compiled by BGP4 routers with connections to the external Internet). Routing table collection can also be enabled or disabled.
CatOS Configuration Command allows you to specify show config or show config all when collecting switch configurations.
Two more settings (Interface Live Viewer Polling Interval and Interface Live Viewer Poller Limit) define the polling interval in seconds, and limit the number of concurrent polling instances triggered by Interface Live Viewer. Another setting, (Enter Enable Mode, default On) determines whether the Configuration Management and Job Management systems in NetMRI should enter the Enable mode on managed devices before entering device commands.
Extended Device Discovery is a Cisco Discovery Service setting that allows some extended levels of SNMP data to be gathered by CDS from Cisco devices. Off by default, this setting potentially improves download times when the CDS user requests the data collection for a report.
For virtual device contexts data collection, enable the Collect Virtual Device Context (VDC) Datasetting. For more information, see Viewing Virtual Device Contexts.An SNMP-related setting, SNMPv1 Data Collection Fallback, enables or disables the use of SNMPv1 if the device does not support SNMPv2c for any reason.
The CPU Utilization setting defines the method for CPU utilization calculation for the device CPU utilization issue. This can be "max" or "average". The default value is "max". That means the maximum value from all CPU utilization values is used as the indicator for the device CPU utilization issue. If the "average" method is used, the average value from all CPU utilization values is used as the indicator for the device CPU utilization issue.
Polling Frequency Modifier is the coefficient that allows you to slow down or speed up the device polling frequency relative to the default NetMRI setting. This setting applies globally. For more information, see Setting Polling Frequency for a Device Group.
Deduplication Settings related to the deduplication of devices discovered from multiple collectors.
Enable the load balancer turns on the load balancing feature for moving devices from highly-loaded collectors to less loaded collectors.
Minimum capacity utilization sets the minimum percentage of devices, from collector's total capacity in terms of managed devices, at which moving devices from such collectors is allowed.
Minimum capacity utilization difference sets the minimum difference, in percentage, in the current devices utilization by collectors, at which devices can be moved to the less loaded collector.
Timeout for choosing the collector sets the maximum allowable time, in hours, for choosing the best management collector for the device.
For more information, see Deduplication and Load Balancing Settings.
Note
Setting a custom polling frequency may affect performance. High modifier coefficient results in polling performed more frequently, so the NetMRI unit may be more busy than usual.

Infoblox NetMRI 7.4.4 Administrator Guide Part 7 Appendices
Copyright ©2020, Infoblox, Inc. All rights reserved. Page 438
Settings Group Description
Discovery Several Discovery settings that affect how devices are collected in the NetMRI database. Device Expiration in Days governs the 'stickiness' of device records in the database.
Default Naming Priority allows setting of DNS or SNMP as the primary protocol for naming devices when added to the database.
Ping Sweep Frequency determines the elapsed time period, in hours, between ping sweeps within IP address ranges (default value 24).
Enabling the Discovery Ignore Duplicate MACs setting forces NetMRI to delete pre-existing records for a switch identified by a specific MAC address should the device change its assigned IP. Discovery Truncate IP History prevents IPs that aren't assigned to interfaces from being assigned in NetMRI to particular devices, which preserves the functions of the Cisco ip alias command where needed.
The SNMPv1/SNMPv2c Discovery Version setting allows a choice between three options: Use SNMPv1 for credential discovery; Use SNMPv2c for credential discovery; or Use both SNMPv2c and SNMPv1 for credential discovery. See Choosing SNMP Protocol Preferences for related information.
SDN Network Mapping Policy enables or disables the policy of mapping SDN networks to network views.
SDN Discovery enables or disables discovery of SDN controllers.
Default SDN Virtual Network sets the ID of the default network to map collected SDN networks.
NIOS Administration Define the NIOS administrator login password, used primarily for Automation Change Management applications (see Automation Change Manager (ACM) and associated topics for more details).
Notification Choose the Syslog facility used for tagging Syslog notifications.
Reports Define the number of concurrent reports allowed to run on the NetMRI appliance (Concurrent Running Reports). The default is 2 and should be retained in most cases.
Security Provides a single setting for visually hiding passwords as they are entered on the login screen (Hide Password Fields).
Switch Port Management Settings to Convert Free Ports to Available ports on a switch, following a certain number of days after interfaces are disconnected from an end device; and the ARP Cache Refresh Period, which causes NetMRI to issue pings to discovered devices before collecting switch port information. This can have a beneficial effect on the availability of devices in Cisco Catalyst switch forwarding tables when NetMRI does its periodic query of those forwarding tables.
The ARP Cache Refresh Ignore Discovery Ranges Advanced Setting helps to optimize the discovery of end hosts by disabling pinging of such devices outside of specified discovery ranges. By default, this feature is set to False, which means that devices outside the configured discovery ranges will be pinged by NetMRI. Set this value to True if deemed necessary.
Switch Port Management can use the new Advanced Setting ARP Cache Refresh Device History to enable pinging of devices from older tables compiled from previous polling days, prior to the most recently compiled End Host data tables. The default value is 14 days and the minimum value is one day. This feature helps rediscover devices that move off the managed network and eventually rejoin, such as laptops returning from travel.

Infoblox NetMRI 7.4.4 Administrator Guide Part 7 Appendices
Copyright ©2020, Infoblox, Inc. All rights reserved. Page 439
1.
2.3.4.
Settings Group Description
System Provides a pair of helpful settings for NIOS IPAM Sync functionality (IPAM Sync Retries and IPAM Sync Retry Interval).
Also provides JVM server settings that default to zero and should only be modified if the NetMRI appliance is a VM running under VMware.
Block Device Prompt access prohibits the use of device prompts (shell) through the web UI and Admin Shell. You may need this to prevent access to your devices from anywhere except your jump hosts. If you are running NetMRI in redundant mode, contact support to disable this setting. Once disabled, this setting can only be reverted by the Infoblox Support team.
User Administration User Administration settings, found and 5 of Advanced Settings, to determine the required length of passwords, whether a password should be more complex, the number of permitted login failures before lockout, and more. See Advanced User Administration Settings for details.
User Interface Settings to rewrite the password banner message on the login page; change the number of rows automatically displayed in NetMRI data tables (Minimum Table Size); change the period of time before which NetMRI logs the user out of an admin shell or UI session (Inactivity Timer); change the period of time before NetMRI notifies the user to Cancel or continue to Wait during a long-running request (Long Running Request Timer).
Checking Hardware Status MessagesThe Hardware Status page (Settings icon –> Notifications section –> Hardware Status page) provides status information about hardware components in the NetMRI NT-4000 appliance, including component failures and general messages about the health and operation of elements such as the fan assemblies, LCD screen, removable hard disks, power supplies, events that are reported when the case is open, overall System Health messages and others.
The Hardware Status page does not apply to NetMRI virtual appliances or to NetMRI 1102-A 1U or NT-1400 appliances. Also consult the Infoblox Installation Guide For the NetMRI NT-4000 Appliance for more information about the NT-4000 system.
Auto UpdateNetMRI can be configured to periodically check for minor software updates, and can optionally automatically download and install those updates. Software update notifications appear as the issue "NetMRI Update Available," and users are notified of automatic software installations through a system message, visible in the Settings icon –> Notifications –> System Messages page, to notify users of Applied or Available updates.
NetMRI must be able to reach the server techdata.infoblox.com using TCP port 22.
To configure automatic updates, do the following:
Select the Auto Update Setting option:Disabled: Do not check for updates. If you select this option, go to step 4. Notify Only: Check for updates.Automatic: Check for updates, and if an update is available, download and install it.Select the Frequency for notification or automatic updates.Select the Hour to Start and Minute to Start.Click the Update button.
Replacing a Banner LogoUse the Banner Logo page (Settings icon –> General Settings –> Banner Logo) to display your logo in reports generated by NetMRI. Your logo will replace the default logo that is provided with NetMRI.

Infoblox NetMRI 7.4.4 Administrator Guide Part 7 Appendices
Copyright ©2020, Infoblox, Inc. All rights reserved. Page 440
1.2.
3.
1.
2.
1.2.
To replace the default logo with your logo, do the following:
Click Browse, then locate and select the logo file.The file can be any common image format, such as JPEG, GIF, PNG, etc. The ideal image size is 220 x 60 pixels (an image that is not this size is automatically resized to those dimensions).Click Update.
To restore use of the default logo: Click Reset.
Shutting Down the ServerUse the Shutdown Server page (Settings icon –> General Settings –> Shutdown Server) to stop or restart NetMRI.
NetMRI includes embedded database and file systems to manage the vast amount of information it gathers from the network. Although the database and file systems are designed to be resilient to failures, it is always best to shut the appliance down gracefully whenever possible to avoid data corruption.
Note: Failure to properly shutdown NetMRI may result in corruption of one or more database tables. Although NetMRI automatically attempts to repair tables when restarted, such repairs may not always work, resulting in a loss of data or functionality. In certain cases, you may need to restore the database or reset to factory defaults.
To shutdown the server from the browser interface, do the following:
Select a shutdown option:Restart Server. This option will shutdown NetMRI and then immediately restart it.Power Down Server. Use this option for a planned power outage or to move NetMRI to another location.Disable Collection, Then Power Down Server. Use this method when removing NetMRI from a network, possibly for further review of analysis information. This option will likely be used most frequently by consulting organizations who use NetMRI on a network for a few days, then take it back to their office to prepare a customer report.Save Network Database and Force Re-Configuration On Server Startup. Use this method when NetMRI is being moved to a new network or to a different section of an existing network. A consultant could also use this mode when moving NetMRI between different sites. A campus or enterprise customer can use this mode when moving NetMRI to different logical sections of a single network. The next time NetMRI is booted, the setup wizard will run, allowing you to configure it for a new network or a previously existing network. If a previously existing network is selected during the startup process, the system loads the archived copy of the database for that network, allowing NetMRI to pick up where it left off or allowing you to analyze the old data.Click OK.
You can also shut down the server from the Administrative Shell.the appliance is configured for separate analysis and management operation, check its rear panel. For separate operation, the SCAN port is connected to the production network for analysis, and the MGMT port is connected to the management network for system administration. If the appliance is connected to only one network, instructions in this section are not necessary.
Go to Settings icon –> General Settings section –> Shutdown Server.Type the CIDR-format Address (using syntax A.B.C.D/NN), type the Gateway IP address, then click Add. To delete a static route: Click the Delete button for any static route listed in the Static Route List on the page.
NetMRI Update HistoryThe Update History page (Settings icon –> General Settings –> Update History) lists NetMRI patches and upgrades that have been installed. Each action is time-stamped. If an installation failed, it is shown in red, with the failure status code.
Infoblox NetMRI 7.4.4 Administrator Guide Part 7 Appendices
Copyright ©2020, Infoblox, Inc. All rights reserved. Page 441
••
1.
2.3.
1.2.
3.
4.
5.
1.
File Transfer OperationsOccasionally, software update files or database archive files must be transferred to or from NetMRI. NetMRI supports two methods for transferring files:
File transfer between NetMRI and an external workstation or server using the SCP protocol.File transfer between NetMRI and an external server from the Administrative Shell using the SCP or FTP protocol.
Although NetMRI allows the FTP client to be used for transferring files from within the Administrative Shell, NetMRI instances of any kind do not allow external FTP clients to send or receive files directly into the system. No FTP server is provided on NetMRI appliances or VMs.
Client Workstation File Transfer Using WinSCPThe Windows Secure Copy (WinSCP) utility is a Windows-based tool with a graphical user interface that allows you to copy files to/from NetMRI using a drag-and-drop approach. WinSCP is available from http://winscp.net/eng/index.phpand other public domain web sites.Follow the directions that come with the utility to install it on a Windows-based PC. Then
Log in to the Administrative Shell by specifying the DNS name (or IP Address), a username of admin and the admin account's password.WinSCP will display the contents of the Backup directory.Transfer files between the source directory and NetMRI by dragging and dropping.
Client Workstation File Transfer Using FTP and SCPThe method for starting the SCP client will depend on the operating system. Examples below are based on Unix. All command line inputs to the SCP client are case-sensitive.The Secure Copy (scp) utility is a command line tool that can be used to download or upload files. It runs on most major operating systems and can be obtained from http://www.openssh.org. Only the scp client utility is needed on the storage device, not the scp server daemon.Follow the directions that come with the utility to install it on the storage device where the files are stored.
Exporting using SCPLog in to the storage device that will receive the exported file, and navigate to the directory where it will be stored.At the prompt, enter this command:scp "admin@<NetMRI>:Backup/*".including the double-quotes and the trailing space and period, but replacing <NetMRI> with the DNS name or IP address of the NetMRI machine that has the file to be downloaded.The first time you access NetMRI from a given storage device, you will be prompted by SCP to verify the authenticity of the instance. Answer yes to continue the download. (Once authenticity has been established on the storage device, this question will no longer be asked when accessing NetMRI from the same storage device using the same login.)After the connection authenticity has been established, SCP will prompt for the admin password. Enter the same password used to access the NetMRI admin account via the web interface.After accepting the password, SCP will copy the file from NetMRI to the storage device.
Importing using SCPUse SCP to download files:
Log in to the storage device that holds the file to be imported, and navigate to the directory where it is stored.

Infoblox NetMRI 7.4.4 Administrator Guide Part 7 Appendices
Copyright ©2020, Infoblox, Inc. All rights reserved. Page 442
2.
3.
4.
1.2.
1.2.3.
•
•••••
At the prompt, enter this command:scp <importfile> "admin@<NetMRI>:Backup"including the double-quotes, but replacing <NetMRI> with the DNS name or IP address of the NetMRI machine, and replacing <importfile> with the name of the file to be imported.After the connection authenticity has been established, SCP will prompt for the admin password. Enter the same password used to access the NetMRI admin account via the web interface.After accepting the password, SCP will copy the file from the storage device to NetMRI.
External Server Import and Export Using FTPThe NetMRI Administrative Shell supports the use of the FTP client within the shell itself to import/export files from and to an external server. Thus, instead of using your client application to access the NetMRI server, you can use the NetMRI client application to access other servers, such as the Infoblox Support FTP server.
Log in to the Administrative Shell using an SSH application.Execute this command:
ftp <servername>where <servername> is the name of the FTP server.
The Settings window organizes configuration options in the following sections:User Administration section: create and manage user accounts and roles, and view the audit log.
Sending Technical Support Bundles to Infoblox
Note: Support bundle operations require the SysAdmin role.
To obtain and send technical data from any NetMRI appliance for troubleshooting purposes, do the following:
1. Click the Actions icon and choose Send Support Bundle.–Or–
Go to Settings icon –> Database Settings -> Send Support Bundle.Choose a Transfer Mode: Download to Client Workstation or Send to Infoblox Support Site.Click, CTRL+click or SHIFT+click to select one or more Data Categories. Sending technical data requires at least one category selection. Data categories include the following:
Discovery Stats: Logs documenting events related to device discovery, network path collection, ping sweep results, and discovered device support information;SNMP/CLI Logs: Collections of SNMP and CLI data collection event logs;Config Logs: Device configurations, downloaded from the devices that NetMRI is managing;Standard Logs: Event log data for all server protocols and tasks used by NetMRI;Visualization Logs: NetMRI GUI processing events;System Health Logs: Event log journals directly related to System Health alerts.
4. Click Start and confirm the operation. Depending on the amount of requested data, a few minutes may be required to generate and download the bundle.
NetMRI Syslog Messages ListThis document provides a list of hard-coded system alert messages. It also includes a NetMRI Database Issues List.
System Alert Messages ListThe text in bold below indicates the source script for the message.

Infoblox NetMRI 7.4.4 Administrator Guide Part 7 Appendices
Copyright ©2020, Infoblox, Inc. All rights reserved. Page 443
drbdmonitord.pl
The replication data is synchronized
The replication data is out of sync
The connectivity to peer MGMT port is re-established
Lost connectivity on peer MGMT port
The connectivity via replication link is re-established
Lost connectivity via peer replication link
Lost all contact with primary peer. Performing auto fail over, becoming primary.
Lost all contact with primary peer. Not performing auto fail over. Disk state unfit
DeviceLimitExceeded.pm
Device license limit exceeded by {NumAffected} devices
Interface number exceeded by {NumAffected} devices for {NetworkTotal} interfaces, polling a high number of interfaces will affect performance
Security Control license limit exceeded by {NumAffected} devices
Number of used Security Control license exceeded 85% of license limit
GlobalConfigDisabled.pm
Global config collection is disabled
NetMRIMaintenance.pm
Weekly maintenance is disabled
DevicePolicy.pm
Device policy $short_name not evaluated for {DeviceIPDotted}. Status is $ps.
UpgradeUtil.pm
Upgrade Partitioned History Tables
Not enough database connections to upgrade table {table}. Retrying.
ibsync.pl
Infoblox Sync could not export data for NetMRI network ….
Retrying in {retryDelay} seconds.
The synchronization will not be retried until the next schedule synchronization attempt.
Could not authenticate to grid master as user ...
The network view was not found on the grid master.
CiscoCallMgrObject.pm

Infoblox NetMRI 7.4.4 Administrator Guide Part 7 Appendices
Copyright ©2020, Infoblox, Inc. All rights reserved. Page 444
CCM collector error
Error connecting to Call Manger
Error collection VoIP call manager system data
Error collection VoIP call manager type
ifTableObject.pm
Not polling interface performance data for {IPAddress} because license limit is exceeded
Rapid polling interface limit exceeded
voipResponderObject.pm
IPSLA responder setup failure
voipTestObject.pm
IPSLA jitter test setup failure
UpgradeIssues.pl
NetMRI Issue Upgrade Complete
SensorsCollector.pl
System Hardware Failure
cdr.pl
CDR collector error
Can't setup CDR listener server
Received connection from unknown host $client->peerhost
Received {invalidCount} invalid CDR record(s)
{sqlError}
Can't lock PID to modify ACL
Can't modify ACL
rtcp.pl
RTCP collector error
Can't lock PID to modify ACL
Can't modify ACL {error message}
copyArchive.pl
NetMRI Database Archive Failure
Unable to create archive

Infoblox NetMRI 7.4.4 Administrator Guide Part 7 Appendices
Copyright ©2020, Infoblox, Inc. All rights reserved. Page 445
Failed to copy archive to remote host
copyConfigs.pl
NetMRI Config Archive Failure
Unable to create archive
Failed to copy archive to remote host
NetMRI Config Archive Copied
Config Archive successfully copied to remote host
authKasai.pl
Failed login attempt
Error on server {auth_server} in service {service_name}
Error remote authentication is not usable, no authentication servers are reachable.
Successful Login
User {userName} successfully logged in from server {auth_server} using service {service_name}
login.tdf
Failed login attempt…
Successful Login…
User Lockout…
BackgroundUpgradeMonitor.pl
Background upgrade has aborted with {completed} of {total} tables processed.
Background upgrade has completed with {completed} tables processed.
WeeklyMaintenance
$productName maintenance process started
$productName maintenance process generated {Errors}
$productName maintenance process completed normally
AutoUpdate
NetMRI {updateTypeName} Installed
NetMRI {updatesNum} {updateTypeName(s)} Available
UpgradeNetMRI.pl
NetMRI Update Installed
NetMRI Update Available
Rebooting for kernel upgrade

Infoblox NetMRI 7.4.4 Administrator Guide Part 7 Appendices
Copyright ©2020, Infoblox, Inc. All rights reserved. Page 446
checkDiskUsage.pl
General Errors
NetMRI disk usage for {mount} exceeds {diskWarningThreshold}%. Current usage {capacity}%. Beginning data reduction
NetMRI disk usage for {mount} after pruning is {capacity}%. It was unable to free any significant amount of space
NetMRI disk usage for {mount} after pruning is {capacity}%
NetMRI disk usage for {mount} exceeds {diskWarningThreshold}%. Current usage {capacity}%
checkSkipjack.pl
Watchdog restarted MySQL
Watchdog restarted Skipjack Application Server
Watchdog restarted Tomcat Application Server
Watchdog restarted SNMP collector
Watchdog restarted Gromit Java service
Watchdog restarted Report Manager
Watchdog restarted discovery engine
Watchdog restarted analysis engine
Watchdog restarted Anyterm Daemon
Watchdog restarted OpenVPN service
Watchdog restarted Sensors Collector
Watchdog restarted Perl scripting service
Watchdog restarted Device Interaction Service
Watchdog restarted Message Queue Daemon Watchdog
Watchdog restarted Message Queue Server
NetMRI memory usage is extremely high. Current swap free is {swapFree}%. Taking corrective measures.
NetMRI memory usage is high. Current swap free is {swapFree}%
skipjack.pl
{productName} killed by system.
{productName} started by system.
{productName} stopped by system.
CredentialCollector.pm
SNMP Credentials: Failed to authenticate
NetMRI Database Issues ListThe following table lists the defined NetMRI database issues.

Infoblox NetMRI 7.4.4 Administrator Guide Part 7 Appendices
Copyright ©2020, Infoblox, Inc. All rights reserved. Page 447
Description Component
10Mbps Switch Port Errors High Interfaces
2007 Extended DST Compliance Devices
3Com Stack Unit Not Active Devices
Access Port With PortFast Disabled Interfaces
Access Port With SNMP Link Up/Down Trap Enabled Interfaces
Bad CatOS - SNMP Crash Devices
Bad IOS - SNMP Memory Leak Devices
Bare Metal Device Found Devices
BGP Neighbor Changes High Routing
Broadcast Forwards Update Succeeded Devices
Broken Switch Port Interfaces
Catalyst 3750 Bad Stack Switch Devices
Catalyst Switch Port in ErrDisabled Mode Devices
CDP Neighbor Changed Devices
Change SNMP Settings Succeeded Devices
Cisco Buffer Misses High Devices
Cisco No Buffer Memory Devices
Config Activity Configurations
Config Collection Disabled Configurations
Config Difference Configurations
Config Policy Failure Configurations
Config Retrieval Error Configurations
Config Rollback Failed Devices
Config Rollback Successful Devices
Config Rollback Verify Failed Devices
Config Running Not Saved Configurations
Configuration Command Script Failure Configurations
Corrupt IOS Image File Devices
Current Interface Utilization High Interfaces

Infoblox NetMRI 7.4.4 Administrator Guide Part 7 Appendices
Copyright ©2020, Infoblox, Inc. All rights reserved. Page 448
Description Component
Device 5 minute CPU utilization average Devices
Device CPU Utilization High Devices
Device Disk Utilization High Devices
Device DNS and SNMP sysName Mismatch Devices
Device Fan Problem Devices
Device Free Memory Low Devices
Device Identity Change Devices
Device Issue Limit Exceeded Devices
Device Memory Utilization High Devices
Device Memory Utilization Increasing Devices
Device No Route Routing
Device OS Version Change Devices
Device Partially Supported Devices
Device Power Supply Problem Devices
Device Recently Restarted Devices
Device Restarted Multiple Times Devices
Device Routing Table Changed Routing
Device Temperature Problem Devices
Device Voltage Problem Devices
Device With Web Interface Open Security
DHCP Relay Settings Update Succeeded Devices
Down Device Devices
Downstream Hub or Switch Interfaces
EIGRP Neighbor Changes High Routing
EtherChannel On One Card Interfaces
EtherChannel Unbalanced Interfaces
Event Analysis Degraded Mode Devices
Event Analysis Disk Space Check Devices
Event Analysis License Exceeded Devices

Infoblox NetMRI 7.4.4 Administrator Guide Part 7 Appendices
Copyright ©2020, Infoblox, Inc. All rights reserved. Page 449
Description Component
Exec Privs Update Succeeded Devices
Failed Determining Active IOS Image Devices
Failed To Change SNMP Settings Devices
Failed To Create ACL Devices
Failed To Disable MOP Settings Devices
Failed To Remove ACL Devices
Failed To Update Aux Port Settings Devices
Failed To Update Broadcast Forwards Devices
Failed To Update Console Port Settings Devices
Failed To Update DHCP Relay Settings Devices
Failed To Update DNS Config Devices
Failed To Update Exec Banner Devices
Failed To Update Exec Privs Devices
Failed To Update Interface ACL Devices
Failed To Update Interface Descriptions Devices
Failed To Update Interface Settings Devices
Failed To Update Interface Speed or Duplex Devices
Failed To Update Interface State Devices
Failed To Update Log Settings Devices
Failed To Update Login Banner Devices
Failed To Update MOTD Banner Devices
Failed To Update NTP Settings Devices
Failed To Update Password Settings Devices
Failed To Update Portfast Setting Devices
Failed To Update Recommended Device IP Settings Devices
Failed To Update Recommended Services Devices
Failed To Update Services Devices
Failed To Update SSH Settings Devices
Failed To Update Telnet Source Devices

Infoblox NetMRI 7.4.4 Administrator Guide Part 7 Appendices
Copyright ©2020, Infoblox, Inc. All rights reserved. Page 450
Description Component
Failed To Update TFTP Source Devices
Failed To Update UTC Clock Settings Devices
Failed To Update VTY Settings Devices
Flash Squeeze Operation Failed Devices
HP Buffer Misses High Devices
HP Corrupted Buffer Deletes High Devices
HSRP Group Changed Active Router Routing
HSRP In Initial State Routing
HSRP Not Recognizing Peer Routing
HSRP Timers Different Routing
HTTP Server Running On Router Or Switch Security
ICMP Destination Unreachables Sent Routing
ICMP Redirects High Routing
Incorrect Duplex Setting Interfaces
Incorrect or Missing Boot Commands Devices
Incorrect Serial Bandwidth Setting Interfaces
Insufficient Space for IOS Image Devices
Interface Broadcasts High Interfaces
Interface Congested Interfaces
Interface Disable MOP Succeeded Devices
Interface Errors High Interfaces
Interface Non-Unicasts High Interfaces
Interface Not Stable Interfaces
Interface Settings Update Succeeded Devices
Interface Unexpected Utilization Change Interfaces
Interface Utilization High Interfaces
Interface Utilization Low Interfaces
Invalid Admin / Oper State Interfaces
Invalid User Account Configurations

Infoblox NetMRI 7.4.4 Administrator Guide Part 7 Appendices
Copyright ©2020, Infoblox, Inc. All rights reserved. Page 451
Description Component
IOS Debug Command Left Enabled Devices
IOS Exec banner updated Devices
IOS Image File Copy Failed Devices
IOS Login banner updated Devices
IOS MOTD banner updated Devices
IOS Upgrade Failed Devices
IOS Upgrade Succeeded Devices
IP ACL Creation Succeeded Devices
IP ACL Removal Succeeded Devices
IP Routing Discards Routing
Log Settings Update Succeeded Devices
Management IP Not Reachable Devices
Missing VRRP Backup Router Routing
Network Routing Table Changed Routing
New Device Found Devices
New Non-Network Device Found Devices
New Wireless AP Device Found Devices
NTP Settings Update Succeeded Devices
OSPF Area Not Connected to Backbone Routing
OSPF Authentication Disabled Routing
OSPF Neighbor Changes High Routing
OSPF Stability Problem Routing
Password Settings Update Succeeded Devices
Policy Violation: Advisories Configurations
Policy Violation: DISA v7, r1.9 Cisco Infrastructure Router Configurations
Policy Violation: DISA v7, r1.9 Cisco Infrastructure Switch Configurations
Policy Violation: DISA v7, r1.9 Cisco L2 Switch Configurations
Policy Violation: DISA v7, r1.9 Cisco Perimeter Router Configurations
Policy Violation: DISA v7, r1.9 Cisco Perimeter Switch Configurations

Infoblox NetMRI 7.4.4 Administrator Guide Part 7 Appendices
Copyright ©2020, Infoblox, Inc. All rights reserved. Page 452
Description Component
Policy Violation: DISA v7, r1.9 JUNOS Configurations
Policy Violation: DISA v8, r11 STIG Firewall Configurations
Policy Violation: DISA v8, r11 STIG Infrastructure Layer 2 Switch Configurations
Policy Violation: DISA v8, r11 STIG Infrastructure Layer 3 Switch Configurations
Policy Violation: DISA v8, r11 STIG Infrastructure Router Configurations
Policy Violation: DISA v8, r11 STIG Network Devices Configurations
Policy Violation: DISA v8, r11 STIG Perimeter L3 Switch Configurations
Policy Violation: DISA v8, r11 STIG Perimeter Router Configurations
Policy Violation: IAVA 2009-A-0022 Configurations
Policy Violation: IAVA 2009-A-0026 Configurations
Policy Violation: NSA 1.1c IOS Configurations
Policy Violation: PCI DSS 1.2 IOS Configurations
Policy Violation: PCI DSS 2.0 IOS Configurations
Policy Violation: PCI DSS 3.0 IOS/NX-OS Configurations
Policy Violation: SANS IOS Configurations
Port In Error Disable State Interfaces
Possible Bad IPv4 Route Routing
Possible Routing Loop Routing
QoS Queue Dropped Packets Routing
QoS Queue Without Any Hits Routing
Rogue DHCP Server Cannot Be Isolated Devices
Rogue DHCP Server Detected Devices
Rogue DHCP Server Located Devices
Router Interface Down Interfaces
Router With No ARP or Routing Tables Devices
Router With No Loopback Address Devices
Services Update Succeeded Devices
SNMP Access Lost Devices
SNMP Collection Disabled Devices

Infoblox NetMRI 7.4.4 Administrator Guide Part 7 Appendices
Copyright ©2020, Infoblox, Inc. All rights reserved. Page 453
Description Component
SSH Settings Update Succeeded Devices
Subnet Empty Subnets
Subnet Mask Inconsistent Subnets
Subnet Utilization High Subnets
Subnet With Only One Device Subnets
Switch Port Duplex Mismatch Interfaces
Switch Port Failed Power-On Self Test Interfaces
Switch With No Forwarding Tables Devices
Telnet source interface update succeeded. Devices
TFTP source interface update succeeded. Devices
Trunk Port With PortFast Enabled Interfaces
Unidirectional Traffic Flow Interfaces
Unknown Community Strings Security
Unknown Password Configured Configurations
Update Aux Port Configuration Succeeded Devices
Update Console Port Configuration Succeeded Devices
Update DNS Config Succeeded Devices
Update Interface ACL Succeeded Devices
Update Interface Descriptions Succeeded Devices
Update Interface Portfast Succeeded Devices
Update Interface Speed and Duplex Succeeded Devices
Update Interface State Succeeded Devices
Update Recommended Device IP Settings Succeeded Devices
Update VTY Line Settings Succeeded Devices
UTC Clock Settings Update Succeeded Devices
Vendor Defaults Found Configurations
VLAN Definition Missing VLANs
VLAN Inconsistent Member Name VLANs
VLAN Member Minimum Priority VLANs

Infoblox NetMRI 7.4.4 Administrator Guide Part 7 Appendices
Copyright ©2020, Infoblox, Inc. All rights reserved. Page 454
••••••••••••••••••
Description Component
VLAN Member Priority VLANs
VLAN Root Bridge Not Connected To Router VLANs
VLAN Root Bridge Not Stable VLANs
VLAN Spanning Tree Protocol Timers Differ VLANs
VLAN Topology Change VLANs
VLAN Trunk Port Down Interfaces
VLAN With No Active Ports VLANs
VPN Tunnel MTU Mismatch Interfaces
VRRP Master Router Changed Multiple Times Routing
VRRP Protocol Errors Routing
VRRP Timers Different Routing
Weak Community String Security
Wireless AP Broadcasting SSID Wireless
Wireless AP EAP Disabled Wireless
Wireless AP Hot Standby Active Wireless
Wireless AP Hot Standby Ethernet Failure Wireless
Wireless AP Hot Standby Radio Failure Wireless
Infrastructure Devices ListCurrently, the following infrastructure devices are supported in NetMRI:
Call ServerCMTSComm ServerConsole ServerFirewallIPSLoad BalancerMedia GatewayNIOSProxyRouterSDN ControllerSDN ElementSecurity ManagerSwitchSwitch-RouterVideo DecoderVideo Encoder

Infoblox NetMRI 7.4.4 Administrator Guide Part 7 Appendices
Copyright ©2020, Infoblox, Inc. All rights reserved. Page 455
•••••••••••
Video GroomerVideo MonitorVideo QAMVideo ReceivervNIOSVoIP GatewayVPNWeb GatewayWireless APWireless ControllerWOC
This list is updated as new devices are supported.
Open Source ComponentsThe following table lists open source components with their licenses for the binary-only distribution from Infoblox. To request a copy of the source code of the open source software referenced below, contact Infoblox technical support.
Open Source Components
Product Name Version Licence

Infoblox NetMRI 7.4.4 Administrator Guide Part 7 Appendices
Copyright ©2020, Infoblox, Inc. All rights reserved. Page 456
Acme Java Resources 1996 BSD Two Clause License (BSD)
The two-clause BSD License
Redistribution and use in source and binary forms, with or withoutmodification, are permitted provided that the following conditions aremet:
1. Redistributions of source code must retain the above copyright notice, this list of conditions and the following disclaimer.
2. Redistributions in binary form must reproduce the above copyright notice, this list of conditions and the following disclaimer in the documentation and/or other materials provided with the distribution.
THIS SOFTWARE IS PROVIDED BY THE AUTHOR AND CONTRIBUTORS ``AS IS'' ANDANY EXPRESS OR IMPLIED WARRANTIES, INCLUDING, BUT NOT LIMITED TO, THEIMPLIED WARRANTIES OF MERCHANTABILITY AND FITNESS FOR A PARTICULARPURPOSE ARE DISCLAIMED. IN NO EVENT SHALL THE AUTHOR OR CONTRIBUTORSBE LIABLE FOR ANY DIRECT, INDIRECT, INCIDENTAL, SPECIAL, EXEMPLARY, ORCONSEQUENTIAL DAMAGES (INCLUDING, BUT NOT LIMITED TO, PROCUREMENT OFSUBSTITUTE GOODS OR SERVICES; LOSS OF USE, DATA, OR PROFITS; ORBUSINESS INTERRUPTION) HOWEVER CAUSED AND ON ANY THEORY OF LIABILITY,WHETHER IN CONTRACT, STRICT LIABILITY, OR TORT (INCLUDING NEGLIGENCEOR OTHERWISE) ARISING IN ANY WAY OUT OF THE USE OF THIS SOFTWARE, EVENIF ADVISED OF THE POSSIBILITY OF SUCH DAMAGE.
Infoblox NetMRI 7.4.4 Administrator Guide Part 7 Appendices
Copyright ©2020, Infoblox, Inc. All rights reserved. Page 457
adobe-flex 3 Mozilla Public License Version 1.1 and Adobe Flex SDK
ADOBE SYSTEMS INCORPORATEDSOFTWARE DEVELOPMENT KITLICENSE AGREEMENTAdobe® Flex® 4 SDK
1. NO WARRANTY, LIMITATION OF LIABILITY, BINDING AGREEMENT AND ADDITIONALTERMS AND AGREEMENTS.
1.1 WARRANTY DISCLAIMER. YOU ACKNOWLEDGE THAT THE SDK MAY BE PRONE TO BUGSAND/OR STABILITY ISSUES. THE SDK IS PROVIDED TO YOU “AS IS,” AND ADOBE AND ITSSUPPLIERS DISCLAIM ANY WARRANTY OR LIABILITY OBLIGATIONS TO YOU OF ANY KIND.YOU ACKNOWLEDGE THAT ADOBE MAKES NO EXPRESS, IMPLIED, OR STATUTORY WARRANTYOF ANY KIND WITH RESPECT TO THE SDK INCLUDING ANY WARRANTY WITH REGARD TOPERFORMANCE, MERCHANTABILITY, SATISFACTORY QUALITY, NONINFRINGEMENT OR FITNESSFOR ANY PARTICULAR PURPOSE. YOU BEAR THE ENTIRE RISK AS TO THE QUALITY ANDPERFORMANCE OF THE SDK AND YOUR USE OF AND OUTPUT FROM THE SDK. Adobe is not obligatedto provide maintenance, technical support or updates to you for any portion of the SDK. The foregoing limitations,exclusions and limitations shall apply to the maximum extent permitted by applicable law, even if any remedy failsits essential purpose.
TBD

Infoblox NetMRI 7.4.4 Administrator Guide Part 7 Appendices
Copyright ©2020, Infoblox, Inc. All rights reserved. Page 458