United States Marine Corps Physical Fitness, Combat Fitness ...

International Journal of Pediatric Obesity, 2010; 5: 467–473
ORIGINAL ARTICLE
Int J
Ped
iatr
Obe
s D
ownl
oade
d fr
om in
form
ahea
lthca
re.c
om b
y U
nive
rsity
of
Sao
Paul
o on
12/
07/1
1Fo
r pe
rson
al u
se o
nly.
Infl uence of socioeconomic factors on fi tness and fatness in Spanish adolescents: The AVENA study
DAVID JIMÉNEZ-PAVÓN 1,2 , FRANCISCO B. ORTEGA 2,3 , JONATAN R. RUIZ 3 , PALMA CHILLÓN 4 , RUTH CASTILLO 5 , ENRIQUE G. ARTERO 2 , DAVID MARTINEZ-GÓMEZ 6 , GERMAN VICENTE-RODRIGUEZ 7 , JUAN P. REY-LÓPEZ 7 , LUIS A. GRACIA 7 , MARIA JOSÉ NORIEGA 8 , LUIS A. MORENO 7 & MARCELA GONZALEZ-GROSS 1
1 Department of Health and Human Performance, Faculty of Physical Activity and Sport Sciences-INEF, Universidad
Polit é cnica de Madrid, Spain, 2 Department of Medical Physiology, School of Medicine, University of Granada, Spain,
3 Department of Biosciences and Nutrition, Karolinska Institutet, Sweden,
4 Department of Physical Education and Sport,
School of Physical Activity and Sport Sciences, University of Granada, Granada, Spain, 5 Faculty of Psychology, University
of M á laga, Spain, 6 Immunonutrition Research Group, Department of Metabolism and Nutrition, Instituto del Frio,
Institute of Food Science, Technology and Nutrition (ICTAN), Spanish National Research Council (CSIC), Madrid, Spain,
7 GENUD (Growth, Exercise, Nutrition and Development) Research Group, EU Ciencias de la Salud,
Universidad de Zaragoza, Spain, 8 Departament of Physiology and Pharmacology, University of Cantabria, Spain
AbstractObjective. This study was to examine the infl uence of socioeconomic status on fi tness and fatness in Spanish adolescents. Subjects and Methods. A total of 1 795 adolescents (833 boys) aged 12.5–18.5 years from the AVENA study participated in this study. The following physical fi tness components were assessed: muscular strength (standing long jump), speed-agility (4 � 10 m shuttle run) and cardiorespiratory fi tness (20 m shuttle run). Total and central body fat was assessed using skinfold thickness and waist circumference, respectively. Both parents reported their educational and professional level. Results. Girls with higher paternal educational level and boys with higher either maternal or paternal professional level had higher muscular strength levels (all P � 0.05). Speed-agility and cardiorespiratory fi tness were not associated with parental educational or professional levels in boys. In contrast, girls with higher paternal educational level or higher paren-tal professional level had higher levels in both fi tness components (all P � 0.05). A higher maternal educational level was associated with lower total and central body fat in boys (all P � 0.05), but not in girls. We observed a small effect size (Cohen´s d ∼ 0.2) in most of these associations. Conclusions. Our results suggest modest associations of high socioeconomic status with better fi tness and fatness levels in Spanish adolescents. These associations greatly depend on the socioeconomic status and fi tness parameters studied.
Key words: Socioeconomic status , fi tness , fatness , obesity , adolescents
Introduction
Physical fi tness is an important health marker in children and adolescents, and the main health-related fi tness components are cardiorespiratory fi tness, muscular fi tness, speed-agility and body composition (1,2). Physical fi tness is partially determined by genetic endowment, yet it is highly modifi ed by envi-ronmental factors (3). Socioeconomic status (SES) has been shown to infl uence several health-related
ISSN Print 1747-7166 ISSN Online 1747-7174 © 2010 Informa HealthcareDOI: 10.3109/17477160903576093
Correspondence: David Jiménez-Pavón, Department of Physiology, School of MeFax: 349 5824 9015. Email: [email protected]
(Received 5 July 2009; accepted 1 December 2009)
factors, such as birth weight, height, metabolic syndrome, malnutrition and obesity (4–7). Further-more, several studies reported that low SES in childhood may lead to higher morbidity, including cardiovascular disease later in life (8–10).
Several studies reported the association of SES with fi tness and fatness in European youth, and the results are contradictory (11–13). Freitas et al. (11) studied children from the Madeira Growth Study
dicine, University of Granada. Avd. Madrid s/n. CP: 18012. Granada, Spain.
468 D. Jiménez-Pavón et al.
Int J
Ped
iatr
Obe
s D
ownl
oade
d fr
om in
form
ahea
lthca
re.c
om b
y U
nive
rsity
of
Sao
Paul
o on
12/
07/1
1Fo
r pe
rson
al u
se o
nly.
aged 8–18 years old. Physical fi tness was assessed using the Eurofi t test battery. The authors found that boys from the low SES group performed better for muscular and aerobic endurance whereas girls from the high SES group performed better for power (11). By contrast, a cross-sectional survey conducted by Mutunga et al. in adolescents aged 12 and 15 years from Northern Ireland, observed that adolescents with higher SES (family affl uence) had higher cardio-respiratory fi tness than those with lower SES (12). Regarding the association between SES and fatness, Armstrong et al. showed that Scottish children in the most deprived families had a 30% higher risk of obesity (14), which concurs with others (13,15,16), but not all (6). Likewise, Ness et al. observed that even in children higher fat mass assessed by dual energy X-ray absorptiometry (DXA) was associated with lower social class although no association with lean mass or central adiposity were found (17). It is important to highlight that both social and cultural contexts are often country-specifi c. To the best of our knowledge, the effect of SES on both physical fi tness and fatness has not been studied in Spanish adoles-cents. Therefore, the present study aimed to examine the infl uence of SES on fi tness and fatness in a sample of Spanish adolescents
Methods
Study sample and design
The data presented in this paper were gathered as a part of the AVENA study (Alimentación y Valoración del Estado Nutricional de los Adolescentes / Feeding and assessment of nutritional status of Spanish ado-lescents). The complete methodology has been pub-lished elsewhere (18). Participants of the AVENA study were urban adolescents aged 12.5–18.5 years. Sampling was multi-staged and stratifi ed by city of origin (Madrid, Granada, Santander, Zaragoza and Murcia), gender and age. Data collection was carried out between 2000 and 2002. A total of 2 100 subjects were deemed necessary for the full study to be rep-resentative of the population, yet a greater number of subjects were measured to avoid problems of drop-out and consequent data loss. The response rate was � 90%.
All the adolescents meeting the general AVENA inclusion criteria (18,19) and with valid data for age and sex were included in this report. Consequently, sample sizes vary for the different models, the aver-age number of adolescents involved 819 boys and 931 girls. These subjects were equally distributed by gender and age in the study cities. The study sample was considered urban, as all the subjects lived in cities.
Parents and school supervisors were informed by letter about the nature and purpose of the study and written informed consent was required. The study protocol was designed and followed in accordance with the ethical standards laid down in the 1964 Declaration of Helsinki (amended in Hong-Kong in 1989 and in Edinburgh in 2000), and was approved by the Review Committee for Research Involving Human Subjects of the Hospital Universitario Marqués de Valdecilla (Santander, Spain).
Physical fi tness
The physical fi tness components, i.e., muscular fi t-ness, speed-agility and aerobic capacity, were assessed by the physical fi tness tests described below. All the tests were performed twice and the best score was retained, except the 20 m shuttle run test, which was performed only once. The scientifi c rationale for the selection of all of these tests, as well as the validity and reliability in young people, was published else-where (20–22).
1. Standing long jump test (muscular strength): The participant stands behind the starting line and was instructed to push off vigorously and jump as far as possible. The distance is measured from the take-off line to the point where the back of the heel nearest to the take-off line lands on the mat. The result was recorded in centimeters (cm).
2. 4 � 10 m shuttle run test (speed-agility): The adolescent runs as fast as possible from the starting line to the other line and returns to the starting line (10 m apart), crossing each line with both feet every time. This is performed twice, covering a distance of 40 m (4 � 10 m). Every time the adolescent crosses any of the lines, he/she should pick up (the fi rst time) or exchange (second and third times) a sponge, pre-viously placed behind the lines. The time taken to complete the test was recorded to the nearest tenth of a second.
3. 20 m shuttle run test (cardiorespiratory fi tness): Adolescents run back and forth between two lines set 20 m apart. Running pace was determined by audio signals, emitted from a pre-recorded cassette tape. The initial speed was 8.5 km·h� 1 , increasing by 0.5 km·h �1 every minute (1 minute equals 1 stage). Participants were instructed to run in a straight line, to pivot upon completing a shuttle and to pace themselves in accordance with the time intervals. The test was fi nished when the ado-lescent failed to reach the end lines concurrent with the audio signals on two consecutive occasions. Otherwise, the test ends when the adolescent stops because of fatigue. The fi nal score was computed as the number of stages completed (precision of 0.5 stages).

Socieconomic factors, fi tness and fatness 469
Int J
Ped
iatr
Obe
s D
ownl
oade
d fr
om in
form
ahea
lthca
re.c
om b
y U
nive
rsity
of
Sao
Paul
o on
12/
07/1
1Fo
r pe
rson
al u
se o
nly.
Physical examination
The description of the anthropometric procedures used in the AVENA study, as well as the reference values can be found elsewhere (19,23,24). In brief, weight and height were measured and body mass index was calculated as weight/height squared (kg/m 2 ). Waist circumference was measured using an inelastic tape (range 0–150 cm; precision 1 mm), horizontally midway between the lowest rib margin and the iliac crest, at the end of a gentle expiration. Skinfold thick-nesses were measured to the nearest 0.2 mm in the left side of the body at biceps, triceps, subscapular, suprailiac, thigh, and medial calf using a Holtain skinfold caliper (range: 0 to 40 mm; precision: 0.2 mm). The sum of six skinfold thickness was com-puted. Overall the technical error of measurement (TEMs) intra-observer for skinfold thickness was smaller than 1 mm. Likewise, the TEMs inter-observer ranged from 1 to 2 mm for the six skinfold thicknesses measured. Pubertal stage was estimated following the Tanner and Whitehouse’ method (25).
Socioeconomic factors
Parental educational level . Detailed information about socioeconomic assessment in the AVENA study, as well as the representivity of the AVENA participants in terms of parental educational and professional level, has been previously described (26).
Both parents were asked to fi ll in a questionnaire about their educational level, and the possible answers were: primary school, secondary school/technical training or university training. The minimum train-ing period in the Spanish education system was 8 years for primary school, 4 years for secondary school/technical training and 3 years for university training. These three categories shall be referred to as primary, secondary and university, respectively.
Parental professional level
Parents also answered several questions concerning their current occupation. The questions were adapted from, and classifi ed according to, the recommenda-tions of the Spanish Society of Epidemiology (27). Three categories of parental professional levels were established: unskilled worker/unemployed, skilled worker and managerial. These three categories shall be referred to as low, medium and high professional level, respectively.
Statistical analysis
Data are presented as mean � standard deviation, standard error of the mean or percentages. All the
variables showed a Normal distribution, except for the sum of skinfold thickness that showed a border-line Normal distribution. We calculated the log skinfold and ran the statistical analyses using both log data and raw data. The results were rather sim-ilar, so we decided to show the raw data to facilitate the interpretation. Differences in fi tness and fatness according to SES (education and professional level) groups were examined by one-way analysis of cova-riance (ANCOVA), with parental educational and professional levels as fi xed factors, and fi tness or fatness as dependent variables. Age, height and sum of skinfold thickness were entered as covariates. Effect size statistics is a measure of the magnitude of effect and in this study was assessed using Cohen´s d (standardized mean difference) (28). Taking into account the cut-off established by Cohen, the effect size (Cohen´s d ) can be small ( ∼ 0.2), medium ( ∼ 0.5) or large ( ∼ 0.8). The analyses were performed using the Statistical Package for Social Science (SPSS, v. 15.0 for Windows; SPSS Inc., Chicago, IL) and the level of signifi cance was set to 0.05.
Results
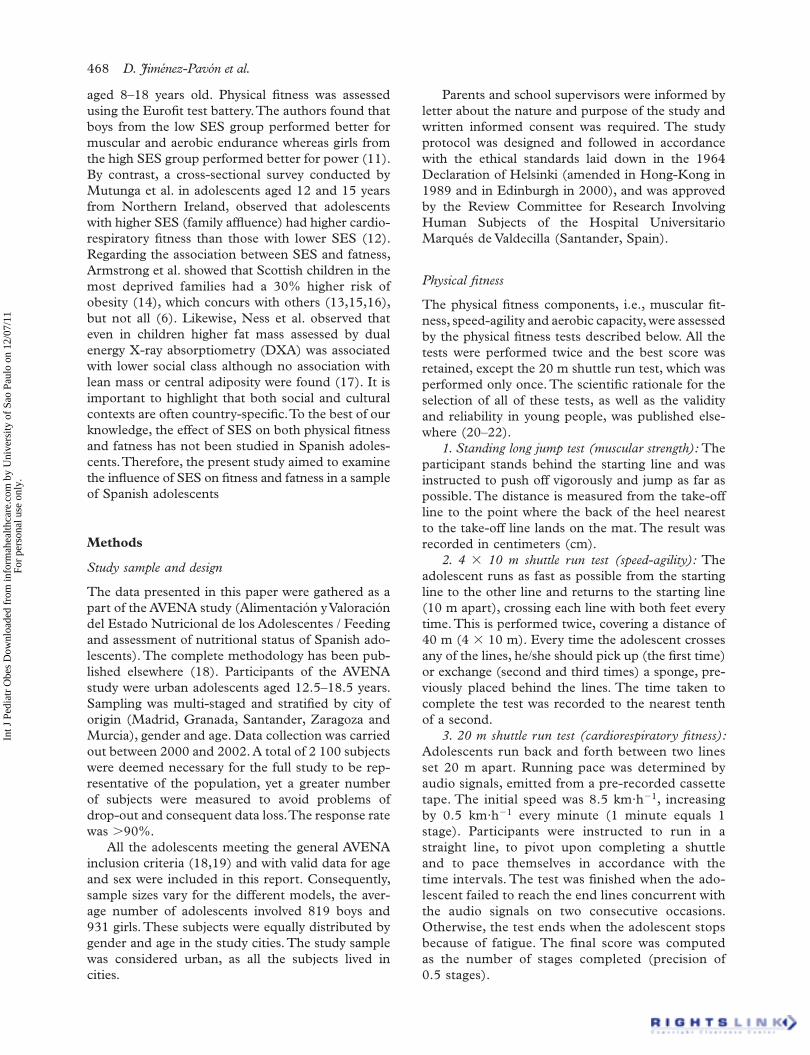
Table I shows descriptive characteristics of the study sample.
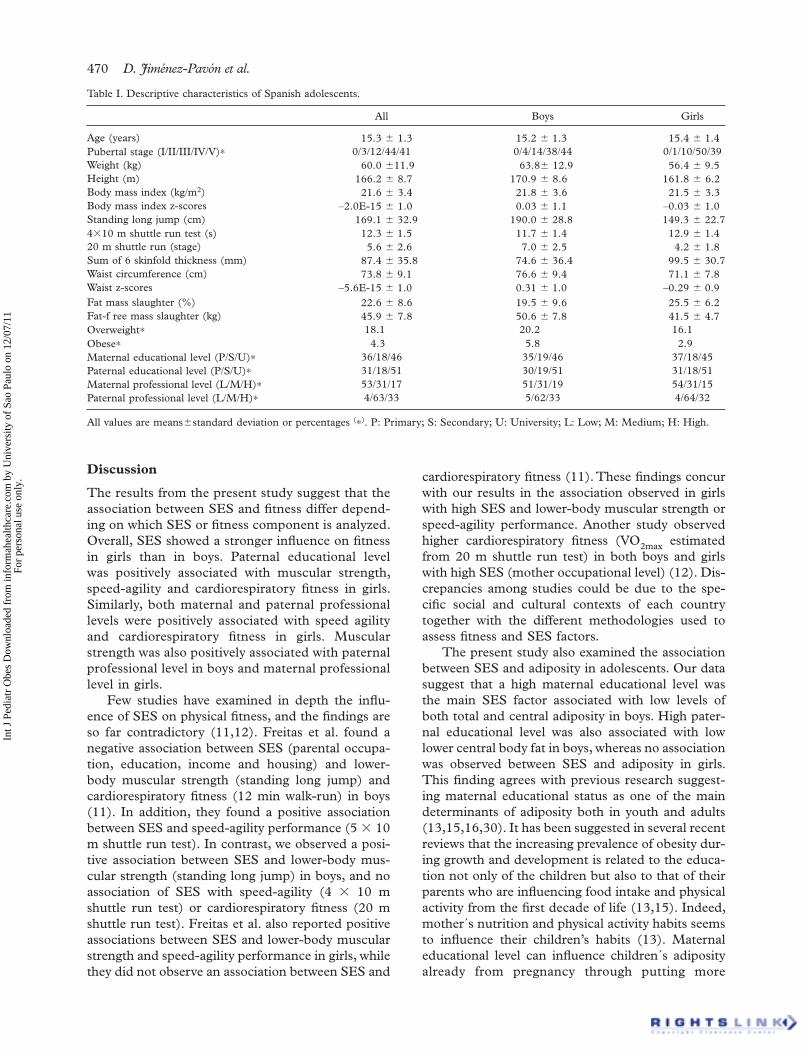
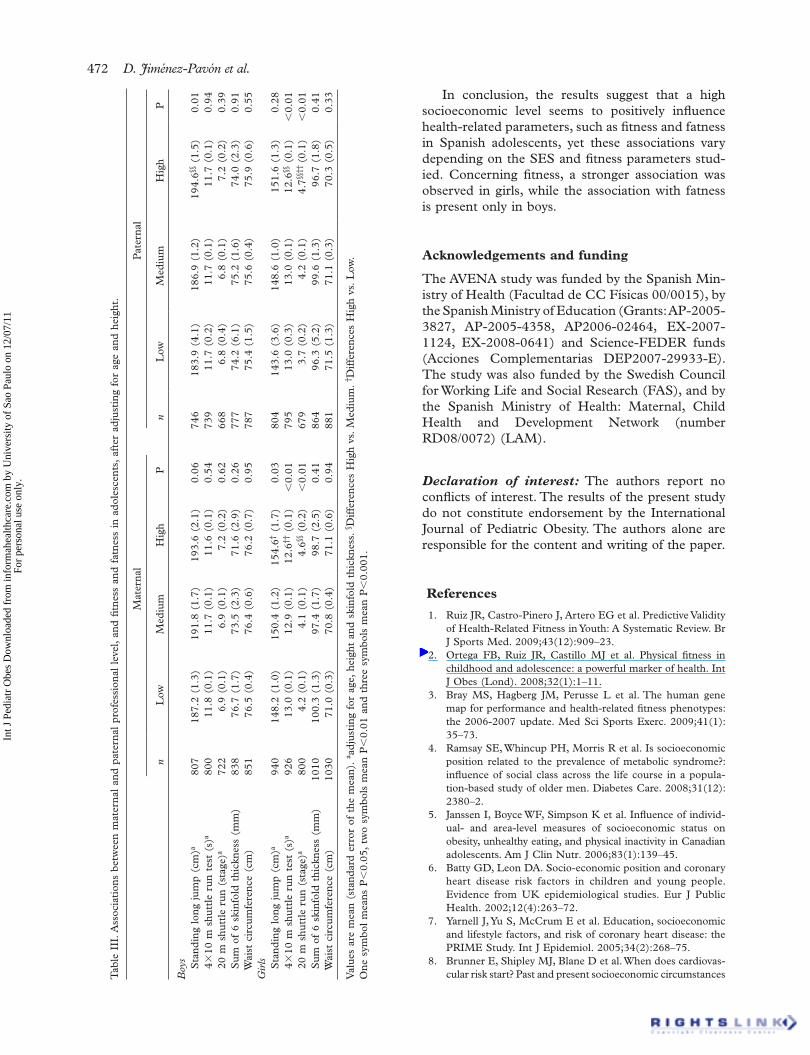
Differences in fi tness and fatness across parental educational and professional levels are displayed in Tables II and III, respectively. Girls with either a higher paternal educational level or maternal professional level showed higher muscular strength (all P � 0.05). Likewise, boys with higher paternal professional level showed higher muscular strength (P � 0.01). Speed-agility and cardiorespiratory fi tness were not associated with either parental educational or professional levels in boys, whereas girls with higher paternal educational level or higher parental professional level had higher levels in these physical fi tness components (all P � 0.01). Higher maternal educational level was associated with lower total and central body fat in boys (all P � 0.05), but not in girls. The associations of SES with speed-agility and cardirespiratory fi tness remained signifi cant after adjusting for multiple comparisons (29).
Additional adjustments for pubertal stage instead of age did not modify the results. In Table II, we observed small effect sizes (Cohen´s d � 0.2 and 0.3 for boys and girls, respectively) for the previous analyses with signifi cant differences. Likewise, in Table III, we observed small effect sizes (Cohen´s d � 0.2 and 0.3 for boys and girls, respectively) and medium effect size (Cohen´s d � 0.6 for girls regard-ing paternal professional level).
470 D. Jiménez-Pavón et al.
All Boys Girls
Age (years) 15.3 � 1.3 15.2 � 1.3 15.4 � 1.4Pubertal stage (I/II/III/IV/V)∗ 0/3/12/44/41 0/4/14/38/44 0/1/10/50/39Weight (kg) 60.0 � 11.9 63.8 � 12.9 56.4 � 9.5Height (m) 166.2 � 8.7 170.9 � 8.6 161.8 � 6.2Body mass index (kg/m 2 ) 21.6 � 3.4 21.8 � 3.6 21.5 � 3.3Body mass index z-scores –2.0E-15 � 1.0 0.03 � 1.1 –0.03 � 1.0Standing long jump (cm) 169.1 � 32.9 190.0 � 28.8 149.3 � 22.74�10 m shuttle run test (s) 12.3 � 1.5 11.7 � 1.4 12.9 � 1.420 m shuttle run (stage) 5.6 � 2.6 7.0 � 2.5 4.2 � 1.8Sum of 6 skinfold thickness (mm) 87.4 � 35.8 74.6 � 36.4 99.5 � 30.7Waist circumference (cm) 73.8 � 9.1 76.6 � 9.4 71.1 � 7.8Waist z-scores –5.6E-15 � 1.0 0.31 � 1.0 –0.29 � 0.9Fat mass slaughter (%) 22.6 � 8.6 19.5 � 9.6 25.5 � 6.2Fat-f ree mass slaughter (kg) 45.9 � 7.8 50.6 � 7.8 41.5 � 4.7Overweight∗ 18.1 20.2 16.1Obese∗ 4.3 5.8 2.9Maternal educational level (P/S/U)∗ 36/18/46 35/19/46 37/18/45Paternal educational level (P/S/U)∗ 31/18/51 30/19/51 31/18/51Maternal professional level (L/M/H)∗ 53/31/17 51/31/19 54/31/15Paternal professional level (L/M/H)∗ 4/63/33 5/62/33 4/64/32
Int J
Ped
iatr
Obe
s D
ownl
oade
d fr
om in
form
ahea
lthca
re.c
om b
y U
nive
rsity
of
Sao
Paul
o on
12/
07/1
1Fo
r pe
rson
al u
se o
nly.
Discussion
The results from the present study suggest that the association between SES and fi tness differ depend-ing on which SES or fi tness component is analyzed. Overall, SES showed a stronger infl uence on fi tness in girls than in boys. Paternal educational level was positively associated with muscular strength, speed-agility and cardiorespiratory fi tness in girls. Similarly, both maternal and paternal professional levels were positively associated with speed agility and cardiorespiratory fi tness in girls. Muscular strength was also positively associated with paternal professional level in boys and maternal professional level in girls.
Few studies have examined in depth the infl u-ence of SES on physical fi tness, and the fi ndings are so far contradictory (11,12). Freitas et al. found a negative association between SES (parental occupa-tion, education, income and housing) and lower-body muscular strength (standing long jump) and cardiorespiratory fi tness (12 min walk-run) in boys (11). In addition, they found a positive association between SES and speed-agility performance (5 � 10 m shuttle run test). In contrast, we observed a posi-tive association between SES and lower-body mus-cular strength (standing long jump) in boys, and no association of SES with speed-agility (4 � 10 m shuttle run test) or cardiorespiratory fi tness (20 m shuttle run test). Freitas et al. also reported positive associations between SES and lower-body muscular strength and speed-agility performance in girls, while they did not observe an association between SES and
cardiorespiratory fi tness (11). These fi ndings concur with our results in the association observed in girls with high SES and lower-body muscular strength or speed-agility performance. Another study observed higher cardiorespiratory fi tness (VO 2max estimated from 20 m shuttle run test) in both boys and girls with high SES (mother occupational level) (12). Dis-crepancies among studies could be due to the spe-cifi c social and cultural contexts of each country together with the different methodologies used to assess fi tness and SES factors.
The present study also examined the association between SES and adiposity in adolescents. Our data suggest that a high maternal educational level was the main SES factor associated with low levels of both total and central adiposity in boys. High pater-nal educational level was also associated with low lower central body fat in boys, whereas no association was observed between SES and adiposity in girls. This fi nding agrees with previous research suggest-ing maternal educational status as one of the main determinants of adiposity both in youth and adults (13,15,16,30). It has been suggested in several recent reviews that the increasing prevalence of obesity dur-ing growth and development is related to the educa-tion not only of the children but also to that of their parents who are infl uencing food intake and physical activity from the fi rst decade of life (13,15). Indeed, mother´s nutrition and physical activity habits seems to infl uence their children’s habits (13). Maternal educational level can infl uence children´s adiposity already from pregnancy through putting more
Table I. Descriptive characteristics of Spanish adolescents.
All values are means � standard deviation or percentages ( ∗ ) . P: Primary; S: Secondary; U: University; L: Low; M: Medium; H: High.

Socieconomic factors, fi tness and fatness 471
Tab
le I
I. A
ssoc
iati
ons
betw
een
mat
erna
l an
d pa
tern
al e
duca
tion
al l
evel
wit
h fi t
ness
and
fat
ness
in
adol
esce
nts,
aft
er a
djus
ting
for
age
and
hei
ght.
Mat
erna
lP
ater
nal
n P
rim
ary
Sec
onda
ryU
nive
rsit
yP
n P
rim
ary
Sec
onda
ryU
nive
rsit
yP
Boy
s S
tand
ing
long
jum
p (c
m) a
873
188.
1 (1
.5)
188.
9 (2
.0)
193.
0 (1
.3)
0.62
860
187.
9 (1
.6)
190.
2 (2
.0)
192.
5 (1
.2)
0.19
4�10
m s
hutt
le r
un t
est
(s) a
862
11.6
(0.
1)11
.8 (
0.1)
11.7
(0.
1)0.
1384
911
.7 (
0.1)
11.7
(0.
1)11
.7 (
0.1)
0.91
20 m
shu
ttle
run
(st
age)
a 78
86.
8 (0
.1)
7.1
(0.1
)7.
2 (0
.2)
0.15
774
6.7
(0.2
)7.
2 (0
.2)
7.1
(0.1
)0.
06S
um o
f 6
skin
fold
thi
ckne
ss (
mm
)90
876
.7 (
2.0)
78.7
(2.
6)71
.0§§
(1.
7)0.
0289
575
.4 (
2.1)
77.7
(2.
7)71
.8 (
1.7)
0.14
Wai
st c
ircu
mfe
renc
e (c
m)
920
76.4
(0.
5)77
.8 (
0.7)
75.9
§§ (
0.4)
0.01
906
76.6
(0.
5)77
.7 (
0.7)
75.6
(0.
4)0.
04 G
irls Sta
ndin
g lo
ng j
ump
(cm
) a 10
0114
7.4
(1.1
)14
9.5
(1.6
)15
1.7
(1.0
)0.
1197
014
6.2
(1.2
)15
0.8
(1.5
)15
1.5††
(1.
0)0.
024�
10 m
shu
ttle
run
tes
t (s
) a 96
813
.0 (
0.1)
12.9
(0.
1)12
.8 (
0.1)
0.16
946
13.1
(0.
1)13
.0 (
0.1)
12.7
†††
(0.1
) �
0.00
120
m s
hutt
le r
un (
stag
e) a
854
4.2
(0.1
)4.
3 (0
.1)
4.4
(0.1
) 0.
3283
03.
9 (0
.1)
4.6∗∗
(0.
1)4.
4†† (
0.1)
0.00
1S
um o
f 6
skin
fold
thi
ckne
ss (
mm
)10
7599
.5 (
1.5)
98.6
(2.
2)97
.9 (
1.3)
0.72
1043
100.
8 (1
.7)
97.2
(2.
2)98
.6 (
1.3)
0.39
Wai
st c
ircu
mfe
renc
e (c
m)
1093
71.1
(0.
4)70
.6 (
0.6)
70.6
(0.
3)0.
57 1
062
71.6
(0.
4)70
.3 (
0.6)
70.8
(0.
3)0.
15
Val
ues
are
mea
n (s
tand
ard
erro
r of
the
mea
n).
a adj
usti
ng f
or a
ge,
heig
ht a
nd s
kinf
old
thic
knes
s.∗ D
iffe
renc
es S
econ
dary
vs
Pri
mar
y. § D
iffe
renc
es U
nive
rsit
y vs
. S
econ
dary
. † D
iffe
renc
es U
nive
rsit
y V
s pr
imar
y.
One
sym
bol
indi
cate
s P
� 0.
05,
two
sym
bols
ind
icat
es P
� 0.
01 a
nd t
hree
sym
bols
ind
icat
es P
� 0.
001 .
Int J
Ped
iatr
Obe
s D
ownl
oade
d fr
om in
form
ahea
lthca
re.c
om b
y U
nive
rsity
of
Sao
Paul
o on
12/
07/1
1Fo
r pe
rson
al u
se o
nly.
attention on the selection of the appropriate diet during this period and also with regard to the dura-tion of breast-feeding (13,15).
We did not fi nd any empirical evidence to justify the stronger association observed in girls, compared with boys, in the association between SES and fi tness. However, we can hypothesize about this. The different social and cultural roles attrib-uted to boys and girls may at least partially explain this fi nding. Girls from a low SES environment may have a role more related with home tasks or indoor entertainment activities; while boys in this same SES environment spend more time doing outdoor activities, such as running, jumping, play-ing football, etc. On the other hand, high SES families may have a higher awareness about healthy lifestyle, physical activity and fi tness, and promote these behaviors equally in both daughters and sons. This may result in bigger differences in fi tness between girls from different SES than between boys from different SES, and explain therefore the stron-ger association between SES and fi tness observed in girls.
We studied the association between maternal educational level and total and central (waist circum-ference) body fat in Swedish children and adoles-cents, and observed a borderline association between maternal educational level and the risk of being over-weight (31). In agreement with our results a previous study showed that Scottish children in the most deprived families had a 30% higher risk of obesity (14). In contrast, others concluded that there was little evidence of an association between adiposity and SES in children (6).
The small effect size observed for the associations of SES with fi tness and fatness could be due to the multifactorial aetiology of adolescent fi tness and fat-ness status. Cross-sectional designs usually do not enable identifi cation of the direction of the associa-tions. However, in the current work is not likely that adolescent’s fi tness and fatness levels could infl uence their parents’ educational or professional level. So, the results from this study can be interpreted as the infl uence of SES on fi tness and fatness, rather than the other way around. Another limitation of the pres-ent study was the use of proxy measures for fatness instead of using more accurate methods, such as DXA. In fi tness fi eld tests participant´s motivation can skew the fi nal performance, so in the present study researchers strongly encouraged the adoles-cents during the tests in order to avoid this effect. The relatively large sample of adolescents from Southern, Central and Northern Spain studied in this work provides an overall picture of the relation-ships between SES, fi tness and fatness in the Spanish adolescent population.
472 D. Jiménez-Pavón et al.
Tab
le I
II. A
ssoc
iati
ons
betw
een
mat
erna
l an
d pa
tern
al p
rofe
ssio
nal
leve
l, an
d fi t
ness
and
fat
ness
in
adol
esce
nts,
aft
er a
djus
ting
for
age
and
hei
ght.
Mat
erna
lP
ater
nal
nL
owM
ediu
mH
igh
P
nL
owM
ediu
mH
igh
P
Boy
s
Sta
ndin
g lo
ng j
ump
(cm
) a 80
718
7.2
(1.3
)19
1.8
(1.7
)19
3.6
(2.1
)0.
0674
618
3.9
(4.1
)18
6.9
(1.2
)19
4.6§§
(1.
5)0.
01
4�10
m s
hutt
le r
un t
est
(s) a
800
11.8
(0.
1)11
.7 (
0.1)
11.6
(0.
1)0.
5473
911
.7 (
0.2)
11.7
(0.
1)11
.7 (
0.1)
0.94
20
m s
hutt
le r
un (
stag
e) a
722
6.9
(0.1
)6.
9 (0
.1)
7.2
(0.2
)0.
6266
86.
8 (0
.4)
6.8
(0.1
)7.
2 (0
.2)
0.39
S
um o
f 6
skin
fold
thi
ckne
ss (
mm
)83
876
.7 (
1.7)
73.5
(2.
3)71
.6 (
2.9)
0.26
777
74.2
(6.
1)75
.2 (
1.6)
74.0
(2.
3)0.
91
Wai
st c
ircu
mfe
renc
e (c
m)
851
76.5
(0.
4)76
.4 (
0.6)
76.2
(0.
7)0.
9578
775
.4 (
1.5)
75.6
(0.
4)75
.9 (
0.6)
0.55
Gir
ls
Sta
ndin
g lo
ng j
ump
(cm
) a 94
014
8.2
(1.0
)15
0.4
(1.2
)15
4.6†
(1.7
)0.
0380
414
3.6
(3.6
)14
8.6
(1.0
)15
1.6
(1.3
)0.
28
4�10
m s
hutt
le r
un t
est
(s) a
926
13.0
(0.
1)12
.9 (
0.1)
12.6
†† (
0.1)
� 0.
0179
513
.0 (
0.3)
13.0
(0.
1)12
.6§§
(0.
1) �
0.01
20
m s
hutt
le r
un (
stag
e) a
800
4.2
(0.1
)4.
1 (0
.1)
4.6§§
(0.
2) �
0.01
679
3.7
(0.2
)4.
2 (0
.1)
4.7§§
†† (
0.1)
� 0.
01
Sum
of
6 sk
info
ld t
hick
ness
(m
m)
1010
100.
3 (1
.3)
97.4
(1.
7)98
.7 (
2.5)
0.41
864
96.3
(5.
2)99
.6 (
1.3)
96.7
(1.
8)0.
41
Wai
st c
ircu
mfe
renc
e (c
m)
1030
71.0
(0.
3)70
.8 (
0.4)
71.1
(0.
6)0.
94 8
8171
.5 (
1.3)
71.1
(0.
3)70
.3 (
0.5)
0.33
Val
ues
are
mea
n (s
tand
ard
erro
r of
the
mea
n).
a adj
usti
ng f
or a
ge,
heig
ht a
nd s
kinf
old
thic
knes
s. § D
iffe
renc
es H
igh
vs.
Med
ium
. † D
iffe
renc
es H
igh
vs.
Low
. O
ne s
ymbo
l m
eans
P �
0.05
, tw
o sy
mbo
ls m
ean
P �
0.01
and
thr
ee s
ymbo
ls m
ean
P �
0.00
1.
Int J
Ped
iatr
Obe
s D
ownl
oade
d fr
om in
form
ahea
lthca
re.c
om b
y U
nive
rsity
of
Sao
Paul
o on
12/
07/1
1Fo
r pe
rson
al u
se o
nly.
In conclusion, the results suggest that a high socioeconomic level seems to positively infl uence health-related parameters, such as fi tness and fatness in Spanish adolescents, yet these associations vary depending on the SES and fi tness parameters stud-ied. Concerning fi tness, a stronger association was observed in girls, while the association with fatness is present only in boys.
Acknowledgements and funding
The AVENA study was funded by the Spanish Min-istry of Health (Facultad de CC Físicas 00/0015), by the Spanish Ministry of Education (Grants: AP-2005-3827, AP-2005-4358, AP2006-02464, EX-2007-1124, EX-2008-0641) and Science-FEDER funds (Acciones Complementarias DEP2007-29933-E). The study was also funded by the Swedish Council for Working Life and Social Research (FAS), and by the Spanish Ministry of Health: Maternal, Child Health and Development Network (number RD08/0072) (LAM).
Declaration of interest: The authors report no confl icts of interest. The results of the present study do not constitute endorsement by the International Journal of Pediatric Obesity. The authors alone are responsible for the content and writing of the paper.
References
Ruiz JR, Castro-Pinero J, Artero EG et al. Predictive Validity 1. of Health-Related Fitness in Youth: A Systematic Review. Br J Sports Med. 2009; 43(12):909 – 23 . Ortega FB, Ruiz JR, Castillo MJ et al. Physical fi tness in 2. childhood and adolescence: a powerful marker of health. Int J Obes (Lond). 2008;32(1):1–11. Bray MS, Hagberg JM, Perusse L et al. The human gene 3. map for performance and health-related fi tness phenotypes: the 2006-2007 update. Med Sci Sports Exerc. 2009;41(1):35–73. Ramsay SE, Whincup PH, Morris R et al. Is socioeconomic 4. position related to the prevalence of metabolic syndrome?: infl uence of social class across the life course in a popula-tion-based study of older men. Diabetes Care. 2008;31(12): 2380–2. Janssen I, Boyce WF, Simpson K et al. Infl uence of individ-5. ual- and area-level measures of socioeconomic status on obesity, unhealthy eating, and physical inactivity in Canadian adolescents. Am J Clin Nutr. 2006;83(1):139–45. Batty GD, Leon DA. Socio-economic position and coronary 6. heart disease risk factors in children and young people. Evidence from UK epidemiological studies. Eur J Public Health. 2002;12(4):263–72. Yarnell J, Yu S, McCrum E et al. Education, socioeconomic 7. and lifestyle factors, and risk of coronary heart disease: the PRIME Study. Int J Epidemiol. 2005;34(2):268–75. Brunner E, Shipley MJ, Blane D et al. When does cardiovas-8. cular risk start? Past and present socioeconomic circumstances

Socieconomic factors, fi tness and fatness 473
Int J
Ped
iatr
Obe
s D
ownl
oade
d fr
om in
form
ahea
lthca
re.c
om b
y U
nive
rsity
of
Sao
Paul
o on
12/
07/1
1Fo
r pe
rson
al u
se o
nly.
and risk factors in adulthood. J Epidemiol Community Health. 1999;53(12):757–64. Power C, Graham H, Due P et al. The contribution of child-9. hood and adult socioeconomic position to adult obesity and smoking behaviour: an international comparison. Int J Epi-demiol. 2005;34(2):335–44. Regidor E, Banegas JR, Gutierrez-Fisac JL et al. Socio-10. economic position in childhood and cardiovascular risk factors in older Spanish people. Int J Epidemiol. 2004;33 (4):723–30. Freitas D, Maia J, Beunen G et al. Socio-economic status, 11. growth, physical activity and fi tness: the Madeira Growth Study. Ann Hum Biol. 2007;34(1):107–22. Mutunga M, Gallagher AM, Boreham C et al. Socioeco-12. nomic differences in risk factors for obesity in adolescents in Northern Ireland. Int J Pediatr Obes. 2006;1(2):114–9. Parizkova J. Impact of education on food behaviour, body 13. composition and physical fi tness in children. Br J Nutr. 2008;99 Suppl 1:S26–32. Armstrong J, Dorosty AR, Reilly JJ et al. Coexistence of 14. social inequalities in undernutrition and obesity in preschool children: population based cross sectional study. Arch Dis Child. 2003;88(8):671–5. Moreno LA, Tomas C, Gonzalez-Gross M et al. Micro-15. environmental and socio-demographic determinants of childhood obesity. Int J Obes Relat Metab Disord. 2004;28 Suppl 3:S16–20. Shrewsbury V, Wardle J. Socioeconomic status and adiposity 16. in childhood: a systematic review of cross-sectional studies 1990-2005. Obesity (Silver Spring). 2008;16(2):275–84. Ness AR, Leary S, Reilly J et al. The social patterning of fat 17. and lean mass in a contemporary cohort of children. Int J Pediatr Obes. 2006;1(1):59–61. Gonzalez-Gross M, Castillo MJ, Moreno L et al. [Feeding 18. and assessment of nutritional status of spanish adolescents (AVENA study). Evaluation of risks and interventional pro-posal. I.Methodology]. Nutr Hosp. 2003;18(1):15–28. Moreno LA, Joyanes M, Mesana MI et al. Harmonization of 19. anthropometric measurements for a multicenter nutrition survey in Spanish adolescents. Nutrition. 2003;19(6):481–6. Ortega FB, Artero EG, Ruiz JR et al. Reliability of health-20. related physical fi tness tests in European adolescents. The
HELENA Study. Int J Obes (Lond). 2008;32 Suppl 5:S49–57. Ruiz JR, Ortega FB, Gutierrez A et al. Health-related fi tness 21. assessment in childhood and adolescence: a European approach based on the AVENA, EYHS and HELENA studies. J Public Health. 2006;14(5):269–77. Castro-Piñero J, Artero EG, Espana-Romero V et al. 22. Criterion-related validity of fi eld-based fi tness tests in youth: A systematic review. Br J Sports Med. 2009 Apr 12. [Epub ahead of print] Moreno LA, Mesana MI, Gonzalez-Gross M et al. Anthro-23. pometric body fat composition reference values in Spanish adolescents. The AVENA Study. Eur J Clin Nutr. 2006;60 (2):191–6. Moreno LA, Mesana MI, Gonzalez-Gross M et al. Body fat 24. distribution reference standards in Spanish adolescents: the AVENA Study. Int J Obes (Lond). 2007;31(12):1798–805. Tanner JM, Whitehouse RH. Clinical longitudinal standards 25. for height, weight, height velocity, weight velocity, and stages of puberty. Arch Dis Child. 1976;51(3):170–9. Chillon P, Ortega FB, Ruiz JR et al. Socio-economic factors 26. and active commuting to school in urban Spanish ado-lescents: the AVENA study. Eur J Public Health. 2009 ;19 (5):470 – 6 . Álvarez-Dardet C, Alonso J, Domingo A et al. La medición 27. de la clase social en ciencias de la salud. Informe de un grupo de trabajo de la Sociedad Española de Epidemiología [The measurement of social class in health sciences. Report of a working group of the Spanish Society of Epidemiology]. Barcelona: S G Editores; 1995. Nakagawa S, Cuthill IC. Effect size, confi dence interval and 28. statistical signifi cance: a practical guide for biologists. Biol Rev Camb Philos Soc. 2007;82(4):591–605. Holm S. A simple sequentially rejective multiple test proce-29. dure. Scand J Statist. 1997;6:65–70. Kaplan GA, Keil JE. Socioeconomic factors and cardiovas-30. cular disease: a review of the literature. Circulation. 1993;88(4 Pt 1):1973–98. Ortega FB, Ruiz JR, Sjostrom M. Physical activity, over-31. weight and central adiposity in Swedish children and adoles-cents: the European Youth Heart Study. Int J Behav Nutr Phys Act. 2007;4:61.
Copyright © 2022 FDOKUMEN