Notes and communications: The Tail-Fatness of FX Returns Reconsidered
Upload
khangminh22Category
view
1download
0
DETERMINANTS OF BODY FATNESS IN YOUNG
ADULTS LIVING IN A DUTCH COMMUNITY
CENTRALE LANDBOUWCATALOGUS
OOOO 0086 6349
Promotor: dr. J.G.A.J. Hautvast, hoogleraar in de leer van de voeding en de
voedselbereiding.
M M O 2 2 Ö \ }°I2.V
J.A.H. Baecke
DETERMINANTS OF BODY FATNESS IN YOUNG ADULTS LIVING IN A DUTCH COMMUNITY
PROEFSCHRIFT
TER VERKRIJGING VAN DE GRAAD VAN
DOCTOR IN DE LANDBOUWWETENSCHAPPEN,
OP GEZAG VAN DE RECTOR MAGNIFICUS,
DR. C.C. OOSTERLEE,
HOOGLERAAR IN DE VEETEELTWETENSCHAP,
IN HET OPENBAAR TE VERDEDIGEN
OP VRIJDAG 17 DECEMBER 1982
DES NAMIDDAGS TE VIER UUR IN DE AULA
VAN DE LANDBOUWHOGESCHOOL TE WAGENINGEN.
U \]s p^H 1?9H -c?b

Het onderzoek werd mede mogelijk gemaakt door steun van het Praeventiefonds.

^ooi2D\t W
STELLINGEN
1. Bij de behandeling van overgewicht moet er rekening mee gehouden worden
dat veel zware personen reeds minder eten dan lichtere personen terwijl
ze niet minder lichamelijk actief zijn.
Dit proefschrift.
2. Een reductie van de dagelijkse energie-opname bij jong volwassen mannen
is wenselijk.
Dit proefschrift.
3. Het argument dat men vanwege een grovere skeletbouw bij een bepaalde
lengte zwaarder mag zijn, is zelden van toepassing.
Dit proefschrift
4. De groep jong volwassen vrouwen is qua lichamelijke activiteit zo homogeen
dat hierdoor verschillen in energie-opname niet kunnen worden verklaard.
Dit proefschrift.
5. Nationale campagnes die tot doel hebben het gemiddelde lichaamsgewicht van
de bevolking te verlagen zijn niet gewenst.
Berger M, Berchtold P, Gries A & Zimmermann H. In: Björntorp P, Cairella M, Howard AN, eds. Recent advances in obesity research III. London: John Libbey, 1981:1-9.
6. Bij de bestudering van de relatie tussen voedingsvezel en de gezondheids
toestand in observationeel onderzoek dient rekening gehouden te worden met
de reële mogelijkheid dat de hoeveelheid voedingsvezel opname een indicator
is voor gezond gedrag in het algemeen.
7. De structuur van zowel bedrijfs- als jeugdgezondheidszorg zijn bijzonder
geschikt voor het uitvoeren van epidemiologisch onderzoek.
3. Afslankthee en -enzymen maken het gesuggereerde effect niet waar.
). Een hoge beheersdrempel is te prefereren boven een hoge verkeersdrempel.
). Een schaatsenrijder heeft op de 500 meter deze afstand niet nodig om
reglementair de eindstreep te halen.
roefschrift J.A.H. Baecke
^terminants of body fatness in young adults living in a Dutch community
igeningen, 17 december 1982.

CONTENTS
Voorwoord
Chapter 1
Chapter 2
Chapter 3
Chapter 4
Chapter 5
Chapter 6
Introduction
Obesity in young Dutch adults:
I, socio-demographic variables and
body mass index.
Int.J.Obesity, in press
Obesity in young Dutch adults:
II, daily life-style and body mass index.
Int.J.Obesity, in press
Body fatness, relative weight and frame
size in young adults.
Br.J.Nutr. 1982l48:l-6
A short questionnaire for the measurement
of habitual physical activity in
epidemiological studies.
Am.J.Clin.Nutr., in press
Food consumption, habitual physical activity
and body fatness in young Dutch adults.
Am.J.Clin.Nutr., in press
Chapter 7 General discussion
Summary
Samenvatting
Curriculum vitae
Page
6
9
23
39
55
65
79
97
108
110
112

VOORWOORD
In dit proefschrift worden enkele onderzoeken beschreven naar de relatie
tussen enerzijds socio-demografische kenmerken en het leefpatroon en ander
zijds het lichaamsvetpercentage. Speciale aandacht is besteed aan voedsel -
consumptie en lichamelijke activiteit. Het onderzoek werd uitgevoerd in de
gemeente Ede door medewerkers van de vakgroep Humane Voeding van de Landbouw
hogeschool , financieel gesteund door het Praeventiefonds.
Van de vele mensen die mij bij dit onderzoek hebben geholpen, wil ik een
aantal met name noemen. In de eerste plaats gaat mijn dank uit naar mijn
promotor Prof.dr. J.G.A.J. Hautvast voor zijn talrijke adviezen bij dit
onderzoek. Van bijzonder belang zijn ook geweest de vele discussies met
Jan Burema, Paul Deurenberg, Jan Frijters, René Roosen en Wija van Staveren.
Zij leverden allen een belangrijke bijdrage in de verschillende fasen van het
onderzoek op basis van hun specifieke deskundigheid.
De administratieve en organisatorische ondersteuning was in bekwame handen
van Wil Knuiman en Helmi van der Wiel, terwijl de statistische analyses op
adequate wijze werden uitgevoerd door Jan Burema en Ben Schölte. Aan de samen
werking met hen heb ik prettige herinneringen.
Veel dank ben ik verschuldigd aan de diëtistes Netty van Kaathoven,
Geesje Sanderink en Jeanne de Vries. Zij hebben de voedingsgegevens op nauwge
zette wijze verzameld. Bij het overige veldwerk waren Klarie Baerends,
Veronica van de Braak, Marjan van Item, Brigit Janssen, Mathilde Kraetzer,
Hel ma Nijenhuis, Eveline Oosterhaven, Geesje Sanderink, Susan Vermaat en
Helmi van der Wiel nauw betrokken. Hun inzet was geweldig.
De hulp van Piet Middelburg bij de financiële aspecten en de assistentie
van Bert Gundlach bij de technische problemen, waren met name bij de voorbe
reiding van de verschillende deelonderzoeken steeds van grote waarde.
De co-auteurs van de verschillende artikelen, die in dit proefschrift zijn
opgenomen, dank ik voor de vruchtbare discussies en het kritisch doorlezen van
de manuscripten.
Bestuurders van de gemeente Ede ben ik dank verschuldigd voor het ter
beschikking stellen van het gevraagde adressenbestand. De contacten met mede
werkers van de afdeling Bevolking heb ik als plezierig ervaren. En wat zeker

niet onvermeld mag blijven is dat zonder de enthousiaste medewerking van een
groot aantal inwoners van de gemeente Ede dit onderzoek niet mogelijk was
geweest.
Het Engels is op zorgvuldige wijze gecorrigeerd door Helen West en het
typewerk van dit proefschrift is op voortreffelijke wijze verzorgd door Riet
Hoogkamer.
Veel dank ben ik verschuldigd aan mijn vrouw Miek voor haar stimulerend
enthousiasme en haar inzet die het mij mogelijk maakten aan de tot stand koming
van dit proefschrift te werken.
Tot slot wil ik ook aldiegenen die op een of andere wijze aan dit onder
zoek hebben bijgedragen en die ik hier niet heb kunnen noemen, dank zeggen.
Wageningen, najaar 1982 j o s Baecke

1 INTRODUCTION
In 1979, the Department of Human Nutrition of the Agricultural University
in Wageningen began a research project on obesity in young adults. The main
objectives of this project are the investigation of aetiological aspects and
health consequences of obesity. It is a prospective study being carried out in
the Municipality of Ede. Other Dutch studies have shown that the prevalence of
obesity appears to be much higher in the middle-aged than in children and
adolescents (1,2), suggesting that the age range, 20-40 years, is a critical
period for the development of obesity. Therefore, this study is being carried
out in a young adult population.
This thesis describes the investigations carried out in the first part of
this research project which deals with the study of the relationship between
socio-demographic variables and daily life-style on the one hand and body
fatness on the other. Attention has been paid to food consumption and habitual
physical activity, in particular. In addition, two methodological studies
concerning relative weight and habitual physical activity are reported. In this
chapter, a general survey is given of current methods of measuring body fatness,
and the health consequences and aetiology of obesity are also surveyed. A model
for the aetiology of obesity is presented and a brief outline is given of the
studies described in this thesis.
BODY FATNESS
The human body can be considered as being divided into three compartments:
cell mass, extra cellular supporting tissue, and fat (3). The cell mass is the
active tissue of the body. Extra cellular supporting tissue, supporting the
cell mass, consists of blood plasma, lymph and fluid which bathes the cells,
and minerals and protein fibres in the skeleton and other supporting tissue.
Fat is the energy reserve held in adipose tissue beneath the skin and around
internal organs. There are well established indirect methods for estimating
the fat content of an individual. These methods are all based on the principle
that the body can, in theory, be divided into two compartments; the lean body
mass, and the fat mass. The lean body mass consists of the cell mass and extra
10
cellular supporting tissue mentioned above.
Fat mass differs from lean body mass, because it contains practically no 3
water and potassium, and has a relatively low density (approximately 900 kg/m ). Lean body mass on the other hand, has a water content of approximately 72%, a
potassium content of approximately 65 mEq/kg and a density of approximately q
1100 kg/m (4). Current laboratory methods of estimating the fat mass are based
on these values. By measuring either total body water, total body potassium, or
body density, it is possible to estimate the proportion of the body which is
fat, and the proportion which is lean body mass. Lean subjects, for example,
have a relatively high content of body water and potassium per kg body weight,
and a relatively high body density. Since these methods of estimating body
fatness are obviously time-consuming and complicated, they cannot be used in
large-scale epidemiological studies. Only the plethysmometric method, in which
body volume is measured by pressure changes in a closed chamber (5) may be an
exception.
Relative weight, based on body weight and body height, is often used as an
indicator for body fatness. Two criteria must be considered in the choice of an
index of relative weight (6). Firstly, the index should be relatively
independent of body height, because there is a priori no reason to believe that
in the general population taller subjects are either leaner or fatter than
shorter subjects. Secondly, the correlation between the index and body fatness
should be as high as possible. There are two types of indices of relative
weight which are independent of body height. The first is of the form
body weight/body heighr (W/H^) in which p is the exponent which makes the
index independent of body height. This exponent can be calculated quite simply
(7). In the second type, actual body weight is expressed as a percentage of the
average body weight of a standard population of the same body height.
A disadvantage of the latter type of indices of relative weight is that
different standards are used thus making comparisons between studies difficult.
If the exponent p of the first type of indices is restricted to an integer 2
value, then W/H which was originally described by Quetelet and referred to as the Quetelet index or body mass index (BMI), is closest to meeting the
criterion of independence of body height in adults (6,8).
A general disadvantage of all indices of relative weight is that they do
not differentiate between overweight caused by an excess of lean body mass, and
overweight caused by an excess of fat (9). Therefore, skinfold thicknesses have
often been used as a simple measure of body fat. The use of the skinfold method
depends on the assumption that the subcutaneous fat constitutes a constant, or

11
at least predictable, proportion of the total body fat. Special calipers have
been designed for measuring skinfold thicknesses. Measurements taken at
several sites on the body can be combined to give an index of body fatness and
correlate well with the determination of the total body fat from body density
measurements (10).
The average proportion of fat in the human body differs between males and
females. In young adult males, about 15-18% of body weight is fat, while in
females about 20-25% of body weight is fat (11). The condition in which there
is an excessive amount of body fat, is referred to as obesity. However, the
question remains as to when is there an 'excessive' amount of body fat. This
implies that there is a certain point in body fatness above which there is an
extra risk of physical and/or psychological health problems. In the next
paragraph some attention is paid to these health consequences.
HEALTH CONSEQUENCES OF OBESITY
Extensive data on the relationship between body build and mortality has
been collected by life insurance companies in North America from individual
policy holders. The Build and Blood Pressure Study reported in 1959, was based
on the records of 4.9 million people over a period of 20 years from 1935. This
study has had an enormous impact on the attitudes to obesity of both the
medical community and the general public (12). It was calculated that there is,
in fact, a consistent gradient (linear) advance in mortality with increasing
degree of overweight. However, a critical re-evaluation of these data by
Seltzer (13) in 1966 showed the existence of a U-shape relationship (Fig. 1).
There does not appear to be a significant increase in mortality until a BMI of 2
about 30 kg/m is reached at which point the rise in the mortality ratio
becomes considerable.
This critical interpretation which has been largely neglected in the past
is in accordance with prospective scientific studies on the relationship
between relative weight and mortality. At present data of these studies'are
becoming increasingly available. In several studies, a quadratic relationship
between mortality from all causes and relative weight has been observed (14-16),
which suggests that mortality is lowest in those of average weight and is
increased in people weighing more or less than average. Keys concluded that
risk increases substantially only at the extremes of under- and overweight (17).

12
mortality ratio 250n
200
150
100
50
0 15 20 25 30 35 40
body mass index (kg/m2 )
FIG. 1. The relationship between mortality ratio and body mass index adapted from data from the Build and Blood Pressure Study of 1959 (13). Average mortality is 100.
It should be stated, however, that these studies were carried out mainly in
middle-aged populations. There is some evidence from prospective studies,
which also included younger age categories, that excess mortality risk is
particularly apparent in obesity occurring before the age of 45 years (15,18,19),
Life insurance data also support these findings in younger populations (13,20).
Coronary heart disease appears to be the major factor in the higher
mortality of those who are overweight (15). This can be explained by the fact
that relative weight is positively related to risk factors of cardiovascular
diseases such as blood pressure and serum cholesterol (17,21,22). Weight gain
can also lead to rise in atherogenic traits and weight loss to a decline
(21,23). It has been shown that the effect of relative weight on the incidence
of cardiovascular disease is mediated to a large extent by blood pressure,
impaired glucose tolerance and serum cholesterol (24). Thus, obesity is probably
not an important independent coronary risk factor, but, in any case, grossly
obese people can be considered at coronary risk due to high prevalence of
primary risk factors.
Other diseases which are less prevalent than cardiovascular disease have
also been observed to be related to obesity. Diabetes mellitus is a well-
-recognized complication of obesity and gallstones also appear to be closely
related to obesity (25). Other related physical health problems are
musculoskeletal disorders particularly those involving the weight-bearing

13
joints, ventilation disorders, and surgical and anaesthetical risks (26). The
definition of obesity should also include degrees of overweight which are known
to increase the morbidity of those diseases mentioned above. As at present
insufficient quantitative information is available with respect to the
relationship between body fatness and morbidity (12), a definition of obesity
can be based only on the relationship between body fatness and mortality.
In fact, an operational definition of obesity should also be based on data
available on the psychosocial consequences of obesity, but in regard to this
there are again only few studies from which conclusions can be drawn (26). The
most salient psychosocial consequence of obesity known at present is the effect
on the individual's self-concept and emotional well-being (27). If psycho-
pathology is related to obesity, it may arise from society's reaction to body
fatness (27). There is some evidence to suggest that there is a negative
attitude to obesity in western society (27,28). This may be based on the
presumption that obese people are responsible for their physical deviance (28).
It can be concluded from the studies on the relationship between mortality
and relative weight that it is desirable to consider an excess in body weight
of about 20 to 25% above the present average weight standards as a pathological
disorder which requires intervention (12). This parallels a BMI of about 2
30.0 kg/m , which has generally been accepted as the cut-off point for severe ?
obesity (11,29). A BMI of 30.0 kg/m corresponds to a percentage of body fat of
about 28 in males and 37 in females (8). On the basis of this definition, 5-10%
of the western adult population would be considered to be obese (29-31). There 2
is little evidence that a BMI of between 25.0 and 29.9 kg/m , which can be
considered to be moderately obese, carries significant health hazards. This may
not be the case in younger people as already mentioned. Therefore, it seems
justified that some action should be taken regarding moderate obesity in younger
people. It is clear that treatment of moderate obesity is also indicated if
health problems are present which can be improved by weight reduction such as
hypertension (12,32).
AETIOLOGY OF OBESITY
Obesity occurs only when the intake of food is in excess of physiological
needs during a certain period of time. The physiological needs, which parallel
the energy output and energy for growth, depend directly on metabolic rate and
the amount of physical activity. In research on obesity, not only energy intake

14
and output but also their determinants should be studied. Only by understanding
the aetiology of obesity in detail will it be possible to develop successful
methods for its prevention and treatment.
Obesity is clearly multiple determined and it derives from the contribution
and interaction of genetic, biological, psychological and environmental factors.
It often runs in families, which suggests that genetic factors are important
determinants of obesity; however, it is difficult to separate genetic from
environmental factors. In the Tecumseh Community Health Survey, evidence was
found for long-term synchrony of body fatness change in husbands and wives (33).
They are genetically unrelated subjects living together under very similar
circumstances. In a study using data from families with biologically unrelated
children, and from families with biologically related children, the effects of
family environment and heredity were distinguished (34). It appeared that
family environment was more important in determining obesity in children than
heredity. If genetic factors partially determine the development of obesity
their influence will act through the central nervous system. Genes may also
have a direct effect on the metabolic rate and on the proliferation of fat
tissue (35).
In general, biological factors such as metabolic rate and morphology of fat
tissue, have received more attention in research on obesity than the genetic
factors. While there appear to be several factors which affect metabolic rate
(36), research on the aetiology of obesity is mainly focused on the effect of
food intake on metabolic rate. A decrease in metabolic rate has been observed
in people on a restricted diet (37,38). This phenomenon is in accordance with
the frequently observed smaller weight loss than expected in people who are
slimming. A similar trend has been observed in cases of overeating; weight
gain often appears to be smaller than expected from the positive energy
balance. Possible explanations of this observation have been summarized (39).
One of the most feasible seems to be an increase in metabolic rate. Another is
change in body composition, so that more energy is stored than is apparent from
the change in body weight. An increased form of heat production, which is
referred to as "luxusconsumption" or dietary induced thermogenesis, has been
postulated to operate as a homeostatic mechanism for energy balance during
overeating. The last explanation is supported by findings in several studies
(40,41), and it appears to be a phenomenon independent of the thermic effect
of meals (40). There is evidence that obese people have a smaller thermogenic
response to food than those who are lean. However, it is not clear at present,

15
whether this is of quantitative importance in causing and maintaining obesity
in human subjects (42).
From the point of view of the morphology of adipose tissue, two general
types of obesity can be distinguished: hyperplastic obesity, characterized by
an excess number of fat cells; and hypertrophic obesity, characterized by large
fat cells. These represent the two extremes by which adipose tissue can
increase. In the dynamic phase of obesity, triglycerides can be stored either
by multiplication or by enlargement of fat cells. For a long time it was
thought that hyperplastic obesity began at an early age, especially in infancy
and that adult-onset obesity is mostly hypertrophic (43). This was known as the
fat cell hypothesis. Prognosis for the treatment of the hyperplastic type of
obesity is poor (43), perhaps because fat cells are conditioned to a certain
filling rate. It has been proposed that fat cell expansion plays a role in the
regulation of the energy balance (43). This has been an important reason for
emphasis on the prevention of obesity during childhood and in particular in
infancy. If the fat cell hypothesis is correct, there should then be a
relationship between obesity in childhood and in adulthood. This relationship
may be explained also by environmental factors. Nevertheless the trend in the
studies reviewed (36) and in two recently reported studies (44,45) is that
body fatness in adults cannot be accurately predicted from measurements made
when they were children. In addition, data from recent studies also suggest
that fat cells can increase in number in adults (46,47). Thus it seems that
multiplication of fat cells in childhood is not a very important determinant
of obesity in adulthood.
Following this survey of aspects of the aetiology of obesity, factors
affecting food intake and physical activity are to be considered. In general,
it can be stated that food intake is affected by physiological, psychological
and environmental factors. In the physiological control of feeding especially,
certain regions of the central nervous system and the gastro-intestinal tract
are nf great importance. Certain hormones and internal sensory systems such as
distension of the gastro-intestinal tract, have been shown to affect food
intake (29,48,49). In addition, nutrient composition, taste and other sensory
aspects of the ingested food modulate food intake (29,28,49), but all these
aspects are outside the scope of this thesis. Food intake is also affected by
psychological and environmental factors which also affect physical activity.
The influence of psychological and environmental factors on food habits,
habitual physical activity and the development of obesity are being studied in
detail in the research project on obesity in young adults of which the studies
16
described in this thesis constitute the first part.
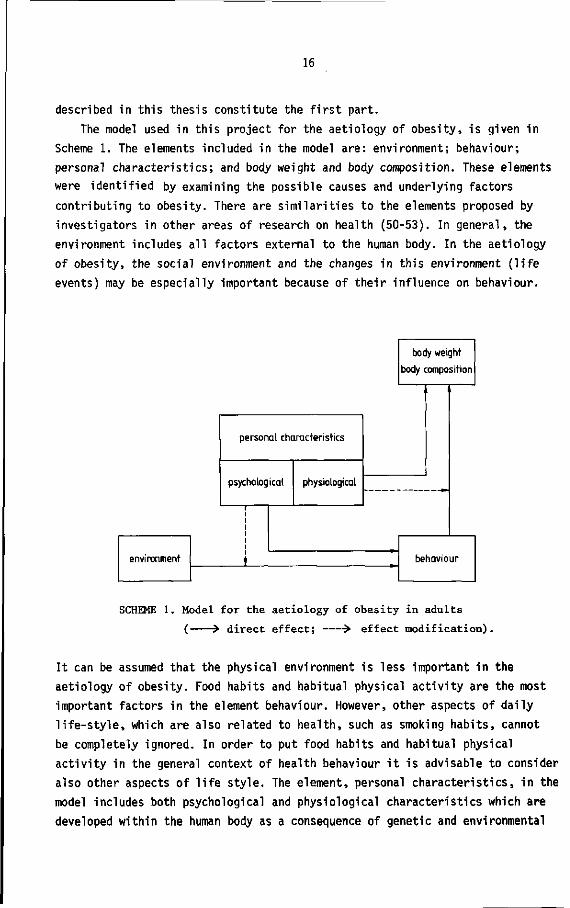
The model used in this project for the aetiology of obesity, is given in
Scheme 1. The elements included in the model are: environment; behaviour;
personal characteristics; and body weight and body composition. These elements
were identified by examining the possible causes and underlying factors
contributing to obesity. There are similarities to the elements proposed by
investigators in other areas of research on health (50-53). In general, the
environment includes all factors external to the human body. In the aetiology
of obesity, the social environment and the changes in this environment (life
events) may be especially important because of their influence on behaviour.
environment
personal characteristics
psychological
i
t
physiological
body weight
body composition
behaviour
SCHEME 1. Model for the aetiology of obesity in adults
( > direct effect; •> effect modification).
It can be assumed that the physical environment is less important in the
aetiology of obesity. Food habits and habitual physical activity are the most
important factors in the element behaviour. However, other aspects of daily
life-style, which are also related to health, such as smoking habits, cannot
be completely ignored. In order to put food habits and habitual physical
activity in the general context of health behaviour it is advisable to consider
also other aspects of life style. The element, personal characteristics, in the
model includes both psychological and physiological characteristics which are
developed within the human body as a consequence of genetic and environmental
17
factors and the interactions between these factors. Psychological characteristics
such as personality traits (54,55), and knowledge and attitudes about health and
nutrition (54) can have a direct effect on behaviour. Nevertheless it is also
possible that these characteristics act as modifiers of the effect of
environment and changes in environment on behaviour. Not everyone will respond in
the same way to a particular environment; individual response will depend on
psychological characteristics. Similarly, the physiological characteristics of
the individual may modify the effect of behaviour on body weight and body
composition. It may well be that certain individuals have a better system for
compensating for increased food intake, as mentioned above. In these individuals
weight gain may be limited, while in others having an impaired compensatory
system, a considerable weight gain may be observed. The physiological
characteristics of an individual may also directly affect metabolic rate and
consequently affect body weight and body composition. This will occur, for
example, if an endocrine abnormality is the cause of obesity. However, the
question remains whether endocrine abnormalities are important causes of obesity
in the general population. In addition, it has been shown that many hormonal
changes are secondary to the subjects' increased body weight (3,8).
OUTLINE OF THIS THESIS
In the studies described in Chapter 2 and 3, about 3900 subjects participated,
while a subsample of about 300 subjects from this initial population participated
in the studies described in the Chapters 4-6. Chapter 2 deals with a descriptive
study, in which the relationship between socio-demographic variables and BMI was
studied. The socio-demographic variables represent various personal and
environmental characteristics. This study indicates the categories of the
population which should be given special attention in treatment and prevention
of obesity, and, in addition, it provides some insight on the potential primary
causes of obesity.
Chapter 3 deals with the study of the relationship between aspects of daily
life-style and BMI. In the literature, several aspects of daily life-style are
shown to be related to obesity. It is not clear whether all these aspects are
independently related to obesity, or whether they represent only a limited number
of indicators of causal determinants. The aim of this study was to investigate
whether general types of behaviour could be distinguished within various aspects
of daily life-style which were related to BMI. From this study, hypotheses can

18
be formulated which can be tested in the prospective study.
Two methodological studies are described in Chapter 4 and 5. Previously,
two criteria have been considered in the choice of an index of relative weight
derived from body weight and body height: firstly, the index should be
relatively independent of body height; and secondly, the correlation between
the index and body fatness should be as high as possible. Chapter 4 is
concerned with the desirability of adding a third criterion, that the index
should be relatively independent of frame size. The results of this study have
been applied in Chapter 2 and 3. A short questionnaire has been developed for
the measurement of habitual physical activity, the results of which are
presented in Chapter 5. This questionnaire was developed in particular for the
prospective study but has also been used in the food consumption study described
in Chapter 6.
The food consumption study was carried out firstly, to study the intake of
energy and macronutrients in comparison with recommended intakes and secondly,
to investigate the relationships between body fatness and both food consumption
and habitual physical activity. An adequate measurement of energy intake had to
be established because there are no recent data available on the energy intake
of young Dutch adults on a community basis. For the management of obesity it is
essential to know whether the actual energy intake of the population deviates
from the recommended intake. This would indicate whether it may be expected that
energy intake is relatively high or that physical activity is relatively low.
In this context, data on food consumption and physical activity of both obese
and non-obese people are also essential. A general discussion of the studies
presented in this thesis is given in Chapter 7.
REFERENCES
1. Kok FJ, Matroos AW, Vandenbroucke JP. Te zwaar of niet te zwaar. Een onderzoek bij de volwassen bevolking van Nederland. Voeding 1981;42:262-9.
2. Kromhout D. Obesitas en coronaire hartziekten. Hartbulletin 1979;10:119-24.
3. Davidson S, Passmore R, Brock JF, Truswell AS. Human nutrition and dietetics. 7th ed. New York: Churchill Livingstone, 1979.
4. Womersley J, Durnin JVGA. A comparison of the skinfold method with extent of 'overweight' and various weight - height relationships in the assessment of obesity. Brit J Nutr 1977;38:271-84.
5. Gundlach BL, Nijkrake HGM, Hautvast JGAJ. A rapid and simplified plethysmo-metric method for measuring body volume. Hum Biol 1980;52:23-33.
6. Keys A, Fidanza F, Karvonen MJ, Kimura N, Taylor HL. Indices of relative weight and obesity. J Chron Dis 1972;25:329-43.

19
7. Benn RT. Some mathematical properties of weight-for-height indices used as measures of adiposity. Brit J prev soc Med 1971;25:42-50.
8. Department of Health and Social Security / Medical Research Council. Research on obesity. James WPT, comp. London: Her Majesty's Stationery Office, 1976.
9. Keys A, Brozek J. Overweight versus obesity and the evaluation of calorie needs. Metab Clin Exp 1957;4:425-34.
10. Durnin JVGA, Womersley J. Body fat assessed from total body density and its estimation from skinfold thickness: measurements on 481 men and women aged from 16 to 72 years. Brit J Nutr 1974;32:77-97.
11. Bray GA. Definition, measurement, and classification of the syndromes of obesity. Int J Obesity 1978;2:99-112.
12. Berger M, Berchtold P, Gries A, Zimmermann H. Indications for the treatment of obesity. In: Björntorp P, Cairella M, Howard AN, eds. Recent advances in obesity research III. London: John Libbey, 1981:1-9.
13. Seltzer CC. Some re-evaluations of the build and blood pressure study, 1959 as related to pondéral index, somatotype and mortality. New Engl J Med 1966; 274:254-9.
14. Dyer AR, Stamler J, Berkson DM, Lindberg HA. Relationship of relative weight and body mass index to 14-year mortality in the Chicago peoples gas company study. J Chron Dis 1975;28:109-23.
15. Lew EA, Garfinkel L. Variations in mortality by weight among 750,000 men and women. J Chron Dis 1979;32:563-76.
16. Sorlie P, Gordon T, Kannel WB. Body build and mortality. The Framingham Study. J Am Med Ass 1980;243:1828-31.
17. Keys A. Overweight, obesity, coronary heart disease and mortality. Nutr Rev 1980;38:297-307.
18. Pooling Project Research Group. Relationship of blood pressure, serum cholesterol, smoking habits, relative weight and ECG abnormalities to incidence of major coronary events: final report of the Pooling Project. J Chron Dis 1978;31:201-306.
19. Rabkin SW, Mathewson FAL, Hsu PH. Relation of body weight to development of ischemic heart disease in a cohort of young North American men after a 26 year observation period: The Manitoba Study. Am J Cardiology 1977;39:452-8.
20. Blair BF, Haines LW. Mortality experience according to build at the higher durations. Trans Acturial Soc America 1966;18:35-41.
21. Hsu PH, Mathewson FAL, Rabkin SW. Blood pressure and body mass index patterns - a longitudinal study. J Chron Dis 1977;30:93-113.
22. Kannel WB, Gordon T. Physiological and medical concomitants of obesity: The Framingham Study. In: Bray GA ed. Obesity in America. Washington DC: NIH Publication No. 79-359, 1979:125-63.
23. Ashley FW, Kannel WB. Relation of weight change to changes in atherogenic traits: The Framingham Study. J Chron Dis 1974;27:103-14.
24. Kannel WB, Gordon T. Some determinants of obesity and its impact as a cardiovascular risk factor. In: Howard A. ed. Recent advances in obesity research I. London: Newman Publishing Ltd, 1975:14-27.
20
25. James WPT. The prevalence and risks of obesity. In: Why obesity? Sundyberg: Caslon Press, 1978:15-26.
26. Van Itallie TB. Obesity: adverse effects on health and longevity. Am J Clin Nutr 1979;32:2723-33.
27. Rodin J. Psychological factors in obesity. In: Björntorp P, Cairella M, Howard AN, eds. Recent advances in obesity research III. London: John Libbey, 1981:106-23.
28. DeJong W. The stigma of obesity: The consequences of naive assumptions concerning the causes of physical deviance. J of Health and Social Behavior 1980;21:75-87.
29. Garrow JS. Treat obesity seriously. 1st ed. Edinburgh: Churchill Livingstone, 1981.
30. Abraham S, Johnson CL. Prevalence of severe obesity in adults in the United States. Am J Clin Nutr 1980;33:364-9.
31. Larsson B, Björntorp P, Tibblin G. The health consequences of moderate obesity. Int J Obesity 1981;5:97-116.
32. Hovell MF. The experimental evidence for weight-loss treatment of essential hypertension: a critical review. Am J Pub! Health 1982;72:359-68.
33. Garn SM, Baily SM, Cole PE. Synchronous fatness changes in husbands and wives. Am J Clin Nutr 1979;32:2375-7.
34. Hartz A, Giefer E, Rimm AA. Relative importance of the effect of family environment and heredity on obesity. Ann Hum Genet 1977;41:185-93.
35. Vuille JC, Mellbin T. Obesity in 10-year-olds: an epidemiologic study. Pediatrics 1979;64:564-72.
36. Garrow JS. Energy balance and obesity in man. 2nd ed. Amsterdam: Elsevier/ North-Holland Biomedical Press, 1978.
37. Apfelbaum M, Bostarron J, Lacatis D. Effect of caloric restriction and excessive caloric intake on energy expenditure. Am J Clin Nutr 1971;24: 1405-9.
38. Bray GA. Effect of caloric restriction on energy expenditure in obese patients. Lancet 1969;11:397-8.
39. Dauncey MJ. Energy metabolism in man and the influence of diet and temperature: a review. J Human Nutr 1979;33:259-69.
40. Danforth E, Burger AG, Goldman RF, Sims EAH. Thermogenesis during weight gain. In: Bray G, ed. Recent advances in obesity research II. London: Newman Publishing Ltd, 1978:229-36.
41. Garrow JS. The regulation of energy expenditure in man. In: Bray G, ed. Recent advances in obesity research II. London: Newman Publishing Ltd, 1978:200-10.
42. Garrow JS. Thermogenesis and obesity in man. In: Björntorp P, Cairella M, Howard AN, eds. Recent advances in obesity research III. London: John Libbey, 1981:208-13.
43. Björntorp P. The fat cell: a clinical view. In: Bray G, ed. Recent advances in obesity research II. London: Newman Publishing Ltd, 1978:153-68.
44. Hawk LJ, Brook CGD. Influence of body fatness in childhood on fatness in adult life. Brit Med J. 1979;1:151-2.
21
45. Stark 0, Atkins E, Wolf OH, Douglas JWB. Longitudinal study of obesity in the National Survey of Health and Development. Brit Med J 1981;283:13-7.
46. Chumlea C, Roche AF, Siervogel RM, Knittle JL, Webb P. Adipocytes and adiposity in adults. Am J Clin Nutr 1981;34:1798-803.
47. Sjöström L, William-Olsson T. Prospective studies on adipose tissue development in man. Int J Obesity 1981;5:597-604.
48. Bray GA. Physiological control of energy balance. Int J Obesity 1980;4: 287-95.
49. Thompson CI. Controls of eating. Jamaica, NY: Spectrum Publications Inc, 1980.
50. Haes WFM de, Schuurman JH, Sturmans F. Gezondheidsvoorlichting en -opvoeding: gedragsdeterminanten. Medisch Contact 1976;31:385-94.
51. Jonkers R. Gezondheidsgedrag. Rotterdam: Studiecentrum Sociale Oncologie, Erasmus Universiteit, 1978.
52. Lalonde M. A new perspective on the health of Canadians. Ottawa: Ministry of National Health and Welfare, 1974.
53. Mausner JS, Bahn AK. Epidemiology, an introductory text. Philadelphia: WS Saunders Co, 1974.
54. Frijters JER, Roosen RGMF. Eetgedrag en (over)gewicht. In: Pierloot R, Vandereycken W. Afwijkend eetgedrag. Alphen aan de Rijn: Stafleu's Wetenschappelijke Uitgeversmaatschappij BV, 1981.
55. Leon GR, Roth L. Obesity: psychological causes, correlations, and speculations. Psychol Bull 1977;84:117-39.
23
2 OBESITY IN YOUNG DUTCH ADULTS: I, SOCIO-DEMOGRAPHIC VARIABLES AND BODY MASS INDEX
JOS A.H. BAECKE, JAN BUREMA, JAN E.R. FRIJTERS, JOSEPH G.A.J. HAUTVAST and
WILHELMINA A.M. VAN DER WIEL-WETZELS
Department of Human Nutrition, Agricultural University, De Dreijen 12, 6703 BC Wageningen, The Netherlands
Int.J.Obesity, in press
SUMMARY
The simultaneous contr ibut ion of various socio-demographic variables to
body mass index (BMI; weight/height ) was studied in young adults in three age
groups (19-21, 24-26 and 29-31 years) in a Dutch population. Medians of the
BMI of males (n = 1765) and females (n = 2092) were 23.1 and 21.8 kg/m2, 2
respectively. The prevalence of severe obesity (BMI £ 30.0 kg/m ) was 2% in
both sexes. There was a positive relationship between age and BMI, while level
of education and level of fa ther 's occupation were inversely related to BMI in
both sexes. Married females who had given birth to two or more children weighed
more than those with one or no children. The mean BMI of the males in the rural
area was higher than that of the males in the urban area. Both the Lutheran
males and females weighed more than the non-Lutherans. The mean BMI was lower
in males attending church more frequentely than once a month. There were no
independent relationships between BMI and the other socio-demographic variables
(marital status, main daily occupation, size of family of origin and birth
order) in either sex. In conclusion, it can be stated that age and socio-
-economic status were the most important socio-demographic determinants of BMI.
Socio-economic status can be useful in directed prevention of obesity.
INTRODUCTION
Some health disorders are believed to be related to obesity. From the point
of view of public health, the most important disorders to which obesity may
contribute include: cardiovascular disease, diabetes mellitus, gallbladder

24
disease, psychosocial disability and musculoskeletal disorders (33). The
relationship between relative weight, coronary heart disease and mortality has
been recently reviewed by Keys (14). Risk appears to be substantial only at the
extremes of underweight and overweight in middle-aged males and females. Few
data are available on younger men and women, but there is some evidence to
suggest that obesity occurring before the age of 45 has more health consequences
than obesity occurring after this age (11,29,30).
For planning and developing of programmes aimed at the prevention of obesity,
knowledge of the prevalence of obesity in various categories of the population
is required. Relationships between several socio-demographic variables and
obesity have been reported, but only a few studies have been carried out in
young adults and in most studies only a few socio-demographic variables have
been included. This has the disadvantage that the observed relationship may be
confounded by other socio-demographic variables.
Cross-sectional studies suggest that, in both sexes, relative weight
increases during adulthood, is maintained in middle age, and decreases in old
age (16,23,34), but cohort differences may influence these observations.
Longitudinal studies, however, have also shown a similar trend (6,10,13).
In males no relationship has been found between marital status and obesity
(18), while in females such a relationship has been shown (25,28), but it is
important to study this relationship after adjustments for age and parity have
been made. Both variables are related to marital status, and in addition to
age, parity has also been shown to be related to obesity in females. Obesity
tends to be more common in women who have borne more children (3,4,9,25).
Even though in affluent countries obesity is generally more common in
people of lower socio-economic status (8,12,25,26,32), some investigations in
males have not shown this relationship (17,23) and the opposite trend has even
been observed (7,20,21,28). These discrepancies may have arisen because of
differences in the definition of obesity, the socio-economic indices used,
differences in the study population and various cultural factors. The
prevalence of obesity in both males and females appears to be higher in rural
areas than in urban areas (24,27), but the opposite has also been reported for
males (28). In a study in 19-year-old males, obesity was found to be related
to small families and especially to the one-child families, while no clear
relationship between obesity and birth order was observed (31).
The purpose of the present study in young adults living in an urban-rural
Dutch community is to investigate the simultaneous contribution of various
socio-demographic variables to relative weight. By this approach each

25
re lat ionship is an adjusted re lat ionship fo r the other socio-demographic
variables in the model.
METHODS
Population. Between March and Hay in 1980, a population of young adults was
studied in the Municipality of Ede in The Netherlands. The municipality,
situated in the centre of the country, consists of three districts in an urban
area with a total population of about 72,000 inhabitants, and four villages in
a rural area with a total population of about 10,000 inhabitants. Each district
in the urban area has more than 10,000 inhabitants, and each village in the
rural area has less than 3,000 inhabitants.
All inhabitants in three age groups (19-21, 24-26 and 29-31 years as at
1 January 1980) were invited by mail to participate in the study. Their
addresses were obtained from the Civil Registration Office in Ede. Complete
information was obtained of 3,936 subjects representing 33% of all invited
subjects. Women, pregnant for three months or longer (n = 79), were excluded
from further analysis.
procedure. All participants were requested to complete a questionnaire at home
and to visit a mobile research unit which was stationed in each section of the
municipality for a period of two weeks. At the mobile research unit the
questionnaire was checked for completeness and body weight and body height
without shoes and jacket were measured to the nearest 0.1 kg and 0.1 cm,
respectively. The body mi
index of relative weight
respectively. The body mass index (BMI; weight/height ) was calculated as an
socio-demographic variables. By means of the questionnaire, information was
collected on specific socio-demographic, behavioural and medical aspects. In
this paper attention is paid only to the socio-demographic factors as related
to the BMI. The socio-demographic variables considered were: age, marital
status, parity, level of education, main daily occupation, urbanization,
religion, church attendance, father's occupation, size of family of origin,
and birth order in the family (Table 1). In the final analysis some categories
were combined, as indicated by brackets in Table 1, because there were only a
limited number of observations and because mean BMIs of categories were
similar in both sexes.

26
Three levels of education were distinguished: low level comprising the
primary school and some occupational training; middle level comprising the
secondary school; and high level comprising the university and other tertiary
institutions. Students were coded according to the level of education of the
course of study to be completed.
The parti ci pants were categori zed accordi ng to rel i gi ous af f i 1 i ati on as f oil ows :
Protestant, Roman Catholic, other religions and no religion. Protestants were
further subdivided into two groups, Lutheran and Calvinist. There may be a
relationship between life style and religion, however it may be expected that
this relationship is weak, if people do not attend church regularly. Therefore,
frequency of church attendance more or less than once a month, was taken into
account.
The occupations of the fathers of the participants were divided into four
categories which were derived from a Dutch classification (35). The first
category included blue-collar workers, that is wage-earners such as plumbers
and carpenters, and unskilled manual workers such as factory workers. The
second category included self-employed tradesmen, small businessmen and
farmers. White-collar workers formed the third category and included occupations
such as office work and laboratory work. The fourth category consisted of
professional workers including teachers, business executives, doctors and all
other occupations with a university education.
Non-participants study. As a result of the low rate of response, a non-
-partici pants study was carried out in which efforts were made to visit all
non-participants in two sections of the Municipality of Ede. The rate of
response of those subjects who were at home on the first or second visit
(n = 472) was 92% (including five women more than three months pregnant).
Subjects were asked for their reasons for not responding to the mail
invitation and to state their education. Body weight and height without
shoes and jacket were measured at home to the nearest 0.5 kg and 1.0 cm,
respectively.
statistical methods. The differences between participants and non-participants
were tested using Student's t-test, and analysis of variance was used to test
the age and level of education adjusted BHI-difference. Product-moment
correlation-coefficients were calculated in order to study the mutual
relationships between the socio-demographic variables. Multiple regression
analysis with dummy variables (19) was used to study the relationship between

27
w e g CO ON
i - t O cd C M
B ll 0) c
En ^
B S c o — oo v o C M
oo C M < r c o — o n CNI — CM
r - CT,
• • — 0 0 LO < f
O N M -
• • • • •— r - cN a>, CO —• CN CN
C M i n r - r -
• • • • co r . CM ^o « CM LO
- % t m
• • • co r-* o> CO CM CO
ta o M
H <! ö Pu o CM
ix
H C/l
W SB H
Pu O
c/3 O H H C/l M Cri W H CJ
S < SB O
u H I
te
ü o S w o i
o H O
o m
4 3 n)
• H U cd
>
•—\ CO CN CU CJN
•-H O Cd CN
e ii ai a
PM ^
/—s CO LO CU NO
T-H r ^ cd —
S II a
, — i
co CU
I-H
4 3 CO
• i - I
u cd
>
00 — CO CO LD o VD m o\ oo ^o — co CM — CM CO
CO CN «tf ~
CO <J\ c o <f — CM m
\D r*» \o CO CM CO
ë o • H
6 0 • H rM
cu tó
a cd r l
cu .c • u
3 r J
1
• • 4-1
a cd • u co ai 4-1
o u
CM
CO • r l
C •rH
> i—t cd
O
1 O
• H r H O
J 2 4-1 cd
o S cd
B 0
ps
co
C O
• H OO
• H t—1 0) r l
r l
m 45 4J
O
c o • H 0 0
• H i-H <l) >J
o s
• • a) o a cd
- d
ö eu 4-i 4-1 cd
4 3
o 3
4 2 O
4 3 4-1
a O
s cd
CU
o e o ö cd
4 3 4-1
CO CO CU
r J
4 3 4J
a o s cd
CU
o e o
c cd 4 3 4J
CU
u o s
** c o • r l 4M cd CM 3 o o o co — SM
01 4 3 4-1 cd
P M
co
u CU
A i r i O
S V) cd
i—i i—i
o o 1 01
3 r H ca
CO
n CU
M u o ü
T3 01 U > N cd 0 r H
1-4 l—1 CU o
e o 3 i 1 01
MM 4J r H - H 01 4 3
c/3 J 3
CO
n CU
Ai M O
S t—i
cd ö o
• H CO CO 01
4M O r l CM
.. Ö • r l 0 0
• H r l O
UM O
>. i-M • H
i MM
M-l O
CU N
•rM C/3
T 3 r H • H 4 3 O
'—
C3 CU U
T ) r H • r l 4 3 Ü
CN
' ' ' a CU
ö u CU T 3 V4 i-H
t ) - H r - l 4 3 • H O 4 3 o <r
co A\
• • t-i CU
T 3 U 0
43 4J —. U
•iM
pa
CN A \
00 CN - ^ 00
<J — n~i m m co oo — o
en vo LO CT\ LTi CN LO —
C I N - J v û
00 — vo O ^D — _
CM < t LO • - ' r^
o — — — LO LO —• CO
LO CN LO 00
co m cN oo i
r*- cN
• • / ™ \ CO ^ U CN cd CU 1
^ •—' ON
— cu 0 0
<!
NO CN
1
< f CN
«—> CO
1 ON CN
• • CO
3 4-1 cd 4M CO
i-M cd 4J
• H V4
J3 a
CU r H 6 0 C3
• H C/l
"Ö
cu S o
T 3 • H
S " -•o 0)
ü
u o > • H
a
1 3 CU
• H h
H cd g
• • >N 4J
•iM W cd
CM
•
O — CN
CO
A \
• • C3 O
• H 4J
cd CJ
3 T3-CU
CH O
1-1
eu > 01
1-3
S 6 f j
eu r M 1 3 T 3 • H
S
4 3 0 0
• H
CC
c o
• H 4M cd CM 3 Ü Ü
o s*. t-M
• H
ed T 3
Ci •iM cd
S
,—
co u eu e u cd eu 1
eu
T 3 01
>> O T 3 r M eu p . >> co
§ ^ ^ 1 CM eu
MM a -a 6 0 . - H eU 3 cd
S eu a 4J
e n ö cyj
co
eu > • H
3 S CO
3 O te
• • (3 O
• H 4-1 cd i-M N cd
• H JJ Pi 3 S ai
43-IM
Î 3
c cd
4 3 I J
D

28
BMI and the various socio-demographic variables, because most independent
variables were nominal or ordinal variables. For each independent variable of
interest with k categories, k-1 dummy variables were introduced in the analysis.
With this approach, the intercept can be interpreted as the mean BMI of a well-
-defined reference group, this is the group of subjects with zero scores for
each dummy variable in the equation. Each regression coefficient represents the
mean BMI-difference between the subjects in a certain category and the reference
group. It is easy to calculate the mean BMI for each specific group, because
the model is additive. Only P-values <0.05 are reported.
RESULTS
In the non-participants study, no differences between the participants and
non-participants were observed with respect to age and BMI (Table 2) in either
sex, but the non-participants had lower levels of education.
Table 2.
COMPARISON OF AGE, LEVEL OF EDUCATION AND BMI (kg/m2) OF PARTICIPANTS AND NON-PARTICIPANTS IN TWO SECTIONS OF THE MUNICIPALITY
Sex Variable Participants Non-participants P-value
SEM mean SEM
Males
Age 2
Level of education
Unadjusted BMI 3
Adjusted BMI
(n=239)
1.7 0.1
2.1 0.1
23.2 0.2
23.4
(n=227)
1.8 0.1
1.6 0.0
23.2 0.2
23.0
< 0.001
Females
Age 2
Level of education
Unadjusted BMI 3 Adjusted BMI
(n=256)
1.9 0.1
1.9 0.0
22.5 0.2
22.5
(n=201)
1.8 0.1
1.7 0.1
22.3 0.2
22.3
< 0.001
The three age groups 19-21, 24-26 and 29-31 years were coded as 1, 2 and 3, 2
respectively. The low, middle and high level of education were coded as 1, 3
2, and 3, respectively. Adjusted for age and level of education.
29
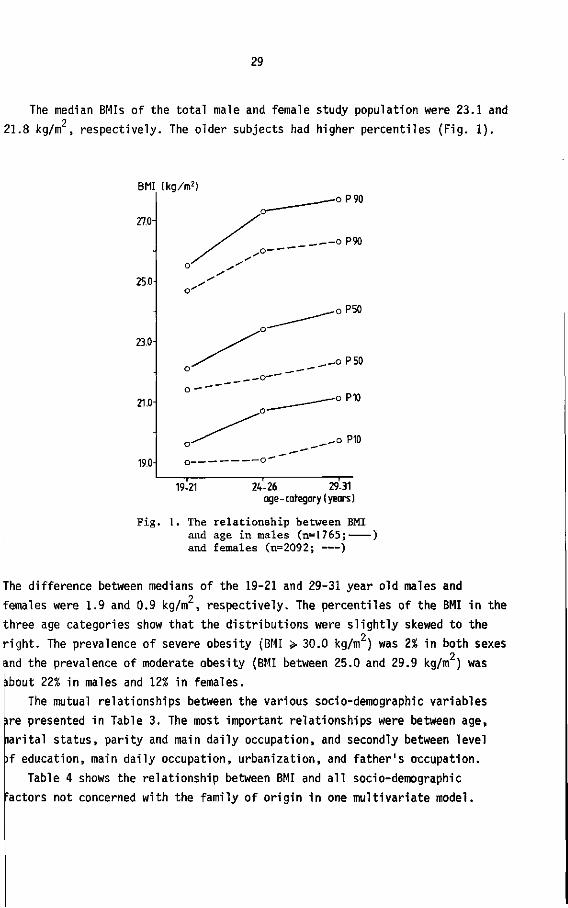
The median BMIs of the total male and female study population were 23.1 and 2
21.8 kg/m , respectively. The older subjects had higher percentiles (Fig. 1).
BMI
27.0-
25.0-
23.0-
21.0-
19.0-
(kg/m2) .—oP90
o— """'
S^ oP90
s-
o'
^__^_oP50
JO—~~~
^ ^
s ' ____-oP50
o — """"" ^___—-—-° P10
o—'
' 1 1 1 —
Fig .
19-21 24-26 29-31 age - category ( years )
1. The relationship between BMI and age in males (n=1765; ) and females (n=2092; )
The difference between medians of the 19-21 and 29-31 year old males and 2
females were 1.9 and 0.9 kg/m , respectively. The percentiles of the BMI in the
three age categories show that the distributions were slightly skewed to the 2
right. The prevalence of severe obesity (BMI > 30.0 kg/m ) was 2% in both sexes 2
and the prevalence of moderate obesity (BMI between 25.0 and 29.9 kg/m ) was îbout 22% in males and 12% in females.
The mutual relationships between the various socio-demographic variables
ire presented in Table 3. The most important relationships were between age,
narital status, parity and main daily occupation, and secondly between level
)f education, main daily occupation, urbanization, and father's occupation.
Table 4 shows the relationship between BMI and all socio-demographic
Factors not concerned with the family of origin in one multivariate model.

30
co
I
c/> w 1-1
o o
I I
1
i
00 m
l
CS
1
co m
| *o m
o
o
7 <r •
1
<f
i
1
o "
1
co
1
co •
o 1 —
ID m cN
o
i
CU 0 0
<
CO
3 • u
ca 4-1 CO
r H
ca t J
• r l
M ca S
^ 4-1 • H I J cd
P-.
3 o
• r l
4 J
ca o 3
T )
CU
M- l
O
r - l
0)
> CO l J
co
< ci 0
• r l
4J
ca p . 3 ü
o 0
> ï r ^
••-1
ca •u
c • r l
ca S
co w 3 o
• H 4-1
ca o. 3 O
o o
>> r H
• r l
ca •o
3 • r l
ca S
s 0 • r l
4-1
ca N
• r l
3 ca
. O u
Ö
d o
• H 0 0
• H i—1 0) OS
<L> O
3 CÖ
T 3 C CD
4-1 4-1
ca
X O
h
3 • ß O
<r 3 o
• H • u
ca B. 3 O O
o CO
a-
n CU
XI 4J
ca Pu
s • r l 6 0
• H
V H
O
M - l
O
>. i—1 • r l
1 M- l
14-1 O
CU N
• H ÙO
JJ CU
TS
n o
X ! 4-1
u • H
co
1-1 cfl >
• o •—
Â
co 4-1
e 0) • r l
CJ • H M H
M- l
cu o CJ
c o • r l
+J ca
i—i CU
u u o
o
• "" CU
1-4
,o ca
H
c • r l
T 3 CU 4J
e CU CO CU !-4 C i -
co
ca CU
o a CU
3 o-CU co
Ci • r l
• d CU
T 3 o o CU
u CU
s co CU
1-1
X> ca
• r H
1-1
ca > CU
- C 4 J
M-l
O
co CU
• H
u 0 0 0 CU 4-1
ca o CU
X I H
T > 3 4-1 co
T 3
3 ca
• o
CU
^ o i - i
a e CU
3 3
T 3 CU
>> O
O .
e CU
co CU
i—I x i
ca • H
u ca > CO
3 O E o 4J O
X o
• r l
• o
CU 4-1 ca u ca Cu CU co
0
S 4-1
3 • r H
• o
CU
-o •1-1
> • r H
T >
CO
ca S
3 0
• r l
4J
ca p . 3 CJ CJ 0
>, I-H • r l
ca T 3
ö • H ca S
, s
M — co
CU
> • r H
S CU co 3 o
X !
- 0 3 ca
•a CU
s* o r H
O . E S 3 3
T3 CU
^ O i—1
<x e s
• a
C ca
, n CU
4J CU 0 0 O 4-1
• Ö CU
T 3 O O
CU U CU
» T 3 CU
P 0
1-4 ü g CU
1 M- l i - l
CU CO
T 3 3 ca
co U CU
X r l
o s VH
ca r H
i - H
O
o 1 CU
3 r H
C f l
31
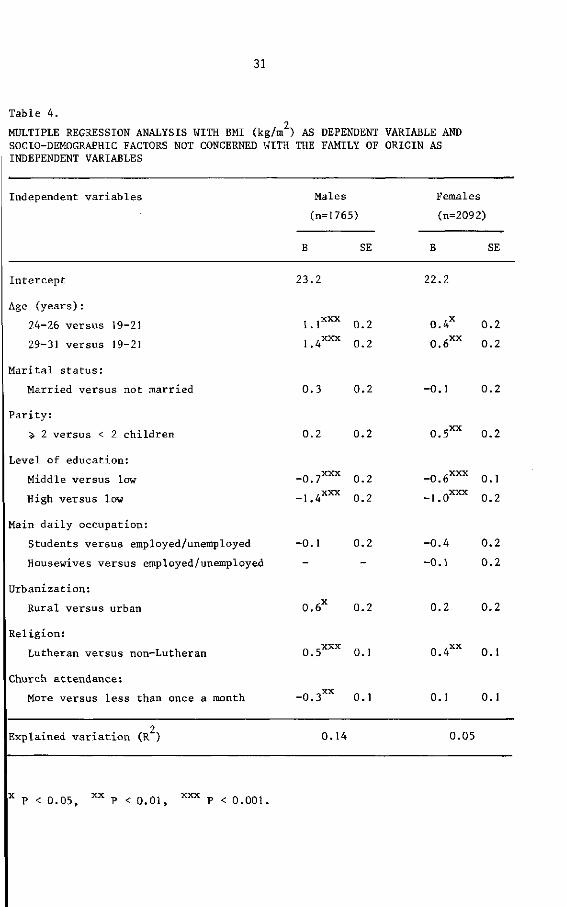
Table 4.
MULTIPLE REGRESSION ANALYSIS WITH BMI (kg/m2) AS DEPENDENT VARIABLE AND SOCIO-DEMOGRAPHIC FACTORS NOT CONCERNED WITH THE FAMILY OF ORIGIN AS INDEPENDENT VARIABLES
Independent variables Males
(n=1765)
Females
(n=2092)
SE B SE
Intercept 23.2 22.2
Age (years):
24-26 versus 19-21
29-31 versus 19-21
1.1XXX 0.2
1.4XXX 0.2
0.4 0.2
0.6XX 0.2
Marital status:
Married versus not married 0.3 0.2 -0.1 0.2
Parity:
>, 2 versus < 2 children 0.2 0.2 O.S^ 0.2
Level of education:
Middle versus low
High versus low
-0.7XXX 0.2
-1.4XXX 0.2
-0.6XXX 0.1
-1.0XXX 0.2
Main daily occupation:
Students versus employed/unemployed
Housewives versus employed/unemployed
-0.1 0.2 -0.4 0.2
-0.1 0.2
Urbanization:
Rural versus urban 0.6 0.2 0.2 0.2
Religion:
Lutheran versus non-Lutheran 0.5XXX 0.1 0.4XX 0.1
Church attendance:
More versus less than once a month -0.3XX 0.1 0.1 0.1
Explained variation (R ) 0.14 0.05
x P < 0.05, x x P < 0.01, X X X p < 0.001,

32
Age was s ign i f i can t l y related to BMI in both sexes. The mean BMI of the 2
29-31 year old males was 1.4 kg/m higher than of the 19-21 year old males, but 2
in females this difference was only 0.6 kg/m . The difference between the
24-26 and 29-31 year old groups was small in both sexes.
No significant relationship between marital status and BMI was found in
either sex. Married females who had given birth to two or more children were
significantly heavier than those who had one child, or no children. The
difference was 0.5 kg/m . Such a relationship did not exist in males.
Differences in BMI as related to level of education were significant and
the trends were similar in both sexes; the higher the level of education was
the lower the mean BMI. Mean BMIs in males and females with a high level of
education differed by 1.4 and 1.0 kg/m respectively from those of the low
level of education. The middle level of education about half-way in between.
There appeared to be no significant differences in BMI between the
categories of main daily occupation, although the female students tended to be
lighter than the employed/unemployed group and housewives.
The mean BMI of males living in the rural area was 0.6 kg/m higher than
the mean BMI of those in the urban area, but this difference was only weakly
significant (P < 0.05). No relationship between urbanization and BMI was
observed in females.
The mean BMIs of both the Lutheran males and females were higher than of
the non-Lutheran males and females, 0.5 and 0.4 kg/m , respectively. Males
attending church more frequently than once a month, regardless of their
religion, had a slightly, although significantly, lower mean BMI than others,
0.3 kg/m2.
In an additional analysis, a possible age-dependent effect of level of
education was investigated. Interaction terms of age by level of education
were introduced in the analysis, but did not prove to be statistically
significant.
Table 5 shows the relationship between BMI and the socio-demographic
factors concerned with family of origin. The relationship between father's
occupation and BMI was inverse as was the relationship between the own level
of education and BMI, although daughters of professional workers did not
differ from daughters of white-collar workers. The mean BMI of sons and
daughters of the self-employed and the blue-collar workers did not differ.
A relationship between BMI and size of family of origin, and birth order
was not observed in either sex.

33
Table 5.
MULTIPLE REGRESSION ANALYSIS WITH BMI (kg/m ) AS DEPENDENT VARIABLE AND SOCIO-DEMOGRAPHIC FACTORS CONCERNED WITH THE FAMILY OF ORIGIN AS INDEPENDENT VARIABLES
Independent variables Males
(n=1765)
Females
(n=2092)
SE B SE
Intercept
Father's occupation:
Self-employed versus blue-collar
White-collar versus blue-collar
Professional versus blue-collar
Size of family of origin:
<: 2 versus > 2 children
Birth order:
1 versus 5- 3
2 versus ^ 3
23.9 22.6
0.1
0 .5 X X
o.g3 0"
0.2
0.2
0.2
- 0 . 2
- 0 . 8 X X X
- 0 . 7 X X X
0.2
0.2
0.2
0.2 0.2
-0.1 0.2
-0.1 0.2
0.1 0.2
0.1 0.2
0.0 0.2
Explained variation (R ) 0.02 0.02
X X P < 0.01, x x x P < 0.001.
DISCUSSION
An adequate index of relative weight derived from measures of body weight
and height should have a high correlation with body fatness, and a low
correlation with height (15). In a separate study these correlations were
checked for the BMI in a subsample of 139 males and 167 females of the present
population. The correlation between BMI and percentage of body fat as derived
from the sum of four skinfolds (5), was 0.81 in males and 0.79 in females.
The correlations with height were only -0.08 and -0.11, respectively (1).
These results showed that in the present population, the BMI is a suitable
index of relative weight.

34
The common indicators of socio-economic status are level of education,
level of occupation, level of father's occupation, income and monthly rent.
For various reasons, many young adults are unemployed and therefore level of
occupation and income are inadequate indicators of socio-economic status in
this population. The same is also true for monthly rent, because some young
adults live with their parents, and others live independently. As many young
adults do not have a job, the main daily occupation was introduced as a
socio-demographic parameter. It seems a reasonable approach to code the level
of education of students according to the course of study to be completed, as
otherwise the older subjects tend to have higher levels of education.
It is thought that the most important reasons for the low rate of response
in this study was that the subjects were invited by mail to participate,
because the home visits in the non-participants study resulted in a high
response (92%). The non-participants study showed that no bias was introduced
to BMI, even after adjustments for age and level of education no differences
between participants and non-participants were observed with respect to BMI.
The rate of response was dependent on level of education which has the
consequence that the mean BMI of the total young adult population is slightly
biased because level of education is related to BMI. Selection by level of
education, however, does not hinder the investigation of the BMI-differences
between various categories of the population. It can be stated that for such
an analysis, as for the study of the aetiology of a disease in general, a
representative population is not necessary.
The choice of 30.0 kg/m2 as a cut-off point for separating severe obese
from moderate obese subjects is arbitrary. However, it has been shown that
above this point health problems increase considerably (11,14), whereas there
is little evidence for an increased risk in the range 25.0-29.9 kg/m . The BMI
levels in these young Dutch adults are similar to those reported in other
studies, such as the Manitoba follow-up study, in which the mean BMI ranges
from about 22.3 to 23.9 kg/m2 in the 17-34 year old males (10). The results of
a study in London in which the mean BMI was 22.6 and 21.6 kg/m in 15-29 year
old males and females, respectively are also in accordance with the present
study (22).
The relationship between age and BMI, as shown by multiple regression
analysis, was stronger in males than in females. This suggests a greater
increase in body weight in young adult males, if it is assumed that no cohort
effect is present.

35
Unlike other studies (25,28), no relationship between marital status and
BMI was shown in this study, because adjustments were made for age and parity.
The positive relationship between parity and BMI in females has also been shown
by others (3,4,9,25). This finding may be explained by: changes in endocrine
functions during pregnancy; changes in food habits and physical activity during
pregnancy which remain after delivery and after breast feeding; or by the fact
that the increased size of the family influences living conditions in such a
way that behaviour is changed.
The negative relationship between BMI and level of education in females is
in accordance with findings of other studies (7,8,12,20-22,25,26,28). An inverse
relationship has also been observed in males by others (8,12,18). The negative
relationship between father's occupation and BMI suggests that socio-economic
status is a causal determinant of overweight, because it may be assumed that
the socio-economic status of the family of origin is not influenced by body
weight of the children (8).
Main daily occupation showed no independent relationship with BMI. Other
variables related to the main daily occupation, such as age, parity and level
of education, appear to be more important determinants of obesity than the
occupation itself.
In earlier studies, a higher prevalence of obesity was observed in rural
areas than in urban areas in both sexes (24,27). In the present study, a weak
relationship was observed in males only. This discrepancy may be partly
explained by the adjustments for level of education. The average level of
education in the rural population was lower than in the urban population
studied.
The higher BMI in the Lutheran males and females, and the lower BMI in
those males attending church regularly, suggest that the general attitude to
life may have an influence on food habits and pattern of physical activity.
Mean BMI of sons and daughters of small families was not higher than that
of sons and daughters of larger families, as observed in studies in children
and in 19-year-old males (31). It may be suggested that such differences
disappear with aging. As in the study of Ravelli and Belmont (31), no
independent effect of birth order was found for either sex.
In conclusion, it can be stated that certain socio-demographic variables
show a distinct relationship with BMI. However, it must be recognized that
both in males and females, only a small proportion of the variation in BMI is
explained by these socio-demographic factors. This indicates that other
factors may be more important in the aetiology of obesity, such as physiological

36
factors which influence energy metabolism, and psychological factors which
effect eating behaviour, choice of food, and pattern of physical activity.
The most important socio-demographic determinants of BMI found in this
study were age and socio-economic status as measured by level of education
and father's occupation. Socio-economic status can be useful in directed
prevention of obesity, but it is also necessary to know which types of
behaviour are important in the aetiology of obesity, and to know the
differences between the various socio-economic classes with respect to this
behaviour. Therefore, the relationships between daily life-style and age,
level of education, and BMI have also been studied in the present population
(2).
ACKNOWLEDGEMENTS
The authors wish to thank the Praeventiefonds in The Netherlands for the
financial support for this study; the Local Government Office and the Civil
Registration Office in Ede for assistance in the preparation of the study
population; and all the people who participated in the study. They would also
like to thank R. Roosen for assistance with the design of the study; V. van de
Braak, G. Gundlach, M. van Item, B. Janssen, W. Knuiman-Hijl, M. Kraetzer,
P. Middelburg, H. Nijenhuis, G. Sanderink-Hulsink, B. Schölte, S. Vermaat-
Miedema, and H. West for technical assistance with the study.
REFERENCES
1. Baecke, J.A.H., Burema, J. & Deurenberg, P. (1982): Body fatness, relative weight and frame size in young adults. Br.J.Nutr. 48, 1-6.
2. Baecke, J.A.H., Burema, J., Frijters, J.E.R., Hautvast, J.G.A.J. & Wiel-Wetzels, W.A.M. van der (1982): Obesity in young Dutch adults: II, daily life-style and body mass index. Int.J.Obesity, in press.
3. Billewicz, W.Z. & Thomson, A.M. (1970): Body weight in parous women. Br.J.Prev.Soc.Med. 24, 97-104.
4. Cederlb'f, R. & Kay, L. (1970): The effect of childbearing on body weight. A twin control study. Acta Psychiatr.Scand.Suppl. 219, 47-49.
5. Durnin, J.V.G.A. & Womersley, J. (1974): Body fat assessed from total body density and its estimation from skinfold thickness: measurements on 481 men and women aged from 16 to 72 years. Br.J.Nutr. 3£, 77-97.
6. Friedlaender, J.S., Costa, P.T., Bosse, R., Ellis, E., Rhoads, J.G. & Stoudt, H.W. (1977): Longitudinal physique changes among healthy white veterans at Boston. Hum.Biol. 49, 541-558.

37
7. Garn, S.M., Baily, S.M., Cole, P.E. & Higgins, I.T.T. (1977): Level of education, level of income, and level of fatness in adults. Am.J.Clin.Nutr. 30, 721-725.
8. Goldblatt, P.B., Moore, M.E. & Stunkard, A.J. (1965): Social factors in obesity. J.Am.Med.Ass. _192, 1039-1044.
9. Helliövaara, M. & Aromaa, A. (1981): Parity and obesity. J.Epidemiol.Comm. Health 35, 197-199.
10. Hsu, P.H., Mathewson, F.A.L. & Rabkin, S.W. (1977): Blood pressure and body mass index patterns - a longitudinal study. J.Chron.Dis. 30, 93-113.
11. James, W.P.T. (1978): The prevalence and risks of obesity. In Why Obesity?, pp 15-26. Sundbyberg: Caslon press.
12. Kannel, W.B. & Gordon, T. (1975): Some determinants of obesity and its impact as a cardiovascular risk factor. In Recent advances in obesity research I, ed A. Howard, pp. 14-27. London: Newman Publishing Ltd.
13. Kannel, W.B., Gordon, T. & Castelli, W.P. (1979): Obesity, lipids, and glucose intolerance. The Framingham Study. Am.J.Clin.Nutr. 32, 1238-1245.
14. Keys, A. (1980): Overweight, obesity, coronary heart disease and mortality. Nutr.Rev. 38, 297-307.
15. Keys, A., Fidanza, F., Karvonen, M.J., Kimura, N. & Taylor, H.L. (1972): Indices of relative weight and obesity. J.Chron.Dis. 25, 329-343.
16. Khosla, T. & Lowe, C R . (1968): Height and weight of British men. Lancet U 742-745.
17. Khoury, P.R., Morrison, J.A., Laskarzewski, P., Kelly, K., Mellies, M.J., King, P., Larsen, R. & Glueck, C.J. (1981): Relationships of education and occupation to coronary heart risk factors in schoolchildren and adults: the Princeton School District Study. Am. J. Epi demi ol. U 3 , 378-395.
18. Kittel, F., Rustin, R.M., Dramaix, M., Backer, G. de & Kornitzer, M. (1978): Psycho-socio-biological correlates of moderate overweight in an industrial population. J.Psychosom.Res. 22, 145-158.
19. Kleinbaum, D.G. & Kupper, L.L. (1978): Applied regression analysis and other multivariable methods. North Scituate, Massachusetts: Duxbury Press.
20. Kohrs, M.B., Wang, L.L., Eklund, D., Paulsen, B. & O'Neal, R. (1979): The association of obesity with socioeconomic factors in Missouri. Am.J.Clin.Nutr. 32, 2120-2128.
21. Lowenstein, F.W.. (1976): Preliminary clinical and anthropometric findings from the first Health and Nutritional Examination Survey, U.S.A. 1971-1972. Am.J.Clin.Nutr. 29, 918-927.
22. McLean Baird, I., Silverstone, J.T., Grimshaw, J.J. & Ashwell, M. (1974): Prevalence of obesity in a London borough. Practitioner 212, 706-714.
23. Montoye, H.J., Epstein, F.H. & Kjelsberg, M.O. (1965): The measurement of body fatness. A study in a total community. Am.J.Clin.Nutr. 16» 417-427.
24. Müller, F. & Paul, I. (1972): Ergebnisse epidemiologischer Fettsuchtforschung in der DDR. Ernährungsforschung 17, 237-248.
25. Noppa, H. & Bengtsson, C. (1980): Obesity in relation to socioeconomic status. A population study of women in Göteborg. J.Epidemiol.Cornm. Health 34, 139-142.

38
26. Oken, B., Hartz, A., Giefer, E. & Rimm, A.A. (1977): Relation between socio-economic status and obesity changes in 9046 women. Prev.Med. 6, 447-453.
27. Osancova, K. & Hejda, S., (1975): Epidemiology of obesity. In Obesity: its pathogenesis and management, ed. T. Sil verstone, pp 57-91. Acton, Massachusetts: Publishing Sciences Group.
28. Pflanz, M. (1962): Medizinisch-soziologische Aspekte der Fettsucht. Psyche 16, 575-591.
29. The Pooling Project Research Group (1978): Relationship of blood pressure, serum cholesterol, smoking habits, relative weight and ECG abnormalities to incidence of major coronary events: final report of the Pooling Project. J.Chron.Dis. 31, 201-306.
30. Rabkin, S.W., Mathewson, F.A.L. & Hsu, P.H. (1977): Relation of body weight to development of ischemic heart disease in a cohort of young North American men after a 26 year period: The Manitoba study. Am.J.Cardiol. 3£, 452-458.
31. Ravelli, G.P. & Belmont, L. (1979): Obesity in nineteen-year-old men: Family size and birth order associations. Am.J.Epidemiol. 109, 66-70.
32. Stunkard, A.J. (1975): Obesity and social environment. In Recent advances in obesity research I, ed A. Howard, pp 178-190. London: Newman Publishing Ltd.
33. Van Itallie, T.B. (1979): Obesity: adverse effects on health and longevity. Am.J.Clin.Nutr. 32, 2723-2733.
34. Van Itallie, T. (1977): Statement of Dr. Theodore Van Itallie. In Diet related to killer diseases. Part 2 Obesity, pp 44-64. Washington: U.S. Government Printing Office.
35. Westerlaak, J.M. van, Kropman, J.A. & Collaris, J.W.M. (1975): Beroepenklapper. Nijmegen: Instituut voor Toegepaste Sociologie.

39
3 OBESITY IN YOUNG DUTCH ADULTS: II, DAILY LIFE-STYLE AND BODY MASS INDEX
JOS A.H. BAECKE, JAN BUREMA, JAN E.R. FRIJTERS, JOSEPH G.A.J. HAUTVAST and
WILHELMINA A.M. VAN DER WIEL-WETZELS
Department of Human Nutrition, Agricultural University, De Dreijen 12, 6703 BC Wageninqen, The Netherlands
Int.J.Obesity, in press
SUMMARY
The relationships between aspects of daily life-style and age, level of
education, and body mass index (BMI; weight/height ) were studied in young
adult males (n=1765) and females (n=2092) in three age groups (19-21, 24-26
and 29-31 years) in a Dutch population. By means of principal-components
analysis five conceptually meaningful factors could be distinguished within
the aspects of daily life-style which were considered. These factors were
interpreted as constructs of: 1, slimming behaviour; 2, behaviour characterized
by the consumption of coffee and alcohol, smoking habits and the number of
hours sleep per night (CASS behaviour); 3, eating sweet and savoury snacks
between meals; 4, health-conscious behaviour; and 5, physical activity. After
adjustments were made for age and level of education, multiple regression
analysis showed that slimming behaviour was positively related to BMI in both
sexes, CASS behaviour was positively related to BMI in males, and health-
-conscious behaviour was inversely related to BMI in both sexes. An observed
positive relationship between BMI and occupational physical activity in males
could be explained by a confounding effect of socio-economic status. The
observed weak positive relationship between number of hours active sport per
month and BMI in males is possibly due to a difference in lean body mass. The
consumption of sweet and savoury snacks was not related to BMI in either sex.
These findings suggest that the daily life-style variables should be inter
preted as indicators of more general types of behaviour, some of which may be
important determinants of obesity.

40
INTRODUCTION
In order to successfully prevent and treat obesity, it is essential to
understand the aetiology of obesity. Hence it is important to investigate the
relationships between aspects of daily life-style and obesity, as a number of
these aspects may be relevant to the description of the obese population, and
the population which is most prone to become obese. Although various aspects of
daily life-style and obesity have already been considered in a number of studies,
most of these studies were only concerned with isolated variables. It is not
clear whether the observed relationships between these variables and obesity
were direct relationships or, whether in fact, these variables should be
interpreted only .as indicators of more general types of behaviour.
It has been shown in several studies that cigarette smokers weigh less than
non-smokers (5,15,17,22,31), but in general heavy smokers weigh more than light
or moderate smokers. A U-shape relationship has often been observed between
smoking categories and relative weight (5,17,31). The average weight gain in
people who have stopped smoking has generally been found to be higher than in
smokers and those who have never smoked (5,6,31), but individual weight losses
have also been observed (6). Up until now there have been three hypotheses to
explain this observed relationship (6): firstly, smoking acts as an appetite
suppressant; secondly, smoking stimulates the resting metabolic rate; and
thirdly, after giving up the habit of smoking, the amount of food eaten is
increased as a substitute for smoking.
Relationships between smoking and other aspects of daily life-style have
also been observed. Positive relationships have been observed between smoking
and the consumption of alcohol (4,9,10,12,15,35), and coffee (4,9). The three
aspects of daily life-style mentioned above, together with the number of hours
sleep per night have been found to be related to type-A behaviour (4,18,25).
Hence it may be that these aspects of daily life-style are only indicators of
a more general type of behaviour.
Observational studies have shown no clear agreement on the contribution of
physical inactivity at work to obesity. In some studies, an inverse relation
ship has been observed between physical activity at work and obesity (20,29).
In the Seven-countries study, this influence was found to be much smaller after
adjustments had been made for socio-economic differences (20). In other studies,
no relationship was observed (14,23), or the prevalence of obesity was found to
be lower only in those whose physical activity at work was high and who were
also physically active in leisure time (16). This result may also have been
41
confounded by socio-economic differences. An inverse relationship between
physical activity during leisure time and risk indicators of coronary heart
disease, including relative weight, has been observed (14). It was suggested
that physical activity itself was not responsible for the lower levels of risk
indicators, because in the same study no such relationship was observed between
physical activity at work and the levels of risk indicators. It is possible
that those subjects who were physically active during leisure time also differed
with respect to other habits.
Studies have shown that the number of meals per day is inversely related to
obesity (13,27,28); especially omitting breakfast is a habit which is more
common in obese people than in others (3,7). In a recent experiment, Garrow et
ai. found that the number of meals per day had no effect on the rate of fat
loss (11). Therefore, omitting meals may be an effect of obesity rather than a
cause; people who are obese may omit meals more often than others in their
efforts to reduce total energy intake. If this is so, omitting meals should be
related to typical slimming behaviour, such as frequent weight measurement,
restricting the intake of sweet foods, and adding less sugar to beverages. An
inverse relationship between sugar intake and relative weight has already been
observed (33).
The purpose of the present study is: firstly, to investigate the relation
ship between aspects of daily life-style and to construct conceptually
meaningful behaviour indices; and secondly, to investigate the relationships
between these indices and age, level of education, and relative weight in young
adults living in an urban-rural Dutch community.
METHODS
population. In 1980 a population of young adults living in the Municipality of
Ede in The Netherlands was studied. The addresses of people were obtained from
the Civil Registration Office in Ede and complete information was obtained from
3,936 people in three age groups (19-21, 24-26 and 29-31 years as at 1 January
1980). Women, pregnant for three months or longer (n=79), were excluded from
further analysis. Details of the municipality, the study population and the
procedure followed have already been described elsewhere (2).
variables. As an index of relative weight, the body mass index (BMI; weight/ 2
height ) was calculated. By means of a questionnaire information was collected

42
on specific socio-demographic, behavioural and medical aspects. In this paper,
the relationships between aspects of daily life-style and age, level of
education, and BMI are considered. The present subdivision of education into
three levels has been described elsewhere (2).
The aspects of daily life-style which were studied are summarized in Table 1.
Three levels of occupational physical activity as derived from a Dutch classifi
cation (36) were distinguished; the low level including occupations such as
clerical work, driving, shop keeping, teaching, studying, housework, medical
practice, and all other occupations with a university education; the middle level
including occupations such as factory work, plumbing, carpentry and farming; and
the high level including occupations such as dock work, removals and construction
work.
statistical methods. Principal-components analysis with quartimax rotation (30)
was used to study the relationship between the aspects of daily life-style, and
to find meaningful underlying concepts of these aspects. Only factors with Eigen
values greater than 1.0 were retained for the final rotated solution. For several
underlying concepts, behaviour indices were constructed as a linear combination
of the variables with high loadings (> 0.40) on the factor in question;
standardized factor scores of separate one-factor solutions of the appropriate
set of variables were used as scores of the various indices. Differences between
males and females with respect to the constructed behaviour indices were tested
using Student's t-test. The relationships between behaviour indices and age, and
level of education were studied by calculating partial correlation coefficients.
Multiple regression analysis was used to study the relationships between BMI and
smoking habits, and behaviour indices. Four dummy variables were introduced in
the analysis for smoking habits (24). Adjustments for age and socio-economic
status were made by adding dummy variables simultaneously in the analyses,
because in earlier analyses the relationships between these variables and BMI
appeared to be non-linear (2). Only P-values < 0.05 are reported.
RESULTS
In Table 1, males and females are compared with respect to the daily life
style variables. Females tended to weigh themselves more frequently, to slim
more often, to add sugar to beverages less frequently, and to eat butter on
bread less frequently than males. While on the other hand, males reported a
higher consumption of coffee and alcoholic drinks and to sleep fewer hours per

43
^ 1 " f CM
• u u t
r o CO CT>
C M O n i
co r o en
r o r - co
r-. r-» t o
rHcnco
•dr "3- LO t o
en * * t o en
LT) L D "dr t O
c o E •• O J
- i — E D l w Z r - i
0 ) L ü
+ J L ü
E ü .
• r - Q - Q :
LÜ
* -° ï 3 •—'
trt ^
O ro -z.
t ?
-a
JXL ^4 t r t
•z. (/) l / l i—' gj a» —i E E<->
+ J + J C_)
o CM r o C3
t/> T-H __1 C
<C
<C
_ i
h -
</l D_
- * > * O &
O -
o
1—
o
S- t . J -3 3 3 O O O
CO CM LÜ cn _J o <C CM
O C\J CM tO co t o r o r o
co «d- co co
J H C M N
•< r - i o r-~
LO CTi CO CM
cn t o o r o r o r o CM
CM co
o cn
r o LO t o t o
ro ro r - i n .—1 r H ^
O N O C O
LO CM t O t O CO
r o * * • i—i C M
r - . O N i O
! - • CO LO LT)
CO ^ J - CTi CM
t l f l H O l O
co «a- r o o r o
i—i m •—i m
LO CO LO . - i
<. 01 t -
in 01
rO
o
LO
1
.-H
O
LO
r
t o
^
cn
O
A \
3 - D Q
U <J E
t_ )
+-*
• i - 2 :
x : LU
T ) • ~ fc
O l O L Ü v i ! A =n c 1 1
I— I — r - CO
i <D O QJ O U_ U C H O I
(1)
o
!-
E E QJ
S . V L
<L) . r - O
E CO O O
> ) 0 r-. co
ai cc:
0 ) 0 ) 0 )
i .
3 0)
CL ai ai c
o » -C O)
i a> cu "o o
5 ro cn
O) 3

night than females. Differences between males and females in reported smoking
habits were quite small. Females reported to eat sweet snacks with coffee and
tea between meals slightly more frequently than males, but the reported
frequency of eating sweet and savoury snacks with soft and alcoholic drinks
differed very little between males and females. Females reported eating more
bread containing more dietary fibre and eating more fruit per day than males.
Omitting breakfast was as common in males as in females. Females tended to walk
and cycle more often, but to spend fewer hours per month participating in sport
than males. The number of males and females with a high level of occupational
physical activity was small, females were more often classified as having a
medium level of occupational physical activity than males.
Table 2.
MULTIPLE INDICATORS OF CATEGORIES OF SMOKING HABITS AS INDEPENDENT VARIABLES MULTIPLE REGRESSION ANALYSIS WITH BMI (kg/m ) AS DEPENDENT VARIABLE AND
Smoking categories
Ex- versus never
Light versus never
Moderate versus never
Heavy versus never
Explained variation (R2)
Males (n=1765)
unadjusted
B
0.87XXX
0.19
0.47XX
1.43XXX
0.03
adjusted
B
0.31
-0.04
0.04
0.71XXX
0.13
unadjus
B
0.47X
0.02
0.06
0.39X
0.00
Females (n=2092)
ted adjusted
B
0.29
-0.04
-0.12
0.19
0.05
Adjusted for age and level of education.
X P < 0.05, X X P < 0.01, X X X P < 0.001.
A U-shape relationship between smoking habits and BMI was observed in males
(Table 2 ) , but after adjustments for age and level of education, it appeared
that only the mean BMI of the heavy smokers was significantly higher (0.7 kg/m2]
than the mean BMI of those who had never smoked. In females only the ex-smokers
and heavy smokers were slightly heavier than those who had never smoked, while
there were no significant differences after adjustments had been made for age
and level of education. Interaction terms were introduced in an additional

45
analysis, but did not appear to be s t a t i s t i c a l l y s i gn i f i can t .
Table 3 gives the factor- loading matrix of the variables concerned with
the aspects of da i ly l i f e - s t y l e . Data on males and females were pooled because
the sex-specif ic matrices showed a s imi lar pat tern. The reported frequency of
weight measurement, slimming during previous 12 months, adding sugar to coffee
and tea, and eating butter on bread had high loadings on the f i r s t fac tor .
Table 3.
FACTOR-LOADING MATRIX OF THE DAILY LIFE-STYLE VARIABLES; COMBINED RESULTS OF MALES (n=1765) AND FEMALES (n=2092).
Variables
Frequency of weight measurement
Slimming during previous 12 months
Sugar in coffee/tea
Eating butter on bread
Quantity of coffee
Quantity of alcoholic drinks
Smoking habits
Hours of sleep per night
Sweet snacks with coffee/tea
Snacks with soft/alcoholic drinks
Type of bread
Fruit consumption
Omitting breakfast
Walking/cycling (most days)
Occupational physical activity
Active sport
2 Percentage of explained variation 11.5 10.5 7.9 9.3 7.9
I Ex-smokers and never smoked were classified as non-smokers for this analysis.
I After rotation.
As these variables are aspects of slimming, the first factor may be interpreted
as a construct of slimming behaviour. The reported consumption of coffee and
1
.64
.72
.69
.50
.01
. 10
. 0 3
.01
. 10
.01
.21
.31
. 15
.04
.01
. 06
2
- . 0 2
.02
- . 0 2
.12
.68
.67
.47
- . 5 9
- . 2 5
. 16
.12
- . 1 5
. 06
- . 0 5
. 16
.11
F a c t o r
3
. 12
.01
. 10
.17
.01
- . 0 5
- . 2 0
- . 0 5
.71
.81
- . 0 9
. 02
- . 0 6
- . 0 2
- . 0 1
.02
4
. 02
- . 0 7
- . 1 9
.09
- . 0 8
- . 1 3
- . 4 0
- . 0 7
.17
- . 1 3
.58
.43
-.63
.52
- . 0 2
. 09
5
- . 0 3
- . 0 8
. 1 3
- . 2 4
- . 1 4
.27
- . 1 9
. 03
- . 0 7
. 08
. 22
.09
.12
- . 0 1
-.66
.73
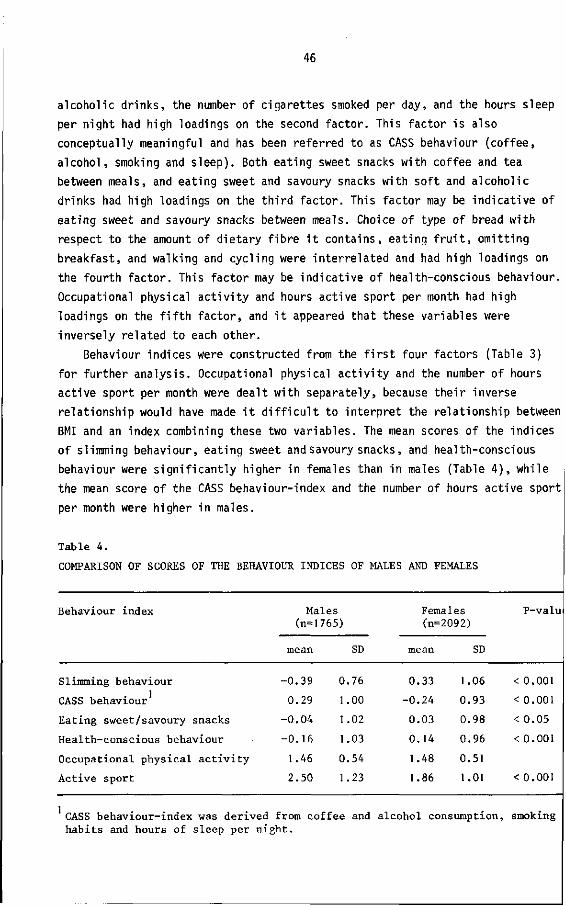
46
alcoholic drinks, the number of cigarettes smoked per day, and the hours sleep
per night had high loadings on the second factor. This factor is also
conceptually meaningful and has been referred to as CASS behaviour (coffee,
alcohol, smoking and sleep). Both eating sweet snacks with coffee and tea
between meals, and eating sweet and savoury snacks with soft and alcoholic
drinks had high loadings on the third factor. This factor may be indicative of
eating sweet and savoury snacks between meals. Choice of type of bread with
respect to the amount of dietary fibre it contains, eating fruit, omitting
breakfast, and walking and cycling were interrelated and had high loadings on
the fourth factor. This factor may be indicative of health-conscious behaviour.
Occupational physical activity and hours active sport per month had high
loadings on the fifth factor, and it appeared that these variables were
inversely related to each other.
Behaviour indices were constructed from the first four factors (Table 3)
for further analysis. Occupational physical activity and the number of hours
active sport per month were dealt with separately, because their inverse
relationship would have made it difficult to interpret the relationship between
BMI and an index combining these two variables. The mean scores of the indices
of slimming behaviour, eating sweet and savoury snacks, and health-conscious
behaviour were significantly higher in females than in males (Table 4 ) , while
the mean score of the CASS behaviour-index and the number of hours active sport
per month were higher in males.
Table 4.
COMPARISON OF SCORES OF THE BEHAVIOUR INDICES OF MALES AND FEMALES
Behaviour index Males (n=1765)
mean
-0.39
0.29
-0.04
-0.16
1.46
2.50
0
1
I
1
0
1
SD
76
00
.02
.03
54
23
Females (n=2092)
mean
0.33
-0.24
0.03
0.14
1.48
1.86
SD
1.06
0.93
0.98
0.96
0.51
1.01
P-val
< 0.001
< 0.001
< 0.05
< 0.001
< 0.001
Slimming behaviour
CASS behaviour
Eating sweet/savoury snacks
Health-conscious behaviour
Occupational physical activity
Active sport
CASS behaviour-index was derived from coffee and alcohol consumption, smoking habits and hours of sleep per night.

47
Table 5.
PARTIAL CORRELATION COEFFICIENTS BETWEEN BEHAVIOUR INDICES AND AGE , AND LEVEL OF EDUCATION2 IN MALES AND FEMALES
Behaviour index Males (n=1765)
Age
-.01
.20X
-.02
.01
.00
Level of education
.09X
-.11X
.06
.21x
-.47X
Age
Females (n=2092)
-.06
.11X
-.02
.07
-.05
Level of education
.09X
-.05
-.07
.22x
-.29X
Slimming behaviour 3
CASS behaviour
Eating sweet/savoury snacks
Health-conscious behaviour
Occupational physical activity
Active sport ,17' ,12' -.07' .16"
Adjusted for BMI and level of education.
Adjusted for BMI and age.
CASS behaviour-index was derived from coffee and alcohol consumption, smoking habits and hours of sleep per night.
P < 0.001.
Table 5 shows the relationships between the behaviour indices and age, and
level of education. There was a weak positive relationship between slimming
behaviour and level of education in both sexes. A positive relationship was
found between CASS behaviour and age, particularly in males. A weak inverse
relationship between CASS behaviour and level of education was also found in
males. Eating sweet and savoury snacks was not related to age or level of
education. Health-conscious behaviour was positively related to level of
education in males and females, while occupational physical activity was
inversely related to the level of education in both sexes. The number of hours
active sport per month was inversely related to age, especially in males, but
positively related to the level of education in both sexes.
The independent relationships between BMI and behaviour indices, before and
after adjustments for age and level of education, are presented in Table 6.
Slimming behaviour was positively related to BMI, the regression coefficient
being similar in both sexes. The CASS behaviour-index was positively related to
BMI only in males, eating snacks was not related to BMI in either sex and
health-conscious behaviour appeared to be negatively related to BMI in both

48
sexes. Occupational physical activity was positively related to BMI in males.
The regression coefficient, however, became much smaller after adjustment, and
was no longer significant in the employed males (n=1386) after adjustments had
been made, not only for age and level of education, but also for level of
occupation. After adjustment for age and level of education, there was a weak
positive relationship between the number of hours active sport per month and
BMI in males. Interaction terms were introduced in an additional analysis, but
did not appear to be statistically significant.
Table 6.
MULTIPLE REGRESSION ANALYSIS WITH BMI (kg/m ) AS DEPENDENT VARIABLE AND BEHAVIOUR INDICES AS INDEPENDENT VARIABLES
Behaviour index Mai es (n=1765)
unadjusted
B
1.11XXX
0.39XXX
-0.07
-o.ig**
0.70xxx
0.00
adjusted
B
1.04XXX
0.21XX
-0.05
-0.17X X
0.35XX
0.11X
Females (n-
unadjusted
B
1.06XXX
0.06
0.03
-0.18X X
0.23X
-0.12X
2092)
adjusted
B
1.06XXX
0.00
0.01
-0.15X
0.07
-0.04
Slimming behaviour 2
CASS behaviour
Eating sweet/savoury snacks
Health-conscious behaviour
Occupational physical activity
Active sport
Explained variation (R ) 0.15 0.22 0.16 0.20
Adjusted for age and level of education.
CASS behaviour-index was derived from coffee and alcohol consumption, smoking habits and hours of sleep per night.
P < 0.05, P < 0.01, P < 0.001.
DISCUSSION
By means of principal-components analysis, five meaningful factors could be
distinguished within the aspects of daily life-style which were considered. The
first factor consisted of four typical aspects of slimming behaviour. The
amount of fruit consumed also had a loading on this factor, indicating that

49
this is also an aspect of slimming behaviour, but it had a higher loading on
the fourth factor. The strong positive relationship between BMI and the
constructed slimming behaviour-index may be partly responsible for the finding
of several cross-sectional studies, that the obese population does not eat more
food than the non-obese population (32,34).
An inverse relationship between BMI and level of education had been
observed in the present population (2). As the relationship between the
slimming behaviour-index and level of education was weak, it does not seem
likely that greater weight-consciousness anu social pressure to be thin in
higher socio-economic classes are largely responsible for the earlier observed
inverse relationship.
The second factor showed that the amount of coffee and alcohol consumed and
the number of cigarettes smoked were related. This is in concordance with the
findings of other studies (4,9,10,12,15,35). The number of hours sleep per
night was inversely related to these variables, which are all aspects of daily
life-style which tend to be related to type-A behaviour (4,18,25). The relation
ship between age and the constructed CASS behaviour-index showed that there was
an increase of this type of behaviour with age, especially in males. It may be
hypothesized from the observed relationship with BMI, that this type of
behaviour is a determinant for the development of obesity in young adult males.
In the present study, the generally observed U-shape relationship between
smoking and body weight (5,17,31) disappeared after adjustments were made for
age and level of education. Only the male heavy smokers had a significantly
higher mean BMI than those who had never smoked. The differences between the
categories of smoking habits may become greater with increase in age, because
in other studies, differences in body weight between the different categories
also tended to be smaller in young adults than in older people (15,17).
The finding that the mean BMI of male heavy-smokers was higher than the BMI of
other categories is not in agreement with the hypotheses, that smoking acts as
an appetite suppressant, or that smoking stimulates the resting metabolic rate.
The trend, that ex-smokers are heavier than those who have never smoked, may
well be explained by the above hypotheses, or by the hypothesis, that after
stopping smoking the amount of food eaten is increased as a substitute for
smoking. In addition to a loading on the second factor, smoking had a
considerable loading on the fourth factor, indicating that the interpretation
of this variable is not simple. Smoking is concerned with more than one
theoretical dimension, and therefore it is not possible to explain an observed
relationship between smoking and body weight adequately without taking into

50
consideration other aspects of behaviour.
Eating fewer sweet snacks with coffee and tea between meals, and eating
fewer sweet and savoury snacks with soft and alcoholic drinks did not appear
to be typical aspects of slimming behaviour as these variables did not have
high negative loadings on the first factor. They formed a separate factor, and
the derived behaviour index was not related to age, level of education, and BMI
in either sex.
It was also shown in principal-components analysis that omitting breakfast
was not a typical aspect of slimming behaviour, because the loading on the first
factor was low. Thus, there is no reason to suppose that omitting breakfast is
characteristic of people who are trying to loose body weight by reducing their
total energy intake. Omitting breakfast had a negative loading on the fourth
factor, and this factor may be indicative of health-conscious behaviour. There
was an inverse relationship between the constructed health-conscious behaviour-
-index and BMI in both sexes. Therefore it may be hypothesized that the finding;
in other studies that frequency of food intake is inversely related to obesity
(13,27,28) and that omitting breakfast is more common in obese people (3,7), car
be explained by a less health-conscious type of behaviour among obese people,
and that frequency of food intake or omitting breakfast are indicators of this
type of behaviour.
The positive relationship observed between BMI and occupational physical
activity in males could be explained by a confounding effect of socio-economic
status. After adjustment for level of education the regression coefficient was
smaller, and was no longer significant in the employed males after adjustment
for level of occupation. Keys et ai. also observed such a confounding effect of
socio-economic status (20). The finding, that there is no inverse relationship
between occupational physical activity and relative weight, has also been
observed in other studies (14,23). This may be due to small differences in the
intensity of physical activity between the low and medium levels of occupationa'
physical activity, and the small number of people with a high level of
occupational physical activity. The positive relationship between lean body mas;
and physical activity at work, which was observed in a subsample of males in th<
present population (1) and by others (19,21,26) may also be partly responsible
for the absence of an inverse relationship.
The number of hours active sport per month, which was positively related to
level of education in both sexes and negatively related to age, especially in
males, was not independently related to BMI in females after adjustments for ag<
and level of education, but had a weak positive relationship in males. In the

51
present study, the subjects were asked to state the number of hours active
sport per month but not the type of sport, and thus the intensity of physical
activity was not taken into account. It may well be that heavier people tend to
choose sports which require less physical activity, but it is also possible
that they are less active while playing sport than lighter people (8). A more
obvious explanation may be the observed positive relationship between the
amount of active sport and lean body mass found in the subsample (1).
In summary, it can be concluded that there is a clear pattern within the
daily life-style variables considered, which suggests that the daily life-style
variables can be interpreted as indicators of more general types of behaviour,
some of which may be important determinants of obesity. It is necessary to
describe these types of behaviour in more detail and to study whether these
types of behaviour are causally related to obesity. This will be investigated
in a subsample of the present population in a prospective study, which will
also be concerned with personality traits, attitudes and knowledge about health
and nutrition, and more specific questions about eating behaviour, choice of
food and pattern of physical activity.
ACKNOWLEDGEMENTS
The authors wish to thank the Praeventiefonds in The Netherlands for the
financial support for this study; the Local Government Office and the Civil
Registration Office in Ede for assistance in the preparation of the study
population; and all the people who participated in the study. They would also
like to thank R. Roosen for assistance with the design of the study;
V. van de Braak, B. Gundlach, M. van Item, B. Janssen, W. Knuiman-Hijl,
M. Kraetzer, P. Middelburg, H. Nijenhuis, G. Sanderink-Hulsink, B. Schölte,
S. Vermaat-Miedema and H. West for technical assistance with the study.
REFERENCES
1. Baecke, J.A.H., Burema, J. & Frijters, J.E.R. (1982): A short questionnaire for the measurement of habitual physical activity in epidemiological studies. Am.J.Clin.Nutr., in press.
2. Baecke, J.A.H., Burema, J., Frijters, J.E.R., Hautvast, J.G.A.J. & Wiel-Wetzels, W.A.M. van der (1982): Obesity in young Dutch adults: I, socio-demographic variables and body mass index. Int.J.Obesity, in press.
3. Birkbeck, J.A. (1981): Obesity, socioeconomic variables and eating habits in New Zealand. J.Biosoc.Sci. 13, 299-307.

52
4. B l a i r , A. , B l a i r , S.N., Howe, H.G., Pate, R.R., Rosenberg, M., Parker, G.M. & P ick le, L.W. (1980): Physical, psychological, and sociodemographic differences among smokers, exsmokers, and non-smokers in a working population. Prev.Med. 9, 747-759.
5. B l i t ze r , P.H., Rimm, A.A. & Giefer, E.E. (1977): The e f fect of cessation of smoking on body weight in 57,032 women: cross-sectional and longitudinal analyses. J.Chron.Dis. 30, 415-429.
6. Bossé, R., Garvey, A.J. & Costa, P.T. (1980): Predictors of weight change fol lowing smoking cessation. I n t . J .o f the Addictions ^ 5 , 969-991.
7. Bul len, B.A., Monello, L .F. , Cohen, H. & Mayer, J . (1963): Att i tudes towards physical a c t i v i t y , food and family in obese and nonobese adolescent g i r l s . Am.J.Clin.Nutr. U, 1-11.
8. Bul len, B.A., Reed. R.B. & Mayer, J . (1964): Physical a c t i v i t y of obese and nonobese adolescent g i r l s appraised by motion p icture sampling. Am.J.Clin. Nutr. L4, 211-223.
9. Conway, T .L . , Vickers, R.R., Ward, H.W. & Rahe, R.H. (1981): Occupational stress and var iat ion in c igare t te , cof fee, and alcohol consumption. J.Health and Soc.Behavior. 22, 155-165.
10. Cummins, R.O., Shaper, A.G., Walker, M. & Wale, C.J. (1981): Smoking and drinking by middle-aged B r i t i sh men: ef fects of social class and town of residence. Br.Med.J. 283, 1497-1502.
11. Garrow, J .S . , Durrant, M., Blaza, S. , Wi lk ins, D., Royston, P. & Sunkin, S. (1981): The e f fect of meal frequency and protein concentration on the composition of the weight lost by obese subjects. Br.J.Nutr. 45, 5-15.
12. Gordon, T . , Kanne!, W.B., Dawber, T.R. & McGee, D. (1975): Changes associated wi th qu i t t i ng c igaret te smoking: The Framingham Study. Am.Heart J . 90, 322-328.
13. Hejda, S., Fabry, P. & Zvolänkovä, K. (1964): Frequency of food intake in re la t ion to some parameters of the nu t r i t i ona l s tatus. Nutr.Dieta 6, 216-228.
14. Hickey, N., Mulcahy, R., Bourke, G.J. , Graham, I . & Wilson-Davis, K. (1975): Study of coronary r isk factors related to physical a c t i v i t y in 15,171 men. Br.Med.J. 3, 507-509.
15. Higgins, M.W. & Kjelsberg, M. (1967): Characteristics of smokers and non-smokers in Tecumseh, Michigan. Am.J.Epidemiol. 86, 60-77.
16. I lmarinen, J . , Knauth, P., Rutenfranz, J . & Karvonen, M.J. (1980): Untersuchungen liber unterschiedliche präventive Effekte von habituel len körperlichen Akt iv i tä ten in Beruf bzw. F re ize i t . Int.Arch.Occup.Environ. Health 45, 15-33.
17. Jacobs, D.R. & Gottenborg, S. (1981): Smoking and weight: The Minnesota L ipid Research C l in ic . Am.J.Publ.Health 71 , 391-396.
18. Jenkins, C D . , Zyzanski, S.J. & Rosenman, R.H. (1973): B io log ica l , psychological and social character ist ics of men wi th d i f fe rent smoking habits. Health Serv.Rep. 88, 834-843.
19. Karvonen, M.J., Orma, E., Punsar, S . , Ka l l i o , V . , A r s t i l a , M., Luomanmäki, K. & Takkunen, J . (1970): Five year experience in Finland. In Amer. Heart Ass. Monograph nr 29, ed A. Keys, pp. 1-52-62, New York: The American Heart Association, Inc.

53
20. Keys, A., Aravanis, C., Blackburn, H.W., Buchem, F.S.P. van, Buzina, R., Djordjevic, B.S., Dontas, A.S., Fidanza, F., Karvonen, H.J., Kimura, N., Lekos, D., Monti, M., Puddu, V. S Taylor, H.L. (1967): Physical activity, occupation and socio-economic status. Acta Med.Scand.Suppl. 460, 278-288.
21. Keys, A. & Brozek, J. (1957): Overweight versus obesity and the evaluation of calorie needs. Metab.CI in.Exp. 4, 425-434.
22. Khosla, T. & Lowe, C R . (1972): Obesity and smoking habits by social class. Br.J.Prev.Soc.Med. 26, 249-256.
23. Kittel, F., Rustin, R.M., Dramaix, M., De Backer, G. & Kornitzer, M. (1978): Psycho-socio-biological correlates of moderate overweight in an industrial population. J.Psychosom.Res. 22, 145-158.
24. Kleinbaum, D.G. & Kupper, L.L. (1978): Applied regression analysis and other multivariable methods. North Scituate, Massachusetts: Duxbury Press.
25. Koskenvuo, M., Kaprio, J., Langinvainio, H., Romo, M. & Sarna, S. (1981): Psychosocial and environmental correlates of coronary-prone behavior in Finland. J.Chron.Dis. 34, 331-340.
26. Parizkova, J. (1977): Body fat and physical fitness. The Hague: Marti nus Nijhoff B.V.
27. Metzner, H.L., Lamphiear, D.E., Wheeler, N.C. & Larkin, F.A. (1977): The relationship between frequency of eating and adiposity in adult men and women in the Tecumseh Community Health Study. Am.J.Clin.Nutr. 30, 712-715.
28. Monello, L.F., Seltzer, C.C. & Mayer, J. (1965): Hunger and satiety sensations in men, women, boys and girls: A preliminary report. Ann.N.Y.Acad.Sei. 131, 593-602.
29. Montoye, J.H. (1975): Physical activity and health: an epidemiological study of an entire community. Englewood Cliffs: Prentice Hall, Inc.
30. Nie, N.H., Hadlai Hull, C , Jenkins, J.G., Steinbrenner, K. & Bent, D.H. (1975): Statistical package for the social sciences. New York: McGraw-Hill, Inc.
31. Noppa, H. & Bengtsson, C. (1980): Obesity in relation to smoking: A population study of women in Göteborg, Sweden. Prev.Med. , 534-543.
32. Osancova, K. & Hejda, S. (1975): Epidemiology of obesity. In Obesity: its pathogenesis and management, ed T. Sil verstone, pp. 57-91. Acton Massachusetts: Publishing Sciences Group.
33. Richardson, J.F. (1972): The sugar intake of businessmen and its inverse relationship with relative weight. Br.J.Nutr. 27, 449-460.
34. Rodin, J. (1981): Psychological factors in obesity. In Recent advances in obesity research: III, ed P. Björntorp, M. Cairella & A.N. Howard, pp. 106-123. London: John Libbey.
35. Tillotson, J.L., Gorder, D.D. & Kassim, N. (1981): Nutrition data collection in the Multiple Risk Factor Intervention Trial (MRFIT). J.Am.Diet.Ass. 78, 235-240. ~~
36. Westerlaak, J.M. van, Kropman, J.A. & Collaris, J.W.M. (1975): Beroepenklapper. Nijmegen: Instituut voor Toegepaste Sociologie.

55
4 BODY FATNESS, RELATIVE WEIGHT AND FRAME SIZE IN YOUNG ADULTS
JOS A.H. BAECKE, JAN BUREMA and PAUL DEURENBERG
Department of Human Nutrition, Agricultural University, De Dreijen 12, 6703 BC Wageningen, The Netherlands
Br.J.Nutr. 1982;48:1-6
SUMMARY
1. Body weight, body height, knee width, wrist width and skinfold
measurements were made on males (n=139) and females (n=167) in three age groups
(20-22, 25-27 and 30-32 years). Percentage of body fat was calculated from
skinfold thicknesses using regression equations according to Durnin & Womersley
(1974). Three indices of relative weight were calculated, namely W/H , W/Hp and
W/W, where W is body weight, H is body height, p is the exponent that made the
index of relative weight independent of height, and Q is the weight estimated
from body height and frame size.
2. The standard error of the estimate of body weight was only reduced by 5%
in males and by 13% in females, when in addition to body height knee width was
taken into account. The addition of wrist width did not improve the accuracy of
estimation of body weight in either sex. Therefore in further analyses W was
estimated from body height and knee width. In the present population the
exponent p was 1.7 in males and 1.6 in females.
3. The correlations between the percentage of body fat and the indices,
W/H , W/Hp, and W/W, were all very similar, being approximately 0.8 in both
sexes.
4. A positive relationship was observed between percentage of body fat and
knee width in females, which may be explained by an artifact of measurement.
5. In conclusion it can be stated that the accuracy of estimation of
percentage of body fat was not improved when the index of relative weight was
adjusted for knee width or wrist width in the present population. The W/H was
the most preferable of the three indices which were calculated.

56
INTRODUCTION
In epidemiological studies, several indices of relative weight have been
used as indicators of obesity. Previously, in the choice of an accurate index
of relative weight derived from measures of body weight and body height, two
criteria have been considered: first, the index should be relatively independent
of body height, and secondly, the correlation between the index and body fatness
should be as high as possible (Billewicz et ai., 1962; Keys et al., 1972). In 2 2
several studies the body mass index (weight/height ; W/H ) appeared to meet both
criteria for adult males (Florey, 1970; Keys et al., 1972; Womersley & Durnin,
1977; Watson et ai., 1979). In other studies in which no information about body
fatness was available, W/H2 appeared to be almost independent of body height in
males (Khosla & Lowe, 1967; Goldbourt & Medalie, 1974). W/H2 has also been shown
to be the most accurate index of relative weight in adult females (Womersley &
Durnin, 1977), but in other studies weight/height has been preferred (Florey,
1970; Watson et ai., 1979). Another method often used to obtain an index of
relative weight independent of height is to express the actual body weight as a
percentage of average weight of a reference population of the same body height
and sex.
The disadvantage of the indices of relative weight mentioned previously is
that they are confounded by body-build type; muscularity and skeletal robustness
are not taken into account (Seltzer et ai., 1970). In the weight standards
established by the Metropolitan Life Insurance Company (1959), weights are
categorized in terms of sex, body height and frame size, but no objective
definition of frame size is given. There are several bone diameters which are
related to skeletal frame size (Jackson & Pollock, 1976; Harrison et ai., 1977),
but in epidemiological studies it may be easiest to measure knee width and wrist
width. Furthermore, it was observed that the accuracy of estimating body weight
in young adults was not improved, when in addition to body height and knee width,
other bone diameters were included in multiple regression analysis (Wijn & /aat,
1968).
The purpose of the present study in young adults was first, to construct an
index of relative weight adjusted for body height and frame size, and secondly,
to investigate the relationship of this index and also of two weight-height
indices to body fatness derived from the sum of four skinfold thicknesses.
57
METHODS
Population. In the first part of 1980 a study was carried out in the
Municipality of Ede in The Netherlands in which all inhabitants in three age
groups (19-21, 24-26 and 29-31 years as at 1 January 1980) were invited to
participate (Baecke et al., 1981). Their addresses were obtained from the Civil
Registration Office in Ede. All the participants from three sections of the
municipality, with a distribution of sex, age and level of education comparable
with the total study population, were invited again in November 1980 to
participate in the present study. Complete information was obtained from 309
subjects, representing 70% of all invited subjects. Women, pregnant for three
months or longer (n=3), were excluded from further analyses.
Procedure. All subjects were invited by mail to visit a mobile research unit
which was stationed in each section for seven days. The anthropometric
measurements were made at the mobile research unit. Non-participants were
visited at home in order to invite them once again to participate.
Measurements. Body weight and body height without shoes and jacket were
measured to the nearest 0.1 kg and 0.1 cm, respectively. Knee width and wrist
width were measured on both sides of the body to the nearest 0.1 cm, according
to Meiner & Lourie (1969), using a GPM anthropometer. If the difference between
the left and right side measurements was greater than five percent, the width
measurements were repeated. The sum of left and right measurements were used in
further analyses. Biceps, triceps, suprailiac and subscapular skinfold
thicknesses were measured, according to Durnin & Rahaman (1967), twice on the
left side of the body to the nearest 0.2 mm using a Holtain skinfold caliper.
Body fat was calculated as a percentage of total body weight from the average
sum of the four skinfold thicknesses, using linear regression equations for
20-29 years old males and females (Durnin & Womersley, 1974). All measurements
were made by one observer for each sex, but it was not necessary to make
adjustment for observer bias, because the analyses for males and females were
done separately.
Three indices of relative weight were calculated, i.e. W/H , W/Hp, and W/W
where W is body weight, H is body height, p is the exponent which made the
index of relative weight independent of body height (calculated according to
Benn, 1971), and W is the body weight estimated from body height and frame size.

58
statistical Methods, stepwise multiple regression analysis was done with body
weight as a dependent variable and body height, knee width, and wrist width as
independent variables. Product-moment correlation-coefficients were calculated
in order to study the relationship between the indices of re lat ive weight and
percentage of body fa t , body height, and knee width.
RESULTS
Table 1 shows the distribution of age in the study population. The three
age groups appeared to be reasonably well represented in both sexes.
Table 1.
DISTRIBUTION OF AGE OF THE STUDY POPULATION
Age Males Females
(years) (n=139) (n=167)
20 - 22
25 - 27
30 - 32
38.1
35.3
26.6
35.9
31.1
32.9
Table 2 shows mean values with their standard errors for the anthropometric
measurements. The distributions of the percentage of body fat in males and
body weight in females were slightly skewed to the right, but all other
measurements had an approximately normal distribution.
The estimation of body weight from body height, knee width and wrist width
in multiple regression analysis is shown in Table 3. It was observed, that the
accuracy of estimation of body weight from body height was slightly improved
in both sexes, when knee width was also taken into account. The addition of
wrist width in the third step did not improve the accuracy of estimation. Even
when knee width was excluded, the contribution of wrist width in addition to
body height was not significant in either sex. In an additional analysis, the
interaction term of body height and knee width was introduced, but did not
appear to be statistically significant. As the accuracy of estimation of body
weight was not improved after logarithmic transformations of all measurements,
the simpler equations without transformation were used to calculate Î).

59
Table 2
MEAN BODY WEIGHT, BODY HEIGHT, KNEE WIDTH, WRIST WIDTH AND PERCENTAGE OF BODY FAT IN MALES AND FEMALES
Measurement
Body weight (kg)
Body height (cm)
Knee width (cm)
Wrist width (cm)
Body fat (%)
Males (n=139
mean
76.9
180.5
19.2
11.5
17.0
SE
0.9
0.6
0.1
0.1
0.4
Females (n=167)
mean
62.5
167.3
17.2
10.0
27.3
SE
0.6
0.4
0.1
0.0
0.4
Table 3.
REGRESSION COEFFICIENTS OF STEPWISE MULTIPLE REGRESSION ANALYSIS WITH BODY WEIGHT (kg) AS DEPENDENT VARIABLE AND BONE MEASUREMENTS (cm) AS INDEPENDENT VARIABLES IN MALES AND FEMALES
Independent variables Males (n=139)
Females (n=167)
step 1 step 2 step 3 step 1 step 2 step 3
Intercept
Body height
Knee width
Wrist width
-58.18
0.75*
>.24 -85.74 .x 0 5 ] x
4.42x
-1.30
0.49
4.0l'
-40.39
0.62*
-85.34
0.33*
5.42*
-84.93
0.34*
5.49*
-0.32
SEE
0.29
8.55
0.36
8.11
0.37
8.11
0.17
7.53
0.38
6.52
0.39
6.54
SEE, square root of residual variance.
P < 0.001.

60
The relationships of W/H , W/Hp, and W/W with percentage of body fat, body
height, and knee width are shown in Table 4. In the present study the exponent
p in W/Hp, which rendered an index of relative weight almost completely
independent of body height, was 1.7 in males and 1.6 in females. The
correlations of the percentage of body fat with the three indices were all
equal in males (0.81). In females, the correlations of the percentage of body
fat with the three indices were similar, although the correlation with W/W was
slightly lower (0.76). This finding may have been due to an artifact of
measurement, because the correlation between the percentage of body fat and
knee width was 0.26 (P < 0.001) in females. As a consequence of the latter, the
index adjusted for knee width (W/W) was inevitably adjusted to some extent for
body fatness. All three indices were independent of body height, but W/H and
W/Hp correlated with knee width in both sexes.
Table 4.
PRODUCT-MOMENT CORRELATION-COEFFICIENTS OF W/H2, W/HP AND W/w' WITH PERCENTAGE OF BODY FAT, BODY HEIGHT AND KNEE WIDTH IN MALES AND FEMALES
,-1
Sex
Males (n=139)
Females (n=167)
Index
W/H2
W/H1-7
W/W
W/H2
W/H1'6
W/W
Percentage of body fat
0.81XXX
0.81xxx
0.81xxx
0.79XXX
0.80xxx
0.76XXX
Body height
-0.08
0.03
0.01
-0.11
0.00
-0.01
Knee width
0.24XX
0.30XXX
0.00
0.42XXX
0.47XXX
-0.02
W/H , weight/height ; W/H , weight/height (p is 1.7 in males and 1.6 in females); W/W, weight/predicted weight (weight is predicted from the multiple regression equation with height and knee width).
X X P < 0.01, X X X P < 0.001.
DISCUSSION
The densitometric method has often been considered to be the most accurate
method of determining body fatness in vivo, but Womersley & Durnin (1977)

61
estimated that the accuracy of the densitometryc method and the skinfold
method in the prediction of percentage of body fat are probably of the same
order of magnitude. Thus, it seems reasonable to assume that the skinfold
method is an adequate reference for body fatness in the present study.
The standard error of the estimate of body weight was only reduced by
approximately 5% in males and by approximately 13% in females, when in
addition to body height, knee width was taken into account. The regression
coefficients of knee width suggested that knee width had a great influence
on body weight in both sexes. However, it should be noted that the regression
coefficient of body height decreased considerably, when knee width was added
as an independent variable, because of a relationship between body height and
knee width. Wrist width did not improve the accuracy of estimation of body
weight. Similarly, it was shown in a study in young adults that the additional
contribution of shoulder, chest and pelvic width was also small (Wijn & Zaat,
1968). Explanations for these findings may well be: first, that only a small
proportion of body weight consists of bone tissue (approximately 14%; Passmore
& Robson, 1973); secondly, that bone mass can be predicted mainly from body
height; and thirdly, that there is a weak relationship between bone diameters
and muscle mass (Harrison et al., 1977). Brozek (1956) suggested that the
lateral size of the bony frame of the trunk is closely related to the size of
the skeletal musculature and viscera. Thus, it may be implied that the bone
diameters of the trunk are more important in the prediction of body weight
than diameters of limb bones, but this is not in accordance with the findings
of Wijn & Zaat (1968).
The correlation of the percentage of body fat with W/W was not higher than
the correlation of the percentage of body fat with W/H2, and with W/H*3. This
finding is in agreement with the small improvement in the accuracy of estimation
of body weight from knee width. In females, the correlation of the percentage of
body fat with W/W was even smaller than the correlation of the percentage of
body fat with W/H2, and with W/Hp. This finding may well be the result of an
artifact of measurement, because some subcutaneous fat may be unavoidably
included in the anthropometric measurement of knee width (Harrison et ai., 1977). The relationship between the percentage of body fat and knee width
was only significant in females. Keys et ai. (1967) observed a positive
relationship between the laterality-linearity index (sum of the bi-acromial and
bi-cristal diameter : total body height) and skinfold thickness in adult males,
which was not considered to be the result of an artifact of measurement. The
suggested artifact may only occur in the measurement of knee width. This is
supported by another study in adults, in which it was shown by factor analysis,
62
that the anthropometric measurement of knee width was related to fat
measurements, but this relationship was not observed for the bi-acromial and
bi-cristal diameter measurements (Harrison et ai., 1977).
No difference was found between the correlation of the percentage of body
fat with W/H , and with W/Hp in males, and the difference in females was
negligible. This can be explained by the fact that W/H is almost independent
of body height in this population. The correlation of W/H with the percentage
of body fat was of the same order of magnitude as was found in adult males by
Keys et ai. (1972).
In conclusion, it can be stated that the relationship between the percentage
of body fat and the index of relative weight was not improved after the index
had been adjusted, not only for body height, but also for knee width or wrist
width. Adjustment of the index of relative weight for other bone diameters is
also unlikely to improve the accuracy of prediction of body fatness, because of
the small improvement in the accuracy of estimation of body weight, when in
addition to body height and knee width, other bone diameters are taken into
account (Wijn & Zaat, 1968). This would have the practical consequence that in
general adjustment of body weight for skeletal frame size does not improve the
accuracy of prediction of body fatness. The W/H often referred to as the body
mass index, is the most preferable of the three indices which were calculated.
This index appeared to be the most accurate index of relative weight for adults
in several studies, and hence has been used regularly, with the additional
advantage of making comparisons between studies easier.
ACKNOWLEDGEMENTS
The authors wish to thank the Praeventiefonds in The Netherlands for the
financial support for this study; the Local Government Office and the Civil
Registration Office in Ede for assistance in the preparation of the study
population; and all the people who participated in the study. They would also
like to thank K. Baerends-Bos, W. Knuiman-Hijl, E. Oosterhaven-Rappard,
B. Schölte, H. West and W. van der Wiel-Wetzels for technical assistance with
the study.

63
REFERENCES
Baecke, J.A.H., Burema, J. & Wiel-Wetzels, W.A.M, van der (1981). Prevalentie van overgewicht bij jonge volwassenen in Ede. Wageningen: Department of Human Nutrition, Agricultural University.
Benn, R.T. (1971). Br.J.prev.soc.Med. 25, 42.
Billewicz, W.Z., Kemsley, W.F.F. & Thomson, A.M. (1962). Br.J.Drev.soc.Med. 26, 183.
Brozek, J. (1956). Science,N.Y. 124, 685.
Durnin, J.V.G.A. & Rahaman, H.M. (1967). Br.J.Nutr. 21, 681.
Durnin, J.V.G.A. & Womersley, J. (1974). Br.J.Nutr. 32, 77.
Florey, C. du V. (1970). J.Chron.Dis. 23, 93.
Goldbourt, U. & Medal i e , J.H. (1974). Br.J.prev.soc.Med. 28, 116.
Harrison, G.A., Weiner, J .S . , Tanner, J.M. & Barnicot, N.A. (1977). Human Biology, 2nd ed. Oxford: University Press.
Jackson, A.S. & Pollock, M.L. (1976). Med.Science Sports 8, 196.
Keys, A . , Aravanis, C , Blackburn, H.W., Buchem, F.S.P. van, Buzina, R., D jordjevic, B.S., Dontas, A .S. , Fidanza, F., Karvonen, M.J., Kimura, N., Lekos, D., Monti, M., Puddu, V. & Taylor, H.L. (1967). Acta Med.Scand.Suppl. 460, 289.
Keys, A. , Fidanza, F., Karvonen, M.J., Kimura, N. & Taylor H.L. (1972). J.Chron.Dis. 25, 329.
Khosla, T. & Lowe, CR. (1967). Br.J.prev.soc.Med. 21 , 122.
Metropolitan Life Insurance Company (1959). Stat.Bull. 40, 1.
Passmore, R. & Robson, J.S. (1973). A Companion to Medical Studies, vol. 1, 2nd ed. Oxford: Blackwell Scientific Publications.
Seltzer, C.C., Stoudt, H.W.Jr., Bell, B. & Mayer, J. (1970). Am.J.Epidemiol. 92, 339.
Watson, P.E., Watson, I.D. & Batt, R.D. (1979). Am.J.Clin.Nutr. 32_, 736.
Weiner, J.S. & Lourie, J.A. (1969). Human Biology. A Guide to Field Methods, 1st ed. Oxford: Blackwell Scientific Publications.
Womersley, J. & Durnin, J.V.G.A. (1977). Br.J.Nutr. 38, 271.
Wijn, J.F. de & Zaat, J.CA. (1968). Voeding 29, 208.

65
5 A SHORT QUESTIONNAIRE FOR THE MEASUREMENT OF HABITUAL PHYSICAL ACTIVITY IN EPIDEMIOLOGICAL STUDIES
JOS A.H. BAECKE, JAN BUREMA and JAN E.R. FRIJTERS
Department of Human Nutrition, Agricultural University, De Dreijen 12, 6703 BC Wageningen, The Netherlands
Am.J.Clin.Nutr., in press
ABSTRACT
The construct v a l i d i t y and the tes t - re tes t r e l i a b i l i t y of a se l f -
administered questionnaire about habitual physical a c t i v i t y were investigated
in young males (n=139) and females (n=167) in three age groups (20-22, 25-27
and 30-32 years) in a Dutch population. By principal-components analysis three
conceptually meaningful factors were d ist inguished. They were interpreted as:
1 , physical a c t i v i t y at work; 2, sport during le isure t ime; and 3, physical
a c t i v i t y during le isure time excluding sport. Test-retest showed that the
r e l i a b i l i t y of the three indices constructed from these factors was adequate.
Further, i t was found that level of education was inversely related to the work
index, and pos i t ive ly related to the le isure-t ime index in both sexes. The
subjective experience of work load was not related to the work index, but was
inversely related to the sport index, and the le isure-t ime index in both sexes.
The lean body mass was pos i t ive ly related to the work index, and the sport
index in males, but was not related to the le isure-t ime index in e i ther sex.
These differences in the relat ionships support the subdivision of habitual
physical a c t i v i t y in to the three components mentioned above.
INTRODUCTION
Measurement of physical activity is often found to be important in research
about health, especially in the area of cardiovascular disease and obesity. The
accuracy in assessing energy expenditure by both direct and indirect calorimetry
techniques is good, but these laboratory techniques are not applicable to large
scale epidemiological studies.

66
There are various methods for measuring physical activity in larger scale
epidemiological studies. Body movement can be measured with pedometers, but
this method has limitations as it only measures certain types of movement (1).
Two further techniques are monitoring heart rate with a portable heart rate
recorder (1,2) and the use of an activity diary in which the subjects record
their activities (1). With all three methods, information is only collected
about a relatively short period of time and the long-term pattern of habitual
physical activity of the individual is not measured. In studying the
relationship between physical activity and health, it is necessary to consider
not only the total energy expenditure during a certain day or week, but also
to consider the pattern of habitual physical activity over a longer period.
Questionnaires developed to measure habitual physical activity at work and
during leisure time have been used in observational studies, such as the
Framingham Study (3) and the Tecumseh Community Health Study (4). A questionnaii
was also developed to assess habitual physical activity only during leisure timt
by Taylor et ai. (5). The three questionnaires, which were not designed to be
self-administered, measured habitual physical activity in terms of the usual
time spent in various types of activity. This was then multiplied by the energy
expenditure per unit of time of the activity. The values for the intensity of
the activities were derived from data in the literature. In the Health Insuranci
Plan Study, a sel f-administered questionnaire containing ten items about
occupational and leisure time physical activity, was used (6). The scores were
calculated without the use of intensities for the different types of activities
To the authors' knowledge, the reliability of the questionnaires mentioned
above has not been tested. Criterion-oriented validation (concurrent validation
is not possible because a valid reference method which measures habitual
physical activity independently, does not exist. Therefore, some investigators
have studied the relationship between the assessed habitual physical activity
and another parameter which is assumed to be related to habitual physical
activity, e.g. physical work capacity (5). It is of interest to study the
construct validity of the questionnaire (7), especially when a completely valid
criterion is not available. This implies that an adequate investigation
encompasses the study of subdivision of physical activity into more specific
groupings of activities. Up until now two dimensions of habitual physical
activity have been distinguished namely, occupational and leisure time physical
activity. However, it may be possible to distinguish more or other dimensions,
which are important to the description of the pattern of habitual physical
activity.

67
The purpose of the present study in young adults is firstly, to investigate
the construct validity of a self-administered questionnaire about habitual
physical activity and to establish meaningful indices of physical activity,
secondly, to estimate the test-retest reliability of the questionnaire, and
thirdly, to investigate the relationship between the indices of physical
activity and age, level of education, subjective experience of work load, and
lean body mass.
METHODS
population. In the first part of 1980 a study was carried out in the Municipality
of Ede in The Netherlands in which all the inhabitants in three age groups
(19-21, 24-26 and 29-31 years as at 1 January 1980) were invited to participate
(8). Their addresses were obtained from the Civil Registration Office in Ede.
All the participants from three sections of the municipality, with a distribution
of sex, age and level of education comparable with the total study population,
were invited again in November 1980 to participate in the present study. Complete
information was obtained from 309 subjects, representing 70% of all invited
subjects. Women, pregnant for three months or longer (n=3), were excluded from
further analyses.
Procedure. All subjects were invited by mail to complete the questionnaire at
home and then to visit a mobile research unit which was stationed in each
section of the municipality for seven days. The questionnaire was checked for
completeness and the anthropometric measurements were made at the mobile
research unit. Body weight and body height without shoes and jacket were
measured to the nearest 0.1 kg and 0.1 cm, respectively. Biceps, triceps,
suprailiac and subscapular skinfold thicknesses were measured, according to
Durnin and Rahaman (9), twice on the left side of the body to the nearest 0.2
mm using a Holtain skinfold caliper. Body fat was calculated as a percentage of
total body weight (BF%) from the average sum of the four skinfold thicknesses,
using linear regression equations for 20-29 year old males and females (10).
Lean body mass (LBM) was calculated from total body weight (W) and BF%
(LBM = W (100 - BF%)/100).
About three months after this examination, the participants were visited at
home and requested again to complete the questionnaire on habitual physical
activity so that the test-retest reliability could be studied. The visit was
68
part of a food consumption study in which 90% (n=277) of all subjects
participated.
Questionnaire. Using a questionnaire, information was collected on the level of
education, subjective experience of work load and habitual physical activity.
The present subdivision of education into three levels has been described
elsewhere (8). Subjective experience of work load was measured by means of an
existing Dutch questionnaire (SEUL) devised by Josten (11). This questionnaire
consists of 53 items referring to daily activities. It contains a dichotomous
response format; a subject experiences a certain activity either as physically
strenuous or not. This response scale is different from the Borg's perceived
exertion rating scale (12), however it may be assumed that both scales are
related to the identical concept.
The original questionnaire on habitual physical activity consisted of 29
items concerning the following five components: occupation, movement, sport,
leisure time activities excluding sport, and sleeping habits. All responses
were precoded on five-point scales with the exception of the questions on the
name of main occupation and the types of sport played. Three levels of
occupational physical activity were defined according to The Netherlands
Nutrition Council (13): the low level for occupations as, clerical work,
driving, shopkeeping, teaching, studying, housework, medical practice, and all
other occupations with a university education; the middle level for occupations
such as, factory work, plumbing, carpentry and farming; and the high level for
occupations such as, dock work, construction work, and sport.
Sports were subdivided into three levels of physical activity according to
Durnin and Passmore (14); the low level for sports such as, billiards, sailing,
bowling and golf (average energy expenditure 0.76 MJ/h); the middle level for
sports such as, badminton, cycling, dancing, swimming and tennis (average
energy expenditure 1.26 MJ/h); and the high level for sports such as, boxing,
basket ball, football, rugby and rowing (average energy expenditure 1.76 MJ/h).
A sport score was calculated from a combination of the intensity of the sport
which was played, the amount of time per week playing that sport, and the
proportion of the year in which the sport was played regularly (see Appendix).
statistical methods. Principal-components analysis with quartimax rotation (15)
was used to find meaningful underlying dimensions of habitual physical activity
Only factors with Eigenvalues greater than 1.0 were retained for the final
rotated solution. Indices of physical activity were constructed from the

69
underlying concepts by combining the variables with high loadings (»0.50) on
the factor in question as described in the Appendix. With a second method,
factor scores of separate one-factor solutions of the appropriate set of
variables were calculated. Finally the first method was chosen because it was
the simplest and the correlation between the two methods was high for all
indices (r > 0.95).
Product-moment correlation-coefficients were calculated in order to study
the test-retest reliability, and for the determination of the relationships
between the indices of physical activity and age, level of education, and SEWL.
Multiple regression analysis was used to study the relationship between LBM and
the indices of physical activity, with adjustments for body height and
percentage of body fat being made by adding these variables simultaneously in
the analysis.
RESULTS
Table 1 shows the frequency distribution of age and level of education in
the present study population. There were a reasonable number of subjects in
each age group and each level of education in both sexes. Table 2 shows the
mean and standard deviation of body weight, body height and percentage of body
fat. The distribution of the percentage of body fat in males and body weight in
females were significantly skewed to the right, but other measurements were
approximately normally distributed.
Thirteen of the original 29 items about habitual physical activity were
excluded, because of a bimodal distribution of responses, or because the items
did not have a high loading on one specific factor. Table 3 contains the factor
loading matrix of the 16 remaining items. Data on males and females were pooled
because the sex-specific matrices showed a similar pattern. Items 1-8 had high
loadings on the first factor. Since these items were concerned with occupational
physical activity, the first factor may be interpreted as a dimension of
physical activity at work. The second factor is indicative of sport during
leisure time, because Items 9 and 12 which were concerned with sport had high
loadings on this factor. It appeared that Item 10 about the self-perception of
the degree of physical activity during leisure time and Item 11 about the
frequency of sweating during leisure time, were related to the same concept as
the items about sport. Items 13-16 about watching television, cycling and
talking during leisure time, and the time spent walking and/or cycling per day

70
to and from work, school, and shopping had high loadings on the third factor.
This third factor may be interpreted as a dimension of habitual physical
activity during leisure time excluding sport.
Table 1
FREQUENCY DISTRIBUTION OF AGE AND LEVEL OF EDUCATION IN MALES AND FEMALES
Variable
Age (years):
20 - 22
25 - 27
30 - 32
Level of education:
low
middle
high
Males (n=139)
%
38.1
35.3
26.6
18.0
48.2
33.8
Females (n=167)
%
35.9
31.1
32.9
25.7
52.1
22.2
Table 2
MEAN BODY WEIGHT, BODY HEIGHT AND PERCENTAGE OF BODY FAT IN MALES AND FEMALES
Measurement
Body weight (kg)
Body height (cm)
Body fat (%)
Males (n=139)
mean
76.9
180.5
17.0
SD
10.1
7.2
4.5
Females (n=167)
mean SD
62.5 8.3
167.3 5.6
27.3 5.0
For fur ther analysis, indices of physical a c t i v i t y were established fo r the
three factors mentioned above. The mean scores of the indices of work and
le isure time were s i gn i f i can t l y higher i n females than in males (Table 4 ) ,
while the mean score of the sport index was s ign i f i can t l y higher in males. The
tes t - re tes t r e l i a b i l i t y of the work index, sport index and le isure-t ime index
were 0.88, 0.81 and 0.74, respect ively.

71
Table 3
FACTOR-LOADING MATRIX OF THE ITEMS ABOUT PHYSICAL ACTIVITY1
COMBINED RESULTS OF MALES (n=139) AND FEMALES (n=167)
Item
1
0.74
-0.85
0.80
0.81
0.83
0.59
0.57
0.71
-0.09
0.04
-0.13
-0.12
0.15
-0.02
-0.03
0.03
Factor
2
-0.08
0.05
-0.02
-0.06
0.02
-0.23
0.04
0.04
0.86
0.78
0.59
0.87
-0.10
-0.09
0.15
0.04
3
-0.08
-0.01
0.01
-0.02
-0.01
0.10
-0.09
-0.05
-0.09
0.23
0.18
-0.06
-0.52
0.72
0.79
0.50
1
2
3
4
5
6
7
8
9
10
11
12
13
14
15
16
Explained variation (%)' 28.0 16.0 11.1
1 . 2 See appendix for the items. After rotation.
Table 4
MEAN SCORES OF THE INDICES OF PHYSICAL ACTIVITY IN MALES AND FEMALES
Index
Work
Sport
Leisure-•time
Males (n=139)
mean
2.6
2.8
2.8
SEM
0.1
0.1
0.1
Females (n=167)
mean
2.9
2.4
3.1
SEM
0.0
0.1
0.0
P-value
< 0.001
< 0.001
< 0.01

72
Table 5 shows the relationship between the indices of physical activity and
age, level of education, and SEWL. Age was related to the work index only in
females, the index was higher in the older females. The level of education was
inversely related to the work index, and positively related to the leisure-time
index in both sexes, while in females there was also a weak positive relation
ship between the level of education and the sport index. SEWL was inversely
related to the sport index, and the leisure-time index in both sexes.
Multiple regression analysis showed a positive relationship between LBM and
the work index, and the sport index in males (Table 6 ) . Body height and the
percentage of body fat were also positively related to the LBM in males as well
as in females. Interaction terms were introduced in an additional analysis, but
didnot appear to be statistically significant.
Table 5
PRODUCT-MOMENT CORRELATION-COEFFICIENTS OF THE INDICES OF PHYSICAL ACTIVITY WITH AGE, LEVEL OF EDUCATION AND SEWL1, IN MALES AND FEMALES
Sex
Males (n=139)
Females (n=167)
Index
Work
Sport
Leisure-time
Work
Sport
Leisure-time
Age
-0.15
0.04
0.05
0.19X
0.00
-0.01
Level of education
-0.56xxx
0.13
0.38XXX
-0.25XXX
0.17X
0.34XXX
SEWL
0.11
-0.20X
- O ^ * *
0.09
-0.24XX
-0.18X
Subjective Experience of Work Load.
X P < 0.05, ^ P < 0.01, X x x P < 0.001.

73
Table 6
MULTIPLE REGRESSION ANALYSIS WITH LBM (kg) AS DEPENDENT VARIABLE AND THE INDICES OF PHYSICAL ACTIVITY, BODY HEIGHT (cm) AND BODY FAT (%) AS INDEPENDENT VARIABLES IN MALES AND FEMALES
Independent variables
Intercept
Work index
Sport index
Leisure-time index
Body height
Body fat
R2
Males (n=139)
B
-66.66
1.36X
1.23X
0.15
0.64xx
0.47xx
0.65
SE
0.42
0.43
0.49
0.05
0.07
Females (n=167)
B
-40.51
0.48
0.23
-0.27
0.47^
0.25XX
0.46
SE
0.41
0.36
0.42
0.04
0.05
X p < o.oi, X X P < 0.001.
DISCUSSION
In the present study population, there were a reasonable number of subjects
from each level of education. This has the advantage that the questionnaire
which has been developed can be used for the various socio-economic classes in
the general population. The average anthropometric measures also showed that
the study population was similar to the general population with respect to body
composition.
By means of principal-components analysis, three meaningful factors could
be distinguished within the aspects of habitual physical activity which were
studied. The first factor consisted of aspects of occupational physical activity
(Items 1-8). As all occupations have been precoded according to three levels of
physical activity, Item 1 gives an objective measure of physical activity at
work. However, this measure has the disadvantage, that a particular occupation
is always classified in the same way and therefore inter-individual variability
in physical activity within a certain occupation is not taken into account. The
measurement of physical activity at work can be improved with the addition of

74
Items 2-8 concerning self-assessment of physical activity. It has been shown
that self-assessment of physical activity parallels the scores of actual
physical activity reasonably well (16).
The second factor can be interpreted as sport during leisure time. Items 10
and 11 about habitual physical activity during leisure time in general were
related to sport. This finding suggests that people connect physical activity
during leisure time mainly with playing sport. Bullen et ai. (17), who measured
physical activity by observation, showed that there is inter-individual
variability in the energy expenditure within certain types of sport. It can be
suggested that this inter-individual variability is partly taken into account
by Items 10 and 11. In addition to sport in leisure time, another dimension of
physical activity in leisure time could be distinguished. This relates to
watching television, walking and cycling during leisure time in general, and
the time spent walking and/or cycling per day to and from work, school and
shopping, in particular.
The test-retest reliability of the indices of physical activity, measured
with an interval of three months, being between 0.80 and 0.90 for the work
index and sport index, and 0.74 for the leisure-time index, makes the
questionnaire useful.
The finding, that the level of education was inversely related to the work
index, and positively related to the leisure-time index, is in accordance with
the results of the Oslo Study (18). The sport index also tended to be positively
related to the level of education, but this was only significant in females. The
inverse relationship observed between SEWL and the sport index, and leisure-time
index, while SEWL was not related to the work index, may be explained by the
fact that there is more freedom of choice in the selection of activities during
leisure time than at work. People who have a high SEWL tend to choose more
sedentary activities during leisure time than people with a low SEWL.
LBM was chosen as a parameter of body composition because there is supposed
to be a relationship between LBM and physical activity. However, in analysing
the relationship between LBM and the indices of physical activity, adjustments
for body height and the percentage of body fat should be made. The effects of
the percentage of body fat may be especially confusing since the relationship
of body fat to LBM is assumed to be positive (19,20), whereas that of body fat
to physical activity may be negative. The adjusted positive relationship
between LBM and the work index, and the sport index in males is in accordance
with the positive relationship between LBM and physical activity observed by
others (21,22,23). The leisure-time index was not related to LBM, which may

75
indicate that the intensities of the activities during leisure time are too low
to affect LBM. The independence of physical activity and LBM observed in
females may also be explained in the same way.
In summary, it was concluded that habitual physical activity encompassed
three distinct dimensions. These were physical activity at work, sport during
leisure time, and other physical activity during leisure time. The indices of
physical activity derived from these dimensions were reliable. The differences
in the relationships between the three indices of physical activity on one side
and level of education, SEWL and LBM on the other, emphasize the need to
distinguish the three dimensions. Therefore, the present study suggests that
habitual physical activity can be determined when these three factors are
measured and included in the assessment.
ACKNOWLEDGEMENTS
The authors wish to thank the Local Government Office and the Civil
Registration Office in Ede for assistance in the preparation of the study
population; and all the people who participated in the study. They would
also like to thank K. Baerends-Bos, P. Deurenberg, Y. van Erp, R. Hoogkamer-
Weijman, W. Knuiman-Hijl, E. Oosterhaven-Rappard, B. Schölte, H. West and
W. van der Wiel-Wetzels, for technical assistance with the study.
REFERENCES
1. Garrow JS. Energy balance and obesity in man. 2nd ed. Amsterdam: Elsevier/North-Holland Biomedical Press, 1978.
Saris WHM, Snel P, Baecke J, Waesberghe F van, Binkhorst RA. A portable miniature solid-state heart rate recorder for monitoring daily physical activity. Biotelemetry 1977;4:131-40.
Kannel WB, Sorlie P. Some health benefits of physical activity. The Framingham study. Arch Intern Med 1979;139:857-61.
. Rei ff GG, Montoye HJ, Remington RD, Napier JA, Metzner HL, Epstein FH. Assessment of physical activity by questionnaire and interview. In: Karvonen MJ, Barry AJ, eds. Physical activity and the heart. Springfield: Thomas, 1967:336-72.
5. Taylor HL, Jacobs DR Jr, Schucker B, Knudsen J, Leon AS, Debacker G. A questionnaire for the assessment of leisure time physical activities. J Chronic Dis 1978;31:744-55.
6. Shapiro S, Weinblatt E, Frank CW, Sager RV. The H.I.P. study of incidence and prognosis of coronary heart disease. J Chronic Dis 1965;18:527-58.
76
7. Cronbach LJ, Meehl PE. Construct validity in psychological tests. Psychol Bull 1955;52:281-301.
8. Baecke JAH, Burema J, Frijters JER, Hautvast JGAJ, Wiel-Wetzels WAM van der. Obesity in young Dutch adults: I, socio-demographic variables and body mass index. Int J Obesity 1982; in press.
9. Durnin JVGA, Rahaman MM. The assessment of the amount of fat in the human body from measurements of skinfold thickness. Brit J Nutr 1967;21:681-9.
10. Durnin JVGA, Womersley J. Body fat assessed from total body density and its estimation from skinfold thickness: measurements on 481 men and women aged from 16 to 72 years. Brit J Nutr 1974;32:77-97.
11. Josten JGJE. Subjektieve belasting door lichamelijke aktiviteit. Leiden: Nederlands instituut voor Praeventieve Geneeskunde TNO, 1973.
12. Borg, G, Linderholm H. Perceived exertion and pulse rate during graded exercise in various age groups. Acta Med Scand Suppl 1967;472:194-206.
13. Nederlandse Voedingsmiddelentabel. 32nd ed. 's-Gravenhage: Voorlichtingsbureau voor de Voeding, 1979.
14. Durnin JVGA, Passmore R. Energy, work and leisure. 1st ed. London: Heinemann Educational Books Ltd, 1967.
15. Nie NH, Had!ai Hull C, Jenkins JG, Steinbrenner K, Bent DH. Statistical package for the social sciences. New York: Mc Graw-Hill, Inc, 1975:468-514.
16. Chave SPW, Morris JN, Moss S. Vigorous exercise in leisure time and the death rate: a study of male civil servants. J Epidemiol Comm Health 1978; 32:239-43.
17. Bullen BA, Reed RB, Mayer J. Physical activity of obese and nonobese adolescent girls appraised by motion picture sampling. Am J Clin Nutr 1964; 14:211-23.
18. Holme I, Helgeland A, Hjermann 1, Lund-Larsen PG, Leren P. Coronary risk factors and socioeconomic status. The Oslo study. Lancet 1976;2:1396-8.
19. James WPT, Bai les J, Davies HL, Dauncey MJ. Elevated metabolic rates in obesity. Lancet 1978;1:1122-5.
20. Womersley J, Durnin JVGA, Boddy K, Mahaffy M. Influence of muscular development, obesity, and age on the fat-free mass of adults. J Appl Physiol 1976;41:223-9.
21. Karvonen MJ, Orma E, Punsar S et al. Five year experience in Finland. In: Keys A, ed. Coronary heart disease in seven countries. New York: Am Heart Ass, Inc, 1970;I-52-62.
22. Keys A, Brozek J. Overweight versus obesity and the evaluation of calorie needs. Metab Clin Exp 1957;4:425-34.
23. Parizkova J. Body fat and physical fitness. The Hague: Marti nus Nijhoff BV, 1977.

77
Appendix
Questionnaire, codes and method of calculat ion of scores on habitual physical a c t i v i t y .
What is your main occupation?
At work I sit
never/seldom/sometimes/often/always
At work I stand
never/seldom/sometimes/often/always
At work I walk
never/seldom/sometimes/often/always
At work I lift heavy loads
never/seldom/sometimes/often/very often
After working I am tired
very often/often/sometimes/seldom/never
At work I sweat
very often/often/sometimes/seldom/never
In comparison with others of my own age
I think my work is physically
much heavier/heavier/as heavy/lighter/much lighter
9) Do you play sport?
yes/no
If yes:
- which sport do you play most frequently?
- how many hours a week?
- how many months a year?
I f you play a second sport:
- which sport i s i t ?
- how many hours a week?
- how many months a year?
10) In comparison with others of my own age I think my physical
a c t i v i t y during leisure time is
much more/more/the same/less/much less
11) During leisure time I sweat
very often/often/sometimes/seldom/never
12) During leisure time I play sport
never/seldom/sometimes/often/very often
13) During leisure time I watch te lev is ion
never/seldom/sometimes/often/very often
14) During leisure time I walk
never/seldom/sometimes/often/very often
15) During leisure time I cycle
never/seldom/sometimes/often/very often
16) How many minutes do you walk and/or cycle per
day to and from work, school and shopping?
<5/5-15/15-30/30-45/>45
<l/l-2/2-3/3-4/>4 <l/l-3/4-6/7-9/>9
<l/l-2/2-3/3-4/>4 <l/l-3/4-6/7-9/>9
Calculation of the simple sport-score ( I g ) :
(a score of zero is given to people who do not play sport)
l ( In tensi ty x Time x Proportion) i = l
0/0.01-<4/4-<8/8-<12/>12
2 - 3 - 4 - 5
- 2 - 3 - 4 - 5
Intensity
Time
0.76 - 1.26 - 1.76
0.5 - 1.5 - 2.5 - 3.5 - 4.5
Proportion 0.04 - 0.17 - 0.42 - 0.67 - 0.92
Intensity 0.76 - 1.26 - 1.76
Time 0.5 - 1.5 - 2.5 - 3.5 - 4.5
Proportion 0.04 - 0.17 - 0.42 - 0.67 - 0.92
3 - 2 - ]
1 - 2 - 3 - 4 - 5
1 - 2 - 3 - 4 - 5
Calculation of scores of the indices of physical a c t i v i t y :
WORK INDEX = { I j + ( 6 - I 2 ) + I 3 + I 4 + I 5 + I 6 + I7 + I 8}/8
SPORT INDEX = { I 9 + I 1 0 + I n + I 1 2>/4
LEISURE-TIME INDEX ={ (6-1 13' + h& + ha + iifi>/4 44 15 x16'

79
6 FOOD CONSUMPTION, HABITUAL PHYSICAL ACTIVITY AND BODY FATNESS IN YOUNG DUTCH ADULTS
JOS A.H. BAECKE, WIJA A. VAN STAVEREN and JAN BUREMA
Department of Human Nutrition, Agricultural University, De Dreijen 12, 6703 BC Wageningen, The Netherlands
Am.J.Clin.Nutr., in press
ABSTRACT
The relationship between body fatness and both food consumption and habitual
physical activity, were studied in young adult males (n=122) and females (n=140)
in three age groups (20-22, 25-27 and 30-32 years) in a Dutch population. In
males the average daily energy intake was rather high (about 3000 kcal) and
average body weight increased by 1.2 kg in the preceding year. Both findings
suggest the existence of a positive energy balance. In females the average
daily energy intake was normal (2170 kcal) and average body weight remained
constant. Physical activity at work and sport were not related to the percentage
of body fat (BF%) in either sex, but physical activity, such as walking and
cycling during leisure time, was slightly lower in fatter males. The fatter
subjects tended to eat less than the leaner subjects but this was only
significant in females. However, after adjusting for lean body mass and physical
activity in a multiple regression model, energy intake was inversely related to
BF% in both sexes. Change in body weight in the period of four months preceding
the food consumption study seemed to reflect energy balance at the time of the
food consumption study in only leaner and fatter females. After adjusting also
for change in body weight in these females energy intake of fatter females
remained lower, suggesting a reduced need for energy among many fatter females.
INTRODUCTION
In several studies in adult populations an inverse relationship between
relative weight or body fatness and energy intake has been observed (1-3),
while others have observed non-significant trends, both negative (4,5) and

80
positive (6,7). Physical activity, however, should be taken into consideration
as a possible confounder of the relationship between body fatness and energy
intake. In the Framingham study, it appeared that the fatter subjects not only
had a lower energy intake per unit of body weight, but they also had a lower
score for physical activity (8). A similar trend was also observed by Hutson
et ai. (9). Other studies have shown no differences between obese and control
groups with respect to energy intake and physical activity (10-12).
In general, studies do not support the hypothesis that obese people eat
more, or are less physically active than non-obese people. Three aspects may be
important in order to explain these findings; the accuracy of the methods used,
the time of measurement and physiological confounders.
It may be that the field methods used to measure energy intake and
expenditure are inadequate to detect an energy imbalance (13). It is also
possible that obese people systematically under-report the quantity of food
they eat, as has been shown by some investigators (14-16). Keen et al. (1),
however, observed an inverse relationship between energy intake and the body
mass index across the whole range of the index, and this trend was not only
restricted to the manifestly obese subjects versus controls. They suggested
that under-reporting of energy intake occurs especially in clinically obese
patients as a behavioural response to obesity. It also is important to mention
that if obese people tend to under-report their weights, this also is a
potential confounding factor unless measured weights are used.
The time of measurement can be important in two ways. Firstly, subjects may
have had a positive energy balance in an earlier period of their lives (7,17).
It may be assumed that the dynamic phase of obesity is a relatively short
period, and as a consequence in cross-sectional studies most obese people will
be in energy balance. Secondly, it is possible that a number of obese people
have reduced their food intake in an attempt to reduce body weight. Thus in
both cases, it is desirable to be aware of the changes in body weight of the
subjects. This may provide an opportunity to distinguish three categories:
those who are in positive energy balance, the dynamic phase of obesity; those
who are in energy balance, the static phase of obesity; and those who are in
negative energy balance.
The potential physiological confounders are resting metabolic rate and
thermogenesis. In general, the resting metabolic rate is about 22 kcal/kg lean
body mass/day (18,19). This can be taken into account in epidemiological
studies but it should be noted that the resting metabolic rate may decrease
when food consumption is restricted (20,21). In addition, obese people may have
81
an impaired thermogenic mechanism (22), which may be an important compensatory
system for a high energy intake. For practical reasons these physiological
confounders can only be studied in detail in laboratory experiments.
The present study was part of a larger prospective study concerning the
aetiology of obesity in young Dutch adults for whom few data on food intake
were available. This study has been undertaken: firstly, to study the intake of
energy and macronutrients in comparison with recommended intakes; and secondly,
to investigate the relationships between body fatness and both food consumption
and habitual physical activity. Change in body weight has been taken into
account as a possible indicator of the energy balance.
METHODS
Population. In the first part of 1980, a study was carried out in the
Municipality of Ede in The Netherlands in which all the inhabitants in three
age groups (19-21, 24-26 and 29-31 years as at 1 January 1980) were invited to
participate (23). The addresses were obtained from the Civil Registration
Office in Ede. All participants from three of the nineteen sections of the
municipality (n=439) were again invited in November 1980 to participate in the
present study. All socio-economic classes were represented in these three
sections of the municipality. In November 1980, 309 subjects participated in
the study and 277 of these subjects also participated in the second part of
this study between February and April 1981. Women, pregnant for three months
or longer during the study (n=15), were excluded from further analyses.
procedure. Body weight was measured three times over a period of approximately
one year. It was first measured between March and May 1980, without shoes and
jacket to the nearest 0.1 kg. Body height was also measured without shoes to
the nearest 0.1 cm.
In November 1980, body weight was again measured. In addition, biceps,
triceps, suprailiac and subscapular skinfold thicknesses were measured,
according to Durnin and Rahaman (24), twice on the left side of the body to
the nearest 0.2 mm using a Holtain skinfold caliper. Body fat was calculated
as a percentage of total body weight (BF%) from the average sum of the four
skinfold thicknesses using linear regression equations for 20-29 year old males
and females (25). All measurements were made by one observer for each sex, but
it was not necessary to make adjustments for observer bias, because the

82
analyses for males and females were done separately. Lean body mass (LBM) was
calculated from total body weight (W) and BF% (LBM = W (100-BF%)/100).
On the first two occasions, body weight of the participants was measured
during visits to the mobil research unit which was stationed in each of the
three sections of the municipality for several days. On the third occasion,
body weight was measured during home visits between February and April 1981.
At the same time, information was collected on food intake and habitual
physical activity. At home, body weight was measured to the nearest 0.5 kg
without shoes and jacket. The balances used in this study were calibrated
regularly.
Physical activity pattern and food consumption. A Self-adminiStered
questionnaire was used to measure habitual physical activity of which the
construct validity and test-retest reliability had been investigated (26).
It appeared to be meaningful to distinguish three dimensions within the pattern
of habitual physical activity: physical activity at work; sport during leisure
time; and other physical activities during leisure time. The participants were
coded on a scale ranging from one (low) to five (high) for each dimension of
habitual physical activity. The test-retest reliability of the work index,
sport index and leisure-time index were 0.88, 0.81 and 0.74, respectively.
Information about food intake was collected by using a two-day record
method. Food intake was noted in household measures in diaries, and recipes
were requested for all mixed dishes. The subjects were visited on two occasions
by one of three trained dietitians. On the first visit, the dietitian gave
instructions on how to complete the diary. On the second visit, the dietitian
checked the diary for completeness and the household measures and portions of
foods used regularly were also checked. The intake of energy and nutrients was
calculated by multiplying the weights of foods consumed with the appropriate
values from a computerized food consumption table (27).
The subjects recorded their food intake on two consecutive days. The
average daily intakes of energy and nutrients of each subject were used in
further analyses. The possible combinations of two consecutive days were
randomly assigned to the subjects. The ratio of recording days during the
weekend (Saturday and Sunday) to recording days during the working week
(Monday to Friday) was about 2 : 5 in both sexes. This had the advantage that
the average for all record days could be interpreted as a weighted average for
the whole week. Each subject was given a code for the combination of days on
which food intake was recorded. Two workdays, one workday and one day of the

83
weekend, and two days of the weekend were coded as zero, one and two,
respectively. This code made it possible to adjust for the combination of
recording days in the analyses. The subjects were adequately randomized over
the three combinations of recording days, because the groups were comparable
with regard to age, level of education (the three levels of education have been
described elsewhere (23)), BF%, LBM and indices of habitual physical activity.
No evidence of an observer effect was found between the three dietitians.
statistical methods. Student's t-test was used to test differences between
groups of subjects. Regression coefficients of energy intake of specific food
groups and meals on BF% were calculated, while energy intake was adjusted for
the combination of recording days. Multiple regression analysis was also used
to study simultaneously the relationship between energy intake and both body
composition and habitual physical activity. The mean energy intake in categories
according to body fatness and change in body weight, taking confounders into
account, was studied in an analysis of covariance. Unless otherwise indicated,
two-sided P-values smaller than 0.05 are reported.
RESULTS
Table 1 shows the frequency distribution of age and level of education in
the present study population. There was a reasonable number of subjects from
each age group and each level of education in both sexes. Table 2 shows the
mean and standard deviation of body weight during the three periods of
measurement, body height, BF% and LBM. During the year before the food
consumption study, mean body weight increased by 1.2 kg (P < 0.001) in males,
but the change in mean body weight in females was negligible.
Mean daily intake of total energy was about 830 kcal higher in males than
in females (Table 3). The proportion of energy intake as animal protein and the
relative intake of dietary fibre were slightly higher in females, but the
proportion of energy intake as alcohol and the intake of dietary cholesterol
was higher in males. No differences were observed between males and females
with respect to the proportion of energy intake as vegetable protein, fatty
acids, sugars and polysaccharides.
Table 4 shows the proportional energy intake of food groups and meals to
total energy intake and the regression coefficients of the absolute energy
intake of food groups and meals on BF%. Sugar and sugar-rich products appeared

84
Table 1
FREQUENCY DISTRIBUTION OF AGE AND LEVEL OF EDUCATION IN MALES AND FEMALES
Variables Males Females (n=122) (n=140)
Age (years):
20 - 22 38.5 36.4
25 - 27 34.4 29.3
30 - 32 27.0 34.3
Level of education:
low 15.6 24.3
middle 50.0 52.9
high 34.4 22.9
Table 2
MEAN BODY WEIGHT, BODY HEIGHT, BODY FATNESS AND LBM IN MALES AND FEMALES
Measurement
Body weight (kg)
Body height (cm)
BF%
LBM (kg)
Period
1
2
3
1
2
2
Males (n=122)
mean
75.7
76.4
76.9
180.6
16.8
63.7
SD
9.6
9.5
9.9
7.2
4.5
6.5
Females (n=140)
mean
62.2
62.4
62.3
167.4
27.2
45.1
SD
8.1
7.8
7.8
5.6
4.9
4.2
Period 1, March-May 1980; Period 2, November 198U; Period 3, February-April 1981.

85
to contribute most to the total energy intake in both sexes, followed by dairy
products and cereal products. About 55% of total energy intake was consumed at
lunch and dinner, while about 35% was consumed as snacks. A negative relation
ship was observed between BF% and the amount of fruits and vegetables consumed
by males, and between BF% and food groups containing products such as margarine,
fats, sugar and sugar-rich products in females. In both males and females, a
negative relationship was observed between the amount of food eaten at
breakfast and BF%. A negative relationship was also observed in females between
the amount of food eaten at lunch and BF%, and between the amount of food eaten
in the evening and BF% in males.
Table 3
MEAN DAILY INTAKE OF ENERGY, MACRONUTRIENTS, DIETARY CHOLESTEROL AND DIETARY FIBRE IN MALES AND FEMALES
Variables Males (n=122)
Females (n=140)
P-value
Energy (kcal)
(MJ)
Total protein (energy %)
animal protein
vegetable protein
Total fat (energy %)
saturated
mono-unsaturated
poly-unsaturated
Total carbohydrates (energy %)
sugars
polysaccharides
Alcohol (energy %)
Dietary cholesterol (mg)
Dietary fibre (g/1000 kcal)
mean
3005
12.6
12.6
8.2
4.4
37.7
16.9
14.0
5.8
44.4
22.5
22.0
5.3
396
9.7
SEM
66
0.3
0.2
0.2
0.1
0.6
0.3
0.3
0.2
0.6
0.5
0.4
0.5
17
0.3
mean
2173
9.1
13.6
9.0
4.5
38.3
17.4
14.4
5.5
45.3
23.7
21.6
2.7
317
10.6
SEM
40
0.2
0.2
0.2
0.1
0.5
0.3
0.3
0.2
0.5
0.5
0.4
0.4
12
0.3
<0
< 0
< 0
< 0
<0
<0
< 0
001
001
001
01
001
001
05

86
Table 4
CONTRIBUTION OF FOOD GROUPS AND MEALS TO TOTAL ENERGY INTAKE AND THE REGRESSION COEFFICIENTS1 OF DAILY ENERGY INTAKE ON BF% IN MALES AND FEMALES
Variables Males (n=122)
Females (n=140)
Energy% Kcal/BF% Energy% Kcal/BF%
Food groups :
cereal products
potatoes, rice, etc.
margarine, fats and oils
meat, meat products, fish
dairy products and eggs
fruits and vegetables
sugar, sugar-rich products
soft drinks
alcoholic drinks
savoury snacks
Meals:
breakfast
lunch
dinner
morning and afternoon snack
evening snack
15.4
8.2
12.5
12.3
15.3
4.8
16.2
3.3
6.9
2.8
-6.0
-4.1
1.3
6.6
-0.8
-4.1*
-7.1
-0.7
-5.5
-0.3
14.3
7.8
10.3
12.7
16.8
6.1
17.6
4.1
3.4
4.0
-3.5
1.1
-5.4*
-1.6
-4.1
-1.1
-10.6*
1.4
3.1
-1.8
11.6
23.1
31.7
15.5
18.1
- 9 . 2 *
5.4
3.9
- 8 .2
- 13 .9 X
11.3
20.8
33.0
17.5
17.5
- 4 . 6
- 8 . 6
- 0 . 0
- 5 . 3
- 3 . 0
Adjusted for combination of recording days.
Miscellaneous group (< 70 kcal) is omitted.
x One-sided P<0.05, X x One-sided P<0.01.
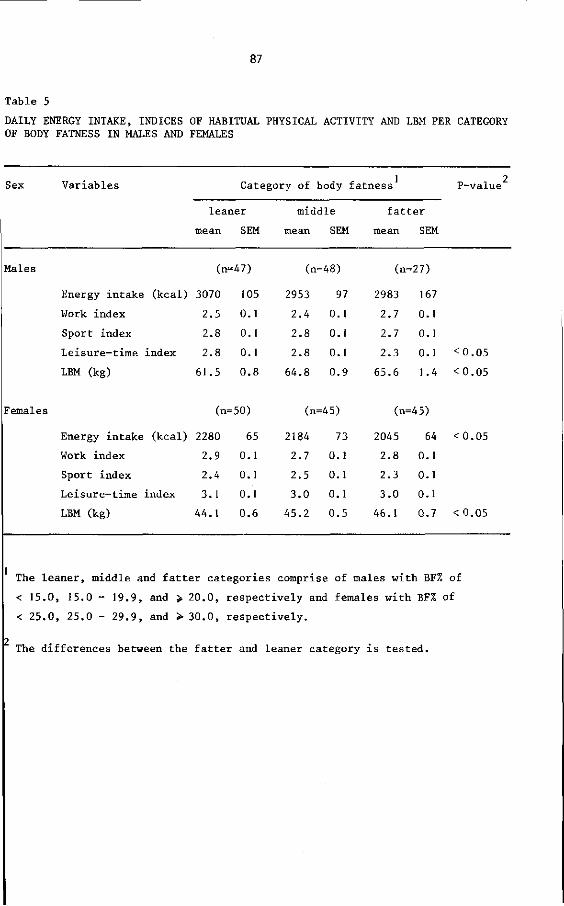
87
Table 5
DAILY ENERGY INTAKE, INDICES OF HABITUAL PHYSICAL ACTIVITY AND LBM PER CATEGORY OF BODY FATNESS IN MALES AND FEMALES
Sex Variables Category of body fatness
leaner
mean SEM
middle
mean SEM
fatter
mean SEM
P-value
Males (n-47)
Energy intake (kcal) 3070
Work index 2.5
Sport index 2.8
Leisure-time index 2.8
LBM (kg) 61.5
(n=48) (n=27)
105
0 .1
0 .1
0 .1
0 . 8
2953
2 . 4
2 . 8
2 . 8
6 4 . 8
97
0 .1
0 .1
0 .1
0 . 9
2983
2 . 7
2 .7
2 . 3
6 5 . 6
167
0 .1
0 .1
0 .1
1.4
< 0 . 0 5
< 0 . 0 5
Females (n=50)
Energy intake (kcal) 2280
Work index 2.9
Sport index 2.4
Leisure-time index 3.1
LBM (kg) 44.1
(n=45) (n=45)
65
0 .1
0 .1
0 .1
0 . 6
2184
2 . 7
2 . 5
3 . 0
4 5 . 2
73
0 .1
0 .1
0 .1
0 . 5
2045
2 . 8
2 . 3
3 . 0
46 .1
64
0 .1
0 .1
0 .1
0 . 7
<0.05
< 0.05
The leaner, middle and fatter categories comprise of males with BF% of
< 15.0, 15.0 - 19.9, and > 20.0, respectively and females with BF% of
< 25.0, 25.0 - 29.9, and > 30.0, respectively.
The differences between the fatter and leaner category is tested.

The daily energy intake of fatter males tended to be slightly lower than of
leaner males but this was not significant (Table 5). On the other hand, the
daily energy intake of fatter females was about 235 kcal less than of the
leaner females. No differences in indices of habitual physical activity were
observed between the categories of body fatness in either sex, except for the
mean score of the leisure-time index, which was lower for the fatter group of
males than for the other males. For both males and females, the LBM was higher
in the fatter group than for the leaner group.
Table 6 shows the relationships between energy intake and body composition,
and habitual physical activity in a multiple regression model. Energy intake of
males appeared to be negatively related to BF% and positively related to LBM
and to the work index. The sport index tended to be positively related to
energy intake, but this was not statistically significant. The type of
recording days, introduced in the analysis in order to make an adjustment for
the combination of days of the week the subjects recorded their food intake,
was positively related to energy intake of males. It appeared that on each day
of the weekend, daily energy intake was 207 kcal higher than on workdays.
Table 6
MULTIPLE REGRESSION ANALYSIS OF TOTAL ENERGY INTAKE (kcal/day) ON BF%, LBM (kg) AND INDICES OF HABITUAL PHYSICAL ACTIVITY IN MALES AND FEMALES1
Independent variables
Intercept
BF%
LBM
Work index
Sport index
Leisure-time index
Type of recording days
R2
Males (n=122)
B
232
- 3 7 ^ -,-XXX
307xxx
125
-26
207X
0 29
SE
14
9
82
80
83
81
Fema] es (n=140)
B
2252 _27xxx
24X
-34
-16
-109
66
0. 13
SE
8
9
64
59
67
51
Adjusted for combination of recording days.
X P < 0.05, X X P < 0.01, X X X P < 0.001.
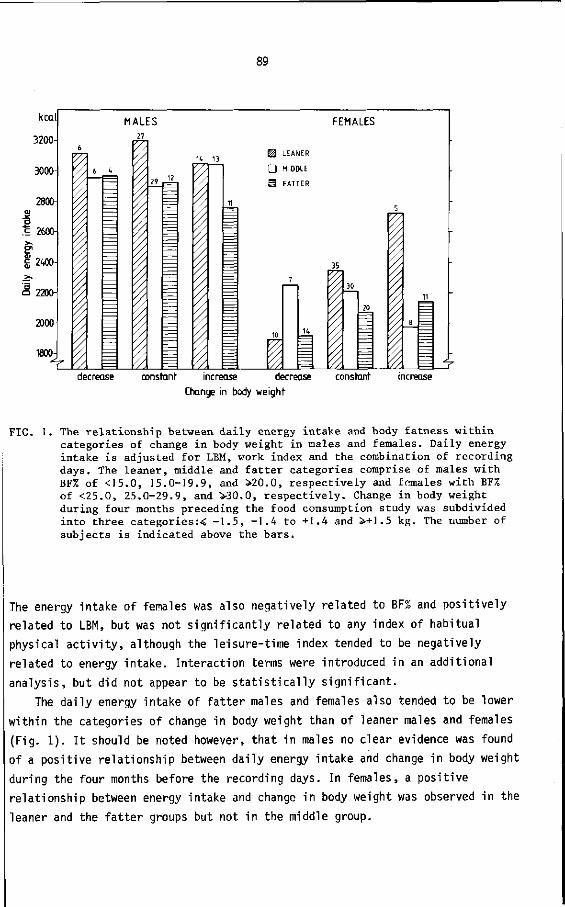
89
kcal
3200-
3000-
Dai
ly e
nerg
y in
take
&J
N
y r
o
po
O Ç
> O
ö
o
1800-
MALES FEMALES
r
6
\
6 U
—
27
29
K
3 <
13 H LEANER
D MIDDLE
11
m
10
1
FAT
7
rER
K
35
i 30
20
5
8
11
^ decrease constant increase decrease constant
Change in body weight
FIG. I. The relationship between daily energy intake and body fatness within categories of change in body weight in males and females. Daily energy intake is adjusted for LBM, work index and the combination of recording days. The leaner, middle and fatter categories comprise of males with BF% of <15.0, 15.0-19.9, and >20.0, respectively and females with BF% of <25.0, 25.0-29.9, and >30.0, respectively. Change in body weight during four months preceding the food consumption study was subdivided into three categories:< -1.5, -1.4 to +1.4 and +1.5 kg. The number of subjects is indicated above the bars.
The energy intake of females was also negatively related to BF% and positively
related to LBM, but was not significantly related to any index of habitual
physical activity, although the leisure-time index tended to be negatively
related to energy intake. Interaction terms were introduced in an additional
analysis, but did not appear to be statistically significant.
The daily energy intake of fatter males and females also tended to be lower
within the categories of change in body weight than of leaner males and females
(Fig. 1). It should be noted however, that in males no clear evidence was found
of a positive relationship between daily energy intake and change in body weight
during the four months before the recording days. In females, a positive
relationship between energy intake and change in body weight was observed in the
leaner and the fatter groups but not in the middle group.

90
DISCUSSION
In comparison with a prudent diet (28,29), the proportional intake of fat
is slightly higher and the intake of sugar is rather high in the present study
population. The contribution of poly-unsaturated fatty acids to total fat
intake is lower than recommended. In addition, the intake of dietary cholesterol
is rather high especially in males, and the proportional intake from total
protein is slightly higher than recommended, especially in females.
The average daily energy intake of about 3000 kcal in males seems to be
rather high for the present population of sedentary to moderately active
subjects. Generally, a daily energy intake between 2500 and 2900 kcal is
recommended (29-31) for such a population. This observation parallels the
gradual increase of mean body weight in males which was 1.2 kg during the year
before the food consumption study. Both findings suggest the existence of a
positive energy balance for the male population. The stability of mean body
weight in females seems to be in concordance with the average daily energy
intake of about 2170 kcal which is closer to the recommended daily energy
intake for females (29-31).
The finding, that differences in physical activity between categories of
body fatness were negligible in both sexes, is in accordance with some other
studies (10-12). The observation that fatter males tended to eat slightly less
than leaner males has also been shown by others (4,5,10). This is also the case
for the more pronounced inverse relationship between body fatness and energy
intake in females (1,3). An explanation for this inverse relationship may be
that the fatter females in particular restrict their food intake in an attempt
to lose body weight. This interpretation is supported by the finding that BF% in females was inversely related to the intakes of foods such as margarine,
fats, oils, sugars and sugar-rich products (Table 4 ) ; limitation of intakes of
these products with a high energy density is generally found desirable when
slimming (13,32). Other investigators have also found an inverse relationship
between obesity and the intakes of sugar (1,33) and fat (1). Further, it has
been shown that obese people systematically under-report their intake (14-16),
and this may also explain the inverse relationship. However, this is not likely
to occur across the whole range of body fatness, as has been stated by Keen et
ai. (1). The inverse relationship already exists between the leaner and middle
category of body fatness (Table 5). The relationship between meal pattern and
body fatness (Table 4) also suggests that under-reporting is not an appropriate
explanation for the inverse relationship between energy intake and body fatness.
91
It may be assumed that, if people under-report food intake, they will
especially under-report the food between meals, when a dietary record method is
used (14). While the inverse relationship was found to be most pronounced in
females (Table 5 ) , there was no clear evidence in the present study to support
the suggestion that obese females under-report the amount of food eaten between
meals. The fatter females restricted their food intake mainly at breakfast and
lunch.
An adjustment for energy expenditure should be made in order to study the
relationship between body fatness and energy intake in detail. Therefore,
multiple regression analysis was used to explain energy intake by BF%, LBM and
habitual physical activity. It is assumed that LBM is an adequate parameter for
the assessment of resting metabolic rate (18,19,34). After making the adjustment,
a clear inverse relationship between BF% and energy intake was also observed in
males. The reason for this relationship being poor before adjustment for energy
expenditure may well be that fatter people have on average a higher resting
metabolic rate as has been shown by James et ai. (35).
The work index was the only index of habitual physical activity which was
related to energy intake in males (Table 6 ) . A positive relationship between
energy intake and expenditure in army recruits over a longer period has been
shown by Edholm et al. (36). Lincoln (10) also observed a positive relationship
between energy intake and physical activity at work in males. A similar
relationship in females was not observed by McCarthy (12) and this is also in
concordance with the present study.
The positive trend between the sport index and energy intake in males was
not significant, perhaps because food intake was measured on two randomly
selected days, whereas the sport index is related to the habitual sport, which
is often played on particular days of the week. The finding that energy intake
was related to the work index and tended to be related to the sport index only
in males, parallels the earlier observed positive relationship in the same
population between LBM and work index, and sport index in males (26). In
addition, LBM was not related to leisure-time index in males, and was not
related to any of the three indices of physical activity in females (26). This
suggests that different scores on these indices reflect too small differences
in energy expenditure to observe an effect on the amount of LBM and energy
intake. The present female population, which is a normal young adult population,
seems to be sufficiently homogeneous with regard to physical activity to allow
variation in energy intake to be influenced only by body composition and other
personal and environmental factors. Whereas in males, physical activity at work

92
also affects variation in the amount of energy intake.
The period of about four months immediately before the recording days of
the food consumption study was used to classify the subjects according to the
changes in their body weight. Acheson et al. (37) stated that changes in body
energy may be seen as changes in weight, but because of day-to-day fluctuations,
changes in the body weight do not necessarily reflect changes in energy balance
or energy stores. If the cut-off point for change in body weight is, however,
greater than these fluctuations, only a few people will be incorrectly
classified. The cut-off point of 1.5 kg used seems to be adequate according to
other studies (38,39). It was observed, however, that the adjusted daily energy
intake tended to be lower among those with a decrease in body weight and to be
higher among those with an increase in body weight only in the leaner and fatter
group of females (Fig. 1). Therefore it is assumed that the change in body
weight reflects an energy balance at the time of the food consumption study only
in the leaner and fatter group of females. An explanation for the absence of
this relationship in other females and in males may be that relevant changes in
body weight often occur in relatively short periods or abruptly. This will have
the consequence that change in body weight over a period of four months, as in
the present study, does not always reflect energy balance at the end of this
period.
For the reason mentioned above, it may be supposed only in females that the
trend of a lower daily energy intake of fatter subjects cannot be explained by
a negative energy balance or successful slimming at the time of the study. The
fatter females seem to have a reduced need for energy, but it is not clear
whether this is a causal factor of obesity or ah effect of prolonged slimming.
The latter is supported by the observation in other studies that resting
metabolic rate decreases when energy intake is restricted (20,21). There may be
one exception to this, that is the group of fatter females who were successful
in reducing body weight, because they ate the same amount of food as the leaner
females who also lost body weight.
The authors consider that in studies on the relationship between energy
intake and body fatness it is desirable to take the phase of obesity into
account. However, the present findings with respect to this should be
interpreted with caution for two reasons. Firstly, the subdivision of the study
population according to body fatness and change in body weight has led to
unavoidably small numbers of subjects in each category. Secondly, an adjustment
for energy expenditure was made by taking LBM and habitual physical activity
into account. It may have been better to have used an activity diary technique

93
in which measurements of energy expenditure for specific activities (13) were
made, because it must be recognized that only a small proportion of the
variation in energy intake is explained by LBM and habitual physical activity
(Table 6 ) . However, for practical reasons the diary technique is not useful in
large-scale studies.
In summary, the average energy intake in males was higher than the
recommended intake, which was not found to be the case in females. This
observation is supported by a mean increase in body weight in males during
the preceding year, while mean body weight of females during the same period
remained constant. In both sexes, the fatter groups were not less physically
active than the leaner groups, apart from the fatter males who had a slightly
lower score on the leisure-time index. The fatter groups tended to eat less
than the leaner groups, but this was only significant in females. In a multiple
regression model, it appeared that energy intake was determined by BF% and LBM
in both sexes, and the work index was related to energy intake only in males.
These findings suggest that females are so homogeneous with regard to physical
activity that physical activity has little influence on differences in energy
intake between individuals. In addition, it is supposed that many of the fatter
females have a reduced need for energy. Nevertheless, mean body weight remained
constant for about one year in females, while body weight of males increased.
It may be that social pressure to be thin is greater for females, which makes
females more conscious of body weight than males.
ACKNOWLEDGEMENTS
The authors wish to thank the Local Government Office and the Civil
Registration Office in Ede for assistance in the preparation of the study
population; and all the people who participated in the study. They would also
like to thank P. Deurenberg, J. Frijters and J. Hautvast for fruitful
discussions in the preparation of the manuscript; and K. Baerends-Bos,
R. Hoogkamer-Weijman, N. van Kaathoven, W. Knuiman-Hijl, E. Oosterhaven-Rappard,
G. Sanderink-Hulsink, B. Schölte, J. de Vries, H. West and W. van der Wiel-
Wetzels for technical assistance with the study.
94
REFERENCES
1. Keen H, Thomas BJ, Jarrett JR, Fuller JH. Nutrient intake, adiposity, and diabetes. Br Med J 1979;1:655-8.
2. Keys A. Coronary heart disease in seven countries. Am Heart Ass Monograph nr 29. New York: The American Heart Association Inc., 1970.
3. Ohlson MA, Harper LJ. Longitudinal studies of food intake and weight of women from ages 18 to 56 years. J Am Diet Assoc 1976;69:626-31.
4. Birkbeck JA. Obesity, socioeconomic variables and eating habits in New Zealand. J biosoc Sei 1981;13:299-307.
5. Osancova K, Hejda S. Epidemiology of obesity. In: Sil verstone T, ed. Obesity: its pathogenesis and management. Acton Massachusetts: Publishing sciences group, 1975:57-91.
6. Matter S, Weltman A, Stamford BA. Body fat content and serum lipid levels. J Am Diet Assoc 1980;77:149-52.
7. Ries W. Feeding behaviour in obesity. Proc Nutr Soc 1973;32:187-93.
8. Kannel WB, Gordon T. Some determinants of obesity and its impact as a cardiovascular risk factor. In: Howard A, ed. Recent advances in obesity research I. London: Newman Publishing Ltd., 1975:14-27.
9. Hutson EM, Cohen NL, Kunkel ND, Steinkamp RC, Rourke MH, Walsh HE. Measures of body fat and related factors in normal adults. J Am Diet Assoc 1965;47: 179-86.
10. Lincoln JE. Calorie intake, obesity and physical activity. Am J Clin Nutr 1972;25:390-4.
11. Maxfield E, Konishi F. Patterns of food intake and physical activity in obesity. J Am Diet Assoc 1966;49:406-8.
12. McCarthy MC. Dietary and activity patterns of obese women in Trinidad. J Am Diet Assoc 1966;48:33-7.
13. Garrow JS. Energy balance and obesity in man. 2nd ed. Amsterdam: Elsevier/ North-Holland Biomedical Press, 1978.
14. Beaudoin R, Mayer J. Food intakes of obese and non-obese women. J Am Diet Assoc 1953;29:29-33.
15. Bray GA, Zachary B, Dahms WT, Atkinson RL, Oddie Th. Eating patterns of massively obese individuals. J Am Diet Assoc 1978;72:24-7.
16. Mahalko JR, Johnson LK. Accuracy of predictions of long-term energy needs. J Am Diet Assoc 1980;77:557-61.
17. Miller DS. Energy balance and obesity. In: Burland WL, Samuel PD, Yudkin J, eds. Obesity. Edinburgh: Churchill Livingstone, 1974:160-70.
18. Cunningham JJ. A reanalysis of the factors influencing basal metabolic rate in normal adults. Am J Clin Nutr 1980;33:2372-4.
19. Webb P. Energy expenditure and fat-free mass in men and women. Am J Clin Nutr 1981;34:1816-26.
20. Apfelbaum M, Bostarron J, Lacatis D. Effect of caloric restriction and excessive caloric intake on energy expenditure. Am J Clin Nutr 1971;24: 1405-9.

95
21. Bray GA. Effect of caloric restriction on energy expenditure in ODese patients. Lancet 1969;11:397-8.
22. James WPT, Trayhurn P. An integrated view of the metabolic and genetic basis for obesity. Lancet 1976;11:770-2.
23. Baecke JAH, Burema J, Frijters JER, Hautvast JGAJ, Wiel-Wetzels WAM van der. Obesity in young Dutch adults: I, socio-demographic variables and body mass index. Int J Obesity 1982: in press.
24. Durnin JVGA, Rahaman MM. The assessment of the amount of fat in the human body from measurements of skinfold thickness. Brit J Nutr 1967;21:681-9.
25. Durnin JVGA, Womersley J. Body fat assessed from total body density and its estimation from skinfold thickness: measurements on 481 men and women aged from 16 to 72 years. Brit J Nutr 1974;32:77-97.
26. Baecke JAH, Burema J, Frijters JER. A short questionnaire for the measurement of habitual physical activity in epidemiological studies. Am J Clin Nutr 1982;36:in press.
27. Hautvast JGAJ. Ontwikkeling van een systeem om gegevens van voedingsenquêtes met behulp van de computer te verwerken. Voeding 1975;36:356-61.
28. US Select Committee on Nutrition and Human Needs. Dietary goals for the United States. 2nd ed. Washington DC: US Senate US Government Printing Office, 1977.
29. Nederlandse Voedingsmiddelentabel. 32nd ed. 's-Gravenhage: Voorlichtingsbureau voor de Voeding, 1979.
30. Food and Nutrition Board, National Research Council. Recommended dietary allowances. 9th ed. Washington DC: National Academy of Sciences, 1980.
31. Department of Health and Social Security. Recommended daily amounts of food energy and nutrients for groups of people in the United Kingdom. 1st ed. London: Her Majesty's Stationery Office, 1979.
32. Davidson S, Passmore R, Brock JF, Truswell AS. Human nutrition and dietetics. 7th ed. New York: Churchill Livingstone, 1979.
33. Richardson JF. The sugar intake of business men and its inverse relationship with relative weight. Brit J Nutr 1972;27:449-60.
34. Halliday D, Hesp R, Stalley SF, Warwick P, Altman DG, Garrow JS. Resting metabolic rate, weight, surface area and body composition in obese women. Int J Obesity 1979;3:1-6.
35. James WPT, Davies HL, Bai les J, Dauncey MJ. Elevated metabolic rates in obesity. Lancet 1978;1:1122-5.
36. Edholm 0G, Adam JM, Healy MJR, Wolff HS, Goldsmith R, Best TW. Food intake and energy expenditure of army recruits. Brit J Nutr 1970;24:1091-107.
37. Acheson KJ, Campbell IT, Edholm 0G, Miller DS, Stock MJ. A longitudinal study of body weight and body fat changes in Antarctica. Am J Clin Nutr 1980;33:972-7.
38. Edholm 0G, Adam JM, Best TW. Day-to-day weight changes in young men. Ann Human Biol 1974;1:3-12.
39. Robinson MF, Watson PE. Day to day variation in body weight of young women. Brit J Nutr 1965;19:225-35.
97
7 GENERAL DISCUSSION
BODY FATNESS
It has been shown in Chapter 4 that the body mass index (BMI; weight/height )
is a reasonable indicator of body fatness, as has also been observed in other
studies (1,2). It is noteworthy that an index of relative weight, based not only
on body weight and body height, but also on knee width and/or wrist width did
not improve the prediction of body fatness in either sex. Even in females
accuracy in prediction of body fatness was slightly less when knee width was
taken into account, perhaps because of an artifact of measurement. It would
appear to be unavoidable that some subcutaneous fat is included in the anthro
pometric measurement of knee width (3).
A general disadvantage of all indices of relative weight is that they do
not differentiate between overweight caused by an excess of lean body mass
(LBM), and overweight caused by an excess of body fat. An increased LBH per
unit of body height may be the result of increased physical activity in
particular. However, in the present study no relationship between LBM and
physical activity was observed in females (Chapter 5 ) . Therefore also from this
point of view BMI appears to be an adequate indicator of body fatness in
females. On the other hand in males, it was shown that physical activity at work
and the amount of sport undertaken were positively related to LBM (Chapter 5 ) .
It can be assessed from the regression coefficients that the males with the
highest physical activity at work (score 5) have on average an LBM of 5.4 kg
more than those with the lowest physical activity at work (score 1). This may 2
result in a BMI-difference of approximately 1.7 kg/m with the average body 2
height of 1.80 m. This difference is 4.9 kg or approximately 1.5 kg/m for males with extreme scores on the sport index. Both differences can be added in order
to assess the maximum overall effect of physical activity on LBM, but in general
it seldom occurs that males are both extremely physically active at work and
extremely active sportsmen, because physical activity at work is inversely
related to the amount of sport undertaken (Chapter 3 ) .

98
FOOD CONSUMPTION AND PHYSICAL ACTIVITY
The average daily energy intake of about 3000 kcal in the present
population of young adult males appears to be rather high, while the average
energy intake of about 2170 kcal in females is quite normal (Chapter 6 ) . In The
Netherlands no comparable food consumption studies in young adults have been
carried out on a community basis. However, a study recently carried out in 17
and 18 year old Dutch boys showed an even slightly higher daily energy intake
(4), while in studies including older age categories, a lower daily energy
intake was observed (5,6). This suggests that the energy intake decreases with
age, perhaps because of a reduced need of energy for growth and physical
activity. The reduction in energy intake may occur too slowly in males, because
in the present study average body weight increased in males (Chapter 6) which
indicates the existence of a positive energy balance.
In respect of the proportional intake of both macronutrients and food
groups, and the distribution of energy intake over the various meals,
differences between males and females were generally small, the most salient
being the higher consumption of alcoholic drinks by males. It is clear from the
present food consumption study that a large part of energy intake is derived
from food groups with a high energy density and/or with a low dietary fibre
content (Chapter 6 ) . In both sexes approximately 28% of energy intake only is
derived from cereal products, potatoes, fruit and vegetables. It has also been
suggested by de Wijn that this is a negative characteristic of the food
consumption pattern of the Dutch (6). It indicates that little food is consumed
which has a high satiety because of its slow digestibility and/or the intensive
mastication required.
It is noteworthy that approximately 35% of total daily energy intake is
derived from food and drinks consumed between meals (Chapter 6 ) , whereas it is
generally believed that the typical daily food consumption pattern of the Dutch
consists of three main meals; breakfast, lunch and dinner. In another Dutch
study including older age categories, only about 20% of energy intake was
obtained from food eaten in addition to the three main meals (5). The
observation in the present study may be typical of the eating pattern of young
adults, but such a pattern may be undesirable because it may lead to a high
total energy intake, and because the food consumption between meals consists
mainly of foods of low nutritive value. In the present study, it appeared that
between meals more foods were consumed of lower protein content and higher
alcohol, and mono- and disaccharides contents than at the main meals (7).
99
The average daily energy intake by males was about 200 kcal higher during
the weekend than on workdays, while the difference between weekend and workdays
in females was negligible (Chapter 6 ) . Further analysis showed that the higher
energy intake during the weekend by males could be explained especially by a
higher consumption of alcoholic drinks of about 100 kcal per day (7). There was
no significant difference during the weekend and on workdays in the energy
intake derived from foods in the other nine groups distinguished. This means
that the extra alcohol consumption during the weekend is not compensated by a
reduction in consumption of food from the other groups.
The results of the development of a short questionnaire for the measurement
of habitual physical activity are reported in Chapter 5. It was concluded that
habitual physical activity encompassed at least three distinct dimensions:
physical activity at work; sport during leisure time; and other physical
activity during leisure time. Physical activity at work and sport during
leisure time were both positively related to LBM (Chapter 5) and to daily
energy intake (Chapter 6) in males, but not in females. In addition, energy
expenditure through physical activities such as walking and cycling during
leisure time was not related to LBM (Chapter 5) or to daily energy intake
(Chapter 6) in both sexes. These observations suggest that the present female
population is so homogeneous in respect of physical activity, that the latter
cannot be responsible for differences in daily energy intake.
DETERMINANTS OF BODY FATNESS
In the literature, several aspects of daily life-style are shown to be
related to obesity, but it is not clear whether all these aspects are
independently related to obesity, or whether they are only indicators of more
general types of behaviour. Structuring the various aspects of daily life-style
is important because this will make it easier to interpret its relationship to
Dody fatness. Indeed, in the present study it appeared that a number of aspects
Df daily life-style could be interpreted as indicators of general types of
behaviour (Chapter 3 ) . Five types could be distinguished within the 16 aspects
if daily life-style considered. These were: slimming behaviour, CASS behaviour
(characterized by coffee and alcohol consumption, smoking habits and hours of
;leep per night), eating sweet and savoury snacks, health-conscious behaviour,
ind physical activity.

100
Slimming behaviour was positively related to BMI in both sexes. This
parallels the findings in Chapter 6 that fatter people eat less food than
leaner people. Similar findings have also been observed in several other
cross-sectional studies (8,9). This illustrates the importance of studying the
aetiology of obesity in prospective studies instead of cross-sectional studies,
because changes in food consumption may occur after the development of obesity.
In addition, other aspects of behaviour and psychological characteristics may
also change as a consequence of increased body weight.
CASS behaviour was positively related to BMI in males and health-conscious
behaviour was inversely related to BMI in both sexes. It may be hypothesized
that CASS behaviour is influenced especially by a certain personality structure,
whilst health-conscious behaviour is influenced, in particular, by knowledge
and attitudes about health and nutrition. This view is supported by the finding:
in other studies that items concerning CASS behaviour are related to a type A
personality (Chapter 3 ) . Separating these two types of behaviour may be
important for health education programmes, which are aimed at changing behaviour
by increasing knowledge, changing attitudes and/or influencing norms and values
(10). If CASS behaviour is primarily dependent on certain personality traits,
the effect of a health programme to reduce this type of behaviour may be less
than the effect of a programme to stimulate health-conscious behaviour.
Assuming that no cohort effect is present, then the wide difference between
the average BMI of the 19-21 and 29-31 year age groups (Chapter 2) suggests
that this age range is a critical period for the development of obesity. There
seems to be a large increase in body weight in this period, especially in males
In general, this period of life is characterized by a number of changes in the
social environment; a number of life events take place during this period.
Stressful life events may temporarily affect food habits and physical activity
to the extent that body weight is increased (11). In addition to the effect of
life events on behaviour, also new living conditions themselves may be related
to other food habits and habitual physical activity.
The observations, that those who have a lower level of education and whose
fathers have a lower level of occupation, have on average a higher BMI
(Chapter 2) is in accordance with the relationship as generally observed in the
literature (12). This relationship may be explained in two ways. Firstly,
characteristics such as level of education and level of occupation are
indicators of the type of social environment of the subjects. These
characteristics reflect certain aspects of the living conditions. If, therefore
level of education and occupation are related to BMI, then different values,

101
norms and attitudes about health and nutrition in various social
environments will be important underlying causal determinants of obesity.
Secondly, a certain level of education will be concomitant with a certain level
of knowledge in relation to health and health-related behaviour. This knowledge
about health and health-related behaviour is also a potential causal determinant
of obesity. This view is supported by the observed positive relationship between
level of education and both health-conscious behaviour (Chapter 3 ) , and the
amount of physical activity during leisure time (Chapter 5 ) . The weaker positive
relationship between level of education and slimming behaviour (Chapter 3 ) ,
indicating a slightly higher level of weight-consciousness among people with a
higher level of education, also supports this view.
The relationships between BMI and the other socio-demographic variables
were less important than those between BUI and both age and level of education.
However, a relationship such as between BMI and religion, and church attendance
(Chapter 2) illustrates the possible influence of attitudes, and in this case
the general attitude to life, on food habits and/or habitual physical activity.
The finding that females who had given birth to two or more children were
heavier than other females may be explained by physiological changes during
pregnancy. However, it is also possible that because of the increased size of
the family, living conditions are influenced to the extent that behaviour is
changed.
The mechanisms described above may partly explain the observed relationships
between socio-demographic variables and BMI. These mechanisms link up with the
model for the aetiology of obesity presented in Chapter 1, and will be studied
further in the prospective study also mentioned. In addition, it is necessary
to describe in more detail the specified types of behaviour within the aspects
of daily life-style (Chapter 3 ) , and to study them in relation to
characteristics such as personality traits and attitudes. Furthermore, the
relationships between these types of behaviour and change in body weight should
ae studied in order to determine whether they are causal determinants of
Dbesity.
The study described in Chapter 6 showed that the daily energy intake of
fatter people was lower than of others, whereas physical activity at work and
the amount of sport undertaken were not related to body fatness in either sex.
)nly physical activities such as walking and cycling during leisure time were
îlightly less in fatter males, but it has been suggested already that this may
>e accompanied by only a minor difference in energy expenditure. The trend that
'atter people eat less than others, may be explained by a restriction of food

102
intake by the fatter people in an attempt to lose body weight and, as already
mentioned, is in concordance with the observed relationship between slimming
behaviour and BMI (Chapter 3). However, there is also some evidence to suggest
that apart from slimming behaviour, fatter people have a reduced need for
energy. It appeared that within the categories of change in body weight:
decrease, constant, and increase (Chapter 6) fatter people also tend to eat
less than leaner people. For reasons mentioned in Chapter 6, this could only be
concluded from the results in females. It is not clear from the present study
whether the suggested reduction in the fatter subjects is a potential causal
factor of obesity or an effect of prolonged slimming. The latter is supported
by the observation in other studies that resting metabolic rate decreases when
energy intake is restricted (13,14).
The contribution of the various food groups to total daily energy intake
differed only slightly between categories of body fatness (Chapter 6 ) .
Nevertheless it is noteworthy that the fatter females tended to restrict
consumption of products such as margarine, fats, sugar and sugar-rich products
especially. This suggests that the diet of fatter females is more in accordance
with a prudent diet (15,16) than that of other females. It may well be that
this trend is secondary to the increased body weight of the subjects and should
be interpreted as a reflection of slimming behaviour; limitation of intake of
foods which have a high energy density is generally found to be desirable when
slimming (17,18). The contribution of various meals to total daily energy
intake in relation to body fatness has received much attention in the past
(19-22). In general, it has been found that obese people omit more meals than
others, in particular breakfast. In Chapter 3 it is suggested that omitting
meals is an effect of obesity rather than a cause; people who are obese may
omit meals more often than others in their efforts to reduce total energy
intake. This is supported by the inverse relationship found between the amount
of food eaten at breakfast and body fatness (Chapter 6 ) . However in the study
described in Chapter 3, it appeared that omitting breakfast was not related to
slimming behaviour, but inversely related to health-conscious behaviour. This
suggests that omitting breakfast should be interpreted as an indicator of
health-conscious behaviour which may be causally related to obesity.
MANAGEMENT OF OBESITY
A general survey of the health consequences of obesity is given in Chapter

103
1. It is concluded that a definition of obesity can only be based on the
relationship between body fatness and mortality. At present insufficient
quantitative data on the relationship between body fatness and both morbidity
and psychological problems are available in order to include these aspects in
an operational definition of obesity. In the present study the prevalence of
severe obesity (BMI 30.0 kg/m2) was 2% in both sexes (Chapter 2 ) . In other
studies in adult western populations the prevalence of severe obesity has been
found to be between 5 and 10% (23-25). It should be noted however, that the
present study population consisted only of young adults and that, in general,
body weight increases during adulthood (26-28). The prevalence of moderate
obesity (BMI between 25.0 and 29.9 kg/m2) was about 22% in males and 12% in
females (Chapter 2). Similar cut-off points for males and females are often
chosen for simplicity (24) but it may be that the higher prevalence of moderate
obesity in males can be explained partly by a larger LBM in males than in
females as shown in Chapter 6. Therefore, different cut-off points for males
and females as proposed by de Wijn (29) have also been used in the present
study. Ten percent of males had a BMI of at least 27.0 kg/m and 9.6% of o
females had a BMI of at least 26.0 kg/m (30). These prevalence rates of
obesity were similar to the rates in young adults in a study carried out with
a representative sample of the Dutch adult population (31).
It is generally accepted that both individual and group treatment programmes
to reduce body weight are useful for the severely obese and also for the
moderately obese, if obesity-induced health consequences are present which can
be improved by weight reduction such as hypertension. However, there is less
agreement as to whether it is desirable to develop programmes for moderately
obese people without health problems related to obesity.
Since the number of people who are moderately obese is considerable, it is
not practical to administer individual weight reduction programmes. If necessary,
these programmes should be based on the group or community. Such programmes may
influence people who are not yet obese and those who are already obese. However,
3erger has stated that public campaigns in order to enforce a reduction of the
populations' average body weight do not appear to be justified for several
reasons of which the absence of valid evidence to support the slogan 'the
slimmer the healthier' is the most important (32). But as mentioned in Chapter
1, the effect of obesity on health seems to be greater in younger people than
in middle-aged and older people. For this reason the management of obesity
should be focused more on younger people than on the population as a whole,
/oung adults in particular may be an important target group because the age

104
range between 20 and 30 years seems to be a critical period for the development
of obesity, as discussed above. In addition, level of education and/or level of
occupation can be useful in directed prevention and treatment of obesity,
because there is a considerable difference between the mean BMIs of those with
lower levels of education and occupation and those with higher levels of
education and occupation. It seems to be justified to give more attention to
the management of obesity at primary school and schools for occupational
training.
Severe and moderate obesity are often the concomitant of a number of
psychosocial problems such as inability to cope with the environment; social,
economic or other types of discrimination; impairment of self-image; and
deviation from the prevailing aesthetic view of attractive appearance (33).
Females, especially, seem to experience the most problems with respect to this,
which is supported by the findings that slimming behaviour is more prevalent in
females than in males (Chapter 3 ) , and that anorexia nervosa developes more
often in females (34). However, many obesity related psychosocial problems do
not seem to be a direct consequence of the development of obesity but rather a
consequence of the seemingly negative attitude towards the obese in western
societies (35,36). Therefore, in fact these problems are no reason to start a
weight reduction programme. Health programmes may be successful in changing the
negative attitude towards the obese by educating people that obesity is a
complicated disorder, and that it is a naive theory that overeating and lack of
exercise are the sole causes of obesity (35). It should be recognized and
emphasized that the primary causes of obesity in individuals are often derived
from their living conditions and personal characteristics (see Chapter 1 ) ,
which cannot be influenced by people themselves. In addition, publication of
normal ranges of body weight requires more attention in these programmes. It is
concluded that people often perceive their own body weight as too heavy while
from the medical point of view there are no justifications for this opinion
(30,31), which may lead to unnecessary efforts to reduce body weight.
While some of the findings which are summarized and discussed in this
chapter, can be useful for the management of obesity, it must be emphasized
that several aspects have yet to be studied in further detail before definite
conclusions can be drawn. This is being done in the research project of which
the present studies form the first part.

105
REFERENCES
1. Keys A, Fidanza F, Karvonen MJ, Kimura N, Taylor HL. Indices of relative weight and obesity. J Chron Dis 1972;25:329-43.
2. Womersley J, Durnin JVGA. A comparison of the skinfold method with extent of 'overweight' and various weight - height relationships in the assessment of obesity. Brit J Nutr 1977;38:271-84.
3. Harrison GA, Weiner JS, Tanner JM, Barnicot NA. Human Biology. 2nd ed. Oxford: University Press, 1977.
4. Kemper HCG, Bom C /ander, Dekker H, Ootjers G, Post B, Snel J, Splinter PG, Storm-van Essen L, Verschuur R. Groei en gezondheid van tieners. Haarlem: Uitgeverij de Vrieseborch, 1982.
5. Staveren WA van. Kan de voedingsvezel van een categorie volwassen Nederlanders bepaald worden? Voeding 1979;40:113-21.
6. Wijn JF de. Energetische aspecten van voeding in theorie en praktijk. Voeding 1981;42:186-92.
7. Baecke JAH, Staveren WA van. Voedsel consumptie bij jonge volwassenen. In preparation, 1982.
8. Osancova K, Hejda S. Epidemiology of obesity. In: Silverstone T, ed. Obesity: its pathogenesis and management. Acton Massachusetts: Publishing Sciences Group, 1975:57-91.
9. Spitzer L, Rodin J. Human eating behavior: a critical review of studies in normal weight and overweight individuals. Appetite 1981;2:293-329.
10. Schuurman JH, Haes WFM, Sturmans F. Gezondheidsvoorlichting en -opvoeding: Verandering van gedrag. Medisch Contact 1976;31:421-8.
11. Lipinski BG. Life change events as correlates of weight gain. In: Howard A, ed. Recent advances in obesity research I. London: Newman Publishing Ltd, 1975:210-2.
12. Stunkard AJ. Obesity and the social environment. In: Howard A, ed. Recent advances in obesity research I. London: Newman Publishing Ltd, 1975:178-90.
13. Apfelbaum M, Bostarron J, Lacatis D. Effect of caloric restriction and excessive caloric intake on energy expenditure. Am J Clin Nutr 1971;24: 1405-9.
14. Bray GA. Effect of caloric restriction on energy expenditure in obese patients. Lancet 1969;11:397-8.
15. US Select Committee on Nutrition and Human Needs. Dietary Goals for the United States. 2nd ed. Washington DC: US Senate US Government Printing Office, 1977.
16. Nederlandse Voedingsmiddelentabel 32nd ed. 's-Gravenhage: Voorlichtingsbureau voor de Voeding, 1979.
17. Davidson S, Passmore R, Brock JF, Truswell AS. Human nutrition and dietetics. 7th ed. New York: Churchill Livingstone, 1979.
18. Garrow JS. Energy balance and obesity in man. 2nd ed. Amsterdam: Elsevier/ North-Holland Biomedical Press, 1978.
19. Bullen BA, Monello LF, Cohen H, Mayer J. Attitudes towards physical activity, food and family in obese and nonobese adolescent girls. Am J Clin Nutr 1963;12:1-11.

106
20. Birkbeck JA. Obesity, socioeconomic variables and eating habits in New Zealand. J Biosoc Sei 1981;13:299-307.
21. Hejda S, Fabry P, ZvolänkovS K. Frequency of food intake in relation to some parameters of the nutritional status. Nutr Dieta 1964;6:216-28.
22. Metzner HL, Lamphiear DE, Wheeler NC, Larkin FA. The relationship between frequency of eating and adiposity in adult men and women in the Tecumseh Community Health Study. Am J Clin Nutr 1977;30:712-5.
23. Abraham S, Johnson CL. Prevalence of severe obesity in adults in the United States. Am J Clin Nutr 1980;33:364-9.
24. Garrow JS. Treat obesity seriously. 1st ed. Edinburgh: Churchill Livingstone, 1981.
25. Larsson B, Bjb'rntorp P, Tibblin G. The health consequences of moderate obesity. Int J Obesity 1981;5:97-116.
26. Friedlaender JS, Costa PT, Bosse R, Ellis E, Rhoads JG, Stoudt HW. Longitudinal physique changes among healthy white veterans at Boston. Hum Biol 1977;49:541-58.
27. Hsu PH, Mathewson FAL, Rabkin SW. Blood pressure and body mass index patterns - a longitudinal study. J Chron Dis 1977;30:93-113.
28. Kannel WB, Gordon T, Castelli WP. Obesity, lipids, and glucose intolerance. The Framingham Study. Am J Clin Nutr 1979;32:1238-45.
29. Wijn JF de. Wat kan voeding bijdragen tot de primaire preventie van atherosclerotische aandoeningen? Ned T Geneesk 1975;119:492-505.
30. Baecke JAH, Burema J, Wiel-Wetzels WAM van der. Prevalentie van overgewicht bij jonge volwassenen in Ede. Wageningen: Department of Human Nutrition, Agricultural University, 1981.
31. Kok FJ, Matroos AW, Vandenbroucke JP. Te zwaar of niet te zwaar. Een onderzoek bij de volwassen bevolking van Nederland. Voeding 1981;42:262-9.
32. Berger M, Berchtold P, Gries FA, Zimmermann H. Indications for the treatment of obesity. In: Bjb'rntorp P, Cairella M, Howard AN, eds. Recent advances in obesity research III. London: John Libbey, 1981:1-9.
33. Van Itallie TB. Obesity: adverse effects on health and longevity. Am J Clin Nutr 1979;32:2723-33.
34. Leon GR. Is it bad not to be thin? Am J Clin Nutr 1980;33:174-6.
35. DeJong W. The stigma of obesity: The consequences of naive assumptions concerning the causes of physical deviance. J of Health and Social Behavior 1980;21:75-87.
36. Rodin J. Psychological factors in obesity. In: Bjb'rntorp P, Cairella M, Howard AN, eds. Recent advances in obesity research III. London: John Libbey, 1981:106-23.

108
SUMMARY
In 1979, the Department of Human Nut r i t ion of the Agr icul tural University
at Wageningen began a research project on obesity in young adul ts. The main
objectives of th is project are the invest igat ion of aet io logical aspects and
health consequences of obesity. I t i s a prospective study and is being carried
out in a young adult population of three age groups (19-21, 24-26 and 29-31
years as at 1 January 1980) in the Municipal i ty of Ede. The present thesis
deals with the investigations in to determinants of body fatness and two
methodological studies concerning re la t ive weight and habitual physical
a c t i v i t y which form the f i r s t part of the research project mentioned above.
In the In t roduct ion, a general survey is given of the methods of measuring
body fatness. Health consequences and aetiology of obesity are also surveyed.
Approximately 3900 subjects part ic ipated in the studies described in Chapter 2
and 3, and a subsample of approximately 300 subjects from the i n i t i a l population
part ic ipated in the studies described in Chapters 4-6.
The re lat ionship between various socio-demographic variables and body mass 2
index (BMI; weight/height ) i s dealt with in Chapter 2. The prevalence of
severe obesity (BMI > 30.0 kg/m ) was 2% i n both sexes. The most sa l ient socio-
-demographic determinants of BMI were age and level of education. Older subjects
were heavier, and subjects who had a higher level of education were l i gh te r .
Other socio-demographic determinants of BMI were: level of fa ther 's occupation
and re l ig ion in both sexes; par i ty in females; and urbanization and church
attendance in males.
The re lat ionship between aspects of da i ly l i f e - s t y l e and BMI are described
in Chapter 3. Five conceptually meaningful factors could be distinguished
w i th in the aspects of da i ly l i f e - s t y l e considered. These factors were i n te r
preted as constructs o f : 1 , slimming behaviour; 2 , behaviour characterized by
the consumption of coffee and a lcohol , smoking habits and number of hours of
sleep per night (CASS behaviour); 3, eating sweet and savoury snacks;
4, health-conscious behaviour; and 5, physical a c t i v i t y . Heavier subjects had
higher rat ings for slimming behaviour and lower rat ings for health-conscious
behaviour. In addit ion heavier males had higher rat ings fo r CASS behaviour.
Possible improvement in the predict ion of body fatness when an index of
re la t ive weight i s based not only on body weight and body height, but also on

109
frame size, is considered in Chapter 4. The prediction of body fatness was not
improved when frame size, as assessed by knee width and wrist width, was taken
into account. BMI was the most preferable of the indices considered.
The development of a short questionnaire for the measurement of habitual
physical activity is discussed in Chapter 5. Three dimensions could be
distinguished within the pattern of habitual physical activity. They are
interpreted as: 1, physical activity at work; 2, sport during leisure time; and
3, physical activity during leisure time excluding sport. Level of education
was inversely related to physical activity at work, and positively related to
physical activity during leisure time excluding sport. Subjective experience of
work load was inversely related to both sport and other physical activities
during leisure time. Lean body mass was positively related to both physical
activity at work and sport, in males only.
The relationship between body fatness and both food consumption and habitual
physical activity are dealt with in Chapter 6. The average daily energy intake
in males was rather high (about 3000 kcal) and average body weight increased by
1.2 kg in the preceding year. Both findings suggest the existence of a positive
energy balance. In females the average daily energy intake of about 2170 kcal
was closer to the recommended intake and average body weight remained constant.
There were no important differences in the pattern of habitual physical
activity between the categories of body fatness defined. However the daily
energy intake of fatter subjects was lower than that of leaner subjects. This
finding may be explained by a reduction of food intake in fatter subjects in an
attempt to reduce body weight. There is also some evidence to suggest that many
fatter subjects have a reduced need for energy, but it is not clear whether
this is a causal factor of obesity or an effect of prolonged slimming.
Finally, a general discussion of the results is given in Chapter 7. While
some of the findings can be useful for the management of obesity, it must be
emphasized, that several aspects have yet to be studied in detail in the
research project of which this thesis forms the first part.

110
SAMENVATTING
In 1979 is de vakgroep Humane Voeding van de Landbouwhogeschool te
Wageningen gestart met een onderzoeksproject op het gebied van obesitas bij
jonge volwassenen. De belangrijkste doelstellingen van dit project hebben be
trekking op de etiologie en op gezondheidsconsequenties van obesitas. Het
betreft een prospectief onderzoek dat in de gemeente Ede wordt uitgevoerd bij
jonge volwassenen in drie leeftijdsgroepen (19-21, 24-26 en 29-31 jaar op
1 januari 1980). Dit proefschrift handelt over onderzoeken naar determinanten
van het lichaamsvetpercentage en twee methodologische onderzoeken met betrekking
tot relatief gewicht en het gewoonlijke lichamelijke activiteitenpatroon die
zijn uitgevoerd in het eerste deel van het bovengenoemde onderzoeksproject.
In de Inleiding wordt een algemeen overzicht gegeven van gangbare methoden
om het lichaamsvetpercentage te meten. Gezondheidsconsequenties en de etiologie
van obesitas worden hierin ook besproken. De onderzoeken die in Hoofdstuk 2 en
3 worden gerapporteerd hebben betrekking op ongeveer 3900 personen, terwijl een
steekproef van ongeveer 300 personen hieruit deelnam aan de onderzoeken die in
de Hoofdstukken 4-6 worden beschreven.
Hoofdstuk 2 heeft betrekking op de relatie tussen verschillende socio-2
-demografische variabelen en de body mass index (BMI; gewicht/lengte ) . De 2
prevalentie van ernstige obesitas (BMI > 30.0 kg/m ) was zowel bij mannen als
vrouwen 2%. De meest uitgesproken socio-demografische determinanten van BMI
waren leeftijd en opleidingsniveau. De oudere personen waren zwaarder dan de
jongere personen en diegenen met een hoger opleidingsniveau waren lichter dan
diegenen met een lager opleidingsniveau. Andere socio-demografische determinan
ten van BMI waren: het beroepsniveau van de vader en religie zowel bij mannen
als vrouwen; pariteit bij vrouwen; en de urbanisatiegraad en kerkbezoek bij
mannen.
In Hoofdstuk 3 wordt de gevonden relatie tussen het leefpatroon en BMI
beschreven. Vijf goed interpreteerbare factoren konden worden onderscheiden
binnen de aspecten van het leefpatroon die bij het onderzoek waren opgenomen.
Deze factoren werden geïnterpreteerd als indicatoren voor: 1, aan de lijn doen;
2, gedrag dat gekarakteriseerd wordt door de consumptie van koffie en alcohol,
rookgewoonten en het aantal uren slaap per nacht (CASS-gedrag); 3, snack-
-gebruik; 4, gezond-gedrag; en 5, lichamelijke activiteit. De zwaardere
personen hadden een hogere score voor aan de lijn doen en een lagere score voor

Ill
gezond-gedrag. Zwaardere mannen hadden ook een hogere score voor CASS-gedrag.
Hoofdstuk 4 heeft betrekking op de mogelijke verbetering van de schatting
van het lichaamsvetpercentage wanneer het relatief gewicht niet alleen is ge
baseerd op gewicht en lengte maar ook op skeletbouw. De schatting van het
lichaamsvetpercentage bleek echter niet verbeterd te kunnen worden wanneer ook
rekening werd gehouden met maten voor skeletbouw, zoals kniebreedte en pols
breedte. Van de berekende gewicht-lengte indices bleek BMI de meest geschikte
index te zijn.
In Hoofdstuk 5 worden de resultaten gepresenteerd van een vragenlijst die
ontwikkeld is voor de meting van het gewoonlijke lichamelijke activiteiten
patroon. Drie dimensies werden onderscheiden binnen dit patroon, namelijk:
1, lichamelijke activiteit bij het werk; 2, sport; en 3, lichamelijke activiteit
in de vrije tijd exclusief sport. Het opleidingsniveau was negatief gerelateerd
met de lichamelijke activiteit bij het werk, en positief met de lichamelijke
activiteit in de vrije tijd exclusief sport. Subjectieve belasting bij lichame
lijke inspanning was zowel negatief gerelateerd met de hoeveelheid sport die
men beoefende als met de overige lichamelijke activiteit in de vrije tijd. Bij
mannen was ook de lean body mass positief gerelateerd met lichamelijke activi
teit bij het werk en met de hoeveelheid sport die men beoefende.
Hoofdstuk 6 heeft betrekking op de relaties tussen enerzijds het lichaams
vetpercentage en anderzijds voedsel consumptie en het lichamelijke activiteiten
patroon. De gemiddelde energie-opname bij mannen was tamelijk hoog (ongeveer
3000 kcal); hetgeen een verklaring kan zijn voor de gemiddelde gewichtstoename
van 1,2 kg in het jaar voorafgaande aan het voedselconsumptieonderzoek. De ge
middelde energie-opname bij vrouwen was ongeveer 2170 kcal, hetgeen in overeen
stemming is met de aanbevolen hoeveelheid terwijl het gemiddelde lichaamsgewicht
constant bleef. Er waren geen grote verschillen tussen categorieën naar
lichaamsvetpercentage wat betreft het lichamelijke activiteitenpatroon. Haar de
energie-opname bij zwaardere personen was wel lager dan bij lichtere personen.
Deze bevinding is wellicht te verklaren door een bewuste vermindering van de
voedsel consumptie bij zwaardere personen die proberen af te vallen. Er is ook
een aanwijzing dat veel zwaardere personen een verlaagde energiebehoefte hebben,
maar het is niet duidelijk of dit een oorzaak is geweest van het ontstaan van
hun overgewicht, of juist een gevolg van langdurig aan de lijn doen.
Dit proefschrift wordt besloten met een algemene discussie in Hoofdstuk 7.
Enkele van de bevindingen kunnen nuttig zijn voor de preventie en behandeling
van obesitas. Wel moet worden benadrukt dat verschillende onderdelen nog nader
bestudeerd moeten worden in het onderzoeksproject waarvan dit proefschrift het
eerste resultaat is.
112
CURRICULUM VITAE
De auteur werd geboren op 10 november 1949 te Nieuw-Namen (gemeente Clinge).
Na het behalen van het diploma aan de Hogere Landbouwtechnologische School te
's-Hertogenbosch in 1971 en het vervullen van de militaire dienstplicht begon
hij in september 1972 met zijn studie aan de Landbouwhogeschool te Wageningen.
In 1979 slaagde hij voor het doctoraal examen met Voedingsleer en Gezondheids
leer als hoofdvakken en Inspanningsfysiologie als extra bijvak. Van april 1979
tot september 1982 verrichtte hij met financiële steun van het Praeventiefonds
het in dit proefschrift beschreven onderzoek bij de vakgroep Humane Voeding van
de Landbouwhogeschool. Vanaf januari 1982 is hij tevens werkzaam bij het
Instituut voor Sociale Geneeskunde van de Katholieke Universiteit Nijmegen.
Copyright © 2022 FDOKUMEN