Changes in Active Behaviours, Physical Activity, Sedentary ...
Upload
khangminh22Category
view
4download
0
Explaining socioeconomic inequalities in health behaviours
– the role of environmental factors
C.B.M. Kamphuis
Kamphuis_09.indd 1 20-8-2008 10:34:24

The printing of this thesis was financially supported by the Netherlands Institute for Social Research/Scp, The Hague, and by Zonmw, the Netherlands organisation for health research and development, The Hague.
Kamphuis, c.B.m.Socioeconomic inequalities in health behaviours - the role of environmental factors. Thesis Erasmus mc, University medical centre Rotterdam – with references – with summary in Dutch.
ISBN 978-90-9023392-5
DTp: Textcetera, The Hagueprinted by: The Netherlands Institute for Social Research/Scp, The Haguecover design by: moon grafisch ontwerp, Leiden
© 2008, c.B.m. Kamphuis
No part of this publication may be reproduced or transmitted in any form or by any means without written permission of the copyright owner. Some of the chapters are based on pub-lished manuscripts, which were reproduced with permission of the publishers and co-authors.
Kamphuis_09.indd 2 20-8-2008 10:34:24

Explaining Socioeconomic Inequalities in Health Behaviours
– the role of environmental factors
Het verklaren van sociaaleconomische verschillen in gezondheidsgerelateerd gedrag
– de rol van omgevingsfactoren
proefschrift
ter verkrijging van de graad van doctor aan deErasmus Universiteit Rotterdam
op gezag van de rector magnificus
prof.dr. S.w.J. Lamberts
en volgens besluit van het college van promoties
De openbare verdediging zal plaatsvinden opwoensdag 8 oktober 2008 om 9.45 uur
door
carlijn Barbara maria Kamphuisgeboren te Zoetermeer
Kamphuis_09.indd 3 20-8-2008 10:34:24

Promotiecommissie
promotor: prof.dr. J.p. mackenbachOverige leden: prof.dr. ir. J. Brug prof.dr. p.p. Groenewegen prof.dr. S. macintyre
co-promotor: Dr. F.J. van Lenthe
Kamphuis_09.indd 4 20-8-2008 10:34:24

Contents
Part 1: Introduction
1 General Introduction
2 Investigating the contribution of environmental characteristics to socioeconomic inequalities in health-related behaviour in the GLOBE study: theoretical framework and study design Submitted
3 perceived environmental determinants of physical activity and fruit and vegetable consumption among low and high socioeconomic groups in the Netherlands Health & Place 2007, 13(2):493-503.
Part 2: Socioeconomic status, environmental factors and physical activity
4 The relative importance of neighbourhood factors for different levels of sports activity Submitted
5 Socioeconomic status, environmental and individual factors, and sports participation Medicine & Science in Sports & Exercise 2008, 40(1):71-81
6 Socioeconomic variations in recreational walking among older adults: mediation of neighbourhood perceptions and individual cognitions Submitted
7 why do poor people perceive poor neighbourhoods? Explaining socioeconomic differences in neighbourhood perceptions with objective neighbourhood features and psychosocial characteristics Submitted
9
25
45
67
77
99
119
Kamphuis_09.indd 5 20-8-2008 10:34:24

Contents
8 Area variations in recreational cycling in melbourne, Australia: a composition or contextual effect? Journal of Epidemiology and Community Health (in press)
Part 3: Socioeconomic status, environmental factors and diet
9 A systematic review of environmental factors and energy and fat intakes among adults: is there evidence for environments that encourage obesogenic dietary intakes? Public Health Nutrition, 10(10):1005-1017
10 Environmental correlates of fruit and vegetable consumption - a systematic review British Journal of Nutrition 2006, 96(4):620-635
11 Household and food shopping environments: do they play a role in fruit and vegetable consumption, socioeconomic and area differences in these behaviours? Journal of Epidemiology and Community Health (in press)
Part 4: Discussion
12 General Discussion
SummarySamenvatting
Tot slot
Dankwoordcurriculum Vitaepublications
143
165
191
219
239
267275
284287289
Kamphuis_09.indd 6 20-8-2008 10:34:24

Part 1Introduction
Kamphuis_09.indd 7 20-8-2008 10:34:24

Kamphuis_09.indd 8 20-8-2008 10:34:24

General Introduction
1
Kamphuis_09.indd 9 20-8-2008 10:34:25

10 Part I Introduction
General Introduction
In general, those who are worse off in terms of power, knowledge and wealth are also worse off in terms of health. This inverse relation between socioeconomic status (SES) and health has been observed for centuries [1]. with few excep-tions, the association exists regardless of the measure of SES that is employed (education, income, or occupation) or the health outcome studied. Still today, in a developed country like the Netherlands, considerable socioeconomic dif-ferences in health exist. Those with a lower socioeconomic position live three to five years shorter than their higher status counterparts (on average), and also spend ten to fifteen more years in poorer health [2]. Lower socioeconomic groups have higher rates of morbidity and mortality from cardiovascular dis-eases, obesity, type 2 diabetes and cancers [3, 4], report more health problems and complaints [5], and have poorer self-perceived health [6].
Despite all advances during the last century that have resulted in today’s modern society, health inequalities have not reduced over time, in fact, they have even widened over the recent decades [7]. However, the common conven-tion in nowadays’ western societies is that socioeconomic health inequalities should be reduced, for several reasons. First, health inequalities are considered unjust, as the poorer health of lower socioeconomic groups is at least partly due to societal and environmental processes which are beyond their individual con-trol [8]. Secondly, good health and freedom of choice are valued high within our society, and good health is an important predisposition for every individ-ual’s opportunities in life. Thirdly, if the average health status of lower SES groups could be upgraded to the level of their more advantaged counterparts, this would have large gains for public health in general [8]. Lastly, variations in the magnitude of health inequalities over time and between countries suggest that health inequalities are, at least to some extent, modifiable [9]. Therefore, research is needed to find entry-points for policies and interventions to reduce socioeconomic health inequalities.
1.1 Possible explanations for socioeconomic health inequalities
much remains to be understood about the ways in which SES and health are related. The influential Black report, published in the U.K. in 1980 [10], pro-posed three explanatory mechanisms for the observed socioeconomic patterns: causation, selection, and artefacts. The latter mechanism suggests that soci-oeconomic health differences are the result of artefacts due to, for instance, measurement error or inappropriate measures of health or SES. The strong and consistent findings for the association between SES and health, noted in many countries and across varying time periods, do not suggest that artefact plays a major role. The second mechanism, selection, can be either direct or
Kamphuis_09.indd 10 20-8-2008 10:34:25

11General Introduction
indirect. Direct selection involves a person’s health status affecting their social position, i.e. healthy people may move up in the socioeconomic hierarchy, while unhealthy people may move down. Indirect selection effects may also play a role, in which indicators of good health affect SES, such as between height and SES, or physical attractiveness and SES; that is, taller and handsomer per-sons are more likely to be upwardly mobile [11]. However, the first mentioned mechanism, causation, where SES is related to health via intermediary factors, is believed to be the main explanatory mechanism for socioeconomic health differences.
causation mechanisms assume that SES has an indirect effect on health through an unequal distribution of determinants of health across socioeconomic groups, with unfavourable determinants being more prevalent among the lower socioeconomic groups. many causal pathways through which income, educa-tion and occupation may affect health have been postulated and investigated, including (1) material factors, i.e. exposure to household/work/neighbourhood environments that are not conducive to health, such as poor housing condi-tions, crowding, occupational hazards, and crime; (2) psychosocial factors, e.g. exposure to stressful situations, adoption of effective coping strategies, abil-ity to control one’s environment, availability of social relationships and sup-port; (3) behavioural factors, i.e. distribution of health risk behaviours, such as smoking, excessive alcohol consumption, unhealthy diet, and inadequate exer-cise; and (4) healthcare-related factors, i.e. access to preventive and curative health care, or information regarding health risks [12, 13]. The four groups of explanatory factors seem to be interrelated, indicating that some mechanisms work through others rather than work independently from each other [3, 13]. Studies that have incorporated risk factors from several domains show that, for instance, income differences in cardiovascular mortality and all-cause mor-tality [3], and educational differences in all-cause mortality [13] were almost completely explained by a combination of multiple explanatory factors.
The relative importance of different (groups of) explanatory factors for socio-economic health differences is under debate. Some argue for a primarily mate-rial explanation, in which inequalities in health are the result of differential exposure to material deprivation (the ‘neo-material’ interpretation [14]), i.e. unequal access to tangible material conditions. Others argue that relative mate-rial standards, rather than absolute standards, are influential (the ‘psychosocial interpretation’). They consider socioeconomic health inequalities largely the direct or indirect effects of stress stemming from being lower on the socio-economic hierarchy, or living under conditions of relative disadvantage [14]. Another part of the literature merely focuses on health behaviours as explana-tion for socioeconomic health differences. Health behaviours have been ranked as one of the main explanations since the 1980’s [15, 16], and have been found
Kamphuis_09.indd 11 20-8-2008 10:34:25

12 Part I Introduction
to explain about 30-50% of socioeconomic differences in mortality [3, 13, 17, 18], although other studies found only modest contributions [19]. Lastly, some studies suggest that unequal access to health care contributes to socioeconomic differences in health, however in the Netherlands, health care utilisation could not explain socioeconomic differences in the course of diabetes and heart dis-ease [20, 21]. Instead, lower SES groups were found to visit their Gp more often and spend more nights in hospital compared to higher SES groups, even when taking into account their worse health status [22] (however, they were less likely to consult a specialist).
Despite all research pointing to possible explanatory factors for the consist-ent association between SES and health, still, it is unclear why these risk fac-tors are differentially distributed by SES. In this thesis, we will focus on the behavioural explanation for socioeconomic health differences, as behaviour is in principal changeable, and determinants of health behaviours may offer good entry-points to reduce socioeconomic health inequalities. we will ascertain why these are differentially patterned across SES-groups for two health behaviours, namely physical activity and diet.
1.2 Socioeconomic differences in health-related behaviours
physical activity and diet are important determinants of health. The protective effects of physical activity for total mortality, cardiovascular disease, and dia-betes are widely known and supported by a large amount of evidence [23-25]. physical activity also increases chances for longevity: life expectancy for seden-tary people at age 50 years is 1,5 years shorter than for people engaging in mod-erate daily physical activity, and more than 3,5 years shorter than for people with high physical activity levels [26]. How much activity is required to achieve health benefits is still a topic of debate. while many studies show that moderate intensity exercise, like walking, is sufficient to reduce the risk of cardiovascu-lar disease [27, 28], others conclude that only heavy or vigorous activity, like sports, confers benefit [29-31]. As walking is more easily implemented on a daily base and more attainable for sedentary people than vigorous exercise, the focus of current physical activity recommendations is to promote moderately intense types of physical activity [32, 33]. Substantial epidemiological evidence points to a protective role for fruit and vegetables in the prevention of several cancers and coronary heart disease, and evidence is accumulating for a protec-tive role in stroke [34]. Low fruit and vegetable intake is one of the leading risk factors for death from cancer worldwide, together with smoking and alcohol use [35]. Since fruits and vegetables are a valuable source of dietary fibre, their consumption may also protect against weight gain and obesity [36, 37].
Kamphuis_09.indd 12 20-8-2008 10:34:25

13General Introduction
compared to people from high socioeconomic groups, people from lower socio economic groups are more likely to be physically inactive [38-40], not to walk for recreation or transport [41], to have lower levels of leisure time physical activity [42, 43], and to show decreases in leisure physical activity over time [44]. Dietary patterns also differ between socioeconomic groups [45]. Lower socioeconomic groups are less likely to consume any fruit or vegetables [46-48], have lower average levels consumption of both fruits and vegetables [49-53], and consume fewer varieties of fruits and vegetables than their more advantaged counterparts [46, 47]. To be able to reduce socioeconomic differ-ences in physical activity and fruit and vegetable consumption, one needs to know which factors may offer good entry-points for interventions, i.e. factors that are related to the health behaviour and patterned by SES. To ascertain the relevant determinants, theoretical models that try to explain and predict varia-tions in health behaviours are consulted.
1.3 Social-cognitive models: individual cognitions and health behaviours
Among the most commonly-employed theoretical models to predict health behaviours are two social cognitive theories: the Theory of planned Behav-iour and the Social cognitive Theory [54, 55]. Fishbein and Ajzen’s Theory of planned Behaviour (TpB) assumes that one’s intention to change his/her behaviour (e.g. I want to become physically activity on a daily basis) is deter-mined by attitudes towards the behaviour (e.g. daily physical activity is fun; daily physical activity is healthy), subjective norms that are associated with the behaviour (e.g. family and friends think that I should be physically active on a daily base), and perceived behavioural control to perform the behaviour (e.g. I’m sure I could be physically active daily) (see Figure 1.1).
Figure 1.1 Core of the Theory of Planned Behaviour, Fishbein & Ajzen
Backgroundfactors
Attitude
Subjective norm
Perceived behavioral control
Intention Health behaviour
Bandura’s Social cognitive Theory (ScT) proposes that behaviour change is affected by social environmental influences, personal factors, and attributes of the behaviour itself. Each of these factors may affect or be affected by either of
Kamphuis_09.indd 13 20-8-2008 10:34:25

14 Part I Introduction
the other two (see Figure 1.2). The ScT has some similarities with the TpB. comparable to the TpB construct of ‘attitude’ is the ScT construct of ‘out-come expectancies’, which are anticipated, either positive or negative outcomes of a particular behaviour (e.g. daily physical activity will cost too much time; daily physical activity will be good for my health). Very similar to the construct of perceived behavioural control in the TpB, is the ScT construct of self-efficacy, which is the confidence a person feels about performing a particular behaviour (e.g. I’m sure I could be physically active daily). The social compo-nent, however, receives more attention in the ScT than TpB. The effects of expected reinforcement from the social environment (e.g. social support for daily activity by friends and family) and observation and modelling (e.g. friends and family are daily active as well) are considered crucial in the adoption of health behaviours.
Figure 1.2 Social Cognitive Theory, Bandura
Environment Personal factors
Behaviour
Attitudes, subjective norms and perceived behavioural control predict general variations in health behaviours, accounting for 27% and 39% of the variance in behaviour and intention, respectively [56]. Also, social support and mod-elling and, in particular, self-efficacy are strong correlates of health behav-iours [57]. These individual cognitions have been utilised less frequently for understanding socioeconomic variations in health behaviours. However, lower socioeconomic groups have shown to be less health consciousness and having stronger beliefs about effects of destiny on health, which were associated with less healthy behavioural choices [58]. Knowledge is thought to be an important prerequisite for making decisions about health and health behaviours, as these are partly based on beliefs of what causes disease and whether or not those causes can be overcome. A canadian study has shown that knowledge of the main modifiable cardiovascular risk factors was strongly and positively related to SES [59]. Similar, having more nutrition knowledge is likely to be one of
Kamphuis_09.indd 14 20-8-2008 10:34:26
15General Introduction
the reasons why people of higher SES eat more fruit and vegetables [58]. Self-efficacy, enjoyment of physical activity, and intentions were found to contribute to the explanation of socioeconomic differences in walking [41].
Although some of the variations in health behaviours can be accounted for by individual cognitions, social-cognitive theories have been criticized for their focus on such motivational factors only, paying little attention to environmental, non-voluntary factors which are beyond the individual’s control. To better understand why people behave as they do, and to increase the likelihood of behaviour change, it is important to put behaviour into context. This renewed interest in environmental factors for health and health behaviours has shifted the focus from social-cognitive towards ecological models of health-behaviours.
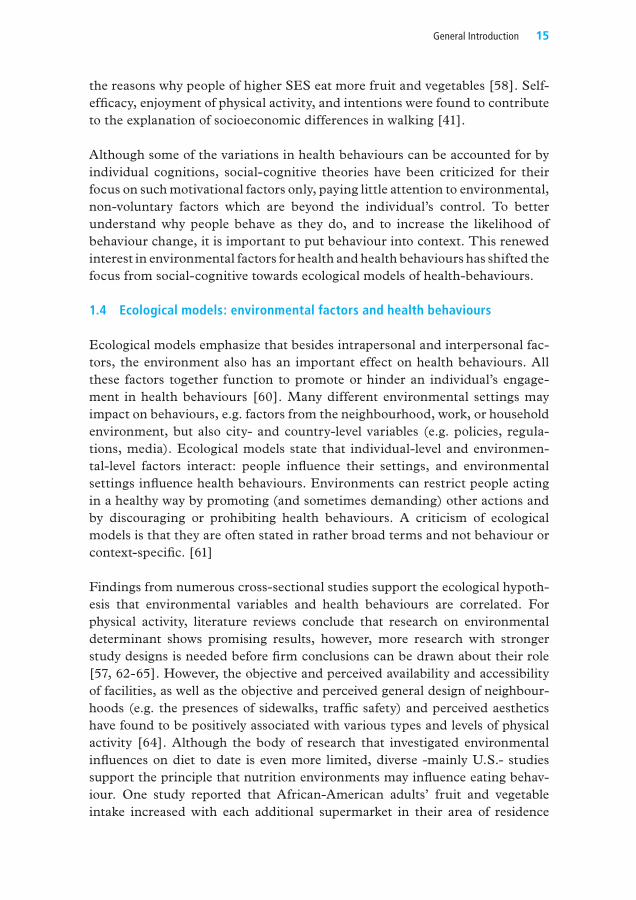
1.4 Ecological models: environmental factors and health behaviours
Ecological models emphasize that besides intrapersonal and interpersonal fac-tors, the environment also has an important effect on health behaviours. All these factors together function to promote or hinder an individual’s engage-ment in health behaviours [60]. many different environmental settings may impact on behaviours, e.g. factors from the neighbourhood, work, or household environment, but also city- and country-level variables (e.g. policies, regula-tions, media). Ecological models state that individual-level and environmen-tal-level factors interact: people influence their settings, and environmental settings influence health behaviours. Environments can restrict people acting in a healthy way by promoting (and sometimes demanding) other actions and by discouraging or prohibiting health behaviours. A criticism of ecological models is that they are often stated in rather broad terms and not behaviour or context-specific. [61]
Findings from numerous cross-sectional studies support the ecological hypoth-esis that environmental variables and health behaviours are correlated. For physical activity, literature reviews conclude that research on environmental determinant shows promising results, however, more research with stronger study designs is needed before firm conclusions can be drawn about their role [57, 62-65]. However, the objective and perceived availability and accessibility of facilities, as well as the objective and perceived general design of neighbour-hoods (e.g. the presences of sidewalks, traffic safety) and perceived aesthetics have found to be positively associated with various types and levels of physical activity [64]. Although the body of research that investigated environmental influences on diet to date is even more limited, diverse -mainly U.S.- studies support the principle that nutrition environments may influence eating behav-iour. One study reported that African-American adults’ fruit and vegetable intake increased with each additional supermarket in their area of residence
Kamphuis_09.indd 15 20-8-2008 10:34:26

16 Part I Introduction
[66]. Two other U.S. studies reported positive associations between proximity to supermarkets/health food stores and dietary patterns [67, 68]. The growing number of fast food establishments present in neighbourhoods has been linked to the current obesity epidemic, as fast food consumption is associated with weight gain and intakes less consistent with dietary recommendations [69, 70].
1.5 Environmental factors and socioeconomic inequalities in health behaviours
One may hold the opinion that it is an individual’s choice to eat less healthy, do less exercise and smoke. However, in view of the collective nature of mul-tiple health behaviours being less favourable among the disadvantaged, it is rather unlikely that these behaviours are purely the result of individual choices. choices in relation to food and activity are not solely individual matters, but it is more likely that neighbourhood, household or material conditions con-strain and govern choices to a considerable extent, as suggested by ecologi-cal models. The cost and accessibility of products and facilities, the physical area where households of lower SES groups are located, and less favourable social circumstances may make it less easy for lower SES groups to behave in a healthy manner [43, 71-73]. The growing body of evidence for place effects on health supports this hypothesis. Even after adjustment for individual-level variables such as age, gender, and individual SES, residents of disadvantaged neighbourhoods were found to be in poorer health [74-77] and have higher rates of unhealthy behaviours, i.e. smoking [74, 78-81], physical inactivity [78, 80-83] and poor diet [81, 84]. This means that the higher prevalence of unhealthy behaviours among people of low SES may be partly due to either direct or indirect adverse effects of their neighbourhood of residence. Although there is some promising evidence that neighbourhood factors may influence physical activity and dietary behaviours, little is known about the contribu-tion of specific neighbourhood characteristics to socioeconomic differences in health behaviours.
1.6 This thesis
The aim of this thesis is to investigate why poor people behave poorly [43], and to examine the contribution of environmental factors to the explanation of socioeconomic inequalities in health behaviours. Associations between SES, environmental factors, and health behaviours that will be tested in this thesis, are illustrated in Figure 1.3. Factors from many environmental settings may influence behaviour (e.g. work, household, media, national policies) and sev-eral of these will be examined in this thesis. However, in view of the above-mentioned evidence, that neighbourhoods in which poorer people live may be of poorer quality, and because the neighbourhood may offer good opportuni-
Kamphuis_09.indd 16 20-8-2008 10:34:26

17General Introduction
ties for (community) interventions, neighbourhood factors will be the main environmental factors examined in this thesis. The central research questions that will be addressed are:
1) To what extent do socioeconomic inequalities in specific types of physical inactivity and dietary behaviours exist?
2) To what extent are neighbourhood factors associated with specific physical inactivity and dietary behaviours (2a) and do they differ by SES (2b)?
3) To what extent and via which pathways are neighbourhood factors involved in the explanation of socioeconomic inequalities in physical inactivity and dietary behaviours?
Figure 1.3 Hypothesised associations between SES, environmental factors and health behaviours
Individual SES- Income- Education
Area SES
1
Health behaviours
- Physical inactivity- Diet
2b 2a
Objective/perceivedenvironmental factors:- Physical environment- Social environment
3
The thesis is divided into three parts. part 1 has started with the present chap-ter and continues with chapter 2, introducing the conceptual framework, the stepwise study design and research methods that have been applied in several studies of this thesis. chapter 3 presents a focus group study, with which we started off this project, to explore the research questions of this thesis in a qualitative way, i.e. by asking groups of adults from lower and higher socio-economic backgrounds: what environmental factors in your daily life influence your physical activity and fruit and vegetable consumption?
In part 2, the focus is on physical inactivity behaviours, and associations with SES and environmental factors are examined. First, we study the relative impor-tance of neighbourhood factors for two specific outcomes of sports activity: doing any sports activity, and doing sports according to recommended levels (chapter 4). The contributions of neighbourhood, household, and individual factors to the explanation of socioeconomic inequalities in sports participa-tion are explored in chapter 5. In chapter 6, we examine how socioeconomic variations in recreational walking among older adults are mediated by neigh-
Kamphuis_09.indd 17 20-8-2008 10:34:26
18 Part I Introduction
bourhood factors and individual cognitions. In the next chapter, chapter 7, we study to what extent neighbourhood perceptions correspond with objective characteristics of neighbourhoods, and which other factors may play a role in how people form perceptions of their neighbourhood. The study described in the last chapter of part 2, chapter 8, has been carried out in Australia, and data were collected by the University of melbourne, in collaboration with the Queensland University of Technology, Brisbane. we investigate how area vari-ations in recreational cycling in melbourne can be explained by objective area characteristics.
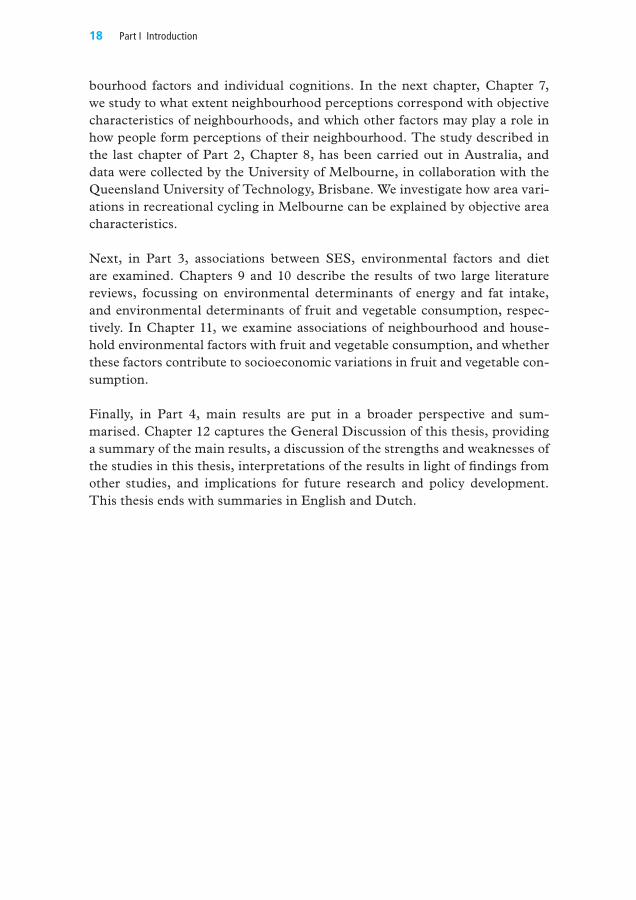
Next, in part 3, associations between SES, environmental factors and diet are examined. chapters 9 and 10 describe the results of two large literature reviews, focussing on environmental determinants of energy and fat intake, and environmental determinants of fruit and vegetable consumption, respec-tively. In chapter 11, we examine associations of neighbourhood and house-hold environmental factors with fruit and vegetable consumption, and whether these factors contribute to socioeconomic variations in fruit and vegetable con-sumption.
Finally, in part 4, main results are put in a broader perspective and sum-marised. chapter 12 captures the General Discussion of this thesis, providing a summary of the main results, a discussion of the strengths and weaknesses of the studies in this thesis, interpretations of the results in light of findings from other studies, and implications for future research and policy development. This thesis ends with summaries in English and Dutch.
Kamphuis_09.indd 18 20-8-2008 10:34:26

19General Introduction
References
1 Antonovsky A. Social class, life expectancy and overall mortality. Milbank Mem Fund Q 1967;45:31-73.
2 Van Herten L, Oudshoorn K, perenboom Rea. Gezonde levenswachting naar sociaal-economische status [Healthy life expectancy and socioeconomic position]. Leiden: TNO preventie en Gezondheid 2002.
3 Lynch Jw, Kaplan GA, cohen RD, et al. Do cardiovascular risk factors explain the rela-tion between socioeconomic status, risk of all-cause mortality, cardiovascular mortality, and acute myocardial infarction? Am J Epidemiol 1996;144:934-42.
4 Van Lenthe FJ, mackenbach Jp. Neighbourhood deprivation and overweight: the GLOBE study. Int J Obes Relat Metab Disord 2002;26:234-40.
5 Stronks K, Van de mheen H, Looman cwN, et al. Behavioural and structural factors in the explanation of socioeconomic inequalities in health: an empirical analysis. Sociol Health Illness 1996;18:653-74.
6 Simon JG, Van de mheen H, Van der meer JB, et al. Socioeconomic differences in self-assessed health in a chronically ill population: the role of different health aspects. J Behav Med 2000;23:399-420.
7 mackenbach Jp, Bos V, Andersen O, et al. widening socioeconomic inequalities in mortality in six western European countries. Int J Epidemiol 2003;32:830-7.
8 mackenbach Jp. Ongezonde verschillen: over sociale stratificatie en gezondheid in Nederland. Assen: Van Gorcum 1994.
9 mackenbach Jp, Judge K, Navarro V, et al. Strategies to reduce socioeconomic inequali-ties in health in Europe: lessons from the Eurothine project. Tackling health inequalities in Europe: an integrated approach - Eurothine Final Report. Rotterdam: Erasmus University medical centre 2007.
10 Inequalities in health: the Black report. Harmondsworth: pelican 1992:(Originally Department of Health and Social Security, August 1980.).
11 Nystrom peck Am, Vagero D. Adult body height, self perceived health and mortality in the Swedish population. J Epidemiol Community Health 1989;43:380–4.
12 Goldman N. Social inequalities in health. Disentangling the underlying mechanisms. Ann N Y Acad Sci 2001;954:118-39.
13 van Oort FV, van Lenthe FJ, mackenbach Jp. material, psychosocial, and behavioural factors in the explanation of educational inequalities in mortality in The Netherlands. J Epidemiol Community Health 2005;59:214-20.
14 Lynch Jw, Smith GD, Kaplan GA, et al. Income inequality and mortality: importance to health of individual income, psychosocial environment, or material conditions. Bmj 2000;320:1200-4.
15 macintyre S. The Black Report and beyond: what are the issues? Soc Sci Med 1997;44:723-45.
16 Towsend p, Davidson N, whitehead m, eds. Imequalities in health. The Black Report. London: penguin 1982.
17 Laaksonen m, Talala K, martelin T, et al. Health behaviours as explanations for educa-tional level differences in cardiovascular and all-cause mortality: a follow-up of 60 000 men and women over 23 years. European Journal of Public Health 2007;18:38-43.
18 Schrijvers cT, Stronks K, van de mheen HD, et al. Explaining educational dif-ferences in mortality: the role of behavioral and material factors. Am J Public Health 1999;89:535-40.
Kamphuis_09.indd 19 20-8-2008 10:34:26

20 Part I Introduction
19 Lantz pm, Lynch Jw, House JS, et al. Socioeconomic disparities in health change in a longitudinal study of US adults: the role of health-risk behaviors. Soc Sci Med 2001;53:29-40.
20 Van der meer JBw, mackenbach Jp. The heart of the matter: differences in the course of heart disease according to level of education. In: Van der meer JBw, ed. Equal care, equal cure? (PhD thesis). Rotterdam: Erasmus University 1998:141-55.
21 Van der meer JBw, mackenbach Jp. The care and course of diabetes: differences accord-ing to level of education. Health Policy 1999;46:127-41.
22 Kunst AE, meerding wJ, Varenik N, et al. Sociale verschillen in zorggebruik en zorgko-sten in Nederland 2003. Een verkenning van verschillen naar sociaal-economische positie, samenlevingsvorm en land van herkomst. Zorg voor Euro’s - 5. Bilthoven: Rijksinstituut voor Volksgezondheid en milieu 2008:25-33.
23 Batty GD. physical activity and coronary heart disease in older adults. A systematic review of epidemiological studies. Eur J Public Health 2002;12:171-6.
24 Schnohr p, Lange p, Scharling H, et al. Long-term physical activity in leisure time and mortality from coronary heart disease, stroke, respiratory diseases, and cancer. The copenhagen city Heart Study. Eur J Cardiovasc Prev Rehabil 2006;13:173-9.
25 Schnohr p, Scharling H, Jensen JS. changes in leisure-time physical activity and risk of death: an observational study of 7,000 men and women. Am J Epidemiol 2003;158:639-44.
26 Franco OH, de Laet c, peeters A, et al. Effects of physical activity on life expectancy with cardiovascular disease. Arch Intern Med 2005;165:2355-60.
27 wannamethee SG, Shaper AG. physical activity in the prevention of cardiovascular dis-ease: an epidemiological perspective. Sports Med 2001;31:101-14.
28 wannamethee SG, Shaper AG, walker m. changes in physical activity, mortality and inci-dence of coronary heart disease in older men. Lancet 1998;351:1603-8.
29 Lee I-m. No pain, no gain? Thoughts on the caerphilly study. Br J Sports Med 2004;38:4-5.
30 Rothenbacher D, Koenig w, Brenner H. Lifetime physical activity patterns and risk of coronary heart disease. Heart 2006;92:1319-20.
31 Swain Dp, Franklin BA. comparison of cardioprotective benefits of vigorous versus moderate intensity aerobic exercise. Am J Cariol 2006;97:141-7.
32 Haskell wL, Lee I-m, pate RR, et al. physical Activity and public Health: Updated Recommendation for Adults from the American college of Sports medicine and the American Heart Association. MedSciSports Exerc 2007;39:1423-34.
33 Kemper HcG, Ooijendijk wTm, Stiggelbout m. consensus over de Nederlandse norm voor gezond bewegen. TSG 2000;78:180-3.
34 Van Duyn mA, pivonka E. Overview of the health benefits of fruit and vegeta-ble consumption for the dietetics professional: selected literature. J Am Diet Assoc 2000;100:1511-21.
35 Danaei G, Vander Hoorn S, Lopez AD, et al. causes of cancer in the world: com-parative risk assessment of nine behavioural and environmental risk factors. Lancet 2005;366:1784-93.
36 Bes-Rastrollo m, martinez-Gonzalez mA, Sanchez-Villegas A, et al. Association of fiber intake and fruit/vegetable consumption with weight gain in a mediterranean population. Nutrition 2006;22:504-11.
37 Davis JN, Hodges VA, Gillham mB. Normal-weight adults consume more fiber and fruit than their age- and height-matched overweight/obese counterparts. J Am Diet Assoc 2006;106:833-40.
Kamphuis_09.indd 20 20-8-2008 10:34:26

21General Introduction
38 Droomers m, Schrijvers cT, van de mheen H, et al. Educational differences in lei-sure-time physical inactivity: a descriptive and explanatory study. Soc Sci Med 1998;47:1665-76.
39 marshall SJ, Jones DA, Ainsworth BE, et al. Race/ethnicity, social class, and leisure-time physical inactivity. Med Sci Sports Exerc 2007;39:44-51.
40 crespo cJ, Ainsworth BE, Keteyian SJ, et al. prevalence of physical inactivity and its relation to social class in U.S. adults: results from the Third National Health and Nutri-tion Examination Survey, 1988-1994. Med Sci Sports Exerc 1999;31:1821-7.
41 Ball K, Timperio A, Salmon J, et al. personal, social and environmental determinants of educational inequalities in walking: a multilevel study. J Epidemiol Community Health 2007;61:108-14.
42 Lindstrom m, Hanson BS, Ostergren pO. Socioeconomic differences in leisure-time physical activity: the role of social participation and social capital in shaping health related behaviour. Soc Sci Med 2001;52:441-51.
43 Lynch Jw, Kaplan GA, Salonen JT. why do poor people behave poorly? Variation in adult health behaviours and psychosocial characteristics by stages of the socioeconomic lifecourse. Soc Sci Med 1997;44:809-19.
44 Droomers m, Schrijvers cT, mackenbach Jp. Educational level and decreases in leisure time physical activity: predictors from the longitudinal GLOBE study. J Epidemiol Com-munity Health 2001;55:562-8.
45 martikainen p, Brunner E, marmot m. Socioeconomic differences in dietary patterns among middle-aged men and women. Soc Sci Med 2003;56:1397-410.
46 Giskes K, Turrell G, patterson c, et al. Socioeconomic differences among Australian adults in consumption of fruit and vegetables and intakes of vitamins A, c and folate. J Hum Nutr Diet 2002;15:375-85; discussion 87-90.
47 Giskes K, Turrell G, patterson c, et al. Socioeconomic differences in fruit and veg-etable consumption among Australian adolescents and adults. Public Health Nutr 2002;5:663-9.
48 Laaksonen m, prattala R, Helasoja V, et al. Income and health behaviours. Evi-dence from monitoring surveys among Finnish adults. J Epidemiol Community Health 2003;57:711-7.
49 Irala-Estevez JD, Groth m, Johansson L, et al. A systematic review of socioeconomic differences in food habits in Europe: consumption of fruit and vegetables. Eur J Clin Nutr 2000;54:706-14.
50 Roos G, Johansson L, Kasmel A, et al. Disparities in vegetable and fruit consumption: European cases from the north to the south. Public Health Nutr 2001;4:35-43.
51 Johannson L, Andersen L. who eats 5 a day?: intake of fruits and vegetables among Norwegians in relation to gender and lifestyle. Journal of the American Dietetic Association 1998;98:689-91.
52 Johansson L, Thelle DS, Solvoll K, et al. Healthy dietary habits in relation to social determinants and lifestyle factors. Br J Nutr 1999;81:211-20.
53 Lindstrom m, Hanson BS, wirfalt E, et al. Socioeconomic differences in the consump-tion of vegetables, fruit and fruit juices. The influence of psychosocial factors. Eur J Public Health 2001;11:51-9.
54 Baranowski T, cullen Kw, Nicklas T, et al. Are current health behavioral change models helpful in guiding prevention of weight gain efforts? Obes Res 2003;11 Suppl:23S-43S.
55 Gebhardt wA, maes S. Integrating social-psychological frameworks for health behavior research. Am J Health Behav 2001;25:528-36.
56 Armitage cJ, conner m. Efficacy of the Theory of planned Behaviour: a meta-analytic review. Br J Soc Psychol 2001;40:471-99.
Kamphuis_09.indd 21 20-8-2008 10:34:26

22 Part I Introduction
57 Trost SG, Owen N, Bauman AE, et al. correlates of adults’ participation in physical activity: review and update. Med Sci Sports Exerc 2002;34:1996-2001.
58 wardle J, Steptoe A. Socioeconomic differences in attitudes and beliefs about healthy lifestyles. J Epidemiol Community Health 2003;57:440-3.
59 potvin L, Richard L, Edwards Ac. Knowledge of cardiovascular disease risk factors among the canadian population: relationships with indicators of socioeconomic status. Cmaj 2000;162:S5-11.
60 Sallis JF, Owen N. Ecological models of health behaviour. In: Glanz K, Lewis Fm, Rimer BK, eds. Health behaviour and health education Theory, research and practice. San Francisco: Jossey-Bass 2002:462-84.
61 Giles-corti B, Timperio A, Bull F, et al. Understanding physical activity environ-mental correlates: increased specificity for ecological models. Exerc Sport Sci Rev 2005;33:175-81.
62 Owen N, Humpel N, Leslie E, et al. Understanding environmental influences on walk-ing; Review and research agenda. Am J Prev Med 2004;27:67-76.
63 Humpel N, Owen N, Leslie E. Environmental factors associated with adults’ participa-tion in physical activity: a review. Am J Prev Med 2002;22:188-99.
64 mccormack G, Giles-corti B, Lange A, et al. An update of recent evidence of the rela-tionship between objective and self-report measures of the physical environment and physical activity behaviours. J Sci Med Sport 2004;7:81-92.
65 wendel-Vos w, Droomers m, Kremers S, et al. potential environmental determinants of physical activity in adults: a systematic review. Obesity reviews 2007.
66 morland K, wing S, Diez Roux A. The contextual effect of the local food environment on residents’ diets: the atherosclerosis risk in communities study. Am J Public Health 2002;92:1761-7.
67 cheadle A, psaty Bm, curry S, et al. community-level comparisons between the gro-cery store environment and individual dietary practices. Prev Med 1991;20:250-61.
68 Laraia BA, Siega-Riz Am, Kaufman JS, et al. proximity of supermarkets is positively associated with diet quality index for pregnancy. Prev Med 2004;39:869-75.
69 Bowman SA, Vinyard BT. Fast food consumption of U.S. adults: impact on energy and nutrient intakes and overweight status. J Am Coll Nutr 2004;23:163-8.
70 Satia JA, Galanko J, Siega-Riz Am. Eating at fast-food restaurants is associated with dietary intake, demographic, psychosocial and behavioral factors among African Ameri-cans in North carolina. Pub Health Nutr 2004;7:1089-96.
71 Booth SL, Sallis JF, Ritenbaugh c, et al. Environmental and societal factors affect food choice and physical activity: rationale, influences, and leverage points. Nutr Rev 2001;59:S21-39; discussion S57-65.
72 Dowler E. Inequalities in diet and physical activity in Europe. Public Health Nutr 2001;4:701-9.
73 Berkman LF, Kawachi I. A historical framework for social epidemiology. In: Berkman LF, Kawachi I, eds. Social epidemiology. Oxford: University press 2000.
74 Diez-Roux AV, Nieto FJ, muntaner c, et al. Neighborhood environments and coronary heart disease: a multilevel analysis. Am J Epidemiol 1997;146:48-63.
75 Bosma H, Van de mheen HD, Borsboom GJ, et al. Neighborhood socioeconomic status and all-cause mortality. Am J Epidemiol 2001;153:363-71.
76 pickett KE, pearl m. multilevel analyses of neighbourhood socioeconomic context and health outcomes: a critical review. J Epidemiol Community Health 2001;55:111-22.
77 Turrell G, Kavanagh A, Draper G, et al. Do places affect the probability of death in Aus-tralia? A multilevel study of area-level disadvantage, individual-level socioeconomic posi-tion and all-cause mortality, 1998-2000. J Epidemiol Community Health 2007;61:13-9.
Kamphuis_09.indd 22 20-8-2008 10:34:27

23General Introduction
78 Sundquist J, malmstrom m, Johansson SE. cardiovascular risk factors and the neigh-bourhood environment: a multilevel analysis. Int J Epidemiol 1999;28:841-5.
79 Diehr p, Koepsell T, cheadle A, et al. Do communities differ in health behaviors? J Clin Epidemiol 1993;46:1141-9.
80 Diez-Roux AV, Link BG, Northridge mE. A multilevel analysis of income inequality and cardiovascular disease risk factors. Soc Sci Med 2000;50:673-87.
81 Ecob R, macintyre S. Small area variations in health related behaviours; do these depend on the behaviour itself, its measurement, or on personal characteristics? Health Place 2000;6:261-74.
82 Van Lenthe FJ, Brug J, mackenbach Jp. Neighbourhood inequalities in physical inactiv-ity: the role of neighbourhood attractiveness, proximity to local facilities and safety in the Netherlands. Soc Sci Med 2005;60:763-75.
83 Yen IH, Kaplan GA. poverty area residence and changes in physical activity level: evi-dence from the Alameda county Study. Am J Public Health 1998;88:1709-12.
84 Diez-Roux AV, Nieto FJ, caulfield L, et al. Neighbourhood differences in diet: the Atherosclerosis Risk in communities (ARIc) Study. J Epidemiol Community Health 1999;53:55-63.
Kamphuis_09.indd 23 20-8-2008 10:34:27

Kamphuis_09.indd 24 20-8-2008 10:34:27

Van Lenthe Fj, Kamphuis CBm, Giskes K, Looman Cwn, Huisman m, Brug j & mackenbach jP. Investigating the contribution of environ mental characteristics to socioeconomic inequalities in health-related behaviour in the GLoBE study: theoretical framework and study design (submitted to BMC Public Health)
Investigating the contribution of environ-mental characteristics to socioeconomic inequalities in health-related behaviour in the GloBE study: theoretical framework and study design
2
Kamphuis_09.indd 25 20-8-2008 10:34:27

26 Part I Introduction
Abstract
Background The higher prevalence of unhealthy behaviours (such as smok-ing, physical inactivity, and low fruit and vegetable intake) among lower as compared to higher socioeconomic groups is still largely unexplained. we con-ducted a study to investigate the contribution of environmental characteristics at the neighbourhood, household and work level to socioeconomic inequalities in unhealthy behaviours within an ongoing prospective cohort study, i.e. the Dutch GLOBE study.
Aim To describe the theoretical background, design, methods, and response of the study, and some baseline characteristics of the study sample.
Methods Data were collected following a stepwise approach, including focus group interviews, a large scale postal survey, in-depth interviews, and an audit of objective environmental characteristics. Focus group interviews were con-ducted to explore perceptions of environmental influences on health behaviours among higher educated persons residing in affluent neighbourhoods (N=24), and lower educated participants from deprived neighbourhoods (N=14). A total of 10.270 persons aged 25 years and older were invited to participate in a postal survey in 2004. The overall response was 64.4%. Among respond-ers, 210 persons living in seven disadvantaged and 217 persons living in seven advantaged neighbourhoods were additionally interviewed (response 72.4%). For these fourteen neighbourhoods, objective environmental characteristics were assessed with systematic environmental audits.
Conclusions At the start of the study, there were many environmental charac-teristics of potential relevance for (socioeconomic inequalities in) health behav-iours. combining complementary methods of research in a stepwise approach is an efficient way of investigating the contribution of perceived and objective environmental determinants to socioeconomic inequalities in health-related behaviour and the pathways by which environmental characteristics are associ-ated with health-related behaviours.
Kamphuis_09.indd 26 20-8-2008 10:34:27

272 Theoretical framework and study design
Introduction
in the Netherlands, males and females with the lowest educational level have a lower life expectancy at birth of 5 and 2,5 years, respectively, compared to those in the highest educational group [1]. many unhealthy behaviours (smoking, phys-ical inactivity, and low fruit and vegetable intake) are more prevalent in lower than in higher socioeconomic groups, and contribute substantially to socioeconomic inequalities in mortality [2, 3] and morbidity [4]. Explanations of socioeconomic inequalities in smoking, physical inactivity and low fruit and vegetable intake are still largely unknown, and this hinders the development of effective interventions to reduce socioeconomic inequalities in these health behaviours.
Socioeconomic inequalities in health-related behaviours may be the result of an unequal distribution of behavioural determinants or mediators across socio-economic groups. For a long time, research on the determinants of health-related behaviour has focused on personal cognitive and other ‘proximal’ determinants. In recent years however, there has been a shift in perspective towards more distal and generic – environmental – determinants of health-related behaviours. For the explanation of socioeconomic inequalities in these behaviours, this shift may be particularly relevant: the collective nature of unhealthy behaviours within the lower socioeconomic groups suggests that health behaviours to some extent can be due to common environmental expo-sures, which may be more unfavourable in lower as compared to higher socio-economic groups. But which environmental characteristics are important in the explanation of socioeconomic inequalities in health-related behaviour, and what are the pathways through which environmental characteristics are linked to health-related behaviours?
The prospective GLOBE study was initiated in 1991 with the aim to assess the contribution of groups of factors to the explanation of socioeconomic inequali-ties in health in the Netherlands. The design of the study, as well as key find-ings after ten years of follow up have been described in detail elsewhere [5, 6]. The most recent wave of data collection (which started October 2004) was conducted with the main purpose of investigating the explanation of socio-economic inequalities in health-related behaviours (smoking, physical inactiv-ity, and low fruit and vegetable intake) with a special emphasis on the role of environmental characteristics. Specifically, the study aimed at answering the following research questions:1. what are the main environmental factors involved in the explanation of
socioeconomic inequalities in smoking, physical inactivity, and low fruit and vegetable intake?
2. what are the specific pathways between exposure to these environmental factors and smoking, physical inactivity, and low fruit and vegetable intake?
Kamphuis_09.indd 27 20-8-2008 10:34:27

28 Part I Introduction
3. what entry-points for interventions and policies to reduce socioeconomic variations in these health-related behaviours can be identified?To answer the first and second research questions empirically, a stepwise
protocol was adopted, in which different research methods were employed. It is the aim of this paper to describe the study protocol of this wave of data col-lection.
Design, participants and methods
A conceptual theoretical modelAt the start of the study there appeared to be no established conceptual model linking indicators of socioeconomic position (SEp) to (detailed) environmen-tal and individual characteristics and, ultimately, to health-related behaviours. Using an eclectic approach, a conceptual model was developed (Figure 1).
Figure 2.1 A framework of environmental determinants contributing to the explanation of socioeconomic inequalities in health behaviours
Enviromental influences
National
International
Socioeconomicposition
EducationOccupationIncome
Accessibility and availability → affect behaviour through (perceived) barriers ofbehaviour change. Include financial,geographical and temporal accessibility offacilities, and availability of products.
Psychosocial conditions → affect behaviour through e.g. social support and perceived behavioural control. Important aspects include social relation-ships, demand-control unbalance, and psychosocial stress.
-
Cultural conditions → affect behaviourthrough e.g. attitudes and social norms.Include ethnic background, religion, childhood circumstances, culture specific lifestyle patterns, general value orienta-tions, and cultural participation
Materialconditions Include financialproblems, material and socialdeprivation, andunfavourableworking, housingand neighbourhoodconditions.
Healthbehaviour
PhysicalactivityDiet
I
PBC
A
S
Household Work Neighbourhood
notes: The grey panel incorporates four boxes of environmental determinants. The terms household, neighbourhood and work are examples of the different settings in which these determinants may influence health behaviours. The abbreviations in the right hand boxes represent the following constructs: A= attitude; S= social influences, like social support, subjective norms, and modelling; PBC= perceived behavioural control; I=intention. These constructs are derived from the Theory of Planned Behaviour (33)
Kamphuis_09.indd 28 20-8-2008 10:34:27

292 Theoretical framework and study design
For this purpose, we based the model on existing knowledge about mecha-nisms leading to socioeconomic inequalities in health, i.e. a social causation mechanism was assumed to be operating. According to this mechanism, SEp is related to health-related behaviour via intermediary factors. Inspiration for such intermediary environmental factors came from leading reports [7] and empirical evidence on the explanation of socioeconomic inequalities in health [8], general ecological models [9], the Triadic Influence model [10], and the separation of environmental groups in the Angelo model [11]. Eventually, envi-ronmental characteristics of the neighbourhood, household, and work setting were included, which focussed on material conditions, access and availability, psychosocial and cultural conditions. These groups of factors were thought to be linked to health-related behaviours via individual characteristics as derived from the Theory of planned Behaviour [12]. This model served as a general framework for data collection and analysis.
Design: A stepwise approachTo answer the research questions, a stepwise approach was used. This approach included focus group discussions, a postal survey and in-depth oral interviews. It was recognised that both perceived and objective environmental character-istics could be relevant for health-related behaviours, and that these would not automatically be overlapping, since people may differ in their perceptions of objectively equal environmental characteristics [13]. Therefore, objective envi-ronmental data were also collected. The use of personal data in the GLOBE study is in compliance with the Dutch personal Data protection Act and the municipal Database Act, and has been registered with the Dutch Data protec-tion Authority (number 1248943). No formal approval of the medical Ethical committee was required for the study.
1 FocusgroupsAs a first step, focus group discussions were conducted to investigate whether environmental factors (as captured by the conceptual model) were indeed per-ceived as relevant for participants’ health behaviours, and whether additional environmental factors were perceived relevant by participants. participants of the focus groups were selected from the existing GLOBE study sample, as we had information on their educational level and neighbourhood socioeco-nomic characteristics. In this way, we were able to apply a purposive sampling approach, selecting participants from contrasting socioeconomic backgrounds, and to investigate whether perceptions of environmental factors differed between socioeconomic groups.
Two focus groups were conducted among individuals with high education residing in one of the eight most affluent neighbourhoods of Eindhoven, and two groups among individuals with low education residing in one of the eight
Kamphuis_09.indd 29 20-8-2008 10:34:27

30 Part I Introduction
most deprived neighbourhoods. potential participants were invited via letters and follow-up phone calls. Discussions were organised at the city municipality hall, as this was considered a central and neutral setting for potential partici-pants. Table 1 shows the number of participants included in the focus groups. Two interviews (one in a high and one in a low SEp group) focused mainly on smoking behaviour, with some questions at the end of the interviews address-ing fruit and vegetable intake and physical activity, while the other two pre-dominantly focused on fruit and vegetable intake and physical activity with some brief questions addressing smoking behaviour.
Table 2.1 Characteristics of focus group participants
High educated people residing in advantaged neighbourhoods
Low educated people residing in disadvantaged neighbourhoods
Group 1 Group 2 Group 3 Group 4
Participants (n) 12 12 6 8women 5 3 3 6men 7 9 3 2
Age, mean(age range)
57(39-81)
62(39-74)
64(58-75)
62(29-75)
A semi-structured questioning route was developed to ensure consistency in questions asked across groups [14, 15]. Questions were pre-tested for under-standing in a high and low SEp pilot group. Questions guiding the discussion included:�Do you engage in this health behaviour? How often? why or why not?�can you think of determinants in your living environment that may influ-
ence whether or not you engage in this behaviour?�How do those environmental determinants influence your behaviour?
The interviews were led by experienced moderators and group members con-sented to the discussion being taped. Data analysis was performed following the framework approach [16], and results have been described in detail else-where [17]. Briefly, it followed from the interviews that environmental factors most often perceived as important to participants’ health-behaviours, had all been included in the conceptual model. Some environmental factors were men-tioned both in higher and lower socioeconomic groups (such as the importance of social support); other factors (such as price concerns) differed in relevance between both groups [17].
2 Postal surveyResults from the focus group study and from a series of systematic reviews on environmental determinants of health related behaviours [18] were used for
Kamphuis_09.indd 30 20-8-2008 10:34:28

312 Theoretical framework and study design
the final selection of environmental factors to be included in the postal survey. The main aim of the postal survey was to make quantitative estimations of the contributions of environmental characteristics to socioeconomic inequali-ties in health-related behaviours. In addition, the survey allowed selection of respondents for the in-depth interviews, and the further selection of variables to be included in the in-depth interview and in the objective measurement of neighbourhood characteristics.
Postal survey: Study sampleThe total sample of persons invited to fill in the postal survey in October 2004 (N=10.271) comprised three sub-samples. The first sub-sample was recruited among the subjects who participated in baseline interviews of the GLOBE study in 1991 (n=5.667). These persons were by that time residing in the city of Eind-hoven or in selected surrounding villages, born in the Netherlands, and were between 15 and 74 years of age. In 2004, these GLOBE-participants did not necessarily live in Eindhoven or the surrounding villages anymore; they could have moved to places all over the Netherlands and abroad. with the exception of those who emigrated, participants’ addresses were traced through an annually updated administrative follow-up. Attrition due to death, emigration, refusal to be followed up longitudinally and addresses that could not be traced anymore, the sample invited consisted of 4.347 persons. The second sub-sample consisted of a random sample of subjects (n=2.190) who participated in the baseline postal survey of the GLOBE study in 1991 (n=18.973 minus those who were in the baseline interview sample (n=5.667) described above). To be eligible for invita-tion, these persons still had to live in the city of Eindhoven in 2004 and had to be between 25-75 years of age. This sample was included because it allowed for more robust longitudinal analyses among residents of the city of Eindhoven, for example for exploring changes in the environment in relation to changes in health-related behaviours. Because of attrition (due to illness, death, emigration, and loss to follow up) and in order to include persons that moved into the area since 1991, non-born Dutch persons (not approached in 1991) or persons who were too young in 1991, these two sub-samples of GLOBE-participants together would not be representative of the population of the region of Eindhoven in 2004, and therefore could not be used for cross-sectional analyses. Thus, a third sub-sample was invited to participate, including adults in the age range of 25 to 75 years, residing in Eindhoven or the selected surrounding villages and who were not previously approached in the GLOBE study (n=3,734).
The cross-sectional analyses aimed to answer the first research question. For this purpose, a cross-sectional sample was compiled, including a selection of persons from all three of the above-mentioned samples, i.e. adults between 25 and 75 years of age, residing in the city of Eindhoven or the surrounding vil-lages in October 2004.
Kamphuis_09.indd 31 20-8-2008 10:34:28

32 Part I Introduction
Postal survey: ResponseThe questionnaire was sent to 10.271 persons. Different cover letters were sent to those who had and those who had not participated in the GLOBE study before. As an incentive to respond, two bicycles were raffled among respondents. Some invited persons had died (n=106) and some questionnaires were returned because of incorrect addresses (n=84) or unknown reasons (n=183). These persons never had the opportunity to fill out the questionnaire, and therefore the number of persons who actually received a questionnaire (N=9,898) was used as the denominator when calculating the response. with 6,377 respond-ents returning the questionnaire, the overall response was 64.4%. Among those who participated before in the study, the response was 74.4%, while among those who were new in the study the response was 55.0%.
Among those who received the questionnaire, 48.2% were male and 51.8% were female. There appeared to be small selective non-response by sex (chi-square 23.294, p<0.01), with a slightly lower percentage of men (46.4%) returning the questionnaire compared to those invited (Table 2). Respondents were also more likely to be older. Using data from Statistics Netherlands on the mean monthly taxable income of residents and the average value of houses, it appeared that non-response was slightly higher in the lower quartiles of neigh-bourhood income and housing values.
Postal survey: MethodsThe study focused on three behaviours: 1) smoking, 2) physical activity and 3) fruit and vegetable intake. current smoking and smoking history were asked for using similar questions as asked in previous waves of the study [19, 20]. The Short QUestionnaire to ASsess Health-enhancing physical activity (SQUASH) is a reliable and reasonably valid Dutch questionnaire to assess the level of physical activity among adults [21], which was included in the survey to obtain information on leisure-time physical activity, sports, work-related transport and occupational physical activity. Fruit and vegetable intake were measured by a validated food frequency questionnaire with a reference period of one month [22]. Two indicators of SEp were sought: highest attained educational level and monthly net household income. Level of education is considered a good indicator of SEp in the Netherlands, and therefore often applied [23]. Our study appeared to be among the few epidemiological studies in the Nether-lands measuring income data in a postal survey. To avoid a high non-response we followed recommendations as described elsewhere [24], which included an introduction of the question by a short rationale for asking information on income, using broad response categories, and by including an answer category ‘I do not know my household income, or I don’t want to answer this ques-tion’. Table 3 presents the socio-demographic characteristics of the cross-sec-tional sample and some baseline characteristics of the health-related variables.
Kamphuis_09.indd 32 20-8-2008 10:34:28

332 Theoretical framework and study design
Table 2.2 Response and non-response by sociodemographic characteristics, GLoBE postal survey 2004
Invited*
n = 9.898Responsen = 6.395
non- responsen = 3.425
Age
25-34 15.1 11.9 20.935-44 17.7 15.6 21.445-54 14.1 14.1 14.055-64 19.1 21.8 14.165-74 18.5 21.8 12.475- 84 10.5 10.8 9.985 > 1.9 1.2 2.8missing 3.2 2.9 3.7Chi-Square (p-value)
413.406(p>0.01)
Sexb
males 48.2 46.4 51.5Females 51.8 53.6 48.5Chi-Square(p-value)
23.249(p<0.01)
neighbourhood income quartilesc
1 (low) 24.4 22.7 27.32 28.9 27.7 31.03 20.7 21.4 19.44 (high) 23.4 25.4 19.7missing 2.7 2.8 2.5Chi-Square(p-value)
63.625(p< 0.001)
Average house value quartilesd
1 (low) 24.3 21.7 29.02 23.5 23.5 23.43 23.2 24.0 21.84 (high) 23.9 26.1 19.8missing 5.2 4.8 5.9Chi-Square(p-value)
98.005(p< 0.001)
a Eligible to return the questionnaire, 1 person with missing value for sexb For one person, sex was missingc Income quartiles based on average taxable monthly income (cut off points 1500, 1900 and 2300 euro’s)
Kamphuis_09.indd 33 20-8-2008 10:34:28
34 Part I Introduction
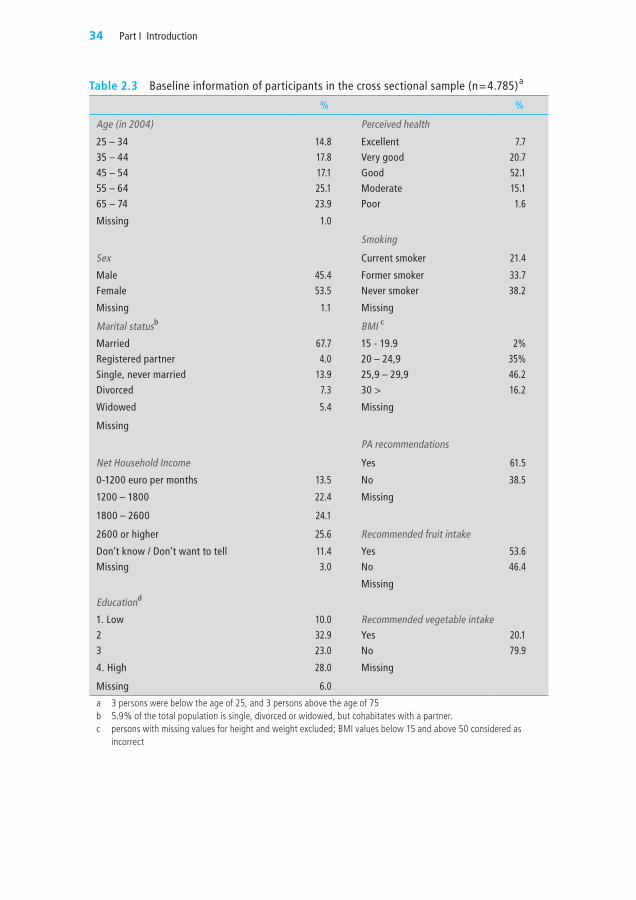
Table 2.3 Baseline information of participants in the cross sectional sample (n=4.785)a
% %
Age (in 2004) Perceived health
25 – 34 14.8 Excellent 7.7 35 – 44 17.8 Very good 20.745 – 54 17.1 Good 52.155 – 64 25.1 moderate 15.165 – 74 23.9 Poor 1.6
missing 1.0
Smoking
Sex Current smoker 21.4
male 45.4 Former smoker 33.7Female 53.5 never smoker 38.2
missing 1.1 missing
marital statusb BmI c
married 67.7 15 - 19.9 2%Registered partner 4.0 20 – 24,9 35%Single, never married 13.9 25,9 – 29,9 46.2Divorced 7.3 30 > 16.2
widowed 5.4 missing
missing
PA recommendations
net Household Income Yes 61.5
0-1200 euro per months 13.5 no 38.5
1200 – 1800 22.4 missing
1800 – 2600 24.1
2600 or higher 25.6 Recommended fruit intake
Don’t know / Don’t want to tell 11.4 Yes 53.6missing 3.0 no 46.4
missing
Educationd
1. Low 10.0 Recommended vegetable intake2 32.9 Yes 20.13 23.0 no 79.9
4. High 28.0 missing
missing 6.0
a 3 persons were below the age of 25, and 3 persons above the age of 75b 5.9% of the total population is single, divorced or widowed, but cohabitates with a partner.c persons with missing values for height and weight excluded; bmI values below 15 and above 50 considered as
incorrect
Kamphuis_09.indd 34 20-8-2008 10:34:28

352 Theoretical framework and study design
Neighbourhood characteristics that were measured included perceptions of a) social neighbourhood characteristics (such as incivilities, safety and length of residence), and b) physical characteristics (attractiveness and absence of facili-ties) and prices. Household environmental characteristics asked for included material (e.g. meeting ends financially) and social deprivation (e.g. having friends or family over for dinner). work-related environmental characteristics included physical working conditions and job control [25]. Individual-level characteristics included were predominantly measured for physical activity and included outcome expectancies, social norms, self-efficacy, barriers and the ‘intention to change’ in relation to physical activity. Environmental barriers were also assessed for fruit and vegetable consumption.
3 In-depth interviewswhile the data from the postal survey can be used to quantitatively estimate the contribution of broad groups of environmental determinants to socioeconomic inequalities in health-behaviours, they do not allow a more specific investigation of the pathways through which specific environmental characteristics are linked to individual level characteristics and ultimately to health-related behaviours. For that purpose, in-depth interviews were conducted in November 2005. The aims of the interviews were 1) to measure perceptions of environmental factors extensively and 2) to explore the pathways between environmental factors and health-related behaviours via individual-level characteristics.
In-depth interviews: Study populationparticipants for the in-depth interviews were recruited among the respon-dents of the postal survey 2004. we conducted interviews among 210 par-ticipants residing in seven socioeconomically disadvantaged neighbourhoods, and 217 participants living in seven advantaged neighbourhoods of the city of Eindhoven. Table 4 presents the recruitment of the participants. The overall response was 72,4% with a higher response among those in the more affluent areas (76,4%) compared to those in the more deprived areas (68,6%).
In-depth interviews: MethodsGenerally, the interview asked about environmental characteristics and indi-vidual-level characteristics in more details than that covered by the postal survey. As an extension of the postal survey, important neighbourhood physical environmental perceptions asked for in more detail included a) the aesthetics of the environment, b) safety, and c) the availability of neighbourhood facili-ties (specifically shops, schools public transport and sports facilities). perceived aesthetics of the environment were asked for by rating aesthetic elements of the environment (green, trash, maintenance). Indicators of safety included (fear of) crime, perceived safety in the evenings, and availability of streetlights). Further, the availability of a large variety of facilities within 10 minutes walking
Kamphuis_09.indd 35 20-8-2008 10:34:28

36 Part I Introduction
from home was asked about, including shops, schools, and specific sports facili-ties. more questions elicited information about working conditions (full time or part time, shift work, job demands and perceived rewards). At the house-hold level, more information on the financial situation was sought, including spending patterns and financial debts. Leisure-time activities were asked for to verify the existence of broader – that is not only restricted to health-related behaviours – cultural differences between socioeconomic groups. Individual-level characteristics (attitudes, social norms, self-efficacy and intentions to change behaviour) were asked in relation to fruit consumption and smoking. For the latter, questions were included to measure nicotine dependence. Infor-mation on knowledge of health-behaviour was obtained by asking participants to recall the current Dutch recommendations for physical activity and fruit consumption. moreover, questions were asked about the big five personality characteristics (extraversion, agreeableness, conscientiousness, neuroticism, and openness to experience), as they may moderate associations between envi-ronmental characteristics and health-related behaviours [26].
Table 2.4 Response to the in-depth interviews 2005Total Area deprivation
low high
Sample invited, participants to postal survey, residing in 14 neighbourhoods in Eindhoven
829 418 411
Total not in denominator 239 112 127
no phone number 119 52 67
Incorrect phone number 48 25 23
not reached 44 18 26
other (moved, died) 28 17 11
Total in denominator 590 306 284
Interview complete 410 204 206
Interview incomplete 17 6 11
Refused 163 96 67
Response Globe in-depth interview 2005
Interview (complete + incomplete)/ total 72,4% 68,6% 76,4%
Interview complete/ total 69,5% 66,7% 72,5%
4 Objective environmental characteristicsThe fourth step in the data collection was to assess objective environmental characteristics of the fourteen neighbourhoods of Eindhoven from which inter-view participants were recruited. To do so, we first developed an audit instru-ment, including items on environmental factors of potential importance for health-related behaviours, including the accessibility of sport facilities, prices,
Kamphuis_09.indd 36 20-8-2008 10:34:28
372 Theoretical framework and study design
accessibility and quality of fruit and vegetables, outlets for fast food and tobacco purchase, neighbourhood aesthetics (litter, graffiti, buildings, gardens, trees), safety (signs of neighbourhood surveillance, street lighting), traffic (speed limits, traffic control devices, crossing aids), and the presence and quality of walk/cycle paths and parks [27]. Each item asked for a rating of the specific neighbourhood characteristic. The audit instrument was pre-tested and refined during three pilot rounds. In these pilots, a selection of streets was rated by four observers and afterwards, answers given to the different items were discussed. Items with low interrater reliability were reformulated or removed from the instrument.
To obtain information on availability, quality and price of the fruits and veg-etables, we selected the five most commons types of fruit and vegetables. The distance to the three closest shops selling fruit and vegetables was measured from each neighbourhood centroid. In these shops, prices of predefined quanti-ties (1 kg) of and types of fruits and vegetables were recorded. A similar strat-egy was used to obtain information about the distance to and costs of the sports facilities closest to each neighbourhood centroid.
The final assessment of the items observed in the streets in the fourteen neigh-bourhoods of Eindhoven was conducted according to the following protocol. First, a list of all streets within each neighbourhood was created. As neighbour-hoods and streets differed in size, the total number of streets per neighbourhood varied from 17 to 76. An assessment of 10% of the streets per neighbourhood, with a minimum of 5 streets, was thought to accurately represent neighbour-hood characteristics. within neighbourhoods, streets were randomly selected. Thirty of the total of 75 streets were assessed twice by two different observers, auditing the segments independently, in order to be able to calculate the inter-rater reliability of the audit (based on percent agreement). The 105 observations were carried out by four trained observers in one week in February 2006.
Interrater reliability of each item of the instrument was calculated using the percentage agreement between two observers (consensus score), as described by Stemler [28]. percent agreement for each specific item was calculated by adding up the number of cases that received the same rating by both observers and dividing that number by the total number of cases rated by the two observ-ers. Table 5 describes the interrater reliability, which in general was moderate to good. Five items had low reliability (i.e. <0.7) and will not be used in analy-ses. The average reliability over the 55 remaining items was 84%.
Kamphuis_09.indd 37 20-8-2008 10:34:28

38 Part I Introduction
Table 2.5 objective neighbourhood characteristics of advantaged and deprived areas in the city of Eindhoven – interrater reliability, and mean score (standard error (SE)) by neighbourhood deprivation
Inter-raterreliabilitya
Advantagedareas (n=7)
Deprivedareas (n=7)
p-value
Sum score functional/design features 2.40 (.23) 2.17 (.13) 0.412Sidewalks present (0=no, 1=yes) 0.97 .90 (.07) 1.00 (.07) 0.192Quality of sidewalks (0=bad-moderate, 1=good) 0.70b .62 (.12) .38 (.05) 0.084Cycling track present (0=no, 1=yes) 0.93 .15 (.06) .08 (.04) 0.345Quality of cycling tracks (0=bad-moderate, 1=good) 0.93b 1.00 (.00) .33 (.33) 0.062Speed-limit zone (max. 30 km/h) (0=no, 1=yes) 0.77 .14 (.04) .22 (.08) 0.404Traffic control devices (0=no; 1=yes) 0.87 .47 (.13) .46 (.12) 0.970
Sum score social unsafety .87 (.11) 1.08 (.18) 0.337Houses for sale (0=no, 1=yes) 0.80b .23 (.07) .35 (.08) 0.846Empty houses (0=no, 1=yes) 0.70b .06 (.03) .30 (.10) 0.036Height of fences (0= below eye level; 1= above eye level) 0.73 .12 (.06) .16 (.06) 0.710Visibility of the street from surrounding houses(0= >½ of the street is visible, 1= <1/2 of the street is visible)
0.73b .26 (.08) .11 (.04) 0.128
Vandalism (0=none, 1=some, 2= many)c 0.97b .06 (.04) .06 (.04) 1.000Street lighting (0= on both sides, 1= on one side) 0.83 .19 (.04) .11 (.04) 0.184Youth hanging around in the streets (0=no, 1=yes)c 0.90 .03 (.03) .06 (.04) 0.552Signs of alcohol/drugs use (0=no; 1=yes) 0.83 .06 (.06) .18 (.05) 0.136
Sum score traffic unsafety .98 (.22) 1.16 (.31) 0.644Traffic (0=bestemmingsverkeer only, 1= through traffic) 0.80 .18 (.07) .36 (.13) 0.246Crossovers present (0=no, 1=yes) 0.93 .06 (.04) .11 (.04) 0.375Traffic signs painted on the road (0=no, 1=yes) 0.67b .21 (.07) .16 (.05) 0.571Traffic control devices (0=no, 1=yes) 0.87 .53 (.13) .54 (.13) 0.970
Sum score aesthetics 4.84 (.71) 2.96 (.37) 0.038Graffiti (0=yes, 1=no) 0.70b .66 (.32) .40 (.12) 0.073Vandalism (0=none, 1=some, 2= many)c 0.97b .06 (.04) .06 (.04) 1.000Litter on the streets (0=yes, quite some-a lot, 1=no, nothing much)
0.67b .69 (.38) .38 (.14) 0.066
maintenance of best buildings (0=bad-moderate, 1=excellent) 0.67b .90 (.19) .65 (.25) 0.061maintenance of worst buildings (0=bad-moderate, 1=excellent) 0.67b .69 (.29) .24 (.27) 0.011Gardens (0=not with all houses, 1=yes, with all houses) 0.87b .71 (.38) .42 (.28) 0.119maintenance of best-maintained gardens(0=bad-moderate, 1=excellent)
0.80b .65 (.35) .49 (.28) 0.343
Green diversity (0= <1 kind of green, 1= >2 kinds of green, e.g. trees, field, bushes)
0.83b .36 (.09) .51 (.06) 0.170
maintenance of public green areas (0=bad-moderate, 1=excel-lent)
0.80 .31 (0.11) .00 (.00) 0.016
Sum score destinations .41 (.12) .51 (.15) 0.590Destinations (0=none, 1= one or more) 0.77b .28 (.12) .37 (.15) 0.617Public transport (0=no; 1=yes) 0.73 .13 (.04) .14 (.06) 0.876
a Interrater reliability is represented by the percentage agreement between two observers (consensus score). Percent agreement for each specific item was calculated by adding up the number of cases that received the same rating by both judges and dividing that number by the total number of cases rated by the two judges (Stemler & Steven, 2004).
b Originally, there were more than two response categories for this audit item. These categories were dichotomised in order to calculate meaningful sum scores. However, inter-rater reliability scores were calculated for the original items, and therefore, are actually higher for the dichotomised items.
c tem was not included in the sum score as the prevalence was very low, e.g. in all neighbourhoods the prevalence of signs of vandalism was close to zero.
Kamphuis_09.indd 38 20-8-2008 10:34:29

392 Theoretical framework and study design
Discussion
we have developed a study protocol to investigate the contribution of environ-mental characteristics to socioeconomic variation in health-related behaviours. A major strength of this study is its stepwise approach, including complemen-tary research methodologies. when we started the study, research in the field of environmental determinants of health-behaviours was just emerging and a stepwise approach was considered necessary as a wide variety of environmental characteristics could be identified as potentially relevant, of which only a selec-tion could be included in the study. It remains to be explored to what extent we indeed identified relevant environmental factors.
There are a number of methodological issues related to this study. Firstly, the environmental characteristics as measured in the audit instrument were not measured in previous waves of the GLOBE study, and therefore the study cannot explore changes in health related behaviours following changes in objec-tive characteristics. On the other hand, data collected on health-behaviours in previous waves may help to establish as to whether they predict environmen-tal characteristics, such as whether physical activity results in social networks and social cohesion. Secondly, selection bias may influence our results. Anal-yses confirmed that residents in neighbourhoods with a lower mean income returned the postal survey slightly less often than those living in higher income neighbourhoods. As a result of SES-heterogeneity in neighbourhoods, mean neighbourhood income cannot automatically be interpreted as income at the individual level. consequently, it remains difficult to estimate to what extent differential response by neighbourhood income influences individual socioeco-nomic inequalities. In addition, it is possible that the lower educated who behave most unhealthy are less likely to respond than the lower and higher educated who behave more healthy. This may ultimately result in an underestimation of socioeconomic inequalities in health-related behaviours, and, if those with the poorest behaviours indeed live under the worst circumstances, in an underes-timation of the contribution of environmental characteristics to these inequali-ties. Thirdly, despite the careful selection of characteristics, we were not able to include items on all potentially interesting characteristics in our postal survey and interviews, due to space constraints. For example, only limited informa-tion on individual social-cognitive factors in relation to vegetable intake was ascertained in the interviews. In the interviews, cognitive factors were asked with regard to behaviours in general, e.g. physical activity cognitions referred to “being physically active for 30 minutes per day”, instead of measuring cogni-tions for walking, cycling, and sports participation specifically. with the grow-ing recognition of the need to analyse associations between environmental and individual characteristics and health-related behaviours as specific as possible, this should be considered a limitation of the data collection [29, 30].
Kamphuis_09.indd 39 20-8-2008 10:34:29
40 Part I Introduction
The cross-sectional sample will be used to explore the contribution of groups of environmental characteristics to socioeconomic inequalities in health-related behaviours. These data should be externally valid for the region of Eindhoven and surroundings and preferably for the Netherlands. About 50% of the study population in the postal survey is 55 and older, which needs to taken into account when interpreting the data, because this is more than in the Dutch population. Using a weighted procedure, which makes the sample representa-tive for our source population, prevalence data can be assessed. Using such a procedure, the prevalence of ‘current’ smoking for example is 23,1%, which is lower than the prevalence of 28% among Dutch adults; the prevalence of overweight and obesity on the other hand is 45% (BmI > 25) and 14.6% (BmI >30), respectively and these rates are reasonably in line with similarly obtained data in the Dutch population [31]. Thus, it seems that the external validity of results obtained in our study needs to be examined for outcomes specifically.
In general, socioeconomic inequalities in health and health-related behaviours are still poorly understood. An unequal distribution of traditional risk factors among socioeconomic groups appears to only partially explain these inequali-ties. Therefore, new lines of research have been proposed. Our study fits in one of these new lines, i.e. the one in which characteristics more distal from the individual-level are included in explanatory analyses. Another rapidly develop-ing line of research adopts the life-course approach. According to the life course approach, socioeconomic inequalities are the result of accumulated exposure to risk factors across the life-course. Repeated measurements of health-related behaviours allow us to perform such ‘life-course-analyses’. For that purpose, a longitudinal sample can be constructed, including for example those persons who participated in the study in 1991 and 2004.
In this paper, we concentrated on the design and data collection of the GLOBE study between 2004 and 2006. In order to answer the third research question concerning entry-points for interventions and policies to reduce socioeconomic variations in health-related behaviour, we will develop a summary report based on the answers of the first and second research question. This summary report will be discussed at a national invitational conference with scientific experts, policy-makers, public health practitioners, and representatives from the local community.
The collected data are currently being analysed, and this will provide impor-tant information on the role of environmental characteristics to socioeconomic inequalities in health-related behaviours. The majority of research on environ-mental determinants of health-related behaviours, and on the contributions of environmental determinants to socioeconomic inequalities in health-related behaviours, is conducted in the U.S. and in Australia. It remains unknown to
Kamphuis_09.indd 40 20-8-2008 10:34:29

412 Theoretical framework and study design
what extent results from these countries can be translated to other countries. Therefore, it is important to extent studies in this area to other countries. we hope this overview of our approach may facilitate the development of similar studies across the world.
Kamphuis_09.indd 41 20-8-2008 10:34:29

42 Part I Introduction
References
1 Herten L, Oudshoorn K, perenboom R, et al. Healthy life expectancy by socioeconomic status (Gezonde levensverwachting naar sociaal economische status). TNO 2002.
2 Schrijvers c, Stronks K, mheen Hv, et al. Explaining educational differences in mortal-ity: the role of behavioral and material factors. Am J Public Health 1999;89:535-40.
3 van Oort FV, van Lenthe FJ, mackenbach Jp. material, psychosocial, and behavioural factors in the explanation of educational inequalities in mortality in The Netherlands. J Epidemiol Community Health 2005;59:214-20.
4 Van Lenthe FJ, Gevers E, Joung Im, et al. material and behavioral factors in the expla-nation of educational differences in incidence of acute myocardial infarction: the Globe study. Ann Epidemiol 2002;12:535-42.
5 mackenbach Jp, mheen Hvd, Stronks K. A prospective cohort study investigating the explanation of socioeconomic inequalities in health in the Netherlands. Soc Sci Med 1994;38:299-308.
6 Van Lenthe FJ, Boreham cA, Twisk Jw, et al. Socioeconomic position and coronary heart disease risk factors in youth. Findings from the Young Hearts project in Northern Ireland. Eur J Public Health 2001;11:43-50.
7 Acheson D. Inequality in health: report of an independent inquiry. London: Stationary Office 1998.
8 van Lenthe FJ, Schrijvers cT, Droomers m, et al. Investigating explanations of socioeconomic inequalities in health: the Dutch GLOBE study. Eur J Public Health 2004;14:63-70.
9 Green L, Kreuter m. Health promotion planning: An educational and ecological approach. mayfield, cA: mountain View 1999.
10 Flay BR, petraitis J. The theory of triadic influence: a new theory of health behaviour with implications for preventive interventions. Adv Med Sociol 1994;4:19-44.
11 Swinburn B, Egger G, Raza F. Dissecting obesogenic environments: the development and application of a framework for identifying and prioritizing environemental interven-tions for obesity. Prev Med 1999;29:563-70.
12 Ajzen I. The theory of planned behaviour. Organisational Behaviur and Human Decision Processes 1991;50:179-211.
13 Giskes K, Van Lenthe FJ, Brug J, et al. Socioeconomic inequalities in food purchasing: The contribution of respondent-perceived and actual (objectively measured) price and availability of foods. Prev Med 2007.
14 morgan DL, Krueger RA. The focus group kit. Thousands Oaks: Sage publications 1998.
15 Vaughn S, Schumm JS, Sinagub J. Focus group interviews in education and psychology. Thousands Oaks: Sage publications 1996.
16 pope c, Ziebland S, mays N. Qualitative research in health care. Analysing qualitative data. BmJ 2000;320:114-6.
17 Kamphuis cBm, van Lenthe FJ, Giskes K, et al. perceived environmental determinants of physical activity and fruit and vegetable consumption among high and low socioeco-nomic groups in the Netherlands. Health Place 2007;13:493-503.
18 Brug J, Lenthe FJv. Environmental determinants and interventions for physical activity, nutrition and smoking: A review. Zoetermeer: Speed-print b.v. 2005.
19 Stronks K, van de mheen HD, Looman cw, et al. cultural, material, and psychosocial correlates of the socioeconomic gradient in smoking behavior among adults. Preventive Medicine 1997;26:754-66.
Kamphuis_09.indd 42 20-8-2008 10:34:29

432 Theoretical framework and study design
20 Droomers m, Schrijvers cT, mackenbach Jp. why do lower educated people con-tinue smoking? Explanations from the longitudinal GLOBE study. Health Psychol 2002;21:263-72.
21 wendel-Vos Gc, Schuit AJ, Saris wH, et al. Reproducibility and relative validity of the short questionnaire to assess health-enhancing physical activity. J Clin Epidemiol 2003;56:1163-9.
22 Van Assema p, Brug J, Ronda G, et al. A short dutch questionnaire to measure fruit and vegetable intake: relative validity among adults and adolescents. Nutr Health 2002;16:85-106.
23 Berkel-van Schaik ABv, Tax B. Naar een standaardoperationalisatie van sociaal-economische status voor epidemiologisch en sociaal-medisch onderzoek [Towards a standard operationalisa-tion of socioeconomic status for epidemiological and sociomedical research]. Rijswijk, the Neth-erlands: ministerie van wcc 1990.
24 Boynton pm, wood Gw, Greenhalgh T. Reaching beyond the white middle classes. Bmj 2004;328:1433-6.
25 Schrijvers cT, van de mheen HD, Stronks K, et al. Socioeconomic inequalities in health in the working population: the contribution of working conditions. Int J Epidemiol 1998;27:1011-8.
26 Kremers Sp, de Bruijn GJ, Visscher TL, et al. Environmental influences on energy bal-ance-related behaviors: A dual-process view. Int J Behav Nutr Phys Act 2006;3:9.
27 Lenthe FJv, Huisman m, Kamphuis cBm, et al. Een beoordelingsinstrument van fysieke en sociale buurtkenmerken die gezondheid stimuleren dan wel bevorderen. Rot-terdam: Department of public Health, Erasmus medical center Rotterdam 2006.
28 Stemler S. A comparison of consensus, consistency, and measurement approaches to estimating interrater reliability. Practical assessment, Research & Evaluation 2004;9: http://pAREonline.net/getvn.asp?v=9&n=4.
29 Giles-corti B, Timperio A, Bull F, et al. Understanding physical activity environ-mental correlates: increased specificity for ecological models. Exerc Sport Sci Rev 2005;33:175-81.
30 Lenthe FJv, Kremers S, Brug J. Exploring environmental determinants of physical activ-ity - the road to the future is always under construction. Public Health 2007:(in press).
31 Schokker DF, Visscher TL, Nooyens Ac, et al. prevalence of overweight and obesity in the Netherlands. Obes Rev 2007;8:101-8.
32 Ajzen I. “The Theory of planned Behaviour”. Organizational Behaviour and Human Decision Processes 1991;50:179-211.
Kamphuis_09.indd 43 20-8-2008 10:34:29

Kamphuis_09.indd 44 20-8-2008 10:34:29

Kamphuis CBm, Van Lenthe Fj, Giskes K, Brug j & mackenbach jP (2007). Perceived environmental determinants of physical activity and fruit and vegetable consumption among low and high socioeconomic groups in the netherlands. Health & Place 13(2), 493-503.
Perceived environmental determinants of physical activity and fruit and vegetable consumption among low and high socio-economic groups in the Netherlands
3
Kamphuis_09.indd 45 20-8-2008 10:34:29

46 Part I Introduction
Abstract
A focus group study was conducted to explore how perceptions of environ-mental influences on health behaviours pattern across socioeconomic groups in the Netherlands. participants perceived their spouse’s and friends’ health behaviour and support as highly important. people from lower socioeconomic backgrounds reported poor neighbourhood aesthetics, safety concerns and poor access to facilities as barriers for being physically active, while easy acces-sibility to sports facilities was mentioned by high socioeconomic participants. The availability of fruits and vegetables at home was perceived as good by all participants. Overall, lower socioeconomic groups expressed more price con-cerns. possible pathways between socioeconomic status, environmental fac-tors and health behaviours are represented in a framework, and they should be investigated further in longitudinal research.
Kamphuis_09.indd 46 20-8-2008 10:34:29
473 Focus group study
Introduction
poorer people experience worse health [1, 2] with higher rates of mortality and morbidity from cardiovascular diseases, obesity, type 2 diabetes and cancers [3-5]. Fruit and vegetable consumption and physical activity play a protective role in the onset of these chronic diseases [6-9]. Low socioeconomic groups consume less fruits and vegetables [10, 11] and do less physical activity [8, 12] than people from higher socioeconomic backgrounds, which is considered one of the explanations for socioeconomic inequalities in health. In view of the col-lective nature of health behaviours being less favourable for the disadvantaged, it is hypothesized in the literature that these socioeconomic variations may be due to common environmental exposures [13, 14].
Research that has examined the patterning of environmental influences of health behaviours across socioeconomic groups is scarce and mainly carried out in the U.K. and U.S. In some studies examining the lower rates of physical activity in disadvantaged areas, the importance of neighbourhood attractive-ness, the accessibility and proximity of neighbourhood facilities, and neighbour-hood safety has been demonstrated [15-19]. participation in social activities was a strong predictor of socioeconomic differences in low leisure-time physical activity, which may be mediated by a higher extent of encouragement or peer pressure to participate in physical activities experienced by persons with a high social participation [20]. In qualitative studies, lack of money, lack of access to transportation and inconvenient access to facilities are more often cited as bar-riers to physical activity among the less affluent [21, 22].
A range of possible mediating environmental factors between area deprivation and an unhealthy diet (again from studies performed in the U.S. and U.K.) includes a lower prevalence of supermarkets [15, 23], a higher prevalence of fast food restaurants [23] and a relatively higher premium on the price of healthy compared to less healthy food in deprived areas [24, 25]. Financial consider-ations were among the most frequently mentioned barriers for healthful eating among low-income women [26]. Social participation and social support may play a role in inequalities in fruit and vegetable consumption [27], as a lack of social participation might indicate a less extensive social network and less social support for adhering to a healthy diet. Also cultural influences, such as traditional beliefs about appropriate or healthy diets [28], may contribute to socioeconomic differences in fruit and vegetable consumption.
As previous research mostly investigated potentially relevant environmental factors based on the literature, we sought to investigate whether these factors are indeed perceived as potentially relevant across the socioeconomic spectrum, and whether additional environmental factors are perceived to play a role. This
Kamphuis_09.indd 47 20-8-2008 10:34:29

48 Part I Introduction
is one of the first studies in Europe (outside the U.K.) to investigate how people from high and low socioeconomic backgrounds perceive how their living envi-ronment shapes their physical activity and fruit and vegetable consumption.
Figure 3.1 A framework of environmental determinants contributing to the explanation of socioeconomic inequalities in health behaviours
Enviromental influences
National
International
Socioeconomicposition
EducationOccupationIncome
Accessibility and availability → affect behaviour through (perceived) barriers ofbehaviour change. Include financial,geographical and temporal accessibility offacilities, and availability of products.
Psychosocial conditions → affect behaviour through e.g. social support and perceived behavioural control. Important aspects include social relation-ships, demand-control unbalance, and psychosocial stress.
-
Cultural conditions → affect behaviourthrough e.g. attitudes and social norms.Include ethnic background, religion, childhood circumstances, culture specific lifestyle patterns, general value orienta-tions, and cultural participation
Materialconditions Include financialproblems, material and socialdeprivation, andunfavourableworking, housingand neighbourhoodconditions.
Healthbehaviour
PhysicalactivityDiet
I
PBC
A
S
Household Work Neighbourhood
notes: The grey panel incorporates four boxes of environmental determinants. The terms household, neighbourhood and work are examples of the different settings in which these determinants may influence health behaviours. The abbreviations in the right hand boxes represent the following constructs: A= attitude; S= social influences, like social support, subjective norms, and modelling; PBC= perceived behavioural control; I=intention. These constructs are
derived from the Theory of Planned Behaviour; see (Ajzen, 1991) for more information.
A framework for explaining socioeconomic inequalities in health-behaviourFor this paper, we developed a framework that specifies the pathways between socioeconomic status (SES), environmental factors, personal level factors (con-structs from the Theory of planned Behaviour; see [29]) and health behaviours (Figure 1). Other models have the disadvantage that they can only be applied to one particular health behaviour [30], focus on personal and environmen-tal factors related to health instead of health behaviour [31], or do not clearly visualise via which pathways socioeconomic status relates to health behaviour [13, 32]. In the development of our framework we reviewed the current state of knowledge on environmental determinants of health behaviours, and com-
Kamphuis_09.indd 48 20-8-2008 10:34:29

493 Focus group study
bined this with the literature on explanations of socioeconomic inequalities in health-related behaviours. The four categories that form the framework are:(a) Accessibility and availability. Including financial, geographical and tempo-
ral accessibility of products and facilities that are needed for (un)healthy behaviour, and interventions to support behaviour change.
(b) psychosocial conditions. Including social relationships, social support, and psychosocial stress.
(c) cultural conditions. culture-specific lifestyle patterns, childhood circum-stances, general value orientations, and cultural participation.
(d) material conditions. Including financial problems, material and social deprivation, and unfavourable working, housing and neighbourhood con-ditions. These may affect behaviour through one of the previous environ-mental factors. For instance, a person’s budgetary situation may partly determine one’s access to products and facilities, or in what neighbourhood one can afford to live.
In this study, we will address the following research questions:1) what environmental factors related to fruit and vegetable consumption and
physical activity are important for all socioeconomic groups?2) How do socioeconomic groups differ in their perception of important envi-
ronmental factors related to fruit and vegetable consumption and physical activity?
3) Does the framework capture all relevant environmental influences for fruit and vegetable consumption and physical activity, or are additional factors perceived as influential?
Methods
A focus group study was carried out to explore perceptions of environmen-tal influences on physical activity and fruit and vegetable consumption among socioeconomic groups. Four groups were held in spring 2004 among a total of 38 adult participants living in one city of the Netherlands (Eindhoven). This study has been subject to appropriate ethical review.
Participantsparticipants were selected from an existing cohort study, the GLOBE study, based on their neighbourhood’s deprivation level (as marker for neighbour-hood SES) and highest educational attainment (as marker for individual SES) Objectives and design of the GLOBE study are presented in detail elsewhere [33]. Neighbourhood deprivation was based on the Dutch general practitioner deprivation score. This index for social and economic deprivation has shown to be a reliable and valid measure for area deprivation in the Netherlands in several other studies [19, 34]. Educational attainment is only one component
Kamphuis_09.indd 49 20-8-2008 10:34:30

50 Part I Introduction
of the broad concept of SES, but is considered a good indicator for SES in the Netherlands [35]. GLOBE participants with a high educational attainment (i.e. either with a higher vocational training or an university degree) were ran-domly selected from the eight most advantaged neighbourhoods (these partici-pants will be referred to as ‘high SES’), while people with a low educational attainment (i.e. with no education, or with primary school or lower vocational training) were randomly selected from the eight most deprived neighbourhoods (these participants will be referred to as ‘low SES’). Via letters and follow-up phone calls, ten to twelve people per focus group were recruited. For the two high SES focus groups all twelve people attended. Response rates for the low SES groups were somewhat lower, with six and eight people showing up (still respectable numbers for focus group discussions). Demographic data of par-ticipants are shown in Table 1.
Table 3.1 Characteristics of focus group participants
High educated people residing in advantaged neighbourhoods
Low educated people residing in disadvantaged neighbourhoods
Group 1 Group 2 Group 3 Group 4
Participants (n) 12 12 6 8women 5 3 3 6men 7 9 3 2
Age, mean(age range)
57(39-81)
62(39-74)
64(58-75)
62(29-75)
ProceduresA semi-structured questioning route was developed to ensure consistency in questions asked across groups [36, 37]. Questions were pretested for under-standing in a high and low SES pilot group. The questioning route covered three subjects: determinants of people’s fruit and vegetable consumption, lei-sure time physical activity and smoking behaviour (results for the latter topic are not in the scope of this paper). Each topic was shortly introduced by the moderator and then discussed by the group, following this questioning route:�Do you engage in this health behaviour? How often? why or why not?�can you think of determinants in your living environment that might influ-
ence whether or not you engage in this behaviour?�How do those environmental determinants influence behaviour?Focus groups were led by an experienced moderator and group members con-sented to the discussion being taped. Group discussions lasted about 2 hours and incentives were given afterwards (i.e. a e15 gift voucher, and a €6,20 bus card as refund of travelling expenses).
Kamphuis_09.indd 50 20-8-2008 10:34:30

513 Focus group study
Data analyesThe audio taped discussions were transcribed verbatim by the first author (cK). As environmental determinants are likely to differ for fruit and vegetable consumption and physical activity, the content analysis procedure as described below was carried out for both behaviours separately.
Data analyses were performed following the framework approach [38], in which our framework served as base. A preliminary list of labels was com-posed, relating to the four categories of environmental determinants in our framework. Next, all relevant phrases in the transcripts (i.e. where a participant addressed an influence), were identified and examined by constant comparison [38]: for each relevant quote a judgement was made whether it fitted into one of the existing labels or required a new label. correspondingly, each quote was coded with one or more labels, to reflect as many of the nuances in the data as possible. The coding of the transcripts was done by cK and FvL indepen-dently. Differences in interpretations of the two researchers were minimal, and consensus between them was readily achieved. Data analysis software NVIVO (1.3) was used in the coding process.
After coding all four transcripts, the labels were reviewed. most labels referred to a specific individual or environmental factor. The importance of each factor was assessed for high and low SES participants separately. more emphasis was given to comments that were discussed in great length, with great intensity, with great specificity, by different participants within one focus group, and/or by participants over different focus groups [37, 39].
Results
whereas enjoyment, relaxation, habit, lack of time and health constraints were important individual-level factors for physical activity, taste, health, habit, weight maintenance, lack of time and disturbance of daily routines were indi-vidual factors often discussed with respect to fruit and vegetable consumption. Our findings of environmental-level factors, as presented in Tables 2 and 3, are described below, and illustrated with quotations. Quotations are followed by the participant’s SES level, sex, and age in years between brackets.
Kamphuis_09.indd 51 20-8-2008 10:34:30

52 Part I Introduction
Table 3.2 Factors related to physical activity (PA), as mentioned by focus group participants with either a high or low socioeconomic status (SES)
High SES Low SES
Individual level factors
good for physical condition, fitness ++ ++good for my health ++ ++weight maintenance ++ +enjoyment, relaxation ++ ++habit + ++lack of time -- 0health constraints - --
Environmental level factors
Accessibility and availability
accessibility of facilities ++ -neighbourhood safety - --neighbourhood aesthetics + --enjoyable nature in surroundings + +availability of home equipment + +
Cultural conditions
parental and own PA in childhood + +
Psychosocial conditions
social support from relevant others ++ ++meeting people during PA ++ ++observed behaviour of relevant others 0 +
material conditions
cost considerations - --
other influences
nice weather, summer + ++bad weather, winter - -
notes The plus and minus signs in the second and third column indicate that the factor either serves as promoter (+) or barrier (-) to being physically active, according to the predominant opinion of the focus group participants. moreover, the number of symbols gives some indication of how important the factor is in relation to PA, according to the focus group participants. Importance is based on whether or not the factor is discussed in great length, with great intensity, on different points in time during the focus group, by different participants within one focus group, and/or by participants over different focus groups. Range: 0 factor of no importance (not mentioned)
- or + factor of minor importance-- or ++ factor of importance
Perceived environmental factors related to PA
Similarities between socioeconomic groupsparticipants described the fact that their partner and friends are fairly active, and the support they receive from them to exercise as important influences for their own level of physical activity. moreover, they enjoyed the opportunities to meet and chat with people during participation in group activities.
Kamphuis_09.indd 52 20-8-2008 10:34:30
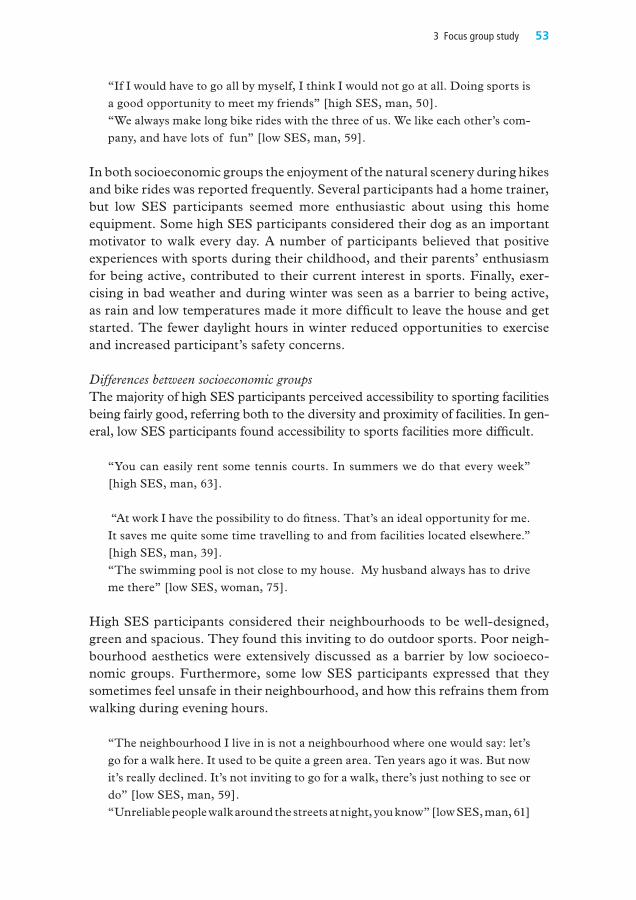
533 Focus group study
“If I would have to go all by myself, I think I would not go at all. Doing sports is a good opportunity to meet my friends” [high SES, man, 50].“we always make long bike rides with the three of us. we like each other’s com-pany, and have lots of fun” [low SES, man, 59].
In both socioeconomic groups the enjoyment of the natural scenery during hikes and bike rides was reported frequently. Several participants had a home trainer, but low SES participants seemed more enthusiastic about using this home equipment. Some high SES participants considered their dog as an important motivator to walk every day. A number of participants believed that positive experiences with sports during their childhood, and their parents’ enthusiasm for being active, contributed to their current interest in sports. Finally, exer-cising in bad weather and during winter was seen as a barrier to being active, as rain and low temperatures made it more difficult to leave the house and get started. The fewer daylight hours in winter reduced opportunities to exercise and increased participant’s safety concerns.
Differences between socioeconomic groupsThe majority of high SES participants perceived accessibility to sporting facilities being fairly good, referring both to the diversity and proximity of facilities. In gen-eral, low SES participants found accessibility to sports facilities more difficult.
“You can easily rent some tennis courts. In summers we do that every week” [high SES, man, 63].
“At work I have the possibility to do fitness. That’s an ideal opportunity for me. It saves me quite some time travelling to and from facilities located elsewhere.” [high SES, man, 39].“The swimming pool is not close to my house. my husband always has to drive me there” [low SES, woman, 75].
High SES participants considered their neighbourhoods to be well-designed, green and spacious. They found this inviting to do outdoor sports. poor neigh-bourhood aesthetics were extensively discussed as a barrier by low socioeco-nomic groups. Furthermore, some low SES participants expressed that they sometimes feel unsafe in their neighbourhood, and how this refrains them from walking during evening hours.
“The neighbourhood I live in is not a neighbourhood where one would say: let’s go for a walk here. It used to be quite a green area. Ten years ago it was. But now it’s really declined. It’s not inviting to go for a walk, there’s just nothing to see or do” [low SES, man, 59].“Unreliable people walk around the streets at night, you know” [low SES, man, 61]
Kamphuis_09.indd 53 20-8-2008 10:34:30

54 Part I Introduction
“Sometimes, in the evening, I do feel a bit unsafe, especially when I walk close by the park. It’s pretty dark there” (low SES, woman, 58]
High SES participants mentioned cost considerations as a plausible barrier for their less advantaged counterparts, but did not consider this a factor important for themselves. Low SES participants explained that rather high expenditures for equipment and sports club contributions are likely to be an important bar-rier to less fortunate people, like single-mothers and people living on social payments. They discussed this subject in greater detail and with more intensity than the high SES groups.
“I know people at my swimming club who cannot afford to swim every week. we just do that, and do not even think about the contribution we have to pay” [high SES, woman, 40].“I do think that the rather high charges of sports clubs refrain some people from doing sports. Find out for yourself what you have to pay when you want to join a fitness club. If you want that for both yourself and your husband… [concerned facial expression]” [low SES, woman, 60].
Perceived environmental factors related to fruit and vegetable consumption
Similarities between high and low socioeconomic groupsAll participants reported that adequate amounts of fruits and vegetables were readily available at home. men admitted that their wives took care of this. A few participants explained that their own vegetable garden was an extra motivator to eat large varieties of fruits and vegetables.
“my wife always makes sure there is enough fruit at home. She goes to the market every week to buy kilos of fruits and vegetables” [high SES, man, 44].
Social support, especially from one’s partner, was mentioned as an important influence by high as well as low SES participants. Some men emphasized the central role their wife’s play in what and how often they eat fruits and vegetables, by choosing, buying, preparing and serving the fruits and vegetables that are eaten within the household. Furthermore, having company from people eating fruits regularly, like a friend or household member, encouraged participants to eat fruit themselves. Having eaten fruits and vegetables regularly in childhood was reported as a habit that some participants carried into their adulthood. more-over, some participants indicated that media attention for fruits and vegetables has made them more aware of their health benefits. Educational campaigns, TV-series and talk shows on health-related topics make participants reflect on their own health behaviour, including their fruit and vegetable consumption.
Kamphuis_09.indd 54 20-8-2008 10:34:30

553 Focus group study
Table 3.3 Factors related to fruit and vegetable (FV) consumption, as mentioned by focus group participants with either a high or low socioeconomic status (SES)
High SES Low SES
Individual level factors
taste preferences ++ ++health considerations ++ ++habit ++ ++weight maintenance ++ 0pleasure of cooking and preparing FV 0 +lack of time -- --disturbance of daily routine (weekends, holidays) - --recommended amounts are too high - -
Environmental level factors
Accessibility and availability
accessibility of shops 0 --availability of FV in shops ++ +presentation of FV in shops + 0availability of FV at home ++ ++have my own garden + +availability of convenience foods - -
Cultural conditions
parental and own behaviour in childhood + +
Psychosocial conditions
social support from relevant others ++ ++observed behaviour of relevant others + +
material conditions
cost considerations - --
other influences
media attention for health and FV + +
notes The plus and minus signs in the second and third column indicate that the factor either serves as promoter (+) or barrier (-) to FV consumption, according to the predominant opinion of the focus group participants.moreover, the number of symbols gives some indication of how important the factor is in relation to FV, according to the focus group participants. Importance is based on whether or not the factor is discussed in great length, with great intensity, on different points in time during the focus group, by different participants within one focus group, and/or by different participants over different focus groups.
Range: 0 factor of no importance (not mentioned)
- or + factor of minor importance
-- or ++ factor of importance
The consumption of convenience foods influenced the vegetable consumption of high as well as low SES participants in a negative way. participants reported that the proximity to fast food outlets in their neighbourhood and the easy availability of convenience foods in shops, lead them to eat these foods more frequently, and with that, consume less vegetables than during a self-prepared meal.
Kamphuis_09.indd 55 20-8-2008 10:34:30

56 Part I Introduction
“Those microwave meals are easily available in every supermarket…” [low SES, women, 60]“.. Indeed, you just put them in the microwave and your meal is ready in a sec!” [low SES, woman, 67]“The pizzeria is close by, just around the corner. my children -always busy- get pizzas there every now and then” [high SES, man, 74].
Differences between high and low socioeconomic groupsHigh SES participants talked about the many different kinds of fruits and veg-etables that are available in the shops the whole year round. moreover, some high SES participants indicated that the attractive way fruits and vegetables are presented in shops tempts them to buy fruits and vegetables.
“You can get everything you want. we used to be dependent on the fruits and vegetables of the season, but now you can easily get everything, every day of the year, and of the most excellent quality” [high SES, man, 58].
poor accessibility to shops was raised several times by low SES participants. Some indicated that there were shops to buy fruits and vegetables in surround-ing neighbourhoods, but among participants of advancing age who were less mobile, accessibility to these shops was a problem. They described that in former times, a mobile grocery shop would go from door-to-door, but that this was no longer the case. Also, they explained that there are fewer green grocers in their neighbourhoods than some years ago.
“where did the shop around the corner go? It’s a pity, but those little shops all moved out of my neighbourhood. For me, that makes it harder to do my own shopping” [low SES, woman, 75].
Finally, relative high prices of fruits and vegetables were reported in both SES groups, though criticized more often and in more detail by low SES groups. These participants stated that price was often a deciding factor for whether or not to buy a certain product. If prices of fresh vegetables were judged as too high, they would rather choose canned or frozen products.
“I think that fruits and vegetables are pretty expensive. Even if you buy fruits and vegetables at the market, you still have to pay a lot of money, I can tell you that” [low SES, woman, 60].
Factors in the framework compared to factors discussed by participantsThe main environmental factors, as identified in the focus groups, were included in the framework. Of the four categories that are distinguished in the
Kamphuis_09.indd 56 20-8-2008 10:34:30

573 Focus group study
framework, accessibility- and availability-factors and psychosocial conditions were discussed most often, in greatest length and in the most detail. For physi-cal activity, determinants that were not included in the framework beforehand, were weather and seasonal influences. For fruit and vegetable consumption, additional environmental determinants were the easy availability of conve-nience foods (like take-away and microwave meals) and having a vegetable garden. Those factors were mentioned by high as well as low socioeconomic participants, though weather influences on physical activity were more salient to the low SES groups.
Discusssion
Focus group discussions with high and low SES participants revealed a rich variety of environmental factors they perceived as associated with their physical activity and fruit and vegetable consumption. participants from both socio-economic groups indicated that their physical activity and fruit and vegetable consumption benefited from social support to perform these behaviours. How-ever, low SES groups perceived more barriers for behaving healthy, specifically barriers related to accessibility, availability, neighbourhood characteristics, and cost considerations. All factors perceived as important have been included in our framework.
most of our findings are supported by conclusions that have been reached in previous research, which verifies the validity of our results [40]. Low SES par-ticipants had a more negative view of their neighbourhood’s aesthetics, attrac-tiveness, and safety [18, 41]. cost considerations are an established barrier for health behaviours [26, 42, 43] and were perceived as a more important influ-ence among low SES participants. we found that social influences for physical activity and fruit and vegetable consumption, like social support and social net-works, were of equal importance and equally positive for both socioeconomic groups. However, studies in Australia and Sweden found the disadvantaged groups more likely to indicate a lack of encouragement and companionship [22] and lack of social participation (which might indicate a less extensive social net-work and less social support) [20]. In a densely populated country such as the Netherlands, it may be less difficult to arrange company for exercising, also for people with less developed social networks.
poor accessibility to products and facilities were reported as barriers by people from low SES backgrounds, as has been found in studies from the U.S., U.K. and Australia [15, 17, 18, 22]. we expected that differences in accessibility and availability of products and facilities, just like for social support, would be less pronounced in a country as the Netherlands, which is geographically compact.
Kamphuis_09.indd 57 20-8-2008 10:34:30

58 Part I Introduction
Nevertheless, relative differences between socioeconomic groups still seem to be apparent in the Netherlands.
All environmental factors that were perceived as important by participants were already included in our framework. weather and seasonal influences were per-ceived to be of some importance but not incorporated in our framework before-hand, as research had shown no significant associations with physical activity [44]. Although weather cannot directly be influenced by policy or interven-tions, levels of physical activity can be promoted by providing indoor facilities in places where climatic extremes are experienced. Both factors will be included in the framework. Regarding fruit and vegetable consumption, we will include two factors that emerged from the focus groups as being important, i.e. avail-ability of convenience foods (like take-away and microwave meals; also found as influential on fruit and vegetable consumption by cox and colleagues [45]) and possessing one’s own vegetable garden (also reported by Eikenberry and colleagues [26]). Though not graded with SES, these factors may be important for the understanding of fruit and vegetable consumption patterns, and are susceptible to change.
Some categories of factors within our framework were hardly discussed. Argu-ments for influences not being raised, could be that they are so ingrained or distal from people’s behaviour, that individuals do not even think of them as influential (e.g. cultural and material conditions). material deprivation and financial problems were perceived as possible determinants for ‘less fortunate others’, but not for the participants themselves. Although these determinants may have been important to participants too, this may have been too sensitive to bring up in the group context [46]. Future longitudinal research needs to confirm whether or not these factors contribute to socioeconomic differences in physical activity and fruit and vegetable consumption.
Study strengths and limitationsAn important strength of this study was the comparison made between views of environmental influences among high and low socioeconomic groups, as this has received little attention in the literature to date [22]. An advantage above the study of Burton and colleagues (2003) was that participants of the focus groups where not only selected on individual level SES, but also on neighbour-hood SES. As physical and social characteristics often differ for affluent and deprived neighbourhoods, this sampling approach made it more likely that, as far as these environmental influences are salient to the participants’ health behaviours, differences between high and low SES groups would be detected.
Another strength of our study was the use of a conceptual framework. First, we incorporated determinants in the framework that emerged from an extensive
Kamphuis_09.indd 58 20-8-2008 10:34:30

593 Focus group study
review of the current body of literature (‘top down’). Then, the focus group study confirmed that most determinants were also perceived as influential by people from different socioeconomic groups, and yielded some additional determinants (‘bottom up’). This gives us firm grounds to believe that the framework incorporates all possibly important determinants for socioeconomic differences in health behaviours, which makes it a suitable framework to build upon in future research.
Furthermore, this study adds a new dimension to this existing body of research, since our study was carried out in a geographically and socially more com-pact context then most previous studies, which mainly have been carried out in the U.S. and U.K. methodological strengths include the semi-structured, pretested questioning route, and independent analyses of the first and second author to optimise the reliability of the outcomes [40].
A limitation of our study was the relatively small and selective sample recruited through a purposive sampling strategy. However, issues of representativeness were considered less important than our objective of obtaining views from people that were on the opposite ends of the socioeconomic spectrum. During the participant recruitment procedure our focus was on their educational level and neighbourhood deprivation score, with age and gender as selection criteria of minor importance. This resulted in some small differences in age and sex distributions between groups. However, apparent gender and age differences in perceptions were not found, which makes it unlikely that these small group differences affected the results.
Another issue is to what extent separate focus groups can be compared with each other. Sim (1998) argues that the fact that some members of a group may or may not voice a viewpoint, may be a reflection of the specific pattern of inter-action occurring at the time [47]. However, it is generally accepted that the importance of a certain theme can based on the frequency, specificity, exten-siveness and emotion with which a view is expressed [39]. As we have sensed the openness and integrity with which participants in different focus groups expressed their views, we believe that everyone could say and has said what he/she thought.
Conclusion
This focus group study provided a rich variety of environmental factors per-ceived by low and high SES groups in the Netherlands, to be associated with their health behaviours. participants from both socioeconomic groups indi-cated to benefit from social support, but the low SES groups perceived more barriers for behaving healthy, related to accessibility, availability, neighbour-
Kamphuis_09.indd 59 20-8-2008 10:34:30

60 Part I Introduction
hood characteristics, and cost considerations. The proposed framework pro-vides a good overview of important environmental influences associated with health behaviour of different socioeconomic groups. As qualitative research cannot tell to what extent the perceived factors truly inhibit or facilitate peo-ple’s behaviour, results should be verified in longitudinal studies to give more insight in the associations between SES, environment and health behaviours. Ultimately, when policy makers and health workers act upon these insights, it seems achievable to exert a positive influence on health behaviours -especially the behaviour of the socioeconomic disadvantaged- and, as ultimate goal, to contribute to a reduction in health inequalities.
Acknowledgements
The GLOBE study is carried out by the Department of public Health of the Erasmus University medical centre Rotterdam, in collaboration with the public Health Services of the city of Eindhoven and the region South-East Bra-bant. moderators from IVA Tilburg carried out the focus groups. we are grate-ful to peter van Nierop for his assistance in the practical organisation of the focus groups. we thank all focus group participants for sharing their thoughts with us so openly.
The GLOBE study is supported by grants from the ministry of public Health, welfare and Sports, and the Health Research and Development coun-cil (Zonmw). The third author is supported by an Australian National Health and medical Research council Sidney Sax Fellowship (ID 290540).
Kamphuis_09.indd 60 20-8-2008 10:34:31

613 Focus group study
References
1 Van Herten L. Gezonde levensverwachting naar sociaal-economische status. Leiden: TNO preventie en Gezondheid 2002.
2 mackenbach Jp, Bos V, Andersen O, et al. widening socioeconomic inequalities in mor-tality in six western European countries. Int J Epidemiol 2003;32:830-7.
3 Kaplan GA, Lynch Jw. whither studies on the socioeconomic foundations of popula-tion health? Am J Public Health 1997;87:1409-11.
4 choiniere R, Lafontaine p, Edwards Ac. Distribution of cardiovascular disease risk fac-tors by socioeconomic status among canadian adults. Cmaj 2000;162:S13-24.
5 Van Lenthe FJ, mackenbach Jp. Neighbourhood deprivation and overweight: the GLOBE study. Int J Obes Relat Metab Disord 2002;26:234-40.
6 Ness AR, powles Jw. Fruit and vegetables, and cardiovascular disease: a review. Int J Epidemiol 1997;26:1-13.
7 Van Duyn mA, pivonka E. Overview of the health benefits of fruit and vegeta-ble consumption for the dietetics professional: selected literature. J Am Diet Assoc 2000;100:1511-21.
8 USDHHS. Physical activity and health. A report of the Surgeon General. Atlanta, Ga: U.S. Department of health and human services, center for disease control and prevention, National center for chronic disease prevention and health promotion 1996.
9 wannamethee SG, Shaper AG, Alberti KG. physical activity, metabolic factors, and the incidence of coronary heart disease and type 2 diabetes. Arch Intern Med 2000;160:2108-16.
10 James wp, Nelson m, Ralph A, et al. Socioeconomic determinants of health. The con-tribution of nutrition to inequalities in health. Bmj 1997;314:1545-9.
11 Davey Smith G, Brunner E. Socioeconomic differentials in health: the role of nutrition. Proc Nutr Soc 1997;56:75-90.
12 Droomers m, Schrijvers cT, van de mheen H, et al. Educational differences in lei-sure-time physical inactivity: a descriptive and explanatory study. Soc Sci Med 1998;47:1665-76.
13 Booth SL, Sallis JF, Ritenbaugh c, et al. Environmental and societal factors affect food choice and physical activity: rationale, influences, and leverage points. Nutr Rev 2001;59:S21-39; discussion S57-65.
14 Lynch Jw, Kaplan GA, Salonen JT. why do poor people behave poorly? Variation in adult health behaviours and psychosocial characteristics by stages of the socioeconomic lifecourse. Soc Sci Med 1997;44:809-19.
15 Sooman A, macintyre S. Health and perceptions of the local environment in socially contrasting neighbourhoods in Glasgow. Health and Place 1995;1:15-26.
16 macintyre S, Ellaway A. Social and local variations in the use of urban neighbourhoods: a case study in Glasgow. Health Place 1998;4:91-4.
17 Estabrooks pA, Lee RE, Gyurcsik Nc. Resources for physical activity participation: does availability and accessibility differ by neighborhood socioeconomic status? Ann Behav Med 2003;25:100-4.
18 wilson DK, Kirtland KA, Ainsworth BE, et al. Socioeconomic status and perceptions of access and safety for physical activity. Ann Behav Med 2004;28:20-8.
19 Van Lenthe FJ, Brug J, mackenbach Jp. Neighbourhood inequalities in physical inactiv-ity: the role of neighbourhood attractiveness, proximity to local facilities and safety in the Netherlands. Soc Sci Med 2005;60:763-75.
Kamphuis_09.indd 61 20-8-2008 10:34:31

62 Part I Introduction
20 Lindstrom m, Hanson BS, Ostergren pO. Socioeconomic differences in leisure-time physical activity: the role of social participation and social capital in shaping health related behaviour. Soc Sci Med 2001;52:441-51.
21 chinn DJ, white m, Harland J, et al. Barriers to physical activity and socioeconomic posi-tion: implications for health promotion. J Epidemiol Community Health 1999;53:191-2.
22 Burton Nw, Turrell G, Oldenburg B. participation in recreational physical activity: why do socioeconomic groups differ? Health Educ Behav 2003;30:225-44.
23 morland K, wing S, Diez Roux A. The contextual effect of the local food environment on residents’ diets: the atherosclerosis risk in communities study. Am J Public Health 2002;92:1761-7.
24 Sooman A, macintyre S, Anderson A. Scotland’s health--a more difficult challenge for some? The price and availability of healthy foods in socially contrasting localities in the west of Scotland. Health Bull (Edinb) 1993;51:276-84.
25 mooney c. cost and availability of healthy food choices in a London health district. Journal of Human Nutrition Dietetics 1990;3:111-20.
26 Eikenberry N, Smith c. Healthful eating: perceptions, motivations, barriers, and pro-moters in low-income minnesota communities. J Am Diet Assoc 2004;104:1158-61.
27 Lindstrom m, Hanson BS, wirfalt E, et al. Socioeconomic differences in the consump-tion of vegetables, fruit and fruit juices. The influence of psychosocial factors. Eur J Public Health 2001;11:51-9.
28 Forsyth A, macintyre S, Anderson A. Diets for disease? Intraurban variation in reported food consumption in Glasgow. Appetite 1994;22:259-74.
29 Ajzen I. “The Theory of planned Behaviour”. Organizational Behaviour and Human Decision Processes 1991;50:179-211.
30 pikora T, Giles-corti B, Bull F, et al. Developing a framework for assessment of the environmental determinants of walking and cycling. Soc Sci Med 2003;56:1693-703.
31 Stokols D. Establishing and maintaining healthy environments. Toward a social ecology of health promotion. Am Psychol 1992;47:6-22.
32 cohen DA, Scribner RA, Farley TA. A structural model of health behavior: a pragmatic approach to explain and influence health behaviors at the population level. Prev Med 2000;30:146-54.
33 mackenbach Jp, van de mheen H, Stronks K. A prospective cohort study investigating the explanation of socioeconomic inequalities in health in The Netherlands. Soc Sci Med 1994;38:299-308.
34 Reijneveld SA, Verheij RA, de Bakker DH. The impact of area deprivation on differ-ences in health: does the choice of the geographical classification matter? J Epidemiol Community Health 2000;54:306-13.
35 Van Berkel-Van Schaik AB, Tax B. Towards a standard operationalisation of socioeconomic status for epidemiological and socio-medical research [in Dutch]. Rijswijk: ministerie van wVc 1990.
36 morgan DL, Krueger RA. The focus group kit. Thousands Oaks: Sage publications 1998.
37 Vaughn S, Schumm JS, Sinagub J. Focus group interviews in education and psychology. Thousands Oaks: Sage publications 1996.
38 pope c, Ziebland S, mays N. Qualitative research in health care. Analysing qualitative data. bmj 2000;320:114-6.
39 Krueger RA, casey mA. Focus groups. A practical guide for applied research. Thousand Oaks: Sage publications, Inc. 2000.
40 Kidd pS, parshall mB. Getting the focus and the group: enhancing analytical rigor in focus group research. Qual Health Res 2000;10:293-308.
Kamphuis_09.indd 62 20-8-2008 10:34:31

633 Focus group study
41 Giles-corti B, Donovan RJ. Socioeconomic status differences in recreational physical activity levels and real and perceived access to a supportive physical environment. Prev Med 2002;35:601-11.
42 Dibsdall LA, Lambert N, Bobbin RF, et al. Low-income consumers’ attitudes and behaviour towards access, availability and motivation to eat fruit and vegetables. Public Health Nutr 2003;6:159-68.
43 Glanz K, Basil m, maibach E, et al. why Americans eat what they do: taste, nutrition, cost, convenience, and weight control concerns as influences on food consumption. J Am Diet Assoc 1998;98:1118-26.
44 Humpel N, Owen N, Leslie E. Environmental factors associated with adults’ participa-tion in physical activity: a review. Am J Prev Med 2002;22:188-99.
45 cox DN, Anderson AS, Lean mE, et al. UK consumer attitudes, beliefs and barriers to increasing fruit and vegetable consumption. Public Health Nutr 1998;1:61-8.
46 Neumark-Sztainer D, Story m, perry c, et al. Factors influencing food choices of adolescents: findings from focus-group discussions with adolescents. J Am Diet Assoc 1999;99:929-37.
47 Sim J. collecting and analysing qualitative data: issues raised by the focus group. J Adv Nurs 1998;28:345-52.
Kamphuis_09.indd 63 20-8-2008 10:34:31

Kamphuis_09.indd 64 20-8-2008 10:34:31

Part 2Socioeconomic status, environmental factors and physical activity
Kamphuis_09.indd 65 20-8-2008 10:34:31

Kamphuis_09.indd 66 20-8-2008 10:34:31
Kamphuis CBm, Van Lenthe Fj, Giskes K, Huisman m, Brug j, mackenbach jP. Short report - The relative importance of neighbourhood factors for different levels of sports activity (under review with Br J Sports Med)
The relative importance of neighbourhood factors for different levels of sports activity
4
Kamphuis_09.indd 67 20-8-2008 10:34:31

68 Part II Socioeconomic status, environmental factors and physical activity
Abstract
Background It is suggested that increased specificity in outcomes is needed in studies of environmental determinants of physical activity. The objective of this study is to examine the relative importance of neighbourhood perceptions and individual cognitions for two specific cut-off points of sports activity.
Methods Self-reported data from the GLOBE postal survey in 2004 were used, comprising a stratified sample of 4785 adults, aged 25-75 years. multilevel logistic regression models examined physical (e.g. neighbourhood attractive-ness, safety) and social neighbourhood perceptions (e.g. social disorder, com-munity engagement), and individual cognitions with regard to doing regular physical activity (attitude, social influences, self-efficacy) in their associations with the probability of (a) doing any vs. no sports, and (b) meeting vs. not meeting recommendations for sports activity.
Results In the full model, physical and social neighbourhood factors as well as all individual cognitions showed independent associations with doing any sports. No neighbourhood factors were significantly associated with meet-ing recommended sports activity levels, but attitude and self-efficacy showed strong associations with this outcome.
Conclusions Neighbourhood factors were associated with doing any sports, but not with meeting recommended levels of sports activity. Interventions aimed at facilitating the take up of sports among those who do not engage in any sports activity may be most successful if based on neighbourhood factors as well as individual cognitions. However, in interventions aimed at increasing sports activity among those who are active already, it may be particularly important to focus on individual-level cognitions.
Kamphuis_09.indd 68 20-8-2008 10:34:31

694 neighbourhood factors and levels of sports activity
Introduction
Regular vigorous activity, like sports activity, promotes cardio respiratory fit-ness, and reduces the risk of mortality from coronary heart disease and cancer [1]. current guidelines recommend vigorous physical activity on ≥ 3 days per week for ≥ 20 minutes per occasion [2]. However, a large group of the popu-lation does not engage in any sports activities at all, and therefore, meeting recommended levels might be a bridge too far for many people. A first step for public health action therefore may be to facilitate the take up of sports, before increasing sports activity to recommended levels (as doing at least some compared to no sports is associated with health benefits as well, e.g. reduced mortality [3]). But what are the determinants for public health action to focus on regarding those two outcomes of sports activity?
Over the past decade, the field of physical activity research has shifted its focus on a completely new area: identifying and measuring attributes of the physical environment in relation to physical activity [4]. Although evidence is still emerging, neighbourhood factors, such as the availability of facilities and neighbourhood safety, have shown associations with a range of physical activity behaviours. Researchers have become increasingly aware of the importance of studying neighbourhood factors in associations with specific physical activity outcomes [4]. Similarly, neighbourhood factors may also differ for different levels of a specific activity, however, this topic has rarely been addressed yet [5, 6]. To our knowledge, no study has investigated the relative importance of neighbourhood factors for specific levels of sports activity.
we hypothesize that neighbourhood factors may be more important for the adoption of sports activity, than for increasing sports activity to recommended levels. persons participating already once or twice per week in sports activities may, for example, have a social network including company for doing sports, and may not consider distances to facilities or safety as barriers for sports par-ticipation. To increase the level of sports activity of this specific group to the recommended level, individual cognitions such as a positive attitude and high self-efficacy may be more important than environmental issues. However, for those not doing any sports, neighbourhood factors, such as a small social network or the absence of facilities in the neighbourhood may be important barriers to take up sports activity, independent of their individual cognitions. Accordingly, we hypothesize that neighbourhood perceptions will be more strongly associated with (a) doing any vs. no sports, than with (b) meeting vs. not meeting recommendations for sports activity.
Kamphuis_09.indd 69 20-8-2008 10:34:31

70 Part II Socioeconomic status, environmental factors and physical activity
Methods
SampleSelf-reported data were obtained by a large-scale postal survey (as part of the longitudinal GLOBE study) among a stratified sample of the adult population (age 25-75 years) in the Southeast of the Netherlands in October 2004 (N=4785; response rate 64.4%). participants eligible for the analyses (N=3839) resided in 177 neighbourhoods in the study area (participants with missing values on the outcome, confounding variables or neighbourhood indicator (n=639), and those who reported that poor health is often a barrier to be physically active (n=307) were excluded). Information about the objectives, design and results of the GLOBE study can be found elsewhere [7-9].
Sports activitySports activity was measured with the SQUASH questionnaire - a validated Dutch physical activity questionnaire which has shown reasonable reliability among Dutch adults [10]. participants wrote done up to four sports they did on a weekly basis during previous month (open question). For these sports, they reported frequency (times per week), average duration (minutes per day), and intensity (low, average, high). Self-reported intensity, in combination with participant’s age, and activity-specific mET-values, were used to calculate intensity scores. Two binary outcomes were constructed, i.e. (a) doing any vs. no sports with at least moderate intensity (moderate intensity= 4-6 mET for 18-55 yrs-old; 3-5 mET for 55+ yrs-old), and (b) meeting vs. not meeting recommendations for sports activity (i.e. >3 times/week, >20 minutes per occa-sion, with moderate-high intensity) [2].
Neighbourhood perceptionsperceived physical neighbourhood factors measured in the survey were: neighbourhood aesthetics, neighbourhood safety, and the availability of sport facilities. perceived social neighbourhood factors were: social disorder (factor derived from factor analyses with 11 items, cronbach’s α = .94); social cohe-sion, social network and feeling at home in one’s neighbourhood (factors were derived from a factor analysis including 13 items on social relationships (cron-bach’s α = .86). more about the construction of these variables can be found in chapter 5 (Table 5.2) [9].
Individual cognitionsThe Theory of planned Behaviour was used as framework to measure individual cognitions, i.e. attitude, social influences, self-efficacy, and intention to be reg-ularly physically active. Regular physical activity was defined in the question-naire as “being physically active for at least 30 minutes/day, e.g. doing sports, cycling, and gardening”. Items for all constructs were formulated according
Kamphuis_09.indd 70 20-8-2008 10:34:31

714 neighbourhood factors and levels of sports activity
to instructions given by conner & Norman [11]. Individual cognitions in the analyses were: attitude (positive, negative; dichotomized sum score of 12 items for outcome expectancies of regular physical activity (cronbach’s (α = .77)), social influences (positive, negative; dichotomized sum score of three items regarding subjective norm, social support, and modelling of significant others for regular physical activity (cronbach’s α = .85)); self-efficacy (unsure, not sure/unsure, sure), and intention (unsure, not sure/unsure, sure).
Demographic variablesparticipants reported their highest attained educational level (categorized in high, medium-high, medium-low, and low). Other possible confounding fac-tors that were measured were age (in ten-year categories), sex, and country of origin (Netherlands, other country).
Statistical analyseswe tested bivariate associations between outcomes and neighbourhood and individual factors (adjusting for educational level, age, sex, country of origin) in SpSS version 11.0 [12]. Factors associated with the outcome were included in a 3-step multilevel logistic regression modelling sequence in mlwiN version 2.02 (to take into account the hierarchical structure of the data) [13]. we included neighbourhood perceptions (model 1) and individual cognitions (model 2) separately, and then tested all factors simultaneously (model 3). Analyses were carried out in 2007.
Results
Half of the study sample (49.7%) indicated to do at least some sports, whereas 16.9% of the sample reported sports activity according to recommended levels. mean age of the sample was 47.7 years (range 25-75 years), 52.5% of the sample were women, and 90.3% were born in the Netherlands [9].
outcome (a): any sports activityperceived neighbourhood attractiveness, safety, social cohesion, social network and feeling at home in one’s neighbourhood were associated with doing any sports in bivariate associations (results not shown). As presented in Table 1, four neighbourhood factors remained significant when including all neighbour-hood factors in one model (model 1a). In the full model, two neighbourhood factors (safety and social cohesion) remained significantly associated with doing any sports in addition to all individual cognitions.
Kamphuis_09.indd 71 20-8-2008 10:34:31

72 Part II Socioeconomic status, environmental factors and physical activity
Tabl
e 4.
1 A
djus
ted
odds
ratio
s (o
R) a
nd 9
5% c
onfid
ence
inte
rval
s (9
5% C
I)a fo
r nei
ghbo
urho
od p
erce
ptio
ns a
nd in
divi
dual
cog
nitio
nsb
with
a)
any
spo
rts
activ
ity,
and
(b)
mee
ting
reco
mm
ende
d le
vels
of s
port
s ac
tivit
yo
utco
me
(a):
any
spor
ts a
ctiv
ityo
utco
me
(b):
mee
ting
reco
mm
ende
d le
vels
of s
port
s ac
tivity
Mod
el 1
a:ne
ighb
ourh
ood
perc
epti
ons
Mod
el 2
a: in
divi
dual
co
gnit
ions
Mod
el 3
a:ne
ighb
ourh
ood
+ in
divi
dual
Mod
el 1
b:ne
ighb
ourh
ood
perc
epti
ons
Mod
el 2
b:in
divi
dual
cogn
itio
ns
Mod
el 3
b: b
ase
nei
ghbo
urho
od+
indi
vidu
al
nei
ghbo
urho
od p
erce
ptio
nso
R (9
5% C
I)o
R (9
5% C
I)o
R (9
5% C
I)o
R (9
5% C
I)o
R (9
5% C
I)o
R (9
5% C
I)
my
neig
hbou
rhoo
d is
una
ttra
ctiv
e
agre
e1.
001.
00
disa
gree
1.27
(1.0
5-1.
54)
1.14
(0.9
3-1.
39)
my
neig
hbou
rhoo
d is
uns
afe
agre
e1.
001.
00
disa
gree
1.47
(1.0
0-2.
19)
1.44
(1.0
4-2.
00)
Ther
e ar
e in
suffi
cien
t pla
ces
to d
o ph
ysic
al a
ctiv
ity
agre
e1.
001.
00
disa
gree
1.16
(0.9
2-1.
46)
1.08
(0.8
1-1.
43)
nei
ghbo
urho
od s
ocia
l coh
esio
n
smal
l1.
001.
00
med
ium
1.45
(1.2
2-1.
72)
1.39
(1.17
-1.6
6)
larg
e1.
22 (1
.03-
1.44
)1.1
3 (0
.95-
1.34
)
nei
ghbo
urho
od s
ocia
l net
wor
k
smal
l1.
001.
00
med
ium
0.99
(0.8
4-1.1
7)0.
95 (0
.79-
1.13)
larg
e1.
20 (1
.01-
1.42
)1.
08 (0
.92-
1.29
)
Kamphuis_09.indd 72 20-8-2008 10:34:32

734 neighbourhood factors and levels of sports activity
Tabl
e 4.
1 (C
ontin
ued)
out
com
e (a
): an
y sp
orts
act
ivity
out
com
e (b
): m
eetin
g re
com
men
ded
leve
ls o
f spo
rts
activ
ity
Indi
vidu
al c
ogni
tions
Mod
el 1
a:ne
ighb
ourh
ood
perc
epti
ons
Mod
el 2
a: in
divi
dual
co
gnit
ions
Mod
el 3
a:ne
ighb
ourh
ood
+ in
divi
dual
Mod
el 1
b:ne
ighb
ourh
ood
perc
epti
ons
Mod
el 2
b:in
divi
dual
cogn
itio
ns
Mod
el 3
b: b
ase
nei
ghbo
urho
od+
indi
vidu
al
Attit
ude
nega
tive
1.00
1.00
1.00
1.00
posi
tive
1.79
(1.5
4-2.
08)
1.76
(1.5
1-2.
06)
3.22
(2.6
4-3.
91)
3.19
(2.6
1-3.
90)
Soci
al in
fluen
ces
nega
tive
1.00
1.00
posi
tive
1.23
(1.0
7-1.
43)
1.21
(1.0
4-1.
41)
Self-
effic
acy
for b
eing
regu
larly
act
ive
(ver
y) u
nsur
e1.
001.
001.
001.
00
not s
ure/
unsu
re1.
25 (0
.84-
1.87
)1.
26 (0
.91-
1.75
)5.
42 (1
.03-
28.6
2)1.
96 (0
.85-
4.49
)
(ver
y) s
ure
1.70
(1.15
-2.5
1)1.
71 (1
.24-
2.36
)16
.46
(3.2
3-83
.91)
6.00
(2.7
3-13
.20)
Inte
ntio
n to
be
regu
larly
act
ive
(ver
y) u
nsur
e1.
001.
00
not s
ure/
unsu
re1.
52 (1
.07-
2.14
)1.
47 (1
.03-
2.10
)
(ver
y) s
ure
2.70
(1.9
1-3.
83)
2.62
(1.8
5-3.
71)
Rand
om e
ffec
ts c
Leve
l-2 v
aria
nce
(SE)
0.04
9 (0
.035
)0.
064
(0.0
33)
0.06
6 (0
.031
)0.
005
(0.0
05)
0.03
3 (0
.028
)0.
029
(0.0
37)
mo
R (9
5% C
rI) c
1.
23 (1
.04-
1.39
)1.
27 (1
.10-1
.42)
1.28
(1.15
-1.4
3)1.
07 (1
.00-
1.14)
1.19
(1.0
3-1.
36)
1.18
(1.0
3-1.
42)
a Al
l mod
els
are
adju
sted
for a
ge, s
ex, e
duca
tion
and
coun
try
of o
rigin
.b
Onl
y ne
ighb
ourh
ood
perc
eptio
ns a
nd in
divi
dual
cog
nitio
ns w
ith s
igni
fican
t ass
ocia
tions
are
pre
sent
ed in
this
tabl
e.c
mul
tilev
el m
odel
s w
ere
estim
ated
with
the
mar
kov
Chai
n m
onte
Car
lo m
etho
d im
plem
ente
d in
mlw
iN v
ersio
n 2.
02 (C
rI =
cre
dibl
e in
terv
al; m
Or
= m
edia
n od
ds ra
tio; S
E =
sta
ndar
d er
ror).
Th
e m
Or
repr
esen
ts th
e le
vel-2
var
ianc
e, tr
ansla
ted
into
the
odds
ratio
sca
le. I
f the
mO
r is
equa
l to
1.00
, the
re a
re n
o di
ffere
nces
bet
wee
n ar
eas
in th
e pr
obab
ility
that
resid
ents
do
spor
ts
activ
ity. I
f the
mO
r >
>1.0
0, th
is in
dica
tes
that
the
area
of r
esid
ence
is re
leva
nt fo
r und
erst
andi
ng v
aria
tions
of t
he in
divi
dual
pro
babi
lity
of s
port
s ac
tivity
[16]
.
Kamphuis_09.indd 73 20-8-2008 10:34:32

74 Part II Socioeconomic status, environmental factors and physical activity
outcome (b): meeting recommended levels of sports activityAvailability of facilities and feeling at home in one’s neighbourhood were asso-ciated with meeting recommended levels of sports activity in bivariate associa-tions (results not shown), however, only the first remained borderline associated when taking both into account (model 1b). where social influences for physi-cal activity and intention to be regularly active fell short of significance in the model containing all individual factors (model 2b), attitude and self-efficacy showed high odds ratios. In the full model (model 3b), no neighbourhood fac-tors but only attitude and self-efficacy remained significant.
Discussion
In this paper, we showed that perceived physical and social neighbourhood factors were associated with doing any sports activity, in addition to individual cognitions. However, no neighbourhood factors were associated with meeting recommended levels of sports activity, though two individual cognitions, i.e. attitude and self-efficacy, showed strong associations.
Our findings are consistent with previous research, which showed that associa-tions of neighbourhood factors with physical activity differed for specific out-comes in terms of purpose of the activity (transport or recreation) [14, 15], and for different cut-off points regarding one specific activity [5, 6]. Study limita-tions to be kept in mind are the cross-sectional design, the fact that perceptions do not necessarily reflect objective neighbourhood characteristics, the relatively old-aged sample which explains the rather low prevalence of sports activity, and that individual cognitions and neighbourhood perceptions were not specifically asked in the context of sports activity.
An important implication of the study is that, in order to increase sports activity among the inactive, interventions may fall short if they focus on individual fac-tors only, disregarding a person’s social and physical environment. However, when aiming to increase sports activity among those active already, individual-level factors, such as attitudes and self-efficacy with regard to regular physical activity, may be particularly important to focus on. The relative importance of neighbourhood factors for different levels of specific physical activity behav-iours deserves attention in future research, to further increase our understand-ing of the mechanisms underlying differences in physical activity.
Acknowledgements
The GLOBE study is carried out by the Department of public Health of the Erasmus University medical centre in Rotterdam, in collaboration with the public Health Services of the city of Eindhoven and region Southeast Brabant.
Kamphuis_09.indd 74 20-8-2008 10:34:32

754 neighbourhood factors and levels of sports activity
The study is supported by grants of the ministry of public Health, welfare and Sport and the Health Research and Development council (ZON; number 40050009). KG is supported by an Australian National Health and medical Research council Sidney Sax Fellowship (ID 290540). The authors carried out the study and publication independently, without involvement of the funders.
Kamphuis_09.indd 75 20-8-2008 10:34:32

76 Part II Socioeconomic status, environmental factors and physical activity
References
1 Schnohr p, Lange p, Scharling H, et al. Long-term physical activity in leisure time and mortality from coronary heart disease, stroke, respiratory diseases, and cancer. The copenhagen city Heart Study. Eur J Cardiovasc Prev Rehabil 2006;13:173-9.
2 USDHHS. Healthy people 2010: understanding and improving health. washington Dc: U.S. Department of Health and Human Services. 2000.
3 Andersen LB, Schnohr p, Schroll m, et al. All-cause mortality associated with physi-cal activity during leisure time, work, sports, and cycling to work. Arch Intern Med 2000;160:1621-8.
4 Giles-corti B, Timperio A, Bull F, et al. Understanding physical activity environ-mental correlates: increased specificity for ecological models. Exerc Sport Sci Rev 2005;33:175-81.
5 Foster c, Hillsdon m, Thorogood m. Environmental perceptions and walking in Eng-lish adults. J Epidemiol Community Health 2004;58:924-8.
6 Sallis JF, Hovell mF, Hofstetter cR. predictors of adoption and maintenance of vigor-ous physical activity in men and women. Preventive Medicine 1992;21:237-51.
7 Van Lenthe FJ, Schrijvers cT, Droomers m, et al. Investigating explanations of socioeconomic inequalities in health: the Dutch GLOBE study. Eur J Public Health 2004;14:63-70.
8 mackenbach Jp, van de mheen H, Stronks K. A prospective cohort study investigating the explanation of socioeconomic inequalities in health in The Netherlands. Soc Sci Med 1994;38:299-308.
9 Kamphuis cBm, Van Lenthe FJ, Giskes K, et al. Socioeconomic status, environmental and individual factors, and sports participation. Med Sci Sports Exerc 2008;40:71-81
10 wendel-Vos Gc, Schuit AJ, Saris wH, et al. Reproducibility and relative validity of the short questionnaire to assess health-enhancing physical activity. J Clin Epidemiol 2003;56:1163-9.
11 conner m, Norman p, eds. Predicting health behaviour: research and practice with social cognition models. Buckingham: Open University press 1995.
12 Statistical package for Social Sciences version 11. chicago, IL: SpSS 1999.13 Rasbash J, Steele F, Browne w, et al. A user’s guide to mlwiN Version 2.0. Bristol: centre
for multilevel modelling, University of Bristol 2005.14 Ball K, Timperio A, Salmon J, et al. personal, social and environmental determinants
of educational inequalities in walking: a multilevel study. J Epidemiol Community Health 2007;61:108-14.
15 Hoehner cm, Brennan Ramirez LK, Elliott mB, et al. perceived and objective environmental measures and physical activity among urban adults. Am J Prev Med 2005;28:105-16.
16 merlo J, chaix B, Ohlsson H, et al. A brief conceptual tutorial of multilevel analysis in social epidemiology: using measures of clustering in multilevel logistic regression to investigate contextual phenomena. J Epidemiol Community Health 2006;60:290-7.
Kamphuis_09.indd 76 20-8-2008 10:34:32

Kamphuis CBm, Van Lenthe Fj, Giskes K, Huisman m, Brug j, mackenbach jP (2008) Socioeconomic status, environmental and individual factors, and sports participation. Med Sci Sports Exerc 40(1): 71-81
Socioeconomic status, environmental and individual factors, and sports participation
5
Kamphuis_09.indd 77 20-8-2008 10:34:32

78 Part II Socioeconomic status, environmental factors and physical activity
Abstract
Background The objective of this study is to examine the contribution of neigh-bourhood, household and individual factors to socioeconomic inequalities in sports participation in a multilevel design.
Methods Data were obtained by a large-scale postal survey among a stratified sample of the adult population (age 25-75 years) of Eindhoven (the fifth largest city of the Netherlands) and surrounding cities, residing in 213 neighbour-hoods (N=4785; response rate 64.4%). multilevel logistic regression analyses were done with sports participation as binary outcome (no, vs. yes), i.e. respon-dents not doing any moderate or high intensity sports at least once a week were classified as nonparticipants.
Results Unfavourable perceived neighbourhood factors (e.g. feeling unsafe, small social network), household factors (material and social deprivation), and individual physical activity cognitions (e.g. negative outcome expectancies, low self-efficacy) were significantly associated with doing no sports, and reported more frequently among lower socioeconomic groups. Taking these factors into account reduced the odds ratios of doing no sports of the lowest educational group by 57%, from 3.99 (95% cI, 2.99-5.31) to 2.29 (95% cI 1.70-3.07), and among the lowest income group by 67%, from 3.02 (95% cI, 2.36-3.86) to 1.66 (95% cI 1.22-2.27).
Conclusions A combination of neighbourhood, household, and individual fac-tors can explain socioeconomic inequalities in sports participation to a large extent. Interventions and policies should focus on all three groups of factors simultaneously, to yield a maximal reduction of socioeconomic inequalities in sports participation.
Kamphuis_09.indd 78 20-8-2008 10:34:32

795 Socioeconomic status and sports participation
Introduction
Regular physical activity can reduce the risk of several chronic diseases, such as coronary heart disease and type-2 diabetes [1], however, physical activity is among several health behaviours (e.g. smoking, diet) known to be less favour-able for people with a low socioeconomic status (SES), compared to their higher status counterparts [2-5]. In the literature, differences in physical and social environmental exposures have been hypothesized as the ultimate explanations for the differential distribution of physical activity and other health behaviours across socioeconomic groups [5-7]. presently, little is known about the contri-bution of possible environmental influences to socioeconomic inequalities in physical activity.
A considerable number of studies have shown relationships of physical and social environmental factors with physical activity [8-11], however, with little reference to their patterning across socioeconomic groups. Some studies have examined the lower rates of physical activity in disadvantaged areas, and have demonstrated the importance of neighbourhood attractiveness, the accessibil-ity and proximity of neighbourhood facilities, and neighbourhood safety [12-17]. Educational differences in leisure-time walking were explained by a range of personal, physical and social environmental factors, whereas few variables explained educational variations in walking for transport [18]. Social partici-pation (i.e. how actively a person takes part in group activities in society, e.g. courses, events, church) has shown to contribute to socioeconomic differences in leisure-time physical activity [19].
As environmental influences should be investigated for specific behaviours [11, 20], this paper focuses on one aspect of one’s overall physical activity, i.e. sports participation. participation in vigorous activities like sports is low among the socioeconomically disadvantaged [21], however, regular vigorous activity can have an important positive health effect. Life expectancy for sedentary people and moderately active people at age 50 years was found to be 3.8 years and 1.4 years shorter, respectively, compared to people with high physical activity levels [22]. more specifically, within the moderately and highly active persons, sports participants experienced only half the mortality of nonparticipants [21].
Studies that have investigated environmental factors in relation to socioeco-nomic inequalities in pA mainly focused on neighbourhood factors. However, an ecological approach requires the investigation of environmental factors from different settings, as well as individual factors [8, 23]. In recent multilevel stud-ies, the household has shown to have an important effect on health, indepen-dent of individual and neighbourhood-level effects [24, 25]. Therefore, in this paper, we examine the contribution of perceived neighbourhood, household,
Kamphuis_09.indd 79 20-8-2008 10:34:32

80 Part II Socioeconomic status, environmental factors and physical activity
and individual factors to socioeconomic inequalities in sports participation in a multilevel design (to be able to examine and account for possible clustering of sports participation within neighbourhoods) [26].
Methods
Study populationData were obtained by a large-scale postal survey, a component of the new wave of data collection for the longitudinal GLOBE study, among a stratified sample of the adult population (age 25-75 years) of Eindhoven (the fifth larg-est city in the Netherlands) and surrounding cities in October 2004 (N=4785; response rate 64.4%). participants resided in 213 neighbourhoods, which are the smallest geographical units in the Netherlands created for statistical and administrative purposes. more about the objectives, design and results of the GLOBE study can be found elsewhere [27, 28]. The use of personal data in the GLOBE study is in compliance with the Dutch personal Data protection Act and the municipal Database Act, and has been registered with the Dutch Data protection Authority (number 1248943).
participants with missing values for sports participation, education, income or one of the confounding variables, i.e. age, sex, country of origin or marital status, were excluded from the analyses (n=557). Also, we excluded participants who reported that poor health or pain was often a barrier for being physically active (n=307). Furthermore, we excluded participants with missing values for the level-2 indicator (neighbourhood) (n=48), and participants residing in neigh-bourhoods with only one or two participants (n=34). Therefore, the analytic sample comprised of 3839 participants, who resided in 177 neighbourhoods (mean number of participants per neighbourhood: n= 21, range 3-70).
MeasurementsAll factors were measured in the GLOBE postal survey 2004. Selection of items for the questionnaire was based on an extensive literature review [29-31], expert meetings, and focus groups conducted with residents living in the city of Eindhoven [32]. Items that measured neighbourhood, household, and individ-ual factors, as described in Table 2, were mostly derived from existing scales. For physical activity cognitions, we assessed key factors that recur in models commonly employed to predict health behaviours, i.e. Social cognitive Theory and the Theory of planned Behaviour [33]. missing values for neighbourhood, household, individual factors were imputed by drawing randomly from the dis-tribution of answering categories, using observed prevalences per educational group as probabilities. possible confounding factors were age (in ten-year cate-gories), sex, country of origin (Netherlands, other country), and marital status (married/registered partnership, not married).
Kamphuis_09.indd 80 20-8-2008 10:34:32

815 Socioeconomic status and sports participation
Socioeconomic statusEducational attainment is only one component of the broad concept of SES, but is considered a good indicator of SES in the Netherlands [34], and there-fore was our main SES-indicator. Four levels of education were distinguished ((1) no education or primary education; (2) lower professional and intermedi-ate general education; (3) intermediate professional and higher general educa-tion; (4) higher professional education and university). we also used household income as SES-indicator, asking participants to report their net monthly house-hold income (0-1200 euro, 1200-1800 euro, 1800-2600 euro, 2600 euro or more, and ‘don’t want to say / don’t know’).
Table 5.1 Characteristics of the GLoBE study – a stratified sample from the city of Eindhoven, netherlands (2004)- by educational levela
TotalEducational levela
1–low(N=337) b
2(N=1328)
3(N=965)
4–high(N=1215)
nb %c %c %c %c %c
Total sample 3839 100 6.9 31.1 28.3 33.7
Sports participation
Yes 1851 50.3 23.5 41.1 52.3 62.5no 1988 49.7 76.5 58.9 47.7 37.5
Sex
male 1836 47.5 43.5 37.0 47.7 57.8Female 2003 52.5 56.5 63.0 52.3 42.2
Age group
25-34 603 19.8 8.6 8.8 24.3 28.435-44 728 24.0 12.3 18.8 31.0 25.345-54 675 21.8 19.0 24.0 20.9 21.155-64 976 22.0 31.6 31.4 16.1 16.365-74 857 12.4 28.6 17.0 7.7 8.9
Country of birth
netherlands 3505 90.3 78.7 91.6 91.8 90.1other 334 9.7 21.3 8.5 8.2 9.9
monthly net household income
Less than 1200 euro 443 10.6 32.6 14.5 7.6 5.01200-1800 euro 872 20.7 33.3 30.4 20.0 9.71800-2600 euro 1008 26.1 10.7 25.9 34.7 22.1more than 2600 euro 1084 31.3 3.3 14.6 27.9 55.5Don’t want to say/don’t know 432 11.3 20.0 14.6 9.8 7.7
marital status
married 2853 73.9 76.6 78.4 74.6 68.7Unmarried/divorced/ widowed
986 26.1 23.4 21.6 25.4 31.1
a Educational level with 1= primary education, 2= lower secondary, 3= higher secondary, and 4= tertiary education.b The numbers (N) are unweighted, and reflect the actual numbers of participants in our dataset.
Kamphuis_09.indd 81 20-8-2008 10:34:33

82 Part II Socioeconomic status, environmental factors and physical activity
Sports participationSports participation was measured with the SQUASH questionnaire - a vali-dated Dutch questionnaire to measure various types of physical activity among an adult population: commuting, leisure time, sports, occupational, and house-keeping activities [35]. participants wrote done up to four sports they did on a weekly basis during previous month (open question). For these sports they reported frequency (times per week), average duration (minutes per day), and intensity (low, average, high). Self-reported intensity, in combination with participant’s age, and activity-specific mET-values, were used to calculate intensity scores. As almost half of the sample did not do any sport, sports par-ticipation was dichotomised, with ‘no’: not doing any sports weekly with at least moderate intensity (moderate intensity= 4-6 mET for 18-55 yrs-old; 3-5 mET for 55+ yrs-old) versus ‘yes’: doing sports at least once a week with moderate or high intensity.
Figure 5.1 Adjusted odds ratios (oRs) for no sports participation by education and household income, and median odds ratios (moRs) (indicating clustering of sports participation within neighbourhoods)
SES (individual level) MOR (area level)1- low 2 3 4 - high unadjusted adjusted
Odd
s ra
tios
no s
port
par
ticip
atio
n
0
1
2
3
4
5
6
odds ratio education (adjusted)
odds ratio income (adjusted)
note:models for education were adjusted for age, sex, and country of origin.models for income were adjusted for age, sex, country of origin, and marital status.
Statistical analyses‘No sports participation’ was modelled as a binary outcome variable in weighted multilevel logistic regression models of participants (level 1) nested within neighbourhoods (level 2). To take into account the hierarchical nature of the
Kamphuis_09.indd 82 20-8-2008 10:34:33
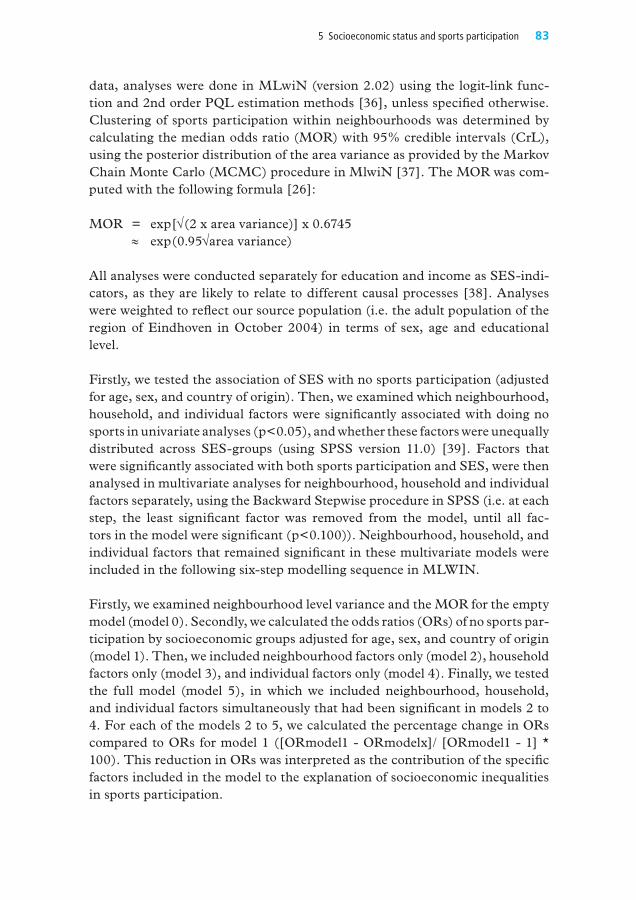
835 Socioeconomic status and sports participation
data, analyses were done in mLwiN (version 2.02) using the logit-link func-tion and 2nd order pQL estimation methods [36], unless specified otherwise. clustering of sports participation within neighbourhoods was determined by calculating the median odds ratio (mOR) with 95% credible intervals (crL), using the posterior distribution of the area variance as provided by the markov chain monte carlo (mcmc) procedure in mlwiN [37]. The mOR was com-puted with the following formula [26]:
mOR = exp[√(2 x area variance)] x 0.6745 ≈ exp(0.95√area variance)
All analyses were conducted separately for education and income as SES-indi-cators, as they are likely to relate to different causal processes [38]. Analyses were weighted to reflect our source population (i.e. the adult population of the region of Eindhoven in October 2004) in terms of sex, age and educational level.
Firstly, we tested the association of SES with no sports participation (adjusted for age, sex, and country of origin). Then, we examined which neighbourhood, household, and individual factors were significantly associated with doing no sports in univariate analyses (p<0.05), and whether these factors were unequally distributed across SES-groups (using SpSS version 11.0) [39]. Factors that were significantly associated with both sports participation and SES, were then analysed in multivariate analyses for neighbourhood, household and individual factors separately, using the Backward Stepwise procedure in SpSS (i.e. at each step, the least significant factor was removed from the model, until all fac-tors in the model were significant (p<0.100)). Neighbourhood, household, and individual factors that remained significant in these multivariate models were included in the following six-step modelling sequence in mLwIN.
Firstly, we examined neighbourhood level variance and the mOR for the empty model (model 0). Secondly, we calculated the odds ratios (ORs) of no sports par-ticipation by socioeconomic groups adjusted for age, sex, and country of origin (model 1). Then, we included neighbourhood factors only (model 2), household factors only (model 3), and individual factors only (model 4). Finally, we tested the full model (model 5), in which we included neighbourhood, household, and individual factors simultaneously that had been significant in models 2 to 4. For each of the models 2 to 5, we calculated the percentage change in ORs compared to ORs for model 1 ([ORmodel1 - ORmodelx]/ [ORmodel1 - 1] * 100). This reduction in ORs was interpreted as the contribution of the specific factors included in the model to the explanation of socioeconomic inequalities in sports participation.
Kamphuis_09.indd 83 20-8-2008 10:34:33

84 Part II Socioeconomic status, environmental factors and physical activity
Tabl
e 5.
2 n
eigh
bour
hood
, hou
seho
ld, a
nd in
divi
dual
fact
ors
as m
easu
red
in th
e G
LoBE
pos
tal s
urve
y 20
04Fa
ctor
s in
logi
stic
regr
essi
on m
odel
sm
easu
rem
ent o
f fac
tors
in G
LoBE
pos
tal s
urve
y 20
04A
nsw
erin
g ca
tego
ries
in th
e an
alys
esN
EIG
hBo
uRh
oo
D
nei
ghbo
urho
od p
hysi
cal f
acto
rs
nei
ghbo
urho
od s
afet
y “m
y ne
ighb
ourh
ood
is un
safe
”Ag
ree,
disa
gree
nei
ghbo
urho
od a
ttra
ctiv
enes
s “m
y ne
ighb
ourh
ood
is un
attr
activ
e”Ag
ree,
disa
gree
Avai
labi
lity
of fa
cilit
ies
“The
re a
re in
suff
icie
nt p
lace
s for
phy
sical
act
ivity
in m
y ne
ighb
ourh
ood”
Agre
e, d
isagr
eePo
or w
eath
er
“It i
s oft
en p
oor w
eath
er”
Agre
e, d
isagr
een
eigh
bour
hood
soc
ial f
acto
rs
Soci
al n
etw
ork
(the
ext
ent t
o w
hich
one
is
inte
rcon
nect
ed a
nd e
mbe
dded
in a
co
mm
unity
26)
The
first
fact
or c
onst
ruct
ed b
y a
fact
or a
naly
sis w
ith 1
3 ite
ms c
once
rnin
g as
pect
s of s
ocia
l re
latio
nshi
ps, w
hich
we
refe
rred
to a
s ‘so
cial
net
wor
k’. I
tem
s tha
t loa
ded
on th
is fa
ctor
w
ere
e.g.
“I b
orro
w s
tuff
from
my
neig
hbou
rs”,
“I v
isit m
y ne
ighb
ours
in th
eir h
ouse
”, a
nd
“I a
sk m
y ne
ighb
ours
for a
dvic
e” (f
ive-
poin
t sca
le: t
otal
ly a
gree
- to
tally
disa
gree
).
Larg
e, m
ediu
m, s
mal
l
Soci
al c
apita
l in
the
neig
hbou
rhoo
d (t
he
exte
nt o
f con
nect
edne
ss a
nd s
olid
arity
am
ong
grou
ps 26
)
Seco
nd fa
ctor
con
stru
cted
by
a fa
ctor
ana
lysis
with
13
item
s con
cern
ing
aspe
cts o
f soc
ial
rela
tions
hips
, whi
ch w
e re
ferr
ed to
as ‘
soci
al c
apita
l’. I
tem
s tha
t loa
ded
on th
is fa
ctor
w
ere
e.g.
“Pe
ople
in th
is ne
ighb
ourh
ood
agre
e on
nor
ms a
nd v
alue
s”, “
Peop
le in
this
neig
hbou
rhoo
d ar
e w
illin
g to
hel
p ea
ch o
ther
”, a
nd “
Peop
le in
this
neig
hbou
rhoo
d ca
n be
tr
uste
d” (f
ive-
poin
t sca
le: t
otal
ly a
gree
- to
tally
dis
agre
e).
High
, med
ium
, low
Feel
ing
at h
ome
in o
ne’s
neig
hbou
rhoo
dTh
ird fa
ctor
con
stru
cted
by
a fa
ctor
ana
lysis
with
13
item
s con
cern
ing
aspe
cts o
f soc
ial
rela
tions
hips
, whi
ch w
e re
ferr
ed to
as ‘
feel
ing
at h
ome
in o
ne’s
neig
hbou
rhoo
d’.
Item
s th
at lo
aded
on
this
fact
or w
ere
e.g.
“I f
eel a
lone
in th
is ne
ighb
ourh
ood”
, “(f
) I fe
el a
t ho
me
in th
is ne
ighb
ourh
ood”
, (g)
“I w
ant t
o m
ove
out o
f thi
s nei
ghbo
urho
od”
(five
-poi
nt
scal
e: to
tally
agr
ee -
tota
lly d
isagr
ee).
High
, med
ium
, low
Soci
al d
isor
gani
satio
n (t
he in
abili
ty o
f re
side
nts
of a
n ar
ea to
regu
late
eve
ryda
y pu
blic
beh
avio
urs
and
phys
ical
con
di-
tions
25)
one
fact
or c
onst
ruct
ed b
y a
fact
or a
naly
sis w
ith 1
1 ite
ms c
once
rnin
g th
e fre
quen
cy w
ith
whi
ch a
dver
se n
eigh
bour
hood
eve
nts o
ccur
red
(oft
en, s
omet
imes
, (al
mos
t) ne
ver)
. Ite
ms
refe
rred
to e
.g. l
itter
, gra
ffiti
, van
dalis
m, p
eopl
e be
ing
hass
led
on th
e st
reet
s, d
runk
en
peop
le in
the
stre
ets.
High
, med
ium
, low
Leng
th o
f res
iden
ce
“For
how
long
hav
e yo
u liv
ed in
this
neig
hbou
rhoo
d?”
0-2
; 2-5
; 5-
15 ;
15 >
yea
rs
Kamphuis_09.indd 84 20-8-2008 10:34:33

855 Socioeconomic status and sports participation
Tabl
e 5.
2 (C
ontin
ued)
Fact
ors
in lo
gist
ic re
gres
sion
mod
els
mea
sure
men
t of f
acto
rs in
GLo
BE p
osta
l sur
vey
2004
Ans
wer
ing
cate
gorie
s in
the
anal
yses
ho
uSE
ho
lD
Indi
cato
rs fo
r mat
eria
l dep
rivat
ion
Indi
cato
r 1: fi
nanc
ial p
robl
ems
“D
id y
ou h
ave
finan
cial
pro
blem
s las
t yea
r, e.
g. p
robl
ems p
ayin
g bi
lls, f
ood
or re
nt?”
no
ne, s
ome,
man
yIn
dica
tor 2
: car
pos
sess
ion
“Is t
here
a c
ar a
vaila
ble
in y
our h
ouse
hold
?”Ye
s, n
oIn
dica
tor 3
: cro
wdi
ngCr
owdi
ng w
as c
alcu
late
d fro
m 2
item
s, i.
e. “
with
how
man
y pe
ople
do
you
live
toge
ther
in
your
hou
seho
ld?
(incl
udin
g yo
urse
lf)”,
and
“Ho
w m
any
room
s has
the
hous
e yo
u liv
e in
?”
(exc
ludi
ng k
itche
n, c
orrid
or, c
ella
r, ba
thro
om, t
oile
t, ga
rage
, att
ic)
1< p
erso
n pe
r roo
m,
1 > p
erso
ns p
er ro
om,
Indi
cato
rs fo
r soc
ial d
epriv
atio
n
Indi
cato
r 1: f
riend
s/fa
mily
for d
inne
r m
onth
ly“D
o yo
u ha
ve fr
iend
s/fa
mily
ove
r for
din
ner a
t lea
st m
onth
ly?”
Yes;
no,
for f
inan
cial
reas
ons;
no,
for
othe
r rea
sons
; In
dica
tor 2
: goi
ng o
ut fo
rtni
ghtly
“Do
you
go fo
r a n
ight
out
with
frie
nds/
fam
ily a
t lea
st fo
rtni
ghtly
?”Ye
s; n
o, fo
r fin
anci
al re
ason
s; n
o, fo
r ot
her r
easo
ns;
Indi
cato
r 3: g
oing
on
holid
ay y
early
“Do
you
go o
n ho
liday
for a
t lea
st o
ne w
eek
per y
ear?
” Ye
s; n
o, fo
r fin
anci
al re
ason
s; n
o, fo
r ot
her r
easo
ns;
IND
IvID
uA
l
Posi
tive
outc
ome
expe
ctan
cies
of r
ecom
-m
ende
d PA
a m
easu
red
with
six
item
s on
a fiv
e-po
int s
cale
(ver
y im
port
ant –
ver
y un
impo
rtan
t)b :
“It m
akes
me
feel
less
str
esse
d”, “
I get
in a
goo
d m
ood”
, “I e
njoy
bei
ng a
ctiv
e”, “
I’m m
ore
conf
iden
t with
my
body
”, “
It is
good
for m
y fit
ness
”, a
nd “
I fee
l ene
rgize
d”.
(Ver
y) im
port
ant,
not i
mpo
rtan
t/ u
nim
-po
rtan
t, (v
ery)
uni
mpo
rtan
t,
neg
ativ
e ou
tcom
e ex
pect
anci
es o
f re
com
men
ded
PAm
easu
red
with
six
item
s on
a fiv
e-po
int s
cale
(ver
y im
port
ant –
ver
y un
impo
rtan
t)b :
“It r
equi
res t
oo m
uch
time”
, “It
requ
ires t
oo m
uch
disc
iplin
e”, “
It re
quire
s too
muc
h en
ergy
”, “
I’m a
fraid
of i
njur
ies”
, “I f
eel u
ncom
fort
able
whe
n ot
hers
see
me
exer
cisin
g”,
and
“Doi
ng s
port
s is e
xpen
sive”
.
(Ver
y) im
port
ant,
not i
mpo
rtan
t/ u
nim
-po
rtan
t, (v
ery)
uni
mpo
rtan
t,
Subj
ectiv
e no
rm“S
igni
fican
t oth
ers t
hink
that
I sh
ould
be
phys
ical
ly a
ctiv
e fo
r at l
east
30
min
utes
/day
”Ag
ree,
par
tly a
gree
/disa
gree
, disa
gree
, So
cial
sup
port
“Sig
nific
ant o
ther
s sup
port
me
to b
e ph
ysic
ally
act
ive
for a
t lea
st 3
0 m
inut
es/d
ay”
Agre
e, p
artly
agr
ee/d
isagr
ee, d
isagr
ee,
mod
ellin
g“S
igni
fican
t oth
ers a
re p
hysic
ally
act
ive
for a
t lea
st 3
0 m
inut
es/d
ay th
emse
lves
”Ag
ree,
par
tly a
gree
/disa
gree
, disa
gree
, Se
lf-ef
ficac
y“H
ow su
re a
re y
ou th
at y
ou c
an b
e ph
ysic
ally
act
ive
for a
t lea
st 3
0 m
inut
es/d
ay?”
(m
easu
red
on a
five
-poi
nt s
cale
(ver
y su
re –
ver
y un
sure
)b (V
ery)
sure
, not
sure
/uns
ure,
(ver
y)
unsu
re,
Inte
ntio
n“D
o yo
u pl
an to
be
phys
ical
ly a
ctiv
e fo
r at l
east
30
min
utes
/day
?”(m
easu
red
on a
five
-poi
nt s
cale
(sur
ely
yes –
sur
ely
no)b
(Sur
ely)
yes
, may
be, (
sure
ly) n
o,
a Al
l ite
ms
rega
rdin
g in
divi
dual
fact
ors
wer
e as
ked
in re
latio
n to
the
follo
win
g de
finiti
on o
f rec
omm
ende
d ph
ysic
al a
ctiv
ity (P
A):
“bei
ng p
hysic
ally
act
ive
with
at l
east
mod
erat
e in
tens
ity o
n at
le
ast 3
0 m
inut
es p
er d
ay”.
Kamphuis_09.indd 85 20-8-2008 10:34:34

86 Part II Socioeconomic status, environmental factors and physical activity
Results
Demographic characteristics of our sample are provided in Table 1. All char-acteristics were significantly associated with sports participation (not shown). compared to higher educational groups, people in the lowest educational group were more likely than higher educated to be female, to be of older age, to have a low household income, and to be born in a country other than the Netherlands (Table 1). marital status differed by income group (not shown), but not by edu-cational group. Therefore, marital status was taken into account as confounder in analyses with income as SES-indicator.
SES and sports participationAs presented in Figure 1, a gradient was found between SES and no sports par-ticipation, with the lowest educated (OR=3.99; 95% cI: 2.99-5.31) and lowest income group (OR=3.02; 95% cI: 2.36-2.86) most likely to report no sports participation. moreover, we found significant clustering of no sports participa-tion within neighbourhoods, as indicated by the mOR. possible explanatory factors that could mediate the association between SES and sports participa-tion are discussed below.
Associations of neighbourhood, household, and individual factors with SES and sports participation
compared to higher groups, participants from lower socioeconomic groups were more likely to report that their neighbourhood was unsafe, unattractive, and had insufficient places for physical activity (Table 3). Also, they were more likely to report that ‘it is often poor weather’, and to report a small social network and low social cohesion. All of these characteristics increased the likelihood of doing no sports. people indicating not feeling at home in their neighbourhood were also more likely to do no sports, but this was not significantly more preva-lent among any of the educational groups (p=.093). Social disorganisation and length of residence were not significantly associated with doing no sports.
Two out of three indicators of material deprivation (crowding, and having financial problems) and all three indicators of social deprivation increased the likelihood of doing no sports. Also, these factors showed higher prevalence among lower socioeconomic groups.
Furthermore, all individual cognitions of recommended physical activity were significantly related to sports participation, and unfavourable cognitions were more prevalent among lower socioeconomic groups. As an exception, the nega-tive outcome expectancy ‘physical activity requires too much time’ was more frequently reported by people from higher than lower socioeconomic groups. Of all factors examined, self-efficacy and intention showed the strongest associ-
Kamphuis_09.indd 86 20-8-2008 10:34:34

875 Socioeconomic status and sports participation
ations with sports participation. Factors that were either not significantly asso-ciated with sports participation nor/or with SES, were not included in further explanatory analyses.
Explanatory modelscompared to the basic model (including education, age, sex and country of origin), the increased ORs for doing no sports seen among lower educated groups decreased by 0-7% when neighbourhood factors were added (model 2, Table 4). Adjustment for household factors (model 3) lowered ORs by 17-28% compared to the basic model. Adding individual factors to the basic model showed the largest percentages reduction in ORs, i.e. 19-42% (model 4). In the full model, two neighbourhood factors (safety and social cohesion), three household factors (material deprivation (indicator 3) and social deprivation (indicator 2 and 3)), and nine individual factors (six outcome expectancies, social support, modelling, self-efficacy, and intention) remained statistically significant. All factors together reduced the ORs of doing no sports among the lowest educational group by 57%, for the second-lowest by 48%, and for the second-highest by 26%. As presented in Table 5, results of the explanatory analyses for income as SES-indicator were comparable to those for education, however, adjustment for neighbourhood factors, household factors and all fac-tors showed larger reductions in ORs.
compared to the empty model, the mOR reduced substantially in model 1 (taking compositional characteristics into account), and further reduced some-what after inclusion of neighbourhood factors (in models with income as SES indicator) or household factors (in models with education as SES indicator).
Discussion
we examined the contributions of neighbourhood, household and individual factors to the explanation of socioeconomic variation in sports participation using a multilevel design. Unfavourable neighbourhood (e.g. feeling unsafe, low social network), household (e.g. material and social deprivation), and indi-vidual factors (e.g. low self-efficacy, perceived negative outcome expectancies) were associated with doing no sports, and were reported among lower socio-economic groups more frequently. Together, these factors explained socioeco-nomic inequalities in sports participation to a large extent. Interventions and policies should focus on all three groups of factors simultaneously, to yield a maximal reduction of socioeconomic inequalities in sports participation.
Kamphuis_09.indd 87 20-8-2008 10:34:34

88 Part II Socioeconomic status, environmental factors and physical activity
Table 5.3 Adjusted odds ratios (oR)a for doing no sports, and prevalence rates of response categories of neighbourhood, household, and individual factors by educational level
Independent factors oRa for doing no sports
Educational level
95% CI pb 1 (low)
2 3 4 (high)
pb
NEIGhBouRhooD neighbourhood physical factors
neighbourhood is unsafe disagree 1.00 .005 92.9c 96.4 97.7 97.8 .000agree 1.77 (1.18-2.65) 7.1 3.6 2.3 2.2
neighbourhood is unattractive disagree 1.00 .000 72.4 83.9 88.4 87.2 .000agree 1.45 (1.20-1.75) 27.6 16.1 11.6 12.8
Insufficient places for physical activity disagree 1.00 .106 68.7 80.1 84.7 89.4 .000agree 1.16 (0.97-1.37) 31.1 19.9 15.3 10.6
often poor weather disagree 1.00 .051 72.8 82.0 84.0 82.1 .000agree 1.19 (1.00-1.41) 27.2 18.0 16.0 17.9
neighbourhood social factorsSocial network
large 1.00 .006 32.8 39.5 36.5 29.1 .000medium 1.27 (1.09-1.49) 35.8 31.4 34.2 33.3small 1.23 (1.05-1.45) 31.3 29.1 29.3 37.6
Social cohesion high 1.00 .000 30.9 36.1 36.1 36.9 .028medium 0.85 (0.72-0.99) 30.5 32.9 33.5 35.5low 1.17 (1.00-1.38) 38.7 31.0 30.4 27.6
Feeling at home in neighbourhood high 1.00 .018 30.1 37.0 36.6 35.3 .093medium 1.16 (0.99-1.35) 31.2 34.2 33.5 34.2low 1.26 (1.07-1.48) 38.7 28.9 29.9 30.5
Social disorganisation low 1.00 .552 43.9 52.1 51.2 54.5 .058medium 1.16 (0.89-1.50) 8.9 6.7 6.8 7.2high 1.02 (0.89-1.17) 47.2 41.2 42.1 38.3
Length of residence 0-2 years 1.08 (0.85-1.36) .681 12.5 8.7 14.5 19.0 .000 2-5 years 0.95 (0.77-1.17) 12.1 13.6 22.0 22.9 5-15 years 1.05 (0.88-1.24) 28.7 32.2 34.0 35.015> years 1.00 46.8 45.5 29.5 23.2
houSEholD Indicators of material deprivation1) Financial problems
no 1.00 .000 53.0 61.8 63.4 79.7 .000some 1.36 (1.17-1.59) 34.3 30.2 30.8 17.3many 2.13 (1.59-2.87) 12.7 8.0 5.8 3.0
Kamphuis_09.indd 88 20-8-2008 10:34:34

895 Socioeconomic status and sports participation
Independent factors oRa for doing no sports
Educational level
95% CI p 1 (low)
2 3 4 (high)
p
2) Car possession yes 1.00 .105 79.9 91.9 94.4 95.0 .000no 1.27 (0.96-1.62) 20.1 8.1 5.6 5.0
3) Crowding <1 per room 1.00 .001 78.4 82.0 80.1 85.8 .000>1 person per room 1.37 (1.14-1.64) 21.6 18.0 19.9 14.2
Indicators of social deprivation1) Friends/family for dinner monthly
yes 1.00 .052 43.7 50.7 55.2 67.7 .000no, for financial reasons 1.31 (1.02-1.69) 18.7 10.9 8.0 2.8no, for other reasons 1.13 (0.98-1.30) 37.7 38.4 36.8 29.5
2) Going out fortnightlyyes 1.00 .000 27.7 29.4 40.3 46.2 .000no, for financial reasons 1.57 (1.30-1.91) 35.4 22.8 19.0 9.3no, for other reasons 1.31 (1.13-1.51) 37.7 47.8 40.8 44.5
3) Going on holiday yearlyyes 1.00 .000 50.2 76.1 81.6 90.1 .000
no, for financial reasons 1.68 (1.35-2.10) 31.6 13.4 11.7 5.0no, for other reasons 1.33 (1.04-1.77) 18.2 10.5 6.7 4.9
INDIvIDuAl Positive outcome expectancies of PA
makes me feel less stressed important 1.00 .000 59.7 63.2 70.5 69.3 .000unimportant 2.13 (1.85-2.46) 40.3 36.8 29.5 30.7
Get in good mood important 1.00 .000 59.9 67.4 71.4 68.6 .003unimportant 2.17 (1.87-2.50) 40.1 32.6 28.6 31.4
Like being active important 1.00 .000 64.7 64.8 64.2 65.2 .966unimportant 2.61 (2.27-3.00) 35.3 35.2 35.8 34.8
more confident with body important 1.00 .000 61.9 67.9 68.3 67.4 .257unimportant 1.89 (1.64-2.18) 38.1 32.4 31.7 32.6
Good for fitness/condition important 1.00 .000 80.3 87.0 91.5 92.0 .000unimportant 2.45 (1.94-3.08) 19.7 13.0 8.5 8.0
Feel energized important 1.00 .000 71.6 80.4 85.1 84.4 .000unimportant 2.23 (1.86-2.67) 28.4 19.6 14.9 15.6
negative outcome expectancies of PARequires too much time
unimportant 1.00 .000 47.4 53.1 45.3 37.7 .000important 1.43 (1.25-1.64) 52.6 46.9 54.7 62.3
Table 5.3 (continued)
Kamphuis_09.indd 89 20-8-2008 10:34:35

90 Part II Socioeconomic status, environmental factors and physical activity
Table 5.3 (continued)
Independent factors oRa for doing no sports
Educational level
95% CI p 1 (low)
2 3 4 (high)
p
Requires too much discipline unimportant 1.00 .000 49.1 51.4 45.6 44.8 .005important 1.55 (1.36-1.77) 50.9 48.6 54.4 55.2
Requires too much energy unimportant 1.00 .000 47.7 58.5 65.3 74.1 .000important 1.85 (1.61-2.13) 52.3 41.5 34.7 25.9
Afraid to get injured unimportant 1.00 .000 55.0 67.2 75.1 81.9 .000important 1.31 (1.13-1.53) 45.0 32.8 24.9 18.1
Feel uncomfortable when exercising unimportant 1.00 .000 65.3 78.9 84.4 90.0 .000important 1.89 (1.57-2.26) 34.7 21.1 15.6 10.0
Doing sports is expensive unimportant 1.00 .000 48.5 68.2 76.7 82.4 .000important 1.81 (1.55-2.12) 51.5 31.8 23.3 17.6
Social influences Subj. norm: other think I should do PA
true 1.00 .000 54.1 57.5 58.6 65.0 .000not true/false 1.31 (1.12-1.53) 19.8 24.3 25.0 22.5false 1.48 (1.23-1.78) 26.1 18.2 16.4 12.5
Soc. support: others support me in PA true 1.00 .000 46.3 41.2 37.7 40.2 .000not true/false 1.40 (1.20-1.62) 25.7 34.4 36.7 39.2false 1.87 (1.59-2.22) 28.0 24.4 25.7 20.6
modelling: others do PA true 1.00 .000 51.3 48.6 44.4 46.9 .175not true/false 1.32 (1.15-1.52) 37.9 39.2 44.6 41.6false 1.30 (1.05-1.61) 10.8 12.2 11.0 11.5
Self-efficacyHow sure to get sufficient PA?
(very) sure 1.00 .000 57.5 70.6 73.6 79.0 .000not sure/unsure 2.25 (1.91-2.66) 33.2 24.9 20.8 15.2(very) unsure 2.81 (2.08-3.81) 9.3 4.5 5.6 5.8
Intention: Plan to get sufficient PA? yes 1.00 .000 46.3 60.4 65.9 75.3 .000maybe 2.73 (2.35-3.57) 44.0 34.6 30.7 21.4no 3.39 (2.36-4.87) 9.7 5.0 3.4 3.3
a models were adjusted for age, sex, educational level, and country of origin. n.s. = not significant; *= p<0.050; **= p<0.010; ***= p<0.001.b This is the percentage of respondents that agreed on the statement per socioeconomic group; for example, 92.9% of
those in the lowest group disagreed with the statement “my neighbourhood is unsafe”.
Kamphuis_09.indd 90 20-8-2008 10:34:35

915 Socioeconomic status and sports participation
The main strength of our study is that we incorporated neighbourhood, house-hold as well as individual factors in our analyses to explain socioeconomic vari-ations in sports participation, using a multilevel design to correct for possible area variance. Although not the focus of this paper, we also showed that the individual probability to do no sports was statistically dependent on the neigh-bourhood of residence (indicated by the mOR>>1), which could be mainly explained by compositional differences between neighbourhoods (in terms of age, education, sex) and slightly by differences in neighbourhood perceptions and household factors.
Another strength is our well-considered selection of factors, which was pre-ceded by an extensive literature review [29-31], expert meetings, and focus groups [32]. moreover, we could quantify the contributions of groups of fac-tors, by interpreting the reduction in ORs after introduction of explanatory fac-tors to the basic model as the mediating role of these factors to socioeconomic inequalities in sports participation.
Our study was cross-sectional, and therefore could not disentangle causal path-ways between SES, explanatory factors, and sports participation. Although we made a well-considered selection of explanatory factors, results are likely to depend on the specific factors used in this study. The classification of factors in the three domains (neighbourhood, household, and individual) has been done through informed discussion among the research team and in close consulta-tion with the literature. However, we acknowledge that this classification is debatable, as different researchers may classify items differently.
Items to measure individual-level cognitions were not behaviour-specific for sports participation, but referred to recommended physical activity (“being physically active with moderate intensity for at least 30 minutes per day”). we suspect that associations of individual factors with the outcome measure sports participation would have been even stronger if those variables would have been behaviour-specific for the outcome [20].
For many of the neighbourhood and household factors, participants with miss-ing values had increased ORs to do no sports, and the prevalence of missing values was highest among participants from the lowest SES group. when we took missing values into account by treating them as separate answering cat-egories, the contribution of certain factors to the explanation of socioeconomic inequalities in sports participation was overestimated, as it was actually the high OR for the missing value category (and its higher prevalence in low SES groups) that was driving the explanatory power. Therefore, missing values for explanatory factors were imputed by drawing randomly from the distribution of answering categories, using observed prevalences per educational group as probabilities.
Kamphuis_09.indd 91 20-8-2008 10:34:35

92 Part II Socioeconomic status, environmental factors and physical activity
we could not include objectively measured neighbourhood characteristics in our analyses. Therefore, it remains uncertain to what extent differences in per-ceived neighbourhood safety and attractiveness reflect objective differences in neighbourhood characteristics. On the one hand, as the lowest socioeco-nomic group more frequently reported bad weather (although weather differ-ences between neighbourhoods are very unlikely) this might suggest that lower socioeconomic groups have an overall negative perception of life, including the perception of their living environment. On the other hand, we found that neighbourhood factors could explain some of the neighbourhood variance in sports participation. Also, in additional multilevel analyses we found significant clustering of perceived safety, attractiveness and availability of facilities within neighbourhoods (results available on request). Both findings may indicate the existence of true neighbourhood differences.
Our findings are in line with two studies from Australia, which concluded that personal, social, and physical environmental factors could explain educational inequalities in leisure-time walking [18], and variations in recommended levels of exercising [40]. Also similar to our study, these two studies found that distal (environmental) factors could explain less of the (socioeconomic) variations in physical activity than more proximal (household and individual) factors. This does not mean that neighbourhood factors require less attention in policy and intervention development. From a population perspective, even small odds ratios for neighbourhood characteristics may imply that changes to (percep-tions of) the neighbourhood context may have a significant effect on physical activity levels. Especially since we found that most perceptions of unfavour-able neighbourhood factors were more prevalent among lower socioeconomic groups, these may offer important opportunities to reduce socioeconomic inequalities in physical activity.
All analyses were done for two different SES-indicators separately, as education and income may be related to sports participation through different processes [38]. In our study, education showed a larger gradient with sports participa-tion than income, but on the other hand, neighbourhood and household fac-tors could explain more of the income than educational inequalities in sports participation. Future research should further disentangle which aetiological mechanisms can explain educational and income inequalities in sports partici-pation.
Kamphuis_09.indd 92 20-8-2008 10:34:35

935 Socioeconomic status and sports participation
Tabl
e 5.
4 Ef
fect
of a
djus
tmen
t for
nei
ghbo
urho
od, h
ouse
hold
, and
indi
vidu
al le
vel f
acto
rs o
n cl
uste
ring
of s
port
s pa
rtic
ipat
ion
in n
eigh
bour
hood
s (r
ando
m e
ffec
ts),
and
on
the
asso
ciat
ion
betw
een
educ
atio
nal l
evel
and
no
spor
ts p
artic
ipat
iona
(fix
ed e
ffec
t)b
Fact
ors
incl
uded
in th
e m
odel
(sig
nific
ant)
Are
a (r
ando
m e
ffec
ts)
Educ
atio
nal l
evel
c (fi
xed
effe
ct)
1-
low
23
4- h
igh
Are
a le
vel
varia
nce
(S
E)
mo
R(9
5% C
rI)
(n=
347)
(n=
1346
)(n
=98
4)(n
=12
44)
mod
el 0
(em
pty)
--0.
157
(0.0
47)
1.46
(1.3
0-1.
63)
mod
el 1
: BA
SIC
educ
atio
n +
age
+ se
x +
coun
try
of o
rigin
0.06
7 (0
.032
)1.
28 (1
.15-1
.43)
3.99
(2.9
9-5.
31)
2.19
(1.8
6-2.
59)
1.65
(1.3
9-1.
96)
1.00
mod
el 2
: BA
SIC
+ n
EIG
HBo
URH
oo
Dne
ighb
ourh
ood
attr
activ
enes
s + n
eigh
bour
-ho
od s
afet
y +
soci
al n
etw
ork
+ s
ocia
l coh
esio
n0.
060
(0.0
31)
1.26
(1.10
-1.4
0)3.
777%
d(2
.83-
5.02
)2.
181%
(1.8
4-2.
59)
1.71
0%(1
.45-
2.02
)1.
00
mod
el 3
: BA
SIC
+ H
oU
SEH
oLD
mat
eria
l dep
rivat
ion
(ind.
1+3
) +
soci
al
depr
ivat
ion
(ind.
2+3
) 0.
049
(0.0
24)
1.23
(1.12
-1.3
6)3.
1628
%(2
.34-
4.26
)1.
8925
%(1
.58-
2.26
)1.
5417
%(1
.29-
1.84
)1.
00
mod
el 4
: BA
SIC
+ In
DIV
IDU
AL
PA m
akes
me
feel
less
str
esse
d +
I get
in a
go
od m
ood
+ PA
is g
ood
for m
y fit
ness
+ P
A co
sts t
oo m
uch
ener
gy +
I fe
el u
ncom
fort
able
du
ring
PA +
PA
is to
o ex
pens
ive
+ so
cial
sup-
port
+ m
odel
ling
+ se
lf-ef
ficac
y +
inte
ntio
n
0.05
2 (0
.036
)1.
24 (1
.05-
1.40
)2.
6744
%(1
.96-
3.63
)1.
7537
%(1
.45-
2.12
)1.
5417
%(1
.27-
1.87
)1.
00
mod
el 5
: BA
SIC
+ n
EIG
HBo
URH
oo
D +
Ho
USE
Ho
LD+
InD
IVID
UA
L
neig
hbou
rhoo
d sa
fety
+ s
ocia
l coh
esio
n +
mat
eria
l dep
rivat
ion
(ind.
3) +
soc
ial d
epriv
a-tio
n (in
d. 2
+3) +
PA
mak
es m
e fe
el le
ss
stre
ssed
+ I
get i
n a
good
moo
d +
PA is
goo
d fo
r my
fitne
ss +
PA
cos
ts to
o m
uch
ener
gy +
I f
eel u
ncom
fort
able
dur
ing
PA +
PA
is to
o ex
pens
ive
+ so
cial
supp
ort +
mod
ellin
g +
self-
effic
acy
+ in
tent
ion
0.04
6 (0
.024
)1.
22 (1
.12-1
.36)
2.29
57%
(1.7
0-3.
07)
1.62
48%
(1.3
4-1.
96)
1.48
26%
(1.2
3-1.
78)
1.00
a Do
ing
spor
ts (n
o vs
. yes
), w
ith ‘n
o’: n
ot d
oing
any
spo
rts,
with
at l
east
mod
erat
e in
tens
ity (i
.e. 3
-5 m
ET fo
r 55+
yrs
-old
, and
4-6
.5 m
ET fo
r 18-
55 y
rs-o
ld).
b m
ultil
evel
mod
els
wer
e es
timat
ed w
ith th
e m
arko
v Ch
ain
mon
te C
arlo
met
hod
impl
emen
ted
in m
lwiN
(ver
sion
2.02
) ; C
rI, c
redi
ble
inte
rval
; mO
r, m
edia
n od
ds ra
tio; O
r, o
dds
ratio
; SE,
st
anda
rd e
rror
.c
Educ
atio
n: h
ighe
st a
ttai
ned
educ
atio
n, w
ith 1
= n
o ed
ucat
ion
or p
rimar
y ed
ucat
ion;
2=
low
er s
econ
dary
; 3=
hig
her s
econ
dary
; 4=
tert
iary
.d
Perc
enta
ges
in it
alic
sho
w th
e pe
rcen
tage
s re
duct
ion
in o
dds
ratio
’s co
mpa
red
to th
e ba
sic m
odel
, per
edu
catio
nal g
roup
. For
inst
ance
, the
redu
ctio
n in
the
Or
for t
he lo
wes
t edu
catio
nal
grou
p w
hen
addi
ng n
eigh
bour
hood
fact
ors
into
the
basic
mod
el, i
s [(3
.99-
3.77
)/(3
.99-
1.00
)] *
100
= 7
%.
Kamphuis_09.indd 93 20-8-2008 10:34:35

94 Part II Socioeconomic status, environmental factors and physical activity
Tabl
e 5.
5 Ef
fect
of a
djus
tmen
t for
nei
ghbo
urho
od, h
ouse
hold
, and
indi
vidu
al le
vel f
acto
rs o
n cl
uste
ring
of s
port
s pa
rtic
ipat
ion
in n
eigh
bour
hood
s (r
ando
m e
ffec
ts),
and
on
the
asso
ciat
ion
betw
een
hous
ehol
d in
com
e an
d no
spo
rts
part
icip
atio
na (f
ixed
eff
ect)
b
Fact
ors
incl
uded
in th
e m
odel
(sig
nific
ant)
Are
a (r
ando
m e
ffec
ts)
Hou
seho
ld in
com
ec (fi
xed
effe
ct)
1- lo
w2
34-
hig
h
Are
a le
vel
varia
nce
(S
E)
mo
R(9
5% C
rI)
(n=
461)
(n=
887)
(n=
1022
)(n
=11
07)
oR
95%
C.I.
oR
95%
C.I.
oR
95%
C.I.
oR
mod
el 0
(e
mpt
y)--
0.15
7(0.
047)
1.
46 (1
.30-
1.63
)
mod
el 1
: BA
SIC
inco
me
+ ag
e +
sex
+ co
untr
y of
orig
in +
mar
ital
stat
us0.
050
(0.0
32)
1.23
(1.0
8-1.
39)
3.02
(2
.36-
3.86
)2.
47
(2.0
5-2.
98)
1.67
(1
.40-
1.99
)1.
00
mod
el 2
: BA
SIC
+ n
EIG
HBo
UR-
Ho
oD
neig
hbou
rhoo
d at
trac
tiven
ess +
nei
ghbo
urho
od
safe
ty +
soc
ial n
etw
ork
+ so
cial
coh
esio
n
0.02
9 (0
.030
) 1.1
8 (1
.04-
1.36
)2.
7712
%d
(2.14
-3.5
9)2.
386%
(1.9
7-2.
88)
1.68
0%(1
.40-
2.01
)1.
00
mod
el 3
: BA
SIC
+ H
oU
SEH
oLD
mat
eria
l dep
rivat
ion
(ind.
1+3
) +
soci
al d
epriv
a-tio
n (in
d. 2
+3)
0.04
2 (0
.031
) 1.
21 (1
.05-
1.38
)1.
9752
%(1
.48-
2.64
)2.
0131
%(1
.64-
2.47
)1.
4927
%(1
.25-
1.79
)1.
00
mod
el 4
: BA
SIC
+ In
DIV
IDU
AL
PA m
akes
me
feel
less
str
esse
d +
I get
in a
goo
d m
ood
+ PA
is g
ood
for m
y fit
ness
+ P
A c
osts
too
muc
h en
ergy
+ I
feel
unc
omfo
rtab
le d
urin
g PA
+
PA is
too
expe
nsiv
e +
soci
al su
ppor
t + s
elf-
effic
acy
+ in
tent
ion
0.05
6 (0
.034
) 1.
25 (1
.08-
1.41
)2.
0648
%(1
.58-
2.70
)2.
0032
%(1
.62-
2.46
)1.
4730
%(1
.21-
1.78
)1.
00
mod
el 5
: BA
SIC
+ n
EIG
H-
BoU
RHo
oD
+
Ho
USE
Ho
LD+
InD
IVID
UA
L
neig
hbou
rhoo
d sa
fety
+ s
ocia
l coh
esio
n +
mat
e-ria
l dep
rivat
ion
(ind.
3) +
soc
ial d
epriv
atio
n (in
d.
3) +
PA
mak
es m
e fe
el le
ss s
tres
sed
+ I g
et in
a
good
moo
d +
PA is
goo
d fo
r my
fitne
ss +
PA
cost
s too
muc
h en
ergy
+ I
feel
unc
omfo
rtab
le
durin
g PA
+ P
A is
too
expe
nsiv
e +
soci
al s
uppo
rt +
self-
effic
acy
+ in
tent
ion
0.04
4 (0
.033
) 1.
22 (1
.08-
1.38
)1.
66 6
7%(1
.22-
2.27
)1.
8046
%(1
.44-
2.26
)1.
4040
%(1
.14-1
.71)
1.00
a Do
ing
spor
ts (n
o vs
. yes
), w
ith ‘n
o’: n
ot d
oing
any
spo
rts,
with
at l
east
mod
erat
e in
tens
ity (i
.e. 3
-5 m
ET fo
r 55+
yrs
-old
, and
4-6
.5 m
ET fo
r 18-
55 y
rs-o
ld).
b m
ultil
evel
mod
els
wer
e es
timat
ed w
ith th
e m
arko
v Ch
ain
mon
te C
arlo
met
hod
impl
emen
ted
in m
lwiN
(ver
sion
2.02
) ; C
rI, c
redi
ble
inte
rval
; mO
r, m
edia
n od
ds ra
tio; O
r, o
dds
ratio
; SE,
st
anda
rd e
rror
.c
Inco
me
leve
l in
four
gro
ups:
1=
<12
00 e
uro;
2=
1200
-180
0 eu
ro; 3
=18
00-2
600
euro
; 4=
> 2
600
euro
.d
Perc
enta
ges
in it
alic
sho
w th
e pe
rcen
tage
s re
duct
ion
in o
dds
ratio
’s co
mpa
red
to th
e ba
sic m
odel
, per
inco
me
grou
p. F
or in
stan
ce, t
he re
duct
ion
in th
e O
r fo
r the
low
est i
ncom
e gr
oup
whe
n ad
ding
nei
ghbo
urho
od fa
ctor
s in
to th
e ba
sic m
odel
, is
[(3.0
2-2.
77)/
(3.0
2-1.
00)]
* 10
0 =
12%
.
Kamphuis_09.indd 94 20-8-2008 10:34:35

955 Socioeconomic status and sports participation
Conclusions and implicationsThis study is among the first to show that neighbourhood and household fac-tors in addition to individual factors contribute to the explanation of socioeco-nomic inequalities in sports participation. more research into specific pathways between (objective and perceived) neighbourhood, household, and individual factors is needed to better understand how socioeconomic disadvantage leads to physical inactivity. Our results suggest that intervention and policy strate-gies targeted towards lower socioeconomic groups would need to intervene on neighbourhood, household, as well as individual factors, to yield a maximal increase in sports participation among lower socioeconomic groups, and, ulti-mately, reduce socioeconomic inequalities in health.
Acknowledgements
The GLOBE study is carried out by the Department of public Health of the Erasmus University medical centre in Rotterdam, in collaboration with the public Health Services of the city of Eindhoven and region South-East Brabant. The authors are thankful to Roel Faber and Frank Santegoeds for constructing the dataset, and to caspar Looman for the solution how to treat missing values. The study is supported by grants of the ministry of public Health, welfare and Sport and the Health Research and Development council (ZON; number 40050009). KG is supported by an Australian National Health and medical Research council Sidney Sax Fellowship (ID 290540).
Kamphuis_09.indd 95 20-8-2008 10:34:36

96 Part II Socioeconomic status, environmental factors and physical activity
References
1 wannamethee SG, Shaper AG, Alberti KG. physical activity, metabolic factors, and the incidence of coronary heart disease and type 2 diabetes. Arch Intern Med 2000;160:2108-16.
2 Droomers m, Schrijvers cT, van de mheen H, et al. Educational differences in lei-sure-time physical inactivity: a descriptive and explanatory study. Soc Sci Med 1998;47:1665-76.
3 crespo cJ, Ainsworth BE, Keteyian SJ, et al. prevalence of physical inactivity and its relation to social class in U.S. adults: results from the Third National Health and Nutri-tion Examination Survey, 1988-1994. Med Sci Sports Exerc 1999;31:1821-7.
4 marshall SJ, Jones DA, Ainsworth BE, et al. Race/ethnicity, social class, and leisure-time physical inactivity. Med Sci Sports Exerc 2007;39:44-51.
5 Lynch Jw, Kaplan GA, Salonen JT. why do poor people behave poorly? Variation in adult health behaviours and psychosocial characteristics by stages of the socioeconomic lifecourse. Soc Sci Med 1997;44:809-19.
6 Booth SL, Sallis JF, Ritenbaugh c, et al. Environmental and societal factors affect food choice and physical activity: rationale, influences, and leverage points. Nutr Rev 2001;59:S21-39; discussion S57-65.
7 pickett KE, pearl m. multilevel analyses of neighbourhood socioeconomic context and health outcomes: a critical review. J Epidemiol Community Health 2001;55:111-22.
8 parkes A, Kearns A. The multi-dimensional neighbourhood and health: a cross-sec-tional analysis of the Scottish Household Survey, 2001. Health Place 2006;12:1-18.
9 popkin Bm, Duffey K, Gordon-Larsen p. Environmental influences on food choice, physical activity and energy balance. Physiol Behav 2005;86:603-13.
10 Owen N, Humpel N, Leslie E, et al. Understanding environmental influences on walk-ing; Review and research agenda. Am J Prev Med 2004;27:67-76.
11 Humpel N, Owen N, Leslie E. Environmental factors associated with adults’ participa-tion in physical activity: a review. Am J Prev Med 2002;22:188-99.
12 Sooman A, macintyre S. Health and perceptions of the local environment in socially contrasting neighbourhoods in Glasgow. Health and Place 1995;1:15-26.
13 macintyre S, Ellaway A. Social and local variations in the use of urban neighbourhoods: a case study in Glasgow. Health Place 1998;4:91-4.
14 Estabrooks pA, Lee RE, Gyurcsik Nc. Resources for physical activity participation: does availability and accessibility differ by neighborhood socioeconomic status? Ann Behav Med 2003;25:100-4.
15 wilson DK, Kirtland KA, Ainsworth BE, et al. Socioeconomic status and perceptions of access and safety for physical activity. Ann Behav Med 2004;28:20-8.
16 Van Lenthe FJ, Brug J, mackenbach Jp. Neighbourhood inequalities in physical inactiv-ity: the role of neighbourhood attractiveness, proximity to local facilities and safety in the Netherlands. Soc Sci Med 2005;60:763-75.
17 Giles-corti B, Donovan RJ. Socioeconomic status differences in recreational physical activity levels and real and perceived access to a supportive physical environment. Prev Med 2002;35:601-11.
18 Ball K, Timperio A, Salmon J, et al. personal, social and environmental determinants of educational inequalities in walking: a multilevel study. J Epidemiol Community Health 2007;61:108-14.
19 Lindstrom m, Hanson BS, Ostergren pO. Socioeconomic differences in leisure-time physical activity: the role of social participation and social capital in shaping health related behaviour. Soc Sci Med 2001;52:441-51.
20 Giles-corti B, Timperio A, Bull F, et al. Understanding physical activity environ-mental correlates: increased specificity for ecological models. Exerc Sport Sci Rev 2005;33:175-81.
Kamphuis_09.indd 96 20-8-2008 10:34:36

975 Socioeconomic status and sports participation
21 Andersen LB, Schnohr p, Schroll m, et al. All-cause mortality associated with physi-cal activity during leisure time, work, sports, and cycling to work. Arch Intern Med 2000;160:1621-8.
22 Franco OH, de Laet c, peeters A, et al. Effects of physical activity on life expectancy with cardiovascular disease. Arch Intern Med 2005;165:2355-60.
23 macintyre S, Ellaway A, cummins S. place effects on health: how can we conceptualise, operationalise and measure them? Soc Sci Med 2002;55:125-39.
24 chandola T, clarke p, wiggins RD, et al. who you live with and where you live: setting the context for health using multiple membership multilevel models. J Epidemiol Com-munity Health 2005;59:170-5.
25 Subramanian SV, Delgado I, Jadue L, et al. Income inequality and health: multilevel analysis of chilean communities. J Epidemiol Community Health 2003;57:844-8.
26 merlo J, chaix B, Ohlsson H, et al. A brief conceptual tutorial of multilevel analysis in social epidemiology: using measures of clustering in multilevel logistic regression to investigate contextual phenomena. J Epidemiol Community Health 2006;60:290-7.
27 Van Lenthe FJ, Schrijvers cT, Droomers m, et al. Investigating explanations of socioeconomic inequalities in health: the Dutch GLOBE study. Eur J Public Health 2004;14:63-70.
28 mackenbach Jp, van de mheen H, Stronks K. A prospective cohort study investigating the explanation of socioeconomic inequalities in health in The Netherlands. Soc Sci Med 1994;38:299-308.
29 Humpel N, Owen N, Iverson D, et al. perceived environment attributes, residential loca-tion, and walking for particular purposes. Am J Prev Med 2004;26:119-25.
30 Trost SG, Owen N, Bauman AE, et al. correlates of adults’ participation in physical activity: review and update. Med Sci Sports Exerc 2002;34:1996-2001.
31 Brug J, van Lenthe FJ, eds. Environmental determinants and interventions for physical activ-ity, nutrition and smoking: a review. Den Haag: Zonmw 2005.
32 Kamphuis cBm, van Lenthe FJ, Giskes K, et al. perceived environmental determinants of physical activity and fruit and vegetable consumption among high and low socioeco-nomic groups in the Netherlands. Health Place 2007;13:493-503.
33 Baranowski T, cullen Kw, Nicklas T, et al. Are current health behavioral change models helpful in guiding prevention of weight gain efforts? Obes Res 2003;11 Suppl:23S-43S.
34 Van Berkel-Van Schaik AB, Tax B. Towards a standard operationalisation of socioeconomic status for epidemiological and socio-medical research [in Dutch]. Rijswijk: ministerie van wVc 1990.
35 wendel-Vos Gc, Schuit AJ, Saris wH, et al. Reproducibility and relative validity of the short questionnaire to assess health-enhancing physical activity. J Clin Epidemiol 2003;56:1163-9.
36 Rasbash J, Steele F, Browne w, et al. A user’s guide to mlwiN Version 2.0. Bristol: centre for multilevel modelling, University of Bristol 2005.
37 Browne wJ, Rasbash J, Edmond wS. mcmc estimation in mLwiN version 2.0 centre for multilevel modelling, University of Bristol 2005.
38 Geyer S, Hemstrom O, peter R, et al. Education, income, and occupational class cannot be used interchangeably in social epidemiology. Empirical evidence against a common practice. J Epidemiol Community Health 2006;60:804-10.
39 Statistical package for Social Sciences. chicago: SpSS 1987.40 Giles-corti B, Donovan RJ. The relative influence of individual, social and physical
environment determinants of physical activity. Soc Sci Med 2002;54:1793-812.41 mcNeill LH, Kreuter mw, Subramanian SV. Social environment and physical activity:
a review of concepts and evidence. Soc Sci Med 2006;63:1011-22.42 mcculloch A. An examination of social capital and social disorganisation in neighbour-
hoods in the British household panel study. Soc Sci Med 2003;56:1425-38.
Kamphuis_09.indd 97 20-8-2008 10:34:36

Kamphuis_09.indd 98 20-8-2008 10:34:36

Kamphuis CBm, Van Lenthe Fj, Giskes K, Huisman m, Brug j, mackenbach jP. Socioeconomic variations in recreational walking among older adults: mediation of neighbourhood perceptions and individual cognitions (under review with IJBNPA)
Socioeconomic variations in recreational walking among older adults: mediation of neighbourhood perceptions and individual cognitions
6
Kamphuis_09.indd 99 20-8-2008 10:34:36

100 Part II Socioeconomic status, environmental factors and physical activity
Abstract
Background people with a low socioeconomic status (SES) are more likely to be physically inactive than their higher status counterparts, however, the mech-anisms underlying this socioeconomic gradient in physical inactivity remain largely unknown. Our aims were (1) to investigate socioeconomic differences in recreational walking among older adults and (2) to examine whether neigh-bourhood perceptions and individual cognitions regarding regular physical activity mediate these differences.
Methods Data were obtained by a large-scale postal survey among a stratified sample of older adults (age 55-75 years) (N=1994), residing in 147 neighbour-hoods of Eindhoven and surrounding areas, in the Netherlands. multilevel logistic regression analyses assessed associations between SES (i.e. education and income), perceptions of the social and physical neighbourhood environ-ment, measures of individual cognitions derived from the Theory of planned Behaviour (e.g. attitude, perceived behaviour control), and recreational walk-ing for >10 minutes/week (no vs. yes).
Results participants in the lowest educational group (OR 1.67 (95% cI, 1.18-2.35)) and lowest income group (OR 1.40 (95% cI, 0.98-2.01)) were more likely to report no recreational walking than their higher status counterparts. The association between SES and recreational walking attenuated when neigh-bourhood aesthetics was included in the model, and largely reduced when indi-vidual cognitions were added to the model (with largest effects of attitude, and intention regarding regular physical activity). The association between poor neighbourhood aesthetics and no recreational walking attenuated to (border-line) insignificance when individual cognitions were taken into account.
Conclusions Both neighbourhood aesthetics and individual cognitions regarding physical activity contributed to the explanation of socioeconomic differences in no recreational walking. Neighbourhood aesthetics mediated the associa-tion between SES and recreational walking largely via individual cognitions towards physical activity. Intervention and policy strategies to reduce socioeco-nomic differences in lack of recreational walking among older adults would be most effective if they intervene on both neighbourhood perceptions as well as individual cognitions.
Kamphuis_09.indd 100 20-8-2008 10:34:36
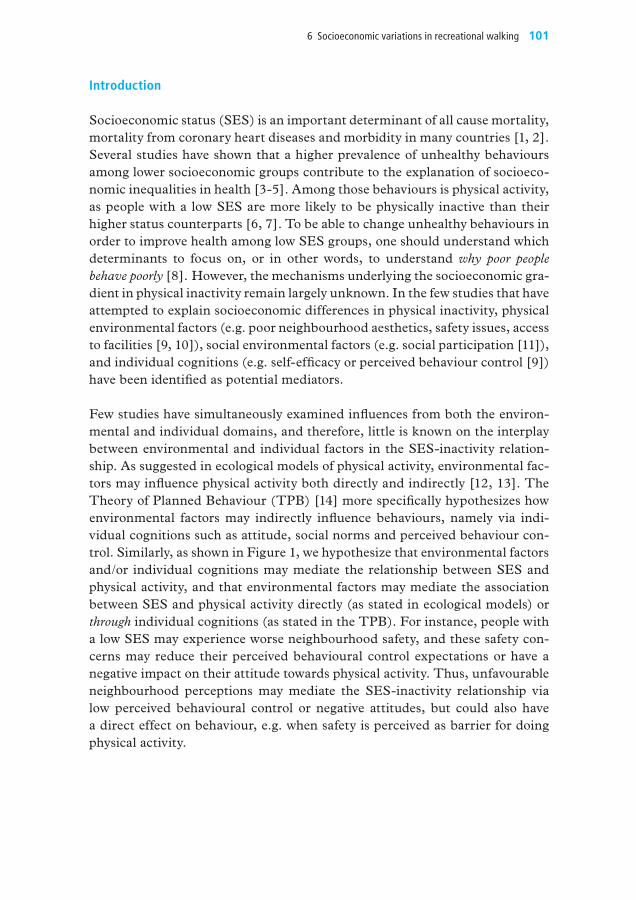
1016 Socioeconomic variations in recreational walking
Introduction
Socioeconomic status (SES) is an important determinant of all cause mortality, mortality from coronary heart diseases and morbidity in many countries [1, 2]. Several studies have shown that a higher prevalence of unhealthy behaviours among lower socioeconomic groups contribute to the explanation of socioeco-nomic inequalities in health [3-5]. Among those behaviours is physical activity, as people with a low SES are more likely to be physically inactive than their higher status counterparts [6, 7]. To be able to change unhealthy behaviours in order to improve health among low SES groups, one should understand which determinants to focus on, or in other words, to understand why poor people behave poorly [8]. However, the mechanisms underlying the socioeconomic gra-dient in physical inactivity remain largely unknown. In the few studies that have attempted to explain socioeconomic differences in physical inactivity, physical environmental factors (e.g. poor neighbourhood aesthetics, safety issues, access to facilities [9, 10]), social environmental factors (e.g. social participation [11]), and individual cognitions (e.g. self-efficacy or perceived behaviour control [9]) have been identified as potential mediators.
Few studies have simultaneously examined influences from both the environ-mental and individual domains, and therefore, little is known on the interplay between environmental and individual factors in the SES-inactivity relation-ship. As suggested in ecological models of physical activity, environmental fac-tors may influence physical activity both directly and indirectly [12, 13]. The Theory of planned Behaviour (TpB) [14] more specifically hypothesizes how environmental factors may indirectly influence behaviours, namely via indi-vidual cognitions such as attitude, social norms and perceived behaviour con-trol. Similarly, as shown in Figure 1, we hypothesize that environmental factors and/or individual cognitions may mediate the relationship between SES and physical activity, and that environmental factors may mediate the association between SES and physical activity directly (as stated in ecological models) or through individual cognitions (as stated in the TpB). For instance, people with a low SES may experience worse neighbourhood safety, and these safety con-cerns may reduce their perceived behavioural control expectations or have a negative impact on their attitude towards physical activity. Thus, unfavourable neighbourhood perceptions may mediate the SES-inactivity relationship via low perceived behavioural control or negative attitudes, but could also have a direct effect on behaviour, e.g. when safety is perceived as barrier for doing physical activity.
Kamphuis_09.indd 101 20-8-2008 10:34:36

102 Part II Socioeconomic status, environmental factors and physical activity
Figure 6.1 Conceptual model of associations between socioeconomic status (SES), neighbourhood factors, individual cognitions regarding physical activity, and recreational walking
Neighbourhood factors:- Physical neighbourhood environment (e.g. safety, aesthetics, accessibility of facilities)- Social neighbourhood environment (e.g. social network, social disorder)
Individal cognitions regarding physical activity:- Attitude- Social influences: subjective norm, social support, modelling- Perceived behaviour control- Intention
Recreational walking
SES- Education- Income
Environmental determinants are likely to differ for specific physical activity behaviours, and environmental and individual mediators of the SES-inactivity relationship may differ for population subgroups [15]. Therefore, in this paper we will focus on one specific behaviour, i.e. recreational walking, and one sub-group: older adults. walking is the most common leisure-time physical activity among the general population in developed countries (e.g. the U.S. [16], Aus-tralia [17], and the Netherlands [18]). walking is promising as a focus of public health interventions, due to its acceptability and accessibility (e.g. in terms of skills, equipment, and costs), especially among subpopulations who are known to be sedentary and whose activity should be increased, e.g. older people and people from a socioeconomically disadvantaged background. Older adults are an important subpopulation for public health interventions, as they represent a rapidly increasing share of the general population, and physical activity is important to preserve their health and functioning, and consequently avoid functional limitations and disability [19]. Little is known about socioeconomic differences in walking (and the determinants of these) among older adults.
In this paper we will integrate perceptions of the physical (i.e. perceived neigh-bourhood safety, aesthetics, and availability of facilities) and social neighbour-hood environment (i.e. perceived social cohesion, social network, feeling at home in the neighbourhood, social disorganisation), with individual’s cogni-tions regarding physical activity (e.g. attitude, perceived behavioural control), to determine to what extent socioeconomic differences in recreational walking
Kamphuis_09.indd 102 20-8-2008 10:34:37

1036 Socioeconomic variations in recreational walking
among older adults are mediated by neighbourhood perceptions and individual cognitions.
Methods
Study populationData were obtained by a large-scale postal survey, a component of the new wave of data collection for the longitudinal GLOBE study, among a stratified sample of the adult population (age 25-75 years) of Eindhoven (the fifth largest city in the Netherlands) and surrounding cities in October 2004 (N=4785; response rate 62%). participants resided in 213 neighbourhoods, which are the smallest geographical units in the Netherlands created for statistical and administrative purposes (with an average population of about 2000 inhabitants). more about the objectives, design and results of the GLOBE study can be found in detail elsewhere [20, 21]. The use of personal data in this study is in compliance with the Dutch personal Data protection Act and the municipal Database Act, and has been registered with the Dutch Data protection Authority (number 1248943).
participants aged 55-75 years (N=2345) were selected for the current study. Those with missing values for recreational walking, education, household income, or sex were excluded from analyses (n=265). Furthermore, we removed participants with missing values for the level-2 indicator (neighbour-hood) (n=26), and participants residing in neighbourhoods with only one or two participants (n=60). Therefore, the analytic sample comprised of 1994 participants, residing in 147 neighbourhoods (mean number of participants per neighbourhood: n= 14, range 3-80). Demographic characteristics of our sample are provided in Table 1.
MeasuresAll factors were measured in the GLOBE postal survey in 2004. Selection of items to measure salient environmental factors was based on an extensive litera-ture review [22-25], expert meetings, and focus groups [26].
Neighbourhood perceptionsThree perceptions of physical neighbourhood factors were measured with single items, assessing whether participants agreed or disagreed with the fol-lowing statements: “my neighbourhood is unsafe” (safety), “my neighbourhood is unattractive for physical activity” (aesthetics), and “There are insufficient facilities for physical activity in my neighbourhood” (availability of facilities).
Thirteen items asked about social relationships within the neighbourhood (on a five-point scale: totally agree - totally disagree) (α = .86), and these items
Kamphuis_09.indd 103 20-8-2008 10:34:37

104 Part II Socioeconomic status, environmental factors and physical activity
Table 6.1 Sample characteristics (n=1994; aged 55-75 years) by educational levela, and univariate associations with no recreational walking (unadjusted)
ToTAL Educational levela Unadjusted oRs forno recreational walking1–low 2 3 4–high
nb %c %c %c %c %c
Total sample 1994 100
Recreational walking
Yes 1356 68.7 61.5 65.3 77.9 70.8
no 638 31.3 38.5 34.7 22.1 29.2
Education
1 Primary education 281 12.5 - - - - 1.51 (1.09-2.09)
2 Lower secondary 908 43.7 1.29 (1.01-1.64)
3 Higher secondary 366 19.8 0.69 (0.50-0.94)
4 Tertiary education 439 24.1 1.00
monthly net household income
Less than 1200 euro 294 13.8 37.4 15.6 6.2 4.5 1.33 (0.97-1.83)1200-1800 euro 533 23.6 32.1 30.3 21.8 8.3 1.04 (0.79-1.38)1800-2600 euro 503 25.1 11.5 26.2 32.5 24.1 0.93 (0.70-1.23)more than 2600 euro 421 24.5 1.2 13.3 26.8 55.2 1.00Don’t want to say/don’t know 243 13.0 17.7 14.7 12.7 7.9 1.57 (1.14-2.16)
Sex
male 958 47.7 42.6 32.0 59.2 69.1 1.00Female 1036 52.3 57.4 68.0 40.8 30.9 1.06 (0.87-1.28)
Age group
55-64 1053 63.5 52.5 64.4 67.4 64.2 1.0065-74 941 36.5 47.5 35.6 32.6 35.8 0.87 (0.71-1.07)
Country of birth
netherlands 1872 93.7 87.5 97.5 95.0 89.0 1.00other 106 6.3 12.5 2.5 5.0 11.0 0.88 (0.59-1.32)
marital status
married 1589 82.3 78.9 82.2 84.4 82.3 1.00Unmarried/divorced/widowed 390 17.7 21.1 17.8 15.6 17.7 1.20 (0.94-1.53)
General health status
Excellent 93 5.3 4.1 6.1 4.2 5.5 1.00Very good 314 18.6 8.2 15.4 23.4 26.0 1.06 (0.65-1.71)Good 1133 57.0 55.1 58.9 57.1 54.4 1.18 (0.76-1.85)moderate 378 15.9 26.3 16.0 13.2 12.4 1.03 (0.63-1.69)Poor 27 0.9 2.1 0.8 0.5 0.9 0.86 (0.28-2.62)missing 49 2.2 4.1 2.7 1.6 0.9 2.17 (1.04-4.52)
a Educational level with 1= primary education, 2= lower secondary, 3= higher secondary, and 4= tertiary education.b The numbers (N) are unweighted, and reflect the actual numbers of participants in the dataset.c The percentages (%) are weighted and represent the prevalence rates as they existed in the population of
Eindhoven by October 2004, which is the source population. The weight factors are calculated from the distribution of the characteristics in a random sample drawn from the municipal registry in Eindhoven, October 2004.
Kamphuis_09.indd 104 20-8-2008 10:34:37
1056 Socioeconomic variations in recreational walking
were represented by three factors, as derived from a factor analysis, e.g. a prin-cipal component analysis with varimax rotation and kaiser normalization. we labelled the first factor ‘social cohesion’, i.e. “the extent of connectedness and solidarity among groups in society” [27]. Items that loaded on this factor were e.g. ‘people in this neighbourhood agree on norms and values’, ‘people in this neighbourhood are willing to help each other’, and ‘people in this neighbour-hood can be trusted’. The second factor was labelled ‘social network’ (i.e. “the presence and nature of interpersonal relationships and interactions; extent to which one is interconnected and embedded in a community” [28]), represent-ing items such as ‘I borrow things from my neighbours’, ‘I visit my neighbours in their home’, and ‘I can ask my neighbours for advice’. The third factor was labelled ‘feeling at home in one’s neighbourhood’, representing items such as “I feel at home in this neighbourhood”, and “I would like to move out of this neighbourhood”. Each factor score was classed into tertiles for analytical pur-poses.
The fourth social neighbourhood factor was derived from a factor analysis that grouped eleven items (α = .94) together in one factor, which we labelled as ‘social disorder’, i.e. “a lack of physical and social order in the community” [29]. These eleven items covered both social and physical indicators of social disorganization, and asked for the frequency with which adverse neighbour-hood events occurred (often, sometimes, (almost) never). Items referred to, for instance, litter on the streets, graffiti, vandalism, and the presence of people hanging around on the streets and drinking alcohol. The factor score was classed into tertiles (high, medium, low).
Individual physical activity cognitionswe used an adapted version of the Theory of planned Behaviour as a framework to measure individual cognitions of regular physical activity. This expanded model incorporated the constructs of attitude, subjective norm, perceived behaviour control, and intention. Two additional social influences of physical activity were added to the model, i.e. social support, and modelling by signifi-cant others [24, 28]. Items for all constructs were derived from existing scales, or formulated according to the algorithms of conner & Norman [30]. All items were asked with regard to the behaviour “regular physical activity”, which was defined in the questionnaire as “being physically active for at least 30 minutes, every day, e.g. cycling, doing sports, gardening”.
Attitude was measured with outcome expectancies of regular physical activity, and responses were measured on a 5-point Likert-scale from (1) “very impor-tant” to (5) “not important at all”. participants reported on six items regarding negative outcome expectations (e.g. “Regular physical activity cost too much time”, “Regular physical activity costs too much energy”) and six items for pos-
Kamphuis_09.indd 105 20-8-2008 10:34:37

106 Part II Socioeconomic status, environmental factors and physical activity
itive outcome expectations (e.g. “Regular physical activity reduces my stress levels”, “Regular physical activity is good for my fitness”) (α = .77). Items were summed and, based on their specific sum scores, participants were divided in three groups: (very) positive attitude, positive-neutral, and neutral-negative attitude.
Social influences for regular physical activity were assessed with three separate items (α = .85) on a three-point scale (true, not true/not false, false): “most important others (e.g. partner, children, parents, friends) think that I should be regularly active” (subjective norm), “most important others support me to be regularly active” (social support), and “most important others are regu-larly active themselves” (modelling). Items were combined into a sum score, and three groups were distinguished based on their sum scores: positive social influences, neutral, and negative social influences.
perceived behaviour control was measured by one item that asked: “How sure are you that you can be regularly active?” (five-point scale, very sure - very unsure). Intention was measured with one item: “Do you plan to be regularly physical active?” (five-point scale, very likely - very unlikely).
Socioeconomic status and other demographic characteristicsEducational attainment is only one component of the broad concept of SES, but is considered a good indicator for SES in the Netherlands [31]. Four levels of education were distinguished ((1) no education or primary education; (2) lower professional and intermediate general education; (3) intermediate professional and higher general education; (4) higher professional education and university). we also measured household income as SES-indicator, asking participants to report their net monthly household income (0-1200 euro, 1200-1800 euro, 1800-2600 euro, 2600 euro or more, and ‘don’t want to say / don’t know’). Other demographic characteristics we measured were age (55-65, 65-75 years), sex, country of origin (Netherlands, other country), marital status (married/registered partnership, not married), and perceived general health (excellent, very good, good, moderate, poor).
Recreational walkingwalking in leisure time was measured with the SQUASH questionnaire - a vali-dated Dutch questionnaire to measure physical activity among an adult popu-lation [32]. participants reported frequency (times per week), average duration (minutes per day), and intensity (low, average, high) for recreational walking over the last couple of months. However, as the distribution of the sample was highly skewed with almost one third not reporting any recreational walking (and a mean (se) of 231 (5,8) minutes recreational walking per week among those who did any recreational walking), inactivity rather than a continuous
Kamphuis_09.indd 106 20-8-2008 10:34:37

1076 Socioeconomic variations in recreational walking
outcome measure the focus of the current paper. The dichotomised outcome we examined was ‘no recreational walking’ (<10 minutes per week) vs. ‘any recreational walking’ (>10 minutes per week).
Statistical analyses‘No recreational walking’ was modelled as a binary outcome variable in weighted multilevel logistic regression models of participants nested within neighbour-hoods. To take into account the hierarchical nature of the data, explanatory models were run in mlwiN (version 2.02) using the logit-link function and 2nd order pQL estimation methods [33] [34]. All analyses were conducted sepa-rately for education and income as SES-indicators, as they are likely to relate to different causal processes [35]. The missing value category of many explanatory factors showed high odds ratios for no recreational walking, and the prevalence of missing values was highest among participants from the lowest SES group. Therefore, to prevent overestimation of the explanatory power of these factors to SES differences in recreational walking, missing values for explanatory fac-tors were imputed by drawing randomly from the distribution of answering categories, using observed prevalences per educational group as probabilities (analyses with non-imputed data show approximately the same results – avail-able upon request). All bivariate and multivariate analyses were adjusted for age and sex (unless specified otherwise) and weighted (level-1 weight) to reflect our source population (i.e. older adults in the region of Eindhoven in October 2004) in terms of sex, age and educational level. This type of (single) imputa-tion was chosen on the assumption of missing at random, dependent on SES only, i.e. conditional mean Imputation [36].
Firstly, we tested univariate associations of education and income with no rec-reational walking. Then, we examined which possible explanatory factors were significantly associated with no recreational walking (p<0.05), and whether these factors were unequally distributed across SES-groups (calculated in SpSS version 11.0) [37]. Factors associated with no recreational walking and with risk categories more prevalent in low than high SES-groups were included in the following modelling sequence in mlwiN.
we examined mediation of neighbourhood perceptions and individual cogni-tions in the association between SES and no recreational walking. Therefore, we firstly calculated the odds ratios of no recreational walking by socioeconomic groups adjusted for age, and sex (model 1). Then, we added neighbourhood perceptions separately (model 2); individual cognitions separately (model 3); and finally neighbourhood perceptions and individual cognitions simultane-ously (model 4). when odds ratios for the SES-indicator in model 2-4 reduced (compared to model 1), this was interpreted as mediation of the explanatory factors included in the model between SES and no recreational walking [38].
Kamphuis_09.indd 107 20-8-2008 10:34:37

108 Part II Socioeconomic status, environmental factors and physical activity
Table 6.2 Adjusted odds ratios (oR)a for no recreational walking, and prevalence rates for response categories of neighbourhood perceptions and individual cognitions by educational level
Educational level
Independent factors oR 95% CI p 1(low)
2 3 4(high)
p
nEIGHBoURHooD
Physical neighbourhood factors
neighbourhood is unsafe
disagree 1.00 .636 95.5b 95.9 98.2 98.9 .004
agree 0.87 (0.49-1.55) 4.5 4.1 1.8 1.1
neighbourhood is unattractive
disagree 1.00 .008 72.5 84.3 88.6 86.0 .000
agree 1.41 (1.09-1.82) 27.5 15.7 11.4 14.0
Insufficient places for physical activity
disagree 1.00 .256 64.3 75.2 77.5 88.7 .000
agree 1.14 (0.91-1.44) 35.7 24.8 22.5 11.3
Social neighbourhood factors
Social cohesion
high 1.00 .000 38.1 36.3 41.3 40.9 .001
medium 0.62 (0.50-0.78) 30.3 37.1 38.2 34.9
low 0.82 (0.64-1.05) 31.6 26.6 20.5 24.3
Social network
large 1.00 .000 34.4 37.4 37.6 29.4 .034
medium 1.56 (1.23-1.98) 33.2 32.9 40.9 37.0
small 1.59 (1.25-2.04) 32.4 29.7 21.5 33.6
Feeling at home in neighbourhood
high 1.00 .120 32.4 35.3 36.4 42.3 .020
moderate 0.80 (0.64-1.01) 33.2 38.0 36.6 31.1
low 0.99 (0.78-1.26) 34.4 26.7 27.0 26.6
Social disorganisation
low 1.00 .540 45.3 48.4 50.6 54.0 .000
medium 0.96 (0.75-1.22) 18.6 24.3 23.5 24.5
high 0.86 (0.67-1.12) 36.1 27.3 25.9 21.5
InDIVIDUAL
Attitude towards regular physical activity
positive 1.00 .000 25.8 32.8 36.0 32.8 .002
neutral 1.34 (1.07-1.67) 61.9 54.9 58.5 58.4
negative 4.16 (2.96-5.84) 12.3 12.3 5.4 8.7
Kamphuis_09.indd 108 20-8-2008 10:34:37

1096 Socioeconomic variations in recreational walking
Educational level
Independent factors oR 95% CI p 1(low)
2 3 4(high)
p
Social influences for regular physical activity
positive 1.00 .000 54.9 50.1 49.6 53.2 .003
neutral 1.62 (1.32-1.99) 30.3 40.3 43.9 38.3
negative 1.76 (1.26-2.45) 14.8 9.6 6.5 8.5
Perceived behaviour control to be regularly active
(very) sure 1.00 .000 59.2 67.0 70.7 74.2 .001
not sure/unsure 1.65 (1.32-2.07) 31.0 25.7 20.5 19.0
(very) unsure 2.10 (1.48-2.97) 9.8 7.3 8.8 6.8
Intention to be regularly active
yes 1.00 .000 45.9 55.0 57.3 67.0 .000
maybe 1.84 (1.49-2.27) 38.9 38.1 35.2 26.7
no 4.41 (3.09-6.29) 15.2 6.9 7.5 6.4
a Weighted models were adjusted for age, sex, and educational level.b This is the percentage of respondents in a certain response category per socioeconomic group; for example, 95.5% of
those in the lowest group disagreed with the statement “my neighbourhood is unsafe”.
Also, we examined whether individual cognitions mediated the association between neighbourhood perceptions and no recreational walking. Therefore, we compared ORs for neighbourhood perceptions with and without control-ling for attitude, social influences, perceived behaviour control, and intention. when the association between neighbourhood perceptions and no recreational walking attenuated after inclusion of individual cognitions in the model, we interpreted this as the mediating role of individual cognitions in the association between neighbourhood perceptions and no recreational walking.
Results
Socioeconomic differences in no recreational walkingAs presented in Table 1, participants in the lowest educational group (OR 1.51 (95% cI, 1.09-2.09)) and lowest income group (OR 1.33 (95% cI, 0.97-1.83)) were more likely to do no recreational walking than their higher status coun-terparts (unadjusted ORs). Other demographic characteristics were not associ-ated with no recreational walking.
Table 6.2 (Continued)
Kamphuis_09.indd 109 20-8-2008 10:34:37

110 Part II Socioeconomic status, environmental factors and physical activity
Selection of explanatory factorsThree out of seven neighbourhood perceptions were significantly associated with no recreational walking, i.e. poor neighbourhood aesthetics, high social cohe-sion, and a small social network (see Table 2). As the latter two risk factors were more prevalent among high SES groups, these factors could not serve as possible explanatory factors for the raised odds for no recreational walking among low SES groups. All four individual cognitions were significantly associated with no recreational walking, and risk categories (i.e. negative attitude, negative social influences, low perceived behaviour control and no intention to be regularly physically active) were most prevalent among the lowest SES groups. Therefore, all individual cognitions and one neighbourhood perception (neighbourhood aesthetics) were taken into account in further explanatory models.
Explaining the ‘SES – no recreational walking’ associationAs presented in Table 3, the sex- and age-adjusted OR to do no recreational walking for the lowest educational group (OR 1.67 (95% cI, 1.18-2.35) attenu-ated when neighbourhood aesthetics was included in the model (model 2), or when individual cognitions were included (model 3), and further reduced when all these factors together (model 4) were taken into account (OR 1.30 (95% cI, 0.91-1.87). Attitude and intention regarding regular physical activity had the largest effect on the reduction of SES inequalities in recreational walking. The odds to do no recreational walking were lowest for the second-highest educa-tional group in all models.
Results of the analyses with income as SES-indicator showed the same pattern as those for education. However, there was a smaller socioeconomic gradient for income (see model 1, Table 4), and the socioeconomic differences were fully explained when all explanatory factors were taken into account (model 4, Table 4). people who ticked the answer category “I do not want to report my income, or I do not know” were most likely not to engage in any recreational walking.
Explaining the ‘neighbourhood aesthetics– no recreational walking’ associationThe association between neighbourhood aesthetics and no recreational walk-ing reduced to non-significance when individual cognitions were taken into account (model 4, Table 3 and Table 4), although the OR for no recreational walking among those finding their neighbourhood unattractive remained ele-vated (OR 1.19 (95% cI, 0.95-1.50).
Discussion
This study is among the first to investigate how neighbourhood perceptions and individual cognitions mediate socioeconomic differences in recreational walking among older adults using a multilevel design. we found the lowest
Kamphuis_09.indd 110 20-8-2008 10:34:37

1116 Socioeconomic variations in recreational walking
Table 6.3 odds ratios with 95% confidence intervals (oR, 95% CI) for no recreational walking by education, mediated by neighbourhood perceptions and individual cognitions
model 1 (base model): education + age + sex
model 2: base+ neighbourhood
model 3: base + individual
model 4: base+ neighbourhood+ individual
oR (95% CI) oR (95% CI) oR (95% CI) oR (95% CI)
Education %no walking
1 - low 38.5 1.67 (1.18-2.35) 1.60 (1.13-2.27) 1.33 (0.93-1.90) 1.30 (0.91-1.87)2 34.7 1.49 (1.17-1.90) 1.48 (1.16-1.89) 1.35 (1.04-1.75) 1.29 (0.99-1.68)3 22.1 0.84 (0.60-1.18) 0.84 (0.60-1.19) 0.80 (0.57-1.13) 0.75 (0.53-1.06)4 - high 29.2 1.00 1.00 1.00 1.00
neighbourhood perceptions
my neighbourhood is unattractive
disagree 1.00 1.00
agree 1.32 (1.06-1.65) 1.19 (0.95-1.50)
Individual cognitions
Attitude towards regular physical activity
positive 1.00 1.00
neutral 1.12 (0.87-1.45) 1.11 (0.86-1.43)
negative 2.30 (1.59-3.32) 2.26 (1.57-3.26)
Social influences for regular physical activity
positive 1.00 1.00
neutral 1.24 (1.01-1.52) 1.24 (1.02-1.532)
negative 1.54 (1.11-2.14) 1.54 (1.11-2.14)
Perceived behaviour control to be regularly active
(very) sure 1.00 1.00
not sure/unsure 1.21 (0.95-1.55) 1.20 (0.94-1.54)
(very) unsure 1.57 (1.11-2.22) 1.56 (1.10-2.21)
Intention to be regularly active
(very) likely 1.00 1.00
maybe 1.31 (0.99-1.73) 1.30 (0.98-1.72)
(very) unlikely 2.38 (1.59-3.57) 2.38 (1.59-3.57)
Random effects a
Level-2 variance (SE) 0.000 (0.000) 0.000 (0.000) 0.000 (0.000) 0.000 (0.000)
a Weighted multilevel models were estimated with the iterative generalized least squares procedure implemented in mlwiN version 2.02.
socioeconomic group most likely to be inactive regarding recreational walking, which is consistent with previous studies on walking [9, 10] and other physi-cal activity outcomes [39-43]. Also consistent with other findings, we found
Kamphuis_09.indd 111 20-8-2008 10:34:38

112 Part II Socioeconomic status, environmental factors and physical activity
that neighbourhood perceptions (i.e. neighbourhood aesthetics [9, 10, 43]) and individual cognitions (i.e. attitude, social influences, perceived behaviour con-trol, and intention [9, 43]) were important in the explanation of socioeconomic differences in recreational walking. Associations of neighbourhood factors with recreational walking, and their contribution to socioeconomic differences in recreational walking were smaller than the effect and contribution of individual factors (similar to findings for sports participation [43]). Still, as small odds ratios for neighbourhood characteristics may imply that changes to (percep-tions of) the neighbourhood context may have a significant effect on physical activity levels, these may offer important opportunities to reduce socioeco-nomic differences in physical activity.
Going beyond previous studies, our findings suggested that perceived unfa-vourable neighbourhood aesthetics mediated the SES-inactivity relationship via individual physical activity cognitions (since the OR for neighbourhood aesthetics reduced to non-significance when individual cognitions were taken into account, OR= 1.19 (95% cI: 0.95-1.50)). As the OR for neighbourhood aesthetics remained rather elevated, a direct effect of neighbourhood aesthetics may also play a role. These results support the hypothesis of ecological models of physical activity [12, 13], which suggest that environmental factors show both direct and indirect effects with physical activity. Findings indicated that older adults from socioeconomically disadvantaged backgrounds were more likely to perceive poor neighbourhood aesthetics, which in turn may have reduced their perceived behavioural control expectations and may have had a negative impact on their attitudes toward regular physical activity, explaining their lower levels of recreational walking. previous studies also reported (small) mediating effects of attitude and perceived behaviour control/self-efficacy in the associa-tion between environmental influences and physical activity [45-47].
The main strength of our study is that we could estimate mediating effects of a wide range of physical and social neighbourhood perceptions and individ-ual cognitions in the explanation of socioeconomic differences in recreational walking among older adults, using multilevel analysis techniques to correct for possible area effects. However, there were several limitations of our study. First, the cross-sectional design precluded any causal inferences from being drawn. Due to the exclusion of participants with missing values for recreational walk-ing, education, and household income, this study may have underestimated SES-walking associations, as lower SES groups may have been more inclined towards selective non-response. mediation effects only indicated that causal pathways may exist, however, selection may also play a role, i.e. people that find regular physical activity important may choose to live in a pleasant environ-ment. Also, as neighbourhood attractiveness and individual cognitions were both self-reported, other characteristics (e.g. personality, depressiveness) may
Kamphuis_09.indd 112 20-8-2008 10:34:38

1136 Socioeconomic variations in recreational walking
have influenced both factors in the same (positive/negative) way. Secondly, we could not examine objective, level-2 measures of neighbourhood influences, and therefore, it remains uncertain to what extent SES differences in neigh-bourhood perceptions reflect objective differences between neighbourhoods.
Table 6.4 odds ratios with 95% confidence intervals (oR, 95% CI) for doing no recreational walking by income, adjusted for neighbourhood perceptions and individual cognitions
model 1 (base model): income+ age + sex
model 2: base+ neighbour-hood
model 3: base + individual
model 4: base+ neighbourhood+ individual
oR (95% CI) oR (95% CI) oR (95% CI) oR (95% CI)
Income % no walking
1 - low 35.7 1.40 (0.98-2.01) 1.34 (0.94-1.91) 1.03 (0.73-1.47) 1.01 (0.71-1.42)2 30.3 1.10 (0.81-1.49) 1.09 (0.80-1.48) 0.94 (0.70-1.27) 0.93 (0.69-1.26)3 27.8 0.81 (0.60-1.10) 0.81 (0.60-1.10) 0.77 (0.57-1.05) 0.77 (0.57-1.05)4 - high 29.4 1.00 1.00 1.00 1.005 - don’t want to say/don’t know
36.6 1.32 (0.97-1.81) 1.31 (1.05-1.63) 1.16 (0.85-1.58) 1.15 (0.84-1.56)
neighbourhood perceptions
my neighbourhood is unattractive
disagree 1.00 1.00
agree 1.31 (1.05-1.63) 1.19 (0.95-1.50)
Individual cognitions
Attitude towards regular physical activity
positive 1.00 1.00
neutral 1.11 (0.86-1.43) 1.10 (0.85-1.42)
negative 2.32 (1.61-3.34) 2.28 (1.59-3.28)
Social influences for regular physical activity
positive 1.00 1.00
neutral 1.22 (0.99-1.51) 1.23 (1.001.51)
negative 1.53 (1.10-2.11) 1.53 (1.10-2.12)
Perceived behaviour control to be regularly active
(very) sure 1.00 1.00
not sure/unsure 1.25 (0.98-1.59) 1.24 (0.97-1.57)
(very) unsure 1.55 (1.09-2.20) 1.55 (1.09-2.19)
Intention to be regularly active
(very) likely 1.00 1.00
maybe 1.32 (1.00-1.75) 1.31 (0.99-1.74)
(very) unlikely 2.43 (1.65-3.57) 2.43 (1.65-3.57)
Random effects a
Level-2 variance (SE) 0.000 (0.000) 0.000 (0.000) 0.000 (0.000) 0.000 (0.000)
a Weighted multilevel models were estimated with the iterative generalized least squares procedure implemented in mlwiN version 2.02.
Kamphuis_09.indd 113 20-8-2008 10:34:38

114 Part II Socioeconomic status, environmental factors and physical activity
However, in additional multilevel analyses we found significant clustering of perceived safety, attractiveness and availability of facilities within neighbour-hoods, even when adjusting for resident’s age, sex, and education. This clus-tering of perceptions might indicate true neighbourhood differences (results available on request). Individual cognitions were not measured specific-spe-cific for recreational walking, but referred to regular physical activity (“being physically active with moderate intensity for at least 30 minutes per day”). In addition, neighbourhood perceptions were not specifically asked in the context of recreational walking. Increased specificity in and correspondence between outcome, and individual and neighbourhood variables, may lead to stronger associations and increased explanation of socioeconomic differences in recre-ational walking [15].
Simple cross tabulations indicated that the proportion of residents engaging in recreational walking does significantly vary by neighbourhood (results avail-able upon request). Unexpectedly, we did not find any neighbourhood variance in recreational walking within our multilevel models (see Table 3 en Table 4), which is difficult to explain. However, the fact that we did not find clustering of the outcome variable entailed no need for the multilevel mediational analysis procedure, as specified by Krull and macKinnon [48], which should have been applied in case of strong clustering. The multilevel statistical package mlwiN (version 2.02) was used nonetheless, as explanatory factors did cluster within neighbourhood.
we found opposite associations of social cohesion and social network with rec-reational walking: both high social cohesion and a small social neighbourhood network were associated with a lower likelihood of recreational walking. The latter association was expected and in line with the literature [28, 40]: par-ticipants with a small social neighbourhood network may find it more difficult to find company for recreational walking, or may experience less social sup-port/peer encouragement for physical activity. However, one can only speculate why people who experience high social cohesion (i.e. those who reported that people in the neighbourhood are willing to help each other, and that people in the neighbourhood agree on norms and values) are more likely to do no recre-ational walking. maybe neighbourhoods with high social cohesion organized other neighbourhood activities in which these participants engaged rather than walking. Or, if social cohesion is high but the social norm is not to engage in recreational walking, people may find it more difficult to go walking than those living in neighbourhoods with low social cohesion and no norm regarding walking.
Kamphuis_09.indd 114 20-8-2008 10:34:38

1156 Socioeconomic variations in recreational walking
This study is among the first to show that unfavourable neighbourhood per-ceptions contribute to the explanation of socioeconomic differences in no rec-reational walking among older adults mainly indirectly, i.e. via unfavourable individual cognitions towards regular physical activity. more research into causal pathways between (objective and perceived) neighbourhood influences and individual cognitions is needed to better understand how socioeconomic disadvantage leads to physical inactivity. Our results suggest that intervention and policy strategies to reduce socioeconomic differences in lack of recreational walking among older adults would need to intervene on both neighbourhood perceptions as well as individual cognitions.
Acknowledgements
The GLOBE study is carried out by the Department of public Health of the Erasmus University medical centre in Rotterdam, in collaboration with the public Health Services of the city of Eindhoven and region South-East Brabant. The authors are thankful to Roel Faber and Frank Santegoeds for construct-ing the dataset, and to caspar Looman for his support on the data weighting procedure and imputation of missings. The study is supported by grants of the ministry of public Health, welfare and Sport and the Health Research and Development council (ZON; number 40050009). KG is supported by an Aus-tralian National Health and medical Research council Sidney Sax Fellowship (ID 290540).
Kamphuis_09.indd 115 20-8-2008 10:34:38
116 Part II Socioeconomic status, environmental factors and physical activity
References
1 Kunst AE, Bos V, Lahelma E, et al. Trends in socioeconomic inequalities in self-assessed health in 10 European countries. Int J Epidemiol 2005;34:295-305.
2 mackenbach Jp, Stirbu I, Roskam AJR, et al. Socioeconomic inequalities in health in 22 European countries. New England Journal of Medicine 2008;358:2486-81.
3 Laaksonen m, Talala K, martelin T, et al. Health behaviours as explanations for educa-tional level differences in cardiovascular and all-cause mortality: a follow-up of 60 000 men and women over 23 years. European Journal of Public Health 2007;18:38-43.
4 Lantz pm, Lynch Jw, House JS, et al. Socioeconomic disparities in health change in a longitudinal study of US adults: the role of health-risk behaviors. Soc Sci Med 2001;53:29-40.
5 Schrijvers cT, Stronks K, van de mheen HD, et al. Explaining educational dif-ferences in mortality: the role of behavioral and material factors. Am J Public Health 1999;89:535-40.
6 Droomers m, Schrijvers cT, mackenbach Jp. Educational level and decreases in leisure time physical activity: predictors from the longitudinal GLOBE study. J Epidemiol Com-munity Health 2001;55:562-8.
7 Giles-corti B, Donovan RJ. Socioeconomic status differences in recreational physical activity levels and real and perceived access to a supportive physical environment. Prev Med 2002;35:601-11.
8 Lynch Jw, Kaplan GA, Salonen JT. why do poor people behave poorly? Variation in adult health behaviours and psychosocial characteristics by stages of the socioeconomic lifecourse. Soc Sci Med 1997;44:809-19.
9 Ball K, Timperio A, Salmon J, et al. personal, social and environmental determinants of educational inequalities in walking: a multilevel study. J Epidemiol Community Health 2007;61:108-14.
10 Van Lenthe FJ, Brug J, mackenbach Jp. Neighbourhood inequalities in physical inactiv-ity: the role of neighbourhood attractiveness, proximity to local facilities and safety in the Netherlands. Soc Sci Med 2005;60:763-75.
11 Lindstrom m, moghaddassi m, merlo J. Social capital and leisure time physical activity: a population based multilevel analysis in malmo, Sweden. J Epidemiol Community Health 2003;57:23-8.
12 Kremers Sp, de Bruijn GJ, Visscher TL, et al. Environmental influences on energy bal-ance-related behaviors: A dual-process view. Int J Behav Nutr Phys Act 2006;3:9.
13 Spence Jc, Lee RJ. Toward a comprehensive model of physical activity. Psychology of Sport and Exercise 2003;4:7-24.
14 Ajzen I. “The Theory of planned Behaviour”. Organizational Behaviour and Human Decision Processes 1991;50:179-211.
15 Giles-corti B, Timperio A, Bull F, et al. Understanding physical activity environ-mental correlates: increased specificity for ecological models. Exerc Sport Sci Rev 2005;33:175-81.
16 Eyler AA, Brownson Rc, Bacak SJ, et al. The epidemiology of walking for physical activ-ity in the United States. Med Sci Sports Exerc 2003;35:1529-36.
17 Australian Bureau of Health Statistics. participation in sport and physical activities. canberra: Australian Bureau of Health Statistics 2000.
18 Ooijendijk wTm, Hildebrandt VH, Hopman-Rock m, eds. Bewegen Gemeten 2000-2004. Leiden: TNO Kwaliteit van Leven 2006.
Kamphuis_09.indd 116 20-8-2008 10:34:38
1176 Socioeconomic variations in recreational walking
19 centers for Disease control and prevention. Physical activity and health: a report of the Surgeon General. washington Dc: U.S. Department of Health and Human services 1996.
20 Van Lenthe FJ, Schrijvers cT, Droomers m, et al. Investigating explanations of socioeconomic inequalities in health: the Dutch GLOBE study. Eur J Public Health 2004;14:63-70.
21 mackenbach Jp, van de mheen H, Stronks K. A prospective cohort study investigating the explanation of socioeconomic inequalities in health in The Netherlands. Soc Sci Med 1994;38:299-308.
22 Bauman AE, Sallis JF, Dzewaltowski DA, et al. Toward a better understanding of the influences on physical activity: the role of determinants, correlates, causal variables, mediators, moderators, and confounders. Am J Prev Med 2002;23:5-14.
23 Humpel N, Owen N, Iverson D, et al. perceived environment attributes, residential loca-tion, and walking for particular purposes. Am J Prev Med 2004;26:119-25.
24 Trost SG, Owen N, Bauman AE, et al. correlates of adults’ participation in physical activity: review and update. Med Sci Sports Exerc 2002;34:1996-2001.
25 Brug J, van Lenthe FJ, eds. Environmental determinants and interventions for physical activ-ity, nutrition and smoking: a review. Den Haag: Zonmw 2005.
26 Kamphuis cBm, van Lenthe FJ, Giskes K, et al. perceived environmental determinants of physical activity and fruit and vegetable consumption among high and low socioeco-nomic groups in the Netherlands. Health Place 2007;13:493-503.
27 Kawachi I, Berkman L. Social cohesion, social capital, and health. In: Berkman L, Kawachi I, eds. Social Epidemiology. New York: Oxford University press 2000.
28 mcNeill LH, Kreuter mw, Subramanian SV. Social environment and physical activity: a review of concepts and evidence. Soc Sci Med 2006;63:1011-22.
29 mcculloch A. An examination of social capital and social disorganisation in neighbour-hoods in the British household panel study. Soc Sci Med 2003;56:1425-38.
30 conner m, Norman p, eds. Predicting health behaviour: research and practice with social cognition models. Buckingham: Open University press 1995.
31 Van Berkel-Van Schaik AB, Tax B. Towards a standard operationalisation of socioeconomic status for epidemiological and socio-medical research [in Dutch]. Rijswijk: ministerie van wVc 1990.
32 wendel-Vos Gc, Schuit AJ, Saris wH, et al. Reproducibility and relative validity of the short questionnaire to assess health-enhancing physical activity. J Clin Epidemiol 2003;56:1163-9.
33 Rasbash J, Steele F, Browne w, et al. A user’s guide to mlwiN Version 2.0. Bristol: centre for multilevel modelling, University of Bristol 2005.
34 woodhouse G. Multilevel modelling applications. A guide for users of mln. multilevel models project, Institute of Education London: University of London 1996.
35 Geyer S, Hemstrom O, peter R, et al. Education, income, and occupational class cannot be used interchangeably in social epidemiology. Empirical evidence against a common practice. J Epidemiol Community Health 2006;60:804-10.
36 Little RJA, Rubin DB. Statistical Analysis with missing data. New Jersey: wiley 2002.37 Statistical package for Social Sciences version 11. chicago, IL: SpSS 1999.38 Baron Rm, Kenny DA. The moderator-mediator variable distinction in social psycho-
logical research: conceptual, strategic, and statistical considerations. J Pers Soc Psychol 1986;51:1173-82.
39 Droomers m, Schrijvers cT, van de mheen H, et al. Educational differences in lei-sure-time physical inactivity: a descriptive and explanatory study. Soc Sci Med 1998;47:1665-76.
Kamphuis_09.indd 117 20-8-2008 10:34:38

118 Part II Socioeconomic status, environmental factors and physical activity
40 Lindstrom m, Hanson BS, Ostergren pO. Socioeconomic differences in leisure-time physical activity: the role of social participation and social capital in shaping health related behaviour. Soc Sci Med 2001;52:441-51.
41 marshall SJ, Jones DA, Ainsworth BE, et al. Race/ethnicity, social class, and leisure-time physical inactivity. Med Sci Sports Exerc 2007;39:44-51.
42 Kamphuis cBm, Giskes K, Kavanagh Am, et al. Area variation in recreational cycling in melbourne: a compositional or contextual effect? jech (in press).
43 Kamphuis cBm, Van Lenthe FJ, Giskes K, et al. Socioeconomic status, environmental and individual factors, and sports participation. Med Sci Sports Exerc 2008;40:71-81.
45 Brassington GS, Atienza AA, perczek RE, et al. Intervention-related cognitive versus social mediators of exercise adherence in the elderly. Am J Prev Med 2002;23:80-6.
46 prodaniuk TR, plotnikoff Rc, Spence Jc, et al. The influence of self-efficacy and out-come expectations on the relationship between perceived environment and physical activity in the workplace. Int J Behav Nutr Phys Act 2004;1:7.
47 Rhodes RE, courneya KS, Blanchard cm, et al. prediction of leisure-time walking: an integration of social cognitive, perceived environmental and personality factors. Int J Behav Nutr Phys Act 2007;4:doi:10.1186/479-5868-4-51.
48 Krull JL, macKinnon Dp. multilevel modeling of individual and group level mediated effects. Multivariate Behavioral Research 2001;36:249-77.
Kamphuis_09.indd 118 20-8-2008 10:34:38

7
Kamphuis CBm, mackenbach jP, Giskes K, Huisman m, Brug j, Van Lenthe Fj. why do poor people perceive poor neighbourhoods? Explaining socioeconomic differences in neighbourhood perceptions with objective neighbourhood features and psychosocial characteristics (submitted to Health & Place)
Why do poor people perceive poor neighbourhoods? Explaining socioeconomic differences in neighbourhood perceptions with objective neighbourhood features and psychosocial characteristics
Kamphuis_09.indd 119 20-8-2008 10:34:38

120 Part II Socioeconomic status, environmental factors and physical activity
Abstract
Background people with a lower socioeconomic status (SES) are more likely to perceive their neighbourhood as unattractive or unsafe, which is associated with lower levels of physical activity. This study investigates to what extent socioeconomic differences in neighbourhood perceptions can be explained by objective neighbourhood characteristics, and to what extent neighbourhood social factors and psychosocial characteristics play a role in these perceptions.
Methods Two outcome variables are studied: perceived neighbourhood safety and perceived neighbourhood attractiveness. In a postal survey, residents (N=814) of fourteen neighbourhoods in the city of Eindhoven (the Netherlands) reported their socioeconomic characteristics (household income and education), social neighbourhood factors (social network, social cohesion), psychosocial factors (depressed/nervousness, negative life events, self-assessed health) as well as perceptions of neighbourhood attractiveness and safety. Neighbourhood audits objectively assessed aesthetic, design, traffic safety, social safety, and destina-tion features of neighbourhoods.
Results compared to higher income groups, those with the lowest incomes were most likely to perceive their neighbourhood as unattractive (OR 1.75 (95% cI, 0.85-3.58)) and unsafe (OR 2.97 (95% cI, 1.55-5.67)). These socioeconomic gradients were partly explained by objective neighbourhood characteristics, and partly by self-reported social neighbourhood cohesion and psychosocial factors.
Conclusions Unfavourable neighbourhood perceptions of low SES-groups partly reflect their actual less appealing and less safe neighbourhoods, and partly their perceptions of low social cohesion and a depressed mood. To yield a maxi-mal improvement of neighbourhood perceptions among lower socioeconomic groups, environmental change strategies, for instance, improving neighbour-hood aesthetics and traffic safety, would need to be combined with social com-munity interventions, and individual level interventions. Ultimately, improved neighbourhood perceptions and truly ‘better’ neighbourhoods may increase residents’ physical activity.
Kamphuis_09.indd 120 20-8-2008 10:34:38

1217 why do poor people perceive poor neighbourhoods?
Introduction
An increasing number of studies confirms that elements of the physical envi-ronment are important for physical activity. Residents’ perceptions of their local area, such as perceived neighbourhood aesthetics and perceived safety, are associated with a wide range of physical activities [1-3], and contribute to the explanation of socioeconomic inequalities in physical inactivity [4-7]. These findings imply that effectively changing these perceptions especially among lower socioeconomic groups, may contribute to an increase of physical activity and/or a reduction in socioeconomic inequalities in physical inactivity. However, little is known about the determinants of environmental perceptions relevant for physical activity.
Studies that have investigated neighbourhood perceptions in association with physical activity often assume – either implicitly or explicitly- that these per-ceptions reflect actual, objective neighbourhood circumstances. Indeed, objec-tive neighbourhood factors have found to be associated with physical activity [8-11], and to contribute to socioeconomic variations in physical activity [6, 12]. However, other studies that have investigated the level of agreement between objective and perceived environmental factors, found this agreement to be moderate or low [13-18]. This suggests that factors other than the objec-tive neighbourhood environment may play a role in the formation of residents’ perceptions.
The scarce evidence of the determinants of these perceptions mainly relates to (1) demographic factors, (2) perceptions of the social neighbourhood environ-ment, (3) self-assessed health, and (4) depressed mood. women, older people, and people with a lower socioeconomic status express feelings of unsafety, disorder, and neighbourhood problems more so than their male, younger and higher status counterparts [19-23]. Indicators of the social neighbourhood environment, such as social capital (i.e. taking part in activities of formal and informal groups in society) and social/community involvement, have shown strong inverse associations with fear of crime, sense of insecurity and perceived disorder [20-23]. Also, poor self-assessed health has shown associations with increased feelings of unsafety [20, 21, 24], as people with poorer health expe-rience increased physical vulnerability, or may be more likely to be negative about life in general [19]. Similarly, people with a pessimistic world view or depressed mood may be more likely to report their neighbourhoods as being poor [19] [20]. As low social capital [25], poor health, and a pessimistic world view [26] and have been found more prevalent in lower than higher socioeco-nomic groups, these factors may play a role in socioeconomically disadvantaged groups perceiving their neighbourhood as less attractive and less safe.
Kamphuis_09.indd 121 20-8-2008 10:34:38

122 Part II Socioeconomic status, environmental factors and physical activity
Thus, up till now, there is little empirical evidence on correlates of neighbour-hood perceptions, and even less on the relative contribution of objective neigh-bourhood and other factors to the explanation of socioeconomic differences in these neighbourhood perceptions. Since perceived neighbourhood aesthet-ics and perceived safety have shown rather consistent associations with several physical activity outcomes [2, 27], and also to contribute to socioeconomic inequalities in physical inactivity [4-6], we selected these two neighbourhood perceptions to investigate which factors should be targeted to change percep-tions. In this present paper, our main aim is to examine to what extent socioeco-nomic variations in perceived neighbourhood unattractiveness and perceived unsafety can be explained by five domains of objective features (i.e. design, traffic safety, social safety, aesthetics, and destinations), and to what extent other factors, such as the social neighbourhood environment and psychosocial factors, contribute to this explanation (see Figure 1). Secondly, as the design of this study demands a multilevel analysis, we will also consider neighbourhood variance in perceptions and investigate whether these neighbourhood differ-ences can be explained by objective characteristics or other factors. Research questions that will be addressed are:
1. Are lower socioeconomic groups more likely to perceive their neighbourhood as unattractive and unsafe?
2. which objective neighbourhood characteristics, neighbourhood social char-acteristics and residents’ psychosocial characteristics are associated with perceptions of neighbourhood unattractiveness and unsafety?
3. which factors can explain socioeconomic differences and neighbourhood differences in perceived neighbourhood attractiveness and safety?
Figure 7.1 Conceptual framework
SES
Demographics (e.g. age, sex)
Objective neighbourhood factors
Perceived social neighbourhood factorsPsychosocial factors
Perceived unattractivenessPerceived unsafety
Kamphuis_09.indd 122 20-8-2008 10:34:39

1237 why do poor people perceive poor neighbourhoods?
Methods
Study populationData were obtained by a large-scale postal survey, a component of the new wave of data collection for the longitudinal GLOBE study, among a stratified sample of the adult population (age 25-75 years) of Eindhoven (the fifth largest city in the Netherlands) and surrounding cities in October 2004 (N=6377; response rate 62%). more about the objectives, design and results of the GLOBE study can be found in detail elsewhere [28, 29]. we selected postal survey partici-pants residing in seven of the most deprived and seven of the most advantaged neighbourhoods of the city of Eindhoven (N=814). participants with missing values for education, household income, age or sex were excluded from the analyses (n=81), which resulted in an analytic sample of 733 participants (mean number of participants per neighbourhood: n= 53, range 16-85). Demographic characteristics of the total GLOBE sample of 2004 and the analytic sample are provided in Table 1. This table shows that the demographic structure of the total sample and selected sample are comparable.
MeasurementsSocioeconomic status (SES), demographic characteristics, possible explanatory factors (psychosocial factors and social neighbourhood factors), and perceived neighbourhood attractiveness and safety were measured in the GLOBE postal survey in October 2004. Objective neighbourhood characteristics were mea-sured during field observations in February 2006. The measures are described below, in order of appearance in Figure 1 (from left to right).
Socioeconomic status and demographic factorsEducational attainment is only one component of the broad concept of SES, but is considered a good indicator for SES in the Netherlands [30]. Four levels of education were distinguished: (1) no education or primary education; (2) lower professional and intermediate general education; (3) intermediate pro-fessional and higher general education; (4) higher professional education and university. we also measured household income as SES-indicator, asking par-ticipants to report their net monthly household income by selecting one out of five response categories: 0-1200 euro, 1200-1800 euro, 1800-2600 euro, 2600 euro or more, and ‘don’t want to say / don’t know’. Analyses were con-trolled for demographic factors that may act as confounders in the association between SES and neighbourhood perceptions, i.e. age (categorised in ten-years age groups), sex, country of origin (Netherlands, other country), marital status (married, unmarried/divorced/widowed), and employment status (employed, unemployed/non-active).
Kamphuis_09.indd 123 20-8-2008 10:34:39
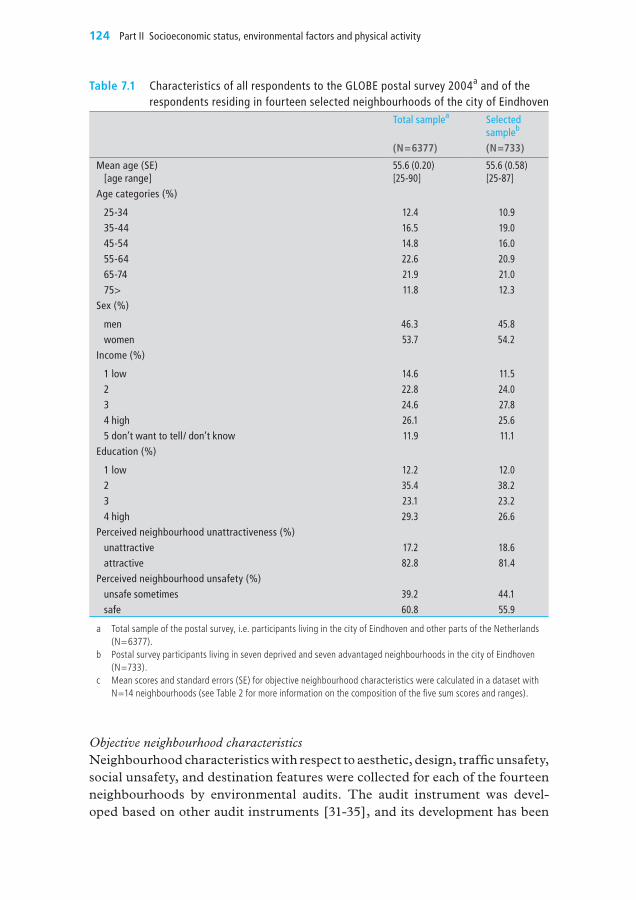
124 Part II Socioeconomic status, environmental factors and physical activity
Table 7.1 Characteristics of all respondents to the GLoBE postal survey 2004a and of the respondents residing in fourteen selected neighbourhoods of the city of Eindhoven
Total samplea Selected sampleb
(N=6377) (N=733)
mean age (SE)[age range]
55.6 (0.20)[25-90]
55.6 (0.58)[25-87]
Age categories (%)
25-34 12.4 10.935-44 16.5 19.045-54 14.8 16.055-64 22.6 20.965-74 21.9 21.075> 11.8 12.3
Sex (%)
men 46.3 45.8women 53.7 54.2
Income (%)
1 low 14.6 11.52 22.8 24.03 24.6 27.84 high 26.1 25.65 don’t want to tell/ don’t know 11.9 11.1
Education (%)
1 low 12.2 12.02 35.4 38.23 23.1 23.24 high 29.3 26.6
Perceived neighbourhood unattractiveness (%)unattractive 17.2 18.6attractive 82.8 81.4
Perceived neighbourhood unsafety (%)unsafe sometimes 39.2 44.1safe 60.8 55.9
a Total sample of the postal survey, i.e. participants living in the city of Eindhoven and other parts of the Netherlands (N=6377).
b Postal survey participants living in seven deprived and seven advantaged neighbourhoods in the city of Eindhoven (N=733).
c mean scores and standard errors (SE) for objective neighbourhood characteristics were calculated in a dataset with N=14 neighbourhoods (see Table 2 for more information on the composition of the five sum scores and ranges).
Objective neighbourhood characteristicsNeighbourhood characteristics with respect to aesthetic, design, traffic unsafety, social unsafety, and destination features were collected for each of the fourteen neighbourhoods by environmental audits. The audit instrument was devel-oped based on other audit instruments [31-35], and its development has been
Kamphuis_09.indd 124 20-8-2008 10:34:39

1257 why do poor people perceive poor neighbourhoods?
described in more detail elsewhere [36]. For each neighbourhood, 10% of the total number of streets in the neighbourhood was randomly selected, resulting in 75 streets to be audited. Thirty of the 75 selected streets were audited by two observers independently, in order to estimate inter-rater reliability afterwards (observers did not know which streets would be audited twice). The 105 street observations were conducted by four trained observers.
Inter-rater reliability of each item of the instrument was calculated by using the percentage agreement between two observers (consensus score), as described by Stemler [37]. percent agreement for each specific item was calculated by adding up the number of cases that received the same rating by both observers and dividing that number by the total number of cases rated by the two observ-ers. Inter-rater reliability was moderate to good, with only five items with a low reliability (i.e. <0.7), and these were excluded from the analyses. The average reliability over the fifty-five remaining items was 84% [36].
Specific audit items measured five domains of objective neighbourhood char-acteristics that are hypothesized to influence physical activity (based on the framework of pikora and colleagues [38, 39]), i.e. aesthetics, design, traffic unsafety, social unsafety, and destinations. Audit scores of all items belonging to a specific domain were summed, and the mean street-level sum scores for each of the five domains were aggregated to the neighbourhood-level, resulting in a database with scores for N=14 neighbourhoods. Table 2 shows the specific items that were summed in each sum score, the reliability of the items and whether the mean sum scores for each domain differed significantly between the fourteen neighbourhoods. Sum scores were dichotomised for analytic pur-poses. Dichotomised sum scores for each neighbourhood were merged with the resident-level (postal survey) data.
Neighbourhood social environmentTen items asked about neighbourhood social relationships (on a five-point Likert scale: totally agree - totally disagree) (α = .85), and factor analyses showed two factors underlying these items. we labelled the first factor ‘social cohesion’, i.e. “the extent of connectedness and solidarity among groups in society” [40]. Items that loaded on this factor were e.g. ‘people in this neigh-bourhood agree on norms and values’, ‘people in this neighbourhood are will-ing to help each other’, and ‘people in this neighbourhood can be trusted’. The second factor was labelled ‘social network’ (i.e. “the presence and nature of interpersonal relationships and interactions; extent to which one is intercon-nected and embedded in a community” [41]), representing items such as ‘I borrow things from my neighbours’, ‘I visit my neighbours in their home’, and ‘I can ask my neighbours for advice’. For analytical purposes, each factor score was classed into tertiles.
Kamphuis_09.indd 125 20-8-2008 10:34:39
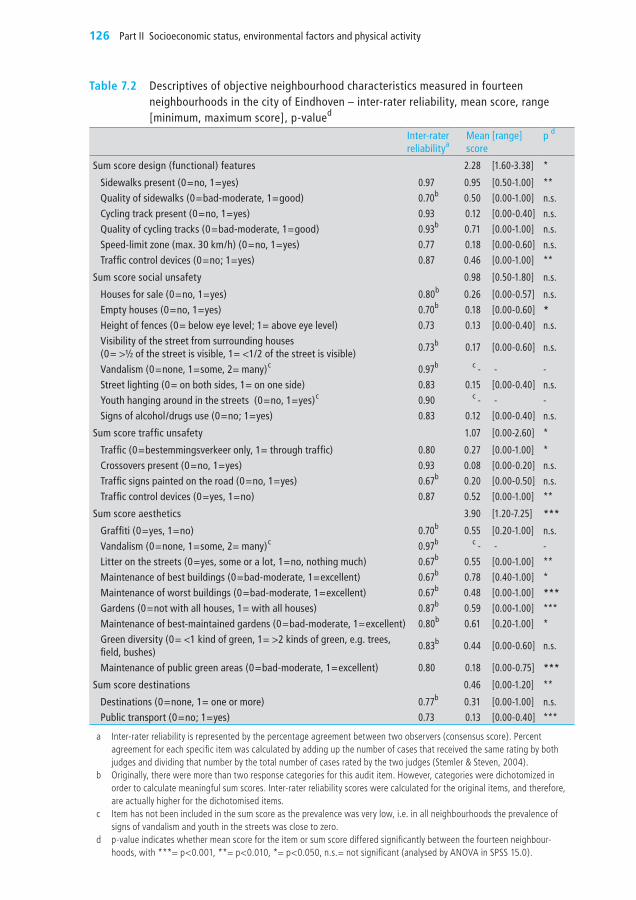
126 Part II Socioeconomic status, environmental factors and physical activity
Table 7.2 Descriptives of objective neighbourhood characteristics measured in fourteen neighbourhoods in the city of Eindhoven – inter-rater reliability, mean score, range [minimum, maximum score], p-valued
Inter-raterreliabilitya
meanscore
[range] p d
Sum score design (functional) features 2.28 [1.60-3.38] *
Sidewalks present (0=no, 1=yes) 0.97 0.95 [0.50-1.00] **Quality of sidewalks (0=bad-moderate, 1=good) 0.70b 0.50 [0.00-1.00] n.s.Cycling track present (0=no, 1=yes) 0.93 0.12 [0.00-0.40] n.s.Quality of cycling tracks (0=bad-moderate, 1=good) 0.93b 0.71 [0.00-1.00] n.s.Speed-limit zone (max. 30 km/h) (0=no, 1=yes) 0.77 0.18 [0.00-0.60] n.s.Traffic control devices (0=no; 1=yes) 0.87 0.46 [0.00-1.00] **
Sum score social unsafety 0.98 [0.50-1.80] n.s.
Houses for sale (0=no, 1=yes) 0.80b 0.26 [0.00-0.57] n.s.Empty houses (0=no, 1=yes) 0.70b 0.18 [0.00-0.60] *Height of fences (0= below eye level; 1= above eye level) 0.73 0.13 [0.00-0.40] n.s.Visibility of the street from surrounding houses(0= >½ of the street is visible, 1= <1/2 of the street is visible)
0.73b 0.17 [0.00-0.60] n.s.
Vandalism (0=none, 1=some, 2= many)c 0.97b c - - -Street lighting (0= on both sides, 1= on one side) 0.83 0.15 [0.00-0.40] n.s.Youth hanging around in the streets (0=no, 1=yes)c 0.90 c - - -Signs of alcohol/drugs use (0=no; 1=yes) 0.83 0.12 [0.00-0.40] n.s.
Sum score traffic unsafety 1.07 [0.00-2.60] *
Traffic (0=bestemmingsverkeer only, 1= through traffic) 0.80 0.27 [0.00-1.00] *Crossovers present (0=no, 1=yes) 0.93 0.08 [0.00-0.20] n.s.Traffic signs painted on the road (0=no, 1=yes) 0.67b 0.20 [0.00-0.50] n.s.Traffic control devices (0=yes, 1=no) 0.87 0.52 [0.00-1.00] **
Sum score aesthetics 3.90 [1.20-7.25] ***
Graffiti (0=yes, 1=no) 0.70b 0.55 [0.20-1.00] n.s.Vandalism (0=none, 1=some, 2= many)c 0.97b c - - -Litter on the streets (0=yes, some or a lot, 1=no, nothing much) 0.67b 0.55 [0.00-1.00] **maintenance of best buildings (0=bad-moderate, 1=excellent) 0.67b 0.78 [0.40-1.00] *maintenance of worst buildings (0=bad-moderate, 1=excellent) 0.67b 0.48 [0.00-1.00] ***Gardens (0=not with all houses, 1= with all houses) 0.87b 0.59 [0.00-1.00] ***maintenance of best-maintained gardens (0=bad-moderate, 1=excellent) 0.80b 0.61 [0.20-1.00] *Green diversity (0= <1 kind of green, 1= >2 kinds of green, e.g. trees, field, bushes)
0.83b 0.44 [0.00-0.60] n.s.
maintenance of public green areas (0=bad-moderate, 1=excellent) 0.80 0.18 [0.00-0.75] ***
Sum score destinations 0.46 [0.00-1.20] **
Destinations (0=none, 1= one or more) 0.77b 0.31 [0.00-1.00] n.s.Public transport (0=no; 1=yes) 0.73 0.13 [0.00-0.40] ***
a Inter-rater reliability is represented by the percentage agreement between two observers (consensus score). Percent agreement for each specific item was calculated by adding up the number of cases that received the same rating by both judges and dividing that number by the total number of cases rated by the two judges (Stemler & Steven, 2004).
b Originally, there were more than two response categories for this audit item. However, categories were dichotomized in order to calculate meaningful sum scores. Inter-rater reliability scores were calculated for the original items, and therefore, are actually higher for the dichotomised items.
c Item has not been included in the sum score as the prevalence was very low, i.e. in all neighbourhoods the prevalence of signs of vandalism and youth in the streets was close to zero.
d p-value indicates whether mean score for the item or sum score differed significantly between the fourteen neighbour-hoods, with ***= p<0.001, **= p<0.010, *= p<0.050, n.s.= not significant (analysed by ANOvA in SPSS 15.0).
Kamphuis_09.indd 126 20-8-2008 10:34:39

1277 why do poor people perceive poor neighbourhoods?
Psychosocial factorsSelf-assessed health was measured with the question “How is your health in general?” (excellent, very good, good, moderate, poor). Response categories were taken together in two groups: excellent-good, vs. less than good. The SF-12 mental Health index was used as a measure of depressiveness and ner-vousness, consisting of five items such as “Did you feel down and depressed?” and “Did you feel nervous?”, with six response categories ranging from con-stantly till never. The five items were summarised in a sum score, and the sum score was dichotomised in low and high depressed mood. For a list of nine stressful life events (e.g. job loss, divorce, significant other deceased), each respondent reported whether he/she had experienced this life event in the last year (yes/no). Responses were summed, and the sum score was divided in three groups: no life events, one life event, two or more life events.
Outcome measures: perceived neighbourhood unattractiveness and unsafetywe investigated two outcome measures: perceived neighbourhood unattrac-tiveness and perceived unsafety. perceived neighbourhood unattractiveness was measured by one item: “my neighbourhood is unattractive for physical activity” (yes, no). perceived neighbourhood unsafety was measured with three items: “Sometimes I’m afraid to go out on the streets in my neighbourhood at night time”, “Sometimes I’m afraid to go out on the streets in my neighbour-hood in the daytime”, “Sometimes I’m afraid to be home alone at night time” (0=disagree, 1=don’t agree/don’t disagree, 2=agree). Scores on these three items were summed, and a sum score of 0 was labelled “feeling safe”, a sum score of 1> was labelled “sometimes feeling unsafe”.
Statistical analysesExploratory analyses were conducted in SpSS version 11.0 [42]. Firstly, we tested bivariate and multivariate associations of SES-indicators and demo-graphic characteristics with perceived neighbourhood unattractiveness and perceived neighbourhood unsafety. Then, we examined bivariate and multi-variate associations of the explanatory factors (objective neighbourhood char-acteristics, social neighbourhood factors, and psychosocial factors) with both of the outcome variables. Factors that remained significant in the multivariate models were included in the following multilevel modelling sequence.
perceived neighbourhood unattractiveness was modelled as a binary outcome variable in logistic regression models of participants (level 1) nested within neighbourhoods (level 2). To take into account the hierarchical nature of the data, multilevel analyses were done in mLwiN version 2.02 (using the logit-link function and 2nd order pQL estimation methods) [43]. Firstly, we calcu-lated the odds ratios (ORs) for perceived neighbourhood unattractiveness by SES group, adjusted for demographics only (model 1). Secondly, we included objective neighbourhood factors (model 2), and thirdly, we added social neigh-
Kamphuis_09.indd 127 20-8-2008 10:34:39

128 Part II Socioeconomic status, environmental factors and physical activity
bourhood and psychosocial factors to the model (model 3). The reduction in ORs for perceived neighbourhood unattractiveness was interpreted as the con-tribution of the specific factors included in the model to the explanation of socioeconomic inequalities in perceived neighbourhood unattractiveness. The modelling sequence was then repeated with perceived neighbourhood unsafety as binary outcome variable.
multilevel models not only account for the structure of data, with participants residing in neighbourhoods, but also provide a measure of the importance of the neighbourhood-level influence on the outcome of interest. This measure is referred to as neighbourhood-level variance or between-neighbourhood vari-ance, which can be used to calculate measures of clustering [44]. clustering of perceived unattractiveness and perceived unsafety within neighbourhoods was determined by calculating the median odds ratio (mOR) with 95% credible intervals (crL), using the posterior distribution of the neighbourhood variance as provided by the markov chain monte carlo (mcmc) procedure in mlwiN [45]. The mOR was computed with the following formula [44]:
mOR
= exp[√(2 x neighbourhood variance) x 0.6745≈ exp (0.95√neighbourhood variance)
An mOR of 1.50, for instance, can be interpreted as follows: if a person moves to another neighbourhood where residents have a higher probability to perceive their neighbourhood as unsafe, his individual odds to perceive the neighbour-hood as unsafe will have a median increase of 1.5 times [44].
we examined neighbourhood level variance and the mOR for the so called “empty” model or null model, i.e. including no explanatory factors, and then for subsequent models, including explanatory factors. The contribution of explanatory factors to neighbourhood level variance in perceived neighbour-hood unattractiveness and perceived unsafety was assessed by reductions in the mOR in the models 1 to 3. when differences between neighbourhoods are seen to diminish when objective neighbourhood characteristics are included in the model (i.e. shown by a reduction of the neighbourhood level variance and mOR), it can be concluded that objective characteristics contribute to the explanation of neighbourhood differences in perceived unattractiveness and unsafety.
Results
Associations of neighbourhood perceptions with SES and demographic characteristicsIn bivariate analyses (results not shown), age, employment status, and coun-try of origin were not related to perceptions of neighbourhood unattractive-ness. Being male, unmarried, having a lower household income, and having
Kamphuis_09.indd 128 20-8-2008 10:34:40

1297 why do poor people perceive poor neighbourhoods?
a lower education were associated with an increased likelihood of perceiving the neighbourhood as unattractive. when these four demographic character-istics were taken into account in a multilevel model, only household income and sex remained significantly associated with neighbourhood unattractiveness (therefore, all subsequent models were sex-adjusted, and household income was chosen as SES-indicator). As presented in Figure 2, the lowest income group had an odds of 1.75 (95% cI: 0.85-3.58) to perceive their neighbour-hood as unattractive, compared to the highest income group (although differ-ences between income groups fell short of significance).
Figure 7.2 odds ratios (oRs) for perceived neighbourhood unattractiveness and unsafety by SES (i.e. household income) (adjusted for demographic characteristics)
0
1
2
3
4
5
6
7
8
= ORs for perceived neighbourhood unattractiveness
= ORs for perceived neighbourhood unsafety
1-lowSES
2 3 4-highSES
country of origin and marital status were not associated with perceived neigh-bourhood unsafety, whereas women, elderly, unemployed, those with lower incomes, and lower levels of education were significantly more likely to per-ceive their neighbourhood as unsafe in bivariate analyses (results not shown). Only household income, age, and sex remained significant in the multivariate model (therefore age and sex were taken into account in subsequent models, and household income was chosen as SES-indicator). Low income residents were more likely to perceive their neighbourhoods as unsafe (OR=2.97 (95% cI: 1.55-5.67) (see Figure 2).
Kamphuis_09.indd 129 20-8-2008 10:34:40

130 Part II Socioeconomic status, environmental factors and physical activity
Table 7.3 Adjusted odds ratios (oR) for perceptions of neighbourhood unattractiveness and neighbourhood unsafety by objective neighbourhood characteristics, social neighbourhood factors, and psychosocial factors
Perception that neighbourhood is unattractive (vs. attractive)
Perception that neighbourhood is unsafe (vs. safe)
Adjusted oRa (95% CI) p Adjusted oRc (95% CI) p
objective neighbourhood characteristics
neighbourhood design score
high 1.00 .385 1.00 .090
low 1.19 (0.81-1.76) 1.33 (0.96-1.86)
Social unsafety score
low 1.00 .217 1.00 .594
high 0.79 (0.54-1.15) 1.10 (0.78-1.53)
Traffic unsafety score
low 1.00 .003 1.00 .005
high 1.83 (1.24-2.71) 1.55 (1.10-2.17)
Aesthetics score
high 1.00 .000 1.00 .000
low 3.17 (2.05-4.91) 1.94 (1.38-2.73)
Destination score
low 1.00 .001 1.00 .217
high 1.96 (1.33-2.92) 1.23 (0.88-1.72)
Social neighbourhood factors
Social network (visiting neighbours in home, asking neighbours advice)
large 1.00 .295 1.00 .231
moderate 1.18 (0.72-1.93) 1.40 (0.93-2.10)
small 1.46 (0.90-2.35) 1.32 (0.88-1.98)
Social cohesion (trust in neighbours, neighbours share norms & values)
high 1.00 .004 1.00 .000
medium 1.29 (0.75-2.19) 1.21 (0.79-1.85)
low 2.17 (1.32-3.57) 2.66 (1.74-4.06)
Psychosocial factors
Self-assessed health
Excellent - good 1.00 .168 1.00 .029
moderate - poor 1.40 (0.87-2.28) 1.66 (1.07-2.58)
Depressed mood score
Low 1.00 .004 1.00 .000
High 1.80 (1.21-2.67) 2.45 (1.75-3.42)
negative life events in the last year
none 1.00 .412 1.00 .014
1 life event 1.14 (0.73-1.81) 0.76 (0.51-1.12)
2> life events 1.38 (0.86-2.21) 1.52 (0.99-2.32)
a Odds ratios were adjusted for household income and sex b Odds ratios were adjusted for household income, age, and sex
Kamphuis_09.indd 130 20-8-2008 10:34:40

1317 why do poor people perceive poor neighbourhoods?
Associations of objective neighbourhood characteristics with neighbourhood perceptionsLow scores for objective aesthetics and high scores for objective traffic unsafety and destinations were associated with perceptions of the neighbourhood as unattractive – objective aesthetics and objective traffic unsafety were also asso-ciated with an increased likelihood to perceive the neighbourhood as unsafe (Table 3). compared to the highest SES group, participants from lower SES groups were more likely to reside in neighbourhoods with higher scores for traffic unsafety, lower scores for neighbourhood aesthetics, and more desti-nations (not shown). The other objective characteristics, design and social unsafety, were not associated with perceived unattractiveness or with perceived unsafety. Taking all objective neighbourhood characteristics into account, traf-fic unsafety, aesthetics and destination scores remained independently asso-ciated with perceived unattractiveness (adjusted for SES and sex), and only aesthetics remained significant in the multivariate model for perceived unsafety (adjusted for SES, sex and age).
Associations of social neighbourhood and psychosocial factors with neighbourhood perceptionsparticipants experiencing low social cohesion in their neighbourhood were also more likely to perceive their neighbourhoods as unattractive and unsafe (Table 3), and this was most often reported by the lowest SES group (not shown). perceived social network was not associated with neighbourhood perceptions, nor with SES. Depressed mood was the only psychosocial factor significantly associated with perceived neighbourhood unattractiveness (Table 3).
All three psychosocial factors showed significant associations with perceived unsafety, with those in moderate-poor health, those with a depressed mood, and those having experienced two or more negative life events in the last year, more likely to perceive their neighbourhood as unsafe. Unfavourable psychoso-cial factors were more prevalent among low than high SES groups (not shown). when all psychosocial factors were entered in a model for explaining perceived unsafety, only depressed mood and stressful life events remained significant.
Kamphuis_09.indd 131 20-8-2008 10:34:40

132 Part II Socioeconomic status, environmental factors and physical activity
Table 7.4 multilevel logistic regression modelsa, with odds ratios and 95% confidence intervals (oR, 95% CI) for perceived neighbourhood unattractiveness, by household income
model 0(empty model)
model 1:income + sex
model 2:income + sex+ objective neighbourhoodfactors
model 3:income + sex+ objectiveneighbourhood+ socialneighbourhood+ psychosocial factors
oR (95% CI) oR (95% CI) oR (95% CI)
Income % perceived neighbourhoodas unattractive
1 - low (n= 82) 29.8 1.75 (0.85-3.58) 1.50 (0.77-2.93)33%b
1.14 (0.57-2.25)81%
2 - (n=176) 20.5 1.17 (0.65-2.12) 1.00 (0.56-1.81)100%
0.88 (0.47-1.62)
3 - (n=204) 14.2 0.82 (0.45-1.49) 0.78 (0.43-1.44) 0.69 (0.37-1.30)
4 - high (n=188) 15.4 1.00 1.00 1.00
objective
Traffic unsafety score
Low 1.00 1.00
High 1.65 (0.97-2.78) 1.59 (0.92-2.76)
Aesthetics score
High 1.00 1.00
Low 2.43 (1.49-3.96) 2.53 (1.48-4.31)
Destination score
Low 1.00 1.00
High 1.96 (1.15-3.35) 1.89 (1.03-3.46)
Self-reported
Social neighbourhood cohesion
High 1.00
medium 1.24 (0.72-2.16)
Low 2.18 (1.29-3.69)
Depressed mood score
Low 1.00
High 1.65 (1.08-2.53)
Random effects a
Level-2 variance (SE) 0.556 (0.342) 0.490 (0.309) 0.049 (0.080) 0.056 (0.086)moR (95%CrI) 2.03 (1.45-3.12) 1.94 (1.42-2.94) 1.23 (1.03-1.65) 1.25 (1.03-1.67)
a multilevel models were estimated the markov Chain monte Carlo method implemented in mlwiN version 2.02 (CrI = credible interval; mOr = median odds ratio; SE = standard error).
b The percentages in blue show the reduction in odds ratio (Or) compared to the basic model, per income group. For instance, the reduction in the Or for the lowest income group when adding neighbourhood factors to the first model, is [(1.75-1.50)/(1.75-1.00)] * 100 = 33%.
Kamphuis_09.indd 132 20-8-2008 10:34:40

1337 why do poor people perceive poor neighbourhoods?
Explaining socioeconomic and neighbourhood variations in perceived neighbourhood unattractivenesscompared to model 1 (including income and sex only), the elevated ORs for neighbourhood unattractiveness observed among the lowest income group decreased by 33% when objective neighbourhood factors were added (model 2, Table 4). Adding self-reported social neighbourhood and psychosocial fac-tors (model 3) reduced the ORs for perceived neighbourhood unattractiveness among the lowest income group by 81% to 1.14 (95% cI: 0.57-2.25). In the full model, two objective neighbourhood factors (aesthetics and destinations), and social cohesion and depressed mood remained statistically significant.
Between-neighbourhood variance in perceived neighbourhood unattractive-ness was 0.556 (SE=0.342) (mOR: 2.03 (95%crI 1.45-3.12)) for model 0 (pre-sented in Table 4), and reduced to 0.490 (SE=0.309) (mOR: 1.94 (95%crI 1.42-2.94)) when income and sex were added (model 1), showing that only a small part of the neighbourhood differences in perceived unattractiveness could be attributed to differences in the demographic composition of neigh-bourhoods. conversely, neighbourhood variations were almost completely explained by differences between neighbourhoods in their objective traffic unsafety, aesthetics, and destination scores, as indicated by the vast reduction in between-neighbourhood variance (to 0.049 (SE=0.080); mOR: 1.23 (95% crI 1.03-1.65)) when these characteristics were taken into account (model 2). Neighbourhood social cohesion and psychosocial factors did not contribute to the explanation of neighbourhood differences in perceived neighbourhood unattractiveness (model 3).
Explaining socioeconomic and neighbourhood variations in perceived neighbourhood unsafetyAs presented in Table 5, the odds for perceived neighbourhood unsafety among the lowest compared to the highest income group was attenuated by 11% when objective neighbourhood aesthetics was included in the model (model 2), and with 66% when self-reported social neighbourhood and psychosocial factors were added (model 3). In this full model, one objective neighbourhood factor (aesthetics), and social cohesion and depressed mood remained statistically sig-nificant.
Between-neighbourhood variance in perceived neighbourhood unsafety was 0.342 (SE: 0.215) for the null model, corresponding with an mOR of 1.74 (95%crI 1.34-2.46) (Table 5), and reduced half to 0.160 (SE: 0.128) (mOR: 1.46 (95%crI 1.07-1.94) when income, sex, and age were added (see model 1). The remaining between-neighbourhood variance was largely explained by objective neighbourhood characteristics, as between-neighbourhood variance reduced to 0.043 (SE=0.061)) (mOR: 1.22 (1.03-1.55) when these characteris-
Kamphuis_09.indd 133 20-8-2008 10:34:41

134 Part II Socioeconomic status, environmental factors and physical activity
Table 7.5 multilevel logistic regression modelsa, with odds ratios and 95% confidence intervals (oR, 95% CI) for perceived neighbourhood unsafety, by household income
model 0(empty model)
model 1:income+ sex+ age
model 2:income + sex + age+ objectiveneighbourhood
model 3:income+ sex + age+ objectiveneighbourhood+ socialneighbourhood+ psychosocial factors
oR (95% CI) oR (95% CI) oR (95% CI)
Income % perceived neighbourhood as unsafe sometimes1 - low (n= 82) 64.3 2.97 (1.55-5.67) 2.76 (1.47-5.18)
11%b1.67 (0.85-3.30)66%c
2 - (n=176) 47.2 1.96 (1.12-3.41) 1.82 (1.08-3.08)15%
1.48 (0.87-2.50)50%
3 - (n=204) 46.1 2.19 (1.33-3.61) 2.11 (1.31-3.41)7%
1.83 (1.11-3.01)30%
4 - high (n=188) 24.5 1.00 1.00 1.00
objective
Aesthetics score
High 1.00 1.00
Low 1.94 (1.30-2.91) 1.91 (1.26-2.90)
Self-reported
Social neighbourhood cohesion
High 1.00
medium 1.23 (0.80-1.91)
Low 2.81 (1.80-4.38)
Depressed mood score
Low 1.00
High 2.50 (1.76-3.56)
Stressful life events
none 1.00
1 life event 0.68 (0.44-1.05)
2> life events 1.31 (0.85-2.03)
Random effects a
Level-2 variance (SE) 0.342 (0.215) 0.160 (0.128) 0.043 (0.061) 0.042 (0.055)moR (95%CrI) 1.74 (1.34-2.46) 1.46 (1.07-1.94) 1.22 (1.03-1.55) 1.21 (1.03-1.53)
a multilevel models were estimated the markov Chain monte Carlo method implemented in mlwiN version 2.02 (CrI = credible interval; mOr = median odds ratio; SE = standard error).
b The blue percentages show the reduction in odds ratio (Or) compared to the basic model, per income group. For instance, the reduction in the Or for the lowest income group when adding objective neighbourhood factors to the first model, is [(2.97-2.76)/(2.99-1.00)] * 100 = 11%.
Kamphuis_09.indd 134 20-8-2008 10:34:41
1357 why do poor people perceive poor neighbourhoods?
tics were added to the model (model 2). This shows that neighbourhood varia-tions in perceived unsafety were partly due to differences in neighbourhood composition, and partly to objective differences in neighbourhood aesthetics. Neighbourhood social factors and psychosocial factors did not contribute to the explanation of neighbourhood differences in perceived unsafety (model 3).
Discussion
Our multilevel study among residents of fourteen neighbourhoods in the city of Eindhoven, the Netherlands, showed that low income groups were more likely than high income groups to perceive their neighbourhoods as unattractive and unsafe. These socioeconomic gradients could be partly explained by less favour-able objective neighbourhood characteristics, and partly by self-reported social neighbourhood cohesion and psychosocial factors. Between-neighbourhood variance in perceived unsafety was partly due to compositional and contextual effects, whereas between-neighbourhood variance in perceived neighbourhood unattractiveness was mainly explained by contextual characteristics. Our find-ings suggest that improvements in unfavourable neighbourhood perceptions among lower socioeconomic groups are most likely to be achieved if environ-mental change strategies (e.g. improving neighbourhood aesthetics and traffic safety), would be combined with community interventions to increase resi-dents’ involvement in social processes, and in acknowledgement of residents’ psychosocial circumstances.
Strengths and limitations of the current studyThe relatively large number of neighbourhoods considered in this study and the rather large sample of participants residing in these neighbourhoods (com-pared to similar studies [46, 47]) are two important strengths of this study. It enabled us to apply multilevel modelling techniques, which allows quantifying the importance of the context for forming neighbourhood perceptions. The purposive neighbourhood selection strategy, which increased the likelihood to select neighbourhoods with a contrasting physical lay-out, and the relatively high response rate of participants to the postal survey, are additional strengths of this study.
Although the number of participants residing in the selected fourteen neigh-bourhoods was relatively high compared to similar studies, a limitation of the data was that the socioeconomic differences in perceived neighbourhood unat-tractiveness were no longer significant, whereas they were when we analysed the total sample of participants (see [5, 7]). The low number of respondents in the lowest income group (n=82) may be responsible for the wide confidence interval of the OR for neighbourhood unattractiveness (including the value of 1.00). Because this OR was still rather elevated compared to higher income
Kamphuis_09.indd 135 20-8-2008 10:34:41

136 Part II Socioeconomic status, environmental factors and physical activity
groups, and because previous analyses of the total sample demonstrated that there were significant income inequalities in neighbourhood unattractiveness, we decided to perform the explanatory analyses nonetheless.
Another study limitation was the 1,3 years time period between measurement of neighbourhood perceptions (in the postal survey) and collection of objective neighbourhood characteristics. If results of this study would have shown no contribution of objective neighbourhood data to the explanation of socioeco-nomic and neighbourhood variations in perceptions, we could have argued that this may have been due to different neighbourhood circumstances by the time of the postal survey and the environmental audit. Although this is not the case, and we have no indications that major changes on relevant neighbourhood characteristics occurred over the time period, this limitation still may have underestimated the contribution of objective neighbourhood characteristics to socioeconomic differences in neighbourhood perceptions.
we developed our own environmental audit tool based on existing audit instru-ments. Existing instruments could not simply be applied in our study as they were developed for other purposes and for other countries [31-35]. Inter-rater reliability of the audit instrument was good [36]. However, we are less sure about the construct validity: it is unknown to what extent specific area char-acteristics, i.e. the specific items in the instrument, when taken together in a sum score truly reflected broader constructs of social unsafety, traffic unsafety, design, etc. The selection of specific items for each construct was a well-delib-erated choice, based on an existing theoretical framework [33, 38]. The result that objective neighbourhood aesthetics could partly explain socioeconomic variations in perceived neighbourhood unattractiveness, suggests that, at least for this concept, objective characteristics have been measured that people take into account in perceptions of neighbourhood aesthetics. The finding that objective measures of aesthetics (rather than objective measures of unsafety) explained perceptions of unsafety showed that the objective sum scores for traf-fic unsafety and social unsafety did not include all neighbourhood characteris-tics that people take into account when forming perceptions of unsafety.
Obviously, the cross-sectional nature of the evidence presented does not permit causal inferences to be drawn. Associations between social neighbourhood cohesion and perceived unsafety, for instance, may include pathways in both directions, as perceived unsafety may be a contributor to the detoriation of the social cohesion of a neighbourhood as well [48]. Another limitation was the measurement of perceived neighbourhood unattractiveness with a single item, although this concept may be multidimensional.
Kamphuis_09.indd 136 20-8-2008 10:34:41

1377 why do poor people perceive poor neighbourhoods?
Interpretation of findingswe are aware of only one study which tested other factors in addition to objec-tive environmental characteristics in their explanations of neighbourhood per-ceptions. Sampson and Raudenbusch (2004) showed that objectively rated neighbourhood disorder predicted perceived disorder, but that being part of a strong social neighbourhood network and the neighbourhoods’ racial composi-tion were stronger predictors [23]. This is comparable to our finding that social neighbourhood cohesion was a strong predictor of perceived neighbourhood unsafety, in addition to objective neighbourhood aesthetics. A study testing the association between a range of indicators for community involvement and per-ceived neighbourhood safety, found that only two indicators showed significant associations with perceived safety: trust in neighbours and length of residence [24].
A handful of studies have investigated the level of agreement between perceived and objective neighbourhood factors. A study among 2053 adults found no association between objectively measured density of facilities and self-reported convenience of exercise facilities [8], whereas a more recent study among ado-lescent girls found that the number and proximity of objectively measured facil-ities could predict their perceived access to recreational facilities [49]. Troped and colleagues (2001) found moderate to strong correlations between objective and self-reported measures of respondents’ distance to a particular bikeway, whether they had to cross a busy street to access the bikeway, and whether there was a steep hill on their road to the bikeway [17]. However, results suggested that only the two distance-variables measured similar environmental phenom-ena, whereas the perceived and objective versions of the busy-street- and steep-hill-variables were not measuring the same constructs. Lastly, Kirtland and colleagues (2003) found moderate to low agreement between objective and self-reported neighbourhood factors (cohens’ kappa ranging from 0.19 to 0.37 for seven of the twenty-one environmental items considered, the remaining kappa’s were lower) [14]. most of these results imply that there must be other factors in addition to objective characteristics involved in forming neighbour-hood perceptions, and our study provides an indication of some factors that may be important.
A noteworthy study finding is that a higher destination score (=more destina-tions in the neighbourhood) was associated with negative perceptions of neigh-bourhood attractiveness. One explanation could be that particularly the more inner-city neighbourhoods have many destinations, but that these neighbour-hoods also experience more graffiti, more litter on the street, and less green areas, which would make them less attractive.
Kamphuis_09.indd 137 20-8-2008 10:34:41

138 Part II Socioeconomic status, environmental factors and physical activity
In additional analyses, we compared mean objective neighbourhood scores by neighbourhood deprivation level and found significant differences between advantaged and deprived neighbourhoods for only the aesthetic sum score (p=0.038); objective scores for the other four domains did not differ signifi-cantly between deprived and advantaged neighbourhoods (results not shown). However, as presented in Table 2, when comparing mean sum scores for the five domains of objective characteristics between all fourteen neighbourhoods, scores for four domains did differ significantly between the neighbourhoods, and only the social unsafety sum score did not. This shows that deprived neigh-bourhoods did not necessarily always had worse scores on specific domains, neither had advantaged neighbourhood always most favourable scores. How-ever, overall, the fourteen neighbourhoods in our selection had a contrasting physical lay-out, which could explain a large part of the clustering in neigh-bourhood perceptions (as shown in Table 4 and 5).
Recommendations for future research and policy & practiceRecommendations for future research include the development and validation of environmental audit instruments for the objective assessment of neighbour-hood characteristics. Future research aiming to increase our understanding of how perceptions and objective measures of the environment are related need to take into account how much time people spend in their neighbourhood, and to what extent people ‘use’ their neighbourhood’s facilities (i.e. footpaths, bike paths, green spaces, recreational facilities, shops). people who spend many hours a day in their own neighbourhood, or people that walk to the neighbour-hood’s shop everyday, may have perceptions of their neighbourhood that better reflect actual circumstances [19].
Non-health interventions can play an important role in improving health-related behaviours. Our results suggest that perceived neighbourhood social cohesion is an important predictor of both perceived neighbourhood unattrac-tiveness and unsafety, in combination with objective neighbourhood aesthet-ics. Therefore, interventions that encourage community participation and, for instance, stimulate residents to take some responsibility for the general up-keep of the neighbourhood may improve neighbourhood perceptions. These kind of non-health interventions may act upon health, for example via increasing neighbourhood walking, and may have a longer lasting positive effect on health and health-related behaviours than individual-level interventions stressing that people should become more physically active. On the other hand, our results show that individual psychosocial characteristics may influence neighbour-hood perceptions as well, implying that individual level (psychosocial) support should accompany neighbourhood level strategies.
Kamphuis_09.indd 138 20-8-2008 10:34:41

1397 why do poor people perceive poor neighbourhoods?
ConclusionIt is important to understand to what extent environmental perceptions, which have been found to be related to physical activity [2, 27] and socioeconomic inequalities in physical inactivity [4-6], would improve when the actual envi-ronment would be improved. This study showed that unfavourable neigh-bourhood perceptions of low SES-groups partly reflected their objectively less attractive and less safe neighbourhoods, and partly their perceptions of lower social neighbourhood cohesion and more often having a depressed mood. To yield a maximal improvement of neighbourhood perceptions, among lower socioeconomic groups in particular, environmental change strategies, for instance, improving neighbourhood aesthetics and traffic safety, would need to be combined with community interventions to increase residents’ involvement in social processes, and individual level interventions. Ultimately, improved neighbourhood perceptions and objectively truly ‘better’ neighbourhoods may result in an increase of residents’ physical activity.
Kamphuis_09.indd 139 20-8-2008 10:34:41

140 Part II Socioeconomic status, environmental factors and physical activity
References
1 De Bourdeaudhuij I, Sallis JF, Saelens BE. Environmental correlates of physical activity in a sample of Belgian adults. Am J Health Promot 2003;18:83-92.
2 mccormack G, Giles-corti B, Lange A, et al. An update of recent evidence of the rela-tionship between objective and self-report measures of the physical environment and physical activity behaviours. J Sci Med Sport 2004;7:81-92.
3 Duncan mJ, Spence Jc, mummery wK. perceived environment and physical activ-ity: a meta-analysis of selected environmental characteristics. Int J Behav Nutr Phys Act 2005;2:11.
4 Ball K, Timperio A, Salmon J, et al. personal, social and environmental determinants of educational inequalities in walking: a multilevel study. J Epidemiol Community Health 2007;61:108-14.
5 Kamphuis cBm, Van Lenthe FJ, Giskes K, et al. Socioeconomic variations in recre-ational walking among older adults: mediation of neighbourhood perceptions and indi-vidual cognitions. ijbnpa (under review).
6 Kamphuis cBm, Giskes K, Kavanagh Am, et al. Area variation in recreational cycling in melbourne: a compositional or contextual effect? jech (in press).
7 Kamphuis cBm, Van Lenthe FJ, Giskes K, et al. Socioeconomic status, environmental and individual factors, and sports participation. Med Sci Sports Exerc 2008;40:71-81.
8 Sallis JF, Hovell mF, Hofstetter cR, et al. Distance between homes and exercise facili-ties related to frequency of exercise among San Diego residents. Public Health Rep 1990;105:179-85.
9 Li F, Fisher KJ, Brownson Rc, et al. multilevel modelling of built environment charac-teristics related to neighbourhood walking activity in older adults. J Epidemiol Commu-nity Health 2005;59:558-64.
10 Saelens BE, Sallis JF, Frank LD. Environmental correlates of walking and cycling: find-ings from the transportation, urban design, and planning literatures. Ann Behav Med 2003;25:80-91.
11 Giles-corti B, Broomhall mH, Knuiman m, et al. Increasing walking: how impor-tant is distance to, attractiveness, and size of public open space? Am J Prev Med 2005;28:169-76.
12 Van Lenthe FJ, Brug J, mackenbach Jp. Neighbourhood inequalities in physical inactiv-ity: the role of neighbourhood attractiveness, proximity to local facilities and safety in the Netherlands. Soc Sci Med 2005;60:763-75.
13 Hoehner cm, Brennan Ramirez LK, Elliott mB, et al. perceived and objective environmental measures and physical activity among urban adults. Am J Prev Med 2005;28:105-16.
14 Kirtland KA, porter DE, Addy cL, et al. Environmental measures of physical activity supports: perception versus reality. Am J Prev Med 2003;24:323-31.
15 Giles-corti B, Donovan RJ. Socioeconomic status differences in recreational physical activity levels and real and perceived access to a supportive physical environment. Prev Med 2002;35:601-11.
16 Kweon BS, Ellis cD, Lee Sw, et al. Large-scale environmental knowledge: Investigat-ing the relationship between self-reported and objectively measured physical environ-ments. Environment and Behaviour 2006;38:72-91.
17 Troped pJ, Saunders Rp, pate RR, et al. Associations between self-reported and objective physical environmental factors and use of a community rail-trail. Prev Med 2001;32:191-200.
Kamphuis_09.indd 140 20-8-2008 10:34:41

1417 why do poor people perceive poor neighbourhoods?
18 mcGinn Ap, Evenson KR, Herring AH, et al. Exploring associations between physical activity and perceived and objective measures of the built environment. J Urban Health 2007;84:162-84.
19 Ellaway A, macIntyre S, Kearns A. perceptions of place and health in socially contrast-ing neighbourhoods. Urban Studies 2001;38:2299-316.
20 Green G, Gilbertson Jm, Grimsley mF. Fear of crime and health in residential tower blocks. A case study in Liverpool, UK. Eur J Public Health 2002;12:10-5.
21 Lindstrom m, Lindstrom c, moghaddassi m, et al. Social capital and neo-materialist contextual determinants of sense of insecurity in the neighbourhood: a multilevel analy-sis in Southern Sweden. Health Place 2006;12:479-89.
22 Lindstrom m, merlo J, Ostergren pO. Social capital and sense of insecurity in the neighbourhood: a population-based multilevel analysis in malmo, Sweden. Soc Sci Med 2003;56:1111-20.
23 Sampson RJ, Raudenbush Sw. Seeing disorder: neighbourhood stigma and the social construction of “broken windows”. Social Psychology Quarterly 2004;67:319-42.
24 Funk Lm, Allan DE, chappell NL. Testing the relationship between involvement and perceived neighbourhood safety: a multinomial logit approach. Environment and Behav-iour 2007;39:332-51.
25 Lindstrom m, Hanson BS, Ostergren pO. Socioeconomic differences in leisure-time physical activity: the role of social participation and social capital in shaping health related behaviour. Soc Sci Med 2001;52:441-51.
26 Gallo Lc, matthews KA. Understanding the association between socioeconomic status and physical health: do negative emotions play a role? Psychol Bull 2003;129:10-51.
27 Trost SG, Owen N, Bauman AE, et al. correlates of adults’ participation in physical activity: review and update. Med Sci Sports Exerc 2002;34:1996-2001.
28 Van Lenthe FJ, Schrijvers cT, Droomers m, et al. Investigating explanations of socioeconomic inequalities in health: the Dutch GLOBE study. Eur J Public Health 2004;14:63-70.
29 mackenbach Jp, van de mheen H, Stronks K. A prospective cohort study investigating the explanation of socioeconomic inequalities in health in The Netherlands. Soc Sci Med 1994;38:299-308.
30 Van Berkel-Van Schaik AB, Tax B. Towards a standard operationalisation of socioeconomic status for epidemiological and socio-medical research [in Dutch]. Rijswijk: ministerie van wVc 1990.
31 caughy mO, O’campo pJ, patterson J. A brief observational measure for urban neigh-borhoods. Health Place 2001;7:225-36.
32 Day K, Boarnet m, Alfonzo m, et al. The Irvine-minnesota inventory to measure built environments: development. Am J Prev Med 2006;30:144-52.
33 pikora TJ, Bull Fc, Jamrozik K, et al. Developing a reliable audit instrument to measure the physical environment for physical activity. Am J Prev Med 2002;23:187-94.
34 weich S, Burton E, Blanchard m, et al. measuring the built environment: validity of a site survey instrument for use in urban settings. Health Place 2001;7:283-92.
35 Zenk SN, Schulz AJ, mentz G, et al. Inter-rater and test-retest reliability: methods and results for the neighborhood observational checklist. Health Place 2007;13:452-65.
36 Van Lenthe FJ, Kamphuis cBm, Giskes K, et al. Investigating the contribution of envi-ronmental characteristics to socioeconomic inequalities in health-related behaviour in the GLOBE study: a stepwise study design. bmc Public Health (submitted).
37 Stemler SE. A comparison of consensus, consistency, and measurement approaches to estimating interrater reliability. Practical Assessment, Research & Evaluation 2004;9.
38 pikora T, Giles-corti B, Bull F, et al. Developing a framework for assessment of the environmental determinants of walking and cycling. Soc Sci Med 2003;56:1693-703.
Kamphuis_09.indd 141 20-8-2008 10:34:41

142 Part II Socioeconomic status, environmental factors and physical activity
39 pikora TJ, Giles-corti B, Knuiman mw, et al. Neighborhood environmental factors cor-related with walking near home: Using SpAcES. Med Sci Sports Exerc 2006;38:708-14.
40 Kawachi I, Berkman L. Social cohesion, social capital, and health. In: Berkman L, Kawachi I, eds. Social Epidemiology. New York: Oxford University press 2000.
41 mcNeill LH, Kreuter mw, Subramanian SV. Social environment and physical activity: a review of concepts and evidence. Soc Sci Med 2006;63:1011-22.
42 Statistical package for Social Sciences version 11. chicago, IL: SpSS 1999.43 Rasbash J, Steele F, Browne w, et al. A user’s guide to mlwiN Version 2.0. Bristol: centre
for multilevel modelling, University of Bristol 2005.44 merlo J, chaix B, Ohlsson H, et al. A brief conceptual tutorial of multilevel analysis
in social epidemiology: using measures of clustering in multilevel logistic regression to investigate contextual phenomena. J Epidemiol Community Health 2006;60:290-7.
45 Browne wJ, Rasbash J, Edmond wS. mcmc estimation in mLwiN version 2.0 centre for multilevel modelling, University of Bristol 2005.
46 wen m, Hawkley Lc, cacioppo JT. Objective and perceived neighborhood environ-ment, individual SES and psychosocial factors, and self-rated health: an analysis of older adults in cook county, Illinois. Soc Sci Med 2006;63:2575-90.
47 wood L, Shannon T, Bulsara m, et al. The anatomy of the safe and social suburb: an exploratory study of the built environment, social capital and residents’ perceptions of safety. Health Place 2008;14:15-31.
48 Kawachi I, Kennedy Bp, wilkinson RG. crime: social disorganization and relative deprivation. Soc Sci Med 1999;48:719-31.
49 Scott mm, Evenson KR, cohen DA, et al. comparing perceived and objectively meas-ured access to recreational facilities as predictors of physical activity in adolescent girls. J Urban Health 2007;84:346-59.
Kamphuis_09.indd 142 20-8-2008 10:34:41

Area variations in recreational cycling in Melbourne, Australia: a composition or contextual effect?
8
Kamphuis CBm, Giskes K, Van Lenthe Fj, Kavanagh Am, Thorton LE, Thomas L, Turrell G. Area variations in recreational cycling in melbourne, Australia: a composition or contextual effect? Journal of Epidemiology and Community Health 2008 (in press)
Kamphuis_09.indd 143 20-8-2008 10:34:41

144 Part II Socioeconomic status, environmental factors and physical activity
Abstract
Background The objective of this study is to examine whether compositional and/or contextual area characteristics are associated with area socioeconomic inequalities and between-area differences in recreational cycling.
Methods In a cross-sectional survey in the city of melbourne, Australia, 2349 men and women residing in 50 areas reported their frequency of recreational cycling (58.7% response rate). Objective area characteristics were collected for their residential area by environmental audits or calculated with Geo-graphic Information Systems software. multilevel logistic regression models with cycling for recreational purposes (at least once a month vs. never) as out-come measure, were performed to examine associations between recreational cycling, area socioeconomic level, compositional characteristics (age, sex, edu-cation, occupation), and area characteristics (design, safety, destinations, or aesthetics).
Results After adjustment for compositional characteristics, residents of deprived areas were less likely to cycle for recreation (OR=0.66; 95% cI: 0.43-1.00), and significant between-area differences in recreational cycling were found (median odds ratio: 1.48 (95% crI: 1.24-1.78). Aesthetic characteristics tended to be worse in deprived areas and were the only group of area characteristics that explained some of the area deprivation differences. Safety characteris-tics explained the largest proportion of between-area variation in recreational cycling.
Conclusion creating supportive environments with respect to safety and aes-thetic area characteristics may decrease between-area differences and area deprivation inequalities in recreational cycling, respectively.
Kamphuis_09.indd 144 20-8-2008 10:34:41

1458 Area variations in recreational cycling in melbourne
Introduction
people with a lower socioeconomic status (SES) are less physically active than their higher status counterparts,[1-3] and this has been suggested as one of the explanations for their poorer health and higher mortality rates.[4] mul-tilevel studies have documented that disparities in physical activity also exist according to area socioeconomic deprivation (area SES), even after adjustment for individual SES.[2, 5-7] These findings suggest that deprived areas may be disadvantaged with respect to area characteristics that influence physical activ-ity, independently of the characteristics of the people living in these areas (i.e. contextual vs. compositional effects).[8-9]
The mechanisms underlying area effects on physical activity are not well understood. Often, multilevel studies have been criticized because they tend to be driven by what data are available (i.e. routinely collected data, or individual-level data aggregated to the area level) rather than objectively and systemati-cally collected environmental characteristics. more theory-driven analyses are needed that link environmental features to specific types of physical activity (e.g. presence of cycle paths with cycling for transport).[10, 11]
cycling is a moderately intense type of physical activity that, compared to more vigorous forms of exercise, can be incorporated into one’s daily routine relatively easy, for multiple purposes (i.e. recreation, transportation), and at relatively low cost.[12] However, in most developed countries the prevalence of cycling is low – e.g. only 8% and 3% of Australian adults cycle at least once a week for recreation and transport, respectively.[13] meanwhile, in some European countries, cycling levels are much higher (in the Netherlands, for instance, 13% and 69% of adults cycle for recreation and transport at least once a week, respectively (Kamphuis and Van den Broek (in preparation). Time use of the Dutch in a European perspective (working title). Den Haag: Scp), suggesting there are significant opportunities to increase cycling. As small environmental changes may have the potential to lead to substantial and sustainable increases in cycling rates, it is important to understand which area level factors should be the target of public health action.
current evidence of area influences on cycling mainly comes from the plan-ning and transportation literature and therefore concentrates on cycling for transport.[12, 14-16] A review study of area influences on cycling for transport concluded that bike-friendly neighbourhoods are characterized by high popu-lation density, a good mixture of land use (i.e., providing different types of des-tinations to cycle to, including residential, office, retail/commercial, and public space), high connectivity of streets (i.e., providing different cycling routes), and adequate design (e.g. continuous bike tracks/lanes).[17] However, evidence about how these factors relate to between-area variation in recreational cycling or to area deprivation inequalities in cycling is limited.[7, 18]
Kamphuis_09.indd 145 20-8-2008 10:34:41

146 Part II Socioeconomic status, environmental factors and physical activity
pikora and colleagues have previously postulated a framework that includes specific design, safety, destinations and aesthetic characteristics which may influence walking and cycling levels.[19] we examine the extent to which these characteristics explain area deprivation inequalities and between-area varia-tion in recreational cycling, beyond compositional characteristics (i.e. age, sex, education, and occupation).
Methods
This study used data from the Victorian Lifestyle and Neighbourhood Envi-ronments Study (VicLANES), conducted in melbourne, Australia, in 2003. The aim of VicLANES is to examine associations between environmental fac-tors and socioeconomic inequalities in physical activity, dietary behaviour and alcohol consumption. The study sample included 2349 people residing in 50 census collector districts (ccDs), with a median of 47 respondents per ccD (range 12–92). Further details of the study design and methodology have been reported elsewhere. [6]
Sample areas and populationThe study was conducted in an area extending about 20 kilometres from the central business district in melbourne. A ccD is the basic geographical unit used by the Australian Bureau of Statistics to collect population census data, with a mean size of 0.34 km2 for the ccDs in our study area. All ccDs in the study area (n= 4170) were ranked according to the percentage of households with incomes of less than $400 per week (this income band includes about 15% of Australian households [6]), and then stratified into septiles. Fifty ccDs were randomly selected from this list, i.e. 17 from the highest, 16 from the middle, and 17 from the lowest septile (stage 1). Using the electoral roll (voting is com-pulsory for Australian adults aged > 18 years), 4005 households were randomly selected and one adult, aged 18 to 74 years, was randomly selected from each of these households (stage 2). Approximately equal numbers of participants were selected per strata. Selected participants were sent a postal survey. Valid responses were obtained from 2349 persons, giving an overall response rate of 58.7% (54.6% in the most disadvantaged septile, 59.0% in the middle septile and 62.1% in the most advantaged septile). participants with missing values for cycling, education and/or occupation (n=146) were excluded, resulting in N=2203 participants eligible for the analyses.
outcome measure: recreational cyclingTwo closed-response items assessed participation in cycling and cycling pur-pose. The first item asked: ‘‘How often in the last month did you go cycling for 10 minutes or more?’’ we asked for cycling for more than 10 minutes, as we wanted respondents to recall substantial cycling episodes during the last
Kamphuis_09.indd 146 20-8-2008 10:34:42

1478 Area variations in recreational cycling in melbourne
month. participants were asked to nominate one of the following six responses: never, about once or twice, about once a week, 2-3 times a week, 4-5 times a week or every day. The second item asked: “For what purpose do you usually cycle?” with three responses listed: for transport (e.g. to get to work, shops), for recreation or exercise or for both transport and recreation. A test-retest of both items over a two-week interval on 67 participants showed good reliability (i.e. weighted kappa’s: k=0.85 and k=0.72 respectively). The outcome under investigation in the present study was ‘cycling for recreation’, coded: 0=‘never’; and 1=‘at least once a month’.
Area socioeconomic characteristicsArea socioeconomic level was categorized as high, medium, or low, accord-ing to the septile from which the ccD was sampled. The mean proportion of households on low income (i.e. less than $400 per week) ranged from 7.0% in the high socioeconomic areas to 31.4% in the low socioeconomic areas.
objectively-measured area characteristicsAll area characteristics and environmental audits were measured at the same time the postal questionnaire was distributed (between September and Decem-ber- spring/summer in melbourne). Based on the framework of pikora and colleagues [19] we assessed four domains of objective area characteristics, i.e. design (cycling paths/lanes, streets, street width, alternative routes), safety (lighting, traffic control), destination features (bike parking facilities and des-tinations such as: education institutions, shops [all types], post offices, sport facilities and public transport stops/stations), and aesthetics (streetscape, views, maintenance). These features have been suggested to be related to cycling for recreation by key-experts in in-depth interviews, and by a Delphi study. [19]
To measure area characteristics, first, we randomly selected a household within each ccD and drew a 400m radius around that house, resulting in a 0.50 km2 assessment area. The assessment areas were created using data from cDATA (a census data product from the Australian Bureau of Statistics) [20] and Vicmap datasets [21], and mapInfo software [22]. A cosmetic (picture) layer using electronic street directory of greater melbourne (‘melways’, provided by mapInfo) [23] was overlaid to facilitate street recognition. All streets within each assessment area were divided into segments, with a segment being the section of a road between two intersections. Figure 1 shows an example of an assessment area with its segments. Each segment was identified with a unique number, resulting in a total of 3054 street segments for the 50 ccDs (average number of segments per ccD was 59, range 23-161).
Auditors carried out an objective environmental audit (including both sides of the street) on each segment by filling in a modified version of the System-
Kamphuis_09.indd 147 20-8-2008 10:34:42

148 Part II Socioeconomic status, environmental factors and physical activity
atic pedestrian and cycling Environmental Scan (SpAcES) instrument, which measured characteristics from the pikora framework. [24] For each item, seg-ment scores were aggregated to the area level (ccD) by calculating the average score of the segments in the assessment area. Inter and intra-rater reliability was conducted among the auditors prior to data collection. Both inter- and intra-rater reliability of the items in the instrument have been found to be high in general[24], however, in the current investigation 7 of the 31 items (i.e. path maintenance, path continuity, traffic volume, traffic speed limits, path/lane obstruction, cleanliness, architecture) were excluded from the analyses because of their low inter-rater reliability (kappa < 0.30). we used melways to calculate the total length of walking and cycling tracks (paths for walking and cycling that were not on a road) and the total area of parks for an area with a 2km radius from the centre point of each ccD. (See Table 2 for details of area characteristics).
Figure 8.1 Example of an assessment area and its segments
LANES - Walking Audit Area:Melways Ref.: 71D9 Suburb: Wheelers Hill Postcode: 3150
Kamphuis_09.indd 148 20-8-2008 10:34:42

1498 Area variations in recreational cycling in melbourne
Individual characteristicsOccupation was coded to the Australian Standard classification of Occupa-tions, and further recoded into professionals (managers, administrators, pro-fessionals, and paraprofessionals), white-collar employees (clerks, salespersons, and service workers) and blue-collar employees (tradespersons, machine oper-ator, drivers, labourers, and related workers). A fourth category ‘not in labour force’ was created for respondents who were retired, studying, unemployed, not looking for work, or unable to work. Respondents reported their highest school level completed and any post-school qualifications. Responses were recoded as (1) bachelor degree or higher, (2) diploma (associate or undergraduate) (3) vocational and (4) no post-school qualification. Information on age and sex were obtained from the survey responses or from the electoral roll data if these items were missing.
AnalysesDistributions of individual and area characteristics over high, medium, and low socioeconomic areas were investigated with ANOVA, and associations of individual and area characteristics with recreational cycling were conducted with logistic regression models, both in SpSS (version 14). we used mLwiN version 2.02 to examine area deprivation inequalities and between-area differ-ences in recreational cycling. Since recreational cycling was a binary outcome, we performed multilevel logistic analyses using the logit-link function and 2nd order pQL estimation methods.[25] Between-area differences in recreational cycling were determined by calculating the median odds ratio (mOR) with 95% credible intervals (crL), using the posterior distribution of the area vari-ance as provided by the markov chain monte carlo (mcmc) procedure in mlwiN.[26] The intraclass correlation coefficient (Icc) is often calculated for continuous outcomes, and represents the proportion of total variance in the outcome that is attributable to the area level. However, the interpretation of the Icc for dichotomous outcomes is difficult to understand as the individual level variance and the area level variance are not directly comparable [27]. Therefore, we calculated the mOR instead of the Icc to determine clustering of recreational cycling within areas. The mOR was computed with the follow-ing formula: [27]
mOR = exp[√(2 x area variance) x 0.6745 ≈ exp (0.95√area variance)
An advantage of the mOR over the between-area variance is its consistent and intuitive interpretation. If the mOR would for instance be 1.50, this shows that in the median case the residual heterogeneity between areas increased by 1.5 times the individual odds of recreational cycling when randomly selecting two persons in different areas – that is, if a person moves to another area with a higher probability of recreational cycling, their odds of engaging in recreational cycling will have a median increase of 1.5 times. [27]
Kamphuis_09.indd 149 20-8-2008 10:34:42

150 Part II Socioeconomic status, environmental factors and physical activity
To examine the contributions of different groups of compositional and contex-tual factors, we used a sequential modelling strategy. Firstly, we fitted a two-level random intercept model without any explanatory variables (‘null’ model), and then included area SES (model 1). Further, we added sex and age (model 2), and education and occupation (model 3), to examine to what extent area differences and area socioeconomic variations in recreational cycling could be accounted for by compositional characteristics. Then, we added each of the four groups of area characteristics separately (i.e. functional, safety, aesthet-ics, and destination; models 4-7), to observe how much of the remaining area differences and area socioeconomic inequalities each group explained (contex-tual effects). The contribution of explanatory factors to area differences was assessed by reductions in the mOR. The contribution of factors to area socio-economic inequalities in recreational cycling was assessed by attenuation of the odds ratios for area SES.
Results
CyclingOf all participants, 81.8% (n=1802) reported no cycling at all in the previous month, whereas 1.8% (n=40) cycled at least once a month for transportation only, 12.8% (n=282) for recreation only, and 3.6% (n=79) cycled at least once a month for both transport and recreation purposes. Low statistical power did not permit us to investigate cycling for transport in relation to areas and area characteristics, therefore participants cycling for transport only (n=40) were excluded from the analyses. we focused on recreational cycling, with 361 par-ticipants who cycled for recreation at least once a month (i.e. those cycling for recreation only, plus those cycling for both recreation and transport), and 1802 participants never cycling.
The contribution of compositional characteristicscompared to high socioeconomic areas, participants residing in low socioeco-nomic areas were older, less educated, and a higher proportion did not par-ticipate in the labour force (see Table 1). women and older participants were significantly less likely to cycle for recreation compared to men and younger participants. participants with no post school qualification (OR=0.66; 95% cI: 0.48-0.91) and those not in the labour force (OR=0.72; 95% cI: 0.51-1.03) were less likely to cycle compared to their higher status counterparts (although these differences were not significant).
Influence of contextual characteristicsAs shown in Table 2, four of the eight design features were significantly related to recreational cycling, i.e. presence of an on-road cycle lane, total track length (km), prevalence of traffic control devices, and prevalence of alternative routes.
Kamphuis_09.indd 150 20-8-2008 10:34:42

1518 Area variations in recreational cycling in melbourne
Table 8.1 Sample (compositional) characteristics by area socioeconomic level, and their associations with recreational cyclinga
ToTAL Area socioeconomic level Likelihood ofrecreational cyclinga
high Medium low pb oRc 95% CI pc
(n=2163) (n=795) (n=725) (n=643)
n % % % %
Recreational cycling *
At least once a month 361 16.7 18.7 17.5 13.2
never 1802 83.3 81.3 82.5 86.8
Sex n.s. ***
male 933 43.1 43.3 42.5 43.7 1.00
Female 1230 56.9 56.7 57.5 56.3 0.48 (0.37-0.62)
Age group *** ***
18-24 172 8.0 7.8 8.0 8.1 1.00
25-34 391 18.1 14.1 21.9 18.7 0.76 (0.48-1.20)
35-44 470 21.7 20.5 21.4 23.6 0.74 (0.47-1.15)
45-54 469 21.7 25.3 19.4 19.8 0.54 (0.34-0.85)
55-64 357 16.5 20.0 16.4 12.3 0.42 (0.25-0.68)
65> 304 14.1 12.3 12.8 17.6 0.35 (0.19-0.62)
Education *** n.s.
1 Bachelor or higher 724 33.5 40.4 34.9 23.3 1.00
2 Diploma 243 11.2 12.6 9.5 11.5 0.90 (0.61-1.34)
3 Vocational 411 19.0 16.6 19.4 21.5 0.91 (0.64-1.29)
4 no post school qualification
785 36.3 30.4 36.1 43.7 0.66 (0.48-0.91)
occupation *** n.s.
1 Professional 805 37.2 44.5 38.9 26.3 1.00
2 white collar 362 16.7 16.6 16.3 17.4 0.82 (0.57-1.19)
3 Blue collar 262 12.1 8.1 14.6 14.3 0.97 (0.66-1.43)
4 not in labour force 734 33.9 30.8 30.2 42.0 0.72 (0.51-1.03)
a Likelihood of recreational cycling, ‘at least once a month’ vs. ‘never’.b P-values indicate whether high, medium, and low socioeconomic areas have different prevalences of the given
characteristics. P-value is based on a X2 distribution; with n.s. = not significant; *= p<0.05; **= p<0.01; ***= p<0.001.
c Odds ratios were adjusted for area socioeconomic level, sex, age, education, and occupation. P-values indicate whether characteristics are significantly associated with recreational cycling.
Kamphuis_09.indd 151 20-8-2008 10:34:42

152 Part II Socioeconomic status, environmental factors and physical activity
Tabl
e 8.
2 A
rea
(con
text
ual)
char
acte
ristic
s of
ass
essm
ent a
reas
(n
=50
) by
area
soc
ioec
onom
ic le
vel,
and
asso
ciat
ions
of a
rea
char
acte
ristic
s w
ith
recr
eatio
nal c
yclin
g (r
ecre
atio
nal c
yclin
g re
port
ed b
y re
side
nts
of th
e 50
are
as (
n=
216
3))
Varia
bles
mea
sure
men
t of a
rea
char
acte
ristic
saA
ll ar
eas
(n=
50)
Are
a so
cioe
cono
mic
leve
lm
ean
[SD
]Li
kelih
ood
ofre
crea
tiona
l cyc
ling
mea
n [S
D]
rang
eh
igh
(n=1
7)M
ediu
m(n
=16)
low
(n=1
7)pb
oRc
95%
CI
Des
ign
Cycl
ing
surf
ace
Path
Pr
opor
tions
of s
egm
ents
with
a w
alki
ng/c
yclin
g pa
th p
rese
nt0.
83[0
.16]
0.20
-1.0
00.
75[0
.20]
0.88
[0.13
]0.
86[0
.12]
*1.
04(0
.54-
2.00
)
Cycl
e la
nePr
opor
tions
of s
egm
ents
with
an
on-r
oad
cycl
e la
ne0.
05[0
.08]
0.00
-0.2
80.
06[0
.07]
0.09
[0.10
]0.
01[0
.01]
*5.
40(1
.29-
22.6
0)
Slop
eTh
e de
gree
of i
nclin
e on
wal
king
/cyc
ling
trac
ks m
easu
red
by th
e av
erag
e pa
th-
slope
-sco
re (1
= fla
t/ge
ntle
, 2=
mod
erat
e, 3
=st
eep)
1.20
[0.3
0]1.
00-2
.60
1.38
[0.4
2]1.1
0[0
.14]
1.11
[0.15
]*
0.87
(0.6
1-1.
25)
Trac
k le
ngth
To
tal l
engt
h of
wal
king
/cyc
ling
trac
ks (k
m)
15.7
0[9
.95]
3.55
-49.
8715
.58
[7.9
4]18
.74
[14.
20]
12.9
4[5
.84]
n.s.
1.02
d(1
.01-
1.03
)
Stre
ets
wid
thAv
erag
e nu
mbe
r of l
anes
on
road
2.65
[0.2
4]2.
00-3
.27
2.61
[0.2
5]2.
64[0
.14]
2.69
[0.2
9]n.
s.0.
81(0
.49-
1.35
)
Vehi
cle
park
ing
Prop
ortio
ns o
f seg
men
ts w
ith v
ehic
le p
arki
ng re
stric
tion
signs
pre
sent
0.26
[0.2
5]0.
00-0
.95
0.23
[0.2
6]0.
31[0
.29]
0.25
[0.2
1]n.
s.1.
52(0
.92-
2.53
)
Traf
fic
Traf
fic c
ontr
ol d
evic
esPr
opor
tions
of s
egm
ents
with
at l
east
one
traf
fic c
ontr
ol d
evic
e (i.
e. s
peed
bum
ps,
traf
fic c
alm
ing
stru
ctur
es th
at e
ffect
the
spee
d/flo
w o
f tra
ffic
) 0.
26[0
.14]
0.01
-0.6
20.
24[0
.13]
0.30
[0.17
]0.
25[0
.13]
n.s.
2.90
e(1
.19-7
.02)
Alte
rnat
ive
rout
es
oth
er a
cces
s po
ints
Prop
ortio
ns o
f seg
men
ts w
ith o
ne o
r mor
e ot
her r
oute
ava
ilabl
e (t
hat p
rovi
de
alte
rnat
ive
way
s of c
yclin
g ar
ound
the
neig
hbou
rhoo
d)0.
23[0
.11]
0.00
-0.4
50.
23[0
.11]
0.22
[0.10
]0.
23[0
.13]
n.s.
4.49
(1.5
5-13
.00)
Safe
ty
Pers
onal
Ligh
ting
Prop
ortio
ns o
f seg
men
ts w
ith s
tree
t lig
hts p
rese
nt0.
56[0
.08]
0.40
-0.8
00.
56[0
.07]
0.57
[0.11
]0.
54[0
.07]
n.s.
0.72
(0.17
-3.16
)
Kamphuis_09.indd 152 20-8-2008 10:34:42

1538 Area variations in recreational cycling in melbourne
Varia
bles
mea
sure
men
t of a
rea
char
acte
ristic
saA
ll ar
eas
(n=
50)
Are
a so
cioe
cono
mic
leve
lm
ean
[SD
]Li
kelih
ood
ofre
crea
tiona
l cyc
ling
mea
n [S
D]
rang
eh
igh
(n=1
7)M
ediu
m(n
=16)
low
(n=1
7)pb
oRc
95%
CI
Surv
eilla
nce
Aver
age
surv
eilla
nce-
scor
e (1
= ot
hers
can
obs
erve
cyc
lists
from
<50
% o
f bui
ld-
ings
, 2=
from
50-
75%
of b
uild
ings
, 3=
from
>75
% o
f bui
ldin
gs)
2.22
[0.4
6]1.
00-2
.86
2.14
[0.4
8]2.
25[0
.55]
2.25
[0.3
8]n.
s.1.1
1(0
.85-
1.45
)
Traf
fic
Cros
sing
s Pr
opor
tions
of s
egm
ents
with
one
or m
ore
cros
sings
pre
sent
(e.g
. zeb
ra, t
raff
ic sig
nals
, brid
ge/o
verp
ass,
und
erpa
ss)
0.07
[0.0
6]0.
00-0
.27
0.05
[0.0
5]0.
08[0
.07]
0.08
[0.0
5]
n.s.
0.32
(0.0
2-3.
22)
Cros
sing
aid
sPr
opor
tions
of s
egm
ents
with
one
or m
ore
cros
sing
aids
(e.g
. med
ian
refu
ge, t
raff
ic is
land
, ker
b ex
tens
ions
)0.
23[0
.14]
0.02
-0.5
80.
22[0
.13]
0.27
[0.17
]0.
22[0
.13]
n.s.
0.73
(0.3
0-1.
78)
Verg
e w
idth
Aver
age
path
-loca
tion-
scor
e (1
=ne
xt to
road
, 2=
<1m
from
ker
b, 3
= 1-
2m fr
om
kerb
, 4=
2-3m
from
ker
b, 5
= 3>
m fr
om k
erb)
3.30
[0.9
2]1.
08-4
.58
3.41
[0.8
6]3.
10[1
.10]
3.38
[0.8
1]n.
s.0.
89(0
.78-
1.01
)
Abs
ence
of d
rivew
ay
cros
sove
rsAv
erag
e sc
ore
for d
rivew
ay-c
ross
over
s (1=
mos
t bui
ldin
gs h
ave
driv
eway
, 2=
½ o
f bu
ildin
gs h
ave
driv
eway
, 3=
¼ o
f bui
ldin
gs h
ave
driv
eway
, 4=
no d
rivew
ays)
1.61
[0.6
2]1.
00-3
.29
1.54
[0.4
9]1.
76[0
.83]
1.53
[0.4
9]n.
s.1.
43(1
.18-1
.73)
Des
tinat
ions
Des
tinat
ion
pres
ent
Prop
ortio
n of
seg
men
ts w
ith a
t lea
st o
ne d
estin
atio
n pr
esen
t0.
40[0
.19]
0.12
-0.9
30.
36[0
.15]
0.36
[0.2
1]0.
48[0
.19]
n.s.
1.91
(0.9
9-3.
69)
Des
tinat
ion
varie
tyAv
erag
e nu
mbe
r of d
iffer
ent d
estin
atio
ns a
long
a s
egm
ent
0.39
[0.2
7]0.
07-1
.28
0.31
[0.2
0]0.
34[0
.25]
0.50
[0.3
3]n.
s.1.
44(0
.91-
2.27
)
Bike
par
king
faci
litie
sPr
opor
tions
of s
egm
ents
with
bik
e pa
rkin
g fa
cilit
ies
0.02
[0.0
3]0.
00-0
.130.
02[0
.02]
0.02
[0.0
3]0.
03[0
.04]
n.s.
8.93
(0.13
-607
.8)
Aest
hetic
s
Stre
etsc
ape
Abs
ence
of
tree
sAv
erag
e sc
ore
for t
rees
alo
ng th
e ro
ad (1
= on
e or
mor
e tr
ees p
er h
ouse
blo
ck,
2= o
ne tr
ee fo
r eve
ry 2
hou
se b
lock
s, 3
= on
e tr
ee fo
r eve
ry 3
> ho
use
bloc
ks,
4=no
tree
s)
2.06
[0.5
5]0.
68-2
.76
2.14
[0.4
8]2.
10[0
.64]
1.95
[0.5
5]]
n.s.
0.89
(0.7
2-1.1
1)
Tabl
e 8.
2 (C
ontin
ued)
Kamphuis_09.indd 153 20-8-2008 10:34:43

154 Part II Socioeconomic status, environmental factors and physical activity
Varia
bles
mea
sure
men
t of a
rea
char
acte
ristic
saA
ll ar
eas
(n=
50)
Are
a so
cioe
cono
mic
leve
lm
ean
[SD
]Li
kelih
ood
ofre
crea
tiona
l cyc
ling
mea
n [S
D]
rang
eh
igh
(n=1
7)M
ediu
m(n
=16)
low
(n=1
7)pb
oRc
95%
CI
Lack
of g
arde
n m
aint
enan
ce A
vera
ge s
core
for g
arde
n m
aint
enan
ce (1
= >7
5% w
ell m
aint
aine
d, 2
= 50
-75%
w
ell m
aint
aine
d, 3
= <
50%
wel
l mai
ntai
ned)
1.24
[0.2
1]1.
00-1
.86
1.14
[0.14
]1.
22[0
.22]
1.36
[0.2
1]n.
s.0.
55(0
.29-
1.04
)
Lack
of v
erge
mai
nten
ance
Av
erag
e sc
ore
for v
erge
mai
nten
ance
(1=
>75%
wel
l mai
ntai
ned,
2=
50-7
5% w
ell
mai
ntai
ned,
3=
<50
% w
ell m
aint
aine
d, 4
=ve
rge
unde
rgoi
ng w
ork)
1.37
[0.2
8]1.
03-2
.29
1.28
[0.3
1]1.
40[0
.30]
1.41
[0.2
4]n.
s.1.
08(0
.68-
1.69
)
Park
are
aTo
tal p
ark
area
(km
2 )0.
94[0
.72]
0.12
-3.5
11.1
0[1
.00]
0.98
[0.6
5]0.
73[0
.34]
n.s.
1.26
(1.0
9-1.
46)
View
s
Urb
an v
iew
Prop
ortio
ns o
f seg
men
ts w
ith a
n ur
ban
view
(hou
ses,
hou
seho
ld g
arde
ns)
0.90
[0.18
]0.
00-1
.00
0.93
[0.14
]0.
89[0
.25]
0.89
[0.17
]n.
s.0.
85(0
.35-
2.06
)
Com
mer
cial
vie
wPr
opor
tions
of s
egm
ents
with
a c
omm
erci
al v
iew
(sho
ps, o
ffic
es)
0.27
[0.2
2]0.
00-0
.80
0.22
[0.2
0]0.
24[0
.25]
0.36
[0.2
1]n.
s.1.
35(0
.78-
2.33
)
nat
ural
vie
wPr
opor
tions
of s
egm
ents
with
a n
atur
al v
iew
(par
k, la
ke, r
iver
)0.
22[0
.17]
0.00
-0.6
70.
25[0
.18]
0.20
[0.18
]0.
20[0
.15]
n.s.
1.16
(0.6
0-2.
26)
a A
rea
char
acte
ristic
s w
ere
colle
cted
dur
ing
field
obs
erva
tions
with
the
SPAC
ES in
stru
men
t, ex
cept
for t
he to
tal l
engt
h of
trac
ks a
nd th
e km
2 of
par
ks, w
hich
wer
e ca
lcul
ated
by
gIS
.b
We
used
AN
OvA
to c
ompa
re th
e ar
ea c
hara
cter
istic
s am
ong
the
soci
oeco
nom
ic a
reas
. P -v
alue
s in
dica
te w
heth
er h
igh,
med
ium
, and
low
soc
ioec
onom
ic a
reas
hav
e di
ffere
nt p
reva
lenc
es o
f the
gi
ven
char
acte
ristic
s, w
ith n
.s. =
not
sig
nific
ant;
*= p
<0.
050;
**=
p<
0.01
0; *
**=
p<
0.00
1.c
Odd
s ra
tios
expr
ess
the
likel
ihoo
d of
recr
eatio
nal c
yclin
g (a
t lea
st o
nce
a m
onth
vs.
nev
er).
All
mod
els
incl
uded
onl
y th
e pr
edic
tor v
aria
ble
of in
tere
st in
the
mod
el a
nd w
ere
age-
and
sex
-ad
just
ed. O
dds
ratio
s in
bol
d in
dica
te a
sig
nific
ant o
r bor
derli
ne s
igni
fican
t ass
ocia
tion
with
recr
eatio
nal c
yclin
g.d
Exam
ple
1 fo
r int
erpr
etat
ion
of re
sults
: the
odd
s ra
tio fo
r tra
ck le
ngth
mea
ns th
at fo
r eac
h on
e un
it in
crea
se in
leng
th (s
o fo
r eac
h ad
ditio
nal k
ilom
etre
), th
e od
ds o
f rec
reat
iona
l cyc
ling
incr
ease
s by
2%
.e
Exam
ple
2 fo
r int
erpr
etat
ion
of re
sults
: The
odd
s ra
tio fo
r tra
ffic
cont
rol d
evic
es re
flect
s th
e ef
fect
of a
n in
crea
se in
the
prop
ortio
n of
seg
men
ts w
ith tr
affic
con
trol
dev
ices
from
zer
o (n
o se
gmen
t) to
1 (1
00%
of t
he s
egm
ents
).
Tabl
e 8.
2 (C
ontin
ued)
Kamphuis_09.indd 154 20-8-2008 10:34:43

1558 Area variations in recreational cycling in melbourne
Also, two out of six safety features (i.e. verge width, and absence of driveway crossovers), one out of three destination features (i.e. prevalence of destina-tions), and two out of seven aesthetic features (i.e. total park area, and lack of garden maintenance) showed a (borderline) significant association with recrea-tional cycling. Larger verge width and lack of garden maintenance was nega-tively associated with recreational cycling, whereas the other features showed a positive association.
Between-area differences in recreational cyclingwe found significant between-area differences in recreational cycling for the null model (i.e. mOR= 1.49 (1.26-1.77); see Table 3). The mOR did not change when area socioeconomic level (model 1), and compositional factors (models 2 and 3) were added to the null model, and neither changed when design, desti-nation, or aesthetic characteristics were separately added to model 3. However, a drop in the mOR was seen when safety features were included (mOR reduced to 1.27(1.03-1.60)). Two safety features (surveillance and absence of driveway crossovers) were independently related to recreational cycling.
Area socioeconomic inequalities in recreational cyclingAs presented in Table 3, area socioeconomic inequalities remained borderline significant when adjusting for age, sex, education, and occupation, with resi-dents of low socioeconomic areas least likely to cycle for recreation (OR=0.65; 95% cI: 0.42-1.01). when design, safety, or destination features were added to the model, area socioeconomic inequalities increased marginally. However, area socioeconomic inequalities were attenuated when aesthetic features were added to the model.
Discussion
Principal findingsOur study in the city of melbourne, Australia, showed that there were between-area differences in recreational cycling and that residents of socioeconomically deprived areas were less likely to cycle for recreation, independent of resi-dents’ age, sex, occupational and educational level. Safety characteristics par-tially explained between-area differences in recreational cycling, and poorer aesthetic characteristics in deprived areas made a contribution to explaining the lower rates of engagement in recreational cycling among residents of these areas. Improving the safety and aesthetic characteristics of areas are strategies that may increase recreational cycling.
Kamphuis_09.indd 155 20-8-2008 10:34:43

156 Part II Socioeconomic status, environmental factors and physical activity
Tabl
e 8.
3 Th
e ef
fect
of a
rea
desi
gn, s
afet
y, d
estin
atio
n an
d ae
sthe
tic c
hara
cter
istic
s on
are
a di
ffer
ence
sa and
are
a so
cioe
cono
mic
(are
a SE
S) v
aria
tions
in
the
likel
ihoo
d of
recr
eatio
nal c
yclin
gb (od
ds ra
tios
(oR)
and
95%
con
fiden
ce in
terv
als
(CI)
)m
odel
0m
odel
1:
area
SES
mod
el 2
:ar
ea S
ES+
age
+ s
ex
mod
el 3
:ar
ea S
ES+
age
+ s
ex+
ed
ucat
ion
+ o
ccup
atio
n
mod
el 4
:m
odel
3+
des
ign
feat
ures
mod
el 5
:m
odel
3+
saf
ety
feat
ures
mod
el 6
:m
odel
3+
des
tinat
ion
feat
ures
mod
el 7
:m
odel
3+
aes
thet
ic
feat
ures
Rand
om e
ffec
ts
mo
R (9
5% C
rI)
1.49
(1.2
6-1.
77)
1.47
(1.2
2-1.
74)
1.52
(1.2
5-1.
82)
1.48
(1.2
4-1.
78)
1.49
(1.2
4-1.
82)
1.27
(1.0
3-1.
60)
1.48
(1.2
2-1.
77)
1.51
(1.2
3-1.
82)
Fixe
d ef
fect
s
Are
a se
s
Hig
h 1.
001.
001.
001.
001.
001.
001.
00
med
ium
0.
90 (0
.60-
1.36
)0.
83 (0
.56-
1.25
)0.
84 (0
.55-
1.29
)0.
79 (0
.49-
1.27
)0.
69 (0
.47-
1.01
)0.
82 (0
.55-
1.22
)0.
91 (0
.60-
1.39
)
Low
0.
66 (0
.43-
1.00
)0.
60 (0
.40-
0.89
)0.
65 (0
.42-
1.01
)0.
64 (0
.41-
0.99
)0.
61 (0
.41-
0.91
)0.
56 (0
.36-
0.87
)0.
76 (0
.46-
1.23
)
DES
IGN
Path
1.
92 (0
.58-
6.37
)
Slop
e1.
06 (0
.59-
1.90
)
Trac
k le
ngth
(km
)1.
01 (0
.99-
1.04
)
Stre
et w
idth
1.17
(0.6
2-2.
21)
Ve
hicl
e pa
rkin
g si
gns
0.81
(0.3
0-2.
20)
Tr
affic
con
trol
dev
ices
1.96
(0.4
9-7.
91)
o
ther
acc
ess
poin
ts3.
24 (0
.70-
14.9
)
SAFE
Ty
Ligh
ting
1.05
(0.0
8-13
.8)
Surv
eilla
nce
1.81
(1.0
4-3.
17)
Cros
sing
s 0.
53 (0
.01-
41.6
)
Kamphuis_09.indd 156 20-8-2008 10:34:43

1578 Area variations in recreational cycling in melbourne
mod
el 0
mod
el 1
:ar
ea S
ESm
odel
2:
area
SES
+ a
ge+
sex
mod
el 3
:ar
ea S
ES+
age
+ s
ex+
ed
ucat
ion
+ o
ccup
atio
n
mod
el 4
:m
odel
3+
des
ign
feat
ures
mod
el 5
:m
odel
3+
saf
ety
feat
ures
mod
el 6
:m
odel
3+
des
tinat
ion
feat
ures
mod
el 7
:m
odel
3+
aes
thet
ic
feat
ures
Cros
sing
aid
s0.
20 (0
.04-
1.09
)
Verg
e w
idth
1.02
(0.8
1-1.
29)
A
bsen
ce o
f driv
eway
cro
ssov
ers
2.16
(1.5
2-3.
06)
DES
TIN
ATIo
NS
D
estin
atio
n pr
esen
t 0.
90 (0
.04-
21.8
)
D
estin
atio
n va
riety
1.95
(0.2
1-18
.0)
AES
ThET
ICS
Abs
ence
of t
rees
0.81
(0.5
0-1.
31)
Lac
k of
gar
den
mai
nten
ance
0.
47 (0
.20-
1.13)
Lac
k of
ver
ge m
aint
enan
ce
1.37
(0.7
1-2.
65)
Park
are
a1.
21 (0
.94-
1.57
)
Urb
an v
iew
3.04
(0.8
1-11
.5)
Co
mm
erci
al v
iew
1.60
(0.5
9-4.
35)
nat
ural
vie
w1.
05 (0
.37-
2.94
)
a A
rea
diffe
renc
es a
re in
dica
ted
by th
e m
edia
n od
ds ra
tio (m
Or)
with
95%
cre
dibl
e in
terv
als
(CrL
), us
ing
the
post
erio
r dist
ribut
ion
of th
e ar
ea v
aria
nce
as p
rovi
ded
by th
e m
arko
v Ch
ain
mon
te
Carlo
(mCm
C) p
roce
dure
in m
lwiN
[25]
.b
Odd
s ra
tios
expr
ess
the
likel
ihoo
d of
recr
eatio
nal c
yclin
g (a
t lea
st o
nce
a m
onth
vs.
nev
er),
and
are
adju
sted
for a
ll va
riabl
es th
at w
ere
incl
uded
in th
e sp
ecifi
c m
odel
. Odd
s ra
tios
in b
old
indi
cate
a s
igni
fican
t ass
ocia
tion
betw
een
the
area
cha
ract
erist
ic a
nd re
crea
tiona
l cyc
ling.
Tabl
e 8.
3 (C
ontin
ued)
Kamphuis_09.indd 157 20-8-2008 10:34:43

158 Part II Socioeconomic status, environmental factors and physical activity
Study strengths and weaknessesThis is the first known multilevel study that has investigated a large range of objective area characteristics in relation to recreational cycling, and the contri-bution of those characteristics to area socioeconomic inequalities and between-area differences in recreational cycling. However, this study has a number of limitations. Firstly, it was restricted to a specific geographic area, the city of melbourne. Therefore, results may only be generalisable to similar areas. Fur-thermore, audit areas had a 400m radius, although cyclists are likely to travel further than 400 meters. Someone’s immediate surrounding was expected to make a difference for whether people even consider cycling, and more practi-cally, for a data collection method as resource/labour intensive as an environ-mental audit, this area was the size that we could most cost-effectively collect information. The cross-sectional design did not allow us to determine whether area characteristics caused recreational cycling differences or whether residents self-selected into areas according to physical activity opportunities, including bikability. The low prevalence of cycling did not allow us to use a cut-off point of which a larger health impact might be expected, for instance, cycling for rec-reation at least three times per week (instead of at least once a month), nor could we examine transport-related cycling. Additionally, we did not collect informa-tion on destinations that participants cycled to. It may be that the design, safety, destination and aesthetic characteristics of areas where participants cycled to were more influential on their recreational cycling than characteristics of their immediate residential areas. Finally, area characteristics were systematically measured with pikora’s SpAcES instrument, [24] however not all items could be included in the analyses. Some items were excluded because of their low inter-rater reliability (seven items), their low overall prevalence in the assessed areas (two items), or because information on them was not collected (four items). However, we were still able to examine twenty-two area characteristics, most of which have never been investigated in relation to recreational cycling.
Interpretation of findingsA previous multilevel paper based on the VicLANES study did not find an association between area socioeconomic level and overall cycling levels. [6] In contrast, focusing on recreational cycling rather than overall cycling, we did find area socioeconomic variation, showing that area effects may differ even for closely-related physical activity outcomes. we found that area socioeconomic inequalities in recreational cycling reduced to non-significance when aesthetic characteristics were taken into account, which is in line with a study from the Netherlands, that found that people residing in the most disadvantaged areas had an increased probability of almost never cycling, walking, and gardening for recreation, which was partly mediated by poorer general neighbourhood attractiveness.[7] Total park area was one of the aesthetic features that showed a significant positive association with recreational cycling (as also found for
Kamphuis_09.indd 158 20-8-2008 10:34:43

1598 Area variations in recreational cycling in melbourne
transportational cycling [18]), and decreased with area socioeconomic level (although not significantly). These results are consistent with the literature on perceptions of area characteristics, which has shown that residents of low socio-economic areas have less positive perceptions of physical-activity related neigh-bourhood characteristics than residents of high socioeconomic areas [2, 28].
Although several specific design, destination, and aesthetic characteristics were associated with recreational cycling in bivariate associations (adjusted for age and sex), these did not contribute to between-area differences in recreational cycling. This may be due to the areas being relatively uniform in terms of these characteristics. Our findings suggest that some other individual- or area-level factor(s) not considered in the current study contributed to the between-area differences in recreational cycling found. Only safety characteristics explained part of the area differences in recreational cycling, and two specific safety items, surveillance level and absence of driveway crossovers, remained signifi-cantly associated with recreational cycling when adjusting for all safety features and compositional factors. This shows that personal as well as traffic safety were independently important for recreational cycling, as had been suggested by the framework developed by pikora and colleagues [18]. In contrast, a U.S. study did not find associations between objective measures of traffic or per-sonal safety and combined recreational cycling and walking [29], which may be due to e.g. their different safety measure (i.e. a summary score instead of analysing specific items), their different outcome measure, or because associa-tions between environmental correlates and health behaviours may be country-specific [30].
Area socioeconomic inequalities in recreational cycling actually widened when design, safety, or destination characteristics were included in the explana-tory model. This is probably due to a suppression effect.[31] In general, the adjustment of models for explanatory factors (with the highest socioeconomic group being the reference group), leads to a reduction in the magnitude of the inequalities, as explanatory factors are often most favourable for the highest socioeconomic group. However, as we found that some design, safety, and des-tination characteristics were more favourable in low than high socioeconomic areas, adjustment for these factors resulted in a widening of the socioeconomic area inequalities in recreational cycling rather than a decline.
Future researchThe results of this study add to previous findings, confirming the potential role of the built environment on physical activity behaviours.[17, 19, 32] In future research, causal pathways between area characteristics and transport-related and recreational physical activities should be tested, either in a longitudinal study or ‘natural experiment’ in which activity is measured before and after an
Kamphuis_09.indd 159 20-8-2008 10:34:43

160 Part II Socioeconomic status, environmental factors and physical activity
environmental modification. Both objective and perceived area characteristics should be investigated, as agreement between the two has found to be small, [29, 33] and their relevance for public health action is still under debate.
ConclusionsThis study provided evidence of significant area differences and socioeconomic area inequalities in recreational cycling that could be explained by some con-textual effects, and only marginally by compositional factors. This study also showed that cycling levels are relatively low, also among residents of advan-taged areas. creating supportive neighbourhood environments, especially with respect to aesthetic and safety characteristics may have the potential to increase cycling levels. Lessons could be learned from countries like the Netherlands and Denmark where cycling is extremely popular, and where measures to improve the bikability of cities are readily available. [12]
Acknowledgements
cK is supported by a grant from NwO (Netherlands Organization for Scien-tific Research), and by a fund of the Trustfonds (Erasmus University Rotter-dam, the Netherlands). KG is supported by an Australian National Health and medical Research council Sidney Sax Fellowship (ID 290540). GT is sup-ported by an Australian National Health and medical Research council Senior Research Fellowship (ID 390109). The VicLANES study was supported by a grant from the Victorian Health promotion Foundation.
Ethics approval: the project was approved by the La Trobe University Human Ethics committee.
Kamphuis_09.indd 160 20-8-2008 10:34:43

1618 Area variations in recreational cycling in melbourne
References
1 Droomers m, Schrijvers cT, mackenbach Jp. Educational level and decreases in leisure time physical activity: predictors from the longitudinal GLOBE study. J Epidemiol Com-munity Health 2001;55:562-8.
2 Giles-corti B, Donovan RJ. Socioeconomic status differences in recreational physical activity levels and real and perceived access to a supportive physical environment. Prev Med 2002;35:601-11.
3 Lindstrom m, Hanson BS, Ostergren pO. Socioeconomic differences in leisure-time physical activity: the role of social participation and social capital in shaping health related behaviour. Soc Sci Med 2001;52:441-51.
4 Lynch Jw, Kaplan GA, cohen RD, et al. Do cardiovascular risk factors explain the rela-tion between socioeconomic status, risk of all-cause mortality, cardiovascular mortality, and acute myocardial infarction? Am J Epidemiol 1996;144:934-42.
5 Sundquist J, malmstrom m, Johansson SE. cardiovascular risk factors and the neigh-bourhood environment: a multilevel analysis. Int J Epidemiol 1999;28:841-5.
6 Kavanagh Am, Goller JL, King T, et al. Urban area disadvantage and physical activity: a multilevel study in melbourne, Australia. J Epidemiol Community Health 2005;59:934-40.
7 Van Lenthe FJ, Brug J, mackenbach Jp. Neighbourhood inequalities in physical inactiv-ity: the role of neighbourhood attractiveness, proximity to local facilities and safety in the Netherlands. Soc Sci Med 2005;60:763-75.
8 macintyre S, macIver S, Sooman A. Area, class and health: should we be focusing on places or people? Journal of Social Policy 1993;22:213-34.
9 Smith GD, Hart c, watt G, et al. Individual social class, area-based deprivation, cardio-vascular disease risk factors, and mortality: the Renfrew and paisley Study. J Epidemiol Community Health 1998;52:399-405.
10 Giles-corti B, Timperio A, Bull F, et al. Understanding physical activity environ-mental correlates: increased specificity for ecological models. Exerc Sport Sci Rev 2005;33:175-81.
11 Diez Roux AV. Investigating neighborhood and area effects on health. Am J Public Health 2001;91(11):1783-9.
12 pucher J, Dijkstra L. promoting safe walking and cycling to improve public health: les-sons from The Netherlands and Germany. Am J Public Health 2003;93:1509-16.
13 mccormack G, milligan R, Giles-corti B, et al. Physical Activity Levels of Western Aus-tralian Adults 2002: Results from the adult physical activity survey and pedometer study. perth, western Australia: western Australian Government 2003.
14 cervero R, Duncan m. walking, bicycling, and urban landscapes: evidence from the San Francisco Bay Area. Am J Public Health 2003;93:1478-83.
15 plaut pO. Non-motorized commuting in the US. Transportation Research Part D 2005;10:347-56.
16 Vernez moudon A, Lee c, cheadle A, et al. cycling and the built envrionment, a US perspective. Transportation Research Part D 2005;10:245-61.
17 Saelens BE, Sallis JF, Frank LD. Environmental correlates of walking and cycling: find-ings from the transportation, urban design, and planning literatures. Ann Behav Med 2003;25:80-91.
18 wendel-Vos Gc, Schuit AJ, de Niet R, et al. Factors of the physical environment associ-ated with walking and bicycling. Med Sci Sports Exerc 2004;36:725-30.
19 pikora T, Giles-corti B, Bull F, et al. Developing a framework for assessment of the environmental determinants of walking and cycling. Soc Sci Med 2003;56:1693-703.
Kamphuis_09.indd 161 20-8-2008 10:34:43

162 Part II Socioeconomic status, environmental factors and physical activity
20 Australian Bureau of Statistics. cDATA 2001 - Your census at work (2nd release). can-berra: Australian Bureau of Statistics 2003.
21 Department of Sustainability and Environment. Vicmaps, Land Information Group Victoria. melbourne: Department of Sustainability and Environment 2002.
22 mapInfo corporation. mapInfo professional version 7.2. New York: Troy 2002.23 melways Greater melbourne (V30). mount waverly: Ausway 2003.24 pikora TJ, Bull Fc, Jamrozik K, et al. Developing a reliable audit instrument to measure
the physical environment for physical activity. Am J Prev Med 2002;23:187-94.25 Rasbash J, Steele F, Browne w, et al. A user’s guide to mlwiN Version 2.0. Bristol: centre
for multilevel modelling, University of Bristol 2005.26 Browne wJ, Rasbash J, Edmond wS. mcmc estimation in mLwiN version 2.0 centre
for multilevel modelling, University of Bristol 2005.27 merlo J, chaix B, Ohlsson H, et al. A brief conceptual tutorial of multilevel analysis
in social epidemiology: using measures of clustering in multilevel logistic regression to investigate contextual phenomena. J Epidemiol Community Health 2006;60:290-7.
28 wilson DK, Kirtland KA, Ainsworth BE, et al. Socioeconomic status and perceptions of access and safety for physical activity. Ann Behav Med 2004;28:20-8.
29 Hoehner cm, Brennan Ramirez LK, Elliott mB, et al. perceived and objective environmental measures and physical activity among urban adults. Am J Prev Med 2005;28:105-16.
30 cummins S, macintyre S. Food environments and obesity--neighbourhood or nation? Int J Epidemiol 2006;35:100-4.
31 macKinnon Dp, Krull JL, Lockwood cm. Equivalence of the mediation, confounding and suppression effect. Prev Sci 2000;1:173-81.
32 Frank LD, Schmid TL, Sallis JF, et al. Linking objectively measured physical activity with objectively measured urban form: findings from SmARTRAQ. Am J Prev Med 2005;28:117-25.
33 mcGinn Ap, Evenson KR, Herring AH, et al. The relationship between leisure, walk-ing, and transportation activity with the natural environment. Health Place 2006.
Kamphuis_09.indd 162 20-8-2008 10:34:43

Socioeconomic status, environmental factors and diet
Part 3
Kamphuis_09.indd 163 20-8-2008 10:34:44

Kamphuis_09.indd 164 20-8-2008 10:34:44

A systematic review of environmental factors and energy and fat intakes among adults: is there evidence for environments that encourage obesogenic dietary intakes?
9
Giskes K, Kamphuis CBm, Van Lenthe Fj, Kremers S, Droomers m & Brug j (2007) A systematic review of environmental factors and energy and fat intakes among adults: is there evidence for environments that encourage obesogenic dietary intakes? Public Health Nutr, 10(10): 1005-1017.
Kamphuis_09.indd 165 20-8-2008 10:34:44

166 Part III Socioeconomic status, environmental factors and diet
Abstract
Background The goal of this study is to review the literature examining associa-tions between environmental factors, energy and fat intakes among adults, and to identify issues for future research.
Methods Literature searches of studies published between 1980 and 2004 were conducted in major databases (i.e. pubmed, Human Nutrition, web of Science, psychInfo, and Sociofile). Additional articles were located by citation tracking.
Results Twenty-one articles met the inclusion criteria. No study provided a clear conceptualisation of how environmental factors may influence these dietary intakes. Availability, social, cultural and material aspects of the environment were relatively understudied compared with other factors such as seasonal/day of the week variation and work-related factors. Few studies examined the spe-cific environmental factors implicated in the obesity epidemic, and there was little study replication. All studies were observational and cross-sectional.
Conclusion It is too premature to conclude whether or not environmental factors play a role in obesogenic and unhealthy dietary intakes. more studies need to examine associations with those environmental factors thought to contribute to obesogenic environments. There needs to be more development in theories that conceptualise the relationship between environmental factors and dietary intakes.
Kamphuis_09.indd 166 20-8-2008 10:34:44

1679 Environmental correlates of obesity-related intakes
Introduction
Unhealthy dietary intakes are risk factors for cardiovascular diseases and some forms of cancer [1], which are the most common causes of mortality in western countries [2-3]. High levels of energy intakes play a role by contributing to overweight and obesity [4-5]. Total fat and saturated fat intakes supply energy which contributes to overweight and obesity, and saturated fat influences blood levels of harmful (LDL) cholesterol [1]. In an effort to achieve reductions in morbidity and mortality, dietary guidelines have been developed that endorse a suitable energy intake and promote low consumption levels of total and satu-rated fats [5-6].
Until recently, the mainstream thought was that most determinants of dietary intakes occurred within the individual. Taste preferences, habit, nutrition knowledge, intentions, attitudes, outcome expectancies, self-efficacy and a number of other individual-level factors were considered to primarily drive what people eat [7-8]. However, these determinants were found to only explain a small portion of the variance in dietary intakes [9]. Recently, there has been a growing interest in the role of the environment in influencing people’s dietary behaviour. This social ecological view of health emphasises that individuals interact with their environments [10] and that characteristics of the environ-ment influence their health behaviours.
The rising prevalence of overweight and obesity is one of the major public health concerns today. changes in dietary and physical activity behaviours are thought to underlie this trend. The determinants of these changes are less well known. Since Swinburn and Egger introduced their ecological paradigm for understanding obesity [11], and argued that an increasingly ‘obesogenic environment’ contributed to the trends, there has been great popularity in examining whether environmental factors are associated with obesity-related behaviours.
A number of position papers and narrative reviews have identified environmen-tal factors associated with the obesity epidemic [12-13]; however no system-atic review has examined the role of environmental factors in dietary intakes. For example, the increasing densities of fast food restaurants and convenience stores are thought to promote unhealthy food choices [14]. media marketing of high-fat foods, their low prices and the greater range of convenience foods available are considered to be contributing factors [11, 14]. The increased par-ticipation of women in the workforce has resulted in a greater reliance on con-venience foods and less structured meal patterns, contributing to less healthy dietary intakes [15]. The greater variety of foods available in supermarkets may contribute to populations deviating from their traditional diets, adopting less
Kamphuis_09.indd 167 20-8-2008 10:34:44

168 Part III Socioeconomic status, environmental factors and diet
healthy intakes, and portion sizes have increased [15]. The presumed impor-tance of these environmental determinants of unhealthy dietary behaviours have resulted in strong appeals for a better understanding of the role of envi-ronmental factors in dietary intakes and environmental interventions.
we conducted a systematic review of studies on environmental factors associ-ated with energy, total and saturated fat intakes to summarise the current sci-entific evidence. we aimed to address which environmental factors have been examined in relation to these dietary outcomes to date, and identify issues for future research.
Methods
For the purposes of this study, the environment was defined as everything out-side the individual [16]. A framework used in previous research [17], that iden-tifies four categories of environmental factors related to health behaviours was used to classify different environmental factors during the review process. The framework shares common features with ecological models [18-19], stressing the importance of multiple types of environmental influences. The four catego-ries that form this framework are:(a) Accessibility and availability. Including physical and financial accessibility
of products and shops that are needed for an (un)healthy diet (e.g. access to shops, and availability of high fat foods and less healthy snacks).
(b) Social conditions. These arise from inter-personal interactions and include social relationships (e.g. family/marital status), social support and psycho-social stressors such as relationship difficulties.
(c) cultural conditions. These are the result of non-personal interactions or engagement with a larger group of people, such as culture-specific eating patterns, health value orientations, food experiences in childhood, and cul-tural participation.
(d) material conditions. Including financial situation (e.g. household income), material and social deprivation, and unfavourable working, housing and neighbourhood conditions (e.g. neighbourhood deprivation). These may affect behaviour through one of the previous environmental factors. For instance, a person’s budgetary situation may partly determine one’s access to products and facilities. And living or working in an unfavourable envi-ronment might induce stress, which may relate to indifference concerning a healthy diet.
Search strategyThe current study was conducted within a larger study reviewing the literature of environmental factors associated with energy, fat, fruit and vegetable con-sumption among adults. Therefore, literature searches were conducted for a
Kamphuis_09.indd 168 20-8-2008 10:34:44

1699 Environmental correlates of obesity-related intakes
broader range of outcomes than those presented here, and included keywords for fruits and vegetables. Results on environmental factors associated with fruit and vegetable intakes can be found elsewhere [20].
A review protocol based on guidelines from the cochrane Reviewer’s Hand-book [21] was used. Studies conducted among human subjects between 1 Janu-ary 1980 and 31 December 2004 were located by searches of several major databases (i.e. pubmed, Human Nutrition, web of Science, psychInfo, and Sociofile).
Broad search terms were used in the database searches to ensure that all potentially relevant articles entered the screening process. Each database was searched using database-specific indexing terms; suitable terms were selected from lists of the database indexing system. For databases that did not have their own indexing terms (i.e. Human Nutrition and Sociofile), we searched for keywords in titles. The sensitivity of searches was tested by seeing whether they located several key articles. Searches located 20653 potentially relevant titles (7440 in pubmed, 8325 in Human Nutrition, 4828 in web of Science, 58 in psychInfo and two in Sociofile). Detailed search strategies for each database can be found at: http: //mgzlx4.erasmusmc.nl/pwp/?ckamphuis.
Inclusion criteriaTo be included, studies must have been published in English and conducted among a population-based sample of adults (i.e. studies examining disease or patient sub-groups, those conducted among participants below 18 years or above 60 years of age were excluded) and they must have quantified dietary intakes. In addition to this, studies must have been conducted in an estab-lished market economy as defined by the world Bank [22], and the dependent variable(s) must have been energy intake, total/saturated fat intakes or fruit and vegetable intakes. Intervention studies and studies with a research design that made it impossible to decipher associations between environmental factors and the outcome behaviours were excluded.
Title scanningThe title screening process was performed by two reviewers (KG and cK) and took place in three steps. Firstly, the titles located from the search results were scanned, to exclude those out of the scope of the current study. Then the abstracts of all titles were examined by the reviewers. At this step, each reviewer produced a list of suitable articles. These lists were then combined, and both reviewers examined the pooled list independently. They read all study abstracts in the pooled list, and each produced a ‘short list’ of suitable articles. Discrep-ancies between reviewers in the ‘short lists’ were discussed, and a consensus was reached on whether or not the article(s) in question would be incorporated.
Kamphuis_09.indd 169 20-8-2008 10:34:44

170 Part III Socioeconomic status, environmental factors and diet
A total of 55 articles were identified for inclusion at this stage. The reference lists of these articles were scanned and the selection of studies from the refer-ence lists followed the same procedure outlined above. Another 12 publications extracted from reference lists were included in the review.
Data extraction and summarisationThe reviewers extracted data from half of the studies each. The study’s details (i.e. the environmental factor(s) and dietary outcome(s) examined, whether environmental factors were objectively measured or self-reported, sample size, response rate, factors adjusted for in the analyses and the associations found) were summarised in data extraction tables.
In studies where sufficient data were available, effect sizes (ES) were calcu-lated to interpret the magnitude of association of the environmental factors and make comparisons between studies. The formulae of cohen [23] were applied, adjusting for sample size. The magnitude of the ES were also inter-preted according to the guidelines of cohen, with cut-off points of 0.2-0.5 for small ES, 0.5-0.8 for moderate ES and >0.8 for large ES.
Results
Twenty-seven of the 67 studies selected for detailed review were excluded because they were design/theoretical papers or only mentioned environmental factors in their Discussion sections. Nineteen articles were excluded because they did not examine energy, total fat or saturated fat intakes, therefore 21 articles remained in the current review. Table 1 summarises the country where the study was conducted, the environmental factor(s) examined and their mea-surement. most studies examined more than one dietary outcome, and were conducted in the USA (n=11), UK/Europe (n=6) or canada/Australia/Israel (n=4). Just less than half of the studies (n=9) measured the environmental factors objectively. All studies were cross-sectional. Only one study used multi-level analyses [24], census block districts were the area-level used in these anal-yses. All remaining studies were individual-level analyses.
Kamphuis_09.indd 170 20-8-2008 10:34:44

1719 Environmental correlates of obesity-related intakes
Tabl
e 9.
1 D
etai
ls o
f inc
lude
d st
udie
sFi
rst a
utho
r(y
ear)
Die
tary
out
com
es e
xam
ined
Coun
try
Envi
ronm
enta
l fac
tor(
s)w
as e
nviro
nmen
tal f
acto
r su
bjec
tivel
y or
obj
ectiv
ely
mea
sure
d?
Chea
dle
(199
1) (4
3)To
tal f
atU.
S.A.
Shel
f spa
ce o
ccup
ied
by h
ealth
y fo
ods i
n st
ores
obje
ctiv
eD
e Ca
stro
(199
2) (4
4)En
ergy
, tot
al fa
tU.
S.A.
num
ber o
f peo
ple
pres
ent d
urin
g m
eal
subj
ectiv
eD
e Cr
aene
(199
0) (3
5)To
tal f
atBe
lgiu
mLo
catio
n of
resid
ence
, mar
ital s
tatu
s,su
bjec
tive
(bot
h)D
iehr
(199
3) (4
5)To
tal f
atU.
S.A.
Perc
enta
ge c
omm
unity
not
reac
hing
reco
mm
ende
d in
take
ssu
bjec
tive
Die
z-Ro
ux (1
999)
Satu
rate
d fa
tU.
S.A.
med
ian
inco
me
of n
eigh
bour
hood
, hou
seho
ld in
com
esu
bjec
tive
(bot
h)
Frie
l (20
03) (
25)
Ener
gy, t
otal
fat,
satu
rate
d fa
tIre
land
Urba
n/ru
ral r
esid
ence
, mar
ital s
tatu
s, li
ving
situ
atio
n (a
lone
/with
oth
ers)
subj
ectiv
e (a
ll)
Gib
ney
(199
3) (4
6)En
ergy
, tot
al fa
tIre
land
Fam
ily c
ircum
stan
ces (
mar
ried,
chi
ldre
n)su
bjec
tive
Hai
nes
(200
3) (2
9)En
ergy
, tot
al fa
tU.
S.A.
wee
kend
/wee
kday
, sea
son
subj
ectiv
eH
elle
rste
dt (1
997)
(38)
Tota
l fat
U.S.
A.Ps
ycho
logi
cal d
eman
ds, j
ob la
titud
e, jo
b st
rain
subj
ectiv
ejo
hans
son
(199
9) (3
6)To
tal f
atno
rway
Loca
tion
of re
siden
ceHo
useh
old
inco
me
obje
ctiv
e (b
oth)
mcC
ann
(199
0) (3
3)En
ergy
, tot
al fa
t, sa
tura
ted
fat
U.S.
A.Pe
riod
of h
igh/
low
wor
kloa
dob
ject
ive
mor
land
(200
2) (4
7)To
tal f
at, s
atur
ated
fat
U.S.
A.w
heth
er o
r not
ther
e w
ere
the
follo
win
g fo
od s
tore
s in
the
resid
entia
l are
a:Su
perm
arke
ts, G
roce
ry s
tore
s, F
ull s
ervi
ce re
stau
rant
sFa
st fo
od re
stau
rant
s
obje
ctiv
e (a
ll)
Pom
erle
au (1
997)
(37)
Tota
l fat
Cana
daHo
useh
old
inco
me,
Sou
rce
of in
com
esu
bjec
tive
(bot
h)
Rayn
or (2
004)
(48)
Tota
l fat
U.S.
A.Av
aila
bilit
y of
hig
h fa
t foo
ds a
t hom
esu
bjec
tive
Rolls
(200
2) (2
7)
Ener
gyU.
S.A.
Port
ion
size
obje
ctiv
eRo
lls (2
004)
(28)
Ener
gyU.
S.A.
Port
ion
size
obje
ctiv
eRu
tisha
user
(199
4) (2
6)En
ergy
, tot
al fa
t, sa
tura
ted
fat
Aust
ralia
Resid
ing
in a
low
or h
igh
soci
oeco
nom
ic a
rea
obje
ctiv
eSh
ahar
(200
1) (3
0)En
ergy
, tot
al fa
t, sa
tura
ted
fat
Isra
elSe
ason
(sum
mer
/win
ter)
obje
ctiv
eSu
bar (
1994
) (31
)En
ergy
, tot
al fa
tU.
S.A.
Seas
on: s
umm
er o
r win
ter
obje
ctiv
eTa
rasu
k (1
999)
(49)
Ener
gy, t
otal
fat
Cana
daHo
useh
old
food
inse
curit
y su
bjec
tive
Van
Stav
eren
(199
6) (3
2)En
ergy
, tot
al fa
t, sa
tura
ted
fat
The
net-
herla
nds
Seas
on: s
umm
er o
r win
ter
obje
ctiv
e
war
dle
(200
0) (3
4)En
ergy
U.K.
Perio
d of
hig
h/lo
w w
orkl
oad
obje
ctiv
ew
ardl
e (2
000)
(34)
Tota
l fat
, sat
urat
ed fa
tU.
K.Pe
riod
of h
igh/
low
wor
kloa
dob
ject
ive
Kamphuis_09.indd 171 20-8-2008 10:34:44

172 Part III Socioeconomic status, environmental factors and diet
The studies examined 81 associations between intakes and environmental fac-tors, of which 41 were significant. Table 2 briefly summarises the associations found between environmental factors and each of the dietary intakes. This table shows that associations between environmental factors and intakes have been examined mostly for total fat consumption (39 associations were tested) compared to energy and saturated fat consumptions (22 and 20 associations were tested, respectively). Relatively few associations tested the potential influ-ence of cultural factors on dietary intakes. There was little replication of stud-ies testing the same hypotheses; often two associations were tested in different samples (e.g. men and women) from the same study.
Table 9.2 Summary of associations found in the reviewed articlesEnvironmental factors Dietary intakes
Energy Total fat Saturated fat
Availability
high fat food stocked in stores +1
high fat foods available at home +1
grocery store in the residential area 1 +1supermarket in the residential area 1 1
full service restaurant in the residential area 1 1
fast food restaurant in the residential area 1 1
Social factorsbeing married +2 +2 / 2 -2having children 1 1living with others +1 / -1 +2 +2
Cultural factors
presence of others during mealtimes +1 +1
% community exhibiting high fat intakes +1
material factorsliving in a rural area (compared to urban area) +2 +2/2 +2living a disadvantaged area 2 2 4/-2household income 3
household food insecurity -1 1
other factors
portion size +2
weekend (compared to weekdays) +1 +1winter (compared to summer) +1/2/3 +2/1 +1/1workload +2 +1/1 +1 / 1work-related psychological demands +1/1
job strain +1/1
job latitude 2
living in a northern region (in Belgium) +2
blue: number of significant effects found for the combination determinant - dietary outcome.black: number of non-significant effects found for the combination determinant - dietary outcome, or for which information on significance was not available. + positive association between environmental determinant and dietary outcome. - negative association between environmental determinant and dietary outcome.
Kamphuis_09.indd 172 20-8-2008 10:34:44

1739 Environmental correlates of obesity-related intakes
Tables 3-5 detail the study characteristics and findings for each dietary out-come more extensively. For brevity, the following sections only describe find-ings for environmental factors for which two or more associations were tested.
Associations between environmental factors and energy intakesTable 3 details the characteristics and findings of studies examining associa-tions between environmental factors and energy intakes. Fourteen of the 22 associations examined in these studies demonstrated a significant relationship between the environmental factor and energy intakes.
No studies looked at associations between availability factors (such as types of stores available and what they stocked) and energy intakes. The influence of social factors (i.e. being married, having children or living with others) on energy intakes were examined in a number of studies. Living with others dem-onstrated large associations with energy intakes that differed in direction for men and women [25]. One study found that men living alone had lower energy intakes than those living with others; however lower energy intakes were found among women that lived with others. The same study found that marital status was strongly associated with energy intakes; intakes were higher among mar-ried participants compared to their single counterparts [25].
Only one study examined associations between cultural factors (the presence of others during mealtimes) and energy intakes, while a number of studies looked at material factors. Urban/rural residence demonstrated a large asso-ciation with energy intakes; men and women living in rural areas had greater energy intakes than those in urban areas [25]. In a study that contrasted the energy intakes of men and women living in areas with different socioeconomic characteristics, no differences were found [26].
Other potential determinants of energy intakes that were examined in other studies were portion size, weekday/seasonal variations in intakes and associa-tions between workload and energy intakes. Two studies demonstrated strong direct effects between portion sizes and energy intakes [27-28]. Seasonal vari-ations in intakes were measured in countries differing considerably in their climate (US, Israel and Europe), and mixed associations were seen [29-32]. Two studies found small differences in mean energy intakes between winter and summer, one found that intakes were marginally lower in winter among men [31] while another study among men found that energy intakes were slightly higher in winter [30]. A study among women found no seasonal varia-tion in energy intakes [32]. Greater energy intakes have been associated with higher workload in two studies, but the magnitude of these effects were small [33-34].
Kamphuis_09.indd 173 20-8-2008 10:34:44

174 Part III Socioeconomic status, environmental factors and diet
Tabl
e 9.
3 Re
sults
of s
tudi
es e
xam
inin
g en
viro
nmen
tal f
acto
rs a
ssoc
iate
d w
ith e
nerg
y in
take
sFi
rst a
utho
r(y
ear)
Sam
ple
size
(r
espo
nse
rate
%)
Envi
ronm
enta
l fac
tor(
s)Fi
ndin
gsw
as a
ssoc
iatio
n si
gnifi
cant
?am
agni
tude
of e
ffec
t siz
eAd
just
ed fo
r
De
Cast
ro
(199
2) (4
4)15
3(n
ot a
vaila
-bl
e)
num
ber o
f peo
ple
pres
-en
t dur
ing
mea
lIn
take
incr
ease
d 22
.50
Cal p
er p
erso
n pr
esen
tY
Unab
le to
cal
cula
teni
l
Frie
l(2
003)
(25)
6539
(63)
mar
ital s
tatu
s, u
rban
/ru
ral r
esid
ence
, liv
ing
situa
tion
(alo
ne/w
ith
othe
rs)
Sing
le m
en c
onsu
med
0.2
6 m
j/da
y le
ss
than
mar
ried
men
, tho
se li
ving
in ru
ral
area
s con
sum
ed 0
.03
mj/
day
mor
e th
an
thos
e in
urb
an a
reas
and
thos
e liv
ing
alon
e co
nsum
ed 1
.2 m
j/da
y le
ss th
an m
en
livin
g w
ith o
ther
s.Si
ngle
wom
en c
onsu
med
0.1
5 m
j/da
y le
ss
than
thei
r mar
ried
coun
terp
arts
, wom
en
in ru
ral a
reas
con
sum
ed 0
.19
mj/
day
mor
e th
an th
ose
in u
rban
are
as, a
nd w
omen
liv
ing
alon
e co
nsum
ed 0
.51
mj/
day
mor
e th
an w
omen
livi
ng w
ith o
ther
peo
ple.
men
:m
arita
l sta
tus:
YUr
ban/
rura
l: Y
Livi
ng si
tuat
ion:
Yw
omen
:m
arita
l sta
tus:
YUr
ban/
rura
l: Y
Livi
ng si
tuat
ion:
Y
men
:m
arita
l sta
tus:
larg
eUr
ban/
rura
l res
iden
ce: l
arge
Livi
ng si
tuat
ion:
larg
ew
omen
:m
arita
l sta
tus:
larg
eUr
ban/
rura
l res
iden
ce: l
arge
Livi
ng si
tuat
ion:
larg
e
Age,
gen
der,
educ
atio
n, o
ccup
a-tio
n, m
edic
al c
ard
elig
ibili
ty, m
arita
l st
atus
, loc
atio
n of
re
siden
ce, n
umbe
r in
hous
ehol
d.
Gib
ney
(199
3) (4
6)87 w
omen
onl
y(9
4)
Fam
ily c
ircum
stan
ces
(mar
ried,
chi
ldre
n)Si
ngle
mot
hers
con
sum
ed 0
.3 m
j/da
y le
ss
than
mot
hers
with
1-2
chi
ldre
n.
not a
vaila
ble
Unab
le to
cal
cula
teni
l
Hai
nes
(200
3) (2
9)99
0(n
ot a
vaila
-bl
e)
wee
kend
/wee
kday
and
se
ason
Inta
kes 8
2 Ca
l/day
hig
her o
n w
eeke
nds
and
23 C
al/d
ay h
ighe
r in
win
ter.
Day
of w
eek:
YSe
ason
: YUn
able
to c
alcu
late
Age
, gen
der,
eth
-ni
city
, inc
ome,
re
gion
, urb
an/
rura
l res
iden
ce,
hous
ehol
d si
ze,
rece
ipt
of s
ocia
l se
curi
ty/f
ood
assi
stan
ce.
mcC
ann
(199
0) (3
3)10 (n
ot a
vaila
-bl
e)
wor
kloa
dDu
ring
perio
ds o
f hig
h w
orkl
oad
part
ici-
pant
s con
sum
ed 2
40 c
al/d
ay m
ore
than
pe
riods
of l
ow w
orkl
oad.
YSm
all e
ffect
nil
Kamphuis_09.indd 174 20-8-2008 10:34:44

1759 Environmental correlates of obesity-related intakes
Firs
t aut
hor
(yea
r)Sa
mpl
e si
ze
(res
pons
e ra
te %
)
Envi
ronm
enta
l fac
tor(
s)Fi
ndin
gsw
as a
ssoc
iatio
n si
gnifi
cant
?am
agni
tude
of e
ffec
t siz
eAd
just
ed fo
r
Rutis
-ha
user
(199
4) (2
6)
225
(57-
77)
Resid
ing
in a
low
or h
igh
soci
oeco
nom
ic a
rea
men
and
wom
en li
ving
in d
isadv
anta
ged
area
s con
sum
ed 0
.5 a
nd 0
.4m
j/da
y le
ss
ener
gy (r
espe
ctiv
ely)
than
thos
e in
adv
an-
tage
d ar
eas.
nS
for m
en a
nd
wom
enSm
all
nil
Shah
ar(2
001)
(30)
94 men
onl
y(n
ot a
vaila
-bl
e)
Seas
on (s
umm
er/w
inte
r)In
win
ter,
men
con
sum
ed 1
58 c
al/d
ay
mor
e th
an in
sum
mer
. n
Sno
effe
ctni
l
Suba
r(1
994)
(31)
2014
3Se
ason
(sum
mer
/win
ter)
In w
inte
r, m
en c
onsu
med
39
Cal/d
ay le
ss
than
in th
e su
mm
er. I
n w
inte
r, w
omen
co
nsum
ed 1
4 Ca
l/day
mor
e th
an in
the
sum
mer
.
not a
vaila
ble
Unab
le to
cal
cula
teAg
e, ra
ce, r
egio
n,
educ
atio
n, p
over
ty
inde
x.
Tara
suk
(199
9) (4
9)14
5w
omen
onl
y(6
8.3)
Hous
ehol
d fo
od in
se-
curit
y w
omen
in h
ouse
hold
s with
hig
h fo
od
inse
curit
y co
nsum
ed 1
058
kj/d
ay le
ss th
en
thos
e w
ith lo
w fo
od in
secu
rity.
YUn
able
to c
alcu
late
Disp
osab
le in
com
e,
pres
ence
of e
mpl
oy-
men
t inc
ome,
pre
s-en
ce o
f a p
artn
er
in th
e ho
useh
old,
w
omen
’s le
vel o
f ed
ucat
ion,
smok
-in
g st
atus
, eth
nic
iden
tity
Van
Stav
e-re
n(1
996)
(32)
114
wom
en o
nly
(not
ava
ila-
ble)
Seas
on: s
umm
er o
r w
inte
rTh
ere
was
no
diffe
renc
e in
ene
rgy
inta
kes
betw
een
sum
mer
and
win
ter
nS
no e
ffect
Day
of w
eek
war
dle
(200
0) (3
4)90 (n
ot a
vaila
-bl
e)
wor
kloa
dDu
ring
a hi
gh w
orkl
oad
perio
d, e
nerg
y in
take
s wer
e 10
9 Ca
l/day
hig
her t
han
durin
g a
low
wor
kloa
d pe
riod
YSm
all e
ffect
nil
a Y=
effe
cts
was
sta
tistic
ally
sig
nific
ant (
p ≤
0.05
). N
S= e
ffect
was
not
sig
nific
ant.
Tabl
e 9.
3 (C
ontin
ued)
Kamphuis_09.indd 175 20-8-2008 10:34:44

176 Part III Socioeconomic status, environmental factors and diet
Associations between environmental factors and total fat intakesStudies examining associations between environmental factors and total fat intakes are described in Table 4. Sixteen of the 39 associations tested reached statistical significance.
There were no associations between availability factors and total fat intake that were replicated. A number of studies examined potential social determinants of fat intakes. marital status and living situation demonstrated large effects with fat intakes in a US study [25] and showed being married or living with others was associated with higher fat intakes compared to being single or living alone. However, a Belgian study found no association between marital status and fat intakes [35].
There were no replicated associations tested for any cultural factors and total fat intake. However, a number of studies examined associations with mate-rial factors. A US study found that living in a rural area was associated with a higher fat intake, and the effect size of this relationship was large [25]. How-ever, a Norwegian study found no significant urban/rural differences [36]. Fat intakes in relation to the socioeconomic characteristics of the residential area were examined in one study but no significant association was found [26]. Two studies examined the economic circumstances of households in relation to fat intakes, and took a number of confounding factors into account, but found that household income was not associated with fat intakes [36-37].
The majority of studies examined associations with other factors. There were mixed findings about seasonal variations in fat intake. Two small studies (one in Israel and one in Europe) demonstrated higher fat intakes in winter com-pared to summer [30, 32], however a US study found very marginal differ-ences in fat intakes between seasons [31]. Three studies examined associations between work conditions such as psychological demands, job strain and work-load and fat intakes [33, 34, 38]. One study found no association between psy-chological demands and job strain and women’s fat intakes, whereas men with high psychological demands and high job strain consumed more fat than their counterparts with low psychological demands and low job strain [38]. A small study showed a positive relationship of moderate magnitude between workload and fat intakes [33], whereas another study found no association between work stress and fat intakes [34]. Location of residence also showed a relationship with fat intakes in a Belgian study, which illustrated significant regional differ-ences in fat consumption [35].
Kamphuis_09.indd 176 20-8-2008 10:34:44
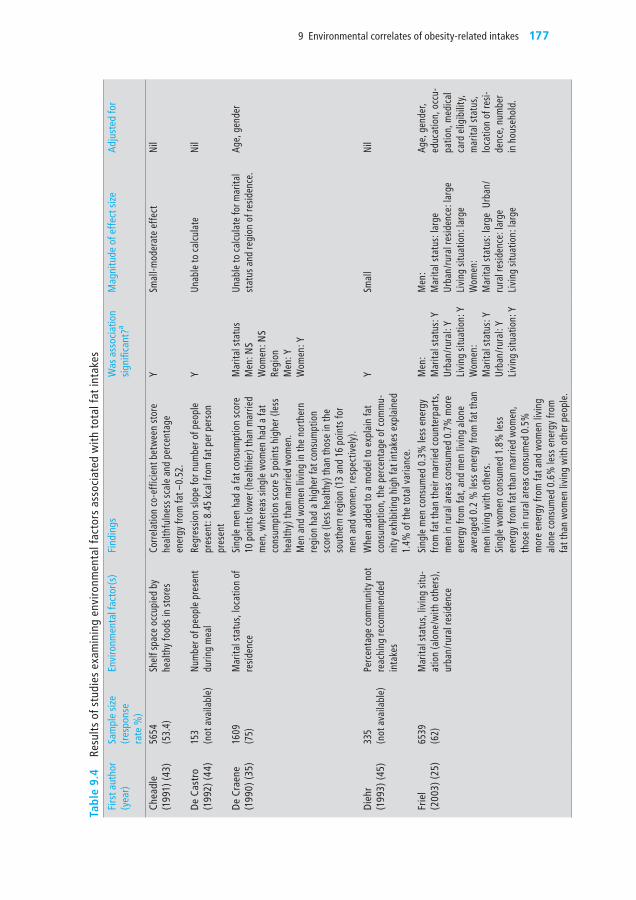
1779 Environmental correlates of obesity-related intakes
Tabl
e 9.
4 Re
sults
of s
tudi
es e
xam
inin
g en
viro
nmen
tal f
acto
rs a
ssoc
iate
d w
ith to
tal f
at in
take
sFi
rst a
utho
r(y
ear)
Sam
ple
size
(r
espo
nse
rate
%)
Envi
ronm
enta
l fac
tor(
s)Fi
ndin
gsw
as a
ssoc
iatio
n si
gnifi
cant
?am
agni
tude
of e
ffec
t siz
eAd
just
ed fo
r
Chea
dle
(199
1) (4
3)56
54(5
3.4)
Shel
f spa
ce o
ccup
ied
by
heal
thy
food
s in
stor
esCo
rrel
atio
n co
-eff
icie
nt b
etw
een
stor
e he
alth
fuln
ess s
cale
and
per
cent
age
ener
gy fr
om fa
t –0.
52.
YSm
all-m
oder
ate
effe
ctni
l
De
Cast
ro(1
992)
(44)
153
(not
ava
ilabl
e)nu
mbe
r of p
eopl
e pr
esen
t du
ring
mea
lRe
gres
sion
slope
for n
umbe
r of p
eopl
e pr
esen
t: 8.
45 k
cal f
rom
fat p
er p
erso
n pr
esen
t
YUn
able
to c
alcu
late
nil
De
Crae
ne(1
990)
(35)
1609
(75)
mar
ital s
tatu
s, lo
catio
n of
re
siden
ceSi
ngle
men
had
a fa
t con
sum
ptio
n sc
ore
10 p
oint
s low
er (h
ealth
ier)
than
mar
ried
men
, whe
reas
sing
le w
omen
had
a fa
t co
nsum
ptio
n sc
ore
5 po
ints
hig
her (
less
he
alth
y) th
an m
arrie
d w
omen
.m
en a
nd w
omen
livi
ng in
the
nort
hern
re
gion
had
a h
ighe
r fat
con
sum
ptio
n sc
ore
(less
hea
lthy)
than
thos
e in
the
sout
hern
regi
on (1
3 an
d 16
poi
nts f
or
men
and
wom
en, r
espe
ctiv
ely)
.
mar
ital s
tatu
sm
en: n
Sw
omen
: nS
Regi
onm
en: Y
wom
en: Y
Unab
le to
cal
cula
te fo
r mar
ital
stat
us a
nd re
gion
of r
esid
ence
.Ag
e, g
ende
r
Die
hr(1
993)
(45)
335
(not
ava
ilabl
e)Pe
rcen
tage
com
mun
ity n
ot
reac
hing
reco
mm
ende
d in
take
s
whe
n ad
ded
to a
mod
el to
exp
lain
fat
cons
umpt
ion,
the
perc
enta
ge o
f com
mu-
nity
exh
ibiti
ng h
igh
fat i
ntak
es e
xpla
ined
1.
4% o
f the
tota
l var
ianc
e.
YSm
all
nil
Frie
l(2
003)
(25)
6539
(62)
mar
ital s
tatu
s, li
ving
situ
-at
ion
(alo
ne/w
ith o
ther
s),
urba
n/ru
ral r
esid
ence
Sing
le m
en c
onsu
med
0.3
% le
ss e
nerg
y fro
m fa
t tha
n th
eir m
arrie
d co
unte
rpar
ts,
men
in ru
ral a
reas
con
sum
ed 0
.7%
mor
e en
ergy
from
fat,
and
men
livi
ng a
lone
av
erag
ed 0
.2 %
less
ene
rgy
from
fat t
han
men
livi
ng w
ith o
ther
s.Si
ngle
wom
en c
onsu
med
1.8
% le
ss
ener
gy fr
om fa
t tha
n m
arrie
d w
omen
, th
ose
in ru
ral a
reas
con
sum
ed 0
.5%
m
ore
ener
gy fr
om fa
t and
wom
en li
ving
al
one
cons
umed
0.6
% le
ss e
nerg
y fro
m
fat t
han
wom
en li
ving
with
oth
er p
eopl
e.
men
:m
arita
l sta
tus:
YUr
ban/
rura
l: Y
Livi
ng si
tuat
ion:
Yw
omen
:m
arita
l sta
tus:
YUr
ban/
rura
l: Y
Livi
ng si
tuat
ion:
Y
men
:m
arita
l sta
tus:
larg
eUr
ban/
rura
l res
iden
ce: l
arge
Livi
ng si
tuat
ion:
larg
ew
omen
:m
arita
l sta
tus:
larg
e U
rban
/ru
ral r
esid
ence
: lar
geLi
ving
situ
atio
n: la
rge
Age,
gen
der,
educ
atio
n, o
ccu-
patio
n, m
edic
al
card
elig
ibili
ty,
mar
ital s
tatu
s, lo
catio
n of
resi-
denc
e, n
umbe
r in
hou
seho
ld.
Kamphuis_09.indd 177 20-8-2008 10:34:44

178 Part III Socioeconomic status, environmental factors and diet
Firs
t aut
hor
(yea
r)Sa
mpl
e si
ze
(res
pons
e ra
te %
)
Envi
ronm
enta
l fac
tor(
s)Fi
ndin
gsw
as a
ssoc
iatio
n si
gnifi
cant
?am
agni
tude
of e
ffec
t siz
eAd
just
ed fo
r
Gib
ney
(199
3) (4
6)87 w
omen
onl
y(9
4)
Fam
ily c
ircum
stan
ces
(mar
ried,
chi
ldre
n)Si
ngle
mot
hers
con
sum
ed 5
.4%
less
of
thei
r ene
rgy
inta
ke a
s fat
than
mot
hers
w
ith 1
-2 c
hild
ren.
not a
vaila
ble
Unab
le to
cal
cula
teni
l
Hai
nes
(200
3) (2
9)99
00(n
ot a
vaila
ble)
wee
kend
/wee
kday
0.
7% h
ighe
r ene
rgy
from
fat o
n w
eek-
ends
. Y
Unab
le to
cal
cula
teAg
e, g
ende
r, et
hnic
ity, e
nerg
y in
take
, inc
ome,
re
gion
, urb
an/
rura
l res
iden
ce,
hous
ehol
d siz
e,
rece
ipt o
f soc
ial
secu
rity/
food
as
sista
nce
Hel
lers
tedt
(199
7) (3
8)38
43(r
ange
of
50-9
3% b
y w
orks
ite)
Psyc
holo
gica
l dem
ands
in
job,
job
latit
ude
and
job
stra
in
men
with
hig
h ps
ycho
logi
cal d
eman
ds in
th
eir j
ob c
onsu
med
51
Cal/d
ay m
ore
than
m
en w
ith lo
w p
sych
olog
ical
dem
ands
. w
omen
with
hig
h ps
ycho
logi
cal d
eman
ds
cons
umed
4 C
al/d
ay le
ss.
men
and
wom
en w
ith lo
w jo
b la
titud
e co
nsum
ed 1
4 an
d 3
Cal/d
ay le
ss (r
espe
c-tiv
ely)
than
thei
r cou
nter
part
s with
hig
h jo
b la
titud
e.
men
with
hig
h jo
b st
rain
con
sum
ed 2
2 Ca
l/day
mor
e an
d w
omen
with
hig
h jo
b st
rain
con
sum
ed 3
Cal
/day
less
than
th
ose
with
low
job
stra
in.
Psyc
holo
gica
l de
man
dsm
en: Y
wom
en: n
Sjo
b la
titud
em
en: n
Sw
omen
: nS
job
stra
inm
en: Y
wom
en: n
S
Unab
le to
cal
cula
te fo
r psy
cho-
logi
cal d
eman
dsUn
able
to c
alcu
late
for j
ob
latit
ude
no e
ffect
for j
ob s
trai
n fo
r men
an
d w
omen
Gend
er, a
ge,
mar
ital s
tatu
s, ra
ce, t
ime
empl
oyed
, ho
urs w
orke
d pe
r wee
k, jo
b ca
tego
ry, s
alar
y, en
viro
nmen
tal/
phys
ical
haz
ards
, ed
ucat
ion.
Tabl
e 9.
4 (C
ontin
ued)
Kamphuis_09.indd 178 20-8-2008 10:34:44

1799 Environmental correlates of obesity-related intakes
Firs
t aut
hor
(yea
r)Sa
mpl
e si
ze
(res
pons
e ra
te %
)
Envi
ronm
enta
l fac
tor(
s)Fi
ndin
gsw
as a
ssoc
iatio
n si
gnifi
cant
?am
agni
tude
of e
ffec
t siz
eAd
just
ed fo
r
joha
nsso
n(1
999)
(36)
3144
(63)
Hous
ehol
d in
com
e, lo
ca-
tion
of re
siden
ceTh
ere
was
no
diffe
renc
e in
fat i
ntak
es
betw
een
inco
me
grou
ps fo
r men
and
w
omen
.Ru
ral m
en a
nd w
omen
der
ived
1%
m
ore
of th
eir e
nerg
y in
take
s fro
m fa
t co
mpa
red
to th
eir c
ount
erpa
rts l
ivin
g in
citi
es.
Inco
me
and
plac
e of
resid
ence
wer
e n
S fo
r men
and
w
omen
Inco
me
and
plac
e of
resid
ence
no
effe
ct fo
r men
and
wom
enAg
e, g
ende
r, ed
ucat
ion
mcC
ann
(199
0) (3
3)10 (n
ot a
vaila
ble)
wor
kloa
dDu
ring
perio
ds o
f hig
h w
orkl
oad
part
ici-
pant
s con
sum
ed 5
% m
ore
ener
gy fr
om
fat t
han
perio
ds o
f low
wor
kloa
d.
Ym
oder
ate
nil
mor
land
(200
2) (4
7)10
623
(not
ava
ilabl
e)Ty
pes o
f foo
d st
ores
in
resid
entia
l are
aTh
e lik
elih
ood
of a
low
fat c
onsu
mp-
tion
with
the
follo
win
g st
ores
in th
e re
siden
tial a
rea:
Supe
rmar
kets
1.0
9 (1
.01,
1.1
8)Gr
ocer
y st
ores
0.9
7 (0
.90,
1.0
4)Fu
ll se
rvic
e re
stau
rant
s 0.9
5 (0
.87,
1.0
5)Fa
st fo
od re
stau
rant
s 0.9
9 (0
.91,
1.0
8)
All o
utle
ts n
Sno
effe
ct fo
r all
outle
tsEd
ucat
ion,
in
com
e an
d ot
her t
ypes
of
food
sto
res
Pom
erle
au(1
997)
(37)
4309
9(7
7-97
)Ho
useh
old
inco
me
The
likel
ihoo
d of
a lo
w fa
t int
ake
amon
g th
ose
with
low
hou
seho
ld in
com
e w
as
0.95
(0.7
5, 1
.19)
nno
effe
ctGe
nder
, age
and
m
arita
l sta
tus,
othe
r soc
ioec
o-no
mic
var
iabl
esRa
ynor
(200
4) (4
8)16
2(n
ot a
vaila
ble)
Avai
labi
lity
of h
igh
fat
food
s at h
ome
The
perc
enta
ge o
f hig
h fa
t foo
ds a
vail-
able
at h
ome
was
pos
itive
ly re
late
d to
to
tal f
at in
take
r=0.
25
Y
mod
erat
e
nil
Rutis
-ha
user
(199
4) (2
6)
225
(57-
77)
Resid
ing
in a
low
or h
igh
soci
oeco
nom
ic a
rea
men
and
wom
en d
epriv
ed a
reas
con
-su
med
0.5
g/da
y an
d 1.
6 g/
day
mor
e fa
t (r
espe
ctiv
ely)
than
thos
e in
adv
anta
ged
area
s.
nS
for m
en a
nd
wom
enm
en: n
ow
omen
: no
nil
Tabl
e 9.
4 (C
ontin
ued)
Kamphuis_09.indd 179 20-8-2008 10:34:44

180 Part III Socioeconomic status, environmental factors and diet
Firs
t aut
hor
(yea
r)Sa
mpl
e si
ze
(res
pons
e ra
te %
)
Envi
ronm
enta
l fac
tor(
s)Fi
ndin
gsw
as a
ssoc
iatio
n si
gnifi
cant
?am
agni
tude
of e
ffec
t siz
eAd
just
ed fo
r
Shah
ar(2
001)
(30)
94 men
onl
y(n
ot a
vaila
ble)
Seas
on (s
umm
er/w
inte
r)In
win
ter,
men
con
sum
ed 9
g/da
y m
ore
fat t
han
in s
umm
erY
mod
erat
eEn
ergy
inta
ke
Suba
r(1
994)
(31)
2014
3Se
ason
(sum
mer
/win
ter)
In w
inte
r, m
en c
onsu
med
1.1
g/da
y le
ss
than
in th
e su
mm
er. I
n w
inte
r, w
omen
co
nsum
ed 0
.1g/
day
less
than
in th
e su
mm
er.
not a
vaila
ble
Unab
le to
cal
cula
teAg
e, ra
ce,
regi
on, e
duca
-tio
n, p
over
ty
inde
x.Ta
rasu
k(1
999)
(49)
145
wom
en o
nly
(68.
3)
Hous
ehol
d fo
od in
secu
rity
wom
en in
hou
seho
lds w
ith a
hig
h fo
od
inse
curit
y co
nsum
ed 8
.45g
/day
less
of f
at
than
thos
e in
a h
ouse
hold
with
low
food
in
secu
rity
nS
Una
ble
to c
alcu
late
disp
osab
le
inco
me,
pre
s-en
ce o
f em
ploy
-m
ent i
ncom
e,
pres
ence
of a
pa
rtne
r in
the
hous
ehol
d,
wom
en’s
leve
l of
edu
catio
n,
smok
ing
stat
us,
ethn
ic id
entit
y
Van
Stav
e-re
n(1
996)
(32)
114
wom
en o
nly
(not
ava
ilabl
e)
Seas
on: s
umm
er o
r win
ter
Fat c
ontr
ibut
ed 2
.2%
mor
e to
tota
l en
ergy
inta
ke in
win
ter c
ompa
red
to
sum
mer
YUn
able
to c
alcu
late
Adju
stm
ent
for t
ime
of th
e w
eek:
wee
kend
s, Fr
iday
, mon
day-
Thur
sday
war
dle
(200
0) (3
4)90 (n
ot a
vaila
ble)
wor
kloa
dDu
ring
a pe
riod
of h
igh
wor
kloa
d, to
tal
fat c
ontr
ibut
ed 1
% le
ss to
tota
l ene
rgy
inta
ke c
ompa
red
to lo
w w
orkl
oad
perio
ds.
no
effe
ct
nil
a Y=
effe
cts
was
sta
tistic
ally
sig
nific
ant (
p ≤
0.05
). N
S= e
ffect
was
not
sig
nific
ant.
Tabl
e 9.
4 (C
ontin
ued)
Kamphuis_09.indd 180 20-8-2008 10:34:44

1819 Environmental correlates of obesity-related intakes
Associations between environmental factors and saturated fat intakesStudies examining associations between environmental factors and saturated fat intakes are shown in Table 5. Nine of the 20 associations tested were statisti-cally significant.
Similar to that reported for energy and total fat intakes, no associations with availability factors were replicated. Studies that examined potential social determinants found that single adults had moderately higher saturated fat intakes than their married counterparts, and that these differences were large in magnitude [25]. The same study found a large positive association between saturated fat intake and living alone, participants that lived alone had higher intakes compared to those living with others [25].
No studies examined associations between saturated fat intakes and cultural factors; however a number looked at the potential influence of material factors. Living in an urban area was associated with higher intakes in one study [25], and the differences in intakes between urban and rural areas were large in magnitude. The influence of living in a deprived neighbourhood was examined in two studies [24-26]; both found no significant differences in saturated fat consumption between people residing in socioeconomically contrasting areas. A US study found that household income was positively related to saturated fat intakes among men and women [24].
A number of other studies looked at the potential influence of other factors on saturated fat intakes. A study among men in Israel showed that saturated fat intakes were moderately higher in winter compared to summer [30]. However, no significant seasonal differences in saturated fat intakes were seen among women in Belgium [32]. Two studies examining the influence of working con-ditions showed that workers consumed slightly (but significantly) more satu-rated fat during periods of high workload [33], but the other found that intakes were not different during periods of high work stress [34].
Kamphuis_09.indd 181 20-8-2008 10:34:44

182 Part III Socioeconomic status, environmental factors and diet
Tabl
e 9.
5 Re
sults
of s
tudi
es e
xam
inin
g en
viro
nmen
tal f
acto
rs a
ssoc
iate
d w
ith s
atur
ated
fat i
ntak
esFi
rst a
utho
r(y
ear)
Sam
ple
size
(r
espo
nse
rate
%)
Envi
ronm
enta
l fa
ctor
(s)
Find
ings
was
ass
ocia
tion
sign
ifica
nt?a
mag
nitu
de o
f eff
ect s
ize
Adju
sted
for
Die
z-Ro
ux(1
999)
(24)
1309
5(n
ot a
vaila
ble)
med
ian
inco
me
of n
eigh
bour
-ho
od, h
ouse
-ho
ld in
com
e
men
in th
e po
ores
t nei
ghbo
urho
ods c
on-
sum
ed 0
.3g/
day
of s
atur
ated
fat l
ess t
han
thos
e in
adv
anta
ged
area
s, w
here
as w
omen
in
dis
adva
ntag
ed a
reas
con
sum
ed 0
.4g/
day
mor
e.m
en a
nd w
omen
in th
e po
ores
t hou
seho
lds
cons
umed
0.5
g an
d 0.
9 g
of s
atur
ated
fat/
day
less
(res
pect
ivel
y) th
an th
e m
ost w
ealth
y gr
oup.
nS
neig
hbou
rhoo
d di
ffere
nces
m
en a
nd w
omen
Y ho
useh
old
inco
me
men
and
w
omen
Unab
le to
cal
cula
teUn
able
to c
alcu
late
Age,
gen
der,
race
, ene
rgy
inta
ke,
field
cen
ter,
indi
vidu
al-le
vel
inco
me.
Frie
l(2
003)
(25)
6539
(62)
mar
ital s
tatu
s, liv
ing
situa
tion
(alo
ne/w
ith
othe
rs),
urba
n/ru
ral r
esid
ence
Sing
le m
en c
onsu
med
0.1
% m
ore
ener
gy
from
sat
urat
ed fa
t tha
n m
arrie
d m
en, t
hose
liv
ing
in ru
ral a
reas
con
sum
ed 0
.4%
mor
e en
ergy
from
sat
urat
ed fa
t and
thos
e liv
ing
alon
e co
nsum
ed 0
.2%
less
sat
urat
ed fa
t co
mpa
red
to m
en li
ving
with
oth
ers.
Sing
le w
omen
con
sum
ed 0
.1%
mor
e en
ergy
fro
m s
atur
ated
fat t
han
thei
r mar
ried
coun
terp
arts
, tho
se li
ving
in ru
ral a
reas
co
nsum
ed 0
.4%
mor
e en
ergy
from
sat
urat
ed
fat c
ompa
red
to th
ose
in u
rban
are
as, a
nd
wom
en li
ving
alo
ne c
onsu
med
0.2
% e
nerg
y fro
m s
atur
ated
fat l
ess t
han
wom
en li
ving
w
ith o
ther
s.
men
:m
arita
l sta
tus:
YUr
ban/
rura
l: Y
Livi
ng si
tuat
ion:
Yw
omen
:m
arita
l sta
tus:
YUr
ban/
rura
l: Y
Livi
ng si
tuat
ion:
Y
men
:m
arita
l sta
tus:
mod
erat
eUr
ban/
rura
l res
iden
ce:
larg
eLi
ving
situ
atio
n: la
rge
wom
en:
mar
ital s
tatu
s: m
oder
ate
Ur
ban/
rura
l res
iden
ce:
larg
eLi
ving
situ
atio
n: la
rge
Age,
gen
der,
educ
atio
n,
occu
patio
n,
med
ical
car
d el
igib
ility
, m
arita
l sta
tus,
loca
tion
of re
si-de
nce,
num
ber
in h
ouse
hold
.
mcC
ann
(199
0) (3
3)10 (n
ot a
vaila
ble)
wor
kloa
dDu
ring
perio
ds o
f hig
h w
orkl
oad
part
icip
ants
co
nsum
ed 3
% m
ore
ener
gy fr
om s
atur
ated
fa
t tha
n pe
riods
of l
ow w
orkl
oad.
YSm
all
nil
Kamphuis_09.indd 182 20-8-2008 10:34:45

1839 Environmental correlates of obesity-related intakes
Firs
t aut
hor
(yea
r)Sa
mpl
e si
ze
(res
pons
e ra
te %
)
Envi
ronm
enta
l fa
ctor
(s)
Find
ings
was
ass
ocia
tion
sign
ifica
nt?a
mag
nitu
de o
f eff
ect s
ize
Adju
sted
for
mor
land
(200
2) (4
7)10
623
(not
ava
ilabl
e)Ty
pes o
f foo
d st
ores
in re
si-de
ntia
l are
a
Like
lihoo
d of
a lo
w s
atur
ated
fat c
onsu
mp-
tion
with
the
follo
win
g ou
tlets
in th
e re
siden
tial a
rea:
Supe
rmar
kets
1.0
9 (0
.99,
1.2
0)Gr
ocer
y st
ores
0.9
2 (0
.84,
1.0
0)Fu
ll se
rvic
e re
stau
rant
s 1.0
3 (0
.91,
1.1
5)Fa
st fo
od re
stau
rant
s 0.9
5 (0
.86,
1.0
5)
nS
for a
ll st
ores
exc
ept f
or
groc
ery
stor
esno
effe
ct fo
r all
stor
es
exce
pt fo
r gro
cery
sto
res
whi
ch h
ad a
smal
l effe
ct
Educ
atio
n,
inco
me
and
othe
r typ
es o
f fo
od s
tore
s
Rutis
-ha
user
(199
4) (2
6)
225
(57-
77)
Resid
ing
in a
lo
w o
r hig
h so
cioe
cono
mic
area
men
and
wom
en li
ving
in d
epriv
ed a
reas
co
nsum
ed 1
.4 a
nd 1
.3g/
day
mor
e sa
tura
ted
fat t
han
thos
e in
adv
anta
ged
area
s.
nS
for m
en a
nd w
omen
Unab
le to
cal
cula
teni
l
Shah
ar(2
001)
(30)
94 men
onl
y(n
ot a
vaila
ble)
Seas
on
(sum
mer
/w
inte
r)
In w
inte
r men
con
sum
ed 3
g/da
y m
ore
satu
-ra
ted
fat t
han
in s
umm
er.
Ym
oder
ate
Ener
gy in
take
Van
Stav
e-re
n(1
996)
(32)
114
wom
en o
nly
(not
ava
ilabl
e)
Seas
on: s
umm
er
or w
inte
rSa
tura
ted
fat c
ontr
ibut
ion
0.7%
mor
e to
en
ergy
inta
ke in
win
ter c
ompa
red
to s
umm
er.
nS
Unab
le to
cal
cula
teAd
just
men
t fo
r tim
e of
the
wee
k: w
eek-
ends
, Frid
ay,
mon
day-
Thur
sday
war
dle
(200
0) (3
4)90 (n
ot a
vaila
ble)
wor
kloa
dDu
ring
perio
ds o
f hig
h w
orkl
oad,
sat
urat
ed
fat c
ontr
ibut
ed 0
.45%
mor
e to
ene
rgy
inta
ke
than
low
wor
kloa
d pe
riods
.
nS
no e
ffect
nil
a Y=
effe
cts
was
sta
tistic
ally
sig
nific
ant (
p ≤
0.05
). N
S= e
ffect
was
not
sig
nific
ant.
Tabl
e 9.
5 (C
ontin
ued)
Kamphuis_09.indd 183 20-8-2008 10:34:45

184 Part III Socioeconomic status, environmental factors and diet
Discussion
we performed a systematic review of the literature examining associations between environmental factors and energy, total and saturated fat intakes. potentially relevant environmental factors from social-ecological models for health behaviours (like availability, social, cultural and material conditions) were relatively understudied in relation to these specific dietary outcomes- research has predominantly focused on other environmental influences (I.e. season/day of the week variation, work-related factors). Few studies have exam-ined the specific environmental factors that have been implicated in the obe-sity epidemic, such as fast food/convenience stores, marketing of unhealthy foods and larger portion sizes. Therefore, it is too premature to conclude that the environment does or does not play an important role in unhealthy dietary behaviour among the adult population at the current time.
Both the public and health professionals have a great deal of interest in the presumed impact of the food environment on weight gain and health. However, our systematic review indicates these notions are currently not well-supported by scientific evidence. The evidence base in this area still needs to grow before extensive investment in developing environmental interventions to bring about dietary change can be justified. But how can we tackle this?
Firstly, there is a need for more theoretical growth in this area before our knowl-edge can be advanced by further research. Research on environmental factors associated with dietary intakes needs to develop beyond the phase of merely reporting associations between environmental factors and dietary intakes. The relationship between the environment and how it influences food choice needs to be conceptualized. There needs to be some more empirical thought given to which environmental factors are most likely related to dietary intakes i.e. are they accessibility and availability issues, social factors, cultural conditions and/or material factors? There needs to be some consideration given to the pathways/mechanisms by which environmental factors are likely to influence intakes. most studies included in the review examined associations between environmental factors and dietary intakes without stating clear hypotheses regarding the underlying mechanisms. Being aware of the mechanisms by which environmental factors influence dietary intakes is necessary so the research can be translated to effective interventions among the population. For example, does the actual environment influence people’s behaviour, or are people’s per-ceptions of the environment a stronger influence? Another question is whether the environment operates directly on dietary behaviour, or whether its’ influ-ence is mediated through other environmental-level factors (e.g. urbanization or area deprivation) or individual-level factors (e.g. self-efficacy or nutrition knowledge). Existing conceptual models are of some assistance, but these are
Kamphuis_09.indd 184 20-8-2008 10:34:45

1859 Environmental correlates of obesity-related intakes
still in their formative stages. Some ecological theories of health behaviour may also offer some direction, however they are also limited as they list and cat-egorise potential environmental factors but do not specify how they influence behaviour [39]. Further development of this theory is necessary to facilitate the formation of recommendations for health practitioners and for deriving hypotheses to be tested in subsequent research. we should also take advantage of knowledge from other fields of research such as sociology, urban geography, economy, as these fields know much about the consequences of physical and/or social deterioration in neighbourhoods. Fields like economics have a stron-ger knowledge about the effects of advertising and the way people spent their money. cross-fertilisation of knowledge from different fields may be the key to growth in this area.
Furthermore, the influence of the environment needs to be examined in rela-tion to other ‘traditional’ (i.e. individual-level) determinants of dietary behav-iour [40]. No known study has simultaneously looked at the relative influence of (and interaction between) environmental and individual-level factors on dietary behaviour. Examining the relative influence of factors at different levels is an important step to help determine where research to understand how dietary behaviour, and interventions and resources to bring about behaviour change could be best targeted.
Stronger study designs will also help to un-pack the relationship between the environment and dietary behaviour. All the studies in the current review were observational and examined cross-sectional associations between environmen-tal factors and dietary intakes. These study designs provide an indication of sig-nificant associations, but are limited for examining causal relationships between the factors of interest and dietary intakes [41]. Longitudinal and experimental study designs would enable environmental determinants (rather than corre-lates) of dietary behaviour to be identified. The use of ‘natural experiments’ (e.g. examining intakes of residents before and after the opening of a takeaway food store, or making cross-country comparisons to examine the influence of cultural factors) may offer opportunities to examine the influence of environ-mental factors that are difficult to manipulate [42].
Our search strategy only located studies that were published in peer-reviewed journals and referenced in electronic databases; therefore they may be influ-enced by publication bias. we tried to minimize this by also performing searches in smaller and more specialized databases. The studies included in the review tested 81 associations of which 41 were found to be significant, sug-gesting that publication bias may have played a role in the current study with an over representation of studies showing significant effects. Other limitations that may have influenced the study findings were differences in the conceptu-
Kamphuis_09.indd 185 20-8-2008 10:34:45

186 Part III Socioeconomic status, environmental factors and diet
alization, measurement and summary of the environmental determinants and/or dietary intakes in the different studies. Even though strict inclusion criteria were used, environmental or dietary intake measurements sometimes differed markedly between studies, and may have contributed to variation in the asso-ciations found.
The findings of this review suggest that there is currently insufficient evidence to conclude that environmental factors do or do not influence obesogenic or unhealthy dietary behaviours. Further research needs to examine the environ-mental factors that the current literature implicates as part of an obesogenic environment, as we found few studies that examined these factors. The evi-dence base in this area still needs to grow in the ways mentioned above, before practice recommendations can be made or extensive investment in developing environmental interventions to bring about dietary change can be justified. Examination of environmental factors associated with dietary habits preced-ing energy and fat intakes (such as food choice and habits) may help to further unpack whether the environment influences health outcomes through dietary behaviour. Additionally, study replication is necessary to confirm or disprove the findings of previous studies.
Acknowledgements
Dr Katrina Giskes is supported by an Australian National Health and medi-cal Research council (NHmRc) Sidney Sax International post Doctoral Fellowship (grant identification number: 290540). The authors wish to thank dr. Gert-Jan de Bruijn for his useful comments on an earlier draft of the manu-script.
Kamphuis_09.indd 186 20-8-2008 10:34:45
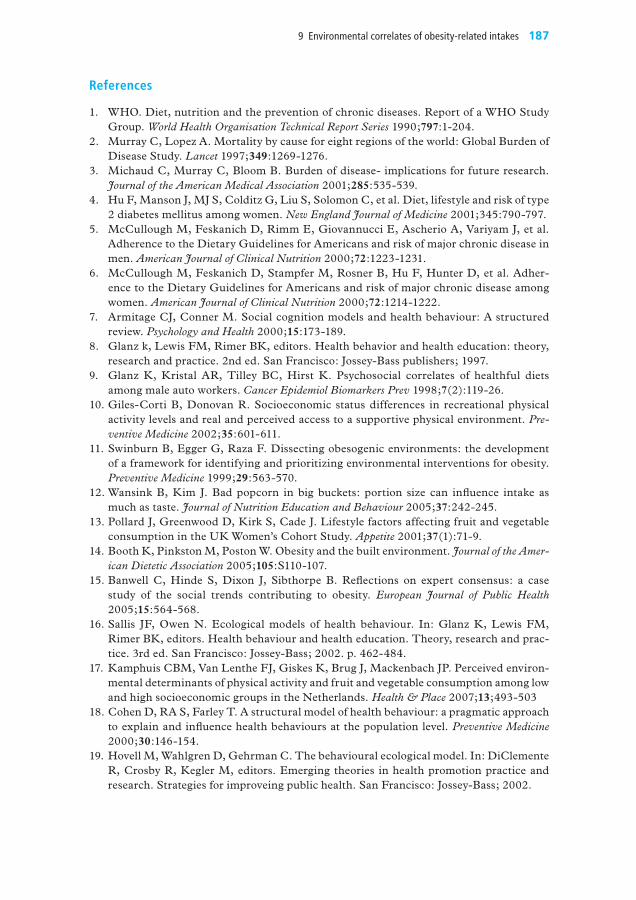
1879 Environmental correlates of obesity-related intakes
References
1. wHO. Diet, nutrition and the prevention of chronic diseases. Report of a wHO Study Group. World Health Organisation Technical Report Series 1990;797:1-204.
2. murray c, Lopez A. mortality by cause for eight regions of the world: Global Burden of Disease Study. Lancet 1997;349:1269-1276.
3. michaud c, murray c, Bloom B. Burden of disease- implications for future research. Journal of the American Medical Association 2001;285:535-539.
4. Hu F, manson J, mJ S, colditz G, Liu S, Solomon c, et al. Diet, lifestyle and risk of type 2 diabetes mellitus among women. New England Journal of Medicine 2001;345:790-797.
5. mccullough m, Feskanich D, Rimm E, Giovannucci E, Ascherio A, Variyam J, et al. Adherence to the Dietary Guidelines for Americans and risk of major chronic disease in men. American Journal of Clinical Nutrition 2000;72:1223-1231.
6. mccullough m, Feskanich D, Stampfer m, Rosner B, Hu F, Hunter D, et al. Adher-ence to the Dietary Guidelines for Americans and risk of major chronic disease among women. American Journal of Clinical Nutrition 2000;72:1214-1222.
7. Armitage cJ, conner m. Social cognition models and health behaviour: A structured review. Psychology and Health 2000;15:173-189.
8. Glanz k, Lewis Fm, Rimer BK, editors. Health behavior and health education: theory, research and practice. 2nd ed. San Francisco: Jossey-Bass publishers; 1997.
9. Glanz K, Kristal AR, Tilley Bc, Hirst K. psychosocial correlates of healthful diets among male auto workers. Cancer Epidemiol Biomarkers Prev 1998;7(2):119-26.
10. Giles-corti B, Donovan R. Socioeconomic status differences in recreational physical activity levels and real and perceived access to a supportive physical environment. Pre-ventive Medicine 2002;35:601-611.
11. Swinburn B, Egger G, Raza F. Dissecting obesogenic environments: the development of a framework for identifying and prioritizing environmental interventions for obesity. Preventive Medicine 1999;29:563-570.
12. wansink B, Kim J. Bad popcorn in big buckets: portion size can influence intake as much as taste. Journal of Nutrition Education and Behaviour 2005;37:242-245.
13. pollard J, Greenwood D, Kirk S, cade J. Lifestyle factors affecting fruit and vegetable consumption in the UK women’s cohort Study. Appetite 2001;37(1):71-9.
14. Booth K, pinkston m, poston w. Obesity and the built environment. Journal of the Amer-ican Dietetic Association 2005;105:S110-107.
15. Banwell c, Hinde S, Dixon J, Sibthorpe B. Reflections on expert consensus: a case study of the social trends contributing to obesity. European Journal of Public Health 2005;15:564-568.
16. Sallis JF, Owen N. Ecological models of health behaviour. In: Glanz K, Lewis Fm, Rimer BK, editors. Health behaviour and health education. Theory, research and prac-tice. 3rd ed. San Francisco: Jossey-Bass; 2002. p. 462-484.
17. Kamphuis cBm, Van Lenthe FJ, Giskes K, Brug J, mackenbach Jp. perceived environ-mental determinants of physical activity and fruit and vegetable consumption among low and high socioeconomic groups in the Netherlands. Health & Place 2007;13;493-503
18. cohen D, RA S, Farley T. A structural model of health behaviour: a pragmatic approach to explain and influence health behaviours at the population level. Preventive Medicine 2000;30:146-154.
19. Hovell m, wahlgren D, Gehrman c. The behavioural ecological model. In: Diclemente R, crosby R, Kegler m, editors. Emerging theories in health promotion practice and research. Strategies for improveing public health. San Francisco: Jossey-Bass; 2002.
Kamphuis_09.indd 187 20-8-2008 10:34:45

188 Part III Socioeconomic status, environmental factors and diet
20. Kamphuis cBm, Giskes K, wendel-Vos w, de Bruijn GJ, Brug J, van Lenthe FJ. Envi-ronmental determinants of fruit and vegetable consumption among adults- a systematic review. British Journal of Nutrition 2006;96(4);620-635.
21. Higgins J, Green S. cochrane Handbook for Systematic Reviews of Interventions 4.2.5. chichester: John wiley & Sons Ltd.; 2005.
22. world Bank. world Bank web Site (www.worldbank.com). In; 2006.23. mullen p, Simons-morton D, Ramirez G, Frankowski R, Green L, mains D. A meta-
analysis of trials evaluating patient education and counseling for three groups of preven-tive health behaviours. Patient Education and Counselling 1991;32:157-173.
24. Diez-Roux AV, Nieto FJ, caulfield L, Tyroler HA, watson RL, Szklo m. Neighbour-hood differences in diet: the Atherosclerosis Risk in communities (ARIc) Study. Jour-nal of Epidemiology and Community Health 1999;53(1):55-63.
25. Friel S, Kelleher cc, Nolan G, Harrington J. Social diversity of Irish adults nutritional intake. European Journal of Clinical Nutrition 2003;57(7):865-75.
26. Rutishauser I, wheeler c, conn J, O’Dea K. Food and nutrient intake in a randomly-selected sample of adults: demographic and temporal influences on energy and nutrient intakes. Australian Journal of Nutrition and Dietetics 1994;51:157-166.
27. Rolls B, morris E, Roe L. portion size of food affects energy intake in normal-weight and overweight men and women. American Journal of Clinical Nutrition 2002;76:1207-1213.
28. Rolls BJ, Roe LS, Kral TV, meengs JS, wall DE. Increasing the portion size of a pack-aged snack increases energy intake in men and women. Appetite 2004;42(1):63-9.
29. Haines pS, Hama mY, Guilkey DK, popkin Bm. weekend eating in the United States is linked with greater energy, fat, and alcohol intake. Obesity Research 2003;11(8):945-9.
30. Shahar DR, Yerushalmi N, Lubin F, Froom p, Shahar A, Kristal-Boneh E. Seasonal variations in dietary intake affect the consistency of dietary assessment. European Jour-nal of Epidemiology 2001;17(2):129-33.
31. Subar AF, Frey cm, Harlan Lc, Kahle L. Differences in reported food frequency by season of questionnaire administration: the 1987 National Health Interview Survey. Epidemiology 1994;5(2):226-33.
32. van Staveren w, Deurenburg p, Burema J, de Groot L, Hautvast J. Seasonal variation in food intake, pattern of physical activity and change in body weight in a group of young adult Dutch women consuming self-selected diets. International Journal of Obesity 1986;10:133-145.
33. mccann B, warnick G, Knopp R. changes in plasms lipids and dietary intake accompa-nying shifts in perceived workload and Stress. Psychosomatic Medicine 1990;52:97-108.
34. wardle J, Steptoe A, Oliver G, Lipsey Z. Stress, dietary restraint and food intake. Jour-nal of Psychosomatic Research 2000;48(2):195-202.
35. De craene I, De Backer G, Kornitzer m, De Henauw S, Bara L, Rosseneu m, et al. Determinants of fat consumption in a general population. Revue de’epidemiologie et de sante publique 1990;38(5-6):539-43.
36. Johansson L, Thelle DS, Solvoll K, Bjorneboe GE, Drevon cA. Healthy dietary habits in relation to social determinants and lifestyle factors. British Journal of Nutrition 1999;81(3):211-20.
37. pomerleau J, pederson LL, Ostbye T, Speechley m, Speechley KN. Health behav-iours and socioeconomic status in Ontario, canada. European Journal of Epidemiology 1997;13(6):613-22.
38. Hellerstedt wL, Jeffery Rw. The association of job strain and health behaviours in men and women. International Journal of Epidemiology 1997;26(3):575-83.
Kamphuis_09.indd 188 20-8-2008 10:34:45

1899 Environmental correlates of obesity-related intakes
39. Brug J, Oenema A, Ferreira I. Theory, evidence and Intervention mapping to improve behaviour nutrition and physical activity measures. International Jounal of Behavioural Nutrition and Physical Activity 2005;4:2.
40. Kremers S, Visscher T, Siedell J, van mechelen w, Brug J. cognitive determinants of energy balance-related behaviours. Sports Medicine 2005;35:923-933.
41. French SA, Story m, Jeffery Rw. Environmental Influences on eating and physical activ-ity. Annu Rev Public Health 2001;22:309-335.
42. petticrew m, cummins S, Ferrell c, Findlay A, Higgins c, Hoy c, et al. Natural exper-iments: an underused tool in public health. Public Health 2005;119:751-757.
43. cheadle A, psaty Bm, curry S, wagner E, Diehr p, Koepsell T, et al. community-level comparisons between the grocery store environment and individual dietary practices. Preventive Medicine 1991;20(2):250-61.
44. de castro Jm, Brewer Em. The amount eaten in meals by humans is a power function of the number of people present. Physiology of Behaviour 1992;51(1):121-5.
45. Diehr p, Koepsell T, cheadle A, psaty Bm, wagner E, curry S. Do communities differ in health behaviors? Journal of Clinical Epidemiology 1993;46(10):1141-9.
46. Gibney m, Lee p. patterns of food and nutrient intake in a suburb of Dublin with chron-ically high unemployment. Journal of Human Nutrition and Dietetics 1993;6:13-22.
47. morland K, wing S, Diez Roux A. The contextual effect of the local food environment on residents’ diets: the atherosclerosis risk in communities study. American Journal of Public Health 2002;92(11):1761-7.
48. Raynor HA, polley BA, wing RR, Jeffery Rw. Is dietary fat intake related to liking or household availability of high- and low-fat foods? Obesity Research 2004;12(5):816-23.
49. Tarasuk VS, Beaton GH. women’s dietary intakes in the context of household food inse-curity. Journal of Nutrition 1999;129(3):672-9.
Kamphuis_09.indd 189 20-8-2008 10:34:45

Kamphuis_09.indd 190 20-8-2008 10:34:45

Kamphuis CBm, Giskes K, de Bruijn Gj, wendel-Vos w, Brug j & Van Lenthe Fj (2006) Environmental correlates of fruit and vegetable consumption – a systematic review. Br J Nutr 96(4):620-635.
10Environmental correlates of fruit and vegetable consumption – a systematic review
Kamphuis_09.indd 191 20-8-2008 10:34:45

192 Part III Socioeconomic status, environmental factors and diet
Abstract
Background The current ecological approach in health behaviour research rec-ognises that health behaviour needs to be understood in a broad environmental context. This has led to an exponential increase in the number of studies on this topic. It is the aim of this systematic review to summarise the existing empirical evidence pertaining to environmental influences on fruit and veg-etable (FV) consumption.
Methods The environment was defined as ‘all factors external to the individual’. Scientific databases and reference lists of selected papers were systematically searched for observational studies among adults (18–60 years old), published in English between 1 January 1980 and 31 December 2004, with environmen-tal factor(s) as independent factor(s), and fruit intake, vegetable intake or FV intake combined as one outcome measure as dependent factor(s).
Results A great diversity in the environmental factors studied was found, but the number of replicated studies for each determinant was limited. most evidence was found for household income, as people with lower household incomes con-sistently had a lower FV consumption. married people had higher intakes than those who were single, whereas having children showed mixed results. Good local availability (e.g. access to one’s own vegetable garden, having low food insecurity) seemed to exert a positive influence on intake.
Conclusions Improved opportunities for sufficient FV consumption among low-income households may lead to improved intakes. For all other environmental factors, more replicated studies are required to examine their influence on FV intake.
Kamphuis_09.indd 192 20-8-2008 10:34:45
19310 Environmental correlates of fruit and vegetable consumption
Introduction
Non-communicable diseases, such as cardiovascular diseases and cancer are the current major causes of death in developed countries [1]. Fruit and veg-etable (FV) consumption play a protective role in the onset of these chronic diseases [2-4] and a low FV intake is one of the leading risk factors for death from cancer worldwide [5]. considerable reductions in morbidity and mortal-ity from diet-related diseases can be achieved if the population adopts recom-mended dietary behaviours, including adequate FV intakes [6]. To understand and promote behaviour change towards recommended FV intakes, health behaviour research has predominantly focussed on individual-level factors, including individuals’ knowledge, intentions, attitudes, self-efficacy, motiva-tion, taste, personal traits, and other personal factors related to FV consump-tion [7-10].
Over the last decade there has been a movement towards a more ecological approach to people’s health behaviour, which has resulted in an exponential increase in the number of studies on living environments [11, 12]. Environ-mental and policy interventions are now promoted as promising strategies for creating population-wide improvements in health behaviours [13-15]. How-ever, no clear overview exists of environmental factors that have consistently shown to be related to FV consumption. It is the aim of this systematic review to summarize the existing empirical evidence pertaining to the association between environmental influences and FV consumption, to identify knowledge gaps, and to provide recommendations for policy and intervention develop-ment. more specifically, we address the following research questions:
1) what environmental determinants of FV consumption have been examined in existing empirical research?
2) For what environmental factors does the existing evidence show a relation-ship with FV consumption?
Methods
Since we were interested in any influence but individual level factors, we kept our definition of the environment as broad as possible, i.e. ‘all factors external to the individual’ [16]. A framework used in previous research [17], that identi-fies four categories of environmental factors related to health behaviours, was a helpful tool in classifying different environmental factors during the review process. The framework shares common features with ecological models [18, 19], stressing the importance of multiple types of environmental influences that affect health behaviour. The four categories of this framework are:
Kamphuis_09.indd 193 20-8-2008 10:34:45

194 Part III Socioeconomic status, environmental factors and diet
(a) Accessibility and availability. Including physical and financial accessibility of products and shops that are needed for an (un)healthy diet (e.g. access to FV shops, and availability of FV and less healthy snacks).
(b) Social conditions. Including social relationships (e.g. family/marital status), social support, and psychosocial stress.
(c) cultural conditions. culture-specific eating patterns, health value orienta-tions, food experiences in childhood, and cultural participation.
(d) material conditions. Including financial situation (e.g. household income), material and social deprivation, and unfavourable working, housing and neighbourhood conditions (e.g. neighbourhood deprivation). These may affect behaviour through one of the previous environmental factors. For instance, a person’s budgetary situation may partly determine one’s access to products and facilities. And living or working in an unfavourable envi-ronment might induce stress, which may relate to indifference concerning a healthy diet.
Any environmental influence that could not be placed under the heading of one of these categories would be referred to as ‘other factors’.
The current study was conducted as part of a larger study examining environ-mental determinants of several dietary outcomes, namely total energy, total fat, saturated fat, and FV intakes. Search strategies therefore also included key-words for energy and fat intakes. Results on environmental determinants of these dietary outcomes can be found elsewhere (Giskes et al, submitted).
Data sources and search strategyThe study protocol was based on guidelines from the cochrane Reviewer’s Handbook [20]. The following databases were searched: pubmed, psychInfo, web of Science and Human Nutrition. Broad search terms were used so as not to miss any potentially relevant articles during the search procedure. The sensi-tivity of search strategies was tested by seeing whether they located key articles [21, 22], that were known by the researchers to fit the inclusion criteria. For each database, relevant indexing terms relating to energy, fat and FV intakes, and environmental determinants were selected and included in the search phrases. For example, in pubmed, the medical subject headings (meSH) ‘social envi-ronment’, ‘environment’, or ‘residence characteristics’ were combined with the meSH terms ‘fruit’, ‘vegetables’, ‘energy intake’, ‘dietary fats’, ‘nutrition’, or ‘diet’ to search for papers. Identical search terms were used for other databases. Detailed search strategies for every database can be found on http://mgzlx4.erasmusmc.nl/pwp/?ckamphuis.
Kamphuis_09.indd 194 20-8-2008 10:34:45

19510 Environmental correlates of fruit and vegetable consumption
Study selectionThe selection criteria for inclusion were:• Observational studies published in English between 1 January 1980 to
31 December 2004;• Studies conducted among a population-based sample of adults (i.e. no patient
groups), aged 18-60 years;• Dependent variable(s) were intakes of energy, fat, fruits, vegetables, or fruits
and vegetables combined as one outcome measure;• Independent variable(s) were variables that could be classified as an ‘envi-
ronmental’ factor according to the definition of Sallis & Owen (2002), i.e. ‘all factors external to the individual’;
• Studies must have been conducted in an ‘established market economy’ as defined by the world Bank (http://www.worldbank.org/).Intervention studies were excluded from the scope of the current study.
Those with a research design that made it impossible to decipher the effects of several environmental determinants on the outcome behaviour were also excluded. Studies among children were excluded, since environmental fac-tors typically investigated in relation to children’s fruit and vegetable intake (e.g. parent’s behaviour, parenting style, availability of fruits and/or unhealthy snacks at school [23]) differed significantly from those potentially relevant for adults.
The selection of articles located from the database searches took place in sev-eral steps. Firstly, titles (and if necessary abstracts) were scanned by the first and second author independently (cK and KG), to exclude those out of scope. when a sound judgement about an article’s suitability could not be made based on title and/or abstract, the article remained in the review process. In the second step, the lists of included articles generated by both authors were com-pared. Discrepancies between the co-authors were discussed until consensus was reached. Then, the full text of each remaining paper was viewed by both cK and KG, and again papers were excluded with consensus of both authors. Finally, the reference lists of all remaining papers were scanned. The selection of studies from the reference lists followed the same steps as outlined above.
Data extraction and study assessmentThe first two authors each extracted data from half of the studies. Each study’s details were summarised in tables. Environmental factors as reported by the participant were referred to as ‘self-reported’ (e.g. marital status, household income), whereas factors extracted from objective databases or systematically measured by the research team were called ‘objective’ (e.g. the actual number of supermarkets in a neighbourhood, as counted by the researcher).
Kamphuis_09.indd 195 20-8-2008 10:34:45

196 Part III Socioeconomic status, environmental factors and diet
Though we have made no formal attempt to gauge study quality, a crude indi-cator was developed to make a rough distinction between studies of acceptable quality and studies of limited quality. Assessing sample size, response rate and whether adjustment was made for a limited set of confounders (age and sex), seemed to be sufficient to distinguish acceptable study quality. A study was judged as being of acceptable quality, if it fulfilled at least two of the follow-ing criteria: sample size>500, response rate>55% and adjustments made for potentially relevant confounders [24]. Note that study quality was no inclusion criteria, so no study was excluded from the review on the base of this crude quality measure.
Results
The literature searches yielded 7440 titles of potentially relevant articles in pubmed, 58 titles in psychinfo, 4828 titles in web of Science, and 8325 titles in Human Nutrition. After scanning titles and abstracts, a total of 55 poten-tially relevant articles were identified. This vigorous reduction in the number of potentially relevant articles based on title/abstract only, was due to the broad search terms used, in combination with the strict inclusion criteria regard-ing dependent variables, and the overlap in titles identified by the databases. The reference lists of the 55 selected articles were scanned, which resulted in another 12 publications for inclusion. when examining the full texts of the total of 67 articles, another 26 articles were excluded, because they were either methodological or theoretical papers, described a naturally occurring interven-tion, or just mentioned environmental determinants of dietary behaviour in their Discussion. Of the remaining 41 articles, a total of 24 articles had fruit and/or vegetable consumption as outcome variable(s). These papers and their findings are described below. The other papers had fat and/or energy intakes as outcome variables, and are described in another review [25].
Table 10.1 Details of studies included in the reviewFirst author(year)
Country Dietary out-comea
Environmental determinants andmeasurement (self-reported (S) or objectively measured (o))
Aspects of study quality b
Association(s) tested for subgroupsN % C
Agudo (1999) Spain F, V north-south location of residence within Spain
o + + + -
Billson (1999) U.K. FV Region of residence within the UK, receiving benefits, marital status, having home grown produce.
S (all) + + men, women
Devine (1999) U.S.A. F, V Having a vegetable garden, parental and marital status, presence of others during mealtime
S (all) + + + -
Dibsdall (2003) U.K. FV Perceived accessibility of FV, perceived affordability of FV, and perceived car access
S + -
Diez-Roux (1999) U.S.A. F, V median income of neighbourhood S + + men, women
Kamphuis_09.indd 196 20-8-2008 10:34:46

19710 Environmental correlates of fruit and vegetable consumption
First author(year)
Country Dietary out-comea
Environmental determinants andmeasurement (self-reported (S) or objectively measured (o))
Aspects of study quality b
N % C
Association(s) tested for subgroups
Forsyth (1994) U.K. F, V Residing in a deprived vs. advantaged area
o + + -
Giskes (2002a) Australia F, V Household income S + + + men, womenGiskes (2002b) Australia F, V Household income S + + + men, womenjohansson (1998)norway FV Household income S + + men, women
johansson (1999)norway FV Residing in a rural vs. urban area in norway,household income
o + + + men, women
Kinter (1981) U.S.A. FV Aspects of family functioning (cohesion, expressiveness, conflict, independence, achievement orienta-tion, intellectual-cultural orienta-tion, active-recreational orientation, moral-religious emphasis, organization, control)
S men, women
Laaksonen (2004)
Finland V Household income o + + + men, women
morland (2002) U.S.A. FV whether or not there were the follow-ing food stores in the census tract (as approximation of neighbourhoods):Supermarkets, Grocery stores, Full ser-vice restaurants, Fast food restaurants
o + + Blacks, whites
naska (2000) Europe F, V,FV
How much fruit and vegetables are available in the food supply in different countries
o + -
Pan (1999) U.S.A. F, V Residing in the US for a minimum of 6 months (compared to an Asia country)
S -
Papadaki (2002) U.K. F, V Residing in Scotland (compared to Greece)
S + -
Pollard (2001) U.K. F, VFV
Region of residence in the UK, having children, marital status
S (all) + + -
Shohaimi (2004) U.K. FV Deprivation of residential area S + + men, women
Staveren, van (1996)
nether-lands
F, V Season (summer or winter) o + -
Steptoe (2004) U.K. FV Social support: from family, from others
S + -
Subar (1994) U.S.A. FV Season (summer or winter) o + + -
Tingay (2003) U.K. F, V Food insecurity c S + + -
wandel (1995) norway F, V Having children, household size, household income, region of residence in norway.
S (all) + + -
Ziegler (1987) U.S.A. F, V Season (summer-spring or winter-fall) S + + -
a F = fruit intake; v = vegetable intake; Fv = fruit and vegetable intake combined in one outcome measure.b Study quality aspects. N marked with a ‘+’ means: sample > 500; % marked with a ‘+’ means: response rate is
reported; C marked with a ‘+’ means: adjustments made for at least age and sex.c Food insecurity has been defined as the limited or uncertain availability of nutritionally adequate safe foods, including
experiences like running out of food, running out of money to buy food, or buying cheaper foods because of financial constraints (Tingay et al., 2003)
Table 10.1 (Continued)
Kamphuis_09.indd 197 20-8-2008 10:34:46

198 Part III Socioeconomic status, environmental factors and diet
Table 1 summarizes the details of each study. Thirteen studies examined fruit and vegetable intake separately, nine studies combined fruit and vegetable intake as one outcome variable, and two presented results for all three out-comes [22, 26]. Nine studies examined associations between environmental determinant(s) and dietary outcome(s) for men and women separately; one study compared subgroups of blacks/whites [21]. Studies were conducted in the U.K. (N=8), U.S. (N=7), Europe (N=7) (e.g. Norway, Spain), and Aus-tralia (N=2). Dietary outcomes were predominantly measured with a food fre-quency questionnaire, and less often with a 7-day food consumption diary or 24-h dietary recall. All studies had a cross-sectional design. A wide range of different environmental determinants were studied. Seven of the 24 studies fulfilled one or none of the quality criteria, eleven studies met two quality crite-ria, and six studies fulfilled all three criteria. Table 2 shows that the 24 studies examined a total of 97 associations between environmental determinants and intakes, and 57 of these were statistically significant. Detailed results for each dietary outcome are shown in Tables 3 to 5.
Fruit consumptionmaterial factors have been studied most often with regard to fruit intake (Table 3). people living in households with a higher income had a greater fruit consumption [27-29]. The same association was found among people living a neighbourhood with a higher median income, even after adjustment for indi-vidual level SES [30]. Neighbourhood deprivation was associated with lower fruit consumption [31]. Accessibility and availability factors have received little attention in the literature to date. However, one study investigated the conse-quences of food insecurity on fruit intake, where food insecurity was defined as the limited or uncertain availability of nutritionally adequate and safe foods, including experiences like running out of food, running out of money to buy food, or buying cheaper foods because of financial constraints [32]. Being food insecure was associated with significantly lower consumption [32]. Another study found that having a vegetable garden was positively and significantly asso-ciated with fruit consumption [33]. considerable disparities between European countries in availability of fruit at the national level were found, which could be a probable explanation for the divers percentages of low fruit consumers (< 150 g/person per day) in countries, ranging from 81% of the population in poland to 32% in Greece [26]. The few studies examining social factors showed that being married and the number of people living in the household were positively related to fruit intake, whereas having children showed mixed associations [22, 29, 33, 34]. country and regional differences in fruit intake were significant for three out of five associations [22, 29, 35-37]. No significant associations were found for seasonal influences [38, 39].
Kamphuis_09.indd 198 20-8-2008 10:34:46

19910 Environmental correlates of fruit and vegetable consumption
Table 10.2 Summary of the number of associations between environmental determinants and fruit and vegetable intakea
Environmental determinants Fruit intake Vegetable intake
Fruit and vegetable intake
Accessibility factors availability of FV at national market 1b 1 1grocery store in the census tract 2
supermarket in the census tract +1/1
full service restaurant in the census tract 2
fast food restaurant in the census tract 2
perceived accessibility (of shops, of FV in shops) +1
perceived affordability (of FV in shops) +1
household food insecurity -1 -1
car access 1having a vegetable garden or home grown produce +1 +1 +2
Social factors being married +1/1 +2 +2/+1household size +1 +1having child(ren) (compared to no children) +1/-2 -1/+1/-1 +1family functioning 1
social support from family members +1/+1
social support from others +1
Cultural factors
presence of others during mealtimes +1 1
intellectual-cultural orientation of a family +1
material factors
median income of neighbourhood +1/+1 +2neighbourhood deprivation -1 -1 -1/1household income +4/+1 +7 +1/+1/-2receiving benefits -2
other factors
living in a rural area (compared to urban) -2
living in a northern region of norway 1 -1
region of residence in Spain 1 1living in the north of the UK -1 -1 -1/ 2living in London/South-East of the UK +1
residing in the U.S. (instead of Asia) +1 -1residing in Scotland (instead of Greece) -1 -1/ 1 -1/1winter (compared to summer) +2/-1/-1 -1/-1 +2/-1
a When a study tested associations for subgroups separately, all associations are reported in this table. results from acceptable as well as minor quality studies are presented.
b The numbers in the table should be interpreted as follows:blue number of significant effects found for the combination determinant - dietary outcome.black number of non-significant effects found for the combination determinant - dietary outcome, or for which+ positive association between environmental determinant and dietary outcome.- negative association between environmental determinant and dietary outcome.(some non-significant associations do not have a plus or minus sign, as this information was not available in all cases)
Kamphuis_09.indd 199 20-8-2008 10:34:46

200 Part III Socioeconomic status, environmental factors and diet
Tabl
e 10
.3 R
esul
ts o
f stu
dies
exa
min
ing
envi
ronm
enta
l det
erm
inan
ts o
f fru
it co
nsum
ptio
na
Firs
t aut
hor
(yea
r)Sa
mpl
e si
ze
(res
pons
e ra
te %
)En
viro
nmen
tal d
eter
min
ant(
s)Fi
ndin
gsw
as a
ssoc
iatio
n si
gnifi
cant
? b
Adju
sted
for
Acc
essi
bilit
y an
d av
aila
bilit
y
nas
ka(2
000)
14
2715
hou
seho
lds
(res
pons
e ra
te %
no
t ava
ilabl
e)
How
muc
h fru
it is
avai
labl
e in
the
food
supp
ly in
diff
eren
t cou
ntrie
sIn
Pol
and,
a c
ount
ry w
ith lo
w a
vaila
bilit
y of
frui
t (i.e
. 100
g/p
erso
n pe
r da
y) 8
1% o
f the
pop
ulat
ion
did
not r
each
the
reco
mm
ende
d in
take
. In
Gree
ce, a
cou
ntry
with
hig
h av
aila
bilit
y of
frui
t (i.e
. 350
g/p
erso
n pe
r da
y) 3
2% o
f the
pop
ulat
ion
did
not r
each
wH
o re
com
men
datio
ns.
not a
vaila
ble
nil
Dev
ine
(199
9)59
2(8
2%)
Havi
ng a
veg
etab
le g
arde
nHa
ving
a v
eget
able
gar
den
was
pos
itive
ly a
nd si
gnifi
cant
ly a
ssoc
iate
d w
ith fr
uit c
onsu
mpt
ion.
YAg
e, g
ende
r, ed
ucat
ion,
race
.Ti
ngay
(200
3)
431
(87%
)Fo
od in
secu
rity
Part
icip
ants
with
food
inse
curit
y ha
d a
likel
ihoo
d of
0.5
7 (0
.36,
0.9
0)
for c
onsu
min
g fru
it da
ily c
ompa
red
to th
eir c
ount
erpa
rts t
hat w
ere
food
se
cure
.
YAg
e, s
ex.
Soci
al f
acto
rs
Dev
ine
(199
9)59
2(8
2%)
Pare
ntal
and
mar
ital s
tatu
sBe
ing
mar
ried
+ ha
ving
a y
oung
chi
ld, o
r bei
ng si
ngle
+ h
avin
g a
youn
g ch
ild (v
s. b
eing
mar
ried
+ ha
ving
no
child
) was
pos
itive
ly a
nd si
gnifi
-ca
ntly
ass
ocia
ted
with
frui
t con
sum
ptio
n am
ong
whi
tes.
YAg
e, g
ende
r, ed
ucat
ion,
race
.
Polla
rd(2
001)
35
367
wom
en o
nly
(58%
)
Havi
ng c
hild
ren,
mar
ital s
tatu
sTh
ose
with
out c
hild
ren
cons
umed
0.2
6 po
rtio
ns o
f fru
it m
ore
than
pa
rtic
ipan
ts w
ith c
hild
ren.
Sin
gle
part
icip
ants
con
sum
ed 0
.21
few
er p
or-
tions
of f
ruit
than
thei
r mar
ried
coun
terp
arts
.
Child
ren:
Ym
arita
l sta
tus:
Yni
l
wan
del
(199
5)14
960
(77%
)Ha
ving
chi
ldre
n, h
ouse
hold
size
Thos
e w
ith c
hild
ren
wer
e 0.
90 m
ore
likel
y to
con
sum
e fru
its s
eldo
mly
th
an p
artic
ipan
ts w
ithou
t. Pa
rtic
ipan
ts in
hou
seho
ld w
ith m
ore
than
2
peop
le w
ere
1.54
tim
es le
ss li
kely
to c
onsu
me
fruits
sel
dom
ly.
Y fo
r chi
ldre
n an
d ho
useh
old
size.
nil
Cult
ural
fac
tors
Dev
ine
(199
9)59
2(8
2%)
Pres
ence
of o
ther
s dur
ing
mea
l tim
eEa
ting
with
oth
ers w
as p
ositi
vely
ass
ocia
ted
with
frui
t con
sum
ptio
n.Y
Age,
gen
der,
educ
atio
n, ra
ce.
Mat
eria
l fac
tors
Die
z-Ro
ux(1
999)
1309
5(r
espo
nse
rate
%
not a
vaila
ble)
med
ian
inco
me
of n
eigh
bour
hood
men
and
wom
en in
the
poor
est n
eigh
bour
hood
s wer
e 1.
67 a
nd 1
.41
times
mor
e lik
ely
to h
ave
low
frui
t con
sum
ptio
n (r
espe
ctiv
ely)
than
thos
e in
the
mos
t adv
anta
ged
neig
hbou
rhoo
ds.
men
: Yw
omen
: nS
Age,
gen
der,
race
, en
ergy
inta
ke,
field
cen
tre,
in
divi
dual
-leve
l in
com
e.Fo
rsyt
h(1
994)
691
(res
pons
e ra
te %
no
t ava
ilabl
e)
Livi
ng in
a d
epriv
ed v
s. a
dvan
tage
d ar
eaRe
siden
ts o
f dis
adva
ntag
ed a
reas
con
sum
ed 3
.4 le
ss s
ervi
ngs o
f fru
it pe
r w
eek
com
pare
d to
thos
e liv
ing
in th
e m
ost a
dvan
tage
d ar
eas.
YAg
e, g
ende
r, oc
cupa
tiona
l cl
ass.
Kamphuis_09.indd 200 20-8-2008 10:34:46

20110 Environmental correlates of fruit and vegetable consumption
Firs
t aut
hor
(yea
r)Sa
mpl
e si
ze
(res
pons
e ra
te %
)En
viro
nmen
tal d
eter
min
ant(
s)Fi
ndin
gsw
as a
ssoc
iatio
n si
gnifi
cant
? b
Adju
sted
for
Gis
kes
(200
2a)
8883
(61%
)Ho
useh
old
inco
me
men
and
wom
en in
the
low
est i
ncom
e qu
intil
e co
nsum
ed 7
7g a
nd 7
3g
less
frui
t (re
spec
tivel
y) in
the
prev
ious
24
hour
s tha
n th
eir c
ount
erpa
rts
in th
e hi
ghes
t inc
ome
quin
tile.
Y fo
r bot
h m
en a
nd
wom
enAg
e, g
ende
r, en
ergy
inta
ke
Gis
kes
(200
2b)
7695
(61%
)Ho
useh
old
inco
me
men
and
wom
en in
the
low
est i
ncom
e qu
intil
e w
ere
2.3
and
2.5
times
m
ore
likel
y (r
espe
ctiv
ely)
to n
ot c
onsu
me
vege
tabl
es o
n a
daily
bas
is.
Y fo
r bot
h m
en a
nd
wom
enAg
e, g
ende
r, en
ergy
inta
kew
ande
l(1
995)
1496
0(7
7%)
Hous
ehol
d in
com
eHi
gh-in
com
e gr
oups
wer
e -1
.78
less
like
ly to
con
sum
e fru
its s
eldo
mly
co
mpa
red
to lo
w in
com
e gr
oups
. n
S fo
r hou
seho
ld
inco
me
nil
oth
er f
acto
rs
Agu
do (1
999)
41
448
(55-
60%
dep
endi
ng
on re
gion
)
nort
h-so
uth
loca
tion
of re
siden
ce
with
in S
pain
over
all,
no c
onsis
tent
diff
eren
ces w
ere
obse
rved
bet
wee
n so
uthe
rn
and
nort
hern
regi
ons r
egar
ding
frui
t int
ake
(one
regi
on fr
om th
e so
uth
cons
umed
hig
her a
mou
nts o
f fru
its th
an th
e re
mai
ning
regi
ons)
.
nS
Age,
gen
der
Pan
(199
9)63 (5
3%)
Resid
ing
in th
e U
S fo
r a m
inim
um o
f 6
mon
ths,
inst
ead
of re
sidin
g in
an
Asia
n co
untr
y
whe
n m
ovin
g to
the
US,
the
frequ
ency
of f
ruit
cons
umpt
ion
incr
ease
d fro
m 1
2 to
15
times
a w
eek
com
pare
d to
whe
n liv
ing
in th
e As
ian
coun
try
of o
rigin
.
Yni
l
Papa
daki
(200
2)80 (9
5,2%
)Re
sidin
g in
Sco
tland
inst
ead
of
Gree
cem
ovin
g to
Sco
tland
(fro
m G
reec
e) re
sulte
d in
40%
of t
he s
tude
nts
chan
ging
thei
r fre
sh fr
uits
con
sum
ptio
n fro
m >
1 ti
me/
day
to le
ss th
an
1 tim
e/da
y.
Yni
l
Polla
rd(2
001)
35
367
wom
en o
nly
(58%
)
Regi
on o
f res
iden
ce in
the
U.K.
Part
icip
ants
in th
e no
rth
wes
t of t
he U
K co
nsum
ed 0
.39
port
ions
less
th
an th
ose
in th
e so
uth
wes
t.Y
nil
wan
del
(199
5)
1496
0(7
7%)
Regi
on o
f res
iden
ce in
nor
way
Livi
ng in
the
nort
h, m
iddl
e, s
outh
/wes
t, ea
st o
r the
cap
ital o
f nor
way
ha
d no
sign
ifica
nt in
fluen
ce o
n be
ing
a fre
quen
t fru
its c
onsu
mer
.n
Sni
l
Suba
r(1
994)
2014
3(r
espo
nse
rate
%
not a
vaila
ble)
Seas
on(s
umm
er o
r win
ter)
In w
inte
r, m
en c
onsu
med
0.7
ser
ving
s of f
ruits
per
wee
k m
ore
than
in
the
sum
mer
. In
win
ter,
wom
en c
onsu
med
0.9
ser
ving
per
wee
k m
ore
than
in th
e su
mm
er.
not a
vaila
ble
Age,
race
, reg
ion,
ed
ucat
ion,
pov
-er
ty in
dex.
Van
Stav
eren
(199
6)
114
wom
en o
nly
(res
pons
e ra
te %
no
t ava
ilabl
e)
Seas
on (s
umm
er o
r win
ter)
Frui
t con
sum
ptio
n w
as 7
g lo
wer
in w
inte
r com
pare
d to
sum
mer
. n
SAd
just
men
t for
tim
e of
the
wee
k:
wee
kend
s, F
riday
, m
onda
y-Th
ursd
ayZi
egle
r(1
987)
900
(64%
)Se
ason
(sum
mer
-spr
ing
or
win
ter-f
all)
In w
inte
r-fal
l, pa
rtic
ipan
ts a
te 4
0 se
rvin
gs o
f fru
it le
ss p
er m
onth
than
in
sum
mer
-spr
ing.
not a
vaila
ble
nil
a St
udie
s ar
e gr
oupe
d by
the
envi
ronm
enta
l det
erm
inan
t(s)
they
exa
min
e (fo
llow
ing
the
clas
sific
atio
n of
the
fram
ewor
k). W
ithin
eac
h su
bgro
up, s
tudi
es a
re g
roup
ed b
y sp
ecifi
c de
term
inan
ts.
b Y=
effe
cts
was
sta
tistic
ally
sig
nific
ant (
p ≤
0.05
). N
S= e
ffect
was
not
sig
nific
ant.
Tabl
e 10
.3 (
Cont
inue
d)
Kamphuis_09.indd 201 20-8-2008 10:34:46

202 Part III Socioeconomic status, environmental factors and diet
vegetable consumptionAs for fruit, material factors were studied most often in relation to vegetable intake (Table 4). Household income demonstrated a consistent and significantly positive association with vegetable intake in seven associations [27-29, 40], even after adjustment for education and occupational social class [40]. people living in higher income neighbourhoods generally had higher energy-adjusted intakes of vegetables, than those living in lower income neighbourhoods [30], and this pattern was still present after adjustment for individual level income. Living in the most socially disadvantaged neighbourhood of Glasgow was associated with the poorest intakes [31], also when individual characteristics such as occu-pational class and income were taken into account. The same availability and social factors were studied for vegetables as for fruits, and associations were comparable to those with fruit intake as described above. country and regional differences in vegetable intake were often significant [22, 29, 35-37]. winter was negatively associated with vegetable intake in two studies [38, 39].
Fruit and vegetable consumptionThe group of environmental factors that have been studied most often are those related to accessibility and availability of FV, though only five of the fourteen associations tested were statistically significant (Table 5). men and women who reported eating home grown produce had a significantly higher FV consump-tion than those who did not [41]. The presence of a supermarket in the census tract where a participant lived had a significant relationship with the FV intake for black residents [21]. The presence of other food facilities in the census tract showed no significant relationships with the FV intake of blacks or whites [21]. Another study showed that positive perceptions of the accessibility of shops, the variety of FV in shops, and the affordability of FV were all positively related to FV intake, whereas car access showed no significant results [42]. considerable differences between European countries in FV availability at the national level were found, with parallel differences in FV consumption between the popula-tions [26].
Other categories of factors were less frequently studied for FV than for fruits and vegetable consumption as separate outcomes, but results were comparable. One exception was household income, where no significant differences in FV intake between high and low income households where found for men [43] and women [44], but the latter study showed a significant positive association between income and FV intake for men. people receiving benefits consumed significantly less FV than people not in receipt of benefits [41]. Residential area based deprivation significantly predicted FV intake, independently from occupational class and educational level [45]. Significant negative associations between living in a rural area and FV intakes were found for men and women [44].
Kamphuis_09.indd 202 20-8-2008 10:34:46

20310 Environmental correlates of fruit and vegetable consumption
Tabl
e 10
.4 R
esul
ts o
f stu
dies
exa
min
ing
envi
ronm
enta
l det
erm
inan
ts o
f veg
etab
le c
onsu
mpt
iona
Firs
t aut
hor
(yea
r)Sa
mpl
e si
ze(r
espo
nse
rate
%)
Envi
ronm
enta
l de
term
inan
t(s)
Find
ings
was
ass
ocia
tion
sign
ifica
nt?
bAd
just
ed fo
r
Acc
essi
bilit
y an
d av
aila
bilit
y
Agu
do(1
999)
41
448
(55-
60%
dep
endi
ng
on c
entr
e)
nort
h-so
uth
loca
tion
of re
si-de
nce
with
in S
pain
over
all,
no c
onsis
tent
diff
eren
ces w
ere
obse
rved
bet
wee
n so
uthe
rn a
nd n
orth
ern
regi
ons r
egar
ding
frui
t int
ake
(one
re
gion
from
the
sout
h co
nsum
ed h
ighe
r am
ount
s of v
eg-
etab
les,
whi
le a
noth
er fr
om th
e no
rth
had
low
er a
mou
nts
of v
eget
able
s tha
n th
e re
mai
ning
regi
ons)
.
nS
Age,
gen
der.
Cult
ural
fac
tors
Dev
ine
(199
9)59
2(8
2%)
Havi
ng a
veg
etab
le g
arde
nHa
ving
a v
eget
able
gar
den
was
pos
itive
ly a
nd si
gnifi
cant
ly
asso
ciat
ed w
ith v
eget
able
con
sum
ptio
n.Y
Age,
gen
der,
educ
atio
n,
race
.D
evin
e(1
999)
592
(82%
)Pa
rent
al a
nd m
arita
l sta
tus
Bein
g m
arrie
d +
havi
ng a
you
ng c
hild
, or b
eing
sing
le +
ha
ving
no
child
(vs.
bei
ng si
ngle
+ h
avin
g a
youn
g ch
ild)
was
pos
itive
ly a
nd si
gnifi
cant
ly a
ssoc
iate
d w
ith v
eget
able
co
nsum
ptio
n.
YAg
e, g
ende
r, ed
ucat
ion,
ra
ce.
Dev
ine
(199
9)59
2(8
2%)
Pres
ence
of o
ther
s dur
ing
mea
l tim
e Ea
ting
with
oth
ers w
as n
ot a
ssoc
iate
d w
ith v
eget
able
co
nsum
ptio
n.no
t ava
ilabl
eAg
e, g
ende
r, ed
ucat
ion,
ra
ce.
Die
z-Ro
ux(1
999)
1309
5(r
espo
nse
rate
% n
ot
avai
labl
e)
med
ian
inco
me
of n
eigh
bour
-ho
odm
en a
nd w
omen
in th
e po
ores
t nei
ghbo
urho
ods w
ere
1.20
an
d 1.
11 ti
mes
mor
e lik
ely
to h
ave
low
veg
etab
le c
onsu
mp-
tions
(res
pect
ivel
y) th
an th
ose
in th
e m
ost a
dvan
tage
d ne
ighb
ourh
oods
.
nS
men
and
wom
enAg
e, g
ende
r, ra
ce, e
nerg
y in
take
, fie
ld c
entr
e,
indi
vidu
al-le
vel i
ncom
e.
Fors
yth
(199
4)69
1(r
espo
nse
rate
% n
ot
avai
labl
e)
Livi
ng in
a d
epriv
ed v
s. a
dvan
-ta
ged
area
Resid
ents
of d
epriv
ed a
reas
repo
rted
con
sum
ing
2.2
serv
-in
gs le
ss o
f veg
etab
les p
er w
eek
than
thos
e in
adv
anta
ged
area
s.
Y Ag
e, g
ende
r, oc
cupa
tiona
l cl
ass.
Gis
kes
(200
2a)
8883
(61%
)Ho
useh
old
inco
me
men
and
wom
en in
the
low
est i
ncom
e qu
intil
e co
nsum
ed
18g
and
16g
less
veg
etab
les (
resp
ectiv
ely)
in th
e pr
evio
us
24 h
ours
than
thei
r cou
nter
part
s in
the
high
est i
ncom
e qu
intil
e.
Y fo
r men
and
wom
enAg
e, g
ende
r, en
ergy
inta
ke.
Gis
kes
(200
2b)
7695
(61%
)Ho
useh
old
inco
me
men
and
wom
en in
the
low
est i
ncom
e qu
intil
e w
ere
1.6
times
mor
e lik
ely
to n
ot c
onsu
me
vege
tabl
es o
n a
daily
ba
sis.
Y fo
r men
and
wom
enAg
e, g
ende
r, en
ergy
inta
ke.
Kamphuis_09.indd 203 20-8-2008 10:34:46

204 Part III Socioeconomic status, environmental factors and diet
Tabl
e 10
.4 (
Cont
inue
d)
Firs
t aut
hor
(yea
r)Sa
mpl
e si
ze(r
espo
nse
rate
%)
Envi
ronm
enta
l de
term
inan
t(s)
Find
ings
was
ass
ocia
tion
sign
ifica
nt?
bAd
just
ed fo
r
Laak
sone
n (2
004)
1992
(70%
)Ho
useh
old
inco
me
men
and
wom
en in
low
-inco
me
hous
ehol
ds w
ere
1.54
an
d 1.
42 ti
mes
mor
e lik
ely
to b
e lo
w v
eget
able
con
sum
-er
s (re
spec
tivel
y) c
ompa
red
to th
ose
in h
igh
inco
me
hous
ehol
ds.
Y fo
r men
and
wom
enAg
e, s
tudy
yea
r, ed
ucat
ion
and
occu
patio
n, m
arita
l st
atus
, hav
ing
depe
nden
t ch
ildre
n in
the
fam
ily.
Mat
eria
l fac
tors
nas
ka(2
000)
14
2715
hou
seho
lds
(res
pons
e ra
te %
not
av
aila
ble)
How
muc
h ve
geta
bles
are
av
aila
ble
in th
e fo
od s
uppl
y in
di
ffere
nt c
ount
ries
In n
orw
ay, a
cou
ntry
of l
ow a
vaila
bilit
y (i.
e. 1
02 g
/pe
rson
per
day
) 93%
of t
he p
opul
atio
n di
d no
t rea
ch th
e re
com
men
ded
inta
ke fo
r veg
etab
les,
whe
reas
in G
reec
e, a
co
untr
y of
hig
h av
aila
bilit
y (2
67 g
/per
son
per d
ay) 5
6% o
f th
e po
pula
tion
did
not r
each
wH
o re
com
men
datio
ns.
not a
vaila
ble
nil
oth
er f
acto
rs
Pan
(199
9)63 (5
3%)
Resid
ing
in th
e U
S fo
r a m
ini-
mum
of 6
mon
ths i
nste
ad o
f re
sidin
g in
an
Asia
n co
untr
y.
whe
n m
ovin
g fro
m a
n As
ian
coun
try
to th
e U
S, th
e fre
quen
cy o
f ve
geta
ble
cons
umpt
ion
decr
ease
d fro
m 2
6 to
21
tim
es p
er w
eek.
Yni
l
Papa
daki
(200
2)
80 (95.
2%)
Resid
ing
in S
cotla
nd in
stea
d of
Gre
ece.
mov
ing
to S
cotla
nd (f
rom
Gre
ece)
resu
lted
in 5
2% o
f the
st
uden
ts c
hang
ing
thei
r raw
veg
etab
les c
onsu
mpt
ion
from
>
1 ti
me/
day
to le
ss th
an 1
tim
e/da
y.m
ovin
g to
Sco
tland
(fro
m G
reec
e) h
ad n
o sig
nific
ant e
ffect
on
the
cons
umpt
ion
of c
ooke
d ve
geta
bles
.
Raw
veg
etab
les:
YCo
oked
veg
etab
les:
nS
nil
Polla
rd(2
001)
35
367
wom
en o
nly
(58%
)
Havi
ng c
hild
ren,
mar
ital s
tatu
sTho
se w
ithou
t chi
ldre
n co
nsum
ed 0
.17
port
ions
less
than
pa
rtic
ipan
ts w
ith c
hild
ren.
Sin
gle
part
icip
ants
con
sum
ed
0.60
few
er p
ortio
ns o
f veg
etab
les t
han
thei
r mar
ried
coun
terp
arts
.
Child
ren:
Ym
arita
l sta
tus:
Yni
l
Polla
rd(2
001)
35
367
wom
en o
nly
(58%
)
Regi
on o
f res
iden
cePa
rtic
ipan
ts in
the
nort
h w
est c
onsu
med
0.3
2 po
rtio
ns le
ss
than
thos
e in
the
sout
h w
est.
Regi
on o
f res
iden
ce: Y
nil
Soci
al f
acto
rs
Ting
ay(2
003)
43
1(8
7%)
Food
inse
curit
yPa
rtic
ipan
ts w
ith fo
od in
secu
rity
had
a lik
elih
ood
of 0
.43
(0.2
5, 0
.74)
for c
onsu
min
g ve
geta
bles
dai
ly c
ompa
red
to
thei
r cou
nter
part
s tha
t wer
e fo
od s
ecur
e.
YAg
e, s
ex
Kamphuis_09.indd 204 20-8-2008 10:34:47

20510 Environmental correlates of fruit and vegetable consumption
Firs
t aut
hor
(yea
r)Sa
mpl
e si
ze(r
espo
nse
rate
%)
Envi
ronm
enta
l de
term
inan
t(s)
Find
ings
was
ass
ocia
tion
sign
ifica
nt?
bAd
just
ed fo
r
Van
Stav
eren
(199
6)
114
wom
en o
nly
(res
pons
e ra
te %
not
av
aila
ble)
Seas
on: s
umm
er o
r win
ter
Vege
tabl
e co
nsum
ptio
n w
as 4
5g lo
wer
in th
e w
inte
r co
mpa
red
to s
umm
er.
YDa
y of
the
wee
k
wan
del
(199
5)14
960
(77%
)nu
mbe
r of c
hild
ren
in h
ouse
-ho
ld, h
ouse
hold
size
Thos
e w
ith c
hild
ren
wer
e -0
.15
less
like
ly to
be
frequ
ent
cons
umer
s of v
eget
able
s tha
n pa
rtic
ipan
ts w
ithou
t. Pa
r-tic
ipan
ts in
hou
seho
lds w
ith m
ore
than
2 p
eopl
e w
ere
1.11
tim
es m
ore
likel
y to
be
frequ
ent v
eget
able
con
sum
ers t
han
thos
e liv
ing
alon
e.
nS
for h
avin
g ch
ildre
nY
for h
ouse
hold
size
.ni
l
wan
del
(199
5)
1496
0(7
7%)
Hous
ehol
d in
com
eHi
gh-in
com
e gr
oups
wer
e -0
.89
times
less
like
ly to
con
-su
me
vege
tabl
es s
eldo
mly
than
low
inco
me
grou
ps.
Yni
l
wan
del
(199
5)
1496
0(7
7%)
Regi
on o
f res
iden
ceTh
ose
livin
g in
the
nort
h of
nor
way
wer
e–0
.73
less
like
ly to
be
frequ
ent v
eget
able
con
sum
ers t
han
thos
e liv
ing
in o
slo.
Yni
l
Zieg
ler
(198
7)90
0(6
4%)
Seas
on: s
umm
er-s
prin
g or
w
inte
r-fal
lIn
win
ter-f
all,
part
icip
ants
ate
11
serv
ings
of v
eget
able
s le
ss p
er m
onth
than
in su
mm
er-s
prin
g.no
t ava
ilabl
eni
l
a St
udie
s ar
e gr
oupe
d by
the
envi
ronm
enta
l det
erm
inan
t(s)
they
exa
min
e (fo
llow
ing
the
clas
sific
atio
n of
the
fram
ewor
k). W
ithin
eac
h su
bgro
up, s
tudi
es a
re g
roup
ed b
y sp
ecifi
c de
term
inan
ts.
b Y=
effe
cts
was
sta
tistic
ally
sig
nific
ant (
p ≤
0.05
). N
S= e
ffect
was
not
sig
nific
ant.
Tabl
e 10
.4 (
Cont
inue
d)
Kamphuis_09.indd 205 20-8-2008 10:34:47

206 Part III Socioeconomic status, environmental factors and diet
Tabl
e 10
.5 R
esul
ts o
f stu
dies
exa
min
ing
envi
ronm
enta
l det
erm
inan
ts o
f fru
it an
d ve
geta
ble
cons
umpt
iona
Firs
t aut
hor
(yea
r)Sa
mpl
e si
ze(r
espo
nse
rate
%)
Envi
ronm
enta
l det
erm
inan
t(s)
Find
ings
was
ass
ocia
tion
sign
ifica
nt?
bAd
just
ed fo
r
Acc
essi
bilit
y an
d av
aila
bilit
y
Bills
on (1
999)
144
4 (7
0%)
Havi
ng h
ome
grow
n pr
oduc
eEa
ting
hom
e gr
own
prod
uce
was
ver
y sig
nific
antly
ass
ocia
ted
with
hi
gher
FV
cons
umpt
ion.
mor
e th
an 4
0% o
f the
men
and
wom
en in
th
e hi
ghes
t FV
cons
umpt
ion
quar
tile
cons
umed
hom
e gr
own
prod
uce.
Y fo
r men
and
w
omen
nil
nas
ka(2
000)
14
2715
hou
seho
lds
(res
pons
e ra
te %
not
av
aila
ble)
How
muc
h fru
its a
nd v
eget
able
s are
av
aila
ble
in th
e fo
od s
uppl
y in
diff
er-
ent c
ount
ries
In Ir
elan
d, a
cou
ntry
of l
ow a
vaila
bilit
y (i.
e. 2
33 g
/per
son
per d
ay)
88%
of t
he p
opul
atio
n di
d no
t rea
ch th
e re
com
men
ded
inta
ke fo
r FV,
w
here
as in
Gre
ece,
a c
ount
ry o
f hig
h av
aila
bilit
y (6
17 g
/per
son
per
day)
37%
of t
he p
opul
atio
n di
d no
t rea
ch w
Ho
reco
mm
enda
tions
.
not a
vaila
ble
nil
Dib
sdal
l(2
003)
680
(23%
)Ac
cess
ibili
ty (o
f sho
ps, c
hoic
e of
FV
in
shop
s), a
fford
abili
ty, c
ar a
cces
sPe
ople
that
indi
cate
d to
eat
five
or m
ore
port
ions
of F
V pe
r day
had
a
signi
fican
tly m
ore
posit
ive
attit
ude
tow
ards
thei
r acc
essib
ility
of F
V
than
peo
ple
eatin
g tw
o or
less
FV
port
ions
per
day
.Pe
ople
that
indi
cate
d to
eat
five
or m
ore
port
ions
of F
V pe
r day
had
a
signi
fican
tly l
ess n
egat
ive
attit
ude
tow
ards
the
affo
rdab
ility
of F
V
than
peo
ple
eatin
g fo
ur o
r les
s FV
port
ions
per
day
.68
% o
f the
peo
ple
that
indi
cate
d to
eat
five
or m
ore
port
ions
had
ac
cess
to a
car
, whi
le re
sp. 5
5% a
nd 4
8% o
f the
peo
ple
that
ate
0-2
an
d 3-
4 po
rtio
ns h
ad c
ar a
cces
s.
Acce
ssib
ility
: Y
Affo
rdab
ility
: YCa
r acc
ess:
not
re
port
ed
nil
mor
land
(200
2)10
623
(res
pons
e ra
te %
not
av
aila
ble)
whe
ther
or n
ot th
ere
wer
e th
e fo
llow
-in
g fo
od s
tore
s in
the
cens
us tr
act:
- Su
perm
arke
ts-
Gro
cery
sto
res
- Fu
ll se
rvic
e re
stau
rant
s-
Fast
food
rest
aura
nts
Like
lihoo
d of
reac
hing
frui
t and
veg
etab
le re
com
men
datio
ns fo
r whi
te
Amer
ican
s (n
=82
31) w
ith th
e fo
llow
ing
stor
es in
the
cens
us tr
act:
- Su
perm
arke
ts 1
.08
(0.8
9, 1
.30)
- G
roce
ry s
tore
s 0.
93 (0
.78,
1.1
0)-
Full
serv
ice
rest
aura
nts
0.94
(0.7
5, 1
.19)
- Fa
st fo
od re
stau
rant
s 1.
12 (0
.91,
1.3
7)Li
kelih
ood
of re
achi
ng fr
uit a
nd v
eget
able
reco
mm
enda
tions
for b
lack
Am
eric
ans (
n=2
392)
with
the
follo
win
g st
ores
in th
e ce
nsus
trac
t:-
Supe
rmar
kets
1.5
4 (1
.11,
2.1
2)-
Gro
cery
sto
res
1.07
(0.8
3, 1
.38)
- Fu
ll se
rvic
e re
stau
rant
s 1.
06 (0
.79,
1.4
1)-
Fast
food
rest
aura
nts
0.94
(0.7
4, 1
.21)
whi
te A
mer
ican
s:
nS
for a
ll ty
pes o
f
food
out
lets
Blac
k Am
eric
ans:
Supe
rmar
kets
: Yo
ther
out
lets
: nS
Educ
atio
n, in
com
e an
d ot
her t
ypes
of
food
sto
res
Kamphuis_09.indd 206 20-8-2008 10:34:47

20710 Environmental correlates of fruit and vegetable consumption
Firs
t aut
hor
(yea
r)Sa
mpl
e si
ze(r
espo
nse
rate
%)
Envi
ronm
enta
l det
erm
inan
t(s)
Find
ings
was
ass
ocia
tion
sign
ifica
nt?
bAd
just
ed fo
r
Soci
al f
acto
rs
Bills
on (1
999)
144
4 (7
0%)
mar
ital s
tatu
sAm
ong
men
, bei
ng m
arrie
d w
as a
ssoc
iate
d w
ith in
crea
sed
FV in
take
an
d be
ing
singl
e or
div
orce
d/se
para
ted
was
ass
ocia
ted
with
low
FV
inta
ke.
men
: Yw
omen
: nS
nil
Kint
ner
(198
1)84 (r
espo
nse
rate
% n
ot
avai
labl
e)
over
all f
amily
func
tioni
ngCo
hesio
n-as
pect
of f
amily
func
tioni
ng
(whe
ther
fam
ily m
embe
rs h
elp
and
supp
ort e
ach
othe
r)
over
all,
the
asso
ciat
ions
of f
amily
func
tioni
ng w
ith F
V in
take
s wer
e
smal
l and
non
-sig
nific
ant.
Fam
ily h
elp
and
supp
ort w
as si
gnifi
cant
and
pos
itive
ly c
orre
late
d w
ith
FV c
onsu
mpt
ion
amon
g w
omen
(not
am
ong
men
).
over
all f
amily
func
tioni
ng: n
SY
for h
elp
and
supp
ort a
mon
g w
omen
.
nil
Polla
rd(2
001)
35
367
wom
en o
nly
(58%
)
Havi
ng c
hild
ren,
mar
ital s
tatu
sTh
e lik
elih
ood
of b
eing
a h
igh
FV c
onsu
mer
was
1.0
9 (0
.98,
1.2
1) fo
r w
omen
with
chi
ldre
n co
mpa
red
to w
omen
with
no
child
ren,
and
1.6
2 (1
.38,
1.9
1) fo
r mar
ried
wom
en c
ompa
red
to si
ngle
wom
en.
Havi
ng c
hild
ren:
n
Sm
arrie
d: Y
Age,
phy
sical
ac
tivity
sta
tus,
vege
taria
n st
atus
, in
take
of v
itam
in
supp
lem
ents
, ill
ness
es, a
lcoh
ol
cons
umpt
ion,
ed
ucat
ion
leve
l, em
ploy
men
t sta
tus,
occu
patio
n, re
gion
of
resid
ence
.St
epto
e(2
004)
21
8(r
espo
nse
rate
% n
ot
avai
labl
e)
Soci
al su
ppor
t: fro
m fa
mily
, fro
m
othe
rsRe
gres
sion
co-e
ffic
ient
for s
ocia
l sup
port
(fam
ily) i
s 0.1
0 (0
.012
,
0.18
); ch
ange
in v
aria
nce:
1.9
%Re
gres
sion
co-e
ffic
ient
for s
ocia
l sup
port
(oth
er) i
s 0.1
0 (0
.011
, 0.1
9);
chan
ge in
var
ianc
e 1.
8%
Soci
al su
ppor
t
(fam
ily):
YSo
cial
supp
ort
(oth
er):
Y
Expe
rimen
tal
grou
p, g
ende
r, et
hnic
ity, i
ncom
e,
smok
ing,
bas
elin
e F/
V co
nsum
ptio
nCu
ltur
al f
acto
rs
Kint
ner
(198
1)84 (r
espo
nse
rate
% n
ot
avai
labl
e)
Inte
llect
ual-c
ultu
ral a
spec
t of f
amily
fu
nctio
ning
Th
e in
telle
ctua
l-cul
tura
l asp
ect o
f fam
ily fu
nctio
ning
(whe
ther
the
fam
ily is
con
cern
ed a
bout
pol
itica
l, so
cial
, int
elle
ctua
l, an
d cu
ltura
l ac
tiviti
es) w
as si
gnifi
cant
ly c
orre
late
d w
ith F
V in
take
for w
omen
.
Y fo
r int
elle
ctua
l-cu
ltura
l asp
ect
amon
g w
omen
.
nil
Mat
eria
l fac
tors
Bills
on (1
999)
144
4 (7
0%)
Rece
ivin
g be
nefit
sBe
ing
in re
ceip
t of b
enef
its w
as n
egat
ivel
y as
soci
ated
with
FV
inta
ke m
en: Y
wom
en: Y
nil
Tabl
e 10
.5 (
Cont
inue
d)
Kamphuis_09.indd 207 20-8-2008 10:34:47

208 Part III Socioeconomic status, environmental factors and diet
Firs
t aut
hor
(yea
r)Sa
mpl
e si
ze(r
espo
nse
rate
%)
Envi
ronm
enta
l det
erm
inan
t(s)
Find
ings
was
ass
ocia
tion
sign
ifica
nt?
bAd
just
ed fo
r
Shoh
aim
i(2
004)
22
562
(38%
)De
priv
atio
n of
resid
entia
l are
am
en a
nd w
omen
in th
e m
ost d
epriv
ed a
reas
con
sum
ed 2
6.5g
/d a
nd
16g/
d le
ss fr
uit a
nd v
eget
able
s (re
spec
tivel
y) c
ompa
red
to th
eir m
ost
adva
ntag
ed c
ount
erpa
rts.
men
: Yw
omen
: nS
occu
patio
nal c
lass
, ed
ucat
ion,
age
joha
nsso
n(1
998)
1564
(87%
) + 3
144
(63%
)Ho
useh
old
inco
me
Low
inco
me
men
con
sum
ed 1
g le
ss fr
uit a
nd v
eget
able
s per
day
than
hi
gh in
com
e m
en. L
ow in
com
e w
omen
con
sum
ed 3
5g m
ore
fruit
and
vege
tabl
es p
er d
ay th
an th
eir h
igh
inco
me
coun
terp
arts
.
men
: nS
wom
en: Y
nil
joha
nsso
n(1
999)
31
44(6
3%)
Hous
ehol
d in
com
eLo
w in
com
e m
en c
onsu
med
32g
less
frui
t and
veg
etab
les t
han
high
in
com
e m
en. L
ow-in
com
e w
omen
con
sum
ed 7
g m
ore
fruit
and
veg-
etab
les t
han
high
inco
me
wom
en.
men
: Yw
omen
: nS
Age,
gen
der,
educ
atio
n
oth
er f
acto
rs
Bills
on (1
999)
144
4 (7
0%)
Regi
on o
f res
iden
ce in
the
U.K.
Amon
g w
omen
, liv
ing
in S
cotla
nd w
as n
egat
ivel
y as
soci
ated
with
FV
inta
ke, w
here
as li
ving
in L
ondo
n or
the
Sout
h-Ea
st o
f the
U.K
. was
po
sitiv
ely
asso
ciat
ed w
ith F
V co
nsum
ptio
n.
wom
en: Y
men
: nS
nil
joha
nsso
n(1
999)
3144
(63%
)Re
sidin
g in
an
urba
n vs
. rur
al a
rea
in
norw
aym
en li
ving
in ru
ral a
reas
con
sum
ed 4
7g le
ss fr
uit a
nd v
eget
able
s tha
n th
ose
in c
ities
, whe
reas
wom
en in
rura
l are
as c
onsu
med
58g
less
frui
t an
d ve
geta
bles
than
thei
r cou
nter
part
s liv
ing
in c
ities
.
men
: Yw
omen
: YAg
e, g
ende
r, ed
ucat
ion
Papa
daki
(200
2)
80 (95,
2%)
Resid
ing
in S
cotla
nd in
stea
d of
Gre
ece
The
med
ian
estim
ated
dai
ly in
take
of f
ruit
and
vege
tabl
es d
ecre
ased
fro
m 3
63g
in G
reec
e to
124
g in
Gla
sgow
.no
t ava
ilabl
eni
l
Polla
rd(2
001)
35
367
wom
en o
nly
(58%
)
Regi
on o
f res
iden
ce in
the
UK
The
likel
ihoo
d of
bei
ng a
hig
h FV
con
sum
er w
as 0
.71
(0.5
5, 0
.93)
for
wom
en li
ving
in th
e no
rthw
est o
f the
UK
and
2.09
(0.6
2, 6
.99)
for
wom
en in
nor
ther
n Ire
land
, com
pare
d to
wom
en in
the
nort
h ea
st.
nS
(See
abo
ve)
Suba
r(1
994)
2014
3(r
espo
nse
rate
% n
ot
avai
labl
e)
Seas
on(s
umm
er/w
inte
r)In
win
ter,
men
con
sum
ed 0
.5 s
ervi
ngs p
er w
eek
mor
e th
an in
the
sum
mer
. In
win
ter,
wom
en c
onsu
med
1 s
ervi
ng p
er w
eek
mor
e th
an
in th
e su
mm
er.
not a
vaila
ble
Age,
race
, reg
ion,
ed
ucat
ion,
pov
erty
in
dex.
Zieg
ler
(198
7)90
0(6
4%)
Seas
on (s
umm
er-s
prin
g or
win
ter-f
all)
In w
inte
r-fal
l, pa
rtic
ipan
ts a
te 4
9 se
rvin
gs o
f FV
less
per
mon
th th
an
in su
mm
er-s
prin
g.no
t ava
ilabl
eni
l
a St
udie
s ar
e gr
oupe
d by
the
envi
ronm
enta
l det
erm
inan
t(s)
they
exa
min
e (fo
llow
ing
the
clas
sific
atio
n of
the
fram
ewor
k). W
ithin
eac
h su
bgro
up, s
tudi
es a
re g
roup
ed b
y sp
ecifi
c de
term
inan
ts.
b Y=
effe
cts
was
sta
tistic
ally
sig
nific
ant (
p ≤
0.05
). N
S= e
ffect
was
not
sig
nific
ant.
Tabl
e 10
.5 (
Cont
inue
d)
Kamphuis_09.indd 208 20-8-2008 10:34:47

20910 Environmental correlates of fruit and vegetable consumption
Discussion
we performed a systematic review of environmental determinants of FV intakes. Household income was investigated in six studies that showed in general con-sistent positive associations with FV intakes [27-29, 40, 43, 44]. Being married [22, 33, 41], and residing in an advantaged area (even after adjustment for individual characteristics like occupation or income level) [30, 31, 45] showed positive –though not always significant- associations with FV consumption, in at least three studies of acceptable quality. Good local availability of FV (e.g. by growing FV in one’s own garden, or having low food insecurity) also seemed positively related to intakes, although the evidence was limited. Overall conclu-sions should be drawn with caution, due to the confined number of studies for each specific environment–intake association.
Income and being married, two of the factors studied most frequently, may not sound as typical environmental influences. However, income has been described as a feature of an individual’s micro-environment elsewhere [46]. In our view, household income is a true environmental influence, as all household members are exposed to one and the same household income -whether they are breadwinner, housewife or child. Being married (i.e. living together with a partner) compared to being single, can be viewed as a socio-environmental factor, since the presence of a partner may affect a person’s FV intake via his/her eating patterns, social support, sociocultural norms, home availability of FV (when the partner does most of the groceries, often the case for men), etc.
The finding that people living on a smaller household budget or in disadvan-taged areas consume less FV may be due to the perceptions that FV are expen-sive [47, 48] [17], have a short shelf life, or are difficult to store [28]. Although food has been found to be equally or lower priced in deprived areas [47, 49], people pay a relatively higher premium on the price of healthy compared to less healthy foods in deprived areas [47, 48]. Interventions to improve opportuni-ties for sufficient FV consumption among low-income households seem neces-sary to improve intakes. Offering discount coupons for FV-rich menu items has been shown to be an effective strategy to encourage consumption of these foods in certain venues [50]. Nevertheless, more research into the associations between household income and FV consumption is necessary to better under-stand the precise mechanisms that lead from low incomes to low intakes.
Three dependent variables, i.e. fruit consumption, vegetable consumption, and FV consumption combined, were studied. As can be derived from Table 2, no major differences in their relationships with environmental factors were observed. However, associations have been studied most for FV consumption when combined (45 tests) and less for fruit and vegetable consumptions sepa-Firs
t aut
hor
(yea
r)Sa
mpl
e si
ze(r
espo
nse
rate
%)
Envi
ronm
enta
l det
erm
inan
t(s)
Find
ings
was
ass
ocia
tion
sign
ifica
nt?
bAd
just
ed fo
r
Shoh
aim
i(2
004)
22
562
(38%
)De
priv
atio
n of
resid
entia
l are
am
en a
nd w
omen
in th
e m
ost d
epriv
ed a
reas
con
sum
ed 2
6.5g
/d a
nd
16g/
d le
ss fr
uit a
nd v
eget
able
s (re
spec
tivel
y) c
ompa
red
to th
eir m
ost
adva
ntag
ed c
ount
erpa
rts.
men
: Yw
omen
: nS
occu
patio
nal c
lass
, ed
ucat
ion,
age
joha
nsso
n(1
998)
1564
(87%
) + 3
144
(63%
)Ho
useh
old
inco
me
Low
inco
me
men
con
sum
ed 1
g le
ss fr
uit a
nd v
eget
able
s per
day
than
hi
gh in
com
e m
en. L
ow in
com
e w
omen
con
sum
ed 3
5g m
ore
fruit
and
vege
tabl
es p
er d
ay th
an th
eir h
igh
inco
me
coun
terp
arts
.
men
: nS
wom
en: Y
nil
joha
nsso
n(1
999)
31
44(6
3%)
Hous
ehol
d in
com
eLo
w in
com
e m
en c
onsu
med
32g
less
frui
t and
veg
etab
les t
han
high
in
com
e m
en. L
ow-in
com
e w
omen
con
sum
ed 7
g m
ore
fruit
and
veg-
etab
les t
han
high
inco
me
wom
en.
men
: Yw
omen
: nS
Age,
gen
der,
educ
atio
n
oth
er f
acto
rs
Bills
on (1
999)
144
4 (7
0%)
Regi
on o
f res
iden
ce in
the
U.K.
Amon
g w
omen
, liv
ing
in S
cotla
nd w
as n
egat
ivel
y as
soci
ated
with
FV
inta
ke, w
here
as li
ving
in L
ondo
n or
the
Sout
h-Ea
st o
f the
U.K
. was
po
sitiv
ely
asso
ciat
ed w
ith F
V co
nsum
ptio
n.
wom
en: Y
men
: nS
nil
joha
nsso
n(1
999)
3144
(63%
)Re
sidin
g in
an
urba
n vs
. rur
al a
rea
in
norw
aym
en li
ving
in ru
ral a
reas
con
sum
ed 4
7g le
ss fr
uit a
nd v
eget
able
s tha
n th
ose
in c
ities
, whe
reas
wom
en in
rura
l are
as c
onsu
med
58g
less
frui
t an
d ve
geta
bles
than
thei
r cou
nter
part
s liv
ing
in c
ities
.
men
: Yw
omen
: YAg
e, g
ende
r, ed
ucat
ion
Papa
daki
(200
2)
80 (95,
2%)
Resid
ing
in S
cotla
nd in
stea
d of
Gre
ece
The
med
ian
estim
ated
dai
ly in
take
of f
ruit
and
vege
tabl
es d
ecre
ased
fro
m 3
63g
in G
reec
e to
124
g in
Gla
sgow
.no
t ava
ilabl
eni
l
Polla
rd(2
001)
35
367
wom
en o
nly
(58%
)
Regi
on o
f res
iden
ce in
the
UK
The
likel
ihoo
d of
bei
ng a
hig
h FV
con
sum
er w
as 0
.71
(0.5
5, 0
.93)
for
wom
en li
ving
in th
e no
rthw
est o
f the
UK
and
2.09
(0.6
2, 6
.99)
for
wom
en in
nor
ther
n Ire
land
, com
pare
d to
wom
en in
the
nort
h ea
st.
nS
(See
abo
ve)
Suba
r(1
994)
2014
3(r
espo
nse
rate
% n
ot
avai
labl
e)
Seas
on(s
umm
er/w
inte
r)In
win
ter,
men
con
sum
ed 0
.5 s
ervi
ngs p
er w
eek
mor
e th
an in
the
sum
mer
. In
win
ter,
wom
en c
onsu
med
1 s
ervi
ng p
er w
eek
mor
e th
an
in th
e su
mm
er.
not a
vaila
ble
Age,
race
, reg
ion,
ed
ucat
ion,
pov
erty
in
dex.
Zieg
ler
(198
7)90
0(6
4%)
Seas
on (s
umm
er-s
prin
g or
win
ter-f
all)
In w
inte
r-fal
l, pa
rtic
ipan
ts a
te 4
9 se
rvin
gs o
f FV
less
per
mon
th th
an
in su
mm
er-s
prin
g.no
t ava
ilabl
eni
l
a St
udie
s ar
e gr
oupe
d by
the
envi
ronm
enta
l det
erm
inan
t(s)
they
exa
min
e (fo
llow
ing
the
clas
sific
atio
n of
the
fram
ewor
k). W
ithin
eac
h su
bgro
up, s
tudi
es a
re g
roup
ed b
y sp
ecifi
c de
term
inan
ts.
b Y=
effe
cts
was
sta
tistic
ally
sig
nific
ant (
p ≤
0.05
). N
S= e
ffect
was
not
sig
nific
ant.
Kamphuis_09.indd 209 20-8-2008 10:34:47

210 Part III Socioeconomic status, environmental factors and diet
rately (27 and 28 tests respectively). Researchers might assume that environ-mental determinants relate to fruit and vegetable consumption in the same way, and therefore take both dietary measures together as one outcome. It seems reasonable to presume that, for instance, the presence of a supermarket in one’s neighbourhood relates to the accessibility of fruits and vegetables in the same way. Other factors, however, can be important for fruit rather than for vegetable intake (e.g. the presence of fruit in the fruit bowl on the home table may elicit fruit consumption) and vice versa (e.g. cultural specific eating patterns may determine the amount of vegetables eaten during meals). Other research has found that similar behaviours (such as walking and cycling) do in fact show dif-ferent associations with some environmental factors [51, 52]. Hence, it seems important for future research to investigate environmental influences on fruit and vegetable consumption separately.
Four categories of environmental variables were distinguished in this study. we have found about an equal, though fairly low number of studies examining accessibility, social and material factors (resulting in 24, 20 and 26 tests respec-tively). Only two studies examined cultural factors (3 tests in total), of which one study was of doubtful quality [53]. This very low number of studies for cultural factors might be surprising, since culture has been known as the foun-dation that underlies food choices, as it determines what people consider to be acceptable and preferable foods, and the amount and combinations of food they choose [54]. On the other hand, cultural influences may be difficult to concep-tualise and measure, and they have rarely been specified in health behaviour models. One exception is the Theory of Triadic Influences, that incorporates the cultural environment as one of the ultimate influences on health behaviour [55]. A more specific conceptualisation of cultural factors in health behaviour models may be needed to explore the pathways between, for instance, cultural-specific eating patterns and FV consumption.
Two groups of factors, regional and seasonal influences, were grouped under a separate heading of ‘other factors’, since it was unclear how they relate to FV intake. This could, for instance, be via availability of FV in a certain area or season, or via culturally determined FV consumption patterns in an area or season. Although studies were often of low quality, it can be concluded that living in the north of the U.K is not beneficial for one’s FV consumption com-pared to other parts of the U.K. [22, 41] or to living in Greece [37]. This can be related to the fact that average income levels are generally known to be lower in the North East of England and Scotland compared to the South East of Eng-land. Seasonal influences showed mixed associations with intakes.
Kamphuis_09.indd 210 20-8-2008 10:34:47

21110 Environmental correlates of fruit and vegetable consumption
Study limitationsThere were several limitations of this review study that have to been taken into account in the interpretation of the findings. The search strategies did not locate ‘grey literature’ (e.g. unpublished studies, local reports, phD and masters abstracts). However, it was reasoned that problems with including grey literature (poor study quality due to lack of peer review [56] and time and costs involved in identifying and retrieving grey literature [57]), outweighed the pos-sible advantage of preventing our results from the influence of publication bias. However, we could have missed important ‘grey literature’ that could have con-tributed to this review (e.g. [58])
Another limitation is that measurements of dietary intakes differed between studies. In sixteen papers, intakes were measured by a food frequency ques-tionnaire, with the number of food items ranging from 2 (one for fruit and one for vegetables) [59] till 217 different food items [22]. Less frequently used mea-surement tools were a 7-day food consumption diary [41], and a 24-h dietary recall [27, 28, 38]. The validity of the measures was hardly discussed in these papers. It is likely that the variation in measures for fruit and vegetable intakes, as well as for the environmental determinants, may have contributed to ‘noise’ or variation in the associations found.
Three other limitations directly relate to the relatively few studies found in this area of research. Firstly, there is very little known about appropriate confound-ers in the relationship between the environment and FV intake. Some studies included in this review may ‘overcorrect’ for individual factors that are on the pathway between the environment and FV intake (e.g. being a vegetarian), which wrongly diminishes the actual association. In studies that do not cor-rect for confounders or only adjusted for a limited set (age, sex, and education/occupation), associations might be overestimated. This makes it possible that this review gives an ‘overestimated’ overview of relevant environmental factors. It is likely that future research, when taking correct confounders into account, will show that some associations are non-existent.
moreover, this review lacks an estimation of the relative importance of environ-mental compared to individual level factors, as most studies did not report on the strength of the associations found. Just one study reported that social sup-port from family and social support from others accounted for 1.9% and 1.8% of the variance in fruit and vegetable intake, respectively [59]. compared to the proportion explained variance by typical individual level factors, this is rather small [7, 8]. For instance, four psychosocial correlates – importance of eating vegetables, health benefits, convenience and taste of raw vegetables, and taste of cooked vegetables – explained 14% of the variance in vegetable intake [7]. In general, the proportion of variance explained by environmental factors will be
Kamphuis_09.indd 211 20-8-2008 10:34:47

212 Part III Socioeconomic status, environmental factors and diet
substantially smaller than for individual level factors, since the latter factors are much closer related to the actual behaviour. Subsequent research in this area should focus on the relative importance of these factors.
Finally, the fact that studies in this review originate from different countries makes the interpretation of the results difficult. Relevant availability-related influences may be country specific, as, for instance, neighbourhood differences in the accessibility of supermarkets and grocery stores appear to only exist in the U.S. [60]. As can be derived from Table 1, factors related to local availabil-ity of FV (i.e. having one’s own vegetable garden, low food insecurity, presence of a supermarket in the residence area, and positive perceptions of the acces-sibility of FV shops) were positively associated with intakes in the U.S. as well as the U.K. Nevertheless, the availability of FV on the national level differed considerably for European countries (in 1990), ranging from 233 g of FV per person per day in Ireland to a total of 617 g/person per day in Greece, with parallel differences in intakes. [26].
Comparison with other reviewswe located four other reviews on environmental determinants of either FV consumption or healthy diets, by searching several databases and the refer-ence lists of studies. These reviews differed from ours in that they were not performed in a systematic way, had a more narrative tenor or focused on other dietary outcomes. Our findings are in line with these studies regarding the associations of accessibility and household income with FV consumption [8, 61] or healthy eating [62, 63]. Individual consumers need sufficient access to quantities of fruits and vegetables at affordable prices and in forms that meet standards for quality, taste, palatability and convenience to be able to meet recommended intake levels. This is often not the case, especially among low income households in poor central cities and sparsely populated rural areas [64]. The increasing numbers of meals being consumed away from home was also stressed as an important factor for unhealthy eating [62, 63]. Away-from-home foods typically have higher energy and fat densities and larger portion sizes, which are associated with a decreased diet quality and increased total energy intake [63]. Reviews also stressed the necessity to improve our under-standing of food environments, referring to the small number of studies in this research area, and that existing studies suffer many limitations (e.g. small population sizes, non-longitudinal designs, and geographic isolation) [62, 63].
Conclusions and recommendationsThere is a clear need for more research on supportive food environments, ide-ally for different dietary intakes separately, as relevant environmental factors may differ for various outcomes. This research should preferably be longitudi-nal, to understand the causal pathways between the environment and intakes.
Kamphuis_09.indd 212 20-8-2008 10:34:47

21310 Environmental correlates of fruit and vegetable consumption
Studies should investigate the strength of the associations observed, or specifi-cally, study the relative importance of environmental compared to individual-level factors, as has been done for environment-physical activity associations [11, 65]. A good theoretical framework should underlie this research, so that hypotheses can be formed and tested, to further develop scientific knowledge and theory in this emerging field. Specifically, extensive research into acces-sibility- and availability-related influences and cultural influences can result in new explanations for variations in FV consumption, and offer new avenues to promote behaviour change towards recommended FV intakes.
In summary, with the available data, it can be concluded that consumption of FV is likely to be higher among people with higher incomes, being married, living in an advantaged neighbourhood and/or with good local availability and accessibility of FV. However, the evidence base for the latter determinants is still too thin to justify large-scale interventions targeting those environmental determinants. The only exception to this is household income. Interventions to improve opportunities for sufficient FV consumption among low-income households are likely to lead to improved intakes.
Acknowledgements
This review paper resulted from a broad review project on environmental deter-minants and environmental interventions of several health-related behaviours. The project was a joint effort of researchers from three research institutes: the Department of public Health of Erasmus University medical centre (Erasmus mc) that coordinated the study, the Department of Health Education and pro-motion of maastricht University and the National Institute for public Health and the Environment (RIVm). we are thankful to all participating researchers from these institutes for their fruitful collaboration. Also, we are grateful to our international colleagues from Deakin University (Australia), Glasgow Univer-sity (U.K.), University of Oslo (Norway), and Ghent University (Belgium) for sharing their views on environmental determinants of health behaviours with us during the expert-meeting in Rotterdam on June 14, 2005. The project was supported by a grant from the Netherlands Organisation for Health Research and Development (Zonmw). The second author is supported by an Australian National Health and medical Research council Sidney Sax Fellowship (ID 290540).
Kamphuis_09.indd 213 20-8-2008 10:34:48

214 Part III Socioeconomic status, environmental factors and diet
References
1 murray cJ, Lopez AD. mortality by cause for eight regions of the world: Global Burden of Disease Study. Lancet 1997;349:1269-76.
2 Ness AR, powles Jw. Fruit and vegetables, and cardiovascular disease: a review. Int J Epidemiol 1997;26:1-13.
3 Van Duyn mA, pivonka E. Overview of the health benefits of fruit and vegeta-ble consumption for the dietetics professional: selected literature. J Am Diet Assoc 2000;100:1511-21.
4 Steinmetz KA, potter JD. Vegetables, fruit, and cancer prevention: a review. J Am Diet Assoc 1996;96:1027-39.
5 Danaei G, Vander Hoorn S, Lopez AD, et al. causes of cancer in the world: com-parative risk assessment of nine behavioural and environmental risk factors. Lancet 2005;366:1784-93.
6 mccullough mL, Feskanich D, Stampfer mJ, et al. Diet quality and major chronic dis-ease risk in men and women: moving toward improved dietary guidance. Am J Clin Nutr 2002;76:1261-71.
7 Satia JA, Kristal AR, patterson RE, et al. psychosocial factors and dietary habits associ-ated with vegetable consumption. Nutrition 2002;18:247-54.
8 Krebs-Smith Sm, Heimendinger J, patterson BH, et al. psychosocial factors associated with fruit and vegetable consumption. Am J Health Promot 1995;10:98-104.
9 Van Duyn mA, Kristal AR, Dodd K, et al. Association of awareness, intrapersonal and interpersonal factors, and stage of dietary change with fruit and vegetable consumption: a national survey. Am J Health Promot 2001;16:69-78.
10 De Bruijn GJ, Kremers Sp, van mechelen w, et al. Is personality related to fruit and vegetable intake and physical activity in adolescents? Health Educ Res 2005;20:635-44.
11 Giles-corti B, Donovan RJ. Relative influences of individual, social environmental, and physical environmental correlates of walking. Am J Public Health 2003;93:1583-9.
12 Humpel N, Owen N, Leslie E. Environmental factors associated with adults’ participa-tion in physical activity: a review. Am J Prev Med 2002;22:188-99.
13 Booth SL, Sallis JF, Ritenbaugh c, et al. Environmental and societal factors affect food choice and physical activity: rationale, influences, and leverage points. Nutr Rev 2001;59:S21-39; discussion S57-65.
14 Stokols D, Grzywacz JG, mcmahan S, et al. Increasing the health promotive capacity of human environments. Am J Health Promot 2003;18:4-13.
15 Hill JO, wyatt HR, Reed Gw, et al. Obesity and the environment: where do we go from here? Science 2003;299:853-5.
16 Sallis JF, Owen N. Ecological models of health behaviour. In: Glanz K, Lewis Fm, Rimer BK, eds. Health behaviour and health education Theory, research and practice. San Francisco: Jossey-Bass 2002:462-84.
17 Kamphuis cBm, van Lenthe FJ, Giskes K, et al. perceived environmental determinants of physical activity and fruit and vegetable consumption among low and high socioeco-nomic groups in the Netherlands. Health Place 2007;13:493-503.
18 cohen DA, Scribner RA, Farley TA. A structural model of health behavior: a pragmatic approach to explain and influence health behaviors at the population level. Prev Med 2000;30:146-54.
19 Hovell mF, wahlgren DR, Gehrman cA. The behavioral ecological model. In: Dicle-mente RJ, crosby RA, Kegler mc, eds. Emerging theories in health promotion practice and research Strategies for improving public health. San Francisco: Jossey-Bass 2002:347-85.
Kamphuis_09.indd 214 20-8-2008 10:34:48

21510 Environmental correlates of fruit and vegetable consumption
20 Higgins JpT, Green S, eds. Cochrane Handbook for Systematic Reviews of Interventions 4.2.5 [updated May 2005]. (accessed 26st October 2005): http://www.cochrane.org/resources/handbook/hbook.htm. 2005.
21 morland K, wing S, Diez Roux A. The contextual effect of the local food environment on residents’ diets: the atherosclerosis risk in communities study. Am J Public Health 2002;92:1761-7.
22 pollard J, Greenwood D, Kirk S, et al. Lifestyle factors affecting fruit and vegetable consumption in the UK women’s cohort Study. Appetite 2001;37:71-9.
23 Brug J, van Lenthe FJ, eds. Environmental determinants and interventions for physical activ-ity, nutrition and smoking: a review. Den Haag: Zonmw 2005.
24 Tabachnick BG, Fidel LS. Using Multivariate Statistics. New York: Allyn & Bacon 2001.25 Giskes K, Kamphuis cBm, De Bruijn GJ, et al. Environmental factors associated with
energy and fat intakes among adults: a systematic review of the literature. Public Health Nutrition 2007;22:1-13.
26 Naska A, Vasdekis VG, Trichopoulou A, et al. Fruit and vegetable availability among ten European countries: how does it compare with the ‘five-a-day’ recommendation? DAFNE I and II projects of the European commission. Br J Nutr 2000;84:549-56.
27 Giskes K, Turrell G, patterson c, et al. Socioeconomic differences among Australian adults in consumption of fruit and vegetables and intakes of vitamins A, c and folate. J Hum Nutr Diet 2002;15:375-85; discussion 87-90.
28 Giskes K, Turrell G, patterson c, et al. Socioeconomic differences in fruit and veg-etable consumption among Australian adolescents and adults. Public Health Nutr 2002;5:663-9.
29 wandel m. Dietary intake of fruits and vegetables in Norway: influence of life phase and socioeconomic factors. Int J Food Sci Nutr 1995;46:291-301.
30 Diez-Roux AV, Nieto FJ, caulfield L, et al. Neighbourhood differences in diet: the Atherosclerosis Risk in communities (ARIc) Study. J Epidemiol Community Health 1999;53:55-63.
31 Forsyth A, macintyre S, Anderson A. Diets for disease? Intraurban variation in reported food consumption in Glasgow. Appetite 1994;22:259-74.
32 Tingay RS, Tan cJ, Tan Nc, et al. Food insecurity and low income in an English inner city. J Public Health Med 2003;25:156-9.
33 Devine cm, wolfe wS, Frongillo EA, Jr., et al. Life-course events and experiences: association with fruit and vegetable consumption in 3 ethnic groups. J Am Diet Assoc 1999;99:309-14.
34 Gibney m, Lee p. patterns of food and nutrient intake in a suburb of Dublin with chron-ically high unemployment. Journal of Human Nutrition and Dietetics 1993;6:13-22.
35 Agudo A, Amiano p, Barcos A, et al. Dietary intake of vegetables and fruits among adults in five regions of Spain. EpIc Group of Spain. European prospective Investiga-tion into cancer and Nutrition. Eur J Clin Nutr 1999;53:174-80.
36 pan Y, Dixon Z, Humburg S, et al. Asian students change their eating patterns after living in the United States. Journal of the American Dietetic Association 1999;99:54-7.
37 papadaki A, Scott JA. The impact on eating habits of temporary translocation from a mediterranean to a Northern European environment. Eur J Clin Nutr 2002;56:455-61.
38 Van Staveren w, Deurenburg p, Burema J, et al. Seasonal variation in food intake, pat-tern of physical activity and change in body weight in a group of young adult Dutch women consuming self-selected diets. International Journal of Obesity 1986;10:133-45.
39 Ziegler R, wilcox H, mason T, et al. Seasonal variation in intake of carotenoids and veg-etables and fruits among white men in New Jersey. American Journal of Clinical Nutrition 1987;45:107-14.
Kamphuis_09.indd 215 20-8-2008 10:34:48

216 Part III Socioeconomic status, environmental factors and diet
40 Laaksonen m, prattala R, Helasoja V, et al. Income and health behaviours. Evi-dence from monitoring surveys among Finnish adults. J Epidemiol Community Health 2003;57:711-7.
41 Billson H, pryer JA, Nichols R. Variation in fruit and vegetable consumption among adults in Britain. An analysis from the dietary and nutritional survey of British adults. Eur J Clin Nutr 1999;53:946-52.
42 Dibsdall LA, Lambert N, Bobbin RF, et al. Low-income consumers’ attitudes and behaviour towards access, availability and motivation to eat fruit and vegetables. Public Health Nutr 2003;6:159-68.
43 Johannson L, Andersen L. who eats 5 a day?: intake of fruits and vegetables among Norwegians in relation to gender and lifestyle. Journal of the American Dietetic Association 1998;98:689-91.
44 Johansson L, Thelle DS, Solvoll K, et al. Healthy dietary habits in relation to social determinants and lifestyle factors. Br J Nutr 1999;81:211-20.
45 Shohaimi S, welch A, Bingham S, et al. Residential area deprivation predicts fruit and vegetable consumption independently of individual educational level and occupational social class: a cross sectional population study in the Norfolk cohort of the European prospective Investigation into cancer (EpIc-Norfolk). J Epidemiol Community Health 2004;58:686-91.
46 Swinburn B, Egger G, Raza F. Dissecting obesogenic environments: the development and application of a framework for identifying and prioritizing environmental interven-tions for obesity. Preventive Medicine 1999;29:563-70.
47 mooney c. cost and availability of healthy food choices in a London health district. Journal of Human Nutrition Dietetics 1990;3:111-20.
48 Sooman A, macintyre S, Anderson A. Scotland’s health--a more difficult challenge for some? The price and availability of healthy foods in socially contrasting localities in the west of Scotland. Health Bull (Edinb) 1993;51:276-84.
49 cummins S, macintyre S. A systematic study of an urban foodscape: the price and avail-ability of food in greater Glasgow. Urban Studies 2002;39:2115-30.
50 Glanz K, Hoelscher D. Increasing fruit and vegetable intake by changing environments, policy and pricing: restaurant-based research, strategies, and recommendations. Prev Med 2004;39 Suppl 2:S88-93.
51 cervero R, Duncan m. walking, bicycling, and urban landscapes: evidence from the San Francisco Bay Area. Am J Public Health 2003;93:1478-83.
52 Van Lenthe FJ, Brug J, mackenbach Jp. Neighbourhood inequalities in physical inactiv-ity: the role of neighbourhood attractiveness, proximity to local facilities and safety in the Netherlands. Soc Sci Med 2005;60:763-75.
53 Kintner m, Boss p, Johnson p. The relationship between dysfunctional family environments and family member food intake. Journal of Marriage and the Family 1981;43:633-41.
54 Nestle m, wing R, Birch L, et al. Behavioral and social influences on food choice. Nutr Rev 1998;56:S50-64; discussion S-74.
55 Flay BR, petraitis J. The theory of triadic influence: a new theory of health behavior with implications for preventive interventions. In: Albrecht GL, Fitzpatrick R, eds. Advances in Medical Sociology. Greenwich: JAI press Inc. 1994:19-44.
56 Angell m. Negative studies. N Engl J Med 1989;321:464-6.57 mcAuley L, pham B, Tugwell p, et al. Does the inclusion of grey literature influ-
ence estimates of intervention effectiveness reported in meta-analyses? Lancet 2000;356:1228-31.
Kamphuis_09.indd 216 20-8-2008 10:34:48

21710 Environmental correlates of fruit and vegetable consumption
58 white m, Bunting J, williams L, et al. Do ‘food deserts’ exist? A multi-level, geographi-cal analysis of the relationship between retail food access, socioeconomic position and dietary intake. project Report N09010. Food Standards Agency 2004.
59 Steptoe A, perkins porras L, Rink E, et al. psychological and social predictors of changes in fruit and vegetable consumption over 12 months following behavioral and nutrition education counseling. Health Psychology 2004;23:574-81.
60 cummins S, macintyre S. Food environments and obesity--neighbourhood or nation? Int J Epidemiol 2006;35:100-4.
61 pollard J, Kirk SFL, cade JE. Factors affecting food choice in relation to fruit and veg-etable intake: a review. Nutrtion Research Reviews 2002;15:373-87.
62 Glanz K, Sallis JF, Saelens BE, et al. Healthy nutrition environments: concepts and measures. Am J Health Promot 2005;19:330-3, ii.
63 popkin Bm, Duffey K, Gordon-Larsen p. Environmental influences on food choice, physical activity and energy balance. Physiol Behav 2005;86:603-13.
64 Krebs-Smith Sm, Kantor LS. choose a variety of fruits and vegetables daily: under-standing the complexities. J Nutr 2001;131:487S-501S.
65 Giles-corti B, Donovan RJ. The relative influence of individual, social and physical environment determinants of physical activity. Soc Sci Med 2002;54:1793-812.
Kamphuis_09.indd 217 20-8-2008 10:34:48

Kamphuis_09.indd 218 20-8-2008 10:34:48

Giskes K, Kamphuis CBm, Van Lenthe Fj, Huisman m, Brug j mackenbach jP Household and food shopping environments: do they play a role in socioeconomic inequalities in fruit and vegetable consumption? A multilevel study among Dutch adults. (in press with Journal of Epidemiology and Community Health)
household and food shopping environments: do they play a role in socioeconomic inequalities in fruit and vegetable consumption? A multilevel study among Dutch adults
11
Kamphuis_09.indd 219 20-8-2008 10:34:48

220 Part III Socioeconomic status, environmental factors and diet
Abstract
Background Fruit and vegetables are protective of a number of chronic dis-eases, however their intakes have been shown to vary by socioeconomic posi-tion (SEp) and between areas. Household and food shopping environmental factors are thought to contribute to these differences. The objective of this study is to determine whether household and food shopping environmental factors are associated with fruit and vegetable (FV) intakes, and contribute to socioeconomic and between-area variations in FV consumption.
Methods cross-sectional data were obtained by a postal questionnaire among 4333 adults (23-85 years) living in 168 neighbourhoods in the south-eastern Netherlands. participants agreed/disagreed with a number of statements about the characteristics of their household and food shopping environments. Educa-tion was used to characterize socioeconomic position (SEp). main outcome measures were whether or not participants consumed fruit or vegetables on a daily basis.
Results Household and food shopping environmental factors only made a small contribution to explaining fruit and vegetable consumption. participants who perceived FV to be expensive were more likely to consume them. There were significant socioeconomic and between-area variations in fruit and vegetable consumption; however these were not explained by any household or food shopping environmental factors.
Conclusions Improving access to FV in the household and food shopping environ-ments will only make a small contribution to improving population consump-tion levels, however they will not decrease socioeconomic and between-area variation in their consumption.
Kamphuis_09.indd 220 20-8-2008 10:34:48

22111 Socioeconomic status and fruit and vegetable consumption
Introduction
Dietary behaviours have been established as risk factors for a number of chronic diseases. In western countries, the most prevalent of these diseases are cardio-vascular diseases and cancer [1-2]. population-based nutrition messages, such as dietary guidelines, have focused on improving intakes of total fat, saturated fat and antioxidant vitamins to decrease the incidence of these diseases. These guidelines almost universally encourage increased consumption of fruits and vegetables (FV) [2-4]. However, research has shown that a large proportion of the population does not meet dietary recommendations for FV consump-tion [2-5]. consumption of FV has been shown to be particularly low among socioeconomically-disadvantaged groups [6-8].
A number of factors have been thought to contribute to low FV consumption among the population. These can be broadly classified as operating at the indi-vidual or environmental levels. Individual-level factors are those that operate internal to the individual and include knowledge, beliefs, attitudes and cog-nitions about FV consumption. Nutrition knowledge and beliefs about their health benefits have been associated with higher consumptions of FV [9, 10]. Greater self-efficacy, motivation and perceived norms for FV consumption have also been associated with higher consumptions of FV [9, 11]. Taken together, individual-level factors only account for 20-35% of the variance in FV con-sumption [12]. Therefore, efforts to bring about change in these factors have only shown limited effects.
Over the past decade there has been an increased movement toward a more ecological approach to understanding health-related behaviours [13]. This has partly resulted from studies showing significant between-area differences in a range of health-related behaviours, thereby implicating that environmental fac-tors play an important role in shaping people’s health-related behaviour [14]. Social ecological theory posits that people interact with their environment and that characteristics of these environments (such as access and availability) influence their health behaviours and may constrain their ability to bring about change [15]. The recent increased popularity of the social ecological approach has resulted in an upsurge in the number of studies examining the role of fac-tors outside individuals, such as characteristics of household and residential environments, and their influence on health-related behaviours [16, 17].
Discussion in the literature suggests that household and food shopping envi-ronments play an important role in FV consumption. Specifically, availability of fruit and vegetables in the household, the FV consumption of other house-hold members as well as access to shops selling FV and the selection, quality and price of FV in these shops have been suggested to play an important role
Kamphuis_09.indd 221 20-8-2008 10:34:48

222 Part III Socioeconomic status, environmental factors and diet
[18-20]. However, two recent systematic reviews examining the empirical evi-dence for environmental factors associated with energy, fat and FV intakes con-cluded that there is little evidence to support these assertions [21, 22]. A major limitation of previous research is that there have been few replicated studies examining FV consumption as outcomes, and the contributions of the house-hold and food shopping environments specific to FV intakes. Furthermore, the contributions of these factors to socioeconomic inequalities in FV intakes have remained largely unquantified. Environmental interventions, and policies tar-geted at changing the characteristics of environments are now being promoted as promising strategies to improve health behaviour among the population [17, 23]. Due to the limited evidence base, it is currently not known which elements of the household and food shopping environments need to be targeted in order to improve population intakes of FV, and to decrease socioeconomic inequali-ties in their intakes.
The current study addresses this knowledge gap. Specifically, it aims to deter-mine whether household and food shopping environmental factors are associ-ated with fruit and vegetable (FV) intakes, and whether these factors contribute to socioeconomic inequalities in FV consumption.
Methods
ParticipantsData for this cross-sectional study were obtained by postal survey from the latest wave of the longitudinal GLOBE study (October 2004). The GLOBE study is a Dutch study examining the determinants of socioeconomic inequali-ties in health, and is comprised of a stratified population-based sample from the south-eastern region of the Netherlands. Detailed information about the objec-tives, design and findings of the GLOBE study are available elsewhere [24].
participants in this wave of the GLOBE study (n=6377, response 64.4%) con-sisted of two sub-samples. One of these (n=4323, response 74.4%) comprised of participants that responded to the baseline questionnaire of the GLOBE study (undertaken in 1991). Attrition from the baseline postal survey was due to death (12.3%), emigration (2.0%), refusal to be followed up longitudinally (2.2%) and addresses that could not be traced (2.8%). Due to these factors, the sub-sample was no longer representative of the population. Therefore, a second sub-sample comprised of new participants (n=2054, 55.0% RR) was added to restore the population representativeness of the GLOBE study sample.
Fruit and vegetable intakesFruit and vegetable intakes were measured by a food frequency questionnaire (FFQ) that has been shown to have good validity and reliability among the
Kamphuis_09.indd 222 20-8-2008 10:34:48

22311 Socioeconomic status and fruit and vegetable consumption
Dutch population [25]. The FFQ had a reference period of one month and included the types or categories of fruits and vegetables (including juices) con-sumed most frequently by the Dutch population. potatoes were not included in the FFQ as they are not considered a vegetable in the Dutch dietary recom-mendations [25]. participants were asked how many times they consumed each item on a weekly or monthly basis. Subsequent questions asked participants to indicate how many portions they ate on a typical occasion (e.g. how many pieces, serving spoons, glasses). Intakes of each item were calculated by multi-plying consumption frequency and portion size. Intakes were summed across the various items to obtain total fruit and vegetable intakes, these were then dichotomised to identify participants most in need of intervention for fruit and vegetable intakes; i.e. those consuming no fruit or vegetables (i.e. 0 grams) daily.
Food environmentprior to developing the postal questionnaire, we conducted focus groups and a systematic review of the literature to identify the most salient environmen-tal factors in relation to fruit and vegetable consumption. The focus groups comprised of GLOBE study participants from different socioeconomic back-grounds. During the focus groups, participants were asked about their main barriers and facilitators to consuming fruit and vegetables [21]. Those factors mentioned with the most frequency, the greatest intensity and that were talked about differentially among socioeconomic groups were selected for inclusion in the postal questionnaire. we also conducted a systematic literature review sum-marising the evidence pertaining to environmental factors associated with fruit and vegetable intakes among adults and selected the most important factors identified in the literature [8, 21]. Using these methods, seven salient environ-mental factors were identified in relation to fruit consumption and eight factors regarding vegetable consumption. On the postal questionnaire participants were presented with a series of statements relating to each factor (e.g. ‘fruit is expensive’) and were provided the response categories ‘agree’ and ‘disagree’. Also, participants indicated the frequency with which these factors were actual barriers for their FV consumption (often, sometimes, seldom/never). Responses to these statements were missing for approximately 5% of the sample. miss-ing values were imputed by drawing randomly from the binomial distribution using observed prevalences per education class as probabilities.
Socioeconomic positionparticipants were asked about their highest attained level of education. From the eight response categories, four categories were constructed: elementary (8 or less years), lower secondary (9-11 years), higher secondary (12-13 years) and tertiary (14 or more years). we also measured household income, asking participants to report their net monthly household income (0-1200 euro,
Kamphuis_09.indd 223 20-8-2008 10:34:48

224 Part III Socioeconomic status, environmental factors and diet
1200-1800 euro, 1800-2600 euro, 2600 euro or more, and ‘don’t want to say/ don’t know’).
Statistical analysesparticipants that had moved out of the study region (n=1528) were excluded from the analyses. Those with missing values for education or fruit/vegeta-ble consumption (n=277) were excluded, as well as participants with missing values for one or more of the confounding variables, i.e. age, sex (n=93). Fur-thermore, we excluded participants residing in neighbourhoods with less than three participants (n=146). Therefore, the analytic sample comprised of 4333 participants, who resided in 168 neighbourhoods (mean number of participants per neighbourhood= 26, range 4-112).
To take into account clustering in the environmental factors between neigh-bourhoods, multilevel models consisting of participants (level 1) nested in neighbourhoods (level 2) were used in all analyses. The analyses for this study comprised of two phases: a descriptive phase and a multivariable modelling phase. In the descriptive phase, associations between SEp, the food environ-ments and fruit/vegetable consumption were examined by cross-tabulations.
In the multivariable modelling phase, logistic regression models (using the link-logit function and 2nd order pQL estimation methods [26]) examined the associations of (groups of) household/food shopping environmental factors with FV consumption. Subsequent analyses examined education differences in fruit/vegetable consumption. Household and food shopping environment fac-tors were then entered (first separately, then simultaneously) in order to inves-tigate their contribution to the education inequalities. The factors of interest in these analyses were the direction and significance of the fixed effects for the household/food shopping environment factors, and the attenuation of the mag-nitude of inequalities when groups of factors were added. clustering of fruit/vegetable consumption within neighbourhoods was determined by calculating the median odds ratio (mOR) with 95% credible intervals (cRI), using the posterior distribution of the area variance as provided by the markov chain monte carlo procedure. The mOR was calculated using the following formula [27]:
mOR = exp[√(2 x area variance)] x 0.6745 ≈ exp (0.95√area variance)
All analyses were weighted to take into account the over-representation of older participants, and participants with chronic diseases in the sample (relative to the population of the region). Additionally, all analyses were adjusted for gender and age (continuous) and were conducted in mLwiN version 2 [28].
Kamphuis_09.indd 224 20-8-2008 10:34:48

22511 Socioeconomic status and fruit and vegetable consumption
Results
The mean age of the sample was 48.0 years (sd = 13.3 years) and 54.1% were female. 86.5% and 85.1% of respondents consumed fruit and vegetables on a daily basis (respectively). Table 1 summarises the associations between envi-ronmental factors and fruit consumption, and education differences in the perceptions of environmental factors. participants who reported there was not much fruit in their household, that there were no shops where they could buy fruit in their neighbourhood or had difficulty getting to shops that sold fruit were less likely to consume fruit. However, those who perceived fruit as expen-sive were more likely to consume it.
Table 11.1 Bivariate associations between household/food shopping environments, fruit consumption and education
oR of no fruit consumption Proportion of respondents by education level
oR a 95% CI 1(low)
2 3 4(high)
p b
Household environment
There is not much fruit in my household
Agree 1.86 1.33 to 2.59 11.3 5.8 8.3 8.6
Disagree 1.00 88.7 94.2 91.7 91.4 <0.01my family do not eat much fruit
Agree 1.17 0.87 to 1.57 15.7 15.7 17.0 12.9
Disagree 1.00 84.3 84.3 83.0 87.1 0.03
Food shopping environment
In my neighbourhood there are no shops where I can buy fruit
Agree 1.60 1.06 to 2.41 3.0 4.1 3.1 3.8
Disagree 1.00 97.0 95.9 96.9 96.2 0.52
Fruit is expensive
Agree 0.79 0.62 to 1.00 53.9 53.6 44.5 41.0
Disagree 1.00 46.1 46.4 55.5 59.0 <0.01The selection of fruit is limited
Agree 1.45 0.87 to 2.41 7.5 3.0 2.6 3.5
Disagree 1.00 92.5 97.0 97.4 96.5 <0.01
It is difficult to get to shops that sell fruit
Agree 2.12 1.07 to 4.20 2.2 1.1 0.7 1.0
Disagree 1.00 97.8 98.9 99.3 99.0 0.09
The fruit is of bad quality
Agree 1.12 0.61 to 2.05 3.0 2.0 2.8 3.5
Disagree 1.00 97.0 98.0 97.2 96.5 0.11
a Analyses adjusted for gender, age.b Denotes p-value for education differences in prevalence of responses.
Kamphuis_09.indd 225 20-8-2008 10:34:49

226 Part III Socioeconomic status, environmental factors and diet
Overall, a large proportion of participants (52.5%) perceived that fruit was expensive and this perception was more frequent among lower socioeconomic groups. Only a small proportion (10-15%) reported household factors as being important. There were small education gradients in household factors being reported as important, with lower-educated groups agreeing with the state-ments more frequently. Few participants (<10%) agreed with other statements relating to the food shopping environment, however there were small education gradients for some factors that reached statistical significance.
Table 11.2 Bivariate associations between household/food shopping environments, vegetable consumption and education
oR of no vegetableconsumption
Proportion of respondents byeducation level
oR a 95% CI 1(low)
2 3 4(high)
p b
Household environment
There are not many vegetables in my household
Agree 1.21 0.85 to 1.72 9.4 6.4 8.3 9.5
Disagree 1.00 90.6 93.6 91.7 90.5 0.02
my family do not eat many vegetables
Agree 1.07 0.77 to 1.50 7.7 9.3 10.4 8.0
Disagree 1.00 92.3 90.7 89.6 92.0 0.14
The person who cooks in my household does not cook many vegetables
Agree 3.03 1.90 to 4.86 2.8 2.1 2.8 2.7
Disagree 1.00 97.2 97.9 97.2 97.3 0.65Food shopping environment
In my neighbourhood there are no shops where I can buy vegetables
Agree 1.67 1.13 to 2.46 8.3 5.6 3.8 4.5
Disagree 1.00 91.7 94.4 96.2 95.5 <0.01Vegetables are expensive
Agree 0.79 0.63 to 0.98 53.3 49.1 41.2 37.3
Disagree 1.00 46.7 50.9 58.8 62.7 <0.01The selection of vegetables is limited
Agree 1.45 0.98 to 2.14 7.5 4.7 4.3 5.6
Disagree 1.00 92.5 95.3 95.7 94.4 0.07It is difficult to get to shops that sell vegetables
Agree 1.37 1.12 to 3.92 3.3 1.5 1.1 1.0
Disagree 1.00 96.7 98.5 98.9 99.0 <0.01The vegetables are of bad quality
Agree 1.27 0.69 to 2.33 3.9 2.5 3.5 3.7
Disagree 1.00 96.1 97.5 96.5 96.3 0.30
a Analyses adjusted for gender, age.b Denotes p-value for education differences in prevalence of responses.
Kamphuis_09.indd 226 20-8-2008 10:34:49

22711 Socioeconomic status and fruit and vegetable consumption
Associations between environmental factors and vegetable consumption, and education differences in the perceptions of environmental factors in relation to vegetable consumption are shown in Table 2. Living in a household where the cook did not prepare many vegetables was strongly associated with not consuming vegetables. Likewise, having no shops in the neighbourhood where vegetables could be purchased or having difficulty getting to shops that sold them was associated with not consuming them.
The majority of participants (55.9%) agreed that vegetables were expensive. However, only a small proportion agreed with other statements relating to household or shopping environmental factors. There were inverse education gradients in participants reporting there were no shops where they could buy vegetables, that vegetables were expensive, that the selection of them was lim-ited where they shopped, and that it is difficult for them to get to shops that sold vegetables. The magnitude of these gradients were small, however the large sample size resulted in them reaching statistical significance.
The contribution of the household and food shopping environmental factors to fruit consumption is shown in Table 3. The base model showed direct and graded associations between education and fruit consumption; participants with lower education were more likely to not consume fruit daily. Subsequent models in this table show that the addition of household and food shopping environmental factors (in separate and combined models) did not make a con-tribution to explaining socioeconomic differences in fruit consumption. Three environmental factors were significantly associated with fruit consumption in the fully-adjusted model; having no fruit at home and living in a neighbour-hood where there were no shops to purchase fruit were associated with no con-sumption. However, participants that perceived fruit as expensive were more likely to consume it.
Kamphuis_09.indd 227 20-8-2008 10:34:49

228 Part III Socioeconomic status, environmental factors and diet
Table 11.3 Contribution of the household and food shopping environments to education and between-area inequalities in consumption of no fruita
Base model Base model+ householdenvironment
Base model+ shoppingenvironment
Base model+ all predictors
oR of no fruit consumption (95% CI)
Education level
1 (low) 4.26 (3.00 to 6.07) 4.14 (2.91 to 5.89) 4.44 (3.18 to 6.19) 4.35 (3.06 to 6.19)2 2.36 (1.80 to 3.11) 2.41 (1.83 to 3.17) 2.48 (1.85 to 3.33) 2.51 (1.87 to 3.37)3 1.60 (1.15 to 2.23) 1.60 (1.15 to 2.23) 1.63 (1.17 to 2.28) 1.63 (1.17 to 2.28)4 (high) 1.00 1.00 1.00 1.00
Household environment
There is not much fruit in my household
Agree 1.86 (1.31 to 2.65) 1.88 (1.29 to 2.72)
Disagree 1.00 1.00
my family do not eat much fruit
Agree 0.94 (0.69 to 1.29) 0.95 (0.70 to 1.30)
Disagree 1.00 1.00
Food shopping environment
In my neighbourhood there are no shops where I can buy fruit
Agree 1.68 (1.09 to 2.59) 1.67 (1.08 to 2.56)
Disagree 1.00 1.00
Fruit is expensive
Agree 0.71 (0.56 to 0.90) 0.70 (0.55 to 0.88)
Disagree 1.00 1.00
The selection of fruit is limited
Agree 1.25 (0.69 to 2.24) 1.14 (0.62 to 2.09)
Disagree 1.00 1.00
It is difficult to get to shops that sell fruit
Agree 1.54 (0.69 to 3.43) 1.49 (0.65 to 3.40)
Disagree 1.00 1.00
The fruit is of bad quality
Agree 1.01 (0.49 to 2.09) 0.97 (0.46 to 2.04)
Disagree 1.00 1.00
Random effects
Between area variance (SE)
0.17 (0.05) 0.16 (0.05) 0.17 (0.05) 0.16 (0.05)
median odds Ratio(moR, 95% CrI)b
1.47 (1.18 to 1.67) 1.46 (1.16 to 1.69) 1.47 (1.17 to 1.67) 1.46 (1.16 to 1.69)
a Analyses adjusted for gender, age.b mOr = exp (0.95√area variance) [27], CrI= credible interval.
Kamphuis_09.indd 228 20-8-2008 10:34:49

22911 Socioeconomic status and fruit and vegetable consumption
Table 11.4 Contribution of the household and food shopping environments to education and between-area inequalities in consumption of no vegetablesa
Base model Base model+ householdenvironment
Base model+ shoppingenvironment
Base model+ all predictors
oR of no vegetable consumption (95% CI)
Education
1 (low) 5.47 (3.92 to 7.64) 5.47 (3.92 to 7.64) 5.64 (4.04 to 7.87) 5.64 (4.04 to 7.87)2 2.39 (1.81 to 3.14) 2.39 (1.78 to 3.20) 2.48 (1.85 to 3.33) 2.48 (1.85 to 3.33)3 1.68 (1.23 to 2.30) 1.68 (1.23 to 2.30) 1.72 (1.25 to 2.35) 1.72 (1.23 to 2.39)4 (high) 1.00 1.00 1.00 1.00
Household environment
There are not many vegetables in my household
Agree 1.02 (0.70 to 1.48) 1.03 (0.71 to 1.50)
Disagree 1.00 1.00
my family do not eat many vegetables
Agree 0.85 (0.59 to 1.24) 0.85 (0.58 to 1.26)
Disagree 1.00 1.00
The person who cooks in my household does not cook vegetables
Agree 3.16 (1.86 to 5.36) 2.97 (1.75 to 5.05)
Disagree 1.00 1.00
Food shopping environment
In my neighbourhood there are no shops where I can buy vegetables
Agree 1.54 (1.06 to 2.23) 1.46 (0.99 to 2.16)
Disagree 1.00 1.00
Vegetables are expensive
Agree 0.69 (0.56 to 0.86) 0.69 (0.56 to 0.86)
Disagree 1.00 1.00
The selection of vegetables is limited
Agree 1.34 (0.85 to 2.10) 1.34 (0.85 to 2.10)
Disagree 1.00 1.00
It is difficult to get to shops that sell vegetables
Agree 1.43 (0.77 to 2.68) 1.30 (0.68 to 2.48)
Disagree 1.00 1.00
The vegetables are of bad quality
Agree 1.11 (0.56 to 2.19) 1.01 (0.51 to 2.01)
Disagree 1.00 1.00
Random effects
Between area variance (SE) 0.14 (0.06) 0.13 (0.06) 0.15 (0.06) 0.14 (0.06)median odds Ratio(moR, 95% CrI)b
1.40 (1.10 to 1.62) 1.41 (1.09 to 1.63) 1.44 (1.13 to 1.66) 1.40 (1.11 to 1.64)
a Analyses adjusted for gender, age.b mOr = exp (0.95√area variance) [27], CrI= credible interval.
Kamphuis_09.indd 229 20-8-2008 10:34:49

230 Part III Socioeconomic status, environmental factors and diet
Table 4 summarises the contributions of household and food shopping envi-ronmental factors to vegetable consumption. The baseline model confirmed a marked socioeconomic gradient in vegetable consumption. However, the envi-ronmental factors examined did not contribute to explaining these inequali-ties in vegetable consumption. Living in a household where vegetables are not prepared and residing in a neighbourhood where there are no shops where vegetables can be purchased was associated with a reduced likelihood of veg-etable consumption. Having the perception that vegetables are expensive was independently associated with their consumption.
All analyses were also performed using household income as SEp measure. The direction and magnitude of the income inequalities were similar to those reported for education. The role of household and food shopping environmental factors remained the same with household income. The addition of household income into the multivariate models did not decrease socioeconomic differ-ences in FV consumption.
Discussion
Our study showed that perceptions of some household and food shopping environmental factors were related to FV consumption. However, due to their general low prevalence and small inequalities, they did not play a role in socioeconomic inequalities in their consumption. These findings suggest that interventions aimed at improving access to FV in the household and/or food shopping environments may only make a small contribution to improving population consumption levels. moreover, the selected household and envi-ronmental characteristics may not decrease socioeconomic inequalities in their consumption.
Similar to other studies [2, 6, 7] we found strong socioeconomic gradients in FV consumption. The finding that the food shopping environment only made a small contribution to FV consumption, and did not contribute to socioeco-nomic inequalities in FV consumption was in line with both the emerging lit-erature. Research from the UK [29] and Australia [10, 30] suggests that the food shopping environment may not play an important role in food purchasing decisions, or for explaining socioeconomic variation in food choice and FV purchasing. In contrast, findings from the US suggest that the food shopping environment in socioeconomically deprived areas is less conducive to making healthy food choices compared to more advantaged areas [31]. However, the Dutch situation may differ from the US in many ways that affect the food shop-ping environment. The Dutch population is less stratified along socioeconomic lines, is less geographically segregated by SEp, and the population density in the Netherlands is greater than the US [29, 32] and (consequently) shops are
Kamphuis_09.indd 230 20-8-2008 10:34:49

23111 Socioeconomic status and fruit and vegetable consumption
always nearby. A recent Australian study found that a significant proportion of socioeconomic inequalities in FV consumption were explained by perceived availability, accessibility and affordability factors. However, this study was only conducted among women and measured general perceptions of the food envi-ronment, rather than perceptions of the food environment specific to FV [33]. previous research that has examined socioeconomic differences in perceptions of barriers to consuming a health diet has shown that these are greater when perceptions about diet in general are measured, rather than when perceptions are assessed relative to a specific food group.
The finding that perceptions of the food shopping environment explained little of the socioeconomic variation in FV consumption is also in accordance with objective measures of the food shopping environment. Environmental audits of food shopping environments with respect to FV purchasing were conducted on a sub-set of 14 areas covered by the study (7 socioeconomically disadvantaged areas, 7 advantaged areas). An area of 1km from the centroid of each area was audited. Audits assessed the price and availability of fruits and vegetables in 61 shops. Deprived areas had greater access to supermarkets compared to advantaged areas, and were equally serviced in terms of fruit and vegetable shops (Table 5). The variety, price and quality of fruits were similar in socio-economically deprived and advantaged areas, however vegetables were margin-ally (~10%) cheaper (on average) in deprived areas (Table 5). These findings suggest that deprived areas were at least equally (perhaps even slightly better) serviced in terms of their food shopping infrastructure with respect to FV pur-chase compared to socioeconomically advantaged areas. Similarly, an Austra-lian study also found no differences in FV food shopping infrastructure, and the availability and price of FV in deprived and advantaged areas [30].
Our study is the first (known) study to quantify associations between acces-sibility of FV in the household and their consumption among adults. Studies among children/adolescents have found that household availability of FV, and the FV consumptions of parents are associated with their intakes [34]. How-ever, we found little evidence to support that the household food environment plays a role among adults. This may be because adults exert a greater influence than children/adolescents on the food available in the household, and make most food purchasing decisions.
The findings of the current study suggest that the low FV consumption among adults, and socioeconomic inequalities in their consumption may have little to do with household and food shopping environments. In addition to percep-tions, we also measured objective characteristics of the food environment, how-ever we could not quantify the contribution of these factors to socioeconomic inequalities in FV consumption as only a limited number of neighbourhoods
Kamphuis_09.indd 231 20-8-2008 10:34:49

232 Part III Socioeconomic status, environmental factors and diet
were audited. Other environmental factors, such as cultural factors, may be more important. culture has been known as the foundation that underlies food choices, as it determines what people consider to be acceptable and preferable foods, and the amount and combinations of food they choose [35, 36]. How-ever, cultural influences were not measured in this study, as they are difficult to conceptualise and no validated questionnaires concerning cultural aspects of diet are known to be available. Variations in FV consumption could also be more a consequence of individual-level factors. A number of individual-level factors have been relatively under-researched in relation to FV consumption and inequalities in these, such as taste preferences, cooking skills and habit [37, 38]. Additionally, other household-level factors that were not measured in the current study such as facilities for FV preparation and storage, and the negotiation of food purchasing decisions among household members have been implicated to play a role in other studies [6, 38].
Table 11.5 Shop availability and price of fruits and vegetables in socioeconomically disadvantaged and advantaged areas a
Disadvantagedareas (n=7)
Advantagedareas (n=7)
Shop (total n)
Supermarket 34 15Fruit & vegetable shop 4 3Specialty shop (e.g. delicatessen, ethnic food store) 1 4
Average fruit prices (per kg, euro)
Apples 1.15 1.21oranges 1.44 1.56Banana 1.60 1.59Kiwi 2.15 2.16Pear 1.44 1.57All fruit combined 7.77 8.08
Average vegetable prices (euro)
Broccoli (1 head) 2.26 2.66Beans (1 kg) 3.70 4.01Cauliflower (1 head) 1.92 2.02Carrots (1 kg) 1.20 1.68Tomatoes (1 kg) 2.02 2.04All vegetable combined 10.92 12.41
a All areas in the study region (n= 86) were ranked by their NIvEL deprivation index (derived from the proportion of the population that is economically active, average income, proximity index and proportion of the population who are non-western foreigners). The seven lowest and highest ranking areas were selected for audits.
Kamphuis_09.indd 232 20-8-2008 10:34:49

23311 Socioeconomic status and fruit and vegetable consumption
There is little evidence to justify that interventions aimed at improving FV consumption in the Netherlands, and at reducing socioeconomic inequali-ties in them should target our selected determinants of the household/food shopping environments. The current study suggests that research into other environmental factors, such as cultural aspects of dietary habits, and individ-ual-level factors could bring forth more salient determinants of FV consump-tion. changes in these potentially important factors are more likely to bring about population dietary change and reducing inequalities in FV consumption than making changes to the household and/or food shopping environments.
Kamphuis_09.indd 233 20-8-2008 10:34:49

234 Part III Socioeconomic status, environmental factors and diet
References
1 Lawlor DA, Sterne JA, Tynelius p, et al. Association of childhood socioeconomic posi-tion with cause-specific mortality in a prospective record linkage study of 1,839,384 individuals. Am J Epidemiol 2006;164:907-15.
2 Krebs-Smith Sm, Kantor LS. choose a variety of fruits and vegetables daily: under-standing the complexities. J Nutr 2001;131:487S-501S.
3 Voedingscentrum. Regels schijf van vijf (Dutch dietary guidelines) (http://www.voedingscentrum.nl /voedingscentrum/public /Dynamisch/hoe+eet+ik+gezond/regels+schijf+van+vijf/). Den Haag: Voedingscentrum 2007.
4 National Health and medical Research council. Dietary Guidelines for Australians. can-berra: Australian Government publishing Service 1992.
5 Kearney Jm, mcElhone S. perceived barriers in trying to eat healthier--results of a pan-EU consumer attitudinal survey. Br J Nutr 1999;81 Suppl 2:S133-7.
6 Giskes K, Turrell G, patterson c, et al. Socioeconomic differences in fruit and veg-etable consumption among Australian adolescents and adults. Public Health Nutr 2002;5:663-9.
7 Hulshof KF, Brussaard JH, Kruizinga AG, et al. Socioeconomic status, dietary intake and 10 y trends: the Dutch National Food consumption Survey. Eur J Clin Nutr 2003;57:128-37.
8 Kamphuis cBm, Giskes K, de Bruijn GJ, et al. Environmental determinants of fruit and vegetable consumption among adults: a systematic review. Br J Nutr 2006;96:620-35.
9 Steptoe A, perkins-porras L, Rink E, et al. psychological and social predictors of changes in fruit and vegetable consumption over 12 months following behavioral and nutrition education counseling. Health Psychol 2004;23:574-81.
10 Ball K, crawford D, mishra G. Socioeconomic inequalities in women’s fruit and vegeta-ble intakes: a multilevel study of individual, social and environmental mediators. Public Health Nutr 2006;9:623-30.
11 Trudeau E, Kristal AR, Li S, et al. Demographic and psychosocial predictors of fruit and vegetable intakes differ: implications for dietary interventions. J Am Diet Assoc 1998;98:1412-7.
12 Bogers Rp, Brug J, van Assema p, et al. Explaining fruit and vegetable consumption: the theory of planned behaviour and misconception of personal intake levels. Appetite 2004;42:157-66.
13 Glanz K, Rimer B, Lewis F. Health Behaviour and Health Education. San Francisco: Jossey-Bass 2002.
14 Vereecken cA, Inchley J, Subramanian SV, et al. The relative influence of individual and contextual socioeconomic status on consumption of fruit and soft drinks among adolescents in Europe. Eur J Public Health 2005;15:224-32.
15 Giles-corti B. people or places: what should be the target? J Sci Med Sport 2006;9:357-66.
16 Humpel N, Owen N, Leslie E. Environmental factors associated with adults’ participa-tion in physical activity: a review. Am J Prev Med 2002;22:188-99.
17 Booth SL, Sallis JF, Ritenbaugh c, et al. Environmental and societal factors affect food choice and physical activity: rationale, influences, and leverage points. Nutr Rev 2001;59:S21-39; discussion S57-65.
18 Drewnowski A. Obesity and the food environment: dietary energy density and diet costs. Am J Prev Med 2004;27:154-62.
19 Stevenson c, Doherty G, Barnett J, et al. Adolescents’ views of food and eating: identify-ing barriers to healthy eating. J Adolesc 2007;30:417-34.
20 Kearney m, Kearney J, Dunne A, et al. Sociodemographic determinants of perceived influences on food choice in a nationally representative sample of Irish adults. Public Health Nutrition 2000;3:219-26.
Kamphuis_09.indd 234 20-8-2008 10:34:50

23511 Socioeconomic status and fruit and vegetable consumption
21 Kamphuis cBm, Van Lenthe FJ, Giskes K, et al. perceived environmental determinants of physical activity and fruit and vegetable consumption among high and low socioeco-nomic groups in the Netherlands. Health Place 2007;13:493-503.
22 Giskes K, Kamphuis cBm, van Lenthe FJ, et al. A systematic review of associations between environmental factors, energy and fat intakes among adults: is there evi-dence for environments that encourage obesogenic dietary intakes? Public Health Nutr 2007;22:1-13.
23 Stokols D, Grzywacz JG, mcmahan S, et al. Increasing the health promotive capacity of human environments. Am J Health Promot 2003;18:4-13.
24 van Lenthe FJ, Schrijvers cT, Droomers m, et al. Investigating explanations of socioeconomic inequalities in health: the Dutch GLOBE study. Eur J Public Health 2004;14:63-70.
25 Van Assema p, Brug J, Ronda G, et al. A short dutch questionnaire to measure fruit and vegetable intake: relative validity among adults and adolescents. Nutr Health 2002;16:85-106.
26 Rasbash J, Steele F, Browne w, et al. A user’s guide to mLwiN. Bristol: centre for mul-tilevel modelling, University of Bristol 2005.
27 merlo J, chaix B, Ohlsson H, et al. A brief conceptual tutorial of multilevel analysis in social epidemiology: using measures of clustering in multilevel logistic regression to investigate contextual phenomena. J Epidemiol Community Health 2006;60:290-7.
28 Rasbash J, Browne w, Healy m, et al. mLwiN version 1.10.0007. 2001.29 cummins S, macintyre S. Food environments and obesity--neighbourhood or nation?
Int J Epidemiol 2006;35:100-4.30 winkler E, Turrell G, patterson c. Does living in a disadvantaged area mean fewer
opportunities to purchase fresh fruit and vegetables in the area? Findings from the Bris-bane food study. Health Place 2006;12:306-19.
31 morland K, wing S, Diez Roux A. The contextual effect of the local food environment on residents’ diets: the atherosclerosis risk in communities study. Am J Public Health 2002;92:1761-7.
32 Giskes K, Turrell G, van Lenthe FJ, et al. A multilevel study of socioeconomic inequali-ties in food choice behaviour and dietary intake among the Dutch population: the GLOBE study. Public Health Nutr 2006;9:75-83.
33 Inglis V, Ball K, crawford D. Socioeconomic variations in women’s diets: what is the role of perceptions of the local food environment? J Epidemiol Community Health 2008;62:191-7.
34 De Bourdeaudhuij I, Te Velde S, Brug J, et al. personal, social and environmental pre-dictors of daily fruit and vegetable intake in 11-year-old children in nine European coun-tries. Eur J Clin Nutr 2007.
35 Lennernas m, Fjellstrom c, Becker w, et al. Influences on food choice perceived to be important by nationally-representative samples of adults in the European Union. Eur J Clin Nutr 1997;51 Suppl 2:S8-15.
36 Sorensen G, Stoddard Am, Dubowitz T, et al. The influence of social context on changes in fruit and vegetable consumption: results of the healthy directions studies. Am J Public Health 2007;97:1216-27.
37 Larson NI, perry cL, Story m, et al. Food preparation by young adults is associated with better diet quality. J Am Diet Assoc 2006;106:2001-7.
38 murcott A. Nutrition and inequalities. A note on sociological approaches. Eur J Public Health 2002;12:203-7.
Kamphuis_09.indd 235 20-8-2008 10:34:50

Kamphuis_09.indd 236 20-8-2008 10:34:50

DiscussionPart 4
Kamphuis_09.indd 237 20-8-2008 10:34:50

Kamphuis_09.indd 238 20-8-2008 10:34:50

General Discussion
12
Kamphuis_09.indd 239 20-8-2008 10:34:50

240 Part IV Discussion
General Discussion
In this thesis, a series of studies are presented that focus on socioeconomic differences in health-related behaviours and the role of environmental factors. The objectives of this thesis are threefold: (1) to investigate socioeconomic dif-ferences in physical inactivity and diet, (2) to identify neighbourhood factors associated with physical inactivity or diet, (3) to study to what extent (and via which pathways) neighbourhood factors contribute to the explanation of socioeconomic differences in physical inactivity and diet. In this chapter, the main findings of the various studies are summarised (paragraph 12.1), meth-odological issues concerning the studies are addressed (12.2), results are inter-preted and compared to findings from other studies (12.3), and implications of the results are considered, for theory (12.4), future research (12.5) and policy development (12.6).
12.1 Main findings
moderate to large socioeconomic differences in health-related behaviours were observed, with those from most disadvantaged backgrounds being most likely to behave unhealthy, i.e. not participating in sports, not walking/cycling for recreation, and not consuming fruits and vegetables. Unfavourable percep-tions of the neighbourhood, particularly with respect to attractiveness, safety and social cohesion, were related to several physical inactivity outcomes, and were more prevalent among lower SES groups. Our findings suggested that the neighbourhood environment has a moderate but significant contribution to the explanation of socioeconomic differences in specific types of physical inactiv-ity. Neighbourhood factors may partly mediate the association between SES and physical inactivity via individual cognitions. On the other hand, our tests did not support that neighbourhood- or household-level factors contributed to socioeconomic inequalities in fruit and vegetable consumption. perceptions of some household and neighbourhood factors were related to fruit and vegetable consumption, e.g. the availability of fruits in the household, whether or not the household cook prepared vegetables for dinner, and the presence of fruit and vegetable outlets in the neighbourhood. However, due to their general low prevalence and small inequalities, they did not play a role in socioeconomic inequalities in fruit and vegetable consumption.
Income and educational differences in health-related behavioursIn the chapters regarding socioeconomic differences in sports participation (chapter 5), recreational walking (chapter 6) and fruit and vegetable con-sumption (chapter 11), we performed the same explanatory analyses separately for education and income as SES-indicators. The results suggest that the mag-nitude of the socioeconomic gradient in physical inactivity differs for different
Kamphuis_09.indd 240 20-8-2008 10:34:50

24111 General discussion
SES-indicators, but that specific factors linking these indicators with physi-cal inactivity do not differ markedly. Both with regard to sports participation and recreational walking, we found larger socioeconomic differences with edu-cation compared to income. Educational attainment attempts to capture the knowledge-related components of the concept of SES, whereas income most directly measures the material resources component of SES. This may suggest that socioeconomic differences in physical inactivity are more a result of differ-ences in knowledge and preferences between SES-groups, than of differences in material resources available in the household. However, factors that contrib-uted to the explanation of educational and income inequalities in health behav-iours were similar for both SES-indicators. Explanatory factors contributed to a larger proportion of the income differences than educational differences in physical inactivity (partly a result of the fact that income differences were smaller to begin with). For fruit as well as vegetable consumption, the direc-tion and magnitude of the socioeconomic gradient was similar for education and income, and the (lack of) explanatory value of household and food shop-ping environmental factors was the same for both outcomes and both SES-indicators.
Specificity in outcomesThe strength and, sometimes, the direction of associations with neighbour-hood factors differed for specific physical inactivity outcomes. perceived physi-cal and social neighbourhood factors showed independent associations with doing any (vs. no) sports, but no neighbourhood factors were significantly asso-ciated with meeting (vs. not meeting) recommended levels of sports activity. However, poor neighbourhood attractiveness and neighbourhood safety (objec-tive as well as perceived measures) appeared to be important for explaining socioeconomic differences in three physical activity behaviours: sports inactiv-ity, lack of recreational walking, and lack of recreational cycling.
objective versus perceived neighbourhood factorsAlthough most of the neighbourhood factors we studied were perceptions (i.e. self-reported by residents), the results suggested that these are at least partly a reflection of actual (objective) characteristics of neighbourhoods. we found that unfavourable neighbourhood perceptions of low SES-groups were partly explained by their actual less appealing and less safe neighbourhood environ-ment, and additionally by individual psychosocial factors. That perceptions reflect actual neighbourhood circumstances was moreover shown by the find-ing that resident’s perceptions of neighbourhood unattractiveness and unsafety clustered within neighbourhoods. This clustering reduced to a great extent when objective neighbourhood characteristics were taken into account, which underlined the importance of objective characteristics for neighbourhood per-ceptions. Lastly, our study in the city of melbourne showed that objective area
Kamphuis_09.indd 241 20-8-2008 10:34:50

242 Part IV Discussion
characteristics play an important role for physical activity: objective measures of neighbourhood aesthetics and safety were found to contribute to the expla-nation of (socioeconomic) area variations in recreational cycling.
12.2 Methodological issues
The studies described in this thesis were conducted by an experienced research team, and great care was taken to attain valid results. However, several potential sources of bias may have threatened the internal validity (i.e. whether applied measures measured what we aimed to measure) and external validity of our results (i.e. whether results may be generalised to other populations than our research sample). In the next paragraphs, measurement issues regarding self-reported data and objective neighbourhood data will be discussed in a more detailed way, and, lastly, we will discuss the generalisability of our results.
Measurement issues regarding self-reported dataThe majority of the data analysed in this thesis was self-reported by partici-pants, i.e. self-reported SES-indicators (education and household income), self-reported neighbourhood-, household-, and individual-level factors and self-reported health-behaviours. Self-reported measures have the advantage that they are relatively easy to obtain compared to objective measures (if even available). On the other hand, self-reports have the disadvantage that several types of reporting bias may take place.
First, there is bias due to social desirability. In general, people are susceptible to social norms and tend to fill in survey questions towards perceived socially-desirable standards. As we were mainly interested in differences between SES-groups, bias due to social desirability would have only seriously affected our results if this had occurred differentially according to SES. Neighbourhood factors measured in our mailed survey do not seem very sensitive to social norms and perceptions of social desirability and hence, to (differential) report-ing bias. For instance, it is not so likely that a social norm regarding neighbour-hood attractiveness exists, and even less likely that a participant reports his/her neighbourhood as more attractive or unattractive than he or she actually perceives it. physical activity and fruit and vegetable consumption, on the other hand, are well documented as health-enhancing behaviours, and therefore, participants may have over-reported engaging in these behaviours [1, 2]. If all socioeconomic groups overstated their health behaviour to the same extent, this would not have affected the socioeconomic gradient in the behaviours. There is some indication that people with a higher socioeconomic status value health and a healthy lifestyle more than people from lower SES-groups [3, 4]. This may make them more inclined to overestimate their health behaviours. On the other hand, as unhealthy behaviours are more prevalent among lower SES
Kamphuis_09.indd 242 20-8-2008 10:34:50

24311 General discussion
groups, over-reporting of healthy behaviours may have particularly occurred among these participants. As both high and low SES groups may be likely to over-report their health behaviours, no or little differential reporting of health behaviours may have affected our results in the end.
Another bias that may have affected participants’ responses is the so called ‘same-source bias’, meaning that responses may have systematically been influ-enced, either positively or negatively, by a participant’s overall view of life. A negative worldview may originate from pessimism (‘generalized negative out-come expectancies’), negative affectivity (‘the extent to which individuals gen-erally feel upset or unpleasantly aroused’), particular personality traits, and feelings of depression [5] [6]. These factors have been found to be more preva-lent among lower socioeconomic groups [7-10]. Our finding that the lowest SES-group was more likely to agree with the statement that ‘it is often poor weather’ (27%) compared to higher SES-groups (about 17%), also points in the direction of a more negative world view (chapter 5). Therefore, same-source bias could have resulted in an overestimation of the contribution of perceived neighbourhood factors to socioeconomic differences in health behaviours. On the other hand, we have shown that socioeconomic differences in neighbour-hood perceptions could largely be explained by objective neighbourhood char-acteristics, and only partly by feelings of depression/nervousness (chapter 7). This suggests that self-reports (at least partly) reflect the actual neighbourhood situation, and do not only reflect a negative worldview.
Another type of reporting bias that may have affected our results is what one could call ‘self-justification’ bias, related to Festingers’s cognitive dissonance theory [11]. This theory holds that people want their thoughts, attitudes, and actions to be consistent with one another. when they realise their actions (e.g. smoking) are dissonant from their attitudes (smoking is bad for my health), they feel uncomfortable and will try to make them consistent again. As it is dif-ficult to change behaviour (quit smoking), people rather justify their actions by changing inconsistent attitudes (smoking is not so bad), even if these attitudes are irrational. Similarly, people who reported in our survey not to be physically active may have agreed with the statement ‘my neighbourhood is not attractive for physical activity’, just because they wanted to justify their unhealthy behav-iour for themselves, i.e. to make their attitudes in line with their actions. As lower socioeconomic groups were more often inactive, they may have also been more likely to justify this behaviour with reporting an unattractive neighbour-hood, which then would have over-stated the contribution of neighbourhood factors to socioeconomic differences in physical inactivity. On the other hand, the finding that people who agreed with the statement ‘fruits are expensive’ actually were more likely to consume fruits than those who disagreed (chapter 11), shows that ‘self-justification’ has not necessarily been going on among the survey participants.
Kamphuis_09.indd 243 20-8-2008 10:34:50
244 Part IV Discussion
There is little indication that the measurement of SES-indicators, education and household income, has been biased. Education is often used as SES-indi-cator, as it is considered a good indicator of SES in the Netherlands [12], is seen as more important to health status than occupation or income [13], is com-paratively easy to measure in self-administered questionnaires, is associated with high response rates, and is relevant to people regardless of age or working circumstances [14]. The GLOBE survey 2004 was one of the first Dutch sur-veys to include a question on household income. Income is not often measured in studies, as it is perceived a sensitive and private topic, and may be more sus-ceptible to non-response than education. As it is known that questions asking the respondent to provide an exact amount elicit the highest non-response rates [15], the GLOBE survey asked participants to tick one of four rather broad income categories, i.e. 0-1200 euro, 1200-1800 euro, 1800-2600 euro, 2600 euro or more (or ‘I don’t want to say /I don’t know’). As the income question was put at the very end of the survey, non-response because of the inclusion of this particular item in the questionnaire was minimised.
Overall, the use of self-reported data may have led to biases operating in differ-ent directions. However, we do not believe these have substantially influenced our conclusions.
Measurement issues of objective neighbourhood characteristicsIn two studies as described in this thesis, one carried out in the city of Eind-hoven, the Netherlands, and the other one in melbourne, Australia, we exam-ined ‘objective’ neighbourhood characteristics. These characteristics were not self-reported by participants, but assessed in a systematic way by trained observers that visited the neighbourhoods during field observations. There are some methodological problems concerning these types of neighbourhood mea-surements.
First, there is a lack of validated audit instruments that measure relevant aspects of the neighbourhood context. we developed our own environmental audit tool, as existing tools had been developed for other purposes and in other countries than the Netherlands, and could not simply be applied in our study [16-20]. Inter-rater reliability of the audit instrument was good [5]. content validity has not been confirmed: to what extent did the instrument measure what we wanted to measure? Also unknown is whether the specific area characteristics, i.e. the specific items in the instrument, when taken together in a sum score truly reflected broader constructs of social unsafety, traffic unsafety, design, etc. (construct validity). Did we measure all specific aspects of ‘traffic unsafety’ or did we forget about some, or, otherwise, did we include items in the sum score that had nothing to do with traffic unsafety? Although this is difficult to test, the fact that the selection of specific items for each construct was based on
Kamphuis_09.indd 244 20-8-2008 10:34:50

24511 General discussion
an existing theoretical framework reflects a well-deliberated choice. The over-lap between the objective and subjective measures of area aesthetics (chapter 7), suggests that, at least for the concept of area aesthetics, objective character-istics have been measured that people take into account in perceptions of area aesthetics. The finding that objective measures of aesthetics rather than objec-tive measures of safety explained perceptions of safety, shows that the objective sum scores for traffic safety and social safety did not include all aspects of safety that people take into account when forming perceptions of safety.
Furthermore, one can wonder what the appropriate scale is to measure area effects, and how this scale should vary by health behaviour. The attractiveness of the area within a 5-minute walk from home may affect recreational walking, however, for recreational cycling, one could argue that a much larger area will matter. Also, characteristics of destinations that people walk or cycle to may be at least as important as characteristics of one’s area of residence. These issues show that the objective measurement of neighbourhood characteristics is a very young field of research with many opportunities for improvement.
Cross-sectional analysesAll studies in this thesis (apart from the focus group study and the review studies) had a cross-sectional design, i.e. the measurement of SES, neighbour-hood factors, individual factors, and health-behaviours took place at the same moment in time. This precludes causal inferences being drawn. Overall, more support has been found for causation rather than selection processes related to SES and health behaviours [21-24], and, also, it is highly unlikely that the unequal distribution of explanatory factors across SES is due to an effect of these factors on someone’s SES. However, there are other possible, more gen-eral factors, such as personality, culture and intelligence [25], that may have affected both SES (e.g. eligibility and interest for secondary and higher educa-tion) and health behaviours. These factors have not been studied in the cur-rent thesis, and require further investigation. Regarding individual cognitions, health behaviour models particularly stress causal associations between those factors (i.e. attitude, social norm, perceived behaviour control, intention) and behaviour. However, it has been recognised that also selection mechanisms may play a role, for example: people that try different kinds of fruit may also be more likely to have a positive attitude towards at least one kind of fruit.
Also neighbourhood factors may be subject to selection processes related to health-behaviours. This phenomenon is referred to as endogeneity (related to, though not similar to the concept of confounding), and occurs because of the presence of common prior causes of neighbourhood-level exposures and health outcomes. For example, it is supposed that easy access to good quality facilities for physical activity in a neighbourhood may decrease the risk of physical inac-
Kamphuis_09.indd 245 20-8-2008 10:34:50

246 Part IV Discussion
tivity for local residents. However, it is equally plausible that sports facilities decide to open their businesses in particular locations were demand by local residents is largest, or that residents with an active lifestyle move to neighbour-hoods with good facilities available. In this example, liking physical activity is an unobserved variable that is related to both the location of facilities as well as the risk of inactivity.
Figure 12.1 Example of endogeneity
Unobservedindividual characteristics(e.g. liking for physical activity)
(selection) Neighbourhood characteristics(e.g. number and quality of physicalactivity facilities)
Health (behaviour) ofresidences(e.g. physical inactivity)
To circumvent endogeneity, relevant characteristics of individuals should be measured to correct for in neighbourhood-behaviour associations. Several studies in this thesis took into account individual characteristics, such as atti-tude towards physical activity, and, with that, minimised the possible influence of this bias. Overall, we presume, though, that the results in this thesis are more likely a result of causal rather than selective processes between SES, neigh-bourhood factors, individual factors, and health-behaviours.
Another methodological issue that cannot be tackled with a cross-sectional design, is the so-called ‘lag effect’ between exposure to neighbourhood char-acteristics and health behaviours. we don’t know since when and for how long certain characteristics have been present in neighbourhoods. A single ‘snap-shot’ observation of a neighbourhood does not capture the dynamics of the neighbourhood. we neither know for how long residents have lived in their neighbourhoods. A middle-aged person, who has lived under deprived neigh-bourhood circumstances for the whole his life, may have accumulated more negative experiences over his life course than someone who recently moved into the neighbourhood. Furthermore, day-to-day exposure to neighbourhood char-acteristics may vary for residents. Older people may spend more time in their neighbourhood than young adults, who may work full-time and spend most of their leisure time outside the neighbourhood. The fact that time exposed to specific neighbourhood characteristics has not been taken into account in our
Kamphuis_09.indd 246 20-8-2008 10:34:51
24711 General discussion
analyses, may have underestimated the contribution of neighbourhood factors to socioeconomic differences in health behaviours.
Generalisability of the results to the Dutch populationOur conclusions cannot just be generalised to the whole of the Dutch popula-tion, given the omission of certain population groups in the study sample. This applies in particular to ethnic minorities, illiterate persons, and institutiona-lised persons. The exclusion of the latter is not very likely to affect our conclu-sions, as the proportion of people residing in institutions is rather small (about 1,3% of the total Dutch population; http://statline.cbs.nl/, accessed 3 January 2008). In contrast, about 1,5 million persons in the Netherlands, almost 13% of the Dutch adult population, have poor or low literacy skills, which means that filling in a 16-page postal questionnaire may be difficult (http://www.lezen-enschrijven.nl/, accessed 3 January 2008). Also, ethnic minorities may have difficulties with the Dutch language, and therefore are less likely to participate in our study. They comprise a considerable part of the total Dutch population (19% of Dutch inhabitants have at least one parent born outside the Neth-erlands and is thus classified as non-native; http://statline.cbs.nl/, accessed 3 January 2008). These two subgroups that were less likely to participate in our postal survey are also more likely to have a low SES. Furthermore, as they may experience difficulties to fully participate in Dutch society, they may be more dependent on their direct neighbourhood facilities and nearby social network compared to the literate and/or native Dutch. This could imply that the role of neighbourhood factors in explaining socioeconomic differences in health behaviours is actually larger for the whole of the Dutch population, than we observed in our study sample.
Generalisability of the results to other countriesThe final question with regard to the generalisability of the results is: are con-clusions also applicable to other western countries than the Netherlands? There are a number of issues that should be taken into consideration, especially with regard to differences in patterns of socioeconomic differences in health-behaviours, and differences in the geographical, cultural and policy environ-ments across countries.
Although associations between SES and health behaviours are (in general) rather consistent [26], socioeconomic differences in health behaviours in other countries do not necessarily resemble the patterns observed in the Netherlands. For instance, caverlaars and colleagues found a north-south pattern through Europe for socioeconomic differences in smoking, with strong gradients in northern European countries and weaker or reversed gradients in southern European countries, most noticeable among women [36]. A literature review study found that in the majority of the studies, with the exception of a few in
Kamphuis_09.indd 247 20-8-2008 10:34:51

248 Part IV Discussion
Southern and Eastern Europe, consumption of vegetables and fruits was more common among those with higher education [27]. The results also suggested that in regions where consumption of vegetables and fruits was more common (e.g. Spain, Greece), the lower social classes tended to consume more of these than the higher social classes. Lastly, large variations in leisure time physical inactivity have been observed when comparing European countries. Next to a North-South gradient, with lower levels of sedentariness in the Northern coun-tries, a west-East gradient was apparent, with higher level of sedentariness in Eastern European countries [28]. These findings were linked to European dif-ferences in the presence and content of national initiatives to promote physical activity [28], perceptions of environmental opportunities for physical activity [29, 30], and perceptions of health benefits of physical activity, with less posi-tive beliefs observed among southern Europeans [31, 32].
Second, there are geographic and spatial differences between the Netherlands and other countries, which may decrease the generalisability of our findings. The Netherlands is a small, flat and densely-populated country, and has a moderate climate with mild temperatures. This, in contrast to large, hilly and sparsely populated countries such as the U.S. and Australia, were temperatures can go to extremes. These basic differences in physical lay-out can make a large differ-ence to environmental effects on health behaviours. For instance, walking and cycling for both transport and recreation are very popular in the Netherlands, as distances are small, there are no hills, and there is a good infrastructure for pedestrians and cyclists. walking and cycling is far less common in the U.S. and Australia, which may be partly attributed to the physical design of cities, generally unsupportive for walking or cycling. However, even if good quality walking and cycling paths, safe crossings, and other infrastructural necessities would be made available throughout U.S. and Australian cities, even then, geo-graphic, spatial and climate-related barriers make it unlikely that walking and cycling participation will ever reach Dutch levels.
There are also cultural differences in health behaviours, which can hinder generalisability of results to other countries. Food habits are to a large extent embedded in cultural practices, as culture determines what people consider to be acceptable and preferable foods, and the amount and combinations of food they choose [33]. A typical Japanese diet, with fish and rice and little meat, is completely different from an American diet or a mediterranean diet. what most people eat is what the market tends to sell, and what is most easily avail-able, although these products are not necessarily the healthiest. Even if healthy products are readily available, changes in eating habits of a population may only take place over a long time, just because it is not in a country’s cultural to eat certain products, and because other, unhealthier products (e.g. fast food) are even more easily available. The same applies to physical activity behaviours:
Kamphuis_09.indd 248 20-8-2008 10:34:51

24911 General discussion
if walking, cycling or certain sports activities are more culturally-embedded, or if doing sports is valued high within certain countries, than the likelihood that people practice physical activity is likely to be higher.
Governmental action and policies in the Netherlands differ from those in other countries, and this may affect the extent to which neighbourhood factors can contribute to the explanation of inequalities in health behaviours. The sociolo-gist Esping-Andersen distinguishes between three types of welfare regimes, i.e. liberal regimes (e.g. U.K., U.S.), conservative-corporatistic regimes (e.g. Ger-many, France), and social-democratic regimes (e.g. Sweden, Denmark). The type of regime is related to, for instance, the degree of income redistribution, the access to (de)commodified services (education, health, etc.) and arrange-ments of the housing system [34]. These are also central factors that shape the extent of socio-spatial segregation in a country, which means: do the poor live among the poor and the rich among the rich (segregated), or have residential areas a more mixed composition and do socioeconomic groups interact (deseg-regated)? Therefore, the level of socio-spatial segregation may affect whether neighbourhood factors can contribute to socioeconomic inequalities in health behaviours: only if people with lower incomes and lower levels of education live in other, more deprived neighbourhoods and do not interact with their higher status counterparts, then exposure to neighbourhood factors may vary by socio-economic status. In the U.S., with a liberal welfare regime, residential segrega-tion is more pronounced than in Europe: poor people live highly concentrated and suffer from high levels of social exclusion [34]. In the Netherlands (classi-fied as a ‘hybrid’ welfare system, with characteristics of both social-democratic and conservative-corporatistic regimes), special social housing programs allow low-income groups to live in mixed neighbourhoods, and with that, prevent poverty concentrations. Therefore, in the Netherlands, apart from some areas in large cities like The Hague, Rotterdam and Amsterdam, residential segrega-tion levels are relatively low and neighbourhood compositions rather mixed, which implies that neighbourhood effects on socioeconomic differences in health-behaviours may only be moderate. In the U.S., on the other hand, these effects may be larger.
Also determined by governmental rules and regulations is the extent to which businesses may themselves decide in which location to open an outlet. In the Netherlands, large sport facilities, such as swimming pools, cannot operate where they wish, but the municipality board decides in which location new sport facilities are needed. In the U.S., on the other hand, sports facilities may decide to open their businesses in locations were demand by local residents is expected to be largest, i.e. high-income neighbourhoods. This could make their accessibility difficult for low-income groups. In the Netherlands, where facilities are more equally distributed across neighbourhoods, no differential
Kamphuis_09.indd 249 20-8-2008 10:34:51

250 Part IV Discussion
access to facilities may be experienced by residents of either deprived or advan-taged neighbourhoods.
These issues lead to the remark that results may be generalised to other coun-tries, though with caution. Results are probably most applicable to countries that are alike to the Netherlands with regard to patterns of socioeconomic dif-ferences in health behaviours, and regarding the geographical, cultural and policy environment.
12.3 Interpretation of findings
This thesis provides important indications of the contribution of neighbourhood factors to the explanation of socioeconomic difference in health behaviours. The picture as shown in Figure 12.2 is drawn to facilitate the interpretation of the findings.
In our study, we hypothesized three associations as depicted in the picture below: (1) associations between SES and health behaviours (research question 1), (2a) associations between neighbourhood factors and health behaviours and (2b) associations between SES and neighbourhood factors (research question 2). Only when all three associations exist, then contributions of neighbourhood factors to socioeconomic differences in health behaviours would be likely to find (research question 3). we will compare our results to evidence from other studies following the three associations in Figure 12.2.
Figure 12.2 Hypothesised associations between SES, environmental factors and health behaviours
Individual SES- Income- Education
Area SES
1
Health behaviours
- Physical inactivity- Diet
2b 2a
Objective/perceivedenvironmental factors:- Physical environment- Social environment
3
Research question 1 – SES and health behavioursSocioeconomic differences in health-behaviours have been found over time and for a large range of health behaviours, with those from lower socioeconomic
Kamphuis_09.indd 250 20-8-2008 10:34:51
25111 General discussion
backgrounds in general behaving less healthy [35]. Studies that have compared disparities in health-behaviours over several European countries sometimes found exceptions to this rule [27, 28, 36, 37]. However, our studies contribute to the rather consistent evidence for an association between SES and health behaviours, with large gradients found for sports participation (chapter 5), and fruit and vegetable consumption (chapter 11), and moderate gradients in recreational walking (chapter 6).
Another body of literature has examined associations between area deprivation or area SES and health behaviours, showing that for physical activity as well as dietary behaviours, large to moderate differences between advantaged and deprived areas were observed, even when individual characteristics were taken into account [38-43]). Results of chapter 8 contribute to this evidence, as our study in the city of melbourne, Australia, showed that residents of socioeco-nomically deprived areas were less likely to cycle for recreation, independent of residents’ age, sex, occupational and educational level.
Research question 2a – Neighbourhood factors and health behavioursFor physical activity, literature reviews have shown some repeated associa-tions between physical neighbourhood factors and physical activity behaviours [44-48], although the evidence is still limited. The objective and perceived availability and accessibility of facilities, as well as the objective and perceived general design of neighbourhoods (e.g. the presences of sidewalks) and per-ceived aesthetics have found to be positively associated with various types and levels of physical activity [47]. In general, our results are in line with these findings. However, we did not find the perceived availability of facilities to be (significantly) associated with sports activity (chapter 5). As argued before, the Netherlands is a densely populated country, where distances are small and public transport is well organised, which may make the availability of facilities in the direct surroundings less of a barrier for physical activity.
For neighbourhoods in the city of melbourne, we found significant associations between objective area characteristics and cycling for recreation: four design features (i.e. presence of on-road cycle lanes, total track length, prevalence of traffic control devices, and prevalence of alternative routes), two safety features (i.e. verge width, and absence of driveway crossovers), one destination feature (i.e. prevalence of destinations), and two aesthetic features (i.e. total park area, and lack of garden maintenance) showed associations with recreational cycling (chapter 8). Although perceived neighbourhood aesthetics was associated with both sports participation (chapter 5) and recreational walking (chapter 6), and perceptions of neighbourhood aesthetics could be partly explained with objective measures of aesthetics (chapter 7), we did not find direct associations between objective characteristics of neighbourhoods in Eindhoven (i.e. neigh-
Kamphuis_09.indd 251 20-8-2008 10:34:51

252 Part IV Discussion
bourhood design, social unsafety, traffic unsafety or aesthetics) and cycling or walking for recreation [49]. The sample of this sub-study may have been too small for statistical models to detect a direct association between objec-tive neighbourhood factors could and health behaviours. As said before, the research field of objective neighbourhood characteristics in association with health behaviour is very young, and future research should reveal to what extent, for which countries and for which specific behaviours direct associa-tions between neighbourhood characteristics and residents’ health-related behaviours exist.
perceived social support and having a companion for physical activity have been found consistently associated with different types of physical activity [48], which is again comparable to our findings for sports and recreational walking. Not many studies have investigated associations between more general social neighbourhood factors, like social networks and social capital, and physical activity. Our results are supported though by a Swedish study: where we found social cohesion and social network to be associated with sports activity and recreational walking, Lindstrom and colleagues found social participation to be associated with leisure time physical activity [50].
For dietary behaviours and their associations with environmental factors, the picture is quite different. First and foremost, the body of research that investi-gated environmental influences on diet is very small: our systematic literature reviews with regard to potential environmental determinants of fruit and veg-etable consumption (chapter 9) and fat and energy intakes (chapter 10) came to the same conclusion, namely that more research into specific environment-intake associations is needed before conclusions can be reached. In chapter 11, limited availability of fruits in the household, no vegetables prepared by the household cook, and absence of fruit and vegetable outlets in the neighbour-hood were associated with no fruit and vegetable consumption, however, only very small percentages of participants actually perceived these environmental barriers. However, in the U.S., several studies reported positive associations between proximity to supermarkets/health food stores and dietary patterns [51, 52]. One publication reported that African-American adult’s fruit and veg-etable intake increased with each additional supermarket in their area of resi-dence [53]. Also, the number of fast food establishments in the U.S. has grown rapidly over recent decades, which is linked to the current obesity epidemic, as fast food consumption is associated with weight gain and dietary intakes less consistent with recommendations [54, 55]. This suggests that availability of resources for healthy and unhealthy products may play a more important role in the U.S. than in other western countries. This may be partly the result of the generally larger distances between places in a country like the U.S. - an extra supermarket in the direct neighbourhood may indeed make a difference, more
Kamphuis_09.indd 252 20-8-2008 10:34:52

25311 General discussion
than in a country like the Netherlands were supermarkets are close-by almost everywhere. Easy availability of fast food may also be more influential on U.S. people’s diets, as the ‘away-from-home-eating’ culture may be more common in the U.S. than other western countries – a fast food outlet in the neighbour-hood may then indeed attract families to rather eat out than at home.
Research question 2b – SES and neighbourhood factorsThe body of literature and our own studies with regard to associations between SES and neighbourhood factors can be split up in two parts: one part examin-ing how neighbourhood socioeconomic status or neighbourhood deprivation level relate to objectively measured neighbourhood characteristics (investigated in chapters 7 and 8 of this thesis), and a second part considering individual-level SES in association with perceived neighbourhood factors (examined in chapters 5, 6, 7 and 11).
Neighbourhood-SES and objective neighbourhood characteristicsOf the two studies in which we examined associations between area-SES and area characteristics, one was carried out in the city of Eindhoven, the Nether-lands, and the other in the city of melbourne, Australia. Although miles apart, findings were quite similar: only aesthetic characteristics differed significantly between high- and low-SES areas, other characteristics did not. Those other characteristics, related to design, traffic safety and destinations, did differ between areas in general, however not by area deprivation level. These findings are in line with another Dutch study (based on previous data from the GLOBE study): this study found no relation between area-based economic environment and proximity to sports facilities, but disadvantaged areas showed poorer gen-eral physical design and poorer quality of green facilities [40].
Further, studies conducted in Europe and Australia have mainly focused on associations between the availability of services for physical activity and area socioeconomic context, which yielded inconsistent results. A British investi-gation showed lower accessibility of and proximity to local facilities in disad-vantaged areas [56], while an Australian study showed the opposite: access to sports and recreational facilities was significantly higher for those living in socioeconomically disadvantaged compared to advantaged areas [57]. A study conducted in Spain showed that the number of sports facilities per 1000 popu-lation was associated with the level of absolute wealth —measured at a given moment or over time during a previous period —but not with income distribu-tion [58].
Also in the U.S., studies investigating associations between neighbourhood-SES and objective neighbourhood characteristics mainly focused on the avail-ability of facilities. Recreational facilities were found significantly less common
Kamphuis_09.indd 253 20-8-2008 10:34:52

254 Part IV Discussion
in lower-income and minority neighbourhoods [59-61] while parks were more equitably distributed [61]. On the other hand, in a study of 32 census tracts in the midwest, Estabrooks and colleagues found that neighbourhoods did not differ in the number of pay-for-use parks, sport facilities, fitness clubs, commu-nity centres, and walking/biking trails; however, low-SES neighbourhoods had significantly fewer free-for-use resources [62]. wilson and colleagues found that while respondents in lower-SES areas reported less availability of public recreational facilities, the perception of less availability was not substantiated by GIS data [63].
The body of research regarding ‘nutrition environments’ is small and results are mixed. Some studies in the U.S. and canada have found neighbourhood differences in the price and availability of food, with ‘healthier’ foods generally more expensive and less available in poorer than in wealthier areas [53, 64]. Also, fast food restaurants have been found more available in disadvantaged and low-income areas in the U.S. [65, 66]. The picture outside North America is different. Initially, UK research undertaken in the late 1980s and early 1990s, based on mainly small-scale local surveys, did suggest similar inequalities, with high prices and poor availability being associated with area deprivation [67, 68]. However, more recently, larger and more robust observations found no differences in food price, food availability, and access to supermarkets between deprived and affluent areas [69-72], although the density of the ‘big four’ fast food restaurants was greater in more deprived areas in England and Scotland [73]. In two Australian studies [74, 75], in a study conducted in New Zealand [76], and in a prior study based on the GLOBE data [77], no socioeconomic differences in shopping infrastructure for fruit and vegetables between advan-taged and disadvantaged areas were found. The existence of socioeconomic neighbourhood differences in the availability and price of healthy/unhealthy foods in the U.S., rather than in other western countries, may be the result of social, cultural, economic, and regulatory differences between nations which govern the provision, purchase, and consumption of food. For instance, fruit and vegetable shops may open their outlets where they expect the most demand for healthy foods (i.e. high income neighbourhoods), and fast food outlets were they expect the most demand for unhealthy foods (i.e. low income neighbour-hoods). Since many U.S. states lack governmental regulations to guide these processes, low income neighbourhoods may indeed end up with more resources for an unhealthy than healthy diet.
Individual-SES and perceived neighbourhood factorsLower educated and lower income groups have been found more likely to per-ceive their neighbourhood as unattractive, unsafe, and providing few facilities, compared to their higher status counterparts [57, 63, 78]. Also, some support has been found for associations between individual-SES and perceived social
Kamphuis_09.indd 254 20-8-2008 10:34:52

25511 General discussion
neighbourhood factors: lower SES-groups reported less social participation than high SES groups [50]. Results of this thesis contribute to the present evi-dence, as we found significant associations between SES and perceived physi-cal neighbourhood factors (neighbourhood safety, attractiveness, availability of facilities), perceived social neighbourhood factors (social network, social cohesion), and household factors (material and social deprivation). These associations were found among adults in general (chapter 5), among a sub-sample of older adults (chapter 6), and among a sub-sample of adults living in seven deprived and seven advantaged neighbourhoods in the city of Eindhoven (chapter 7).
perceptions of food shopping and household environments and their associa-tions with SES have been investigated in chapter 11. Although statistically sig-nificant, no large differences between perceptions of low and high SES groups were observed, as the percentages of people that perceived poor availability and accessibility of fruits and vegetables in their neighbourhood or household, were very small. These findings are in line with findings from a British study reporting that few low income participants said that they experienced any dif-ficulty visiting supermarkets, or perceived any problems in the choice of shops, or of fruit and vegetables, in their local area [79]. Also, an Australian qualita-tive study found that women from neighbourhoods across a range of SES were generally satisfied with their local food environment and availability of healthy foods [80]. However, a second Australian study showed perceptions of food availability, accessibility and affordability did differ across SES groups [81].
Research question 3 – Contribution of neighbourhood factors to socioeconomic differences in health behavioursAlthough the literature provides studies that investigated either one or more of the associations between SES, environmental factors, and health behaviours, the body of literature that examined associations between all three groups of factors within one study, and quantified the contribution of environmental fac-tors to the explanation of socioeconomic differences in health behaviours, is very small. A study conducted in Australia showed that a selection of personal, social, and physical environmental factors could explain educational inequali-ties in leisure-time walking to a large extent, however, this same selection did not substantial mediate effects on associations of education with transport-related walking [82]. A Swedish study found significant socioeconomic differences in leisure-time physical activity, which reduced to non-significance when social participation was taken into account [50]. The authors concluded that these results support the idea that insufficient psychosocial resources in some socio-economic groups are a part of the important link behind the socioeconomic differences in leisure-time physical activity. These two studies are in line with our results, as we found that the perceived physical and social neighbourhood
Kamphuis_09.indd 255 20-8-2008 10:34:52

256 Part IV Discussion
environment had a moderate (but significant) contribution to the explanation of socioeconomic differences in several types of physical activity.
Our results for sports participation and recreational walking indicated that neigh-bourhood factors partly mediated the association between SES and physical inac-tivity via individual cognitions. moreover, objective measures of area aesthetics contributed to the explanation of area socioeconomic difference in recreational cycling in Australia (chapter 8), but other area characteristics regarding safety, design and destinations did not. As hardly any comparable studies could be found, these findings give a unique and promising contribution to the field of understanding socioeconomic differences in physical activity.
Evidence for the food environment to contribute to socioeconomic differences in diet has recently been reviewed by cummins and macintyre [83]. Their main conclusion was that even though neighbourhood socioeconomic differences in obesity and diet exist in many western countries, evidence for neighbourhood influences on diet and obesity only exists for those who live in North American neighbourhoods [84]. In chapter 11, no objective but only perceived environ-mental factors were considered, however, in line with the conclusion of cum-mins and macintyre for countries other than the U.S., no contribution of food shopping and household environmental factors to the explanation of individual socioeconomic differences in fruit and in vegetable consumption was found. In section 12.3, some policy and regulatory environmental differences have been indicated between the U.S. and other western countries, which may account for the observed differences. Residential segregation according to SES and race may be larger in the U.S., and there is less governmental action to compensate for socioeconomic area differences than in other western countries.
ConclusionsResearch has shown repeated associations between SES and physical inactivity (research question 1) and between neighbourhood factors and physical inactiv-ity (research question 2a), which are in line with our results. For the association between SES and neighbourhood factors (research question 2b), two of our studies, one conducted in Australian and one in a Dutch city, show the same result: deprived and advantaged areas differ with regard to aesthetic charac-teristics (e.g. green maintenance, garden maintenance, graffiti), while other area characteristics (i.e. with regard to design, traffic safety, social safety, and destinations) were less different. Other SES-neighbourhood research mainly focussed on the availability of physical activity facilities across deprived and advantaged neighbourhood, showing inconsistent findings. Lastly, only very few studies have tried to quantify the contribution of neighbourhood factors to socioeconomic differences in physical activity (research question 3). How-ever, our results are in line with the few studies available, which concluded
Kamphuis_09.indd 256 20-8-2008 10:34:52

25711 General discussion
that physical and social neighbourhood factors, together with more proximal determinants, have a moderate, but significant contribution to the explanation of socioeconomic differences in several types of physical inactivity.
conclusions regarding fruit and vegetable consumption are quite different. Although large socioeconomic inequalities in fruit and vegetable consumption exist (research question 1), no evidence that the household or neighbourhood environment contributes to socioeconomic differences in fruit and vegetable consumption was found in this thesis (research question 2 and 3). This is simi-lar to several studies from the U.K. and Australia, which neither found socio-economic differences in shopping infrastructure, nor differences in food price, food availability, and access to supermarkets between deprived and affluent areas. U.S. studies, on the other hand, in general have found more support for socioeconomic disparities in food environments.
12.4 Implications for future research
In this thesis, we mainly focussed on neighbourhood factors, but other groups of environmental factors (e.g. cultural conditions) and from other environmental settings (e.g. work-related factors, or national-level factors, e.g. governmental regulations) are likely to play a role as well, and deserve further investigation.
pathways between SES, explanatory factors and health-behaviours should be investigated for specific behaviours, as associations may differ for specific outcomes. moreover, the predictive capacity of neighbourhood as well as indi-vidual factors is likely to increase when both would be measured behaviour- and context-specific, so for instance, ‘feeling (un)safe in the neighbourhood when walking at night time’, or ‘self-efficacy to cycle to shops within 1,5 kilometres from home’. Also, early findings indicate that not only availability and acces-sibility of facilities may differ for lower and higher socioeconomic groups, but that also –and maybe more importantly- quality differences between resources should be investigated [84]. Deprived areas may have equal numbers of parks or facilities compared to advantaged areas, but these are less likely to be used when they are old, not well-maintained, and (perceived as) unsafe.
Future research should try to further disentangle relationships between SES, environmental contexts and health behaviours. An important limitation of many studies into place effects on health and health behaviours is that cau-sation and selection mechanisms cannot be disentangled. One approach to circumvent problems of endogeneity, is for researchers to take advantage of “natural experiments” that provide exogenous sources of contextual variation. One example of such a natural experiment is the so-called Gautreaux program, a large public housing relocation program to remedy segregation the city of chicago. Between 1976 and 1998, nearly 4,000 families volunteered to partici-
Kamphuis_09.indd 257 20-8-2008 10:34:52

258 Part IV Discussion
pate in the subsidized program that moved them to communities throughout the six-county chicago metropolitan area. while all participants came from the same low-income and black city neighbourhoods, some moved to middle income white suburbs, while others moved to white and black urban neigh-bourhoods, regardless of clients’ locational preference [85]. In such a setting, baseline and follow up measures of individual-SES, neighbourhood-SES, per-ceived as well as objective environmental factors, individual level factors, and health-behaviours, may give more inside in causal pathways between SES and health behaviours.
12.5 Implications for theory development
Frequently-employed theories for explaining variations in health-related behav-iours, such as the Theory of planned Behaviour and Social cognitive Theory, focus on proximal cognitive determinants of behaviour, such as attitudes, per-ceived social norms and self-efficacy beliefs, and pay little attention to distal environmental factors. Social-ecological models have become more popular since the renewed interest in environmental determinants of health and health behaviours, as these models point to the importance of environmental factors, together with individual factors. However, ecological models are often stated in rather broad terms and lack specificity in hypothesized pathways between factors from different settings [86]. In this thesis, environmental factors and individual cognitions were combined in one model (chapter 2), and associa-tions between SES, environmental factors, individual cognitions and health behaviours were tested in subsequent chapters.
Individual cognitions towards regular physical activity (e.g. positive and nega-tive outcome expectancies, social norm, and self-efficacy regarding regular physical activity) explained socioeconomic differences in sports participation and recreational walking to a large extent. Also, results suggested that individ-ual cognitions partly mediated the associations between SES, neighbourhood factors, and health-behaviours. This shows that individual cognitions may be important for understanding socioeconomic differences in health behaviours, together with environmental factors. Therefore, to be able to formulate and test specific hypotheses concerning environment-individual associations, both groups of factors should be specified in one model. models that have been sug-gested in the literature often do not specify the role of SES [87], and do not visualise the pathways SES relates to health behaviours [88, 89]. The model sug-gested in chapter 2 may come quite close to what may be an appropriate model for testing the role of environmental and individual factors in socioeconomic variations in health behaviours. This model shows similarities to the Theory of Triadic Influences [90], with distal factors influencing health behaviours via more proximal cognitions; however, the Theory of Triadic Influences does not
Kamphuis_09.indd 258 20-8-2008 10:34:52

25911 General discussion
specify the role of the physical environment nor SES. The studies described in this thesis only tested some of the pathways specified in the model of chapter 2. Especially, cultural factors deserve more attention in future research, and should be better conceptualised in theories. Lastly, our studies showed that environmental factors that are important for explaining socioeconomic varia-tions in health behaviours differ for specific outcomes, which suggests that it is important to develop specific models for specific behaviours [91].
12.6 Implications for policy and interventions to reduce socioeconomic inequalities in health-behaviours
Large socioeconomic inequalities in fruit and vegetable consumption exist, however, no evidence was found in this thesis that household or neighbour-hood environments contribute to socioeconomic differences in fruit and veg-etable consumption. Therefore, in this section, our recommendations will be restricted to physical inactivity.
Although the contribution of neighbourhood factors to socioeconomic inequal-ities in physical inactivity may be moderate compared to the contribution of more proximal, individual level factors, this does not mean that neighbourhood factors require less attention in policy and intervention development. From a population perspective, even small odds ratios for neighbourhood character-istics may imply that changes to (perceptions of) the neighbourhood context may have a significant effect on physical activity levels. Especially since we found that perceptions of neighbourhood unsafety and unattractiveness were more prevalent among lower socioeconomic groups, these may offer important opportunities to reduce socioeconomic inequalities in physical inactivity.
with this, we actually follow the reasoning expressed by Rose (1985) and, later, emphasized by Schwartz and Diez-Roux (2001), arguing that the closer in the causal chain a factor is in the onset of the disease, the less opportunity there is for pre-vention [92, 93]. Neighbourhood factors are distal to physical activity and offer much opportunity for prevention, but, since causal associations between neigh-bourhood factors and physical activity behaviours have not been confirmed (as nearly all research to date has a cross-sectional design), there is large causal uncertainty. However, despite greater uncertainty that might adhere to causes that are more distal, Rose argues that these causes should be given priority from a public health point of view. In the long run, once neighbourhoods have been redesigned to be more safe and attractive to their residents, they may posi-tively influence resident’s physical activity behaviours, and the maintenance of that behaviour requires less effort from individuals.
Kamphuis_09.indd 259 20-8-2008 10:34:52

260 Part IV Discussion
Interventions and policies aimed at increasing population rather than individual levels of physical activity have the disadvantage that they offer less for each participating individual (the ‘prevention paradox’) [94]. Therefore, to decrease physical inactivity among the lowest educated residing in the poorest neigh-bourhoods, special individual-level programs may be needed which do focus on reducing physical inactivity, but not without dealing with/changing envi-ronmental circumstances as well. Our results for sports participation suggested that intervention and policy strategies targeted towards lower socioeconomic groups would need to intervene on both neighbourhood, household and indi-vidual factors, to yield a maximal increase in physical activity among lower socioeconomic groups.
Lastly, important to notice in this context, is that not only behavioural inter-ventions may have a positive effect on health and health behaviours, but that general policies may have health effects as well. Unfavourable neighbourhood perceptions were associated with physical inactivity (chapter 5 and 6) and results of chapter 8 showed that unfavourable neighbourhood perceptions of low SES-groups partly reflected their actual less appealing and less safe neigh-bourhoods, and partly their perceptions of low social cohesion and feelings of depression. Therefore, to yield a maximal improvement of neighbourhood perceptions among lower socioeconomic groups, environmental change strate-gies, for instance, improving neighbourhood aesthetics and traffic safety, would need to be combined with social community interventions to increase resident’s involvement in social processes, and individual-level interventions. Even with-out focussing in these interventions on a health outcome or behavioural out-come specifically, ultimately, improved neighbourhood perceptions and truly ‘better’ neighbourhoods may increase resident’s physical activity.
This is good news in light of a new initiative that the Dutch government started last year, called ‘Krachtwijken’, aimed at improving the physical lay-out, safety and social situation of forty poor neighbourhoods in the Netherlands (http://www.vrom.nl/pagina.html?id=31001, accessed may 8th, 2008). Although this project does not specifically aim to improve the health or health-behaviours of the (mainly low-SES) residents of these neighbourhoods, small effects on health behaviours or health outcomes may still be expected in the long run. In the future, more evidence-based, multilevel and multidisciplinary projects should be developed, implemented and evaluated, to improve health behav-iours among lower socioeconomic groups, and ultimately, to reduce socioeco-nomic inequalities in health.
Kamphuis_09.indd 260 20-8-2008 10:34:52

26111 General discussion
References
1 Barros R, moreira p, Oliveira B. [Effect of social desirability on dietary intake esti-mated from a food questionnaire] Influencia da desejabilidade social na estimativa da ingestao alimentar atraves de um questionario de frequencia de consumo. Acta Med Port 2005;18:241-7.
2 Jago R, Baranowski T, Baranowski Jc, et al. Social desirability is associated with some physical activity, psychosocial variables and sedentary behavior but not self-reported physical activity among adolescent males. Health Educ Res 2007;22:438-49.
3 Liberatos p, Link BG, Kelsey JL. The measurement of social class in epidemiology. Epidemiol Rev 1988;10:87-121.
4 Harris Sm. The effect of health value and ethnicity on the relationship between hardi-ness and health behaviors. J Pers 2004;72:379-412.
5 Kamphuis cBm, mackenbach Jp Giskes K, et al. why do poor people perceive poor neighbourhoods? Socioeconomic differences in perceptions of neighbourhood safety and attractiveness: the role of objective neighbourhood features and residents’ psycho-social characteristics Health & Place submitted.
6 Ellaway A, macIntyre S, Kearns A. perceptions of place and health in socially contrast-ing neighbourhoods. Urban Studies 2001;38:2299-316.
7 Bjelland I, Krokstad S, mykletun A, et al. Does a higher educational level protect against anxiety and depression? The HUNT study. Soc Sci Med 2008;66:1334-45.
8 Gallo Lc, matthews KA. Do negative emotions mediate the association between socio-economic status and health? Ann N Y Acad Sci 1999;896:226-45.
9 poulton R, caspi A. commentary: personality and the socioeconomic-health gradient. Int J Epidemiol 2003;32:975-7.
10 pulkki L, Kivimaki m, Keltikangas-Jarvinen L, et al. contribution of adolescent and early adult personality to the inverse association between education and cardio-vascular risk behaviours: prospective population-based cohort study. Int J Epidemiol 2003;32:968-75.
11 Bernstein DA, clarke-Stewart A, Roy EJ, et al. Psychology. Boston: Houghton mifflin company 1997.
12 Van Berkel-Van Schaik AB, Tax B. Towards a standard operationalisation of socioeconomic status for epidemiological and socio-medical research [in Dutch]. Rijswijk: ministerie van wVc 1990.
13 Leigh Jp. multidisciplinary findings on socioeconomic status and health. American Jour-nal of Public Health 1993;83.
14 Galobardes B, Shaw m, Lawlor DA, et al. Indicators of socioeconomic position (part 1). J Epidemiol Community Health 2006;60:7-12.
15 Turrell G. Income non-reporting: implications for health inequalities research. J Epide-miol Community Health 2000;54:207-14.
16 caughy mO, O’campo pJ, patterson J. A brief observational measure for urban neigh-borhoods. Health Place 2001;7:225-36.
17 Day K, Boarnet m, Alfonzo m, et al. The Irvine-minnesota inventory to measure built environments: development. Am J Prev Med 2006;30:144-52.
18 pikora TJ, Bull Fc, Jamrozik K, et al. Developing a reliable audit instrument to measure the physical environment for physical activity. Am J Prev Med 2002;23:187-94.
19 weich S, Burton E, Blanchard m, et al. measuring the built environment: validity of a site survey instrument for use in urban settings. Health Place 2001;7:283-92.
20 Zenk SN, Schulz AJ, mentz G, et al. Inter-rater and test-retest reliability: methods and results for the neighborhood observational checklist. Health Place 2007;13:452-65.
Kamphuis_09.indd 261 20-8-2008 10:34:52

262 Part IV Discussion
21 Droomers m, Schrijvers cT, mackenbach Jp. Educational level and decreases in leisure time physical activity: predictors from the longitudinal GLOBE study. J Epidemiol Com-munity Health 2001;55:562-8.
22 Droomers m, Schrijvers cT, mackenbach Jp. why do lower educated people con-tinue smoking? Explanations from the longitudinal GLOBE study. Health Psychol 2002;21:263-72.
23 Droomers m, Schrijvers cT, mackenbach Jp. Educational differences in starting exces-sive alcohol consumption: explanations from the longitudinal GLOBE study. Soc Sci Med 2004;58:2023-33.
24 Van Lenthe FJ, Schrijvers cT, Droomers m, et al. Investigating explanations of socioeconomic inequalities in health: the Dutch GLOBE study. Eur J Public Health 2004;14:63-70.
25 Huisman m, Kunst AE, mackenbach Jp. Intelligence and socioeconomic inequalities in health. Lancet 2005;366:807-8.
26 Dowler E. Inequalities in diet and physical activity in Europe. Public Health Nutr 2001;4:701-9.
27 Roos G, Johansson L, Kasmel A, et al. Disparities in vegetable and fruit consumption: European cases from the north to the south. Public Health Nutr 2001;4:35-43.
28 Demarest S, Roskam AJR, cox B, et al. Socioeconomic inequalities in leisure time phys-ical activity. Tackling health inequalities in Europe: an integrated approach - Eurothine Final Report Rotterdam: Erasmus University medical centre 2007.
29 Development of a wHO global strategy on diet, physical activity and health: European regional consultation. Report on the consultation copenhagen, 2-4 April 2003. EUR/HQ/03/905732: Available online: http://www.euro.who.int/Document/E81281.pdf (accessed 07 march 2008).
30 European Opinion Research Group EEIG. Eurobarometer: physical activity. Special Eurobarometer 183-6/wave 58.2 Available online at: http://ec.europa.eu/public_opin-ion/archives/ebs/ebs_183_6_en.pdf (accessed 07 march 2008) Brussels: European commission 2003.
31 Rutten A, Abel T, Kannas L, et al. Self reported physical activity, public health, and per-ceived environment: results from a comparative European study. J Epidemiol Community Health 2001;55:139-46.
32 Kafatos A, manios Y, markatji I, et al. Regional, demographic and national influences on attitudes and beliefs with regard to physical activity, body weight and health in a nation-ally representative sample in the European Union. Public Health Nutr 1999;2:87-95.
33 Nestle m, wing R, Birch L, et al. Behavioral and social influences on food choice. Nutr Rev 1998;56:S50-64; discussion S-74.
34 Arbaci, S. (2007) Ethnic Segregation, Housing Systems and Welfare Regimes in Europe, European Journal of Housing policy, 7(4), p. 401-433.
35 Laaksonen m, Talala K, martelin T, et al. Health behaviours as explanations for educa-tional level differences in cardiovascular and all-cause mortality: a follow-up of 60 000 men and women over 23 years. European Journal of Public Health 2007;18:38-43.
36 cavelaars AEJm, Kunst AE, Geurts JJm, et al. Educational differences in smoking: international comparison. bmj 2000;320:1102–7.
37 Roskam AJR, Kunst AE. Overview of inequalities in overweight and obesity across Europe (chapter 23). Tackling health inequalities in Europe: an integrated approach - eurothine Final Report. Rotterdam: Erasmus University medical centre 2007.
38 Sundquist J, malmstrom m, Johansson SE. cardiovascular risk factors and the neigh-bourhood environment: a multilevel analysis. Int J Epidemiol 1999;28:841-5.
Kamphuis_09.indd 262 20-8-2008 10:34:52

26311 General discussion
39 Diez-Roux AV, Link BG, Northridge mE. A multilevel analysis of income inequality and cardiovascular disease risk factors. Soc Sci Med 2000;50:673-87.
40 Van Lenthe FJ, Brug J, mackenbach Jp. Neighbourhood inequalities in physical inactiv-ity: the role of neighbourhood attractiveness, proximity to local facilities and safety in the Netherlands. Soc Sci Med 2005;60:763-75.
41 Ecob R, macintyre S. Small area variations in health related behaviours; do these depend on the behaviour itself, its measurement, or on personal characteristics? Health Place 2000;6:261-74.
42 Yen IH, Kaplan GA. poverty area residence and changes in physical activity level: evi-dence from the Alameda county Study. Am J Public Health 1998;88:1709-12.
43 Diez-Roux AV, Nieto FJ, caulfield L, et al. Neighbourhood differences in diet: the Atherosclerosis Risk in communities (ARIc) Study. J Epidemiol Community Health 1999;53:55-63.
44 Owen N, Humpel N, Leslie E, et al. Understanding environmental influences on walk-ing; Review and research agenda. Am J Prev Med 2004;27:67-76.
45 Trost SG, Owen N, Bauman AE, et al. correlates of adults’ participation in physical activity: review and update. Med Sci Sports Exerc 2002;34:1996-2001.
46 Humpel N, Owen N, Leslie E. Environmental factors associated with adults’ participa-tion in physical activity: a review. Am J Prev Med 2002;22:188-99.
47 mccormack G, Giles-corti B, Lange A, et al. An update of recent evidence of the rela-tionship between objective and self-report measures of the physical environment and physical activity behaviours. J Sci Med Sport 2004;7:81-92.
48 wendel-Vos w, Droomers m, Kremers S, et al. potential environmental determinants of physical activity in adults: a systematic review. Obesity reviews 2007.
49 Kamphuis cBm, Van Lenthe FJ, Giskes K, et al. Socioeconomic inequalities in leisure time walking and cycling in the Netherlands – the contribution of objective area charac-teristics (paper presentation). Annual conference of the International Society for Behavioural Nutrition and Physical Activity. Oslo, Norway, June 21, 2007.
50 Lindstrom m, Hanson BS, Ostergren pO. Socioeconomic differences in leisure-time physical activity: the role of social participation and social capital in shaping health related behaviour. Soc Sci Med 2001;52:441-51.
51 cheadle A, psaty Bm, curry S, et al. community-level comparisons between the gro-cery store environment and individual dietary practices. Prev Med 1991;20:250-61.
52 Laraia BA, Siega-Riz Am, Kaufman JS, et al. proximity of supermarkets is positively associated with diet quality index for pregnancy. Prev Med 2004;39:869-75.
53 morland K, wing S, Diez Roux A. The contextual effect of the local food environment on residents’ diets: the atherosclerosis risk in communities study. Am J Public Health 2002;92:1761-7.
54 Bowman SA, Vinyard BT. Fast food consumption of U.S. adults: impact on energy and nutrient intakes and overweight status. J Am Coll Nutr 2004;23:163-8.
55 Satia JA, Galanko J, Siega-Riz Am. Eating at fast-food restaurants is associated with dietary intake, demographic, psychosocial and behavioral factors among African Ameri-cans in North carolina. Pub Health Nutr 2004;7:1089-96.
56 Sooman A, macintyre S. Health and perceptions of the local environment in socially contrasting neighbourhoods in Glasgow. Health and Place 1995;1:15-26.
57 Giles-corti B, Donovan RJ. Socioeconomic status differences in recreational physical activity levels and real and perceived access to a supportive physical environment. Prev Med 2002;35:601-11.
Kamphuis_09.indd 263 20-8-2008 10:34:52

264 Part IV Discussion
58 pascual c, Regidor E, Astasio p, et al. The association of current and sustained area-based adverse socioeconomic environment with physical inactivity. Soc Sci Med 2007;65:454-66.
59 powell Lm, Slater S, chaloupka FJ, et al. Availability of physical activity-related facili-ties and neighborhood demographic and socioeconomic characteristics: a national study. Am J Public Health 2006;96:1676-80.
60 Gordon-Larsen p, Nelson mc, page p, et al. Inequality in the built environment under-lies key health disparities in physical activity and obesity. Pediatrics 2006;117:417-24.
61 moore LV, Diez Roux AV, Evenson KR, et al. Availability of recreational resources in minority and low socioeconomic status areas. Am J Prev Med 2008;34:16-22.
62 Estabrooks pA, Lee RE, Gyurcsik Nc. Resources for physical activity participation: does availability and accessibility differ by neighborhood socioeconomic status? Ann Behav Med 2003;25:100-4.
63 wilson DK, Kirtland KA, Ainsworth BE, et al. Socioeconomic status and perceptions of access and safety for physical activity. Ann Behav Med 2004;28:20-8.
64 morland K, wing S, Diez Roux A, et al. Neighborhood characteristics associated with the location of food stores and food service places. Am J Prev Med 2002;22:23-9.
65 Block Jp, Scribner RA, DeSalvo KB. Fast food, race/ethnicity, and income: a geographic analysis. Am J Prev Med 2004;27:211-7.
66 Smoyer-Tomic KE, Spence Jc, Raine KD, et al. The association between neighborhood socioeconomic status and exposure to supermarkets and fast food outlets. Health Place 2007.
67 mooney c. cost and availability of healthy food choices in a London health district. Journal of Human Nutrition Dietetics 1990;3:111-20.
68 Sooman A, macintyre S, Anderson A. Scotland’s health--a more difficult challenge for some? The price and availability of healthy foods in socially contrasting localities in the west of Scotland. Health Bull (Edinb) 1993;51:276-84.
69 cummins S, macintyre S. The location of food stores in urban areas: a case study in Glasgow. Brit Food J 1999;101:545–53.
70 cummins S, macintyre S. A systematic study of an urban foodscape: the price and avail-ability of food in greater Glasgow. Urban Studies 2002;39:2115-30.
71 Guy c, David G. measuring physical access to ‘healthy foods’ in areasof social deprivation: a case study in cardiff. Int J Consumer Stud 2004;28:222–34.72 pearson T, Russell J, campbell mJ, et al. Do ‘food deserts’ influence fruit and vegetable
consumption?--A cross-sectional study. Appetite 2005;45:195-7.73 cummins Sc, mcKay L, macIntyre S. mcDonald’s restaurants and neighborhood
deprivation in Scotland and England. Am J Prev Med 2005;29:308-10.74 winkler E, Turrell G, patterson c. Does living in a disadvantaged area entail limited
opportunities to purchase fresh fruit and vegetables in terms of price, availability, and variety? Findings from the Brisbane Food Study. Health Place 2005.
75 winkler E, Turrell G, patterson c. Does living in a disadvantaged area mean fewer opportunities to purchase fresh fruit and vegetables in the area? Findings from the Bris-bane food study. Health Place 2006;12:306-19.
76 pearce J, Hiscock R, Blakely T, et al. The contextual effects of neighbourhood access to supermarkets and convenience stores on individual fruit and vegetable consumption. J Epidemiol Community Health 2008;62:198-201.
77 Giskes K, Turrell G, van Lenthe FJ, et al. A multilevel study of socioeconomic inequali-ties in food choice behaviour and dietary intake among the Dutch population: the GLOBE study. Public Health Nutr 2006;9:75-83.
Kamphuis_09.indd 264 20-8-2008 10:34:52

26511 General discussion
78 Huston SL, Evenson KR, Bors p, et al. Neighborhood environment, access to places for activity, and leisure-time physical activity in a diverse North carolina population. Am J Health Promot 2003;18:58-69.
79 Dibsdall LA, Lambert N, Bobbin RF, et al. Low-income consumers’ attitudes and behaviour towards access, availability and motivation to eat fruit and vegetables. Public Health Nutr 2003;6:159-68.
80 Inglis V, Ball K, crawford D. why do women of low socioeconomic status have poorer dietary behaviours than women of higher socioeconomic status? A qualitative explora-tion. Appetite 2005;45:334–43.
81 Inglis V, Ball K, crawford D. Socioeconomic variations in women’s diets: what is the role of perceptions of the local food environment? J Epidemiol Community Health 2008;62:191-7.
82 Ball K, Timperio A, Salmon J, et al. personal, social and environmental determinants of educational inequalities in walking: a multilevel study. J Epidemiol Community Health 2007;61:108-14.
83 cummins S, macintyre S. Food environments and obesity--neighbourhood or nation? Int J Epidemiol 2006;35:100-4.
84 macintyre S. Deprivation amplification revisited; or, is it always true that poorer places have poorer access to resources for healthy diets and physical activity? International Jour-nal of Behavioral Nutrition and Physical Activity 2007;4.
85 Duncan G, Raudenbusch S. Neighborhood and adolescent development: how can we determine the links? JcpR working paper chicago: Northwestern University 1999.
86 Giles-corti B, Timperio A, Bull F, et al. Understanding physical activity environ-mental correlates: increased specificity for ecological models. Exerc Sport Sci Rev 2005;33:175-81.
87 Kremers Sp, de Bruijn GJ, Visscher TL, et al. Environmental influences on energy bal-ance-related behaviors: A dual-process view. Int J Behav Nutr Phys Act 2006;3:9.
88 Booth SL, Sallis JF, Ritenbaugh c, et al. Environmental and societal factors affect food choice and physical activity: rationale, influences, and leverage points. Nutr Rev 2001;59:S21-39; discussion S57-65.
89 cohen DA, Scribner RA, Farley TA. A structural model of health behavior: a pragmatic approach to explain and influence health behaviors at the population level. Prev Med 2000;30:146-54.
90 Flay BR, petraitis J. The theory of triadic influence: a new theory of health behavior with implications for preventive interventions. In: Albrecht GL, Fitzpatrick R, eds. Advances in Medical Sociology. Greenwich: JAI press Inc. 1994:19-44.
91 pikora T, Giles-corti B, Bull F, et al. Developing a framework for assessment of the environmental determinants of walking and cycling. Soc Sci Med 2003;56:1693-703.
92 Rose G. Sick individuals and sick populations. Int J Epidemiol 1985;14:32-8.93 Schwartz S, Diez-Roux AV. commentary: causes of incidence and causes of cases--a
Durkheimian perspective on Rose. Int J Epidemiol 2001;30:435-9.94 Rose G. Strategy of prevention: lessons from cardiovascular disease. Br Med J (Clin Res
Ed) 1981;282:1847-51.
Kamphuis_09.indd 265 20-8-2008 10:34:53

Kamphuis_09.indd 266 20-8-2008 10:34:53

Summary
Kamphuis_09.indd 267 20-8-2008 10:34:53

268 Part IV Discussion
Summary
Part 1: IntroductionSocioeconomic inequalities in health have existed for centuries. The general opinion is that these inequalities are unfair and should be reduced, and over the last few decades, there has been considerable attention from research and politics for socioeconomic inequalities in health. However, still today, in the Netherlands, those with a lower socioeconomic position on average live three to five years less than their higher status counterparts, and they also spend ten to fifteen more years in poorer health (chapter 1). Not only do higher rates of morbidity and mortality exist among lower socioeconomic groups, this is also the case for several unhealthy behaviours (e.g. smoking, physical inactivity, and low fruit and vegetable intake). Therefore, unhealthy behaviours are an important possible explanation for health inequalities. To be able to change unhealthy behaviours, one should understand which determinants to focus on, or in other words, understand why poor people behave poorly. For a long time, research on the determinants of health behaviours has focused on cognitive and other ‘proximal’ determinants. However, in view of the collective nature of multiple health behaviours being less favourable for the disadvantaged, it is more likely that these behaviours are ultimately the result of common environ-mental exposures.
when we started the studies as presented in this thesis, no clear picture existed of which environmental characteristics would be most important for explain-ing socioeconomic inequalities in health behaviours. Research on nutrition and physical activity increasingly suggested that neighbourhoods in which poorer people live may be of poorer quality, for example, being less safe or having less access to health promoting amenities, than neighbourhoods in which the better-off live. Therefore, we focused on the neighbourhood as main environ-mental setting in this thesis, and the following three research questions were formulated:1) To what extent do socioeconomic inequalities in specific types of physical
inactivity and dietary behaviours exist?2) To what extent are neighbourhood factors associated with specific physical
inactivity and dietary behaviours (2a) and do they differ by SES (2b)?3) To what extent and via which pathways are neighbourhood factors involved
in the explanation of socioeconomic inequalities in physical inactivity and dietary behaviours?
To answer these research questions empirically, a stepwise protocol was designed in which complementary research methods were combined. This study pro-
Kamphuis_09.indd 268 20-8-2008 10:34:53

269Summary
tocol is described in chapter 2. Via an eclectic approach, first, a conceptual model was developed, based on existing knowledge about mechanisms leading to socioeconomic health inequalities and knowledge on determinants of health behaviours. Subsequently, we held focus group interviews among low and high socioeconomic groups, to test the relevance of factors captured in the model, and to investigate whether participants perceived additional environmental influences. we selected the most salient environmental factors based on focus groups results and literature reviews, and included them in a large-scale postal survey, which would allow us to quantify the contribution of environmental factors to socioeconomic inequalities in health-behaviours. Subsequently, we held interviews with a sub-sample of the postal survey participants, to talk more in-depth about environmental influences and health behaviours. The neighbourhoods in which those interview participants lived were visited and area characteristics were scored in an objective, systematic way. These sub-studies are described in more detail in subsequent chapters of this thesis.
In chapter 3, results of the qualitative focus group study are presented. In four focus groups, with adults from high and low socioeconomic backgrounds in separate groups, participants were asked: which environmental factors in your daily life influence your physical activity and fruit and vegetable consump-tion? participants in all groups talked about their spouses’ and friends’ health behaviours and support as being highly important. people from lower socioeco-nomic backgrounds reported poor neighbourhood aesthetics, safety concerns and poor access to facilities as barriers for physical activity, while easy access of sports facilities was reported by high socioeconomic groups. The availabil-ity of fruits and vegetables at home was perceived as good by all participants. Overall, lower socioeconomic groups expressed more price concerns regarding sports facilities and fruit and vegetables. with few exceptions, factors that were discussed during the focus groups had been incorporated in the conceptual model beforehand.
Part 2: SES, environmental factors and physical activityAs specific neighbourhood determinants may only be important for some but not all physical activity behaviours, the second part of this thesis starts with an investigation of the relative importance of neighbourhood factors for two specific outcomes of sports activity (chapter 4). The two outcomes studied were (a) doing any vs. no sports at all, and (b) meeting vs. not meeting recom-mendations for sports activity (i.e. >3 days per week for >20 minutes per occa-sion). we found that physical and social neighbourhood factors as well as all individual cognitions showed independent associations with doing any vs. no sports. On the other hand, no neighbourhood factors were significantly associ-ated with meeting recommended sports activity levels, whereas self-efficacy and attitudes towards regular physical activity were strongly associated. So
Kamphuis_09.indd 269 20-8-2008 10:34:53

270 Part IV Discussion
favourable vs. unfavourable neighbourhood factors appeared to make a differ-ence between inactivity and doing at least some sports, while for meeting rec-ommended levels of sports activity, no neighbourhood factors were important.
In the next study, described in chapter 5, we investigated whether socioeco-nomic groups differed in their sports participation, and to what extent perceived neighbourhood, household, and individual factors contributed to socioeco-nomic differences in sports participation. The lowest socioeconomic group was about three to four times more likely not to participate in sports compared to the highest socioeconomic group. Unfavourable perceived neighbourhood factors (e.g. feeling unsafe, having a small social network), household factors (e.g. material and social deprivation), and individual physical activity cogni-tions (e.g. negative outcome expectancies, low self-efficacy) were significantly associated with doing no sports, and reported more frequently among lower socioeconomic groups. Taking these neighbourhood, household, and individ-ual factors into account reduced socioeconomic inequalities in sports participa-tion to a large extent.
In chapter 6, socioeconomic differences in another physical activity outcome where studied, namely recreational walking, and we examined to what extent neighbourhood perceptions and individual cognitions mediated the SES-walk-ing relationship. These analyses focused on older adults (55 years of age or older), as they represent a rapidly increasing share of the general population, and physical activity is important to preserve their health and functioning. A moderate socioeconomic gradient in recreational walking was observed, with the lowest educated and least affluent about 1,5 times more likely not to engage in any recreational walking than their higher status counterparts. Individual cognitions towards physical activity (e.g. attitude, perceived behavioural con-trol) contributed most to the explanation of these socioeconomic differences. However, perceived neighbourhood aesthetics had a significant contribution to the explanation as well, and mediated the association between SES and recre-ational walking largely via individual cognitions.
In the studies described so far, we noticed that lower socioeconomic groups were more likely to perceive their neighbourhood as unattractive and unsafe than higher socioeconomic groups. In chapter 7, we examined whether objectively-measured neighbourhood characteristics and/or other factors could explain these differences in neighbourhood perceptions. we found that unfavourable neighbourhood perceptions of low socioeconomic groups were partly explained by their actual less appealing and less safe neighbourhoods, and additionally by self-reported psychosocial factors, such as feelings of depression, and low social neighbourhood cohesion. Additionally, we found that residents’ perceptions of neighbourhood unattractiveness and unsafety clustered within neighbour-
Kamphuis_09.indd 270 20-8-2008 10:34:53

271Summary
hoods. This clustering reduced to a great extent when objective neighbourhood characteristics were taken into account, which underlined that the objective neighbourhood characteristics measured with the environmental audit reflected resident’s general perceptions of their neighbourhoods quite well.
In chapter 8, we studied cycling levels of residents in socioeconomically con-trasting areas of the city of melbourne, Australia. Results showed that, after adjustment for residents’ characteristics (i.e. individual-level SES, age and sex), those residing in deprived areas were 1,5 times less likely to cycle for recreation than those in advantaged areas. Objectively measured area aesthetics tended to be worse in deprived areas and explained some of the area socioeconomic inequalities. Safety characteristics were not particularly worse in deprived areas but did differ significantly between areas in general, and also contributed to the explanation of overall area variations in recreational cycling. This last study with regard to physical activity confirmed that objective area characteristics may matter for physical activity.
Part 3: SES, environmental factors and dietSimilar to physical activity behaviours, also dietary intakes have been thought susceptible to contextual effects, e.g. via the availability of healthy and unhealthy products. The rise of obesity over the last decades has often been suggested the result of gradual environmental changes which resulted in an ‘obesogenic’ environment, i.e. an environment that encourages unhealthy food intake and discourages physical activity. To verify whether the food-intake part of this claim is supported by empirical studies, we performed two systematic reviews of the literature concerning environmental determinants of health-related dietary intakes. In a first systematic literature review, environmental determinants of obesity-related dietary intakes were investigated (i.e. saturated fat, total fat, and energy intake). Again, very few replicated studies for specific environment-intake associations were found (chapter 9). Availability, social, cultural and material aspects of the environment were relatively understudied compared to other factors such as seasonal/day of the week variation and work-related factors. more studies are required to examine whether and which envi-ronmental determinants matter for (obesogenic) dietary intakes. The second systematic review investigated studies concerning two dietary outcomes that are believed to have a beneficial effect on health: fruit and vegetable consump-tion (chapter 10). This review showed that a large variety of environmental factors have been studied in association with fruit and vegetable intakes, but that the number of replicated studies for each determinant was limited. All studies were observational and cross-sectional. most evidence was found for household income, as people with lower household incomes consistently had lower FV consumption. Good local availability (e.g. access to one’s own veg-
Kamphuis_09.indd 271 20-8-2008 10:34:53

272 Part IV Discussion
etable garden, having low food insecurity) seemed to exert a positive influence on intakes.
Although evidence was limited, we included neighbourhood and food shop-ping environmental factors in our postal survey, which have been suggested to matter for fruit and vegetable consumption in either the literature or the focus group study. In chapter 11, large socioeconomic gradients in fruit and vegeta-ble consumption were observed, with lower socioeconomic groups four to five times more likely not to consume fruits and vegetables, respectively. However, we did not find evidence for neighbourhood and food shopping environmental factors to explain these inequalities. we did find that respondents were more likely not to consume fruit or vegetables when they reported poor availability of fruits in their household, when the household cook did not cook vegetables, or when reporting there were no fruit and vegetable outlets in the neighbourhood. However, only very small percentages of participants actually perceived these environmental barriers, and none of these factors contributed to the explana-tion of socioeconomic inequalities in fruit and vegetable consumption.
Part 4: Discussion, conclusions, and implicationschapter 12, the General Discussion, started with a summary of the main results of this thesis, followed by study limitations that should be acknowledged when interpreting the results. measurement issues regarding self-reported data are discussed, e.g. bias due to social desirability, ‘same-source bias’, and bias due to processes of social cognitive dissonance. Also, some methodological prob-lems concerning objective measurement of neighbourhood characteristics are reflected on, e.g. the lack of validated audit instruments, and lack of knowledge on the appropriate scale is to measure area effects. Next, limitations of a cross-sectional study design are described, with as main draw back that no causal inferences can be drawn. Also, the generalisability of our results to other west-ern countries is discussed. Results are probably most applicable to countries that are similar to the Netherlands with regard to patterns of socioeconomic differences in health behaviours, and with a similar geographical, cultural and policy environment.
To answer the research questions which were formulated at the start of this project, we took into account our own studies, as well as evidence from other studies in this research field. The body of evidence for associations between SES and physical inactivity (research question 1) and for associations between neighbourhood factors and physical inactivity (research question 2a) is rather consistent, and in line with our results. Associations between SES and objec-tive neighbourhood factors (research question 2b) are discordant in the avail-able literature, however, two of our studies showed the same result: deprived and advantaged areas differed with regard to aesthetic characteristics (e.g.
Kamphuis_09.indd 272 20-8-2008 10:34:53

273Summary
green maintenance, graffiti), while other area characteristics were less dif-ferent. Lower-educated and lower-income groups were found more likely to perceive their neighbourhoods as unattractive, unsafe, and lacking sufficient facilities (research question 2b). Our results are in line with the few studies available that have tried to quantify the contribution of neighbourhood factors to socioeconomic differences in physical activity (research question 3). This led to the conclusion that physical and social neighbourhood factors, together with more proximal determinants, have a moderate, but significant contribu-tion to the explanation of socioeconomic differences in several types of physical inactivity.
conclusions regarding fruit and vegetable consumption were quite different. Although large socioeconomic inequalities in fruit and vegetable consumption exist (research question 1), no evidence for the household or neighbourhood environment to contribute to socioeconomic differences in fruit and vegetable consumption was found in this thesis (research question 2 and 3). This is simi-lar to several studies from the U.K. and Australia, that neither found socio-economic differences in shopping infrastructure, nor differences in food price, food availability, and access to supermarkets between deprived and affluent areas. U.S. studies, on the other hand, in general found more support for socio-economic disparities in food environments.
These results have implications for future research, theory development and intervention development. Future research should try to further disentangle relationships between SES, environmental contexts and health behaviours. Longitudinal designs or ‘natural experiments’ are needed to disentangle cau-sation and selection mechanisms. Specific health-behaviours should be mea-sured, in relation to behaviour- and context-specific environmental factors. Besides neighbourhood factors, also other environmental settings require fur-ther investigation. Important with regard to theory development is that both environmental factors (as described in ecological models) as well as individual cognitions (specified in social cognitive models) are important in the explana-tion of socioeconomic differences in physical inactivity. Therefore, to be able to formulate and test specific hypotheses concerning pathways between environ-mental and individual factors, both groups should be specified in one model. Our results suggest that intervention and policy strategies targeted towards lower socioeconomic groups would need to intervene on both neighbourhood, household and individual factors, to yield a maximal increase in physical activ-ity among lower socioeconomic groups. Not only individual-level interventions targeted on behaviour change may be important, but general policies, aimed to improve physical and social aspects of neighbourhood environments may also have the potential to exert a positive effect on physical activity levels.
Kamphuis_09.indd 273 20-8-2008 10:34:53

Kamphuis_09.indd 274 20-8-2008 10:34:53

Samenvatting
Kamphuis_09.indd 275 20-8-2008 10:34:53

276 Samenvatting
Samenvatting
Deel 1: IntroductieSociaaleconomische verschillen in gezondheid bestaan sinds mensenheuge-nis. De algemene opinie is dat deze verschillen onrechtvaardig zijn en zouden moeten worden verkleind. Sinds begin jaren negentig is in de politiek en in wetenschappelijk onderzoek relatief veel aandacht geweest voor sociaaleconomi-sche gezondheidsverschillen. Toch bestaan ook vandaag de dag, in een modern en ontwikkeld land als Nederland, nog grote verschillen in gezondheid tussen sociale groepen. Vergeleken met Nederlanders in een hoge sociale positie leven zij met een lage sociale positie gemiddeld drie tot vijf jaar korter en bovendien brengen zij tien tot vijftien jaar méér, van hun toch al kortere leven, in ziekte of met gezondheidsklachten door (Hoofdstuk 1). Naast een hogere prevalentie van morbiditeit en mortaliteit komt ook ongezond gedrag vaker voor onder lage sociaaleconomische groepen (bijvoorbeeld roken, lichamelijke inactiviteit en lage groente- en fruitconsumptie). Ongezond gedrag wordt daarom beschouwd als één van de mogelijke verklaringen voor sociaaleconomische gezondheids-verschillen. Om dit ongezonde gedrag te kunnen veranderen, is het cruciaal om te weten welke determinanten ten grondslag liggen aan dit gedrag, of, in andere woorden, om te begrijpen waarom lage sociale klassen zich ongezonder gedragen. Heel lang ging men er vanuit dat ongezond gedrag een persoonlijke keuze is en richtte het onderzoek naar determinanten van gezondheidsgere-lateerd gedrag zich vooral op deze cognitieve, persoonlijke factoren. Echter, aangezien niet slechts één maar een hele serie ongezonde gedragingen vaker voorkomt onder lagere dan hogere sociale groepen, is het waarschijnlijker dat dit het resultaat is van blootstelling aan ongunstige omgevingsfactoren.
Toen de studies zoals beschreven in dit proefschrift van start gingen, bestond er nog geen duidelijk beeld van welke omgevingsfactoren het belangrijkst zouden zijn voor het verklaren van sociaaleconomische verschillen in gedrag. Enige studies op het gebied van voeding en bewegen hadden al wel aangetoond dat verschillen in de fysieke en sociale structuur van de woonomgeving een rol kunnen spelen bij verschillen in gedrag. Daarom richt dit proefschrift zich op de buurt als belangrijkste setting. De volgende onderzoeksvragen staan cen-traal in dit proefschrift:1) Hoe groot zijn sociaaleconomische verschillen in lichamelijke inactiviteit en
voedingsgedrag?2) welke buurtfactoren zijn gerelateerd aan specifieke vormen van lichamelijke
inactiviteit en voedingsgedrag (2a) en aan SES (2b)?3) In hoeverre kunnen buurtfactoren sociaaleconomische verschillen in licha-
melijke inactiviteit en voedingsgedrag verklaren?
Kamphuis_09.indd 276 20-8-2008 10:34:53

277Samenvatting
Om deze onderzoeksvragen te kunnen beantwoorden, is een onderzoeksproto-col opgesteld met verschillende deelstudies die elkaar stapsgewijs opvolgen. Dit onderzoeksprotocol wordt beschreven in Hoofdstuk 2. Als eerste is een concep-tueel model ontworpen, waarin de bestaande kennis over mechanismen die een rol spelen bij sociaaleconomische gezondheidsverschillen wordt gecombineerd met de literatuur over determinanten van gezondheidsgerelateerd gedrag. Ver-volgens zijn kwalitatieve groepsinterviews gehouden onder mensen uit lage en hoge sociaaleconomische groepen. Hiermee is onderzocht of de factoren uit het conceptueel model ook daadwerkelijk als belangrijk worden beschouwd en of nog nieuwe factoren in de gesprekken werden genoemd. Uitgaande van de resultaten van deze kwalitatieve studie en de bestaande literatuur is een selectie van omgevingsfactoren opgenomen in de grootschalige, schriftelijke postenquête, om zo de bijdrage van omgevingsfactoren aan sociaaleconomi-sche verschillen in gezondheidsgerelateerd gedrag te kunnen kwantificeren. Vervolgens zijn diepte-interviews gehouden met een selectie van de posten-quête-deelnemers om met hun verder door te praten over omgevingsfactoren en gezondheidsgerelateerd gedrag. Bovendien zijn de buurten waarin de inter-viewdeelnemers woonden bezocht en kenmerken van deze buurten zijn op een objectieve en systematische wijze gescoord. Deze deelstudies (met uitzondering van de diepte-interviews) komen in de volgende hoofdstukken van het proef-schrift uitgebreider aan bod.
In Hoofdstuk 3 worden de resultaten van de kwalitatieve focusgroepinterviews gepresenteerd. In vier aparte groepen – twee samengesteld uit mensen van hoge en twee uit mensen van lage sociaaleconomische achtergrond – werd aan deelnemers gevraagd: welke factoren die buiten uzelf liggen, hebben invloed op de mate waarin in u beweegt/groente eet/fruit eet? In alle vier de groepen spraken deelnemers over het gedrag van hun partner, familie en vrienden als zeer bepalend voor hun eigen gedrag. Daarnaast spraken mensen met een lage sociaaleconomische achtergrond over hun onaantrekkelijke en onveilige buurt en de beperkte toegang tot sportfaciliteiten als barrières om lichamelijk actief te zijn. mensen met een hoge sociaaleconomische achtergrond benadrukten juist de goede toegang tot faciliteiten. Alle deelnemers vonden de beschikbaar-heid van groente en fruit thuis voldoende. Over het algemeen spraken lagere sociaaleconomische groepen vaker over de hoge prijs van groente en fruit en hoge toegangsprijzen van sportfaciliteiten. Vrijwel alle factoren die tijdens de groepsinterviews door deelnemers werden genoemd, waren reeds opgenomen in het conceptueel model.
Deel 2: Sociaaleconomische status, omgevingsfactoren en bewegenNiet alle specifieke buurtfactoren zijn van belang voor alle vormen van beweeg-gedrag (bijvoorbeeld, de aanwezigheid van sportfaciliteiten in een buurt is wel-licht geassocieerd met sporten, maar minder vanzelfsprekend met wandelen).
Kamphuis_09.indd 277 20-8-2008 10:34:53

278 Samenvatting
Het tweede deel van dit proefschrift start met een studie die kijkt of het rela-tieve belang van zelfgerapporteerde buurtfactoren verschilt voor twee specifieke uitkomstmaten van sporten (Hoofdstuk 4). De twee uitkomstmaten die onder de loep zijn genomen, zijn (a) ten minste iets aan sport doen, versus helemaal niet sporten, en (b) sporten volgens de aanbevolen norm (dat wil zeggen, op ten minste 3 dagen per week gedurende minimaal 20 minuten), versus minder sporten dan de norm. Fysieke en sociale buurtfactoren bleken, samen met per-soonlijke cognities, onafhankelijk geassocieerd te zijn met uitkomstmaat (a), sporten versus niet sporten. Daarentegen was geen enkel buurtkenmerk signi-ficant geassocieerd met uitkomstmaat (b), het wel of niet halen van de norm, terwijl persoonlijke cognities zoals eigeneffectiviteit en attitude ten opzichte van regelmatig bewegen in sterke mate samenhingen met deze uitkomstmaat. Het belang van specifieke buurtfactoren kan dus zelfs verschillen voor verschil-lende afkappunten van één beweeguitkomstmaat. Tevens liet de studie zien dat buurtfactoren dus vooral een verschil kunnen maken tussen iets of helemaal niets aan sport doen, terwijl ze een minimale rol spelen bij wel of niet sporten naar de norm.
In Hoofdstuk 5 is vervolgens onderzocht of er sociaaleconomische verschillen zijn in sporten en in hoeverre dit kan worden toegeschreven aan verschillen in zelfgerapporteerde buurtfactoren, omstandigheden in het huishouden en indi-viduele cognities met betrekking tot regelmatig bewegen. Zowel een laag oplei-dings- als inkomensniveau bleek sterk samen te hangen met een grotere kans om niet aan sport te doen. Ongunstige buurtfactoren (bijvoorbeeld de eigen buurt als onveilig waarnemen, een beperkt sociaal netwerk hebben in de eigen buurt), ongunstige omstandigheden in het huishouden (bijvoorbeeld materiële en sociale deprivatie) en ongunstige individuele cognities (bijvoorbeeld nega-tieve uitkomstverwachtingen van regelmatig bewegen, een lage eigeneffectivi-teit met betrekking tot regelmatig bewegen) waren significant geassocieerd met niet sporten en werden vaker gerapporteerd door de lagere sociaaleconomische groepen. Deze buurt-, huishoudens- en individuele factoren tezamen konden sociaal-economische verschillen in sporten voor een groot deel verklaren.
In Hoofdstuk 6 zijn sociaaleconomische verschillen in wandelen in de vrije tijd onderzocht en wel specifiek onder 55-plussers. Oudere volwassenen vormen door de vergrijzing een steeds grotere groep van de samenleving. Voor hen is lichaamsbeweging belangrijk om zo hun gezondheid en lichamelijk functio-neren op peil te houden. Opnieuw bleek een lage sociaaleconomische status geassocieerd te zijn met lichamelijke inactiviteit. Lager opgeleiden waren vaker inactief met betrekking tot wandelen in de vrije tijd dan hoger opgeleiden en eenzelfde verband werd gevonden naar inkomensniveau. Individuele cognities met betrekking tot regelmatig bewegen (bijvoorbeeld houding en eigeneffec-tiviteit) droegen het meest bij aan de verklaring van deze sociaaleconomische
Kamphuis_09.indd 278 20-8-2008 10:34:53

279Samenvatting
verschillen. Eén buurtfactor, namelijk of mensen hun buurt wel of niet als aan-trekkelijk ervaren, bleek ook significant aan de verklaring van de verschillen bij te dragen. De invloed van deze buurtfactor verliep deels via de individuele cog-nities, dat wil zeggen: lager opgeleiden zagen hun buurt vaker als onaantrek-kelijk, wat samenhing met een negatievere houding ten opzichte van regelmatig bewegen en vervolgens ook met een grotere kans om niet aan wandelen in de vrije tijd te doen.
In de hoofdstukken tot nu toe, vonden we dat lage sociaaleconomische groepen hun buurt vaker onaantrekkelijk en onveilig vinden dan hoge sociaaleconomi-sche groepen. De literatuur laat zien dat dergelijke percepties van buurtbewo-ners niet automatisch één op één staan met objectieve kenmerken van een buurt. Daarom is in Hoofdstuk 7 onderzocht in welke mate objectieve buurtkenmer-ken sociaaleconomische verschillen in buurtpercepties kunnen verklaren en in hoeverre andere factoren hierbij een rol spelen. Het vaker voorkomen van nega-tieve buurtpercepties onder de lagere sociaaleconomische groepen bleek deels te kunnen worden verklaard door objectieve scores van buurtaantrekkelijkheid en buurtveiligheid. Daarnaast speelden ook psychosociale factoren (bijvoor-beeld een depressieve stemming) en sociale factoren (bijvoorbeeld de ervaren sociale cohesie in de buurt) een rol bij de verklaring van sociaaleconomische verschillen in buurtpercepties. Om het beeld dat lagere sociaaleconomische groepen van hun buurt hebben te verbeteren (en daarmee de kans op lichame-lijke activiteit te vergroten), moet hun woonomgeving dus aantrekkelijker en veiliger worden, maar moeten sociale buurtomstandigheden en persoonlijke, psychosociale factoren ook verbeteren.
In het laatste hoofdstuk over lichaamsbeweging wordt een uitstapje gemaakt naar het buitenland, namelijk Australië. Hoofdstuk 8 betreft een studie naar recreatief fietsen onder inwoners van welgestelde buurten en gedepriveerde buurten van melbourne. De resultaten laten zien dat inwoners van gedepri-veerde buurten minder vaak recreatief fietsen dan inwoners van welgestelde buurten, óók wanneer rekening wordt gehouden met de verschillende samen-stelling van gedepriveerde en welgestelde buurten (in gedepriveerde buurten wonen bijvoorbeeld meer lager opgeleiden en meer ouderen dan in de welge-stelde buurten, die minder bewegen). Dit impliceert dat het niet kenmerken van de bewoners, maar ‘iets’ in de buurten zelf moet zijn wat deze verschillen in fietsgedrag kan verklaren. Objectieve scores voor de aantrekkelijkheid van de buurt (onder andere het onderhoud van groenvoorzieningen, het onderhoud van tuinen en de aanwezigheid van een park) waren slechter voor gedepriveerde buurten en konden de sociaaleconomische buurtverschillen in fietsen deels ver-klaren. Objectieve scores voor de veiligheid van de buurt waren niet zozeer slechter in gedepriveerde buurten, maar er waren wel significante verschillen in objectieve veiligheid tussen de onderzochte buurten in het algemeen. Daarmee
Kamphuis_09.indd 279 20-8-2008 10:34:53

280 Samenvatting
konden de verschillen tussen buurten in de mate waarin er gefietst werd gro-tendeels worden verklaard. In deze studie kon dus een direct associatie worden aangetoond tussen objectieve buurtkenmerken en lichaamsbeweging (namelijk recreatief fietsen).
Deel 3: Sociaaleconomische status, omgevingsfactoren en voedingsgedragNet als bij lichaamsbeweging is in het onderzoek naar gezond en ongezond voedingsgedrag de laatste jaren steeds meer aandacht gekomen voor de context waarin dit gedrag plaatsvindt. De oorzaak van de sterke toename van over-gewicht en ernstig overgewicht (obesitas) over de afgelopen decennia wordt vaak gezocht in veranderingen in onze leefomgeving. De ‘obesogene’ omgeving die geleidelijk aan is ontstaan, maakt de consumptie van ongezonde voeding gemakkelijk (bijvoorbeeld door de alom aanwezige snackgelegenheden in win-kelstraten), terwijl de noodzaak tot lichaamsbeweging wordt geminimaliseerd (bijvoorbeeld door de aanwezigheid van liften en roltrappen). Om na te gaan in hoeverre deze redenering wat betreft (on)gezond voedingsgedrag kan worden onderschreven met bewijs uit empirische studies, zijn twee systematische reviews van de literatuur uitgevoerd. In de eerste literatuurstudie, beschreven in Hoofdstuk 9, zijn op een systematische manier studies verzameld en beoor-deeld naar associaties tussen omgevingskenmerken en aan obesitas gerelateerde voedingsconsumptie (namelijk inname van verzadigd vet, totaal vet en totale energie). Het belangrijkste resultaat van deze literatuurstudie is dat er nog zeer weinig studies naar omgevingsdeterminanten van vet- en energie-inname gedaan zijn. Naar veel van de onderzochte omgevingsdeterminanten is slechts één of enkele studies uitgevoerd, meestal in cross-sectioneel onderzoek. Voor een reviewstudie is dit onvoldoende bewijs om conclusies te trekken, laat staan om aanbevelingen voor beleid of interventies te doen. In de tweede review-studie is de bestaande literatuur over associaties tussen omgevingskenmerken en groente- en fruitconsumptie onderzocht (Hoofdstuk 10). Ook deze studie heeft als belangrijkste conclusie: gebrek aan bewijs. Veel verschillende deter-minanten zijn bestudeerd, variërend van wonen in een landelijke of stedelijke omgeving tot werkdruk. Voor vrijwel geen enkel omgevingskenmerk is naar de relatie met groenteconsumptie of fruitconsumptie vaak en goed genoeg onder-zoek gedaan. Een uitzondering hierop is het inkomensniveau van het huishou-den: mensen uit huishoudens met een laag inkomen consumeerden stelselmatig minder groente en minder fruit dan mensen met een hoog huishoudinkomen. Ook is er enig bewijs voor een associatie tussen de beschikbaarheid van groente en fruit in het huishouden (bijvoorbeeld door de aanwezigheid van een eigen groentetuin) en consumptie.
Hoofdstuk 11 is gebaseerd op data van de grootschalige postenquête en draagt hiermee bij aan het empirisch bewijs voor de rol van omgevingsfactoren bij groente- en fruitconsumptie. Tevens zijn in dit hoofdstuk sociaaleconomische verschillen in groente- en fruitconsumptie onderzocht. mensen die rapporte-
Kamphuis_09.indd 280 20-8-2008 10:34:53

281Samenvatting
ren dat er geen of onvoldoende groente en fruit in hun huishouden beschikbaar zijn, dat degene die kookt geen groenten bereidt, of dat in de buurt geen winkels zitten die groente en fruit verkopen, hebben een grotere kans om geen groente en fruit te consumeren. Echter, het percentage mensen dat deze barrières rap-porteert is zeer laag. Sociaaleconomische verschillen in groenteconsumptie en in fruitconsumptie zijn groot, maar deze kunnen niet worden verklaard door de onderzochte huishoud- en buurtfactoren.
Deel 4: Discussie, implicaties en conclusiesHet Discussiehoofdstuk (Hoofdstuk 12) start met een samenvatting van de belangrijkste resultaten van dit proefschrift, gevolgd door een beschrijving van de belangrijkste beperkingen van de onderzoeksmethoden die zijn toege-past. Deze moeten in het achterhoofd worden gehouden bij het interpreteren van de resultaten. Zo zijn veel hoofdstukken gebaseerd op zelfgerapporteerde gegevens, wat de resultaten mogelijk vertekend zou kunnen hebben. methodo-logische problemen die zich voor deden bij het meten van objectieve buurtken-merken zijn onder andere het ontbreken van gevalideerde meetinstrumenten en gebrek aan kennis over wat de juiste schaal is om buurtkenmerken te meten. De meeste studies in dit proefschrift zijn cross-sectioneel van aard, wat wil zeggen dat zowel de verklarende factoren als de uitkomstmaat op hetzelfde moment in de tijd zijn gemeten. Hierdoor kunnen geen conclusies over causaliteit worden getrokken. Ten slotte komt de generaliseerbaarheid van de resultaten aan bod. De resultaten zijn niet direct toepasbaar op de gehele Nederlandse bevolking, omdat twee belangrijke bevolkingsgroepen onvoldoende in de studies zijn ver-tegenwoordigd, namelijk allochtonen en laaggeletterden. De resultaten uit dit proefschrift zijn ook van toepassing op andere westerse landen, die op Neder-land lijken wat betreft patronen van sociaaleconomische verschillen in gezond-heidsgerelateerde gedrag en met min of meer gelijke geografische, culturele en politieke omstandigheden.
In de beantwoording van de onderzoeksvragen die aan het begin van deze studie zijn geformuleerd, worden zowel de resultaten van de studies zoals beschreven in dit proefschrift meegenomen, als die van soortgelijke studies in het onder-zoeksveld. Er is aanzienlijk en consistent bewijs voor associaties tussen soci-aaleconomische status en lichamelijke inactiviteit (onderzoeksvraag 1) en voor associaties tussen buurtfactoren en lichamelijke inactiviteit (onderzoeksvraag 2a). De literatuur geeft geen consistent bewijs voor associaties tussen soci-aaleconomische status en objectieve buurtkenmerken (onderzoeksvraag 2b), maar twee van de studies uit dit proefschrift laten wel eenzelfde resultaat zien: gedepriveerde en welgestelde buurten verschillen vooral van elkaar wat betreft aantrekkelijkheid van de woonomgeving (bijvoorbeeld onderhoud van groen, aanwezigheid van graffiti), terwijl verschillen in andere objectieve kenmerken minder groot waren. Lager opgeleiden en lagere inkomensgroepen zien hun buurt vaker als minder aantrekkelijk, minder veilig en met onvoldoende faci-
Kamphuis_09.indd 281 20-8-2008 10:34:53

282 Samenvatting
liteiten om te bewegen (onderzoeksvraag 2b). Ondanks het beperkte aantal studies dat geprobeerd heeft de bijdrage van omgevingsfactoren aan sociaal-economische verschillen in lichaamsbeweging te kwantificeren, kan worden geconcludeerd dat fysieke en sociale buurtkenmerken, samen met meer proxi-male, individuele factoren, een gematigde maar significante bijdrage leveren aan de verklaring van sociaaleconomische verschillen in lichamelijke inactivi-teit (onderzoeksvraag 3).
De conclusies met betrekking tot groente- en fruitconsumptie zijn geheel anders van aard. Ondanks dat grote sociaaleconomische verschillen in groente- en fruitconsumptie bestaan (onderzoeksvraag 1), geeft dit proefschrift geen bewijs voor een bijdrage van huishoud- en buurtfactoren aan de verklaring van deze verschillen (onderzoeksvraag 2 and 3). Deze conclusie is vergelijkbaar met die van een aantal studies uit het Verenigd Koninkrijk en Australië, die geen verschillen vonden tussen gedepriveerde en welgestelde buurten in het aanbod van winkels, prijzen van voedingsproducten en de toegankelijkheid van super-markten. Daarentegen is in de Verenigde Staten wel bewijs gevonden voor soci-aaleconomische verschillen in de voedingsomgeving.
Deze resultaten hebben implicaties voor onderzoek, theorieontwikkeling en mogelijke interventies. meer onderzoek is nodig om associaties tussen soci-aaleconomische status, omgeving en gezondheidsgerelateerd gedrag verder te ontrafelen. Longitudinale onderzoeksontwerpen (met meerdere meetpunten over de tijd heen) en ‘natuurlijke experimenten’ kunnen worden toegepast om causale en selectie-effecten van elkaar te onderscheiden. Gedrag en omge-vingsfactoren moeten zo specifiek mogelijk worden gemeten, omdat alleen dan mogelijke associaties kunnen worden aangetoond. Naast buurtinvloeden ver-dienen ook andere omgevingsfactoren nader onderzoek, bijvoorbeeld de wer-komgeving, nationaal beleid, het eigen huishouden en invloed van de media. Belangrijk voor de ontwikkeling van theorieën is dat zowel omgevingsfactoren (waarvan het belang wordt benadrukt in ecologische modellen) als individuele cognities (zoals gespecificeerd in sociaalcognitieve theorieën) een rol spelen in de verklaring van sociaaleconomische verschillen in bewegen. Daarom zouden beide groepen factoren moeten worden geïntegreerd in één model, om zo spe-cifieke hypothesen tussen sociaaleconomische status, omgeving- en individuele factoren en gedrag te kunnen formuleren en testen. Om interventie- en beleids-trategieën, met als doel lagere sociaaleconomische groepen aan het bewegen te krijgen, te laten slagen, zouden deze zich gelijktijdig moeten richten op zowel buurt-, huishoudens- als individuele factoren. Naast persoonlijke interventies specifiek gericht op gedragsverandering, kunnen ook meer algemene beleid- en interventiestrategieën gericht op het verbeteren van de fysieke en sociale buurtomgeving (dus zonder een specifiek gezondheidsdoel), een belangrijke bijdrage leveren aan het bevorderen van beweeggedrag.
Kamphuis_09.indd 282 20-8-2008 10:34:53

Tot slot
Kamphuis_09.indd 283 20-8-2008 10:34:53

Kamphuis_09.indd 284 20-8-2008 10:34:53

285
Dankwoord
Veel eer komt toe aan anderen, al prijkt dan alleen mijn naam op de voorkant van dit proefschrift. Het Dankwoord biedt gelukkig een goede mogelijkheid om deze eenzijdige erkenning te compenseren – en het stelt me gerust te weten dat dit hoofdstuk één van de best gelezen hoofdstukken van een proefschrift is.
Johan en Frank, het was me een eer en genoegen om met jullie als promotor en co-promotor samen te werken. Johan, naarmate de jaren vorderde ben ik jouw scherpe blik en oneindige kennis zeer gaan waarderen. Onze besprekingen, in het bijzonder die in de laatste fase van het schrijven van dit proefschrift, vond ik heel inspirerend. Veel dank voor de samenwerking en je deskundige inbreng in dit promotieonderzoek. Frank, je bent een co-promotor om op te bouwen! Deskundig, accuraat, humoristisch en altijd bereid om tijd vrij te maken voor een vraag. Ons wekelijks overleg heb ik als heel waardevol ervaren. Dank je wel voor de prettige en leerzame samenwerking van de afgelopen jaren.
Katrina, I cannot express how grateful I am for the huge contribution you made to this thesis, as well as to my personal development as a researcher. I could always turn to you when struggling with questions or problems. we worked closely together during the data collections, literature reviews, and during my research visit to Australia, and all of our collaborations went very smoothly and with lots of fun. Thank you for sharing your knowledge of good research with me, for all the English corrections you made to my papers and to this thesis, and for your trust and friendship.
martijn Huisman, als co-auteur van veel artikelen wil ik je bedanken voor je belangrijke input en de prettige samenwerking. Hans Brug, jij hebt vanaf het begin ook meegedacht met het onderzoek. Bedankt voor je betrokkenheid en goede adviezen en voor het zitting willen nemen in mijn promotiecommissie. Also, prof.dr. Groenewegen, prof.dr. macintyre, prof.dr. Donker, prof.dr. Bur-gers, and prof.dr. Kok, I would like to thank you all for taking place in my defence commission. Een belangrijk woord van dank gaat ook uit aan alle res-pondenten die hebben deelgenomen aan het onderzoek – zonder hen had dit proefschrift nooit geschreven kunnen worden.
Dr. Gavin Turrell and dr. Katrina Giskes invited me for a three-months research visit at the School of public Health of the Queensland University in Brisbane. Also, I worked together with dr. Anne Kavanagh at the University of melbourne. I would like to thank all of you for giving me the opportunity to work at your departments. my time in Australia was a great life experience.
Kamphuis_09.indd 285 20-8-2008 10:34:54
286 Dankwoord
werken op de afdeling maatschappelijke Gezondheidszorg deed ik altijd met veel plezier en dat komt vooral door de aanwezigheid van vele leuke en betrok-ken collega’s. mijn kamergenoten over de jaren heen wil ik graag speciaal noemen: Loes, Vivian, marianne en Hilde, bedankt voor de gezelligheid, fijne gesprekken en goede adviezen. Ik had het erg getroffen met jullie als kamer-genoten. Birgitte, merel, maartje, Karien en Klazine, het was bijzonder fijn dat jullie ook op mGZ werk(t)en, bedankt voor de vele leuke gesprekken en gezellige lunchwandelingen. Ook aan Vivian, Loes, Ida, Frank, marja en Hein, veel dank voor de gezelligheid binnen, maar vooral ook buiten werktijd, onder andere tijdens sinterklaasavonden en klimuitjes. Allround-statistici caspar en Gerard, heren van de helpdesk en dames van het secretariaat, dank jullie wel voor de goede ondersteuning. mijn nieuwe collega’s van het Sociaal en cultu-reel planbureau wil ik bedanken voor hun steun en betrokkenheid bij het afron-den van mijn proefschrift. Richard, jij speciaal bedankt voor je begeleiding bij het drukken van dit boekje.
Hoewel voor de meeste vrienden en familieleden mijn promotieonderzoek altijd een hoog abstractiegehalte heeft gehad, hebben ze indirect een belangrijke bij-drage geleverd aan de totstandkoming ervan. Fijne vriendinnen, bedankt voor jullie vriendschap, oprechte interesse, lieve woorden en voor de gezelligheid tijdens kopjes thee, etentjes en uitjes. In min of meer chronologische volgorde, van basisschool tot heden: Renate, Bianca, Linda Hendrikx, Krista, martine, Linda Kuik, Josefien, Nicole, merlin, Sandra, Dorien en Lieke, dank je wel dat jullie er zijn! Birgitte en merel, van collega’s werden jullie goede vriendinnen en nu ook nog mijn paranimfen. Ik vind het een geruststellend idee dat jullie gedurende de promotiedag aan mijn zijde staan, veel dank daarvoor.
Van al mijn leuke en lieve familieleden én schoonfamilieleden, noem ik opa en oma Kamphuis graag in het bijzonder. Lieve oma en opa, dank voor uw nimmer aflatende interesse in uw ‘oudste nicht’ (zoals opa het graag zegt). Het is een voorrecht om een stel bijdetijdse en attente grootouders als u te hebben en ik ben heel trots dat u op mijn promotiedag aanwezig kunt zijn. Arvid, je bent een superbroer en melissa, wat heb ik in jou een lieve schoonzus getrof-fen. Het is altijd heel vertrouwd bij jullie en ik verheug me op onze aanstaande vakantie samen. Lieve pap en mam, bedankt voor álles. Voor de prachtige basis die jullie aan mijn leven hebben gegeven in de vorm van een onbezorgde jeugd, met zoveel lieve aandacht en versiert met dagjes uit en eindeloze vakanties. Daarnaast voor jullie wijsheid en betrokkenheid. Voor het er altijd zijn.
Lieve lief, lieve Norbert. Samenleven met jou is heerlijk en ongecompliceerd, of we nu klussen in ons huisje, fietsen door de polders of verre reizen maken. Ik voel me bevoorrecht met zo’n geweldige vriend als jij het leven te kunnen delen. Speciaal bedankt voor je steun en begrip in het afgelopen jaar, waarin ik mijn proefschrift in onze zo geliefde vrije tijd moest afronden. Vol vertrouwen kijk ik uit naar de toekomst die voor ons ligt – samen kunnen we de hele wereld aan!
Kamphuis_09.indd 286 20-8-2008 10:34:54

287
Curriculum vitae
carlijn Barbara maria Kamphuis werd geboren op 20 oktober 1979 te Zoe-termeer. In 1998 behaalde zij haar VwO-diploma aan het Alfrink college in Zoetermeer. Na haar propedeuse HBO-Verpleegkunde te hebben behaald aan de Haagse Hogeschool, startte zij in 1999 met de studie Gezondheidsweten-schappen aan de Universiteit maastricht. In 2003 behaalde ze haar doctoraal Gezondheidswetenschappen (master of Science), met als afstudeerrichting Gezondheidsvoorlichting. Van oktober 2003 tot april 2008 was zij als promov-endus verbonden aan de afdeling maatschappelijke Gezondheidszorg van het Erasmus mc in Rotterdam en voerde haar promotieonderzoek uit wat result-eerde in dit proefschrift. Gelijktijdig volgde ze de post-doctorale opleiding public Health aan het NIHES (Netherlands Institute for Health Sciences) en behaalde in juni 2006 haar master of public Health. Van oktober tot en met december 2006 deed ze onderzoek aan de Queensland University of Technol-ogy (Brisbane) en aan de University of melbourne, Australië. Sinds oktober 2007 is zij werkzaam als wetenschappelijk onderzoeker bij het Sociaal en cul-tureel planbureau in Den Haag.
carlijn Barbara maria Kamphuis was born on October 20, 1979, in Zoetermeer, the Netherlands. She obtained her secondary school education at the Alfrink college in Zoetermeer in 1998. She studied Nursing for one year, and then enrolled at university to study Health Sciences. In 2003 she graduated with her master of Health Sciences (majoring in Health Education and promotion) from the University of maastricht. She was then employed as a phD-student at the Department of public Health at the Erasmus medical centre in Rotter-dam, where she carried out the research presented in this thesis. During this time, she also enrolled in the master of Science programme at the Netherlands Institute for Health Sciences, and obtained her master of public Health in June 2006. From October to December 2006, she worked as a visiting researcher at the Queensland University of Technology in Brisbane and the University of melbourne, Australia. carlijn is currently employed as researcher at the Neth-erlands Institute for Social Research/Scp, The Hague.
Kamphuis_09.indd 287 20-8-2008 10:34:54

Kamphuis_09.indd 288 20-8-2008 10:34:54

289
Publications
2008Kamphuis cBm, Van Lenthe FJ, Giskes K, Huisman m, Brug J & macken-bach Jp (2008). Socioeconomic status, environmental and individual factors, and sports participation. Medicine & Science in Sports & Exercise, 40(1):71-81.
Kamphuis cBm, Giskes K, Kavanagh Am, Thornton LE, Thomas LR, Van Lenthe FJ, mackenbach Jp & Turrell G (2008). Area variation in recreational cycling in melbourne: a compositional or contextual effect? Journal of Epide-miology and Community Health, 62(10) (in press)
Giskes, K, Van Lenthe FJ, Turrell G, Kamphuis cBm, Brug J, mackenbach Jp (2008). Socioeconomic position at different stages of the life course and its influence on bodyweight and weight gain in adulthood: a longitudinal study with 13 years follow-up. Obesity, 16(6):1377-1381
Giskes K, Van Lenthe FJ, Kamphuis cBm, Huisman m, Brug J mackenbach Jp. Household and food shopping environments: do they play a role in socio-economic inequalities in fruit and vegetable consumption? A multilevel study among Dutch adults. Journal of Epidemiology and Community Health (in press)
2007Kamphuis cBm, Van Lenthe FJ, Giskes K, Brug J & mackenbach Jp (2007). perceived environmental determinants of physical activity and fruit and veg-etable consumption among high and low socioeconomic groups in the Nether-lands. Health & Place, 13(2):493-503.
Giskes K, Kamphuis cBm, Van Lenthe FJ, Kremers S, Droomers m & Brug J (2007). A systematic review of associations between environmental factors, energy and fat intakes among adults: is there evidence for environ-ments that encourage obesogenic dietary intakes? Public Health Nutrition, 10(10):1005-1017.
Slingerland AS, Van Lenthe FJ, Jukema Jw, Kamphuis cBm, Looman c, Giskes K, Huisman m, Narayan Km, mackenbach Jp & Brug J (2007). Aging, Retirement, and changes in physical Activity: prospective cohort Findings from the GLOBE Study. American Journal of Epidemiology, 165(12):1356-63.
Kamphuis_09.indd 289 20-8-2008 10:34:54

290 Publications
2006Kamphuis cBm, Giskes K, de Bruijn GJ, wendel-Vos w, Brug J & Van Lenthe FJ (2006). Environmental determinants of fruit and vegetable consumption among adults: a systematic review. British Journal of Nutrition, 96(4):620-635.
Kamphuis cBm & Van der Horst KA (2006). Voedingsgedrag en de leefom-geving. Voeding Nu, Februari:18-21.
Van Lenthe FJ, Huisman m, Kamphuis cBm, Giskes K, Brug J and macken-bach Jp (2006). Een beoordelingsinstrument van fysieke en sociale buurtkenmerken die gezondheid stimuleren danwel belemmeren. Den Haag: Stimuleringsfonds OGZ.
2005Kamphuis cBm & Van Lenthe FJ (2005). Environmental determinants of diet and physical activity: an international expert meeting. In Brug & Van Lenthe (eds). Environmental determinants and interventions for physical activity, nutrition and smoking: a review. Den Haag: Zonmw.
Giskes K, Kamphuis cBm, et al. (2005). potential environmental determi-nants of selected dietary behaviours in adults. In Brug & Van Lenthe (eds). Environmental determinants and interventions for physical activity, nutrition and smoking: a review. Den Haag: Zonmw.
SubmittedKamphuis cBm, Van Lenthe FJ, Giskes K, Brug J, mackenbach Jp. Socioeco-nomic differences in lack of recreational walking among older adults: media-tion of neighbourhood perceptions and individual cognitions. (under review with IJBNPA)
Kamphuis cBm, Van Lenthe FJ, Giskes K, Huisman m, Brug J, mackenbach Jp. Short report – Neighbourhood factors and inequalities in sports activity: need for specificity in outcomes (under review with Br Journal of Sports Med)
Kamphuis cBm, mackenbach Jp, Giskes K, Huisman m, Brug J, Van Lenthe FJ. why do poor people perceive poor neighbourhoods? Explaining socioeco-nomic differences in neighbourhood perceptions with objective neighbourhood features and psychosocial characteristics (submitted to Health & Place)
Van Lenthe FJ, Kamphuis cBm, Giskes K, Looman cwN, Huisman m, Brug J & mackenbach Jp. Investigating the contribution of environmental characteristics to socioeconomic inequalities in health-related behaviour in the GLOBE study: theoretical framework and study design (submitted to BMC Public Health)
Kamphuis_09.indd 290 20-8-2008 10:34:54
Copyright © 2022 FDOKUMEN