
Poly(3,4-ethylenedioxithiophene)/MnO2 composite electrodes for electrochemical capacitors
Upload
independentCategory
view
0download
0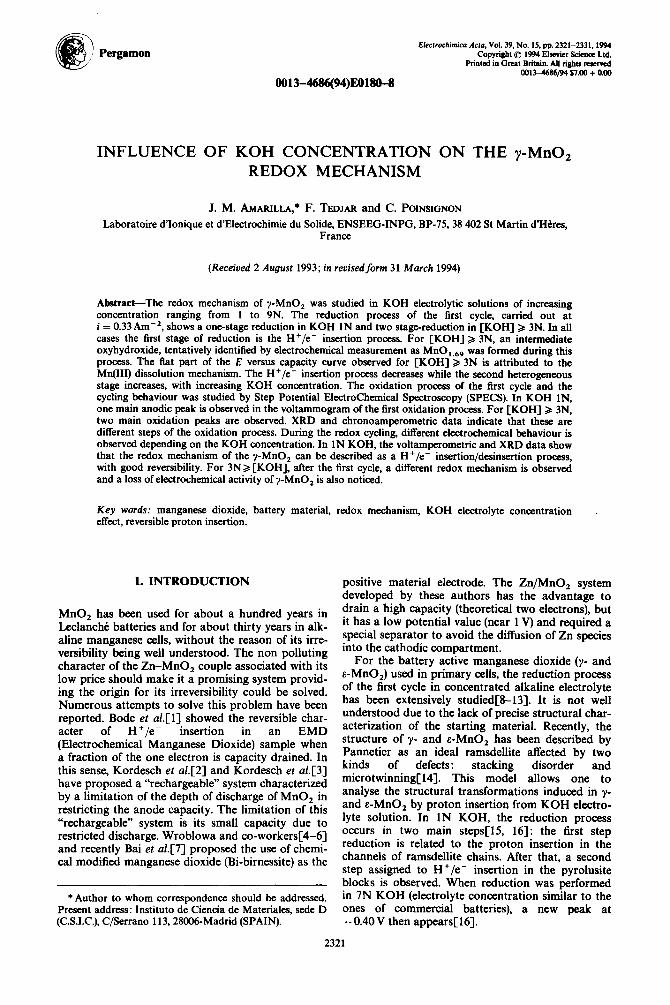
Electrochimic~ Acto. Vol. 39. No. 15. mx 2321-2331. 1994 Pergamon
0013-46%(94)E0189-8
INFLUENCE OF KOH CONCENTRATION REDOX MECHANISM
COpytight’ lti Eilcvicr Sci& Lttt. hinted ia Great Britaia AU ri&tta mmwd
0013-4666,?W $7.00 + 0.00
ON THE y-MnO,
J. M. AYARILLA,* F. TEDJAR and C. POINSIGNON
Laboratoire d’Ionique et d’Electrochimie du Solide, ENSEEG-INPG, BP-75,38 402 St Martin d’Hlres, France
(Received 2 August 1993; in revisedform 31 March 1994)
Abstract-The redox mechanism of y-MnO, was studied in KOH electrolytic solutions of increasing concentration ranging from 1 to 9N. The reduction process of the first cycle, carried out at i = 0.33 Am-‘, shows a one-stage reduction in KOH 1N and two stage-reduction in [KOH] > 3N. In all cases the first stage of reduction is the H+/e- insertion process. For [KOH] 3 3N, an intermediate oxyhydroxide, tentatively identified by electrochemical measurement as MnO,,,, was formed during this process. The flat part of the E versus capacity curve observed for [KOH] > 3N is attributed to the Mn(II1) dissolution mechanism. The H+/e- insertion process decreases while the second heterogeneous stage increases, with increasing KOH concentration. The oxidation process of the first cycle and the cycling behaviour was studied by Step Potential ElectroChemical Spectroscopy (SPECS). In KOH lN, one main anodic peak is observed in the voltammogram of the first oxidation process. For [KOH] > 3N, two main oxidation peaks are observed. XRD and chronoamperomettic data indicate that these are different steps of the oxidation process. During the redox cycling, different electrochemical behaviour is observed depending on the KOH concentration. In 1N KOH, the voltamperometric and XRD data show that the redox mechanism of the y-MnO, can be described as a H+/e- insertion/desinsertion process, with good reversibility. For 3N 2 [KOH], after the first cycle, a different redox mechanism is observed and a loss of electrochemical activity of y-MnO, is also noticed.
Key words: manganese dioxide, battery material, redox mechanism, KOH electrolyte concentration effect, reversible proton insertion.
1. INTRODUCTION
MnO, has been used for about a hundred years in Leclancht batteries and for about thirty years in alk- aline manganese cells, without the reason of its irre- versibility being well understood. The non polluting character of the Zn-MnO, couple associated with its low price should make it a promising system provid- ing the origin for its irreversibility could be solved. Numerous attempts to solve this problem have been reported. Bode et al.[l] showed the reversible char- acter of H+/e- insertion in an EMD (Electrochemical Manganese Dioxide) sample when a fraction of the one electron is capacity drained. In this sense, Kordesch et aI.[2] and Kordesch et a!.[33 have proposed a “rechargeable” system characterized by a limitation of the depth of discharge of MnO, in restricting the anode capacity. The limitation of this “rechargeable” system is its small capacity due to restricted discharge. Wroblowa and co-workers[4-61 and recently Bai et al.[7] proposed the use of chemi- cal modified manganese dioxide (Bi-birnessite) as the
* Author to whom correspondence should be addressed. Present address: Instituto de Ciencia de Materiales, sede D (C.S.I.C.), C/Serrano 113,28OOf5-Madrid (SPAIN).
positive material electrode. The Zn/MnO, system developed by these authors has the advantage to drain a high capacity (theoretical two electrons), but it has a low potential value (near 1 V) and required a special separator to avoid the diffusion of Zn species into the cathodic compartment.
For the battery active manganese dioxide (y- and s-MnO,) used in primary cells, the reduction process of the first cycle in concentrated alkaline electrolyte has been extensively studied[8-131. It is not well understood due to the lack of precise structural char- acterization of the starting material. Recently, the structure of y- and s-MnO, has been described by Pannetier as an ideal ramsdellite affected by two kinds of defects : stacking disorder and microtwinning[14]. This model allows one to analyse the structural transformations induced in y- and s-MnO, by proton insertion from KOH electro- lyte solution. In 1N KOH, the reduction process occurs in two main stepsC15, 161: the first step reduction is related to the proton insertion in the channels of ramsdellite chains. After that, a second step assigned to H+/e- insertion in the pyrolusite blocks is observed. When reduction was performed in 7N KOH (electrolyte concentration similar to the ones of commercial batteries), a new peak at -0.4OV then appears[l6].
2321
2322 J. M. AMARILLA et al.
Kozawa and Yeager[lO] already observed similar results in reducing thin films of electrolytic man- ganese dioxide (EMD) deposited on a glassy carbon electrode in 0.01, 1 and 9N KOH. They concluded that different reduction mechanisms existed. For all KOH concentrations tested a homogeneous step is observed, alter that, only for 9N KOH, a heter- ogeneous step involving the solubilisation of Mn(III) species was noticed. Kang and Liang[ 17, 181 report- ed a different re-oxidation process between 1 and 9N KOH, and noticed an increase of the electrochemical yield when the KOH electrolyte concentration decreases.
The different electrochemical behaviour of the battery active manganese dioxide observed in this KOH electrolyte concentration range, the very few works devoted to the cycling behaviour and the great interest of this compound as positive material in Zn-MnO, systems, justifies a systematic study of the influence of KOH concentration on the y-MnO, redox mechanism.
2. EXPERIMENTAL
The y-MnO, sample used, synthesized by chemical precipitation (CMD type), is commercialized by Sedema under the grade label WSA. Chemical analysis shows: the MnO, percentage = 93.2, the Mn percentage = 60.7 and the O/Mn ratio = 1.97. The electrochemical studies were performed using the multichannel galvanostatic/potentiostatic system Mac Pile@ developed for intercalation kinetics studies. The reduction process of first cycle was carried out at a constant current density i = 0.33 Am-* (0.66mAg- ’ of MnO,) from the equilibrium potential,* E,, , to a value of -0.8 V vs. Hg-HgO. The oxidation process and cycling behav- iour of the y-MnO, (CMD type) was performed by Step Potential ElectroChemical Spectroscopy (SPECS) which is a combination of very slow scan- ning voltammetry and potentiostatic intermittent titration technique (PITT). Mac Pile’s’ controls the potential step by step and during each step, the potential is fixed at a constant value and the evolu- tion of increments in charge (30pA h in our work) is recorded versus time. The voltammograms are built point by point. Each intensity point is obtained as the sum of the increments in charge recorded during the potential step and divided by the time of this step. The scan rate used, 1OmV h- 1 (0.028 mV s- ‘), ensures the response of the bulk material. A three ‘electrode, one compartment cell is used. This cell configuration (Fig. la and b) is usually adopted for corrosion or metals plating studies because the development of soluble species during the redox study, is favoured. The KOH electrolyte concentra- tions used were 1, 3, 5, 7 and 9N in a volume of 70cm3. In order to observe deposition of soluble products without loss of solid material the composite mix [MnO, (50 mg)/carbon black in ratio of 2/l] was pressed between two nickel foam plates (Fig. lb).
* E,, = The rest potential recorded before the beginning of reduction.
W.E RE
a
/ KOH
b Ref. Elect.
Fig. 1. (a) Experimental cell used for electrochemical studies. (b) Detail of the working electrode.
The counter-electrodes were two nickel plates posi- tioned on each side of the working electrode. Poten- tials were measured versus an Hg-HgO reference electrode, filled with the same KOH electrolyte con- centration as the one used in the cell, in order to minimize the junction potential. The temperature was kept constant at 15°C during all the experiment.
3. RESULTS
3.1. Reduction process of thejrst cycle
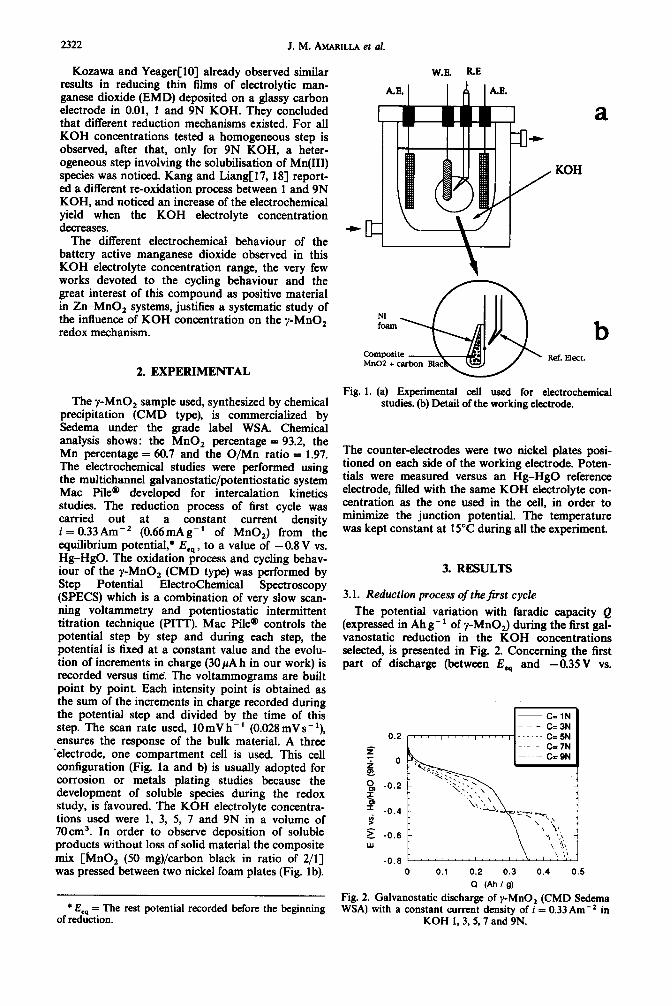
The potential variation with faradic capacity Q (expressed in Ah g-i of y-MnO,) during the first gal- vanostatic reduction in the KOH concentrations selected, is presented in Fig. 2. Concerning the first part of discharge (between E,, and -0.35V vs.
0.2 0.3
Q (Ah 19)
Fig. 2. Galvanostatic discharge of y-MnO, (CMD Sedema WSA) with a constant current density of i = 0.33Amm2 in
KOH 1,3,5,7 and 9N.
The y-MnO, redox mechanism 2323
-4 a
-0.4 -0.3 -0.2 -0.1 0 0.1 0.2 IO.4 -0.3 -0.2 -0.1 0 0.1 0.2
E (V) vs Hg-HgO (3N) E (V) vs Hg-HgO (SN)
0.6
.0.4 -0.3 -0.2 -0.1 0 0.1 0.2 -0.4 .0.3 -0.2 .O.l 0 0.1 0.2
E (V) vs Hg-HgO (7N) E (V) vs Hg-HgO (9N)
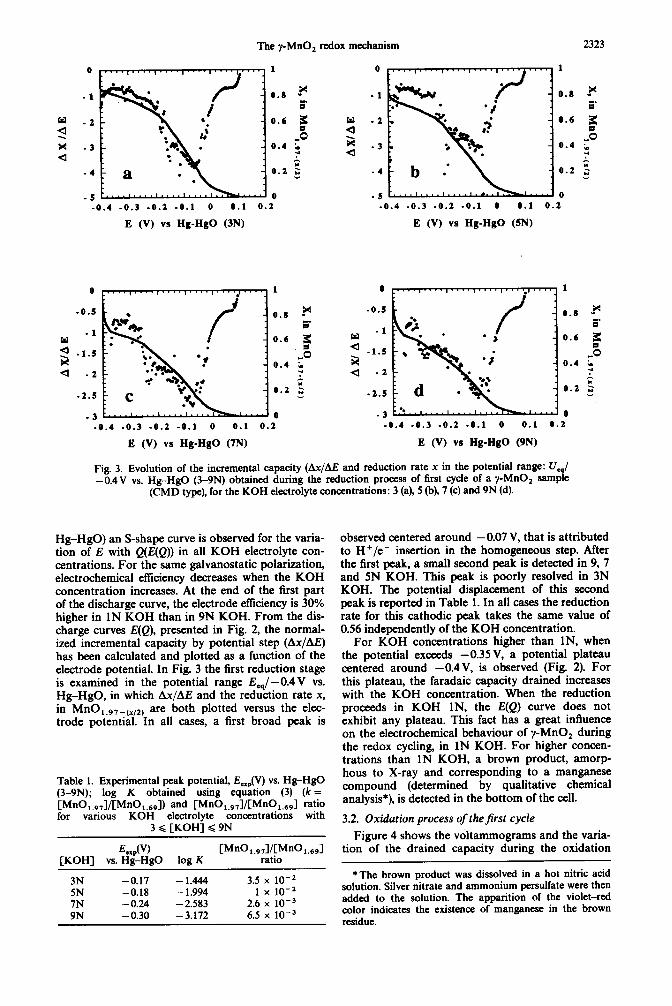
Hg-HgO) an S-shape curve is observed for the varia- tion of E with Q@(Q)) in all KOH electrolyte con- centrations. For the same galvanostatic polarization, electrochemical efftciency decreases when the KOH concentration increases. At the end of the first part of the discharge curve, the electrode efficiency is 30% higher in 1N KOH than in 9N KOH. From the dis- charge curves E(Q), presented in Fig. 2, the normal- ized incremental capacity by potential step (Ax/AE) has been calculated and plotted as a function of the electrode potential. In Fig. 3 the first reduction stage is examined in the potential range E,,/-0.4V vs. Hg-HgO, in which Ax/AE and the reduction rate x,
in MnO1.s,-(X,Z, are both plotted versus the elec- trode potential. In all cases, a first broad peak is
Table 1. Experimental peak potential, E,,,(V) vs. Hg-HgO (3-9N); log K obtained using equation (3) (k = CM~%,1/CM~%d) and CM~%.dCM~%,l ratio for various KOH electrolyte concentrations with
3 c fKOH1 Q 9N
Fig. 3. Evolution of the incremental capacity (Ax/AE and reduction rate x in the potential range: U, / -0.4V vs. Hg-HgO (3-9N) obtained during the reduction process of first cycle of a y-MnO, sample
(CMD type), for the KOH electrolyte concentrations: 3 (a), 5 (b), 7 (c) and 9N (d).
E,,,(V) CM~%,1/CM~%691 [KOH] vs. Hg-HgO log K ratio
3N -0.17 - 1.444 3.5 x 1o-2 5N -0.18 - 1.994 1 x 1o-2 7N -0.24 - 2.583 2.6 x lo-’ 9N -0.30 -3.172 6.5 x 1O-3
observed centered around -0.07 V, that is attributed to H+/e- insertion in the homogeneous step. After the first peak, a small second peak is detected in 9, 7 and SN KOH. This peak is poorly resolved in 3N KOH. The potential displacement of this second peak is reported in Table 1. In all cases the reduction rate for this cathodic peak takes the same value of 0.56 independently of the KOH concentration.
For KOH concentrations higher than lN, when the potential exceeds -0.35V, a potential plateau centered around -0.4V, is observed (Fig. 2). For this plateau, the faradaic capacity drained increases with the KOH concentration. When the reduction proceeds in KOH lN, the E(Q) curve does not exhibit any plateau. This fact has a great influence on the electrochemical behaviour of y-MnO, during the redox cycling, in 1N KOH. For higher concen- trations than 1N KOH, a brown product, amorp- hous to X-ray and corresponding to a manganese compound (determined by qualitative chemical analysis*), is detected in the bottom of the cell.
3.2. Oxidation process of thejrst cycle
Figure 4 shows the voltammograms and the varia- tion of the drained capacity during the oxidation
*The brown product was dissolved in a hot nitric acid solution. Silver nitrate and ammonium persulfate were then added to the solution. The apparition of the violet-red color indicates the existence of manganese in the brown residue.
2324 J. M. AMARILLA et al.
-0.4 -0.2 0 0.2 0.4
Poteatlal, V vs. Hg-HgO (1N)
-0.4 -0.2 0 0.2 0.4"
Potential, V vs. Hg-HgO (3N)
-0.4 -0.2 0 0.2 0.4 -0.4 -0.2 0 0.2 0.4
Potential, V vs Hg-HgO (5N) Potential, V vs Hg-HgO (9N)
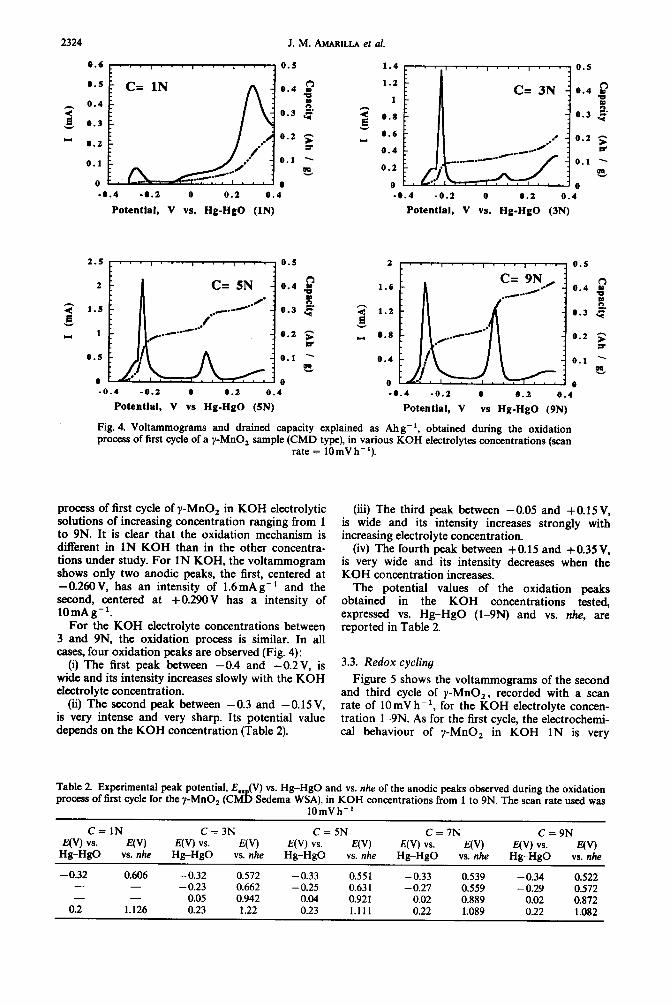
Fig. 4. Voltammograms and drained capacity explained as Ahg-‘, obtained during the oxidation process of first cycle of a y-MnO, sample (CMD type), in various KOH electrolytes concentrations (scan
rate = 1OmV h-l).
process of first cycle of y-MnO, in KOH electrolytic solutions of increasing concentration ranging from 1 to 9N. It is clear that the oxidation mechanism is different in 1N KOH than in the other concentra- tions under study. For 1N KOH, the voltammogram shows only two anodic peaks, the first, centered at -0.26OV, has an intensity of 1.6mAg-’ and the second, centered at +0.29OV has a intensity of lOmAg_‘.
For the KOH electrolyte concentrations between 3 and 9N, the oxidation process is similar. In all cases, four oxidation peaks are observed (Fig. 4):
(i) The first peak between -0.4 and -0.2 V, is wide and its intensity increases slowly with the KOH electrolyte concentration.
(ii) The second peak between -0.3 and - 0.15 V, is very intense and very sharp. Its potential value depends on the KOH concentration (Table 2).
(iii) The third peak between -0.05 and +0.15 V, is wide and its intensity increases strongly with increasing electrolyte concentration.
(iv) The fourth peak between +0.15 and +0.35 V, is very wide and its intensity decreases when the KOH concentration increases.
The potential values of the oxidation peaks obtained in the KOH concentrations tested, expressed vs. Hg-HgO (l-9N) and vs. nhe, are reported in Table 2.
3.3. Redox cycling
Figure 5 shows the voltammograms of the second and third cycle of y-MnO,, recorded with a scan rate of 10 mV h- I, for the KOH electrolyte concen- tration l-9N. As for the first cycle, the electrochemi- cal behaviour of y-MnO, in KOH 1N is very
Table 2. Experimental peak potential, E,,,,(V) vs. Hg-HgO and vs. nhe of the anodic peaks observed during the oxidation process of first cycle for the y-MnO, (CMD Sedema WSA), in KOH concentrations from 1 to 9N. The scan rate used was
IOmVh-’
C=lN C = 3N C = SN C = 7N C=9N E(V) vs. E(V) E(V) vs. E(V) E(V) vs. E(V) E(V) vs.
Hg-HgO E(V) E(V) vs.
vs. nhe E(V)
Hg-HgO vs. nhe Hg-HgO vs. nhe Hg-HgO vs. nhe Hg-HgO vs. nhe
-0.32 0.606 -0.32 0.572 -0.33 0.551 -0.33 0.539 -0.34 0.522 - - -0.23 0.662 -0.25 0.63 1 -0.27 0.559 - 0.29 0.572 - - 0.05 0.942 0.04 0.921 0.02 0.889 0.02 0.872
0.2 1.126 0.23 1.22 0.23 1.111 0.22 1.089 0.22 1.082

The y-MnO, redox 2325
0.4
0.3
z 0.2
g_ 0.1
- 0
-0.1
-0.2
-0.3
-0.6 -0.6 -0.4 -0.2 0 0.2 0.4
Potential, V vs. Hg/HgO (1N)
1 E ..‘,...I.. I ‘.“‘.“““,
0.5 c==5A/ 0
z -0.5
d -1
_ -1.5
hi 3 scan
?, , . . . , . , , , , . j - Pscan
z -0.2
.E_ -0.4
- -0.6
-0.6
-1
-1.2 F. ” ‘. . . ‘. J* ’ * * “. . . ’ . . -0.6 -0.6 -0.4 -0.2 0 0.2 0.4
Potential, V vs. Hg/HgO (3N)
z E
-0.8 -0.6 -0.4 -0.2 0 0.2 0.4 -0.6 -0.6 -0.4 -0.2 0 0.2 0.4
Potential, V vs. Hg/HgO (5N) Potential, V vs. Hg/HgO (9N) Fig. 5. Voltammograms obtained for the second and third cycle of y-MnO, (CMD Se&ma WSA) in
various KOH electrolyte concentrations (scan rates of 1OmV h-l).
different from the one observed for the more concen- trated KOH solutions tested, proving a different redox mechanism. In 1N KOH, the redox peaks obtained during the cycling are similar in shape and potential as the ones observed during the first cycle. A low decrease of current is noticed during the redox cycling.
With KOH concentrations 23N, the reduction process of the second cycle is very different from the one occurring during the first cycle (Figs 3 and 5). Two peaks are observed during the second cathodic reduction. The first peak, centered around -0.3 V is sharp and very intense; the second peak, in the -0.6 to 0.8 V potential region is wide and weak. For both, their intensity increases with the KOH concentra- Con. Furthermore, the peaks observed during the oxidation process of the second cycle are similar to the ones observed during the first anodic polariza- tion (Figs 4 and 5). In general, the intensity of these peaks is lower than the one recorded during the first cycle, dnly in 3N KOH, the sharp peak normally observed on the oxidation voltammogram of the first cycle given on Fig. 4, is no longer observed.
For the third redox cycle, very low electrochemical activity is observed in 3N KOH (Fig. 5). The compa- rative study of the voltammograms obtained shows that, in SN KOH, the third cycle is very similar to the second cycle of y-MnO, in 3N KOH, with a strong diminution of the cathodic peaks and the dis-
appearance of the sharp anodic peak centered at -0.24V (Fig. 5). In 7 and 9N KOH, similar behav- iour is observed, characterized by a important dimi- nution of the intensity of peaks.
Table 3 provides the drained capacity after each reduction and oxidation process of the redox cycling, for the KOH concentrations tested. In general, the capacity values obtained are very high, favored by the slow scan rate used. For the KOH solution of concentrations higher than 1N and for the same cycle, an increment of the Q (Ahg-‘) value is observed with the increase of the electrolyte concen- tration. From one cycle to the other, an important diminution of the faradic capacity values is noticed. For 1N KOH, this diminution of capacity during the redox cycling is less important. It is interesting to notice that in the potential range explored, the re- oxidation of the y-MnO, is not complete (Fig. 5). It is reasonable to suppose that a larger anodic cut-off potential, increases the drained capacity during the redox cycling in 1N KOH.
3.4. Chronoamperogrbms
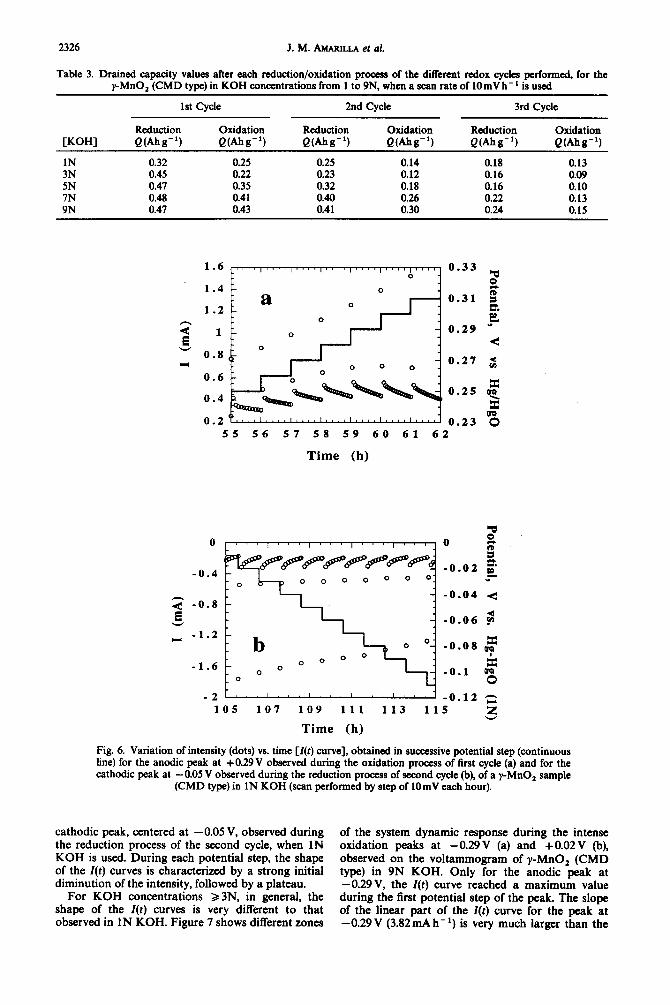
Figure 6 shows details between +0.25/+0.31 V and -O.Ol/-0.11 V, of the 1(t) curves obtained for: (a) the anodic peak, centered at -0.29V, observed during the oxidation process of first cycle and (b) the
2326 J. M. AULW et al.
Table 3. Drained capacity values after each reduction/oxidation process of the different redox cycles performed, for the y-MnO, (CMD type) in KOH concentrations from 1 to 9N, when a scan rate of 1OmV h-’ is used
CKOHI
1st Cycle 2nd Cycle 3rd Cycle
Reduction Oxidation Reduction Oxidation Reduction Oxidation Q(Ahg-'1 QMs-') QNs-') QWg-'1 QWg-'1 QWs-'1
1N 0.32 0.25 0.25 0.14 0.18 0.13 3N 0.45 0.22 0.23 0.12 0.16 0.09 5N 0.47 0.35 0.32 0.18 0.16 0.10 7N 0.48 0.41 0.40 0.26 0.22 0.13 9N 0.47 0.43 0.41 0.30 0.24 0.15
1.6 0.33
1.4 0.31
1.2
1 0.29
0.8 0.27
0.6
0.4 0.25
0.2 0.23 55 56 57 58 59 60 61 62
Time (h)
2 -0.8
5 _ -1.2
-1.6
-i 4 -0.06 3
105 107 109 111 113 115 z
Time (h)
Fig. 6. Variation of intensity (dots) vs. time [I(t) curve], obtained in successive potential step (continuous line) for the anodic peak at +0.29V observed during the oxidation process of first cycle (a) and for the cathodic peak at - 0.05 V observed during the reduction process of second cycle (b), of a y-MnO, sample
(CMD type) in 1N KOH (scan performed by step of 1OmV each hour).
cathodic peak, centered at -0.05 V, observed during the reduction process of the second cycle, when 1N KOH is used. During each potential step, the shape of the I(t) curves is characterized by a strong initial diminution of the intensity, followed by a plateau.
For KOH concentrations 83N, in general, the shape of the I(t) curves is very different to that observed in 1N KOH. Figure 7 shows different zones
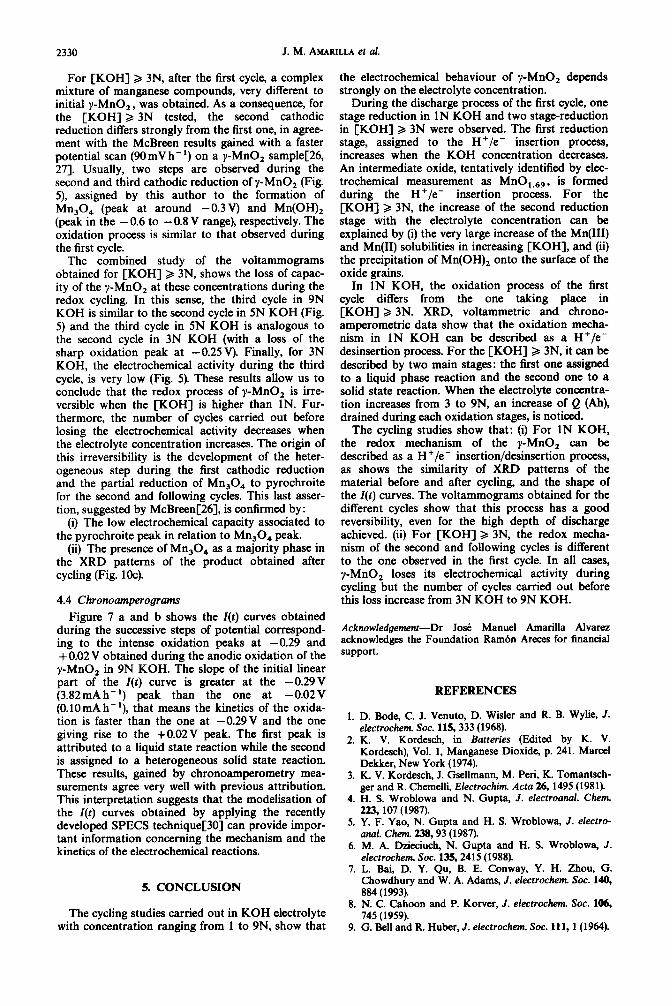
of the system dynamic response during the intense oxidation peaks at -0.29 V (a) and +0.02 V (b), observed on the voltammogram of y-MnO, (CMD type) in 9N KOH. Only for the anodic peak at -0.29V, the I(t) curve reached a maximum value during the first potential step of the peak. The slope of the linear part of the I(t) curve for the peak at -0.29 V (3.82mA h-r) is very much larger than the

The y-MnO, redox mechanism 2327
-0.24 2
-0.26 i.
r -0.28
4
-0.32 3 k
-0.34 "0 4 5 6 7 8 9 10 1112
Time (h)
1.6
2 1.2
.5 _ 0.8
0.4
0
0.1 3
0.06 f C.
,=
0.02 4
;
-0.02 m aa
X -0.06 "0
35 37 39 41 43 45
Time (h)
Fig. 7. I(r) curves (dots) obtained in successive potential steps (continuous line) for the anodic peaks centered at +0.29 (a) and +O.O2V (b), obtained during the first oxida- tion process of a y-MnO, sample (CMD type) in 9N KOH
(scan rate = 10 mV h - I).
peak at +0.02 V (O.lOmA h- i). Similar results are obtained with the other KOH concentrations >3N tested.
4. DISCUSSION
4.1. Reduction process of the first redox cycle
Constant-current reduction curves for composite MnO,-carbon black electrode show two discharge steps in KOH 3 3N and only one discharge step in 1N KOH (Fig. 2). These observations were already reported by Kozawa and co-workers[lO-121 on the graphite plated electrode (thickness of MnO, depos- ited =13 x 10e4cm) and by Kang and Liang*[17]. The shape of the discharge curve obtained in this work, using composite electrodes, is similar to the one gained before by Kozawa and Yeager[lO].
The first discharge step (from E,, to -0.35 V vs. Hg-HgO) is related to a homogeneous phase reduction (namely the H+/e- insertion process). During constant-current polarization, plotted in Fig. 2 for the same cathodic potential (-0.2V vs. Hg- HgO), electrochemical efficiency decreased from 0.25Ah gg’ of y-MnO, in 1N KOH to O.l4Ahg-’ y-MnO, in 9N KOH. This observation shows that solid-state reduction is influenced by the KOH con-
* By means of the current and the surface of the elec- trode used in Kang’s experiment, the thickness of MnO, layer is estimated around 3 x 10⁻⁴cm.
centration. The electrode seems to have a higher impedance when the KOH concentration is increased: for example under galvanostatic condi- tions, when 0.2Ahg-’ of y-MnO, was drained, the electrode potential reached a value of -0.13 V in 1N KOH and -0.36V in 9N KOH. Linear relation- ships are observed between drained capacity (at -0.2 V/Hg-HgO) or polarization (when 0.2 Ah g- 1 of y-MnO, are drained) and KOH concentration (Fig. 8). According to Qu et aI.[19], it is reasonable to assume that during the y-MnO, reduction, a small quantity of the formed MnOOH is dissolved. The longer time used in this work to achieve the cathodic reduction of y-MnO,, favors the dis- mutation of the Mn(II1) dissolved species. This dis- mutation can explain the formation of &MnO, described by Holton et ~I.[203 and Maclean[21] when MnO, samples, reduced by a chemical method, are stored in concentrated KOH solution for extended periods. The deposition of this material on the electrode surface can justify the increase of its resistivity. According to the proposed mechanism, the increase of the Mn(II1) solubility on increasing the KOH concentration[22] favors the &MnO, for- mation, and explains the increase of the electrode polarization with the electrolyte concentration. The very small solubility of Mn(II1) in 1N KOH[22] tends to avoid the formation of &MnO, and leads to the higher observed capacity in the first stage of the discharge: at -0.4V, 300mA hg-’ MnO, was drained against 210 mA h g- ’ MnO, in 9N KOH.
For KOH concentrations > 3N, a second peak for Ax/AE around -0.2V vs. Hg-HgO is noticed (Fig. 3). It is important to show that the corresponding reduction rate x takes the same value of 0.56 inde- pendently of the KOH concentration. This experi- mental fact suggests that the reduction of y-MnO, in alkaline media takes place via an intermediate com- pound. Even if the main first stage for y-MnO, reduction occurs via the well-known solid-state reac- tion with H+/e- insertion, it is evident that the reduction process can also lead to the formation of a complex manganese oxyhydroxide.
This assertion has been confirmed by several authors and, particularly Scott’s studies[23], on the discharge of MnO, and the recovery characteristics,
0.24 7, 0 f
\3{ 2 o.,2 I I I. ! I _o.5 ,
0 2 4 6 8 10 4
KOH Concentration (eqvll)
Fig. 8. Electrode polarization vs. KOH concentration when 200 mA h g- I was drained (circle points) and drained capacity vs. KOH concentration under -200mV of polar- ization (square points), for a y-MnO, sample (CMD type).
2328 J. M. AMARILLA et al.
explain as potential-time curves. Maskell et a[.[133 notice that the properties of the cathodic composite mixture changes around x = 1.75 and these authors suggested that the Mn,O, (explained as MnO,,,,) is midway between ramsdellite and groutite. Boden et aI.[24], from X-ray diffraction, concluded that during discharge of y-MnO,, the formation of an amorphous phase occurred before the appearance of Mn,O,. The process takes place according to equa- tion (1).
MnO, + nH+ + ne- + MnO,_,,(OH),, (1)
and an intermediate compound identified as MnOi.,, was reported. For deeper discharge, MnJO, appears. Cahoon and Korver et aI.[8], using both X-ray diffraction and chemical analysis, deter- mined Mn,O, as intermediate product. Bell and Huber[9] proposed MnO,., as intermediate and found two stages in the discharge during the homo- geneous step. Boden et ~I.[241 showed that during the discharge process of MnO, , two steps take place corresponding to MnOZ/MnO1., and MnO,.,/Mn,O, (mixed with y-Mn,O,).
Consequently this intermediate in the early stage of discharge was tentatively identified as: l MnO,.,, by Cahoon and Korver[S] and
Maskel et aI.[13]. l MnO,,, by Bell and Huber[9]. l MnO i.a2 by Boden et aI.[24]. Regardless of the proposed stoichiometries, all the
authors agree with the fact that this intermediate is badly crystallized.
In our experiments, the influence of KOH concen- tration is also outlined in Fig. 3 where the potential of the second peak is shifted to lower potentials with increasing KOH concentrations. Taking account of the reduction rate associated to the second cathodic peak (x = 0.56) and the initial stoichiometry of the y-MnO, employed (CMD Sedema WSA with x’ in MnO,, = 1.97), the first reduction of this material (written with the simplest formula) leading to the intermediate species already described can occur according to equation (2):
MnO 1,97 + 0.56(H+ + e-) + MnO,.,, + 0.28H,O.
(2)
The reaction is characterized by its thermodyna- mic potential given by equation (3):
RT E=E’+- CMnO,.,-J
0.56F In [MnO,,,,] - 0.06 pH. (3)
Using the determined value of the peak potential from Fig. 3 the ratio MnO,,,,/MnO,,,g is gained from equation (3) as reported in Table 1. From the E peat value (Table 1) for each KOH concentration, the quantity of the intermediate oxyhydroxide Mn01.,9 seems to be more important in 9N KOH than in 3N KOH, and seems to be more stable in higher KOH concentration.
During the second discharge stage of the reduction, the S-shape curve is maintained in 1N KOH but disappears in [KOH] 2 3N. For these later electrolyte concentrations, the flat discharge curve, centered at -0.4V (Fig. 2), is the consequence
of a mechanism involving a biphasic system. This suggests the co-existence of different oxides (oxyhydroxides) of lower oxidation states. Kozawa and Yeager[lO, 123 described the mechanism of this second discharge step as a complex process of:
Dissolution of MnOOH +
Reduction in liquid phase
+ Precipitation of Mn(OH), .
According to Bai et a/.[73 and to Kosawa and Yeager[lZ], the reduction step in liquid phase can be described with the chemical equation (4):
Mn(OH)g- + e- + Mn(OH):- + 20H-. (4)
The solubility properties of Mn(II1) and Mn(I1) species were already measured by Kozawa et al.[22]. These authors reported that the solubility of the Mn(II1) and Mn(I1) species in 1N KOH, is very low. This fact justifies the non-existence of the second reduction stage for the KOH concentration. For [KOH] 2 3N, the increase of this heterogeneous stage with the electrolyte concentration can be explained by (i) the very large increase of Mn(II1) and Mn(I1) solubilities when the [KOH] increases and (ii) the precipitation of Mn(OH), onto the surface of the oxide grains.
4.2. Oxidation process of thefirst redox cycle
The differences observed between the voltam- mograms recorded during the first anodic oxidation in IN KOH and in the other concentrations tested (Fig. 4), show that the oxidation mechanism of y- MnO, in 1N KOH is different. Similar results were already reported by Kang and Liang[17, 181 during cycling of a MnO, sample obtained by electrochemi- cal deposition (EMD type).
In 1N KOH, during the cathodic reduction of y- MnO, (CMD Sedema WSA), an homogeneous step, assigned to H+/e- insertion, is only observed. That allows that the wide peak centered at -0.29V (Fig. 4) observed during the oxidation of y-MnO, in 1N KOH, can be assigned to the reversible H+/e- desinsertion from the material. Two experimental facts confirm this hypothesis:
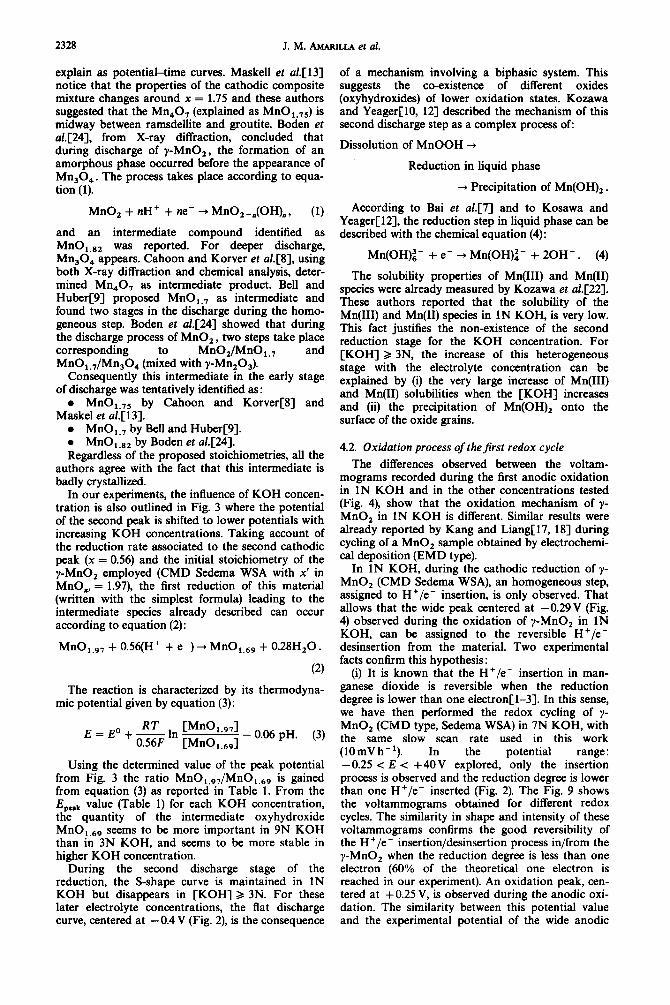
(i) It is known that the H+/e- insertion in man- ganese dioxide is reversible when the reduction degree is lower than one electron[ l-31. In this sense, we have then performed the redox cycling of y- MnO, (CMD type, Sedema WSA) in 7N KOH, with the same slow scan rate used in this work (lOmVh-‘). In the potential range : -0.25 < E < + 40 V explored, only the insertion process is observed and the reduction degree is lower than one H+/e- inserted (Fig. 2). The Fig. 9 shows the voltammograms obtained for different redox cycles. The similarity in shape and intensity of these voltammograms confirms the good reversibility of the H+/e- insertion/desinsertion process in/from the y-MnO, when the reduction degree is less than one electron (60% of the theoretical one electron is reached in our experiment). An oxidation peak, cen- tered at + 0.25 V, is observed during the anodic oxi- dation. The similarity between this potential value and the experimental potential of the wide anodic
The y-MnO, redox mechanism 2329
0.6
0.4
0.2 i
0
-0.2
-0.4
-0.6
-O.St”““““““““” -0.4 -0.2 0 0.2 0.4 0.6
Potential, V vs Hg-HgO Fig. 9. Voltammograms obtained during the redox cycling of a y-MnO, sample (CMD type) in 7N KOH, when a cut-off potential of -0.25V vs. Hg-HgO (7N) and a scan rate of 1OmV h- ’ is used. In this potential range less than
one H+/e- inserted in the material.
peak obtained during the oxidation process in 1N KOH (Fig. 4), confirms the proposed attribution.
(ii) The shape of the Z(t) curves obtained during each potential step for this anodic peak (Fig. 6a), is observed when the process is under diffusion contro1[25]. In our case, it can be attributed to H+/e- desinsertion from the y-MnO, .
For [KOH] >, 3N, all the voltammograms obtained exhibit two main peaks (Fig. 4), being the only differences the increase of the charge quantity transferred and the shift of the potential values (Table 2) when increasing the electrolyte concentra- tion. This result shows that the same oxidation mechanism takes place for these concentrations.
The shape of the intense peak around -0.25V (sharp and asymmetric), suggested a heterogeneous process. This stage can be related to the second step of the reduction process (equation 4), and conse- quently this oxidation mechanism can be expressed by scheme 1. According to McBreen[ZB, 271, Mon- doloni et a1.[28] and Kang and Liang[18], the Mn(II1) compounds obtained after this oxidation step are different to the oxyhydroxide obtained before the second stage of cathodic polarization. This fact can justify the evolution of the potential value with the KOH concentration.
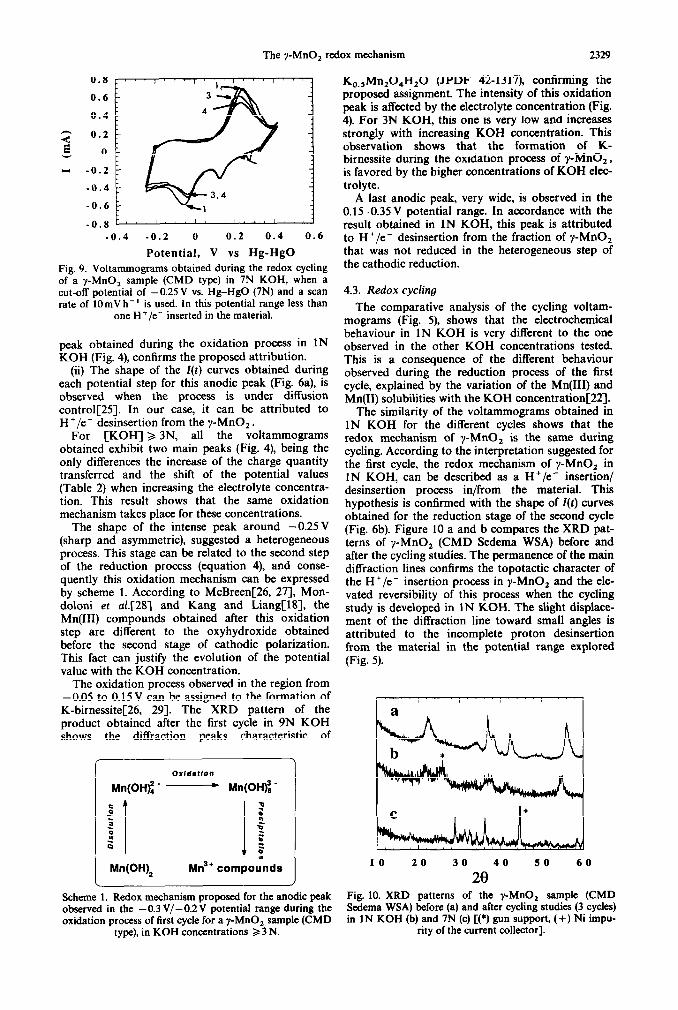
The oxidation process observed in the region from -0.05 to 0.15 V can be assigned to the formation of K-birnessiteC26, 291. The XRD pattern of the product obtained after the first cycle in 9N KOH shows the diffraction peaks characteristic of
OXldStfOll
Mn(OH): _ - Mn(OH$ _
Mn(W3 Mn3’ compounds L
10 20 30 40 50 60
28 Scheme 1. Redox mechanism proposed for the anodic peak Fig. 10. XRD patterns of the y-MnO, sample (CMD observed in the -0.3 V/-0.2V potential range during the Sedema WSA) before (a) and after cycling studies (3 cycles) oxidation process of first cycle for a y-MnO, sample (CMD in 1N KOH (b) and 7N (c) [(*) gun support, (+) Ni impu-
type), in KOH concentrations 2 3 N. rity of the current collector].
K,,,Mn,O,H,O (JPDF 42-1317), confirming the proposed assignment. The intensity of this oxidation peak is affected by the electrolyte concentration (Fig. 4). For 3N KOH, this one is very low and increases strongly with increasing KOH concentration. This observation shows that the formation of K- birnessite during the oxidation process of y-MnO,, is favored by the higher concentrations of KOH elec- trolyte.
A last anodic peak, very wide, is observed in the 0.15-0.35V potential range. In accordance with the result obtained in 1N KOH, this peak is attributed to H+/e- desinsertion from the fraction of y-MnO, that was not reduced in the heterogeneous step of the cathodic reduction.
4.3. Redox cycling
The comparative analysis of the cycling voltam- mograms (Fig. 5), shows that the electrochemical behaviour in 1N KOH is very different to the one observed in the other KOH concentrations tested. This is a consequence of the different behaviour observed during the reduction process of the first cycle, explained by the variation of the Mn(II1) and Mn(I1) solubilities with the KOH concentration[22].
The similarity of the voltammograms obtained in 1N KOH for the different cycles shows that the redox mechanism of y-MnO, is the same during cycling. According to the interpretation suggested for the first cycle, the redox mechanism of y-MnO, in 1N KOH, can be described as a H+/e- insertion/ desinsertion process in/from the material. This hypothesis is confirmed with the shape of I(t) curves obtained for the reduction stage of the second cycle (Fig. 6b). Figure 10 a and b compares the XRD pat- terns of y_MnO, (CMD Sedema WSA) before and after the cycling studies. The permanence of the main diffraction lines confirms the topotactic character of the H+/e- insertion process in y-MnO, and the ele- vated reversibility of this process when the cycling study is developed in 1N KOH. The slight displace- ment of the diffraction line toward small angles is attributed to the incomplete proton desinsertion from the material in the potential range explored (Fig. 5).
2330 J. M. AMARILLA et al.
For [KOH] > 3N, after the first cycle, a complex mixture of manganese compounds, very different to initial y-MnO, , was obtained. As a consequence, for the [KOH] > 3N tested, the second cathodic reduction differs strongly from the first one, in agree- ment with the McBreen results gained with a faster potential scan (90mV h- ‘) on a y-MnO, sample[26, 271. Usually, two steps are observed during the second and third cathodic reduction of y-MnO, (Fig. 5), assigned by this author to the formation of Mn,O, (peak at around -0.3V) and Mn(OH), (peak in the -0.6 to -0.8 V range), respectively. The oxidation process is similar to that observed during the first cycle.
The combined study of the voltammograms obtained for [KOH] 2 3N, shows the loss of capac- ity of the y-MnO, at these concentrations during the redox cycling. In this sense, the third cycle in 9N KOH is similar to the second cycle in 5N KOH (Fig. 5) and the third cycle in 5N KOH is analogous to the second cycle in 3N KOH (with a loss of the sharp oxidation peak at -0.25V). Finally, for 3N KOH, the electrochemical activity during the third cycle, is very low (Fig. 5). These results allow us to conclude that the redox process of y-MnO, is irre- versible when the [KOH] is higher than 1N. Fur- thermore, the number of cycles carried out before losing the electrochemical activity decreases when the electrolyte concentration increases. The origin of this irreversibility is the development of the heter- ogeneous step during the first cathodic reduction and the partial reduction of Mn,O, to pyrochroite for the second and following cycles. This last asser- tion, suggested by McBreen[26], is confirmed by:
(i) The low electrochemical capacity associated to the pyrochroite peak in relation to Mn,O, peak.
(ii) The presence of MnJO, as a majority phase in the XRD patterns of the product obtained after cycling (Fig. 1Oc).
4.4 Chronoamperograms
Figure 7 a and b shows the I(t) curves obtained during the successive steps of potential correspond- ing to the intense oxidation peaks at -0.29 and + 0.02 V obtained during the anodic oxidation of the y-MnO, in 9N KOH. The slope of the initial linear part of the I(t) curve is greater at the -0.29V (3.82mA h-l) peak than the one at -0.02V (O.lOmA h-l), that means the kinetics of the oxida- tion is faster than the one at -0.29V and the one giving rise to the +O.O2V peak. The first peak is attributed to a liquid state reaction while the second is assigned to a heterogeneous solid state reaction. These results, gained by chronoamperometry mea- surements agree very well with previous attribution. This interpretation suggests that the modelisation of the I(t) curves obtained by applying the recently developed SPECS technique[30] can provide impor- tant information concerning the mechanism and the kinetics of the electrochemical reactions.
5. CONCLUSION
The cycling studies carried out in KOH electrolyte with concentration ranging from 1 to 9N, show that
the electrochemical behaviour of y-MnO, depends strongly on the electrolyte concentration.
During the discharge process of the first cycle, one stage reduction in 1N KOH and two stage-reduction in [KOH] > 3N were observed. The first reduction stage, assigned to the H+/e- insertion process, increases when the KOH concentration decreases. An intermediate oxide, tentatively identified by elec- trochemical measurement as MnO,,,,, is formed during the H+/e- insertion process. For the [KOH] > 3N, the increase of the second reduction stage with the electrolyte concentration can be explained by (i) the very large increase of the Mn(II1) and Mn(I1) solubilities in increasing [KOH], and (ii) the precipitation of Mn(OH), onto the surface of the oxide grains.
In 1N KOH, the oxidation process of the first cycle differs from the one taking place in [KOH] > 3N. XRD, voltammetric and chrono- amperometric data show that the oxidation mecha- nism in 1N KOH can be described as a H+/e- desinsertion process. For the [KOH] > 3N, it can be described by two main stages: the first one assigned to a liquid phase reaction and the second one to a solid state reaction. When the electrolyte concentra- tion increases from 3 to 9N, an increase of Q (Ah), drained during each oxidation stages, is noticed.
The cycling studies show that: (i) For 1N KOH, the redox mechanism of the y-MnO, can be described as a H+/e- insertion/desinsertion process, as shows the similarity of XRD patterns of the material before and after cycling, and the shape of the I(t) curves. The voltammograms obtained for the different cycles show that this process has a good reversibility, even for the high depth of discharge achieved. (ii) For [KOH] 2 3N, the redox mecha- nism of the second and following cycles is different to the one observed in the first cycle. In all cases, y-MnO, loses its electrochemical activity during cycling but the number of cycles carried out before this loss increase from 3N KOH to 9N KOH.
Acknowledgement-Dr Jo& Manuel Amarilla Alvarez acknowledges the Foundation Ram6n Areces for financial support.
1.
2.
3.
4.
5.
6.
7.
REFERENCES
D. Bode, C. J. Venuto, D. Wisler and R. B. Wylie, J. electrochem. Sot. 115,333 (1968). K. V. Kordesch, in Batteries (Edited by K. V. Kordesch), Vol. 1, Manganese Dioxide, p. 241. Marcel Dekker, New York (1974). K. V. Kordesch, J. Gsellmann, M. Peri, K. Tomantsch- ger and R. Chemelli, Electrochim. Acta 26, 1495 (198 1). H. S. Wroblowa and N. Gupta, J. electroad. Chem. 223,107 (1987). Y. F. Yao, N. Gupta and H. S. Wroblowa, J. electro- anal. Chem. X%,93 (1987). M. A. Dzieciuch, N. Gupta and H. S. Wroblowa, J. electrochem. Sot. 135,2415 (1988). L. Bai, D. Y. Qu, B. E. Conway, Y. H. Zhou, G. Chowdhury and W. A. Adams, J. electrochem. Sot. 140, 884 (1993).
8. N. C. Cahoon and P. Korver, 1. electrochem. Sot. 106, 745 (1959).
9. G. Bell and R. Huber, J. electrocfwm. Sot. 111, 1 (1964).
10.
11.
12.
13.
14. 15.
16.
17.
18.
19.
The y-MnO, redox mechanism 2331
A. Koxawa and J. Yeager, J. electrochem. Sot. 115 959 20. D. M. Holton, W. C. Maskell and F. L. Tye, Power (1965). Sources 10 (Edited by L. Pearce). The Paul Press Ltd A. Koxawa and R. Powers. J. electrochem. Sot. 113,870 f 19851.
I-- --I
(1966). A. Koxawa and J. Yeager, J. electrochem. Sot. 115, 1003 (1968). W. C. Maskell, J. E. Shaw and F. L. Tye, Electrochim. Acta 12, 101 (1982). J. Pannetier, Prog. Batts Batt. Mot. 11, 51 (1992). M. Ripert, Y. Chabre and C. Poinsignon, IS.91 Letters 1,5 (1990). C. Poinsignon, J. M. Amarilla and F. Tedjar, .I. Mater. Chem. 3(12), 1227 (1993). H. Y. Kang and C. C. Liang, Electrochim. Acta 13, 959 (1968). H. Y. Kann and C. C. Liana. J. electrochem. Sot. llS,6 (1968). -
-.
D. Y. Qu, B. E. Conway, L. Bai and Y. H. thou, J. appl. Electrochem. u(7), 693 (1993).
21.
22.
23. 24.
25.
26. 27. 28.
29.
30.
L. A. H. MacLean, Thesis. Middlesex University, London (1993). H. Y. Koxawa, T. Kahtoki and J. F. Yeager, J. electro- them. Sot. 1135,405 (1966). A. Scott, J. electrochem. Sot. 107,941 (1961). D. Boden, C. Venuto, D. Wisler and R. Wylie, J. elec- trochem. Sot. lOa, 745 (1959). Y. Chabre and M. Ripert, Mat. Res. Sot. Symp. Proc. 210, 367 (1991). J. McBreen, J. Power Sources S, 525 (1975). J. McBreen, Electrochim. Acta 20,221 (1975). C. Mondoloni, M. Laborde, J. Rioux, E. Andoni and C. Levy-Clement, J. electrochem. Sot. 139,954 (1992). J. Ambrose and G. W. D. Briggs, Electrochim. Acta 16, 111 (1971). A. H. Thompson, J. electrochem. Sot. 126,608 (1979).
Copyright © 2022 FDOKUMEN