Inflation Report 1996_11 - Bank of England
49
Bank of England Inflation Report November 1996
-
Upload
khangminh22 -
Category
Documents
-
view
0 -
download
0
Transcript of Inflation Report 1996_11 - Bank of England

Bank of England
Inflation Report
November 1996

Inflation Report
November 1996
Summar)
Recent dc\Clopmcnb in infl a ti on
1.1 Retail price I11 caSU l'cs
1.2 Other price indices 1.3 Expendi ture deflators
1.4 Summary
2 J\ loncy ~lIld int ci'C!l1 rat c!oo 2.1 The demand for monc)'
Personal sector
3
5
5 7
8 8
9
9
9 Industri al and commercial companies 10
Ot her finane ... 1 instit ut ions 10
Di vis ia money I 1
Narrow money I t
2.2 Credit dcm.md 12
Personal sec tor 12
Indust ria l and comll1ercial companies 13
Other financial instituti ons I J
2.3 Supply of credit 1 J
2.4 Interest rates and the cxdmngc ratc 1-1.
ShorHcnn interest rates
Long-term in te rest rates
Thc exc hange rat e
2.5 Summary
3 Demand and sU J>pl~
3.1 Domestic dcnmnd
Personal sec tor dema nd
Corporate sector demand
Stockbuildi ng
Public sec tor demand
3.2 Net external demand 3.3 OUlput 3.4 Sumnulry
4 The labollr nwrket
4.1 Demand 1'01" hahour
4.2 SUI)I)ly of labour
\::.(\)11\ I~
14
15
16
18
19
19
20 21
22 2J
23 24 26
27
27
28

4.3 Measures of labour market t ightness
4.4 Nominnl c<l I'nings
4.5 Rc~tI earnings Measurement
Temporary e ffec ts on wages
The nat ural rate of unemployment
4.6 Inl1alion cxpcct;.,tions
4.7 Sumn1l.lry
5 Prkinl-: hl'lla\'ioul'
5. 1 Import prices and the cx('h:.mge rate
5.2 Raw material and commodit y prices
5.3 Pricing by production industries Un it costs in man ufacturi ng
5.4 Pdcing by retailers
5.5 Summary
6 Prospects I'm" inflation
6.1 Developments in prices, aggregate
demand and SLIp ply
6.2 The Bank 's medium-term innat ion
1)I'ojcclion
6.3 O ther innation project ions
6.4 Conclusions
Prillled b) Parl COIlHllun,cat""" Lld () Jhnl ofEnlllJnd 1·)<)6 ISBN I IIsnn 1358 LS5N 1353- 6737
29 31 31 32 32 34 35 35
36 36 36 36 37 38 38
39
39
42 44 45

Summary
Sillce the Augus t h!/l(/fio/l Rt'porl. there ha ve been three imporl<llll pi eces o f news. First. the shon -rull outlook fo r intlalioll has deteriorated. Second. the effecti ve exc han ge rate has ri se n by 8%. Third. the est imat e of G DP g rowth in the fir st half o f the yea r ha.\ been revised up. and for the third qu arter i .... above trend .
During the course of Ihis year the balance of the rccovery shifted from ne! export s 10 growth of domestic demand. especially consumption. Thai trend is likely 10 be reinforced by the appreciat ion of sterling si nce the August IlIjl(Uio/l Reporl. It would be a mi stake. however. \0 try 10 alter the balance of the recovery by pursui ng an easier monetary policy in order \0 offset the rise in the exchange rale. That would do nothing to control the growth of domestic demand . An appropriate fisca l policy can help 10 restrain the growth of eil her public o r private consumption . But if monetary pol icy fails 10 coun teract the pote ntial inllationary conseque nces of growth of domes tic dema nd then. as in the late 1980s . the problem could become a weak ralher than a ~trong exchan ge rate.
Even afte r the recen t in crease in officia l il1lerest rates of 1/" percentage poil1l. it remains more li kely than no t thal inflation will be above the target at Ih e end of the forec'l.~ t hori zon. And the short- run rise in inflation means that the re is now much less chance of inllation being below 2 1 /~o/r during 1997. Achievement of the I11flati Oll target re mains elusive.
The recent rise in rates shou ld help to reinforce c redibility. But what mallers most is the contin uous pursuit of a monetary policy which is consistent wit h achieving the targel in the medium term. To ensu re Ihis out come. some furl her rise in interest rates is likely 10 become necessary in due course.

Recent developments in inflation 1
Char t 1.1 Inflatiun")
_ "",,,,, I .. ,
''141
I'<', ,,.~ "~"' .. ,.,, ,n I"~" ,,, .. J'" ... 1",. - .
) .. ! , ,.I .. " " _ 0
• 111'1.\ • ~rt.o"I""<' ,o.k, "' ........ n ... _ ,_"''' .... J "" ... NI'!l • MPl X.><ho,l"", \ 'A ' ...... _ " 1 I." ........ " .• " .. " (., .... , ...... .., Ih< 11 ... 1 « I n~"'"" (",,,0 .. ,,_ on ~.~'n, ""'c .... 1""" ,nol~ ....... ~«" , .......... ),poJ \I ., 19"" 001 .. "
, ...... -' ,-. on 'h" /I,,..., ..... _·Iook _"""'" '" ...... ' ...... " .. n... ... "< .. m,' ... ', .... ,"~«I
Tahle LA J-Ieadlint' inflation in the (;7,"
c"n.JJ h....,,, Gc"'''''} ,h' 10 ,.,) l,,,,,n Unn.J UHt"'" K ",~d,.n ", SI ,,"-'
1<)70. , .. .. .. 1!7 '''XU, 6. ~ H 2 '} '" 1<)91" ," , 2 5 ,.
" " T"d\ < """,,h. ,,,Sop .. IW(, " U, ,.
" .. ' ';"'"P ,,( "'''" I ..... ~ >0"""" •• ,...., «"''''''''''''' , hi ,· .... _(;" '00 ... ,"'«_ ""'" ... ,« '.nu",) ,"" I M NI'IX ," , I-""" } ...... "'l 1 'I9O '~ &'""n .... ' I'f ..
Chart 1.2 RP'" inflation h} "c('IUI'
"' 12 , ~
" " I~ H
II tI "
l '<o~ "",0."" on 11"""" "".0 ... ,,,, -. - .
" H> H
.1.0
J.J Retail price measures
The twelve- month intla tion rate targeted by the Government. the ctw nge in RPI X- retail pri ce.'. exclud ing mort gage intcrcst paymellls- rose 10 2.9o/c in Septcmber. fo ll owing fi ve consec utI ve 1l10n l h ~ around 2.8% (see Chart 1. 1), Inlb li on has persisted al just under 3% si nce Oc tober 1995.
RPIY innat ion. whic h excl udes Ihe effec t o f indirect la x changes as we ll as mort gage inte rcst paymellls. rose to
2.5% in the year to September. from 2.39C in the yea r to June . The twel ve- month headli ne (RPI ) rate wa~ .'. tabl e around 2. 1 % between J une and Septembe r.
lnnation has a lso bee n low in most other major industria lised count ric~ in recent year~ . as Table I.A shows. Indeed. inl1 ation in the 1 990s has. on average. been lowe r in Canada . France. Gt!rmany. Japan and the United States than in the United Kingdom .
Goods il nd services eac h fall into two broad categone~
those whi ch are in ternati onally tradabl e and Ihose whi ch are not. Exchllnge rate movement s can affect the prices of tradables d irectly. while dumestic markel conditions are more importa nt for the prices of nOll -tradable good ~ and serv ices . The tr:lCl;lbles COll1pOnelll o f RP1 Y innati on was on a downward trend during th e nrst half of the year. as the e ffec ts of commodit y pri ce increase:and last year' s s terlin g deprec iation fe ll out o f the twelve-month rate of inn ation (sce Chart 1.2 ). More recently. tradables innation has picked up as a result o f the rise in pet ro l prices. A lthough non-tradables in n mi on was fa irly subd ued durin g the first half of 1996. there was ev idence of a pick -up more rece ntl y.
Measuri ng changes in price ind ices over less than twehe months gives a belle r indication of more recc nt developmen ts in inna ti on. a lthough temporary price surprises make such measures volatil e. On a se:lsonall y adjusted. three-month annua lised basis. both RPI X and RP1Y innati on had fu ll en be low 2.5% by June of this year. Bu t. by September. liS Table 1.8 shows. the three- month rates had picked up agai n 10 2.8% fo r RP1 X and 3.2% for RP1Y.
,

I'ahlc 1.11 Short-rUII1lll'a'Urc, nf inlla tiol1 '"
I'/'J~ ,~
Jun. '"' ,,,' h' .\1 .. ,- i\u~ ~.
~I'I I h,,,,' "".IIh " " '" " " " " ~ _1
"'·"~'''h " " " " 1 ~ " ~ .1 ~.O
'"' l'h,,," "~'"'h : t, , . " " " " " 1.8 ~"-m,""I, '" " " '" " " " :5
RI'I\ 1"1""""",""1\ " " " " " " " , ~ ,,, ""."h " " :U " " " " 11 IRP Ih,,',· ".""h " " " " " " " : , ,,, ",,""11 :0 " :0 " " " , " " 11IM':1' n1l«-II" "1I11 , , ", " " " " :. 1 1 5 ' " "".,,1\ " ", " " " " "" 16
, . .,."" 0' ~ ",.J ",," .. , 1 "t',,,,J
\It "''',, "" "·.,,, .. ,II~ .,1,.,'«1 ",.t ... ", ,,, oI , ,,'J~, ,t", I" "~ I"" ,' ''''".,' ..J ,""" ~ ,,, ,. NI'I .,,>,1 N I'I~ ,'" I,,,,,, '''''~, ""''' 'rl,,,,, " " ,",," ,,[ ~I' I '" NI'I I , .. , N"I~ h' ~I''' ~) ",.,,,",11) .. ,,., ,,,,, ~f'I\' "'~I' ->nd T'M~" '" ,.I<.i""J ~, """~ """f """"" '1 .od,"",,1 M" I~ "",I ~I'" ""f'" ""h ,,11" It"' ",o\. ,N,,,'-"'''' ,,,",,.,,,,,,,,,. t, ",,,,,,~
Chart 13 Hl'cnt (Tude nil prin'~
''''' " ... h '''.'' -"
-to,
J ,~
'"
Ch;II'! t .~
GUf)(h and wn kt·,
-"
- . - .
kl'"
L' ~, ....L~-'-':~, '"'~"'_' ~' .h~' .j, I~~, I",..,..L,~. - 0 , ",~ ~'J "! 'JI ')1 '1' ~. 'i' '11>
<',>u ... , ,,~, "",I "'"' ,,' f "t'".J '",' I)., •• " ><,~""ff) ...r l"'''"~) "'" f',"l
,
Twe lve-month RPI X inOati on outturns have been higher than ex pected over the three months si nce the August Report. That was despite downward pressure from seasonal food prices, which fe ll 5.8% in Septe mber. But there were a number of unex pectedly large price inc reases. Some were the resu lt of adverse supply conditions. fo r example in the world oi l market. Such shocks have a onc-off effect on the general price level and . therefore. a temporary impact on inOat ion. They may event uall y be reversed. But some of the pri ce su rpri ses. for example in services . signalled a fas ter-t han-ex pectcd inc rc<lse in nominal demand, with consequcnces fo r ill11alion in the medium term. That is why it is useful to examine recent price surpri ses in some detai l.
Retail petrol prices rose by 7.8% in the year to September. adding 0.3 percentage points to RPIX inOation. That followed price-cutting in response to competitive pressures earlier in the year. and then an increase in oi l prices in response to the indefinite suspension of Iraqi oi l ex ports in September. But that e ffec t is expected to be largely te mporary. The price of oil fo r delive ry in six mon ths· ti me. although it has risen. is much lower than the price fo r one-mon th fu ture delivery. as Chart 1.3 shows. And the difference between the two prices has increased recently. from an average of £0.38 a barre l over the [990s to arou nd £ 1.70 a barre l si nce the August Report. Once the oil market has stabili sed . competiti ve pressures are like ly to rc-emerge. partly reversing recent retail price increases.
C lothing and footwear prices rose by 5.2% in September, the largest monthl y ri se si nce records began in 1947. That increase followed low prices earl ier in the year. Manufacturers may have been ' testing the market', see ing whet her demand had increased enough to support higher prices. Although the volu me of retail sales of textiles. cloth ing and footwear fe ll by 3. I % in September. after an increase of 2.5% in August. it was sti ll 5.5% higher than a year earl ier.
Se rvice sector in Oat ion began to pick up during the second quarter of 1996 (see Chart 1.4). While seasonall y adjusted service price inOation rose to 2.4% in the year to September frOIll 2. I % in the year to April. goods price inl1ation fe ll to 2.8% from 3.2%. The broadly based pick- up in servi ce price inflation ex plai ns much of the recent hi gher-t han -ex pected RPIX inO ation. The prices of catering, transport . car mni ntenance and hous in g repair and maintenance, which account for almost a third of the service sector component of the

Clnu" 1.5 Iluu.s in~·adju .s t cd inll:ltion IMII.I' and II. I' I X
""'
T U,\KI' and RI' I\'
- ,
"""<tM..I$< ""''''K' '.I"~""'" , ...... 1 .... -.
-, -e, ",,,~;;,"":'-,.,, ~...,.;;,_~.,.",~-..,--"
Hn"II/(/" \"/"I''''''II/ , '" ",/llII",,,
retail prices index, increased o n average by 4.5% in the year to Scptcmber, up from 3.8% in April. And the prices o f d welling and car insurance rose by J.4% and 0.9% respecti ve ly in Jul y (the latest well -founded data ava ilable). in contrast to last year's ~harp fall s.(H TllO:-.e rises were consistent wit h s tronger de mand for. and ou tput oC services than goods over the past year or so. increasing the pressures on capacity in the service sector. Consumption of all services (excludi ng the vo latile 'other services' com ponent ) grew by more than 1.0% between the Ji na and second quarters of 1996. So the recent increase in service sec tor price inflation is likely to be in pantile re~Hilt of fastcr dcmand growth, with impli cation s fo r in!lat ion over the mcdium term. Report :-. from the Bank's Agent s co rroborate Ihat view,
The housing depreciation compon cnt of RPIX rose by 1.1 % in September, roll owing an increase or 1.29£- in the prev ious month . That reflects the recelll pick-up in house prices.
Higher-than-ex pected price levels will result in higher twelve-mon th inflat io n over the next year. Some of the surprises. suc h a:-.l hat to the oil price. arc likely to be part ly reversed. But some arc a sign that nomina l demand may be increas ing faster than expected. or Ihat the trade-off between increases in prices and in volumes has worsened. In cither case. aggregate inflation will be hi gher than ex pected. even ;,rte r the onc-off pricc cffcc ts drop o ul of the twelve-month rates.
1.2 Other price indices
The Ban k has constructed housi ng-adjllsled ve rsions of RPIX and RP IY which include a measurc of owner-occupied housi ng costs in place of morlgage interest paymen ts; HARP and THAR P. respectively. HARP and T~IARP rates ha\'c been consistcntly above RP IX and RPI Y since the spring of 1996 because or the recovery in house prices which began 1,Ist year (see Chart 1.5).
Severa l prices Ihat enter the retai l prices index change relat ively infrequently and by large amoun ts. Such movements may rencct cost incre(lses that have buil! up over time. Although it is appropriate to include those increases in measures of the COSI or li vin g. they Illay d istort Illeasures of underlying inflalion. So tile Bank monitors two altermnive indices. constructed to limit the
(I) Th~ III"Jomy or ,Iala ror Ihc" ~ ~"\\\I""\CIll' ,m: "hl,,,,,,'d tn'", q"an~rl' . un'cp. .
7

CIHlrt 1.(,
' ll'a'tII·c, uf umil'rl) inj: inl1ation ... ", ... ,'- -"'-, ," ,..~,. ,.,. " .. < .. ,':!! 1
-, I ,
" I"', ." ", '""''''' "~'"oJ l!""""".,.,.,
I'ahll' 1.( ' Challl:l" in c'l'l'ndi\url' ddlatun (lllOlrl..d pricl" )
(",,,,,ump_ ImN
"",' "",," Ci,,,,,,n l)"mN', h,.. ... , Iml""" GIW ,,",'" "'." ........ ,., ,~.
I'~!ol " ~~ " " '" ~') " 1'1''' ,,,
" " " n " " I'I'X.QI " '" " " '" n ~o
D' " " " " " !-~ " , ",,,,,,..11, ""I',",,~14U""C") I"",'C"'"~' ,....,I\~< ,
QI ,., Q.I ". "' '" " -01 "" " ()! ,.,QI '" '" "" ,,-~ " "' " ,., I) •• ","~ ,k" ....... ,~, .... ""k' "." "'" ," "'" """,,.1 ."""'"'" ," ,,,,,-~ , ...... ~, •• on '"""",, ~h~""',·, ... .of'f'<-" "'r ....... ' on .1", • .oN<
, " \I, ... ",,,,,,
•
effects of extreme price movements: the median and trimmed mean indices.c I1
As Chart 1.6 shows. those measures of underlying inflation tend to be less volati le than RPIX. And they are often lower. because the ou tl ying price changes have tended to be largc and positive. The twelve-month trimllled mean inllation rate rose in recent months. while the twelve-Illonth median inflation rate was stable at around 2.2%. So. even after stripping out the largest price surpri ses. positive pricc shocks to a particular sector- serv ices- were important in ex plaining recent movements in RP[X .
1.3 Expenditure denators
The GDP dellator ilnd its components measure the price of domestic value added. In principle. therefore. thcy are a beller measure of domest ically generated inflation than RP IX. But the GD P deflator is less timely than RPIX and is pronc to revision. Intlation as measured by the GDP detlator has been lower than RPIX inflation in recent years. The annual increase in the GD P detlator was 1.6% in 1994 and 1.8% in 1995, compared wi th increases in RPIX of 2.3% and 2.9% respectively: in 1996 Q2 the GDP detlator was 1.7% higher than a year earl ier. compared with RPIX inllation of 2.8%. That implies imports were an important source of intlationary pressures. T he ri ses in the import and export deflators were smaller in 1996Q2than in 1996 Ql.inline wit h a 1.5% strengthening of ste rli ng between the first and second quarters, Tabl e I.C shows that the import dellator increased by 2.4% in the year 10 the second quarter, having risen 4.7% in the year to the first quarter: the corresponding figures for the export detlator were 2.0% and 3.0% respectively.
1.4 Summary ,
The effects of commodit y price increascs in 1994 and early 1995, and last year's sterli ng deprcciation, have gradua lly worn ofr. There has been a marked fall in seasonal food prices recently: they may rcbound. At the same time. there have been a number of adverse price su rprises. particularl y in the service seClor, and they are more likel y 10 be sustai ned.
(11 TI", momlll)' "hang"' III ,,11 ~omllO'I~n\' of RI'IX "rc wcigllle<.l "ccordmg 10 Ilteir impo,I:,nce in Ihe CXI",,,<.lllurc of 11 'Iypical' hou,chold on<.l "rC Ihcn r,. nlc<.l hy ,"~C , The illc<.lwn j, Ihc MC "\lO"C which halfoflhc rc,ull l" ~ <.li'lrihuliol,lic,. The lrimmc<.l mcan rCI110"C' Ihe large.1 and .,mallc" l 5'il 01 price change •

Money and interest rates 2
Chart 2.1 G roll Ih of 1\1-' and j\ 1-' It·ndinl:
r.,,,,",.,.,, •• ,.., , .. 'j"" , .. ",. - 11
- "
- 11
""
', .. 1 .. ,' .. I. " I, ,I " _ 0
1990 ~I ~l ~, w " % Souo« lI ... l.,. (nI' ......
T~lhre 2.A Gro\\ Ih nllcs of llIont'lar~ ~1J.:J.:rc;':1I1('s '"
I ,,"'nlh 1 ,,,,,,IIIo,.b, 6 ,,,,,,,,j,,,bl I~ ",,,"oh,
N,",·,.nde,"" ne., 0.7
.\10
M" () \ Juoc I I) Ju l) 06 A"~ 0.6 Sel" O,~ ()<, (H
Ixc " M_, O,~ Ju"., " Jul)' ''" A,,~ "' SelM "' 0" 0.7
,~ "' M" '" June 0,6 l ul) " Aug '" ~. 0.'
'''' 0.' M" " Ju ... · "' lul) ' " ,., " ~. "
'" $<,"'"-<11, "",0"<>1 Obl ,\ .... 1, ....
.. , " , ~._l
", " " 6.,
'1.6 ~,O
" " "' S,~ 7 (l
)U ,
"" " " " " .. 11.7
" " " " I qWrl<rl~'
" '" " "
" '" 7 .. 1 '" 7.\ " " 72
" " ,. 7..1
" " " ~.<I 7 .. 1 5,1>
0' " X,U " " " 6.X , " " " Y'l <)~
IOK " ., " " " .. " '" "
" .., 102 '" 10.0 '1..\
" " " " " " ~ 4"'''''''' I~I ~ 4"""''''
" " 10\ 9.5 10\ " " 9.J
Broad money and lending growth remained high in the th ird quarte r. As Chart 2. 1 shows. broad money g rowth was low between 1992 and 1994. rose sharpl y during 1995 and rel11<lined hi gh during 1996. Borrowing by the person:! I sector cont inucd to g row steadil y in the third quarter, in line wi th the recovery in the hOll sing market. Monetary data co ntl11u c 10 suggest Ih at Ihe outlook for co nsumer spc ndi ng is rohll.~1.
2.1 The demand for monc~'
The twe lve-month growth rale of broad money (M""' ) was 9.9% in Scplember. above the Governme nt's monitoring range of 3%-9% (see Table 2.A ). Chart 2.2 shows Ihat the persona l and corporate !->ec tors accollnted almost cqua lly for the strength of M4 during 1995 and 1996.
The in troduc tion of the g ilt rcpo market in January led 10
a ri se in lhc dcmand for. and suppl y of. broad money. whi ch wi ll have boo!->ted the twel ve- month growth rate during 1996. perhaps by around onc perccntage po int. Adj usting for that. the twe lve-lllonth g rowth rale has been arou nd 80/1'-9% for most of Ihc ycar. If suc h a g rowth ralc is 10 be consistent wilh Ihe inflation targe!. thcn thc vcloc il Y of mOtlcy wil l need 10 fall by 3o/c-lo/r a ye<lr. whereas ove r the past fOllr ye,lt·s it fell by less than 10/1' a year. So th e curren t growth rale is 1110SI unlike ly to bc com patibl e with the in!lnlion larget in the medium term .
Per.wlw! s('c/or
Although there is no simple relationship between persolml sec tor de posit s and consumcr spending. rising deposits have in Ihe past ge ne rall y co inc ided with strengthening consumer spending. Previous Reporrs and an article in the May Qllarrerly BIII/nill argued Ihat. based on past relationshi ps bet ween personal sector deposits and their main dcterminan ts (consumption. income. wealt h and interc!->t rales) . deposit s were higher and spending was lower than usual in 1995 .11) Nominal spending was ex pected to ri se duritH! 1996. bri n2. ing
" " " money ho ldi ngs more into line with onc of the ir main determi nants. co nslIm ption. Thm now scems to be
( I) Se,· Thuma, . I{ ( 1'196). 'Un(kN,,,,,I"'I: h,,,,,,I,,, ,,,,,") .IJ(lII~ "rCI/~lillul Q'W"N/ I" IJI/llr /HI . May. p.' g~' 16.1-7'1
,

C hart 2.2 \ 1-1 : (tIl H rlcrl~ n U\I . h~ 'l'rlor
- , - , - ,
Chart.! .. ' I nd h itlua[,' dCIW,ih rl'la th l' 10 cun'>uml)l ion'"
M",-.':, l~
- " _ l!
-"
- !'
I , I ,
' ",
l ()
, ., "" ,"
C hart 2.-1 Ihe l1 uII uf OVh ' del'u,> ih :IIId IIlc r}!u :lIld
al"l lIi ~ i l i nn~ ~I cl i \ i t ,\ Ill ' " 'I"llrlc r
'k'f<" """ ... ""''', •• " ,,>I "" --r-'" ,,., \ 000<4 ...........
()I I, .1<",,,,,,
_ I, I "I , I 1,,, I ,I" ,I ,1" I" J. , "nil >1>, .1 "" •• , '11) q, ~l 'I' 'I' " .' '}O
"." ", 0"..00 ,,," u t I "J'''"''
'"
- ,!
-,"
happcnin g: nominal consumption growth averaged 1.1 % a quarter last year. compared with 1.5% in the fi rst hal f of this year: by con trasL deposit growth fe ll from 1.8% to 1.6%. and fell further to 1.3% in Q3. Put another way. the ratio of individuals' money holdings to consumption rose in 1995. but has now nallened out as nominal spending has acce lerated. as shown in Chart 2.3.
Ri sing house prices and equity prices have increased personal sec tor wea lth to a level which now makes thc earlier rise in de posits more consi stent with households' long-run demand for money. [n other words. the rise in individuals' deposits during 1995 was a signal that consumption would pick up, and that has now been corroborated by the rise in asset prices: both now point to a robust outlook for conslllnption .
Although consumpti on growth has begun to rise, that will not lead to an automatic fa ll in overa ll M4 growth. Thc spending wi ll show up fi rst in the corporate sector 's accoun ts as deposits are ' transfe rred' from the personal sec tor. Broad money growt h would begi n to fa ll onl y if a sec tor began to use money balances to repay bank debt. So while sec toml ex planat ions of broad money growt h are useful. it is stil l importan t to consider the overall broad money aggregate.
IlIdllllrial (//ul cOlllmercial (,OII'p(lIIies (ICC.~)
Deposits held by ICCs rose 2.1 % in Q3, in li ne with the avemge increase over the past year. Changes in ICCs' deposits have oflcll preceded chan ges in investment During thc first half of this year. ICCs' nom inal investment grew by nearly 5% a quarter. broadly consistent wit h previous rises in deposits. The further ri se in deposits in Q3 is consistent wit h the Bank's view that investment will contin ue to grow (see Section 3).
Ollterjil/{lIIcial ilHlillllimll' (OFls)
The deposi ts o f OF Is ,Ire volatile fro l11 quarter 10 quarter: OFls swi tch quic kl y between deposits and other forms of liq uid asset s as expected ret urns change. Despite the volatility. there was a clear ri se in OFls' deposi ts duri ng 1995 and the first th ree quarters o f 1996. Chart 2.4 suggcsts that it may have been linked 10 the strengt h of merger and acqui sit ion activ ity over that period. Payouts 10 shareholders following a takeover might lead OFls, such as life assurancc ilnd pension funds and securities dea lers. to ho ld higher money bala nces . at least temporarily. unti l portfo lios arc rebalanced. In the second quarter. merger and acquis iti on aClivi ty and
Tablt' 2.n "ct in.o; titutiona t irnc .. lmcnt'"
SI"" , ,,'11" IJI( ~"\ 'CII1" "''' ' (K "'''''1'"'' ) 0.1"" I~' "" .. ' "cr h,,~ ,,,",U""",
'"'''fll,,'' I 'N Z " " !2 B 1\1\1:\ ,
" '" " I'J'N , ." " " 1 9<)~ '" " '" n I'"' H I " "
, "
'.1 "" .. ', "'.,'''''') ... .... m ,<> 100 ... "., ,,, ,. """"''''' Ib' h .. 'ooJc , ,""",", "' .'H"' ..... ' """. 1.-1 ..... ''''I''~)
Chart 2.5 (;ro\\ Ih (If nul!' , and coin and I'chlit .o;:ll l'S
""~ ' '' ''''' ~'"'' ' '''' .) ''''"''~ l b
- ~ .. _ II
- " - " _ 'J
- " - . - . - ,
_ I, , , , I , , " '~1\
,. , n....·n •• "" ""',,n. """I<
1/",,,·, "'''/III/ne'' m le'
OFls' depos its growth fel l. In the thi rd quar1e r. depos ih rose sharply; data for third-quarte r mergers and acquisitions were not ava il able when this Reporl W:I S
fi nalised. but early indication:-. :-.uggest a ri se.llt
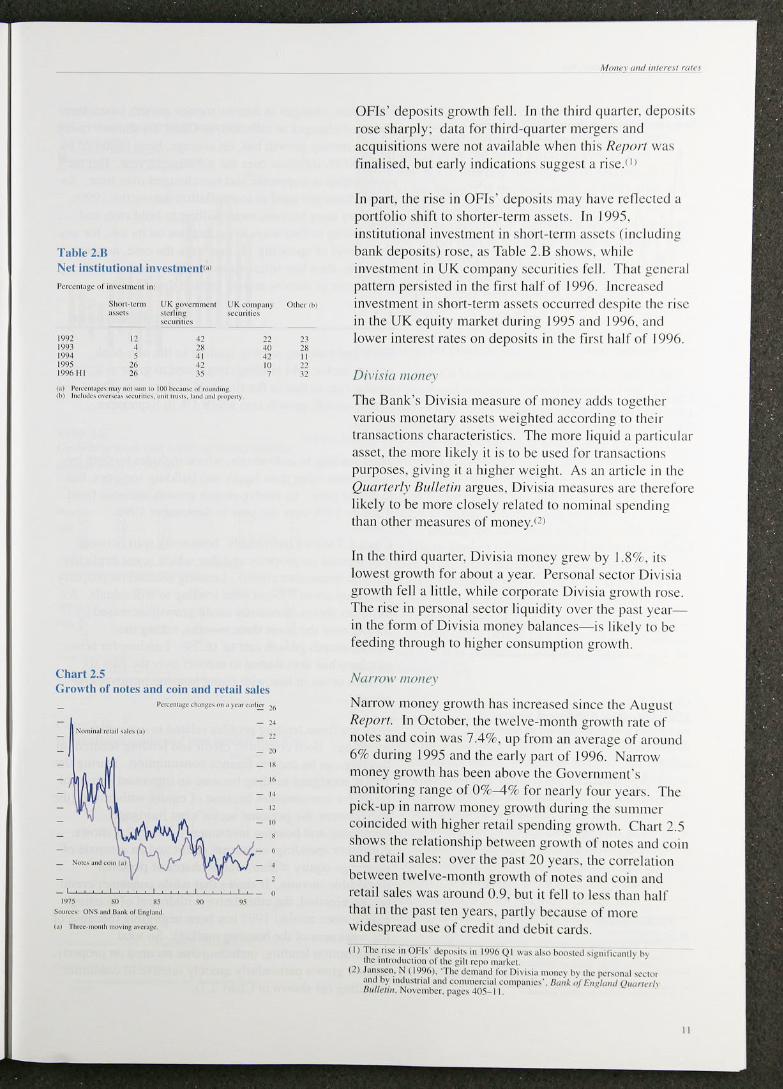
In parI. the ri:-.e in OFI:-.· depo:-. it s Illay have re ll ected a po rt fo lio shift to shorter-term :Issets. In 1995. institut iona l investment in short -te rm assets ( inc luding bank deposits) rose. a." Ta ble 2.B shows. whi le investment in UK com pHny securiti es fel l. That genera l pattern persistcd in the fi rst ha lf of 1996. Increased in vestment in short -term assets occ urred despi te the rise in the UK eq uity mmke t during 1995 and 1996. and lower interest mtes on deposits in the first half of 1996.
Dil'isia II/OII ('Y
The Bank's Di visi" measure of money adds. together vario Lls monetary as:-.e ts we ighted accordin g to their IransaCli ons charac teristics. The more liqu id a pani cul ar as.scl. the more like ly it is to be used for tran:-.action:-. purposes. g iving it a highe r weight. As an arti cle in the Quarterly 8 1111elill argues, Div is ia measures arc therefore likely to be more clo:-.ely re lated to nominal spe ndi ng than other measures of money.at
In the th ird qU<lrl er. Divisia money grew by 1.89(' . it:-. lowest growth for about a year. Pcr!'Olw l secto r Divisia growth fe ll a li tt le, whi le corporate Divisia growth rose. The rise in persona l sec tor liqu id ity over the past yea rin the form of Di visi" money ba lances- Is like ly to be feedi ng through to hi ghe r consll mption growth.
Narro\l ' 1I/001e,\'
Narrow money grow th has increa:-.ecl since the AtH!lIst R('purl. In October, the Iwe lve-month growth rate of notes and co in was 7 A %- , up from an average of around 6% during 1995 and thc early part of 1996, Narrow money growth has been above the Govcrnment's monito ring range of 0%--4% for nearl y fOllr years. The pick-up in narrow money growth during the summer coi ncided with highcr re ta il spending growth . C hart 2.5 shows the re lationship between growt h of no tes and coi n and retai l sa les: ove r the past 20 years. the corre lation between twe lve- month growth o f notes and co in and retai l sales was arou nd 0.9 , but it fell to less than half Ihat in the past ten years, part ly because of morc widespread use of credit and debil cards.
(11 TI1, n"c '" 0 1'1 ,' dq .. ", ' , '" I<}WJ 01 \\U' "1", I"",,,,'d 'I~ I"",·.''''I) !» Ihe 111I moJ u, Io"" ,,/ 'he g,ll reI''' """ h'(
(2) J."",c,,: N ( I 'J'X,). 'Th,' de"':III.! Iw D" " ", IIW'\<'} h) ,11,- (Xl'>ondl '<'C~W and b) ",oJ"" nal :",t! ~OIlIl\ II.' ... : ,al C<I ' " I''' '' ''' ' '. II",,~ /If 1 ', ,, ~hlll,1 Qwm<'r" 11.,1/1'1" '. No\ ~ "'''cr. I'''g<'' ~05- 1 I
"
('h:lI'12.11
",nil'" a nd ruin j.:rIJ\\l h a nd RI' IX inl1ation I~,,< .... ", ,h....,..,,,,,. )< .. <"'I~ ~"
RI'I\
" ,,,"",, ()~, .... ," .... I," ' '' ' ''''''
Chart 2.7
'", ".
_ 1\'
" -" -" - \~
- I"
(;rn\\ lh nfindi\idu:tl , ' h\Jrro\\i n~
1'<"'"'"",' , ..... ~, , ... """ ... ,~,~
, ."'"1<" .. ,., ....... ""J",
- . , ,~
'>« " ,."
.10 , ", ,, ,, ,1 "'''' ',,, 01 ,,, ,, ,, ,,, 01 '' 11 """ 1,,, ,,,,,_ n ," ,,' ."
Chart 2.X ' I u rt ).:a ).:~ I.' tluit ) \\ ilhdr:I\\ ai , un ~l.'rurl.'d
hornmi l1 J,: and CUIl ' Ullllltiun a~ , hare!> or di'II~":th1l- inClI lll 1.'
• "<0 ,,-", , -
"".,~.,-) .. """, ... .1 ... ,,, .... Iwkl """,,
1'< .. <", -. -. -, -. -. -.
,., ,,, .. ,,, .. ...J ~ , .. " .. " " ",, ' ''''''"' '" h,,,,,,, •• ,,,j ,he " I"" ,,( '.,1" 1» "".1 "",,,.,,«, "_"" (," "~'" "'<''''''''''<l
"
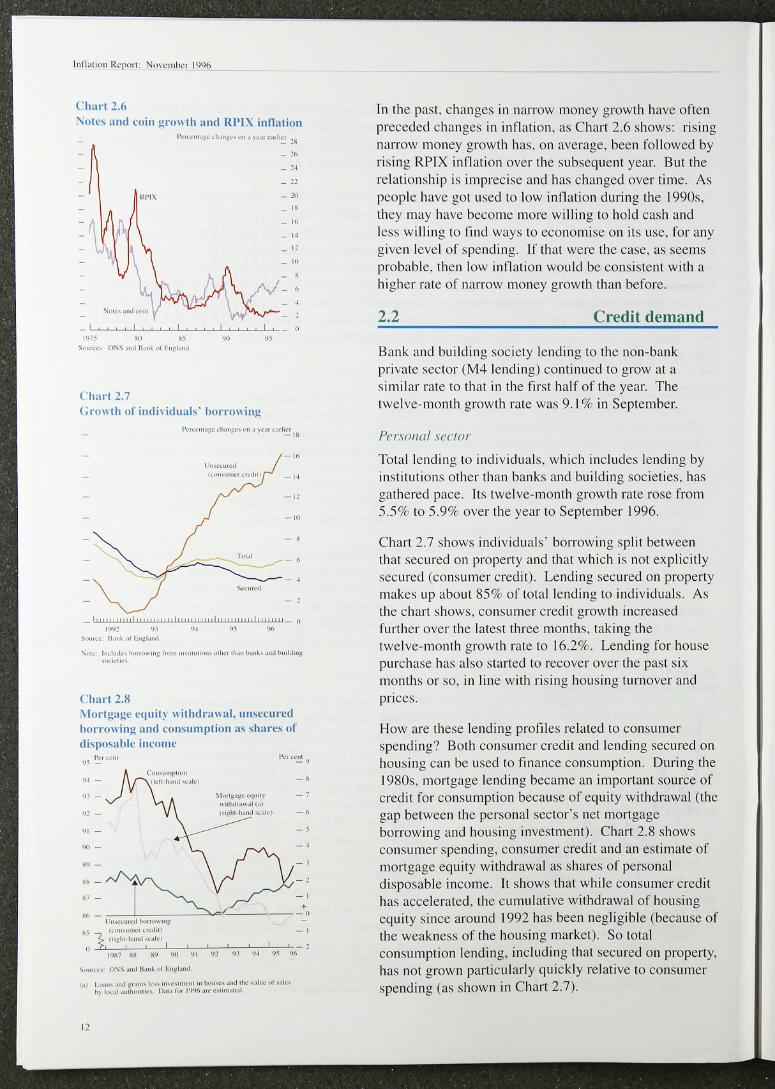
In the past. changes in narrow money growlh have often preceded changes in intlation. as Chart 2.6 shows: risi ng narrow money growt h has. on average. been followed by rising RPI X inflation over the subsequent year. Blit the relationship is imprec ise and has changed over time. As people have got used to low inflation du ring the 1990s. they may have become more wi lling 10 hold cash and less willing 10 lind ways to economise on its use. for any given level of spendin g. If \hal were the case. as seems probable. then low ill0<1lion would be consislenl with a hi gher rate of narrow money growth than before .
2.2 Credit demand
Bank and bu ilding society lending to the non-bank private sec tor (M4 lending) continued to grow at a si mihlr rate to that in the first half of the year. The twel ve- month growlh rate was 9.1 % in Seplember.
Per.wJ//lI/ "eclor
Total lendi ng 10 indiv iduals. which includes lending by instit utions other than banks and building societies, has gathered pace. It s twelve-month growth rate rose from 5.5% to 5.9% over the year to September 1996.
Chart 2.7 shows individuals' borrowing split between that secured on propert y and that which is not explicitl y secu red (consu mer credit) . Lending secured on property makes up about 85% of total lending to individuals. As the chart shows, consumer credit growt h increased further ovcr the lateslthree months, taki ng Ihe twelve-mon th growth rate to 16.2%. Lend ing for house purchase has also started to recover over the past six months or so, in li ne with rising housi ng turnover and prices.
How <Ire thesc lending profiles related to consumer spending? Both consulllcr credit and lending secured on hOllsing can be lIsed 10 finance consumpt ion. During the 1980s, mortgage lend ing became an imporlam source of credit for consumption because of equity withdrawal (the gap between the personal sector's netlllortgage borrowing and hous ing investment). Chart 2.8 shows consumcr spend ing, consu mer credit and an esti mate of mort gage equity wit hdrawal as shares of pe rsonal disposable income. It shows that whi le consumer credit has accelerated, the cu mulative withdrawal of housing equit y since around 1992 has been negligible (because of the weakness of the housing market). So total consumption lending. inc luding that secured on property, has not grown partic ul arl y qu ick ly relative to consumer spending (as shown in Chart 2.7).
C hart 2.9
Ice,· quarterl) , terlilll.: linantin~
'" ",.,. ... ........... "', .. ,....,.., U"'~'. "r '''''' t..ol, ..o.J ... " .......... ~ '''' '-<, ........ "-., ......... .... ..... ,, ... ,
- . - . - , - . - , - . - ,
- , ~i.~-OJu~.Ll .. ~ _ .. n
- ,
"', ... " 11 ..... _' "', .... ,
Tahle 2.C
Gru \\ Ih in ha nk a nd huild i n~ ,oticl) Ic nd in;:
p.,,,,,,,, '"' Ice. OFI ,
&':;u,<d r""",u'C\I
199~ QI " '" 10 ~ I ~ ~
'" " 1 2 ~ '" '" 1996 01 .. '" '" 16 .1 0' " 1.\(, '" 1"1 Q' " I ~ O I ~ I '"
r",,,,,!>u,",.,, '0 .",,",1 Ir,," ,11 '" ,,,"'~ "nd "",Id",~ ',,,ell"~) 1e"""'1 (f'<n·<"'.~< 1''''"''' ", '
Ih"." Icr. OH,
199~ 0' " 2.U ~.S
O· ,", " " 1,/,)(, 0 ' .1." n n 0' ,", 1.(1 " 0' ,17 1,(1 ,A
'" ,,, ,.,'," ""'''''"1''''''''' """"",,,, '''' M"", "") "'" '"m ,,, r,,,', "",,,,,,, ." " ..... "'~
C harl 2. IO
To'~1
.~ .. , • •• '.' .. ,
T",,,, .3 .. , q,(I
~,.\ .. ,
Int l'rnalio nal ,~ ndi ('lIl ed lua n ' I1 H'ad.; 10 ICes .. ,
~.'" "' ''!:'.' ' !~
- '00
- "
- . - l~
_ ' ,,1,,01,,1,, 1 ,1, 1 I,I' _ Q I~M~l.' ~~ '10 ~I ~l VI ~~ ~j%
IlIdlHlriCl/ (l1Il1 cOIlllllerci(l1 ('Oll/p llI/ it,,\
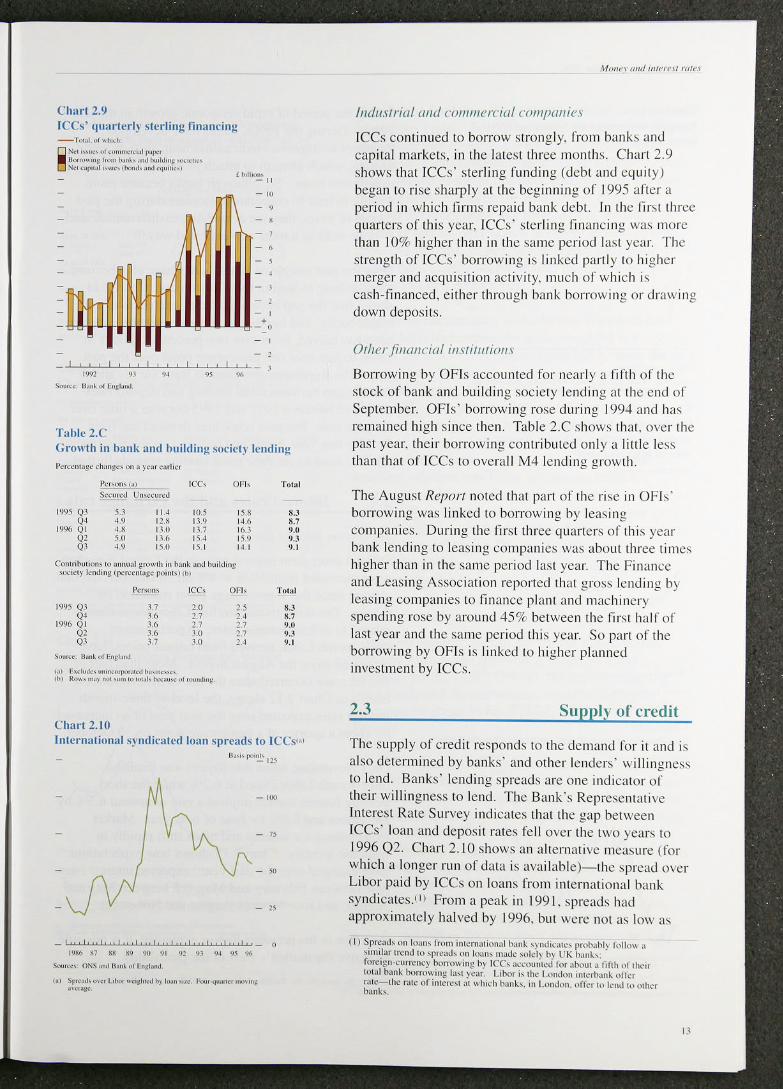
ICCs con ti nued 10 borrow st rongly. from banks and capital market s. in the latest th ree monlh!'. Chart 2.9 shows that ICCs' sterling funding (debt a nd equity) began to rise sharpl y ;lt the beg inning of 1995 after a period in wh ich firm s repa id bunk debt. In the first three quartcrs of this ycar. ICCs' slerling finanCin g wa!' more than 10% hi gher than inthc S,UllC period last year. The strengt h of ICCs' borrowing is linked partl y to higher merger and acqui sition ac ti vit y. mLlch of which is cash-financed. eit her through bank borrOWIng or drawing down deposi ls.
Of iter ./i1/(l11(·io/ illSlil/l1 ilJll ,1
Borrowi ng by OFIs accounlcd for nearly a fifth of the stock of bank ,uld bui ldi ng soc icty lending at the end o r September. OFls' borrowing rose duri ng 1994 and ha .. rema ined high since then. Table 2.C :-.how~ that. ove r the past year. their borrowing contributed only a little l e~:.
than that of ICCs to overal l M4 Icnding growth .
The August Report noted tl1<l1 part of the rise in OFls' borrowing was linkcd 10 borrowing by leasing companies. During the first th ree quarters of this year bank lending 10 leasing companics was aboUl three times higher than in the same period last year. The Finance and Leasing Association reportcd that gross lendi ng by leas ing companies to fina ncc plant and machinery spend ing rose by around 4SW- between the first half of last year and the samc pcriod thi s ye;} !'. So part of the borrow ing by OFls is lin ked 10 higher planned investm ent by ICes.
2.3 Supply of credit
The supply of c redi t responds to thc dcmand for it and is also determined by banks' and othc r lenders' willinglles~
to lend. Ban ks' Icnd ing spreads are one indicator of their willi ngness to lend. The Bank's Representati ve Interest Rate Survcy indicates that the gap between ICCs· loan and dcposit ratcs fc ll over the two years to 1996 0 2. Chart 2.10 shows an al ternative measure (for which a longer run of data is avai lablc)-the spread 0\ er Libor paid by ICCs on loans from intcrnati ona l bank syndi cates.c 11 From u pcak in 1991. spreads had approx imately halved by 1996. but were not as low a~
( I) Spr~;'J, n" I"an, from ;"'ern"llOn,,1 ".m~ ') "",,'ale, pr""""I) f,.lIo\\ " """br lr.:lld '{) 'I"~"J, 0" In ... " 11\".1,' ,,,'-'I) "l UK h.",~ , . for.:'g,,-eurr.:l1c) horn", Ill!; h) ICC, acw unl ,-,I lur .. hoUI .I I.flh {)I Ih,", I"tal bank hornm "'!; I.", )·c:or. L,tM'r" 'he L""d"" "" c,h,,,,~ "ITa r:nC- lile rate of nHerc,' l,t \\I"d, I""",. ,,' Lhnd"". (Ilia 1<' ,,"nd ", ,'l iler hank"

('lHU', 1. 11 \ arhlhlt- morl:':;I!!1.' ral~ " minu .. ulTit.:i;11 illlt'rl· .. t rah'
- I!
- ,,, - ,, ~
w ,.".",' '." .... 1< ",., •• ..", ...... "." , .. , ,1o"'I',J~, '''-'l'' """,, .. >ol .... ,'J •• ' "_,, ",-, "k""," .".,," "'-"1<'
('ha I'( 1.12 Sh' rlill!! thrl.'l'· llIoulh inh' rl" t ratl.' t'\IWl't ,lti"u, ht'furl' ,HId .,I"tt·r the ri,1.' in ofli(-i;lt inlt'n" t ratl""
I, ",,,
~"''''' .n .... , ... _" .1.0, ," "'''' , ... "'"
." ....... "' .... ,." " ... ,
1'<",., . ~"
. '"
... -60
."
,lL' .' "'~"'"'_,~~'","'~~~~~~~};~:; """, 'n
"',," ... ', Ill ! I .,"" !,., •• , ,,~ I,",o
,., " ..... J .... "''"0 •.• ''", ,,' ",.' '' '~ '"'''''' , .... ,,"",,.,
Chart 2, 1.\ St l.' rlitll:. Ih l't'I.' · lII()nlh inh~ rl."l ratt' t'\ pl.'ctatioll <;< ·'
I',·,
I - H
_ HI
- M'
" .. ,," III >1 ... , !I ,.~ ,,1 1 .. ~,,,.I
,.> 11,,,,0 "., " " " ",,, ... ,,,, , d , t"''''~ """ .. , .... , ,","",
duri ng the period of rapid economic growt h in the late I 980s. Du ring the I 990s. banks have developed mcasures to improvc credit assessmen t. such as credit scoring. which attempt to anach probabi lities of default to different loans. So. although banks became more wi lling 10 lend 10 corporate customers duri ng the past cou ple of years, they arc also trying to differentiate and 10 price risks in a more sophisticated way.ll )
Over the paSI couple of years, b,lIl ks have also become mo re will ing to lend 10 retail customers. Chart 2. I I shows th:lI lhe gap between offic ial inleresl rates ,111(1 major banks' and bu ild in g soc ieti es' variable mortgage rates has halved. from over two percentage points in 1994. 10 jus t over one percent age poin t over the past year. T he Represen tative Interest Rate Survey shows that the gap between ret:li llendi ng and deposit rales narrowed belween 1993 and 1995 but rose a little over the past year. Bec:luse retai l loan demand has risen steadi ly Ihi s year, banks and bui lding societies probably fdt less nccd to cut their retai l lending spreads fu rt her.
2.4 Interes t rates and the exchange rate
SIIor1-l('l"1II i ll fN(!lf /"lIte.1
Offic ia l short-term interest rates in the United Kingdom were inc reased from 5'/4% to 6% on 30 October. the firs t cha nge si nce Ihe '/" percentage po int reduction on 6 June. The Ihr-ee- 111onth sterlin g Libor rate is closely re lated 10 offic ial interest rates: expec tat ions of three- month Libor. derived from futures prices, have inc rcased since the August Reporf . More than half of that increase occ urred after the ri se in official interest rates- as Chmt 2. 12 shows, the leve l of Ihree- monlh in terest rates expectcd over the next year or so increased by abou t a quarter of a percent age poi nt on 30 October.
On I November, when this Repon was fi nalised, three-month Libor closed at 6.2% while the short sterl ing futures market impl ied a rate of arou nd 6.3% by December and 6.8% by June of nex t year. Market ex pectations are volati le and often shift rapidly in response to news. Chart 2. I 3 shows how expectations have changed over the past year: ex pected in terest rates rose between February and May, fe ll between May and August. and rose between August and November.
As a box in Ihe prev io Ll s Report ex plai ned. il is possible to de ri ve the market 's view of Ihe probabilit y
(I) Sce, lor C~'U"I)Ic. Ihe //(",1.'''1( An Hr/locI /""51%. Ihnk or England. IMSC 21.

Table 2.1) I)robahilit~ IIr .. te rlill}! three-mUllth intcrha nk m h.' being It''>' th:1Il u r Ctlual tu ' pecilicd ra te in \Iarch :lIId J lllle 1997
S'.,I,"~ Ill" ... "nllh "",,,I>.:I,,~ '~I< ~n'; 61X~1 62Y.;
,\, . , ! ,\,,~. (5 7l'l I M", '17 lH
,\,~, lY 0.'1. (~"'~'l . Mor.,,7 11 ,,,,,...,,7 12
,I . ~I ,~I (1<1. 16 1.,,'11 .\la, 97
,",",'n Asat I N,,,, 1("n'l, M:II '/1
J.,,", '17 " :..-"'< ,I, .",,1 ,",,,,,·,,,," ,10 I ,"" " ... ""'~n ,,' ." ... ~",
Table 2. E
" " " ", " " '" " .. , " " " " 2.1
Ch;lIIge, ill offici .. 1 and ke~ intc l'c,t n ltcs'"
Pc, ,<,K 1><" ""nU'"
COO'''') 1""".-, ,"'. I)"'~ C~~ Cluo~
Itr.>", "'~''',. '" c"' ...... II.",~ ,...., 1 A,,~,," _25 c ........ Ihll~ ,a'" nA"~"" -H F •• ",·< I~,<" <~I"", ..... 22 AUF"" 20 Gorn .... )' 14.",,) '<1"""'<
1\ "".""'1 22 AUi"" '" ,- lo'<"<"'~", .,,",' 1"'5<:1"<'''',",' " C"' ...... U •• ,,~ ,.1<' 20.:"""",, " C"" adr U""k .. ,,' 1(>0.;,,"""', -25 h.l) (),""",M W'. 24o, .• "b<-, " 1,.1) ,\J, oooc,', '''"< 140<..'-"'<, _1~
C"",,,,,-, nar'~ '0'< 2~o.·"",,-'f " Unu .... K'''~Jo."" 11"", "". '00.. .. >1><, .2S
banc, 1111«",,,,,,,,, ,.". 11 0",-",<, , '" '·h ... ,.., '" 'h< (;) ".".,,' , ,,, .. « 'h .. ,., , .. ,I 'I' ,,,< I,,,,, 1"."" ,,"', "'"
A"~"" ''lP,''''''' H".~,
[llOl r t 2.1" Sterl ing :Inel tncn ea .. th ree- munt h ill tl'rc, t rat e eXlled:ltiUll ~'·'
1'<, "", -J O
- ~,
, I • .,"" ..... '
JI,,,,,,,, "I"" "I '" "I " " l~; ~ " S<""'" ""'~,~ I ",,-, H",,~ (,. ,,,,,,," ... ,.,,1 """'''''''''' /,_ .. 11_ • .... ,.11-. ,
1_' H.",d ' .. . ,,, ..... ,.,,, ... 01 ,.",,'~ ' .. , lu'u«, " ... ,,,,, ,~, T' ...... ~"$""d ,"",,,' , .. " ," 'h< ..... ,. '" ,,""" .. '''''''.,,'',
,w ns .J35
". \ ~5 HIll lH L\O ,,'" "" 6.00 .120
d istribution for fulure three-mon th inlerest rat es impli ed by options price~ . So. fo r exa mple . betwee n the August and November R('I}(Jrrs. the ba lance of probabi lities shifted in favour of higher rates. Table 2.D show~ how the perceived probabiliti es have cha nged over Ihe past Ih ree mon ths. Between the August ilnd November Reporls the probabi lity Ihalthrce-month rates wi ll be 6.25% or less by nex t March fell from around 65% to 25%. As the table show~. the inc reased li kelihood of higher rates mainl y occurred after the ri:-.e in offic ial interest rates on 30 October.
Short -Ienn in le resl rates in IIle United Kingdom ha ve mostly been hi gher than the tnlClc-weighled average of rates in Ihe o ther G7 countries since 1985. O ve r the pa"t three months, o ffi cial short -Ierm in tere:-. I rate:-. were cut further in Canada, France. Germany and Iwl y (see Table 2.E). That part ly reflec ted different cycl ica l positions: over the p,*sttwo year:-.. growth in the United Ki ngdom has been higher than in most ot her industrialised counl ries :Ind. a:-. Sec lion I showed. headline inflat ion was lower in Canada. France. Gennany and Japan in Septembe r. Chart 2. I -l :-.how:-. the path of UK and over~ea~ short- term in terest rates and expectations. derived from future:-. market:-.. to June nexl year. The gap between UK and over:-.ea~ rates b expected to widen. with UK rates ris ing and oversea!'> rates broadl y l1aL
LOllg-/erm il/fl' I'C'_\/ m/('.\
Long-term intere ... t rates in th e United Kingdom fell between Au gust and Nove mbe r. Bond yields in Germany fe ll by more. Overall. the gap betwee n UK bond yields and those overseas. we ighted by trade. inc reased by abou t 35 basi s points belween the two Reporr.~.
Long- term inlerest rates rel1ecl the e.'(pccted path of short-term rates and the risk premia associated with th~ uncertai nty about future inl1ation and real interest rates. It is possible to work oUl the implied level of short-term interest rates. at different poin ts in the future. from the current malurit y structure of interest rates. For example. comparing fi ve-year interest rates to those at five ilnd a hal f years it is poss ible to calculate a six- month annualised interest nlle li ve years ahead. Chart 2. 15 calculates six-month annual ised interest rates in that way, from 1998 to 2006.(1) On 1 November. UK
(1) Rcl ,,,bk c ,t'''',,(~, "r C'P",I:'I")I\' r, 'r ,hun.ln'" "",'r,·,t r.JI,·, ()\~r Ihc' neXI 'wu )·car., ca'''',,1 )CI be JcmcJ r'''lIIlh" )Idd ,'(I"~. TIlc' npCCI;o(I",,, "r ,hun.,""", i(l(cr~" r:llc , "'cr (he n,'" m,·I,,· nwntl". dc'cnl",d '" (hc pr.; , io", ,,,Il. ,e," i"tI. ,,, ...... J,''''' cd hmll rUIII'C' pnc'~'
"

Chart 2.15 Inlplil'd nomimll flll" lanl illtl'rl'!>t rate ..... In'l~d K,n):dmu 1'<, « .. -.
I '>""'m"',--:--... : '"1"" -. --- -,
-. - ,
J 1'<0 ,'"! ~
: '''."'' F?C~-'
.....-:;:::l ,~ .. " ... ",., • 7
},~ "''" ,"~,
U1;lrI2 . 1(, ~Il'rlin).: cffcdhc l'\challJ,!l' rail'
_I ,,,,,,I .. , """"I", .t '.. ~, %
",
shorl-term interest rates were about three percentage points higher than German rates. In ten years' ti me. Ihe gap is ex pected 10 be aboul 0.5 percen tage poin ts. hav ing fallen a little since the August Report. So the gap between UK :md German tcn·year bond yields. about 1.8 percentage poin ts. mostl y renects divergent ex pectations of short -term interest rates over the nex t few years. due to different cyclical posi tions.
Till' exc/muge m le
T he sterl in g effec ti ve exchange rate has appreciated by 8% fro111 84, I. at the time of the August Report. 10 90.9 on I November. Char! 2.! 6 shows how the exchange rate has cha nged since the beg inn ing of 1992.
In pri nciple the appreciation of sterling over the past th ree mon ths cu n be accounted fo r by a combination or three factors-a perceived tightening of monetary pol icy in the United Ki ngdom, a perce ived easing of monetary policy in othcr countries. or an apprec iation of the equili brium rea l exchange rate.
Insofar as sterling's st rengt h renects a perceived tigh teni ng of UK pol icy rel ative to three months ago, it could be unwound if policy were not adjusted in line with those ex pectations, To the ex tent that sterl ing's appreciation renccts a loosen ing of overseas monetary policies. it has no implications for domest ic in fla ti on in the medium term. The loosening in overseas monetary conditions wou ld lead to a rise in fo reign prices which, in the long run. woul d exact ly match the fa ll in UK prices brought about by the hi gher exchange rate,fl )
The gap between three-mon th in terest rates expected in December in the United Kingdom and those of its trade-weig hted competitors inc reased by 80 basis poi nts between the twO Reporfs. As Chart 2.14 shows, that is because: (a) UK interest rates are now expec ted to be higher and (b) overseas rates are expeclCd 10 be lower than three months ago. The gap between impl ied short-term interest rates over the longer term was litt le changed. however, between the two Reports. So the monetary fac tors underl yi ng sterling's strength-a perceived tightening of UK monetary conditions and a perceived loosenin g of overseas monetary conditions relative to three months ago---are probably temporary,
( 1) Sec Dmnhu...:;h. 11. ! 1<)76). '!;XpcCI:,1 i"", and c1,hong,' r:l1c d)'n~"'ic" }",mw/ rf /'''/11''0 11;,.""",,,\ , [)ccc,"hcr: "'1<1 May 1995 h'./lm'o" /{"I"'ri pag~< Ib- 17.

Chart 2.17 UK cffcctiH' c\c!mnl!(' ratc rrolil('~'" Uti, ..........
I ,,,,,,,,1,,,,
1"").100 -~:
-" - ~
-" -"" -" -" -" -" -.'
I" ,1 ' 111 " I I " , I " ,I " , I" ,1' 1,1" , I '" 1,-1<
" 17 11 I' 1" " '1 "I '"""",,, , ...... "'''
Chal"t 2. tS Implied fun\ant inflatioll nl l C~
I""'M -,"
2""'~":" ____ , ..
------.. I , '",,,,,,",,, •••
-" -'.
} , I I I I I I ' I I ! I ' I I I I I I I! I ' , I ' I I tl~: 1'1'0<> !OOO 0' IQ
""-,,, II ... l 01 100,1_
Some 2% of the appreciatio n occurred on 30 October. when the risc in in terest ra tes was an nounced. and on the fo ll ow ing two days. so it seems likel y that perceived tighte r UK monetary policy accoun ts for at least so me of the appreciat io n.
Sterling 's ri sc probably ab o re nects rea l factor>;. The 15% or so rise in the dollar oil price since the Augu\t Repor! coul d be o ne such faClOr. Because the United Kingdom is a sig niti cant o il export er. hig her oil prices require a rise in the real exchange rate .ll ) Looking at other countri es' excha nge rates te nd s some support to the oil expla nati o n. Canada is :lI so a sig nifi cant oil ex port er and it s e ffective exc hange rate has apprecia tcd by 3% since August. even thou gh the exc hange rate o f it s main trading partne r. th e Unit ed Statc»,. also appreciated . Japan is a net oi l importer and Its effective exc hange rale depreciated by 6'k betwee n the two RepoJ"(.,·. O il. however. probabl y cannot prov ide a compl ete exp lanati on si nce oil fu tures prices. suggest that part o f the recent rise in the spot price IS
temporary.
By comparing UK interest rate~ to those o verseas. it i ... possible to calculate the implied path fo r the exc hange rale. assuming exchange rates change to eq uali »,c expec ted ret urn s (uncovered inte rest rate parit y. o r UIP). Because UK in terest rat es are hi gher than those ove rseas (we ighted by trade). UIP impli es that Ihe exc han ge rate is expec ted to rail ove r the next ten years. Chart 2. 17 shows that imp lJed exchange rate path .
As the c hart show);. des pite the recent ri se in the exc hange rate. the ); trllClU re o f long-term interest rates impl ies a deprec ia ti on o r 15% or so over ten years-a li ttle more than at the lime o f the August Report. The implied exchan ge rate paths are mo re or less parallel from five years Ollt which suggests Ihat there has not been much c hange in overall U K inflation ex pectat io ns relat ive to those abro;,d in the longer te rm. even though the behaviour o f the exchange rate suggests that UK mo netary pol icy is I>cree ivcd to have tig htened in the shorter term. Esti mates o f UK innation expectations. deri ved by ana lysin g conventio nal ~Hld index- linked g ilt yields. have increased since the Aug ust RepurI over the sho rt term. but have fallen atl ongel" matu rit ies. as Chart 2. [8 shows.
(I) An "" icl~ '" Ih,' Q'''JI"Irri> /I"lI rm, d,"",u"c, Ih~ ,,>ur.;c, ,,1 flu" "", ,,,,,, ," .'I,·rling·, ,,:.,1 cX<' I"",);c 1011,· t>..·!IICCn 197.\ and 1lJ<).I- " ... • ;\,11"1 . 0\1 S an,l G:O'nl!. A ( l')9b). ' \ '11"'1'1\'1111 ;: 'I" rl "'~ ,·.\ d ,.mg,· r.lI, mm,.,,,,:,,,,' . No\cmllCr. p"~n .\<).I .... O~
17

2.5 Summary
For the past 18 months or so the Bank has argued that the fi se in indi vidual s' deposits relati ve to consumer spendi ng was likely IQ le'ld to higher consumption in 1996 and 1997. ThaI has started 10 happen . Nomi nal conSlIlller spending accelerated during the first ha lf of the year and individ uals' deposits growth fe ll. Bank and building society lending remained strong . Overal l, broad money growth remains hi gh and incompatible with the il1l1aliol1 target in the mediu m term.
Offic ial inlcrc.'\ t rates were increased by a quarter of a percentage point on 30 October. Futures markets con tinue 10 discOlllll risi ng shori-tenn interest ralcs over the next twel ve months. They also ass ign a higher probabil ity th an three 1110111hs ago \0 higher rates. The exchange rate has appreciated. probably because UK monetary pol icy is now expected to be temporarily tighter than that overseas and also because of higher oi l prices.

Demand and supply
Ch:lrl .ll C;roll Ih Ill' dUll1c~lk dCllmnd c\dudin!-: .. ttJ('khuilding
-"
-' •
~..---U-LIUJUll-"-,'---IU" _,
T;,ble .1A Contribution!> to donll·~tic demand J:rf)\\th '"
"N I'N~
\,,' " Yea,
("'M""'"'''''' .. ·,r>'-·",j"u ... · ", 1 2 I"'",", .... ," "' 0,0 G,",",""",,,, "M"""'f'I""' 'J.\ 02 S "~ ~ hu ,' d",~ "' "' n",,,",,," ok",.,,~ 1 g"''' ' h B " '" \',",.",J., 1'l'lOm",,, ~ ' K<'
Omrt 3.2 Re;,1 hroad IlInne~ H'l:Iti\l' to re;II dOlllc!>lic dtmand .. '
''''', "" Q'
0." "' 0,0 '" 0,0 " ·O t 0,0
" 0 .\1
- .,
_ LI "'"'"'~, LI "'"'~, ., "'",~~-L~~-"'w.! _ '" '91' >10 ~, 9fJ 95
Q'
OS O,~ 0,0
_0,7 O,l
3
Real domesti c dema nd. exc lud ing ~ [ oc k building . grew at an annual iscd rate of 4% in the first ha l f of Ihis year (see Chart 3. J). il s fastest rale since lhe seco nd half o f 1988. A fal l in slockbui lding meant that [he accelerat ion in dema nd was n OI accompan ied by faster ou tpu t growth. Bu l that did occur in lhe third quarter : rea l GDP at factor cost grew by 0.8%, il s fastest rate since lhe e nd of 1994. The es ti mate of GDP growth in the fi rst half of Ih is year has been revised up to around its long- rull average of 2o/r- 2 Ih9'r a yea r. There were also revisions 10 output in the past three yea rs. The net e ffect o f all those rev isions was 10 ra ise the estimated level o f output in 1996 Q2 by 0 .20/,.-. compared with that at the ti me of the previoll!\ R l'fJOrl . Net ex terna l demand. whic h 1l<ld boosted out put growth in 199~ and 1995. did not do so in the IIrst ha lf of th is year.
Annualised growth of both nominal G DP and nominal domestic de mand averaged 4'U*, in the first two quarters o f this year bUI is likely 10 ha ve ri sen above 5£K in the Ihird qu arter. If rea l outplH and de ma nd were grow ing ,It their 40-year average rates. and inflation was <l l lhe Government 's target o f 2'H7r a year o r less. th al wou ld impl y nominal growth of around 4%-5% it year.
3.1 Domestic demand
Rea l domeslic demand increased by 0.30/(" in Ihe second quarter of this year, aft er ri sing by 0 .9% in the previous quarter. That slowdown was accounted fo r by lower stoc kbuildin g. whi ch reduced domestic demand growth by nearl y '/~ percentage po in! in 1996 Q 2. as shown in Table 3.A. Real M.+-broad money de nated by the increase in reta il pri ces exc luding mortgage inleresl payments-grew by nearly 7% in the four quarters to 1996 Q3. Chart 3.2 shows thal in the 1980s real M4 rose relative to real dema nd. partl y becau se financ ial li beral isation inc reased both Ihe suppl y o f. and demand for. M4 assels. Now. real M4 is again growing more qu ickly th an real de mand , bUI il is less easy to idctll ify financial innovat ions whi ch could be responsible. II is more like ly 10 be signall ing a rise in real dOlllesli c deman d g rowlh over Ihe next year or so (see Secti on 2) .
t .. hll' J.n lIollw pril'c iutlatiun
1')0)\ I'}')(, , .. " Q' 11.,101." " 0 .. 1
'"",,"" ,J< " " ilcl""'"""" ,, ' I·", ",.,,,,,,,,, ," ~.I
,,,""" 1t,I,'" ' ''''~' ''' 1 "'''''''1· ""'k'" ,,~. "",ld"l ,.,,"" .'" ' ' I to< 1)",,,,,",,,," ,,' ,h.' I ,,, ,,,,eo,, ",
UHlrt ;\3
QC
" " , ,
I~atin Ill' I'cl'''lIIml ,cd"r deht tu lil lU id ~I,>~ct,'"
•
•
••• - m
_o~<o
_0 .. ,<
_ OIlS
- o<w
_ "<is
JI", t ",1" ,1, "1", 1, ,, t '" I, ,t, II! ' " t ", " " I, "1~;:: ,"J<.l", "'.07 "" .~ .)() 0 ' 'J1 .' '" 9<'110
'" '"1"'" """,."",,,,,,," _. "."1,,,,_ ,,,1.,...,,, ""'"' •• ,,", '" 1,r • • ""'" .. " -.J f":"'''" tu"'''
21J
0"
" , " " '
p('f.I()/I(i/ .\('('/01' dnl/wul
Real consumer spending grew by 0.8% in 1996 Q2, the third consec utive quarter in which it grew at a rate above its -lO-year average. Growth of rea l personal disposable income- held back by the absence of the special payou ts, such as the regiona l electricity companies' rebate to customers, whic h had boosted income in the prev io lls quarter- was only 0.1 % in the second quarter. Nevertheless, consulllpti on grew qu ickly. 11 is intluenced less by quarterly chan ges in current di sposab le income than by expectations of income over longer periods. Rea l personal di sposable income has grown by an average of 0.8% a quarter in the past two years-i ts fastest rale since the start of the recession in 1990.
Consumption is affected by net financ ial wealth-the d iscounted value of ex pected future income from fi nancial assets- as well as by expected future wages and salaries. Net financial wealth was 18% higher in the second quarter of this year than il was a year earl ier. Gross financilll li .. bi li ties rose. but gross financial assets increased more rapidl y.
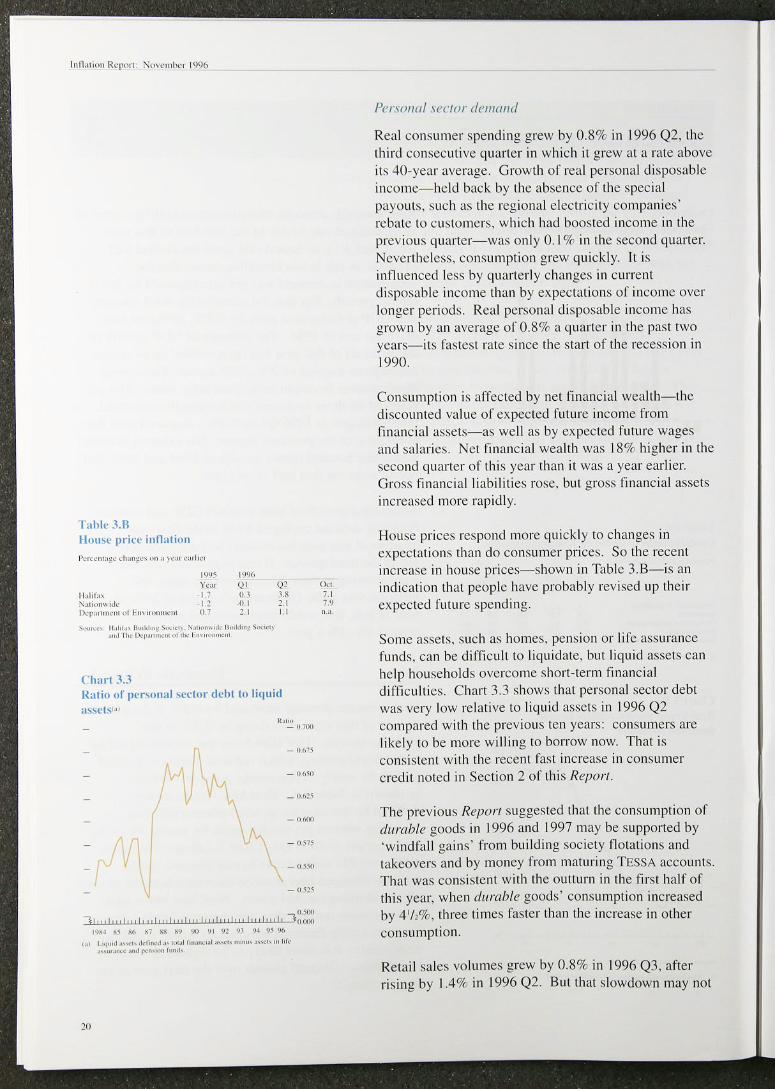
House prices respond more quic kly to changes in expectations than do consumer prices. So the recent increase in house prices-shown in Table 3.B- is an indication that people have probabl y revised up their expected future spending.
Some assets, such as homes, pension or life assura nce funds. can be d iffi cul t to liquidate, but liq ui d assets can help households ove rcome short -term financia l diffi culti es. Chart 3.3 shows that persona l sector debt was very low re lat ive to liquid assets in 1996 Q2 compared with the previous te n years: consumers are likely to be more wi lling to borrow now. That is cons istent with the recent fast increase in consumer credit noted in Section 2 of this Report .
The prev iolls Report suggested that the consumption of durable goods in 1996 and 1997 may be supported by ·wind fall gai ns' frotH bu ilding society notations and takeovers and by money from maturing TESSA accounts. That was consistcnt with the oullurn in the first half o f th is year, when dllrable goods' consum ption increased by 4 1/,%. three times fastcr than the increase in other consumption .
Retai l sales vo lullles grew by 0.8% in 1996 Q3, after rising by 1.4% in 1996 Q2. But that slowdown may not

Tahlc 3.C Rl'al il1\cslml'l1l
Pcr"·",.!,,, P,r,,<nt.,g< < h",,~< ",,,,,,., ,. ," h;,lf F'" <arl"" 'W. 'W, "'" ,,,
'" Il ~ '" TOIal,mC'Om<n' ". "' ·13 H /1. ... J~ ,,,, ' .' ,.1 MononJ a .... '1"""1 on" " .l.) " · 10 .1 ~'>r"'I"" 'ur '''~ ,n '" " " U"""", "
., "' 19.7
Ik" .... n'~1 ,..,. ",,,,.,, ", '" " ·62 0.0 Ochrr , .... u, lr"" '" "' 1.7 " ,., • ",,,,,,. " ... ,1 .. ,,,,,, "''''"" ...... PI'' ,of ~ ...... " .. "" ..... ,_ ......... "'.00
ll1< O~~"" ... , ... ''''''o<_'''''''''''''''.''''''''''''''''''_",o/"",,_., \»'-"')
Clwr13.4 AnnulIl ).trOll Ih of I1wllllfarturin).t output and i'l\c~tl1ll'nl
- "
- " •
,-Il-'!-tO'4I-+fH - ,
-"
-,J;.\' " 20' " .~\." ''['"'' },''' '.k •••• ~~. , ".lo'" .~~. - 16
indicate slower consumption growth. for two reasons. First. reta il sa les represen t only abou t 40lff of consu mption. And second. sa le~ in the second quarter were boosted by tourists' spending during Euro '96. reduci ng retai l sa les growth in 1996 Q3. Tou rists' spending. bec<Jllse it is as~ igned to exports. would not have affected consu mption in the nationa l accounts data . The introduction of the N:ltional LOllery al the end of 1994 reduced retai l sal es growth relat ive to consumption growth last year. Thai di storli on has now largely disappeared.
CorpOral l) wctor d('lIIlIlId
Real private investment grew by nearly 39f- in the second quarier of thi s yea r. after even st ronger growth in the previous quarier. Growth in 02 was entirely due to the purchase of ai rcraft. Table 3.C shows in vestment growth in differen t sectors of the economy. In vestment in the ONS' 'other industries' category- mainl y the service sector-grew quic kly in the !i rst half of thi s year. Faster investmen t growth in the ~cl"\' ice sec tor than in manufac turing was consisten t with ~tronger growth in the demand for. and output of. ~ervices than goods o\ 'er the past year or so. The British Chambers of Commerce Survey suggested that investment intentions in the service sector were higher in the third quarter than thei r average si nce the survey began in 1989.
In the fi rst half of thi s year. manufacturing IIlvestmelll fell sharply. after a lmge ri sc in Ihe second half of last yea r. Over the past 40 years. c1wnges in the output of manufacturers have often preceded ch.mges in their in vestment expenditure. as Chart 3.4 shows. That could be because firms arc not very good at anticipating fUlllrc changes in delll(Hld . The 1':111 in in\ICstmenl in the first hal f of Ih is year was consistent wit h the slowdown in ou tpu t growth last year. And the expected increase in manufacturing ou tpu t in the second half of th is year 111<1)
take some time to sti muhlle more in\'e~tment. Despile that. invest ment intentions were above their long-run average in the third quarter. according to the C BI Industri al Trends Survey.
As we ll as survey evidence. there arc o ther indicators that tota l private investment is like ly to cont inue £rowinQ. quickl y. The market valuat ion of capital exceedS-i ts -replacement cost. That means il should be profitable for firms to issue new equit y to fi nance the purchase of capit al goods. The price of new investment goods. relati ve to ot her goods. was very low in 199602
"

Charl J.5 \ nnu:11 J..lnl" Ih Hf htHh i ll~ lurllm er llnd pri\ llll.' 't't'lor d \\l'I linJ! in,e., lmcnl
~
"''"'
!:Ihlt' ,\.1)
J
V
I~ ....... « ,h_1'<' "". ,< ... <",I"" -~
... " ....... ~" J~d' .... ,,~ ..... -<
-"
Jt - " •
Jl \ - "
~ - '" - ':0
"' .... "~ '",""'" - '11
I -~ .. " '"
CIHIIlJ!t·, in ,I'K" S'"
f, •. ,1 '1 "/,,,/0 ,''',~, \1.",,, , .... , J(<!."lo n~ \\· ... ,k"' hng 0,,,,,.
" " "~ ",.]._'<1<,
I'I')~ 0' '" (I~ "' -0,1 OA 0 ' ". 0- 0,2 (),O "' 0' " (1.'1 0.' "' "' '" 11<) " (, 11 ~ OU "'
I'NI, <i ' 'I' ,," OA 0< 0 ,(1
()~ 02 "' (1,(1 0,' 0,2
,," ""''1''",'"'' "," "" ,"'" , .. , .•• , """.,,,,, ,,' "''' ,,' ,, ' ~
, , ' ,,'.,h"~ "'" _,,,,,,,,,.1 " , >. ",, ~, .... '"~""' .. ",ook I'» ,,,..o~, ~,w' '' 'f.nd ~"''''~' , ".' .... 1< or 'h< ~",,,,,,,,"," ,nd.",,,,
22
compared wi th the previo lls 25 years. That too should be an incentive for firms to increase their investment.
Private hOllsing starts ha ve ri sen considerably since the start of the year. And turnover in the housing market has risen over the past twelve months: in the th ree months to September. it was 12% hi gher than a year earlier. Chart 3.5 shows that. over the past 15 years. changes in Illrnover have lended to coincide with changes in investment in pri vate dwellings. So recent fall s in Ihat category of investment are likely to be reversed soon if the recovery in the hOllsing market co ntinues.
SlOcVmildillg
The Au gust 1995 Report suggested that lower stockbuilding mi ght lead to a slowdown in output growth . The e ffect was significant in the second quarter of thi s year. Excluding the ali gnment adj ustment. stockbuil d ing was £0.2 billion in 1996 Q2 (at 1990 prices) compared with £ 1.0 billion in the previous quarter.! l)
Table 3.0 shows changes in direct measures of stocks in various sectors. Manufacturing stocks. which accounted for nearl y a half of all stocks at the cnd of last year. fe ll in 1996 Q2 for Ihe lirst time in almosl three years. They probably also fcll in the third quarter. judging by evidence from the Chartered Institllte of Purchasing and Supply (CiPS) Survey. Stocks in the di stribution industries-the second largest holders of stocksincreased at around the ir long-run average bst year, but in the first half of Ihi s year rose twice as quickly.
The difference in stockbuildi ng across sectors in the second qu arter was consisten t with survey evidencenoted in the prev ious Rep0rl- that in the first half of thi s year manu fac turers held too many stocks, and wholesalers too few. More recent surveys ind icate that manufacturers· excess stocks have fallen since then. but that wholesale rs may have built up stocks loo rapidl y: the balance of who1eS,llers reporting that stocks relat ive to ex pected sales were more Ihan adequate was above its ten-year average in the past three months' C BI Distributi ve Trades Surveys. Retai lers' stocks have fall en according to the same surveys. perhaps rellecting strong growth in retail sales over the summer.
(I) The pr~\,II)II' R~/",rt "'G"ed Ih"t ,I wa, he,t tu . ,];,I )',c ,"ock, d" ," cxduJIIIS the , t' ''"I ,,·,,1 " " ~lIl11e ll' Th:,1 aJJu' lntC nl "made by Ihe O NS 10 Ihc expclld 'lufC lIIea'u r~ "rGDr ," a, IQ make il tall y w,lh 'he ou'pul IIIC", ,, rc, Scc P:'Bc 2J "r lhe " "GU,1 19')6 h ,j1l11io/j RC!,ort . and page 24 o f the May 1'.1')5 /, ojIlII;OO 111",""'1.
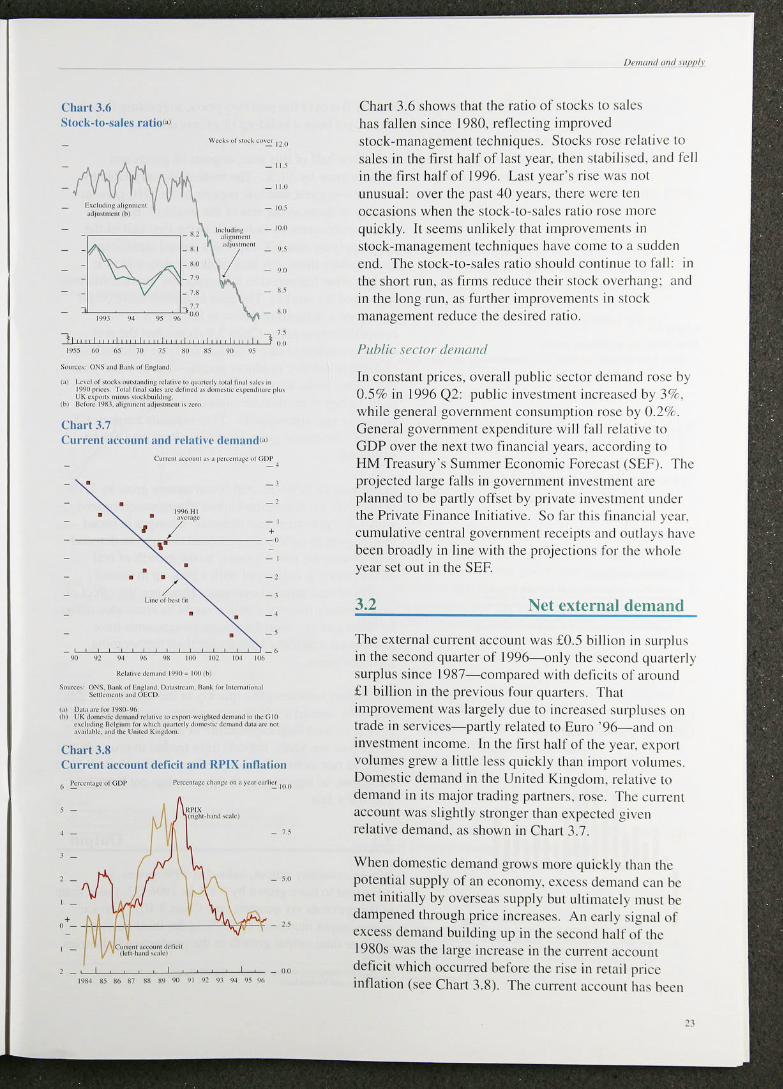
Chart 3,(, Strn:k-to-.. alell ralin'"
_ HO
- 10'
_ 10<1
-" - ~"
- " '" " J I " I II II ' , 11 " ,1"'11"1, 1" " 11 ,. , 11 , , ,1, J ou
,~ W ~ W l ' ~ ~ • ~
"''''''', O~, ... Id H ..... , .. 1:.,1 ......
I " 1..,,,1,. """, '''''" ..... " •• ""~". "''1" .. ,.,1, .... 11, ... ' ... 1<, ,. 1l1'l(I "''''' 1',0.' (,n,1 "I<, .M, >1«,11«1 .. hI<""",~ ......... H"'" pI<!, , """,0" no" .. , ,'" ,0.'''''''1
Ib, ..."".< 191\ .oI,~.,.., .. .-If""""''''' ,«"
Chart .l7 Cur n 'nt an 'ounl :md relathe demand,.,
•
• •
•
• ,
•
('0,,,, .... ,_.,."'" ... , .... ,. ,~)/' -'
--I_In .. ...... -,
/ • -. , -,
• • / -. 1_,,,, ,. b"" t.
• • -, • -,
K, '" ".",",,",,, 'wo. UXI ,hJ
.1«0 '>0, 0:-;'. n .... " 1.11$ 1.00. 1>.< .. """" .... . I,~ 1"1<In,, • • ,,1 :><" 1< .. "." -' O! Cl>
,., !l ... .ud,~ 1'1.«1 "" oM UK _''',>1< ...... "1~,,.~,<'''' ...... Iht<.d''''''''''' ,. ""';111
<,' '''~'n. ''''I".m ". ~h~h .,...,,,,) hI< .. ",,~ >1<.0-1 ............. ..... ,.0111< ...... "" l -.",,~ "'"~'"
Ch .... t .lX Current a('count defi ci t and RI'I X inllat ion
6 !:!"'''''' .... ",Cd>P ...... _,"'''t<' .... ,< ... < .. I~III ..
, - K~l.\ ".p-b.ifkJ ...... ,
, - _B
, -
, ! , _ 00
1'>1<' ~, ~. ~7 ~~ "" '10 "1 "! 'H q,1 ~\ ""
Oc",,,,,,/ (IIul '''1'1'/'
Chart 3.6 shows that the ratio or stocks to sa les has fa llcn since 1980. renecting improved stock-management tech niqucs. Stock!-; ro!'>e relali ve to sa les in the fi rst ha lf of last year. then stabilised. and fell in the fi rst ha lf of 1996. Last year' !,> rise was not un usua l: over the past 40 years. there were ten occasions when the stock-to-sa le!'> rat io rose more quic kl y. It seems unlikel y that improve ments in stock-management tec hnique!'> have come to a sudden end. The stock- t o-sa le~ ratio should continue [0 fall: in the short run. as fi rms reduce the ir !'>tock overhang: ilnd in the long run. as furt her improvements in stock management reduce the desired ratio.
PI/bli(· .Iec/or de/llwlt!
in constant prices. overall public sec tor demand ro~e by 0.5% in 1996 Q2: public investment increased by 3o/r . whi le genera l government consumption rose by 0.29( . General government expenditu re wi ll fall re lati ve to GDP over the nex t two financia l years. accordi ng to HM Treasury 's Summer Economic Forecast (SEF). The projected large fal ls in govern men t investment are planned to be partly ofl:"et by private invest ment under the Private Finance ini tiative. So fa r this financial year. eUlllu lmive cClltral government recei pts and outlays lla\ e been broadl y in line with the projections for the whole year set out in the SEF.
3.2 Net external demand
The ex tern al current account was £0.5 billion in surplus in the second qu. lI· ter of I 996- onl y the second quarterl y surplus since I 987-comparcd with delic its of around £ 1 bill ion in the prev ious four quarters. That improvement was largel y due to increased surpluses on trade in services-parlly related to Euro '96- and on investment income. In the first ha lf of the year. export volu mes grew a litt le less qu ickl y than import volumes. Domestic demand in the United Kingdom. relat ive to demand in it s major trading part ners. rose. The current accoun t was Sligh tly stronger than expected given relmive demand. as shown in Chart 3.7.
When domestic demand grows more quickl y than the pote nt ial supply of an economy, exces~ demand ciln be met initially by overseas supply but ultimately must be dampened through price increases. An earl y signal or excess demand buil d ing up in the second ha lf of the 1980s was the large increase in the current account defi cit whic h occ urred be fore the rise in reta il price inOation (scc Chart 3.8). The current account has been

Ch:II·I .t" Ih'al d r ct \i ,\, C"th llll ),:l' ralc'"
l'""'~ lOO - , I<
_11Il
_ ,0'
:_100
- "
".... "" ",", " ... \ ,. I "" .....
", ,,, ........ , ,",,',,' ,,,', .. ,~, ,~, "".''''.1 '., ''',or<' '" "I .. , .. 1"'..1", •.• I""" '"~, "_,,,. "",,,.,,~ 'u.' j"U '. I'~~' ..... h.,,,,,''' ' ,,''', .. 1'',,1 .... « I"'''' '" ,h<' (;1 I) ... ". , .... --«- .... .... " ... ",H, .. , ~, .... " , ...... " ..... ,"',,' .. , "" " ... ,".,] ,cl,,,., I." ..... '" I.~.·'. "" ,I", ,.., .... ""' .. "~,,,, .,,10 .... < , .• , ,,",",on. ."h, ,, ,,·.' '" ' .. ... ,,,',., ",,1 [J.. ... ,, '00;, "",lI ", ,..,cI ... ' ,,,,, ..... ,
('harl .' . 111 Q ua rll' rl \ ),:1'1I\l lh "r rclIl (;1)1)
''' .... ",,'' ..... "' ... """"."~ .. ,, -! .. , -I"to
- 01'
-",
-to,' " -0 .... '
-O,~
-U'f)
- 0 )'
- , - 1", ." ,, ' 'H %
broadl y !lat over the past two years. suggesti ng that there ha~ not yet been a build-up of excess demand .
In the first h"lf o f this year, exports o f goods and services grew by 3 '/:%. The trade data-ava ilable by country-suggest that UK ex ports to the G I 0 grew as qu ickl y as those to the rest of the world .(1) But G 10 total import s g rew by onl y '/~% in the first ha lf of the year. impl yin g that UK ex porte rs gained significant market share there. (A l:lck of timely data makes it unclear what happened 10 UK ex porters ' market share in the rest o f the world .) The guin in market share could have becn it del'lyed response to last year' s competiti vencss gain. Chart 3 .9 shows that the renl effecti ve exchan ge rate- the nominal rate adju sted for changes in relati ve producer pri ces-was low last yenr. But it rose in the first half o f this year. and will have risen further since then because of the large nominal exchange rate apprec iation. That suggests a ri sk to UK export s: Ihe recent gai ns in market share may no t be slls tai ned.
In the year to 1996 Q2. real broad money grew by 2. 1 % in the G I O. exc luding the United Kingdom. compared with 1.2% growth of real demand . Changes in broad money growth have ofte n preceded changes in demand growth over the past 15 years, so the growth of rea l broad money is consistent with a pick-up in annual growth of real demand overseas. However. the effect of expansion,u'y monet ary policy mi ght be somewhat orfset by fi scal poli cy: most European governments have announ ced res tri ctive budget s for their forthcoming financial years.
UK import volumes grew qui ckl y in the first half o f this year- by .lround 2'1.% in each quarter-compared with growth in total fina l ex pend iture of abou t I % a quarter. In the past ten years. imports have tended to grow about Iwice as fast as total final expe nditure in the United Kingdom. so import growth this year has not been unusuall y fast.
3.3 Output
Whole-econom y o ut put. valued at 1990 prices. is estimated to have grown by 0.8% in 1996 Q3. faster than in the previous six quarters (see Chart 3. 10). Service sector outpul increased by 0 .9% in the third quarter. stronger than output growth in the production industries.
(I) Tile G 10 c"",pri,c, clc'·~ " c""", ric,: lI\e G7. lJcI~,,"n. the Nellierlu,,,"Swcde" ,,,,d Sw,l ,c rl ""d.
Charl.l.11 \\,h()lt .tCllnum~ hlhour IJn.(lul· li\il~
Tahlc 3.10:
1''' ''''' ''''') _ 10(1
_ 'I(,
0·", ·,m -I"" - Ill' _1U1 .,~
-w' _ 1IJ .,. -,W'''' .. , .. _Ill' 1·,, 01, "I. ,,1._00
" '"
Chlll1J,:C~ in ~tl' loral oulpul durhl J,: 111l' rtt·t~~ion and I't C()\ cr~
I'<r"<'''''~< I"'''-C'''"~'' ,h"n,,· ,I",,~ .. I 1)0"",< [)urm~ 1 .... )(, Q!J (;1)1' , .. r,-«""", .~\ '""ul "')' ,", 1'1'15 (,)1
Gil l' ". " lib D A~,«ul"H" '" H I()~ SI) ~ bn"f"<''''H'S p".Ju"""" 212 -7.\ n ·\11
,,1"'/",/, (11<"", .• " ,n,J ",,,,,.,,,,.)r Io~r<'" I 2.4 '" 1611 H \k",I" .1 27 ·1' I " ." 00..." p",J""",",
,00"'''"" '" " 2S .1 ~_ K
COII'I<u<W'" " 12 l "' " S.",<:<, 6.1 I ·1' , " " ' >{ " 'h"h T.an,p"" ""'"t<
:and C<'nln ... " .. · .. ,,"" ,., .. " 24 1 " , . , I. 1'1'10
'hi :=;Q~'~';,;,.Q; :~I~~~"'~' ./(~;'''''''I~·Q'!'":,,,:,!~,,, .. .,1,1>1<, ", ~, .... """"'" n ........ "" ...... "'''~< .... k. """"", ... "..oN h<f<_
-"""1"<1>< ... ,,.
/k",,,,,,I ,,,,,/IIII'I!/'
Manufacturi ng firms' Olll put fell between the thi rd qua rter of last year and 1996 Q2 <I '\' manuracturer.\, soug ht to reduce their stock ... Bu t man uract urer.\, increased thei r o ut put in 1996 Q3. ,lIld in October. manufacturi ng new orders incrca..,ed at their fastest rate si nce September 199-'. according to the CIPS survcy.
Following the measure:-. laken la co ntro llhe 'pread of BSE. such as the c ulling o f catt le. ag ricultural output fell sharpl y In 1996 Q2: it red uced GDr growl h by about 0.1 percentage point s. Accordin g to the ONS. agricultural o utpu t rose 1ll<lrkedly in Ihe third quart er.
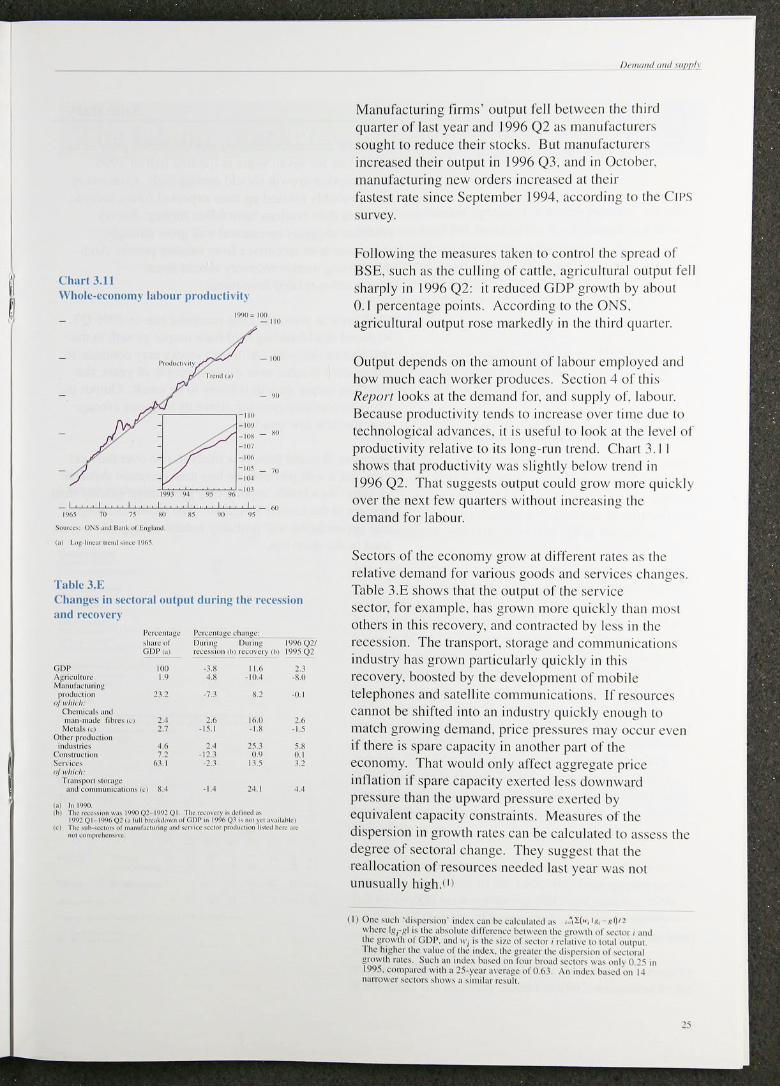
Output depend s on the amount of labour employed and how much each worker prod uce:-.. Section'" or thiS Repol"/ looks al the demand for. and :-.uppl y of. labour. Because producti vity tend:-. to increa:-.e ove r ti me due to tech nolog ical ad vances. it i:-. usefu l to look at the level or prod ucti vity relative to it:-.long-run trend. Chart 3.11 shows that productiv ity W,IS :-. Iig htly below trend in 1996 Q2. That sugge.\,t.\, output could g row more quickl ) ovcr the next rew quarters without increasi ng the demand for labour.
Sectors o f the economy grow at difrerent rate~ a~ the relative demand for vari ous good:-- and service:-- change,. Tablc 3.E shows that the output or the ..,e rvice sector, for example. has grown more quickly than mo,t others in thi s recovery. and cOlllr:lCted by le~:-- in the reccssion. The tnlllsport. storage and communi cation:-industry has g rown ptlrti cu l:l rl y q ui ckl y in this recovery. boostcd by the development o f mo bilc telephones and sa tellite com munications. Ir rcsource:-. ca nnot be shift ed into an industry qui ckl y enough to match growing demand. price pressures may occur evcn ir there is spare capacity in another part of the economy. That would only arrect :lggregatc price inllation ir spare capacit y exerted lc:-.:-- downward pressure than the upw;trd pressure exerted by equi vale nt capacity const rai nb, Measures or the dispers ion in growth rates can be calculated to asses:-- the degree or sectoral c hange. They suggest that the rea llocati on o r resources needed la:-'I year was not unu suall y high.m
11) Onc ,u,'h 'd"pcr"o,, - ""lex CJn I>c ,·"kul.lled." •• ,l:{ .. , I ~. - ~ 1)11 "h~", I ,~,~,~I " Ihc n",()lu!~ d,fT~'~n,-c h<,,1\\ ~"n Ilk' 8",,,(h "I , ,'dor , ~nd 11> .. • gm"lh 01 GDI', and "i" Ih~ ,"~ "I ,e~lur i rd_'I''''' IO IOl~1 OUI PUI The I"gher Ih .. · ,_,Ine "I Ih~ md~~, Ih .. • ~ r"'_'IC' lhe d"I""''''" "I "'do" ,1 £""'Ih ml~,. Su,-h " n Indc\ "",,'d "" 1,1", 1>,,,,,01 ,cd,'", "_" ' >111 ) O. h "' 1995, comp..r,,·d ",I!).! 15 ' )'~a, '''cr:')I~''1 0.(1 .1. ' \11 ""k' b_,,~d "" i~ n"fHma ",''',,,, ,h"",,, ,illlllar ,,-,uli

3.4 Summary
Domestic demand. excluding slockbuilding. grew at its fas test miC fo r seven years in the first hal f of 1996. Consumption growt h should remai n high. Consumers h(lve probabl y revised up their expected future income. and their debt burdens have fallen further. Survey ev idence suggests investment wi ll grow strongly. consisten t with incenti ves from re lative prices. And the housing market recove ry should boost construction-re lat ed investment.
GDP grew at above il s long-rull trend rate in 1996 Q3. Reduced slockbuilding held back output growth in the firsl half of thi s yem. Although stocks may continue to fall rehlli ve 10 sa les over the next cou ple of yea rs. the e ffec t on outplll growth is li kely to be small. Output is likcly to contin uc growing above its long- run average over the next fcw quarters.
Overseas demand growth is likely to rise over the next year. but it will probably be less than domest ic demand growth . As a result im ports may grow more quick ly than ex ports in thc United Kingdom. The recent exc hange rate appreciation will probably reduce net exports too. at least in the short run.
The labour market
Table ·b\ Chanj!c'> in the demand for labour
,,., Q' 0' 0'
Un.'n'.,.Ql n .. 'n, CI."II.n, c,..". ." ., " tFS I" ""."'I~''l'''''"' " ." '" N.m"'"",'ol "" "" \\ I~~ '''''.,"". "
, n.' tH m •• ,", " " ·17 n .•
.:mplo)llIrll l 11'11: II'Ca,""" ." " II .a
L~,~ I. ' ,nC"'""" " '" 10 ."
ONS 1lI ' '''UI 'o<tullll~ " ." n."
Itou rs "br~~d I'0r "C" ~ .h, New ONS Ilk''''''''" ., " o.~ 11.-I.I 'S ,., ""'"""~ '" U,~ 11.' \'""",;",, " " (" 1-""", ".« ''''' 'l "', .... "'''~ ,,,G,, .. 8, • ...., , ... "',~"','
I,,,,, I", ........ Q' ~""",,"I>< '"'"10" ""n". 01<,,,,,,,,, S<I"<""'«. 'K~"'« . .... ,,,,,",,",,
,h' Pa'·' ...... ' .... "",
Tahle -I.n Joh sunc),
,~,
HCC ,., 5< .... "0, M.,,,,'''' IU"n,
CHl lbI ~bnuta<'u"''lI
,,' ~<I' tI'f« "k""~' ,h' ,~'" 'oo, "","'h,
Q'
" " "
,-Q' Q' '" Q'
" " ,
" '" • • " • '" " '"
Q' Q' '" " n n,~
" " ••
" .1.1 n.a
<I I~ 17
4
The labour market tig hte ned in recent months: c laimant unemployment fell faster in the third quarter and there was a s ignificant fall in unemployment 011 the irllcrnalional standardi sed definiti on dUring Ihe summer. An estimate of the gap between Iota I hours worked in Ihe economy ilnd th ose people are prepared IQ olTer narrowed.
Nominal earnings growth is inc reas ing. Unde rl yin g nominal earnings grow th rose from a low of 31/.% 111
December to 4% in Jul y and Aug ust.
4.1 Demand for labour
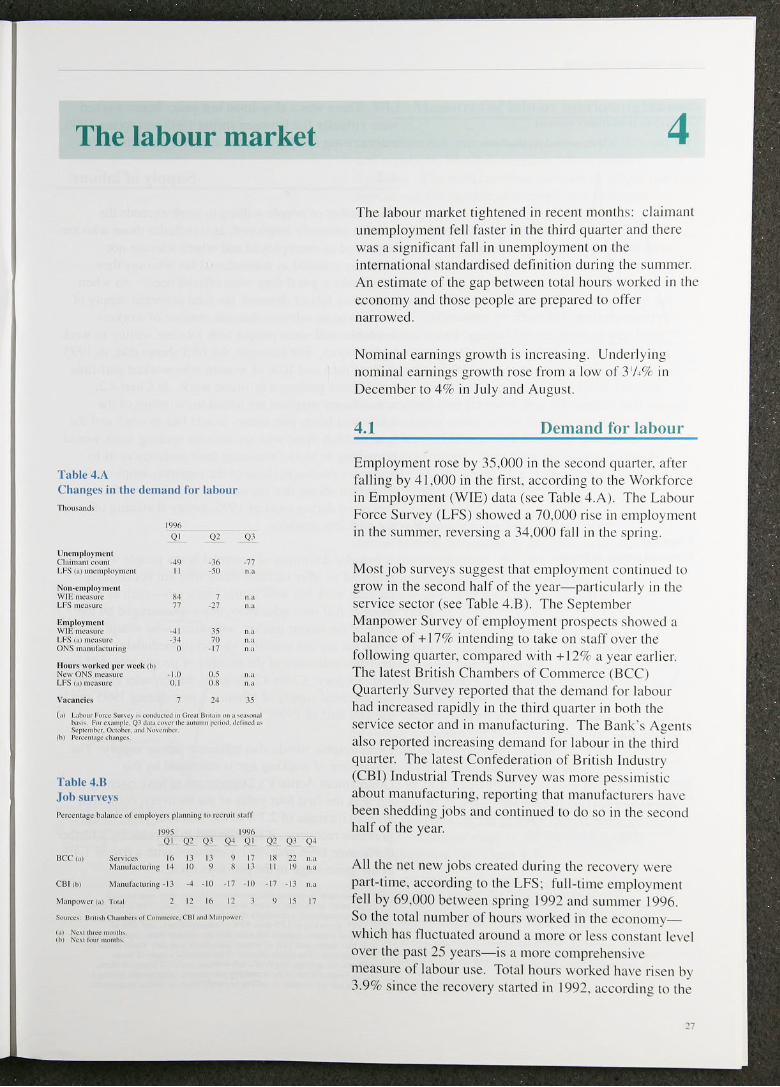
Employmen t rose by 35.000 in the :.ccond qu;u1er. a fter falling by -l1.OOO in the firM . according. tQ Ihe Work force in Employment (W IE) data (see Table ~ .A). The Labour Force Survey (LFS) showed a 70 .000 ri se in employ ment in the summer. reve rsing a 34.000 rail in the spring .
Most job surveys suggest Ihat empl oymcnt continued to grow in the second half of the year- particularl y in the service sector (sec Table 4,B), The Septe mber Manpower Su rvey o f e mploymcnt prospecb showed a balance of + 170/(' intending to take o n st,lll ovcr Ihe following quancr. co mp,lred with + 12% a yea r earl ier. The 1,IIest Briti sh Chambers of Commerce (BCC) Quarterl y Survey reported Ihat the demand fo r labour had increascd rapidl y in Ihe th ird quarter in bot h Ihe se rvice sector and in manufactu ring. The Bank ';, Agen t), al so reported increasing demand fo r labour in the third quarter. The latest Confederati on of Briti sh Indu),try (CB I) Industrial Trend s Survey was more pess imis tic abou t manufacturing. repo rting thal manufacturer~ ha\e been shedding jobs and continued to do so in the second half of the year.
All the net new jobs crea ted during the recovery were part-time. according [0 the LFS: full- [ime employment fell by 69.000 between spring 1992 and summe r 1996. So the [OIalllUmbcr of hours worked in the eeonomywhich has Ouctu(I[eci around a marc or less co nstant le\'el over the P<lst 25 years- is a more comprehensive measure of labour use. Total hours worked have ri sen by 3.9% since th e recovery started in 1992. according to the
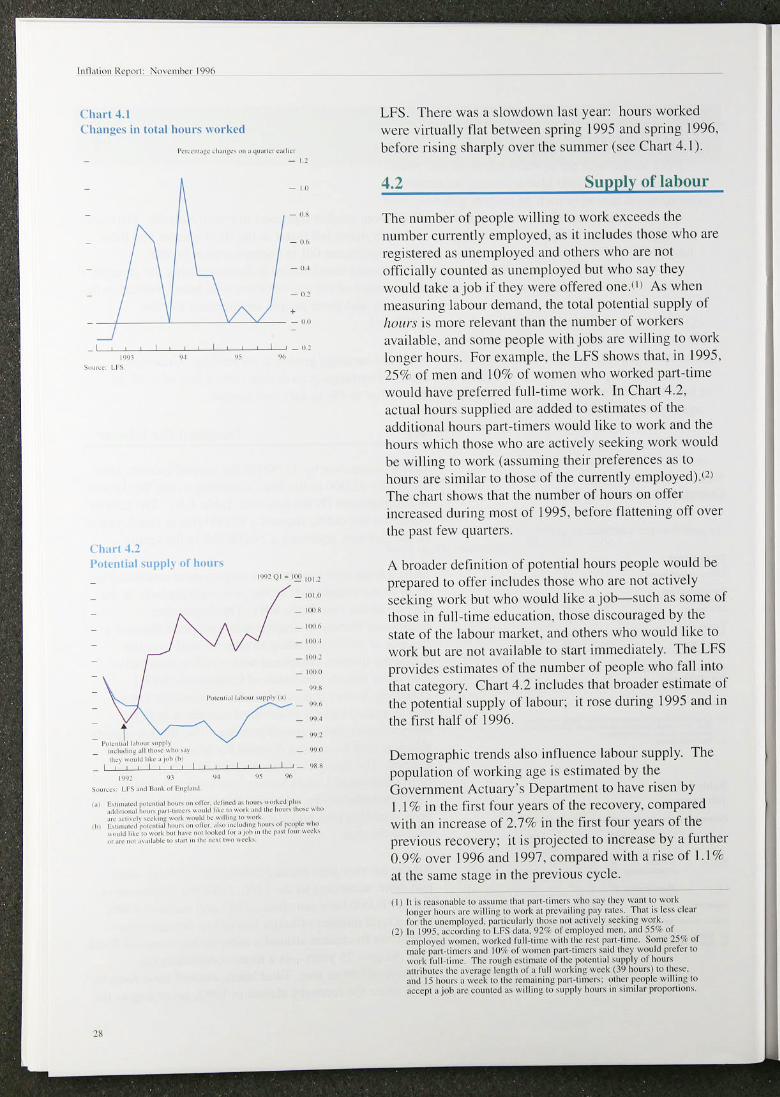
Chart " .1 Ch:lll)!c, in tutal hour, \\ Orkl·d
I'<M,",,< , ..... J<' "" .... _, ,,"h'" - I ~
- 11)
- .. ~ - (j ,
_ 0, •
_-/-___ -'-___ -"''--''-''--__ .. 0
I I
I"" , ,,"," I I ,
Ch .. r! ".1
I I I _ U!
." .J< ""
I'ulcntial ,uppl~ "I' huur, , .... !Q,.,~ 101!
_ 1010
_IW ~
_ LUU I
_lOO!
_ 'wo
","" ,,, 11 ,,,,.,, '"rr" ,. , - " '
• - I " ..,.' ... ,1 ....... '"1'1'"
- ... ~ _ ''''''''',., .. ,.,. .... ,. .... ) - ~,
.t.'1 •••• ldhl<., .... ,~. - I I I ' I I . , I I ' .. ," I "'m .. ' .... "'''''''' ... '"_, ,,,,.'et. "'.--' .... '"_. ~<rl<d rtu·
.J,J" .... '"_' J'M"""'" ., .. k! hl< ,,, ... ' -'1 ... _._ • ...,
'h, :7,,::,:,:~I~:~':f ~= :.':.~,~.7~:'~~~.;~ .. "oo r<"I"<.ho .,.dd ',1< I~ .,., .... "'" _ h ...... I", • "", on ,''' 1"" r_ - .. , . •• "" ........ I_"'~ .... 'n' .... ""' ....... d,
"
LFS. There was a slowdowll last year: hours worked were \' in ually nat between spring 1995 and spri ng 1996. before risi ng sharpl y over the su mmer (see Chart 4. 1).
4.2 Supply of labour
The number of people will ing 10 work exceeds the numbe r curren tly employed. as il incl udes those who are registered as unemployed .md others who are not officiall y counted <IS unemployed but who say they would take a job if they we re a lTered o ne .(I) As whe n measuri ng labour demand. the IOtal potential su ppl y of hOllrs is Illore re levant than the number of workers avai lable. and some people with jobs are wi llin g to work longer hours. For example. the LFS shows that. in 1995. 25% o f men and 10% of women who worked part-ti me would have preferred fu ll -time work. In Chart 4 .2. actual hours supplied arc added to estimates of the add itional hours part -timers would like to work and the hours which those who are active ly seeking work would be will ing to work (assuming their preferences as to hou rs are similar to those of the currently employed).(2) The chart shows that the number o f hours on offer increased during most of 1995. before nattening o ff over the past few quarters.
A broader defin ition o f potential hours people would be prepared to offer includes those who are not actively seeking work but who wou ld like a job-such as some of those in fu lt -time ed ucat ion. those discouraged by the state of the labour market. and others who woul d like to work but are not avai lable to start immedi ate ly. The LFS prov ides estimates of the number of peop le who fa ll into that category. Chart 4.2 includes that broader esti mate of the potential supply of labour: it rose during 1995 and in the first half of 1996 .
Demographic trends also in n llcnee labour supply. The population of working age is esti mated by the Govern ment Actuary's Department to have risen by 1.1 % in the first fO ll r years o f the recovery. compared with an increasc of 2.7% in the firs t fou r years of the previolls recovery: it is projected to increase by a further 0.9% over 1996 and 1997. compared with a rise o f 1.1 % ill the sallle stage in the previous cycle.
(I) It "fea,on.,bk 10 a"um<: Ih,,( pan . tomc" "ho "') lhey w:onl!O work lonl!cr hou" arc will"'~ 10 WQfk m pfevall,ng p~y rdl~S. ThaI i, le" ~kaf IOf Ihe UllCmpIQ)cll. p:"',~ul.,,l y 1110", ~ol '1Cll\'cly .",cli~g WQfk.
12) I" 19<)~ . ,,~c"fding IV LE'S d"I:O. 92~" of cmplQ)cd men. and 55<;< of ClIlplo)cd womcn. n'ofl.~d full · li",e wtlh Ihc reIl pan·tome. Some 25<;< of m~lc parl-I"n~f' ,,,,11 lOCI 01 Women pan-lime" _a,d Ihey would prefer (0 wmk hl ll' IImc . The f'"I~h C,lImdlc or Ihe fIOlcnli~1 ,upply of houfS attrihulc, (he ,"cra~c lenglh of ;l lull WO,~tng wee~ (39 hour.<) to lhc<c. ,,,,11 15 hOUf.' ,,\'CC~ ". Ihe ,emalnin); p,,,!-[imc,,: milef p·coplc wil l in~ 10 ;lccepl" lull orc countell:" willing 10 ""pply houfs in ,imi lar pfopor(ion,.

Chart "".3 Ullt'mplo~ men! and rllJn-l'IllI)lu~ men! ralt'~
"-l'J_
~" -!7 -
1_' _
., -~J.
, "'"''I''''' "~,. ,"< ••• ,,,¥",.h.,,,1 ",1<1
.... ""~""' .. ,-,~. ,I<f,·"-I".I<'
I., " I
~
'" Q>o..---r'o>t ...... ...,
,,,,«"' -re
- .,
- " - , - .
Ibl Il<r,O<d~ ,"" f'Of'<l ...... <oI~"'I,"~. ~ ...... """"' ...... '""'" t ·-.t ~''''''''-~''''''''I<) ."",.....,.. ... <01 ~ .. I ....... _ .. ~~., '1'<0:<".
4.3 Measures of labour market tighlness
In the short run, the interac lion between the demand for. and suppl y of. labour determines labour marke t tightness. The 1110st common mca~ure o f labour market tightness is the number of unemployed cla iman ts.
Claimant unempl oy men t fe ll by an average of 25.700 a month in the three months to September. In the three months to Ju ne, un em ploy ment declined by an average of 12. 100 a month. In October. th e claimant unemploy ment ligures wil l start 10 be reduced by thc Jobseeker's Al lowance.(I) T hat will cut the period of non-means-tested benefit s for the unemployed from twelve to six months. The immedrate effect will be to remove onl y 35.000 peop le from the claimant cou nt over the next six mont hs. according to the ONS. because those unempl oyed for more than six months will remain on the claimalll coun t unle:-:- they choose not to sign on in order to contin ue the ir National Insurance contribu tion record . Over ti me more people may be removed from the coun t. if it itllprovc~ the ir incenti\ e to look for work.
The international standardi sed definition of unemployment. measured by the LFS. i:- unaffected b) administ rati ve changes: the LFS asks indi viduals direct ly whet her they have been looking fo r ajob in the past four weeks. The total fcl l by 50.000 in summcr 1996.
Another measu rc of labour market ti ghtness is the non~employment rat eP) Indeed. non-employme nt may be more appropriate than claimant unemploy ment 1.IS an indicator of labour markct ti ghtness across cyc les. because uncmpl oy me nt was reduced in the carly 1990s by people withdraw ing from the labour force-some of whom may be discouragcd workers.(·I) The UK non-employment rate fell from a peak of 28.8'* in 1993 Q2 to 28. 1 % in 1995 Q ... L it rose sli ght ly in the fir~t half of 1996 to 28.3%. That overa ll decl ine was small er than the fall from 30.5% in 1983 Q2 to 29.0% in 1986 Q2-a similar stage of the previous cycle in non-employment (sec Chart 4.3).
(I) Thc J ob>cc ~er". AII"";,,,cc h~. a)leeled ","Uplc )0"''''1' Ihe unernplm "",", COunl "nce Ap"r oflh,. )"~'. TI,..!iN e' ~I\\1"l W;o, "'''"''''I,-.,,,d ,n -Oclobe'-<>nl) .Ih,,,c \\ h" fad ItIC m,,,,,, '~'I and do nOl "1''' On '" orJ<.-r 10 """''''U~ Ihe,r N;ouo" .• r It""""",,; ,'"",,,1)01,,-,,, "''''.11"<1 \\ ,11 dr"r) oft 11><CO",,!. The erfCel n" lite """'" ,. It~d) Iu h,. •• pn·~d I.mh c,c"l) mer ," I11o'''h,_
(2) Defined '" Ih.· ,,"pulal"'" "r w"" ''' l' .'go: ""hnUI .:"'pie'} "Will '" Ihe Unolcd KH'gd0111 d,,",de" h) Ih,· 1" 'pul.,,,,,,, "r ""'~"'g "l'c. n,,, "",,,,u,,, of empioY' llcnI ",e" ,. It,,· WII, O"·."II',· • . r- Ih" Cl" ,." i>()lh ",·,iOO, or ",""vcry.
0) Sce A"l''''' 1996 /" /1111"''' R<"J"m. I'~g'" 11 _.'\,

Chart ....... (; ;111 hctllccn IlOtl'utia! huul'~ un olTer ;lIld huur, (il-m;tll(kd
" ..... ,.1>0 "'~"" .. ,::::.~ .. ,,,,,',j'
'''-",)-
1"'_ ' ..
,., ,~"h"' ...... ,
1'''_ ,",'M· ......... .."
," I~" -
'" 1"1_ ' , 'J
,,' '" '''"'''' 11''''''' 11 .... '- •• I ".1 ......
\1 ,11_ .... ,. 1>0_ •• ..,. , ... .., ,",<n"",
-
-
1 -
, .,t>. .. , "''''-'' ,,,h" "'"~ -
-
-" %
'.. 1','<,",., ... _. ,", ,."" <1<10,,,,1 " ..... " ~,~L,J r""' 1>0 .. ,. 'loo ..
,"
1"
,",
,,,
". 1'1'
~
... ,,,,1, '« ... ~ <"'r.~ ",,0' ., .. Id 'o!.< '" ."., "", ........ " • ...., ... _ r"'" ,.""" .,,,101 h., ,,,., ....
,.,. r, ................... ,,, .I","""., ... ,,' "'" ..w.' ..... lh ... · .... ,"1'.11 ....... ' .... '.." d." .... Id h', ......
Chart ... .:; Skill ,hnrw).:c\
....... , .... ""'" I., .... "" h"I, ,,,10 .. ,, ),,,,,"pooI"'" ,.., """ r"", ... ,oh.·
,",." ",I..,J 1.01>0 ...
'" 1""'"""." .. ,.,,.""''',,', .. '''' ..... ,,''
10
In principle, the 1110st com prehensive measure of the state of the labour market is the estimated ba lance between the potential number of hours people are prepared to work and those hours actually worked (see Chart ... .4). Ir the potential suppl y or hours IS defi ned as those offered by people currentl y actively seeking work and part-timers who say they wou ld like to work full -time. the labour market ti ghtened between the winter of 1992 and spring 1995 and then stabili sed. before tightening further in the Slllnmer of 1996. If all those who say they would like a job are included in potential labour supply-whether or not they are officially classified as unemployed- the profile is similar.
The stock of vacancies advert ised at Jobcentres rose by an average of 1 1,600 a month in the th ree months to September. up from 7,900 in the three months to June: vacancies are now at their highest level since May 1988. But the stock of vacancies has been inflated by the introduction of thc Labour Market Software system. dcsigned to deal wit h the Jobseeker's Allowance. That has deprcsscd the number of people placed in jobs since the beginning of this ycar.( 1) According to the ONS, the effect is likel y to persist over the nex t few months, so vacanc ies arc not curren tl y :1 good indicator of labour markct tightness.
Skill shortages have increased sharply in recent years in both the servi ce and manufacturing sectors, according to the BCC Survey. The balance of respondents reporting recruitment difficulties in manufacturing rose fairly steadi ly from +23% in 1992 Q2 to +64% in 1996 Q3; in se rvi ces. the balance rose from a low of +20% in 1991 Q3 to +57% in 1996 Q3. The latest CBI Ind ustrial Trends Survey suggests ski ll shortages in manufacturing arc less of a problcmthan is implied by the BCe. however. wi th a balance of onl y + 10% of manufacturers reponing shortages of sk illed labour. Chart 4.5 shows that this measure has crept up from very low levels in the early 1 990s. and is now at a similar le\'cl to that seen at a sim il ar stage of the previolls cycle .
In conclusion. the 1110st comprehensive indicator of labour market tightncss-the balance between hours demanded and those potentially avai lable to employerssuggcsts that the labour markct ti ghtened in the second quarter, after being fairly stable over the preceding ye;:!r. Other evidcnce corroborates this picture of a tightening
( t ) Innow., to "a':alle;c, I""" "ot II1;CII affeeled, b,,( Olllnow, h:,,'c f~lIcn ,ign,fic:,n!ly. u, ,lall at JObcClIlrc, ha"c '"fIlcd their a\lcmion to (he new '("If(w",c

ClllIrl -'.f, RcallJroduCI Ilagc per Cl1lpl()~Cl': ' "
rCl·o\·cries cOlllpared
1'111' 1)1
'WlQ'
-,.
- ,,, ..
_ 'iI'
_ IO~
I ' , , ! , , , I '_ 'Ill
" ~"'_"<"'$h,"G! )! '
'.1 Th< .... f"<'oIo<' '' .... " ... (, ...... " ... "''''r, ... ,'''f'I''I"_,.... <m~<', " .. " ........ 40' ~ 10) "" ( ;t)!' .a... .. .. , .... ,'" «>-< no.. " ,h.. o\o , .... !o) 11( ' "'f'Ool«" " '" ...... )""'" P"' "" h"" ,
labour market: in particular. the re we re s igns of rising skill shortages.
4.4 Nominal earnings
Underly ing nominal earnings growth pi cked up from 3'/.% in May. at the timc of the prev ious I lIflalioll Reporf. to 4% in Aug ust. Bo th manufacturing and service sector earnings growth inc reased . and there were s igns that pri vate sector no minal earnings accelerated.
Wage settlement s have a lso risen over the past few months. after falling in the firs t few month s of the year. The Bank 's three-Illo nth employmen t-we ight ed mean settl ement- wh ich in cludes data frolll the CB t. Industria l Re lations Scrvices and Incomes Data Serv ices-was 3.5% in Scpte mber. up from 3.2lff in J unc but [he sa me as in January. The same pattern was tru e of publ ic and private sec tor ~elllellle lll s . whi ch were both 3.5% in September. the same as at the beginning of the year.
Nominal earn ings depend both on rea l earni ngs bargained over by employers and em ployees and by the inllation rate they expect. Each of these are examined in tu rn below.
4.5 Real earnings
Real product wages per e mployee(ll-calculated lI sing the quarterl y GDP denator- have g rown more s lowly over the cu rren t recovery than over th e previous upturn (see Chart 4.6). Indeed. the real product wage. measured in th is way. inc reased by 3. 10/" in the first four years of the cu rrent recovery, com pared with 8.8% in tile first four years of the upturn in the early 1980s.
There are three main possi ble exp lanations. Firs\. rea l wages may not be appropriately measured: the real cost to a firm o f empl oy ing labour depends o n the wnge per hour rather than per week: nnd prim/" sector wages may be a better guide to labour market pressure on wages. as wages in the public sector ilre subject to pu blic pay policy. Second. rea l wages Illay have been temporarily subdued. and may be about to accelerate. Third. there may have been a step reduction during thi s recovery in the level of real wages worker:- were prepared to accept for any g iven level of unemployment and labour producti vity. If so. that would have e ntailed a
(I) R",, ) pm<1"~1 "a~~, IX"r~n1I'I,,),·~ arc (ldi",·d." LTK ",,·,'mc fm,1) "ml,lo)"mcnl I'h" cmI'IQ)"Cr' · N,,,,,,,,,,II,,,,,,, ,,,,,, "'''1,,1'''1,,)00, d" l(kd b, Ih" m""I,,·r of UK CUlI'!.')"CC' ;" "0111'1,.) '''COli piu, 11.\1 ror,·", . . ,,,<1 . ddl,,,cd b) the GD!' <1cn"lor.
."
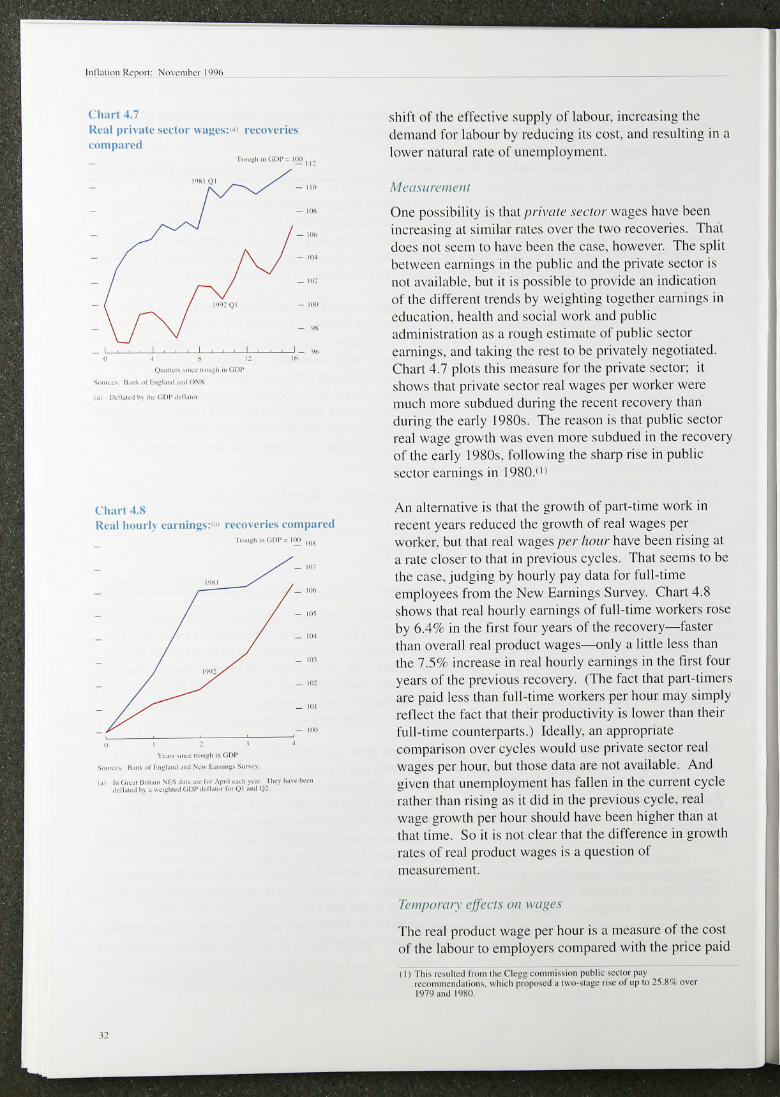
(h .. rl".7 itt'al prhHlc -.ccll)!" \\;IJ,:C':w H'C()H'rit's cumpart'd
'~"'Q'
<)0. .. ", " ... , """,h '" (" ,.. """,·,11,,,, .. ,,,,.,,",,,,,,,,, ,
('harl".R
, '"
_ lIa
-,. -,. _ u"
_ 10:
_ 1(10
- " •
'"
Real hourl~ t':lrninJ,:': ,. r\'coH' ri{'~ cornp;lrt'd
- IQ'
1'1,11
_ 11»
_ IOU
_ 10'
_ 101
_ IIl I
'.:"--;--~:----,---c - ,00
" 1, .. , """." ... ,. ,. (,Ill'
"""'" H .... ,. I .01-'-' ,,~ ( .. _" ,.,><) 1.(", .. H, __ "'u ... ,·'.~ 'rn" ... h), .. 1"" ..... 10«_ ""Uoc.lto.. ~,.,.. ... H;(>I''''n .... I •• 01 -'Q:
shift of the effective suppl y of labour, increasing Ihe demand for labour by reduci ng its cost. and resulti ng in a lower nat ural rate of unemployment.
1\ 1('1/\ III'{'III('III
One poss ibility is that pril'(lfe ,\·e(."lOr wages have been inc reasing at similar rates over the two recoveries. That does not seem to have been the case, however. The split between eurnings in the public and the private sector is not available. but it is poss ible to prov ide an Ind ication of the different trends by weighting togcther earn ings in educalion , hea lth and social work and public admini stration as a rough cstimate of public sector earnings, ;md t"king the rest 10 be priv;llely negotiated . Chart 4.7 plots this mcasure for the private sector: il shows that private sector rea l wages per worker were mueh more subdued during the recent recovery than du ring the early I 980s. The reason is that publ ic ~ector real wage growth was even more subdued in the recovery of the early I 980s, fo llow ing the sharp rise in publ ic sector earnings in 1980.( n
An alternative is that the growth of part-time work in recent years reduced the growt h of real wages per worker, but that re;ll wages per hOl/r have been risi ng at a rate clo~er to that in previoll~ cycles. That ~eems to be the case. judging by hourl y pay data fo r full-time employees from the New Earnings Su rvey. Chart 4.8 shows that real hourly earni ngs of full-time workers rose by 6.4% in the first four years of the recovery-faster than ove ral l real product wages--only a little less than the 7.5% increase in real hourly ea rnings in the fi rst four years of the previolls recovery. (The fact that pan-timers are paid less than fu ll -time workers per hour may simply reneet the fact that their productiv ity is lower than their full-time coun terparts.) Ideally, an appropriate compari son over cycles would use private sector real wages per hour, bu t those data are not avai lable. And give n that unemploymen t has fa llen in the current cycle rather than rising as it did in the pre\!ious cycle, rea l wage growt h per hour should have been higher than at that time. So it is not clear that the difference in growth rates of real product wages is a question of measurement.
Temporary eff(!{'r,~ 011 \rllXe.'
The rea l product wage per hour is a measure of the cost of the labour to employers compared with the price paid
(I) Th" 'c,ull~d rrom Ihe CleG); co"",,,,,"on puhl,c '~Clor I'''>" '~CO"ltllC"lI;,(o<,,". \\I,,~h pmp'"cll a I\\O" I"GC ,;,c or up 10 25.8C,f mc, 197<):l11d 1980.

C hart 4,9 R~:II cun~Ulllllti()n \\ a~~ (J~r l' IIlIlJ()~ Ct' ;
r~l"(l\ ~rit,s cnl1ljlarl'<1 1 ~"Jh ," (;np . 1 ... ) - I".
- 101
1~1 <j1
- .
for Iheir produc ts-that is why it includes e mployers' soc ial securi lY conlribution~ and is denated by the GDr de nalor, a measure of economy· wide price~. But employees arc concerned not wi th the real prod uct wage per hour. but the real take-home pay per hour-the real hourl y consumption wage. The real con~umption wage excludes employer~' :.ocial sec urity contribllti on~
and is denated by the tax and price index. wh ich takes account of changes in di rec t and indirec t taxes as we ll a" prices.
The tax and price index rose by 6'« relative to the GDP denator in thc first four and <l Iwlf years of the early I 980s recovery. while it did not ri se a:. quickl y as the GDP denator in the curre nt recovery. So. whe reas the real product wage per week grew much l e~:. rapidl y in the earl y I 990s than in the carly 1980:.. the rea l consumption wage pcr week increased much in line w it h the 3.8'K ri se over the first four a nd a ha lf year:. in the prev ious recovery (sce Chart 4.9). That mean t that greater labou r suppl y was forthcomi ng at any rea l product wage in the 1990:.. so a llowing employment to grow faster.
What factors allowed real con:.umpti on wages to ri se during thi s recovery, while real product wage growth was relati ve ly slow? There were three l11ain factor:--: the terms of trade. indirect ta xes and direct ta xes. Fi rst. the effect of the te rms of trade- th e price:. peop le pay for imported goods co mpared with the prices of goods produced in the United Kingdom-can be exa mined by considering the r,lIio of RP[Y and the GDP deilator. That measure rose by around I % in the earl y I 980s, but was broadl y flat in the ea rl y 1990s· recovery. so the terms of trade had a s li ghtl y greate r effect on the tax and price index during the early 1980s.
Second. the impact of ind irect taxes can be seen in c hanges in the rati o of the RPIX to RPIY. That rose by three and a ha lf [>crcen tage point s in the recovery of the early I 980s, but onl y two percen tage po ints over the [990s· recovery, suggesting that indi rect taxes had a larger e ffecl on the tax and price index in the earlier upturn .
Lastl y, Ihe e ffect of direcl taxes can be seen in c hanges in the ratio of the tax and pri ce index to the retail price index . That rose by just over half a percentage point in the earl y I 980s. but fe ll more than onc percelHage point in the early 1990s' recovery, suggesting that direct taxes rose faster than prices in th e earli er recovcry. pushin g up the tax and price index as wel l. So the terms of tmde.

Chal"t ·un t{atiu nl nmll' IIUII-malltlal \\cl'k t ~ \laAl'~
10 mal1l1at \'lIAC'
",.,,' "".Q ,.",,,,,. ' ''''''
M .. ,,, -, .... '
-,...,
_, I/)
direct and indircc t ta x~s all had roughly equal effects creati ng a larger 'wedge' between the consumption and product wages in the I 980s than in the 1990s' recovery.
Till' I/(I/lfral raIl' of 11IIl'lIIpfm'III£'1I1
Structural chan ges in the 1980s may have lowered the natural rate of unempl oyment. The pool of labour firms believe to be on offer Illay be less than the total suppl y e ither because of mismatch in the labour marketbetwe(:n sk ill s. occ upati ons or regions-or because workers arc not prepared to accept the market-clearing wagc. The 10ng-rull natural rate of ullemployment depends. therefore. 0 11 f;) ctors which change the deg ree of mi smatch in the labour market or by factors such as job securi ty. the struct ure of bargaining institutions and the benefit system which affect the wage workersindi viduall y or coll ecti vely- arc prepared to accept fo r a g iven job.
What fac tors might have reduced the nalllral rate of unemploymen t recently? Fi rs\. the change in the qual ification period fo r employmen t rights from one year to two years in the mid- 1980s and the reduction in trade union powe r probably reduced the bargaining power of those in jobs. These labour market changes may have had a delayed effect on wages- possibly because the ir imp,let in the 1980s was offset by the relative increase in demand for skilled workers. A shin in demand away from unskilled worke rs, ret1ecting the characteri stics of recent tec hni cal progress, would increase the relative wages of skilled workers: overa llllnem ployment and overall real wages would rise if wages did not fall sufficiently in the un skilled sector to absorb the excess labour suppl y. Male non-manual wages stabi li sed relative to Illanual wages in 1990. however (see Chart 4.10). suggesting that the relative demand shock may have come to an cnd at that ti mc . so that the shock to suppl y began 10 dominate .
Second. there may have becn an increase in the perceived costs of job insecurity in the early I 990s. if thc changing composition of job creation from full -time to part -time tem porary employ ment meant that the penalty attached to losi ng a ful l-time job had increased.(1I Seven ou t of e ight net new jobs created during the recovery were temporary. with onc in three both part-time and temporary.
In ei ther case, the current rate of unemployment is still probably "bove the natural rate of unemployment. and
(I) sc~ '\"S'''' 1\1<)6 h'jI"",,"/1"I"'o" pose 36.
there is probably scope for claimant unemployme nt 10 conlinue 10 f;:1I 1 somewhal before ge nerati ng significant pressure on earni ngs.
The introduction of Ihe Jobsecker's Allowance could have a further e ffect on real wages. if il increases the allractiveness of work relative 10 unemployment. Thai would tend 10 lead 10 (lone-off reduction in real wages fo r any given leve l of productivity. and so presents an additional downside ri sk to real earnings growth.
4.6 Inflation expectations
Innation expectations. measured by th e Barclays Ba"ix Survey. have been fairly slable across the genera l public. economisls and finance director" over the past six mon lhs both at the onc ;:md Iwo-ye<l r horizons. BUI trade union leaders expect innm ion to he arou nd half a percentage point hi gher than Ihey did in March. looking bot h one and two years ahead (sec Seclion 6 for further discussion).
-1.7 Summan
The labour market lightened over Ihe pa:-.I few monlh:-.. after bei ng fairly stable during Ihe preceding year. Nomi nal earnings growth picked lip. Real wages per hour probably inc reased at simi lar rales in the cu rrent and previous recoveri es. although re,11 wages per employee increased much more slowl y in th e recen t recovery. There appears to have been a t~dl in the natural rat e of unem ployment. The introd uction of the Jobsccker's All owance is expec led to remove around 35.000 peop le from Ihe claiman t count over the next six months. It is possible that if it improves the incentives of the unemployed to look for work, rea l wage growth Illay stay low for some time.
-',

5
e lm "' 5. 1 Im pUrI prin', and the c ' t hangl' rail'
" -
,,-!"""'~ "" ..... " ,,'" ~I"", ~." IJ I,,~ I" ,,,".I ...... 1, I
"" _ 1',~" ,,' ''''1'".
",-,I " f ,",,"" ,n.!<, , ,, ,, ",,~,~,
'kit ...... '",.k'
" •• HI .... " ,,_'K' "' .... IY,.j ... It,
''''- ! , I ., .,
-,,, - I~ '
- '"
- I I ~
_,10
"." nK I MI ,. ""~""... _, :o,,~ ... , ..... "' ............... ,,..., 'h< ...... ,,..., ...." ,.~ ,'" ~ .. ", ~ •• ",,,n", 'mf""" ",_,n."" ... ",
.. 'Ah .. " ...... ,,_ ,~, " ..... ""', .. ,,O"', •• d<f« .......
Chart 5.2 Hank ,wrling l'nrmnodil~ price indt''''''
I .t "'~<'''' ~' '' ''''') ,,,,, ,, ,,", ,, ,,. ~"i '''<J b) ">C" ""f'"'.'~< ," I K ."""","
Pricing behaviour
Output price inl1alion has remained subdued since the August Repol"I. as huve import prices. But input prices picked up. and a number or unexpected price increases helped \0 maintain retail price innalioll al just under 3% over the past three mo nths.
5.1 Import prices and the exchange rate
Non-oil imparl prices fell by 1.8% in the three months to August. and were 2.0% below their level a year earlier (see Chart 5.1). More recentl y. movements in the exchange rate may have pu t downward pressure on import price intlation. The sterli ng effective exchange ratc index rose from 84.1 on 2 August to 90.9 on I November, an apprec iation of 8.1 %.
Raw material and commodity prices
The Bank' s UK demand-weighted commodity price index rose 2. 1 % in September, to 2.7% above its level a year earlier. That pick-up was caused by higher o il prices: Chart 5.2 shows that the non-oil index fell in September. Oil accounts for about a fifth of the Bank's commodity price index .
A number of commodity prices have falJcn recently. The prices of imported foodstuffs (such as cocoa and coffee) fe ll by 1.4% in September, reflecting sterling's apprec iation. Metal s' prices. which account for nearly a tenth of the Bank 's index. fe ll by 4.4% in September in response to stock build~ups. Agricultural pri ces. which accou nt fo r more than a third of the index. fcll by 4.2% in August (the latest month for wh ich data are avai lable). That was driven in pari by falling wheat prices following a good harves t. revers ing price rises earlier in the year. And a 3o/c revaluation of the 'green ' exchange rate on I Novcmber wi ll red uce the minimum prices fa rmcrs are guaran teed fo r their products. But the effect on retail food prices wi ll be small. in part because the range of products covered by minimum prices is limited .
5.3 • )ricing by production industries
The I'<l tc of decline in manufucturers' input costs slowed in reccnt mon th s. Inpu t prices were unchanged in Jul y

Chart 5.3 (nl'ut (Irire inf1atiun ;Ind the CII'~ purdl~I"'l'
price indic:ltor
'" I. "I""" 1"''''''''''' "' ,'" ".01, ~""~ .• """" _I 1'<",,,<.,,, "01."",, Ib, R<'I""'I'k'" "" ,,~<~ '''''""""" '''' 1"'" '. r-"-' "','" ".,"' .. """'" _uh n."" , ..... 1".,.,.,,_" '"J''''' ..t.". ''''''''k''''''''''., "'~<,
Tahll.' 5.A Short· run lIIea~ures ur Ilrodul'cr price inl1ation'"
,-AI" .'b) J"ft< J"I~ Au!, xI"
In['<l' ",0<<' B " "' ICJ)
· c"lud,nr HJl" '~1 "' ." ." ·IHo
Qu'['<I' "'"'.'''''' " " " · c.dud'"f Fln1' ,h) " " "' · ~.dud,n~ C'<'''' du"~' (I'Pln '" " "'
Onc·"..,n," r<"e,",,~< d'.n~<'
In['<l' ""<~, " " U, · ~,,' I"""W 1'1)1'1' ,t" ·0.2 ." · 1(,
O"'I""I""'c,"1 "' "" oU · e'''' .... 'ng I:D1''' .", '" Uo "' - ~.d """,J' C>C"" Ju"~,(I'''IY) " '"
.",
,., " .. " ... 11) ;od!", ,,d h) ,I .. 0:< ' . ""r' • "'" ,"""I ' ''' fin!'"" ( ..... , ~"'." ........ "...u "'",,',"'''
0.0 O.CJ
0.0
0" ., , 00
·0 I
""
.~g " ." _1.1
" " " 00
"" "
"' 03 0.2 0. '
02 0.'
"' '" '" (Jl
1<1 10. o~s <loc, "'" f">hh'h .. "'.~ ... " ) ;od,.,,,J "";od, ,,,, '''''1'" ' '"~< ,."." Tu """" ""'" ,h,,) ,((,~" u" ... ~ ... , "". hNd un 'h< "",~",, It ) ... lJ,,,,,d ,,,,,,,,,h>,,>< ''''1'''' I"~< .." .. ' "," I "r'''~ hI ,"" ,.."" '" ""'"'1",1«1 , ... ,,,, .. ,,,.,,,,",,,,,, 1,,,,< 1"''''
Ch:lrI5.4 Producer price inf1~llion
0.0"", I"~<' I""ud". "'''''' 0100 ... ,
_ 100
" '"
• ---1----1-~I-------\-- - "'
and increased in the fo ll owing two mon th!'., mainl y because of o il prices; in September. oil prices rose by 7.0%, addi ng 0.8% to the producer input price index. The change in trend wa~ confirmed by othcr data . Fir,t, the inpu t price index which excl ude!'. food. drink. tobacco and petroleum rose by 0.11ff in September. the second monthl y increase in a row. That fo ll owed twelve consecut ive monthl y fal ls. Second. the Chartered Instit ute of Purchasing ,md Suppl y (OPS) pri(~e index rose by 1.1 index point s to 44.8 in October. it s th ird consec uti ve monthly inc rease (see Chart 5.3). Although the CJPs index did not reach the neutral 50 level. above which manufacturers' input pri ces are gene ral ly risi ng, the increase in October sugges ts that the offi cial input price index may have risen J~lste r in October than in September.
Output pri ce inilation has been very subdued over the past six mon ths. as the short-run inllalion measures in Table 5.A show. But there arc some signs of a change in trend. OulPlll prices rose by O.-l.%- in September. and were 2.2% above their level a year earl ier (see Chart 5.4). And a balance of +99'(' of manufactu rers in the October CB I Industrial Trends Survey expected to increase thei r prices over the next four mon ths. up frolll +2% in Jul y.
The ONS has constructed PPI Y. a new output price series that exc ludes excise duti es and is therefore analogous to the RPIY measure of reta il price inllati on (see Section I). The index has ri sen Illore slowly than the head line output price index since the beginning of the year (see Chart 5.4). The short -run inflat ion measures of PPIY have tendcd to be eve n more subdued than the headline rate over the IXlst six months. because taxes have increased faster than the pri ces charged by manufac turers for the ir output.
Vllif COSh illl//WII/j'{/cfllrillg
About a hal f of manufacturi ng ind ustry's \!ariable costs are accounted for by "Ibour. a fu rther quarter by materia ls and fue ls (incl uding semi-fin ished manufactured imports), and the remainder by impons of fini shed manu l~lctures and bought -in services (such as transport ). Table 5. B shows that domesti c output prices rose more than estimated unit costs in 1996 QI . In 1996 Q2 outpu t price inc reases slowed and unit costs were unchanged. And in th e three months to August. costs and output pri ces rose at th e same ratc. Downward presslIre on manuf<lcture rs ' costs from materials and fue ls and from imports of fini shed manufactures
.'7
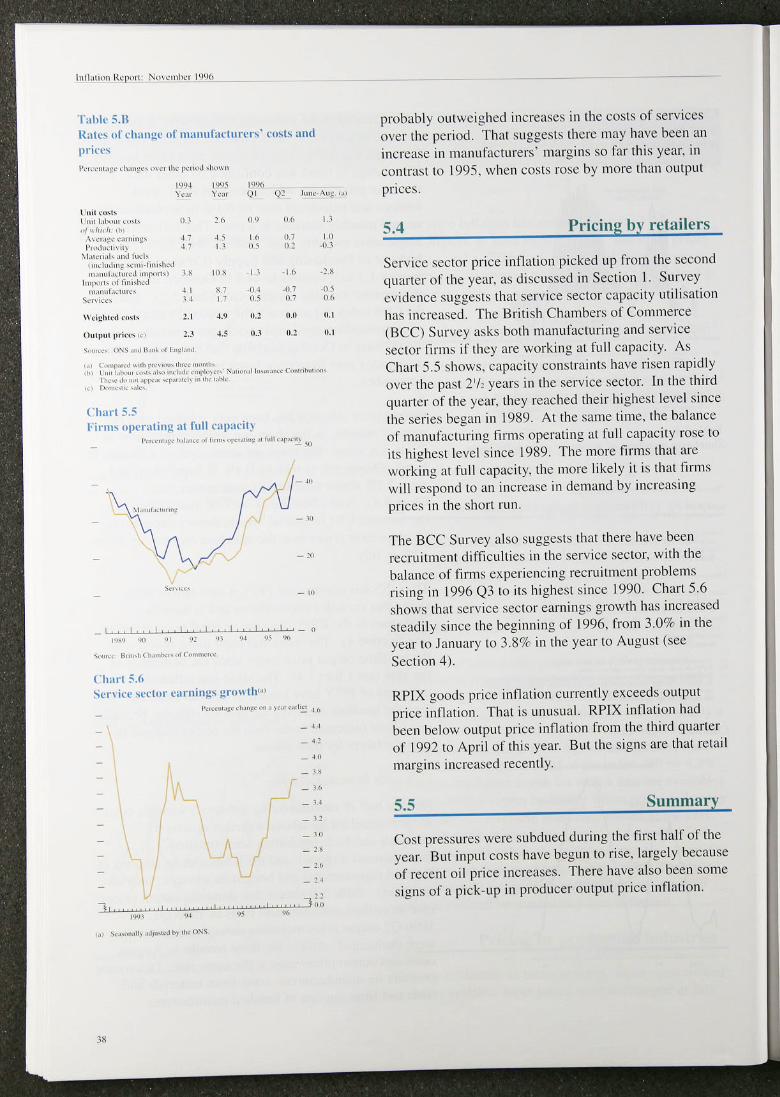
r ;lhk 5.H natl" Ill' changt' Ill' 1Il;illilfacturer,' ro~b and
Ilrit'c' l'~r .. 'n'.).'" .I ... ,,~<. '''<I ,I ... 1'<'''>,1 ""-".,,
11JO!~ I'I'H 1'1'11> ,~," \ ~.t 01 Q! J~rrc- -\"~ ...
I .. il.-." I, I nil I""'~" ,,,,,, '" :" '" "" Ll "/H/"d, .,
\\ <t •• , <~, ""'~, n " '" "' " I ~,.!","\ "l n , , .' " ·0.' \1 .,,,,,,10 .,~I " .. ,01,
I "" I "d,"~ """" 1 '''''h<,1 ,,,.nul ... ,",,·.! ""I~.t>' " '" ., ,
'" ·1 S Imp'"""II"".heJ
,,,, .. wl,,,"'"". " " '" ·0.7 _O~
\,'""," " " " , '" 06
\\ <;~hh'd ,·n," l, 1 ,., 11.1 n.ll n.1
(1"'1'"' I'ri,"" '" U ~ ,!, tl .. ' 11.1 11, 1
,,,,,,,,, o,' ..nJ ., ... 1 .. , 1 ",I .. ",
( , ........ -J ~ ,," 1"" .... ' Ih«< ", .. ",,, ,~ , I no< I."''" ' "~,, .I~, ,,... 1,,,,· <" ..... 1«. "",,,,,, '" ........ , C"",,,hot ,,., ,
!h< ... """ ........... "'1"'''''' '" 'h< ,.N, ", I) •• 'K"'~ .... k,
('hart 55 Finll' operating :1I full C:lpal'il~
1\·",", ,"'I.on.<,~ r" .... ''1'''' .. ..., .. ,~lI,.op..~ <0
'"''''
_ L' ~'-'-! '~.~~'-'-...,o,~.,.,..L' C. c' e,e . .".", ~" - 0 ""., ,~, '" .,: '>' 'IJ 9 ' ~
Chart :HI ~cn in' welur earning' I:r()11 Ih'"
-" _ 41
- '" - " -" -"
_ \0
_ ~b
J".~~~~~~-.""~~~~~~~'"',,' J. " ! "'" 01 " ,," J ,,,,,, 'I' .)~ "b
'"
probably out weighed increases in the costs of services over the period. That suggests there may have been an increase in manufacturers' margins so far this year. in contrast to 1995. when costs rose by more than output
pnces.
SA Pricing by retailers
Service sec tor pri ce intlation picked up from the second quarter of the ye;lr. as discussed in Section 1. Survey ev idence suggests that service sector capacit y utilisation h'1S increased. The Briti sh Chambers of Commerce (BCC) Survey asks both man ufacturing and service sector tinm if they arc working at full capacity. As Chart 5.5 shows, capacity constraints have risen rapidl y over the past 2'h years in tile service sector. In the third quarter of the year. they reached their hi ghest level since the series began in 1989. At the same time. the balance of manufacturing finns operati ng at full capacity rose 10
its highest Icvel since 1989. The more firms that are working at ful l capacity. the more likely it is that fi rms wi ll rcspond to an increase in demand by increasing prices in the short ru n.
The BCC Survey al so suggests that there have been recruitme nt difficu lties in the service sec tor. with the balance of firms ex periencing recruitment problems risi ng in 1996 Q3 to its hi ghest since 1990. Chart 5,6 shows that service sec tor earnings growth has increased steadil y since the beginn ing of 1996. from 3.0% in the year to January to 3.8% in the year 10 August (see
Secti on 4).
RPI X goods price infl ati on currentl y exceeds ou tput pri ce inflation. Tlmt is unu sual. RPIX inflation had been below output price inflatiol1 from the third quarter of 1992 to April of this year. But the signs are that retai l margins increased recentl y.
5.5 Summary
Cost pressures were subdued duri ng the first hal f of the year. But in put costs have begun to ri se . largely because of recen t oi l pri ce increases. There have also been some signs of a pick-u p in producer out put price in flation.

Prospects for inflation 6
Tahlc n. \ G..o\\ Ih rail'S (lr cnmIJlIlll'nt" of rcal s llcndinl!
"'" l"'-ill
l).." '''',h< 00""" .. 1 '" ~.4 I)"",,,.,,,· o<",.,no <" h,J",~
.''''''h''' ' J'"~ "' ~,()
C""'"'''pt,.", ". " 1'","". ,,,,'c'''''<o'' .", 1.14 I'ubhc It' ,,,,,,,,,, ,,, '" ·7.(' Gmcm",on' "'I"'I\~nu", '" "" I"' I~" " " ') ,1
Imp"'" ~.I ., ColiI' ,,\ ,., 1.4
,., ... ,,,,.,,,,,,,
6.1 Developments in prices, aggregate demand and 5uppl)
Economic growth has ri sen during the year. Es timat ed quarterl y real GDP growth was 0.8 0/(' in the third quarte r. co mpared with a rev ised estimated average of 0.69'(' in the first half of th e year and 0.4% during 1995 . Bul the growt h of real domes ti c demand exc ludin g stock bullding rose by morc. It increased from an average quarterl y rate of 0.2% in 1995 tQ 1.0% in the firsl half o f 1996. Nomin al demand has also accelerated over the pasl year.
Both consumpti on and investment accelerated in the fi r:-I half of 1996 (sec T'lble 6.A). In formation about the third quarter is incomple te. but the s igns arc that consumption grew rapid ly. Household goods sales- an indicator o f the demand for durabl e goods-were particularly stron g. Retai l sa le~ growth as a who le s lowed. but the Q2 ligures. boosted by Euro '96. reflected spending in the United Kingdom by fore igners rather than domesti c consumpti on. Consumer confidence improved over the qU:lrte r. The Halifax and Nationw ide house price ind ices both increased in the third q uarter. to give annual rates o f increase of some 5%, re inforc ing the view Ihat co nsumpti on is likely 10
continue to grow rapidl y. Th e increases in hou s ing IUrnover. loan approval s and private ho us ing start s are cons is te nt with th ose prospect:;. too . as is th e continu ing growth of personal sec tor M4 deposits.
Inve:; tment accelerated in the first halfo!, 1996. grow ing a t an annual ised rate of 6 .6 %. Both the Brit ish Chambers of Comme rce and the CBI Surveys reported that investment intenti ons remained s trong in the third quarte r. And the market va luatio n o f asset:; in the corporate sector increased fu rt her above thei r replacemen t cost. which suggests that it would be pro fitable fo r firms to isslle eq uity or borrow fu nd~ to buy capital goods. M-t deposit s hetd by ind us trial and commcrcial companies (lCCs) continued to ri se strong ly. increas ing by 11.9% over the year 10 the third quarter- which in (he past has been a s ign that Ices' in vestment was about to pick up.
The sig nal s from the hlbour market arc consistent with strengtheni ng ou tput growth. Th e more compre hens ive
"

indicator~ of labour demand . such as total hours worked reported in the Labour Force Survey. were fairl y stable th rougholLt 1995 and into spri ng 1996. But total hours worked picked up by 0.8% between the spring and summer LFS, and employment also grew strongly. suggcsti ng that thc labour market started to tighten then. That was fo llowcd during the third quarter by faster declines in clai mant unemployment and an acceleration of underlying earnings. so the grow lh rate of labour demand ma y have incrc l.lsed further. Private sector earnings. ullconstrained by pay-bill caps, have been growin g faster Ihan those in the public sector. The rate of increase of earnin gs in service sector industries started 10
catch up with Ihe ratc of increase in manufacturing in the middle of last yea r. and survey ev idence suggests that rec ruitment difficulti es are emerging in the service sector.
The pattern of demand has been changing over the past year. with a switch from net exports to domestic demand. Net export s fe ll sli ghtl y in the first half of 1996. Nevertheless. gross export volumes he ld up surprisingly well. given the weakness of demand in most of the United Kingdom's main trading partners. Export volumes increased by 3.6% between the second hal f of 1995 and the fi rst half of 1996. but appear to have been almost Ilat since then.
OveralL there has been little news over the past quarter to chan ge the prospec t that the faster pace of output growth will be ma intained. As the output gap closes. the downward pressure on domestical ly generated inflation will be red uced. How quickly that happens will depend on two factors. stocks and net exports. identifi ed in earl ier Reports as down side ri sks to output in the near term. Fi rs t. there is still a downside risk to output from stocks. as firms probably wi sh 10 reduce stock-to-sales rati os further. The main issue is what aggregate stock-to-sales ratio is implied by firms ' individual targets. and hence the size of the overhang. Stocks fe ll relative to ou tput in 1996 Q2 and out put accelerated in Q3, so it now looks more likely that the stock-ta-sales ratio will be brought down graduall y. mainly by increases in sales rather than reductions in stocks. The risk of a sharp fall in output growth from th is source has fall en.
Second. uncertaint y about future net exports remains. Prospects for demand growth in continental Europe remain unclea r. not least because it is difficult 10 assess the impact that fi sca l consolidation programmes will have. In the fir st half of 1996, net ex ports held up betler than expected, prob<1bl y because UK exporters gained

market share and im port s may have been red uced by lower s toc kbu il di ng, But those facto r:. are unli kel y to pe rsist particularly given s terli ng':. 89C apprec iati on between 2 August and I November. U K competit iveness is likel y to worsen in the short run . The apprec iation of s te rl ing is likel y to accen tuate the emergi ng imbalance between do mestic demand and net exports.
The s trength of underlying domestic demand suggests that hi gher ou tput growth will bc s llstaincd. He nce inflat ionary prcss urc is expected to mo unt as unemployment approac hes its nat ural rate and fi rms' unit costs arc driven up. Output pri cc inflation ha s bee n ve ry subdued so far thi s yea r, but survey ev idcnce suggests that it is closc 10 a turning point. The Octobe r CBI Industrial Trends Survcy fo und that more manufacturers expec ted to increase their prices ovcr thc next four months than did in Jul y, Output prices rose in Septcmber. Simi larly. the three- mon th rate o f change of input prices became posi ti ve in Se ptember.
The uncertain ty surroundi ng the ou tlook for inflati on is greater th is q uarter because of the d iffic ulty in interpreti ng two unexpccted devc lo pmcn ts: first. the fail urc of RP IX infl ation to fall ovcr thc past quarter and. second. the sharp apprcc ia tion of s te rl ing.
Some of the spec ific price in('rea~e .~ that contributed 10 hi gher-t han-ex pected RPJX- for examp le. tho:;c for petrol- may have a ri ~en becau);e of adverse 'supp ly shocks' . which, prov ided they do not ini1uc nce wage and pri ce ex pectations, arc lIllll ke ly to affec t the two-ye:u'-ahead inllatio n rate. But it is d ifficu lt to identify m.my such shocks. Some of the unexpected pri cc increases could be the result of rcta il e r~ 'testing the market ' 10 see what it wi ll bear. Some o f those price increases may be unwound . But many of the price inc reases. such as those for services s lIch as catering. transport. and insurance ,md for cars. are morc likel y to be the result of s tronger nomina l demand growth . and may therefore s ignal that inflation is pi cking lip sooncr than forecast.
How does the appreciation o f the exchange rate affect the inflation ou tl ook? Secti on 2 concluded that the most li kely explanation s for the rise in ste rl ing were ( i) a perceived temporary looseni ng of monetary pol ic ies overseas (ii ) a perceived te mporary ti gh te ning of monetary policy in the United Kin gdo m and ( iii ) a ri se in the rea l exchange rate. perhaps becau);c of the high er oi l price.

First, to the ex tent that a perceived temporary loosening of monetary policies overseas was responsible . the reduction in import prices wi ll be unwound graduall y as overseas prices ri se more than they ot herwise would have done . In that case. the nominal apprec iation of sterling wi ll have only a temporary effect on the real exchange rate. There will be no lasting impact on the overall price level- a good example of a case where mixing together exchange mte and interest rate changes to assess the Sl,wee of monct:lry poli cy makes no sense. Inflation will be lower in the short rUIl. Then. as prices start to rise faster abro:ld. UK import prices will sl<l rlto increase, too, and the UK fewil price inflation mte will go up. Second, if a perceived temporary tightenin g of U K monetary policy- signalled by the rise in interest rates implied by short-sterling futures to levels significantly above 6%-is responsible for the apprec iation. it s persistence will depend on whethcr interest rates do indeed ri se further. Third, if the equilibrium real exchan ge rate has ri sen, the price of tradables will decline re lati ve to non-tradables and. if monetary policy does nOI offset the first-round effect. there will be a one-off reduction in the aggregate price lcvel. The twelve-month rate of inflation will decline temporari ly.
All three ex planations entail at least a temporary fa ll in imporl prices (relati ve to the path they would have followed) and a temporary decline in the twelve-month rate of inflation. although only the second-a perceived tightening of monetary policy in the United Kingdom. as retlected in the upward shift of the yield curve at the short end-would impl y lower intlation in the long ru n. The Bank 's central projection is based on ajudgment that a ri se in the real exc hange rate accounts for about one half of the apprec iation of sterling, the rest being due to the two monetary explanat ions in rough ly equal measure. Because the projection is based 0 11 unchanged official interest rates. that part of the appreciation due to recent perceived UK ti ghtening is assumed to unwind.
6.2 The Bank's medium-term inflation projection
The Bank 's medium-term projection of the twe lve-month inflation rate is shown in Chart 6.1, next to August's projection. shown in Chart 6.2. Offic ial interest rates are assumed to remain unchanged at 6% over the nex t two years, and the sterlin g effective exchange rate is projected to evolve according to differe nces between nominal interest rates in other cou ntri es on the one hand and the constant UK interest rate assumed on the other. Real publi c spcnding and effect ive tax rates are assumed

I'r"'f'~( /lfor "'fI''''''''
Chart 6.1 C ha rt (,.2 Current RPIX inl1alinn 1l"tJjection RI'IX inllalion Ilrvjediun in \u j:u'l
I~", .. ,,.. .... '.,,'" '" J"'«- , .. , )<" ,,,1,,,-.': ..
- ,
-,
1 1 1 I 1 1 1 I 1 1 1 I 1 1 1 I 1 1 1 I 1 1 ' t 1 1 1 -0 19iI: ~\ Q' '" '>to 9J '>o!
, -0
1bc cban ,I",", IIll" rdall\~ hlchhood of f'O",ble OUI,on..., •. The ccn\r~1 Ixmd. coloured 1I.:<:p red. "lelude, \be •· ... !Ur~II'ro ........ \''''1 .ha,·" Jud~cd wbc Ji:>oul a 100l chance lh", mnall<ln ",11 be w,.hm .b;1l ce mr:al band at anyda.e The , .... " deel"'" ,b~d,·. "n hoch "dc. ", 'Ill" cem'dl band. 'dl ... , Ihe d,qnbullon OUI 10 20<1. Jnd "" "". ,n "cp' often [lCnx noa~e po;"" . or Couf'.C. n """I"""bk W .",,:" tl ... · p,,>I>,b,lou," "nh "If} [I" .... "'on bul Iho< f"Cpr ... .cn" .he lIa"k', IJ,:" c"ml:l t .... The more "n("naim} tbere is ahoul I .... ,"11 .. IIon o.neon .... dl "fly p,nu,ub, IImc "'".""n. lb..' " .dc' Ih" hand,. and the " "".: ,.-.Ktu.III)' Ihe colour lado.·, And. if IIll" ,;,h a(,' ,nor" on onc "de lh.," Ih.: ",lIo:r. IlIo:n.1ll" reIt\J"''''~ band. "Ill hi: ".d.:r "" IbJ! "de o f the central hand
to follow the profile set Oll l in HM Treasury's SUll1mer Forecast.
The Bank's assess ment is Ihtltlwelvc-1ll0n lh RP IX inflation is likely to filII next year after it ri se in the final quarter of 1996. rc,lChin1! a rat c around 21hO/C towards the end of 1997. Thcn it is likel y to turn up aga in, and ri se to the end of the forecastin g period. Thi s profi lc reflects the fo llowing three consideration:.:
(i) there probably remai ns some margin of undcrutiliscd rcsources in thc econom y. As a result there is somc downward pressurc on inflation . But that is ex pcctcd to dimi ni sh and thcll reverse as outplll growth continucs above it s long-run trend:
( ii) the highcr-tI1<ln-ex pectcd out(urns for inflation in the third quarter did not simpl y rcflect one-o ff adverse suppl y dC\iclopmctlts. It is not yct c lear why infl ation was higher. Somc of thc unexpected price in crcascs arc likely to be unwound, at least in part . BUI it is I ikc ly that some of thcm (for

Chart (>..\ Di,trihutillll HI" ttl'l:\. innatiun fun'l"a~" tur 11)% Q"'
", .... n
I"." I ': I ...... , ....... 01, , !Jou<"" , , , , , , , , , , , , , ,
- :<
-"
- ,,,
- . " .. Un ,: , ~ :. '" ,~ ~: ... , .. "~
M., ,'", '"''''''
""'" I .. , .•• ~ •••• ' ...... ~. 1 .. ,,·. , .. " .. " ," 0.""", I'"",
( 'harl (,"", Ili,trihuliun 41\ RI'I\ inllal iun furc(·a .. h
fur \')')7 Q"'
I'ahlc (!.I~
t, ... " Qo .. ,,~ : , , , , , , , , , , ,
, .. , " 1'1" , 0. ... "',
E\I}C{' tcd RI'I:\. innati(lll' ''
'"""",, ,. """".!c 10
- ,.
lI."n~" I."" II!' ; 2 ~', ~O'; ~h>r<
,I, . .., , .. ", , .. ,loa" I (~, ~ -~'; ,., ~ ~'; ~5'.}
1'N6()-l " " 1"'17 (.)-' " " " I.. II ,,,, .,,J.-",,",""" 1"'" ,,,,," ' h< " ... , ~ " I> ,h< .. ,· .... "."'"1. ,.r,h<
I,' <hho." "'"" " .. ", I,."",, •. ,,' """.~ ... '0 <1,,_,,"",," MPIX ,,,,1.,,, .. I,II,,'~ '" u'" '""~, •• '"'~n ... . « 1 1> .. I"N, ", .. <n,. th< """,, . ""h< "'1''''''' ',H ... " "'""_ (," <""'1"'. "" ""-,<,<_ ",,",c,,\<' • .... 1" • "', .... k,' ''1 ,,( : ,'. ,,, on".,,,", '"'"'"1 ... , ,,, '" "'".«on ,', ... , 1 \'. '" I''"', I)' H" • • "") "'" ... ". '" '''', "'" " '" ~ "","" ,n!
, ,
example. those for services) reflect an increase in nominal demand growth . which is likely to push up prices further in thc fut ure: and
( iii) the apprec iation o f s terling w ill reduce the ove rall price leve l in the short run by making imports cheaper, That wi ll tend to reduce inflation, the e ffec t increasing over the nex t year as firms review price li sts and the lower im port costs feed through the suppl y c h~\in . What then happens will depend on why sterling appreciated .
The central proj ec tion. which now extends to 1998 Q4, is broad ly s imilar to that in the August f?eport. except in the near term. The pro fil e IS influe nced by the much c learer evide nce of a pick-up in output and demand growth and the possibi lity that some of the unex pected price ri ses of the past quarter refl ect greater-than-expected inflationary pressures. part icularl y in the sel"\' ice sector. Those e ffec ts are ex pected to be offset by the 'I. percentage point rise in offic ial rates and weaker ex port demand . which will dampen output growth .
The uncertai nty surrounding the current central projection is greater than it was in August. and that is reflec ted in the wider sprcad of the shading in Chart 6. I . The uncertainty about in flat ion over the next year or so has increased more than at the two-year horizon. Alt ernative ex plan.lIions of the change in the short-run inflation outlook and of why sterling apprec iated have very different implications for infl ati on over the next year. but much less so for inflation in two years' time. For example, if the price of oil fell s ignificantl y. measured infl 'ltioll over the next year- but not two years out- wou ld be lower. The risks of an inflati on outcome diffe rent fromlhe central projection are morc on the upside than the downside. as they were in August. reflecti ng the skewed distribu tion of possible outturns for acti vity over the nex t year or so. As in August. it is more likely than not that the inflatio n target will be mi ssed in two years' ti me.
6.3 Other inflation projections
Among the economic forecas ts monitored by the Bank. the media n projectio ns for twelve- month inflation in 1996 Q4 and 1997 Q4 arc 2.7% and 2.9%. unchanged fr0111 Augll~t (sce Chart s 6.3 und 6.4). The median projecti on for 1996 Q4 is lower than the Bank 's central projec ti on. while that for 1997 Q4 is higher. The spread

Tllblcll.C Hardu~ , Il;l ~ ix Sun e, C' IJC('111Iiom
T"ri"'·n ... n, h IU'I ;"lIa';~" un~ , ',",r .I, .... ~d
Grnrra l pul>l ... lIu"",,,, c<" ".,,"',," Fi""nc~ d""",,~, In, «'""" M a,oal} , ' , A' .... ,,,,, """ ...... ",,', T.a.k "n, .. "
G .. ncr.,lpuh l,,· nu., ,, ,",, ," "",,",, '" "'" . ..,,,ed, .. e,',,,,, It"", ,,,"",,, """I)" " A" ... I", ,,i, ,',,,,,,,,,,,, ,, Tr-.dc u",,,,,,
Table 6.1>
Jun, .. IW6
" " ' 0
" H)
" J"n,' 1W6
'" 1,/, 4,0
" l.b
"
"""" I_
" '" 1.1
" ., 1/,
l\ ler rill L~ nch -(; .. lIu l) SUrl e, oft K fund nlllna~e"
T,,~I" ... nlpnlh IU' I 10;<)(, ;nnalio", al '"~ Jul)' Aur ~" 1:r>J· I'!'1to " " " 2.b E'>\I-1 997 " " " " '''''~'< M"."II' )",hG.dI,p
C harl6.5 ImJllied forll ilnl innalion rate!;'"
."',""'<, B."l p, I ", I" ..
I.' c.~,,'., ,"."""."'.,.
"' "I
- 10
" I " ", J O(} %
0 "
~,b .1,2
I'rm/lr. /I f or ",11",,,,,,
of centra l projections can be ll1e.l:'lIred by Ihe inlerquartile range: that is. the ran ge of projections excluding the top and bollom quarter:. o f the di stribu ti on. The range has narrowed a lillle at the longer hori.wn. but not at the shorter one . The forecas t ~ were co lleclCd before the change in offi c ial in terest rates was announced.
Some oll tsidc forecaste rs have provided the Bank wi th their assessments of the probabilitie~ to be attac hed to various poss ibl e inll ali on outcOll1es (sce Table 6.B). On Ihe who le. they arc less uncertain than they were in August: that mi ght reflec t the sho rte r length s of tillle to
the specifi ed horizons. The average probabilit y attached to RPIX inflation being 2'h% or below in 1996 Q~ is 22%. dow n sharpl y from 45?'r in Augu:.t: for 1997 Q~. the correspondi ng number is 2Y/r. down :-.l ightly from 33% in August.
Expectati ons about inflation over the next ycar o r so reported by the Bardays Basix and the Merrill Lynch-Gallup Surveys have changed very little on the whole. as Tables 6.C and 6. 0 show.
Longer-term inflation expectat ions. derived by comparing convent ional and index- linked gilt prices. have fallen at both the live-year and ten-year hori zons (see Chart 6.5). The credibi l ity of th e monetary polic)' framework is inc reas ing. but both mcasu re~ still refle(~ t
some scepti cism abou t achievemcnt of price stabi lity in th e long run.
6.4 Conclusions
Since the August ft ~/'(l{i()1I RepOrT. there have been three Important pieces of news. First. the short-run outlook for inflation has deteriorated. Second. the effective exchange rate has ri sen by 8~. Third. the estimate of GDP growt h in the first hal f of Ihe year has been revi sed up. and for the third quarter is above trend .
Retai l price inflation has been somewhat higher than expected in recen t mon ths despite weak cost pressures. That can partly be allribuled to higher oil prices and does nOl in itse lf mean higher clomestica ll y gener:lted inflation. But in some sec tors of the econom)'. espec iall y services. there is evidence Ihat increas ing capacit)' utilisation is pUlling pressure on retai l pri ces. Despite the sharp ri se in th e exc hange rate, it IS li kely that inflation will ri se further befo re weak cost pressures. as re fl ected in conti nui ng low rates of increase of producer output prices. lead to a further dec line.

There is now clear ev idence that the pick-up in domestic demand has fed through to ou tpu t growt h. A reduction in stockbui lding kept manufacturing out put broad ly flat over the past year. but total output grew at above trend duri ng the third quarter. hav ing grown at about trend for the first hal f of the year. Rea l broad money growth-at an annual rate of more than 5% for we ll over a yearcontinues to sig nal above-t rend growt h in demand and out put. The mai n upside risk remains higher consumer spend ing. and the main downside risk is of weaker ex ports. Survey (hHa arc consiste nt with that central view of cont inuing growth in the domestic economy.
Both the observed rise in inllati on and the appreciation of sterling inc rease sig nifi cant ly the short-run uncertainty about RP IX in llation. There is likely to be a rise in the fou rth quarter of thi s year fol lowed by a slow dec li ne in response to low producer and import price inflation. But infl ation is likely to pick up over the nex t year or so as capac ity is used up and demand pressures resuh increas ingly in higher in flation rather than rea l activity. Already earnings growth has risen by about one percentage point during thi s year.
Althoug h there is a good deal of uncertainty abou t where inflation wi ll be in the short term. the prospect of above-trend growth of demand and ou tput fo r some time poses a threat to the inflation t<t rget some two years ahead. Even after the recent increase in offic ial interest rates of 1/. percentage point. it remains more likel y than not that innation wi ll be above the target at the end of the forecas t hori zon. And the short-run rise in inflation means that there is now much less chance of inflation being below 2 1h% during 1997. Achievement of the innation target remains elusive.
During the COurse of thi s year the balance of the recovery shifted from net exports to growth of domestic demand . espec ia ll y consumption. That trend is likely to be reinforced by the apprec iation of sterli ng since the August Inflatioll Reporr. It would be a mistake. however. tQ try 10 alter the ba lance of the recovery by pu rsui ng an easier monetary po licy in order to offset the ri se in the exchange rate. That would do nothi ng to contro l the growth of domestic demand. An appropriate fisca l policy ca n help to restrain the growt h of either pu blic or private consumption. But if monetary policy fai ls to counteract the poten ti al inflationary consequences of g rowth of domestic dema nd then, as in the IlIte 1980s. the problem could become a weak rather than a strong exc hange rate.

A further rise in inflat ion in the next month or two could pose questions about the credibi lity of the commitment to the inflat ion target. The recent rise in rates shou ld help to reinforce credibility. But what matters most is the con tinuous pu rsuit of a monetary policy which is consistent wit h achiev ing the target in the mediulllterm. To ensu re this outcome, some further rbe in interest rates is likely to become necessary in due cour~e.

Glossary tlnd other information
Gloss.w) of selected terms
RI'I inl\a lion: in Oat ion me;t~ured by Ihe rel;lil prices index. RJ> IX inl1ation: il10:l liol1 Illea,urcd by the RPI excluding mo rtgage inlerc .. t pay llle nt ~.
IB'IY inllaliun: ill0:lIion me:Nlred by the RPI cxcluding mortgage intere~1 p' l), lllc nl." and the following indirecltaxes: eOllncill :l:ll.. VAT. dulie,. c:w purt:ha~c lax and vehicle excise duty. in,ur;lllce tax am! ;Iirport tax. H,uu' index : ;1 price index which replace, the mortgage interest paymenh e0l11pOl1Cnl of the RPI with iI Bank estim;lte of Ihe u'er-('ost or hou,ing. Tllt\Rl'i udex: the HARP index excl uding indirect taxes.
i\ 10: nolI.', and ('o in in {"irCllJation oUI~ide Ihc Bank of England and b;mkcr,' operational depo,i" althe Bank . 1\14: UK non-bank. non-building ,ocielY privale se(' lor'~ holding~ of no te' and coi n. toge ther with a ll ~Ierling deposit~ (induding cerl ific:I I C~ of depo,il) held with UK b:mks and building so(' icti e~ by the non-ban\... non-bui lding ~ocie lY pri vate sector. Dh"isia money: a llle:Nlre oflhe money stoc\.. in which each component i~ weighled according to:1Il e:.tinlale of how useful arc the tr:m\aclion '\Crvicc~ il prOl ide<;.
ncc: Briti,h Chall1bcr~ ofCommercc. HS E: bovine ,pongiform encephalopathy. C II'S: ClWf\c red In,t itUle of Purch'l~ ing and Supply. ICCs: indu 'olrial and commercial companies. Lt'S: Labour For('c Survey, OF ls: other finan c ial ilbtilutions. T~.:ss l\: 1;lx-exempt ' l)Cc ial ,avings ilC('Ollnl. \VIE: Workforcc in Employmcnt.
Three· month a nllua liscd : lhc l)Crcclllage change in ,I series belween onc period and thal three month~ earlier. expressed as illl annu,tl Tille ,
Symbols lllld conventions
Excepl where othcrwhc \lalcd. the ~ource for thc d'l ta uscd in chart~ ;lIld table, i, lhe OHice for National SlatiSlic~ (ONS).
The mea~ure\ of innalion included in th is Reporl have been adju'led by lhe Bank for a O NS error in underrecording RPI and RPIX ill0alion belween Fcbruary and May 1995.
lUI. '" not avai lable. BccaUM; of rounding. Ihe ~um of the scparale items may ~ometime~ differ from the tOla l ~hown .
On the hori zontal axe, of g raph~. larger ticks denote lhe first ob~ervalion within the relevanl period. eg data for the first qu.lrter o f the year,
Other informati on
Email : mapll bl i cat ion ... @h;l1lkofengland.co. uk Thc Summary of lhi s Rejlarl is ;Ivailable at: http://www.bankofenglalld.co. lIk

Price £3.00