Inflation Dynamics and the Labour Share in the UK
48
"Inflation Dynamics and the Labour Share in the UK" by Nicoletta Batini, Brian Jackson and Stephen Nickell Discussion Paper No. 2 UNIT External π time
-
Upload
independent -
Category
Documents
-
view
1 -
download
0
Transcript of Inflation Dynamics and the Labour Share in the UK

"Inflation Dynamics and the Labour Share in the UK"by Nicoletta Batini, Brian Jackson and Stephen Nickell
Discussion Paper No. 2
UNIT
Externalp
time

External MPC Unit Discussion Paper No. 2*
Inflation Dynamics and the Labour Share in the UK
By Nicoletta Batini, Brian Jackson and Stephen Nickell
November 2000
ISSN: 1748 – 6203 Copyright Bank of England 2000
(*) Disclaimer: These Discussion Papers report on research carried out by, or under supervision of the External Members of the Monetary Policy Committee and their dedicated economic staff. Papers are made available as soon as practicable in order to share research and stimulate further discussion of key policy issues. However, the views expressed are those of the authors and do not represent the views of the Bank of England or necessarily the views of External Members of the Monetary Policy Committee.

2
Inflation Dynamics and the Labour Share in the UK1
By Nicoletta Batini*, Brian Jackson† and Stephen Nickell‡
First draft: September 2000This draft: November 2000
Abstract
In recent years UK real wages have been growing faster than labour factor productivity, implying that thelabour share has been rising. This paper looks at various definitions of the labour share and derives ameasure for the UK, which appears positively correlated with the growth rate of the UK gross value addedprice deflator. Following Layard, Nickell and Jackman (1991), we investigate the relationship betweeninflation and the share more formally by estimating a pricing equation or “new Phillips curve” obtainedfrom a structural dynamic model of price setting based on Rotemberg (1982) and extended to captureemployment adjustment costs and the openness of the UK economy. This model nests the Sbordone (1998)and Gali, Gertler and Lopez-Salido (2000) relationship between inflation and marginal costs in the limitingcase of a constant equilibrium mark-up and no employment adjustment costs. Our findings suggest thatthere is a stable ceteris paribus relationship between inflation and the labour share over the last 30 years inthe UK and so the share contains information that helps to predict inflation.
* Research Adviser, MPC Unit, Bank of England, Threadneedle Street, London EC2R 8AH, UnitedKingdom. Tel: +44 20 7601 4354. Fax: +44 20 7601 3550E-mail: [email protected]
† Economist, MPC Unit, Bank of England, Threadneedle Street, London EC2R 8AH, United Kingdom.Tel: +44 20 7601 5040 Fax: +44 20 7601 3550E-mail: [email protected]
‡ Professor of Economics at the London School of Economics and Member of the Monetary PolicyCommittee of the Bank of England, Threadneedle Street, London EC2R 8AH, United Kingdom. Tel: +4420 7601 4071. Fax: +44 20 7601 3550E-mail: [email protected] or [email protected]
(1) We thank Larry Ball, Mark Gertler, DeAnne Julius, Ed Nelson, Katharine Neiss, Evi Pappa, andseminar participants at the Bank of England for helpful comments on an earlier draft of this paper.Remaining errors are our own.

3
List of Contents
page
Abstract ............................................................................................................................... 4
Introduction......................................................................................................................... 5
1. Measuring the labour share with UK data....................................................................... 7
2. A theoretical relationship between the labour share and inflation in an open economy
........................................................................................................................................... 14
3. An empirical investigation........................................................................................ 25
4. Conclusions ................................................................................................................... 35
References ......................................................................................................................... 36
Data Appendix................................................................................................................... 31
Technical Appendix .......................................................................................................... 44
4
Abstract
In recent years UK real wages have been growing faster than labour factor productivity,
implying that the labour share has been rising. This paper looks at various definitions of
the labour share and derives a measure for the UK, which appears positively correlated
with the growth rate of the UK gross value added price deflator. Following Layard,
Nickell and Jackman (1991), we investigate the relationship between inflation and the
share more formally by estimating a pricing equation or “new Phillips curve” obtained
from a structural dynamic model of price setting based on Rotemberg (1982) and
extended to capture employment adjustment costs and the openness of the UK economy.
This model nests the Sbordone (1998) and Gali, Gertler and Lopez-Salido (2000)
relationship between inflation and marginal costs in the limiting case of a constant
equilibrium mark-up and no employment adjustment costs. Our findings suggest that
there is a stable ceteris paribus relationship between inflation and the labour share over
the last 30 years in the UK and so the share contains information that helps to predict
inflation.

5
Introduction
Since 1996, real product wages in Britain have tended to rise faster than labour
productivity. Intuitively, this implies that workers are getting more than they deserve. It
also implies that workers’ share in the ‘national cake’ is growing. Our purpose in what
follows is to investigate whether this has implications for inflation and, thus, whether it
matters for monetary policy in the UK.
The share of value added (net of indirect taxes) that accrues to workers from their supply
of labour to firms is usually referred to as the “labour share”. The concept of labour
share goes back a long time. Ricardo originally introduced the term in The Principles of
Taxation and Political Economy in 1821. Subsequently, the meaning and importance of
the share as a measure of the division of output between workers and firms for
macroeconomics has been investigated at length by both classical and neoclassical
economists. Among these, Henley (1987), Sherman (1990), Praschnik and Costello
(1992), Modesto and Monteiro (1993) and Kang et al. (1998), all looked at the
determinants of the labour share and analysed its cyclical patterns. Recently, Blanchard
(1997, 1998), Caballero and Hammour (1998), and Bentolila and Saint-Paul (1999), have
also looked at the labour share, examining its role in the determination of unemployment
or patterns in the distribution of income.1
In real business cycle models, the labour share is often assumed to be constant, so not
much importance is attached to it in explaining economic fluctuations and growth. As
Bentolila and Saint-Paul (1999) point out, in the UK the labour share does indeed appear
to be stationary, even if it displays large short-run fluctuations around its mean.
However, this is not true in other countries, such as Japan and Germany, where the share
has been following either upward or downward-sloping trends (see Chart 1).
1 See also Artus (1984).

6
Chart 1: international comparisions of the labour share
56
58
60
62
64
66
68
70
72
74
1970 1975 1980 1985 1990 199556
58
60
62
64
66
68
70
72
74
JapanUSGermanyUK
Per cent Per cent
Source: OECD, International Sectoral Data Base
Importantly, as Chart 2 below illustrates, in the UK spikes in the labour share over the
past have often been associated with rises in inflation, supporting the idea of a
relationship between the two. This is perhaps less evident since 1995, when the labour
share has increased as real wages have been growing faster than labour factor
productivity in the UK but inflation has remained subdued.
Chart 2: UK inflation and the labour share
56
58
60
62
64
66
68
70
72
74
Jun-69 Jun-72 Jun-75 Jun-78 Jun-81 Jun-84 Jun-87 Jun-90 Jun-93 Jun-96 Jun-990
5
10
15
20
25
30
35
labour share (adjusted measure) (LHS) *
gross value added price deflator (RHS)
Per cent change on a year earlierPer cent
* See Section 1 for details of how this series is constructed

7
In this paper we explore the theoretical and empirical relationship between the share of
labour and inflation in the UK. We examine whether the labour share can be regarded as
a good indicator of UK inflationary pressures, and, more broadly, we speculate about the
future implications for inflation of the rise in the share observed since1995.
The plan of the paper is as follows. Section 1 looks at various definitions of the labour
share and derives a sensible measure of the share for the UK. Dynamic correlations
indicate that this is positively correlated with inflation (measured in terms of changes in
the gross value added price deflator). In addition, simple Granger causality tests suggest
that the share Granger-causes inflation. Hence, section 2 examines the relationship
between inflation and the share more formally, by deriving a pricing equation or a “new
Keynesian Phillips curve” obtained from a structural dynamic model of pricing behaviour
à la Layard et al. (1991) based on Rotemberg (1982), and extended to capture the
openness of the UK economy. 2 This model has the Sbordone (1998) and Gali, Gertler
and Lopez-Salido (2000) relationship between inflation and marginal costs as a special
case, extending it to account for variations in the equilibrium price mark-up and for
labour adjustment costs. In section 3 we estimate our theoretically derived pricing model
by using a generalised method of moments estimator. We find a stable relationship,
which implies that the measure of labour share that we employ contains information that
is helpful to predict inflation. Concluding remarks follow. At the end of the paper we
include a Data Appendix which describes the data that we have used in section 3, and a
Technical Appendix.
1. Measuring the labour share with UK data
1.1 Definition and measurement
Algebraically, the labour share can be expressed as:
2 See Roberts (1995) for an analysis of the contributions of new Keynesian economics to the study of thePhillips curve.

8
/Ls WN PY≡ (1)
where W is labour cost per employee, N is employment, P is the GDP deflator at factor
cost, and Y is national income.
So, on the face of it, the labour share appears easy to compute: take the total
compensation of employees in the economy and divide it by the national income. In
practice, there are three issues to bear in mind when computing the labour share.
First, the share must be derived relative to a measure of value added that is net of indirect
taxes. Conceptually, firms and workers can only lay claims on revenue (in terms of
output per head) that actually accrues to the firm. By definition, this will be net of taxes
on value added, as these are paid to the government and are not received by the firm. For
this reason, we have defined the basic measure of the labour share, which we denote as
‘s’, as the ratio of the compensation of employees to total gross value added, measured at
basic prices.3
Second, as Bentolila and Saint-Paul (1999) emphasise, because the share in equation (1)
represents the remuneration of employees in value added, it ignores that part of
remuneration of the self-employed that constitutes a return to labour rather than to
capital. There are two ways of adjusting for this. We can either augment the numerator
of equation (1) to include the fraction of total compensation of self-employed that relates
to labour; or we can subtract the amount of value added generated by the self-employed
from its denominator.
Chart 3 below plots the self-employment adjusted labour share under these alternative
approaches for the period 1969 Q2 − 2000 Q1. In particular, the thin line corresponds to
the labour share including the remuneration of self-employed [numerator adjustment in
equation (1)], whereas the thick line gives the employees-only measure of labour share
3 For further details on how variables are derived, refer to the Data Appendix.

9
[denominator adjustment in equation (1)]. Both measures assume that the average return
to labour of the self-employed is equal to the average remuneration of employees.
As the chart shows, these adjusted measures moved closely together throughout the
period, and so give a broadly consistent picture of the path followed by the share over the
past three decades. In what follows we will use the measure of the labour share that
augments the numerator of equation (1) to incorporate the remuneration of the self-
employed. This measure we refer to as the “labour share” and denote as ‘ Ls ’.
A final consideration when deriving a measure of the labour share relates to the
contribution of the public sector. It might be argued that the concepts of labour and
capital shares only really make sense with regard to the market sector of the economy. In
this spirit, we may adjust equation (1) to remove the public sector’s inputs from the
numerator and the denominator of that expression. We do so by subtracting from the
numerator of the self-employed adjusted share, the compensation of employees by the
general government; and by removing from the denominator of that share the general
government’s total resources, essentially a measure of general government gross value
added. We refer to this measure of labour share adjusted for both self-employment and
Chart 3: alternative measures of the labour share adjusted for self-employment
62
64
66
68
70
72
74
76
78
Jun-69 Jun-72 Jun-75 Jun-78 Jun-81 Jun-84 Jun-87 Jun-90 Jun-93 Jun-96 Jun-9962
64
66
68
70
72
74
76
78
labour share measure adjusted for self-employment via the numerator
labour share measure adjusted for self-employment via the denominator
Per cent Per cent
10
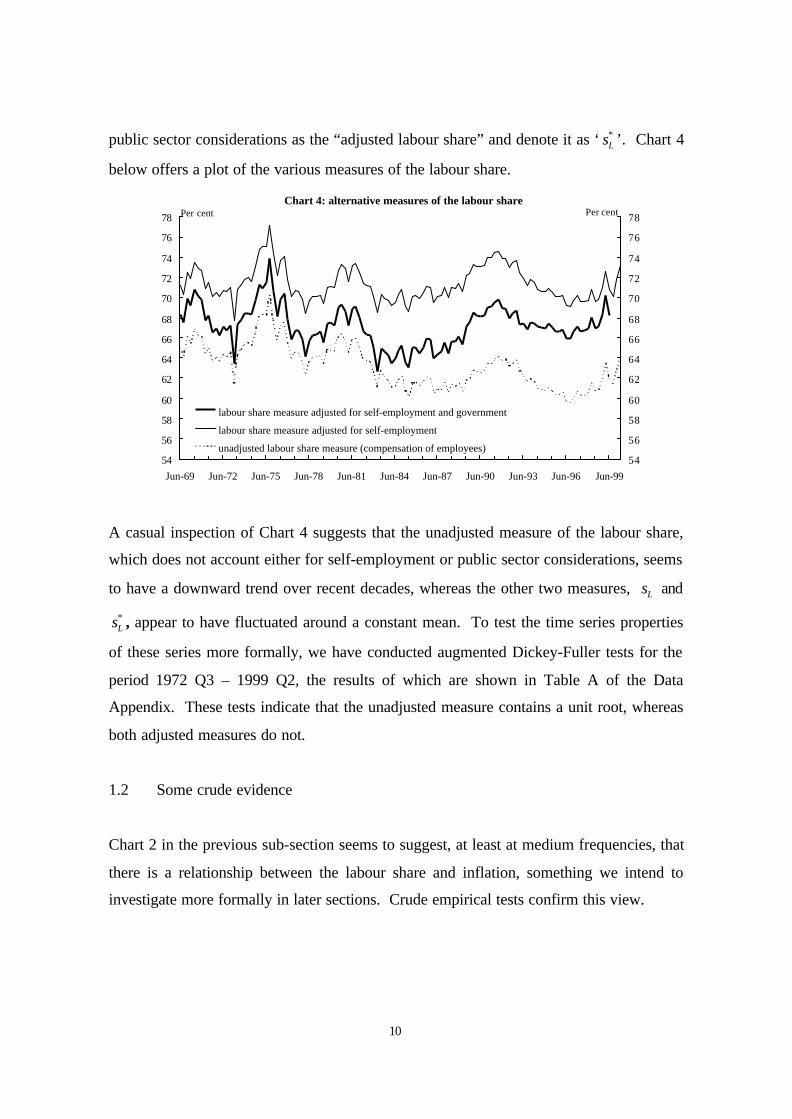
public sector considerations as the “adjusted labour share” and denote it as ‘ *Ls ’. Chart 4
below offers a plot of the various measures of the labour share.
Chart 4: alternative measures of the labour share
54
56
58
60
62
64
66
68
70
72
74
76
78
Jun-69 Jun-72 Jun-75 Jun-78 Jun-81 Jun-84 Jun-87 Jun-90 Jun-93 Jun-96 Jun-9954
56
58
60
62
64
66
68
70
72
74
76
78
labour share measure adjusted for self-employment and government
labour share measure adjusted for self-employment
unadjusted labour share measure (compensation of employees)
Per cent Per cent
A casual inspection of Chart 4 suggests that the unadjusted measure of the labour share,
which does not account either for self-employment or public sector considerations, seems
to have a downward trend over recent decades, whereas the other two measures, Ls and
*Ls , appear to have fluctuated around a constant mean. To test the time series properties
of these series more formally, we have conducted augmented Dickey-Fuller tests for the
period 1972 Q3 – 1999 Q2, the results of which are shown in Table A of the Data
Appendix. These tests indicate that the unadjusted measure contains a unit root, whereas
both adjusted measures do not.
1.2 Some crude evidence
Chart 2 in the previous sub-section seems to suggest, at least at medium frequencies, that
there is a relationship between the labour share and inflation, something we intend to
investigate more formally in later sections. Crude empirical tests confirm this view.

11
Table 1 below lists contemporaneous and dynamic correlations computed over the period
1972 Q3 – 1999 Q2 between Ls and inflation, measured both in terms of one-quarter
changes ( 1t t tp pπ −= − ) and four-quarter changes ( 4 4t t tp pπ −= − ) in the natural log of
the gross value added price deflator (henceforth ‘GVAD’). Table 2 lists analogous
correlations derived over that same period using the adjusted labour share ( *Ls ).
Table 1: Contemporaneous and dynamic correlations ( Lts , tπ , 4tπ )
Lags 0 1 2 3 4
Corr( tπ , Lt ks − ) 0.34 0.32 0.24 0.16 0.10
Corr( 4tπ , Lt ks − ) 0.46 0.43 0.37 0.31 0.23
Lags 5 6 7 8 9
Corr( tπ , Lt ks − ) 0.05 -0.002 -0.09 -0.11 -0.10
Corr( 4tπ , Lt ks − ) 0.15 0.08 -0.02 -0.08 -0.11
Table 2: Contemporaneous and dynamic correlations ( *Ls , tπ , 4tπ )
Lags 0 1 2 3 4
Corr( tπ , *Lt ks − ) 0.35 0.36 0.30 0.24 0.20
Corr( 4tπ , *Lt ks − ) 0.46 0.45 0.43 0.38 0.33
Lags 5 6 7 8 9
Corr( tπ , *Lt ks − ) 0.15 0.12 0.02 0.02 0.03
Corr( 4tπ , *Lt ks − ) 0.27 0.21 0.12 0.07 0.04
In line with the informal visual evidence from Chart 2, both tables indicate that inflationis contemporaneously and dynamically positively correlated with inflation at shorter lags.As one would expect, the correlation is stronger when inflation is measured in terms offour-quarter changes in the GVAD.
These results are also supported by findings from five-lag Granger causality tests
calculated over the period 1972 Q3 – 1999 Q2. We present these in Table 3 (for Ls ) and

12
in Table 4 (for *Ls ) below. In general the hypothesis that the labour share does not
Granger cause inflation is rejected at standard levels of significance.4 This tentativeevidence seems to favor the view that the share of labour may contain corroborative orincremental information for predicting inflation.
Table 3: Pairwise Granger causality tests [( Ls , tπ ) and ( Ls , 4tπ )]
Null Hypothesis F-Statistic Probability
Ls does not GC tπ 2.58250 0.03082
tπ does not GC Ls 1.97776 0.08870
Ls does not GC 4tπ 3.41162 0.00698
4tπ does not GC Ls 2.97902 0.01519
Table 4: Pairwise Granger causality tests [( *Ls , tπ ) and ( *
Ls , 4tπ )]
Null Hypothesis F-Statistic Probability*Ls does not GC tπ 2.72585 0.02388
tπ does not GC *Ls 1.85382 0.10956
*Ls does not GC 4tπ 3.51067 0.00584
4tπ does not GC *Ls 2.90249 0.01742
Perhaps a more powerful test of the information content of the labour share is whether it
is informative, at given levels of the output gap, about changes in inflation since
disequilibrium is associated with rising or falling inflation, rather than with the level of
inflation per se. To pursue this final test, we considered autoregressions of the form:
( )*1 1( ) ( ) ( )t t Lt t s t sA L B L s C L y yπ π − − − −∆ = ∆ + + −
4 There is also some evidence that Granger causality runs the other way, although this is not as strong in thecase of the one-quarter change in the GVAD where the null of no Granger causality is not rejected at the 5
per cent significance level when Ls is considered and is not rejected at the 10 per cent level when *Ls is
considered.

13
where 1 1 1 2( ) ( )t t t t t t tp p p pπ π π − − − −∆ = − = − − − is the change in the one-quarter growth
rate of the GVAD and ( )*t ty y− is the output gap, and investigated the joint significance
of the ( )B L and ( )C L coefficients. Similar results are also reported using the change in
the four-quarter growth rate of the GVAD, 4 4 4 4 4 4 4 8( ) ( )t t t t t t tp p p pπ π π − − − −∆ = − = − − − .
When estimating the model it became clear that we could restrict the labour share effects
to be in first differences because the sum of the level effects was almost exactly zero. So
below we report results of a series of F-tests examining the joint significance of four lags
of changes in the labour share ( Ls∆ , Table 5) and the adjusted labour share ( *Ls∆ , Table
6) in a regression of inflation (one-quarter and four-quarter change in the GVAD,
respectively) on four lags of itself and five lags of the output gap, which we measure in
terms of deviations of gross value added from its Hodrick-Prescott trend. Throughout,
the sample period over which we estimate the regression is 1972 Q3 – 1999 Q2.
Table 5: Joint significance of lags (t −1 to t −4) of Ls∆
Dependent variable: tπ∆
Explanatory variables: t kπ −∆ , Lt ks −∆ , k = 1,…, 4; ( )*t m t my y− −− , m = 1,…, 5.
F-statistic 2.76 Probability 0.032
Coefficients(a) on lags of Lt ms −∆ : 1Lts −∆ : 0.19 (2.2); 2Lts −∆ : 0.20 (2.3); 3Lts −∆ : -0.03 (0.4);
4Lts −∆ : 0.12 (1.3)
Dependent variable: 4 4tπ∆
Explanatory variables: 4 4t kπ −∆ , Lt ks −∆ , k = 1,…, 4; ( )*t m t my y− −− , m = 1,…, 5.
F-statistic 4.12 Probability 0.004
Coefficients(a) on lags of Lt ms −∆ : 1Lts −∆ : 0.46 (2.9); 2Lts −∆ : 0.38 (2.3); 3Lts −∆ : 0.42 (2.6);
4Lts −∆ : 0.56 (3.6)
Notes: (a) t-statistics in parenthesis.

14
Table 6: Joint significance of lags (t −1 to t −4) of *Ls∆
Dependent variable: tπ∆
Explanatory variables: t kπ −∆ , *Lt ks −∆ , k = 1,…, 4; ( )*
t m t my y− −− , m = 1,…, 5.
F-statistic 3.37 Probability 0.013
Coefficients(a) on lags of *Lt ms −∆ : *
1Lts −∆ : 0.16 (2.33); *2Lts −∆ : 0.19 (2.83); *
3Lts −∆ : -0.006 (0.081);*
4Lts −∆ : 0.12 (1.74)
Dependent variable: 4 4tπ∆
Explanatory variables: 4 4t kπ −∆ , *Lt ks −∆ , k = 1,…, 4; ( )*
t m t my y− −− , m = 1,…, 5.
F-statistic 4.64 Probability 0.002
Coefficients(a) on lags of *Lt ms −∆ : *
1Lts −∆ : 0.38 (3.01); *2Lts −∆ : 0.34 (2.6); *
3Lts −∆ : 0.38 (2.9);*
4Lts −∆ : 0.48 (3.83)
Notes: (a) t-statistics in parenthesis.
Taken together, the tables reveal that for those regressions involving both the one-quarter
and four-quarter change in inflation, we can reject the hypothesis that lags of changes in
the labour share (either Ls∆ or *Ls∆ ) have no impact.5 This is not just a consequence of
the broad correlations generated by the two oil shocks: we obtain similar results even if
we carry out the regressions using a sample period that starts in 1982.
2. A theoretical relationship between the labour share and inflation in an openeconomy
In this section we examine the relationship between inflation and the share more formally
by deriving a pricing equation or a “new Keynesian Phillips curve” from a structural
dynamic pricing model with prices and employment adjustment costs à la Layard,
Nickell and Jackman (1991) (‘henceforth ‘LNJ’). This, in turn, is based on Rotemberg
(1982), and is extended here to capture the openness of the UK economy. For simplicity,
we start by deriving a theoretical relationship between inflation and the labour share for
an economy that is closed and with no adjustment costs (sub-section 2.1). We then
modify the model to allow for dynamic adjustment costs (sub-section 2.2). And finally,

15
we extend the model to account for the fact that the economy is open (sub-section 2.3).
As anticipated in the Introduction, this model has the Sbordone (1998) and Gali, Gertler
and Lopez-Salido (2000) “new” Phillips curve relationship between inflation and
marginal costs as a special case, extending it to account for variations in the price mark-
up and for labour adjustment costs.6 In section 3 we estimate the pricing model that we
derive in section 2 to explore whether the share of labour contains information that is
relevant for predicting inflation as preliminary evidence suggests.
2.1 A static closed-economy pricing model
To unveil the relationship linking inflation and the share of labour, we need a model of
the pricing behaviour of firms. This pins down the linkage between prices, inflation and
marginal costs. For this purpose, we start by considering the static equilibrium level of
prices, that is, the price that would prevail in the absence of adjustment costs. Thus we
assume that the economy is inhabited by F identical firms, labeled i, and that technology
is Cobb-Douglas and can be written as:
it it itY A N α= (2)
where 0α > , itY is value added output, itN is employment and itA represents an
exogenous productivity index capturing shifts in labour productivity. This includes the
impact of both capital and total factor productivity. 7 Following LNJ, we postulate that
each firm faces a constant elasticity demand function, i.e.:
( / ) itit it t ditY P P Yη−= (3)
5 In these regressions involving the one-quarter change in inflation we can also reject the hypothesis thatthe output gap has zero impact.6 It is worth emphasizing that the “new Keynesian Phillips curve” is essentially a model of pricingbehaviour, thus telling us about prices given wages. It is, therefore, a completely different animal from the“old Phillips curve”, which was generated by eliminating wages from the pricing model using some wageequation, leaving a relationship between price inflation and some measure of economic activity. Of course,Phillips (1958) original curve was concerned with wage inflation and excess demand in the labour market.7 Capital is assumed fixed with regard to short-run variations in output.

16
where 1η > , itP is the price of value added of firm i, tP is the aggregate price of value
added (i.e. the GDP deflator), and ditY is an exogenous demand index.
We then define the cost of producing output as:
t it it iC W N cK= + (4)
where itW represents the labour cost per employee (consisting of wages plus non-wage
labour costs) and icK is a predetermined capital cost, which is fixed with regard to
short-run variations in output.
Using (2), we can re-express cost as:
1/ 1/t it it it iC W Y A cKα α−= + (4a)
so that marginal cost is equal to:
(1/ 1) 1/(1/ )( ) (1/ )( / )t it it it it it itMC W Y A W N Yα αα α− −= = (from (2)) (5)
The static equilibrium price *itP is hence given by:
* *it it itP MCµ= (6)
where *itµ is the equilibrium mark-up of prices on marginal cost, i.e. * 1(1 1/ )it itµ η −= − ,
which is decreasing in the demand elasticity.

17
2.2 Dynamic model based on quadratic adjustment costs
Following LNJ,8 we now modify the basic pricing model to encompass quadratic
adjustment costs of changing both prices and employment a specification based on
Rotemberg (1982). This gives a model that is preferable to Calvo (1983) because it
enables us to incorporate employment adjustment costs more easily. As we will discuss
shortly, these are a crucial source of the inertia usually observed in the UK and hence
should not be ignored. Throughout, lower-case letters denote natural logarithms of the
corresponding upper-case variables.
To simplify the analytical solution of the dynamic optimisation problem faced by firms,
and ensure linear first-order conditions, we begin by approximating the firm’s real profit
objective ( ( )ipϕ ), by a Taylor expansion around *ip [ tp , *
ip = ln tP , ln *iP ] based on (6)
or (6a). Thus:
* * 2( ) ( ) ( /2)( )i i i ip p p pϕ ϕ θ− −; (7)
where ' *( ) 0ipϕ = (since *ip is the equilibrium price) and '' *( ) 0ipθ ϕ= − > . We assume
that the firm wishes to maximise an objective like (7), but that it faces additional
quadratic employment adjustment costs. When these are included, the firm’s problem
consists in deriving, at the start of period t, a price and employment path that solve:
( ) ( ) ( )2 2 2*1 , , , , 1 , , 1
0
min / 2 / 2st i t s i t s p i t s i t s n i t s i t s
s
E p p b p p b n nφ∞
− + + + + − + + −=
− + − + − ∑ (8)
where φ is a discount factor, and 1tE − denotes expectations formed on the basis of
information available at the end of period t-1. Objective (8) is subject to the constraint
that demand is met in each period, that is:
8 See Layard et al (1991), pp. 346 and ff.
18
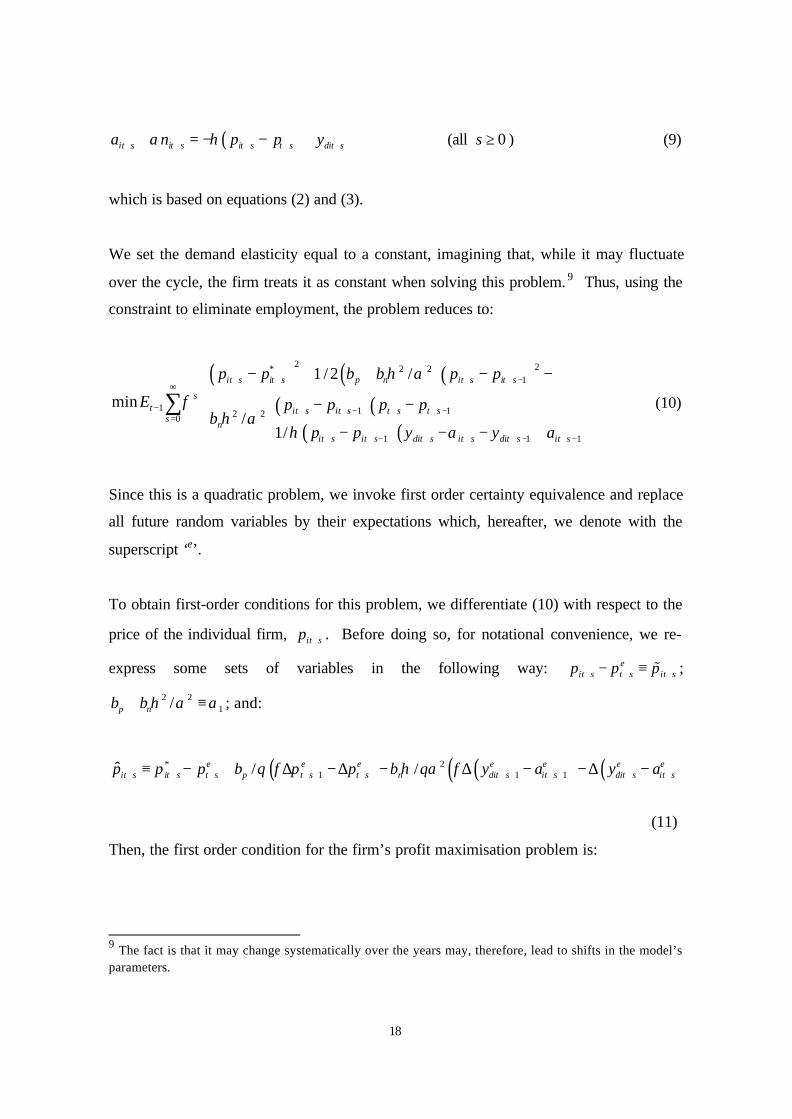
( )it s it s it s t s dit sa n p p yα η+ + + + ++ = − − + (all 0s ≥ ) (9)
which is based on equations (2) and (3).
We set the demand elasticity equal to a constant, imagining that, while it may fluctuate
over the cycle, the firm treats it as constant when solving this problem. 9 Thus, using the
constraint to eliminate employment, the problem reduces to:
( ) ( )( )( )( )
( )( )
2 2* 2 21
1 1 12 20
1 1 1
1 / 2 /
min/
1/
it s it s p n it s it s
st it s it s t s t s
sn
it s it s dit s it s dit s it s
p p b b p p
E p p p pb
p p y a y a
η α
φη α
η
+ + + + −∞
− + + − + + −=
+ + − + + + − + −
− + + − − − − +
− − − +
∑ (10)
Since this is a quadratic problem, we invoke first order certainty equivalence and replace
all future random variables by their expectations which, hereafter, we denote with the
superscript ‘e’.
To obtain first-order conditions for this problem, we differentiate (10) with respect to the
price of the individual firm, it sp + . Before doing so, for notational convenience, we re-
express some sets of variables in the following way: eit s t s it sp p p+ + +− ≡ % ;
2 21/p nb b η α α+ ≡ ; and:
( ) ( ) ( )( )* 21 1 1ˆ / /e e e e e e e
it s it s t s p t s t s n dit s it s dit s it sp p p b p p b y a y aθ φ η θα φ+ + + + + + + + + + + +≡ − + ∆ − ∆ − ∆ − − ∆ −
(11)
Then, the first order condition for the firm’s profit maximisation problem is:
9 The fact is that it may change systematically over the years may, therefore, lead to shifts in the model’sparameters.

19
( )1 1 1 1 1 ˆ1it s it s it s it sp p p pφα θ α φ α θ+ + + + − +− + + + = − % % % ( 0s > ) (11a)
The standard (first period) solution to this second order difference equation (or Euler
equation) is:
( ) ( ) ( )10
ˆ1 1j
it it it jj
p p pλ λ φλ φλ∞
− +=
= + − − ∑% % (12)
where λ is the unique stable root of:
( )21 1 11 0φα λ θ α φ λ α− + + + = (13)
We now make the expectations in (12) more explicit, i.e.:
( ) ( ) ( ) ( )1 1 1 10
ˆ1 1 jit t t it t t it j
j
p E p p p E pλ λ φλ φλ∞
− − − − +=
− = − + − − ∑ (14)
and shift (14) one period forward. By taking expectations dated t − 1, multiplying by
( )φλ and subtracting from (14), we obtain:
( ) ( ) ( ) ( ) ( ) ( )21 1 1 1 1 1 1 1 ˆ1 1it t t t it t t it t it t t itp E p E p p E p p p p E pφλ φλ λ λ φλ− − + + − − − −− = − − − + − + − −
(15)
We can use the assumption that firms are identical to note that it tp p= . Hence, from (3),
/ / 1it dit t dtY Y Y Y= = . Using (9) then ensures that the aggregate version of (11) is:
( ) ( )*1 1 1 1 1 1 1ˆ / /t s t s t t s p t t s t t s n t t s t t sp p E p b E p E p b E n E nθ φ η θα φ+ + − + − + + − + − + + − += − + ∆ − ∆ − ∆ − ∆
(16)

20
where *1 1lnt s t t s t t sp E E mcµ+ − + − += + (with lnt tmc MC≡ ).
So the aggregate version of (15) becomes:
( ) ( )( ) ( ) ( )( ) ( ) ( )( ) ( ) ( ) ( )
*1 1 1
1 1 1
1 1 1
1 1 1 1
1 1 /
1 1 /
t t t t t t t
p t t t t
n t t t t
p E p E p E p
b E E
b E n E n
λ φλ λ φλ
λ φλ θ φ π π
λ φλ η θα φ
− − −
− + −
− + −
− = − − − − − +
− − − −
− − ∆ − ∆ (17)
where 1t t tp pπ −= − , the rate of inflation. From the definition of *p [see (6)], this
becomes:
( ) ( ) ( ) ( ) ( ) ( )( ) ( ) ( )( ) ( ) ( ) ( )
*1 1 1
1 1 1
1 1 1
1 1 ln 1 1
1 1 /
1 1 /
t t t t t t t t
p t t t t
n t t t t
E E E mc p
b E E
b E n E n
π π λ φλ µ λ φλ
λ φλ θ φ π π
λ φλ η θα φ
− − −
− + −
− + −
− = − − + − − − +
− − − −
− − ∆ − ∆
(17a)
Setting ( ) ( )1 1λ φλ ω− − = , we can re-write the above as:
( ) ( ) ( )( ) ( )
*1 1 1 1
'1 1 1
/ / ln
/
p t p t t t t t t t
n t t t t t
b b E E E mc p
b E n E n
ω θ π ω θ φ π ω µ ω
ω η θα φ ν
− + − −
− + −
= + + − −
∆ − ∆ + (18)
where ( ) ( )'11 /t p t t tb Eν ω θ π π−= − − − , an innovation, or:
( )( ) ( )
*1 1 1 1
1 1 1
/ ln /
/ /
t t t p t t p t t t
n p t t n p t t t
E b E b E mc p
b b E n b b E n
π φ π θ µ θ
ηφ α η α ν
− + − −
− + −
= + + − −
∆ + ∆ + (19)
where ( ) ( ) ( )11 / / /t p p t t tb b Eν ω θ ω θ π π− = − − − .
Equation (19) is the final structural equation governing the aggregate price level in our
model. If we note that ( )t tp mc− is the actual mark-up of price on marginal cost, ln tµ ,
say, we can rewrite (19) as:

21
( ) ( )*1 1 1 1 1ln ln n
t t t t t t t t t tp p
bE E E
b bηθ
π φ π µ µ φ η η να− + − − +
= + − − ∆ − ∆ +
(19’)
This reveals that inflation depends positively on the gap between the equilibrium mark-up
and the actual mark-up, this gap arising because of the stickiness of prices. So one
interpretation of (19) is that inflation will be higher, ceteris paribus, if the equilibrium
mark-up exceeds the actual mark-up, because, in this case firms will be raising prices in
an attempt to restore their profitability.
Equation (19) has a similar structure to that proposed by Gali et al. (2000) which, mutatis
mutandis, has the form:10
( )'1 1t t t t tE mc p const errorπ φ π λ− += + − + +
The differences between this and our equation (19) are that we allow for a variable mark-
up and also account for employment adjustment costs. However, both ours and the Gali
et al. (2000) model imply non-neutrality, i.e. a non-zero relationship between inflation
and real variables in the long run. 11 This follows from the fact that the process generating
price rigidity in the two models is unaffected by the general level of inflation.
Thus in the Calvo (1983) model, which underlies Gali et al. (2000), each firm resets its
price with probability ( )1 θ− in each period, irrespective of the general level of inflation.
This seems unlikely. As Sims (1988, p.77) remarks:
“[I]f there is such a thing as an economy with a rock-solid inflation rate of 40 per cent,plus or minus 2 per cent, per year, institutions would surely adapt, so that prices would beannounced in catalogs and wage contracts with smooth growth paths paralleling the 10 The notation in Gali et al. (2000) is slightly different (their β is equal to our φ , and their tmc is real
marginal cost which corresponds to our ( )t tmc p− ). In their model, 'λ is decreasing in the degree of
price rigidity as is our coefficient on ( )t tmc p− , which is decreasing in pb .11 Note, in the long-run steady state, 1 1 1t t t tEπ π π+ − += = , and we find that (1 ) tφ π− = real factors.

22
smooth aggregate price path. Nominal rigidity would set in about this price path in muchthe same form as we see around the zero inflation rate in low-inflation economies.”
It is, in fact, more plausible that the probability of each firm resetting its price will rise
with the general level of inflation, since the costs of not doing so will most certainly rise
with this general level. In this case, firms will reset their prices far more frequently when
general inflation is 10 percent per month than when general inflation is 1 percent per
month [see Ball et al. (1988) for a formal analysis of such a mechanism].12 Similarly, in
the quadratic adjustment cost model of Rotemberg (1982), the cost of adjusting prices
depends only on the absolute change in prices 1it itp p −− , independently of the general
level of inflation.
An alternative way of specifying price adjustment costs which ensures long-run neutrality
is to suppose that the costs depend on the deviation of price changes from the general
level of inflation, i.e.:
adjustment costs = ( ) ( ) ( ) 21 1 2/ 2p it it t tb p p p p− − −− − − (20)
If we use adjustment costs as described in (20), equation (15) is unchanged, but the
definition of ˆitp is now given by:
( ) ( ) ( )( )* 21 1 1ˆ / /e e e e e e e
it it t p t t n dit it dit itp p p b b y a y aθ φ π π η θα φ+ + += − + ∆ − ∆ − ∆ − − ∆ − (21)
Then the aggregate equation (19) becomes:
( ) ( )( )
*1 1 1 1 1 1
1
/ ln / /
/
t t t p t t p t t t n p t t
n p t t t
E b E b E mc p b b E n
b b E n
π φ π θ µ θ ηφ α
η α ν
− + − − − +
−
∆ = ∆ + + − − ∆
+ ∆ + (19a)
12 Dotsey, King and Wolman (1999) show how to endogenise the probability of price changes.

23
This has exactly the same form as (19), except that it has the property that in the long run,
inflation is independent of real factors, although they influence the change in inflation.
2.3 An open-economy dynamic pricing model
In order to estimate equations (19) and (19a), we must first specify the equilibrium price
mark-up on marginal cost, *tµ . The equilibrium mark-up depends on the demand
elasticity facing the firm [see (6) and the following discussion] and this will in turn
depend on the extent of competition faced by the firm in the product market. There are
three factors which are worth noting in this context. First, the extent of product market
competition may be subject to long-term secular shifts arising, for example, from changes
in the rigor of anti-trust regulation or the extent of trade barriers. These we denote by
ptz . Second, the extent of product market competition may, in an open economy, depend
on the weakness of foreign competition, which we measure by ( )wt tp p− , where w
tp is
the world price of domestic GDP. So, for example, if the world price of domestic GDP
decreases because of an appreciation of the domestic currency, then domestic firms may
face increased competition and will tend to lower their equilibrium mark-up. Finally, the
equilibrium mark-up may be affected by the overall state of the domestic economy. For
example, in the model of oligopolistic collusion developed by Rotemberg and Saloner
(1986), price wars tend to break out in booms leading to a reduced mark-up at such times.
By contrast, the model of secret price-cutting due to Green and Porter (1984), has price
wars breaking out in slumps.13 Either way, this suggests that we should allow the
equilibrium mark-up to be influenced by the state of the business cycle which we capture
by ( )*t ty y− , the deviation of output from trend (i.e. the output gap). Note that this term
is to capture cyclical effects on the equilibrium mark-up which are over and above the
cyclical effects on the actual mark-up that we have derived explicitly in our model and
arise from price stickiness. Overall, therefore, we may specify the equilibrium mark-up
by:
13 A comprehensive overview of these models may be found in Chapter 6 of Tirole (1988).

24
( ) ( )* *0 1 2ln w
t pt t t t tz y y p pµ µ µ µ= + + − + − (22)
Turning to the real marginal cost ( )t tmc p− , from equation (5), this is given by:
ln lnt t t t t t Ltmc p w n y p sα α− = − + + − − = − + (23)
where Lts is the (log) share of labour. This remains true even when we take account of
material inputs, so long as we remain strictly within the Cobb-Douglas framework.
However, as Bentolila and Saint-Paul (1999) explain, this may have to be adjusted for the
real price of imports, ( )mt tp p− , if we assume more general technologies. For example,
if the import requirement of gross output is rising at the margin, marginal costs will be
increasing in the real price of imports (see the Technical Appendix). So in general we
have:
( )3lnt t Lt mt tmc p s p pα µ− = − + + − (24)
The operational equations (22) and (24) maybe substituted into (19) and (19a) to generate
the basis of estimated models. These are as follows. Equation (19) generates:
( ) ( )( ) ( ) ( )
*0 1 1 1 1 1 2 1 1
3 1 1 1 1
/ / / /
/ / /
wt t t p t pt p t t t p t t t p t Lt
p t mt t n p t t n p t t t
E b E z b E y y b E p p b E s
b E p p b b E n b b E n
π α φ π θ θµ θµ θ
θµ ηφ α η α ν
− + − − − −
− − + −
= + + + − + − + +
− − ∆ + ∆ + (25)
whereas equation (19) generates:
( ) ( )( ) ( ) ( )
*0 1 1 1 1 1 2 1
1 3 1 1 1 1
/ / /
/ / / /
wt t t p t pt p t t t p t t t
p t Lt p t mt t n p t t n p t t t
E b E z b E y y b E p p
b E s b E p p b b E n b b E n
π α φ π θ θµ θµ
θ θµ ηφ α η α ν
− + − − −
− − − + −
∆ = + ∆ + + + − + − +
+ − − ∆ + ∆ +
(26)

25
3. An empirical investigation
We now confront the models of inflation described in the previous section with UK data.
For this purpose we estimate equations like (25) and (26) or slight modifications of those
equations. To deal with the expectation terms in equations (25) and (26), we estimate the
models using the generalised method of moments (GMM). We prefer this method to
alternative instrumental variable regression methods because, by exploiting orthogonality
conditions between some function of the parameters in the model and a set of
instrumental variables, it is typically more efficient and robust. For comparison,
however, we also report some estimates obtained using the standard instrumental
variables (IV) estimator.
All data are quarterly time series over the period 1972 Q3 – 1999 Q2.14 Inflation, the
dependent variable in our regressions that we indicate by 1t t tp pπ −= − , is measured by
the first difference of the GVAD.
We do not model zpt since we do not possess a time series measure of average product
market competition. However, we consider two alternative measures of the output gap.
The first, ( )*t ty y− , is derived by calculating deviations of the log of real output from its
Hodrick-Prescott (HP) trend (with the smoothing parameter set at 1,600). The second
measure, ( )ˆt ty y− , is obtained as a residual from an estimate of potential output based on
a Cobb-Douglas production function. nt is our measure of employment, given by the log
of subordinated employment plus employment of the self-employed. wt represents per
capita wages, and is calculated as the difference between the log of the total
compensation of employees, adjusted to account for the labour remuneration of the self-
employed, and nt. We have two marginal cost adjustment variables: (i) ∆oilt denoting the
change in the real price of oil, where oilt is the log of the oil spot price in US dollars first
adjusted for the log of the sterling/US dollar bilateral exchange rate, and then deflated via
the GVAD; and (ii) rpmt = pmt – pt, a measure of the relative price of imports, where pmt
14 The Data Appendix provides more details about the series we use.

26
is equal to the log of the ratio of total imports at current prices to total imports at constant
prices. We give oil a special status in imports because its price is subject to such
enormous fluctuations.
We measure the weakness of foreign competition with comt. This is given by the log of
the ratio of an index of M6 (that is, the G7 countries, excluding the UK) export prices
(goods and services), which uses the weights employed to construct the effective
exchange rate, and the GVAD, tp . Finally, Lts and *Lts indicate the labour share adjusted
for self-employment contributions with and without adjustment for public-sector
considerations, respectively, as described in section 1.
We estimate equation (25) as it is. However, to estimate equation (26) we note that it
may be rewritten as follows.
( ) ( )( ) ( ) ( )
*0 1 1 1 1 1 1 2 1
1 3 1 1 1 1
/ / /11 ˆ/ / / /
wt t t p t pt p t t t p t t t
t
p t Lt p t mt t n p t t n p t t t
E b E z b E y y b E p p
b E s b E p p b b E n b b E n
α φ π π θ θµ θµπ
φ θ θµ ηφ α η α ν
− + − − − −
− − − + −
+ + + + − + − + =
+ + − − ∆ + ∆ + (26a)
where 1ˆ ( )t t t t tv v Eφ π π−= + − .
Equation (26a) has the same structure as (25), with the exception that 1tπ − is included and
the coefficients on 1 1t tE π− + and 1tπ − now sum to unity.
3.1 Estimation results
We now present results of the estimation of equations (25) and (26a). To obtain GMM
estimates of these equations, we have written down the moment conditions as
orthogonality conditions between an expression including the parameters in the equations
and a set of instrumental variables tx . More specifically, under rational expectations,
equation (25) defines the set of orthogonality conditions:
27
( ) ( )( ) ( ) ( )
*0 1 1 2
3 1
/ / / /0
/ / /
wt p pt p t t p t t p Lt
t t t
p mt t n p t n p t
b z b y y b p p b sE x
b p p b b n b b n
α φπ θ θµ θµ θπ
θµ ηφ α η α
+
+
+ + + − + − + + − = − − ∆ + ∆
Similarly, the set of orthogonality conditions associated with equation (26a) is given by:
( ) ( )( ) ( ) ( )
*0 1 1 1 2
3 1
/ / /10
1 / / / /
wt t p pt p t t p t t
t t t
p Lt p mt t n p t n p t
b z b y y b p pE x
b s b p p b b n b b n
α φπ π θ θµ θµπ
φ θ θµ ηφ α η α
+ −
+
+ + + + − + − + − = + + − − ∆ + ∆
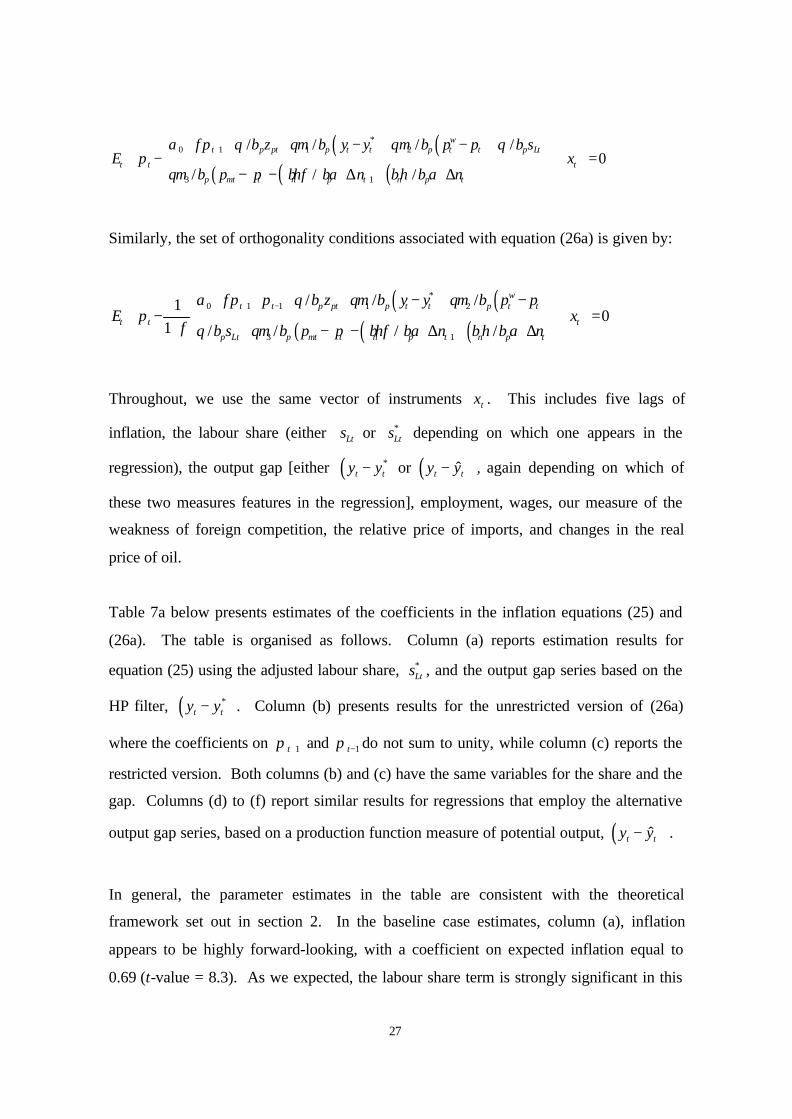
Throughout, we use the same vector of instruments tx . This includes five lags of
inflation, the labour share (either Lts or *Lts depending on which one appears in the
regression), the output gap [either ( )*t ty y− or ( )ˆt ty y− , again depending on which of
these two measures features in the regression], employment, wages, our measure of the
weakness of foreign competition, the relative price of imports, and changes in the real
price of oil.
Table 7a below presents estimates of the coefficients in the inflation equations (25) and
(26a). The table is organised as follows. Column (a) reports estimation results for
equation (25) using the adjusted labour share, *Lts , and the output gap series based on the
HP filter, ( )*t ty y− . Column (b) presents results for the unrestricted version of (26a)
where the coefficients on 1tπ + and 1tπ − do not sum to unity, while column (c) reports the
restricted version. Both columns (b) and (c) have the same variables for the share and the
gap. Columns (d) to (f) report similar results for regressions that employ the alternative
output gap series, based on a production function measure of potential output, ( )ˆt ty y− .
In general, the parameter estimates in the table are consistent with the theoretical
framework set out in section 2. In the baseline case estimates, column (a), inflation
appears to be highly forward-looking, with a coefficient on expected inflation equal to
0.69 (t-value = 8.3). As we expected, the labour share term is strongly significant in this

28
equation entering with a coefficient of 0.16 (t-value = 4.9), which implies that a 1 per
cent rise in the share of labour gives rise to a 0.16 percentage point increase in inflation.
Additional cost elements, namely real import prices and the change in oil prices, are also
important. The employment terms ∆nt+1 and ∆nt are correctly signed and significant in
this equation, suggesting that employment adjustment costs are relevant for pricing
decisions and hence for inflation in the UK. On the other hand, in this baseline
regression, both variables that capture variations in the equilibrium mark-up, i.e. the
output gap and the term capturing the impact of foreign competition, are not significant.
When we model adjustment costs so as to envisage long-run neutrality between real and
nominal variables in the inflation equation, results are not greatly altered. In this respect,
column (b) in Table 7a shows estimates of the unrestricted version of equation (26a),
which introduces a lag term in inflation on the right hand side, but does not restrict the
coefficients on the inflation terms to sum to unity. The coefficient on the lagged inflation
term is significant but small (0.15, t-value = 4.3). Furthermore, when we impose the
restriction that the weights on 1tπ + and 1tπ − sum to unity in column (c), the restriction is
decisively rejected by the data (F-statistic = 34.8, p-value = 0.00), a result that is not new
for estimates of UK inflation equations. Taken together, this implies that the persistence
in inflation relative to output that is usually observed in UK data may be ultimately
related to the sluggish movement in the share of labour as well as in other relevant
variables, particularly contemporaneous and expected changes in employment, capturing
employment adjustment costs. In general, introducing a lagged inflation term has the
effect of making other regressors in the equation notably the degree of foreign
competition, the relative price of imports and the output gap more significant. When
the restriction is actually imposed [column (c)], the coefficients on expected and current
employment, and foreign competition become even more significant, although the sign of
the latter effect changes. The coefficient on the labour share remains positive when this
restriction is imposed, but it is no longer significant. However, since the restriction is
decisively rejected, significant weight should not be attached to the results in column (c).

29
We now turn to the estimation results obtained when we use the output gap measure that
we derive as a residual of an estimate of a Cobb-Douglas production function, ( )ˆt ty y−
[see columns (d), (e), (f)]. Three things emerge looking at these results. First, in line
with results from the regressions using ( )*t ty y− , in these regressions the coefficient on
labour share is always ‘correctly’ signed (positive) and strongly significant. In some
instances, the coefficient on the share is even larger than in the former regressions
[notably, in column (d) this coefficient is 0.26 compared with 0.16 in the similar
regression of column (a) using ( )*t ty y− ]. Second, as in the previous case, the restriction
that the weights on expected and lagged inflation terms sum to one is rejected (F-statistic
= 42.5, p-value = 0.00). Imposing this restriction [(column (f)] makes the foreign
competition variable more significant relative to the case where this restriction is not
imposed. Finally, the role of the output gap in all the regressions is not a strong one,
although it is generally negative, indicating a degree of counter-cyclicality in the
equilibrium mark-up.
Taken together, the results in Table 7a suggest that a theory-based pricing model that
accounts for the impact of employment adjustment costs and openness of the economy in
the pricing decisions of firms offers a good portrait of UK inflation over the period 1972
Q3 – 1999 Q2. Importantly, in line with the crude empirical evidence in section 2, and
with the intuition behind our theory-based pricing model, the results in Table 7a suggest
unanimously that the share of labour may contain information that is useful in predicting
inflation in the UK.
In this sense, for instance, these regressions can help us explain why the labour share and
inflation seem to have taken different paths since 1995 (see Chart 2). Focussing on our
baseline equation [equation (a) in table 7a], we find no evidence of parameter instability

30
in this equation, so a structural break cannot explain this finding. 15 In the framework of
equation (a), a more plausible explanation for the divergent paths in the share and
inflation seems instead to be the sharp fall of the relative price of imports ( trpm ), one of
the regressors in equation (a), after 1995. As Chart 5 below shows, this paralleled the
post-1995 surge in the labour share and thereby counterbalanced the inflationary effects
of a rising labour share ( trpm also enters with a positive coefficient in the equation). It is
possible that if in the future the price of relative imports reverts to its pre-1995 level,
other things being equal, the current level of the share may unleash inflationary pressures
as it did in the past for comparable levels.
Chart 5: labour share measures and the relative price of imports
54
56
58
60
62
64
66
68
70
72
74
76
78
Mar-87 Mar-88 Mar-89 Mar-90 Mar-91 Mar-92 Mar-93 Mar-94 Mar-95 Mar-96 Mar-97 Mar-98 Mar-99 Mar-00-0.30
-0.25
-0.20
-0.15
-0.10
-0.05
0.00
0.05
0.10
0.15
labour share measure adjusted for self-employment and government (LHS)
labour share measure adjusted for self-employment (LHS)
relative price of imports (RHS)
Per cent Log of ratio
In Table 7b we present some further variants of the basic model (25). In column (g) we
replace the adjusted share of labour, *Lts , with Lts , the measure that refers to the whole
economy rather than just the market sector. The equation appears to be well specified
with the coefficient on the labour share remaining significant, although it is only around
two-thirds the size of that in Table 7a, column (a). In column (h) of Table 7b, we simply
15 Results from a rolling regression of our baseline equation (column (a) in Table 7a) indicate that thecoefficient on the labour share has been stable over the sample of estimation around a level of 0.15. This isconfirmed by an analysis of residuals from this equation, which reveals that the fit has improved, ratherthan deteriorated, since 1995 Q2 (the standard deviation of the residuals over the 1972 Q3 –1995 Q2 periodis actually higher than that computed over the whole sample period (0.0117 compared with 0.0108)).

31
check that the pre-whitening procedure we use in GMM is not generating major changes
in the results. So here we remove it, and, as can be seen, the basic structure remains
broadly unchanged. However, it is worth noting that in column (h), the coefficients on
comt and trpm are almost exactly the opposite of those in column (a). This is perhaps
due to the broad similarity between these two variables (see the Data Appendix) which
obviously makes it difficult separately to identify their individual coefficients.
Turning to columns (i) and (j) of Table 7b, we report standard IV estimates using both
measures of the output gap. While the overall structure of the estimates is similar to the
corresponding GMM equations [columns (a) and (d) of table 7a], the coefficients are
generally less well determined, as might be expected given that the GMM estimator
should be more efficient. Nevertheless, the labour share coefficient remains significant
and is of the same order of magnitude.
The impact of the Single European Act on UK inflation
The remaining columns of Table 7b consider the longer term stability of the equilibrium
mark-up of prices on marginal cost. With the signing of the Single European Act in the
UK in 1986, a procedure for progressively removing internal barriers within the
European Single Market was put in train. This steadily increased the degree of product
market competition facing UK firms, so one potentially interesting issue is whether or not
there is any evidence of a fall in the equilibrium mark-up over this period. In column (k)
we address this issue by including a dummy variable (Dt) which takes the value of 1 after
1990 Q1. In the estimation, this dummy appears significantly negative, indicating that
the mark-up may have been consistently smaller after this point. In fact, a similarly-
constructed dummy starting at any point between mid-1987 and mid-1991 is significant,
but not outside that interval. So there is no evidence, for example, of a shift in the
constant term following the introduction of inflation targeting in 1992. However, there is
weak evidence of an increase in the labour share coefficient around this time for, in
column (l), we allow this coefficient to change (using a linear spline) and the increase in
the coefficient has a t-value of 1.5.

32
Table 7a – Explaining UK Inflation [based on (25) and (26a)]
Dependent variable: t tpπ = ∆
(a) (b) (c) (d) (e) (f)
Constant -0.66(4.9)
-0.70(6.8)
-0.08(0.7)
-1.07(8.0)
-0.95(7.8)
-0.34(2.8)
1tπ +0.69(8.3)
0.48(9.3)
0.73(18.9)
0.44(7.7)
0.46(8.1)
0.68(16.1)
1tπ − -0.15(4.3)
0.27(7.2) -
0.10(2.3)
0.32(7.7)
( )*-t ty y 0.022(0.4)
0.08(1.9)
-0.05(1.2) - - -
( )ˆ-t ty y - - --0.031(1.0)
-0.035(1.4)
-0.059(2.0)
comt-0.001(0.1)
-0.012(1.5)
0.032(3.6)
-0.021(1.5)
-0.019(1.7)
0.047(3.5)
*Lts 0.16
(4.9)0.17(6.8)
0.020(0.7)
0.26(8.1)
0.23(7.8)
0.080(2.8)
rpmt0.017(1.5)
0.036(3.2)
-0.042(3.8)
0.061(3.6)
0.054(3.8)
-0.050(3.3)
∆oilt-0.024(8.0)
-0.022(8.2)
-0.024(10.4)
-0.023(7.6)
-0.024(8.5)
-0.029(10.4)
∆nt+1-1.04(3.5)
-0.78(3.2)
-1.04(3.7)
-1.12(3.2)
-0.89(2.6)
-1.42(4.0)
∆nt1.27(4.2)
0.89(3.2)
1.18(4.4)
1.80(4.5)
1.54(4.2)
1.89(4.7)
Estimationmethod GMM GMM GMM GMM GMM GMM
χ2 test ofover-identifyingrestrictions
χ2(31) =18.6 χ2(30) =18.2 χ2(30) =18.6 χ2(31) =15.4 χ2(30) =15.6 χ2(30) =17.3
Adjusted R20.484 0.583 0.523 0.470 0.515 0.435
Test of therestriction
- - F(1,98)=34.8 - - F(1,98)=42.5

33
Table 7b – Explaining UK Inflation [variants of (25)]
Dependent variable: t tpπ = ∆
(g) (h) (i) (j) (k) (l)
Constant -0.47(3.0)
-0.41(2.0)
-0.69(2.2)
-0.62(2.1)
-0.40(2.8)
-0.28(2.5)
1tπ +0.79
(10.0)0.65(5.8)
0.41(2.2)
0.35(1.9)
0.70(9.5)
0.78(18.3)
( )*-t ty y -0.021(0.4)
0.016(0.3)
0.16(1.4) -
-0.001(0.0)
0.08(2.0)
( )ˆ-t ty y - - -0.086(1.3) - -
comt-0.001(0.2)
0.024(2.2)
-0.003(0.2)
-0.017(0.7)
0.016(1.8)
0.014(1.7)
*Lts -
0.10(2.0)
0.17(2.2)
0.15(2.2)
0.10(2.8)
0.067(2.5)
Lts 0.11(3.0) - - - - -
Rpmt0.011(1.1)
-0.008(0.5)
0.041(1.4)
0.056(1.7)
-0.017(1.2)
-0.013(1.2)
∆oilt-0.015(5.7)
-0.010(2.4)
-0.021(2.9)
-0.023(3.3)
-0.019(7.0)
-0.016(6.3)
∆nt+1-0.84(2.4)
-1.21(4.0)
-0.48(0.7)
-0.66(1.0)
-0.99(3.6)
0.38(1.6)
∆nt1.07(3.2)
1.31(4.2)
0.30(0.5)
0.45(0.6)
0.99(3.4)
-0.23(0.9)
Dt - - - --0.004(2.6) -
*Lts (post 1992) - - - - -
0.057(1.5)
Estimationmethod GMM GMM* IV IV GMM GMM
χ2 test ofover-identifyingrestrictions
χ2 (31) =17.7 χ2 (31) =16.9 na na χ2 (30) =19.0 χ2 (30) =18.6
Adjusted R20.514 0.514 0.598 0.599 0.532 0.497
34
Notes to Tables (7a) and (7b):
(i) Absolute t-values in parentheses. Sample period 1972 Q3 – 1999 Q2.
(ii) Instruments include lags t-1, t-2,…,t-5 for the variables tπ , ( )*-t ty y [or( )ˆ-t ty y ], *Lts [or Lts ],
comt, rpmt, ∆oilt, nt, and wt.
(iii) The GMM method uses pre-whitening, whereby a preliminary VAR(1) is estimated to “soak up”
the correlation in the moment conditions. Column (h) reports an equation where pre-whitening is
not used (denoted GMM*).
(iv) ( )*-t ty y is the output gap based on deviations from a Hodrick-Prescott trend. ( )ˆ-t ty y is based
on deviations from a Cobb-Douglas based measure of potential output. nt is employment, wt is the
per capita wage, *Lts and Lts are variants of the labour share (see section 1), rpmt is the real price
of imports, comt is real world prices, and oilt is the real price of oil . tπ is inflation, the first
difference of the natural log of the gross value added price deflator. 1tD = for t >1990 Q1, zero
otherwise.
(v) In column (l), the variable *Lts (post 1992) takes the value ( )( )* * 1992Q3Lt Lts s− for t ≥ 1992 Q3
and zero otherwise.

35
4. Conclusions
We have examined the relationship between labour’s share and the rate of inflation in the
context of a simple dynamic model of firms pricing behaviour (the “new Keynesian
Phillips curve”). This is based on an adjustment cost model, which includes costs of
adjusting both prices and employment. Our main conclusions are as follows.
(i) The share of labour in the UK (corrected for self-employment) has been stationary
over the last 30 years.
(ii) The share of labour has a significant impact on inflation, given the output gap.
This is true both within a VAR framework and in the context of a forward-looking
Phillips curve. A one per cent increase in labour’s share generates a 0.16 percentage
point rise in inflation, ceteris paribus.
(iii) Our theoretical and empirical findings on the UK dynamic pricing relationship
also help us understand why the surge in the labour share observed since 1995 did not
have significant effects on inflation. This is due to the ‘compensating’ impact of falling
relative import prices over that period, which also matter for that relationship. It follows
that if the relative price of imports reverts to its pre-1995 levels, a high level of the share
as the one currently observed may eventually drive up in inflation, other things being
equal.
(iv) Finally, there is some evidence that the equilibrium price mark-up on marginal
cost fell at the end of the 1980s as the European Single Market was being completed.

36
References
Artus, J R (1984), ‘An Empirical Evaluation of the Disequilibrium Real Wage Rate
Hypothesis’, NBER Working Paper no. 1404, Cambridge, Mass.
Bank of England (1999), Economic Models at the Bank of England, London: Bank of
England.
Bentolila, S and Saint-Paul, G (1999), ‘Explaining Movements in the Labor Share’,
CEMFI Working Paper no. 9905.
Blanchard, O J (1997), ‘The Medium Run’, Brookings Papers on Economic Activity,
0(2), pp. 89-141.
Blanchard, O J (1998), ‘Revisiting European Unemployment: Unemployment, Capital
Accumulation and Factor Prices’, NBER Working Paper no.6566, Cambridge, Mass.
Caballero, R and Hammour, M (1998), ‘Jobless Growth: Appropriability, Factor
Substitution, and Unemployment’, Carnegie-Rochester Conference Series on Public
Policy; 48(0), pp. 51-94.
Calvo, G A, (1983), ‘Staggered Prices in a Utility Maximising Framework’, Journal of
Monetary Economics, 12, pp. 383-398.
Dotsey, M, King, R G, Wolman, A L, (1999), “State-Dependent Pricing and the General
Equilibrium Dynamics of Money and Output”, Quarterly Journal of Economics, 114(2),
pp. 655-90.
Gali, J, Gertler, M and Lopez-Salido, J (2000), ‘European Inflation Dynamics’,
mimeo.

37
Green, E and Porter, R, (1984), “Non-Cooperative Collusion Under Imperfect price
Information”, Econometrica, 52, pp. 87-100.
Henley, A, (1987), ‘Labour's Shares and Profitability Crisis in the U.S.: Recent
Experience and Post-war Trends’, Cambridge Journal of Economics, 11(4), pp. 315-30.
Kang, J H, Jeong, U and Bae, J H, (1998), ‘Cyclicality of Markups and Real Wages in
Korea’, Economics Letters, 60(3), pp. 343-49.
Layard, R, Nickell, S and Jackman, R, (1991), Unemployment, Macroeconomic
Performance and the Labour Market, Oxford: Oxford University Press.
Modesto, L and Monteiro, M L, (1993), ‘Wages, Productivity and Efficiency: An
Empirical Study for the Portuguese Manufacturing Sector’, Economia (Portuguese-
Catholic-University), 17(1), pp. 1-25.
Phillips, A V, (1958), “The Relationship Between Unemployment and the Rate of
Change of Money Wage Rates in the United Kingdom, 1861-1957”, Economica, 25, pp.
283-99.
Phillips, J and Costello, D, (1992), ‘Are Labor Shares Really Constant? An International
Study of the Cyclical Behaviour of Labor Shares’, University of Western Ontario
Department of Economics Research Report no. 9207.
Praschnik, J and Costello, D, (1992), ‘Are Labor Shares Really Constant? An
International Study of the Cyclical Behaviour of Labor Shares’, University of Western
Ontario Department of Economics Research Report no. 9207.
Ricardo, D (1821), The Principles of Taxation and Political Economy, London: J. M.
Dent.

38
Roberts, J M, (1995), “New Keynesian Economics and the Phillips Curve”, Journal of
Money Credit and Banking, 27, pp. 975-984.
Rotemberg, J J, (1982), ‘Sticky Prices in the United States’, Journal of Political
Economy, 90(6), pp. 1187-1211.
Rotemberg, J J and Saloner, G, (1986), ‘A Supergame-Theoretic Model of Price Wars
during Booms’, American Economic Review, 76(3), pp. 390-407
Sbordone, A, (1998), ‘Prices and Unit Labor Costs: A New Test of Price Stickiness’,
IIES Seminar Paper 653, Stockholm University.
Sherman, H, (1990), ‘Cyclical Behavior of the Labor Share’, Review of Radical Political
Economics, 22(2-3), pp. 92-112.
Sims, C, (1988), ‘Comments and Discussion’, Brookings Papers on Economic Activity,
1, pp.75-79.
Tirole, J, (1988), The Theory of Industrial Organisation, Cambridge, MIT Press.

39
Data Appendix
The following variables are used in the regressions estimated in this paper.16
ts = ln[(HAEAt/ABMLt)*100] where HAEAt is the compensation of employees,
including the value of social contributions payable by the employer, and ABMLt is gross
value added (current prices) measured at basic prices, excluding taxes less subsidies on
products.
Lts = ln[((HAEAt*At)/ABMLt)*100], where At = (Et + SEt)/Et. From June 1978, Et is
given by BCAJt, the number of employee workforce jobs (seasonally adjusted), while SEt
is given by DYZNt, the number of self-employment workforce jobs (seasonally adjusted).
Prior to June 1978, data for these two series are only available for the second quarter of
each year: these observations have been linearly interpolated in order to obtain
observations for Et and SEt for the other quarters.
*Lts = ln[{((HAEAt – NMXSt)*At)/(ABMLt – GGGVAt)}*100], where NMXSt is
compensation of employees paid by the general government. The series GGGVAt is a
measure of the part of gross value added attributable to the general government. From
1987 Q1 to 1997 Q4, this is given by NMXNt, which is general government gross value
added. This series is not available for other quarters, so to derive the series GGGVAt for
these quarters, it is assumed that NMXNt grows at the same rate as the sum of its two
largest components, NMXSt and NMXVt, the general government gross operating
surplus. Together these two components account for around 98 per cent of NMXN t
throughout the sample period.
pt = ln[(ABMLt/ABMMt)*100], where ABMMt is gross value added (constant prices)
measured at basic prices, excluding taxes less subsidies on products. Two measures of
inflation are considered: 1t t tp pπ −= − and 4 4t t tp pπ −= − . Two corresponding measures
16 Four letter codes refer to series produced by the UK Office for National Statistics.

40
of the change in inflation are also considered: 1 1 1 2( ) ( )t t t t t t tp p p pπ π π − − − −∆ = − = − − −
and 4 4 4 4 4 4 8( ) ( )t t t t t t tp p p pπ π π − − − −∆ = − = − − − .
yt = ln(ABMMt). Applying a Hodrick-Prescott filter to this series provides a statistical
measure of trend output, *ty , and of the output gap, ( )*
t ty y− . An alternative measure of
the output gap, ( )ˆt ty y− , is obtained as a residual from an estimate of potential output
based on a Cobb-Douglas production function, as described in Bank of England (1999,
p.27).
nt = ln(Et + SEt). ∆nt = nt - nt-1. wt = ln[((HAEAt*At)/(Et + SEt))*100].
oilt = ln[(PETSPOTt/AJFAt)*100] - pt, where PETSPOTt is the oil spot price (average of
Brent Crude, West Texas and Dubai Light) in $US, with data obtained from Bloomberg.
The series AJFAt is the sterling - $US exchange rate. ∆oilt = oilt - oilt-1.
comt = ln[(WPXt/EERt)*100] – pt, where WPXt is the weighted average of export prices
for the G7 countries (excluding UK), with effective exchange rate weights applied.
Export price data have been obtained from the IMF’s International Financial Statistics
data base and from Datastream. The series EERt is the UK’s nominal effective exchange
rate and is also obtained from the International Financial Statist ics data base.
rpmt = ln[(IKBIt/IKBLt)*100] – pt, where IKBIt is total imports (current prices), and
IKBLt is total imports (constant prices).

41
Chart A: Dependent and explanatory variables used in regressions
tπ *Lts Lts
( )*t ty y− ( )ˆt ty y− comt
rpmt ∆oilt ∆nt
-0.02
0.00
0.02
0.04
0.06
0.08
74 76 78 80 82 84 86 88 90 92 94 96 984.10
4.15
4.20
4.25
4.30
4.35
74 76 78 80 82 84 86 88 90 92 94 96 984.20
4.25
4.30
4.35
74 76 78 80 82 84 86 88 90 92 94 96 98
-0.04
-0.02
0.00
0.02
0.04
0.06
74 76 78 80 82 84 86 88 90 92 94 96 98-0.05
0.00
0.05
0.10
0.15
74 76 78 80 82 84 86 88 90 92 94 96 98-0.4
-0.2
0.0
0.2
0.4
0.6
74 76 78 80 82 84 86 88 90 92 94 96 98
-0.4
-0.2
0.0
0.2
0.4
0.6
74 76 78 80 82 84 86 88 90 92 94 96 98-1.0
-0.5
0.0
0.5
1.0
1.5
74 76 78 80 82 84 86 88 90 92 94 96 98-0.015
-0.010
-0.005
0.000
0.005
0.010
0.015
74 76 78 80 82 84 86 88 90 92 94 96 98

42
Table A: ADF tests for model variables
Variable ADF statistic Specification H0: Unit root
s -3.066105 Trend, intercept Accept
∆s -3.443830*** No trend, no intercept Reject
Lts -3.129561** No trend, intercept Reject
Lts∆ -3.534816*** No trend, no intercept Reject
*Lts -2.683510* No trend, intercept Reject
*Lts∆ -3.480881*** No trend, no intercept Reject
pt -1.930334 Trend, intercept Accept
tπ -3.827583** Trend, intercept Reject
tπ∆ -5.782957*** No trend, no intercept Reject
4tπ -2.888511 Trend, intercept Accept
4 4tπ∆ -3.220575*** No trend, no intercept Reject
yt -2.087793 Trend, intercept Accept
∆yt -2.719457*** No trend, no intercept Reject
( )*-t ty y -3.484631*** No trend, no intercept Reject
( )*-t ty y∆ -5.021502*** No trend, no intercept Reject
( )ˆ-t ty y t -2.107960** Trend, intercept Reject
( )ˆ-t ty y∆ -4.034647*** No trend, no intercept Reject
comt -3.277054* Trend, intercept Reject
∆comt -5.069141*** Trend, intercept Reject
rpmt -4.111657*** Trend, intercept Reject
∆rpmt -4.991285*** No trend, no intercept Reject
oilt -2.858666 Trend, intercept Accept
∆oilt -5.893210*** No trend, no intercept Reject
nt -2.737882 Trend, intercept Accept

43
∆nt -3.069719*** No trend, no intercept Reject
wt -2.480260 Trend, intercept Accept
∆wt -3.637233** Trend, intercept Reject
The sample period for each regression is 1972 Q3 – 1999 Q2, except for ( )*-t ty y∆ where the sample period
is 1972 Q4 – 1999 Q2. A lag length of four is used for each regression. One, two and three asterisks are used
to indicate that the null hypothesis of a unit root is rejected at the ten, five and one per cent significance levels
respectively.

44
Technical Appendix
Role of the price of materials in marginal cost
Suppose technology has the form:
1GY AK Nα α−= (A1)
and the material input requirement depends only on GY and is given by ( )G Gm Y Y , m′> 0.
The idea here is that to produce a given amount of gross output, GY , we require
quantities of capital and labour satisfying (A1) plus material inputs, M , satisfying:
( )G GM m Y Y= (A2)
( )Gm Y′ could well be positive because as output rises for given K , less and less efficient
machines are used so the per unit material input per unit of output goes up.
Now consider short-run variations (i.e. K fixed). The cost of producing gross output,
GC , is given by:
( ) ( )G G m G GC Y WN P m Y Y= + (A3)
where W is the wage and mP is the price of materials. So the corresponding marginal
cost, GMC , is:
( ) ( )/G G m G G m GMC W N Y P m Y Y P m Y′= ∂ ∂ + +
or
45
( ) ( )G m G m m GG
WNMC P m Y P m Y
Yε
α= + + (A4)
using (A1) and noting that ( ) ( )/m G G Gm Y Y m Yε ′= , the elasticity of unit material input
with respect to gross output.
Now consider the connection between gross output and value added. If Y is value added
at price P , then from (A1), the numerical quantity of value added is the same as the
numerical quantity of gross output, so:
GY Y= (A5)
Then, by the definition of value added:
G G mPY P Y P M= − (A6)
where GP is the price of gross output. Then (A4), (A2) imply:
( )G G G m G GPY P Y P m Y Y= −
and so:
( )G m GP P P m Y= − (A7)
Now define the marginal cost of producing value added as MC . The super-normal profit
generated by producing an extra unit of output is G GP MC P MC− = − , since it must be
the same either way because GY Y= . (Note, under competition, both are zero).
Consequently:

46
( ) ( ) ( )
G G
m G m G m m GG
MC P P MCWN
P m Y P m Y P m YY
εα
= − +
= − + + + (from A7, A4)
( )m G m
WNP m Y
Yε
α= + (from A5)
So:
( ) mG m
PMC WNm Y
P PY Pε
α = +
( ) mLG m
Psm Y
Pε
α = +
(A8)
Derivation of equation (26a):
Starting from (26),
( ) ( )( ) ( ) ( )
*0 1 1 1 1 1 2 1
1 3 1 1 1
/ / /
/ / / /
wt t t p t pt p t t t p t t t
p t Lt p t mt t n p t t n p t t t
E b E z b E y y b E p p
b E s b E p p b b E n b b E n
π α φ π θ θµ θµ
θ θµ ηφ α η α ν
− + − − −
− − − +
∆ = + ∆ + + − + − +
+ − − ∆ + ∆ +
( ) ( )( ) ( ) ( )
*1 0 1 1 1 1 1 1 2 1
1 3 1 1 1
/ / /
/ / / /
wt t t t t t p t pt p t t t p t t t
p t Lt p t mt t n p t t n p t t t
E E b E z b E y y b E p p
b E s b E p p b b E n b b E n
π π α φ π φ π θ θµ θµ
θ θµ ηφ α η α ν
− − + − − − −
− − − +
− = + − + + − + − +
+ − − ∆ + ∆ +
( ) ( )( ) ( ) ( )
*0 1 1 1 1 1 1 1 2 1
1 3 1 1 1
/ / /
/ / / /
wt t t t t t p t pt p t t t p t t t
p t Lt p t mt t n p t t n p t t t
E E b E z b E y y b E p p
b E s b E p p b b E n b b E n
π α φ π φ π π θ θµ θµ
θ θµ ηφ α η α ν
− + − − − − −
− − − +
= + − + + + − + − +
+ − − ∆ + ∆ +
( ) ( ) ( )( ) ( ) ( )
*0 1 1 1 1 1 1 1 2 1
1 3 1 1 1
/ / /
/ / / /
wt t t t t t t t p t pt p t t t p t t t
p t Lt p t mt t n p t t n p t t t
E E b E z b E y y b E p p
b E s b E p p b b E n b b E n
π φπ α φ π φ π π π θ θµ θµ
θ θµ ηφ α η α ν
− + − − − − −
− − − +
+ = + + − + + + − + − +
+ − − ∆ + ∆ +

47
[ ( ) ( )
( ) ( ) ( ) ]
*01 1 1 1 1 1 2 1
2 21 3 1 1 1
1 1/ / /
1 1 1 1
ˆ/ / / /
wt t t t p t pt p t t t p t t t
p t Lt p t mt t n p t t n p t t t
E b E z b E y y b E p p
b E s b E p p b b E n b b E n
α φπ π π θ θµ θµ
φ φ φ φ
θ θµ ηφ α φ η α ν
− + − − − −
− − − +
= + + + + − + − ++ + + +
+ − − ∆ + ∆ +
where ( )1ˆ1
t t t tt
v Ev
φ π πφ
−+ −=
+ .