
Polymeric nanocomposites for electromagnetic wave absorption
Upload
independentCategory
view
0download
0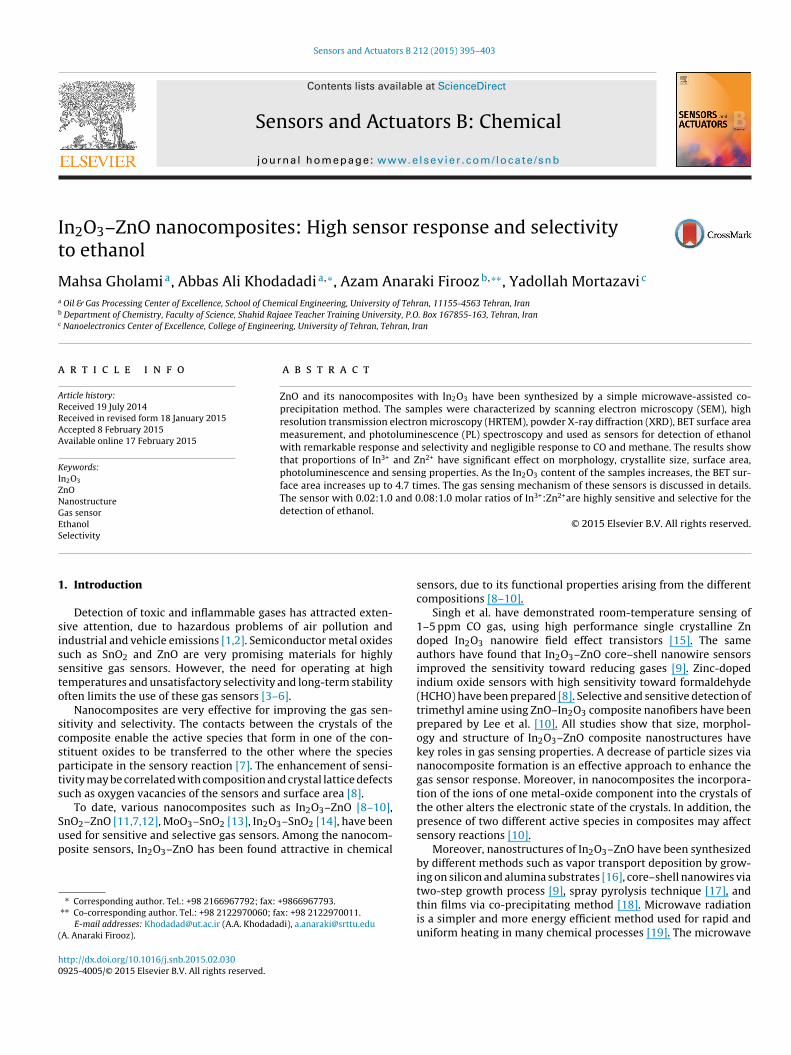
It
Ma
b
c
a
ARRAA
KIZNGES
1
sissto
scspts
Sup
(
h0
Sensors and Actuators B 212 (2015) 395–403
Contents lists available at ScienceDirect
Sensors and Actuators B: Chemical
jo ur nal home page: www.elsev ier .com/ locate /snb
n2O3–ZnO nanocomposites: High sensor response and selectivityo ethanol
ahsa Gholamia, Abbas Ali Khodadadia,∗, Azam Anaraki Firoozb,∗∗, Yadollah Mortazavi c
Oil & Gas Processing Center of Excellence, School of Chemical Engineering, University of Tehran, 11155-4563 Tehran, IranDepartment of Chemistry, Faculty of Science, Shahid Rajaee Teacher Training University, P.O. Box 167855-163, Tehran, IranNanoelectronics Center of Excellence, College of Engineering, University of Tehran, Tehran, Iran
r t i c l e i n f o
rticle history:eceived 19 July 2014eceived in revised form 18 January 2015ccepted 8 February 2015vailable online 17 February 2015
a b s t r a c t
ZnO and its nanocomposites with In2O3 have been synthesized by a simple microwave-assisted co-precipitation method. The samples were characterized by scanning electron microscopy (SEM), highresolution transmission electron microscopy (HRTEM), powder X-ray diffraction (XRD), BET surface areameasurement, and photoluminescence (PL) spectroscopy and used as sensors for detection of ethanolwith remarkable response and selectivity and negligible response to CO and methane. The results showthat proportions of In3+ and Zn2+ have significant effect on morphology, crystallite size, surface area,
eywords:n2O3
nOanostructureas sensorthanol
photoluminescence and sensing properties. As the In2O3 content of the samples increases, the BET sur-face area increases up to 4.7 times. The gas sensing mechanism of these sensors is discussed in details.The sensor with 0.02:1.0 and 0.08:1.0 molar ratios of In3+:Zn2+are highly sensitive and selective for thedetection of ethanol.
© 2015 Elsevier B.V. All rights reserved.
electivity. Introduction
Detection of toxic and inflammable gases has attracted exten-ive attention, due to hazardous problems of air pollution andndustrial and vehicle emissions [1,2]. Semiconductor metal oxidesuch as SnO2 and ZnO are very promising materials for highlyensitive gas sensors. However, the need for operating at highemperatures and unsatisfactory selectivity and long-term stabilityften limits the use of these gas sensors [3–6].
Nanocomposites are very effective for improving the gas sen-itivity and selectivity. The contacts between the crystals of theomposite enable the active species that form in one of the con-tituent oxides to be transferred to the other where the speciesarticipate in the sensory reaction [7]. The enhancement of sensi-ivity may be correlated with composition and crystal lattice defectsuch as oxygen vacancies of the sensors and surface area [8].
To date, various nanocomposites such as In2O3–ZnO [8–10],
nO2–ZnO [11,7,12], MoO3–SnO2 [13], In2O3–SnO2 [14], have beensed for sensitive and selective gas sensors. Among the nanocom-osite sensors, In2O3–ZnO has been found attractive in chemical∗ Corresponding author. Tel.: +98 2166967792; fax: +9866967793.∗∗ Co-corresponding author. Tel.: +98 2122970060; fax: +98 2122970011.
E-mail addresses: [email protected] (A.A. Khodadadi), [email protected]. Anaraki Firooz).
ttp://dx.doi.org/10.1016/j.snb.2015.02.030925-4005/© 2015 Elsevier B.V. All rights reserved.
sensors, due to its functional properties arising from the differentcompositions [8–10].
Singh et al. have demonstrated room-temperature sensing of1–5 ppm CO gas, using high performance single crystalline Zndoped In2O3 nanowire field effect transistors [15]. The sameauthors have found that In2O3–ZnO core–shell nanowire sensorsimproved the sensitivity toward reducing gases [9]. Zinc-dopedindium oxide sensors with high sensitivity toward formaldehyde(HCHO) have been prepared [8]. Selective and sensitive detection oftrimethyl amine using ZnO–In2O3 composite nanofibers have beenprepared by Lee et al. [10]. All studies show that size, morphol-ogy and structure of In2O3–ZnO composite nanostructures havekey roles in gas sensing properties. A decrease of particle sizes viananocomposite formation is an effective approach to enhance thegas sensor response. Moreover, in nanocomposites the incorpora-tion of the ions of one metal-oxide component into the crystals ofthe other alters the electronic state of the crystals. In addition, thepresence of two different active species in composites may affectsensory reactions [10].
Moreover, nanostructures of In2O3–ZnO have been synthesizedby different methods such as vapor transport deposition by grow-ing on silicon and alumina substrates [16], core–shell nanowires via
two-step growth process [9], spray pyrolysis technique [17], andthin films via co-precipitating method [18]. Microwave radiationis a simpler and more energy efficient method used for rapid anduniform heating in many chemical processes [19]. The microwave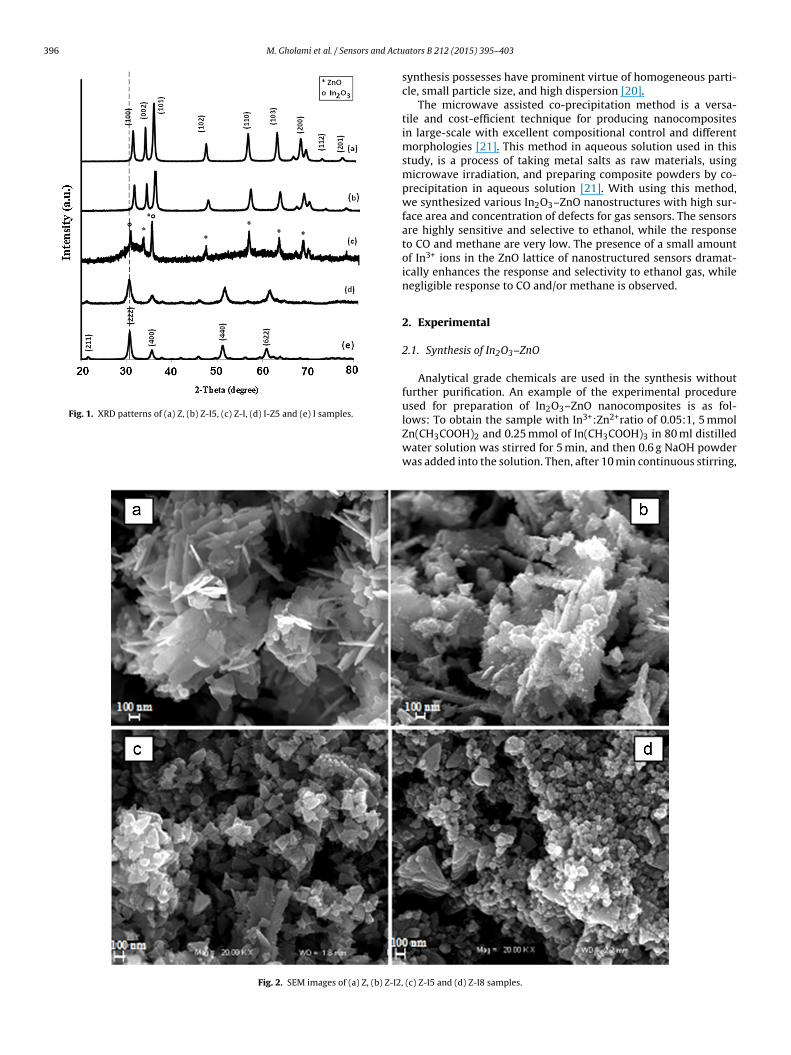
396 M. Gholami et al. / Sensors and Actu
Fig. 1. XRD patterns of (a) Z, (b) Z-I5, (c) Z-I, (d) I-Z5 and (e) I samples.
Fig. 2. SEM images of (a) Z, (b) Z-I2,
ators B 212 (2015) 395–403
synthesis possesses have prominent virtue of homogeneous parti-cle, small particle size, and high dispersion [20].
The microwave assisted co-precipitation method is a versa-tile and cost-efficient technique for producing nanocompositesin large-scale with excellent compositional control and differentmorphologies [21]. This method in aqueous solution used in thisstudy, is a process of taking metal salts as raw materials, usingmicrowave irradiation, and preparing composite powders by co-precipitation in aqueous solution [21]. With using this method,we synthesized various In2O3–ZnO nanostructures with high sur-face area and concentration of defects for gas sensors. The sensorsare highly sensitive and selective to ethanol, while the responseto CO and methane are very low. The presence of a small amountof In3+ ions in the ZnO lattice of nanostructured sensors dramat-ically enhances the response and selectivity to ethanol gas, whilenegligible response to CO and/or methane is observed.
2. Experimental
2.1. Synthesis of In2O3–ZnO
Analytical grade chemicals are used in the synthesis withoutfurther purification. An example of the experimental procedureused for preparation of In2O3–ZnO nanocomposites is as fol-
lows: To obtain the sample with In3+:Zn2+ratio of 0.05:1, 5 mmolZn(CH3COOH)2 and 0.25 mmol of In(CH3COOH)3 in 80 ml distilledwater solution was stirred for 5 min, and then 0.6 g NaOH powderwas added into the solution. Then, after 10 min continuous stirring,(c) Z-I5 and (d) Z-I8 samples.
M. Gholami et al. / Sensors and Actuators B 212 (2015) 395–403 397
Z-I, (b
towtoBI1p
2
wrciˇd
TM
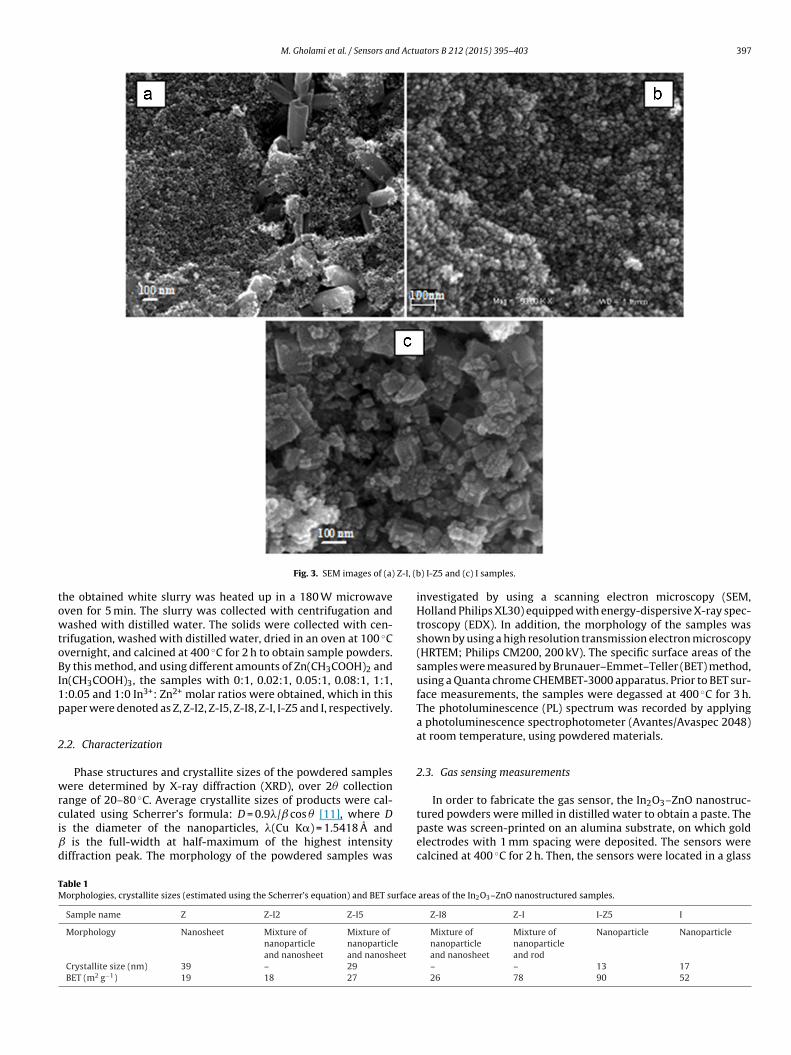
Fig. 3. SEM images of (a)
he obtained white slurry was heated up in a 180 W microwaveven for 5 min. The slurry was collected with centrifugation andashed with distilled water. The solids were collected with cen-
rifugation, washed with distilled water, dried in an oven at 100 ◦Cvernight, and calcined at 400 ◦C for 2 h to obtain sample powders.y this method, and using different amounts of Zn(CH3COOH)2 and
n(CH3COOH)3, the samples with 0:1, 0.02:1, 0.05:1, 0.08:1, 1:1,:0.05 and 1:0 In3+: Zn2+ molar ratios were obtained, which in thisaper were denoted as Z, Z-I2, Z-I5, Z-I8, Z-I, I-Z5 and I, respectively.
.2. Characterization
Phase structures and crystallite sizes of the powdered samplesere determined by X-ray diffraction (XRD), over 2� collection
ange of 20–80 ◦C. Average crystallite sizes of products were cal-
ulated using Scherrer’s formula: D = 0.9�/ cos � [11], where Ds the diameter of the nanoparticles, �(Cu K�) = 1.5418 A andis the full-width at half-maximum of the highest intensityiffraction peak. The morphology of the powdered samples was
able 1orphologies, crystallite sizes (estimated using the Scherrer’s equation) and BET surface
Sample name Z Z-I2 Z-I5
Morphology Nanosheet Mixture ofnanoparticleand nanosheet
Mixture ofnanoparticleand nanosheet
Crystallite size (nm) 39 – 29
BET (m2 g−1) 19 18 27
) I-Z5 and (c) I samples.
investigated by using a scanning electron microscopy (SEM,Holland Philips XL30) equipped with energy-dispersive X-ray spec-troscopy (EDX). In addition, the morphology of the samples wasshown by using a high resolution transmission electron microscopy(HRTEM; Philips CM200, 200 kV). The specific surface areas of thesamples were measured by Brunauer–Emmet–Teller (BET) method,using a Quanta chrome CHEMBET-3000 apparatus. Prior to BET sur-face measurements, the samples were degassed at 400 ◦C for 3 h.The photoluminescence (PL) spectrum was recorded by applyinga photoluminescence spectrophotometer (Avantes/Avaspec 2048)at room temperature, using powdered materials.
2.3. Gas sensing measurements
In order to fabricate the gas sensor, the In2O3–ZnO nanostruc-
tured powders were milled in distilled water to obtain a paste. Thepaste was screen-printed on an alumina substrate, on which goldelectrodes with 1 mm spacing were deposited. The sensors werecalcined at 400 ◦C for 2 h. Then, the sensors were located in a glassareas of the In2O3–ZnO nanostructured samples.
Z-I8 Z-I I-Z5 I
Mixture ofnanoparticleand nanosheet
Mixture ofnanoparticleand rod
Nanoparticle Nanoparticle
– – 13 1726 78 90 52
398 M. Gholami et al. / Sensors and Actuators B 212 (2015) 395–403
Fi
htcwtwfsw
Rtt
3
3
nuIthtadmsf
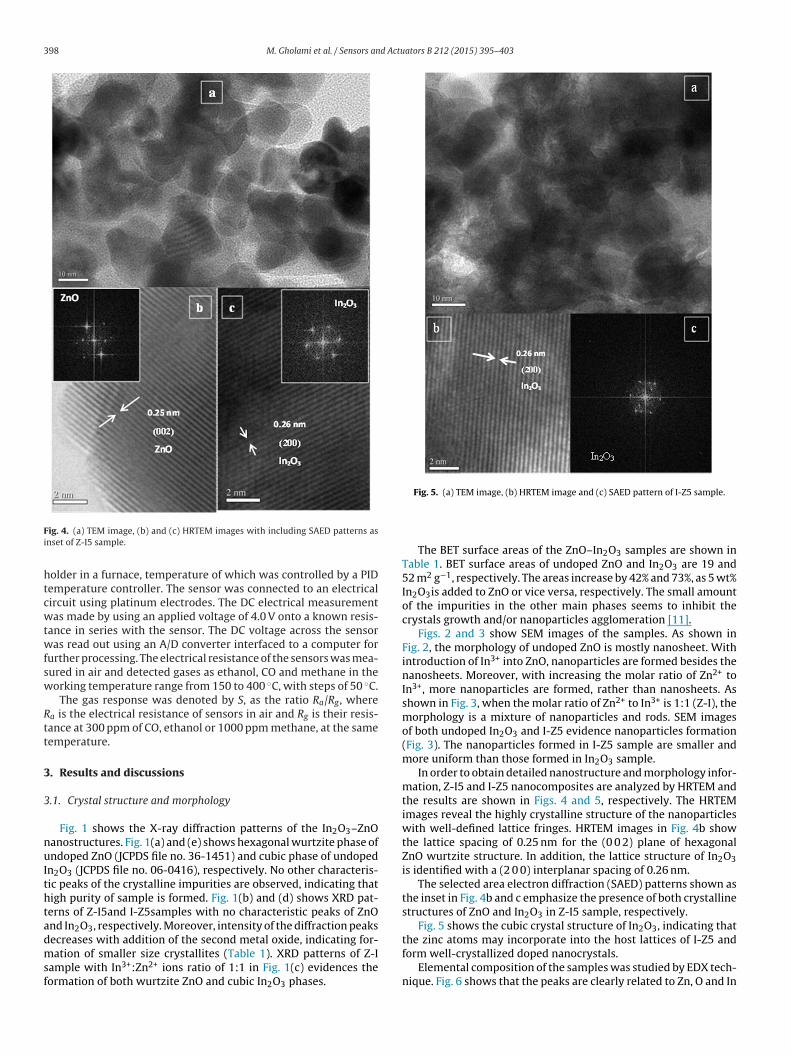
ig. 4. (a) TEM image, (b) and (c) HRTEM images with including SAED patterns asnset of Z-I5 sample.
older in a furnace, temperature of which was controlled by a PIDemperature controller. The sensor was connected to an electricalircuit using platinum electrodes. The DC electrical measurementas made by using an applied voltage of 4.0 V onto a known resis-
ance in series with the sensor. The DC voltage across the sensoras read out using an A/D converter interfaced to a computer for
urther processing. The electrical resistance of the sensors was mea-ured in air and detected gases as ethanol, CO and methane in theorking temperature range from 150 to 400 ◦C, with steps of 50 ◦C.
The gas response was denoted by S, as the ratio Ra/Rg, wherea is the electrical resistance of sensors in air and Rg is their resis-ance at 300 ppm of CO, ethanol or 1000 ppm methane, at the sameemperature.
. Results and discussions
.1. Crystal structure and morphology
Fig. 1 shows the X-ray diffraction patterns of the In2O3–ZnOanostructures. Fig. 1(a) and (e) shows hexagonal wurtzite phase ofndoped ZnO (JCPDS file no. 36-1451) and cubic phase of undoped
n2O3 (JCPDS file no. 06-0416), respectively. No other characteris-ic peaks of the crystalline impurities are observed, indicating thatigh purity of sample is formed. Fig. 1(b) and (d) shows XRD pat-erns of Z-I5and I-Z5samples with no characteristic peaks of ZnOnd In2O3, respectively. Moreover, intensity of the diffraction peaks
ecreases with addition of the second metal oxide, indicating for-ation of smaller size crystallites (Table 1). XRD patterns of Z-Iample with In3+:Zn2+ ions ratio of 1:1 in Fig. 1(c) evidences theormation of both wurtzite ZnO and cubic In2O3 phases.
Fig. 5. (a) TEM image, (b) HRTEM image and (c) SAED pattern of I-Z5 sample.
The BET surface areas of the ZnO–In2O3 samples are shown inTable 1. BET surface areas of undoped ZnO and In2O3 are 19 and52 m2 g−1, respectively. The areas increase by 42% and 73%, as 5 wt%In2O3is added to ZnO or vice versa, respectively. The small amountof the impurities in the other main phases seems to inhibit thecrystals growth and/or nanoparticles agglomeration [11].
Figs. 2 and 3 show SEM images of the samples. As shown inFig. 2, the morphology of undoped ZnO is mostly nanosheet. Withintroduction of In3+ into ZnO, nanoparticles are formed besides thenanosheets. Moreover, with increasing the molar ratio of Zn2+ toIn3+, more nanoparticles are formed, rather than nanosheets. Asshown in Fig. 3, when the molar ratio of Zn2+ to In3+ is 1:1 (Z-I), themorphology is a mixture of nanoparticles and rods. SEM imagesof both undoped In2O3 and I-Z5 evidence nanoparticles formation(Fig. 3). The nanoparticles formed in I-Z5 sample are smaller andmore uniform than those formed in In2O3 sample.
In order to obtain detailed nanostructure and morphology infor-mation, Z-I5 and I-Z5 nanocomposites are analyzed by HRTEM andthe results are shown in Figs. 4 and 5, respectively. The HRTEMimages reveal the highly crystalline structure of the nanoparticleswith well-defined lattice fringes. HRTEM images in Fig. 4b showthe lattice spacing of 0.25 nm for the (0 0 2) plane of hexagonalZnO wurtzite structure. In addition, the lattice structure of In2O3is identified with a (2 0 0) interplanar spacing of 0.26 nm.
The selected area electron diffraction (SAED) patterns shown asthe inset in Fig. 4b and c emphasize the presence of both crystallinestructures of ZnO and In2O3 in Z-I5 sample, respectively.
Fig. 5 shows the cubic crystal structure of In2O3, indicating thatthe zinc atoms may incorporate into the host lattices of I-Z5 and
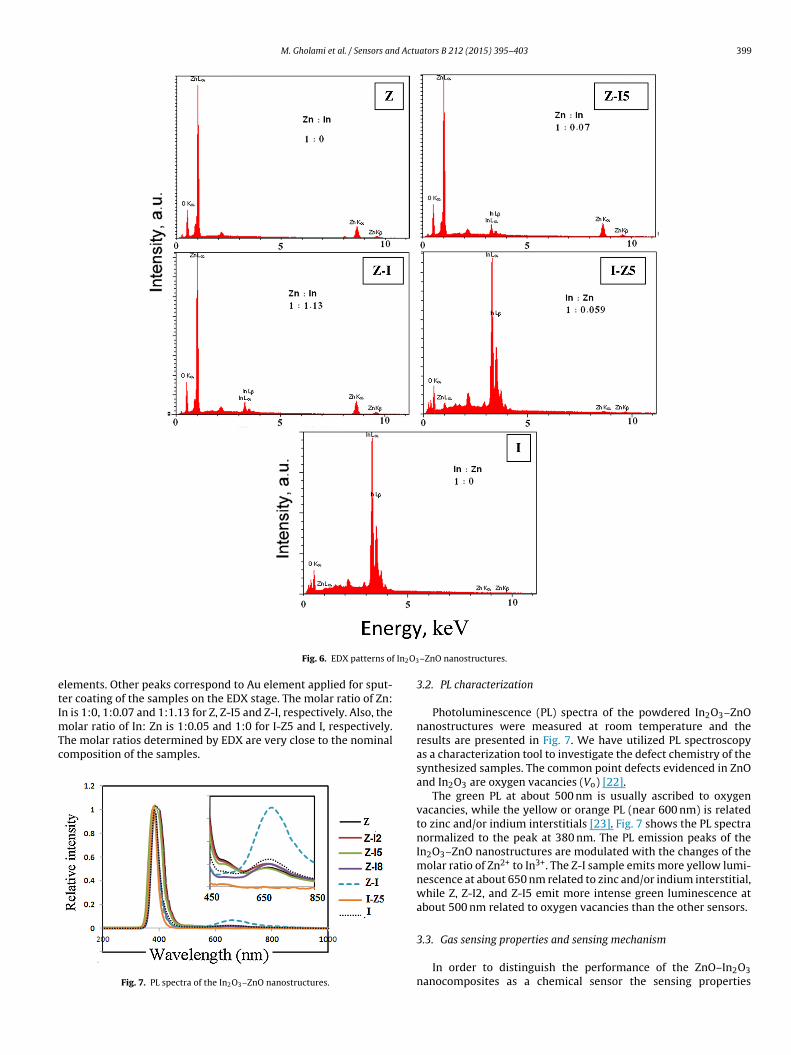
form well-crystallized doped nanocrystals.Elemental composition of the samples was studied by EDX tech-nique. Fig. 6 shows that the peaks are clearly related to Zn, O and In
M. Gholami et al. / Sensors and Actuators B 212 (2015) 395–403 399
In2O3
etImTc
Fig. 6. EDX patterns of
lements. Other peaks correspond to Au element applied for sput-er coating of the samples on the EDX stage. The molar ratio of Zn:
n is 1:0, 1:0.07 and 1:1.13 for Z, Z-I5 and Z-I, respectively. Also, theolar ratio of In: Zn is 1:0.05 and 1:0 for I-Z5 and I, respectively.he molar ratios determined by EDX are very close to the nominalomposition of the samples.
Fig. 7. PL spectra of the In2O3–ZnO nanostructures.
–ZnO nanostructures.
3.2. PL characterization
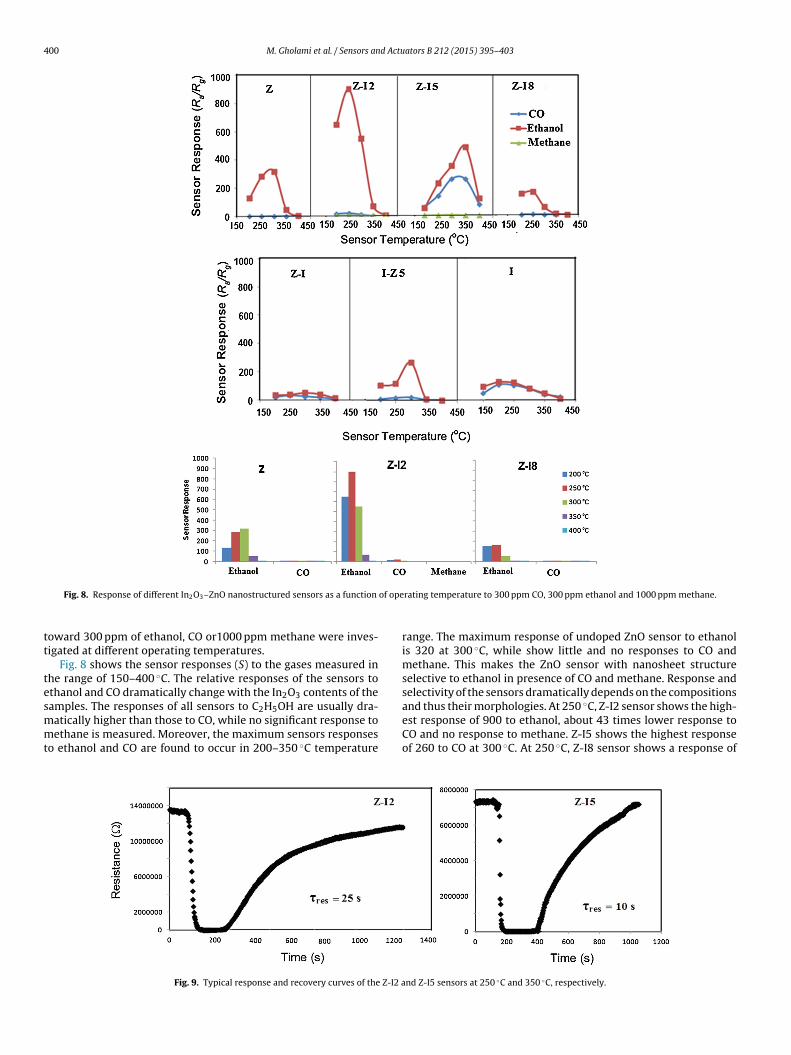
Photoluminescence (PL) spectra of the powdered In2O3–ZnOnanostructures were measured at room temperature and theresults are presented in Fig. 7. We have utilized PL spectroscopyas a characterization tool to investigate the defect chemistry of thesynthesized samples. The common point defects evidenced in ZnOand In2O3 are oxygen vacancies (Vo) [22].
The green PL at about 500 nm is usually ascribed to oxygenvacancies, while the yellow or orange PL (near 600 nm) is relatedto zinc and/or indium interstitials [23]. Fig. 7 shows the PL spectranormalized to the peak at 380 nm. The PL emission peaks of theIn2O3–ZnO nanostructures are modulated with the changes of themolar ratio of Zn2+ to In3+. The Z-I sample emits more yellow lumi-nescence at about 650 nm related to zinc and/or indium interstitial,while Z, Z-I2, and Z-I5 emit more intense green luminescence atabout 500 nm related to oxygen vacancies than the other sensors.
3.3. Gas sensing properties and sensing mechanism
In order to distinguish the performance of the ZnO–In2O3nanocomposites as a chemical sensor the sensing properties
400 M. Gholami et al. / Sensors and Actuators B 212 (2015) 395–403
of ope
tt
tesmmt
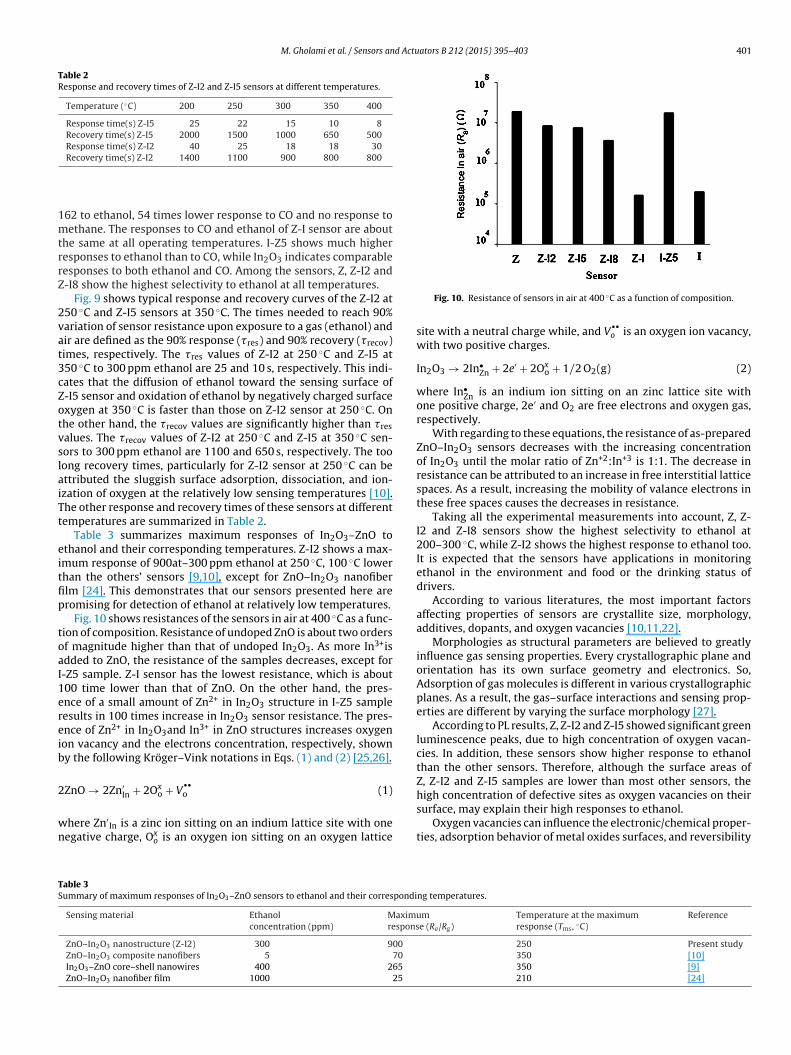
Fig. 8. Response of different In2O3–ZnO nanostructured sensors as a function
oward 300 ppm of ethanol, CO or1000 ppm methane were inves-igated at different operating temperatures.
Fig. 8 shows the sensor responses (S) to the gases measured inhe range of 150–400 ◦C. The relative responses of the sensors tothanol and CO dramatically change with the In2O3 contents of theamples. The responses of all sensors to C2H5OH are usually dra-
atically higher than those to CO, while no significant response toethane is measured. Moreover, the maximum sensors responseso ethanol and CO are found to occur in 200–350 ◦C temperature
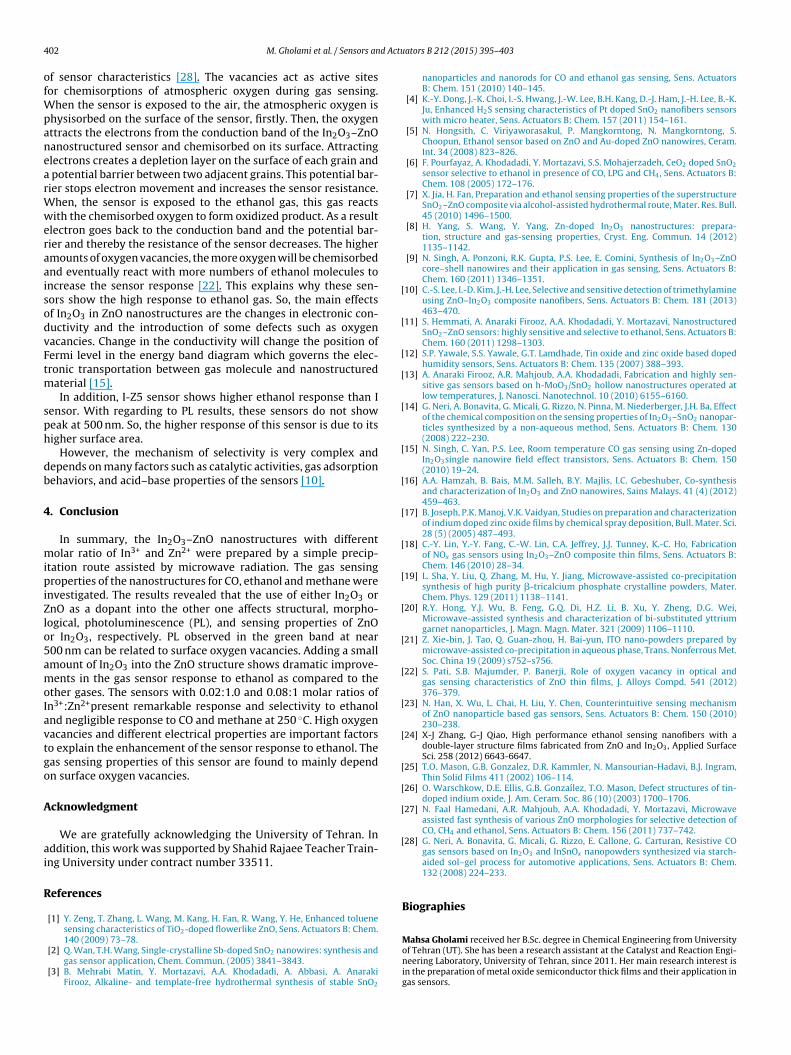
Fig. 9. Typical response and recovery curves of the Z-I2 a
rating temperature to 300 ppm CO, 300 ppm ethanol and 1000 ppm methane.
range. The maximum response of undoped ZnO sensor to ethanolis 320 at 300 ◦C, while show little and no responses to CO andmethane. This makes the ZnO sensor with nanosheet structureselective to ethanol in presence of CO and methane. Response andselectivity of the sensors dramatically depends on the compositionsand thus their morphologies. At 250 ◦C, Z-I2 sensor shows the high-
est response of 900 to ethanol, about 43 times lower response toCO and no response to methane. Z-I5 shows the highest responseof 260 to CO at 300 ◦C. At 250 ◦C, Z-I8 sensor shows a response ofnd Z-I5 sensors at 250 ◦C and 350 ◦C, respectively.
M. Gholami et al. / Sensors and Actuators B 212 (2015) 395–403 401
Table 2Response and recovery times of Z-I2 and Z-I5 sensors at different temperatures.
Temperature (◦C) 200 250 300 350 400
Response time(s) Z-I5 25 22 15 10 8Recovery time(s) Z-I5 2000 1500 1000 650 500Response time(s) Z-I2 40 25 18 18 30
1mtrrZ
2vat3cZotvslaiTt
eitfip
toaI1ereib
2
wn
high concentration of defective sites as oxygen vacancies on their
TS
Recovery time(s) Z-I2 1400 1100 900 800 800
62 to ethanol, 54 times lower response to CO and no response toethane. The responses to CO and ethanol of Z-I sensor are about
he same at all operating temperatures. I-Z5 shows much higheresponses to ethanol than to CO, while In2O3 indicates comparableesponses to both ethanol and CO. Among the sensors, Z, Z-I2 and-I8 show the highest selectivity to ethanol at all temperatures.
Fig. 9 shows typical response and recovery curves of the Z-I2 at50 ◦C and Z-I5 sensors at 350 ◦C. The times needed to reach 90%ariation of sensor resistance upon exposure to a gas (ethanol) andir are defined as the 90% response (�res) and 90% recovery (�recov)imes, respectively. The �res values of Z-I2 at 250 ◦C and Z-I5 at50 ◦C to 300 ppm ethanol are 25 and 10 s, respectively. This indi-ates that the diffusion of ethanol toward the sensing surface of-I5 sensor and oxidation of ethanol by negatively charged surfacexygen at 350 ◦C is faster than those on Z-I2 sensor at 250 ◦C. Onhe other hand, the �recov values are significantly higher than �res
alues. The �recov values of Z-I2 at 250 ◦C and Z-I5 at 350 ◦C sen-ors to 300 ppm ethanol are 1100 and 650 s, respectively. The tooong recovery times, particularly for Z-I2 sensor at 250 ◦C can bettributed the sluggish surface adsorption, dissociation, and ion-zation of oxygen at the relatively low sensing temperatures [10].he other response and recovery times of these sensors at differentemperatures are summarized in Table 2.
Table 3 summarizes maximum responses of In2O3–ZnO tothanol and their corresponding temperatures. Z-I2 shows a max-mum response of 900at–300 ppm ethanol at 250 ◦C, 100 ◦C lowerhan the others’ sensors [9,10], except for ZnO–In2O3 nanofiberlm [24]. This demonstrates that our sensors presented here areromising for detection of ethanol at relatively low temperatures.
Fig. 10 shows resistances of the sensors in air at 400 ◦C as a func-ion of composition. Resistance of undoped ZnO is about two ordersf magnitude higher than that of undoped In2O3. As more In3+isdded to ZnO, the resistance of the samples decreases, except for-Z5 sample. Z-I sensor has the lowest resistance, which is about00 time lower than that of ZnO. On the other hand, the pres-nce of a small amount of Zn2+ in In2O3 structure in I-Z5 sampleesults in 100 times increase in In2O3 sensor resistance. The pres-nce of Zn2+ in In2O3and In3+ in ZnO structures increases oxygenon vacancy and the electrons concentration, respectively, showny the following Kröger–Vink notations in Eqs. (1) and (2) [25,26].
ZnO → 2Zn′In + 2Ox
o + V••o (1)
here Zn′In is a zinc ion sitting on an indium lattice site with one
egative charge, Oxo is an oxygen ion sitting on an oxygen lattice
able 3ummary of maximum responses of In2O3–ZnO sensors to ethanol and their correspondi
Sensing material Ethanolconcentration (ppm)
Maximurespons
ZnO–In2O3 nanostructure (Z-I2) 300 900
ZnO–In2O3 composite nanofibers 5 70
In2O3–ZnO core–shell nanowires 400 265
ZnO–In2O3 nanofiber film 1000 25
Fig. 10. Resistance of sensors in air at 400 ◦C as a function of composition.
site with a neutral charge while, and V••o is an oxygen ion vacancy,
with two positive charges.
In2O3 → 2In•Zn + 2e′ + 2Ox
o + 1/2 O2(g) (2)
where In•Zn is an indium ion sitting on an zinc lattice site with
one positive charge, 2e′ and O2 are free electrons and oxygen gas,respectively.
With regarding to these equations, the resistance of as-preparedZnO–In2O3 sensors decreases with the increasing concentrationof In2O3 until the molar ratio of Zn+2:In+3 is 1:1. The decrease inresistance can be attributed to an increase in free interstitial latticespaces. As a result, increasing the mobility of valance electrons inthese free spaces causes the decreases in resistance.
Taking all the experimental measurements into account, Z, Z-I2 and Z-I8 sensors show the highest selectivity to ethanol at200–300 ◦C, while Z-I2 shows the highest response to ethanol too.It is expected that the sensors have applications in monitoringethanol in the environment and food or the drinking status ofdrivers.
According to various literatures, the most important factorsaffecting properties of sensors are crystallite size, morphology,additives, dopants, and oxygen vacancies [10,11,22].
Morphologies as structural parameters are believed to greatlyinfluence gas sensing properties. Every crystallographic plane andorientation has its own surface geometry and electronics. So,Adsorption of gas molecules is different in various crystallographicplanes. As a result, the gas–surface interactions and sensing prop-erties are different by varying the surface morphology [27].
According to PL results, Z, Z-I2 and Z-I5 showed significant greenluminescence peaks, due to high concentration of oxygen vacan-cies. In addition, these sensors show higher response to ethanolthan the other sensors. Therefore, although the surface areas ofZ, Z-I2 and Z-I5 samples are lower than most other sensors, the
surface, may explain their high responses to ethanol.Oxygen vacancies can influence the electronic/chemical proper-
ties, adsorption behavior of metal oxides surfaces, and reversibility
ng temperatures.
me (Ra/Rg)
Temperature at the maximumresponse (Tms, ◦C)
Reference
250 Present study350 [10]350 [9]210 [24]
4 d Actu
ofWpanearWweraaisodvFtm
sph
db
4
mipiZlo5amoIavtgo
A
ai
R
[
[
[
[
[
[
[
[
[
[
[
[
[
[
[
[
[
[
[
02 M. Gholami et al. / Sensors an
f sensor characteristics [28]. The vacancies act as active sitesor chemisorptions of atmospheric oxygen during gas sensing.
hen the sensor is exposed to the air, the atmospheric oxygen ishysisorbed on the surface of the sensor, firstly. Then, the oxygenttracts the electrons from the conduction band of the In2O3–ZnOanostructured sensor and chemisorbed on its surface. Attractinglectrons creates a depletion layer on the surface of each grain and
potential barrier between two adjacent grains. This potential bar-ier stops electron movement and increases the sensor resistance.
hen, the sensor is exposed to the ethanol gas, this gas reactsith the chemisorbed oxygen to form oxidized product. As a result
lectron goes back to the conduction band and the potential bar-ier and thereby the resistance of the sensor decreases. The highermounts of oxygen vacancies, the more oxygen will be chemisorbednd eventually react with more numbers of ethanol molecules toncrease the sensor response [22]. This explains why these sen-ors show the high response to ethanol gas. So, the main effectsf In2O3 in ZnO nanostructures are the changes in electronic con-uctivity and the introduction of some defects such as oxygenacancies. Change in the conductivity will change the position ofermi level in the energy band diagram which governs the elec-ronic transportation between gas molecule and nanostructured
aterial [15].In addition, I-Z5 sensor shows higher ethanol response than I
ensor. With regarding to PL results, these sensors do not showeak at 500 nm. So, the higher response of this sensor is due to itsigher surface area.
However, the mechanism of selectivity is very complex andepends on many factors such as catalytic activities, gas adsorptionehaviors, and acid–base properties of the sensors [10].
. Conclusion
In summary, the In2O3–ZnO nanostructures with differentolar ratio of In3+ and Zn2+ were prepared by a simple precip-
tation route assisted by microwave radiation. The gas sensingroperties of the nanostructures for CO, ethanol and methane were
nvestigated. The results revealed that the use of either In2O3 ornO as a dopant into the other one affects structural, morpho-ogical, photoluminescence (PL), and sensing properties of ZnOr In2O3, respectively. PL observed in the green band at near00 nm can be related to surface oxygen vacancies. Adding a smallmount of In2O3 into the ZnO structure shows dramatic improve-ents in the gas sensor response to ethanol as compared to the
ther gases. The sensors with 0.02:1.0 and 0.08:1 molar ratios ofn3+:Zn2+present remarkable response and selectivity to ethanolnd negligible response to CO and methane at 250 ◦C. High oxygenacancies and different electrical properties are important factorso explain the enhancement of the sensor response to ethanol. Theas sensing properties of this sensor are found to mainly dependn surface oxygen vacancies.
cknowledgment
We are gratefully acknowledging the University of Tehran. Inddition, this work was supported by Shahid Rajaee Teacher Train-ng University under contract number 33511.
eferences
[1] Y. Zeng, T. Zhang, L. Wang, M. Kang, H. Fan, R. Wang, Y. He, Enhanced toluenesensing characteristics of TiO2-doped flowerlike ZnO, Sens. Actuators B: Chem.
140 (2009) 73–78.[2] Q. Wan, T.H. Wang, Single-crystalline Sb-doped SnO2 nanowires: synthesis andgas sensor application, Chem. Commun. (2005) 3841–3843.
[3] B. Mehrabi Matin, Y. Mortazavi, A.A. Khodadadi, A. Abbasi, A. AnarakiFirooz, Alkaline- and template-free hydrothermal synthesis of stable SnO2
ators B 212 (2015) 395–403
nanoparticles and nanorods for CO and ethanol gas sensing, Sens. ActuatorsB: Chem. 151 (2010) 140–145.
[4] K.-Y. Dong, J.-K. Choi, I.-S. Hwang, J.-W. Lee, B.H. Kang, D.-J. Ham, J.-H. Lee, B.-K.Ju, Enhanced H2S sensing characteristics of Pt doped SnO2 nanofibers sensorswith micro heater, Sens. Actuators B: Chem. 157 (2011) 154–161.
[5] N. Hongsith, C. Viriyaworasakul, P. Mangkorntong, N. Mangkorntong, S.Choopun, Ethanol sensor based on ZnO and Au-doped ZnO nanowires, Ceram.Int. 34 (2008) 823–826.
[6] F. Pourfayaz, A. Khodadadi, Y. Mortazavi, S.S. Mohajerzadeh, CeO2 doped SnO2
sensor selective to ethanol in presence of CO, LPG and CH4, Sens. Actuators B:Chem. 108 (2005) 172–176.
[7] X. Jia, H. Fan, Preparation and ethanol sensing properties of the superstructureSnO2–ZnO composite via alcohol-assisted hydrothermal route, Mater. Res. Bull.45 (2010) 1496–1500.
[8] H. Yang, S. Wang, Y. Yang, Zn-doped In2O3 nanostructures: prepara-tion, structure and gas-sensing properties, Cryst. Eng. Commun. 14 (2012)1135–1142.
[9] N. Singh, A. Ponzoni, R.K. Gupta, P.S. Lee, E. Comini, Synthesis of In2O3–ZnOcore–shell nanowires and their application in gas sensing, Sens. Actuators B:Chem. 160 (2011) 1346–1351.
10] C.-S. Lee, I.-D. Kim, J.-H. Lee, Selective and sensitive detection of trimethylamineusing ZnO–In2O3 composite nanofibers, Sens. Actuators B: Chem. 181 (2013)463–470.
11] S. Hemmati, A. Anaraki Firooz, A.A. Khodadadi, Y. Mortazavi, NanostructuredSnO2–ZnO sensors: highly sensitive and selective to ethanol, Sens. Actuators B:Chem. 160 (2011) 1298–1303.
12] S.P. Yawale, S.S. Yawale, G.T. Lamdhade, Tin oxide and zinc oxide based dopedhumidity sensors, Sens. Actuators B: Chem. 135 (2007) 388–393.
13] A. Anaraki Firooz, A.R. Mahjoub, A.A. Khodadadi, Fabrication and highly sen-sitive gas sensors based on h-MoO3/SnO2 hollow nanostructures operated atlow temperatures, J. Nanosci. Nanotechnol. 10 (2010) 6155–6160.
14] G. Neri, A. Bonavita, G. Micali, G. Rizzo, N. Pinna, M. Niederberger, J.H. Ba, Effectof the chemical composition on the sensing properties of In2O3–SnO2 nanopar-ticles synthesized by a non-aqueous method, Sens. Actuators B: Chem. 130(2008) 222–230.
15] N. Singh, C. Yan, P.S. Lee, Room temperature CO gas sensing using Zn-dopedIn2O3single nanowire field effect transistors, Sens. Actuators B: Chem. 150(2010) 19–24.
16] A.A. Hamzah, B. Bais, M.M. Salleh, B.Y. Majlis, I.C. Gebeshuber, Co-synthesisand characterization of In2O3 and ZnO nanowires, Sains Malays. 41 (4) (2012)459–463.
17] B. Joseph, P.K. Manoj, V.K. Vaidyan, Studies on preparation and characterizationof indium doped zinc oxide films by chemical spray deposition, Bull. Mater. Sci.28 (5) (2005) 487–493.
18] C.-Y. Lin, Y.-Y. Fang, C.-W. Lin, C.A. Jeffrey, J.J. Tunney, K.-C. Ho, Fabricationof NOx gas sensors using In2O3–ZnO composite thin films, Sens. Actuators B:Chem. 146 (2010) 28–34.
19] L. Sha, Y. Liu, Q. Zhang, M. Hu, Y. Jiang, Microwave-assisted co-precipitationsynthesis of high purity �-tricalcium phosphate crystalline powders, Mater.Chem. Phys. 129 (2011) 1138–1141.
20] R.Y. Hong, Y.J. Wu, B. Feng, G.Q. Di, H.Z. Li, B. Xu, Y. Zheng, D.G. Wei,Microwave-assisted synthesis and characterization of bi-substituted yttriumgarnet nanoparticles, J. Magn. Magn. Mater. 321 (2009) 1106–1110.
21] Z. Xie-bin, J. Tao, Q. Guan-zhou, H. Bai-yun, ITO nano-powders prepared bymicrowave-assisted co-precipitation in aqueous phase, Trans. Nonferrous Met.Soc. China 19 (2009) s752–s756.
22] S. Pati, S.B. Majumder, P. Banerji, Role of oxygen vacancy in optical andgas sensing characteristics of ZnO thin films, J. Alloys Compd. 541 (2012)376–379.
23] N. Han, X. Wu, L. Chai, H. Liu, Y. Chen, Counterintuitive sensing mechanismof ZnO nanoparticle based gas sensors, Sens. Actuators B: Chem. 150 (2010)230–238.
24] X-J Zhang, G-J Qiao, High performance ethanol sensing nanofibers with adouble-layer structure films fabricated from ZnO and In2O3, Applied SurfaceSci. 258 (2012) 6643-6647.
25] T.O. Mason, G.B. Gonzalez, D.R. Kammler, N. Mansourian-Hadavi, B.J. Ingram,Thin Solid Films 411 (2002) 106–114.
26] O. Warschkow, D.E. Ellis, G.B. Gonzaılez, T.O. Mason, Defect structures of tin-doped indium oxide, J. Am. Ceram. Soc. 86 (10) (2003) 1700–1706.
27] N. Faal Hamedani, A.R. Mahjoub, A.A. Khodadadi, Y. Mortazavi, Microwaveassisted fast synthesis of various ZnO morphologies for selective detection ofCO, CH4 and ethanol, Sens. Actuators B: Chem. 156 (2011) 737–742.
28] G. Neri, A. Bonavita, G. Micali, G. Rizzo, E. Callone, G. Carturan, Resistive COgas sensors based on In2O3 and InSnOx nanopowders synthesized via starch-aided sol–gel process for automotive applications, Sens. Actuators B: Chem.132 (2008) 224–233.
Biographies
Mahsa Gholami received her B.Sc. degree in Chemical Engineering from Universityof Tehran (UT). She has been a research assistant at the Catalyst and Reaction Engi-neering Laboratory, University of Tehran, since 2011. Her main research interest isin the preparation of metal oxide semiconductor thick films and their application ingas sensors.

d Actu
AsUrcic
ATe
M. Gholami et al. / Sensors an
bbas Ali Khodadadi received his M.Sc. in Chemical Engineering from Univer-ity of Tehranin 1986 and his Ph.D. in Catalysis and Reaction Engineering fromniversity of Waterloo, Canada, in 1994. His research interests include catalysis,
eaction engineering, and nano-structured materials as applied to nano-particles,arbon nanotubes, plasma-catalytic conversion of natural gas to liquids and chem-cals, metal oxide semiconductor gas-sensors, air pollution control using catalytic
onverters and oxygen sensors using solid electrolytes.zam Anaraki Firooz received M.Sc. and Ph.D. degrees in Inorganic Chemistry fromarbiat Modares University in 2005 and 2010, respectively. Her research inter-sts include the effect of morphology and additives on sensing and photocatalytic
ators B 212 (2015) 395–403 403
functions of oxide nanostructures. Now, she is a faculty member in Shahid RajaeeTeacher Training University in Tehran.
Yadollah Mortazavi received the B.Sc. degree in Chemical Engineering from Univer-sity of Shiraz, Shiraz, Iran, and the M.Sc. and Ph.D. degrees in Chemical Engineeringfrom University of Waterloo, Waterloo, Ont., Canada. He joined University of
Tehran, Tehran, Iran in 1995. His research interests include catalysis and reac-tion engineering especially in C1 chemistry, environmental catalysis, chemicalgas-sensors and nano-structured materials. Currently he is the chair of Nano-technology Department at College of Engineering, University of Tehran, Tehran,Iran.Copyright © 2022 FDOKUMEN


![[2014] Visible light photocatalysis of Methylene blue by graphene-based ZnO and Ag/AgCl nanocomposites](https://static.fdokumen.com/doc/165x107/631de24b4265d1c0f1072ee5/2014-visible-light-photocatalysis-of-methylene-blue-by-graphene-based-zno-and.jpg)