In vivo MRI of neural cell migration dynamics in the mouse brain
20
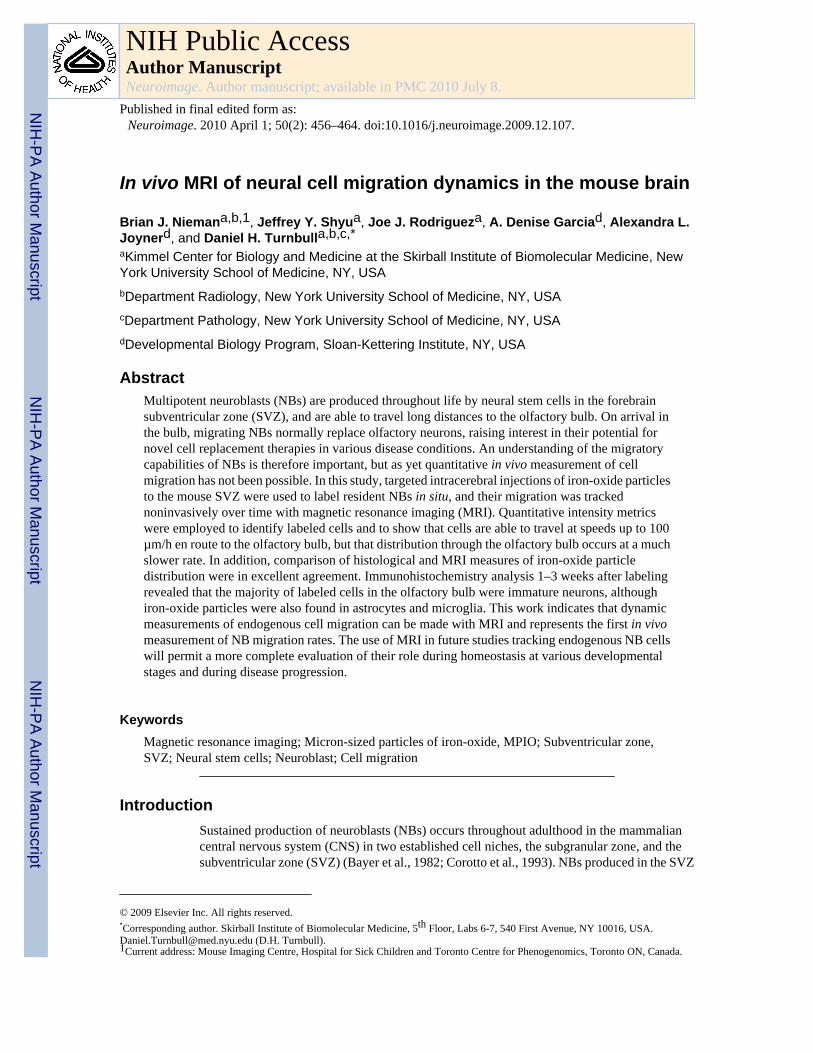
In vivo MRI of neural cell migration dynamics in the mouse brain Brian J. Nieman a,b,1 , Jeffrey Y. Shyu a , Joe J. Rodriguez a , A. Denise Garcia d , Alexandra L. Joyner d , and Daniel H. Turnbull a,b,c,* a Kimmel Center for Biology and Medicine at the Skirball Institute of Biomolecular Medicine, New York University School of Medicine, NY, USA b Department Radiology, New York University School of Medicine, NY, USA c Department Pathology, New York University School of Medicine, NY, USA d Developmental Biology Program, Sloan-Kettering Institute, NY, USA Abstract Multipotent neuroblasts (NBs) are produced throughout life by neural stem cells in the forebrain subventricular zone (SVZ), and are able to travel long distances to the olfactory bulb. On arrival in the bulb, migrating NBs normally replace olfactory neurons, raising interest in their potential for novel cell replacement therapies in various disease conditions. An understanding of the migratory capabilities of NBs is therefore important, but as yet quantitative in vivo measurement of cell migration has not been possible. In this study, targeted intracerebral injections of iron-oxide particles to the mouse SVZ were used to label resident NBs in situ, and their migration was tracked noninvasively over time with magnetic resonance imaging (MRI). Quantitative intensity metrics were employed to identify labeled cells and to show that cells are able to travel at speeds up to 100 μm/h en route to the olfactory bulb, but that distribution through the olfactory bulb occurs at a much slower rate. In addition, comparison of histological and MRI measures of iron-oxide particle distribution were in excellent agreement. Immunohistochemistry analysis 1–3 weeks after labeling revealed that the majority of labeled cells in the olfactory bulb were immature neurons, although iron-oxide particles were also found in astrocytes and microglia. This work indicates that dynamic measurements of endogenous cell migration can be made with MRI and represents the first in vivo measurement of NB migration rates. The use of MRI in future studies tracking endogenous NB cells will permit a more complete evaluation of their role during homeostasis at various developmental stages and during disease progression. Keywords Magnetic resonance imaging; Micron-sized particles of iron-oxide, MPIO; Subventricular zone, SVZ; Neural stem cells; Neuroblast; Cell migration Introduction Sustained production of neuroblasts (NBs) occurs throughout adulthood in the mammalian central nervous system (CNS) in two established cell niches, the subgranular zone, and the subventricular zone (SVZ) (Bayer et al., 1982; Corotto et al., 1993). NBs produced in the SVZ © 2009 Elsevier Inc. All rights reserved. * Corresponding author. Skirball Institute of Biomolecular Medicine, 5 th Floor, Labs 6-7, 540 First Avenue, NY 10016, USA. [email protected] (D.H. Turnbull). 1 Current address: Mouse Imaging Centre, Hospital for Sick Children and Toronto Centre for Phenogenomics, Toronto ON, Canada. NIH Public Access Author Manuscript Neuroimage. Author manuscript; available in PMC 2010 July 8. Published in final edited form as: Neuroimage. 2010 April 1; 50(2): 456–464. doi:10.1016/j.neuroimage.2009.12.107. NIH-PA Author Manuscript NIH-PA Author Manuscript NIH-PA Author Manuscript
-
Upload
hms-harvard -
Category
Documents
-
view
4 -
download
0
Transcript of In vivo MRI of neural cell migration dynamics in the mouse brain
In vivo MRI of neural cell migration dynamics in the mouse brain
Brian J. Niemana,b,1, Jeffrey Y. Shyua, Joe J. Rodrigueza, A. Denise Garciad, Alexandra L.Joynerd, and Daniel H. Turnbulla,b,c,*aKimmel Center for Biology and Medicine at the Skirball Institute of Biomolecular Medicine, NewYork University School of Medicine, NY, USAbDepartment Radiology, New York University School of Medicine, NY, USAcDepartment Pathology, New York University School of Medicine, NY, USAdDevelopmental Biology Program, Sloan-Kettering Institute, NY, USA
AbstractMultipotent neuroblasts (NBs) are produced throughout life by neural stem cells in the forebrainsubventricular zone (SVZ), and are able to travel long distances to the olfactory bulb. On arrival inthe bulb, migrating NBs normally replace olfactory neurons, raising interest in their potential fornovel cell replacement therapies in various disease conditions. An understanding of the migratorycapabilities of NBs is therefore important, but as yet quantitative in vivo measurement of cellmigration has not been possible. In this study, targeted intracerebral injections of iron-oxide particlesto the mouse SVZ were used to label resident NBs in situ, and their migration was trackednoninvasively over time with magnetic resonance imaging (MRI). Quantitative intensity metricswere employed to identify labeled cells and to show that cells are able to travel at speeds up to 100µm/h en route to the olfactory bulb, but that distribution through the olfactory bulb occurs at a muchslower rate. In addition, comparison of histological and MRI measures of iron-oxide particledistribution were in excellent agreement. Immunohistochemistry analysis 1–3 weeks after labelingrevealed that the majority of labeled cells in the olfactory bulb were immature neurons, althoughiron-oxide particles were also found in astrocytes and microglia. This work indicates that dynamicmeasurements of endogenous cell migration can be made with MRI and represents the first in vivomeasurement of NB migration rates. The use of MRI in future studies tracking endogenous NB cellswill permit a more complete evaluation of their role during homeostasis at various developmentalstages and during disease progression.
KeywordsMagnetic resonance imaging; Micron-sized particles of iron-oxide, MPIO; Subventricular zone,SVZ; Neural stem cells; Neuroblast; Cell migration
IntroductionSustained production of neuroblasts (NBs) occurs throughout adulthood in the mammaliancentral nervous system (CNS) in two established cell niches, the subgranular zone, and thesubventricular zone (SVZ) (Bayer et al., 1982; Corotto et al., 1993). NBs produced in the SVZ
© 2009 Elsevier Inc. All rights reserved.*Corresponding author. Skirball Institute of Biomolecular Medicine, 5th Floor, Labs 6-7, 540 First Avenue, NY 10016, [email protected] (D.H. Turnbull).1Current address: Mouse Imaging Centre, Hospital for Sick Children and Toronto Centre for Phenogenomics, Toronto ON, Canada.
NIH Public AccessAuthor ManuscriptNeuroimage. Author manuscript; available in PMC 2010 July 8.
Published in final edited form as:Neuroimage. 2010 April 1; 50(2): 456–464. doi:10.1016/j.neuroimage.2009.12.107.
NIH
-PA Author Manuscript
NIH
-PA Author Manuscript
NIH
-PA Author Manuscript
are particularly critical for neuronal homeostasis in the olfactory bulb (OB), where they arerequired to replenish various types of interneurons throughout adulthood (Lledo et al., 2008;Lois and Alvarez-Buylla, 1994). These cells migrate from their origin in the SVZ rostrally,and then along a sharply defined pathway known as the rostral migratory stream (RMS), whichbridges the large distance between the SVZ and the OB. Interestingly, damage to the brainthrough acute injury or chronic disease has been shown to alter NB activities. Increased ratesof proliferation have been detected following ischemia (Arvidsson et al., 2002; Thored et al.,2006), demyelination (Nait-Oumesmar et al., 1999), or excitotoxic injury (Tattersfield et al.,2004) and NBs have been shown to migrate from the SVZ to sites of brain damage where theycan promote some functional recovery, especially after treatment with defined growth factors(Cooper and Isacson, 2004; Fallon et al., 2000; Kolb et al., 2007). This introduces the possibilitythat NBs from the SVZ could participate in CNS repair in regions of the brain other than theOB. Enhancement of such an endogenous repair response, for example with administeredgrowth factors, would be an exciting therapeutic possibility for many disease conditions.
Clearly, the dynamics of endogenous NB migration—including the speed, spatial distributionand timing—relative to disease progression are of critical importance in assessing any suchtherapeutic potential. Various methods have been used to estimate the normal rate of NBmigration from or through the SVZ. In the rat neonate, retroviral labeling and counting of cellsin serial sections were used to estimate an average RMS speed of ∼23 µm/h (Luskin and Boone,1994). In vitro measurements in a cell culture system suggested much faster speeds of 120 µm/h (Wichterle et al., 1997). More recently, time-lapse analyses in mouse brain slice explantshave yielded estimated speeds of ∼50 µm/h in the adult SVZ (Bolteus and Bordey, 2004) and∼89 µm/h in the neonatal RMS (Hirota et al., 2007). The slice explants method is feasible onlybecause the RMS, although curved in profile, resides largely in a sagittal plane. More complexthree-dimensional patterns of migration or cellular distribution—which may result after diseaseor injury—cannot be assessed in the same fashion. Methods of noninvasively andlongitudinally detecting NB distribution would permit more detailed measurements of RMSmigration properties and importantly, permit characterization of the more complex movementpatterns associated with possible disease response.
In situ labeling of endogenous SVZ cells in the adult rat has been demonstrated by injectionsof micron-sized particles of iron-oxide (MPIOs) into the lateral ventricle with subsequentdetection by magnetic resonance imaging (MRI) (Shapiro et al., 2006). MRI provides thedistinct advantage of providing inherently three-dimensional data with the capability oflongitudinal temporal evaluation. However, the migration rate of MPIO-labeled cells has notbeen evaluated with longitudinal studies in individual animals, nor have strictly quantitativeimage intensity metrics been used to describe the MR-detected distributions of labeled cells.
In this study, the potential of mouse MRI was investigated for quantitative analysis of NBmigration in the RMS, characterization of NB distribution in the OB, and evaluation of labeledcell types at two time points. For this purpose, we introduced a modified MPIO-labelingprotocol in which MPIO injections are targeted directly to the anterior SVZ and then followedby serial MR imaging of individual mice. Importantly, these studies serve to: (1) verify thefeasibility of labeling mouse NBs in situ with small-volume, SVZ-targeted MPIO injections;(2) quantify normal NB migration rates in the RMS; (3) characterize NB distribution throughthe OB over time; and (4) evaluate migrating MPIO-labeled cell types.
Nieman et al. Page 2
Neuroimage. Author manuscript; available in PMC 2010 July 8.
NIH
-PA Author Manuscript
NIH
-PA Author Manuscript
NIH
-PA Author Manuscript

Materials and methodsAnimals
All animal studies described in this report were approved by the Institutional Animal Care andUse Committee at New York University School of Medicine. Studies were performed using6–10 week old, female ICR mice (Taconic Farms, Hudson, NY).
Surgical injectionsFor injection of MPIOs, mice were anesthetized using isoflurane and placed in a stereotaxicframe. The head was shaved and a ∼1 cm incision was made to expose the skull. Using amicrodrill, a 1–2 mm hole was produced to allow an injection into the anterior portion of theSVZ (stereotaxic coordinates 0.7–0.9 mm lateral to bregma, 1.1–1.3 mm rostral to bregma and2.4–2.6 mm deep from the pial surface). All injections were performed with glassmicrocapillary tubes (0.5 mm ID, 1.0 mm OD, 10 cm length, Sutter Instruments, Novato, CA),pulled and cut to produce a 100 µm diameter needle tip and mounted on a microinjector(Narishige International, East Meadow, NY). MPIO solution (50 nl, ∼1.5 × 10⁶ particles) wasinjected as provided by the manufacturer (encapsulated, fluorescent, magnetic beads, nominal1.63 µm diameter, 520/480 nm excitation/emission, Bangs Laboratories, Inc, Fishers, IN).Following surgery, the skin over the skull was sutured closed and animals were placed inseparate, heated cages and monitored until fully recovered.
Magnetic resonance imagingAll imaging experiments were performed on a 7T 200-mm bore Magnex magnet equipped witha Bruker Biospec Avance II console (Bruker Biospin MRI, Ettlingen, Germany) and activelyshielded gradients (BGA9S, Bruker Biospin MRI). Images were collected using a quadrature,transmit/receive Litzcage volume coil (25 mm inner diameter, Doty Scientific, Columbia, SC,USA). For visualization of MPIO distribution, a multiple gradient-echo image acquisitionsequence was employed (TR = 40 ms, TE = 4.0, 8.3 ms, 12° excitation angle and 8 repeats).Image dimensions included a field-of-view of 25.6 × 19.2 × 12.8 mm and matrix size 256 ×192 × 128 to yield 100 µm isotropic voxels in an imaging time of 2 h, 12 min. Imagereconstruction with retrospective self-gating was used to minimize artifact due to respirationand motion as described previously (Nieman et al., 2009). A magnitude image was generatedfor each echo and then the two images were averaged to yield a single image for subsequentanalysis. The averaged image provided ∼30% higher signal-to-noise and contrast-to-noise ratiothan either single image, while retaining a short echo-time image for clearer visualization ofthe injection site. Prior to imaging, animals were prepared in an induction chamber with 4–5%isoflurane in compressed air and then transferred to the imaging holder and coil assembly wherethey were maintained under anesthesia with 1.0–1.5% isoflurane.
Image analysesLabeled image voxels were isolated by statistically testing for hypointense voxels (Fig. 1).Images were first registered together into a common space to align ipsilateral voxels across allimages and subsequently to align the contralateral voxels as well. This process, including eachof the steps described below, was performed separately for analyses of RMS migration ratesand OB distribution. For the migration rate analyses, image time points included Days 0 (∼2h post-injection), 1 and 2. The OB distribution analyses included images from Days 0–1(comprised of images collected 3 to 24 h post-injection), 4, 7 and 21. In each case, the imageprocessing began by positional alignment and intensity normalization of all images. The latterincluded correction for nonuniformity (Sled et al., 1998) and histogram normalization. Allimages were then registered together to generate an unbiased space into which all images wereresampled. This process has been described in several previous publications (Kovacevic et al.,
Nieman et al. Page 3
Neuroimage. Author manuscript; available in PMC 2010 July 8.
NIH
-PA Author Manuscript
NIH
-PA Author Manuscript
NIH
-PA Author Manuscript
2005;Lerch et al., 2008;Nieman et al., 2006;Woods et al., 1998a,b). The unbiased space wasdefined through a process of pairwise linear registrations and then refined through an iterativenonlinear registration of the individual images. For these analyses, the region of the MPIOinjection was excluded from the registration process with a mask and the final nonlinearregistration step was limited to a coarse resolution (300 µm). This permitted alignment of theolfactory bulbs without fine adjustment of isolated hypointense voxels, which appearsomewhat stochastically through the OB at late stages. All registrations were performed usingsoftware tools from the Montreal Neurological Institute (Collins et al., 1994).
With images registered together, individual voxels were determined to be hypointense—andtherefore “labeled”—by comparison of the intensity value in the ipsilateral side to thecorresponding values in the equivalent contralateral voxel. This comparison was performedfor each voxel in the forebrain and OB. To isolate the relevant voxel on the contralateral sideof the brain, all images were mirrored left to right and then registered to the common space.Subsequently, the set of contralateral intensity values at the voxel of interest and from allacquired images was used as reference values to assign a p-value to each ipsilateral voxel usinga one-sided Student’s t-test. Statistical thresholds were then applied using a false discoveryrate (FDR, q = 0.05) to correct for multiple comparisons (Benjamini and Hochberg, 1995). Forvisualization of the distribution of particles, thresholded binary maps of hypointense voxelswere overlaid on the average images.
In order to facilitate visualization of the RMS in three dimensions, two image planes weregenerated for viewing. The first image plane was a conventional parasagittal plane runningthrough the center of the OB ipsilateral to the injection site. The second plane was a curvilinearplane perpendicular to the parasagittal plane and running along the curved path of the RMS,enabling clear visualization of the lateral distribution of MPIOs about the RMS and in the OB.This second plane was generated by manually identifying points on the RMS path in the averageimages and then using tricubic interpolation to generate signal intensities at equidistant siteson the curved path.
To estimate the speed of MPIO movement from MR images, the location of hypointense voxelswas compared on consecutive days in images from individual mice. The distance between thedetected voxels furthest along the RMS was computed along the curved path of the RMS. Anaverage was determined for the maximum speed between Days 0 and 1 and between Days 1and 2 by calculating the speeds in each mouse and then averaging the results. This methodtended to detect the fastest migrating cells and therefore produced an average of the maximumRMS migration rate.
Histological analysesOn Days 2, 7 or 21 after MPIO injection, selected mice were prepared for histological analysis.For this purpose, mice received an intraperitoneal injection of nembutal (400 mg/kg), and wereperfusion fixed through the left ventricle with 4 °C, 4% paraformaldehyde (PFA, Sigma-Aldrich, St. Louis, MO). After extraction from the skull and post-fixation (overnight in 4 °C,4% PFA), brains were cryoprotected in 30% sucrose in phosphate buffered saline, mounted inembedding compound (Tissue-Tek OCT, Sakura Finetek USA Inc., Torrance, CA) and frozeninto blocks. Sections were cut serially at 20 µm thickness on a cryostat (CM3050S, LeicaMicrosystems, Bannockburn, IL).
The Day 2 specimens were used to verify the MR detected particle distribution with histologicalcounts of the distribution. In cryostat sections, the rostral–caudal distribution of particles wascharacterized by counting particles prior to any staining. Particles were visualized using afluorescence dissection scope (Leica MZ16F, Leica Microsystems) and the total particle countin each section was recorded. Where sections were damaged or missing, a count was assigned
Nieman et al. Page 4
Neuroimage. Author manuscript; available in PMC 2010 July 8.
NIH
-PA Author Manuscript
NIH
-PA Author Manuscript
NIH
-PA Author Manuscript
based on the averages of the nearest 5 available sections. In this manner, a complete rostral–caudal particle count distribution was determined. In order to compare with MRI results (inwhich the voxel size was 100 µm), the counts from every five consecutive (20 µm) slices weresummed to estimate the expected total particle count in serial 100 µm thick sections. Acomparable metric was generated from the MRI images by counting the MRI hypointensevoxels from planes running in the same rostral–caudal dimension. The image voxel and particlecount distributions were then aligned by maximizing the correlation between the twodistributions. By virtue of the registration of separate MR images, separate histological particlecount distributions were also brought to a common space and, therefore, an average particlecount distribution based on the histological sections was calculated and compared to theaverage hypointense voxel counts by MRI. For visualization of the histology sections, thehistogram of the resultant images was manipulated to highlight the auto-fluorescent signal fromthe tissue, thus putting the much brighter MPIO fluorescence into an anatomical context.
ImmunohistochemistrySelected mice were injected with bromodeoxyuridine (BrdU, 100 mg/kg, Sigma) once per dayfor 3 days immediately following MPIO injection. BrdU is incorporated into cells during celldivision, and marks dividing cells in the SVZ. Sections from these mice were visualized afterstaining for BrdU and for Nissl. Evaluation of these sections permitted visualization of theparticle distribution in the SVZ at the ventricles and qualitative comparison of MPIO and BrdUdistribution.
Serial sections were stained at different time points to identify which cell types containedMPIOs. For Day 2 images, Glial fibrillary acidic protein (GFAP, an astrocyte marker) wasdetected using a mouse anti-GFAP primary antibody (Chemicon, Millipore Corp., Billerica,MA). Likewise, doublecortin (Dcx, marker of migrating neuroblasts) was detected with goatanti-Dcx (Santa Cruz Biotechnology, Santa Cruz, CA). At later time points, staining was alsoperformed with primary antibodies for Class III β-tubulin (Tuj1, immature neuronal marker)(Covance, Inc., Princeton, NJ) and Ionized calcium binding adaptor molecule 1 (Iba1,microglial marker) (Wako Chemicals, Inc., Richmond, VA). All immunostaining used IgGCy3 secondary antibodies (Jackson ImmunoResearch Laboratories Inc., West Grove, PA),following protocols provided by the manufacturers.
Following staining, three independent readers scored each section for labeled cells by countingthe total number of MPIOs per section and the subset localized within stained cells. Celllocalization was determined by inspection based upon the proximity of MPIOs to stained cells.An average reader count for each section was computed and then the total for all sections wastabulated. Cell types were assessed at both Day 2 and Day 21. All counts included at least 3different mice and a total of at least 500 and 85 MPIO particles per stain type for Day 2 andDay 21, respectively.
ResultsSVZ-targeted MPIO injections resulted in rapid MPIO migration in the RMS
Stereotaxic injection of MPIO particles in the anterior region of the SVZ resulted inhypointense artifacts at the site of injection on T2*-weighted images immediately after surgery.Injections frequently showed evidence of MPIOs in the lateral ventricle adjacent to the injectionsite, a result that could not be completely eliminated by adjustment of stereotaxic coordinatesdue to the small size of the SVZ and its close proximity to the ventricle. Follow-up images 24h postinjection showed significant hypointense regions extending along the putative path ofthe RMS and away from the injection site artifact, suggesting transport of the MPIOs. Afterinitial experimentation with the methodology, this labeling was successful in approximately
Nieman et al. Page 5
Neuroimage. Author manuscript; available in PMC 2010 July 8.
NIH
-PA Author Manuscript
NIH
-PA Author Manuscript
NIH
-PA Author Manuscript

70% of surgeries. For analyses, hypointense voxels were determined by statistical comparisonto intensity values in the contralateral voxel. The most distal MPIO-labeled voxels weredetected, and the distance traveled between Days 0 and 1 and between Days 1 and 2 wascomputed. From these data, an average maximum migration speed of 102 µm/h was estimatedin the RMS (Days 0–1), while the speed slowed significantly in the initial, caudal part of theolfactory bulb (49 µm/h) between Days 1 and 2 (Fig. 2).
MPIO-labeled cells distributed slowly through the OBMRI at later time points revealed a slow distribution of MPIOs through the olfactory bulb (Fig.3). By Day 4, the particles were found throughout much of the medial region of the olfactorybulb, while relatively smaller changes in distribution were observed through Days 7 and 21.Throughout the 3-week observation period, the distribution of the particles in the olfactorybulb was predominantly parasagittal in orientation, with more limited movement of particleslaterally (Fig. 3).
Hypointense image voxels accurately mapped the MPIO spatial distributionOn Day 2, detailed comparisons were made between the distribution of MPIOs as assessed byMRI, and the distribution determined by traditional histological methods (Fig. 4). Goodqualitative agreement was observed between MRI and matched histological sections (Fig. 4a).Plots of the average particle count and average voxel count as a function of position showedvery similar distribution profiles (Fig. 4b). Furthermore, a direct comparison of counts at eachposition showed that the average voxel count and average particle count were highly correlated(Fig. 4c).
SVZ-targeted MPIO injections labeled astrocytes and migrating neuroblastsThe site of injection in the anterior SVZ was verified on MR images and was also analyzedusing histological sections. Histological examination 7 days after injection showed very limitedMPIO presence in the more posterior regions of the SVZ (Fig. 5a), even though MPIO particlesfrequently leaked into the ventricle. Accumulation of MPIOs was most evident in the targetedanterior region of the SVZ (Figs. 5b, c). A majority of the MPIOs remained at or near theinjection site, with isolated particles distributed throughout the regions of the RMS and OB(Figs. 5d, e). When BrdU was administered following MPIO injection, the distribution patternof the MPIOs qualitatively matched that of BrdU positive cells, with small clusters of MPIOand BrdU distributed throughout the RMS and more widely dispersed through the medialregion of the OB. Precise colocalization was infrequent and the number of MPIOs wasapproximately 15% of the number of BrdU-labeled cells, suggesting that these experimentsdid not label precisely the same cells or cell populations.
We evaluated labeled cells on Day 2 and Day 21 by immunohistochemistry in sections fromthe RMS and OB in the aim of detecting labeled cell type (Fig. 6, Fig. 7). On Day 2, MPIO-labeled cells were distributed largely in astrocytes and migrating NBs, which accounted for90% of labeled cells (62% and 28% for Dcx and GFAP, respectively). Scoring the sectionsseparately in the RMS and OB did not reveal any significant differences in the relativeproportion of labeled cells in these regions.
We further evaluated MPIO-labeled cell types on Day 21 (Fig. 7). Migrating NB, marked byDcx, and astrocytes, marked by GFAP, continued to represent a large fraction of labeled cells,although the number of labeled Dcx+ cells decreased marginally (to 50%). Immunostainingwith Tuj1, a marker expected to show significant overlap with Dcx, verified the large fractionof immature neuronal cells. Notably at Day 21, a large percentage of cells (35%) was alsofound in Iba1+ cells, perhaps indicating cell death followed by phagocytosis of MPIO particlesin microglia.
Nieman et al. Page 6
Neuroimage. Author manuscript; available in PMC 2010 July 8.
NIH
-PA Author Manuscript
NIH
-PA Author Manuscript
NIH
-PA Author Manuscript
DiscussionIn this paper, we presented the first detailed longitudinal measurements of the migrationcharacteristics of NB progenitor cells originating in the SVZ of the mouse brain. These resultsdemonstrate that at least some NBs are capable of migrating in vivo at 100 µm/h or more. Thisis consistent with some other reported estimates (Hirota et al., 2007), and represents the firstlongitudinal measurement of such cellular migration speeds in vivo. The potential speed of thismigration is important because it represents a limiting factor for novel therapies based onmobilization of endogenous stem cells to peripheral sites. We also observed much slowermigration rates as MPIO-cells distributed through the OB. While most MPIO-labeled cellsdifferentiated into a neuronal phenotype, an increasing number of these particles were alsolocated in phagocytic cell types, suggesting death of some of the originally labeled NB cellsin the OB, which occurs under normal physiological conditions.
The rapid migration observed in the RMS likely represents an upper limit of the achievablemigration rates in brain tissue. The RMS has a unique composition, defined by glial-sheathedchains of migrating NBs in close proximity to one another (Lois et al., 1996). The SVZ containslarge networks of similar chains that permit the migration of cells along the ventricle walls andinto the RMS (Doetsch and Alvarez-Buylla, 1996). Thus, throughout the SVZ and RMS andinto the OB, there is an established cellular structure that facilitates NB migration. As cellsbegin exiting the RMS and dispersing through the OB, the speed of movement rapidly becomesslower. It is possible that migration through brain parenchyma, as a response to peripheraldisease or injury for instance, would likewise be slower than rates observed in the RMS. Inthese cases, NBs must be coerced away from the normal route of established chain migrationand move through alternative and less-traveled routes. In the future, a finer temporal samplingduring RMS migration and OB distribution (Days 0 through 4) could provide more detailedmeasures of the migration rate extremes. These could then be compared with underlyingcellular features (observed histologically) or with the distribution of chemoattractants orrepellents to investigate their influence on the NB migration rate.
Recent results characterized the cell types of MPIO-labeled cells in the rat RMS and OB bymagnetically and fluorescently activated cell sorting of large numbers of cells (Sumner et al.,2009). In comparison to those results, our immunohistological results show a larger numberof migrating or immature neurons and fewer astrocytes (50% and 29% at Day 21 as comparedto 10% and 40% in their OB data at Day 14). Although substantial differences in the countingmethodologies cannot be ruled out as a source of discrepancy, it is also likely that mouse–ratspecies differences result in different cell type requirements. In addition, the anterior SVZ-targeted injections we describe here label only a subset of SVZ cells, in comparison to thelarger ventricular injections used in their report which may result in labeling of a different sub-population of SVZ cells. On a similar note, in our own data, the BrdU labeling, which alsolabels cells throughout the SVZ, resulted in higher numbers of labeled cells than the MPIOsthat were concentrated in only the anterior portion of the SVZ.
The surgical labeling of smaller portions of the SVZ as proposed here with MPIOs hasdifferences, and some potential advantages over alternative methods. Recently, it has beenshown that the NB population is organized spatially, such that various types of periglomerularand granule progenitor cells originate in segregated SVZ regions (Lledo et al., 2008; Merkleet al., 2007). As the separate subpopulations are not yet separable by immunohistochemical orgenetic means, surgically targeted labeling may permit comparison of the relative migratorycapacity of these different cell populations under normal and disease conditions. Furthermore,direct targeting of the SVZ permits use of relatively small volume MPIO-injections, resultingin a smaller artifact than comparable ventricular injections and thereby improving visualizationnear the injection site. In this study, this permitted quantification of migration over a large
Nieman et al. Page 7
Neuroimage. Author manuscript; available in PMC 2010 July 8.
NIH
-PA Author Manuscript
NIH
-PA Author Manuscript
NIH
-PA Author Manuscript
region of the mouse RMS, an area apt to be obscured by large ventricular injections. It shouldalso permit visualization of cells moving into the striatum or cortex, sites frequently obscuredor distorted by large volume iron-oxide injections in the ventricle (Shapiro et al., 2006).Improvements in the efficiency of MPIO uptake by modification of the particles and a mappingof stereotaxic coordinates along the ventricle for improved targeting will further increase thepotential applications of this labeling method.
Alternative methods of labeling and noninvasively imaging cells are an important topic ofongoing research. The use of genetic reporters is, of course, a very attractive possibility formouse research that may ultimately provide a more powerful approach for long-term in vivomonitoring of specific cell populations. For studies in the mouse, where sub-millimeteraccuracy is essential, image resolution must be kept very high. Optical methods, which haveproven more easily adapted to genetic reporters, are limited in penetration and resolution andtherefore difficult to apply in studies where spatially resolved dynamics are required deepwithin the brain. As a result, the development of an MR reporter gene continues to be an areaof interest, despite the more limited sensitivity of MRI. Several potential candidates have beendescribed, but the sensitivity of detecting relatively small numbers of labeled migrating cellshas not been demonstrated (Cohen et al., 2005; Cohen et al., 2007; Deans et al., 2006; Genoveet al., 2005; Gilad et al., 2007; Moore et al., 1998; Weissleder et al., 2000; Zurkiya et al.,2008). The imaging methods described here provide sufficient sensitivity, flexibility and spatialresolution to study SVZ-derived NB dynamics in normal and disease conditions, particularlywhere the migration or distribution of cellular populations needs to be monitoredlongitudinally.
This study has demonstrated quantitative measurement of rates and patterns of migration ofneuronal precursors in the RMS and OB. The use of magnetically labeled cells and longitudinalMRI has enabled the first in vivo measurements of migration rates in the RMS, and suggeststhat precursor cells can travel very quickly under appropriate conditions. Similar measurementsusing MRI in conditions of disease or injury may reveal important factors affecting the abilityof precursor cells to participate in tissue repair at novel sites throughout the brain or elsewherein the CNS.
AcknowledgmentsWe thank Mark Henkelman, John Sled and Jason Lerch (Mouse Imaging Centre, Hospital for Sick Children, Toronto,Canada) for providing the software used for image registration. Funding for this work was provided by the New YorkState Department of Health, Spinal Cord Injury Research Board (contracts #C020926, C022053).
ReferencesArvidsson A, Collin T, Kirik D, Kokaia Z, Lindvall O. Neuronal replacement from endogenous precursors
in the adult brain after stroke. Nat. Med 2002;8:963–970. [PubMed: 12161747]Bayer SA, Yackel JW, Puri PS. Neurons in the rat dentate gyrus granular layer substantially increase
during juvenile and adult life. Science 1982;216:890–892. [PubMed: 7079742]Benjamini Y, Hochberg Y. Controlling the false discovery rate—a practical and powerful approach to
multiple testing. J. R. Stat. Soc., Ser. B Methodol 1995;57:289–300.Bolteus AJ, Bordey A. GABA release and uptake regulate neuronal precursor migration in the postnatal
subventricular zone. J. Neurosci 2004;24:7623–7631. [PubMed: 15342728]Cohen B, Dafni H, Meir G, Harmelin A, Neeman M. Ferritin as an endogenous MRI reporter for
noninvasive imaging of gene expression in C6 glioma tumors. Neoplasia 2005;7:109–117. [PubMed:15802016]
Cohen B, Ziv K, Plaks V, Israely T, Kalchenko V, Harmelin A, Benjamin LE, Neeman M. MRI detectionof transcriptional regulation of gene expression in transgenic mice. Nat. Med 2007;13:498–503.[PubMed: 17351627]
Nieman et al. Page 8
Neuroimage. Author manuscript; available in PMC 2010 July 8.
NIH
-PA Author Manuscript
NIH
-PA Author Manuscript
NIH
-PA Author Manuscript

Collins DL, Neelin P, Peters TM, Evans AC. Automatic 3D intersubject registration of MR volumetricdata in standardized Talairach space. J. Comput. Assist. Tomogr 1994;18:192–205. [PubMed:8126267]
Cooper O, Isacson O. Intrastriatal transforming growth factor alpha delivery to a model of Parkinson'sdisease induces proliferation and migration of endogenous adult neural progenitor cells withoutdifferentiation into dopaminergic neurons. J. Neurosci 2004;24:8924–8931. [PubMed: 15483111]
Corotto FS, Henegar JA, Maruniak JA. Neurogenesis persists in the subependymal layer of the adultmouse brain. Neurosci. Lett 1993;149:111–114. [PubMed: 8474679]
Deans AE, Wadghiri YZ, Bernas LM, Yu X, Rutt BK, Turnbull DH. Cellular MRI contrast viacoexpression of transferrin receptor and ferritin. Magn. Reson. Med 2006;56:51–59. [PubMed:16724301]
Doetsch F, Alvarez-Buylla A. Network of tangential pathways for neuronal migration in adult mammalianbrain. Proc. Natl. Acad. Sci. U. S. A 1996;93:14895–14900. [PubMed: 8962152]
Fallon J, Reid S, Kinyamu R, Opole I, Opole R, Baratta J, Korc M, Endo TL, Duong A, Nguyen G,Karkehabadhi M, Twardzik D, Patel S, Loughlin S. In vivo induction of massive proliferation,directed migration, and differentiation of neural cells in the adult mammalian brain. Proc. Natl. Acad.Sci. U. S. A 2000;97:14686–14691. [PubMed: 11121069]
Genove G, DeMarco U, Xu H, Goins WF, Ahrens ET. A new transgene reporter for in vivo magneticresonance imaging. Nat. Med 2005;11:450–454. [PubMed: 15778721]
Gilad AA, McMahon MT, Walczak P, Winnard PT Jr, Raman V, van Laarhoven HW, Skoglund CM,Bulte JW, van Zijl PC. Artificial reporter gene providing MRI contrast based on proton exchange.Nat. Biotechnol 2007;25:217–219. [PubMed: 17259977]
Hirota Y, Ohshima T, Kaneko N, Ikeda M, Iwasato T, Kulkarni AB, Mikoshiba K, Okano H, SawamotoK. Cyclin-dependent kinase 5 is required for control of neuroblast migration in the postnatalsubventricular zone. J. Neurosci 2007;27:12829–12838. [PubMed: 18032654]
Kolb B, Morshead C, Gonzalez C, Kim M, Gregg C, Shingo T, Weiss S. Growth factor-stimulatedgeneration of new cortical tissue and functional recovery after stroke damage to the motor cortex ofrats. J. Cereb. Blood Flow Metab 2007;27:983–997. [PubMed: 16985505]
Kovacevic N, Henderson JT, Chan E, Lifshitz N, Bishop J, Evans AC, Henkelman RM, Chen XJ. Athree-dimensional MRI atlas of the mouse brain with estimates of the average and variability. Cereb.Cortex 2005;15:639–645. [PubMed: 15342433]
Lerch JP, Carroll JB, Spring S, Bertram LN, Schwab C, Hayden MR, Henkelman RM. Automateddeformation analysis in the YAC128 Huntington disease mouse model. Neuroimage 2008;39:32–39.[PubMed: 17942324]
Lledo PM, Merkle FT, Alvarez-Buylla A. Origin and function of olfactory bulb interneuron diversity.Trends Neurosci 2008;31:392–400. [PubMed: 18603310]
Lois C, Alvarez-Buylla A. Long-distance neuronal migration in the adult mammalian brain. Science1994;264:1145–1148. [PubMed: 8178174]
Lois C, Garcia-Verdugo JM, Alvarez-Buylla A. Chain migration of neuronal precursors. Science1996;271:978–981. [PubMed: 8584933]
Luskin MB, Boone MS. Rate and pattern of migration of lineally-related olfactory bulb interneuronsgenerated postnatally in the subventricular zone of the rat. Chem. Senses 1994;19:695–714.[PubMed: 7735848]
Merkle FT, Mirzadeh Z, Alvarez-Buylla A. Mosaic organization of neural stem cells in the adult brain.Science 2007;317:381–384. [PubMed: 17615304]
Moore A, Basilion JP, Chiocca EA, Weissleder R. Measuring transferrin receptor gene expression byNMR imaging. Biochim. Biophys. Acta 1998;1402:239–249. [PubMed: 9606982]
Nait-Oumesmar B, Decker L, Lachapelle F, Avellana-Adalid V, Bachelin C, Van Evercooren AB.Progenitor cells of the adult mouse subventricular zone proliferate, migrate and differentiate intooligodendrocytes after demyelination. Eur. J. Neurosci 1999;11:4357–4366. [PubMed: 10594662]
Nieman BJ, Flenniken AM, Adamson SL, Henkelman RM, Sled JG. Anatomical phenotyping in the brainand skull of a mutant mouse by magnetic resonance imaging and computed tomography. Physiol.Genomics 2006;24:154–162. [PubMed: 16410543]
Nieman et al. Page 9
Neuroimage. Author manuscript; available in PMC 2010 July 8.
NIH
-PA Author Manuscript
NIH
-PA Author Manuscript
NIH
-PA Author Manuscript
Nieman BJ, Szulc KU, Turnbull DH. Three-dimensional, in vivo MRI with selfgating and imagecoregistration in the mouse. Magn. Reson. Med 2009;61:1148–1157. [PubMed: 19253389]
Shapiro EM, Gonzalez-Perez O, Manuel Garcia-Verdugo J, Alvarez-Buylla A, Koretsky AP. Magneticresonance imaging of the migration of neuronal precursors generated in the adult rodent brain.Neuroimage 2006;32:1150–1157. [PubMed: 16814567]
Sled JG, Zijdenbos AP, Evans AC. A nonparametric method for automatic correction of intensitynonuniformity in MRI data. IEEE Trans. Med. Imaging 1998;17:87–97. [PubMed: 9617910]
Sumner JP, Shapiro EM, Maric D, Conroy R, Koretsky AP. In vivo labeling of adult neural progenitorsfor MRI with micron sized particles of iron oxide: quantification of labeled cell phenotype.Neuroimage 2009;44:671–678. [PubMed: 18722534]
Tattersfield AS, Croon RJ, Liu YW, Kells AP, Faull RL, Connor B. Neurogenesis in the striatum of thequinolinic acid lesion model of Huntington's disease. Neuroscience 2004;127:319–332. [PubMed:15262322]
Thored P, Arvidsson A, Cacci E, Ahlenius H, Kallur T, Darsalia V, Ekdahl CT, Kokaia Z, Lindvall O.Persistent production of neurons from adult brain stem cells during recovery after stroke. Stem Cells2006;24:739–747. [PubMed: 16210404]
Weissleder R, Moore A, Mahmood U, Bhorade R, Benveniste H, Chiocca EA, Basilion JP. In vivomagnetic resonance imaging of transgene expression. Nat. Med 2000;6:351–355. [PubMed:10700241]
Wichterle H, Garcia-Verdugo JM, Alvarez-Buylla A. Direct evidence for homotypic, glia-independentneuronal migration. Neuron 1997;18:779–791. [PubMed: 9182802]
Woods RP, Grafton ST, Holmes CJ, Cherry SR, Mazziotta JC. Automated image registration: I. Generalmethods and intrasubject, intramodality validation. J. Comput. Assist. Tomogr 1998a;22:139–152.[PubMed: 9448779]
Woods RP, Grafton ST, Watson JD, Sicotte NL, Mazziotta JC. Automated image registration: II.Intersubject validation of linear and nonlinear models. J. Comput. Assist. Tomogr 1998b;22:153–165. [PubMed: 9448780]
Zurkiya O, Chan AW, Hu X. MagA is sufficient for producing magnetic nanoparticles in mammaliancells, making it an MRI reporter. Magn. Reson. Med 2008;59:1225–1231. [PubMed: 18506784]
Nieman et al. Page 10
Neuroimage. Author manuscript; available in PMC 2010 July 8.
NIH
-PA Author Manuscript
NIH
-PA Author Manuscript
NIH
-PA Author Manuscript

Fig. 1.Intensity-based analyses of labeled MR images. To isolate hypointense, labeled voxels in MRimages, images were first aligned to a reference (removing translation and rotation differences)and intensity-normalized (a). The set of all images–only two are shown for simplicity–wasused to define a consensus space (b), unbiased toward any individual image. An average in theconsensus space was mirrored left-to-right and registered upon itself (c) to define a mirroredspace. Images were resampled into each of these spaces (d and e) so that all image voxels werealigned. Intensity values of individual voxel in each image were then tested against thecorresponding values in the contralateral voxel, using a color overlay to indicate voxels with
Nieman et al. Page 11
Neuroimage. Author manuscript; available in PMC 2010 July 8.
NIH
-PA Author Manuscript
NIH
-PA Author Manuscript
NIH
-PA Author Manuscript

significant differences in intensity (f; red in left panel, blue in right panel). The entire set ofimages was used to characterize the expected unlabeled signal-intensity distribution.
Nieman et al. Page 12
Neuroimage. Author manuscript; available in PMC 2010 July 8.
NIH
-PA Author Manuscript
NIH
-PA Author Manuscript
NIH
-PA Author Manuscript
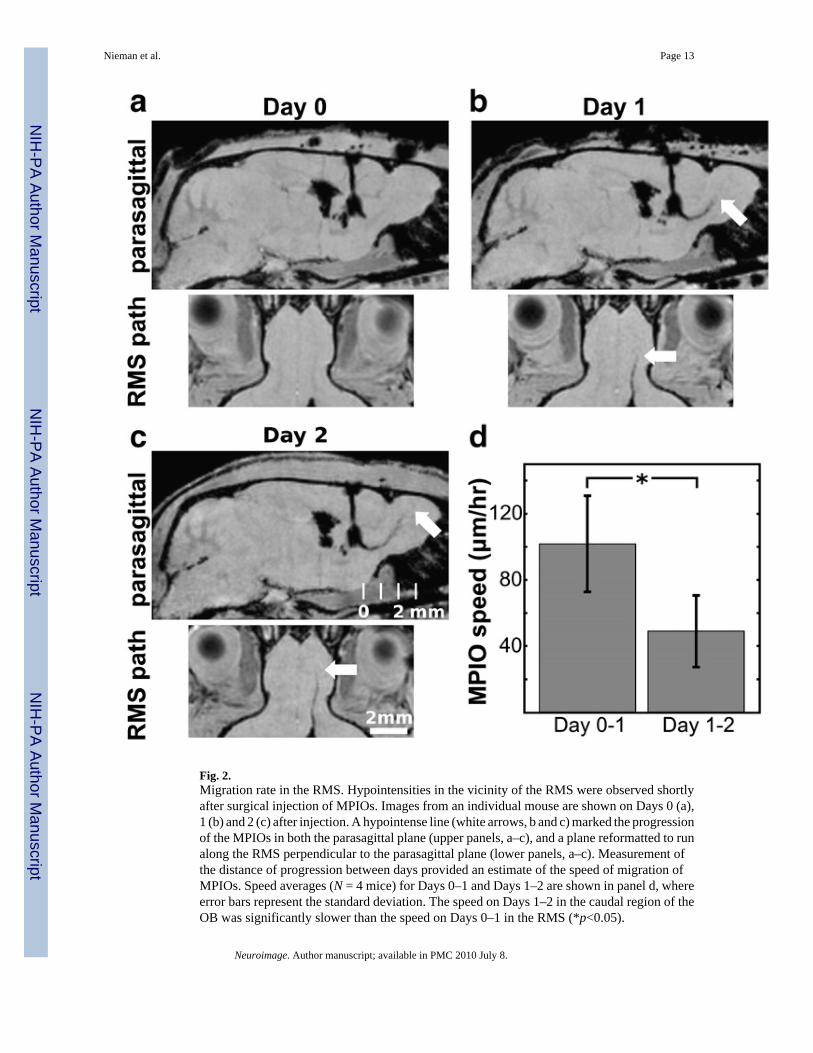
Fig. 2.Migration rate in the RMS. Hypointensities in the vicinity of the RMS were observed shortlyafter surgical injection of MPIOs. Images from an individual mouse are shown on Days 0 (a),1 (b) and 2 (c) after injection. A hypointense line (white arrows, b and c) marked the progressionof the MPIOs in both the parasagittal plane (upper panels, a–c), and a plane reformatted to runalong the RMS perpendicular to the parasagittal plane (lower panels, a–c). Measurement ofthe distance of progression between days provided an estimate of the speed of migration ofMPIOs. Speed averages (N = 4 mice) for Days 0–1 and Days 1–2 are shown in panel d, whereerror bars represent the standard deviation. The speed on Days 1–2 in the caudal region of theOB was significantly slower than the speed on Days 0–1 in the RMS (*p<0.05).
Nieman et al. Page 13
Neuroimage. Author manuscript; available in PMC 2010 July 8.
NIH
-PA Author Manuscript
NIH
-PA Author Manuscript
NIH
-PA Author Manuscript

Fig. 3.Distribution of MPIO in the olfactory bulb. Parasagittal and RMS reformatted images areshown at Days 0–1 (combining images from 3 to 24 h post-injection), Day 4, Day 7 and Day21. Each image is representative of a composite of three or more individual animals.Distribution through the bulb occurs primarily in the parasagital plane (left column) withrelatively little motion laterally (as seen in the right column). In the lowest row of images, acolor overlay indicates voxels determined to be significantly hypointense (FDR<0.05) for eachday. Earlier days are shown superimposed on later ones. Slow migration into the OB wasevident by the limited green and red rim (Days 7 and 21, respectively) extending beyond the
Nieman et al. Page 14
Neuroimage. Author manuscript; available in PMC 2010 July 8.
NIH
-PA Author Manuscript
NIH
-PA Author Manuscript
NIH
-PA Author Manuscript

blue Day 4 region. In contrast, significant changes were evident between Days 0–1 and 4 (whiteand blue, respectively).
Nieman et al. Page 15
Neuroimage. Author manuscript; available in PMC 2010 July 8.
NIH
-PA Author Manuscript
NIH
-PA Author Manuscript
NIH
-PA Author Manuscript
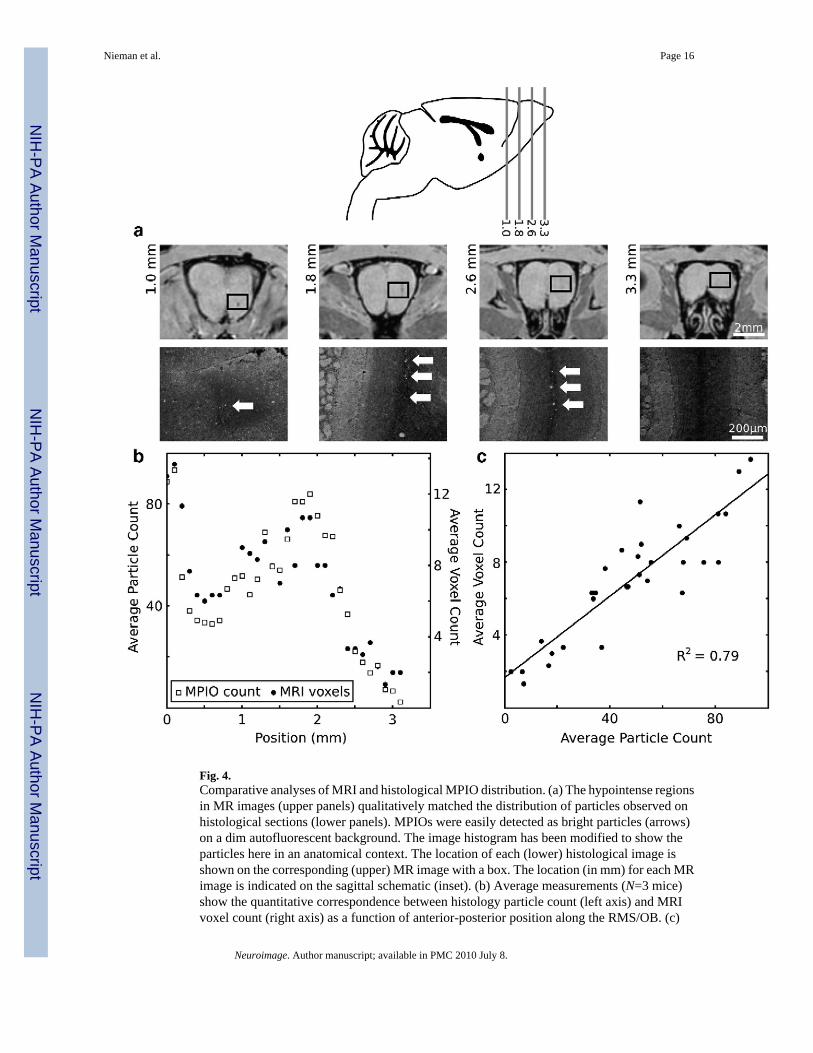
Fig. 4.Comparative analyses of MRI and histological MPIO distribution. (a) The hypointense regionsin MR images (upper panels) qualitatively matched the distribution of particles observed onhistological sections (lower panels). MPIOs were easily detected as bright particles (arrows)on a dim autofluorescent background. The image histogram has been modified to show theparticles here in an anatomical context. The location of each (lower) histological image isshown on the corresponding (upper) MR image with a box. The location (in mm) for each MRimage is indicated on the sagittal schematic (inset). (b) Average measurements (N=3 mice)show the quantitative correspondence between histology particle count (left axis) and MRIvoxel count (right axis) as a function of anterior-posterior position along the RMS/OB. (c)
Nieman et al. Page 16
Neuroimage. Author manuscript; available in PMC 2010 July 8.
NIH
-PA Author Manuscript
NIH
-PA Author Manuscript
NIH
-PA Author Manuscript

Plotting the voxel count as a function of the particle count for each position showed a highlycorrelated, linear relationship between the two (R2 = 0.79).
Nieman et al. Page 17
Neuroimage. Author manuscript; available in PMC 2010 July 8.
NIH
-PA Author Manuscript
NIH
-PA Author Manuscript
NIH
-PA Author Manuscript

Fig. 5.Histological visualization of post-injection particles. The MPIO injection resulted in significantaccumulation of particles in the anterior region of the SVZ. Panels here show results at Day 7post-injection. Green shows the Dragon Green fluorescence of the encapsulated MPIOs, redshows BrdU and blue shows a Nissl stain. More caudal portions of the SVZ (a) did not showsignificant accumulation of particles even when isolated particles were evident in theventricles. Advancing to the rostral portion of the SVZ (b, c) showed more notableaccumulation of MPIOs in the SVZ. In the RMS (d) and OB (e), MPIOs were observed in aspatial distribution similar to BrdU positive cells, but colocalization of the MPIO and BrdUwas not generally observed. A sagittal schematic (top left) shows the approximate locations ofeach section from left to right (a to e, respectively). Scale bars in panels d (for a–d) and erepresent 100 µm.
Nieman et al. Page 18
Neuroimage. Author manuscript; available in PMC 2010 July 8.
NIH
-PA Author Manuscript
NIH
-PA Author Manuscript
NIH
-PA Author Manuscript
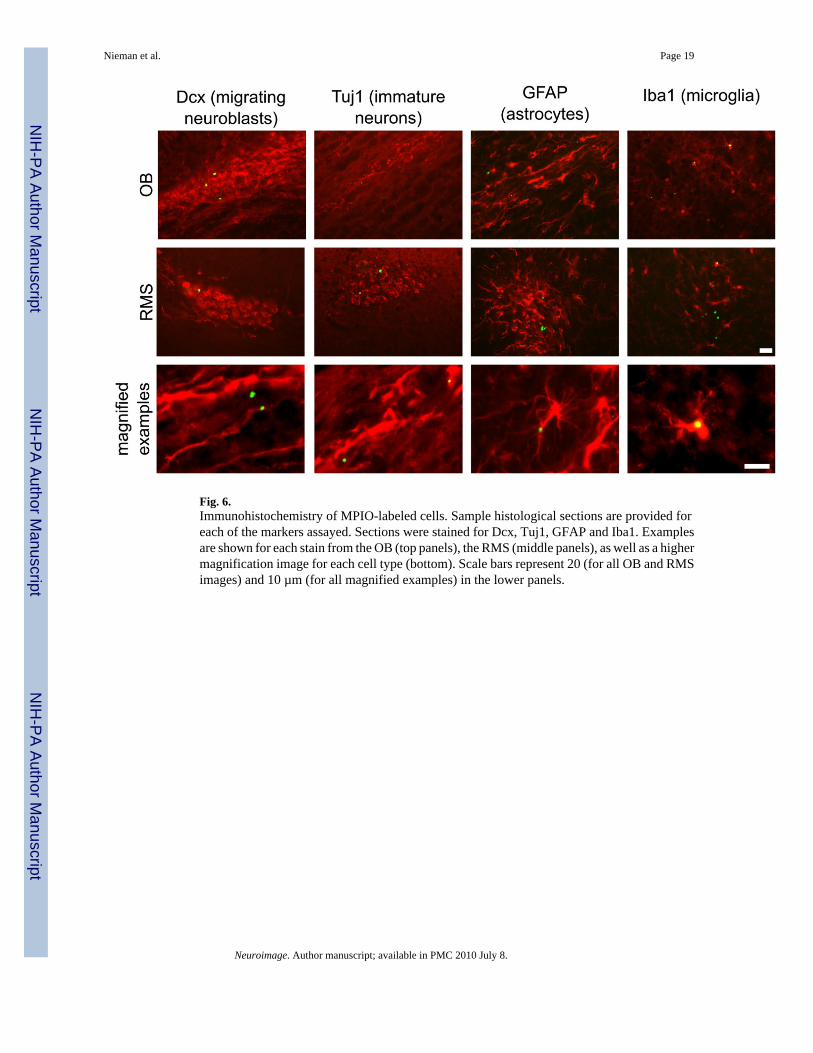
Fig. 6.Immunohistochemistry of MPIO-labeled cells. Sample histological sections are provided foreach of the markers assayed. Sections were stained for Dcx, Tuj1, GFAP and Iba1. Examplesare shown for each stain from the OB (top panels), the RMS (middle panels), as well as a highermagnification image for each cell type (bottom). Scale bars represent 20 (for all OB and RMSimages) and 10 µm (for all magnified examples) in the lower panels.
Nieman et al. Page 19
Neuroimage. Author manuscript; available in PMC 2010 July 8.
NIH
-PA Author Manuscript
NIH
-PA Author Manuscript
NIH
-PA Author Manuscript
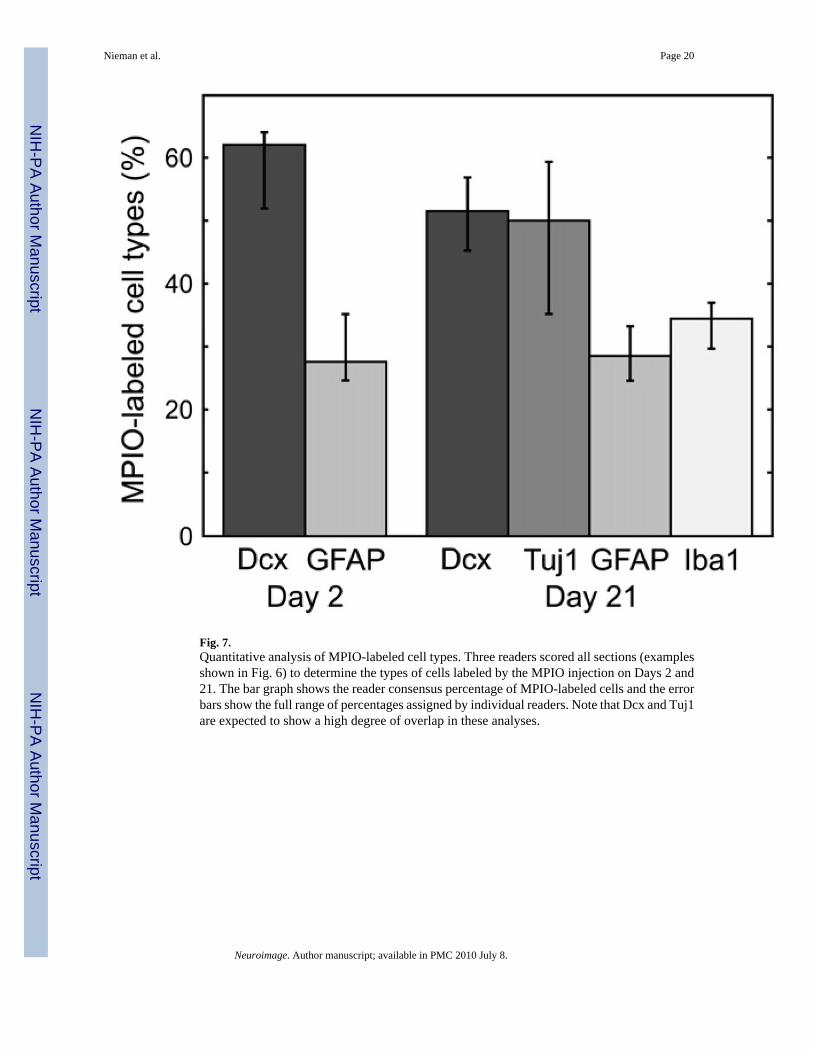
Fig. 7.Quantitative analysis of MPIO-labeled cell types. Three readers scored all sections (examplesshown in Fig. 6) to determine the types of cells labeled by the MPIO injection on Days 2 and21. The bar graph shows the reader consensus percentage of MPIO-labeled cells and the errorbars show the full range of percentages assigned by individual readers. Note that Dcx and Tuj1are expected to show a high degree of overlap in these analyses.
Nieman et al. Page 20
Neuroimage. Author manuscript; available in PMC 2010 July 8.
NIH
-PA Author Manuscript
NIH
-PA Author Manuscript
NIH
-PA Author Manuscript