Dynamics of neural crest-derived cell migration in the embryonic mouse gut
19
Dynamics of neural crest-derived cell migration in the embryonic mouse gut $ H.M. Young, a, * A.J. Bergner, a R.B. Anderson, a H. Enomoto, b J. Milbrandt, c D.F. Newgreen, d and P.M. Whitington a a Department of Anatomy and Cell Biology, University of Melbourne, 3010 Parkville, Victoria, Australia b Laboratory for Neuronal Differentiation and Regeneration, RIKEN Center for Developmental Biology, Chuo, Kobe, Hyogo 650-0047 Japan c Departments of Pathology and Internal Medicine, Washington University School of Medicine, St. Louis, MO 63110, USA d Murdoch Childrens Research Institute, Royal Children’s Hospital, 3052 Parkville, Victoria, Australia Received for publication 13 January 2004, revised 3 March 2004, accepted 5 March 2004 Available online 15 April 2004 Abstract Neural crest-derived cells that form the enteric nervous system undergo an extensive migration from the caudal hindbrain to colonize the entire gastrointestinal tract. Mice in which the expression of GFP is under the control of the Ret promoter were used to visualize neural crest- derived cell migration in the embryonic mouse gut in organ culture. Time-lapse imaging revealed that GFP + crest-derived cells formed chains that displayed complicated patterns of migration, with sudden and frequent changes in migratory speed and trajectories. Some of the leading cells and their processes formed a scaffold along which later cells migrated. To examine the effect of population size on migratory behavior, a small number of the most caudal GFP + cells were isolated from the remainder of the population. The isolated cells migrated slower than cells in large control populations, suggesting that migratory behavior is influenced by cell number and cell – cell contact. Previous studies have shown that neurons differentiate among the migrating cell population, but it is unclear whether they migrate. The phenotype of migrating cells was examined. Migrating cells expressed the neural crest cell marker, Sox10, but not neuronal markers, indicating that the majority of migratory cells observed did not have a neuronal phenotype. D 2004 Elsevier Inc. All rights reserved. Keywords: Migration; Enteric; Neural crest; Chain migration Introduction Neural crest cell migration into and along the gastroin- testinal tract is crucial for the establishment of the enteric nervous system. Most enteric neurons and glial cells arise from vagal level crest cells (Le Douarin and Teillet, 1973). Sacral crest cells also contribute some enteric neurons and glial cells (Burns and Le Douarin, 1998). In mice, vagal crest-derived cells enter the foregut around E9.5 and then migrate caudally (Kapur et al., 1992). Although many molecules required for the colonization of the gut by crest-derived cells have been identified (Gershon, 1999; Newgreen and Young, 2002a,b; Parisi and Kapur, 2000; Taraviras and Pachnis, 1999), little is known about the behavior of enteric crest-derived cells at the cellular level. The behavior of enteric crest-derived cells is likely to be influenced by intrinsic factors (the motile nature of crest cells) and molecules expressed by the gut mesenchyme including GDNF and endothelin-3 (Barlow et al., 2003; Iwashita et al., 2003; Jiang et al., 2003; Kruger et al., 2003; Natarajan et al., 2002; Young et al., 2001). Further- more, when the number of vagal crest cells is surgically reduced, they do not migrate as far caudally (Burns, 2000; Peters-van der Sanden et al., 1993; Yntema and Ham- mond, 1954), suggesting that interactions between cells affect migratory behavior. To date, the only information about the behavior of enteric crest cells has been obtained from fixed samples of gut. Some of these studies have provided a timetable by which crest-derived cells colonize 0012-1606/$ - see front matter D 2004 Elsevier Inc. All rights reserved. doi:10.1016/j.ydbio.2004.03.015 $ Supplementary data associated with this article can be found, in the online version, at doi: 10.1016/j.ydbio.2004.03.015. * Corresponding author. Fax: +613-9347-5219. E-mail address: [email protected] (H.M. Young). www.elsevier.com/locate/ydbio Developmental Biology 270 (2004) 455 – 473
-
Upload
independent -
Category
Documents
-
view
0 -
download
0
Transcript of Dynamics of neural crest-derived cell migration in the embryonic mouse gut

www.elsevier.com/locate/ydbio
Developmental Biology 270 (2004) 455–473
Dynamics of neural crest-derived cell migration
in the embryonic mouse gut$
H.M. Young,a,* A.J. Bergner,a R.B. Anderson,a H. Enomoto,b J. Milbrandt,c
D.F. Newgreen,d and P.M. Whitingtona
aDepartment of Anatomy and Cell Biology, University of Melbourne, 3010 Parkville, Victoria, AustraliabLaboratory for Neuronal Differentiation and Regeneration, RIKEN Center for Developmental Biology, Chuo, Kobe, Hyogo 650-0047 Japan
cDepartments of Pathology and Internal Medicine, Washington University School of Medicine, St. Louis, MO 63110, USAdMurdoch Childrens Research Institute, Royal Children’s Hospital, 3052 Parkville, Victoria, Australia
Received for publication 13 January 2004, revised 3 March 2004, accepted 5 March 2004
Available online 15 April 2004
Abstract
Neural crest-derived cells that form the enteric nervous system undergo an extensive migration from the caudal hindbrain to colonize the
entire gastrointestinal tract. Mice in which the expression of GFP is under the control of the Ret promoter were used to visualize neural crest-
derived cell migration in the embryonic mouse gut in organ culture. Time-lapse imaging revealed that GFP+ crest-derived cells formed chains
that displayed complicated patterns of migration, with sudden and frequent changes in migratory speed and trajectories. Some of the leading
cells and their processes formed a scaffold along which later cells migrated. To examine the effect of population size on migratory behavior, a
small number of the most caudal GFP+ cells were isolated from the remainder of the population. The isolated cells migrated slower than cells in
large control populations, suggesting that migratory behavior is influenced by cell number and cell–cell contact. Previous studies have shown
that neurons differentiate among the migrating cell population, but it is unclear whether they migrate. The phenotype of migrating cells was
examined.Migrating cells expressed the neural crest cell marker, Sox10, but not neuronal markers, indicating that themajority of migratory cells
observed did not have a neuronal phenotype.
D 2004 Elsevier Inc. All rights reserved.
Keywords: Migration; Enteric; Neural crest; Chain migration
Introduction Newgreen and Young, 2002a,b; Parisi and Kapur, 2000;
Neural crest cell migration into and along the gastroin-
testinal tract is crucial for the establishment of the enteric
nervous system. Most enteric neurons and glial cells arise
from vagal level crest cells (Le Douarin and Teillet, 1973).
Sacral crest cells also contribute some enteric neurons and
glial cells (Burns and Le Douarin, 1998). In mice, vagal
crest-derived cells enter the foregut around E9.5 and then
migrate caudally (Kapur et al., 1992). Although many
molecules required for the colonization of the gut by
crest-derived cells have been identified (Gershon, 1999;
0012-1606/$ - see front matter D 2004 Elsevier Inc. All rights reserved.
doi:10.1016/j.ydbio.2004.03.015
$ Supplementary data associated with this article can be found, in the
online version, at doi: 10.1016/j.ydbio.2004.03.015.
* Corresponding author. Fax: +613-9347-5219.
E-mail address: [email protected] (H.M. Young).
Taraviras and Pachnis, 1999), little is known about the
behavior of enteric crest-derived cells at the cellular level.
The behavior of enteric crest-derived cells is likely to
be influenced by intrinsic factors (the motile nature of crest
cells) and molecules expressed by the gut mesenchyme
including GDNF and endothelin-3 (Barlow et al., 2003;
Iwashita et al., 2003; Jiang et al., 2003; Kruger et al.,
2003; Natarajan et al., 2002; Young et al., 2001). Further-
more, when the number of vagal crest cells is surgically
reduced, they do not migrate as far caudally (Burns, 2000;
Peters-van der Sanden et al., 1993; Yntema and Ham-
mond, 1954), suggesting that interactions between cells
affect migratory behavior. To date, the only information
about the behavior of enteric crest cells has been obtained
from fixed samples of gut. Some of these studies have
provided a timetable by which crest-derived cells colonize

Table 2
Secondary antisera used
Species in which primary
antisera were raised
Secondary antisera
Rabbit + Human Donkey antihuman Texas Red (1:200, Jackson
Immunoresearch, West Grove, PA, USA), and
goat anti-rabbit Alexa 488 (1:200, Molecular
Probes) or biotinylated donkey anti-rabbit
(1:100, Jackson Immunoresearch) followed by
streptavidin Cy5 (1:100, Amersham)
Rabbit + Sheep Donkey anti-sheep Alexa 594 and biotinylated
donkey anti-rabbit followed by streptavidin
Cy5
Rabbit + Rat Goat anti-rabbit Alexa 488 and donkey anti-rat
Alexa 594 (1:100)
H.M. Young et al. / Developmental Biology 270 (2004) 455–473456
the gut of many species (Burns and Le Douarin, 1998; Fu
et al., 2003; Kapur et al., 1992; Newgreen and Hartley,
1995). Several inferences have been made about the
dynamics of migrating crest-derived cells in the gut from
static studies (Conner et al., 2003). However, to understand
the mechanisms that influence the behavior of crest-de-
rived cells, it is imperative to know, rather than infer, how
they are behaving dynamically (Lichtman and Fraser,
2001).
Time-lapse imaging is a powerful tool to study neuronal
(Nadarajah et al., 2001, 2002) and neural crest cell
migration (Gilmour et al., 2002; Krull et al., 1995; Kulesa
and Fraser, 1998, 2000; Kulesa et al., 2000). The behavior
of DiI-labeled crest cells in chick embryos has been
examined in trunk and cranial regions (Krull et al.,
1995; Kulesa and Fraser, 1998, 2000; Kulesa et al.,
2000). Here, we used time-lapse imaging to analyze
crest-derived cells migrating through the gut. Migration
of enteric crest-derived cells differs from other crest cells
in two important aspects. First, the scale of migration is
greater. The distance they migrate to colonize the entire
gastrointestinal tract exceeds that of any other crest cell
population (Allan and Newgreen, 1980), and the duration
of migration is longer; the colonization of the mouse gut
by crest-derived cells takes more than one quarter of the
gestation period (Kapur, 1999). Second, in comparison to
other environments through which neural crest cells mi-
grate, the gut mesenchyme appears to be relatively uni-
form. Both of these qualities require and facilitate cell
biological studies.
Using transgenic mice in which every enteric crest-
derived cell expresses GFP, we made direct observations
of crest-derived cells within the embryonic gut. We show
that the cells migrate in chains that follow complex and
unpredictable trajectories, but in population terms the mi-
gration is predictable. Some of the leading cells and their
processes form a scaffold along which later cells migrate,
which is reminiscent of axon tract formation. Furthermore,
we found that migrating cells undergo cell division, that
reducing the number of crest-derived cells decreases the
migration speed, and that migrating cells do not exhibit a
Table 1
Primary antisera used
Antiserum Host Dilution Source or reference
B-FABP Rabbit 1:2000 Kurtz et al., 1994
Hu Human 1:2000 Gift of Dr. M. Epstein
Neurofilament M,
145 kDa
Rabbit 1:100 Chemicon, Temecula, USA
PECAM-1 Rat 1:1000 BD Biosciences Pharmingen,
San Diego, USA
PGP9.5 Rabbit 1:1000 Ultraclone, Isle of Wight, UK
PGP9.5 Sheep 1:50 The Binding Site, UK
Phox2b Rabbit 1:700 Pattyn et al., 1997
Sox10 Rabbit 1:1000 Chemicon
neuronal phenotype, although neurons are found among the
migrating cells.
Materials and methods
Animals
Mice in which cDNA encoding tau-EGFP-myc (TGM)
had been inserted into the first coding exon of the receptor
tyrosine kinase gene, Ret, were used (Enomoto et al., 2001).
Male mice heterozygous for the Ret-TGM mutation
(RetTGM/+ mice) were mated to wild-type (C57Bl6) females.
The genotype of adult RetTGM mice was determined by PCR
using the primers and conditions reported by Enomoto et al.
(2001). Time-mated, pregnant mice were killed by cervical
dislocation.
Time-lapse video microscopy
The gastrointestinal tract was dissected from each em-
bryo and placed in tissue culture medium (DMEM contain-
ing 10% foetal bovine serum, 2 mM glutamine, 0.075%
sodium bicarbonate and penicillin/streptomycin sulfate so-
lution). Guts in which GFP+ cells were present were then set
up as suspended explants as described by Hearn et al.
(1999). The region of gut to be imaged was suspended
across a ‘‘V’’ cut in a piece of black Millipore filter paper
and was held in place by attaching the mesentery to filter
paper. The preparation was placed in tissue culture medium
in a chamber of a multi-well cell culture plate (Molecular
Probes, Eugene, OR, USA) and coverslipped. Time-lapse
observations were made using a Zeiss Axioskop fixed stage
microscope equipped with a heated stage, a Zeiss 09 filter
set, FLUAR objective lenses (Zeiss, Germany), a UniBlitz
shutter and a COHU 4913 video camera connected to a
Scion LG-3 frame grabber. The hardware was controlled
with a modified version of Scion Image software (Murray et
al., 1998). Images were captured every 1–10 min, and
between 10 and 30 video frames were integrated for each
H.M. Young et al. / Developmental
exposure (giving exposure times of 0.4–1.2 s). The plane of
focus was altered manually when required.
Determination of migratory speed
The net speed of forward movement of the migratory
wavefront was determined by measuring the distance be-
tween the location of the most caudal GFP+ cell visible at one
time point and the location of the most caudal GFP+ cell at a
later time using Scion Image, and dividing by the time (a
minimum of 8 h). To estimate the mean rate of migration of an
individual cell, the total path length that the cell moved
(including forward, backward and circumferential compo-
nents) was determined using Scion Image, and divided by the
time.
Cell trajectory analysis
The trajectory of the leading (most caudal) cell was
determined at 10-min intervals by constructing a straight
line from its position with its position 10 min earlier and
measuring the angle that each vector made with the ros-
trocaudal axis of the gut, which is the axis of population
advance. Where necessary, the autofluorescence of the gut
epithelium was used to locate the rostrocaudal axis. Angles
were measured using Scion Image, and polar histograms
plotted using Origin software.
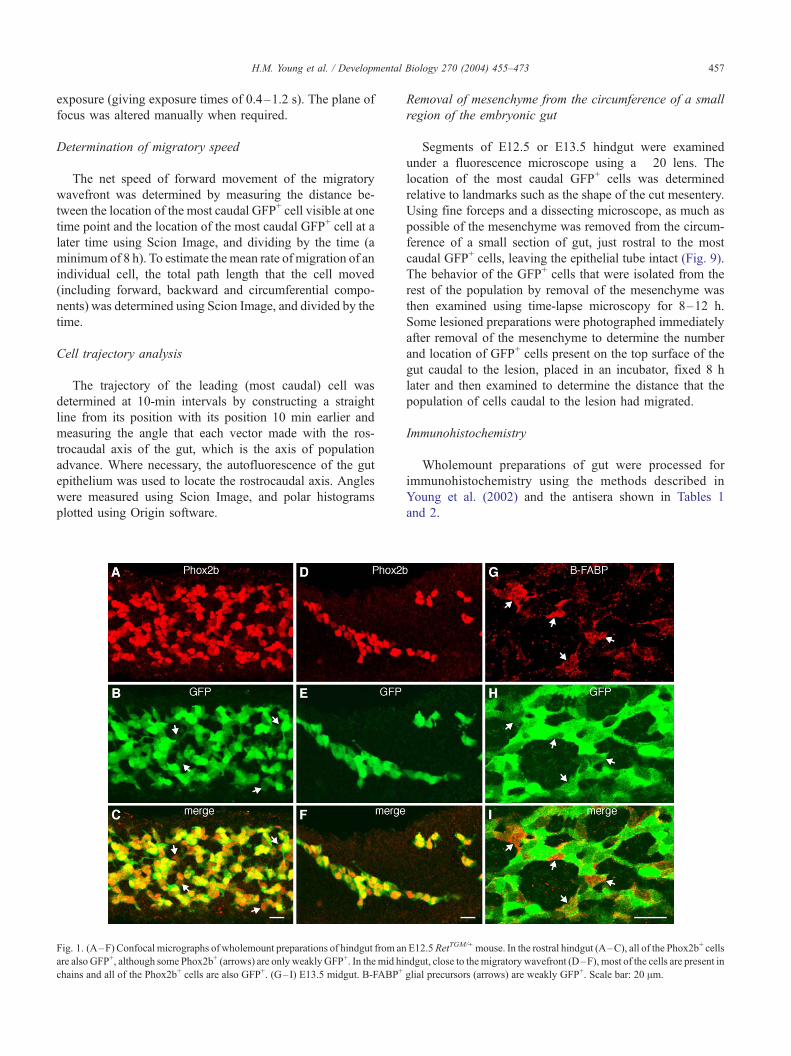
Fig. 1. (A–F) Confocal micrographs of wholemount preparations of hindgut from an
are also GFP+, although some Phox2b+ (arrows) are only weakly GFP+. In themid hi
chains and all of the Phox2b+ cells are also GFP+. (G– I) E13.5 midgut. B-FABP+
Removal of mesenchyme from the circumference of a small
region of the embryonic gut
Segments of E12.5 or E13.5 hindgut were examined
under a fluorescence microscope using a �20 lens. The
location of the most caudal GFP+ cells was determined
relative to landmarks such as the shape of the cut mesentery.
Using fine forceps and a dissecting microscope, as much as
possible of the mesenchyme was removed from the circum-
ference of a small section of gut, just rostral to the most
caudal GFP+ cells, leaving the epithelial tube intact (Fig. 9).
The behavior of the GFP+ cells that were isolated from the
rest of the population by removal of the mesenchyme was
then examined using time-lapse microscopy for 8–12 h.
Some lesioned preparations were photographed immediately
after removal of the mesenchyme to determine the number
and location of GFP+ cells present on the top surface of the
gut caudal to the lesion, placed in an incubator, fixed 8 h
later and then examined to determine the distance that the
population of cells caudal to the lesion had migrated.
Immunohistochemistry
Wholemount preparations of gut were processed for
immunohistochemistry using the methods described in
Young et al. (2002) and the antisera shown in Tables 1
and 2.
Biology 270 (2004) 455–473 457
E12.5RetTGM/+mouse. In the rostral hindgut (A–C), all of the Phox2b+ cells
ndgut, close to themigratorywavefront (D–F), most of the cells are present in
glial precursors (arrows) are weakly GFP+. Scale bar: 20 Am.

ental Biology 270 (2004) 455–473
Phenotype of migrating cells
Short, time-lapse sequences (2–10 images taken every
2.5–5 min) of GFP+ cells were taken using a �20 lens.
The gut was then fixed immediately and processed for
double-label immunohistochemistry. The region containing
H.M. Young et al. / Developm458
Fig. 2. Selected frames of the hindgut of an E12.5 mouse showing the caudal prog
cells are present in chains that follow a variety of trajectories. A polar plot showing
is shown in Fig. 5A. Scale bar: 100 Am. A movie (movie 1) of this preparation i
the migrating GFP+ cells was then re-located and exam-
ined using a MRC-1024 BioRad confocal microscope
attached to a Zeiss Axioplan microscope. We established
whether GFP+ cells that had migrated in the 5 min
immediately before fixation showed Hu-, PGP9.5-,
Sox10- or neurofilament-immunoreactivity.
ression of GFP+ neural crest cells. Time is noted in minutes (V). Most of the
the trajectories of the most caudal cell in this preparation at 10-min intervals
s available at the Developmental Biology website.

H.M. Young et al. / Developmental Biology 270 (2004) 455–473 459
Results
Use of Ret-TGM mice to visualize enteric neural
crest-derived cells
Neural crest-derived cells that colonize the embryonic
gut express the tyrosine kinase, Ret (Pachnis et al., 1993).
Recently, mice were generated in which cDNA encoding
tau-EGFP-myc (TGM) was inserted into the first coding
exon of the Ret gene (Enomoto et al., 2001). To visualize
neural crest-derived cells in the gut, embryonic mice that
were heterozygous for the Ret-TGM mutation (RetTGM/+
mice) were generated by breeding male RetTGM/+ mice with
wild-type females. Approximately 50% (145/301) of the
E10.5–E13.5 embryos screened for this study showed TGM
expression in the gut. GFP was ubiquitously expressed in
the neural crest-derived cells, including the nuclei, cyto-
plasm and processes (Figs. 1B, E, H). The intensity of GFP
was very weak at E10.5, and although it increased with age,
even at E12.5 and E13.5, the intensity of GFP was low.
To determine whether all enteric neural crest-derived cells
in the embryonic gut expressed TGM, the presence of GFP
was compared to the immunolocalization of the transcription
factor, Phox2b. Phox2b appears to be expressed by all crest-
derived cells in the E11.5–E14.5 mouse gut because all cells
labeled with other neuronal or neural crest cell markers are
Phox2b+ (Young et al., 1999, 2003). In the current study, all
Phox2b+ cells in the E11.5–E12.5 gut were GFP+ and vice
versa (Fig. 1). Behind the migratory wavefront, some
Phox2b+ cells were found to be only weakly GFP+ (Figs.
1A–C). The differentiation of enteric glial cells appears to be
associated with a down regulation of Ret (Natarajan et al.,
1999). In the embryonic mouse gut, glial precursors can be
identified using an antiserum to brain-derived fatty acid
binding protein (B-FABP). B-FABP+ cells are not present
at the migratory wavefront and cannot be detected until at
least 1 day after the passage of the migratory wavefront
through each gut region (Young et al., 2003). In the present
specimens, all B-FABP+ cells were weakly GFP+, but there
were also cells that were weakly GFP+ that were not B-
FABP+ (Figs. 1G–I).
RetTGM/TGM homozygotes lack enteric neurons and
kidneys and have defects in the sympathetic nervous sys-
tem, but RetTGM/+ mice have been reported to show no
deficits (Enomoto et al., 2001). However, to examine
whether the timetable by which neural crest-derived cells
Fig. 3. Selected frames of the midgut of an E10.5–E11 mouse showing the
caudal progression of GFP+ neural crest cells. The intensity of GFP is very
low at this age. The most caudal cell at each interval is arrowed. Time is
noted in minutes (V). During the sequence, the cells migrated around the
curve in the midgut adjacent to the umbilical artery. The caecum is just out
of the field of view. The epithelial lining of the gut (asterisks) is
autofluorescent. A polar plot showing the trajectories of the most caudal
cell in this preparation at 10-min intervals is shown in Fig. 5D. Scale bar:
100 Am. A movie (movie 4) of this preparation is available at the
Developmental Biology website.

Fig. 4. Net speed at which the migratory wavefront of GFP+ neural crest
cells migrated caudally along the gut under control conditions (left), and
when there was a reduced population (right). The net speed was determined
by measuring the distance between the location of the most caudal GFP+
cell visible at the beginning of the sequence and the location of the most
caudal GFP+ cell at the end of the sequence (a minimum of 8 h later).
Normally, the population of GFP+ cells moved caudally at around 35 Am/h
(left). A rim of mesenchyme was removed to isolate a small population of
GFP+ neural crest cells from the remainder of the population. When the
population was reduced, the net speed was significantly reduced (right).
The number in brackets is the estimated number of GFP+ neural crest cells
on the top surface of the gut caudal to the zone where the mesenchyme was
removed in each preparation.
H.M. Young et al. / Developmental Biology 270 (2004) 455–473460
colonize the gut in RetTGM/+ mice is the same as that in
wild-type mice, the location of Phox2b+ cells in the gut of
three E12.5 RetTGM/+ mice was compared to that of six wild-
type littermates, and to the well-established timetable of
neural crest-derived cell migration through the embryonic
mouse gut (see Young and Newgreen, 2001). There was no
obvious difference in the distribution of Phox2b+ cells along
the gastrointestinal tract between RetTGM/+ and wild-type
embryos, and the most caudal Phox2b+ cells were approx-
imately midway along the post-caecal hindgut in both
genotypes (data not shown). In addition, the location of
GFP+ cells along the gut of E10.5–E13.5 RetTGM/+ embryos
was similar to that reported previously using other neural
crest cell markers (Kapur et al., 1992; Young et al., 1998). In
summary, at E10.5, the most caudal GFP+ cells in RetTGM/+
mice were colonizing the midgut, at E11.5 they were
colonizing the caecum and post-caecal hindgut, at E12.5
they were midway along the post-caecal hindgut, and at
E13.5, they were in the caudal hindgut, which is the same as
in wild-type mice.
These observations show that although expression varies
between cells, TGM is expressed by all enteric neural crest-
derived cells in E10.5–E13.5 RetTGM/+ mice. Furthermore,
the timetable by which neural crest-derived cells colonize
the gut of RetTGM/+ mice is indistinguishable from that in
wild-type mice.
Time-lapse videomicroscopy of neural crest-derived cell
migration within the gut
To characterize the migratory behavior of neural crest-
derived cells within the gut, time-lapse video microscopy
was performed. GFP+ cells in explants of gut from E10.5–
E13.5 RetTGM/+ mice were imaged for up to 17 h (Figs. 2, 3;
movies 1–4). Long-term (minimum of 4 h) GFP+ cell
migration behavior was examined in preparations of mid-
and hindgut from E10.5 (n = 3), E11 (n = 2), E11.5 (n = 5)
and E12.5 (n = 20) mice. As only one preparation per litter
could be imaged at a time, the preparations that were not
imaged were left in tissue culture medium in an incubator.
At the end of imaging sessions that lasted > 8 h, the location
of the GFP+ cells in the imaged preparation was compared
to that of preparations left in the incubator. The locations of
GFP+ cells in the gut preparations that underwent time-lapse
analysis were always similar to that in gut preparations left
in the incubator, indicating that the conditions to which the
cells were exposed specifically during time-lapse microsco-
py did not noticeably affect the speed of neural crest-derived
cell migration. Importantly, we did not observe any GFP+
cells undergoing cell death in the imaged preparations, nor
did we observe signs that any of the imaged GFP+ cells were
unhealthy (e.g., blebbing). Furthermore, the behavior of
GFP+ cells imaged for 12 h showed no detectable differ-
ences from the behavior of cells in the first hour of imaging.
It is likely that the lack of any detectable phototoxic effects
is due to the low levels of GFP expressed by the crest-
derived cells in the Ret-TGM mice. In contrast, we have
observed blebbing and cell death when imaging migrating
crest-derived cells exhibiting a high-intensity GFP signal
(from a different transgenic mouse—data not shown).
Based on the rate at which the embryonic gut increases in
length, and the appearance of neuron precursors rostrocau-
dally in fixed samples of gut, it has been estimated that the
neural crest-derived cell wavefront moves down the embry-
onic chick gut in vivo at around 40 Am/h (Allan and
Newgreen, 1980). We determined the net speed at which
the wavefront of GFP+ cells migrated along explants of
E10.5 midgut (n = 3) and E12.5 hindgut (n = 4) by
measuring the distance between the location of the most
caudal GFP+ cell visible at one time point and the location
of the most caudal GFP+ cell a minimum of 8 h later. The
wavefront of GFP+ cells within the E12.5 hindgut and E10.5
midgut moved caudally at a net speed of around 35 Am/
h (Fig. 4). At E11.5, GFP+ cells were colonizing the
caecum, but we were unable to follow accurately the most
caudal cell because of the wide range of focal planes in
which cells were found within the caecum.
At E12.5, the migratory wavefront of GFP+ cells was in
the middle part of the hindgut. When explants of E12.5 gut
were removed and grown in organ culture, the wavefront of
GFP+ crest-derived cells reached the anal end of the hindgut
H.M. Young et al. / Developmental Biology 270 (2004) 455–473 461
after approximately 24–30 h (i.e., equivalent to E13.5).
However, in vivo, the migratory wavefront of crest-derived
cells does not reach the anal end until E14.5 (Young et al.,
1998). As the speed of crest cell migration in vitro is similar
to that reported in vivo (see above), the earlier colonization
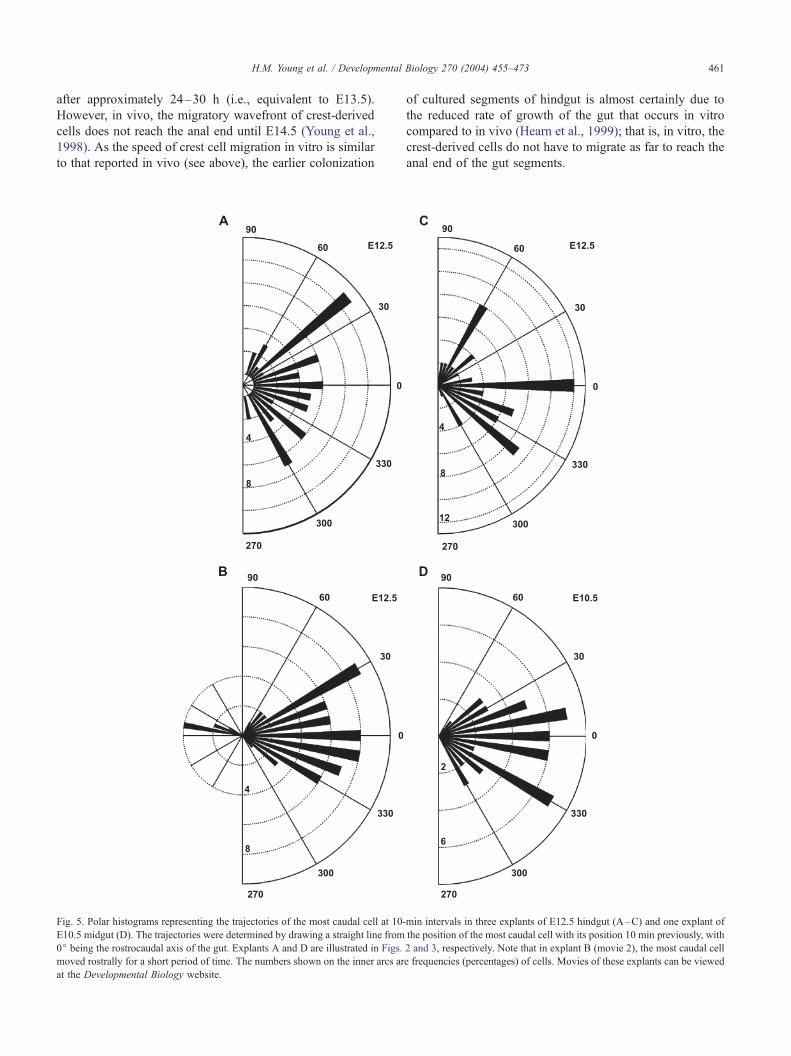
Fig. 5. Polar histograms representing the trajectories of the most caudal cell at 10-
E10.5 midgut (D). The trajectories were determined by drawing a straight line from
0j being the rostrocaudal axis of the gut. Explants A and D are illustrated in Figs.
moved rostrally for a short period of time. The numbers shown on the inner arcs ar
at the Developmental Biology website.
of cultured segments of hindgut is almost certainly due to
the reduced rate of growth of the gut that occurs in vitro
compared to in vivo (Hearn et al., 1999); that is, in vitro, the
crest-derived cells do not have to migrate as far to reach the
anal end of the gut segments.
min intervals in three explants of E12.5 hindgut (A–C) and one explant of
the position of the most caudal cell with its position 10 min previously, with
2 and 3, respectively. Note that in explant B (movie 2), the most caudal cell
e frequencies (percentages) of cells. Movies of these explants can be viewed
ental Biology 270 (2004) 455–473
Dynamic behavior of migrating neural crest-derived cells
within the gut
The rate of migration of GFP+ cells, and the trajectories
they followed, were highly variable (Figs. 2, 3; movies 1–
4). The trajectory of the leading (i.e., most caudal) cell was
determined at 10-min intervals by constructing a straight
line from its position with its position 10 min previously,
with horizontal being the rostrocaudal axis of the gut
(E10.5, n = 1; E12.5, n = 3). Thus, cells moving straight
down the gut would have a trajectory of 0j. Polar histo-
grams of the angle of the vectors show that the trajectories
of the leading (most caudal) GFP+ cells were variable in
detail. The proportion of the vectors that pointed directly
down the gut varied between preparations, but there was
also a strong, but not absolute, bias against backward
(rostrally directed) movement (Fig. 5).
Static images of fixed preparations suggest that enteric
neural crest-derived cells usually occur in chains (Conner et
al., 2003; Pomeranz et al., 1991; Young et al., 1998).
Imaging of living cells showed that both at, and behind,
H.M. Young et al. / Developm462
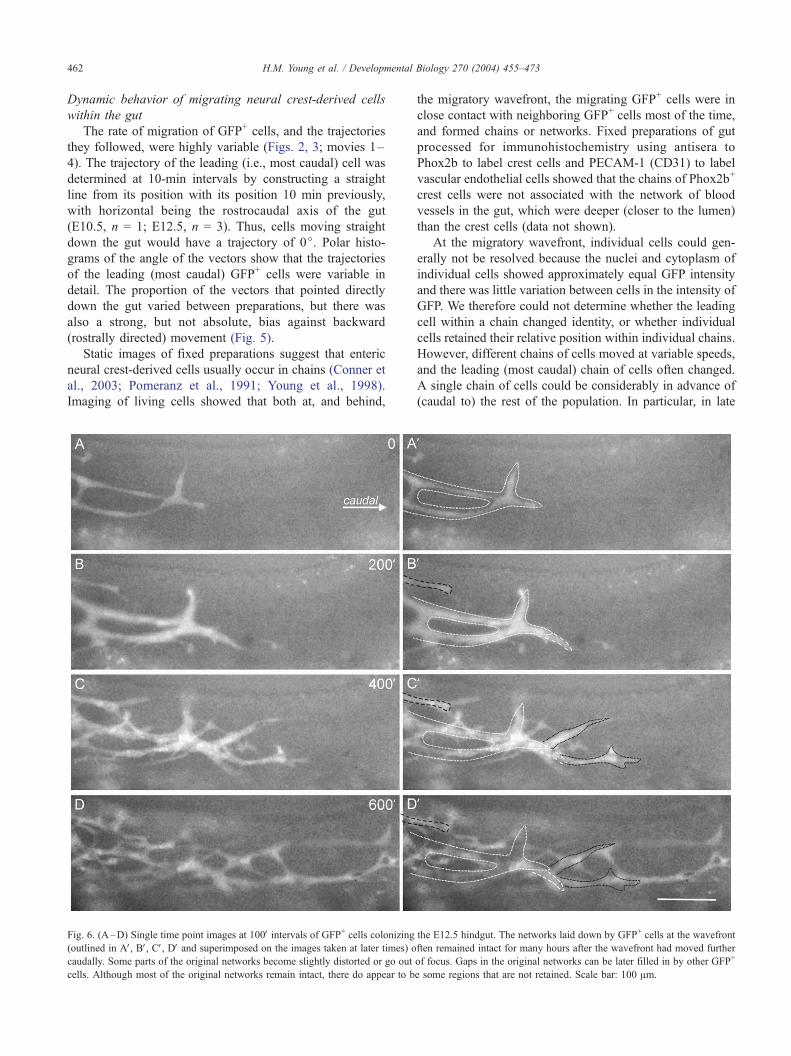
Fig. 6. (A–D) Single time point images at 100V intervals of GFP+ cells colonizing(outlined in AV, BV, CV, DV and superimposed on the images taken at later times) o
caudally. Some parts of the original networks become slightly distorted or go out
cells. Although most of the original networks remain intact, there do appear to b
the migratory wavefront, the migrating GFP+ cells were in
close contact with neighboring GFP+ cells most of the time,
and formed chains or networks. Fixed preparations of gut
processed for immunohistochemistry using antisera to
Phox2b to label crest cells and PECAM-1 (CD31) to label
vascular endothelial cells showed that the chains of Phox2b+
crest cells were not associated with the network of blood
vessels in the gut, which were deeper (closer to the lumen)
than the crest cells (data not shown).
At the migratory wavefront, individual cells could gen-
erally not be resolved because the nuclei and cytoplasm of
individual cells showed approximately equal GFP intensity
and there was little variation between cells in the intensity of
GFP. We therefore could not determine whether the leading
cell within a chain changed identity, or whether individual
cells retained their relative position within individual chains.
However, different chains of cells moved at variable speeds,
and the leading (most caudal) chain of cells often changed.
A single chain of cells could be considerably in advance of
(caudal to) the rest of the population. In particular, in late
the E12.5 hindgut. The networks laid down by GFP+ cells at the wavefront
ften remained intact for many hours after the wavefront had moved further
of focus. Gaps in the original networks can be later filled in by other GFP+
e some regions that are not retained. Scale bar: 100 Am.

H.M. Young et al. / Developmental Biology 270 (2004) 455–473 463
E11.5 mice, there was often a long chain of cells that
extended from the caecum into the post-caecal hindgut
along the mesenteric border, which preceded the entry of
other GFP+ cells into the post-caecal hindgut. The chains of
GFP+ cells that colonized the hindgut at E12.5 and E13.5
tended to be longer and broader than the chains of cells that
colonized the midgut at E10.5.
Chains of GFP+ cells at, or close to, the migratory wave-
front showed complicated and unpredictable patterns of
migration, with changes in migratory speed and trajectories.
A chain of GFP+ cells that was migrating in one direction
could suddenly slow or stop, change direction, branch or
retract. However, cells that retracted usually did so along
their previous trajectory of advance. Moreover, cells imme-
diately behind the leading chains often appeared to follow
the same pathway through the mesenchyme as the cells that
preceded them. The network laid down by chains of cells at
the wavefront often remained intact for many hours after the
wavefront had moved further caudally (Fig. 6). The con-
stancy in the form of the network may be because (i) some of
the neural crest-derived cells that are transiently at the
wavefront (pioneers) become nonmigratory and they and
their processes form a scaffold along which more rostral cells
(followers) migrate, or (ii) there are preexisting cues in the
gut environment which guide the detailed migration of all
Fig. 7. Selected images of GFP+ cells in the E12.5 hindgut, just behind the migra
Over a period of 3.5 h, this cell-free region was ‘‘filled in’’ both by cells from behi
bar: 25 Am.
cells, both pioneer and follower cells, or (iii) pioneer cells
leave a ‘‘molecular trail’’ or otherwise alter the environment
to favor the migration of following cells.
Behind the migratory wavefront, there were some differ-
ences between cells in the intensity of GFP. Differences
between cells in the levels of expression of Ret are also seen
in fixed preparations of gut using antisera to Ret (e.g.,
Schiltz et al., 1999; Young et al., 2003) and in gut from
RetTGM/+ embryos that are fixed immediately (Figs. 1B, H).
The differences between cells in the intensity of GFP
enabled us to visualize, within the networks of GFP+ cells,
a subpopulation of cells that was streaming caudally along a
scaffold of nonmigratory cells and cell processes (see movie
5). Most migrating cells within a chain of cells appeared to
follow the same pathway along the scaffold as the cell in
front. This suggests that at least some of the consistency in
the shape of the network is due to a scaffold formed by
nonmigratory GFP+ cells and cell processes. The relation-
ship between this early network and the interconnected
ganglia seen in mature animals in unclear, as distinct
myenteric ganglia do not form in the mouse hindgut until
late embryonic stages (E16.5).
Caudally migrating GFP+ cells were commonly observed
in regions of the gut that had been populated by crest-
derived cells for up to 8–12 h, but were less frequently
tory wavefront. (A) A small region (dotted) had remained cell-free. (B–D)
nd moving caudally and cells from in front moving rostrally (arrows). Scale

Table 3
Behavior of selected individual GFP+ cells (cells not part of a chain)
Cell # Approximate
length of time not
in contact with
other cells (min)
Outcome
1 30–40 Divided, one daughter cell rejoined
original chain, the other went in the
opposite direction around the gut
and out of focus
2 30–40 Rejoined original chain
3 120 Stopped migrating after approximately
80 min and was joined by another
chain of cells
4 60 Left one chain and joined another
5 30–40 Rejoined original chain
H.M. Young et al. / Developmental Biology 270 (2004) 455–473464
observed in regions that had been colonized for over 12 h.
In regions well behind (rostral to) the wavefront that had
been colonized by neural crest-derived cells for over 24
h (for example, the midgut of E12.5 mice when the
migratory wavefront is well into the hindgut), GFP+ cells
formed web-like networks with cell-free spaces. Within the
networks, individual GFP+ cells were sometimes observed
Fig. 8. The most caudal cell visible in this preparation (arrow) of E12.5 hindgut ro
opposite directions circumferentially around the gut. Scale bar: 25 Am.
to migrate, across cell-free spaces, from one cluster of GFP+
cells to another. However, we did not observe streams of
cells migrating caudally through the network. Hence, we did
not find any evidence for significant numbers of late,
caudally migrating cells. In addition, the cell-free spaces
were often in constant locations for many hours.
Although the population of GFP+ cells moved caudally,
some chains of cells, or what appeared to be individual cells,
moved rostrally transiently. Rostrally directed movement
was observed by cells both at (see Fig. 5B and movie 2), and
behind, the wavefront (Fig. 7).
In fixed preparations, some crest-derived cells within the
gut do not appear to be in contact with other crest-derived
cells (Young et al., 1998). In the current time-lapse study,
individual GFP+ cells were sometimes observed to break off
from a chain and lose all visible contact with other GFP+
cells. These cells migrated at very variable speeds of up to
90 Am/h when calculated over a 30-min timebase. (Note: the
rates of migration of individual cells were determined by
measuring the total path length of individual cells, unlike the
calculations of net speed of the migratory wavefront, which
only measured the total forward movement.) The behavior
of selected individual cells is shown in Table 3. All
unded up (B) and divided (C), and then the daughter cells (arrows) went in

H.M. Young et al. / Developmental Biology 270 (2004) 455–473 465
individual cells we observed (a) later rejoined the same
chain of GFP+ cells, (b) joined another chain, (c) migrated
for a short time and then ceased migrating and were later
contacted by other GFP+ cells, or (d) rounded up and
divided (see below) and then re-contacted other GFP+ cells.
Thus, GFP+ neural crest-derived cells only appeared to lose
contact with other GFP+ cells transiently.
Cells undergoing mitosis were easy to distinguish (see
cells arrowed in movie 5). Just before undergoing cell
division, most cells at the migratory wavefront would first
appear to break contact with neighboring cells, then round
up and divide (Fig. 8). In some cases of cell division we
observed at the wavefront (5/9), immediately after dividing,
the daughter cells would elongate and then migrate in
Fig. 9. (A) Diagram showing that removal of a rim of mesenchyme just rostral to t
rest of the population. (B–H) Selected images of a preparation in which a rim of
caudal to the region in which the mesenchyme was removed (dotted). One cell (a
position. Another cell (open arrow) migrates for a short period of time, rounds u
another cell. Scale bar: 50 Am.
opposite directions. However, in three other instances, the
two daughter cells appeared to remain in contact, and in
another case, one of the daughter cells migrated out of the
plane of focus, so its direction of migration could not be
ascertained. Behind the wavefront, most cells undergoing
mitosis remained within chains, but the behavior of their
daughter cells could not be followed (see movie 5).
At E11.5–E13.5, GFP+ cells were observed in the
mesentery and tissue adjacent to the distal hindgut (data
not shown). These GFP+ cells presumably arise from the
sacral neural crest (Burns and Le Douarin, 1998; Kapur,
2000). We did not observe any migration of sacral GFP+
cells into the hindgut before the colonization of the distal
hindgut by vagal GFP+ cells.
he most caudal cells will isolate a small group of neural crest cells from the
mesenchyme had been removed. There were only a small number of cells
rrow) extends processes in many different directions, but does not alter its
p and is stationary for over 2 h, and then migrates to the same location as

ental Biology 270 (2004) 455–473
Effects of reducing neural crest-derived cell number on the
dynamic behavior of neural crest-derived cells
The above observations indicate a high degree of inter-
action between neural crest-derived cells during migration.
Previous studies have shown that following a reduction in
the starting population of vagal neural crest cells, they do
not migrate as far distally along the gut (Burns, 2000;
Peters-van der Sanden et al., 1993; Yntema and Hammond,
1954). To test the hypothesis that cell number influences the
migratory behavior of enteric crest-derived cells, we wished
to isolate a small group of the most caudal GFP+ cells. In
preliminary experiments in which the gut was completely
severed just rostral to a small group of the most caudal
H.M. Young et al. / Developm466
Fig. 10. Confocal images of wholemount preparations of E12.5 (A–D) and E11.
strong Hu immunostaining in both the nucleus and cytoplasm and also neurofila
cytoplasmic Hu staining and no neurofilament staining. (E–G) The subpopulati
(arrows), but the cells that show strong Hu staining in both the nucleus and cytopl
bar: 10 Am.
GFP+ cells, it was not possible to image the cells because it
was impossible to prevent the unattached (severed) end
from moving. Therefore, a rim of mesenchyme just rostral
to the most caudal neural crest-derived cells was removed,
leaving the epithelium intact, in the E12.5 or E13.5 hindgut
(Fig. 9). In some of the preparations (n = 4), the behavior of
the isolated cells was examined by time-lapse microscopy
for a minimum of 8 h. In other preparations (n = 3), the
region caudal to the lesion was photographed immediately
after the lesion was performed, the preparations were then
left in an incubator for 8 h and then re-photographed. The
distance between the location of the most caudal GFP+ cell
visible immediately after the lesion and the location of the
5 (E–G) midgut. (A–D) A subpopulation of GFP+ cells (asterisks) shows
ment staining. Another subpopulation of GFP+ cells (arrows) shows weak
on of cells that shows weak Hu staining only in the cytoplasm is Sox10+
asm are Sox10� (asterisk). Some Sox10+ cells are Hu� (open arrow). Scale

Table 4
The phenotype of migrating neural crest cells
Combination of
antisera used
Number of GFP+
migrating cells
examined
Phenotype
Hu and neurofilament
M (NF)
27 93% weak cytoplasmic
Hu+/NF�
3.5% weak cytoplasmic
Hu+/?NF
3.5% nuclear Hu+/NF�
Hu and PGP9.5 8 88% weak cytoplasmic
Hu+/weak PGP9.5+
12% weak cytoplasmic
Hu+/PGP9.5�
Neurofilament M
(NF) and PGP9.5
2 100% NF�/weak PGP9.5+
PGP9.5 and Sox10 18 94% Sox10+/weak PGP9.5+
6% Sox10+/?PGP9.5
Short time-lapse sequences (2–10 images taken every 2.5–5 min) of
migrating GFP+ cells were taken, the gut was then fixed immediately and
processed for immunohistochemistry using four different combinations of
antisera (left hand column). The regions containing the GFP+ cells that had
migrated in the 5-min period immediately before fixation were relocated
and examined using confocal microscopy. ‘‘?’’ indicates that we were
unable to decide if the level of immunostaining was above background.
H.M. Young et al. / Developmental Biology 270 (2004) 455–473 467
most caudal GFP+ cell a minimum of 8 h later was measured
(using the method described above for determining the
speed of the migratory wavefront). The net migratory speeds
of the populations of isolated cells were significantly lower
than that of control populations (Fig. 4; t test: two-sample
assuming unequal variances, P < 0.05). The number of
GFP+ cells on the top surface of the explants, caudal to the
lesion, was estimated. The total size of the isolated popu-
lation of GFP+ cells in each explant could not be determined
because the GFP+ cells on the sides and bottom of the each
preparation could not be visualized, and thus we could not
establish the number of cells required for normal migratory
speed. However, in general, the greater the number of GFP+
cells on the top surface, the faster the migration rate (Fig. 4);
in one preparation, the migration rate was not very different
from control preparations.
Time-lapse analysis revealed that in preparations with
only two or three GFP+ cells on the top surface caudal to the
lesion, most GFP+ cells caudal to the lesion failed to migrate
at all, although some stationary cells did send out processes
in a variety of directions (Fig. 9). Other cells on the caudal
side of the lesion migrated intermittently (Fig. 9). In
preparations that had larger numbers of cells present caudal
to the lesion, the population of isolated cells migrated
caudally at a slower rate than control populations but no
difference in the behavior of cells was observed—the cells
showed a large degree of cell–cell contact and formed
chains that displayed complicated patterns of migration.
Do migrating neural crest-derived cells show a neuronal
phenotype?
Previous studies have hypothesized that the migratory
ability of enteric neural crest-derived cells is reduced once
the cells differentiate into neurons (Hearn et al., 1998; Wu et
al., 1999). Cells with a neuronal phenotype are present
among crest-derived cells at the migratory wavefront in
the embryonic gut (Young et al., 1999). We therefore
examined the phenotype of migrating GFP+ neural crest-
derived cells. Neural crest cells undergo many changes in
phenotype between their emigration from the neural tube
until their final differentiated state. To define cells at
different states of differentiation, antisera to the transcription
factor, Sox10, and to three different pan-neuronal markers,
PGP9.5, neurofilament (NF) and Hu, were used. Sox10 is
expressed by neural crest-derived cells before emigration
from the neural tube and is rapidly down-regulated in
differentiating neurons (Lo et al., 2002; Young et al.,
2002, 2003). PGP9.5 and NF antisera have been used
previously to label neurons in the embryonic mouse and
rat gut (Chalazonitis et al., 1998, 2001; Sidebotham et al.,
2001; Young et al., 2003). Hu antiserum, which labels all
differentiated neurons in the adult mouse gut (Stewart et al.,
2003), has been used to label neurons in the embryonic quail
and chick gut (Burns and Le Douarin, 1998; Conner et al.,
2003). We first compared the presence of Hu immunostain-
ing with other neural crest-derived cell and neuronal
markers in the E11.5 and E12.5 mid- and hindgut. Two
populations of Hu+ cells were observed: one population
showed strong Hu immunostaining in both the nucleus and
cytoplasm (termed ‘‘nuclear Hu+’’), and a second population
showed weak immunostaining that was present only in the
cytoplasm (‘‘weak cytoplasmic Hu+’’). Nuclear Hu+ cells
were Sox10-negative, but all weak cytoplasmic Hu+ cells
were Sox10+ (Figs. 10E–G). There were also Sox10+ cells
that did not show any Hu staining (Figs. 10E–G). At the
migratory wavefront, most of the cells showed weak cyto-
plasmic Hu+. Only nuclear Hu+ cells showed NF immunos-
taining (Figs. 10A–D). All nuclear Hu+ cells were strongly
PGP9.5+, and many of the weak cytoplasmic Hu+ cells
including those at the migratory wavefront were also weakly
PGP9.5+ (not shown; Sidebotham et al., 2001).
In summary, these markers seem to distinguish between
two populations of cells; one is Sox10�/nuclear Hu+/NF+/
strong PGP9.5+ and can be defined as neurons, and the other
is Sox10+/weak cytoplasmic Hu+/NF�/weak PGP9.5+ and
represent cells that have not commenced differentiation into
neurons or glial cells. Glial cell and glial precursor markers
were not used for this part of the study because cells
showing mature glial markers such as S100b cannot be
detected before E14.5, and although glial precursors (B-
FABP+ cells) are present in the foregut of E12.5 mice, they
cannot be detected in the caudal midgut or hindgut (Young
et al., 2003).
To determine the phenotype of migrating neural crest-
derived cells, short time-lapse sequences (2–10 images
taken every 2.5–5 min) of GFP+ cells were taken. The
gut was then fixed immediately, processed for immunohis-
tochemistry, and the region containing the migrating GFP+
cells re-located and examined using confocal microscopy.

Fig. 11. (A) Image of a GFP+ cell (arrow and outlined in pink dots) that had migrated from a previous location (outlined in white dots) over a period of 10 min.
The tissue was fixed immediately after the image was taken and processed for immunohistochemistry. The GFP+ cell was then re-located and examined using
confocal microscopy (B–D). The migrating GFP+ cell (arrow) was weakly PGP9.5+ (C) and showed Hu staining in the cytoplasm, but not the nucleus (D). The
migrating cell was approximately 150 Am from the migratory wavefront. Scale bar: 10 Am.
H.M. Young et al. / Developmental Biology 270 (2004) 455–473468
As it was difficult to identify individual cells within chains,
only cells that were at the leading edge of a chain, or that
formed a branch from a chain, were chosen for analysis so
that they could be unequivocally identified. Most of the
fields of view analyzed were within 250 Am of the wave-
front. The phenotypes of 55 GFP+ cells from E12.5 hindgut
Fig. 12. (A, B) Selected images of a time-lapse series showing a GFP+ cell (asteri
moved circumferentially from its original position (dotted outline). The tissue was
immunohistochemistry. The GFP+ cell (arrow) was then re-located and examined
(D) and Sox10+, and was about 100 Am from the migratory wavefront. Scale bar
preparations that had migrated in the 5 min immediately
before fixation are shown in Table 4. Most of these
migrating cells were Sox10+, weakly PGP9.5+ and also
showed weak cytoplasmic Hu+ (Figs. 11, 12; movie 6).
Sox10 is expressed by undifferentiated neural crest-derived
cells and then subsequently by glial precursors. The migrat-
sk) that migrated over a period of 12.5 min. (B) The GFP+ cell (arrow) had
fixed immediately after the image shown in B was taken and processed for
using confocal microscopy (C–F). The migrating cell was weakly PGP9.5+
: 10 Am. See movie 6 the Developmental Biology website.
H.M. Young et al. / Developmental Biology 270 (2004) 455–473 469
ing Sox10+ cells observed are unlikely to be glial precursors
because glial precursors are not present in the caudal midgut
or hindgut of E12.5 mice (the preparations used for this
series of experiments) (Young et al., 2003). A total of 130
GFP+ cells in the wavefront fields of view were scored for
Hu labeling and 16% had a Hu+ nucleus (i.e., a neuronal
phenotype). In contrast, only 3% (1/35) of migrating GFP+
cells had a Hu+ nucleus, and none showed neurofilament
immunostaining (n = 29). Taken together, less than 2% of all
migrating cells examined (n = 55) expressed any of the
neuronal markers used. Some cells extended processes
during the short, time-lapse sequences, and some of these
processes showed neurofilament immunostaining. In the
fields of view examined, we did not observe any cell
showing Sox10, PGP9.5, Hu or NF staining that were not
GFP+, confirming that GFP appears to be expressed by all
crest-derived cells at the embryonic stages examined.
Discussion
Most neural crest-derived cells that enter the developing
gut undergo an extensive migration before forming the
enteric nervous system. To examine the dynamic behavior
of crest-derived cells as they migrate through the gut mesen-
chyme, we used time-lapse microscopy and Ret-TGM mice,
in which enteric crest-derived cells express GFP (Enomoto et
al., 2001). We showed that the developing gut is a technically
tractable system to examine long-range cell migration in a
real tissue milieu. Most previous time-lapse studies of neural
crest cells used DiI applied to premigratory crest cells, and
thus only a subpopulation of cells was labeled. In contrast,
GFP appears to be expressed by every enteric crest-derived
cell of E10.5–E13.5 Ret-TGMmice, and hence we were able
to observe the entire population.
Our data have revealed some novel and hitherto unex-
pected behavior—for example, the network laid down by
leading cells is maintained for many hours, in part because a
subpopulation of the cells forms a scaffold. Paradoxically,
although the migration is predictable in population terms,
we showed that the behavior is unpredictable at the single-
cell level, at least at current levels of analysis. Previous
studies have shown that vagal crest cell number has an
effect on migratory behavior, but our study has revealed that
the likely underlying cellular mechanism is that cell–cell
contact is required for migration. Although many inferences
have been made about the behavior of migrating crest-
derived cells in the gut from static studies, it is extremely
important that these inferences are tested by examining the
dynamic behavior of the cells (Lichtman and Fraser, 2001).
Our data have demonstrated directly some behaviors that
had previously only been inferred, such as a high degree of
cell–cell interactions and migration of cells in chains.
Finally, it has been generally assumed that there is an
inverse correlation between neuronal differentiation and
migratory ability, yet to our knowledge, the phenotype of
migrating cells has never been directly examined anywhere
in the nervous system. We show that only an extremely
small proportion of the migrating crest-derived cells
expressed neuronal markers.
Migratory behavior of enteric crest-derived cells
Like crest cells in other locations (Krull et al., 1995;
Kulesa and Fraser, 1998, 2000; Kulesa et al., 2000), migrat-
ing enteric crest-derived cells formed chains that displayed
episodic and complicated patterns of movement, with un-
predictable changes in speed and trajectory. However, the
network laid down by the leading migratory cells remained
constant for many hours. This appears to be because some of
the leading cells and their processes form a scaffold along
which the following cells migrated. This phenomenon shows
some similarities to peripheral nerve formation where mi-
grating crest-derived cells follow axons (Gilmour et al.,
2002) and axon tract formation, where follower axons follow
a scaffold laid down by pioneer neurons (Bate, 1976; Easter
et al., 1994). We also observed that when chains of cells
retracted, they usually did so along the same pathway
followed during their advance. The molecular mechanisms
underlying the detailed pathway choice made by the migrat-
ing cells remain to be determined. Important influences on
pathway choice could include (i) interactions between crest-
derived cells (both migratory and postmigratory cells), (ii)
preexisting local variations in the stationary environment of
mesenchymal cells or the extracellular matrix (Gershon et
al., 1993; Howard and Gershon, 1998; Newgreen and
Hartley, 1995), and/or (iii) local environmental variations
induced by pioneering crest-derived cells.
Cell–cell contact
Like other populations of neural crest cells, and some
populations of migrating neurons in the CNS (Lois et al.,
1996), enteric crest-derived cells migrated in chains. The
chains were sometimes broken, but only transiently. The
propensity to form chains strongly suggests the presence of
cell–cell adhesive interactions mediated by cell adhesion
molecules. A variety of cell adhesion molecules are
expressed by enteric crest-derived cells (Chalazonitis et
al., 1997; Iwashita et al., 2003). Furthermore, Ret, which
appears to be expressed by all crest-derived cells in the gut,
contains cadherin-related sequences in the extracellular
domain (see Airaksinen and Saarma, 2002). However, the
identity of the molecules, and the way that they mediate the
formation of chains of crest-derived cells rather than other
forms of aggregates, has yet to been elucidated.
Cell number
Our time-lapse observations of enteric crest-derived cells
revealed high cell density and almost continuous cell–cell

H.M. Young et al. / Developmental Biology 270 (2004) 455–473470
interactions. Previous studies have shown that partial abla-
tion of the vagal crest cell population in vivo reduces the
distance that the cells migrate along the gut (Burns, 2000;
Peters-van der Sanden et al., 1993; Yntema and Hammond,
1954), and that high cell density promotes migration of
trunk neural crest cells in vitro (Newgreen et al., 1979;
Rovasio et al., 1983; Thomas and Yamada, 1992). This has
lead to the idea that cell density or ‘‘population pressure’’
may, by increasing cell–cell contact, stimulate cell migra-
tion in a direction other than the contact direction (New-
green, 1990). Alternatively, or additionally, crest-derived
cells could alter their local microenvironment, for example,
by growth/chemotactic factor depletion, thereby promoting
cell movement into uncolonized regions (see below). We
found that when a small population of the most caudal crest-
derived cells was isolated from the population behind
(rostral to) them, the cells migrated slower. Furthermore,
some of the isolated cells that were not in contact with any
other crest-derived cells were immobile, although they did
extend projections. Our observations suggest that cell–cell
contact is required for ongoing motility of enteric neural
crest-derived cells, and provide at least a partial explanation
for unpredictable trajectories that individual cells follow.
To produce small, isolated populations of crest-derived
cells, we removed a rim of mesenchyme. We cannot rule out
the possibility that the removal of mesenchyme affected the
migration of neural crest cells, for example, by release of
substances from lesion site. However, any perturbation that
reduces the number of neural crest-derived cells could have
indirect influences on the crest-derived cells. It is extremely
unlikely that the retarded crest cell migration we observed
following removal of a rim of mesenchyme was due to
isolation of the cells from a rostral source of chemorepellent
because in both avian (Burns et al., 2002) and mouse (HMY,
AJB, RBA unpublished data) gut, vagal neural crest cells
will migrate rostrally if introduced to the distal hindgut.
It would be very interesting to determine how large a
population is required for normal migration rate. In the
current study, the number of GFP+ cells on the top surface of
the isolated segments of gut was estimated. In general, the
greater the number of GFP+ cells on the top surface, the
faster the migration rate. However, because crest-derived
cells are likely to be present around the entire circumference
of the explants, and because it was not possible to count
GFP+ cells on the sides and underneath surface of the
explant, the exact relationship between cell number and
migration rate could not be determined. The idea that enteric
crest cell migratory behavior is influenced by cell number is
supported by (a) studies showing that partial ablation of the
vagal premigratory crest cell population in avian embryos
results in aganglionosis of the distal gut (Burns, 2000;
Peters-van der Sanden et al., 1993; Yntema and Hammond,
1954), and (b) the phenotype of Et-3�/� mice, which have
reduced numbers of crest cells in the gut from E10.5 and
aganglionosis (Barlow et al., 2003). However, the relation-
ship between crest cell number and migratory ability seems
to be complex as gdnf+/� mice have reduced numbers of
crest cells within the gut, but do not exhibit aganglionosis
(Shen et al., 2002).
It is possible that the combined outcome of a cell density
effect (cell–cell contact stimulating motility away from
contact) and of cell–cell adhesion is that crest-derived cells
migrate in chains. However, trunk neural crest cells in vitro
advance as a broad front with no observable chains, but with
numerous cell–cell contacts (Newgreen et al., 1979), so
chain formation is not an inevitable consequence of a
combination of cell–cell adhesion and migration.
The molecular signals underlying these cellular interac-
tions (cell–cell adhesion and motility induced by cell–cell
contact) are unknown. It is possible that the same cell
surface molecule mediates both adhesion and motility. For
example, while the extracellular domain of cadherins medi-
ates cell–cell adhesion, the cytoplasmic tail can interact
with the actin cytoskeleton via intracellular attachment
proteins, such as catenins.
Chemotactic molecules
GDNF is expressed by the gut mesenchyme and is
chemoattractive to enteric crest-derived cells (Iwashita et
al., 2003; Natarajan et al., 2002; Young et al., 2001). Thus,
the concentration of GDNF to which each crest-derived cell
is exposed could influence their migratory behavior. We
have previously proposed that, even if the differences in
levels of GDNF rostrocaudally along the gut are not high,
crest-derived cells may still migrate towards regions lacking
other crest-derived cells because of the presence of available
(unbound) GDNF in the mesenchyme (Young et al., 2001).
The current study suggests that the local concentration
differences of unbound GDNF are not the only influence
on migratory behavior, as cells would be expected to
separate from each other and ‘‘tile’’ the mesenchyme evenly.
However, the response to GDNF will be occurring concur-
rently with other mechanisms influencing migratory behav-
ior such as endothelin-3 concentration (Barlow et al., 2003;
Kruger et al., 2003), cell–cell contact and cell density. It is
unknown to what extent the chemoattractive effect of
GDNF is dependent on cell density, and whether a steep
gradient of GDNF can counteract the effect of low cell
numbers on migration.
Other factors affecting migratory behavior
Mice lacking endothelin-3 (Et-3�/� mice) have aganglio-
nosis of the distal hindgut. Based on the location of crest-
derived cells in fixed preparations of wild-type and Et-3�/�
mice (Coventry et al., 1994), and the high levels of Et-3
expression in the caecum of wild-type mice (Leibl et al.,
1999), it has been proposed that migration of crest cells
through the caecum is important for the colonization of the
post-caecal hindgut (Barlow et al., 2003; Coventry et al.,
1994; Kruger et al., 2003). Since the caecal wall is thick and

H.M. Young et al. / Developmental Biology 270 (2004) 455–473 471
the crest-derived cells are in many different focal planes
within the caecal wall, we were unable to examine the
migratory behavior of the crest cells as they migrated
through the caecum in the current study. Future studies
using confocal microscopy should reveal whether any
aspect of the migratory behavior changes as crest cells enter
and migrate through the caecum.
Phenotype of migrating cells
Vagal crest-derived cells that enter the foregut migrate
caudally. However, at variable distances along the gut,
individual cells must then cease migrating so that enteric
neuron precursors are distributed relatively evenly along the
entire gastrointestinal tract. The ‘‘stop’’ signals influencing
crest-derived cell migration have not been identified. Since
in vitro studies have shown that endothelin-3 inhibits the
differentiation of enteric crest-derived cells into neurons
(Hearn et al., 1998; Wu et al., 1999), and since mice lacking
endothelin-3 or its receptor, endothelin receptor B, lack
enteric neurons in the distal part of the intestine (Baynash
et al., 1994; Hosoda et al., 1994), it has been hypothesized
that in the absence of endothelin-3 signaling, crest-derived
cell differentiate into neurons before colonizing the distal
part of the intestine (Hearn et al., 1998; Wu et al., 1999).
This hypothesis assumes that the differentiation of cells into
neurons inhibits their migratory ability. This assumption has
not previously been tested.
In the current study, we examined the phenotype of
migrating crest-derived cells and found that less than 2% of
migrating cells examined expressed any of the neuronal
markers used, although cells with neuronal phenotypes were
present nearby. It is possible that neurons may migrate at
significantly slower rates than other cells, and had not
migrated detectable distances in the 5- to 10-min time period
used for this study. Also, to make re-localization of individual
cells possible, we only examined migrating cells that were at
the leading edge of a chain. We therefore cannot rule out the
possibility that neurons do migrate, but only within chains.
In regions of the embryonic gut that have been colonized
by crest-derived cells, not all of the cells show a neuronal
phenotype. Furthermore, undifferentiated crest-derived cells
are present in the mouse gut even after birth (Kruger et al.,
2002; Young et al., 2003). Thus, although our data support
the idea that neuronal differentiation may be a ‘‘stop’’ signal
for some cells, other mechanisms must also operate to halt
the migration of a subpopulation of undifferentiated crest-
derived cells throughout the gut.
Conclusions
This study presents the first direct examination of crest-
derived cell migration in the gastrointestinal tract. The
behavior of crest-derived cells described in the current study
provide essential information, which was previously un-
known or unproven, about the dynamic behavior of normal
enteric crest-derived cells, and will provide an important
baseline for proposed future studies in which the effects of
perturbing endothelin-3 or GDNF levels (or any other mol-
ecule of interest) on migratory behavior of cells can be
examined. The results emphasize the importance of cell–cell
interactions in the migratory process, which affect rate,
directionality and persistence of migration. As cell interac-
tions imply a population, they remind us that in some circum-
stances, cell behavior cannot be simply divided into ‘‘cell
autonomous’’ and ‘‘non-cell autonomous’’, but a concept of
‘‘cell population autonomous’’ should be considered.
Acknowledgments
This work was supported by the National Health and
Medical Research Council of Australia (project grant
145628 to HMY and PMW, project grant 237144 to DFN,
Senior Research Fellowship 170224 to HMY and C.J.
Martin Fellowship 007144 to RBA) and the ANZ Trust. We
thank Dr. Heather Wheat for assistance with plotting the
polar histograms, Dr. Colin Anderson and Professor John
Furness for sharing equipment, and Drs. Jean-Franc�oisBrunet, Miles Epstein, Mark Murphy and Thomas Muller
for supplying antisera.
References
Airaksinen, M.S., Saarma, M., 2002. The gdnf family: signalling, biolog-
ical functions and therapeutic value. Nat. Rev., Neurosci. 3, 383–394.
Allan, I.J., Newgreen, D.F., 1980. The origin and differentiation of enteric
neurons of the intestine of the fowl embryo. Am. J. Anat. 157, 137–154.
Barlow, A., de Graaff, E., Pachnis, V., 2003. Enteric nervous system pro-
genitors are coordinately controlled by the G Protein-coupled receptor
EDNRB and the receptor tyrosine kinase RET. Neuron 40, 905–916.
Bate, C.M., 1976. Pioneer neurones in an insect embryo. Nature 260, 54–56.
Baynash, A.G., Hosoda, K., Giaid, A., Richardson, J.A., Emoto, N., Ham-
mer, R.E., Yanagisawa, M., 1994. Interaction of endothelin-3 with
endothelin-B receptor is essential for development of epidermal mela-
nocytes and enteric neurons. Cell 79, 1277–1285.
Burns, A.J., Le Douarin, N.M., 1998. The sacral neural crest contributes
neurons and glia to the post-umbilical gut: spatiotemporal analysis of
the development of the enteric nervous system. Development 125,
4335–4347.
Burns, A.J., Champeval, D., Le Douarin, N.M., 2000. Sacral neural crest
cells colonise aganglionic hindgut in vivo but fail to compensate for
lack of enteric ganglia. Dev. Biol. 219, 30–43.
Burns, A.J., Delalande, J.M., Le Douarin, N.M., 2002. In ovo transplanta-
tion of enteric nervous system precursors from vagal to sacral neural
crest results in extensive hindgut colonisation. Development 129,
2785–2796.
Chalazonitis, A., Tennyson, V.M., Kibbey, M.C., Rothman, T.P., Gershon,
M.D., 1997. The alpha1 subunit of laminin-1 promotes the develop-
ment of neurons by interacting with LBP110 expressed by neural crest-
derived cells immunoselected from the fetal mouse gut. J. Neurobiol.
33, 118–138.
Chalazonitis, A., Rothman, T.P., Chen, J., Gershon, M.D., 1998. Age-de-
pendent differences in the effects of GDNF and NT-3 on the develop-

H.M. Young et al. / Developmental Biology 270 (2004) 455–473472
ment of neurons and glia from neural crest-derived precursors immu-
noselected from the fetal rat gut: expression of GFRalpha-1 in vitro and
in vivo. Dev. Biol. 204, 385–406.
Chalazonitis, A., Pham, T.D., Rothman, T.P., DiStefano, P.S., Bothwell, M.,
Blair-Flynn, J., Tessarollo, L., Gershon, M.D., 2001. Neurotrophin-3 is
required for the survival-differentiation of subsets of developing enteric
neurons. J. Neurosci. 21, 5620–5636.
Conner, P.J., Focke, P.J., Noden, D.M., Epstein, M.L., 2003. Appearance of
neurons and glia with respect to the wavefront during colonization of
the avian gut by neural crest cells. Dev. Dyn. 226, 91–98.
Coventry, S., Yost, C., Palmiter, R.D., Kapur, R.P., 1994. Migration of
ganglion cell precursors in the ileoceca of normal and lethal spotted
embryos, a murine model for Hirschsprung disease. Lab. Invest. 71,
82–93.
Easter Jr., S.S., Burrill, J., Marcus, R.C., Ross, L.S., Taylor, J.S., Wilson,
S.W., 1994. Initial tract formation in the vertebrate brain. Prog. Brain
Res. 102, 79–93.
Enomoto, H., Crawford, P.A., Gorodinsky, A., Heuckeroth, R.O. , Johnson
Jr., E.M., Milbrandt, J. 2001. RET signaling is essential for migration,
axonal growth and axon guidance of developing sympathetic neurons.
Development 128, 3963–3974.
Fu, M., Chi Hang Lui, V., Har Sham, M., Nga Yin Cheung, A., Kwong
Hang Tam, P., 2003. HOXB5 expression is spatially and temporarily
regulated in human embryonic gut during neural crest cell colonization
and differentiation of enteric neuroblasts. Dev. Dyn. 228, 1–10.
Gershon, M.D., 1999. Lessons from genetically engineered animal models
II. Disorders of enteric neuronal development: insights from transgenic
mice. Am. J. Physiol. 277, G262–G267.
Gershon, M.D., Chalazonitis, A., Rothman, T.P., 1993. From neural crest to
bowel: development of the enteric nervous system. J. Neurobiol. 24,
199–214.
Gilmour, D.T., Maischein, H.M., Nusslein-Volhard, C., 2002. Migration
and function of a glial subtype in the vertebrate peripheral nervous
system. Neuron 34, 577–588.
Hearn, C.J., Murphy, M., Newgreen, D., 1998. GDNF and ET-3 differen-
tially modulate the numbers of avian enteric neural crest cells and
enteric neurons in vitro. Dev. Biol. 197, 93–105.
Hearn, C.J., Young, H.M., Ciampoli, D., Lomax, A.E., Newgreen, D.,
1999. Catenary cultures of embryonic gastrointestinal tract support or-
gan morphogenesis, motility, neural crest cell migration, and cell dif-
ferentiation. Dev. Dyn. 214, 239–247.
Hosoda, K., Hammer, R.E., Richardson, J.A., Baynash, A.G., Cheung, J.C.,
Giaid, A., Yanagisawa, M., 1994. Targeted and natural (piebald-lethal)
mutations of endothelin-B receptor gene produce megacolon associated
with spotted coat color in mice. Cell 79, 1267–1276.
Howard, M.J., Gershon, M.D., 1998. Development of LBP110 expression
by neural crest-derived enteric precursors: migration and differentiation
potential in ls/ls mutant mice. J. Neurobiol. 35, 341–354.
Iwashita, T., Kruger, G.M., Pardal, R., Kiel, M.J., Morrison, S.J., 2003.
Hirschsprung disease is linked to defects in neural crest stem cell func-
tion. Science 301, 972–976.
Jiang, Y., Liu, M.T., Gershon, M.D., 2003. Netrins and DCC in the guid-
ance of migrating neural crest-derived cells in the developing bowel and
pancreas. Dev. Biol. 258, 364–384.
Kapur, R.P., 1999. Early death of neural crest cells is responsible for total
enteric aganglionosis in Sox10(Dom)/Sox10(Dom) mouse embryos.
Pediatr. Dev. Pathol. 2, 559–569.
Kapur, R.P., 2000. Colonization of the murine hindgut by sacral crest-
derived neural precursors: experimental support for an evolutionarily
conserved model. Dev. Biol. 227, 146–155.
Kapur, R.P., Yost, C., Palmiter, R.D., 1992. A transgenic model for study-
ing development of the enteric nervous system in normal and agan-
glionic mice. Development 116, 167–175.
Kruger, G., Mosher, J., Bixby, S., Joseph, N., Iwashita, T., Morrison, S.,
2002. Neural crest stem cells persist in the adult gut but undergo
changes in self-renewal, neuronal subtype potential, and factor respon-
siveness. Neuron 35, 657.
Kruger, G.M., Mosher, J.T., Tsai, Y.H., Yeager, K.J., Iwashita, T., Gariepy,
C.E., Morrison, S.J., 2003. Temporally distinct requirements for endo-
thelin receptor B in the generation and migration of gut neural crest
stem cells. Neuron 40, 917–929.
Krull, C.E., Collazo, A., Fraser, S.E., Bronner-Fraser, M., 1995. Segmental
migration of trunk neural crest: time-lapse analysis reveals a role for
PNA-binding molecules. Development 121, 3733–3743.
Kulesa, P.M., Fraser, S.E., 1998. Neural crest cell dynamics revealed by
time-lapse video microscopy of whole embryo chick explant cultures.
Dev. Biol. 204, 327–344.
Kulesa, P.M., Fraser, S.E., 2000. In ovo time-lapse analysis of chick hind-
brain neural crest cell migration shows cell interactions during migra-
tion to the branchial arches. Development 127, 1161–1172.
Kulesa, P., Bronner-Fraser, M., Fraser, S., 2000. In ovo time-lapse analysis
after dorsal neural tube ablation shows rerouting of chick hindbrain
neural crest. Development 127, 2843–2852.
Kurtz, A., Zimmer, A., Schnutgen, F., Bruning, G., Spener, F., Muller, T.,
1994. The expression pattern of a novel gene encoding brain-fatty acid
binding protein correlates with neuronal and glial cell development.
Development 120, 2637–2649.
Le Douarin, N.M., Teillet, M.A., 1973. The migration of neural crest cells
to the wall of the digestive tract in avian embryo. J. Embryol. Exp.
Morphol. 30, 31–48.
Leibl, M.A., Ota, T., Woodward, M.N., Kenny, S.E., Lloyd, D.A., Vaillant,
D.H., Edgar, D.H., 1999. Expression of endothelin 3 by mesenchymal
cells of embryonic mouse caecum. Gut 44, 246–252.
Lichtman, J.W., Fraser, S.E., 2001. The neuronal naturalist: watching neu-
rons in their native habitat. Nat. Neurosci. , (4 Suppl), 1215–1220.
Lo, L., Dormand, E., Greenwood, A., Anderson, D.J., 2002. Comparison of
the generic neuronal differentiation and neuron subtype specification
functions of mammalian achaete-scute and atonal homologs in cultured
neural progenitor cells. Development 129, 1553–1567.
Lois, C., Garcia-Verdugo, J.M., Alvarez-Buylla, A., 1996. Chain migration
of neuronal precursors. Science 271, 978–981.
Murray, M.J., Merritt, D.J., Brand, A.H., Whitington, P.M., 1998. In vivo
dynamics of axon pathfinding in the Drosophilia CNS: a time-lapse
study of an identified motorneuron. J. Neurobiol. 37, 607–621.
Nadarajah, B., Brunstrom, J.E., Grutzendler, J., Wong, R.O., Pearlman, A.L.,
2001. Twomodes of radial migration in early development of the cerebral
cortex. Nat. Neurosci. 4, 143–150.
Nadarajah, B., Alifragis, P., Wong, R.O., Parnavelas, J.G., 2002. Ventricle-
directed migration in the developing cerebral cortex. Nat. Neurosci. 5,
218–224.
Natarajan, D., Grigoriou, M., Marcos-Gutierrez, C.V., Atkins, C., Pachis,
V., 1999. Multipotential progenitors of the mammalian enteric nervous
system capable of colonising aganglionic bowel in organ culture.
Development 126, 157–168.
Natarajan, D., Marcos-Gutierrez, C., Pachnis, V., de Graaff, E., 2002. Re-
quirement of signalling by receptor tyrosine kinase RET for the directed
migration of enteric nervous system progenitor cells during mammalian
embryogenesis. Development 129, 5151–5160.
Newgreen, D.F., 1990. Control of the directional migration of mesenchyme
cells and neurites. Semin. Dev. Biol. 1, 301–311.
Newgreen, D.F., Hartley, L., 1995. Extracellular matrix and adhesive
molecules in the early development of the gut and its innervation
in normal and spotting lethal rat embryos. Acta Anat. (Basel) 154,
243–260.
Newgreen, D., Young, H.M., 2002a. Enteric nervous system: develop-
ment and developmental disturbances—Part 1. Pediatr. Dev. Pathol.
5, 224–247.
Newgreen, D., Young, H.M., 2002b. Enteric nervous system: develop-
ment and developmental disturbances—Part 2. Pediatr. Dev. Pathol. 5,
329–349.
Newgreen, D.F., Ritterman, M., Peters, E.A., 1979. Morphology and be-
haviour of neural crest cells of chick embryo in vitro. Cell Tissue Res.
203, 115–140.
Pachnis, V., Mankoo, B., Costantini, F., 1993. Expression of the c-ret
H.M. Young et al. / Developmental Biology 270 (2004) 455–473 473
proto-oncogene during mouse embryogenesis. Development 119,
1005–1017.
Parisi, M.A., Kapur, R.P., 2000. Genetics of Hirschsprung disease. Curr.
Opin. Pediatr. 12, 610–617.
Pattyn, A., Morin, X., Cremer, H., Goridis, C., Brunet, J.F., 1997. Expres-
sion and interactions of the two closely related homeobox genes Phox2a
and Phox2b during neurogenesis. Development 124, 4065–4075.
Peters-van der Sanden, M.J., Kirby, M.L., Gittenberger-de Groot, A.,
Tibboel, D., Mulder, M.P., Meijers, C., 1993. Ablation of various
regions within the avian vagal neural crest has differential effects on
ganglion formation in the fore-, mid- and hindgut. Dev. Dyn. 196,
183–194.
Pomeranz, H.D., Rothman, T.P., Gershon, M.D., 1991. Colonization of the
post-umbilical bowel by cells derived from the sacral neural crest: direct
tracing of cell migration using an intercalating probe and a replication-
deficient retrovirus. Development 111, 647–655.
Rovasio, R.A., Delouvee, A., Yamada, K.M., Timpl, R., Thiery, J.P., 1983.
Neural crest cell migration: requirements for exogenous fibronectin and
high cell density. J. Cell Biol. 96, 462–473.
Schiltz, C.A., Benjamin, J., Epstein, M.L., 1999. Expression of the GDNF
receptors Ret and GFRalpha1 in the developing avian enteric nervous
system. J. Comp. Neurol. 414, 193–211.
Shen, L., Pichel, J.G., Mayeli, T., Sariola, H., Lu, B., Westphal, H., 2002.
Gdnf haploinsufficiency causes Hirschsprung-like intestinal obstruction
and early-onset lethality in mice. Am. J. Hum. Genet. 70, 435–447.
Sidebotham, E.L., Woodward, M.N., Kenny, S.E., Lloyd, D.A., Vaillant,
C.R., Edgar, D.H., 2001. Assessment of protein gene product 9.5 as a
marker of neural crest-derived precursor cells in the developing enteric
nervous system. Pediatr. Surg. Int. 17, 304–307.
Stewart, A.L., Anderson, R.B., Young, H.M., 2003. Characterization of
lacZ-expressing cells in the gut of embryonic and adult DbH-nlacZ
mice. J. Comp. Neurol. 464, 208–219.
Taraviras, S., Pachnis, V., 1999. Development of the mammalian enteric
nervous system. Curr. Opin. Genet. Dev. 9, 321–327.
Thomas, L.A., Yamada, K.M., 1992. Contact stimulation of cell migration.
J. Cell. Sci. 103, 1211–1214.
Wu, J.J., Chen, J.X., Rothman, T.P., Gershon, M.D., 1999. Inhibition of in
vitro enteric neuronal development by endothelin-3: mediation by endo-
thelin B receptors. Development 126, 1161–1173.
Yntema, C.L., Hammond, W.S., 1954. The origin of intrinsic ganglia of
trunk viscera from vagal neural crest in the chick embryo. J. Comp.
Neurol. 101, 515–541.
Young, H.M., Newgreen, D., 2001. Enteric neural crest-derived cells:
origin, identification, migration, and differentiation. Anat. Rec. 262,
1–15.
Young, H.M., Hearn, C.J., Ciampoli, D., Southwell, B.R., Brunet, J.F.,
Newgreen, D.F., 1998. A single rostrocaudal colonization of the rodent
intestine by enteric neuron precursors is revealed by the expression of
Phox2b, Ret, and p75 and by explants grown under the kidney capsule
or in organ culture. Dev. Biol. 202, 67–84.
Young, H.M., Ciampoli, D., Hsuan, J., Canty, A.J., 1999. Expression of
ret-, p75(NTR)-, Phox2a-, Phox2b-, and tyrosine hydroxylase-immu-
noreactivity by undifferentiated neural crest-derived cells and different
classes of enteric neurons in the embryonic mouse gut. Dev. Dyn.
216, 137–152.
Young, H.M., Hearn, C.J., Farlie, P.G., Canty, A.J., Thomas, P.Q., New-
green, D.F., 2001. GDNF is a chemoattractant for enteric neural cells.
Dev. Biol. 229, 503–516.
Young, H.M., Jones, B.R., McKeown, S.J., 2002. The projections of early
enteric neurons are influenced by the direction of neural crest cell
migration. J. Neurosci. 22, 6005–6018.
Young, H.M., Bergner, A.J., Muller, T., 2003. Acquisition of neuronal
and glial markers by neural crest-derived cells in the mouse intestine.
J. Comp. Neurol. 456, 1–11.