DAMPAK TRAGEDI TIANANMEN SQUARE TERHADAP HAK ASASI MANUSIA DAN STATUS KEWARGANEGARAAN CHINA
Upload
khangminh22Category
view
3download
0
eISBN 978-967-17072-5-8

i
Editor-in-Chief Dr. Zaid Mujaiyid Putra Ahmad Baidowi
Editors (Physical Science) Dr. Siti Khatijah Deraman Dr. Salizatul Ilyana Ibrahim Dr. Aisyah Salihah Kamarozaman
Editor (Biological Science) Dr. Mazhani Muhammad
Editors (IT, Engineering & Mathematics) Dr. Norzilah Musa Dr. Nur Syazana Rosly
Editors (Social Sciences & Humanities) Dr. Azhar Abdul Aziz Dr. Tengku Maaidah Tengku A. Razak Dr. Farhah Abdullah Dr. Marziah Mokhtar Nor Hashima Mohd Sukor
Associate Editors Sathiyaperba Subramaniam G. Nagamany GovindanAinul Hafiza Abdul HairJebakumari Selvarani Ebenezer
Copy Editors Dr. Nurul Raihan Mohd Suib Dr. Megat Mohd Izhar Sapeli Fatma Nadiah Abd Hamid Sharifah Norasikin Syed Hod Nor Faridah Hanim Mat Junit
Editorial (Advisory) Board Professor Ts. Dr. Saifollah Abdullah Dr. Ikhwan Naim Md Nawi
I-CReST 2021International Conference on Research
and Practices in Science, Technology and Social Sciences
held on 26 June 2021
PROCEEDING BOOK
Published by:Centre of Foundation Studies, Universiti
Teknologi MARA Cawangan Selangor, Kampus Dengkil
2022

ii
Publisher@ Pusat Asasi, UiTM Cawangan Selangor, Kampus Dengkil, 2022
UITM CAWANGAN SELANGOR KAMPUS DENGKIL I-CReST 2021 International Conference on Research and Practices in Science,Technology and Social Sciences: PROCEEDING BOOK/Editors Zaid Mujaiyid Putra Ahmad Baidowi / Siti Khatijah Deraman / SalizatulIlyana Ibrahim / Aisyah Salihah Kamarozaman / Mazhani Muhammad / NorzilahMusa / Nur Syazana Rosly / Azhar Abdul Aziz / Tengku Maaidah Tengku A. Razak /Farhah Abdullah / Marziah Mokhtar / Nor Hashima Mohd Sukor / SathiyaperbaSubramaniam / G. Nagamany Govindan / Ainul Hafiza Abdul Hair / JebakumariSelvarani Ebenezer / Nurul Raihan Mohd Suib / Megat Mohd Izhar Sapeli/ Fatma Nadiah Abd Hamid / Sharifah Norasikin Syed Hod / Nor Faridah Hanim MatJunit
eISBN 978-967-17072-5-8
All Rights Reserved. No part of this publication may be reproduced, stored in a retrieval system, or transmitted, in any form or by any means, electronic, mechanical, photocopying, recording, or otherwise, without the prior written permission of the publisher, except in the case of brief quotations embodied in critical reviews and certain other non-commercial uses permitted by copyright law.

iii
Preface
Assalamualaikum warahmatullahi wabarakatuh and greetings, It gives me great pleasure to extend my warmest greetings and welcome to all participants attending the 2nd virtual International Conference on Research and Practices in Sciences, Technology and Social Sciences 2021 (I-CReST 2021). Thank you for your participation in the conference. This annual conference aims to provide a global platform and ecosystem for academicians, practitioners and researchers to present and constructively discuss their wide array of views on the subject matters within the clusters of Science and Technology as well as Social Sciences. I hope that this year’s
theme, “Embracing Research Culture & Fostering Academic Excellence”, has led to a meaningful collaboration and exchange of reliable, valuable information in areas of expertise. We received more than 180 papers and participation from different countries including Malaysia, Brunei, Russia, Japan, Indonesia, the Philippines, and India. The proceedings illustrate the wide range of topics in the areas of research and practices in Sciences, Technology and Social Sciences. Last, but not least, I would like to take this opportunity to thank all the I-CReST 2021 committee members for the great work and utmost dedication in ensuring the success of the conference, despite the difficult time of the pandemic. I also would like to express my sincere gratitude to the sponsors for synergising with us. Smart university-industry linkages are indeed vital in keeping the research culture flourishing and prosperous. Thank you. Dr Salizatul Ilyana Ibrahim Chaiperson I-CReST 2021
iv
Foreword
Assalamualaikum warahmatullahi wabarakatuh and greetings. Dear authors and esteemed readers, I would like to welcome all attendees to our second virtual International Conference I-CReST 2021 hosted by the Centre of Foundation Studies UiTM Cawangan Selangor Kampus Dengkil. This year’s conference is themed “Embracing Research Culture and Fostering Academic Excellence” in research is proof of the centre’s commitment to strive for academic dynamism and to deliver a platform for academicians and professionals to share their research findings and achievements for ideas to be explored and experienced as well as expertise to be commissioned into. This is in line with UiTM’s mission to place the university
on the global map. This conference shares an insight into the recent research and cutting-edge technologies, which gains immense interest with the colossal and exuberant presence of adept, young and brilliant researchers, and talented student communities presenting their research works and findings with common enthusiasts. This online event will offer the same impactful academic sharing and networking opportunities although it is done online. I am particularly happy to be present in this unique event and to exchange views and share experiences with other high-level professors, colleagues, and friends, representing many well-known universities and research institutes together with members of relevant international organizations. I congratulate you for your commitment and active participation and wish you all the success and also would like to take this opportunity to congratulate the organising committee of the Centre of Foundation, UiTM Cawangan Selangor Kampus Dengkil whose commitment and tireless efforts have made I-CReST 2021 a success. I sincerely hope that this conference will discuss all the different facets of this exciting topic and come up with recommendations that will lead to a better, healthier, merrier world. I wish the conference a great success. Thank you. Professor Ts. Dr. Saifollah Abdullah Director Centre of Foundation Studies University Teknologi MARA (UiTM) Cawangan Selangor, Kampus Dengkil

v
About the Conference
The Centre of Foundation Studies, Universiti Teknologi MARA (UiTM), Malaysia held its 2nd International Conference (I-CReST 2021) on 26 June 2021. With the theme, “Embracing Research Culture and Fostering Academic Excellence”, the conference provided a platform for undergraduate and postgraduate students, academics, researchers, professionals, and industrial practitioners from various backgrounds to share ideas and research findings in their respective fields. A total of 130 papers were presented by academics from local institutions, while 10 papers were from international educational institutions, for example from, India, Indonesia and Russia. Due to the recent Covid-19 developments in Malaysia and in order to comply with the Movement Control Order (MCO) restrictions, I-CReST 2021 was made available to participants online. Similar to last year’s conference, I-CReST 2020 was also successfully conducted online with the theme, “Harnessing Potential and Leading Transformational Change”. Interestingly, even though the conference was held virtually, a significant number of more than 1000 participants took part in the conference. This year’s conference offered the same impactful opportunities for academic sharing and networking. The conference also provided opportunities for publication in proceedings with e-ISBN. The selected papers will be considered for publication in WOS/Scopus/MyCite/MyJournal indexed journals after a peer-reviewed process.

vi
Theme Synopsis
I-CReST 2021’s main theme addresses four tracks to encourage scientific writing/ publication across multidisciplinary research in the broad fields of:- Physical Sciences: Medical Physics; Nuclear Physics; Photonics; Optics; Spectroscopy; Device Physics; Material Science; Polymers; Nanotechnology; Solid State Ionics; Inorganic and Organic Chemistry; Natural Products Chemistry; Catalysis; Renewable and Sustainable Energy Biological Sciences: Botany; Forestry; Ecology; Zoology; Entomology; Microbiology; Biotechnology; Genetics; Bioinformatics; Nutraceutical; Cosmeceutical; Pharmaceutical; Pharmacology; Biomedicine; Health Sciences Information Technology, Engineering and Mathematics: Information Technology, Engineering and Mathematics; Human-Computer Interaction; Information Virtualization; Modelling and Simulation; Computer Security; Wireless and mobile communications; Software Engineering; Internet of Things; Data Analytics; Multimedia Computing; Information Retrieval; Electronic Learning; Artificial Intelligence and Machine Learning; Web Technology; Pure and Applied Mathematics; Mathematics Education; Mathematical Modelling; Mathematical Statistics; Fuzzy Mathematics and Applications; Operations Research Social Sciences & Humanities: Social Sciences & Humanities; Education/Pedagogy; Communication Arts; Information Communication; Linguistics/Neurolinguistics/Sociolinguistics; Literature and Poetry; Educational Management and Leadership; Early Childhood Education; Panicgogy; Civil Law; Economics and Financial Law; Human Right Law; Public Law; Islamic Law; Contract Law; Consumer Law; Comparative Law; Commercial Law; Competition Law; Constitutional Law; Environmental Law; Family Law; Medical Law; Private Law; Social Policy and Social; Legislation; Legal Education; Criminology; Al-Quran and Hadith; Aqidah and Islamic; Thoughts; Muamalat; Halal Management; Education and Shariah; Astrofiqh and Cosmofiqh; Dakwah and Human Development; Economics
vii
TABLE OF CONTENTS
Preface iii Foreword iv
About the Conference v
Theme Synopsis vi PROCEEDING PAPERS
Physical Sciences
I-CReST 2021:110-100 – Formation of Silicon Nanograss on Silicon Substrate Using ICP Etching 3
Siti Aisyah Zawawi, Azrul Azlan Hamzah, Faisal Mohd-Yasin
I-CReST 2021:184-186 – Characterization of Maltodextrin-chitosan based Polymer Electrolyte with the Addition of Polymerized Ionic Liquid (PIL) 9
Syaza Zaitun Akmal Binti Sabri, Ninie Suhana Abdul Manan, Mohd Fakhrul Zamani Abdul Kadir, Yuhanees Mohamed Yusof
Biological Sciences
I-CReST 2021:006-011 – Maternal Caffeine Consumption during Pregnancy and the Risk of Miscarriage 30
Juliana Yusof
I-CReST 2021:099-087 – Morphological Identification of Erwinia sp. that Associated with Pineapple Heart Rot Disease 40
Siti Aisyah Binti Musa, Intan Sakinah Mohd Anuar
I-CReST 2021:156-152 – Expression of IL-1β, IL-6, and TNF-ɑ in rat molar periodontium tissues after concurrent orthodontic wire placement and Enterococcus faecalis inoculation 46
Fazle Khuda, Badiah Baharin, Nur Najmi Mohamad Anuar, Nurrul Shaqinah Nasruddin
Information Technology, Engineering and Mathematics
I-CReST 2021:017-014 – Student’s Perception on Mathematics: A Case Study on Peer Mentoring Programme 53
Mohd Faiez Suhaimin, Mardhiyah Ismail, Masnira Ramli, Firdawati Mohamed, Suziana Aida Othman, Siti Farah Haryatie Mohd Kanafiah
I-CReST 2021:024-015 – New Algorithms for Encryption and Decryption Data using Laplace Transformation for Data Security 61
Fatimatuzahra Musa, Nur Syafika Atilah Zaini, Alif Syazwan Abdul Rahim, Mardhiyah Ismail
I-CReST 2021:046-028 – A Review: Education Research in Electrical and Electronic Engineering 70
Muhammad Ridzuan Idris, Irdayanti Mat Nashir, Shaiful Hazmir Shaifuddin
viii
I-CReST 2021:064-090 – Students' Perception on Characteristics of Effective Lecturers Using Fuzzy Conjoint Method 79
Hamidah Ayub, Roselah Osman, Zuraidar Badaruddin, Afiqah Mazalan, Nadatul Mutjarob Muhammad Misdi
I-CReST 2021:083-070 – The Effect of Oil Price, Interest Rate, Consumer Price Index and Exchange Rate on Food Price 86
Nur Anysatul Hanak Abdullah, Azrul Azim Mohd Yunus, Safwan Ibrahima, Arif Asraf Mohd Yunusa
I-CReST 2021:097-085 – Using Latent Dirichlet Allocation to Identify Text Messages Topic in Mental Health Mobile Therapy 93
Teh Faradilla Abdul Rahman, Norshita Mat Nayan
I-CReST 2021:108-117 – Willingness to Pay for the External Cost of Last Mile Delivery Services in Jakarta 103
Fanny Mailan Sari, Nahry, Jachrizal Sumabrata, Mochamad Adhiraga Pratam
I-CReST 2021:112-134 – Affecting Factors that Committing Motorcyclists Violations at RLC 112
Nurul Firkhati Hidayah, Tri Tjahjono, Guritnaningsih Santoso
I-CReST 2021:113-129 – Airport Selection Preference in Central Java Multi Airport Region 121
Zahra Zakiyya Mustaqima, Tri Tjahjono, Alloysius Joko Purwanto
I-CReST 2021:114-140 – Analysis of Driving Speeds of Private Vehicles and Contributing Factors on The Cipali Toll Road (Cikopo-Palimanan) 130
Yanika Desita, Tri Tjahjono, Guritnaningsih
I-CReST 2021:124-145 – Contribution of Nano Crumb Rubber to Hot-Mix and Warm-Mix Buton Rock Asphalt with used Waste Engine Oil 138
Celcio Ricardo, Sigit Pranowo Hadiwardoyo
I-CReST 2021:125-132 – Perception Measurement after Service Upgrade towards Feeder Ridership (Case Study: Mikrotrans Jakarta) 147
Kusumastuti Rahmawati, Andyka Kusuma, Robby Yudo Purnomo
I-CReST 2021:174-175 – Development of Multipurpose In-House Tracking Device 155
Hasnorhafiza binti Husni, Nik Muhammad Syazwan bin Nik Yusof, Muhammad Iqbal Haziq bin Othman, Nor Shazwaney Atiqah bt Ibrahim
Social Sciences & Humanities
I-CReST 2021:001-055 – Peranan Undang-undang Jenayah Syariah dalam Menangani Isu Gejala Sosial dalam Kalangan Masyarakat Islam di Malaysia 162
Mohamad Afandi Md Ismail, Mohd Sabree Nasri, Ikmal Hafiz Jamal, Muhammad Hasif Yahaya, Muhd Najib Abdul Wakil
I-CReST 2021:059-038 – Students’ Readiness, Performance, and Intention to Continue Online Learning during Covid-19 Pandemic 173
Siti Ngayesah Ab Hamid, Hafizah Omar Zaki
ix
I-CReST 2021:063-047 – A Systematic Review Analysis on Module Development: Systematic Review Analysis of Module Development in Technical Teaching and Learning in Technical and Vocational Education Systems 183
Shaiful Hazmir Shaifuddin, Dr. Irdayanti Mat Nashir, Muhammad Ridzuan Idris
I-CReST 2021:101-092 – Rights of Education: Review of the Conditions of Students in Learning amid the Covid-19 Pandemic 195
Ainul Mardhiyyah binti Tajudin, Fareez Junaidy bin Mohd Junus
I-CReST 2021:102-098 – Right of Education: Difficulties to Earn Education for Children from Minimum Wage Families 203
Ainul Mardhiyyah binti Tajudin, Mohamad Nasrul bin Mohd Nizar
I-CReST 2021:121-108 – The Admissibility of Eyewitness Identification Evidence in Malaysian Courts: An Analysis on R v Turnbull guidelines and Scientific Approach to Eyewitness Identification 211
Nur Hafidah Abd Kadir, Hariati Ibrahim @ Musa, Sharifah Zulia Balqish Syed Agil
I-CReST 2021:144-138 – Konsep Manusia dalam Pemikiran dan Peradaban Barat 218
Wan Noor Zeiti Wan Abdul Rashid, Aliza Elias, 2Mohd Razali Haron dan Noorkharilhuda Ibrahim
I-CReST 2021:151-147 – Al-Quran and Environmental Preservation: A Specific Study on Water Conservation 229
Mohd Takiyuddin Ibrahim, Huzaimah Hj Ismail, Ahmad Jamil Jaafar, Mohd Shahrudin Mohmud
I-CReST 2021:161-165 – Perceptions and Views of Pre-University Students about Physics 239
Noorakmar Hidayah Mohamed Hashini, Nur Sa’aidah Ismail, Nur ‘Ain Hamdan
Our Sponsors

1
PROCEEDING PAPERS

2
PHYSICAL SCIENCES
3
I-CReST 2021:110-100 – Formation of Silicon Nanograss on Silicon Substrate Using ICP Etching
*1Siti Aisyah Zawawi, 2Azrul Azlan Hamzah, 3Faisal Mohd-Yasin
1Centre of Foundation Studies, Universiti Teknologi MARA, Cawangan Selangor, Kampus
Dengkil, 43800 Dengkil, Selangor, Malaysia 2Institute of Microengineering and Nanoelectronics (IMEN), Universiti Kebangsaan
Malaysia, 43600 Bangi, Selangor, Malaysia 3Queensland Micro- and Nanotechnology Centre, Griffith University, 4111, Brisbane, QLD,
Australia
*E-mail: [email protected]
ABSTRACT In this work, the formation of unwanted silicon nanograss was investigated during plasma etching process. The silicon substrate (silicon nitride-silicon-silicon nitride) was etched by wet etching process. The thickness of silicon and silicon nitride are 400 µm and 200 nm, respectively. Substrate was immersed in Buffered Oxide Etch (BOE) solution to remove silicon nitride layer and Potassium Hydroxide (KOH) solution to remove 310 µm layer of silicon. Silicon membrane was produced after wet etching process. Then, silicon nitride layer on the other side was etched by Inductively Coupled Plasma (ICP) etching. The formation of silicon nanopillars and unexpected silicon nanograss were observed on the silicon surface. During the etching process, redeposition of the silicon nanograss occurred on the silicon membrane. SEM and FESEM were used to study the morphology of the silicon nanograss, while EDX analysis was used to determine the composition analysis of the nanograss. It was found that the formation of the silicon nanograss had a greatest influence on parameter setting used during plasma etching prosess as well as micromasking effect. Keywords: MEMS; silicon nanograss; ICP etching 1. INTRODUCTION Silicon is often referred to a widespread material used in semiconductors technologies. Over the past few years, silicon have been attracted increasing attention and have been considered for applications such as MEMS sensor, photodetector and solar cell. At present, numerous models have been developed to investigate the formation of silicon nanograss or black silicon. Silicon nanograss is one of the unwanted effect in RIE based processes, occurred by accompanying dust contamination [1]. However, their formation can be control by monitoring proper flow of gases during the passivation and hydrogenation steps [2]. Generally, the formation of the silicon nanograss are due to the micromasks and anisotropic etching through the deposition of sidewall passivation on silicon pillars. Moreover, miromasking issue mainly because of the product of plasma polymerization or sputtering of reactor walls and electrodes [3].
4
Nevertheless, some researchers proposed the advantage from the nanoscale morphology of silicon nanograss. The physical behavior on the surface of the silicon substrate changed and show a great performance for chemical, physical and electrical applications. Silicon nanograss improves the wetability of the silicon substrate. Wetability properties influenced the chemical composition and geometrical microstructures of the surface [4]. The different pore morphology properties of silicon substrate results in different wetting properties from nanoporous to macroporous [5]. This silicon nanograss is widely used in photovoltaic solar cell [6-7], accelerometer [8] and photodetector [9].
In this study, the formation of unwanted silicon nanograss was discussed. Plasma-based
using Inductively Coupled Plasma (ICP) etching was used to synthesis the development of silicon nanograss on silicon membrane. The growth of silicon nanograss unexpectedly pile up during the fabrication of silicon nanopillars. 2. METHODOLOGY The fabrication process of the silicon nanopillars depends on the back-side anisotropy and front-side ICP etching step. The Si3N4-Si-Si3N4 substrate was fabricated on both side, where the back-side and front-side undergo wet etching and plasma etching, respectively. The back-side was etched using BOE solution to remove 200 nm thickness of Si3N4 layer. Then the substrate was etched using KOH solution to remove around 310 µm thickness, remaining 90 µm membrane thickness of Si layer.
Meanwhile, the formation of silicon nanopillars was growth on the front-side of the Si
substrate using ICP etching. The substrate was cleaned before ICP etching process to remove contamination on the surface. Then, AZ 4620 positive photoresist layer was deposited by using spin coating machine. It was spin coated at the rotation speed of 500 rpm for 10 s, followed by the second spinning at 2000 rpm for 20 s. Then, the sample was baked at a temperature of 90oC for 2 minutes. The photoresist layer was removed using photolithography process. Positive chrome mask, made from antireflective chrome soda on lime glass was used for this process. Substrate was aligned by mask aligner MIDAS SYSTEM, MDA-400LJ. It was then exposed to UV light for 35s to soften the area of the photoresist under the mask. The exposed substrate was then immersed in the solution of AZ 400 developer and DI water with ratio 1:3 for 30s to remove the softened photoresist. Then the substrate was baked at temperature of 120oC for 2 minutes to harden the unexposed photoresist layer.
The front-side substrate was then undergo ICP etching process to form silicon nanopillars.
The substrate exposed to ICP etching twice, first exposed to remove Si3N4 layer, the second exposed to form silicon nanopillars. A mixture of CF4 precursor and Ar gases were used as an etching gases at a flow rate of 70 sccm and 5 sccm, respectively. The RF bias, ICP bias, APC control and time to remove 200 nm thick Si3N4 layer were 50 W, 150 W, 2 Pa and 1 minute, respectively. Then, the silicon membrane was exposed to plasma etching to form silicon nanopillars and unwanted silicon nanograss on its surface. A mixture of precursor CF4 (30 sccm) and O2 (20 sccm) gases were used for this purposed. The RF bias, ICP bias, APC control and time were 120 W, 500 W, 2 Pa and 75 minutes, respectively. The concentration of atomic fluorine can be increased by adding O2 gas to fluorine plasma. The following chemical reaction defines the extraction of fluorine atoms from a CF4 precursor [10]:
5
𝐶𝐶𝐶𝐶4 + 𝑂𝑂 → 𝐶𝐶𝑂𝑂𝐶𝐶2 + 2𝐶𝐶
Nevertheless, oxygen also reacts with fluorine atoms. Unreasonable amounts of oxygen
can reduce the amount of atomic fluorine and thus prevent the fluorine etching process:
𝑂𝑂2 + 𝐶𝐶 → 𝐶𝐶𝑂𝑂2
𝐶𝐶𝑂𝑂2 + 𝐶𝐶 → 𝐶𝐶2 + 𝑂𝑂2
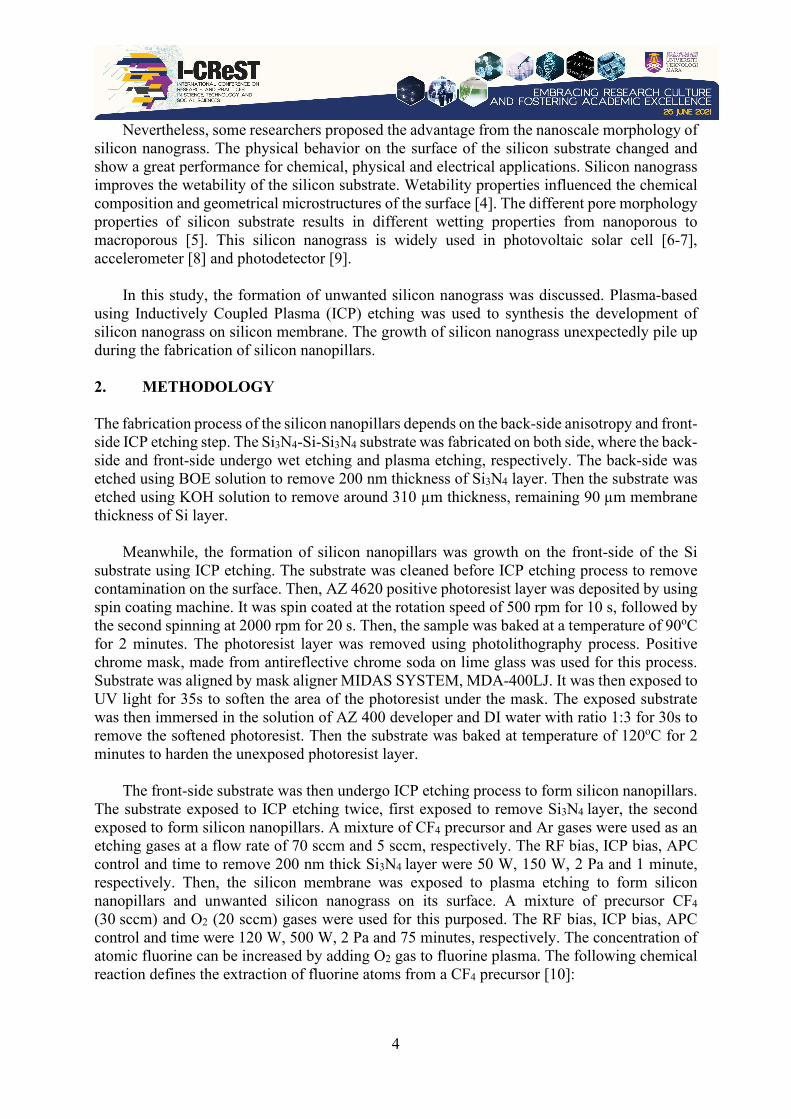
On the other hand, anisotropic etching needs operative passivation of the sidewalls. Combining oxygen with fluorine-based gases can increase etching anisotropy to passivate silicon surfaces with SiOxFy [11]. 3. RESULT AND DISCUSSION The photograph of a front-side silicon substrate decorated with unwanted silicon nanograss or black silicon is shown in Figure 1, while the inset shows the amplified view of silicon nanopillars on the silicon substrate. The silicon substrate is turned black due to parameter setting during plasma etching and micromasking effect. Generally, the size of silicon nanograss was smaller than the typical size of silicon nanostructure fabricated by plasma etching. This is due to the evolution of high aspect ratio features [12] and micromasking effect [13].
Figure 1: The image of silicon substrate covered by silicon nanograss or black silicon.
(1)
(2)
(3)
6
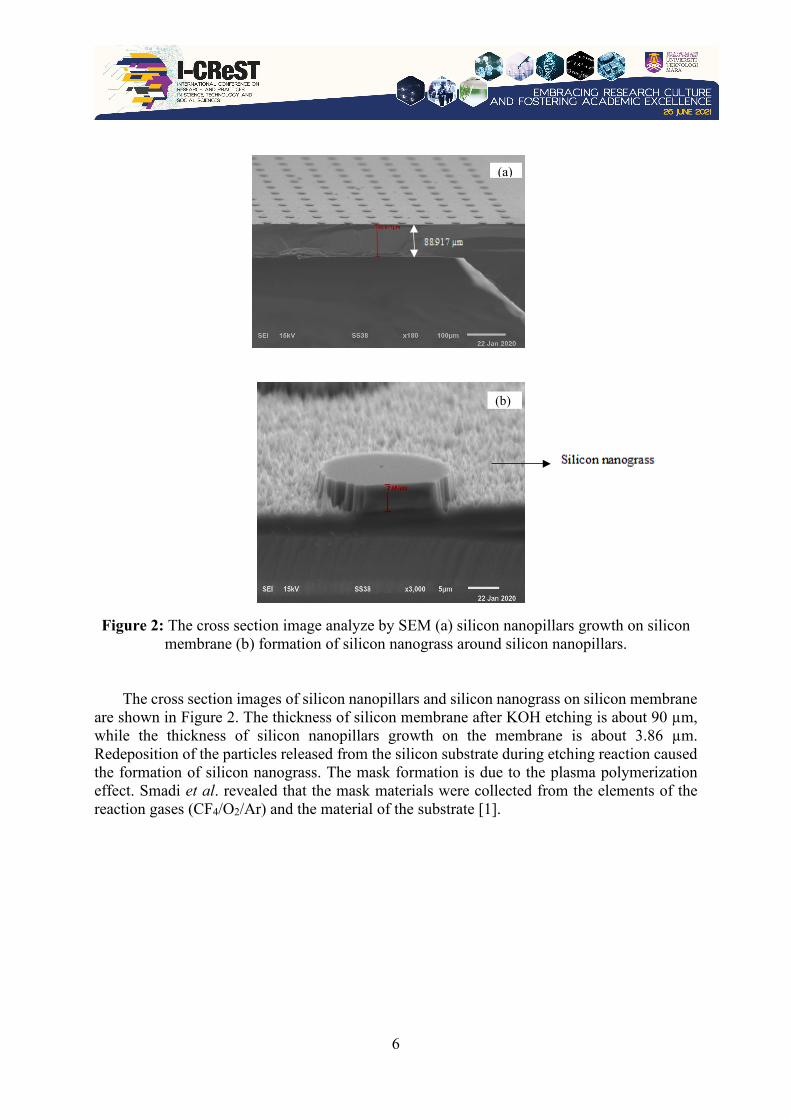
Figure 2: The cross section image analyze by SEM (a) silicon nanopillars growth on silicon
membrane (b) formation of silicon nanograss around silicon nanopillars. The cross section images of silicon nanopillars and silicon nanograss on silicon membrane
are shown in Figure 2. The thickness of silicon membrane after KOH etching is about 90 µm, while the thickness of silicon nanopillars growth on the membrane is about 3.86 µm. Redeposition of the particles released from the silicon substrate during etching reaction caused the formation of silicon nanograss. The mask formation is due to the plasma polymerization effect. Smadi et al. revealed that the mask materials were collected from the elements of the reaction gases (CF4/O2/Ar) and the material of the substrate [1].
(a)
(b)
7
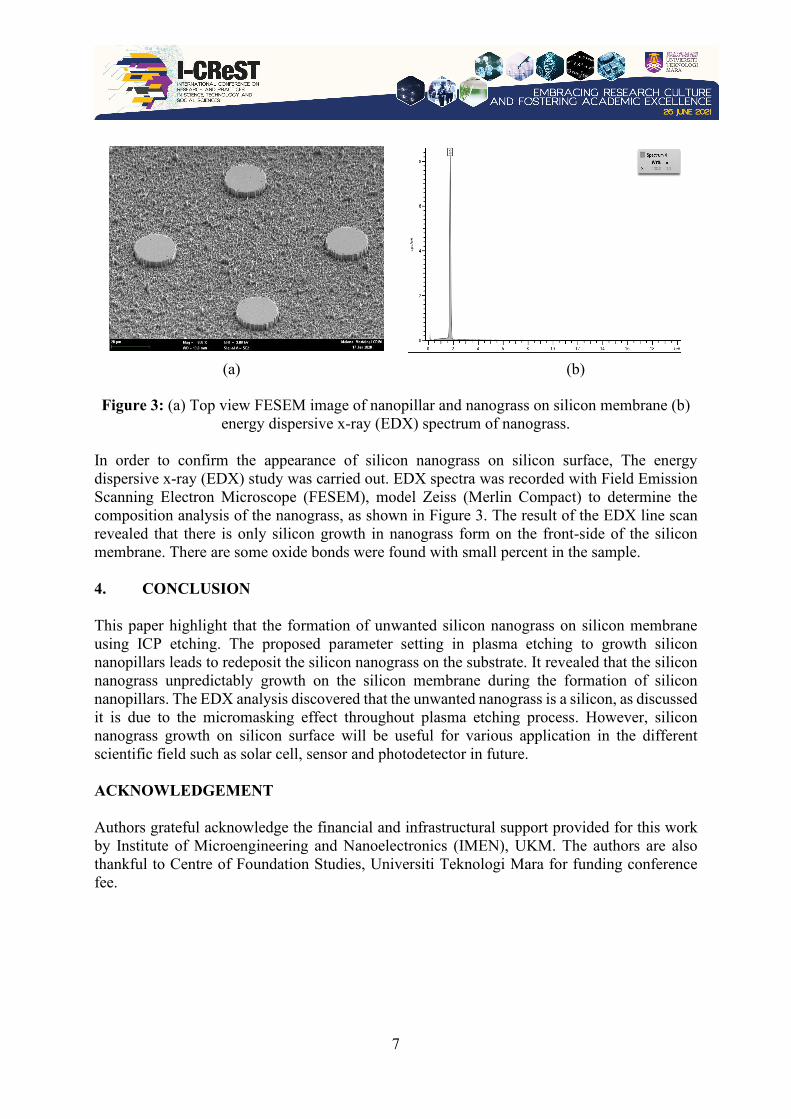
Figure 3: (a) Top view FESEM image of nanopillar and nanograss on silicon membrane (b)
energy dispersive x-ray (EDX) spectrum of nanograss. In order to confirm the appearance of silicon nanograss on silicon surface, The energy dispersive x-ray (EDX) study was carried out. EDX spectra was recorded with Field Emission Scanning Electron Microscope (FESEM), model Zeiss (Merlin Compact) to determine the composition analysis of the nanograss, as shown in Figure 3. The result of the EDX line scan revealed that there is only silicon growth in nanograss form on the front-side of the silicon membrane. There are some oxide bonds were found with small percent in the sample.
4. CONCLUSION This paper highlight that the formation of unwanted silicon nanograss on silicon membrane using ICP etching. The proposed parameter setting in plasma etching to growth silicon nanopillars leads to redeposit the silicon nanograss on the substrate. It revealed that the silicon nanograss unpredictably growth on the silicon membrane during the formation of silicon nanopillars. The EDX analysis discovered that the unwanted nanograss is a silicon, as discussed it is due to the micromasking effect throughout plasma etching process. However, silicon nanograss growth on silicon surface will be useful for various application in the different scientific field such as solar cell, sensor and photodetector in future. ACKNOWLEDGEMENT Authors grateful acknowledge the financial and infrastructural support provided for this work by Institute of Microengineering and Nanoelectronics (IMEN), UKM. The authors are also thankful to Centre of Foundation Studies, Universiti Teknologi Mara for funding conference fee.
(b) (a) (b)
8
REFERENCES [1] M. M. Smadi, “Particle Contamination of Silicon in SF6 and CF4 ∕ O2 RF Etch Plasmas,”
J. Electrochem. Soc., vol. 139, no. 11, p. 3356, 1992. [2] M. Mehran and S. Mohajerzade, “Low frequency interdigital capacitive sensor using
deep reactive ion etching and bulk micromachining of silicon,” Proc. - 2010 18th Iran. Conf. Electr. Eng. ICEE 2010, pp. 450–454, 2010.
[3] J. Shieh, S. Ravipati, F. H. Ko, and K. Ostrikov, “Plasma-made silicon nanograss and related nanostructures,” J. Phys. D. Appl. Phys., vol. 44, no. 17, 2011.
[4] G. Zhang et al., “Controlling pore size and wettability of a unique microheterogeneous copolymer film with porous structure,” Langmuir, vol. 19, no. 6, pp. 2434–2443, 2003.
[5] A. Ressine, D. Finnskog, G. Marko-Varga, and T. Laurell, “Superhydrophobic properties of nanostructured-microstructured porous silicon for improved surface-based bioanalysis,” Nanobiotechnology, vol. 4, no. 1–4, pp. 18–27, 2008.
[6] J. S. Yoo et al., “Black silicon layer formation for application in solar cells,” Sol. Energy Mater. Sol. Cells, vol. 90, no. 18–19, pp. 3085–3093, 2006.
[7] D. Das and L. Karmakar, “Autogenic single p/n-junction solar cells from black-Si nano-grass structures of p-to-n type self-converted electronic configuration,” Nanoscale, vol. 12, no. 28, pp. 15371–15382, 2020.
[8] M. Mehran, S. Mohajerzadeh, Z. Sanaee, and Y. Abdi, “Nanograss and nanostructure formation on silicon using a modified deep reactive ion etching,” Appl. Phys. Lett., vol. 96, no. 20, pp. 1–4, 2010.
[9] Z. Huang, J. E. Carey, M. Liu, X. Guo, E. Mazur, and J. C. Campbell, “Microstructured silicon photodetector,” Appl. Phys. Lett., vol. 89, no. 3, pp. 3–5, 2006.
[10] S. J. Pearton and D. P. Norton, “Dry etching of electronic oxides, polymers, and semiconductors,” Plasma Process. Polym., vol. 2, no. 1, pp. 16–37, 2005.
[11] H. Jansen, M. De Boer, R. Legtenberg, and M. Elwenspoek, “The black silicon method: A universal method for determining the parameter setting of a fluorine-based reactive ion etcher in deep silicon trench etching with profile control,” J. Micromechanics Microengineering, vol. 5, no. 2, pp. 115–120, 1995.
[12] F. Sheikhshoaei, M. Mehran, and I. Sheikhshoaei, “Effect of Nano-Textured Silicon Substrate on the Synthesize of Metal Oxides Nanostructures,” Int. J. Nanosci. Nanotechnol., vol. 13, no. 3, pp. 265–274, 2017.
[13] V. T. H. Nguyen, F. Jensen, J. Hübner, P. Leussink, and H. Jansen, “On the formation of black silicon in SF6O2 plasma: The clear, oxidize, remove, and etch (CORE) sequence and black silicon on demand,” J. Vac. Sci. Technol. A, vol. 38, no. 4, p. 043004, 2020.
9
I-CReST 2021:184-186 – Characterization of Maltodextrin-chitosan based Polymer Electrolyte with the Addition of Polymerized Ionic Liquid (PIL)
1Syaza Zaitun Akmal Binti Sabri, 2Ninie Suhana Abdul Manan, 3Mohd Fakhrul Zamani
Abdul Kadir, *1Yuhanees Mohamed Yusof
1Chemical Engineering Section, Universiti Kuala Lumpur, Malaysian Institute of Chemical & Bioengineering Technology (UniKL MICET), 78000 Alor Gajah, Malacca
2Department of Chemistry, Faculty of Science, University of Malaya, 50603 Kuala Lumpur, Malaysia
3Centre of Foundation Studies in Science, University of Malaya, 50603 Kuala Lumpur, Malaysia
*E-mail: [email protected]
ABSTRACT Liquid electrolyte is a commonly used electrolyte in electrochemical device industry. However, the potential of solid polymer electrolyte (SPE) has been widely explored due to promising performance with flexible form. This study focuses on preparation of SPE based on maltodextrin-chitosan doped with ammonium bromide (NH4Br) and polymerized ionic liquid (PIL) via solution casting method. A polymer blend electrolyte with composition of 70 wt. % of maltodextrin and 30 wt. % of chitosan (PB3) is the most amorphous blend composition which has been confirmed by X-ray diffraction (XRD) deconvolution analysis. The plasticized electrolyte containing 30 wt. % PIL (PIL3) has the highest conductivity of 2.52×10⁻³ S cm-1. The interaction between maltodextrin-chitosan-NH4Br and plasticizer is confirmed by Fourier Transform Infrared (FTIR) spectroscopy. All electrolytes exhibit a non-Debye behaviour. Thermogravimetric analysis (TGA) shows that the electrolytes are stable up to 270 ºC. Differential scanning calorimetry (DSC) analysis shows that the highest conducting electrolyte has the lowest glass transition temperature (Tg) value. Cyclic voltammetry (CV) result confirms that the specific capacitance, Csp is increased as the scan rate is reduced which proved that this polymer electrolyte is suitable to be applied in energy devices. Keywords: Maltodextrin-chitosan electrolyte; Polymerized ionic liquid; Solid polymer electrolyte; XRD deconvolution, Electrochemical Impedance Spectroscopy 1. INTRODUCTION Various applications using polymer electrolytes have been explored such as secondary batteries, fuel cells and sensors [1]. High energy density batteries, stable performance of solid state electrochemical cells and avoiding problem in leakage are few examples of advantages that polymer electrolytes can offer compared to liquid electrolyte [2,3]. It also has good mechanical properties and can be easily fabricated due to the thin film [3].
Other than synthetic polymers, natural polymers such as chitosan and methylcellulose are the main focus of researchers. The advantages such as water-soluble, biodegradable,
10
biocompatible and non-toxic are the attraction of choosing natural polymers [4]. To improve the mechanical, thermal, and conductive properties of polymers, polymer blending technique is used [2]. Polymer blend also is the easiest and cheapest technique where the physical properties can be controlled. As reported by Parameswaran & Nagarajan [5], blending two or more polymers resulting in higher mechanical strength and at the same time can offer high amorphous region compared to single polymer.
Lithium salt a well-known proton provider in polymer electrolyte field. However, the concern on the harmful of lithium salt has raised where ammonium salts come to the advantage as an alternative to replace lithium salt. Ammonium salt is a good proton donor which can exhibit specific conductivity that has five to six orders of magnitude higher than alkali salts [3,6,7].
PIL is a subclass of polymer that feature ionic liquid (IL) species in each monomer repeating unit. PIL have attracted researchers in solid polymer electrolytes due to the plasticizing effect which can enhance the performance of SPE [8]. There are various techniques that can be used to synthesize PIL. However, the best PIL depends on the type of solvent used, monomer, cross liner and initiator [7,8,9]. In this study, PIL is synthesized using 1-allyl-3-methylimidazolium bromide [AMIM]Br and ethylene glycol dimethacrylate (EGDMA) as the monomer and DMF as the solvent. A study by Ramesh & Shanti [12] has proved that the addition of PIL has increased the conductivity up to 1.75 ×10⁻³ S cm-1 [10,11,12]. Therefore, in this work the potential of PIL plasticized electrolyte is interesting to be explored and is believed that this finding will be significant in electrochemical device and polymer electrolyte industries. 2. EXPERIMENTAL METHODOLOGY Synthesis of PIL PIL was synthesized by dissolving [AMIM]Br ionic liquid (Sigma Aldrich) and EGDMA (Sigma Aldrich) in DMF (J.T. Baker). Azobisisobutyronitrile (AIBN) (Merck) were also used in synthesize of PIL as the initiator. In this study, DMF was used to dissolve ionic liquid, EGDMA and AIBN. Reflux of the mixture was done for 48 hours at 80 ºC with continuous stirring. The sample was washed with ethanol and water until it reaches pH7. The sample was dried in the oven at 55 ºC for 4 hours. Preparation of electrolytes The polymer blend sample based on different compositions of maltodextrin-chitosan as listed in Table 1 were prepared by dissolving chitosan (x g) (Sigma Aldrich) in 1 % acetic acid (50 ml) (Merck) at ambient temperature followed by dissolving maltodextrin (1-x g) (Sigma Aldrich) in DMF solvent (50 ml) at 80 ºC for 30 minutes . The two solutions were stirred continuously using a magnetic stirrer for 24 hours, until both chitosan and maltodextrin were completely dissolved. Then, these two solutions were mixed and stirred until a homogenous solution was obtained.
For the salted system preparation, chitosan (0.3 g) was dissolved in 1% acetic acid (50 ml) at ambient temperature and maltodextrin (0.7 g) was dissolved in DMF solvent (50 ml) at 80 ºC for 30 minutes. The two solutions were stirred continuously using a magnetic stirrer for 24 hours, until both chitosan and maltodextrin were completely dissolved. Then, these two

11
solutions were mixed and stirred until a homogenous solution was obtained. Different concentration of ammonium bromide (NH4Br) (Sigma Aldrich) was added into maltodextrin-chitosan mixture. The compositions can be referred in Table 1. The maltodextrin-chitosan-NH4Br solutions (salted system) were stirred until completely dissolved.
For the plasticized electrolytes preparation, different compositions of PIL as listed in Table 1 were added into the system and stirred until completely dissolved. The maltodextrin-chitosan-NH4Br-PIL solutions (plasticized system) were then poured into petri dishes and left to dry in an oven at 45 ºC for 24 hours. The dried samples were kept in a desiccator containing silica gel to avoid the presence of water prior to sample characterizations.
Table 1: Composition for polymer blend, salted and plasticized systems. Samples Maltodextrin:Chitosan NH4Br composition
(wt. %)
PIL composition (wt. %)
PB0 100:0 0 0
PB3 70:30 0 0
PB5 50:50 0 0
PB7 30:70 0 0
PB10 0:100 0 0
S1 70:30 10 0
S2 70:30 20 0
S3 70:30 30 0
S4 70:30 40 0
PIL1 70:30 20 10
PIL2 70:30 20 20
PIL3 70:30 20 30
PIL4 70:30 20 40
PIL5 70:30 20 50
Electrolyte characterization Polymer electrolyte with a good system should contain higher amorphous region compared to crystalline region since the ions are mobile in amorphous phase which can be studied based on XRD analysis. XRD analysis was carried out by using Siemens D5000 X-ray diffractometer (1.5406 Å). The angle 2θ was verified from 5° to 80° at a resolution of 0.1°. Deconvolution of XRD analysis was done using Origin9 software and the degree of crystallinity, Xc was calculated using equation (1) where Ac and AT were the areas of crystalline and total hump, respectively. Xc= Ac
AT×100% (1)
12
FESEM was used to study the surface morphology of the electrolytes at room temperature using Hitachi SU8220. FESEM study was done at ×1000 magnification. The HIOKI 3532–50 LCR Hi-Tester was used to analyze ionic conductivity via Electrical Impedance Spectroscopy (EIS) in range of 50 Hz to 5 MHz. The sample was cut into suitable size and placed between two stainless steels of the sample holder. Data for real (Zr) and imaginary (Zi) impedance at various frequencies were recorded. Equation (2) below was the formula used to calculate ionic conductivity of SPE where, y is a thickness of the sample, Rb is the bulk resistance and A is the cross-sectional area. σ = y
RbA (2)
FTIR spectroscopy was used to study the complexation between the polymer blend and
ammonium salt. FTIR spectroscopy spectra were recorded using the Spotlight 400 Perkin-Elmer spectrometer in the wavenumber range of 400 – 4000 cm-1. TGA was conducted using STA 6000 Perkin-Elmer thermal analyzer from 25 ºC to 500 ºC with a heating rate of 20 ºC min-1 under nitrogen atmosphere. From TGA analysis, the decomposition temperatures of electrolytes can be determined. DSC was conducted using TA Instruments Q200. The electrolytes were sealed and heated from -50 °C to 350 °C with heating and cooling rate at 10 °C min-1. Electrodes of the cyclic voltammetry (CV) were prepared using the carbon electrodes where 0.25 g of carbon black was dry-combined with 3.25 g of activated carbon powder by a planetary ball miller at a 500 r/min rotational speed for 15 min. 15 mL of N-methyl pyrolidone (NMP) solvent was used to dissolve 0.50 g of polyvinylidene fluoride (PVdF) at room temperature. The activated carbon-carbon black powder was then dissolved in the PVdF-NMP solution for 90 min. The homogeneous solution was coated on aluminum foil and then dried in an oven for 120 min at 60 ◦C. The dried electrodes (thickness = 0.01 cm) were kept in a desiccator filled with silica gel to remove extra moisture. The electrolyte was placed between two carbon electrodes and packed in coin cells. The CV measurement was carried out using a potentiostat (Digi-IVY DY2300) to identify the specific capacitance (Cs) at different scan rates (2 to 20 mV s −1). The range of voltage applied was between 0.0 and 0.9 V and the Cs was obtained using equation (3) below:
Csp =∫ I(V) dvv2v1
2 (v2−v1)mv (3)
where m is the mass of active materials, (v2 – v1) is the voltage range, ∫ I(V) dvv2
v1 is the area of
CV plot and v is the scan rate. 3. RESULTS AND DISCUSSION XRD analysis X-ray diffraction (XRD) studies have been carried out to investigate the occurrence of complex formation of the polymer blend and the degree of crystallinity of the polymer complex [3]. Figure 1 shows the XRD patterns and deconvolution of XRD for selected maltodextrin-chitosan blend.
13
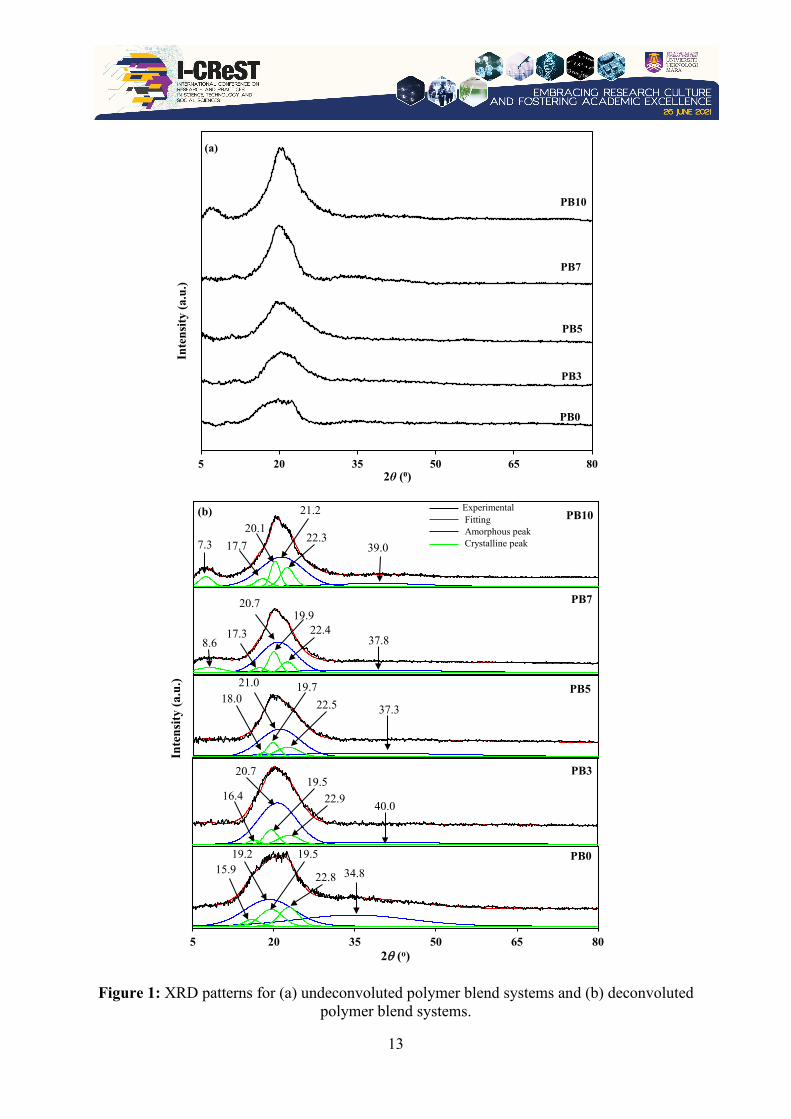
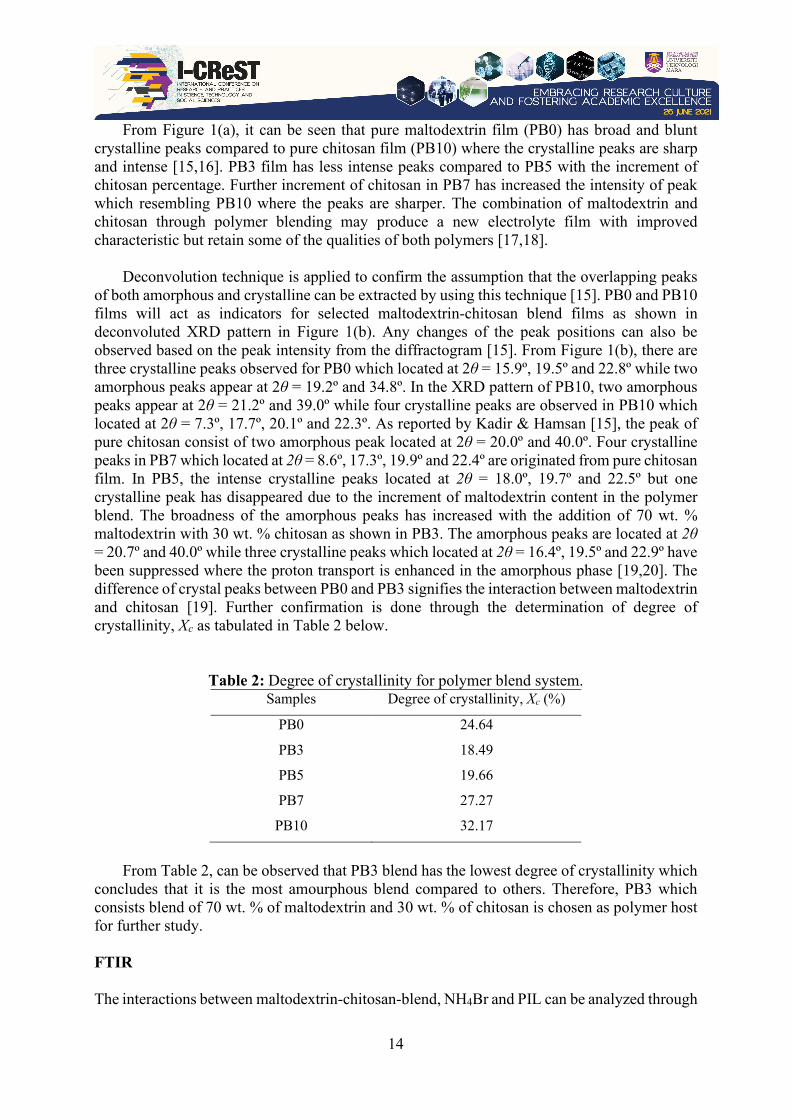
Figure 1: XRD patterns for (a) undeconvoluted polymer blend systems and (b) deconvoluted polymer blend systems.
(a)
5 20 35 50 65 80
Inte
nsity
(a.u
.)
2θ (⁰)
PB0
PB3
PB5
PB7
PB10
Inte
nsity
(a.u
.)
PB3
PB5
PB7
PB10
16.4
20.719.5
22.9 40.0
18.021.0 19.7
22.5 37.3
8.617.3
20.719.9
22.437.8
7.3 17.7
21.220.1
22.339.0
(b)
5 20 35 50 65 802θ (o)
15.919.2 19.5
22.8 34.8PB0
ExperimentalFittingAmorphous peakCrystalline peak
14
From Figure 1(a), it can be seen that pure maltodextrin film (PB0) has broad and blunt crystalline peaks compared to pure chitosan film (PB10) where the crystalline peaks are sharp and intense [15,16]. PB3 film has less intense peaks compared to PB5 with the increment of chitosan percentage. Further increment of chitosan in PB7 has increased the intensity of peak which resembling PB10 where the peaks are sharper. The combination of maltodextrin and chitosan through polymer blending may produce a new electrolyte film with improved characteristic but retain some of the qualities of both polymers [17,18].
Deconvolution technique is applied to confirm the assumption that the overlapping peaks
of both amorphous and crystalline can be extracted by using this technique [15]. PB0 and PB10 films will act as indicators for selected maltodextrin-chitosan blend films as shown in deconvoluted XRD pattern in Figure 1(b). Any changes of the peak positions can also be observed based on the peak intensity from the diffractogram [15]. From Figure 1(b), there are three crystalline peaks observed for PB0 which located at 2θ = 15.9º, 19.5º and 22.8º while two amorphous peaks appear at 2θ = 19.2º and 34.8º. In the XRD pattern of PB10, two amorphous peaks appear at 2θ = 21.2º and 39.0º while four crystalline peaks are observed in PB10 which located at 2θ = 7.3º, 17.7º, 20.1º and 22.3º. As reported by Kadir & Hamsan [15], the peak of pure chitosan consist of two amorphous peak located at 2θ = 20.0º and 40.0º. Four crystalline peaks in PB7 which located at 2θ = 8.6º, 17.3º, 19.9º and 22.4º are originated from pure chitosan film. In PB5, the intense crystalline peaks located at 2θ = 18.0º, 19.7º and 22.5º but one crystalline peak has disappeared due to the increment of maltodextrin content in the polymer blend. The broadness of the amorphous peaks has increased with the addition of 70 wt. % maltodextrin with 30 wt. % chitosan as shown in PB3. The amorphous peaks are located at 2θ = 20.7º and 40.0º while three crystalline peaks which located at 2θ = 16.4º, 19.5º and 22.9º have been suppressed where the proton transport is enhanced in the amorphous phase [19,20]. The difference of crystal peaks between PB0 and PB3 signifies the interaction between maltodextrin and chitosan [19]. Further confirmation is done through the determination of degree of crystallinity, Xc as tabulated in Table 2 below.
Table 2: Degree of crystallinity for polymer blend system. Samples Degree of crystallinity, Xc (%)
PB0 24.64
PB3 18.49
PB5 19.66
PB7 27.27
PB10 32.17
From Table 2, can be observed that PB3 blend has the lowest degree of crystallinity which
concludes that it is the most amourphous blend compared to others. Therefore, PB3 which consists blend of 70 wt. % of maltodextrin and 30 wt. % of chitosan is chosen as polymer host for further study. FTIR The interactions between maltodextrin-chitosan-blend, NH4Br and PIL can be analyzed through
15
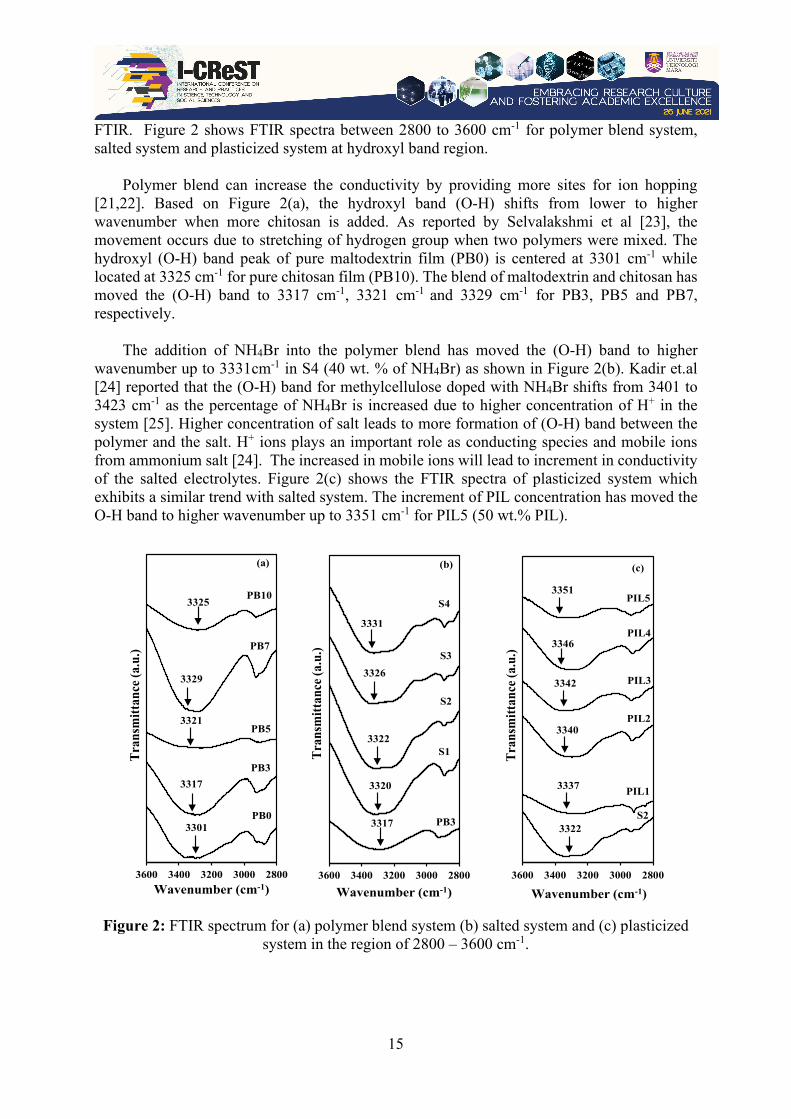
FTIR. Figure 2 shows FTIR spectra between 2800 to 3600 cm-1 for polymer blend system, salted system and plasticized system at hydroxyl band region.
Polymer blend can increase the conductivity by providing more sites for ion hopping [21,22]. Based on Figure 2(a), the hydroxyl band (O-H) shifts from lower to higher wavenumber when more chitosan is added. As reported by Selvalakshmi et al [23], the movement occurs due to stretching of hydrogen group when two polymers were mixed. The hydroxyl (O-H) band peak of pure maltodextrin film (PB0) is centered at 3301 cm-1 while located at 3325 cm-1 for pure chitosan film (PB10). The blend of maltodextrin and chitosan has moved the (O-H) band to 3317 cm-1, 3321 cm-1 and 3329 cm-1 for PB3, PB5 and PB7, respectively.
The addition of NH4Br into the polymer blend has moved the (O-H) band to higher wavenumber up to 3331cm-1 in S4 (40 wt. % of NH4Br) as shown in Figure 2(b). Kadir et.al [24] reported that the (O-H) band for methylcellulose doped with NH4Br shifts from 3401 to 3423 cm-1 as the percentage of NH4Br is increased due to higher concentration of H+ in the system [25]. Higher concentration of salt leads to more formation of (O-H) band between the polymer and the salt. H+ ions plays an important role as conducting species and mobile ions from ammonium salt [24]. The increased in mobile ions will lead to increment in conductivity of the salted electrolytes. Figure 2(c) shows the FTIR spectra of plasticized system which exhibits a similar trend with salted system. The increment of PIL concentration has moved the O-H band to higher wavenumber up to 3351 cm-1 for PIL5 (50 wt.% PIL).
Figure 2: FTIR spectrum for (a) polymer blend system (b) salted system and (c) plasticized
system in the region of 2800 – 3600 cm-1.
28003000320034003600
Tran
smitt
ance
(a.u
.)
Wavenumber (cm-1)
PB0
PB3
PB5
PB7
PB10
3301
3317
3321
3329
3325
(a)
28003000320034003600
Tran
smitt
ance
(a.u
.)
Wavenumber (cm-1)
3317
3320
3322
3326
3331
PB3
S1
S2
S3
(b)
S4
28003000320034003600
Tran
smitt
ance
(a.u
.)
Wavenumber (cm-1)
PIL1
PIL2
PIL3
PIL4
PIL5
S23322
3340
3342
3346
3351
3337
(c)

16
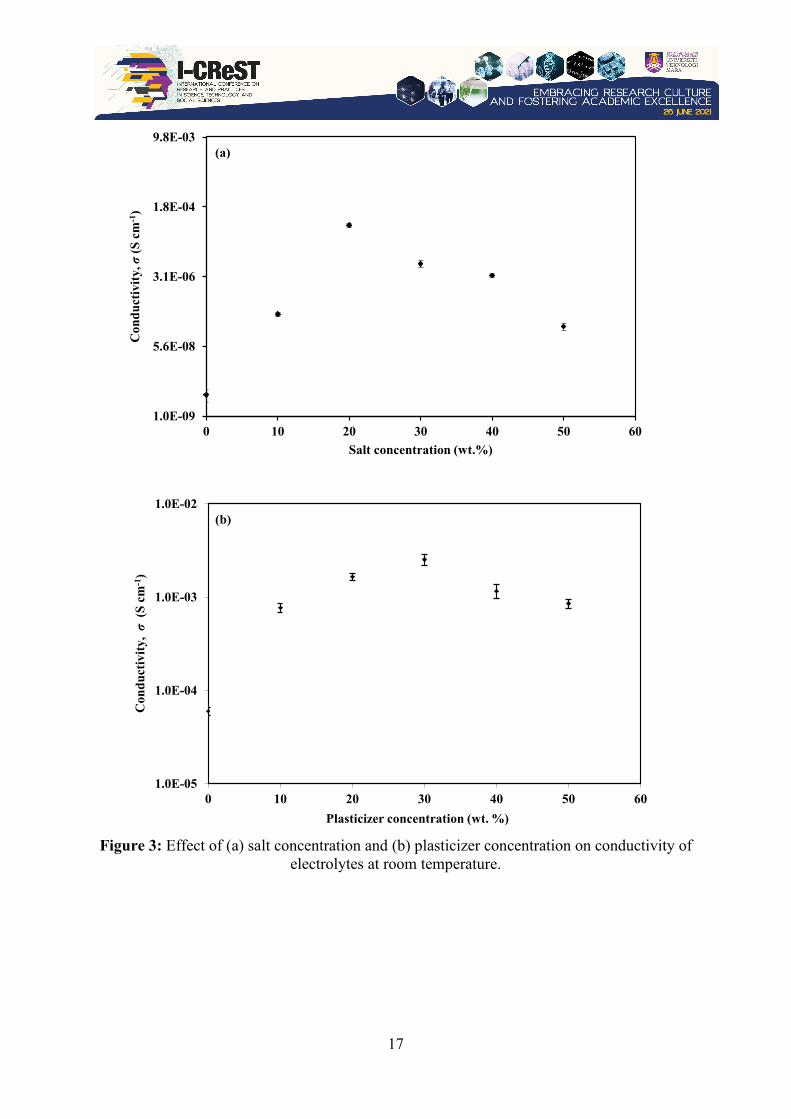
Conductivity analysis Figure 3(a) shows the conductivity study of salted system at room temperature.
H+ ion acts as ionic conducting species which is one of the factors that strongly affect the conductivity [22]. The addition of NH4Br up to 20 wt. % has increased the conductivity of polymer blend electrolyte from 3.43×10⁻⁹ S cm-1 for PB3 to 6.11×10⁻⁵ S cm-1 for S2. The conductivity shows increment trend as the concentration of salt increases due to large amount of mobile charge carriers. However, the addition of more than 20 wt. % of NH4Br leads to conductivity reduction since the polymer host is unable to accommodate the ions which brings to ions recombination and aggregation [22,26]. A study reported by Shukur et al [27] on chitosan-NH4Br system exhibited a conductivity of 4.38×10⁻⁷ S cm-1 which is comparable with the current study.
PIL is the polymerized IL that consist almost all features of IL. Moreover, PIL has flexible
architecture where it can be easily re-designed by both the polymer back bone and outer ion [28]. In this study, PIL plays the role as plasticizer is added to the salted system to enhance the conductivity. The result is shown in Figure 3(b) where, the conductivity increases up to 2.52×10⁻³ S cm-1 for PIL3 (30 wt. % of PIL). This proves that PIL can promote ionic conductivity. However, at 40 wt. % and 50 wt. % of PIL, the conductivity starts to decrease. At this PIL concentration, the molecules within the PIL and the polymer blend interact with each other which leads to ions recombination [27]. The comparison with other studies has been tabulated in Table 3.
17
Figure 3: Effect of (a) salt concentration and (b) plasticizer concentration on conductivity of
electrolytes at room temperature.
1.0E-05
1.0E-04
1.0E-03
1.0E-02
0 10 20 30 40 50 60
Con
duct
ivity
, σ
(S c
m-1
)
Plasticizer concentration (wt. %)
(b)
1.0E-09
5.6E-08
3.1E-06
1.8E-04
9.8E-03
0 10 20 30 40 50 60
Con
duct
ivity
,σ(S
cm
-1)
Salt concentration (wt.%)
(a)
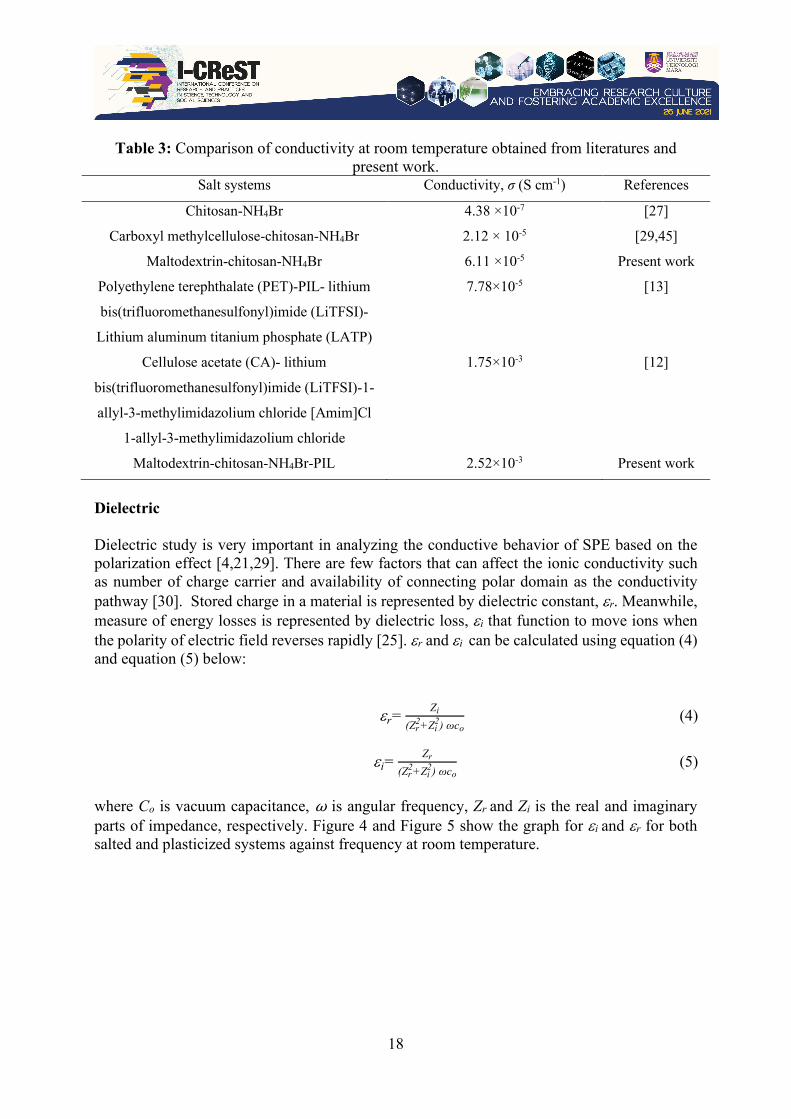
18
Table 3: Comparison of conductivity at room temperature obtained from literatures and
present work. Salt systems Conductivity, σ (S cm-1) References
Chitosan-NH4Br 4.38 ×10⁻⁷ [27]
Carboxyl methylcellulose-chitosan-NH4Br 2.12 × 10⁻⁵ [29,45]
Maltodextrin-chitosan-NH4Br 6.11 ×10⁻⁵ Present work
Polyethylene terephthalate (PET)-PIL- lithium
bis(trifluoromethanesulfonyl)imide (LiTFSI)-
Lithium aluminum titanium phosphate (LATP)
7.78×10⁻⁵ [13]
Cellulose acetate (CA)- lithium
bis(trifluoromethanesulfonyl)imide (LiTFSI)-1-
allyl-3-methylimidazolium chloride [Amim]Cl
1-allyl-3-methylimidazolium chloride
1.75×10⁻³ [12]
Maltodextrin-chitosan-NH4Br-PIL 2.52×10⁻³ Present work
Dielectric Dielectric study is very important in analyzing the conductive behavior of SPE based on the polarization effect [4,21,29]. There are few factors that can affect the ionic conductivity such as number of charge carrier and availability of connecting polar domain as the conductivity pathway [30]. Stored charge in a material is represented by dielectric constant, εr. Meanwhile, measure of energy losses is represented by dielectric loss, εi that function to move ions when the polarity of electric field reverses rapidly [25]. εr and εi can be calculated using equation (4) and equation (5) below:
εr=Zi
(Zr2+Zi
2) ωco (4)
εi=Zr
(Zr2+Zi
2) ωco (5)
where Co is vacuum capacitance, ω is angular frequency, Zr and Zi is the real and imaginary parts of impedance, respectively. Figure 4 and Figure 5 show the graph for εi and εr for both salted and plasticized systems against frequency at room temperature.
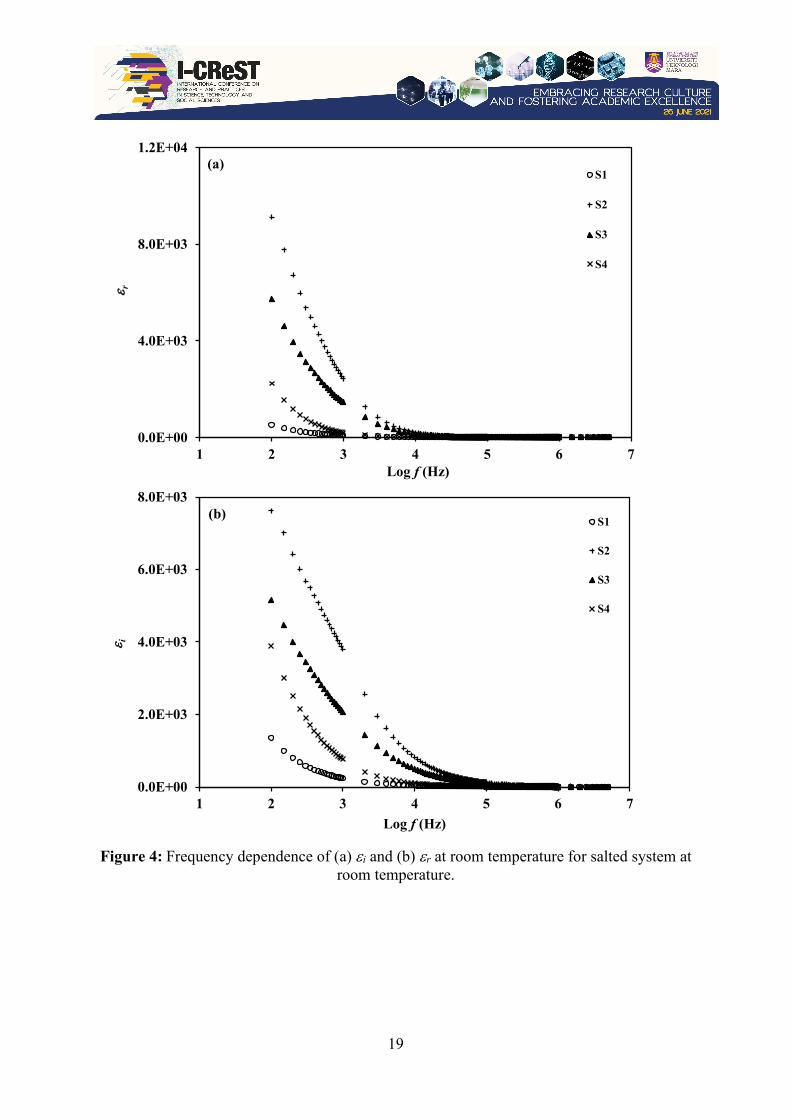
19
Figure 4: Frequency dependence of (a) εi and (b) εr at room temperature for salted system at
room temperature.
0.0E+00
4.0E+03
8.0E+03
1.2E+04
1 2 3 4 5 6 7
ε r
Log f (Hz)
S1
S2
S3
S4
0.0E+00
2.0E+03
4.0E+03
6.0E+03
8.0E+03
1 2 3 4 5 6 7
ε i
Log f (Hz)
S1
S2
S3
S4
(a)
(b)
20
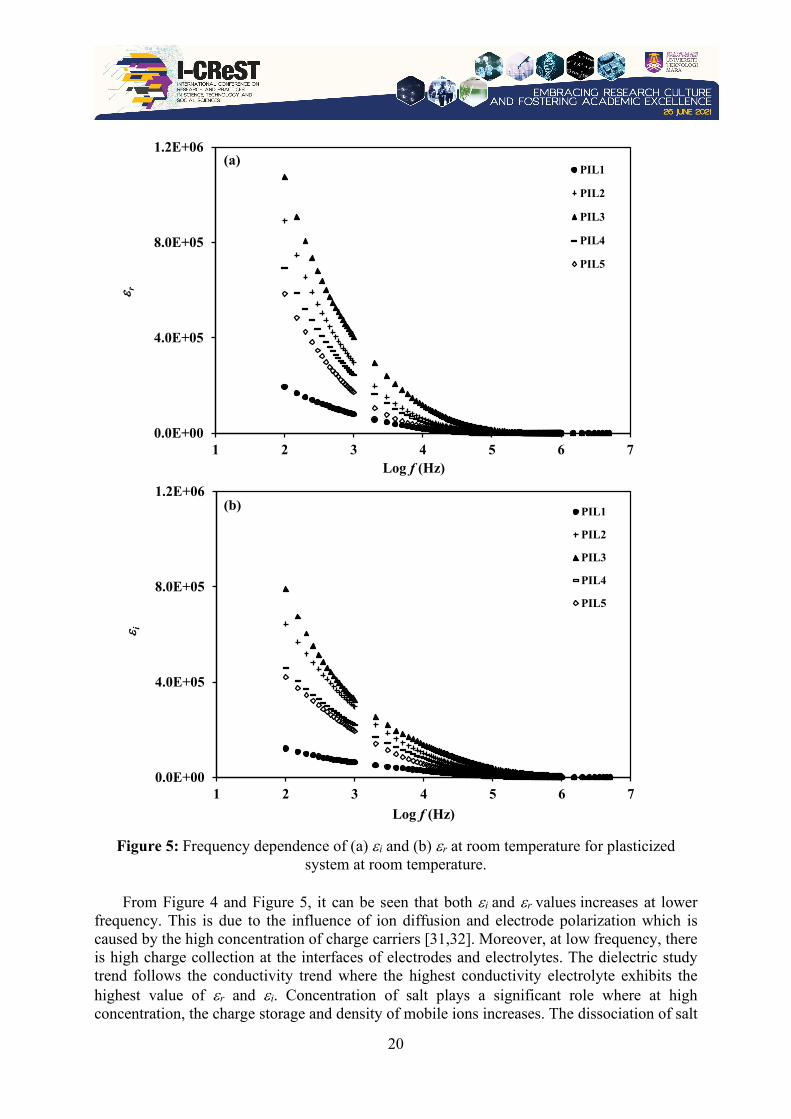
Figure 5: Frequency dependence of (a) εi and (b) εr at room temperature for plasticized
system at room temperature.
From Figure 4 and Figure 5, it can be seen that both εi and εr values increases at lower frequency. This is due to the influence of ion diffusion and electrode polarization which is caused by the high concentration of charge carriers [31,32]. Moreover, at low frequency, there is high charge collection at the interfaces of electrodes and electrolytes. The dielectric study trend follows the conductivity trend where the highest conductivity electrolyte exhibits the highest value of εr and εi. Concentration of salt plays a significant role where at high concentration, the charge storage and density of mobile ions increases. The dissociation of salt
0.0E+00
4.0E+05
8.0E+05
1.2E+06
1 2 3 4 5 6 7
ε r
Log f (Hz)
PIL1
PIL2
PIL3
PIL4
PIL5
0.0E+00
4.0E+05
8.0E+05
1.2E+06
1 2 3 4 5 6 7
ε i
Log f (Hz)
PIL1
PIL2
PIL3
PIL4
PIL5
(a)
(b)
21
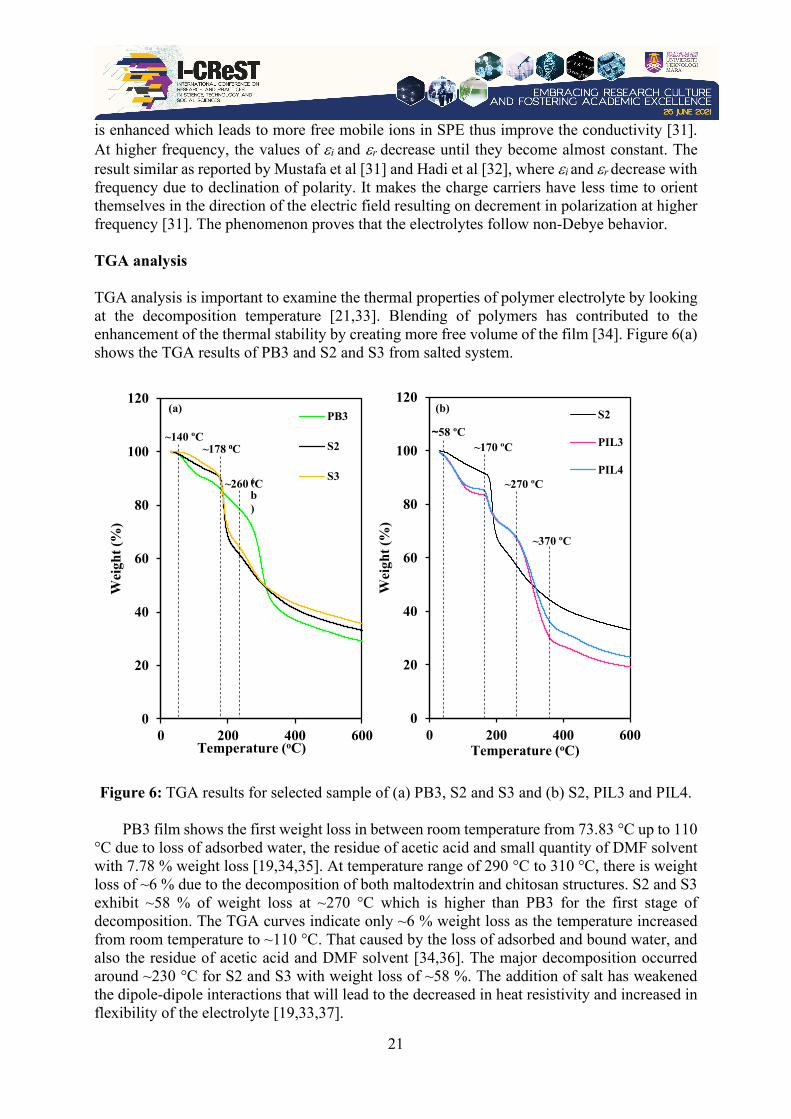
is enhanced which leads to more free mobile ions in SPE thus improve the conductivity [31]. At higher frequency, the values of εi and εr decrease until they become almost constant. The result similar as reported by Mustafa et al [31] and Hadi et al [32], where εi and εr decrease with frequency due to declination of polarity. It makes the charge carriers have less time to orient themselves in the direction of the electric field resulting on decrement in polarization at higher frequency [31]. The phenomenon proves that the electrolytes follow non-Debye behavior. TGA analysis TGA analysis is important to examine the thermal properties of polymer electrolyte by looking at the decomposition temperature [21,33]. Blending of polymers has contributed to the enhancement of the thermal stability by creating more free volume of the film [34]. Figure 6(a) shows the TGA results of PB3 and S2 and S3 from salted system.
Figure 6: TGA results for selected sample of (a) PB3, S2 and S3 and (b) S2, PIL3 and PIL4.
PB3 film shows the first weight loss in between room temperature from 73.83 °C up to 110 °C due to loss of adsorbed water, the residue of acetic acid and small quantity of DMF solvent with 7.78 % weight loss [19,34,35]. At temperature range of 290 °C to 310 °C, there is weight loss of ~6 % due to the decomposition of both maltodextrin and chitosan structures. S2 and S3 exhibit ~58 % of weight loss at ~270 °C which is higher than PB3 for the first stage of decomposition. The TGA curves indicate only ~6 % weight loss as the temperature increased from room temperature to ~110 °C. That caused by the loss of adsorbed and bound water, and also the residue of acetic acid and DMF solvent [34,36]. The major decomposition occurred around ~230 °C for S2 and S3 with weight loss of ~58 %. The addition of salt has weakened the dipole-dipole interactions that will lead to the decreased in heat resistivity and increased in flexibility of the electrolyte [19,33,37].
0
20
40
60
80
100
120
0 200 400 600
Wei
ght (
%)
Temperature (oC)
PB3
S2
S3
0
20
40
60
80
100
120
0 200 400 600
Wei
ght (
%)
Temperature (oC)
S2
PIL3
PIL4
~58 ºC~170 ºC
~370 ºC
~270 ºC
(b)(a)
(b)
~140 ºC~178 ⁰C
~260 ⁰C

22
Figure 6(b) shows TGA curves for S2 and PIL3 and PIL4 from plasticized system. Initial
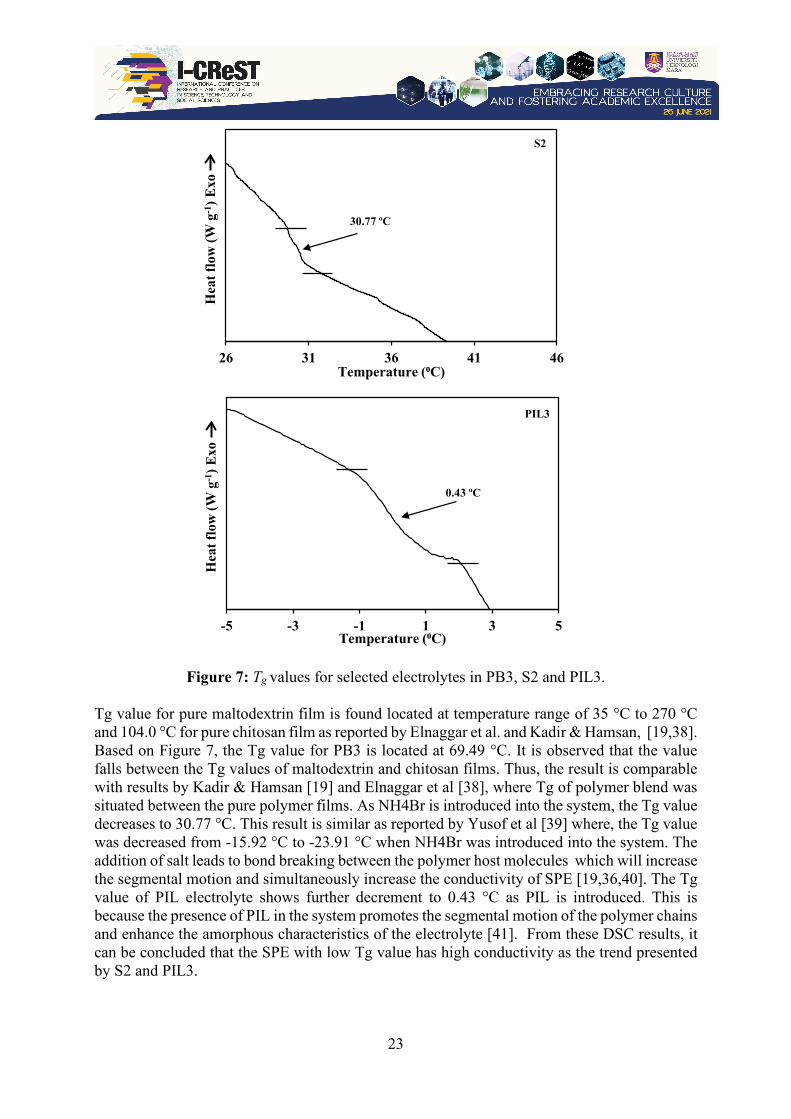
weight loss of ~13 % at temperature of ~58 °C exhibited by PIL3 and PIL4. The TGA curves for PIL3 and PIL4 show two steps of major weight loss. The first step occur at temperature range of ~165 °C to ~270 °C as reported by Farzin et al [36] where, this region is related to decompose of imidazole groups. The second step occurs at temperature range of 350 °C to 450 °C due to the decomposition of polymer backbone [36]. These results prove that the SPE films which added with salt and PIL are thermally stable up to 270 °C and retain 25-40% weight upon reaching 600 °C. DSC analysis Glass transition temperature, Tg can be determined from DSC analysis where the Tg values for PB3, S2 and PIL3 are shown in Figure 7.
50 60 70 80 90
Hea
t flo
w (W
g-1
) Exo
Temperature (⁰C)
69.49 ºC
PB3
23
Figure 7: Tg values for selected electrolytes in PB3, S2 and PIL3.
Tg value for pure maltodextrin film is found located at temperature range of 35 °C to 270 °C and 104.0 °C for pure chitosan film as reported by Elnaggar et al. and Kadir & Hamsan, [19,38]. Based on Figure 7, the Tg value for PB3 is located at 69.49 °C. It is observed that the value falls between the Tg values of maltodextrin and chitosan films. Thus, the result is comparable with results by Kadir & Hamsan [19] and Elnaggar et al [38], where Tg of polymer blend was situated between the pure polymer films. As NH4Br is introduced into the system, the Tg value decreases to 30.77 °C. This result is similar as reported by Yusof et al [39] where, the Tg value was decreased from -15.92 °C to -23.91 °C when NH4Br was introduced into the system. The addition of salt leads to bond breaking between the polymer host molecules which will increase the segmental motion and simultaneously increase the conductivity of SPE [19,36,40]. The Tg value of PIL electrolyte shows further decrement to 0.43 °C as PIL is introduced. This is because the presence of PIL in the system promotes the segmental motion of the polymer chains and enhance the amorphous characteristics of the electrolyte [41]. From these DSC results, it can be concluded that the SPE with low Tg value has high conductivity as the trend presented by S2 and PIL3.
26 31 36 41 46
Hea
t flo
w (W
g-1
) Exo
Temperature (⁰C)
30.77 ºC
S2
-5 -3 -1 1 3 5
Hea
t flo
w (W
g-1
) Exo
Temperature (⁰C)
0.43 ºC
PIL3

24
Cyclic voltammetry CV is used to determine the electrochemical performance of SPEs to study the electrolyte potential in device fabrication. The CV curves for S2 and PIL3 are plotted in Figure 8(a) and (b) respectively at scan rates of 100 and 200 mVs-1.
Figure 8: Plots of cyclic voltammetry at various scan rate for (a) S2 and (b) PIL3.
-0.06
-0.04
-0.02
0
0.02
0.04
0.06
0 0.2 0.4 0.6 0.8 1
Cur
rent
den
sity
(mA
cm
-2)
Potential (V)
100 mV/s
200 mV/s
(a)
-8
-6
-4
-2
0
2
4
6
8
0 0.2 0.4 0.6 0.8 1
Cur
rent
den
sity
(mA
cm
-2)
Potential (V)
100 mV/s
200 mV/s
(b)
25
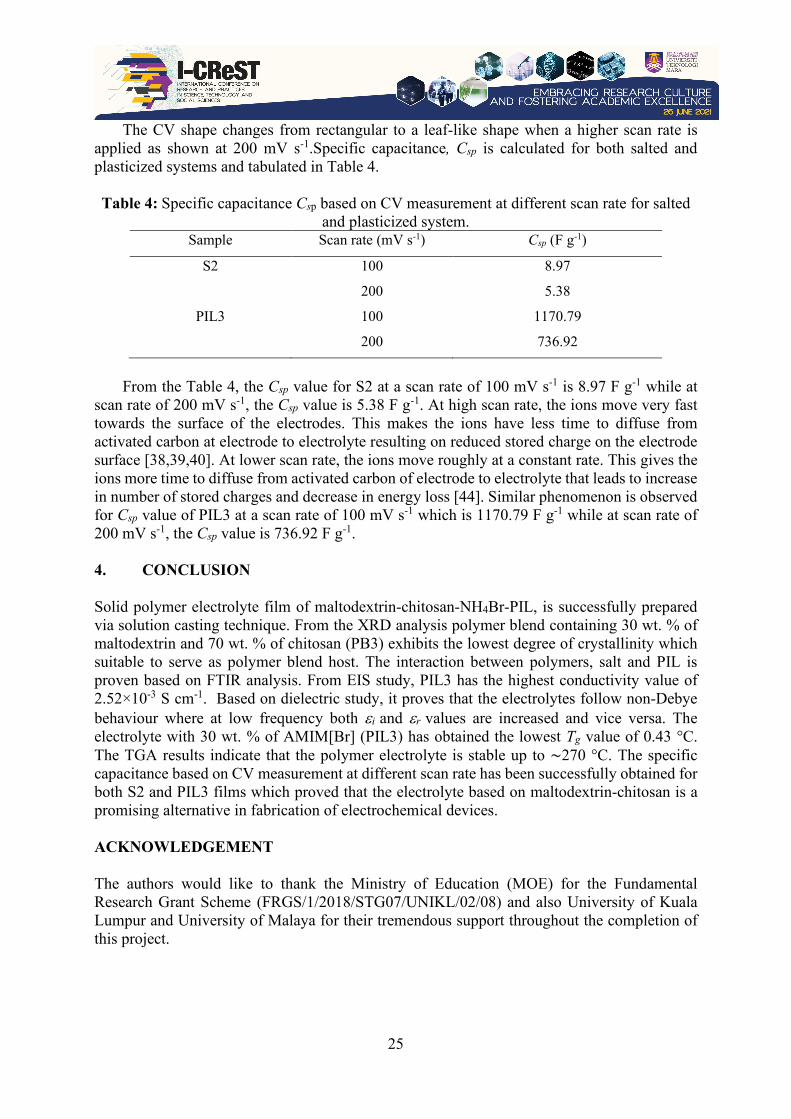
The CV shape changes from rectangular to a leaf-like shape when a higher scan rate is applied as shown at 200 mV s-1.Specific capacitance, Csp is calculated for both salted and plasticized systems and tabulated in Table 4. Table 4: Specific capacitance Csp based on CV measurement at different scan rate for salted
and plasticized system. Sample Scan rate (mV s-1) Csp (F g-1)
S2 100 8.97
200 5.38
PIL3 100 1170.79
200 736.92
From the Table 4, the Csp value for S2 at a scan rate of 100 mV s-1 is 8.97 F g-1 while at
scan rate of 200 mV s-1, the Csp value is 5.38 F g-1. At high scan rate, the ions move very fast towards the surface of the electrodes. This makes the ions have less time to diffuse from activated carbon at electrode to electrolyte resulting on reduced stored charge on the electrode surface [38,39,40]. At lower scan rate, the ions move roughly at a constant rate. This gives the ions more time to diffuse from activated carbon of electrode to electrolyte that leads to increase in number of stored charges and decrease in energy loss [44]. Similar phenomenon is observed for Csp value of PIL3 at a scan rate of 100 mV s-1 which is 1170.79 F g-1 while at scan rate of 200 mV s-1, the Csp value is 736.92 F g-1. 4. CONCLUSION Solid polymer electrolyte film of maltodextrin-chitosan-NH4Br-PIL, is successfully prepared via solution casting technique. From the XRD analysis polymer blend containing 30 wt. % of maltodextrin and 70 wt. % of chitosan (PB3) exhibits the lowest degree of crystallinity which suitable to serve as polymer blend host. The interaction between polymers, salt and PIL is proven based on FTIR analysis. From EIS study, PIL3 has the highest conductivity value of 2.52×10⁻³ S cm-1. Based on dielectric study, it proves that the electrolytes follow non-Debye behaviour where at low frequency both εi and εr values are increased and vice versa. The electrolyte with 30 wt. % of AMIM[Br] (PIL3) has obtained the lowest Tg value of 0.43 °C. The TGA results indicate that the polymer electrolyte is stable up to ∼270 °C. The specific capacitance based on CV measurement at different scan rate has been successfully obtained for both S2 and PIL3 films which proved that the electrolyte based on maltodextrin-chitosan is a promising alternative in fabrication of electrochemical devices. ACKNOWLEDGEMENT The authors would like to thank the Ministry of Education (MOE) for the Fundamental Research Grant Scheme (FRGS/1/2018/STG07/UNIKL/02/08) and also University of Kuala Lumpur and University of Malaya for their tremendous support throughout the completion of this project.

26
REFERENCES [1] Sciencedirect S, Symposium I and Electrolytes P 2011 Electrochimica Acta Polymer
electrolytes : Present , past and future 57 4–13 [2] Zhang H and Shen P K 2012 Recent development of polymer electrolyte membranes for
fuel cells Chem. Rev. 112 2780–832 [3] Nithya S, Selvasekarapandian S, Karthikeyan S, Inbavalli D, Sikkinthar S and
Sanjeeviraja C 2014 AC impedance studies on proton-conducting PAN : NH4SCN polymer electrolytes Ionics (Kiel). 20 1391–8
[4] Salman Y A K, Abdullah O G, Hanna R R and Aziz S B 2018 Conductivity and electrical properties of chitosan - methylcellulose blend biopolymer electrolyte incorporated with lithium tetrafluoroborate Int. J. Electrochem. Sci. 13 3185–99
[5] Parameswaran V and Nagarajan E R 2018 Antibacterial Activity and Conductivity Studies of CoS Nanoparticles Incorporated in PVA/PVP/NH 4 Br Electrolyte J. Nanosci. Nanotechnol. 19 2522–36
[6] Maheshwari T, Tamilarasan K, Selvasekarapandian S, Chitra R and Kiruthika S 2021 Investigation of blend biopolymer electrolytes based on Dextran-PVA with ammonium thiocyanate J. Solid State Electrochem. 25 755–65
[7] Saeed M A M and Abdullah O G 2021 Effect of Structural Features on Ionic Conductivity and Dielectric Response of PVA Proton Conductor-Based Solid Polymer Electrolytes J. Electron. Mater. 50 432–42
[8] Yuan J, Mecerreyes D and Antonietti M 2013 Poly(ionic liquid)s: An update Prog. Polym. Sci. 38 1009–36
[9] Field C 2010 Modern Polymerization Techniques vol 5 [10] Mori H, Yanagi M and Endo T 2009 RAFT polymerization of N-vinylimidazolium salts
and synthesis of thermoresponsive ionic liquid block copolymers Macromolecules 42 8082–92
[11] Hadjichristidis N and Hirao A 2015 Anionic Polymerization: Principles, Practice, Strength, Consequences and Applications Anionic Polym. Princ. Pract. Strength, Consequences Appl. 1–1082
[12] Ramesh S, Shanti R and Morris E 2012 Plasticizing effect of 1-allyl-3-methylimidazolium chloride in cellulose acetate based polymer electrolytes Carbohydr. Polym. 87 2624–9
[13] Ma F, Zhang Z, Yan W, Ma X, Sun D, Jin Y, Chen X and He K 2019 Solid Polymer Electrolyte Based on Polymerized Ionic Liquid for High Performance All-Solid-State Lithium-Ion Batteries ACS Sustain. Chem. Eng. 7 4675–83
[14] Chaves F A and Jiménez D 2018 Ac ce d M us pt Nanotechnology 29 [15] Aziz S B, Brza M A, Brevik I, Hafiz M H, Asnawi A S F M, Yusof Y M, Abdulwahid
R T and Kadir M F Z 2020 Blending and characteristics of electrochemical double-layer capacitor device assembled from plasticized proton ion conducting chitosan:Dextran:NH4PF6 polymer electrolytes Polymers (Basel). 12
[16] Hamsan M H, Aziz S B, Nofal M M, Brza M A, Abdulwahid R T, Hadi J M, Karim W O and Kadir M F Z 2020 Characteristics of EDLC device fabricated from plasticized chitosan:MgCl2 based polymer electrolyte J. Mater. Res. Technol. 9 10635–46
[17] Cholant C M, Rodrigues M P, Peres L L, Balboni R D C, Krüger L U, Placido D N, Flores W H, Gündel A, Pawlicka A and Avellaneda C O 2020 Study of the conductivity of solid polymeric electrolyte based on PVA/GA blend with addition of acetic acid J. Solid State Electrochem. 24 1867–75
[18] Aziz S B, Hamsan M H, Brza M A, Kadir M F Z, Abdulwahid R T, Ghareeb H O and
27
Woo H J 2019 Fabrication of energy storage EDLC device based on CS:PEO polymer blend electrolytes with high Li+ ion transference number Results Phys. 15
[19] Kadir M F Z and Hamsan M H 2018 Green electrolytes based on dextran-chitosan blend and the effect of NH4SCN as proton provider on the electrical response studies Ionics (Kiel). 24 2379–98
[20] Mejenom A A, Hafiza M N and Isa M I N 2018 X-Ray diffraction and infrared spectroscopic analysis of solid biopolymer electrolytes based on dual blend carboxymethyl cellulose-chitosan doped with ammonium bromide ASM Sci. J. 11 37–46
[21] Yusof Y M, Illias H A and Kadir M F Z 2014 Incorporation of NH4Br in PVA-chitosan blend-based polymer electrolyte and its effect on the conductivity and other electrical properties Ionics (Kiel). 20 1235–45
[22] Samsudin A S, Lai H M and Isa M I N 2014 Biopolymer materials based carboxymethyl cellulose as a proton conducting biopolymer electrolyte for application in rechargeable proton battery Electrochim. Acta 129 1–13
[23] Selvalakshmi S, Mathavan T, Selvasekarapandian S and Premalatha M 2018 Effect of ethylene carbonate plasticizer on agar-agar: NH4Br-based solid polymer electrolytes Ionics (Kiel). 24 2209–17
[24] Kadir M F Z, Salleh N S, Hamsan M H, Aspanut Z, Majid N A and Shukur M F 2018 Biopolymeric electrolyte based on glycerolized methyl cellulose with NH4Br as proton source and potential application in EDLC Ionics (Kiel). 24 1651–62
[25] Shukur M F and Kadir M F Z 2014 Electrical and transport properties of NH4Br-doped cornstarch-based solid biopolymer electrolyte Ionics (Kiel). 21 111–24
[26] Othman L, Md Isa K B, Osman Z and Yahya R 2017 Ionic Transport Studies of Gel Polymer Electrolytes Containing Sodium Salt Mater. Today Proc. 4 5122–9
[27] Shukur M F, Azmi M S, Zawawi S M M, Majid N A, Illias H A and Kadir M F Z 2013 Conductivity studies of biopolymer electrolytes based on chitosan incorporated with NH4Br Phys. Scr. T157
[28] Eftekhari A and Saito T 2017 Synthesis and properties of polymerized ionic liquids Eur. Polym. J. 90 245–72
[29] Hafiza M N, Bashirah A N A, Bakar N Y and Isa M I N 2014 Electrical Properties of Carboxyl Methylcellulose/Chitosan Dual-Blend Green Polymer Doped with Ammonium Bromide Int. J. Polym. Anal. Charact. 19 151–8
[30] Yusof Y M, Shukur M F, Illias H A and Kadir M F Z 2014 Conductivity and electrical properties of corn starch-chitosan blend biopolymer electrolyte incorporated with ammonium iodide Phys. Scr. 89
[31] Mustafa M S, Ghareeb H O, Aziz S B, Brza M A, Al‐zangana S, Hadi J M and Kadir M F Z 2020 Electrochemical characteristics of glycerolized PEO‐based polymer electrolytes Membranes (Basel). 10 1–16
[32] Hadi J M, Aziz S B, Mustafa M S, Brza M A, Hamsan M H, Kadir M F Z, Ghareeb H O and Hussein S A 2020 Electrochemical impedance study of proton conducting polymer electrolytes based on PVC doped with thiocyanate and plasticized with glycerol Int. J. Electrochem. Sci. 15 4671–83
[33] Ahad N, Saion E and Gharibshahi E 2012 Structural, thermal, and electrical properties of Pva-sodium salicylate solid composite polymer electrolyte J. Nanomater. 2012
[34] Mazuki N F, Abdul Majeed A P P, Nagao Y and Samsudin A S 2020 Studies on ionics conduction properties of modification CMC-PVA based polymer blend electrolytes via impedance approach Polym. Test. 81 106234
[35] Aziz S B, Woo T J, Kadir M F Z and Ahmed H M 2018 Journal of Science : Advanced Materials and Devices A conceptual review on polymer electrolytes and ion transport
28
models J. Sci. Adv. Mater. Devices 3 1–17 [36] Farzin M, Nosratzadegan K, Azarnia J and Ferdosi M 2015 Polymeric ionic liquids: A
strategy for preparation of novel polymeric materials Chem. Pap. 69 1211–8 [37] Ramesh S, Uma O, Shanti R, Yi L J and Ramesh K 2014 Preparation and
characterization of poly (ethyl methacrylate) based polymer electrolytes doped with 1-butyl-3-methylimidazolium trifluoromethanesulfonate Meas. J. Int. Meas. Confed. 48 263–73
[38] Elnaggar Y S R, El-Massik M A, Abdallah O Y and Ebian A E R 2010 Maltodextrin: A novel excipient used in sugar-based orally disintegrating tablets and phase transition process AAPS PharmSciTech 11 645–51
[39] Yusof Y M, Illias H A, Shukur M F and Kadir M F Z 2017 Characterization of starch-chitosan blend-based electrolyte doped with ammonium iodide for application in proton batteries Ionics (Kiel). 23 681–97
[40] Mazuki N, Abdul Majeed A P P and Samsudin A S 2020 Study on electrochemical properties of CMC-PVA doped NH4Br based solid polymer electrolytes system as application for EDLC J. Polym. Res. 27
[41] Asnawi A S F M, Hamsan M H, Aziz S B, Kadir M F Z, Matmin J and Yusof Y M 2021 Impregnation of [Emim]Br ionic liquid as plasticizer in biopolymer electrolytes for EDLC application Electrochim. Acta 375
[42] Yusof Y M, Shukur M F, Hamsan M H, Jumbri K and Kadir M F Z 2019 Plasticized solid polymer electrolyte based on natural polymer blend incorporated with lithium perchlorate for electrical double-layer capacitor fabrication
[43] Brza M A, Aziz S B, Anuar H and Ali F 2020 Structural, ion transport parameter and electrochemical properties of plasticized polymer composite electrolyte based on PVA: A novel approach to fabricate high performance EDLC devices Polym. Test. 91 106813
[44] Hamsan M H, Aziz S B, Kadir M F Z, Brza M A and Karim W O 2020 The study of EDLC device fabricated from plasticized magnesium ion conducting chitosan based polymer electrolyte Polym. Test. 90 106714
[45] Hafiza & I 2014 Ionic Conductivity and Conduction Mechanism Studies of CMC/ Chitosan Biopolymer Blend Electrolytes Res. J. Recent Sci. Res.J.Recent Sci 3 50–6

29
BIOLOGICAL SCIENCES
30
I-CReST 2021:006-011 – Maternal Caffeine Consumption during Pregnancy and the Risk of Miscarriage
*Juliana Yusof
Department of Obstetric &Gynaecology, Faculty of Medicine, UiTM Sg Buloh
*E-mail address: [email protected]
ABSTRACT OBJECTIVE: The main objective for this study is to determine the relationship of caffeine consumption and amount of caffeine consumed with miscarriage. METHODOLOGY: This was a cross-sectional study involving 67 pregnant women from Early Pregnancy Assessment Unit (EPAU) of Hospital Sg. Buloh. A validated questionnaire was made and was used in this study. These questionnaires were randomly distributed among women who were diagnosed to have miscarriage. The data was analyzed using SPSS version 22. RESULTS: A total of 67 respondents’ data were collected among pregnant woman who were diagnosed with miscarriage in EPAU of Hospital Sg. Buloh. 46 (68.7%) of the patients consumed caffeine which show majority of them took caffeine. However, this study revealed that there was no association between caffeine consumption with type of miscarriage (p=0.54). There was also no association between amount of caffeine consumption with type of miscarriage based on frequency (p=0.89) and number of cup of caffeine consumption (p=0.59). CONCLUSION: There was no significant association between caffeine consumption and amount of caffeine consumed with miscarriage. Tea is the most common type of caffeine beverage consumed. However, further research needs to be done with larger sample of patients. 1. INTRODUCTION Caffeine is a xanthine found in coffee, tea, chocolate and colas. It is a central nervous system stimulant, diuretics, striated muscle stimulants and acts on the cardiovascular system [1]. It is among the most frequently ingested pharmacologically active substances in the world [2]. For most people, the amount of caffeine in two to four cups of coffee a day is not harmful. However, too much caffeine can cause problems. Some people are more sensitive to the effects of caffeine than others. They should limit their use of caffeine. So should pregnant and nursing women. Mean daily caffeine consumption is 100–300 mg in most pregnant women whereas only very few women consume 400 mg caffeine or more per day [3].
Several mechanisms have been postulated by which caffeine might produce miscarriage. Firstly, through the inhibition of phosphodiesterases, caffeine increases cellular cyclic adenosine monophosphate levels, which may influence embryo–fetal development. Moreover, it reduces hCG and estradiol by deregulating corpus luteum function and placental blood flow increasing circulating catecholamine. Finally, the structural similarity between caffeine, adenine and guanine could justify a direct action of the chemical on nucleic acids, with possible consequent chromosomal anomalies. In the past, after in utero exposure of monkeys to methylxanthines, reproductive failure was observed [3].
31
Miscarriage is defined as the loss of a pregnancy before 22 weeks of gestation and is either early (≤12 weeks) or late (13-24 weeks). Miscarriage experienced by 1–3% of couples. Although numerous studies on maternal caffeine consumption and the risk of miscarriage have been published since the 1980s, the effect of caffeine intake on the risk of miscarriage remains controversial because of methodological limitations in past studies [4].
However, a recent investigation by American Society of Reproductive Medicine concluded
that caffeine consumption did not increase the hazard of miscarriage, even after adjusting for relevant covariates. However, this finding have important methodological limitations, including potential measurement error in caffeine intake, less exposure data on women who conceived during the first cycle compared with women requiring more time, and the highest consumption among women who withdrew from the study, albeit amounts similar to women with live births [5]. We therefore aim to look at this different attributes and assess the relationship of caffeine consumption to miscarriage.
2. METHODOLOGY This was a cross-sectional study involving 67pregnant women from Early Assessment Pregnancy Unit (EPAU) of Hospital Sg. Buloh. A validated questionnaire was made and used in this study. These questionnaires were randomly distributed among women who are diagnosed to have miscarriage. Patients were diagnosed based on symptoms presented and ultrasound examination; transabdominally and transvaginally. The study was conducted from Jun to July 2017. Ethical approval was obtained from the ethics committee of UiTM.
The collected data were analyzed with statistical analysis method (SPSS). Pearson Chi-Square test and correlation test were used to analyze the association of caffeine with miscarriage. Descriptive statistics were used to summarize the data collected.
Based on study by Pollack et al. (2009), which shown that the prevalence of those having
miscarriage was 20% . After taking 95% CI (Confidence Interval) and power of 80%, sample size was calculated through Power and Sample Size Program ver. 2.1.30 showed that minimum sample size needed per arm will be 10. Therefore, after taking consideration of 20% defaulters, the number of sample arm was 12 patients and the total of sample size for this particular study was 60 patients (maximum 5 arms).
EXCLUSION CRITERIA
a. Maternal age >40 years old. b. Patient with chronic medical illness. c. Cervical incompetence or trauma was the cause of miscarriage. d. Maternal smoker/ alcoholic/ drug abuse. e. History of recurrent miscarriage (more than 3 consecutive first trimester miscarriage)
32
3. RESULTS Descriptive statistic
Table 1: Demographic and clinical characteristics of patients, (N=67)
A total of 67 respondents’ data were collected among pregnant woman who were diagnosed
with miscarriage in EPAU of Hospital Sg. Buloh. However, we excluded 9 patients because they have exclusion criteria, 4 of them were age more than 40 year old and 5 of them due to chronic illness. This makes our total respondents 67. The patients were recruited with the mean age of 29.64 year old (SD 4.804). Sixty two (92.5%) of the patients were Malay which make it the majority race. Housewife, teacher and clerk were the majority group of the respondents with (n=10, 14.9%), (n=8, 11.9%) and (n=5, 7.5%) respectively.
Characteristics Frequency (%) Age, years
• Mean (SD) • Range • Median • IQR (Interquartile range)
29.64(4.804) 20(ranging from 40 – 20 years old) 29.00 8.00
Race • Malay • Chinese • Indian • Other
62(92.5) 2(3.0) 2(3.0) 1(1.5)
Period of gestation (POG),weeks • 5-10 • 11-16 • 17-22
35(52.2) 27(40.3) 5(7.5)
Parity • Primigravida • Multigravida • Grandmultipara
21(31.3) 36(53.7) 10(14.9)
Occupation • Housewive • Teacher • Clerk • Others
10(14.9) 8(11.9) 5(7.5) 44(65.67)
Symptoms of miscarriage presented • Per-vaginal bleeding,
Yes No
• Abdominal pain Yes No
• Passing out product of conception Yes No
58(86.6) 9(13.4) 42(62.7) 25(37.3) 26(38.8) 41(61.2)
33
Based on clinical characteristics of patients, thirty five (52.5%) of the patients were diagnosed with miscarriage at 5 to 10 weeks period of gestation, which is more than half of the patients and followed by 40.3% of them were at 11 to 16 weeks period of gestation. Only five (7.5%) patients came at 17 to 22 weeks period of gestation. Most of them were multipara with (n=36, 53.7%) and nulliparous with (n=28, 41.8%). They came with symptoms such as per vaginal bleeding, abdominal pain and passing out product of conception.
Table 2: History of caffeine consumption, (N=67) Characteristics Frequency (%) p-value
Type of miscarriage
Period of gestation (POG)
Caffeine consumption • Yes • No
46(68.7) 21(3.3)
0.54
0.55
Type of caffeine intake • Coffee
Yes No
• Tea Yes No
• Energy drink Yes No
• Dark chocolate Yes No
18(26.9) 49(73.1) 34(50.7) 33(49.3) 0(0.0) 67(100.0) 8(11.9) 59(88.1)
0.75 0.39 0.54 0.65
0.79 0.13 0.0 0.64
Frequency of consumption • No consumption • Daily • Weekly • Twice a week • Once a month
21(31.3) 22(32.8) 6(9.0) 14(20.9) 4(6.0)
0.93
0.9
Number of caffeine consumption per day (cup/s)
• No consumption • 1 • 2-3 • > 3
21(31.3) 32(47.8) 13(19.4) 1(1.5)
0.83
0.64
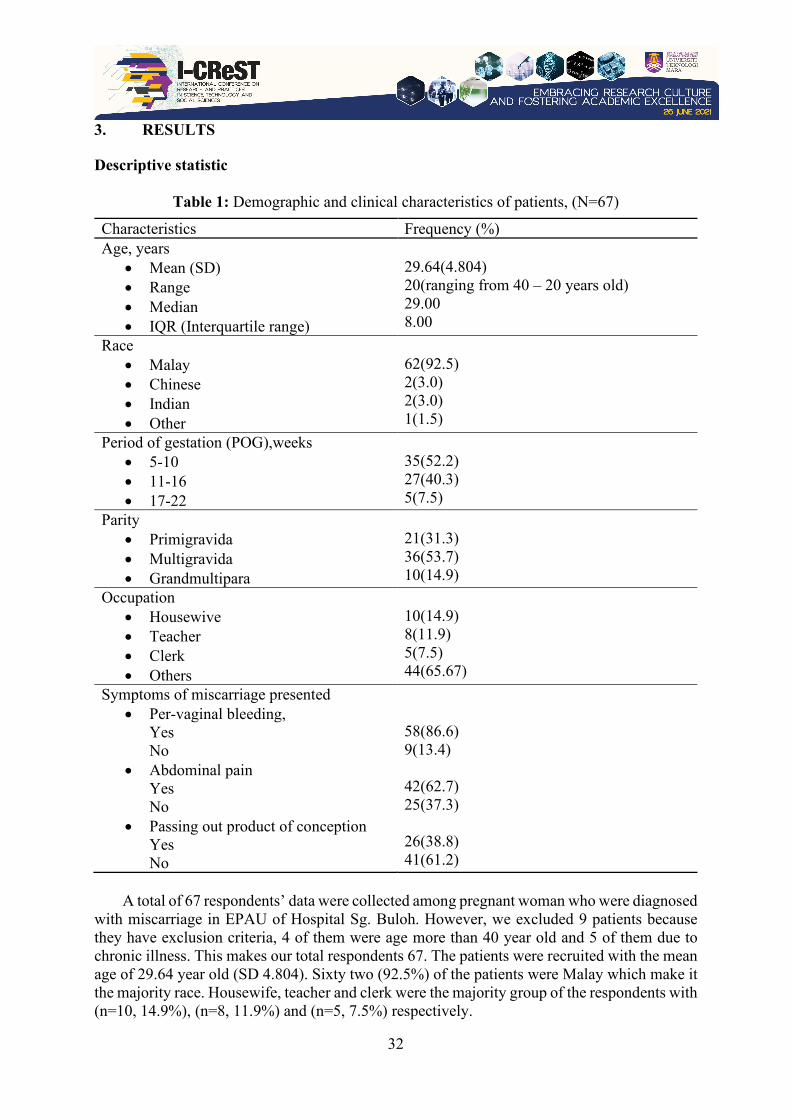
Table 2 summarizes the history of caffeine consumption. Forty six (68.7%) of the patients
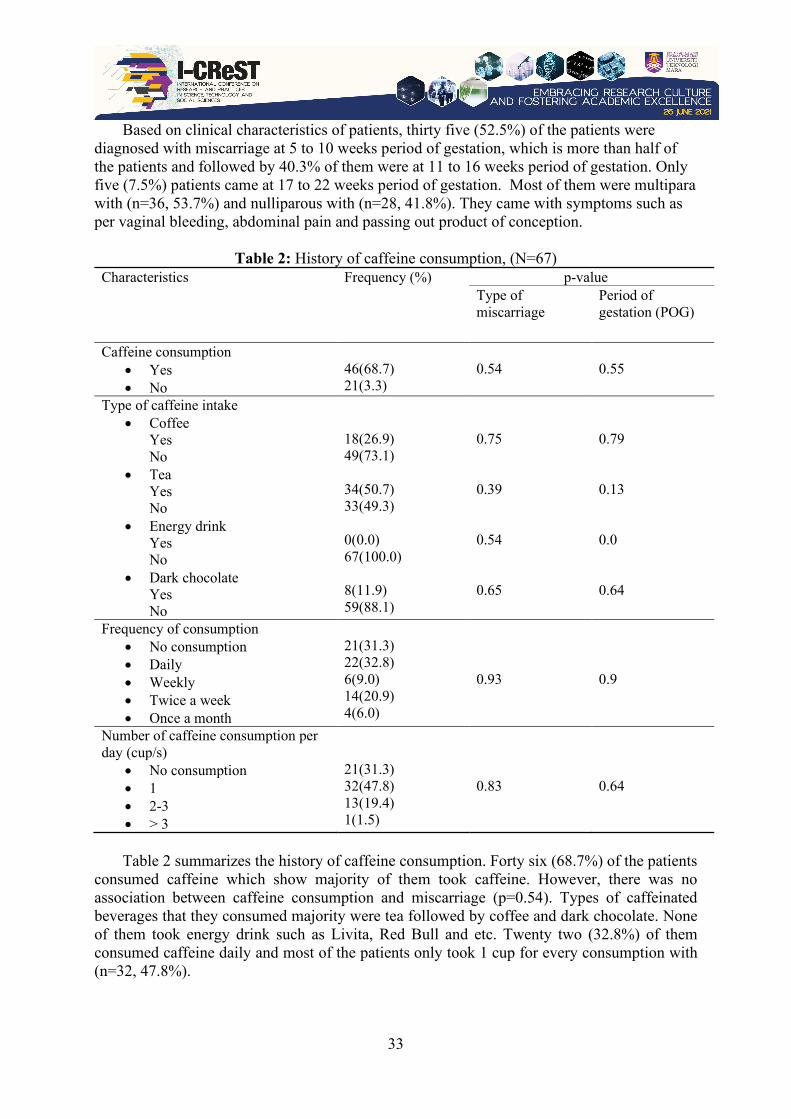
consumed caffeine which show majority of them took caffeine. However, there was no association between caffeine consumption and miscarriage (p=0.54). Types of caffeinated beverages that they consumed majority were tea followed by coffee and dark chocolate. None of them took energy drink such as Livita, Red Bull and etc. Twenty two (32.8%) of them consumed caffeine daily and most of the patients only took 1 cup for every consumption with (n=32, 47.8%).
34
Table 3: Data collection Characteristics Frequency (%) Type of miscarriage Complete Threatened Incomplete Missed Cervical incompetence
34(50.7) 15(22.4) 0(0.0) 18(26.9) 0(0.0)
Table 3 shows the type of miscarriage diagnosed. Complete miscarriage accounts for more
than half of the diagnosis with (n=34, 50.7%). Eighteen (26.9%) of the patients were diagnosed with missed miscarriage and less than a quarter of the patients were diagnosed with threatened miscarriage which counts for 15 (26.9%) patients. None of them had incomplete miscarriage nor cervical incompetence. Data analysis
Figure 1: Majority of respondents consumed caffeine
Figure 2: Tea is the most consumed caffeine among the respondent.
35
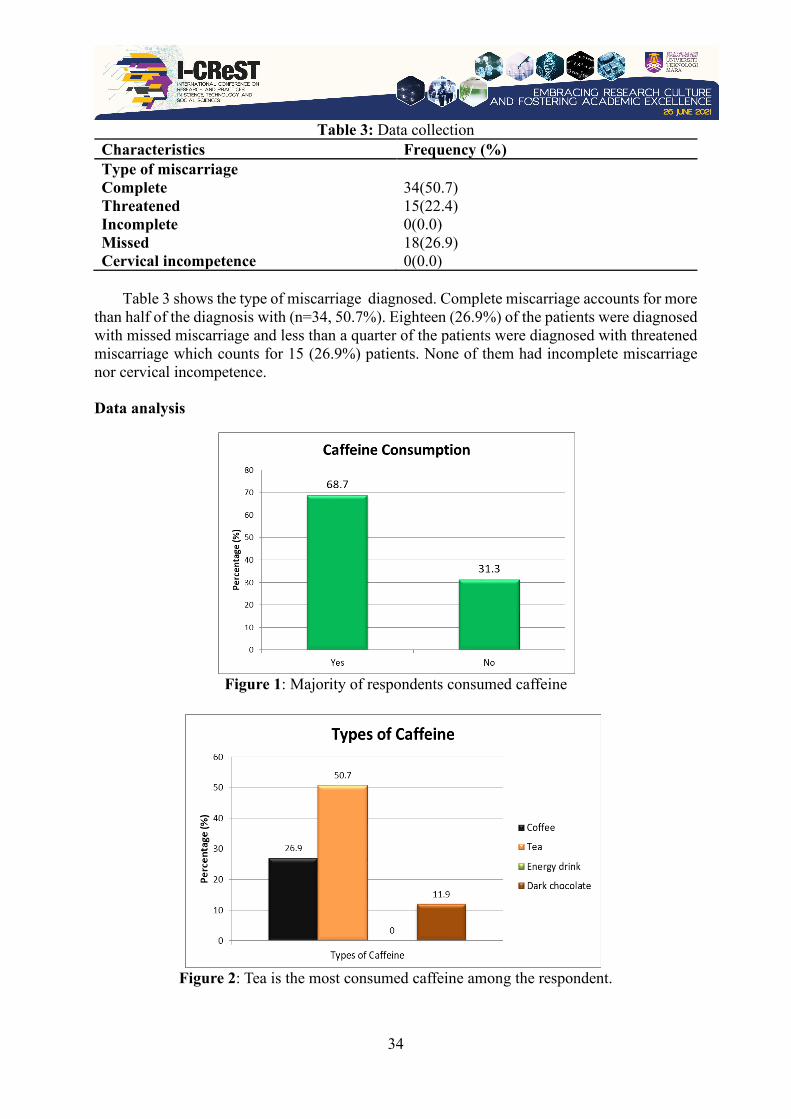
p=0.54
p=0.72
p=0.68

36
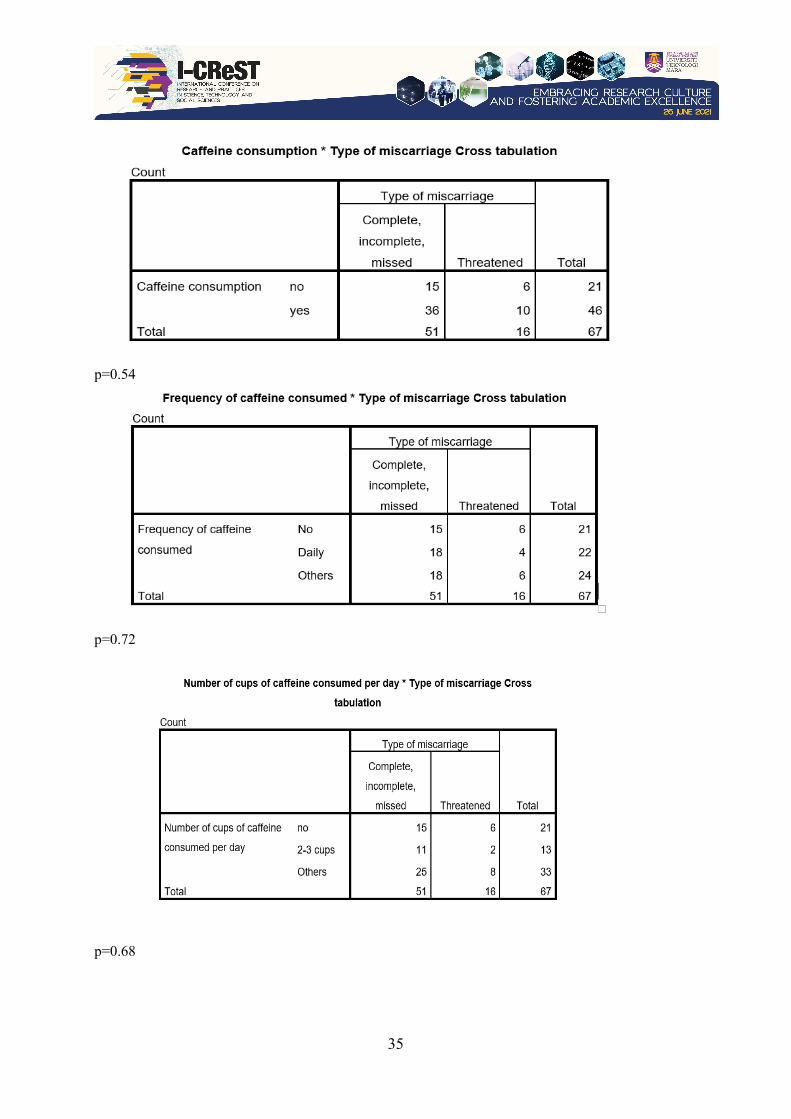
p=0.55
p=0.86
p=0.68
There was no significant association between caffeine consumption and type of miscarriage. We also did not find any significant association between miscarriage with frequency of caffeine intake and number of cups of caffeine intake per day. There was also no significant association between caffeine consumption, frequency of caffeine intake and number of cups of caffeine intake per day with period of gestation when miscarriage.
37
4. DISCUSSION
This cross sectional study was conducted among pregnant women presenting to Early Pregnancy Assessment Unit (EPAU) Hospital Sungai Buloh in their 5th to 22nd weeks of gestation that was diagnosed to have miscarriage to examine the association between caffeine consumption and miscarriage. Patients that were more than 40 years old were excluded as well as patient with chronic medical illness, cervical incompetence or trauma as the cause of miscarriage, maternal smoker/ alcoholic/ drug abuse and patient who had history of recurrent miscarriage (more than 3 consecutive first trimester miscarriage)
In this study, there was no association between caffeine consumption and miscarriage. However in study done by Weng et al in Oakland, California in 2008(2) they concluded that high dose of caffeine intake during pregnancy increase the risk of miscarriage, independent of pregnancy-related symptoms. In another study done by Tan et al in Singapore on 2014(6), they also concluded that any consumption of caffeine had association with miscarriage but they did not differentiate between regular caffeine consumer and non frequent caffeine consumer. They also did not discuss on association between the amount of caffeine consumed with miscarriage.
Even though the association between amount of caffeine consumed with miscarriage was
included in this study, unfortunately it was not significant. There were some limitations the amount of caffeine in every serving was not quantified . Besides that, the size of the cup was not standardised, and therefore the exact amount of caffeine consumed could not be predicted.
In a study done by Anna et al in America on 2010(5), they concluded that caffeine
consumption in sensitive windows was not associated with miscarriage. This study also had the same outcome but the exact time was not taken into account (period of gestation, weeks) of caffeine consumption as one of the variable. 5. CONCLUSION
There was no significant association between caffeine consumption, frequency of caffeine consumption and number of cups of caffeine intake per day with miscarriage. Tea is the most common type of caffeine beverage consumed. However, further research needs to be done with larger sample of patients. REFERENCES [1] In Dorland’s Pocket Medical Dictionary (28th ed.) 2009 Philadelphia, PA: Elsevier
Saunders; 127 [2] Anna Z., Germaine M., Sundaram R., Kirsten J. Caffeine Consumption and
Miscarriage: A Prospective Cohort Study 2010. American Society for Reproductive Medicine. Elsevier Inc.
[3] Erato M. Stefanidou, Laura Caramellino ,AmbraPatriarca, Guido Menato. . Maternal caffeine consumption and sinecausa recurrent miscarriage. European Journal of Obstetrics & Gynecology and Reproductive Biology 2008. Department of Obstetrics and Gynecology, University of Turin, Sant’Anna Hospital, Via Ventimiglia 3, 10126 Turin, Italy. Retrieved on 27th January, 2017, from http://www.ejog.org/article/S0301-2115(11)00240-5/pdf

38
[4] Colin T., Jacqueline P., Shalini P. Miscarriage. Retrieved on 30th November, 2016 from http://patient.info/doctor/miscarriage-pro
[5] Weng X, Odouli R, Li DK, Maternal caffeine consumption during pregnancy and the risk of miscarriage: a prospective cohort study2008. Division of Research, Kaiser Permanente, Oakland, CA.. Retrieved on 27th January, 2017, from http://www.ajog.org/article/S0002-9378(07)02025-X/pdf
[6] Tan T.C., Neo G.H., Malhotra H., Allen J.C., Lie D., Ostbye T. Lifestyle Risk Factors Associated with Threatened Miscarriage: A Case-Control Study 2014 . JFIV Reprod Med Genet2: 123.
APPENDIX
CAFFEINE BEVERAGE AND MISCARRIAGE QUESTIONNAIRE
This questionnaire pertains to a study by medical students of UiTM Sungai Buloh. The purpose of this study is to find the relationship between caffeine consumption and miscarriage. The information given is highly confidential.
Instructions.
Please answer the following questions by selecting the appropriate answer and fill in the blanks.
Part I: Patient’s Demographic data
1. SB Number : __________ 2. Age : __________ 3. Last Menstrual Period (date) : __________ 4. Period of Amenorrhea/Period of Gestation (weeks) : __________ 5. Estimated Delivery Date / Revised Estimated Delivery Date : __________ 6. Gravida : ___________ 7. Occupation: __________ 8. Symptoms of miscarriage (can select more than one)
Do you experience any of these symptoms below? � Per vaginal spotting (bleeding) � Abdominal Pain � Passing out product of conception
Part II: Caffeine consumption
1. Do you consume caffeine? (If no, no need to answer the next questions) � Yes � No
2. What type of caffeine intake do you take? � Coffee � Tea � Energy drink (eg: Livita, Redbull, etc) � Dark chocolate

39
3. How frequent do you consume caffeine?
� Daily � Weekly � Twice a week � Once a month
4. How many cups of caffeine intake do you consume per day? (If more than 3 cups, please state how many cups)
� 1 cup � 2-3 cups � More than 3 cups :__________
DATA COLLECTION
Part III : To be filled by Medical students/personnel
1. Type of miscarriage diagnosed in this patient � Complete miscarriage � Threatened miscarriage � Incomplete miscarriage � Missed miscarriage � Cervical incompetence
2. Was there fetal congenital anomaly in this patient? � Yes � No
40
I-CReST 2021:099-087 – Morphological Identification of Erwinia sp. that Associated with Pineapple Heart Rot Disease
Siti Aisyah Binti Musa, *Intan Sakinah Mohd Anuar
Faculty of Plantation and Agrotechnology, Universiti Teknologi MARA Jasin, 77300,
Melaka, Malaysia
*Emel: [email protected]
ABSTRACT Bacterial heat rot disease is one of the major pathogens threatening pineapple industries in Malaysia. The pathogen that caused bacterial heart rot is Erwinia chrysanthemi. The symptoms appeared as water soaked lesion arising from the basal, bloated and darker and infection border on the plant leaves. The presence and emergence of numerous species of Erwinia sp. has increased and the need of understanding the symptoms and morphological characteristics is important for establishing and implementing practical disease management. Other problem is the lack of research on how to prevent the bacterial heart rot disease because there are no satisfactory solutions to overcome this problem. This study was conducted to characterize the morphological characteristics of Erwinia sp. that causing the bacterial heart rot disease in pineapple. The phytopathogenic bacteria that suspected as Erwinia sp. were isolated, sub-cultured and observed on light microscope. Based on the research study, bacteria B1 has been identified and suspected as genus of Erwinia sp. that caused the bacterial heart rot disease in pineapple.
Keywords: Pineapple; bacterial heart rot disease; morphological characteristics’ Erwinia sp. 1. INTRODUCTION
Malaysia’s involvement in to the worldwide pineapple produces in 2013 was roughly calculated at about 315.977 metric tons which rated it nineteenth pineapple generating country in the world [1]. However, pineapple production have been seriously affected by disease tribulation. Various disease caused by the bacterial infection has been reported and the most severe is bacterial heart rot initiated by E. chrysanthemi or newly known as Dickeya zeae. Bacterial heart rot disease was first announced in Malaysia in 1957 [2].
According to [2], it is one of the major pathogens threatening pineapple industries in Malaysia. The signs appeared as water soaked lesion that emerge from the basal, swollen and darker and have infection border line on the plant leaves. A light brown exudate appears from the blisters as leaves begin to decay. A few days after first infection of the apical, lateral buds, meristem, the pineapple heart and stem can be easily separated from the below ground part of the plant. In some instances, young pineapple fruit become latently infected, exhibiting a brisk soft rot and collapse at full growth called pineapple fruit collapse [3]. Bacterial heart rot initiated by Erwinia chrysanthemi and it is one of the major pathogens threatening pineapple industries in Malaysia [2]. Dickeya, a new genus was submitted by [4] with a some new species for E.

41
chrysanthemi. Both Dickeya dadantii and D. zeae species were announced synonym as E. chrysanthemi [5]. The existence and exposure of numerous species of Dickeya and Erwinia has rised and the important of understanding the symptoms and morphological characteristics is important for establishing and carry out practical disease management plan to lessen or prevent the production and grow of E. chrysanthemi. Therefore the objective of this study is to characterize the morphological characteristics of Erwinia sp. that causing the bacterial heart rot disease in pineapple based on macroscopic and microscopic characteristics.
2. MATERIALS AND METHODS Samples collection A few samples of blister-like leaf lesions were collected at Parit Yusuf, Muar Johor. The varieties that was collected is Josapine because it was reported to be seriously infected by the disease [5]. Then, the samples were transferred to Plant Pathology Laboratory by covering the samples in the plastic bags and kept in the lab’s refrigerator to avoid the samples become dry before the isolation process. Isolation of Erwinia sp. The leaves samples were washed thoroughly by tap water to remove the debris and unwanted particles. Then, the leaves were cut into smaller pieces (1.0 cm-2.0 cm) and surface sterilized in 10% sodium hypochlorite for 3 minutes. Then, rinsed in sterile distilled water and dried on paper towels in laminar flow. The procedure to isolate Erwinia sp. by using scalpel to remove the surface- disinfected of outer layer of leaves, leaving the leave tissue that was cut into small pieces (0.5 cm-1.0cm) in length. The pieces of leaves were direct plating on nutrient agar (NA) in petri dish. There are 4 pieces of leaves in one petri dish. The plates then were incubated for 24 hours to allow the growth of bacteria of the leaves tissue.
After 24 hours, the growth of bacteria were observed on the plate. The bacteria should appear as white, smooth colonies growing on the medium. They may be domed, shining, mucoid-type colonies. If the bacterial growth is too dense, re-streak onto a new NA plate to obtain single colony.
Morphology of bacterial colony The bacteria was exhibit the difference of cultural characteristic in the appearance of their growth on the plate. Each of the bacteria species have different characteristic pattern of colony. Observation colony on agar plate was used by researcher to identify different cultural characteristics. Gram staining reaction Firstly, the slide of bacterial cells was prepared to be stained. The slide that contain distilled water and bacteria on it was air-dry. After that, crystal violet was added on the slide and let it be for one minute before rinse slide with tap water. Iodine was added to fix the crystal violet on bacterial cell wall and let it be for one minute. Then rinse with tap water and decolourised it with 95% ethanol until the purple colour on the slide is cleared. Then, rinse with tap water.
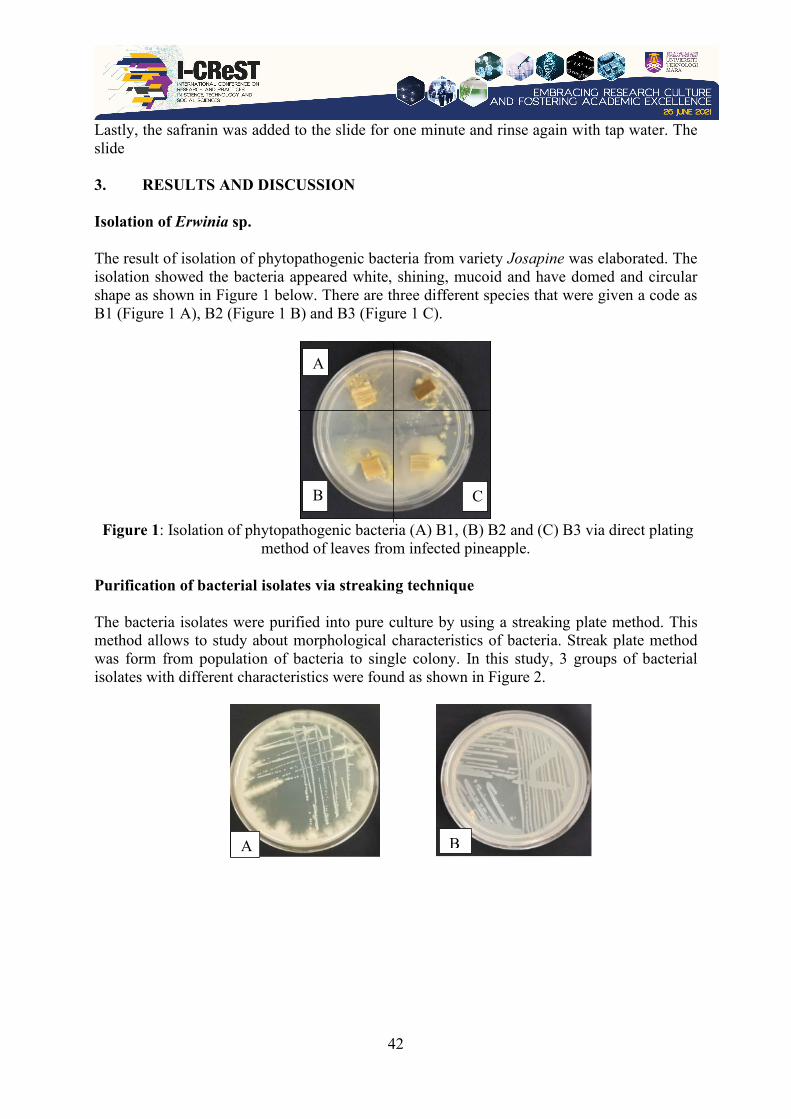
42
Lastly, the safranin was added to the slide for one minute and rinse again with tap water. The slide 3. RESULTS AND DISCUSSION Isolation of Erwinia sp. The result of isolation of phytopathogenic bacteria from variety Josapine was elaborated. The isolation showed the bacteria appeared white, shining, mucoid and have domed and circular shape as shown in Figure 1 below. There are three different species that were given a code as B1 (Figure 1 A), B2 (Figure 1 B) and B3 (Figure 1 C).
Figure 1: Isolation of phytopathogenic bacteria (A) B1, (B) B2 and (C) B3 via direct plating
method of leaves from infected pineapple.
Purification of bacterial isolates via streaking technique The bacteria isolates were purified into pure culture by using a streaking plate method. This method allows to study about morphological characteristics of bacteria. Streak plate method was form from population of bacteria to single colony. In this study, 3 groups of bacterial isolates with different characteristics were found as shown in Figure 2.
A
B C
A B
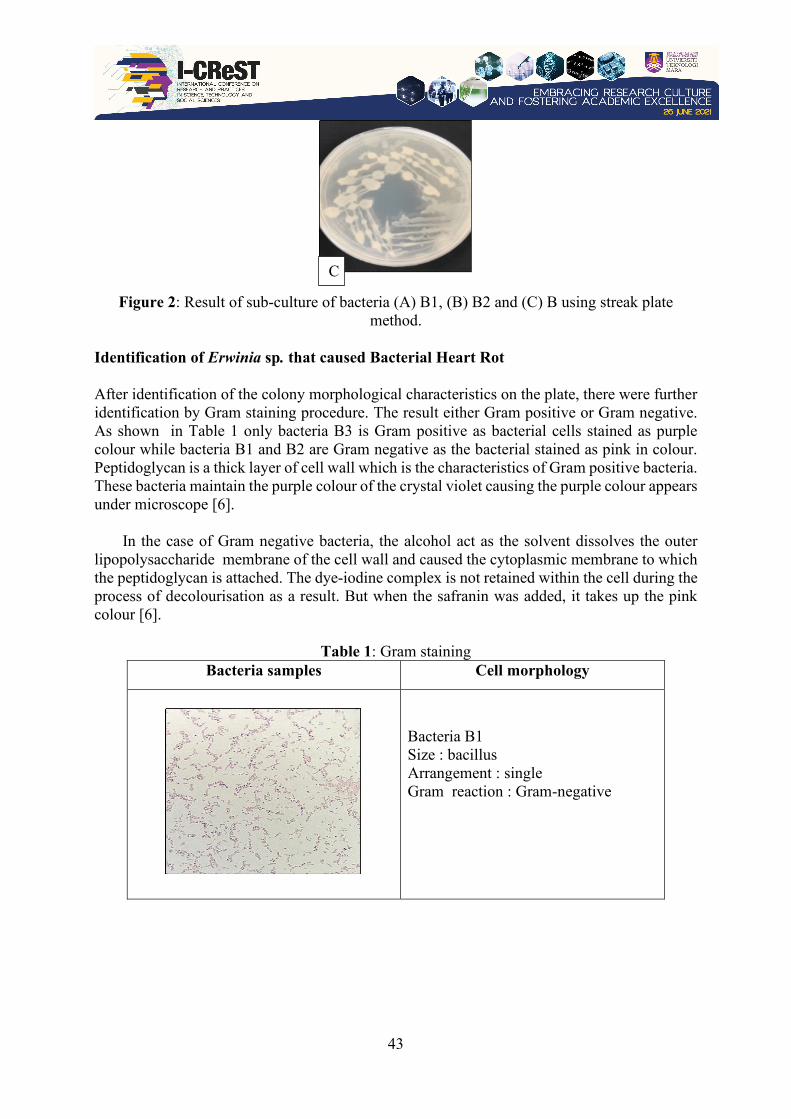
43
Figure 2: Result of sub-culture of bacteria (A) B1, (B) B2 and (C) B using streak plate method.
Identification of Erwinia sp. that caused Bacterial Heart Rot After identification of the colony morphological characteristics on the plate, there were further identification by Gram staining procedure. The result either Gram positive or Gram negative. As shown in Table 1 only bacteria B3 is Gram positive as bacterial cells stained as purple colour while bacteria B1 and B2 are Gram negative as the bacterial stained as pink in colour. Peptidoglycan is a thick layer of cell wall which is the characteristics of Gram positive bacteria. These bacteria maintain the purple colour of the crystal violet causing the purple colour appears under microscope [6].
In the case of Gram negative bacteria, the alcohol act as the solvent dissolves the outer lipopolysaccharide membrane of the cell wall and caused the cytoplasmic membrane to which the peptidoglycan is attached. The dye-iodine complex is not retained within the cell during the process of decolourisation as a result. But when the safranin was added, it takes up the pink colour [6].
Table 1: Gram staining Bacteria samples Cell morphology
Bacteria B1 Size : bacillus Arrangement : single Gram reaction : Gram-negative
C

44
Bacteria B2 Size : coccobacillus Arrangement : single Gram reaction : Gram-negative
Bacteria B3 Size : streptobacillus Arrangement : chains Gram reaction : Gram-positive
All the bacteria species found were observed by light microscope to indicate cell shape and
Gram positive or Gram Negative. The bacteria was observed under magnification lens 100x. As the result from Gram staining, it is concluded as the bacteria B1 suspected as the genus Erwinia that caused the bacterial heart rot in pineapple. That is because the bacteria B1 has almost the same characteristics as the Erwinia sp. because in bacillus form and Gram-negative. Similar results were reported by [7] who reported that Erwinia chrysanthemi was rod-shaped, occurred singly, and Gram negative.
4. CONCLUSION AND RECOMMENDATIONS Based on the research findings, it can be concluded that there was one bacteria that have been suspected as Erwinia sp. that caused the bacterial heart rot in pineapple which is bacteria B1. Bacteria B1 has been identified as Genus Erwinia among the other two bacterium because bacteria B1 has the similar characteristics to Erwinia sp. because it is in bacillus form and Gram-negative. Understanding morphological characteristics is important to establishing and implementing practical disease management due to emergence of numerous species of Erwinia sp. that have been increased. Other recommendation is safety and hygienic handling of plant material to avoid the contaminate and infestation of bacterial heart rot during the planting process and harvesting process. Next, use the less infected plant cultivar like Crystal Honey, Maspine and Sarawak to reduce the infection of bacterial heart rot in pineapple industry [2]. Genome sequence and molecular study are required in order to do the further study about the bacterial strains and species.
45
ACKNOWLEDGEMENT First of all, I would like to thank to Allah for giving me such a great opportunity and provide me with some ideas in completing my research. Besides that, I am really grateful to Allah for giving me such the best motivation to myself in continuing this research until it is completely done. Apart from that, I would like to express my great appreciation towards my supervisor, Madam Intan Sakinah binti Mohd Anuar for her patient guidance and useful opinions to my research before it was finalized.
I would like to show my gratitude to my beloved parents and family for their support and positive encouragement for me in completing this research successfully. Other than that, a deep appreciation was extended to my final year project’s mates that always together supporting me and keep helping each other during the research. Last but not least, special thanks are extended to lab assistants, lectures and my friends for their help in giving me some guidance and support while finishing my research.
REFERENCES [1] FOASTAT (FOA Statistics Division), Food and Agriculture Organization of the United
Nations, Rome. (2018). Retrieved 2019, November 1 from http://foastat.fao.org [2] Azizi, A., & Nor, M. (2019). Dissemination pattern of bacterial heart rot ( BHR )
disease and screening of the disease resistance among commercial pineapple varieties in Malaysia Malaysian Journal of Microbiology, (July). https://doi.org/10.21161/mjm.1915412
[3] Ramachandran, K., Manaf, U. A., & Zakaria, L. (2015). Molecular characterization and pathogenicity of Erwinia spp . associated with pineapple [ Ananas comosus ( L .) Merr .] and papaya ( Carica papaya L .), 55(4). https://doi.org/10.1515/jppr-2015-0053
[4] Kaneshiro, W. S., Protection, E., Peps, S., Vine, B. G., Silva, A. S. De, & Alvarez, A. M. (2008). e - X tra * Characterization of Erwinia chrysanthemi from a Bacterial Heart Rot of Pineapple, 92(10).
[5] Kalsum, U. (2008). Typing of Erwinia Chrysanthemi isolated from josapine pineapple in Malaysia using antimicrobial susceptibility , plasmid profiles , ERIC-PCR and RFLP analysis, 15(3), 273–280.
[6] Lasekan, O., & Hussein, F. K. (2018). Classification of different pineapple varieties grown in Malaysia based on volatile fingerprinting and sensory analysis. Chemistry Central Journal, 1–12. https://doi.org/10.1186/s13065-018-0505-3
[7] Wada, A., Kono, M., Kawauchi, S., Takagi, Y., Morikawa, T., & Funakoshi, K. (2012). Rapid Discrimination of Gram-Positive and Gram- Negative Bacteria in Liquid Samples by Using NaOH- Sodium Dodecyl Sulfate Solution and Flow Cytometry, 7(10). https://doi.org/10.1371/journal.pone.0047093
[8] Vasundhara, B. A., & Thammaiah, N. (2017). Morphological and Biochemical Properties Useful for Identification of Erwinia chrysanthemi, 6(10), 343–348.
46
I-CReST 2021:156-152 – Expression of IL-1β, IL-6, and TNF-ɑ in rat molar periodontium tissues after concurrent orthodontic wire placement and
Enterococcus faecalis inoculation
1Fazle Khuda, 2Badiah Baharin, 3Nur Najmi Mohamad Anuar, *1Nurrul Shaqinah Nasruddin
1Department of Craniofacial Diagnostics and Biosciences, Faculty of Dentistry, Universiti
Kebangsaan Malaysia, Jalan Raja Muda Abdul Aziz, 50300 Kuala Lumpur, Malaysia 2Department of Restorative Dentistry, Faculty of Dentistry, Universiti Kebangsaan Malaysia,
Jalan Raja Muda Abdul Aziz, 50300 Kuala Lumpur, Malaysia 3Programme of Biomedical Science, Centre for Toxicology and Health Risk Studies, Faculty of Health Sciences, Universiti Kebangsaan Malaysia, Jalan Raja Muda Abdul Aziz, 50300
Kuala Lumpur, Malaysia *E-mail: [email protected] ABSTRACT Periodontal disease is a chronic inflammatory disorder which is associated with more than 700 species of bacteria. Enterococcus faecalis is usually a commensal microorganism and not recognized as a periodontal pathogen. However, it is responsible for 90% of enterococcal infection in human. The presence of E. faecalis in the oral cavity raises the question of whether periodontal disease has relationship with this microorganism. The aim of our study is to observe the expression levels of inflammatory cytokines IL-1β, IL-6, TNF-ɑ following infection with E.faecalis and orthodontic wire placement. Rats were divided into 3 groups containing 4 rats each 0 day, 7 days, 14 days induction period. 0.2mm sterile orthodontic wire inserted into the inter dental space of maxillary right 1st and 2nd molar and 0.5 ul of E. faecalis suspension of 1.5x10⁸ CFU/ml of bacteria injected into the gingival sulcus between maxillary right 1st and 2nd molar area once a week during respective induction period. Gingival tissue samples and maxillary samples were collected from respective group after induction period for RNA extraction and cDNA conversion. The RT-PCR was carried out in 10ul reaction as instructed ChamQ Universal SYBER® qPCR master mix (Vanzyme). The two step amplification was performed in a thermocycler (Bio-Rad CFX96 Connect™ real-time PCR) as follows: initial denaturation at 95℃, 30 sec; denaturation 95℃ 10 sec; annealing temperature 60℃ 30 sec; for 40 cycles. RT-PCR analysis shows upregulation of IL-1β, IL-6 and TNF-ɑ expression levels after 7 days of induction which has been decreased significantly after 14 days induction period compared to control (0 day) group. This study revealed acute inflammatory response of periodontal tissue in response to E.faecalis infection and ligature orthodontic wire which suggest ability to shifting of this commensal microorganism to pathogenic state within the periodontal tissue and could play a critical role in periodontal disease progression. Keywords: Periodontal disease; E. faecalis; inflammatory cytokines
47
1. INTRODUCTION The periodontium is consist of group of tissues (gingiva, periodontal ligament, cementum, alveolar bone) that surrounds the tooth and provides structural support to remain it within the bone. Periodontal disease is an inflammatory disorder of the periodontium which is caused by interaction between periodontopathic bacteria and the host immune response which results in proinflammatory mediators production thus leads to tissue destruction [1]. IL-1β, IL-6 and TNF-⍺ are the key inflammatory cytokines which usually elevated in response to periodontal inflammatory process [2]. More than 700 species of bacteria is responsible for periodontal inflammatory condition. Enterococcus faecalis is a Gram positive, facultative anaerobic cocci and responsible for 90% of enterococcal infection in human although it is usually a commensal microorganism and not recognized as a periodontal pathogen [3]. It can get into the oral cavity by food contaminants and by nosocomial infection. The presence of E. faecalis in the oral cavity raises the question of whether periodontal disease has relationship with this microorganism. Orthodontic ligature wire act as a plaque retentive factor and helps in accumulation of bacterial plaque which is an important feature of initiation of periodontal pathological process. To our knowledge no study has performed yet to evaluate the IL-1β, IL-6 and TNF-ɑ expression levels following infection with insertion of orthodontic ligature wire and E.faecalis inoculation within the periodontium. The aim of our research is to evaluate the expression levels of inflammatory cytokines IL-1β, IL-6 and TNF-ɑ following concurrent infection with E.faecalis and orthodontic wire placement. 2. MATERIALS & METHODS Experimental procedure A total of 12 Sprague Dawley (SD) rats aged (6 weeks old) weighing about 180-200 g were divided into 3 groups; 0-day (control), 7-days (experimental) and 14-days (experimental) respectively [4]. All animal study procedure were conducted accordance to the Animal Ethics Committee of Universiti Kebangsaan Malaysia (UKMAEC) on animal care protocol and approval was obtained before experimental period FD/2018/NURRULSHAQINAH/128NOV1961-NOV-2018-JAN 2020. General anesthesia given by intraperitoneal injection with Ketamine 10% 100mg/kg and Xylazine 2% 10mg/kg body weight [5]. A sterile orthodontic ligature wire 0.2mm was cut in 5mm length. Sterile endodontic file #8, #10 (Dentsply) was bent 90° from the tip and inserted carefully between the proximal space of upper right maxillary 1st and 2nd molar tooth area few times by gentle push and pull movement to create space without damaging the gingival tissue. Then 0.2mm sterile orthodontic wire was bent and inserted carefully between the space with the help of a needle holder [6]. Wire was placed on 7-days and 14-days experimental groups. Enterococcus Faecalis strain was obtain from the American Type Culture Collection (ATCC 29212, USA). Bacteria were grown in a Brain Heart Infusion (BHI) blood agar medium in an anaerobic chamber at 37℃ for 24 hours. Then 1.5 x 10⁸ bacteria were standardized using McFarland standard. After insertion of a ligature wire, 0.5μl of bacterial solution was injected carefully into the gingival sulcus of upper right maxillary 1st and 2nd molar area by using a Hamilton syringe once a week during the respective induction period. At 0, 7, 14 days post induction period, animals were sacrificed by using anesthesia overdose. Gingival tissue samples around the molar area were collected for RNA isolation immidiately kept into the -80℃ until further use.
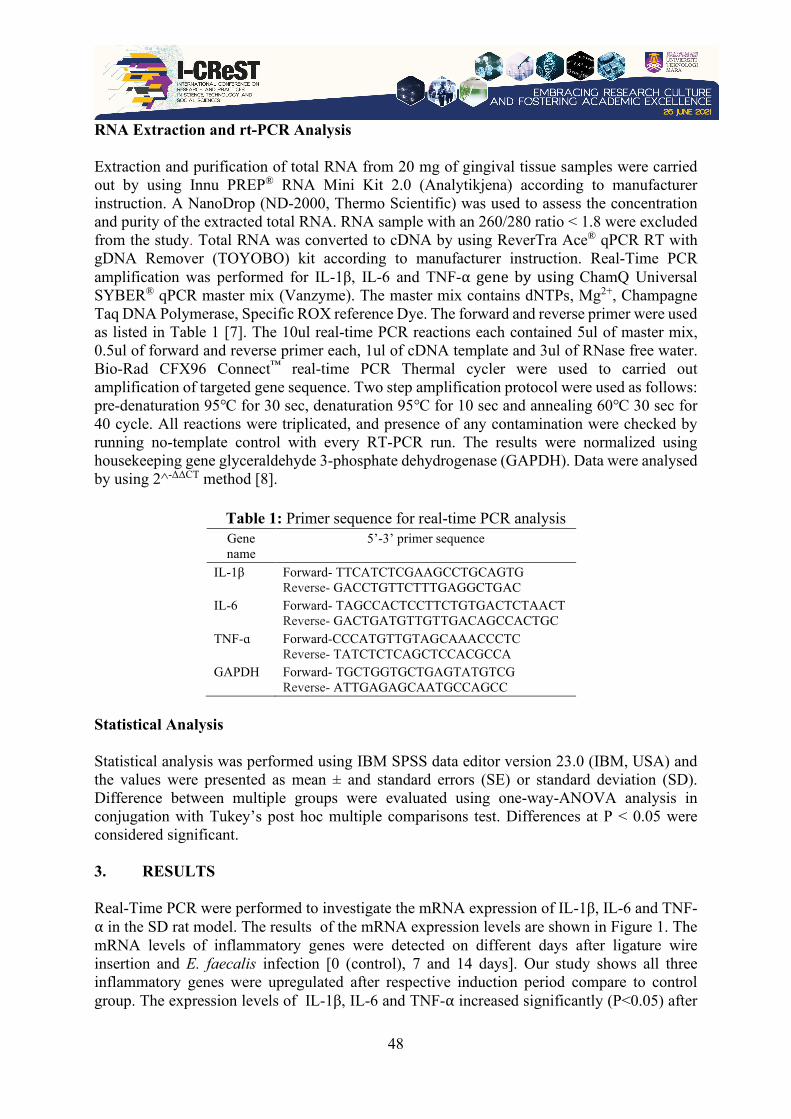
48
RNA Extraction and rt-PCR Analysis Extraction and purification of total RNA from 20 mg of gingival tissue samples were carried out by using Innu PREP® RNA Mini Kit 2.0 (Analytikjena) according to manufacturer instruction. A NanoDrop (ND-2000, Thermo Scientific) was used to assess the concentration and purity of the extracted total RNA. RNA sample with an 260/280 ratio < 1.8 were excluded from the study. Total RNA was converted to cDNA by using ReverTra Ace® qPCR RT with gDNA Remover (TOYOBO) kit according to manufacturer instruction. Real-Time PCR amplification was performed for IL-1β, IL-6 and TNF-⍺ gene by using ChamQ Universal SYBER® qPCR master mix (Vanzyme). The master mix contains dNTPs, Mg2+, Champagne Taq DNA Polymerase, Specific ROX reference Dye. The forward and reverse primer were used as listed in Table 1 [7]. The 10ul real-time PCR reactions each contained 5ul of master mix, 0.5ul of forward and reverse primer each, 1ul of cDNA template and 3ul of RNase free water. Bio-Rad CFX96 Connect™ real-time PCR Thermal cycler were used to carried out amplification of targeted gene sequence. Two step amplification protocol were used as follows: pre-denaturation 95℃ for 30 sec, denaturation 95℃ for 10 sec and annealing 60℃ 30 sec for 40 cycle. All reactions were triplicated, and presence of any contamination were checked by running no-template control with every RT-PCR run. The results were normalized using housekeeping gene glyceraldehyde 3-phosphate dehydrogenase (GAPDH). Data were analysed by using 2^-ΔΔCT method [8].
Table 1: Primer sequence for real-time PCR analysis Gene name
5’-3’ primer sequence
IL-1β Forward- TTCATCTCGAAGCCTGCAGTG Reverse- GACCTGTTCTTTGAGGCTGAC
IL-6 Forward- TAGCCACTCCTTCTGTGACTCTAACT Reverse- GACTGATGTTGTTGACAGCCACTGC
TNF-ɑ Forward-CCCATGTTGTAGCAAACCCTC Reverse- TATCTCTCAGCTCCACGCCA
GAPDH Forward- TGCTGGTGCTGAGTATGTCG Reverse- ATTGAGAGCAATGCCAGCC
Statistical Analysis Statistical analysis was performed using IBM SPSS data editor version 23.0 (IBM, USA) and the values were presented as mean ± and standard errors (SE) or standard deviation (SD). Difference between multiple groups were evaluated using one-way-ANOVA analysis in conjugation with Tukey’s post hoc multiple comparisons test. Differences at P < 0.05 were considered significant. 3. RESULTS Real-Time PCR were performed to investigate the mRNA expression of IL-1β, IL-6 and TNF-⍺ in the SD rat model. The results of the mRNA expression levels are shown in Figure 1. The mRNA levels of inflammatory genes were detected on different days after ligature wire insertion and E. faecalis infection [0 (control), 7 and 14 days]. Our study shows all three inflammatory genes were upregulated after respective induction period compare to control group. The expression levels of IL-1β, IL-6 and TNF-⍺ increased significantly (P<0.05) after
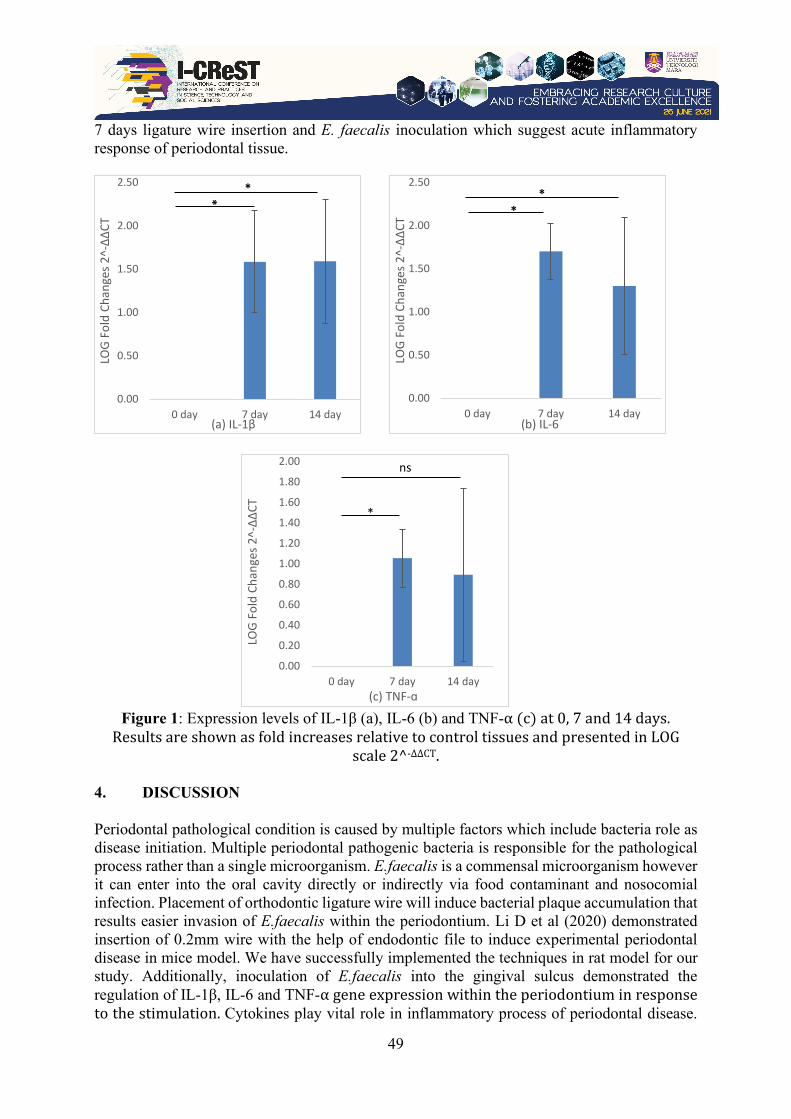
49
7 days ligature wire insertion and E. faecalis inoculation which suggest acute inflammatory response of periodontal tissue.
Figure 1: Expression levels of IL-1β (a), IL-6 (b) and TNF-⍺ (c) at 0, 7 and 14 days.
Results are shown as fold increases relative to control tissues and presented in LOG scale 2^-ΔΔCT.
4. DISCUSSION Periodontal pathological condition is caused by multiple factors which include bacteria role as disease initiation. Multiple periodontal pathogenic bacteria is responsible for the pathological process rather than a single microorganism. E.faecalis is a commensal microorganism however it can enter into the oral cavity directly or indirectly via food contaminant and nosocomial infection. Placement of orthodontic ligature wire will induce bacterial plaque accumulation that results easier invasion of E.faecalis within the periodontium. Li D et al (2020) demonstrated insertion of 0.2mm wire with the help of endodontic file to induce experimental periodontal disease in mice model. We have successfully implemented the techniques in rat model for our study. Additionally, inoculation of E.faecalis into the gingival sulcus demonstrated the regulation of IL-1β, IL-6 and TNF-⍺ gene expression within the periodontium in response to the stimulation. Cytokines play vital role in inflammatory process of periodontal disease.
0.00
0.50
1.00
1.50
2.00
2.50
0 day 7 day 14 day
LOG
Fold
Cha
nges
2^-Δ
ΔCT
(a) IL-1β
*
0.00
0.50
1.00
1.50
2.00
2.50
0 day 7 day 14 dayLO
G Fo
ld C
hang
es 2
^-ΔΔ
CT
(b) IL-6
**
0.00
0.20
0.40
0.60
0.80
1.00
1.20
1.40
1.60
1.80
2.00
0 day 7 day 14 day
LOG
Fold
Cha
nges
2^-Δ
ΔCT
(c) TNF-ɑ
*
ns
50
Several studies have demonstrated upregulation of IL-1β, IL-6 and TNF-⍺ expression levels with the progression of periodontal inflammatory condition. In our study we have also found the upregulation of these three pro-inflammatory cytokines expression level in response to experimental infection with E.faecalis and orthodontic ligature wire compared to control group. The expression levels of the pro-inflammatory genes were elevated significantly (P<0.05) at 7 days period. At 14 days there was a significant difference (p<0.05) of IL-1β, IL-6 cytokines levels compared to control. However, TNF-⍺ expression levels is not significant (P>0.05) compared to control group at 14 days. Furthermore, we have found that IL-1β expression levels were remain unchanged and IL-6, TNF-⍺ expression levels were started to decrease at 14 days period compare to 7 day though it is not significant. de Molon et al (2014) has also reported increase mRNA expression of IL-1β and IL-6 at 7 days and consequent decrease with time in response to treatment which is similar result to our study [9]. The reason for this could be development of immune response into the host to resist the microbial challenge. Pro-inflammatory cytokines increases the bactericidal capacity of phagocytes and recruit additional innate cell populations into the infection sites causing dendritic cell maturation and directing the immune response to the invading microbes. 5. CONCLUSIONS The result obtained from this study suggest that the concurrent infection with E.faecalis and ligature orthodontic wire elevated the mRNA expression levels of pro-inflammatory cytokines IL-1β, IL-6 and TNF-⍺ which indicates acute inflammatory process within the periodontium. Also, study indicates ability to shift E.faecalis from commensal to pathogenic state. Further research is needed on this microorganism to better understand its potential role in periodontal disease study. ACKNOWLEDGEMENT This research was financially supported by the Publication rewards grant, GP-2020-K021271, Universiti Kebangsaan Malaysia. REFERENCES [1] Khuda, F., Najmi, N. M. A., Baharin, B., & Shaqinah, N. N. (2021). A mini review on
the associations of matrix metalloproteinases ( MMPs ) -1 , -8 , -13 with periodontal disease. AIMS molecular science, 8(1):13–31. doi: 10.3934/molsci.2021002.
[2] Ramadan, D. E., Hariyani, N., Indrawati, R., Ridwan, R. D., & Diyatri, I. (2020). Cytokines and Chemokines in Periodontitis. European journal of dentistry, 14(3), 483–495. doi: 10.1055/s-0040-1712718.
[3] Souto, R., & Colombo, A. P. (2008). Prevalence of Enterococcus faecalis in subgingival biofilm and saliva of subjects with chronic periodontal infection. Archives of oral biology, 53(2), 155–160. doi: 10.1016/j.archoralbio.2007.08.004.
[4] Ilyas, M. N., Simbak, N. B., Atif, A. B., & Adzim, M. K. R. (2017). Sample Size Calculation for Animal Studies Using Degree of Freedom (E); an Easy and Statistically Defined Approach for Metabolomics and Genetic Research. Current trends in biomedical engineering biosciences, 10(2), 47-48. doi: 10.19080/ctbeb.2017.10.555785.
51
[5] Davis, J. A. (2008). Mouse and Rat Anesthesia and Analgesia. Current protocols in neuroscience, Appendix 4. doi: 10.1002/0471142301.nsa04bs15.
[6] Li, D., Feng, Y., Tang, H., Huang, L., Tong, Z., Hu, C., Chen, X., & Tan, J. (2020). A Simplified and Effective Method for Generation of Experimental Murine Periodontitis Model. Frontiers in bioengineering biotechnology, 8, 444. doi: 10.3389/fbioe.2020.00444.
[7] Kuo, P. J., Fu, E., Lin, C. Y., Ku, C. T., Chiang, C. Y., Fu, M. M., Fu, M. W., Tu, H. P., & Chiu, H. C. (2019). Ameliorative effect of hesperidin on ligation-induced periodontitis in rats. Journal of periodontology, 90(3), 271–280. doi: 10.1002/JPER.16-0708.
[8] Livak, K. J., & Schmittgen, T. D. (2001). Analysis of relative gene expression data using real-time quantitative PCR and the 2-ΔΔCT method. Methods, 25(4), 402–408. doi: 10.1006/meth.2001.1262.
[9] de Molon, R. S., de Avila, E. D., Boas Nogueria, A. V., Chaves de Souza, J. A., Avila-Campos, M. J., de Andrade, C. R., & Cirelli, J. A. (2014). Evaluation of the host response in various models of induced periodontal disease in mice, Journal of periodontology, 85(3), 465–477. doi: 10.1902/jop.2013.130225.

52
INFORMATION TECHNOLOGY, ENGINEERING AND MATHEMATICS
53
I-CReST 2021:017-014 – Student’s Perception on Mathematics: A Case Study on Peer Mentoring Programme
*Mohd Faiez Suhaimin, Mardhiyah Ismail, Masnira Ramli, Firdawati Mohamed,
Suziana Aida Othman, Siti Farah Haryatie Mohd Kanafiah
Mathematics Department, Faculty of Computer and Mathematical Sciences, Universiti Teknologi MARA, Cawangan Kelantan, Kampus Machang, 18500 Machang, Kelantan,
Malaysia
*E-mail: [email protected]
ABSTRACT Students’ negative perceptions have a huge impact on understanding mathematics. This perception is vital and likely to affect students’ attitudes to learning and consequently, influence the students’ performance. This negative perception is believed to be one of the factors contributing to high failure rate in Pre-Calculus examination at UiTM Cawangan Kelantan. The aims of this research paper are: first, to determine the significant mean difference between student’s perception on mathematics subject and gender, second, to determine the relationship between Mentor’s Professionalism, Teaching and Learning Activities and Infrastructure towards Student’s Perception on Mathematics and third, to determine the most important factors that affect Student’s Perception on Mathematics Subject. The questionnaire was distributed to 60 students involved in Peer Mentoring Programme. The findings showed that the student’s perception towards Mathematics among student’s gender is equal. The findings also revealed that there were significant positive relationships between mentor’s professionalism (low positive correlation), teaching and learning activities (moderate positive correlation) and infrastructure (low positive correlation) towards student’s perception on Mathematics. From these three factors, only teaching and learning activities was classified as the most important factor that affect the student’s perception on Mathematics. This suggests that the peer assistance in learning (Peer Mentoring Programme) had proven to have a positive impact on student’s perception in learning Mathematics. Keywords: Mentor’s professionalism; teaching and learning activities; infrastructure; student’s perception on mathematics subject 1. BACKGROUND OF THE RESEARCH Mathematics is one of the core subjects in school’s education in Malaysia. Mathematics skills are really needed in most of other disciplines including engineering, sciences, social sciences and even the arts. The achievement for this subject has become the focus of interest among educators since it was a compulsory subject for student’s admission for most programmes offered in higher education level. Despite the importance of the subject, the number of students opted for Science, Technology, Engineering and Mathematics (STEM) based course or advanced Mathematics course in school and higher education institutions showed declining trend as reported by Yeo Bee Yin, the Minister of Energy, Science, Technology, Environment and Climate Change [13].
54
The myths about mathematics course that are claimed as a difficult course was widespread among students and continue to create the negative beliefs and perceptions about Mathematics among students in general. The negative perceptions of students regarding mathematics are believed to be one of the factors contributing to this issue. Students are more interested to choose easier subject compared to Mathematics that is always viewed negatively as one of the difficult subject to be learned. Perception of students’ interest in mathematics could depends on whether they feel the usefulness of Mathematics in their daily life or whether they get enough encouragement and support from their lecturers and peers to build positive attitude towards mathematics.
This negative perception is believed to be one of the reasons contributing to high failure rate (>25%) in Pre-Calculus course (MAT133) in UiTM Cawangan Kelantan. In response to the high failure rate in Pre-calculus examination, an initiative programme namely Peer Mentoring Programme has been carried out to supplement the lecturer’s role to help these failing students. Therefore, this research was conducted based on the feedback obtained from the Peer Mentoring Programme to determine three objectives which are first, to determine the significant mean difference between student’s perception on Pre-calculus course and gender, second, to determine the relationship between Mentor’s Professionalism, Teaching and Learning Activities and Infrastructure towards Student’s Perception of Pre-Calculus course and third, to determine the most important factors that affect Student’s Perception of Pre-Calculus course. 2. LITERATURE REVIEW Student’s Perception on Mathematics subject Student’s perception towards mathematics can be made through their comprehension or an understanding of mathematics subject [5]. Many students think mathematics as a difficult subject [18], and only meant for those who are clever or having natural born talent in mathematics and this group of students will naturally dislike the subject [8]. They are also feel difficult to learn mathematics because of the content itself which it is too theoretical and could not relate it for their daily use [11, 15]. Most students perceived mathematics as a difficult subject which the level of difficulty are varies depending on the topics [12]. Some student said mathematics could be easy or difficult depending on whether you had natural ability in the subject. The student’s insight about the difficulties of Mathematics can be changed from the influence of peer mentoring since the lesson related to mathematics can be interpreted among peers in a simpler and easier way to understand. Mentor’s Professionalism Effective ccommunication from mentor may contribute to the improvement of mentees’ academic performance [9]. This was proven true from the research conducted by [4] where the method of teaching from mentor promotes improvement in communication skills and have ability to build self-confidence among mentees. One excellent skill needed by a mentor is to be a good and active listener to their mentee’s problems or inquiries especially on the question they do not understand related to mathematics. According to [14], a highly qualified mentors are those that showed high levels of academic resiliency, good in academic standing, active students in campus, and possessed excellent interpersonal skills.
55
Teaching and Learning Activities Peer tutoring is a teaching methodology that fostering student’s engagement while enabling students to learn from each other [6]. Peer mentoring describes a relationship where a more experienced student helps a less experienced student improve overall academic performance and provides advice, support, and knowledge to the mentee [7]. In every peer mentoring session, mentor is trying to find different ways to explain in their language a content to a mentee and valuing the different procedures used to solve problem or exercises on Mathematics given to them. If mentor can explain the mathematics concepts to the peers, the confidence in their own abilities in mathematics will increase [4]. Infrastructure The infrastructure which includes the classrooms’ conditions and the teaching equipment have a significant impact in the learning progress. A conducive and comfortable classroom creates an atmosphere that encourages participation and learning among students. The research conducted by [3] revealed that several learning environments was greatly influence the academic achievement of students in Mathematics course. For a learning environment to be ideal, it is necessary to provide comfortable learning space that has good ventilation and enough equipment or tools as a support to produce effective learning outcomes from teaching and learning activities [1]. Furthermore, a study by [19] observed that the quality of classroom painting and lighting also influence the students’ academic performance in Mathematics and students can perform significantly better in an ideal learning environment rather than students taught in a dull learning environment. 3. RESEARCH METHODOLOGY
This research is categorized as a correlational research design. Correlational research design examines the relationship between variables which indicate how two or more variable are related to another variable [17]. Population and Method of Data Collection
The respondents for this research are 60 FSKM students at UiTM Cawangan Kelantan that took part in the Peer Mentoring programme which consists of students from Diploma in Mathematical Sciences (CS143) and Diploma in Computer Science (CS110) who enrolled Pre-Calculus (MAT133) subject during 2019/2020 semester. Since there are small population of 60 students, this research focusing using all students as census study. The source of data for this research is primary data which are acquired through questionnaires which adopted from [20]. The questionnaire was designed using 5-point Likert scale; strongly disagree (1), disagree (2), neutral (3), agree (4) and strongly agree (5). 4. RESEARCH FINDINGS Normality Test In statistics, normality test is used to determine whether a data set is normally distributed. This research uses skewness to measure asymmetry of the probability distribution of a random
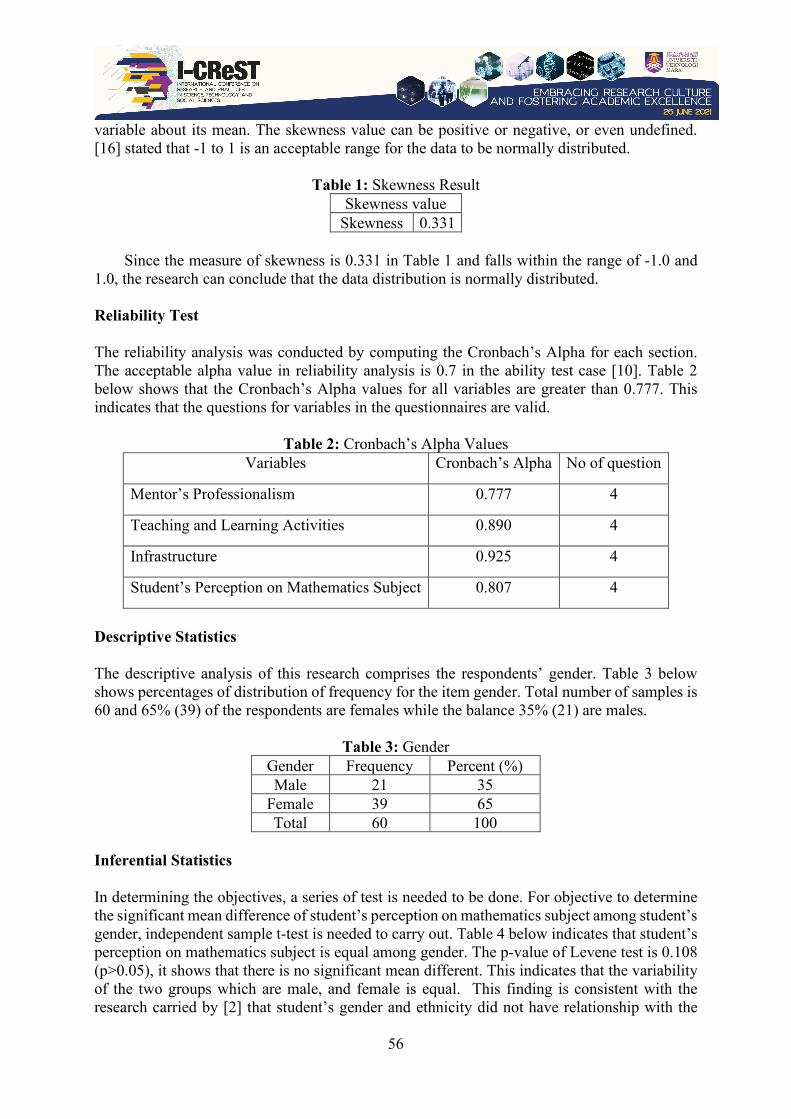
56
variable about its mean. The skewness value can be positive or negative, or even undefined. [16] stated that -1 to 1 is an acceptable range for the data to be normally distributed.
Table 1: Skewness Result
Skewness value Skewness 0.331
Since the measure of skewness is 0.331 in Table 1 and falls within the range of -1.0 and
1.0, the research can conclude that the data distribution is normally distributed. Reliability Test The reliability analysis was conducted by computing the Cronbach’s Alpha for each section. The acceptable alpha value in reliability analysis is 0.7 in the ability test case [10]. Table 2 below shows that the Cronbach’s Alpha values for all variables are greater than 0.777. This indicates that the questions for variables in the questionnaires are valid.
Table 2: Cronbach’s Alpha Values
Variables Cronbach’s Alpha No of question
Mentor’s Professionalism 0.777 4
Teaching and Learning Activities 0.890 4
Infrastructure 0.925 4
Student’s Perception on Mathematics Subject 0.807 4
Descriptive Statistics The descriptive analysis of this research comprises the respondents’ gender. Table 3 below shows percentages of distribution of frequency for the item gender. Total number of samples is 60 and 65% (39) of the respondents are females while the balance 35% (21) are males.
Table 3: Gender Gender Frequency Percent (%) Male 21 35
Female 39 65 Total 60 100
Inferential Statistics In determining the objectives, a series of test is needed to be done. For objective to determine the significant mean difference of student’s perception on mathematics subject among student’s gender, independent sample t-test is needed to carry out. Table 4 below indicates that student’s perception on mathematics subject is equal among gender. The p-value of Levene test is 0.108 (p>0.05), it shows that there is no significant mean different. This indicates that the variability of the two groups which are male, and female is equal. This finding is consistent with the research carried by [2] that student’s gender and ethnicity did not have relationship with the
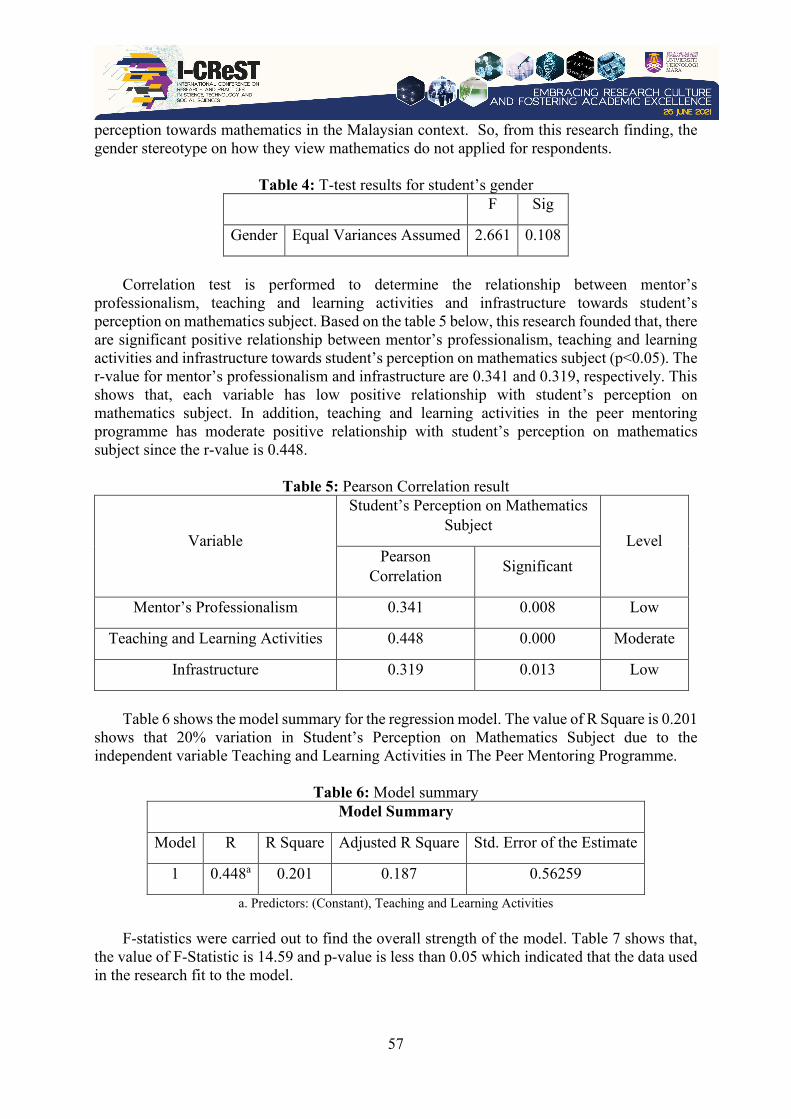
57
perception towards mathematics in the Malaysian context. So, from this research finding, the gender stereotype on how they view mathematics do not applied for respondents.
Table 4: T-test results for student’s gender F Sig
Gender Equal Variances Assumed 2.661 0.108
Correlation test is performed to determine the relationship between mentor’s
professionalism, teaching and learning activities and infrastructure towards student’s perception on mathematics subject. Based on the table 5 below, this research founded that, there are significant positive relationship between mentor’s professionalism, teaching and learning activities and infrastructure towards student’s perception on mathematics subject (p<0.05). The r-value for mentor’s professionalism and infrastructure are 0.341 and 0.319, respectively. This shows that, each variable has low positive relationship with student’s perception on mathematics subject. In addition, teaching and learning activities in the peer mentoring programme has moderate positive relationship with student’s perception on mathematics subject since the r-value is 0.448.
Table 5: Pearson Correlation result
Variable
Student’s Perception on Mathematics Subject
Level Pearson
Correlation Significant
Mentor’s Professionalism 0.341 0.008 Low
Teaching and Learning Activities 0.448 0.000 Moderate
Infrastructure 0.319 0.013 Low
Table 6 shows the model summary for the regression model. The value of R Square is 0.201
shows that 20% variation in Student’s Perception on Mathematics Subject due to the independent variable Teaching and Learning Activities in The Peer Mentoring Programme.
Table 6: Model summary
Model Summary
Model R R Square Adjusted R Square Std. Error of the Estimate
1 0.448a 0.201 0.187 0.56259
a. Predictors: (Constant), Teaching and Learning Activities
F-statistics were carried out to find the overall strength of the model. Table 7 shows that, the value of F-Statistic is 14.59 and p-value is less than 0.05 which indicated that the data used in the research fit to the model.
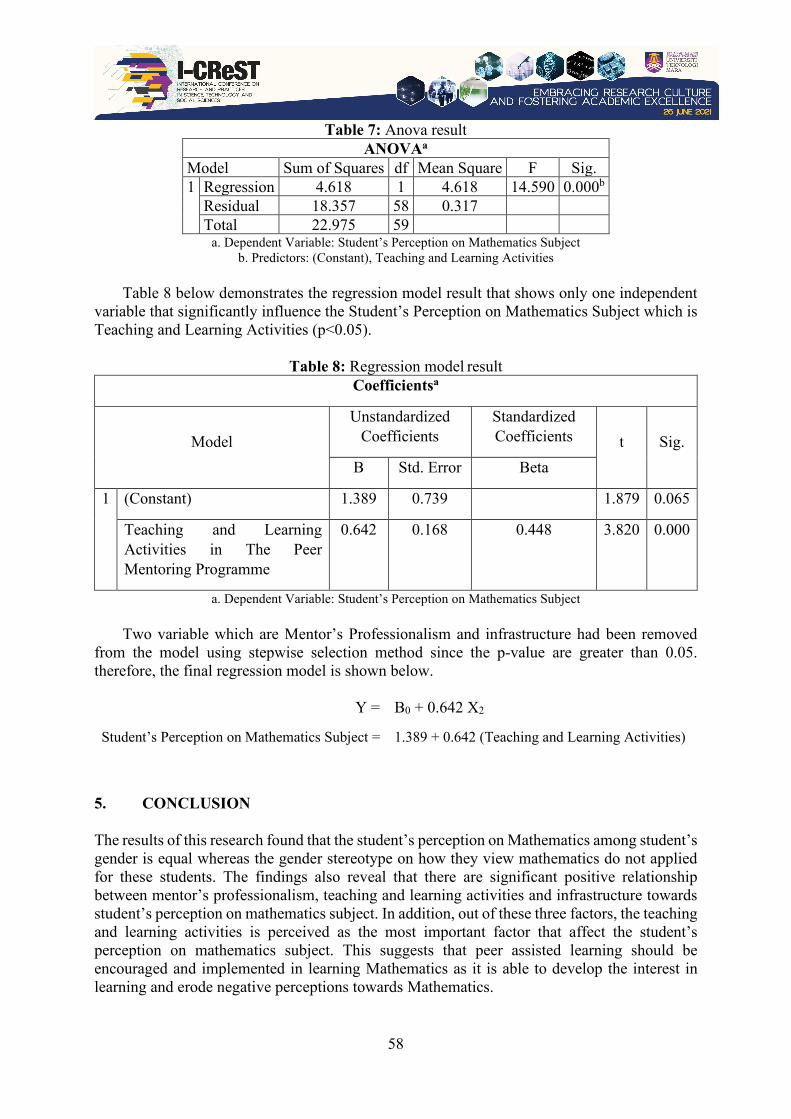
58
Table 7: Anova result ANOVAa
Model Sum of Squares df Mean Square F Sig. 1 Regression 4.618 1 4.618 14.590 0.000b
Residual 18.357 58 0.317 Total 22.975 59
a. Dependent Variable: Student’s Perception on Mathematics Subject b. Predictors: (Constant), Teaching and Learning Activities
Table 8 below demonstrates the regression model result that shows only one independent
variable that significantly influence the Student’s Perception on Mathematics Subject which is Teaching and Learning Activities (p<0.05).
Table 8: Regression model result Coefficientsa
Model Unstandardized
Coefficients Standardized Coefficients t Sig.
B Std. Error Beta
1 (Constant) 1.389 0.739 1.879 0.065
Teaching and Learning Activities in The Peer Mentoring Programme
0.642 0.168 0.448 3.820 0.000
a. Dependent Variable: Student’s Perception on Mathematics Subject
Two variable which are Mentor’s Professionalism and infrastructure had been removed from the model using stepwise selection method since the p-value are greater than 0.05. therefore, the final regression model is shown below.
Y = B0 + 0.642 X2
Student’s Perception on Mathematics Subject = 1.389 + 0.642 (Teaching and Learning Activities)
5. CONCLUSION The results of this research found that the student’s perception on Mathematics among student’s gender is equal whereas the gender stereotype on how they view mathematics do not applied for these students. The findings also reveal that there are significant positive relationship between mentor’s professionalism, teaching and learning activities and infrastructure towards student’s perception on mathematics subject. In addition, out of these three factors, the teaching and learning activities is perceived as the most important factor that affect the student’s perception on mathematics subject. This suggests that peer assisted learning should be encouraged and implemented in learning Mathematics as it is able to develop the interest in learning and erode negative perceptions towards Mathematics.

59
Future research could be conducted by using larger samples from different courses such as Calculus I and Calculus II and involved all students to improve the generalizability of the results. Besides, another variable can be included such as student’s attitude and interest. REFERENCES [1] Akinsola, M. K., Tella, A. & Tella, A. (2007): Correlates of Academic Procrastination
and Mathematics Achievement of University Undergraduate Students. Eurasia Journal of Mathematics, Science & Technology Education, 2007, 3(4), 363-370.
[2] Anith Safura Daud, Mohd Kasturi Nor Abd Aziz, Wan Nor Ashiqin Binti Wan Ali, Nor Syamimi Mohamed Adnan, Zulmaryan Embong. (2019). Students’ Perception in Learning Mathematics across Gender and Ethnicity. J. Phys.: Conf. Ser. 1529 032019.
[3] Basque, J. & Dare, S. W. (1998): Environment and Apparatuship Information. Journal of Distance Education, 13(1) ISSN 0830-0445. Borno State, Nigeria. Journal of Education and Practice, 7, 114-122.
[4] Beevers, Cliff & Paterson, Jane. (2003). Automatic Assessment of Problem-Solving Skills in Mathematics. Active Learning in Higher Education. 4. 127-144. 10.1177/14697874030042002.
[5] Chauhan, R., Bhadouria, S., & Bhakar, S. (2017). Factors affecting student’s attitude and student’s perception towards Mathematics. In 33rd Conference Paper on Creative and Innovative Excellence for World in Motion. pp (pp. 335-350).
[6] Cockerill, Maria & Craig, Nicole & Thurston, Allen. (2018). Teacher Perceptions of the Impact of Peer Learning in their Classrooms: Using Social Interdependence Theory as a Model for Data Analysis and Presentation. International Journal of Education and Practice. 6. 14-27. 10.18488/journal.61.2018.61.14.27.
[7] Colvin, Janet & Ashman, Marinda. (2010). Roles, Risks, and Benefits of Peer Mentoring Relationships in Higher Education. Mentoring & Tutoring: Partnership in Learning. 18. 121-134. 10.1080/13611261003678879.
[8] Gafoor, Kunnathodi & Kurukkan, Abidha. (2014). Construction and Validation of Scale of Parenting Style. Guru Journal of Behavioural Sciences. 2. 315-323.
[9] Ismail, A. Z. M. A. N., Alias, A. S. N. I. A. H., & Amir, A. F. (2012). Mentors' communication Styles As Predictors Of Mentees'academic Performance. Studies in Business & Economics, 7(3).
[10] Kline, P. (1999). The Handbook of Psychological Testing (2nd ed.). London: Routledge. [11] Lealdino Filho, P., Mercat, C., El-Demerdash, M., & Trgalová, J. (2016, September).
Students' Perceptions of Mathematics in Engineering Courses from Partners of MetaMath and MathGeAr Projects. In 44th SEFI Annual Conference (Vol. 12).
[12] Maureen, M. (2018). Mindset and Mathematics in an All-Girls Secondary School. PhD. Thesis. Charles Sturt University.
[13] Ministry: Waning STEM student numbers concerning. (2019, Sept. 27). Malay mail. https://www.malaymail.com/news/malaysia/2019/09/27/ministry-decline-in-students-opting-for-stem-subjects-concerning/1794928
[14] Morales, E. E., Ambrose-Roman, S., & Perez-Maldonado, R. (2016). Transmitting success: Comprehensive peer mentoring for at-risk students in developmental math. Innovative Higher Education, 41(2), 121-135.

60
[15] Mutodi, P., & Ngirande, H. (2014). The Influence of Students’ Perceptions on Mathematics Performance. A Case of a Selected High School in South Africa. Mediterranean Journal of Social Sciences, 430–445.
[16] Pallant, J. (2011). SPSS survival manual: A Step-by-Step Guide to Data Analysis Using the SPSS Program. Berkshire: Open University Press.
[17] Salkind, N. J. (2012). Exploring research. Boston: Pearson. [18] Serin, M. K., & Incikabi, S. (2017). Undergraduate Students' Perceptions of the
Mathematics Courses Included in the Primary School Teacher Education Program. European Journal of Educational Research, 6(4), 541-552.
[19] Shamaki, T. A. (2015). Influence of Learning Environment on Students’ Academic Achievement in Mathematics: A Case Study of Some Selected Secondary Schools in Yobe State – Nigeria. Journal of Education and Practice, 2015, 6(34), 40-44.
[20] Siti Farah Haryatie, M. K., & Azlina, J. (2013). Students’ Perception Towards Mathematics: Attitudes, Interest And Lecturers’ Teaching. International Symposium on Mathematical Sciences and Computing Research, 133-136.
61
I-CReST 2021:024-015 – New Algorithms for Encryption and Decryption Data using Laplace Transformation for Data Security
*1Fatimatuzahra Musa, 1Nur Syafika Atilah Zaini, 1Alif Syazwan Abdul Rahim,
1Mardhiyah Ismail
1Faculty of Computer and Mathematical Sciences, Universiti Teknologi MARA, Cawangan Kelantan, Kampus Machang, Bukit Ilmu, 18500 Machang, Kelantan, Malaysia
ABSTRACT Cryptography is derived from Greek word ‘crypto’ means secret and ‘graphy’ means writing that is used to conceal the content of a message from all except the sender and the receiver and is used to authenticate the correctness of message to the recipient. Nowadays, the increasing growth of technology has become a concern for our society in terms of the security for data and personal information. Thus, cryptography has a crucial and essential role in achieving the primary goals of security objectives, such as authentication, integrity, confidentiality and non-repudiation. This paper aimed to produce algorithms for data encryption and decryption using Laplace Transform for data security. The cryptography algorithms are then being applied to provide security for data, information and many other applications. This paper produced new algorithms for encryption and decryption data using laplace transformation for generalized hyperbolic functions. The algorithm proposed by using this method is a way to keep the data safer with higher confidentiality. The result of this research is a proof that cryptography algorithms can be applied to provide strong security. Keywords: Cryptography; laplace transforms; encryption; decryption; cipher text 1. INTRODUCTION Cryptology is one way to achieve message privacy. The history of cryptography began in the ancient past and the mathematical foundations of cryptographic systems exist without the process of creating an automatic model such as mechanical encryption. The earliest sort of cryptography was the straightforward writing of a message, as the general public couldn't read [2]. The Roman method of cryptography was referred to as the Caesar Shift Cipher like the Monoalphabetic Cipher [13]. At the end of World War I, Arthur Scherbius invented the Enigma, an electro-mechanical machine that was used for encryption and decryption of secret messages [8]. In present time, the general public key method of cryptography has seen wide adoption [3]. Problems arise when communications between multiple organizations require the utilization of the many public keys and knowing when to use which one. regardless of which method is employed, a mixture of methods applied one after the opposite will give the most effective result [14].
Nowadays, increasing growth of our technology has become a concern in our society. The new password protection not only helps secure our digital files and documents, but also

62
enhances voice recognition and gesture control, providing a degree of security for our computers and homes. Technology is convenient to use as part of daily life in human’s routine but it can also raise concern about the security of personal information especially during the Coronavirus pandemic that has infected the world for over 200 countries and territories since March 2020. With the spread of the pandemic, lockdowns have been introduced in almost all areas, stopping all activities involving human gathering and contact. The lockdown has led most individuals to connect, engage, and perform their work duties from home and internet-based services that mostly will be using the technologies [10].It is necessary to provide an efficient and secure system to protect user personal information and data such as password, personal contact details and credit card information. Low level of security systems make it easier being broken into/by others. Today, however, cryptography is widely used in a wide variety of applications, such as health services, public and private banking, and is often used in modern day-to-day applications. The personal and corporate privacy is provided at high level through cryptography, providing secure access to the recipients of the information sent [9]. There are four key security goals for cryptography such as confidentiality, integrity, auntheticity and non-repudiation. 2. LITERATURE REVIEW Information security is the biggest challenge in ensuring the secure transmission of data over the internet. Additionally, concerns about network security become important as society approaches the digital age. Information is respected and for most organizations, cyber security threats impact the business, create stability, reduce image, relationship, financial vulnerabilities and improve customer-partner relationships and productivity [11]. A research on “Information security threats: computer hacking”, stated that the aim of the investigation was to study the sources of information security threats and security threats used by the threat agent. It focuses on the meaning of hackers and the public perception of the word hacker, with particular attention to the various types of hackers in organizations and society [1]. Meanwhile, a journal on cryptography by Abdalrdha et al [15] entitled “Subject Review: Key Generation in Different Cryptography Algorithm”, studied the significance of encryption in most organizations and the importance to encrypt data, it is because the data protection is a necessary components to preserve data and information security in different organizations. This study offers a brief overview and algorithm’s analysis and provides reviews in improving network security of encryption systems.
A journal by Sujatha K et al [12] on “A review paper on cryptography and network security” is to discuss the cryptographic principles, cryptosystem types, cryptographic model and its algorithm. There are two types of cryptosystems. The first is asymmetric cryptosystems that send and receive messages using two separate keys which are also known as public key cryptosystems. Symmetric cryptosystems are the second type of cryptosystems in which both the enciphering and deciphering keys are identical and linked to each other. The difference between encryption model and decryption model is in the encryption model, plain text is converted into cipher text while in decryption model, cipher text is converted into plain text. The researcher concluded that cryptography is one of the most crucial components to provide security to data communication.
Besides that, a research done by Qadir & Varol [9] is about a review on cryptography
concepts, historical and modern algorithms. The researcher claimed that the techniques of security and skills to continue emerge depending on the continuous maturity of terminology’s
63
security. This study also introduced a few historical algorithms that have been used before public key of cryptography was introduced. The modern algorithms of public key cryptography mentioned in this study are more competent with today’s technology compared to the historical algorithms Furthermore, as for providing strong, reliable, and robust network and data security based on these both articles, thus, cryptography plays an important purpose for data security with the help of the algorithms.
A study by M. Tuncay [7] on the "Cryptanalysis of a new cryptographic method using
Laplace Transform Hyperbolic Functions" is to perform security analyses of Laplace Transform based cryptosystems. The method of encryption is carried out using the Taylor series. A few cases are given as the general attack scenario that can be used by a cryptanalyst when evaluating any transformation of Laplace based on the encryption schemes. Subsequently, there is a section that demonstrates the steps taken to carry out a cryptanalysis by applying the attack scenario given in the previous section to the proposed text encryption algorithm based on Laplace Transform. In conclusion, this method is efficient to be used as the secret key found between receiver and sender and cipher text was solved by using modular arithmetic in the proposed algorithm.
Gangupam et. al. [4] has conducted research that introduces a method of asymmetric
cryptography using laplace transform and inverse laplace transform on Maclaurin’s series to gain information and security of the network. In research, using public and private keys, they have developed asymmetric cryptography by Laplace transforms. It is observed that when working with ElGamal and RSA encryption algorithms, the encryption file has the same frequency of the recursive character, but is different from the proposed algorithm. The proposed function was more efficient and made it possible to create an adequate cryptographic algorithm. This ensures a high level of security for your network, data and passwords. 3. STANDARD RESULTS Definition 3.1 : Plain text means a message that is similar to the high-level language of human speech and is understood by the sender and anyone else who approaches the message. When plain text messages are encrypted using any suitable method that is not readable by anyone is called a cipher text. The process of converting plain text into cipher text using the appropriate method is an encryption function, while the decryption function is the process of converting cipher text into plain text. Every process of encryption and decryption has an algorithm and key that makes the cryptography process secure. The Laplace Transform: According to A. P. Hiwarekar [5], the Laplace Transform is defined as 𝐿𝐿{𝑓𝑓(𝑡𝑡)} = 𝐶𝐶(𝑠𝑠) = ∫ 𝑒𝑒−𝑠𝑠𝑠𝑠 𝑓𝑓(𝑡𝑡) ∞
0 𝑑𝑑𝑡𝑡 , 𝑓𝑓(𝑡𝑡) 𝑖𝑖𝑠𝑠 𝑎𝑎 𝑓𝑓𝑓𝑓𝑓𝑓𝑓𝑓𝑡𝑡𝑖𝑖𝑓𝑓𝑓𝑓 (3.1) 𝐿𝐿−1{𝐶𝐶(𝑠𝑠)} = 𝑓𝑓(𝑡𝑡) , 𝑖𝑖𝑠𝑠 𝑡𝑡ℎ𝑒𝑒 𝑖𝑖𝑓𝑓𝑖𝑖𝑒𝑒𝑖𝑖𝑠𝑠𝑒𝑒 𝐿𝐿𝑎𝑎𝐿𝐿𝐿𝐿𝑎𝑎𝑓𝑓𝑒𝑒 𝑇𝑇𝑖𝑖𝑎𝑎𝑓𝑓𝑠𝑠𝑓𝑓𝑓𝑓𝑖𝑖𝑇𝑇 (3.2) Theorem: Laplace Transform is a linear transform. That is, if
𝐿𝐿{𝑓𝑓1(𝑡𝑡)} = 𝐶𝐶1(𝑠𝑠), 𝐿𝐿{𝑓𝑓2(𝑡𝑡)} = 𝐶𝐶2(𝑠𝑠), (3.3) then
64
𝐿𝐿{𝑓𝑓1𝑓𝑓1(𝑡𝑡) + 𝑓𝑓2𝑓𝑓2(𝑡𝑡)} = 𝑓𝑓1𝐿𝐿{𝑓𝑓1(𝑡𝑡)} + 𝑓𝑓2𝐿𝐿{𝑓𝑓2(𝑡𝑡)} (3.4)
where 𝑓𝑓1 and 𝑓𝑓2 are constant [5]. In this paper we are assuming that all the considered functions are such that their Laplace Transform exists. We also assume that N is the set of natural numbers [6]. We need the following standard results:
1. 𝐿𝐿{𝑠𝑠𝑖𝑖𝑓𝑓ℎ 𝑖𝑖𝑡𝑡} = 𝑟𝑟𝑠𝑠2−𝑟𝑟2, 𝐿𝐿−1{ 𝑟𝑟
𝑠𝑠2=𝑟𝑟2} = 𝑠𝑠𝑖𝑖𝑓𝑓ℎ 𝑖𝑖𝑡𝑡
(3.5)
2. 𝐿𝐿{𝑡𝑡𝑛𝑛} = 𝑛𝑛!
𝑠𝑠𝑛𝑛+1, 𝐿𝐿−1{ 𝑛𝑛!𝑠𝑠𝑛𝑛+1} = 𝑡𝑡𝑛𝑛, 𝑓𝑓 ∈ 𝑁𝑁
(3.6)
3. 𝐿𝐿{𝑡𝑡𝑛𝑛𝑓𝑓(𝑡𝑡)} = (− 𝑑𝑑
𝑑𝑑𝑠𝑠)𝑛𝑛𝐶𝐶(𝑠𝑠), 𝐿𝐿−1{𝑡𝑡𝑛𝑛𝐶𝐶(𝑠𝑠)} = 𝑡𝑡𝑛𝑛𝑓𝑓(𝑡𝑡),
(3.7)
4. MAIN RESULTS Encryption We consider standard expansion 𝑠𝑠𝑖𝑖𝑓𝑓ℎ 𝑖𝑖𝑡𝑡 = 𝑖𝑖𝑡𝑡 + 𝑟𝑟3𝑠𝑠3
3!+ 𝑟𝑟5𝑠𝑠5
5!+ 𝑟𝑟7𝑠𝑠7
7!+. . . + 𝑟𝑟2𝑖𝑖+1𝑠𝑠2𝑖𝑖+1
(2𝑖𝑖+1)1+. . . +. .. (4.1)
= ∑ (𝑟𝑟𝑠𝑠)2𝑖𝑖+1
(2𝑖𝑖+1)!𝑛𝑛𝑖𝑖=0
where r𝜖𝜖 𝑁𝑁 is a constant, and 𝑡𝑡2𝑠𝑠𝑖𝑖𝑓𝑓ℎ 3𝑡𝑡 = 3𝑡𝑡3 + 33𝑠𝑠5
3!+ 35𝑠𝑠7
5!+ 37𝑠𝑠9
7!+. . . + 32𝑖𝑖+1𝑠𝑠2𝑖𝑖+3
(2𝑖𝑖+1)!+. . . +. ..
(4.2)
= ∑ 32𝑖𝑖+1𝑠𝑠2𝑖𝑖+3
(2𝑖𝑖+1)!∞𝑖𝑖=0
We allocated 0 to A and 1 to B then Z will be 25. Let given message called plaintext to be ‘CRYPTOGRAPHY’, it is equivalent to 2 17 24 15 19 14 6 17 0 15 7 24.

65
Let us assume that 𝐺𝐺0,0 = 2, 𝐺𝐺1,0 = 17, 𝐺𝐺2,0 = 24, 𝐺𝐺3,015, 𝐺𝐺4,0 = 19, 𝐺𝐺5,0 = 14, 𝐺𝐺6,0 = 6, 𝐺𝐺7,0 = 17, 𝐺𝐺8,0 = 0, 𝐺𝐺9,0 = 15, 𝐺𝐺10,0 = 7, 𝐺𝐺11,0 = 24. 𝐺𝐺𝑛𝑛,0 = 0 for 𝑓𝑓 ≥ 11 Writing these numbers as a coefficients of 𝑡𝑡2𝑠𝑠𝑖𝑖𝑓𝑓ℎ 3𝑡𝑡, and assuming, 𝑓𝑓(𝑡𝑡) = 𝐺𝐺𝑡𝑡2𝑠𝑠𝑖𝑖𝑓𝑓ℎ3𝑡𝑡, we get f(t) = t2[G0,03t + G1,0
33t3
3!+ G2,0
35t5
5!+ G3,0
37t9
7!+ G4,0
39t11
9!+ G5,0
311t13
11!+ G6,0
313t15
13!+
G7,0315t17
15!+ G8,0
317t19
17!!+ G9,0
319t21
19!+ G10,0
321t23
21!+ G11,0
323t25
23!]
= ∑ 32i+1t2i+3Gi,0(2i+1)!
∞i−0
(4.3)
= 2 3𝑠𝑠3
1!+ 17 33𝑠𝑠5
3!+ 24 35𝑠𝑠7
5!+ 15 37𝑠𝑠9
7!+ 19 39𝑠𝑠11
9!+ 14 311𝑠𝑠13
11!+ 6 313𝑠𝑠15
13!+ 17 315𝑠𝑠17
15!+
0 317𝑠𝑠19
17!!+ 15 319𝑠𝑠21
19!+ 7 321𝑠𝑠23
21!+ 24 323𝑠𝑠25
23!.
(4.4)
Taking Laplace Transform on both side we have
𝐿𝐿{𝑓𝑓(𝑡𝑡)} = 𝐿𝐿{𝐺𝐺𝑡𝑡2𝑠𝑠𝑖𝑖𝑓𝑓ℎ3𝑡𝑡} = 36
𝑠𝑠4 + 9180𝑠𝑠6 + 244944
𝑠𝑠8 + 2361960𝑠𝑠10 + 41137470
𝑠𝑠12 + 386889048𝑠𝑠14 + 2008846980
𝑠𝑠16 + 66349345968𝑠𝑠18 +
7322247242100𝑠𝑠22 + 37050571045026
𝑠𝑠24 + 1355661775108800𝑠𝑠26
(4.5)
Adjusting the resultant values 36 9180 244944 2361960 41137470 386889048 2008846980 66349345968 0 7322247242100 37050571045026 1355661775108800 to mod 26 that is 36= 10 mod 26, 9180= 2 mod 26, 244944= 24 mod 26, 2361960= 16 mod 26, 41137470= 10 mod 26, 386889048= 0 mod 26, 2008846980= 10 mod 26, 66349345968= 22 mod 26,

66
0= 0 mod 26, 7322247242100= 24 mod 26, 37050571045026= 6 mod 26, 355661775108800= 16 mod 26. Sender sends the values 1 353 9420 90844 1582210 14880348 77263345 2551897921 0 281624893926 1425021963270 52140837504184 as a key, assuming 𝐺𝐺0,1 = 10, 𝐺𝐺1,1 = 2, 𝐺𝐺2,1 = 24, 𝐺𝐺3,1 = 16, 𝐺𝐺4,1 = 10, 𝐺𝐺5,1 = 0, 𝐺𝐺6,1 = 10, 𝐺𝐺7,1 = 22, 𝐺𝐺8,1 = 0, 𝐺𝐺9,1 = 24, 𝐺𝐺10,1 = 6, 𝐺𝐺11,1 = 16. 𝐺𝐺𝑛𝑛,1 = 0 for 𝑓𝑓 ≥ 11 The given plaintext gets converted to cipher text 10 2 24 16 10 0 10 22 0 24 6 16 Here message ‘CRYPTOGRAPHY’ gets converted to ‘KCYQKAKWAYGQ’ Decryption For the decryption of the received text, we proceed in the reverse direction using inverse Laplace transform. Suppose we have received message as ‘KCYQKAKWAYGQ’ which is equivalent to 10 2 24 16 10 0 10 22 0 24 6 16 Let assume that 𝐺𝐺0,1 = 10, 𝐺𝐺1,1 = 2, 𝐺𝐺2,1 = 24, 𝐺𝐺3,1 = 16, 𝐺𝐺4,0 = 10, 𝐺𝐺5,0 = 0, 𝐺𝐺6,1 = 10, 𝐺𝐺7,1 = 22, 𝐺𝐺8,1 = 0, 𝐺𝐺9,1 = 24, 𝐺𝐺10,1 = 6, 𝐺𝐺11,1 = 16. 𝐺𝐺𝑛𝑛,1 = 0 for 𝑓𝑓 ≥ 11 using mod n as the key, we get 𝑘𝑘𝑖𝑖,0, 𝑖𝑖 = 0,1,2,3, . .. 1 353 9420 90844 1582210 14880348 77263345 2551897921 0 281624893926 1425021963270 52140837504184 and assuming ,
𝑞𝑞𝑖𝑖,0 = 𝐺𝐺𝑖𝑖,1 + 𝑘𝑘𝑖𝑖,0, 𝑖𝑖 = 0,1,2,3, . .. (4.6) We consider
𝐺𝐺(−𝑑𝑑
𝑑𝑑𝑠𝑠)2 3
(𝑠𝑠2 − 32)
= 36𝑠𝑠4 + 9180
𝑠𝑠6 + 244944𝑠𝑠8 + 2361960
𝑠𝑠10 + 41137470𝑠𝑠12 + 386889048
𝑠𝑠14 + 2008846980𝑠𝑠16 + 66349345968
𝑠𝑠18 +
67
7322247242100𝑠𝑠22 + 37050571045026
𝑠𝑠24 + 1355661775108800𝑠𝑠26
= ∑ 𝑞𝑞𝑖𝑖,0𝑠𝑠2𝑖𝑖+4
𝑛𝑛𝑖𝑖=0
(4.7)
Taking inverse Laplace Transform we get 𝑓𝑓(𝑡𝑡) = 𝐺𝐺𝑡𝑡2𝑠𝑠𝑖𝑖𝑓𝑓ℎ3𝑡𝑡
= 2 3𝑠𝑠3
1!+ 17 33𝑠𝑠5
3!+ 24 35𝑠𝑠7
5!+ 15 37𝑠𝑠9
7!+ 19 39𝑠𝑠11
9!+ 14 311𝑠𝑠13
11!+ 6 313𝑠𝑠15
13!+ 17 315𝑠𝑠17
15!+
0 317𝑠𝑠19
17!!+ 15 319𝑠𝑠21
19!+ 7 321𝑠𝑠23
21!+ 24 323𝑠𝑠25
23!
𝑓𝑓(𝑡𝑡) = 𝑡𝑡2[𝐺𝐺0,03𝑡𝑡 + 𝐺𝐺1,033𝑠𝑠3
3!+ 𝐺𝐺2,0
35𝑠𝑠5
5!+ 𝐺𝐺3,0
37𝑠𝑠9
7!+ 𝐺𝐺4,0
39𝑠𝑠11
9!+ 𝐺𝐺5,0
311𝑠𝑠13
11!+ 𝐺𝐺6,0
313𝑠𝑠15
13!+
𝐺𝐺7,0315𝑠𝑠17
15!+ 𝐺𝐺8,0
317𝑠𝑠19
17!!+ 𝐺𝐺9,0
319𝑠𝑠21
19!+ 𝐺𝐺10,0
321𝑠𝑠23
21!+ 𝐺𝐺11,0
323𝑠𝑠25
23!]
(4.8)
Here we get , 𝐺𝐺0,0 = 2, 𝐺𝐺1,0 = 17, 𝐺𝐺2,0 = 24, 𝐺𝐺3,015, 𝐺𝐺4,0 = 19, 𝐺𝐺5,0 = 14, 𝐺𝐺6,0 = 6, 𝐺𝐺7,0 = 17, 𝐺𝐺8,0 = 0, 𝐺𝐺9,0 = 15, 𝐺𝐺10,0 = 7, 𝐺𝐺11,0 = 24. The received message, 2 17 24 15 19 14 6 17 0 15 7 24 C R Y P T O G R A P H Y The given ciphertext message is converted back to plain text and equivalent to ‘CRYPTOGRAPHY’. Theorem: The given cipher text in terms of 𝐺𝐺𝑖𝑖,1, 𝑖𝑖 = 1,2,3, . ..,with a given key 𝑘𝑘𝑖𝑖,0, 𝑖𝑖 = 0,1,2,3, . .., can be converted to plain text 𝐺𝐺𝑖𝑖,0under the inverse Laplace Transform of 𝐺𝐺(− 𝑑𝑑
𝑑𝑑𝑠𝑠)2 3
(𝑠𝑠2−32)= ∑ 𝑞𝑞𝑖𝑖,0
𝑠𝑠2𝑖𝑖+4𝑛𝑛𝑖𝑖=0 ,
(4.9) where
𝐺𝐺𝑖𝑖,0 = 26𝑘𝑘𝑖𝑖,0+𝐺𝐺𝑖𝑖,122𝑖𝑖+1(2𝑖𝑖+2)(2𝑖𝑖+3)
, 𝑖𝑖 = 0,1,2,3, . .., (4.10) and
𝑞𝑞𝑖𝑖,0 = 𝐺𝐺𝑖𝑖,0 + 26𝑘𝑘𝑖𝑖,0, 𝑖𝑖 = 0,1,2,3, . . . . (4.11) Illustrative Examples Using the similar methods in the main results 4.1, if we have original messages 'CRYPTOGRAPHY’, then its get converted to
68
1. ‘IQWIAAIUAMEU’ for r = 5. 2. ‘GKMGCAGGAWGS’ for r = 7. Meanwhile, based on the similar methods in main result 4.2 for decryption, we can convert the received messages again into original messages for any values of the function [6]. 5. DISCUSSION 1. The similar outcomes can be obtained by using Laplace transform of a suitable function. Thus, expansion of this work is possible. 2. In this work we develop a cryptographic scheme using Laplace Transforms and the key is the number of multiples of mod n. Therefore it is very difficult for an eyedropper to trace the key by any attacks. 6. CONCLUSION This paper shows the proposed symmetrical encryption algorithm by Hiwarekar in which the secret key between sender and receiver is detected using molecular arithmetic and the cipher text is solved. Specifically, the proposed encryption algorithm can be broken without knowing the key by simply looking at encrypted text, so this method can give secure data and information systems through the creation of algorithms and ciphers to protect them. This paper provides a better understanding of the various algorithms used in cryptography and their various advantages and disadvantages. It will also help students and researchers in their studies related to the security of systems. The concept of security modeling is presented in the context of cryptography and next-generation cryptography. The main challenge in this study is the implementation of the existing cryptographic method. Its security is dependent on the complexity of the problem. Cryptanalysis can be used for further research of data security with higher confidentiality based on algorithms produced in this paper. ACKNOWLEDGEMENT Authors are thankful to University Technology Mara (UiTM) for the financial support to this work under research project ‘New Algorithms for Encryption and Decryption Data using Laplace Transformation for Data Security’. REFERENCES [1] Alsalim, M., Alsalim, A. M., Al-madhagi, A. H. G., & Shahen, S. M. (2017, 01).Information security threats: Computer hacking. International Journal of Research,5, 349-356. doi: 10.21474/IJAR01/2753 [2] Cohen, F (1990). A short history of cryptography. Retrieved from http://www.all.net/books/ip/Chap2-1.html New World Encyclopedia (2007). [3] Damico, T. M. (2009). "A Brief History of Cryptography." Inquiries Journal/Student
Pulse, 1(11). Retrieved from http://www.inquiriesjournal.com/a?id=1698 [4] G. Nagalakshmi, A. Chandra Sekhar, D. Ravi Sankar (2020). Asymmetric key
Cryptography using Laplace Transform. Retrieved from http://www.ijitee.org/wp- content/uploads/papers/v9i4/D2007029420.pdf
[5] Hiwarekar, A. P. (2012). A new method of cryptography using laplace transform. International Journal of Mathematical Archive EISSN 2229-5046, 3(3). Retrieved
69
from http://www.ijma.info/ index.php/ijma/article/view/1087/635 [6] Hiwarekar A. P. (2014), New Mathematical Modelling For Cryptography, Journal of
Information Assurance and Security. Retrieved from https://www.researchgate.net/publication/301585534_New_Mathematical_Modeling_ For_Cryptography
[7] M. Tuncay, G. (2017). Numerical analysis and applications cryptanalysis of a new method of cryptography using laplace transform hyperbolic functions. Cryptanalysis of A New Method of Cryptography using Laplace Transform Hyperbolic Functions, 8, 183-189.
[8] Nicholas G. McDonald (n.d.). A Review Paper on Past,Present, and Future Methods of Cryptography and Data Encryption. Retrieved from https://my.eng.utah.edu/~nmcdonal/Tutorials/EncryptionResearchReview.pdf
[9] Qadir, A. M., & Varol, N. (2019). A review paper on cryptography. In 2019 7th
international symposium on digital forensics and security (p. 1-6). doi: 10.1109/ISDFS.2019.8757514
[10] Rahul De’, Neena Pandey, Abhipsa Pal. (2020). ‘Impact of digital surge during Covid- 19 pandemic: A viewpoint on research and practice’, International Journal of Information Management, vol. 55, p. 102171. Retrieved from https://www.ncbi.nlm.nih.gov/pmc/arti-cles/PMC7280123
[11] Sandeep Tayal, Nipin Gupta, Pankaj Gupta, Deepak Goyal, and Monika Goyal (2017). A review paper on network security and cryptography.vol, 10:763–770, 2017
[12] Sujatha .K, D.Ramya Devi Kala Rathinam. D (2018), A Review Paper on Cryptography and Network Security. International Journal of Pure and Applied Mathematics (Volume119, No. 17), Retrieved from https://acadpubl.eu/hub/2018-119- 17/4/416.pdf
[13] Taylor, K. (2002, July 31). Number theory 1. Retrieved May 4, 2009, from http://math.usask.ca/encryption/lessons/lesson00/page1.html
[14] Whitman, M. & Mattord, H. (2005). Principles of information security. [University of Phoenix Custom Edition e-text]. Canada, Thomson Learning, Inc. Retrieved May 4, 2009, from University of Phoenix, rEsource, CMGT/432
[15] Zainab Khyioon Abdalrdha, Iman Hussein Al-Qinani and Farah Neamah Abbas, (2019). Subject Review:Key Generation in Different Cryptography Algorithms. DOI: 10.32628/IJSRSET196550
70
I-CReST 2021:046-028 – A Review: Education Research in Electrical and Electronic Engineering
*1Muhammad Ridzuan Idris, 1Irdayanti Mat Nashir, 1Shaiful Hazmir Shaifuddin
1Faculty of Technical and Vocational, Universiti Pendidikan Sultan Idris, Tanjung Malim
Perak, Malaysia
*E-mail: [email protected]
ABSTRACT Electrical and Electronic Engineering education is one of the most important fields in the needed Industrial Revolution (IR 4.0) Era. However, education studies related to the field of Electrical and Electronic Engineering are rarely conducted. Therefore, a study on the latest Electrical and Electronic Engineering in education is needed. This paper aims to review the effectiveness of the research of Electrical and Electronic Engineering in education and to define future research perspectives of technology in education. A review protocol consisting of both automatic and manual searches is used to ensure the retrieval of all relevant studies. The findings show almost of Electrical and Electronics Engineering education research shows its effectiveness and improve the understanding of the subject to be studied. In other views, we also prospect the future research perspectives of Electrical and Electronics Engineering education and propose that more rigorous intervention studies could be conducted to further explore the integration of Electrical and Electronic Engineering and other educational fields. Keywords: Engineering education; electrical; electronic
1. INTRODUCTION Electrical and electronic engineering is one of the important fields in the era industrial revolution (IR 4.0). Electrical engineering, including the study of modern electronics and microelectronics, forms the basis of many technical sciences. Usually, it is taught in a particular volume in any institution of higher education, irrespective of the subfield chosen[1]. Electrical is a branch of engineering which is related to the study, design, equipment, and system that uses the concept of electrical, electronic, or electromagnetic. Electronics, on the other hand, are one of the branches of the electrical field that uses non-linear and active electrical components such as semiconductor devices that usually work to control electrical circuits and systems. Therefore, electrical and electronics are closely related to each other and form the basis of most electrical machinery and equipment.
Electrical and electronic technology is an important connecting link between the preceding and the following in the whole teaching scheme. With the rapid development in science and technology, new devices, new technology and new method come forth continuously[2]. Electrical and electronic technology is one of the technology fields which have the most rapidly developing speed, so the course of electrical and electronic technology is taking on more and more heavy teaching responsibilities[3]. This field also involves many practical areas where it
71
examines teaching aids in achieving the effectiveness of teaching more effectively. Therefore, the teaching and learning process of this field requires a more comprehensive study to create more effective teaching methods. Most studies related to education in engineering generally and not specific to the field of electrical and electronics.
The study of the field of electrical and electronics is more focused on systems, equipment,
fundamentals, and others but education studies related to this field are rarely conducted. Notwithstanding, electrical and electronics engineering becomes more important and widely used; studies on this electrical and electronics education field are still at the middle level. Since then, this paper will discuss the elements in electrical and electronic education that can guide another researcher in this field.
The main contribution of this paper is to explore the relevant experience of electrical and
electronics education with theoretical support for future research. A systematic literature review allows us to design and conduct:
(a) find the research area of electrical and electronics on educational perspective. (b) Summarize proof of the application of educational aids and focus on learning
theories. (c) Suggest future directions for the researcher to improve electrical and electronics
education based on the literature reviewed. 2. METHOD Data Collection This study aims to elicit meaningful research trends through reviewing existing literature about electrical and electronics education. To establish a reliable literature review, we referred to the systematic review process. A systematic literature review is a strategy that comprises discovering, reading linked papers based on research questions, assessing, and creating utilizing systematic and explicit procedures to choose and critically evaluate relevant research. The review method of the present study was conducted by using Scopus as the primary journal database and Google Scholar as a secondary database. This approach appears to have gained popularity in recent years, as it is frequently looked at or searched in Google Scholar and Scopus as more researchers are hoping to use it in their respective investigations.
The systematic review approach included many steps. The initial step was to determine the terms utilized in the search process. Keywords that were comparable to and connected to electrical and electrical engineering education were used based on previous research and a thesaurus. In particular, the keywords employed in the Scopus and Google Scholar database search for this study were in Table 1.
Table 1: Keyword Search setting Database Keyword Search Setting Scopus TITLE-ABS-KEY ( ( electrical* OR electric* OR "electronics*" )
AND ( engineering* OR technology* OR engineer* ) AND ( education* OR training* ) )
Scholar with all of the words: education with at least one of the words: electrical; electronic; education

72
The first phase yielded 50 items from the search database. These keywords were wide enough to collect the most relevant articles while excluding the less relevant ones. A few inclusion and exclusion criteria were specified in the second step. To begin, electrical and electronic engineering only was chosen as the main keyword. Secondly, the searching efforts had excluded the non-education research and instead focussed only on articles published for education purposes. Data Analysis In the process of analyzing 50 articles, we read the whole of each article and outlined the basic information presented. We comprehensively reviewed each research study for the following key characteristics: electrical, electronic, engineering research methodologies, and theoretical frameworks. Then, we analyzed and systematically categorized patterns of our analysis results. In the findings section, we present our review of the research on electrical and electronic engineering education. Although the findings incorporate our opinions and commentary, they are summarized results with appropriate references. 3. RESULT AND DISCUSSION Electrical and Electronics Engineering Education Research Area In this Industrial Revolution (I.R 4.0) era, the research related to electrical, and electronics education becomes increasing. This shows that researchers are aware of the importance of this field in the future. From the paper reviewed, there are several classifications of study areas in this field. The main area is classified into three main ideas. Figure 1 shows a research area chart based on the review done on this study.
Figure 1: Electrical and Electronics Engineering Education Research Area
A teaching aid is anything that a teacher uses to assist in the delivery of a lesson or to make it more engaging and successful for students. Teaching aids also a crucial medium in the
Electrical and Electronics Engineering
Education Research Area
Learning Aids
Teaching
Technique/Method
Teaching
Review Study
73
teaching and learning process. It’s can help teachers to explain the concepts related to the lesson taught while ensuring the students can better understand the lesson taught by the teacher. The effectiveness of teaching aids can help to increase the cognitive level of students[4]. The main area of electrical and electronics engineering education is teaching aid study. [5-9] among researchers who have done research on electrical teaching aids, while [10-15] is among research study about electronics teaching aids. Based on the literature review, most publications on teaching aids in the field of electrical and electronics go into further detail on technical product development, but researchers seldom perform education-based investigations. This is because most of the researchers that published the study solely had an engineering background. As a result, the discussion of educational studies in their essay is brief.
The word "teaching technique" refers to the fundamental ideas, pedagogy, and classroom
management tactics that are employed in the classroom. In this area, the researcher study about the implementation of the current teaching technique or teaching methods such as Problem Based Learning (PBL), E-Learning, and student-centered learning. The implementation of Problem Based Learning (PBL) has had a more effective impact on the teaching and learning process of electrical and electronic engineering [16-19]. Learning in the field of electric and electronic engineering using E-learning also has a greater effect and provides an advantage in information transfer[20- 22].
Some researchers have also reviewed electrical and electrical engineering studies from the
perspective of education. [23] has made an article review about electronic engineering design free software tools.[16] has discussed Problem Based Learning (PBL) in his review paper. [1] has also provided an overview of the teaching of electrical and electronics engineering at technical Universities in the world. However, a detailed study of Electrical and Electronics Engineering Education is still in its infancy. Therefore, this article will review electrical and electronic from the perspective of education in details. Application of Learning Aid in Electrical and Electronics Education Various learning kits are available in different domains for teaching and research, [6-9], [13-14],[24-33]. In this section, few examples of currently feasible learning aids are discussed. The article research regarding electrical and electronics training aids published over a six-year period was chosen (between 2016 and 2021).
Zaliza et al.[8] develop basic electrical circuit kit as learning aids for design and technology
subjects. The product development as teaching aids can help to overcome the problem faced during the process of teaching and facilitating, especially the problem faced in the electrical subject and at the same time can help to improve the success of learning the subject. The researcher uses the Waterfall model as the basis of product development in which comprises several steps such as planning, analysis, design, and implementation. The implication of this research development is that it can help to produce teaching aids that further enhance the student understanding thus improved student achievement in relation to basic electrical circuits.
Michael et al. [6] develop and study about perception and use of the Electronic Trainer Kit
(ETK) by students in the laboratory session. Electronics Trainer Kit (ETK) is a device that functions as a tool for the teaching and learning process and for testing electronic circuits. The effectiveness of using this trainer kit in educational settings has been evaluated through a survey on students 25 students that had attended Electrical Technology and Measurement course.
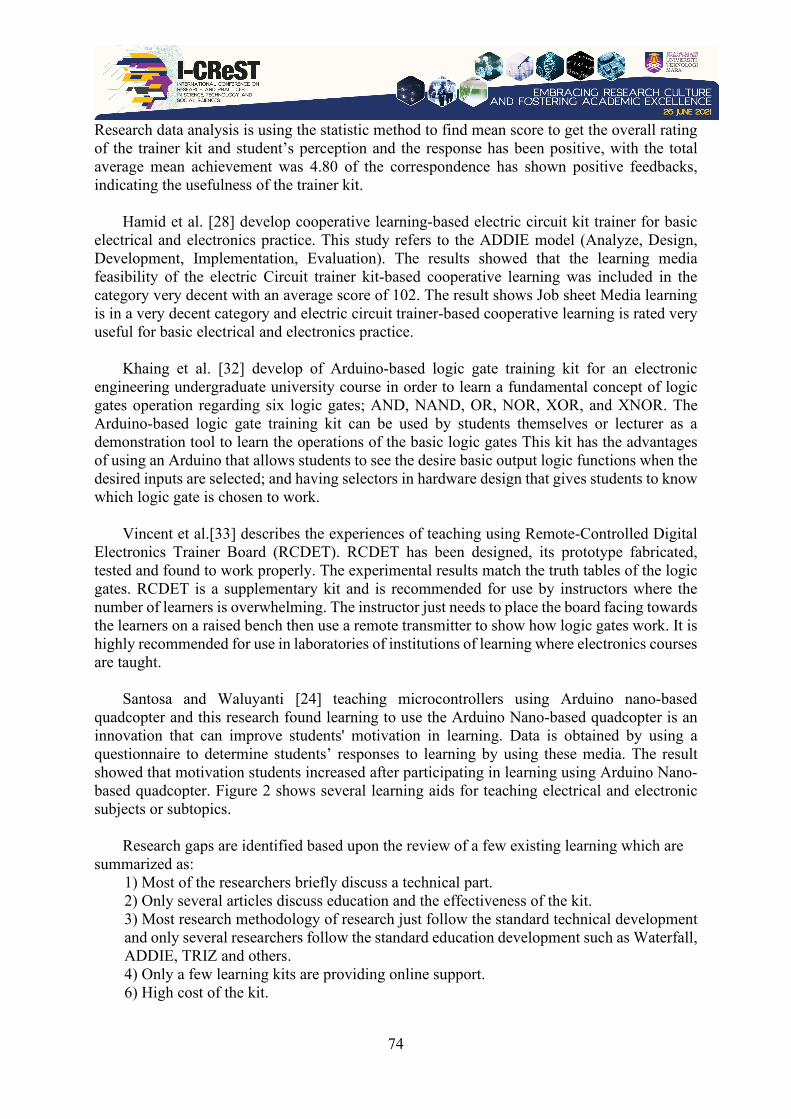
74
Research data analysis is using the statistic method to find mean score to get the overall rating of the trainer kit and student’s perception and the response has been positive, with the total average mean achievement was 4.80 of the correspondence has shown positive feedbacks, indicating the usefulness of the trainer kit.
Hamid et al. [28] develop cooperative learning-based electric circuit kit trainer for basic
electrical and electronics practice. This study refers to the ADDIE model (Analyze, Design, Development, Implementation, Evaluation). The results showed that the learning media feasibility of the electric Circuit trainer kit-based cooperative learning was included in the category very decent with an average score of 102. The result shows Job sheet Media learning is in a very decent category and electric circuit trainer-based cooperative learning is rated very useful for basic electrical and electronics practice.
Khaing et al. [32] develop of Arduino-based logic gate training kit for an electronic
engineering undergraduate university course in order to learn a fundamental concept of logic gates operation regarding six logic gates; AND, NAND, OR, NOR, XOR, and XNOR. The Arduino-based logic gate training kit can be used by students themselves or lecturer as a demonstration tool to learn the operations of the basic logic gates This kit has the advantages of using an Arduino that allows students to see the desire basic output logic functions when the desired inputs are selected; and having selectors in hardware design that gives students to know which logic gate is chosen to work.
Vincent et al.[33] describes the experiences of teaching using Remote-Controlled Digital
Electronics Trainer Board (RCDET). RCDET has been designed, its prototype fabricated, tested and found to work properly. The experimental results match the truth tables of the logic gates. RCDET is a supplementary kit and is recommended for use by instructors where the number of learners is overwhelming. The instructor just needs to place the board facing towards the learners on a raised bench then use a remote transmitter to show how logic gates work. It is highly recommended for use in laboratories of institutions of learning where electronics courses are taught.
Santosa and Waluyanti [24] teaching microcontrollers using Arduino nano-based
quadcopter and this research found learning to use the Arduino Nano-based quadcopter is an innovation that can improve students' motivation in learning. Data is obtained by using a questionnaire to determine students’ responses to learning by using these media. The result showed that motivation students increased after participating in learning using Arduino Nano-based quadcopter. Figure 2 shows several learning aids for teaching electrical and electronic subjects or subtopics.
Research gaps are identified based upon the review of a few existing learning which are
summarized as: 1) Most of the researchers briefly discuss a technical part. 2) Only several articles discuss education and the effectiveness of the kit. 3) Most research methodology of research just follow the standard technical development and only several researchers follow the standard education development such as Waterfall, ADDIE, TRIZ and others. 4) Only a few learning kits are providing online support. 6) High cost of the kit.
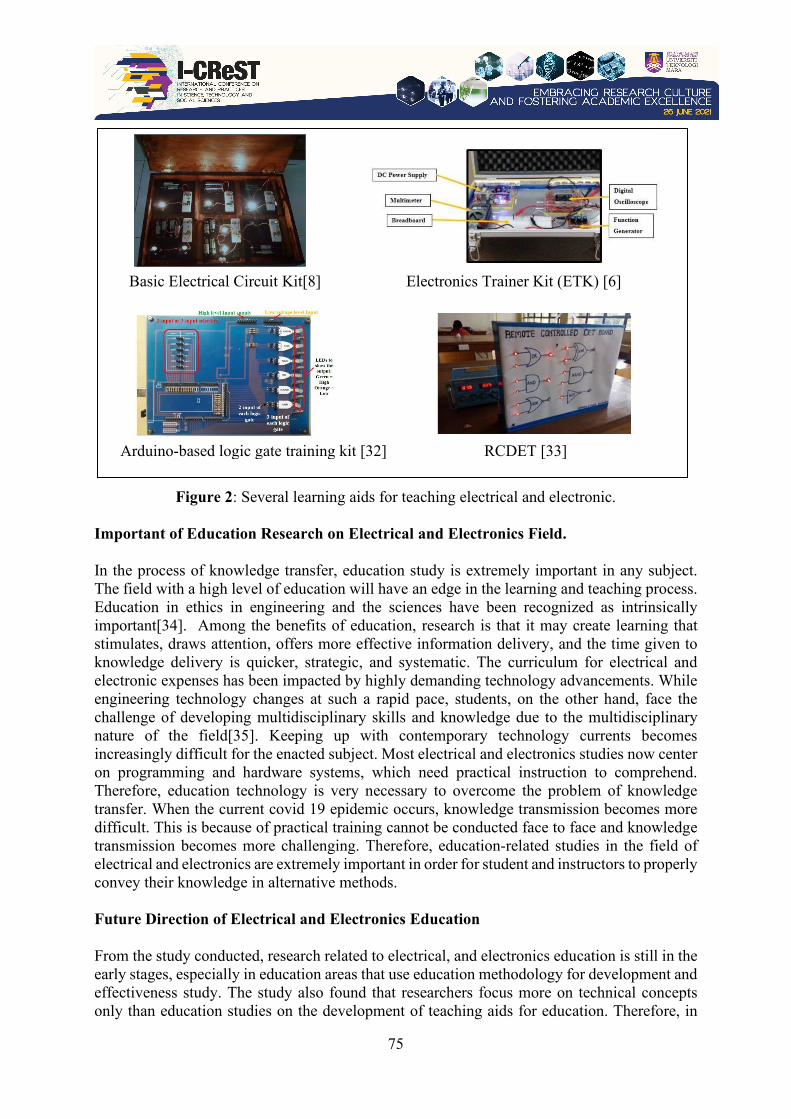
75
Figure 2: Several learning aids for teaching electrical and electronic.
Important of Education Research on Electrical and Electronics Field. In the process of knowledge transfer, education study is extremely important in any subject. The field with a high level of education will have an edge in the learning and teaching process. Education in ethics in engineering and the sciences have been recognized as intrinsically important[34]. Among the benefits of education, research is that it may create learning that stimulates, draws attention, offers more effective information delivery, and the time given to knowledge delivery is quicker, strategic, and systematic. The curriculum for electrical and electronic expenses has been impacted by highly demanding technology advancements. While engineering technology changes at such a rapid pace, students, on the other hand, face the challenge of developing multidisciplinary skills and knowledge due to the multidisciplinary nature of the field[35]. Keeping up with contemporary technology currents becomes increasingly difficult for the enacted subject. Most electrical and electronics studies now center on programming and hardware systems, which need practical instruction to comprehend. Therefore, education technology is very necessary to overcome the problem of knowledge transfer. When the current covid 19 epidemic occurs, knowledge transmission becomes more difficult. This is because of practical training cannot be conducted face to face and knowledge transmission becomes more challenging. Therefore, education-related studies in the field of electrical and electronics are extremely important in order for student and instructors to properly convey their knowledge in alternative methods. Future Direction of Electrical and Electronics Education From the study conducted, research related to electrical, and electronics education is still in the early stages, especially in education areas that use education methodology for development and effectiveness study. The study also found that researchers focus more on technical concepts only than education studies on the development of teaching aids for education. Therefore, in
Basic Electrical Circuit Kit[8] Electronics Trainer Kit (ETK) [6]
Arduino-based logic gate training kit [32] RCDET [33]
76
the future direction of electrical, and electronics education, researchers need to give more research to education part and use standard education. The standard education research methodology need to apply at electrical and electronic engineering education. Further research should also be conducted considering the effectiveness of the teaching aids developed as well as applied in the real world. 4. CONCLUSION Research findings have demonstrated the importance of educational study for the electrical and electronics field. The review result indicates researchers need to do more studies in electrical and electronics education especially in education technology. This is because the application of electrical and electronics education in the real world is still in its infancy and requires detailed study. ACKNOWLEDGEMENT The authors would like to thank Dr. Irdayanti binti Mat Nashir who helped a lot in compiling this paper. This study was supported by Jabatan Kejuruteraan Elektrik PSMZA dan FTV Universiti Pendidikan Sultan Idris. REFERENCES [1] S. V. Levinzon and N. V. Tsarkova, “The teaching of electrical and electronics
engineering at technical Universities in the world,” Proc. - 2016 51st Int. Univ. Power Eng. Conf. UPEC 2016, vol. 2017-Janua, pp. 1–5, 2016, doi: 10.1109/UPEC.2016.8114022.
[2] L. P. Fan, “Engineering education oriented teaching material construction for electrical and electronic technology,” Commun. Comput. Inf. Sci., vol. 217 CCIS, no. PART 4, pp. 319–323, 2011, doi: 10.1007/978-3-642-23339-5_58.
[3] Y. Bauer and D. Wheeler, “Reform and Practice of Electrical and Electronic Experiment Teaching,” vol. 1, no. 2, pp. 1–4, 2018.
[4] S. Nachiappan, S. A. Abdul Rahim, M. Othman, and V. D. Balakrishnan, “Usage of teaching aids in increasing cognition among slow learners through art lessons,” J. Res. Policy Pract. Teach. Teach. Educ., vol. 7, no. 1, pp. 12–20, 2017, doi: 10.37134/jrpptte.vol7.no1.3.2017.
[5] C. G. C. Kob, A. S. Abdullah, and H. Shamsuddin, “Effects of Learning Aid (KIT) on Student Performance for Electric Circuits Topics,” Int. J. Acad. Res. Bus. Soc. Sci., vol. 9, no. 1, pp. 320–330, 2019, doi: 10.6007/ijarbss/v9-i1/5400.
[6] M. Sillang, S. Patricia, and A. Fata, “Perception and Use of Electronic Trainer Kit ( ETK ) by Students in the Laboratory Session,” vol. 2, no. 3, pp. 50–54, 2020.
[7] N. Yuniarti, A. L. Setiawan, and D. Hariyanto, “The development and comprehensive evaluation of control system training kit as a modular-based learning media,” TEM J., vol. 9, no. 3, pp. 1234–1242, 2020, doi: 10.18421/TEM93-52.
[8] Z. Hanapi et al., “The Development of Basic Electrical Circuit Kit as Learning Aids for Design and Technology Subject The Development of Basic Electrical Circuit Kit as Learning Aids for Design and Technology Subject,” vol. 1, no. 2, pp. 410–415, 2021, doi: 10.6007/IJARPED/v10-i2/9918.
[9] M. F. M. A. Halim et al., “Resducational kit the development of an electronic quiz board
77
that test engineering students knowledge on resistors concept in electrical circuit,” Int. J. Recent Technol. Eng., vol. 8, no. 1, pp. 202–207, 2019.
[10] C. Hacker, “A Low Cost Student Constructed Digital Trainer Initial Design of a Student Digital Trainer,” pp. 369–374, 2009.
[11] “Design and Implementation of Digital Trainer Board for Laboratory,” vol. 03, no. 06, pp. 912–919, 2014.
[12] J. M. Jin, Y. Z. Yu, Z. X. Jin, and B. C. Zhang, “Design and implementation of electronic jacquard cylinder,” Appl. Mech. Mater., vol. 220–223, no. August, pp. 934–938, 2012, doi: 10.4028/www.scientific.net/AMM.220-223.934.
[13] I. Resita and C. Ertikanto, “Designing electronic module based on learning content development system in fostering students’ multi representation skills,” J. Phys. Conf. Ser., vol. 1022, no. 1, 2018, doi: 10.1088/1742-6596/1022/1/012025.
[14] W. Nor et al., “Development of Portable Electronic Sensor Trainer ( PEST ) for Teaching and Learning Purpose,” vol. 2, no. 1, 2020.
[15] S. Siagian, “DEVELOPMENT OF BASIC ELECTRONIC INSTRUCTIONAL MODULE AND TRAINER Sahat Siagian Panahatan, Jongga Manullang, State University of Medan,” Eur. J. Comput. Sci. Inf. Technol., vol. 2, no. 3, pp. 36–46, 2014.
[16] N. M. Najid, R. C. Rus, and T. T. Kiong, “A Review of Problem-Based Learning in Electronic Engineering Course,” Int. J. Acad. Res. Bus. Soc. Sci., vol. 7, no. 12, 2018, doi: 10.6007/ijarbss/v7-i12/3590.
[17] C. T. Orji and T. C. Ogbuanya, “Assessing the effectiveness of problem-based and lecture-based learning environments on students’ achievements in electronic works,” Int. J. Electr. Eng. Educ., vol. 55, no. 4, pp. 334–353, 2018, doi: 10.1177/0020720918773983.
[18] J. E. Mitchell and J. Smith, “Case study of the introduction of problem-based learning in electronic engineering,” Int. J. Electr. Eng. Educ., vol. 45, no. 2, pp. 131–143, 2008, doi: 10.7227/IJEEE.45.2.5.
[19] J. C. Cobos-Torres, P. A. Reyes, and C. F. Mendez, “Problem-Based Learning for an Electrical Machines Course,” Int. J. Emerg. Technol. Learn., vol. 15, no. 22, pp. 192–203, 2020, doi: 10.3991/ijet.v15i22.16871.
[20] M. T. Banday, M. Ahmed, and T. R. Jan, “Applications of e-Learning in Engineering Education: A Case Study,” Procedia - Soc. Behav. Sci., vol. 123, pp. 406–413, 2014, doi: 10.1016/j.sbspro.2014.01.1439.
[21] A. Poncela, “A blended learning approach for an electronic instrumentation course,” Int. J. Electr. Eng. Educ., vol. 50, no. 1, pp. 1–18, 2013, doi: 10.7227/IJEEE.50.1.1.
[22] S. Khader and A. Abu-aisheh, “A case study of designing an e-learning electrical engineering course,” Int. J. Online Eng., vol. 8, no. 3, pp. 22–27, 2012, doi: 10.3991/ijoe.v8i3.2103.
[23] C. Medrano et al., “A review of electronic engineering design free software tools,” 2010 IEEE Educ. Eng. Conf. EDUCON 2010, no. May 2014, pp. 1867–1871, 2010, doi: 10.1109/EDUCON.2010.5492430.
[24] E. S. B. Santosa and S. Waluyanti, “Teaching Microcontrollers using Arduino Nano Based Quadcopter,” J. Phys. Conf. Ser., vol. 1413, no. 1, 2019, doi: 10.1088/1742-6596/1413/1/012003.
[25] M. O. Arowolo, A. A. Adekunle, and M. O. Opeyemi, “Design and implementation of a PLC trainer workstation,” Adv. Sci. Technol. Eng. Syst., vol. 5, no. 4, pp. 755–761, 2020, doi: 10.25046/AJ050489.
[26] P. Sudira and R. E. Juwanto, “Design training kits CPI for vocational learning in industry 4.0,” Int. J. Recent Technol. Eng., vol. 8, no. 3, pp. 6293–6302, 2019, doi:
78
10.35940/ijrte.C5917.098319. [27] A. R. Akparibo, A. Appiah, and O. Fosu-Antwi, “Development of a Programmable Logic
Controller Training Platform for the Industrial Control of Processes,” Am. Sci. Res. J. Eng., vol. 15, no. 1, pp. 186–196, 2016, [Online]. Available: http://asrjetsjournal.org/.
[28] M. A. Hamid, E. Permata, D. Aribowo, I. A. Darmawan, M. Nurtanto, and S. Laraswati, “Development of cooperative learning based electric circuit kit trainer for basic electrical and electronics practice,” J. Phys. Conf. Ser., vol. 1456, no. 1, 2020, doi: 10.1088/1742-6596/1456/1/012047.
[29] V. V. Gomes, S. C. F. Cavaco, C. P. Morgado, J. Aires-De-Sousa, and J. C. B. Fernandes, “An Arduino-Based Talking Calorimeter for Inclusive Lab Activities,” J. Chem. Educ., vol. 97, no. 6, pp. 1677–1681, 2020, doi: 10.1021/acs.jchemed.0c00148.
[30] E. S. Maarif and S. Suhartinah, “Compact Portable Industrial Automation Kit for Vocational School and Industrial Training,” IOP Conf. Ser. Mater. Sci. Eng., vol. 384, no. 1, 2018, doi: 10.1088/1757-899X/384/1/012011.
[31] I. S. Mohammad, S. A. Halim, A. L. Jamil, and M. R. Abdul, “Development of Digital Electronics Book Trainer,” vol. 10, pp. 49–56, 2018.
[32] S. W. Khaing, S. Nopparatjamjomras, T. R. Nopparatjamjomras, and R. Chitaree, “Development of Arduino-based logic gate training kit,” J. Phys. Conf. Ser., vol. 1144, no. 1, 2018, doi: 10.1088/1742-6596/1144/1/012134.
[33] T. B. Rcdet and V. Mulwa, “Remote-Controlled Digital Electronics,” no. April, pp. 0–5, 2020, doi: 10.13140/RG.2.2.28602.34245.
[34] Magued Iskander, Innovative Techniques in Instruction Technology, E-learning, E-assessment, and Education, vol. 7, no. 2. 2008.
[35] E. Butun, H. C. Erkin, and L. Altintas, “A new teamwork-based PBL problem design for electrical and electronic engineering education: A systems approach,” Int. J. Electr. Eng. Educ., vol. 45, no. 2, pp. 110–120, 2008, doi: 10.7227/IJEEE.45.2.3.
79
I-CReST 2021:064-090 – Students' Perception on Characteristics of Effective Lecturers Using Fuzzy Conjoint Method
*1Hamidah Ayub, 1Roselah Osman, 2Zuraidar Badaruddin, 1Afiqah Mazalan, 1Nadatul
Mutjarob Muhammad Misdi
1Faculty of Computer and Mathematical Sciences, Universiti Teknologi MARA, 40450 Shah Alam, Selangor, Malaysia
2Akademi Pengajian Bahasa, Universiti Teknologi MARA, 40450 Shah Alam, Selangor, Malaysia
ABSTRACT The purpose of this study is to discover the perception of undergraduate students from Faculty Computer and Mathematical Sciences, University Technology MARA Shah Alam, towards the characteristics for effective lecturers. It is well known that performance of the lecturers is one of the important factors contributes to the education system. Students can be highly motivated to learn or in contrast, the students can be demotivated to learn because of the lecturers’ approaches. In this study 13 characteristics of effective lecturers are evaluated, which include master or high knowledge of the subject, prepared and organised, approachable and friendly, have a sense of humour, and forgiving. Questionnaires were distributed to 62 students. Fuzzy Conjoint Method (FCM) is used to rank the most important characteristic of effective lecturers from students’ perception. Out of 13 characteristics of effective lecturers, the result shows that sense of belonging is the most preferred characteristics of effective lecturers follow by respect students and the third characteristic is forgiving. The important of the finding in this study shows that the rapport aspect is important to the students in determine the characteristics of effective lecturers. It is suggested that the lecturers should create nurturing, supporting and caring environment in the class. Keywords: Characteristic; effective lecturers; fuzzy conjoint method; students perception
1. INTRODUCTION Characteristics of lecturers are important in order to make learning environment in which students can gain more knowledge and experience. The important role of the lecturers not just to transform knowledge but also to make students become human that can value knowledge. Lecturers hold a huge responsibility to educate students to become a good person. According to Ref. [1] a good lecturer must build a good environment in the class so that the students enjoy and not bored. Moreover, the lecturer must master the technique and quality of teaching, communication skills in order to attract student's attention in class.
Students' satisfaction of teaching effectiveness can be expressed through students' evaluation to show their feedback towards lecturer. Usually, every university has its own students' evaluation form to be distributed to students. Every student can give feedback on
80
characteristics of effectives lecturers and from this feedback, the university can improve the quality of learning and teaching [2]. Thus, it is important to know students’ perception on characteristics of effective lecturers.
This study is to find the perception of sixty-two students from Faculty Computer and
Mathematical Sciences, University Technology MARA Shah Alam on the characteristics of effective lecturers and also rank the characteristics preferred by using fuzzy conjoint method. 2. MATERIAL Characteristics define the lecturers' personal qualities felt by the students that enable the lecturers to achieve success. Students would describe their favourite lecturers over the years as an understanding person, not bored while teaching, and a very sporting lecturer. Ref. [3-5] had listed some characteristics of effective lecturers such as master and high knowledge of the subject, well prepared for the teaching and learning process, encourage students to ask questions about the subject, easily approachable, friendly and has a sense of humour. Moreover, these characteristics would create a good relationship between lecturers and students, and the lecturer must be respected by students at the same time.
The main objectives of evaluation towards lecturer are not only focus on the technique of teaching only, but it is also to focus more on students' learning experience [6]. It is essential to have students’ feedback to comment on the lecturers’ performance in order to be effective lecturers [7]. Every lecturer can see their own result. From this process, lecturers can reflect themselves and take action to upgrade their teaching skills in the future.
The study [8], found that the most preferred characteristic of effective lecturer from
students’ point of view was “a lecturer to be approachable”, followed by “being polite” and the third position was “inspiring”. The study [9], showed calm, tolerance, presence of sense of humour, friendly and a well prepared were the preferred characteristic of effective teacher from teenagers’ opinion. While the study [10], revealed that effective lecturers should be friendly and always available and involve students, as well as organized and competent.
Fuzzy set theory was invented in 1965 [11], and has many application on scientific areas.
Conjoint analysis is a quantitative tool that is widely used in marketing research, also known as "trade-off" analysis. Currently, several forms of conjoint analysis are available and have been used in wider areas of research. The fuzzy conjoint analysis used in this study is a method originally proposed by Ref.[12] in which the method is used for the analysis of consumer preferences.
Ref.[13] stated that “Due to the fuzziness in perception toward learning, this paper presents
an application of fuzzy set conjoint model in analyzing students’ perceptions on learning algebra and role of teacher in the presence of a computer algebra system (CAS). Thus, Fuzzy Conjoint method is used in this study in order to analyze students perception on the characteristics of effective lecturers and also rank the characteristics of effective lecturers.
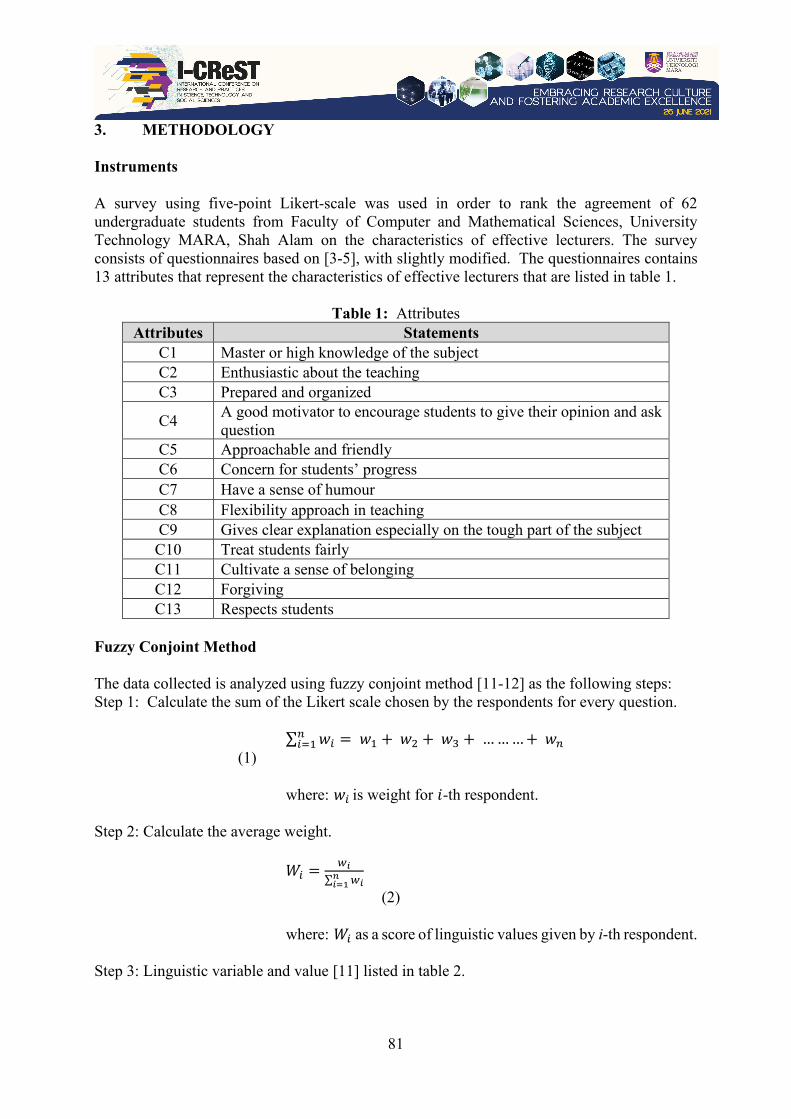
81
3. METHODOLOGY Instruments A survey using five-point Likert-scale was used in order to rank the agreement of 62 undergraduate students from Faculty of Computer and Mathematical Sciences, University Technology MARA, Shah Alam on the characteristics of effective lecturers. The survey consists of questionnaires based on [3-5], with slightly modified. The questionnaires contains 13 attributes that represent the characteristics of effective lecturers that are listed in table 1.
Table 1: Attributes Attributes Statements
C1 Master or high knowledge of the subject C2 Enthusiastic about the teaching C3 Prepared and organized
C4 A good motivator to encourage students to give their opinion and ask question
C5 Approachable and friendly C6 Concern for students’ progress C7 Have a sense of humour C8 Flexibility approach in teaching C9 Gives clear explanation especially on the tough part of the subject C10 Treat students fairly C11 Cultivate a sense of belonging C12 Forgiving C13 Respects students
Fuzzy Conjoint Method The data collected is analyzed using fuzzy conjoint method [11-12] as the following steps: Step 1: Calculate the sum of the Likert scale chosen by the respondents for every question. ∑ 𝑤𝑤𝑖𝑖 = 𝑤𝑤1 + 𝑤𝑤2 + 𝑤𝑤3 + … … … + 𝑤𝑤𝑛𝑛
𝑛𝑛𝑖𝑖=1
(1) where: 𝑤𝑤𝑖𝑖 is weight for 𝑖𝑖-th respondent. Step 2: Calculate the average weight. 𝑊𝑊𝑖𝑖 = 𝑤𝑤𝑖𝑖
∑ 𝑤𝑤𝑖𝑖𝑛𝑛𝑖𝑖=1
(2) where: 𝑊𝑊𝑖𝑖 as a score of linguistic values given by i-th respondent.
Step 3: Linguistic variable and value [11] listed in table 2.
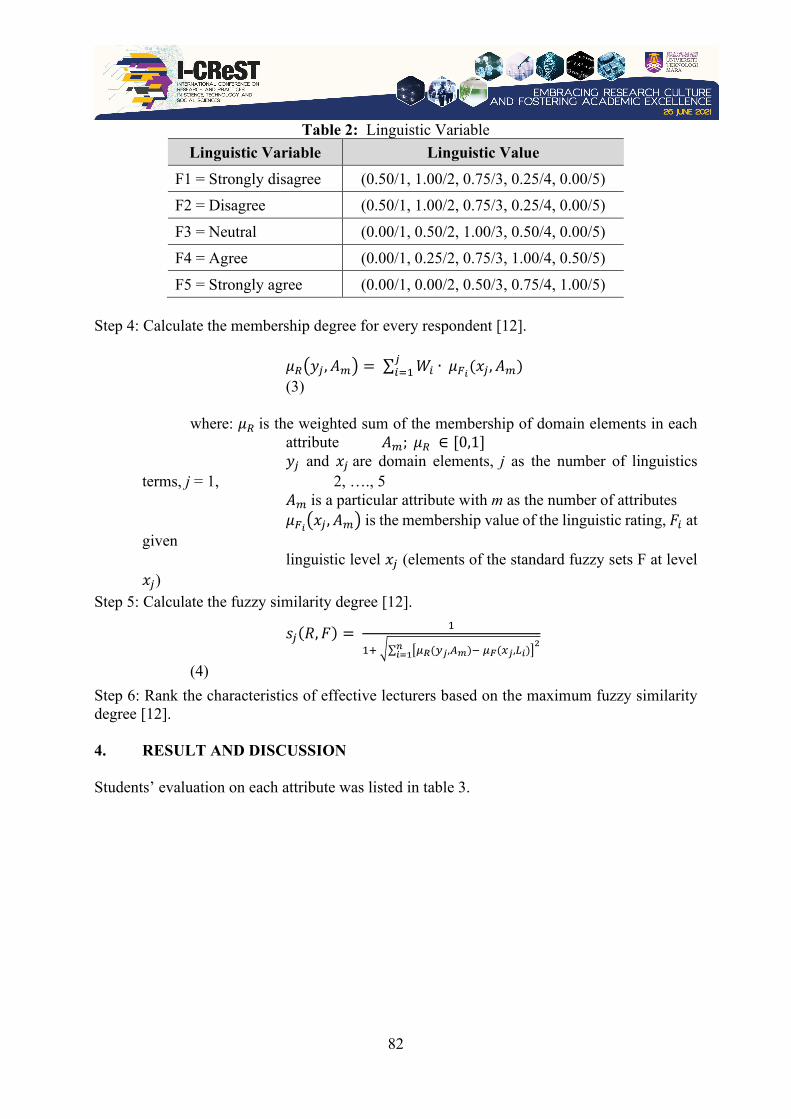
82
Table 2: Linguistic Variable Linguistic Variable Linguistic Value
F1 = Strongly disagree (0.50/1, 1.00/2, 0.75/3, 0.25/4, 0.00/5) F2 = Disagree (0.50/1, 1.00/2, 0.75/3, 0.25/4, 0.00/5)
F3 = Neutral (0.00/1, 0.50/2, 1.00/3, 0.50/4, 0.00/5) F4 = Agree (0.00/1, 0.25/2, 0.75/3, 1.00/4, 0.50/5)
F5 = Strongly agree (0.00/1, 0.00/2, 0.50/3, 0.75/4, 1.00/5) Step 4: Calculate the membership degree for every respondent [12]. 𝜇𝜇𝑅𝑅�𝑦𝑦𝑗𝑗, 𝐴𝐴𝑚𝑚� = ∑ 𝑊𝑊𝑖𝑖
𝑗𝑗𝑖𝑖=1 ∙ 𝜇𝜇𝐹𝐹𝑖𝑖(𝑥𝑥𝑗𝑗, 𝐴𝐴𝑚𝑚)
(3) where: 𝜇𝜇𝑅𝑅 is the weighted sum of the membership of domain elements in each attribute 𝐴𝐴𝑚𝑚; 𝜇𝜇𝑅𝑅 ∈ [0,1]
𝑦𝑦𝑗𝑗 and 𝑥𝑥𝑗𝑗 are domain elements, j as the number of linguistics terms, j = 1, 2, …., 5 𝐴𝐴𝑚𝑚 is a particular attribute with m as the number of attributes 𝜇𝜇𝐹𝐹𝑖𝑖�𝑥𝑥𝑗𝑗, 𝐴𝐴𝑚𝑚� is the membership value of the linguistic rating, 𝐶𝐶𝑖𝑖 at given linguistic level 𝑥𝑥𝑗𝑗 (elements of the standard fuzzy sets F at level 𝑥𝑥𝑗𝑗)
Step 5: Calculate the fuzzy similarity degree [12].
𝑠𝑠𝑗𝑗(𝑅𝑅, 𝐶𝐶) = 1
1+ �∑ �𝜇𝜇𝑅𝑅(𝑦𝑦𝑗𝑗,𝐴𝐴𝑚𝑚)− 𝜇𝜇𝐹𝐹(𝑥𝑥𝑗𝑗,𝐿𝐿𝑖𝑖)�2𝑛𝑛𝑖𝑖=1
(4)
Step 6: Rank the characteristics of effective lecturers based on the maximum fuzzy similarity degree [12]. 4. RESULT AND DISCUSSION Students’ evaluation on each attribute was listed in table 3.
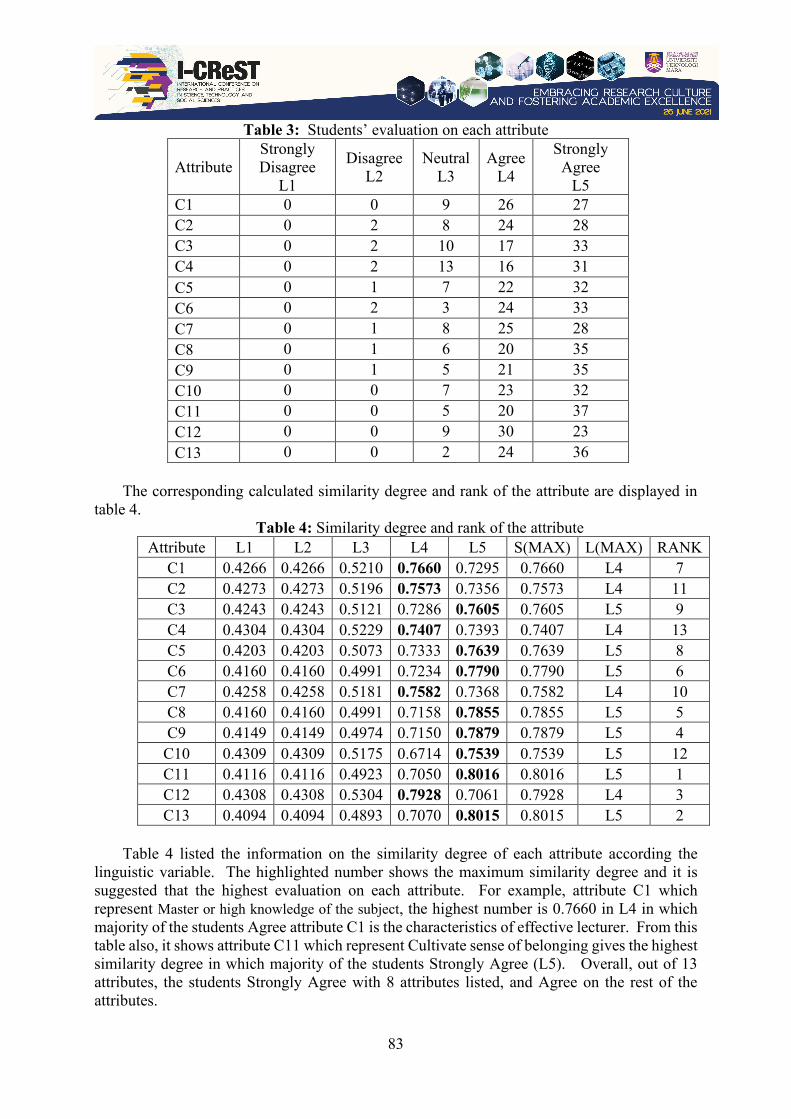
83
Table 3: Students’ evaluation on each attribute
Attribute Strongly Disagree
L1
Disagree L2
Neutral L3
Agree L4
Strongly Agree
L5 C1 0 0 9 26 27 C2 0 2 8 24 28 C3 0 2 10 17 33 C4 0 2 13 16 31 C5 0 1 7 22 32 C6 0 2 3 24 33 C7 0 1 8 25 28 C8 0 1 6 20 35 C9 0 1 5 21 35 C10 0 0 7 23 32 C11 0 0 5 20 37 C12 0 0 9 30 23 C13 0 0 2 24 36
The corresponding calculated similarity degree and rank of the attribute are displayed in
table 4. Table 4: Similarity degree and rank of the attribute
Attribute L1 L2 L3 L4 L5 S(MAX) L(MAX) RANK C1 0.4266 0.4266 0.5210 0.7660 0.7295 0.7660 L4 7 C2 0.4273 0.4273 0.5196 0.7573 0.7356 0.7573 L4 11 C3 0.4243 0.4243 0.5121 0.7286 0.7605 0.7605 L5 9 C4 0.4304 0.4304 0.5229 0.7407 0.7393 0.7407 L4 13 C5 0.4203 0.4203 0.5073 0.7333 0.7639 0.7639 L5 8 C6 0.4160 0.4160 0.4991 0.7234 0.7790 0.7790 L5 6 C7 0.4258 0.4258 0.5181 0.7582 0.7368 0.7582 L4 10 C8 0.4160 0.4160 0.4991 0.7158 0.7855 0.7855 L5 5 C9 0.4149 0.4149 0.4974 0.7150 0.7879 0.7879 L5 4 C10 0.4309 0.4309 0.5175 0.6714 0.7539 0.7539 L5 12 C11 0.4116 0.4116 0.4923 0.7050 0.8016 0.8016 L5 1 C12 0.4308 0.4308 0.5304 0.7928 0.7061 0.7928 L4 3 C13 0.4094 0.4094 0.4893 0.7070 0.8015 0.8015 L5 2
Table 4 listed the information on the similarity degree of each attribute according the
linguistic variable. The highlighted number shows the maximum similarity degree and it is suggested that the highest evaluation on each attribute. For example, attribute C1 which represent Master or high knowledge of the subject, the highest number is 0.7660 in L4 in which majority of the students Agree attribute C1 is the characteristics of effective lecturer. From this table also, it shows attribute C11 which represent Cultivate sense of belonging gives the highest similarity degree in which majority of the students Strongly Agree (L5). Overall, out of 13 attributes, the students Strongly Agree with 8 attributes listed, and Agree on the rest of the attributes.
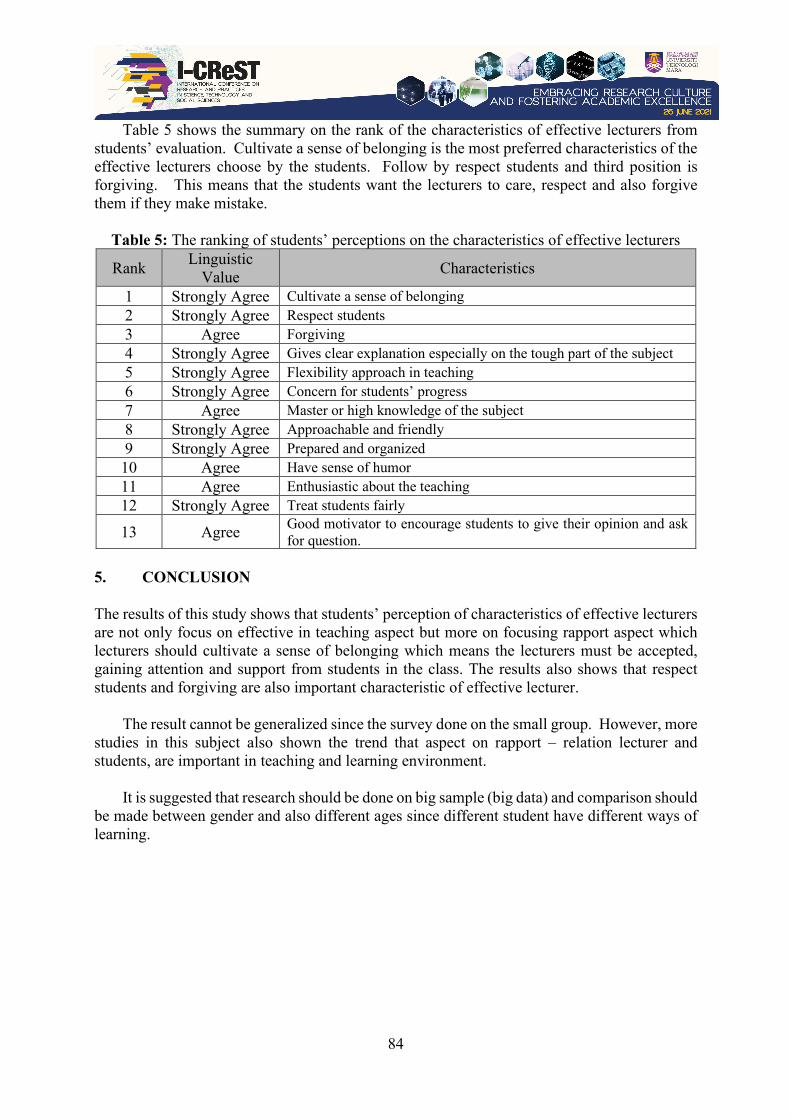
84
Table 5 shows the summary on the rank of the characteristics of effective lecturers from students’ evaluation. Cultivate a sense of belonging is the most preferred characteristics of the effective lecturers choose by the students. Follow by respect students and third position is forgiving. This means that the students want the lecturers to care, respect and also forgive them if they make mistake.
Table 5: The ranking of students’ perceptions on the characteristics of effective lecturers
Rank Linguistic Value Characteristics
1 Strongly Agree Cultivate a sense of belonging 2 Strongly Agree Respect students 3 Agree Forgiving 4 Strongly Agree Gives clear explanation especially on the tough part of the subject 5 Strongly Agree Flexibility approach in teaching 6 Strongly Agree Concern for students’ progress 7 Agree Master or high knowledge of the subject 8 Strongly Agree Approachable and friendly 9 Strongly Agree Prepared and organized 10 Agree Have sense of humor 11 Agree Enthusiastic about the teaching 12 Strongly Agree Treat students fairly
13 Agree Good motivator to encourage students to give their opinion and ask for question.
5. CONCLUSION The results of this study shows that students’ perception of characteristics of effective lecturers are not only focus on effective in teaching aspect but more on focusing rapport aspect which lecturers should cultivate a sense of belonging which means the lecturers must be accepted, gaining attention and support from students in the class. The results also shows that respect students and forgiving are also important characteristic of effective lecturer.
The result cannot be generalized since the survey done on the small group. However, more studies in this subject also shown the trend that aspect on rapport – relation lecturer and students, are important in teaching and learning environment.
It is suggested that research should be done on big sample (big data) and comparison should
be made between gender and also different ages since different student have different ways of learning.
85
REFERENCES [1] Gilkes M. (2018). What makes a good lecturer. Ausmed. Retrieved April 12, 2021 from
https://www.ausmed.com/cpd/articles/what-makes-a-good-lecturer [2] Eng T. H., Ibrahim A. F., Shamsuddin N. E. (2015). Students’ Perception: Student
Feedback Online (SuFO) in Higher Education. Procedia - Social and Behavioral Sciences. 167, 109 – 116.
[3] Raziana Che Aziz & Chiam Chooi Chea (2008). 8th Annual SEAAIR Conference, 4-6 November 2008, Surabaya, Indonesia 5. Retreived 12 April 2021.
http://library.oum.edu.my/repository/395/1/fuzzy.pdf [4] Shieffield E. F., (1974). Characteristics of Effective Teaching in Canadian Universities –
An Analysis Based on The Testimony of a Thousand Graduates. Canadian Journal of Higher Education. 4(1). Retrieved April 12, 2021 from https://journals.sfu.ca/cjhe/index.php/cjhe/article/view/182591/182601
[5] Feldman K. A. (1988). Effective college teaching from the students' and faculty's view: Matched or mismatched priorities? Research in Higher Education. 28(4), 291-344.
[6] Yin-Fah B. C., Foon Y. S., Ho Jo. S., (2012). Student Evaluation of Lecturer Performance Among Private University Students. Canadian Academy of Oriental and Occidental Culture. 8(4), 238-243
[7] Almutairi T., Tymms P., Kind P. (2015). The Tools of Teacher Evaluation: What Should Be Used in Teacher Evaluation from teachers perceptive. International Business & Education Conference, 326. [8] Aregbeyen, Omo. (2010). Students Perceptions of Effective Teaching and Effective Lecturer Characteristics at the University of Ibadan, Nigeria. Pakistan Journal of Social Sciences. 7. 62-69. 10.3923/pjssci.2010.62.69. [9] Andreia Ramona Lupascua , Georgeta Pânisoară, Ion-Ovidiu Pânisoară (2014). Characteristics of effective teacher. Procedia - Social and Behavioral Sciences 127, 534 – 538. DOI: 10.1016/j.sbspro.2014.03.305 [10] Regis Chireshe (2011). Effective and Ineffective Lecturers: University Students’ Perspective in Zimbabwe. The Anthropologist, 13:4,265-269, DOI:10.1080/09720073.2011.11891207 [11] L. A. Zadeh, “Fuzzy sets,” Infection Control, vol. 8, pp. 338–353, 1965. [12] Turksen, I. B. and Willson, I. A. 1994, A fuzzy set preference model for consumer
choice. Fuzzy Sets and Systems. 68(3), 253–266. [13] Lazim Abdullah , Abu Osman Md Tap and Wan Salihin Wong Abdullah (2011). Fuzzy
Set Conjoint Model in Describing Students’ Perceptions on Computer Algebra System Learning Environment. IJCSI International Journal of Computer Science Issues, Vol. 8, Issue 2, March 2011 ISSN (Online): 1694-0814 www.IJCSI.org

86
I-CReST 2021:083-070 – The Effect of Oil Price, Interest Rate, Consumer Price Index and Exchange Rate on Food Price
1Nur Anysatul Hanak Abdullah, *1Azrul Azim Mohd Yunus, 1Safwan Ibrahima, 1Arif
Asraf Mohd Yunusa 1Department of Financial Mathematics, Faculty of Science and Technology, Universiti Sains
Islam Malaysia, 71800 Bandar Baru Nilai, Negeri Sembilan, Malaysia
ABSTRACT Food security is the concern of every nation including Malaysia. Malaysia needs to revamp the way it addresses food production if it serious about achieving food security. Local rice production has become inactive in the last 30 years. Food price will affect the food security crisis in Malaysia. This paper aims to examine the relationship and response of food price on oil price, interest rate, exchange rate, consumer price index (CPI) impulse. This research was conducted using Augmented-Dickey Fuller test, multiple linear regression (MLR) analysis using ordinary least square (OLS) and impulse response function (IRF) analysis under VAR model. Monthly data are taken from January 2011 until February 2021. Findings suggest that oil price has a major effect on the cost of food. From the analysis of impulse response functions, food prices respond positively to any shock in oil prices. Our findings indicate that price volatility has a positive relationship with oil price and food security. Since oil price inflation is detrimental to food security, it is important to diversify energy demand in this market, moving away from a dependence on fossil fuels and toward an optimum mix of renewable and non-renewable energy supplies that would benefit both energy and food security. Keywords: Food price; oil price; exchange rate; interest rate; consumer price index 1. INTRODUCTION Food security refers to the supply of food and people's right to obtain it. Food security is described by United Nations’ Committee on World Food Security as
"The means by which all people have physical, social, and economic access to adequate, clean, and nutritious food that satisfies their food preferences and dietary needs for an active and balanced life at all times [1]” (IFPRI, 2021)
Every country, including Malaysia, is worried about food security. As stated by [2] Dardak
(2020), food is available all year round, despite the country's struggle to grow its own food. Malaysia outsources its food supply to satisfy local market demand, and as a result, become a net food importer country.
Based on [3], global food crisis starts occurring during 2007/2008 where there is a huge
increase in the food prices which lead in increase of food product’s cost. This sudden change
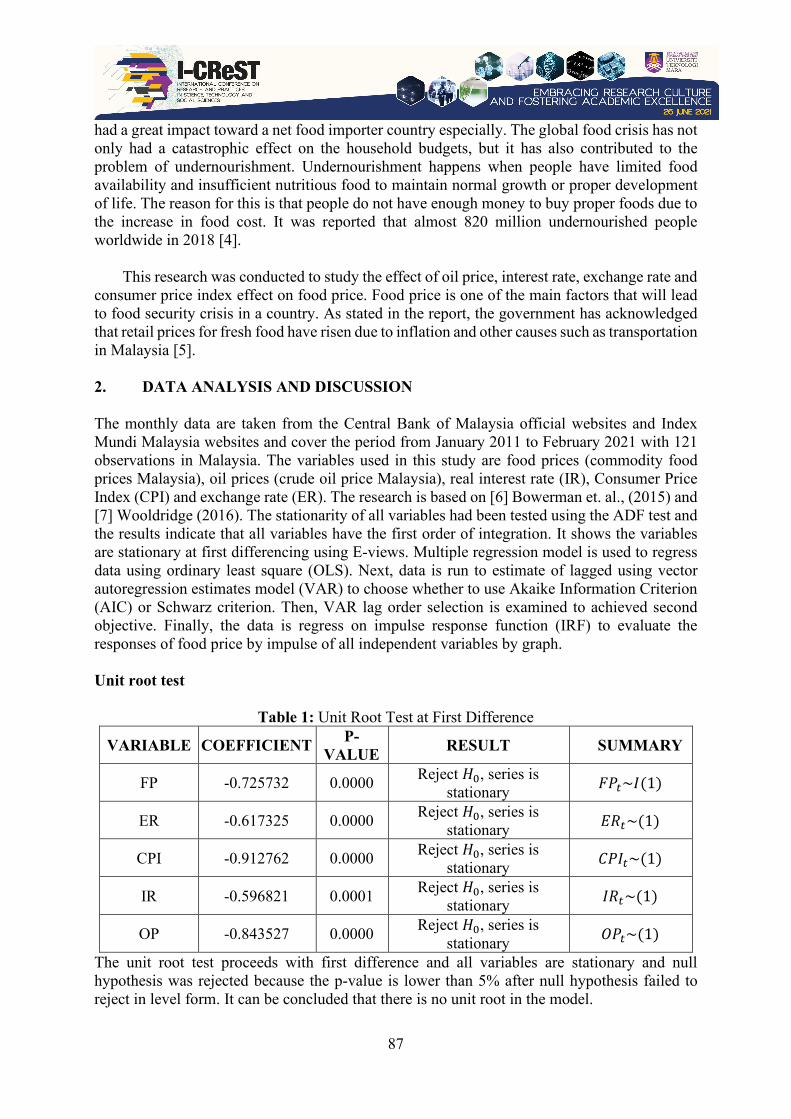
87
had a great impact toward a net food importer country especially. The global food crisis has not only had a catastrophic effect on the household budgets, but it has also contributed to the problem of undernourishment. Undernourishment happens when people have limited food availability and insufficient nutritious food to maintain normal growth or proper development of life. The reason for this is that people do not have enough money to buy proper foods due to the increase in food cost. It was reported that almost 820 million undernourished people worldwide in 2018 [4].
This research was conducted to study the effect of oil price, interest rate, exchange rate and
consumer price index effect on food price. Food price is one of the main factors that will lead to food security crisis in a country. As stated in the report, the government has acknowledged that retail prices for fresh food have risen due to inflation and other causes such as transportation in Malaysia [5]. 2. DATA ANALYSIS AND DISCUSSION The monthly data are taken from the Central Bank of Malaysia official websites and Index Mundi Malaysia websites and cover the period from January 2011 to February 2021 with 121 observations in Malaysia. The variables used in this study are food prices (commodity food prices Malaysia), oil prices (crude oil price Malaysia), real interest rate (IR), Consumer Price Index (CPI) and exchange rate (ER). The research is based on [6] Bowerman et. al., (2015) and [7] Wooldridge (2016). The stationarity of all variables had been tested using the ADF test and the results indicate that all variables have the first order of integration. It shows the variables are stationary at first differencing using E-views. Multiple regression model is used to regress data using ordinary least square (OLS). Next, data is run to estimate of lagged using vector autoregression estimates model (VAR) to choose whether to use Akaike Information Criterion (AIC) or Schwarz criterion. Then, VAR lag order selection is examined to achieved second objective. Finally, the data is regress on impulse response function (IRF) to evaluate the responses of food price by impulse of all independent variables by graph.
Unit root test
Table 1: Unit Root Test at First Difference
The unit root test proceeds with first difference and all variables are stationary and null hypothesis was rejected because the p-value is lower than 5% after null hypothesis failed to reject in level form. It can be concluded that there is no unit root in the model.
VARIABLE COEFFICIENT P-VALUE RESULT SUMMARY
FP -0.725732 0.0000 Reject 𝐻𝐻0, series is stationary 𝐶𝐶𝐹𝐹𝑠𝑠~𝐼𝐼(1)
ER -0.617325 0.0000 Reject 𝐻𝐻0, series is stationary 𝐸𝐸𝑅𝑅𝑠𝑠~(1)
CPI -0.912762 0.0000 Reject 𝐻𝐻0, series is stationary 𝐶𝐶𝐹𝐹𝐼𝐼𝑠𝑠~(1)
IR -0.596821 0.0001 Reject 𝐻𝐻0, series is stationary 𝐼𝐼𝑅𝑅𝑠𝑠~(1)
OP -0.843527 0.0000 Reject 𝐻𝐻0, series is stationary 𝑂𝑂𝐹𝐹𝑠𝑠~(1)

88
Multiple linear regression To test the significant and the relationship of the exchange rate, interest rate, Consumer Price Index (CPI) and oil price towards food cost, the Multiple Linear regression (MLR) was formed. Hence the model of regression for this study can be constructed as follows:
𝐶𝐶𝐹𝐹𝑠𝑠 = 𝛽𝛽0� + 𝛽𝛽1�𝐸𝐸𝑅𝑅𝑠𝑠 + 𝛽𝛽2�𝐶𝐶𝐹𝐹𝐼𝐼𝑠𝑠 + 𝛽𝛽3�𝐼𝐼𝑅𝑅𝑠𝑠 + 𝛽𝛽4�𝑂𝑂𝐹𝐹𝑠𝑠 (1) where FPt is food price index, CPI is Consumer Price Index, OP is oil price, IR is interest rate, ER is exchange rate, 𝜀𝜀 is error term. Data was then regressed using E-views version 11.0
Table 2: Multiple Linear Regression
where *** indicates that the variables are significant at 5% significant level
According to p-value, the result shows that the exchange rate, consumer price index,
interest rate, and oil price is statistically significant at 5% level, thus the null hypothesis is rejected at 5% significance level. If the exchange rate, consumer price index and interest rate increases by 1 percentage point, on average, the food price index goes down to 10.39927%, 0.922794%, 11.02602% respectively by holding other variables constant which means that with the increase of exchange rate, consumer price index and interest rate by 1 percentage point will lead to the declining of food price index by 10.39927%, 0.922794%, 11.02602% respectively or vice versa.
If the crude oil price increases by 1 percentage point, on average, the food price index goes
up to 0.061409% by holding other variables constant which means that with the increases of oil price by 1% will lead to the increase of food price by 0.061409%, or vice versa.
𝑅𝑅2 is found to be 0.897566. This indicates that 0.897566 % of the variation in Malaysian
food price index may be described by the variation in consumer price index, exchange rate, interest rate and oil price. Adjusted 𝑅𝑅2 is found to be 0.894034. This indicates that 0.894034% of the variation in Malaysian food price index may be described by the variation in consumer price index, interest rate, exchange rate and the crude oil price, after the number of exogenous variables and degree of freedom are counted into account. Finally, it can be said that this model is reliable and fit into this study, as the R-squared and adjusted R-squared are greater than 80%.
Based to the result of coefficient in Table 2, the positive coefficient indicates that as the oil
price increases, the mean of food price tends to increase since that crude oil price is significant
VARIABLES COEFFICIENT P-VALUE CONSTANT 261.2010 0.0000***
ER -10.39927 0.0005*** CPI -0.922794 0.0000*** IR -11.02602 0.0000*** OP 0.061409 0.0000***
R-SQUARED 0.897566 ADJUSTED R-
SQUARED 0.894034

89
to food price index in Malaysia. As can be expected because higher oil price, the higher shipping costs to transport food for consumers so the higher the food prices. Consumer price index (CPI), exchange rate and interest rate have negative coefficient suggests that as the CPI, interest rate and exchange rate increases, the food price tends to decrease in Malaysia. Negatively significant means that, the lower the value of exchange rate, consumer price index (CPI) and interest rate, the higher the food price index. Impulse Response Function Based on the VAR model, the Akaike Information Criterion of 10.32720 is lower than that of Schwartz at 14.02689. Therefore, it can be conclude based on this output that the lag selection must be based on the Akaike Information Criterion (AIC) and Final Prediction Error (FPE) which is lag 3.
Figure 1: Impulse response function.
-2
-1
0
1
1 2 3 4 5 6 7 8 9 10
Response of FP to OP
-2
-1
0
1
1 2 3 4 5 6 7 8 9 10
Response of FP to IR
-2
-1
0
1
1 2 3 4 5 6 7 8 9 10
Response of FP to ER
-2
-1
0
1
1 2 3 4 5 6 7 8 9 10
Response of FP to CPI
Response to Cholesky One S.D. (d.f. adjusted) Innovations ± 2 S.E.
Period OP IR ER CPI
1 0.000000 0.000000 0.000000 0.000000 2 0.222356 0.086416 0.032082 0.021523 3 0.110788 0.244688 -0.340462 -0.282937 4 0.088175 -0.020818 -0.363694 -0.534330 5 0.148132 -0.297410 -0.214143 -0.662920 6 0.221672 -0.695270 0.054799 -0.751992 7 0.228374 -1.007962 0.341985 -0.811598 8 0.124058 -1.308180 0.563764 -0.830458 9 -0.049518 -1.535202 0.690126 -0.811669 10 -0.242161 -1.734034 0.727849 -0.780850
Cholesky Ordering: FP OP IR ER CPI

90
From Fig. 1, all variables always lie on 95% confidence interval which stated on the red line while the blue lines are impulse response function. The major outcome is accumulated the positivity response of commodity costs by fuel cost from one to eight period and gradually decrease in negative zone until period 10. These findings of oil price towards food price are in line with [8 ,9]. A standard deviation shock on the food index has a statistically significant and positive influence on oil prices when the effects of the impulse response functions are considered. Based on the effects of the impulse response function, from the oil price shock, there is a good outlook to agriculture food prices. But the costs of production of agricultural crops and food goods may be directly raised due to increase in the oil price. However, any rise in the oil prices leads to a raise in production costs. This shows that additional costs of fuels not just theoretically ruin the energy security levels of oil-consuming nations, and moreover endanger their food safety.
Furthermore, interest rate increase will increase price of food index which in three periods
early is statistically positive significant and it will become negatively until period 10. One standard deviation shock to the food index has a positive statistically significant impact on the interest rate in period one until three and subsequently, when the effects of the impulse response functions are considered. These findings of interest rate are in line with [10]. The results showed that the volatility in food prices was also greatly explained by actual interest rate fluctuations. Increases in real interest rates raise food costs, which are large for two periods and become insignificant after that. Increasing the interest rate raises the price of money in crop output and, as a result, raise the price of output in various industries, including commodities goods, thus increasing the price of food and agricultural products [13]. The agricultural sector is a capital-intensive which are more versatile and have direct impact on profitability such as borrowing, spending and investment.
The response of food price on exchange rate is gradually decline until period three and it
hits its steady state value. Beyond period four, food price response rises above its steady state value and remains in the positive region in period six and above on exchange rate while this findings line with [11]. One standard deviation shock to the food index has a statistically significant and positive effect on the exchange rate when the effects of the impulse response functions are considered, whereas duration two is only in the negative region. Based on [12] in certain nations, if the commodity is a major share of the foreign trade of that region, the exchange rate can be partly dictated by world commodity price movements.
While the response of food costs index to any positive shock from consumer price index (CPI) is positive only on period one until two while in three periods above and goes steady state value in negative zone. One standard deviation shock to the food index has a statistically important and negative effect on the consumer price index when the effects of the impulse response functions are considered. These findings of inflation rate and interest rate is in line with [10]. Results shows that, higher index of consumer prices has a major negative effect on food prices. 3. CONCLUSION The outcomes of multiple regression model show that oil price will affect the food price index in Malaysia positively correlated. The exchange rate, interest rate and consumer price index (CPI) will negatively affect the food price in Malaysia. The second objective is to investigate responses of food costs to independents variables. Based on the outcomes of impulse response function, the rise of oil prices will increase the risk of food security while it shows a country
91
exports more than imports because have high demand of their products even the prices will rise. The response of food price increase on impulse interest rate at early period than goes down to negative zone it can be the agricultural sector has recently been more automated and therefore more versatile in terms of interest rate changes. Besides, a higher consumer price index has a negatively significant effect on commodity prices.
However, the increase food prices affect people in different economies and does not affect
consumer equally on their inflation of consumer price index. This sector's energy use must be diversified away from a dependence on fossil fuels and into an optimum mix of renewable and non-renewable energy supplies. The conclusion that energy diversification in the food sector is important is that energy should be diversified in the food sector from fossil fuels to renewable energy sources. This will not only boost energy security. It also had a huge effect on food security and granting access towards sustainable food and agricultural goods. This step is crucial in securing economic development in Asia country, where food and energy are in high demand. REFERENCE [1] International Food Policy Research Institute. (2021). Food security. Retrieved from
https://www.ifpri.org/topic/food-security [2] Dardak, R. A. (2020). Addressing Food Security in Challenging Times. Retrieved from
https://ap.fftc.org.tw/article/2634 [3] Mohamed Arshad, F., & Hameed, A. A. A. (2010). Global food prices: Implications for
food security in Malaysia. CRRC Consumer Review, 1(1), 21-38. https://doi.org/10.22004/ag.econ.119073.
[4] United Nations World Food Programme. (2019). The State of Food Security and Nutrition in the World. Retrieved from https://docs.wfp.org/api/documents/WFP-0000106763/download/?_ga=2.31261753.786785636.1621567945-224801207.1621567945
[5] Free Malaysia Today. (2021). Yes, food prices have gone up, admits ministry. Retrieved from https://www.freemalaysiatoday.com/category/nation/2021/04/17/yes-food-prices-have-gone-up-admits-ministry/
[6] Bowerman, B. L., O’Connell, R., & Koehler, A. (2015). Forecasting, Time Series and Regression (4th edition). Cengage Learning.
[7] Wooldridge J. M. (2016). Introductory Econometrics a Modern Approach (7th edition). Cengage Learning
[8] Taghizadeh-Hesary, F., Rasoulinezhad, E., & Yoshino, N. (2019). Energy and food security: Linkages through price volatility. Energy Policy, 128, 796-806. https://doi.org/10.1016/j.enpol.2018.12.043
[9] Ibrahim, M. H. (2015). Oil and food prices in Malaysia: a nonlinear ARDL analysis. Agricultural and Food Economics, 3(1), 1-14. https://doi.org/10.1186/s40100-014-0020-3
[10] Kapusuzoglu, A., Liang, X., & Ceylan, N. B. (2018). Macroeconomic impacts of global food price shocks on the economy of Turkey. Agricultural Economics, 64(11), 517-525. https://doi.org/10.17221/261/2017-AGRICECON
[11] Olayungbo, D., & Hassan, W. (2016). Effects of oil price on food prices in developing oil exporting countries: a panel autoregressive distributed lag analysis. OPEC Energy Review, 40(4), 397-411. https://doi.org/10.1111/opec.12090

92
[12] Ahmad Nordin, M. I., Abdul Ghani, N. A., Chong E., & Abu Bakar, Z. (2019). Food imports and the exchange rate: More than meets the eye. The Central Bank of Malaysia. Retrieved from: https://www.bnm.gov.my/documents/20124/766180/3Q2019_fullbook_en.pdf/ec308d44-5eca-dbc6-7e8b-76789cc33c01?t=1614069407486
[13] Frankel, J. A. (2014). Effects of speculation and interest rates in a “carry trade” model of commodity prices. Journal of International Money and Finance, 42, 88-112. https://doi.org/10.1016/j.jimonfin.2013.08.006

93
I-CReST 2021:097-085 – Using Latent Dirichlet Allocation to Identify Text Messages Topic in Mental Health Mobile Therapy
*1Teh Faradilla Abdul Rahman, 2Norshita Mat Nayan
1Centre of Foundation Studies, Universiti Teknologi MARA, Cawangan Selangor, Kampus
Dengkil, 43800 Dengkil, Selangor, Malaysia 2Institute of IR4.0, Universiti Kebangsaan Malaysia, UKM Bangi, 43600 Bangi, Selangor,
Malaysia
*E-mail: [email protected]
ABSTRACT Text messages used in online depression therapy is a mixture of words and hidden treatment content. It suggests the possible essential treatment activities and goals. Discovering the hidden content and language styles used in the text messages for depression therapy is important to examine how these elements could address appropriate treatment to a particular mental health problem. This study aims to identify the content of text message sent by professional practitioner in mental health field related to therapy for depression. The LDA method available in Machine Learning for Language Toolkit (MALLET) was used to identify topics and words within each therapy text message. At first, this study experimented with 55 sample text messages and using 10 – 30 number of topics. After the analysis was done, it was found that 15 topics and 2000 number of iterations produced the most suitable result to be interpreted. The topic over probability distribution produced from the LDA modelling was used to identify the topic category for each document by looking at the topic with the highest probability value. Meanwhile, the topic-word distribution listed the top ten terms which to be used to recognize the theme of each topic. All 15 topics were found relevant to depression therapy. The terms used in each topic derived from the LDA successfully represent the content and topic for depression therapy. This study noted that the Gain and Advantage was the principal topic to the most text messages used in the sample data. Other themes such as side effects, care and wellbeing, general information and focus on today’s opportunity are among the commonly used content. The right choice of language style – motivational, supportive and encouragement- and content could potentially strengthen text messaging therapy approach in improving depression. Keywords: Latent dirichlet allocation; topic modelling; machine learning; text message therapy; depression 1. INTRODUCTION Depression is one of the mental disorders. A person with depression will look at himself as worthless, incapable and lonely. Nowadays, treatment and consultation for depression are provided through face-to-face therapy and online depression therapy such as via Simple Text Message (SMS) using a basic mobile phone, web-based and mobile applications. The research on the implementation of depression therapy via communication technology and its effectiveness has long existed. In a review of literature [1], it was found that mental health therapy using SMS and mobile applications have a strong correlation with positive changes in
94
physical and mental health. While a meta-analysis literature review [2] highlighted that although many studies have found a number of mobile applications have the potential to improve mental health symptoms, full reliance on the use of mobile applications as a psychological treatment is not recommended. In today’s digital world and with the rapid growth of communication technology platforms, new mobile text messaging therapy development in the field of psychology is accelerating. Hence, focusing only on the differences between treatment methods and its effectiveness are insufficient to understand how one’s mental health condition changes. Results from such research were seen as failing to conclude the suitable text messages content appropriate to be used to improve one’s depression conditions. A review of past literature [3] also agreed that no past research was found to address questions on text message content. For these reasons, this research paper is interested in identifying the topics and themes of text messages used in mobile therapy that are addressed specifically to help people with depression. 2. LITERATURE REVIEW A number of mental health studies have focused on the use of different text messages’ topic in their interventions. Previous study presented a theoretical framework that shows various types of text messages topic and text messages delivery time are correlated to patients’ behavioural changes [4]. The topic includes motivational [5-7], supportive [6, 8], reminder [5,8 – 11] and psychology education [6, 7, 11 -13] Findings from a systematic review [1] stated that there were positive changes in participants' behaviour after receiving treatments with different topics of text messages. Other systematic reviews indicate that some interventions show positive changes in participants’ behaviour in the post-test while some studies included in the reviews indicate the opposite results [14, 15]. It is worth to note that different topics of text messages were used across the studies as mentioned above. This might be one of the reasons for the inconsistency of the intervention's results. Additionally, only few studies were found focussing on text message content, its features and development approach, although it is clear that the text message topic is an important aspect in mental health recovery treatment [3].
One of the potential ways to identify discussion content in a text-based conversation is by using topic modelling. Previous studies have shown topic modelling as an effective approach in identifying topics and themes in users’ discussions on the Internet [16, 17] and social media [18]. This research paper aims to identify the hidden topics and themes in the text messages that were used by psychiatrists in treating patients with depression. Thus, probabilistic generative modelling Latent Dirichlet Allocation (LDA) is implemented in this study. To the best of the authors’ knowledge, no published research has used the LDA method to identify text message topics sent by psychiatrists related to therapy for depression.
Topic modelling is one of the methods in machine learning. In machine learning and natural
language processing, topic modelling is a generative model that provides probabilistic value for the frequency of each word found in documents of a corpus. Topic modelling works by searching and summarizing the frequency of words without considering the word ranking order. This refers to the assumption of changing words in a document and this assumption resulted in a bag-of-words model [19].
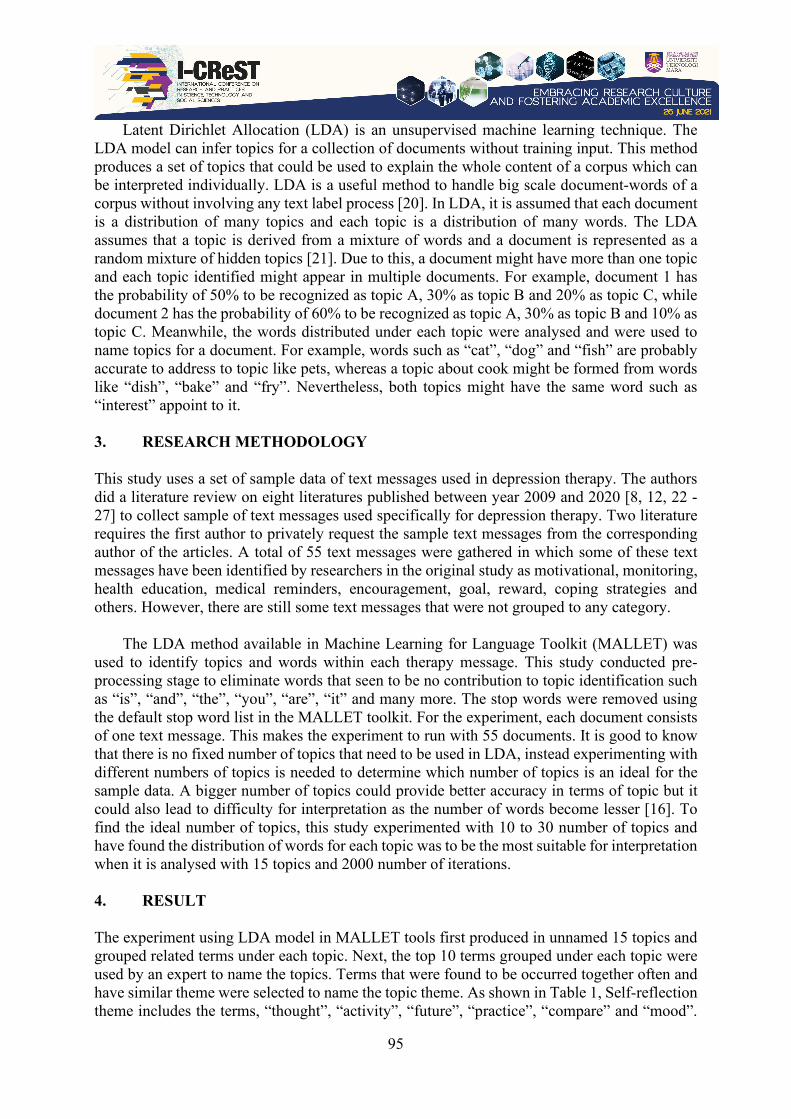
95
Latent Dirichlet Allocation (LDA) is an unsupervised machine learning technique. The LDA model can infer topics for a collection of documents without training input. This method produces a set of topics that could be used to explain the whole content of a corpus which can be interpreted individually. LDA is a useful method to handle big scale document-words of a corpus without involving any text label process [20]. In LDA, it is assumed that each document is a distribution of many topics and each topic is a distribution of many words. The LDA assumes that a topic is derived from a mixture of words and a document is represented as a random mixture of hidden topics [21]. Due to this, a document might have more than one topic and each topic identified might appear in multiple documents. For example, document 1 has the probability of 50% to be recognized as topic A, 30% as topic B and 20% as topic C, while document 2 has the probability of 60% to be recognized as topic A, 30% as topic B and 10% as topic C. Meanwhile, the words distributed under each topic were analysed and were used to name topics for a document. For example, words such as “cat”, “dog” and “fish” are probably accurate to address to topic like pets, whereas a topic about cook might be formed from words like “dish”, “bake” and “fry”. Nevertheless, both topics might have the same word such as “interest” appoint to it. 3. RESEARCH METHODOLOGY This study uses a set of sample data of text messages used in depression therapy. The authors did a literature review on eight literatures published between year 2009 and 2020 [8, 12, 22 - 27] to collect sample of text messages used specifically for depression therapy. Two literature requires the first author to privately request the sample text messages from the corresponding author of the articles. A total of 55 text messages were gathered in which some of these text messages have been identified by researchers in the original study as motivational, monitoring, health education, medical reminders, encouragement, goal, reward, coping strategies and others. However, there are still some text messages that were not grouped to any category.
The LDA method available in Machine Learning for Language Toolkit (MALLET) was used to identify topics and words within each therapy message. This study conducted pre-processing stage to eliminate words that seen to be no contribution to topic identification such as “is”, “and”, “the”, “you”, “are”, “it” and many more. The stop words were removed using the default stop word list in the MALLET toolkit. For the experiment, each document consists of one text message. This makes the experiment to run with 55 documents. It is good to know that there is no fixed number of topics that need to be used in LDA, instead experimenting with different numbers of topics is needed to determine which number of topics is an ideal for the sample data. A bigger number of topics could provide better accuracy in terms of topic but it could also lead to difficulty for interpretation as the number of words become lesser [16]. To find the ideal number of topics, this study experimented with 10 to 30 number of topics and have found the distribution of words for each topic was to be the most suitable for interpretation when it is analysed with 15 topics and 2000 number of iterations. 4. RESULT
The experiment using LDA model in MALLET tools first produced in unnamed 15 topics and grouped related terms under each topic. Next, the top 10 terms grouped under each topic were used by an expert to name the topics. Terms that were found to be occurred together often and have similar theme were selected to name the topic theme. As shown in Table 1, Self-reflection theme includes the terms, “thought”, “activity”, “future”, “practice”, “compare” and “mood”.
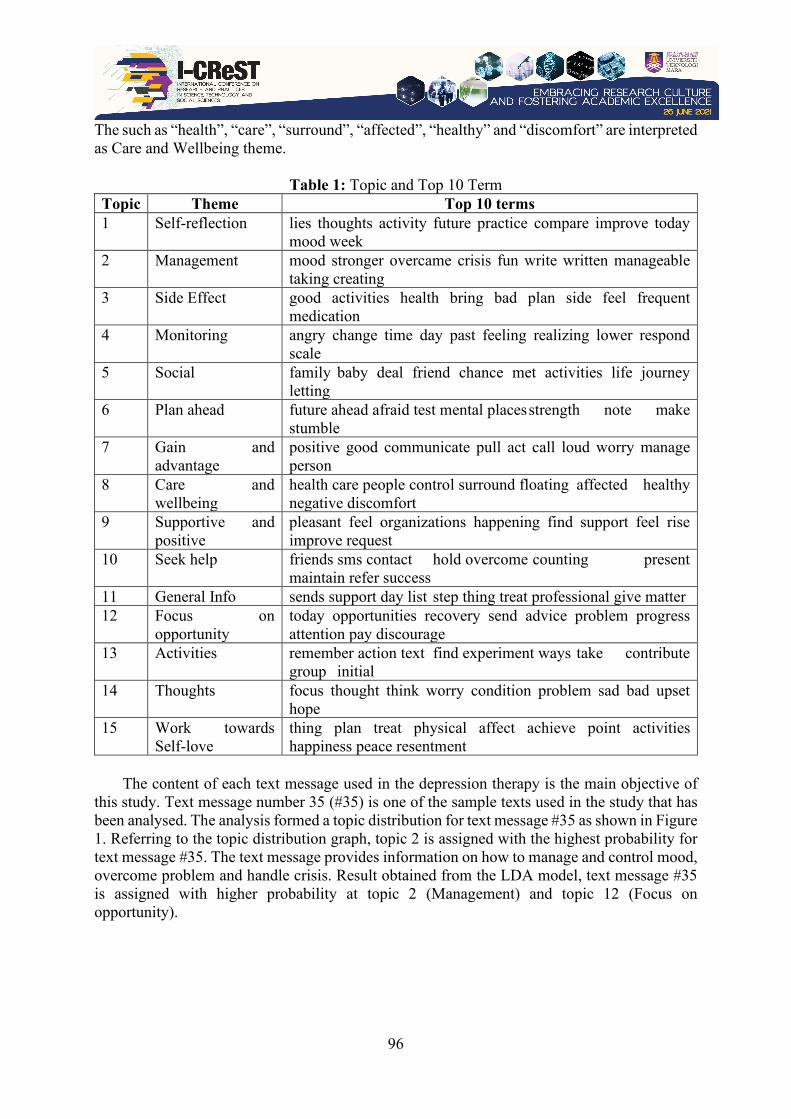
96
The such as “health”, “care”, “surround”, “affected”, “healthy” and “discomfort” are interpreted as Care and Wellbeing theme.
Table 1: Topic and Top 10 Term Topic Theme Top 10 terms 1 Self-reflection lies thoughts activity future practice compare improve today
mood week 2 Management mood stronger overcame crisis fun write written manageable
taking creating 3 Side Effect good activities health bring bad plan side feel frequent
medication 4 Monitoring angry change time day past feeling realizing lower respond
scale 5 Social family baby deal friend chance met activities life journey
letting 6 Plan ahead future ahead afraid test mental places strength note make
stumble 7 Gain and
advantage positive good communicate pull act call loud worry manage person
8 Care and wellbeing
health care people control surround floating affected healthy negative discomfort
9 Supportive and positive
pleasant feel organizations happening find support feel rise improve request
10 Seek help friends sms contact hold overcome counting present maintain refer success
11 General Info sends support day list step thing treat professional give matter 12 Focus on
opportunity today opportunities recovery send advice problem progress attention pay discourage
13 Activities remember action text find experiment ways take contribute group initial
14 Thoughts focus thought think worry condition problem sad bad upset hope
15 Work towards Self-love
thing plan treat physical affect achieve point activities happiness peace resentment
The content of each text message used in the depression therapy is the main objective of
this study. Text message number 35 (#35) is one of the sample texts used in the study that has been analysed. The analysis formed a topic distribution for text message #35 as shown in Figure 1. Referring to the topic distribution graph, topic 2 is assigned with the highest probability for text message #35. The text message provides information on how to manage and control mood, overcome problem and handle crisis. Result obtained from the LDA model, text message #35 is assigned with higher probability at topic 2 (Management) and topic 12 (Focus on opportunity).
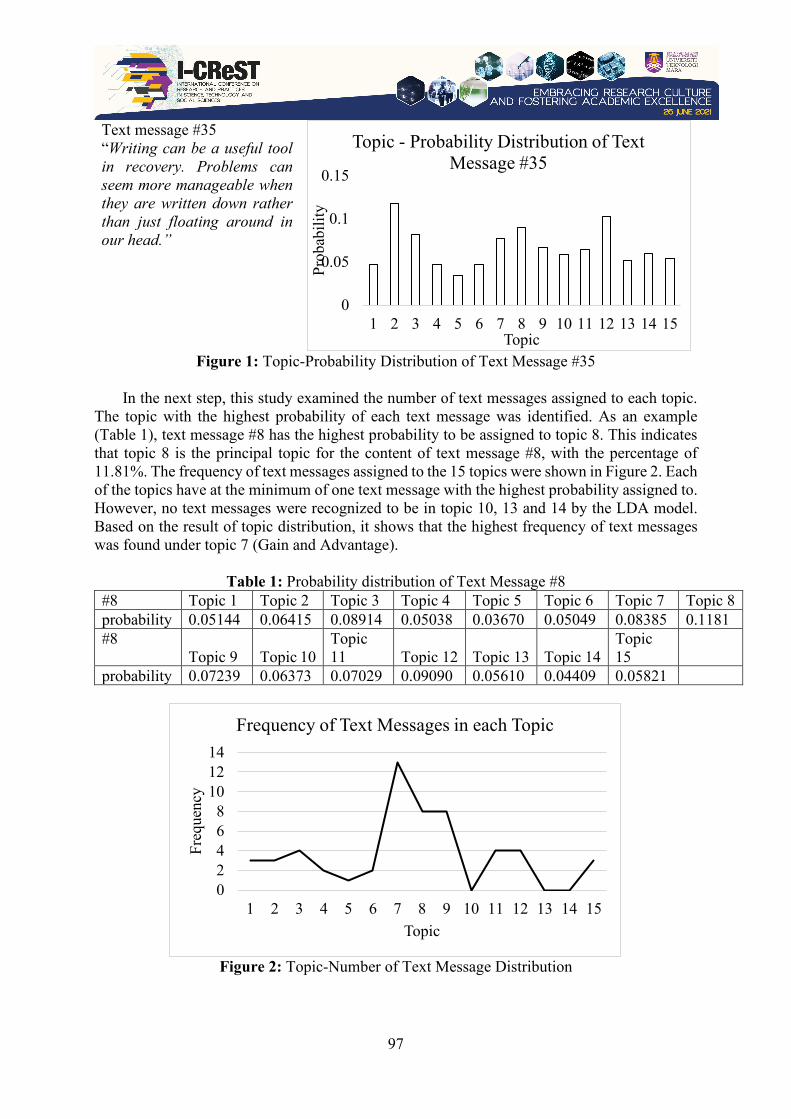
97
Text message #35 “Writing can be a useful tool in recovery. Problems can seem more manageable when they are written down rather than just floating around in our head.”
Figure 1: Topic-Probability Distribution of Text Message #35
In the next step, this study examined the number of text messages assigned to each topic.
The topic with the highest probability of each text message was identified. As an example (Table 1), text message #8 has the highest probability to be assigned to topic 8. This indicates that topic 8 is the principal topic for the content of text message #8, with the percentage of 11.81%. The frequency of text messages assigned to the 15 topics were shown in Figure 2. Each of the topics have at the minimum of one text message with the highest probability assigned to. However, no text messages were recognized to be in topic 10, 13 and 14 by the LDA model. Based on the result of topic distribution, it shows that the highest frequency of text messages was found under topic 7 (Gain and Advantage).
Table 1: Probability distribution of Text Message #8
#8 Topic 1 Topic 2 Topic 3 Topic 4 Topic 5 Topic 6 Topic 7 Topic 8 probability 0.05144 0.06415 0.08914 0.05038 0.03670 0.05049 0.08385 0.1181 #8
Topic 9 Topic 10 Topic 11 Topic 12 Topic 13 Topic 14
Topic 15
probability 0.07239 0.06373 0.07029 0.09090 0.05610 0.04409 0.05821
Figure 2: Topic-Number of Text Message Distribution
0
0.05
0.1
0.15
1 2 3 4 5 6 7 8 9 10 11 12 13 14 15Pr
obab
ility
Topic
Topic - Probability Distribution of Text Message #35
02468
101214
1 2 3 4 5 6 7 8 9 10 11 12 13 14 15
Freq
uenc
y
Topic
Frequency of Text Messages in each Topic
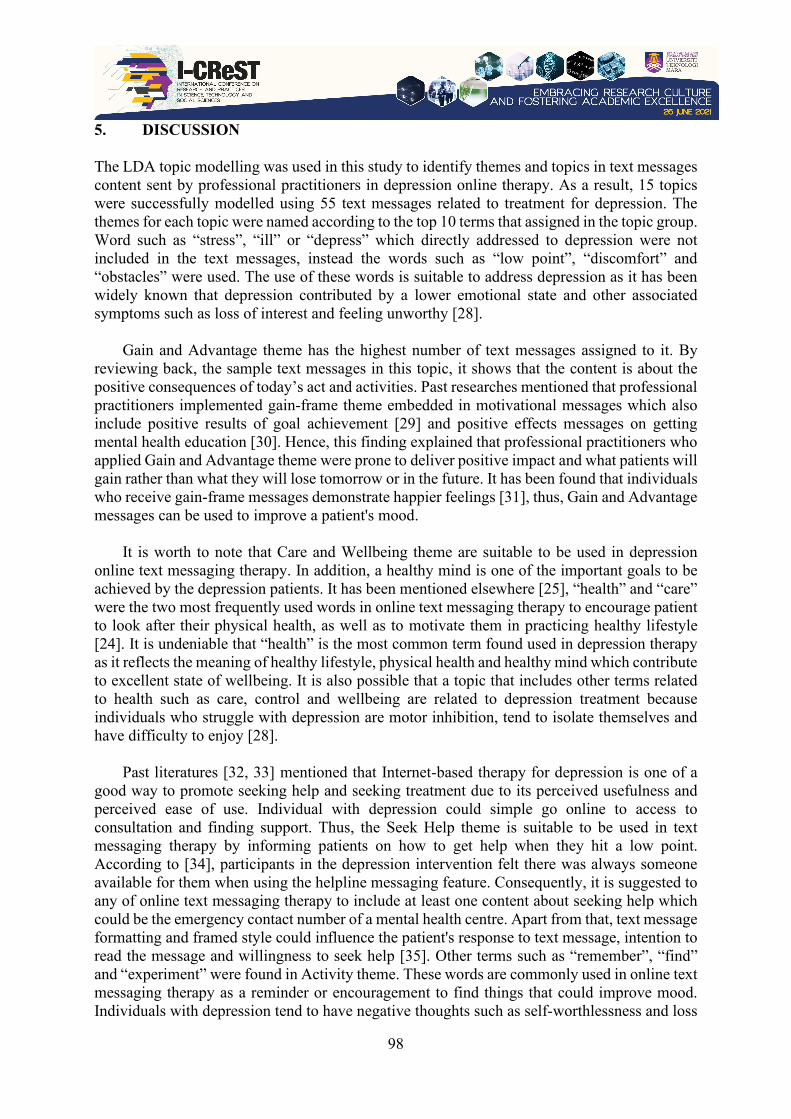
98
5. DISCUSSION
The LDA topic modelling was used in this study to identify themes and topics in text messages content sent by professional practitioners in depression online therapy. As a result, 15 topics were successfully modelled using 55 text messages related to treatment for depression. The themes for each topic were named according to the top 10 terms that assigned in the topic group. Word such as “stress”, “ill” or “depress” which directly addressed to depression were not included in the text messages, instead the words such as “low point”, “discomfort” and “obstacles” were used. The use of these words is suitable to address depression as it has been widely known that depression contributed by a lower emotional state and other associated symptoms such as loss of interest and feeling unworthy [28].
Gain and Advantage theme has the highest number of text messages assigned to it. By
reviewing back, the sample text messages in this topic, it shows that the content is about the positive consequences of today’s act and activities. Past researches mentioned that professional practitioners implemented gain-frame theme embedded in motivational messages which also include positive results of goal achievement [29] and positive effects messages on getting mental health education [30]. Hence, this finding explained that professional practitioners who applied Gain and Advantage theme were prone to deliver positive impact and what patients will gain rather than what they will lose tomorrow or in the future. It has been found that individuals who receive gain-frame messages demonstrate happier feelings [31], thus, Gain and Advantage messages can be used to improve a patient's mood.
It is worth to note that Care and Wellbeing theme are suitable to be used in depression
online text messaging therapy. In addition, a healthy mind is one of the important goals to be achieved by the depression patients. It has been mentioned elsewhere [25], “health” and “care” were the two most frequently used words in online text messaging therapy to encourage patient to look after their physical health, as well as to motivate them in practicing healthy lifestyle [24]. It is undeniable that “health” is the most common term found used in depression therapy as it reflects the meaning of healthy lifestyle, physical health and healthy mind which contribute to excellent state of wellbeing. It is also possible that a topic that includes other terms related to health such as care, control and wellbeing are related to depression treatment because individuals who struggle with depression are motor inhibition, tend to isolate themselves and have difficulty to enjoy [28].
Past literatures [32, 33] mentioned that Internet-based therapy for depression is one of a good way to promote seeking help and seeking treatment due to its perceived usefulness and perceived ease of use. Individual with depression could simple go online to access to consultation and finding support. Thus, the Seek Help theme is suitable to be used in text messaging therapy by informing patients on how to get help when they hit a low point. According to [34], participants in the depression intervention felt there was always someone available for them when using the helpline messaging feature. Consequently, it is suggested to any of online text messaging therapy to include at least one content about seeking help which could be the emergency contact number of a mental health centre. Apart from that, text message formatting and framed style could influence the patient's response to text message, intention to read the message and willingness to seek help [35]. Other terms such as “remember”, “find” and “experiment” were found in Activity theme. These words are commonly used in online text messaging therapy as a reminder or encouragement to find things that could improve mood. Individuals with depression tend to have negative thoughts such as self-worthlessness and loss
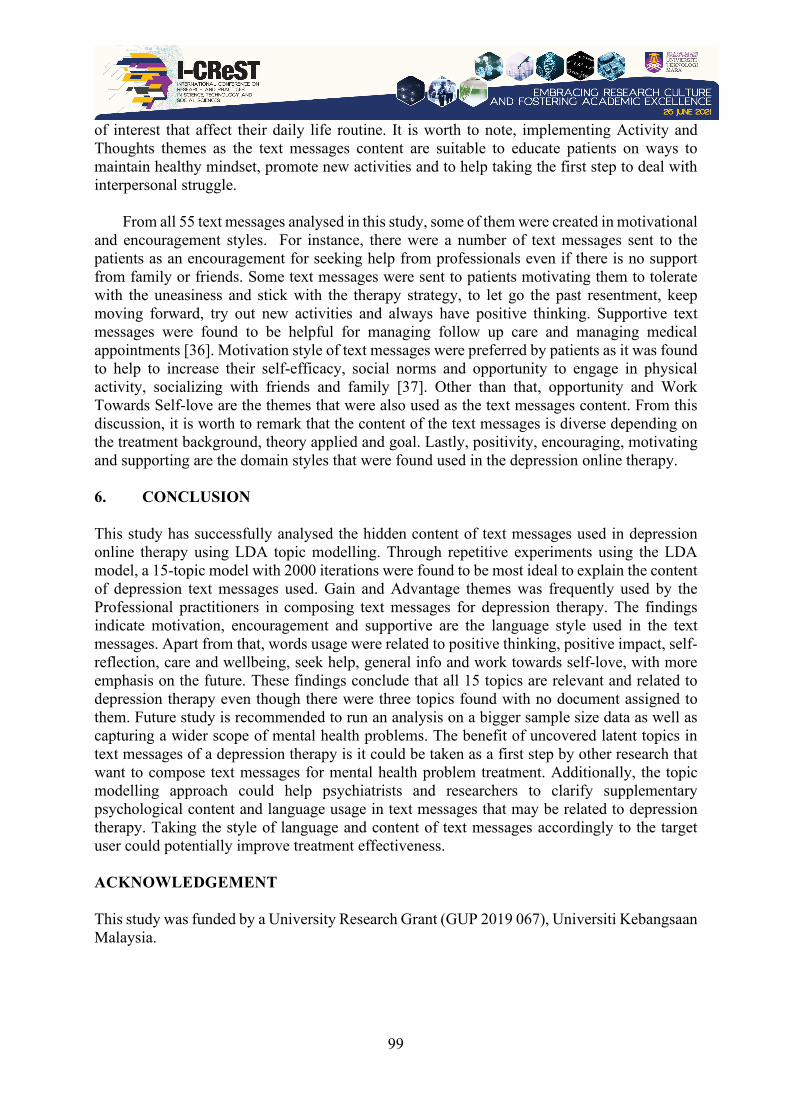
99
of interest that affect their daily life routine. It is worth to note, implementing Activity and Thoughts themes as the text messages content are suitable to educate patients on ways to maintain healthy mindset, promote new activities and to help taking the first step to deal with interpersonal struggle.
From all 55 text messages analysed in this study, some of them were created in motivational
and encouragement styles. For instance, there were a number of text messages sent to the patients as an encouragement for seeking help from professionals even if there is no support from family or friends. Some text messages were sent to patients motivating them to tolerate with the uneasiness and stick with the therapy strategy, to let go the past resentment, keep moving forward, try out new activities and always have positive thinking. Supportive text messages were found to be helpful for managing follow up care and managing medical appointments [36]. Motivation style of text messages were preferred by patients as it was found to help to increase their self-efficacy, social norms and opportunity to engage in physical activity, socializing with friends and family [37]. Other than that, opportunity and Work Towards Self-love are the themes that were also used as the text messages content. From this discussion, it is worth to remark that the content of the text messages is diverse depending on the treatment background, theory applied and goal. Lastly, positivity, encouraging, motivating and supporting are the domain styles that were found used in the depression online therapy. 6. CONCLUSION This study has successfully analysed the hidden content of text messages used in depression online therapy using LDA topic modelling. Through repetitive experiments using the LDA model, a 15-topic model with 2000 iterations were found to be most ideal to explain the content of depression text messages used. Gain and Advantage themes was frequently used by the Professional practitioners in composing text messages for depression therapy. The findings indicate motivation, encouragement and supportive are the language style used in the text messages. Apart from that, words usage were related to positive thinking, positive impact, self-reflection, care and wellbeing, seek help, general info and work towards self-love, with more emphasis on the future. These findings conclude that all 15 topics are relevant and related to depression therapy even though there were three topics found with no document assigned to them. Future study is recommended to run an analysis on a bigger sample size data as well as capturing a wider scope of mental health problems. The benefit of uncovered latent topics in text messages of a depression therapy is it could be taken as a first step by other research that want to compose text messages for mental health problem treatment. Additionally, the topic modelling approach could help psychiatrists and researchers to clarify supplementary psychological content and language usage in text messages that may be related to depression therapy. Taking the style of language and content of text messages accordingly to the target user could potentially improve treatment effectiveness. ACKNOWLEDGEMENT This study was funded by a University Research Grant (GUP 2019 067), Universiti Kebangsaan Malaysia.
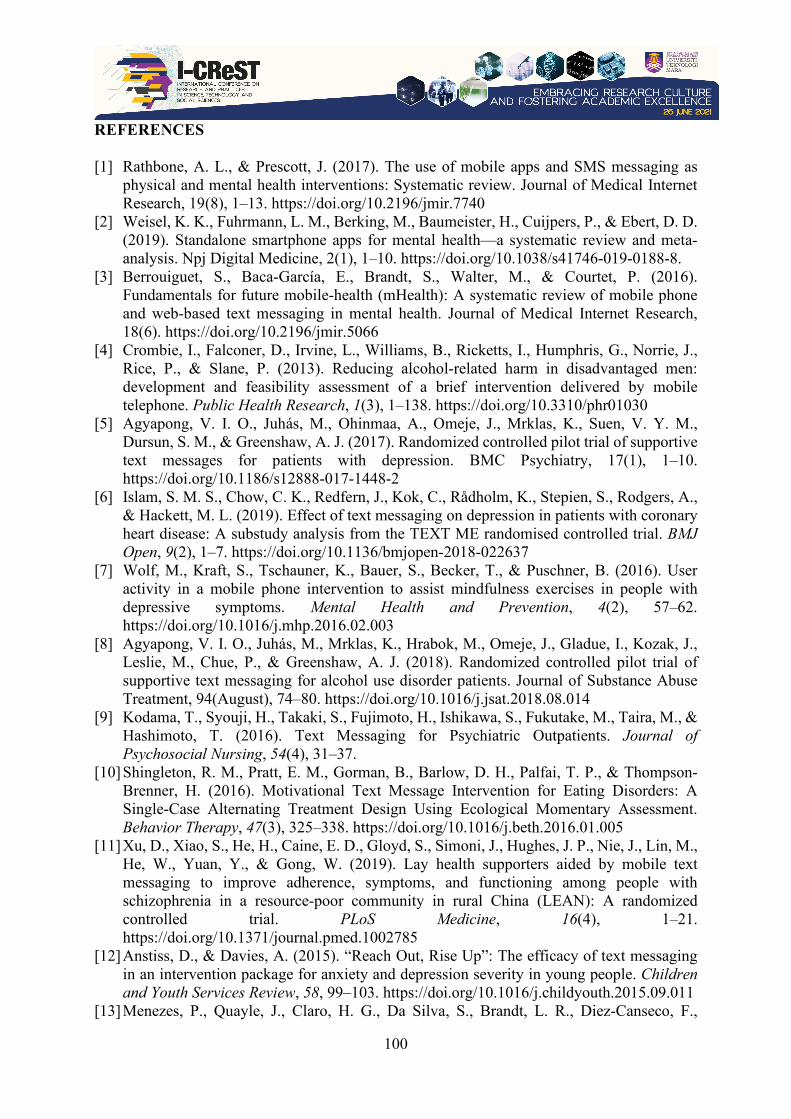
100
REFERENCES [1] Rathbone, A. L., & Prescott, J. (2017). The use of mobile apps and SMS messaging as
physical and mental health interventions: Systematic review. Journal of Medical Internet Research, 19(8), 1–13. https://doi.org/10.2196/jmir.7740
[2] Weisel, K. K., Fuhrmann, L. M., Berking, M., Baumeister, H., Cuijpers, P., & Ebert, D. D. (2019). Standalone smartphone apps for mental health—a systematic review and meta-analysis. Npj Digital Medicine, 2(1), 1–10. https://doi.org/10.1038/s41746-019-0188-8.
[3] Berrouiguet, S., Baca-García, E., Brandt, S., Walter, M., & Courtet, P. (2016). Fundamentals for future mobile-health (mHealth): A systematic review of mobile phone and web-based text messaging in mental health. Journal of Medical Internet Research, 18(6). https://doi.org/10.2196/jmir.5066
[4] Crombie, I., Falconer, D., Irvine, L., Williams, B., Ricketts, I., Humphris, G., Norrie, J., Rice, P., & Slane, P. (2013). Reducing alcohol-related harm in disadvantaged men: development and feasibility assessment of a brief intervention delivered by mobile telephone. Public Health Research, 1(3), 1–138. https://doi.org/10.3310/phr01030
[5] Agyapong, V. I. O., Juhás, M., Ohinmaa, A., Omeje, J., Mrklas, K., Suen, V. Y. M., Dursun, S. M., & Greenshaw, A. J. (2017). Randomized controlled pilot trial of supportive text messages for patients with depression. BMC Psychiatry, 17(1), 1–10. https://doi.org/10.1186/s12888-017-1448-2
[6] Islam, S. M. S., Chow, C. K., Redfern, J., Kok, C., Rådholm, K., Stepien, S., Rodgers, A., & Hackett, M. L. (2019). Effect of text messaging on depression in patients with coronary heart disease: A substudy analysis from the TEXT ME randomised controlled trial. BMJ Open, 9(2), 1–7. https://doi.org/10.1136/bmjopen-2018-022637
[7] Wolf, M., Kraft, S., Tschauner, K., Bauer, S., Becker, T., & Puschner, B. (2016). User activity in a mobile phone intervention to assist mindfulness exercises in people with depressive symptoms. Mental Health and Prevention, 4(2), 57–62. https://doi.org/10.1016/j.mhp.2016.02.003
[8] Agyapong, V. I. O., Juhás, M., Mrklas, K., Hrabok, M., Omeje, J., Gladue, I., Kozak, J., Leslie, M., Chue, P., & Greenshaw, A. J. (2018). Randomized controlled pilot trial of supportive text messaging for alcohol use disorder patients. Journal of Substance Abuse Treatment, 94(August), 74–80. https://doi.org/10.1016/j.jsat.2018.08.014
[9] Kodama, T., Syouji, H., Takaki, S., Fujimoto, H., Ishikawa, S., Fukutake, M., Taira, M., & Hashimoto, T. (2016). Text Messaging for Psychiatric Outpatients. Journal of Psychosocial Nursing, 54(4), 31–37.
[10] Shingleton, R. M., Pratt, E. M., Gorman, B., Barlow, D. H., Palfai, T. P., & Thompson-Brenner, H. (2016). Motivational Text Message Intervention for Eating Disorders: A Single-Case Alternating Treatment Design Using Ecological Momentary Assessment. Behavior Therapy, 47(3), 325–338. https://doi.org/10.1016/j.beth.2016.01.005
[11] Xu, D., Xiao, S., He, H., Caine, E. D., Gloyd, S., Simoni, J., Hughes, J. P., Nie, J., Lin, M., He, W., Yuan, Y., & Gong, W. (2019). Lay health supporters aided by mobile text messaging to improve adherence, symptoms, and functioning among people with schizophrenia in a resource-poor community in rural China (LEAN): A randomized controlled trial. PLoS Medicine, 16(4), 1–21. https://doi.org/10.1371/journal.pmed.1002785
[12] Anstiss, D., & Davies, A. (2015). “Reach Out, Rise Up”: The efficacy of text messaging in an intervention package for anxiety and depression severity in young people. Children and Youth Services Review, 58, 99–103. https://doi.org/10.1016/j.childyouth.2015.09.011
[13] Menezes, P., Quayle, J., Claro, H. G., Da Silva, S., Brandt, L. R., Diez-Canseco, F.,
101
Miranda, J. J., Price, L. S. N., Mohr, D. C., & Araya, R. (2019). Use of a mobile phone app to treat depression comorbid with hypertension or diabetes:A pilot study in Brazil and Peru. Journal of Medical Internet Research, 21(4), 1–12. https://doi.org/10.2196/11698
[14] Cox, K. L., & Allida, S. M. (2020). Text messages to reduce depressive symptoms : Do they work and what makes them effective ? A systematic review. Health Education Journal, 80(3), 253–271. https://doi.org/10.1177/0017896920959368
[15] D’Arcey, J., Collaton, J., Kozloff, N., Voineskos, A. N., Kidd, S. A., & Foussias, G. (2020). The Use of Text Messaging to Improve Clinical Engagement for Individuals With Psychosis: Systematic Review. JMIR Mental Health, 7(4), e16993. https://doi.org/10.2196/16993
[16] Chen, A. T., Swaminathan, A., Kearns, W. R., Alberts, N. M., Law, E. F., & Palermo, T. M. (2019). Understanding user experience: Exploring participants’messages with a web-based behavioral health intervention for adolescents with chronic pain. Journal of Medical Internet Research, 21(4). https://doi.org/10.2196/11756
[17] Franz, P. J., Nook, E. C., Mair, P., & Nock, M. K. (2019). Using Topic Modeling to Detect and Describe Self-Injurious and Related Content on a Large-Scale Digital Platform. Suicide and Life-Threatening Behavior, 50(1), 5–18. https://doi.org/10.1111/sltb.12569
[18] Kao, S. W., & Luarn, P. (2020). Topic modeling analysis of social enterprises: Twitter evidence. Sustainability (Switzerland), 12(8). https://doi.org/10.3390/SU12083419
[19] Grün, B., & Hornik, K. (2011). topicmodels: An R Package for Fitting Topic Models. Journal of Statistical Software., 40(13), 1–30.
[20] Albalawi, R., Yeap, T. H., & Benyoucef, M. (2020). Using Topic Modeling Methods for Short-Text Data: A Comparative Analysis. Frontiers in Artificial Intelligence, 3(July), 1–14. https://doi.org/10.3389/frai.2020.00042
[21] Blei, D. M., Ng, A. Y., & Jordan, M. I. (2003). Latent Dirichlet allocation. Journal of Machine Learning Research, 3(4–5), 993–1022. https://doi.org/10.1016/b978-0-12-411519-4.00006-9
[22] Aguilera, A., Bruehlman-Senecal, E., Demasi, O., & Avila, P. (2017). Automated Text Messaging as an Adjunct to Cognitive Behavioral Therapy for Depression:A Clinical Trial. Journal of Medical Internet Research, 19(5). https://doi.org/10.2196/jmir.6914
[23] Almeida, A. M. P., Almeida, H. S., & Figueiredo-Braga, M. (2018). Mobile solutions in depression: Enhancing communication with patients using an SMS-based intervention. Procedia Computer Science, 138(January), 89–96. https://doi.org/10.1016/j.procs.2018.10.013
[24] Barrera, Z. A., Aguilera, A., Inlow, N., & Servin, J. (2020). A preliminary study on the acceptability of a brief SMS program for perinatal women. Health Informatics Journal, 26(2), 1079–1087. https://doi.org/10.1177/1460458219866560
[25] Hartnett, D., Murphy, E., Kehoe, E., Agyapong, V., Mcloughlin, D. M., & Farren, C. (2017). Supportive text messages for patients with alcohol use disorder and a comorbid depression : a protocol for a single-blind randomised controlled aftercare trial. BMJ Open, 7:e013587. https://doi.org/10.1136/bmjopen-2016-013587
[26] Kraft, S., Wolf, M., Klein, T., Becker, T., Bauer, S., & Puschner, B. (2017). Text message feedback to support mindfulness practice in people with depressive symptoms: A pilot randomized controlled trial. JMIR MHealth and UHealth, 5(5). https://doi.org/10.2196/mhealth.7095
[27] Ranney, M. L., Freeman, J. R., Connell, G., Boyer, E., Walton, M., Guthrie, K., Cunningham, R. M., Behavior, H., G-, B., Worcester, N., & Arbor, A. (2017). HHS Public Access. Journal of Adolescent Health, 59(4), 401–410. https://doi.org/10.1016/j.jadohealth.2016.04.008.A
102
[28] Bernard, J. E. R. (2018). Depression: A Review of its Definition. MOJ Addiction Medicine & Therapy, 5(1), 7–8. https://doi.org/10.15406/mojamt.2018.05.00082
[29] Stolk-cooke, K. Van, Hayes, M., Baumel, A., & Muench, F. (2015). Understanding text-based persuasion and support tactics of concerned significant others. PeerJ, 1–20. https://doi.org/10.7717/peerj.1151
[30] Bai, L., Rao, Q., Cai, Z., Lv, Y., Wu, T., Shi, Z., Sharma, M., Zhao, Y., & Hou, X. (2019). Effects of Goal-Framed Messages on Mental Health Education Among Medical University Students: Moderating Role of Personal Involvement. Frontiers in Public Health, 7(December), 1–9. https://doi.org/10.3389/fpubh.2019.00371
[31] Suka, M., Yamauchi, T., & Yanagisawa, H. (2019). Responses to persuasive messages encouraging professional help seeking for depression: Comparison between individuals with and without psychological distress. Environmental Health and Preventive Medicine, 24(1), 1–9. https://doi.org/10.1186/s12199-019-0786-8
[32] Dear, B. F., Staples, L. G., Terides, M. D., Karin, E., Zou, J., Johnston, L., Gandy, M., Fogliati, V. J., Wootton, B. M., McEvoy, P. M., & Titov, N. (2015). Transdiagnostic versus disorder-specific and clinician-guided versus self-guided internet-delivered treatment for generalized anxiety disorder and comorbid disorders: A randomized controlled trial. Journal of Anxiety Disorders, 36, 63–77. https://doi.org/10.1016/j.janxdis.2015.09.003
[33] Staples, L. G., Dear, B. F., Johnson, B., Fogliati, V., Gandy, M., Fogliati, R., Nielssen, O., & Titov, N. (2019). Internet-delivered treatment for young adults with anxiety and depression: Evaluation in routine clinical care and comparison with research trial outcomes. Journal of Affective Disorders, 256, 103–109. https://doi.org/10.1016/j.jad.2019.05.058
[34] Chandra, P. S., Sowmya, H. R., Mehrotra, S., & Duggal, M. (2014). “SMS” for mental health - Feasibility and acceptability of using text messages for mental health promotion among young women from urban lowincome settings in India. Asian Journal of Psychiatry, 11, 59–64. https://doi.org/10.1016/j.ajp.2014.06.008
[35] Suka, M., Yamauchi, T., & Yanagisawa, H. (2018). Comparing responses to differently framed and formatted persuasive messages to encourage help-seeking for depression in Japanese adults: A cross-sectional study with 2-month follow-up. BMJ Open, 8(11), 1–9. https://doi.org/10.1136/bmjopen-2017-020823
[36] Agyapong, V. I. O., Mrklas, K., Juhás, M., Omeje, J., Ohinmaa, A., Dursun, S. M., & Greenshaw, A. J. (2016). Cross-sectional survey evaluating Text4Mood: Mobile health program to reduce psychological treatment gap in mental healthcare in Alberta through daily supportive text messages. BMC Psychiatry, 16(1), 1–12. https://doi.org/10.1186/s12888-016-1104-2
[37] Avila-garcia, P., Hernandez-ramos, R., Nouri, S. S., Cemballi, A., Sarkar, U., Lyles, C. R., & Aguilera, A. (2019). Engaging users in the design of an mHealth, text message-based intervention to increase physical activity at a safety-net health care system. 2(October), 489–497. https://doi.org/10.1093/jamiaopen/ooz049
103
I-CReST 2021:108-117 – Willingness to Pay for the External Cost of Last Mile Delivery Services in Jakarta
*1Fanny Mailan Sari, 1Nahry, 1Jachrizal Sumabrata, 1Mochamad Adhiraga Pratam
1Department of Civil Engineering, Universitas Indonesia, Depok, Indonesia
*E-mail: [email protected]
ABSTRACT The growth of the e-commerce business has caused the use of goods vehicles in urban areas to increase, especially in the last mile delivery. Last mile delivery is the final part of logistics services from courier to consumers which can produce air pollution that harms environment. The last mile delivery system in the e-commerce business is considered the most expensive, inefficient and polluting part of the entire logistics supply chain. In addition, the pollution can cause various respiratory diseases for the people of Jakarta, Indonesia. This study aimed to analyse the value of the willingness to pay (WTP) for last mile delivery (LMD) service users due to the impact of negative externalities. The determination of the WTP value used the Contingent Valuation Method (CVM) method based on a hypothesis of the compensation cost for air pollution of 10,000 IDR/package. The survey was conducted online of 400 respondents who lived in Jakarta. The results showed that the WTP value was 11,493 IDR. This high WTP value was due to the fact that Jakarta residents already have awareness regarding the dangers and impacts of air pollution on health. Keywords: Last mile delivery; external cost; willingness to pay; stated preference; contingent valuation method; air pollution 1. INTRODUCTION The growth of successful and increasing e-commerce in developed and developing countries has provided a positive influence on goods delivery activities [1]. The development of the e-commerce business has caused the use of goods vehicles as a means of transporting goods in urban areas to increase, especially in the last mile delivery [2]. Last mile delivery is the final process in e-commerce business services by sending consumer orders directly to the last recipient in the logistics chain [3]. However, the last mile delivery system in the e-commerce business is considered the most expensive, inefficient and polluting part of the entire logistics chain [4].
The increasing number of logistics delivery vehicles, such as trucks, vans and motorbikes in urban areas has resulted in congestion and air pollution due to vehicle exhaust emissions and noise pollution [5]. In addition, the total carbon footprint produced in the goods transportation sector contributes as much as 30% of CO2 gas emissions from the transportation sector or 7% of CO2 gas emissions globally [6].
The negative effects of air pollution on public health have become a major concern in many
cities of developing countries in recent decades [7]. To reduce these problems, compensation
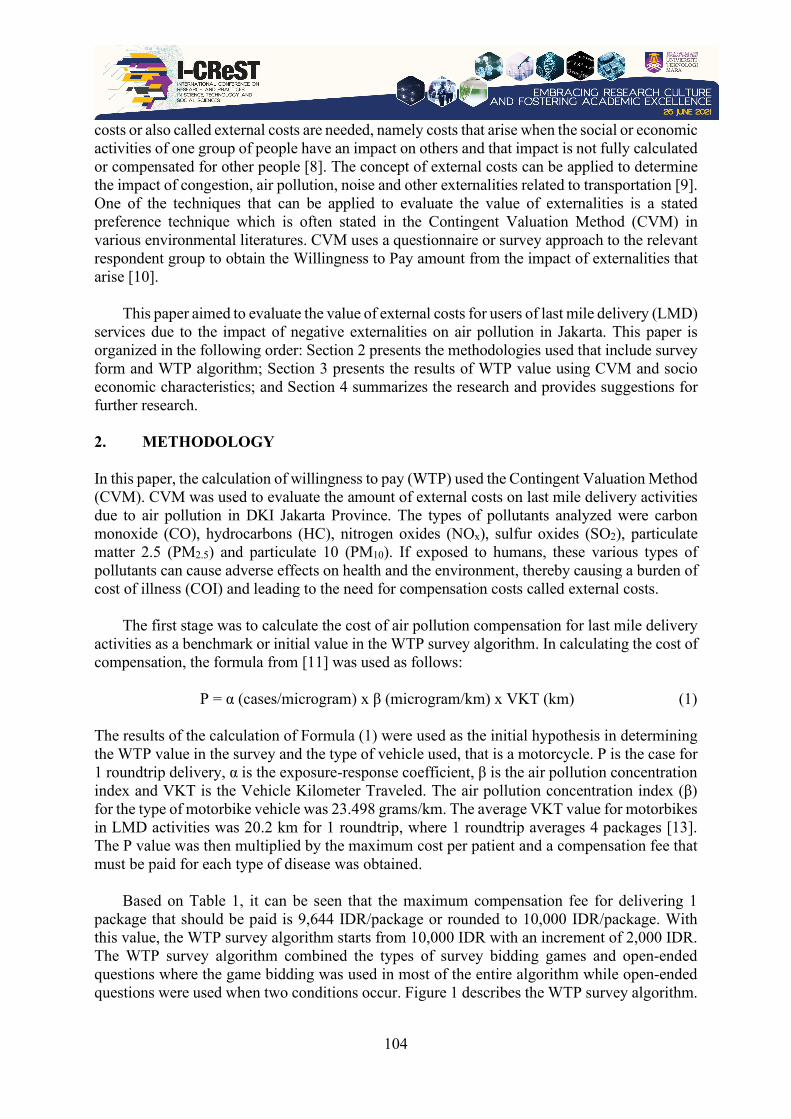
104
costs or also called external costs are needed, namely costs that arise when the social or economic activities of one group of people have an impact on others and that impact is not fully calculated or compensated for other people [8]. The concept of external costs can be applied to determine the impact of congestion, air pollution, noise and other externalities related to transportation [9]. One of the techniques that can be applied to evaluate the value of externalities is a stated preference technique which is often stated in the Contingent Valuation Method (CVM) in various environmental literatures. CVM uses a questionnaire or survey approach to the relevant respondent group to obtain the Willingness to Pay amount from the impact of externalities that arise [10].
This paper aimed to evaluate the value of external costs for users of last mile delivery (LMD)
services due to the impact of negative externalities on air pollution in Jakarta. This paper is organized in the following order: Section 2 presents the methodologies used that include survey form and WTP algorithm; Section 3 presents the results of WTP value using CVM and socio economic characteristics; and Section 4 summarizes the research and provides suggestions for further research. 2. METHODOLOGY In this paper, the calculation of willingness to pay (WTP) used the Contingent Valuation Method (CVM). CVM was used to evaluate the amount of external costs on last mile delivery activities due to air pollution in DKI Jakarta Province. The types of pollutants analyzed were carbon monoxide (CO), hydrocarbons (HC), nitrogen oxides (NOx), sulfur oxides (SO2), particulate matter 2.5 (PM2.5) and particulate 10 (PM10). If exposed to humans, these various types of pollutants can cause adverse effects on health and the environment, thereby causing a burden of cost of illness (COI) and leading to the need for compensation costs called external costs.
The first stage was to calculate the cost of air pollution compensation for last mile delivery activities as a benchmark or initial value in the WTP survey algorithm. In calculating the cost of compensation, the formula from [11] was used as follows:
P = α (cases/microgram) x β (microgram/km) x VKT (km) (1) The results of the calculation of Formula (1) were used as the initial hypothesis in determining the WTP value in the survey and the type of vehicle used, that is a motorcycle. P is the case for 1 roundtrip delivery, α is the exposure-response coefficient, β is the air pollution concentration index and VKT is the Vehicle Kilometer Traveled. The air pollution concentration index (β) for the type of motorbike vehicle was 23.498 grams/km. The average VKT value for motorbikes in LMD activities was 20.2 km for 1 roundtrip, where 1 roundtrip averages 4 packages [13]. The P value was then multiplied by the maximum cost per patient and a compensation fee that must be paid for each type of disease was obtained.
Based on Table 1, it can be seen that the maximum compensation fee for delivering 1 package that should be paid is 9,644 IDR/package or rounded to 10,000 IDR/package. With this value, the WTP survey algorithm starts from 10,000 IDR with an increment of 2,000 IDR. The WTP survey algorithm combined the types of survey bidding games and open-ended questions where the game bidding was used in most of the entire algorithm while open-ended questions were used when two conditions occur. Figure 1 describes the WTP survey algorithm.
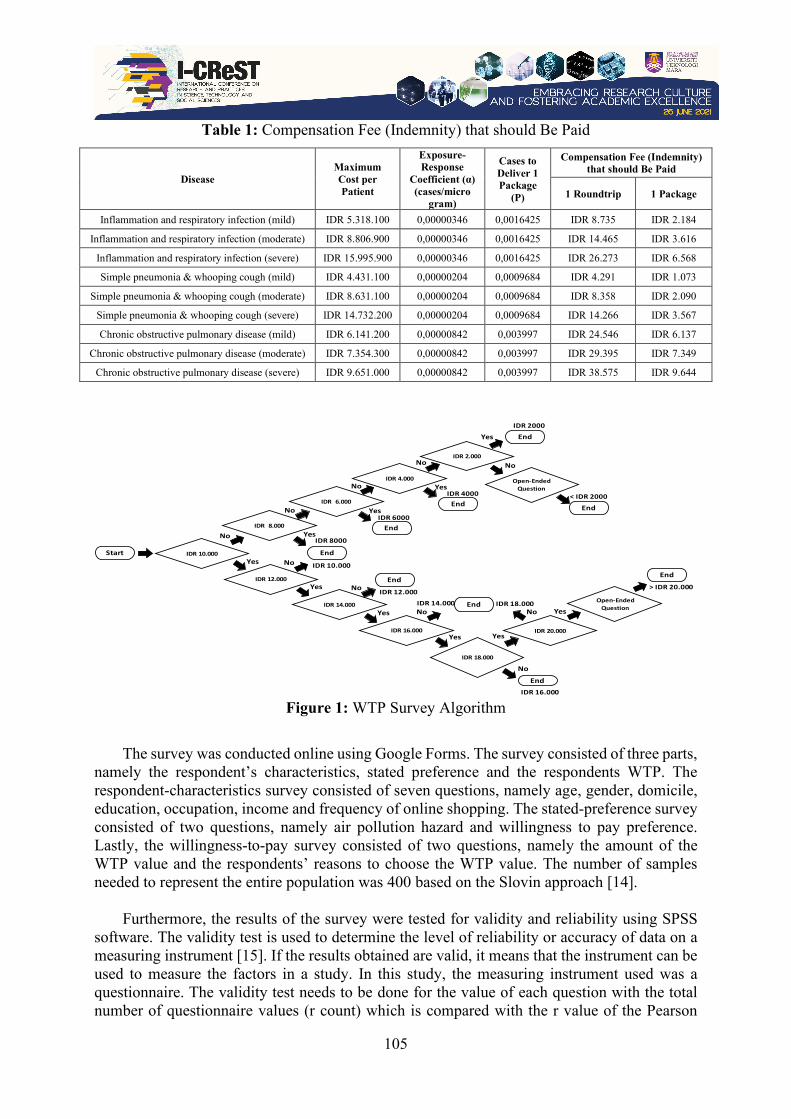
105
Table 1: Compensation Fee (Indemnity) that should Be Paid
Disease Maximum Cost per Patient
Exposure-Response
Coefficient (α) (cases/micro
gram)
Cases to Deliver 1 Package
(P)
Compensation Fee (Indemnity) that should Be Paid
1 Roundtrip 1 Package
Inflammation and respiratory infection (mild) IDR 5.318.100 0,00000346 0,0016425 IDR 8.735 IDR 2.184
Inflammation and respiratory infection (moderate) IDR 8.806.900 0,00000346 0,0016425 IDR 14.465 IDR 3.616
Inflammation and respiratory infection (severe) IDR 15.995.900 0,00000346 0,0016425 IDR 26.273 IDR 6.568
Simple pneumonia & whooping cough (mild) IDR 4.431.100 0,00000204 0,0009684 IDR 4.291 IDR 1.073
Simple pneumonia & whooping cough (moderate) IDR 8.631.100 0,00000204 0,0009684 IDR 8.358 IDR 2.090
Simple pneumonia & whooping cough (severe) IDR 14.732.200 0,00000204 0,0009684 IDR 14.266 IDR 3.567
Chronic obstructive pulmonary disease (mild) IDR 6.141.200 0,00000842 0,003997 IDR 24.546 IDR 6.137
Chronic obstructive pulmonary disease (moderate) IDR 7.354.300 0,00000842 0,003997 IDR 29.395 IDR 7.349
Chronic obstructive pulmonary disease (severe) IDR 9.651.000 0,00000842 0,003997 IDR 38.575 IDR 9.644
Figure 1: WTP Survey Algorithm
The survey was conducted online using Google Forms. The survey consisted of three parts,
namely the respondent’s characteristics, stated preference and the respondents WTP. The respondent-characteristics survey consisted of seven questions, namely age, gender, domicile, education, occupation, income and frequency of online shopping. The stated-preference survey consisted of two questions, namely air pollution hazard and willingness to pay preference. Lastly, the willingness-to-pay survey consisted of two questions, namely the amount of the WTP value and the respondents’ reasons to choose the WTP value. The number of samples needed to represent the entire population was 400 based on the Slovin approach [14].
Furthermore, the results of the survey were tested for validity and reliability using SPSS software. The validity test is used to determine the level of reliability or accuracy of data on a measuring instrument [15]. If the results obtained are valid, it means that the instrument can be used to measure the factors in a study. In this study, the measuring instrument used was a questionnaire. The validity test needs to be done for the value of each question with the total number of questionnaire values (r count) which is compared with the r value of the Pearson
IDR 10.000
IDR 8.000
IDR 6.000
IDR 12.000
IDR 4.000
IDR 14.000
IDR 16.000
IDR 18.000
IDR 20.000
IDR 8000No
No
No
No
Start End
Yes
Yes
Yes
End
End
IDR 6000
Yes
Yes
Yes
Yes Yes
Yes
> IDR 20.000
No
No
No
IDR 10.000
End
End
End
No
IDR 12.000
IDR 14.000 IDR 18.000
IDR 16.000
End
No
IDR 2.000
End
No
YesIDR 2000
IDR 4000 < IDR 2000
End
Open-EndedQuestion
Open-EndedQuestion
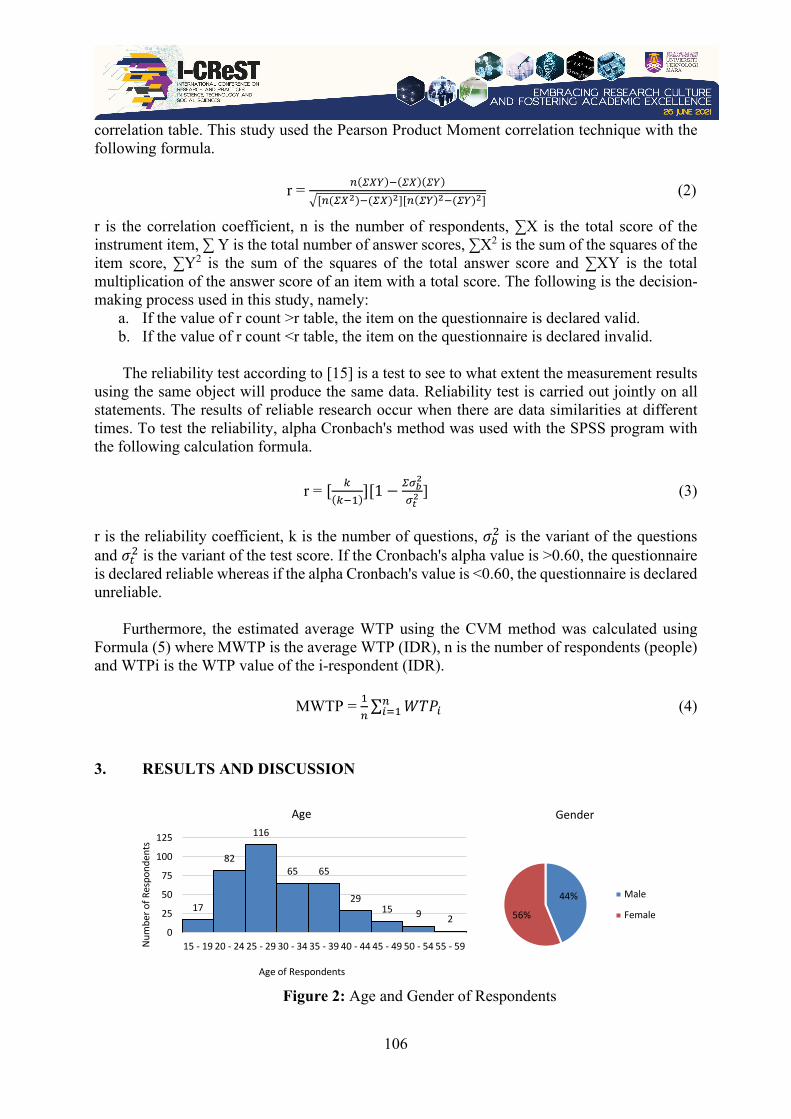
106
correlation table. This study used the Pearson Product Moment correlation technique with the following formula.
r = 𝑛𝑛(𝛴𝛴𝛴𝛴𝛴𝛴)−(𝛴𝛴𝛴𝛴)(𝛴𝛴𝛴𝛴)
�[𝑛𝑛(𝛴𝛴𝛴𝛴2)−(𝛴𝛴𝛴𝛴)2][𝑛𝑛(𝛴𝛴𝛴𝛴)2−(𝛴𝛴𝛴𝛴)2] (2)
r is the correlation coefficient, n is the number of respondents, ∑X is the total score of the instrument item, ∑ Y is the total number of answer scores, ∑X2 is the sum of the squares of the item score, ∑Y2 is the sum of the squares of the total answer score and ∑XY is the total multiplication of the answer score of an item with a total score. The following is the decision-making process used in this study, namely:
a. If the value of r count >r table, the item on the questionnaire is declared valid. b. If the value of r count <r table, the item on the questionnaire is declared invalid.
The reliability test according to [15] is a test to see to what extent the measurement results
using the same object will produce the same data. Reliability test is carried out jointly on all statements. The results of reliable research occur when there are data similarities at different times. To test the reliability, alpha Cronbach's method was used with the SPSS program with the following calculation formula.
r = [ 𝑘𝑘
(𝑘𝑘−1)][1 − 𝛴𝛴𝛴𝛴𝑏𝑏2
𝛴𝛴𝑡𝑡2 ] (3)
r is the reliability coefficient, k is the number of questions, 𝜎𝜎𝑏𝑏
2 is the variant of the questions and 𝜎𝜎𝑠𝑠
2 is the variant of the test score. If the Cronbach's alpha value is >0.60, the questionnaire is declared reliable whereas if the alpha Cronbach's value is <0.60, the questionnaire is declared unreliable.
Furthermore, the estimated average WTP using the CVM method was calculated using
Formula (5) where MWTP is the average WTP (IDR), n is the number of respondents (people) and WTPi is the WTP value of the i-respondent (IDR).
MWTP = 1𝑛𝑛
∑ 𝑊𝑊𝑇𝑇𝐹𝐹𝑖𝑖𝑛𝑛𝑖𝑖=1 (4)
3. RESULTS AND DISCUSSION
Figure 2: Age and Gender of Respondents
17
82
116
65 65
2915 9 2
0
25
50
75
100
125
15 - 19 20 - 24 25 - 29 30 - 34 35 - 39 40 - 44 45 - 49 50 - 54 55 - 59Num
ber o
f Res
pond
ents
Age of Respondents
Age
44%
56%
Gender
Male
Female
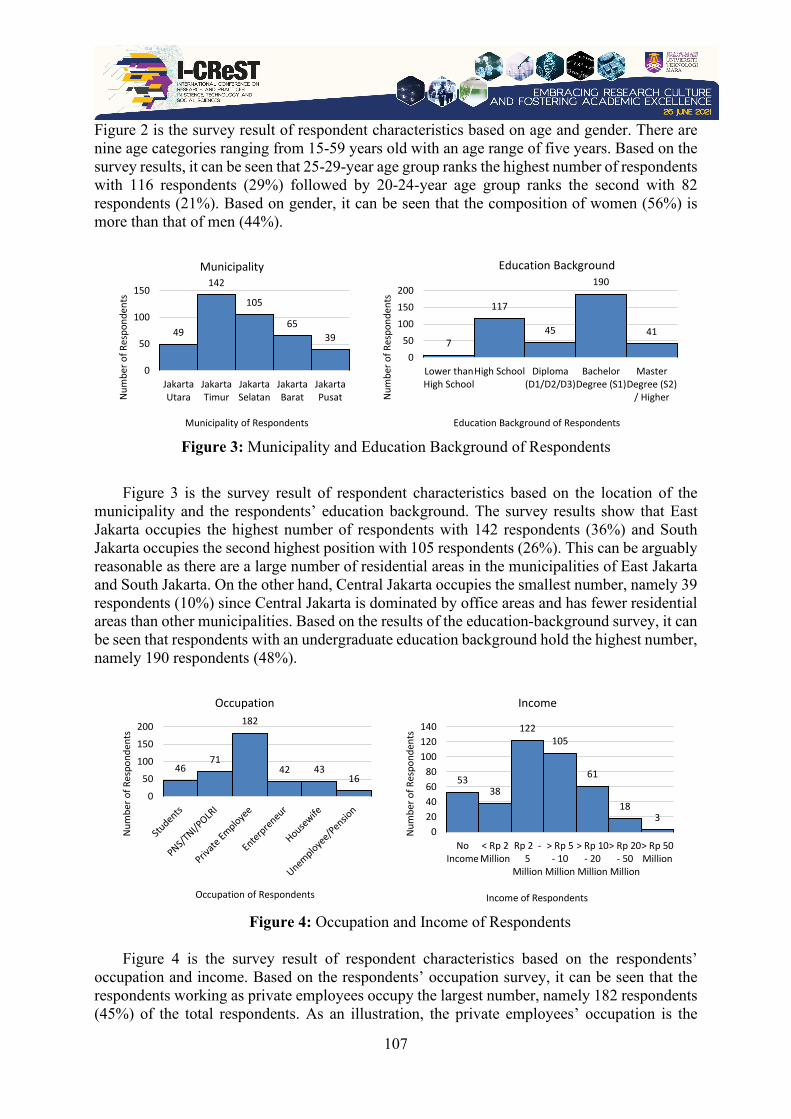
107
Figure 2 is the survey result of respondent characteristics based on age and gender. There are nine age categories ranging from 15-59 years old with an age range of five years. Based on the survey results, it can be seen that 25-29-year age group ranks the highest number of respondents with 116 respondents (29%) followed by 20-24-year age group ranks the second with 82 respondents (21%). Based on gender, it can be seen that the composition of women (56%) is more than that of men (44%).
Figure 3: Municipality and Education Background of Respondents
Figure 3 is the survey result of respondent characteristics based on the location of the
municipality and the respondents’ education background. The survey results show that East Jakarta occupies the highest number of respondents with 142 respondents (36%) and South Jakarta occupies the second highest position with 105 respondents (26%). This can be arguably reasonable as there are a large number of residential areas in the municipalities of East Jakarta and South Jakarta. On the other hand, Central Jakarta occupies the smallest number, namely 39 respondents (10%) since Central Jakarta is dominated by office areas and has fewer residential areas than other municipalities. Based on the results of the education-background survey, it can be seen that respondents with an undergraduate education background hold the highest number, namely 190 respondents (48%).
Figure 4: Occupation and Income of Respondents
Figure 4 is the survey result of respondent characteristics based on the respondents’
occupation and income. Based on the respondents’ occupation survey, it can be seen that the respondents working as private employees occupy the largest number, namely 182 respondents (45%) of the total respondents. As an illustration, the private employees’ occupation is the
49
142
105
6539
0
50
100
150
JakartaUtara
JakartaTimur
JakartaSelatan
JakartaBarat
JakartaPusatN
umbe
r of R
espo
nden
ts
Municipality of Respondents
Municipality
7
117
45
190
41
050
100150200
Lower thanHigh School
High School Diploma(D1/D2/D3)
BachelorDegree (S1)
MasterDegree (S2)
/ HigherNum
ber o
f Res
pond
ents
Education Background of Respondents
Education Background
4671
182
42 4316
0
50
100
150
200
Num
ber o
f Res
pond
ents
Occupation of Respondents
Occupation
5338
122105
61
183
020406080
100120140
NoIncome
< Rp 2Million
Rp 2 -5
Million
> Rp 5- 10
Million
> Rp 10- 20
Million
> Rp 20- 50
Million
> Rp 50Million
Num
ber o
f Res
pond
ents
Income of Respondents
Income
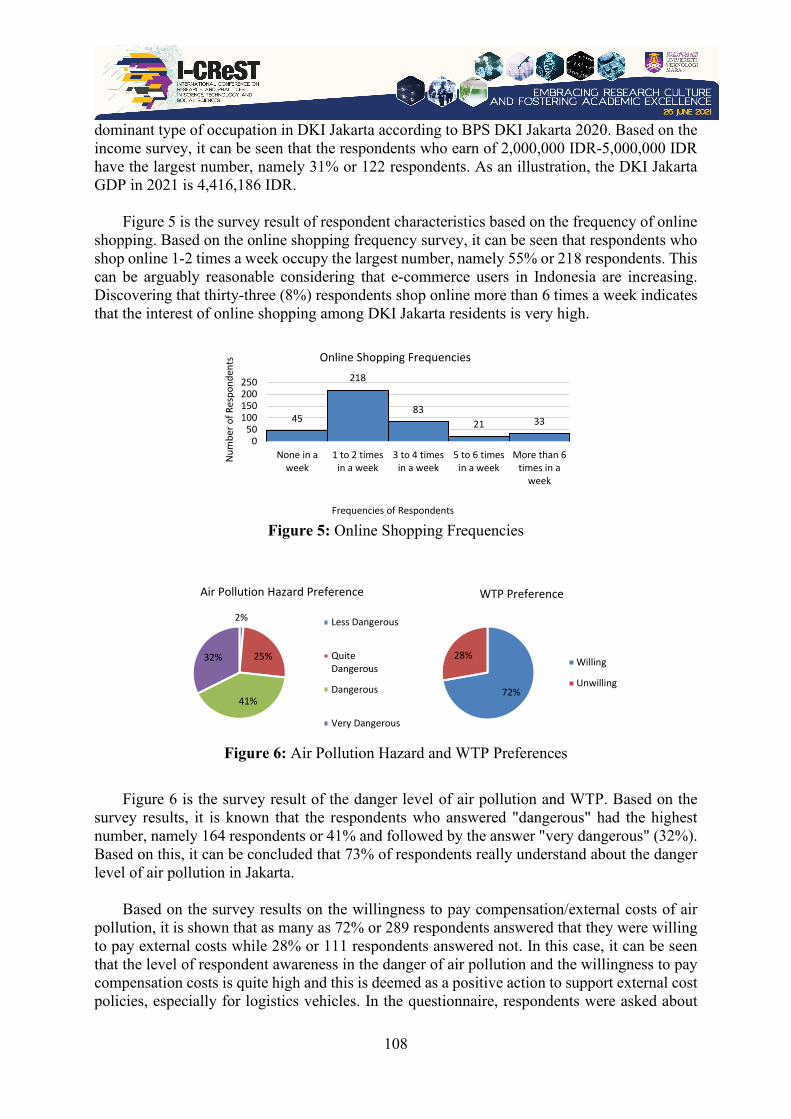
108
dominant type of occupation in DKI Jakarta according to BPS DKI Jakarta 2020. Based on the income survey, it can be seen that the respondents who earn of 2,000,000 IDR-5,000,000 IDR have the largest number, namely 31% or 122 respondents. As an illustration, the DKI Jakarta GDP in 2021 is 4,416,186 IDR.
Figure 5 is the survey result of respondent characteristics based on the frequency of online
shopping. Based on the online shopping frequency survey, it can be seen that respondents who shop online 1-2 times a week occupy the largest number, namely 55% or 218 respondents. This can be arguably reasonable considering that e-commerce users in Indonesia are increasing. Discovering that thirty-three (8%) respondents shop online more than 6 times a week indicates that the interest of online shopping among DKI Jakarta residents is very high.
Figure 5: Online Shopping Frequencies
Figure 6: Air Pollution Hazard and WTP Preferences
Figure 6 is the survey result of the danger level of air pollution and WTP. Based on the
survey results, it is known that the respondents who answered "dangerous" had the highest number, namely 164 respondents or 41% and followed by the answer "very dangerous" (32%). Based on this, it can be concluded that 73% of respondents really understand about the danger level of air pollution in Jakarta.
Based on the survey results on the willingness to pay compensation/external costs of air
pollution, it is shown that as many as 72% or 289 respondents answered that they were willing to pay external costs while 28% or 111 respondents answered not. In this case, it can be seen that the level of respondent awareness in the danger of air pollution and the willingness to pay compensation costs is quite high and this is deemed as a positive action to support external cost policies, especially for logistics vehicles. In the questionnaire, respondents were asked about
45
218
8321 33
050
100150200250
None in aweek
1 to 2 timesin a week
3 to 4 timesin a week
5 to 6 timesin a week
More than 6times in a
week
Num
ber o
f Res
pond
ents
Frequencies of Respondents
Online Shopping Frequencies
2%
25%
41%
32%
Air Pollution Hazard Preference
Less Dangerous
QuiteDangerous
Dangerous
Very Dangerous
72%
28%
WTP Preference
Willing
Unwilling
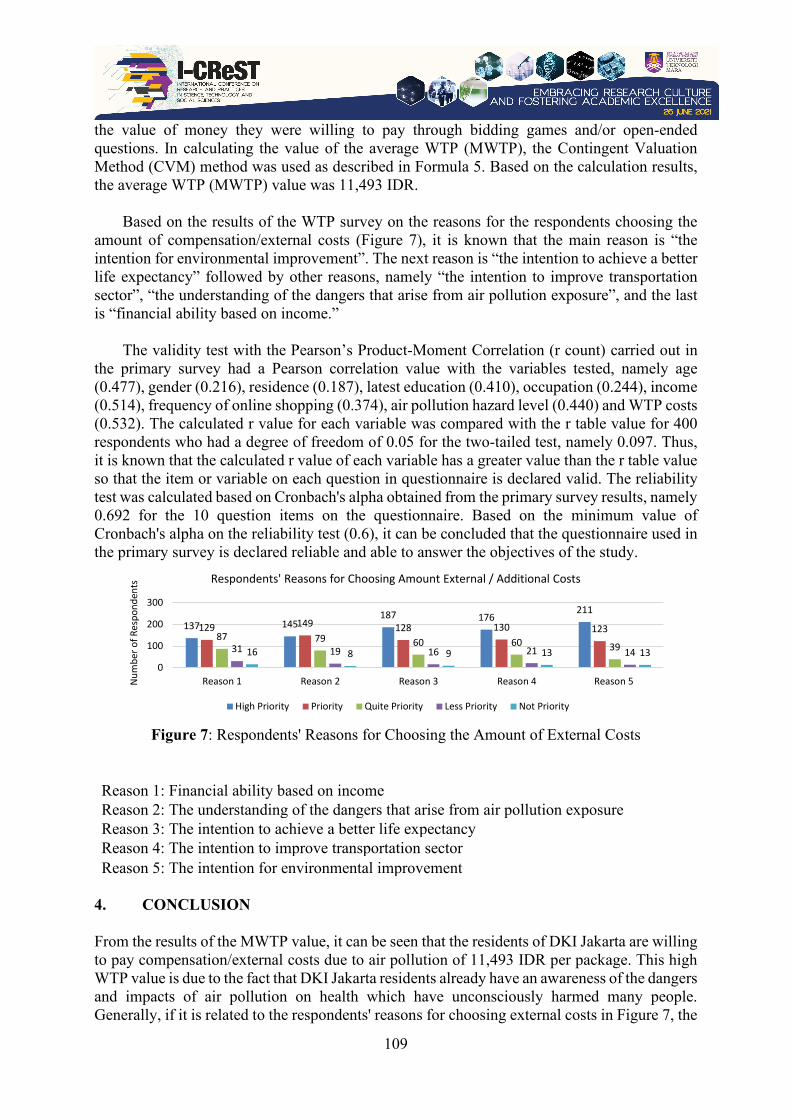
109
the value of money they were willing to pay through bidding games and/or open-ended questions. In calculating the value of the average WTP (MWTP), the Contingent Valuation Method (CVM) method was used as described in Formula 5. Based on the calculation results, the average WTP (MWTP) value was 11,493 IDR.
Based on the results of the WTP survey on the reasons for the respondents choosing the
amount of compensation/external costs (Figure 7), it is known that the main reason is “the intention for environmental improvement”. The next reason is “the intention to achieve a better life expectancy” followed by other reasons, namely “the intention to improve transportation sector”, “the understanding of the dangers that arise from air pollution exposure”, and the last is “financial ability based on income.”
The validity test with the Pearson’s Product-Moment Correlation (r count) carried out in
the primary survey had a Pearson correlation value with the variables tested, namely age (0.477), gender (0.216), residence (0.187), latest education (0.410), occupation (0.244), income (0.514), frequency of online shopping (0.374), air pollution hazard level (0.440) and WTP costs (0.532). The calculated r value for each variable was compared with the r table value for 400 respondents who had a degree of freedom of 0.05 for the two-tailed test, namely 0.097. Thus, it is known that the calculated r value of each variable has a greater value than the r table value so that the item or variable on each question in questionnaire is declared valid. The reliability test was calculated based on Cronbach's alpha obtained from the primary survey results, namely 0.692 for the 10 question items on the questionnaire. Based on the minimum value of Cronbach's alpha on the reliability test (0.6), it can be concluded that the questionnaire used in the primary survey is declared reliable and able to answer the objectives of the study.
Figure 7: Respondents' Reasons for Choosing the Amount of External Costs
Reason 1: Financial ability based on income Reason 2: The understanding of the dangers that arise from air pollution exposure Reason 3: The intention to achieve a better life expectancy Reason 4: The intention to improve transportation sector Reason 5: The intention for environmental improvement
4. CONCLUSION From the results of the MWTP value, it can be seen that the residents of DKI Jakarta are willing to pay compensation/external costs due to air pollution of 11,493 IDR per package. This high WTP value is due to the fact that DKI Jakarta residents already have an awareness of the dangers and impacts of air pollution on health which have unconsciously harmed many people. Generally, if it is related to the respondents' reasons for choosing external costs in Figure 7, the
137 145187 176
211
129 149 128 130 12387 79 60 60 3931 19 16 21 1416 8 9 13 13
0
100
200
300
Reason 1 Reason 2 Reason 3 Reason 4 Reason 5Num
ber o
f Res
pond
ents Respondents' Reasons for Choosing Amount External / Additional Costs
High Priority Priority Quite Priority Less Priority Not Priority

110
main reason is that they want improvements in the environmental sector so that it can be said that it is reasonable if the value of compensation/external costs due to air pollution can be said to be quite high (11,493 IDR) and higher than the hypothesis (10,000 IDR). In addition, the value of compensation costs that must be paid is quite high due to the socio-economic conditions of the respondents with most of whom are at productive age (25-29 years old) and have an undergraduate education background as illustrated in Figure 2 and Figure 3. The compensation costs that must be paid are quite high since the majority of the respondents’ occupations are private employees with an income of 2,000,000 IDR-5,000,000 IDR as explained in Figure 4. ACKNOWLEDGEMENT This research was supported by the Provincial Government of DKI Jakarta in the 2018 Education Scholarship Program. REFERENCES [1] Yu, Y., Wang, X., Zhong, R. Y., & Huang, G. Q. (2016). E-commerce Logistics in Supply
Chain Management: Practice Perspective. Procedia CIRP, 52, 179–185. https://doi.org/10.1016/j.procir.2016.08.002
[2] Baynal, K., & Boyaci, A. İ. (2016). E-Commerce Research and Applications A Proposal for Classification and An Updated Literature Review. International Refereed Journal Of Marketing and Market Researches, 9, 23–23. https://doi.org/10.17369/UHPAD.2016923644
[3] Gevaers, R., Van De Voorde, E., & Vanelslander, T. (2011). Characteristics and typology of lastmile logistics from an innovation perspective in an Urban context. In City Distribution and Urban Freight Transport: Multiple Perspectives. https://doi.org/10.4337/9780857932754.00009
[4] Gevaers, R., Van de Voorde, E., & Vanelslander, T. (2014). Cost Modelling and Simulation of Last-mile Characteristics in an Innovative B2C Supply Chain Environment with Implications on Urban Areas and Cities. Procedia - Social and Behavioral Sciences, 125, 398–411. https://doi.org/10.1016/j.sbspro.2014.01.1483
[5] Liu, C., Wang, Q., & Susilo, Y. O. (2019). Assessing the impacts of collection-delivery points to individual’s activity-travel patterns: A greener last mile alternative? Transportation Research Part E: Logistics and Transportation Review, 121, 84–99. https://doi.org/10.1016/j.tre.2017.08.007
[6] International Transport Forum. (2015). The carbon footprint of global trade: Tackling emissions from international freight transport. 12.
[7] Ma, J., Chen, Z., Wu, M., Feng, J., Horii, Y., Ohura, T., & Kannan, K. (2013). Airborne PM2.5/PM10-associated chlorinated polycyclic aromatic hydrocarbons and their parent compounds in a suburban area in Shanghai, China. Environmental Science and Technology, 47(14), 7615–7623. https://doi.org/10.1021/es400338h
[8] European Commission. (2019). Handbook on External Costs of Transport. Handbook, 1. https://doi.org/Ref: ED 57769 - Issue Number 1
[9] de Palma, A., Lindsey, R., Quinet, E., & Vickerman, R. (2011). A Handbook of Transport Economics. In A. de Palma, R. Lindsey, E. Quinet, & R. Vickerman (Eds.), A Handbook of Transport Economics. Edward Elgar Publishing Limited. https://doi.org/10.4337/9780857930873
111
[10] Carson, R. T. (2000). Contingent valuation: A user’s guide. Environmental Science and Technology. https://doi.org/10.1021/es990728j
[11] Mursinto, D., & Kusumawardani, D. (2016). Estimasi Dampak Ekonomi Dari Pencemaran Udara Terhadap Kesehatan Di Indonesia. Jurnal Kesehatan Masyarakat, 11(2), 163. https://doi.org/10.15294/kemas.v11i2.3677
[12] Muziansyah, D., Sulistyorini, R., & Sebayang, S. (2019). Model Emisi Gas Buangan Kendaraan Bermotor Akibat Aktivitas Transportasi ( Studi Kasus : Terminal Pasar Bawah Ramayana Koita Bandar Lampung ). Jrsdd, 3(1), 57–70.
[13] Talitha. (2021). Optimalisasi Sistem Distribusi Last Mile Delivery dengan Mempertimbangkan Biaya Eksternal. In Thesis (Issue 1). Universitas Indonesia.
[14] Stephanie. (2012). Slovin’s Formula: What is it and When do I use it? - Statistics How To. May 14, 2012.
[15] Sugiyono. (2017). Metode Penelitian Bisnis (Pendekatan Kuantitatif, Kualitatif, Kombinasi dan R&D). In Metodelogi Penelitian.
112
I-CReST 2021:112-134 – Affecting Factors that Committing Motorcyclists Violations at RLC
*1Nurul Firkhati Hidayah, 1Tri Tjahjono, 2Guritnaningsih Santoso
1Civil Engineering Department, University of Indonesia, Depok, Indonesia
2Psychology Department, University of Indonesia, Depok, Indonesia
*E-mail: [email protected]
ABSTRACT The Railway-Road crossing (RLC) in Indonesia has a very high level of accident vulnerability. Based on data from the Integrated Road Safety Management System (IRSMS) from 2013 to 2019, the total accidents at DKI Jakarta railroad crossings reached 101 cases, of which 80% were fatal accidents that caused death. This research aims to analyze the behavior of motorcyclists violating RLCs based on the theory of Traffic Locus of Control. The research instrument is a video recorder and questionnaire. The video recorder is used to recognize the behavior of motorcyclists on RLCs, and to find out the weaknesses of the engineering system. Questionnaires were distributed to 384 motorcyclists (Mage = 31.09; SD = 5.74) who committed violations at RLCs in three locations, namely Kalibata area South Jakarta, Central Jakarta Industrial road intersection, and an RLC in Sentiong area Central Jakarta. The questionnaire used is a Multidimensional Traffic Locus of Control scale (T-LOC) which is consisting of four domains, i.e. self, other drivers, road and environment, and fate. From the results of data processing, the psychological factors of T-LOC that most roles as predictors of violations are age, self, other drivers, and road and environment. Therefore, efforts are needed to control the warning and safety facilities at railway crossings as well as legal affirmations to reduce the level of violations committed by motorcyclists. Keywords: Accident; motorcyclist; traffic locus of control; the railway-road crossing; violent behavior 1. INTRODUCTION The Railway-Road crossing (RLC) is an important location for transportation systems. The RLC provides a connection between the two sides of the railway and on the other, strengthening the road and highway network system [1]. However, with the increasing number of motor vehicles, especially on major roads, the chances of an accident at the crossing of a piece of vehicle-train [1]. Based on data from the Integrated Road Safety Management System (IRSMS) from 2013 to 2019, the total accidents at the DKI Jakarta railway crossing reached 101 cases, of which 80% were fatal accidents that caused deaths.
Traffic accidents at an RLC certainly cause a lot of losses, not only for victims but also for other motorists. Accidents that occur during increased traffic volumes during peak hours at railway crossings can result in the closure of a plot crossing tends to be intense and longer [2]. In this case, the minimum warning time (the time between the activation of the RLC bar and
113
the presence of the railway at the intersection) provided to road users often exceeds up to a few minutes [3]. Coupled with the additional time to close the crossing can result in congestion and long waiting times for road users [4].
The closure of an RLC is a crucial thing to do because it requires a huge cost. DKI Jakarta
has 68% of illegal crossings and 32% of legal crossings. Most of those crossings also have no active warnings. Therefore, for now, the closure of a plot crossing is still focused on locations with severe traffic congestion [5].
The crossing of a plot considered problematic can be seen from the large volume of
vehicles that cause delays as well as long queues of vehicles [6]. Based on data from the Polda Metro Jaya, there are 46 accident and traffic violation-prone locations at the Jakarta railway crossing. In this study, researchers took data in three locations, namely in the Rajawali Area of Central Jakarta, Kramat Sentiong Street, Central Jakarta, and the Kalibata area of South Jakarta. Data retrieval in the three locations is done because each location has interesting characteristics. The crossing of a plot of the Rajawali area in Central Jakarta has complicated road geometrics, long queues, frequent traffic accidents, and poor safety facilities. At the crossing of a section of road Kramat Sentiong central Jakarta is located on a narrow road, many motorists who commit violations, as well as safety facilities, are still low. While at the crossing Kalibata Area of South Jakarta, in terms of safety facilities have been good, but there are often long queues during peak hours because many trains pass by.
Accidents occur due to poor interaction between drivers, vehicles, and environmental
factors [7]. Analysis of traffic accidents in various developing countries shows that human factors are the causative factors of approximately 90% of road traffic accidents [8], [9]. Putranto et al explained that the determining aspects of driving behavior are traffic errors which are the ability to perceive traffic conditions around, control errors that are the ability to control the speed of vehicles under certain conditions, speed violations, or the ability to maintain the maximum speed limit vehicle, traffic violations or the ability to obey traffic signs and regulations, safety violations or the ability to maintain the condition of self and passengers to be safe during driving, as well as stunts or aggressive behaviors that are destructive and harmful [10].
Rider behavior is an important aspect in the study of traffic psychology, one of the studies
that can be used is Traffic-locus of control. Traffic-locus of control is defined as being responsible for an individual's driving behavior and the outcome of that individual's behavior. The person or thing that is used as the person in charge, in this case, is the individual itself (self), other drivers, the condition of the personal vehicle and the surrounding environment (vehicle and environment), and destiny (fate) [7]. Previous studies have shown that Traffic-locus of control (T-LOC) can represent human factors that influence driving behavior [11], [12], [13], [14]. Analysis of the types of violations and psychological factors of T-LOC was conducted because the high level of violations and also the safety facilities of the relevant parties are still minimal. In the context of traffic, the internal Traffic-locus of control is represented by self, and the Traffic-locus of external control is represented by other drivers, vehicles, road and environment, and fate. Based on the above exposure, this study will be conducted by analyzing the behavior of offenders at the crossing of a plot by motorcyclists using the Traffic-locus of control approach.
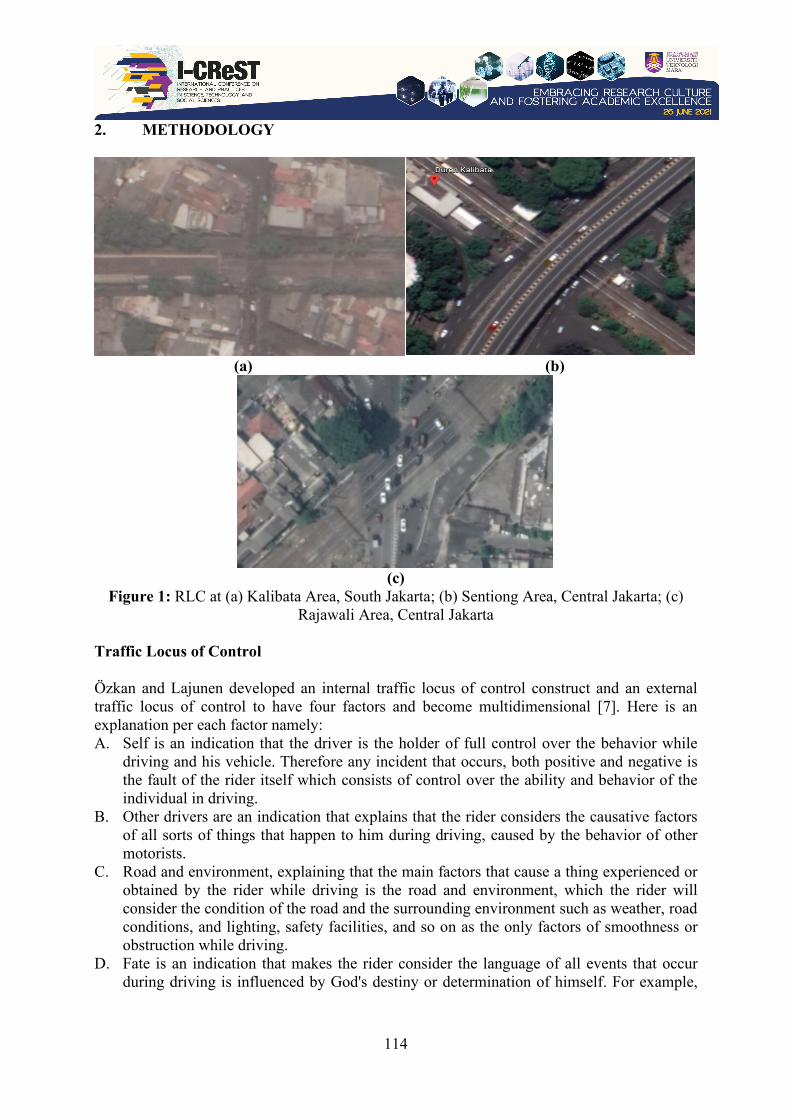
114
2. METHODOLOGY
(a) (b)
(c)
Figure 1: RLC at (a) Kalibata Area, South Jakarta; (b) Sentiong Area, Central Jakarta; (c) Rajawali Area, Central Jakarta
Traffic Locus of Control Özkan and Lajunen developed an internal traffic locus of control construct and an external traffic locus of control to have four factors and become multidimensional [7]. Here is an explanation per each factor namely: A. Self is an indication that the driver is the holder of full control over the behavior while
driving and his vehicle. Therefore any incident that occurs, both positive and negative is the fault of the rider itself which consists of control over the ability and behavior of the individual in driving.
B. Other drivers are an indication that explains that the rider considers the causative factors of all sorts of things that happen to him during driving, caused by the behavior of other motorists.
C. Road and environment, explaining that the main factors that cause a thing experienced or obtained by the rider while driving is the road and environment, which the rider will consider the condition of the road and the surrounding environment such as weather, road conditions, and lighting, safety facilities, and so on as the only factors of smoothness or obstruction while driving.
D. Fate is an indication that makes the rider consider the language of all events that occur during driving is influenced by God's destiny or determination of himself. For example,
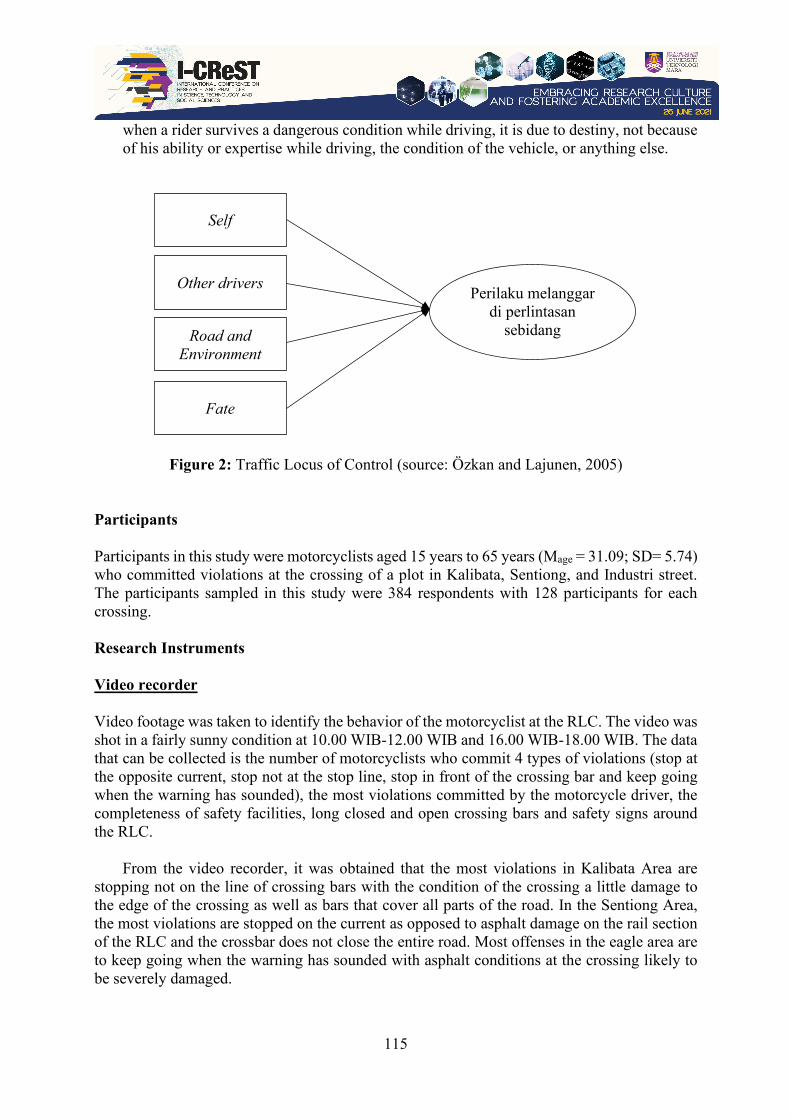
115
when a rider survives a dangerous condition while driving, it is due to destiny, not because of his ability or expertise while driving, the condition of the vehicle, or anything else.
Figure 2: Traffic Locus of Control (source: Özkan and Lajunen, 2005)
Participants
Participants in this study were motorcyclists aged 15 years to 65 years (Mage = 31.09; SD= 5.74) who committed violations at the crossing of a plot in Kalibata, Sentiong, and Industri street. The participants sampled in this study were 384 respondents with 128 participants for each crossing. Research Instruments
Video recorder Video footage was taken to identify the behavior of the motorcyclist at the RLC. The video was shot in a fairly sunny condition at 10.00 WIB-12.00 WIB and 16.00 WIB-18.00 WIB. The data that can be collected is the number of motorcyclists who commit 4 types of violations (stop at the opposite current, stop not at the stop line, stop in front of the crossing bar and keep going when the warning has sounded), the most violations committed by the motorcycle driver, the completeness of safety facilities, long closed and open crossing bars and safety signs around the RLC.
From the video recorder, it was obtained that the most violations in Kalibata Area are stopping not on the line of crossing bars with the condition of the crossing a little damage to the edge of the crossing as well as bars that cover all parts of the road. In the Sentiong Area, the most violations are stopped on the current as opposed to asphalt damage on the rail section of the RLC and the crossbar does not close the entire road. Most offenses in the eagle area are to keep going when the warning has sounded with asphalt conditions at the crossing likely to be severely damaged.
Perilaku melanggar di perlintasan
sebidang
Self
Other drivers
Road and Environment
Fate
116
Questionnaires The questionnaire consists of 2 parts. The first part contains the characteristic of the respondent. The second section contains questions that come from the multidimensional traffic locus of control (T-LOC) scale. Multidimensional traffic locus of control (T-LOC) scale based on the English version translated into Indonesian. A. Demographic variables Participants were asked to fill in personal data, such as age, gender, last education, occupation, driver's license ownership, how to obtain a driver's license, carrying cargo or not, the type of travel made, and the daily path taken. B. Multidimensional Traffic Locus of Control (T-LOC) Participants were given a list of possible causes of accidents based on T-LOC psychological factors (n= 17). The participant was asked to choose from a 6-point Likert scale (1= strongly disagreed to 6= strongly agreed). Procedure Video shooting using a video recorder (Handycam) and questionnaire dissemination is done on weekdays during peak hours (16.00 WIB - 18.00 WIB) and normal hours (10.00 WIB -12.00 WIB). The video was first taken to identify the behavior of the motorcyclist at the RLC. The video was taken using a Handycam about 1 meter from the RLC.
The dissemination of questionnaires was conducted on motorcyclists who were found to have committed violations. They were stopped by the Indonesian Traffic Police who were on standby about 2 km from the RLC. Participants were only given a reprimand by the police and asked to fill out a questionnaire. Participants did not receive any intensive when filling out questionnaires. Data Analysis Quantitative data collected is processed using Statistical Package for Social Science (SPSS) 26 software with Multinomial Logit Regression. 3. RESULT AND DISCUSSION
Demographic Data Demographic data shows the percentage of male motorcyclists (84%) greater than female motorcyclists (16%), with ages ranging from 15 to 65 years (Mage = 31.09, SD = 5.74). In terms of education, about half of the total participants were high school/vocational school graduates (50%), followed by undergraduate education (23%). In terms of driver's license ownership, almost all participants had a driver's license (91%) and the average driver's license test (94%). When viewed in terms of travel, almost all participants carried a load (92%) and personal travel (72%), and the path passed is the daily path (77%).
117
Psychological Factors
Here is a summary of the results of the T-LOC psychological factors.
Table 1: T-LOC Results No. T-LOC Item Mean (M) Standard Deviation (SD) 1 Self 6 4.07 1.80 2 Other Drivers 5 4.07 1.27 3 Road and Environment 4 4.15 1.25 4 Fate 2 4.02 1.28
Among the four items above that play, the most role in breaking behavior at an RLC is the
road and environment followed by self and other drivers and fate (M>Md = 3).
Data Analysis
T-LOC Factor Accuracy Test Results Based on the results of the accuracy test of factors, when measuring the T-LOC factor related to traffic violations at an RLC, it was obtained that the Kaiser-Maye-Olkin Measure of Sampling Adequacy (KMO MSA) value of .813 where this value can be concluded if all instruments are valid and meet the criteria for measuring the influence of traffic violations at an RLC. Reliability Test Results From the reliability test results, the Cronbach Alpha value in SPSS for all T-LOC items was .773 out of a total of 17 questions related to T-LOC factors. If Cronbach Alpha is greater than or equal to 0.7 then the instrument is reliable [15]. From these results, it can be concluded that the reliability in this study is consistent (reliable). Violations of a Plot Crossing
Table 2: Mean and standard deviation for per each violation Variable N Mean (M) Standard Deviation (SD)
1 75 68.92 10.43 2 123 68.60 10.34 3 48 70.46 10.76 4 138 69.88 8.62
Total 384 69.35 9.81 Variable 1: stop at the opposite current; Variable 2: stop not on the stop line, Variable 3: stop
in front of the crossing bar, Variable 4: keep going when the warning has sounded Based on Table 2, it was found that the most common violation by motorists at railway crossings is stopping in front of the crossing bars (M= 70.46, SD= 10.76). The second highest violation is to stop at the opposite current (M= 68.92, SD= 10.43). Multinomial Logit Models
After the test of reliability and validity, followed by analyzing the use of multinomial logit. The variables used include age, last education, gender, driver's license ownership, self, other drivers,
118
road and environment, and fate. Logit multinomial analysis has several stages of workmanship, namely parameter estimation, simultaneous testing, the formation of logistic regression models, model goodness tests, coefficients of determination, partial tests, and classification accuracy tests. However, in this study only up to the stage of determining factors that can affect dependent variables or so-called simultaneous tests.
Simultaneous tests are the result of a value of significance formed, which is .000 or below .05 which means there is at least one independent variable that can control dependent variables. Furthermore, partial significance tests with independent variables, which for variables with significance values greater than .05 will be eliminated and retested with dependent variables that have significant values less than .05. The following are the results of a partial significance test.
Table 3: Independent Variable Partial Test Results Variable Chi-Square Significance
Age 57.816 .000 Last Education 1.146 .766 Gender 1.062 .786 Driver’s License Ownership 2.268 .519 Self 121.709 .000 Other Driver 81.295 .019 Road and Environment 74.266 .009 Fate 40.735 .091
According to Table 3, variables that have a value of significance above .05 are last
education, gender, driver's license ownership, and fate. Therefore, these four variables will be eliminated and re-tested for partial significance.
Table 4: Influential Independent Variable Partial Test Results
Variable Chi-Square Significance Age 59.321 .000 Self 120.117 .000 Other Driver 82.021 .017 Road and Environment 77.354 .005
Furthermore, a goodness-of-fit test was conducted which resulted from a significance value
above .05, so the model is worth using. From Table 4 above, it can be concluded that the variables that can affect motorcycle drivers committing violations at railway crossings are based on age, self factor, other driver factors, and road and environment factor. 4. CONCLUSION
From the results of data processing, the psychological factors of T-LOC that play the most role as predictors of violations are age, self, other drivers, and road and environment. The condition of the RLC is also one of the supporting violations, such as poor safety facilities, poor road conditions, and so on. Therefore, efforts are needed to control the warning and safety facilities at railway crossings as well as legal affirmations and traffic engineering such as the closure of a dean's RLC replacing with flyovers and to reduce the level of violations committed by motorcyclists.
Advice for related parties, such as the Government, Traffic Police, Dki Jakarta Transportation Office, and PT. KAI, it is recommended to conduct a review on the improvement

119
and addition of safety facilities at the RLC. Safety facilities for motorists can be such as, the addition of crossing bars to cover all parts of the road, the installation of CCTV to monitor the activities of motorists, especially those who violate the rules to be sanctioned, improving the quality of the crossing of a piece of the railway such as adding pads along the crossing of a plot so that the rail can be parallel to the road.
For further research can analyze additional safety issues related to crossing a piece of
railway, such as signs, length of crossing bars, warning times, and so on. ACKNOWLEDGEMENT This research is funded by PUTTI funds from Universitas Indonesia and the author thanked for the cooperation and assistance provided by the Jakarta Traffic Police Indonesia.
REFERENCES [1] Lu, P., Tolliver, D., 2016. Accident prediction model for public highway-rail grade
crossings. Accident Analysis and Prevention 90, 73-81 [2] Larue, G. S., Naweed, A. and Rodwell, D. (2018) ‘The road user, the pedestrian, and me:
Investigating the interactions, errors and escalating risks of users of fully protected RLCs’, Safety Science. Elsevier, 110(January), pp. 80–88. DOI: 10.1016/j.ssci.2018.02.007.
[3] Raslear, T.G., (2015) ‘Using Signal Detection Theory to Understand Grade Crossing Warning Time and Motorist Stopping Behavior’. DOT/FRA/ORD-15/02.
[4] Larue, G. S., Blackman, R. A. and Freeman, J. (2020) ‘Frustration at congested railway RLCs: How long before extended closures result in risky behaviors?’, Applied Ergonomics. Elsevier, 82(August 2019), p. 102943. DOI: 10.1016/j.apergo.2019.102943.
[5] Tjahjono, T. et al. (2019) ‘Identification Determinant Variables of the Injury Severity Crashes at Road-Railway RLC in Indonesia’, Transportation Research Procedia. Elsevier B.V., 37(September 2018), pp. 211–218. DOI: 10.1016/j.trpro.2018.12.185.
[6] Yanti, W. F. (2018) Studi Pengaruh Perlintasan Sebidang Jalan dengan Rel Kereta Api Terhadap Karakteristik Lalu LIntas (Studi Kasus: Perlintasan Kereta Api Jalan Hj. Ani Idrus). Universitas Medan Area. Available at: http://repository.uma.ac.id/handle/123456789/9862
[7] Özkan, T., & Lajunen, T. (2005). Multidimensional Traffic Locus of Control Scale (T-LOC): factor structure and relationship to risky driving. Personality and individual differences, 38(3), 533-545.
[8] Otte, D., Pund, B., Ja¨nsch, M., 2009. A new approach of accident causation analysis by seven steps ACASS. 21st ESV Conference.
[9] Dingus, T.A., Guo, F., Lee, S.E., Antin, J., Perez, M., Buchanan-King, M., Hankey, J., 2016. Driver crash risk factors and prevalence evaluation using naturalistic driving data. Proc. National Acad. Sci. https://doi.org/10.1073/pnas.1513271113.
[10] Putranto, L. SS., Setyarini , N.L.P.S.E., Rostiana, & Bunawan, R. (2014). Motorcycle rider behavior of Tarumanegara University lecturer and employee. The 17th FSTPT International Symposium, Jember University. http://repository.untar.ac.id/1883/.
[11] Holland, C., Geraghty, J., & Shah, K. (2010). The differential moderating effect of locus of control on the effect of driving experience in young male and female drivers. Personality and individual differences, 48(7), 821-826.

120
[12] Lheureux, F., Charlois, C., Auzoult, L., & Minary, J. P. (2015). Me have a traffic accident? The effects of core self-evaluations on the perceived likelihood and perceived undesirability of traffic accidents. Transportation research part F: traffic psychology and behavior, 34, 65-75.
[13] Sarma, K. M., Carey, R. N., Kervick, A. A., & Bimpeh, Y. (2013). Psychological factors associated with indices of risky, reckless, and cautious driving in a national sample of drivers in the Republic of Ireland. Accident Analysis & Prevention, 50, 1226-1235.
[14] Özmen, O., & Sümer, Z. H. (2011). Predictors of risk-taking behaviors among Turkish adolescents. Prutterersonality and Individual Differences, 50(1), 4-9.
[15] Hair. Jr., J. F., Black., W. C., Babin., B. J., Anderson., R. E., & L. Tatham., R. (2006). Multivariant Data Analysis. New Jersey: Pearson International Edition.

121
I-CReST 2021:113-129 – Airport Selection Preference in Central Java Multi Airport Region
*1Zahra Zakiyya Mustaqima, 1Tri Tjahjono, 2Alloysius Joko Purwanto
1Civil Engineering Department, University of Indonesia, Depok, Indonesia
2Economics Research Institute for ASEAN and East Asia, Jakarta, Indonesia
*E-mail: [email protected]
ABSTRACT The development of Yogyakarta–Solo–Semarang Region (Joglosemar) has the aim of boosting the economy of the central part of Java Island since the three cities form the economic axis of the area. The role of the region is affected by the availability of good transportation infrastructure. The Yogyakarta–Solo–Semarang (Joglosemar) region meets the characteristics of multiple airport regions as the three cities’ airports are located close to each other (Multi Airport Region). Adisutjipto International Airport (JOG) in Yogyakarta City had been running on its capacity so that the government has opened a new and bigger airport, i.e., Yogyakarta International Airport (YIA) in Kulon Progo Regency to replace Adisutjipto International Airport (JOG). The opening of the new airport means more options for passengers in Yogyakarta–Solo–Semarang (Joglosemar) region who can now choose between the three airports based on variables such as the available schedules, airlines, distance to the airports, and the available airports’ services or facilities. This study uses revealed and stated preference methods to identify airport selection preferences in the Yogyakarta–Solo–Semarang (Joglosemar) area with a multinomial logit model. The results of this study indicate that the distance between the domicile regency or city and the airport, flight frequency, flight schedule, accessibility, and travel time to the destination airports are variables that affect the preference for airport selection in the Yogyakarta–Solo–Semarang (Joglosemar) area. Keywords: Airport; multi-airport region; multinomial logit model; revealed preference; stated preference 1. INTRODUCTION The Multi Airport Region system divides the market demand from a large airport to other airports of a smaller scale or class that are in the same geographic area as the main airport [1,2,3]. Studies on the Multi Airport Region system have been carried out in several countries, such as the Pearl River Delta Region, Hong Kong [2,4]; Northeast Italy [3]; Upper Adriatic Region [5]; and the Metropolitan Area of São Paulo, Brazil [1]. Based on previous research, several factors influence airport selection by passengers, namely airplane ticket prices, travel time to the airport, flight frequency, number of airlines, and number of accesses to airports [1,4,5]. Activities that occur within the airport, such as shopping areas and waiting time in the check-in area do not affect passengers in choosing the airport they will use [4].
The Joglosemar region consists of three cities, namely Yogyakarta, Surakarta and Semarang. The Yogyakarta-Solo-Semarang axis is described as a golden triangle of economic
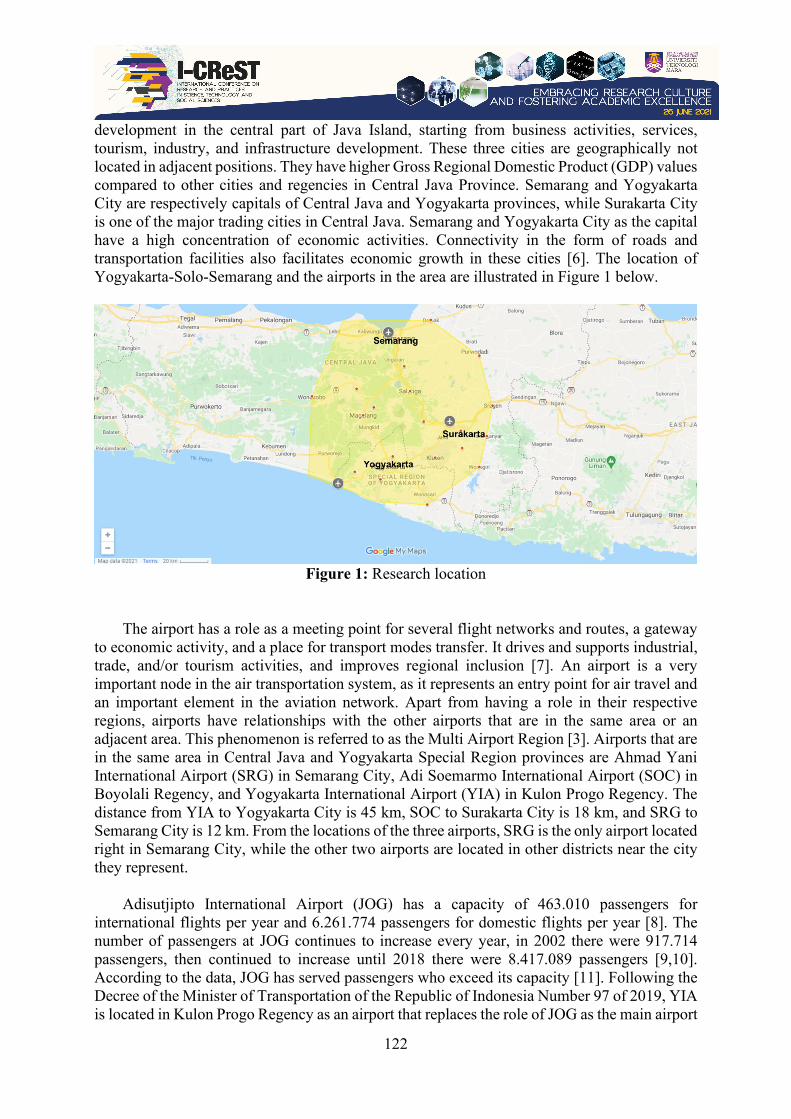
122
development in the central part of Java Island, starting from business activities, services, tourism, industry, and infrastructure development. These three cities are geographically not located in adjacent positions. They have higher Gross Regional Domestic Product (GDP) values compared to other cities and regencies in Central Java Province. Semarang and Yogyakarta City are respectively capitals of Central Java and Yogyakarta provinces, while Surakarta City is one of the major trading cities in Central Java. Semarang and Yogyakarta City as the capital have a high concentration of economic activities. Connectivity in the form of roads and transportation facilities also facilitates economic growth in these cities [6]. The location of Yogyakarta-Solo-Semarang and the airports in the area are illustrated in Figure 1 below.
Figure 1: Research location
The airport has a role as a meeting point for several flight networks and routes, a gateway
to economic activity, and a place for transport modes transfer. It drives and supports industrial, trade, and/or tourism activities, and improves regional inclusion [7]. An airport is a very important node in the air transportation system, as it represents an entry point for air travel and an important element in the aviation network. Apart from having a role in their respective regions, airports have relationships with the other airports that are in the same area or an adjacent area. This phenomenon is referred to as the Multi Airport Region [3]. Airports that are in the same area in Central Java and Yogyakarta Special Region provinces are Ahmad Yani International Airport (SRG) in Semarang City, Adi Soemarmo International Airport (SOC) in Boyolali Regency, and Yogyakarta International Airport (YIA) in Kulon Progo Regency. The distance from YIA to Yogyakarta City is 45 km, SOC to Surakarta City is 18 km, and SRG to Semarang City is 12 km. From the locations of the three airports, SRG is the only airport located right in Semarang City, while the other two airports are located in other districts near the city they represent.
Adisutjipto International Airport (JOG) has a capacity of 463.010 passengers for
international flights per year and 6.261.774 passengers for domestic flights per year [8]. The number of passengers at JOG continues to increase every year, in 2002 there were 917.714 passengers, then continued to increase until 2018 there were 8.417.089 passengers [9,10]. According to the data, JOG has served passengers who exceed its capacity [11]. Following the Decree of the Minister of Transportation of the Republic of Indonesia Number 97 of 2019, YIA is located in Kulon Progo Regency as an airport that replaces the role of JOG as the main airport
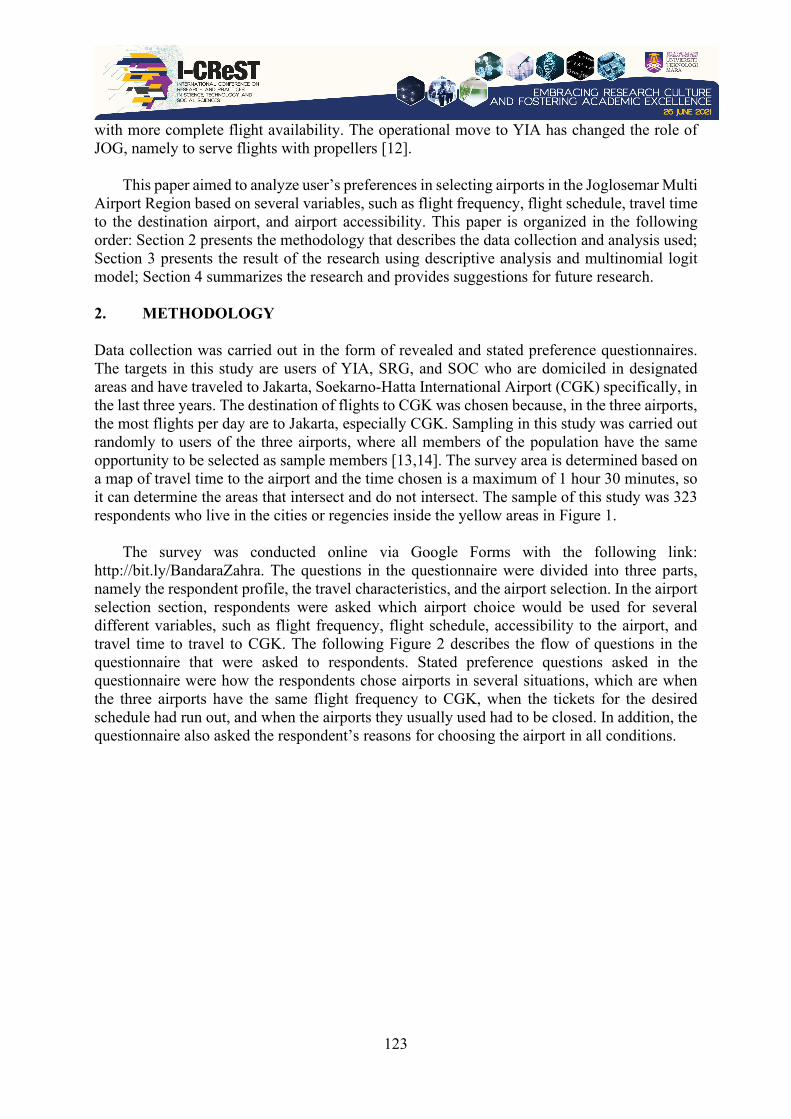
123
with more complete flight availability. The operational move to YIA has changed the role of JOG, namely to serve flights with propellers [12].
This paper aimed to analyze user’s preferences in selecting airports in the Joglosemar Multi
Airport Region based on several variables, such as flight frequency, flight schedule, travel time to the destination airport, and airport accessibility. This paper is organized in the following order: Section 2 presents the methodology that describes the data collection and analysis used; Section 3 presents the result of the research using descriptive analysis and multinomial logit model; Section 4 summarizes the research and provides suggestions for future research.
2. METHODOLOGY Data collection was carried out in the form of revealed and stated preference questionnaires. The targets in this study are users of YIA, SRG, and SOC who are domiciled in designated areas and have traveled to Jakarta, Soekarno-Hatta International Airport (CGK) specifically, in the last three years. The destination of flights to CGK was chosen because, in the three airports, the most flights per day are to Jakarta, especially CGK. Sampling in this study was carried out randomly to users of the three airports, where all members of the population have the same opportunity to be selected as sample members [13,14]. The survey area is determined based on a map of travel time to the airport and the time chosen is a maximum of 1 hour 30 minutes, so it can determine the areas that intersect and do not intersect. The sample of this study was 323 respondents who live in the cities or regencies inside the yellow areas in Figure 1.
The survey was conducted online via Google Forms with the following link: http://bit.ly/BandaraZahra. The questions in the questionnaire were divided into three parts, namely the respondent profile, the travel characteristics, and the airport selection. In the airport selection section, respondents were asked which airport choice would be used for several different variables, such as flight frequency, flight schedule, accessibility to the airport, and travel time to travel to CGK. The following Figure 2 describes the flow of questions in the questionnaire that were asked to respondents. Stated preference questions asked in the questionnaire were how the respondents chose airports in several situations, which are when the three airports have the same flight frequency to CGK, when the tickets for the desired schedule had run out, and when the airports they usually used had to be closed. In addition, the questionnaire also asked the respondent’s reasons for choosing the airport in all conditions.
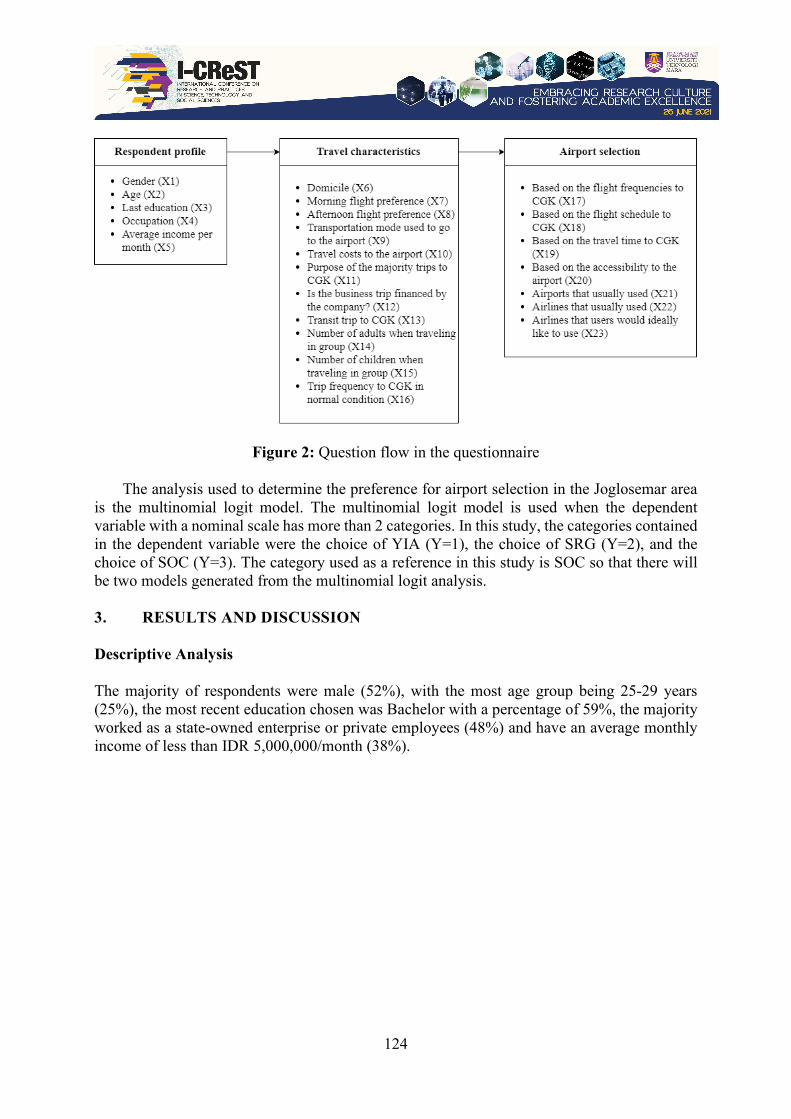
124
Figure 2: Question flow in the questionnaire
The analysis used to determine the preference for airport selection in the Joglosemar area is the multinomial logit model. The multinomial logit model is used when the dependent variable with a nominal scale has more than 2 categories. In this study, the categories contained in the dependent variable were the choice of YIA (Y=1), the choice of SRG (Y=2), and the choice of SOC (Y=3). The category used as a reference in this study is SOC so that there will be two models generated from the multinomial logit analysis. 3. RESULTS AND DISCUSSION Descriptive Analysis The majority of respondents were male (52%), with the most age group being 25-29 years (25%), the most recent education chosen was Bachelor with a percentage of 59%, the majority worked as a state-owned enterprise or private employees (48%) and have an average monthly income of less than IDR 5,000,000/month (38%).
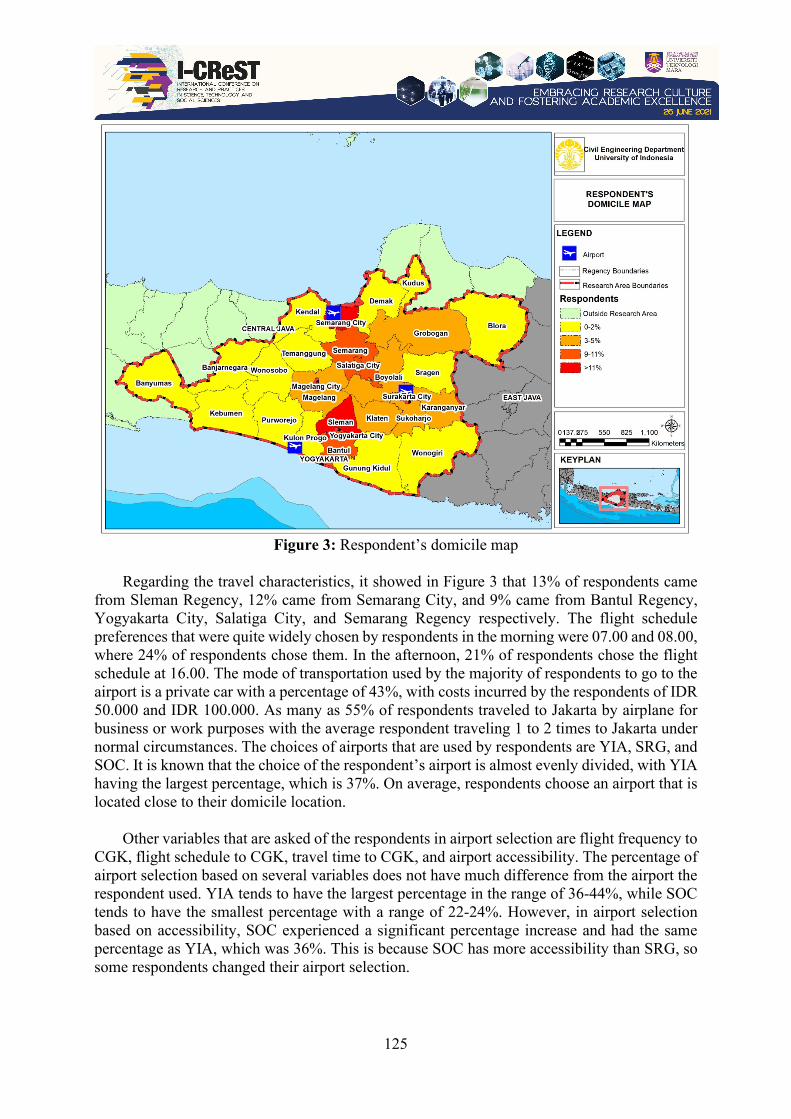
125
Figure 3: Respondent’s domicile map
Regarding the travel characteristics, it showed in Figure 3 that 13% of respondents came
from Sleman Regency, 12% came from Semarang City, and 9% came from Bantul Regency, Yogyakarta City, Salatiga City, and Semarang Regency respectively. The flight schedule preferences that were quite widely chosen by respondents in the morning were 07.00 and 08.00, where 24% of respondents chose them. In the afternoon, 21% of respondents chose the flight schedule at 16.00. The mode of transportation used by the majority of respondents to go to the airport is a private car with a percentage of 43%, with costs incurred by the respondents of IDR 50.000 and IDR 100.000. As many as 55% of respondents traveled to Jakarta by airplane for business or work purposes with the average respondent traveling 1 to 2 times to Jakarta under normal circumstances. The choices of airports that are used by respondents are YIA, SRG, and SOC. It is known that the choice of the respondent’s airport is almost evenly divided, with YIA having the largest percentage, which is 37%. On average, respondents choose an airport that is located close to their domicile location.
Other variables that are asked of the respondents in airport selection are flight frequency to
CGK, flight schedule to CGK, travel time to CGK, and airport accessibility. The percentage of airport selection based on several variables does not have much difference from the airport the respondent used. YIA tends to have the largest percentage in the range of 36-44%, while SOC tends to have the smallest percentage with a range of 22-24%. However, in airport selection based on accessibility, SOC experienced a significant percentage increase and had the same percentage as YIA, which was 36%. This is because SOC has more accessibility than SRG, so some respondents changed their airport selection.
126
The airlines frequently used by respondents for trips to CGK are very diverse. Most of the respondents chose to use low-cost carriers, such as Lion Air, Citilink, and Air Asia. Some of the factors that cause respondents to frequently use low-cost carrier airlines are the relatively cheap ticket prices and limited costs by the respondent’s companies. If there are no financial or cost restrictions, the airline that the respondents would ideally like to use for the trip to CGK tends to be a full-service airline, which is Garuda Indonesia. Apart from not seeing the cost factor, the Garuda Indonesia airline is also known for providing comfortable services for its passengers, so that the respondents’ desire to use the airline is quite high. Multinomial Logit Model Before the multinomial logit analysis, first, the validity and reliability tests are conducted for each question asked in the questionnaire. Variables that have a significance value below 0,05 can be used to perform the next analysis. Based on the results of the validation test, the invalid variables are gender, occupation, flight preferences in the morning and afternoon, the purpose of the majority of trips to CGK, the number of adults and children when traveling in a group, and the trip frequency to CGK in normal condition. The reliability value of Cronbach’s Alpha from all questions in the questionnaire is 0,616, which indicates that the reliability value exceeds the standard of 0,60, so it can be said that the data obtained is reliable.
The variables used in the multinomial logit analysis include age, latest education, average income per month, distance from the domicile city or regency to the airport, the mode used to the airport, travel costs, airport selection based on flight frequency, flight schedules, travel time to CGK, and airport accessibility. The stages of multinomial logit analysis are parameter estimation, simultaneous test, logistic regression model formation, model goodness test, determination coefficient, partial test, and classification accuracy test. Based on the estimated parameter values, a logit function 1 and logit function 2 models can be compiled with SOC as a comparison category. Logit 3 which is the category where YIA as a base airport compared to SRG as an alternative is not included in the model. This is because currently, access from YIA and SRG are too far and it is easier to reach other airports, which is SOC that is located between the two. Based on the survey results, there were no respondents who switched choices from YIA to SRG or vice versa in all conditions. Thus, there is no linkage between the two airports and a logit 3 model is not formed. The logit functions are:
g1(x) = –12,149 + 0,314X2 + 1,950X3.1 + 0,343X3.2 + 2,027X3.3 + 0,839X3.4 – 0,311X5
+ 1,005X6 + 1,169X9.1 + 0,048X10 + 1,439X17.1 + 4,023X17.2 + 2,203X18.1 + 1,983X18.2 + 2,314X19.1 – 0,305X19.2 + 5,223X20.1 + 3,066X20.2 (1)
g2(x) = –6,068 + 0,431X2 – 0,736X3.1 + 1,818X3.2 + 1,293X3.3 + 1,315X3.4 + 0,376X5 + 0,421X6 + 0,758X9.1 – 1,286X10 – 0,905X17.1 + 2,303X17.2 + 3,417X18.1 + 3,495X18.2 + 0,101X19.1 – 3,844X19.2 + 1,033X20.1 + 3,403X20.2 (2)
The next stage is the simultaneous test, where the significance value of the model formed
is 0,000 or below 0,005, which means that there is at least one independent variable that affects the dependent variable. After that, a partial significance test was performed with all variables, in which variables having a significance value greater than 0,05 were eliminated. The variables that have a significance above 0,05 are age, latest education, average income per month, the mode of transportation used to the airport, and travel costs. After that, the goodness-of-fit test is carried out where if the significance value of the model is above 0,05, the model is feasible to use. The result of the model goodness test is 0,859, where it exceeds 0,05, which means the
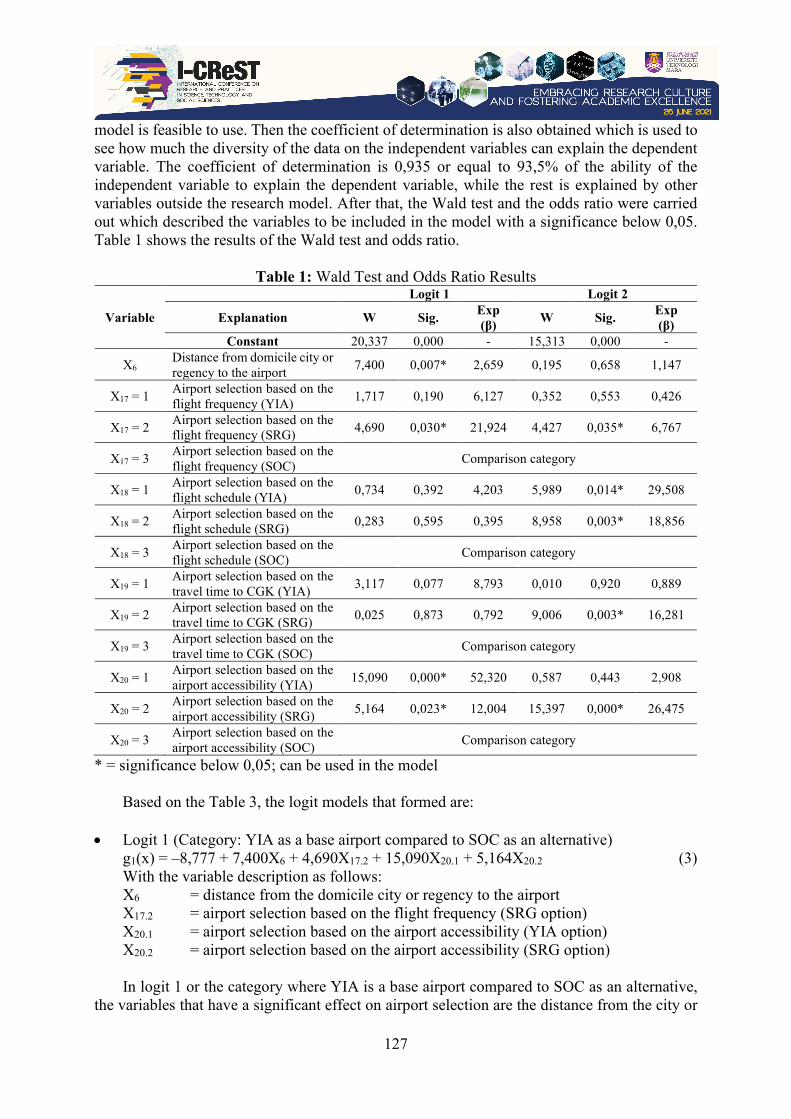
127
model is feasible to use. Then the coefficient of determination is also obtained which is used to see how much the diversity of the data on the independent variables can explain the dependent variable. The coefficient of determination is 0,935 or equal to 93,5% of the ability of the independent variable to explain the dependent variable, while the rest is explained by other variables outside the research model. After that, the Wald test and the odds ratio were carried out which described the variables to be included in the model with a significance below 0,05. Table 1 shows the results of the Wald test and odds ratio.
Table 1: Wald Test and Odds Ratio Results
Variable
Logit 1 Logit 2
Explanation W Sig. Exp (β) W Sig. Exp
(β) Constant 20,337 0,000 - 15,313 0,000 -
X6 Distance from domicile city or regency to the airport 7,400 0,007* 2,659 0,195 0,658 1,147
X17 = 1 Airport selection based on the flight frequency (YIA) 1,717 0,190 6,127 0,352 0,553 0,426
X17 = 2 Airport selection based on the flight frequency (SRG) 4,690 0,030* 21,924 4,427 0,035* 6,767
X17 = 3 Airport selection based on the flight frequency (SOC) Comparison category
X18 = 1 Airport selection based on the flight schedule (YIA) 0,734 0,392 4,203 5,989 0,014* 29,508
X18 = 2 Airport selection based on the flight schedule (SRG) 0,283 0,595 0,395 8,958 0,003* 18,856
X18 = 3 Airport selection based on the flight schedule (SOC) Comparison category
X19 = 1 Airport selection based on the travel time to CGK (YIA) 3,117 0,077 8,793 0,010 0,920 0,889
X19 = 2 Airport selection based on the travel time to CGK (SRG) 0,025 0,873 0,792 9,006 0,003* 16,281
X19 = 3 Airport selection based on the travel time to CGK (SOC) Comparison category
X20 = 1 Airport selection based on the airport accessibility (YIA) 15,090 0,000* 52,320 0,587 0,443 2,908
X20 = 2 Airport selection based on the airport accessibility (SRG) 5,164 0,023* 12,004 15,397 0,000* 26,475
X20 = 3 Airport selection based on the airport accessibility (SOC) Comparison category
* = significance below 0,05; can be used in the model
Based on the Table 3, the logit models that formed are:
• Logit 1 (Category: YIA as a base airport compared to SOC as an alternative) g1(x) = –8,777 + 7,400X6 + 4,690X17.2 + 15,090X20.1 + 5,164X20.2 (3) With the variable description as follows: X6 = distance from the domicile city or regency to the airport X17.2 = airport selection based on the flight frequency (SRG option) X20.1 = airport selection based on the airport accessibility (YIA option) X20.2 = airport selection based on the airport accessibility (SRG option) In logit 1 or the category where YIA is a base airport compared to SOC as an alternative,
the variables that have a significant effect on airport selection are the distance from the city or
128
regency to the airport, airport selection based on the flight frequency, and airport accessibility. The distance from the domicile city or regency to the airport is a significant variable because people tend to use the airport closest to their home, making it easier to get to the airport. Flight frequency is a significant variable in airport selection because the high frequency of flights at an airport results in people being able to choose the flight time they want. In logit 1, the airport selection variable based on flight frequency with the SRG choice has a significant effect because the frequency of flights at YIA and SRG to CGK per day is the same and makes the two airports more likely to be selected. The last variable that has a significant effect is airport accessibility with the choice of YIA and SRG. Accessibility has a significant effect because people tend to choose airports that provide more and easier access, and are familiar or frequently used. These two airports have the same flight frequency, but different amounts of accessibility, where YIA tends to have more public transportation options to get to the airport.
• Logit 2 (Category: SRG as a base airport compared to SOC as an alternative)
g2(x) = –6,338 + 1,912X17.2 + 3,385X18.1 + 2,937X18.2 + 2,790X19.2 + 3,276X20.2 (4) With the variable description as follows: X17.2 = airport selection based on the flight frequency (SRG option) X18.1 = airport selection based on the flight schedule (YIA option) X18.2 = airport selection based on the flight schedule (SRG option) X19.2 = airport selection based on the travel time to CGK (SRG option) X20.2 = airport selection based on the airport accessibility (SRG option) In logit 2 or the category where SRG is a base airport compared to SOC as an alternative,
the influencing variables are the airport selection based on the flight frequency, flight schedule, travel time to CGK, and airport accessibility. All of these variables affect the airport selection of SRG, which means that the choice of another airport does not affect the choice of the airport by the users. Users who previously chose SRG will re-elect SRG in whatever conditions. If there are more frequencies, the airport will provide a variety of flight schedules that can be selected by the community according to the time they want. The travel time to CGK affects because the travel time from SRG is the shortest compared to the other two airports. The accessibility variable also affects because people tend to choose to use airports that have easy accessibility. 4. CONCLUSION The results of this study describe the respondent profile, travel characteristics, and the airport selection by 323 respondents located in Central Java and Yogyakarta Special Region Province. In the Joglosemar Multi Airport Region, factors that influence airport selection are the distance between domicile city or regency to the airport, flight frequency, flight schedule, travel time to CGK, and airport accessibility. The distance from the domicile city or regency to the airport is a significant variable because people tend to use the airport closest to their domicile, making it easier to get to the airport. Flight frequency is a significant variable in airport selection because the high frequency of flights at an airport results in people being able to choose the flight time they want. Airport accessibility has a significant effect because people tend to choose airports that provide more and easier access, and are familiar or frequently used. Further research is expected to be able to develop a more thorough model after the infrastructure and transportation access in the Joglosemar area are more complete and better in the future, such as considering toll plans connecting various cities and airport rail link plans.
129
ACKNOWLEDGEMENT This paper is a part of a Masters’ Dissertation which is used as a requirement for obtaining a master’s degree at the Civil Engineering Department, University of Indonesia. It is also a part of the University of Indonesia’s International Indexed Publication (PUTI) of Proceedings contract number NKB-1054/UN2.RST/HKP05.00/2020 date 29 April 2020. REFERENCES [1] Bezerra, G. C. L., & Gomes, C. F. (2019). Determinants of passenger loyalty in multi-
airport regions: Implications for tourism destination. Tourism Management Perspectives, 31(April), 145–158. https://doi.org/10.1016/j.tmp.2019.04.003
[2] Cheung, T. K. Y., Wong, W. hung, Zhang, A., & Wu, Y. (2020). Spatial panel model for examining airport relationships within multi-airport regions. Transportation Research Part A: Policy and Practice, 133(January), 148–163. https://doi.org/10.1016/j.tra.2019.12.011
[3] Postorino, M. N., & Praticò, F. G. (2012). An application of the Multi-Criteria Decision-Making analysis to a regional multi-airport system. Research in Transportation Business and Management, 4, 44–52. https://doi.org/10.1016/j.rtbm.2012.06.015
[4] Loo, B. P. Y. (2008). Passengers’ airport choice within multi-airport regions (MARs): some insights from a stated preference survey at Hong Kong International Airport. Journal of Transport Geography, 16(2), 117–125. https://doi.org/10.1016/j.jtrangeo.2007.05.003
[5] Paliska, D., Drobne, S., Borruso, G., Gardina, M., & Fabjan, D. (2016). Passengers’ airport choice and airports’ catchment area analysis in cross-border Upper Adriatic multi-airport region. Journal of Air Transport Management, 57, 143–154.
[6] Wibowo, A. A. (2008). Model Pembangunan Ekonomi Daerah Berbasis Kawasan Kerjasama Strategis Joglosemar (Jogjakarta-Solo-Semarang).
[7] Peraturan Menteri Perhubungan PM 69 Tahun 2013 Tentang Tatanan Kebandarudaraan Nasional, 8 (2013).
[8] PT Angkasa Pura I (Persero). (2018). Laporan Tahunan PT Angkasa Pura I (Persero) 2017. https://ap1.co.id/id/about/visi-misi
[9] PT Angkasa Pura I (Persero). (2011). Data Jumlah Penumpang di Bandara PT. AP-I. [10] PT Angkasa Pura I (Persero). (2019). Angkasa Pura I Bandara Adisutjipto Catat
Pertumbuhan Penumpang Hingga 7,65% di Tahun 2018. Adisutjipto-Airport.Co.Id. https://adisutjipto-airport.co.id/en/publication?page=2
[11] Maritsa, D. P., & Ahyudanari, E. (2017). Evaluasi Desain Terminal Penumpang Bandara New Yogyakarta International Airport. Jurnal Teknik ITS, 6(2). https://doi.org/10.12962/j23373539.v6i2.25423
[12] CNN Indonesia. (2020). Pindah Bandara, Adisucipto Layani Pesawat Propeling. https://www.cnnindonesia.com/ekonomi/20200328115501-92-487777/pindah-bandara-adisucipto-layani-pesawat-propeling
[13] Navarrete, J. D., & Cassidy, M. J. (2009). Airport Passenger-Related Processing Rates Guidebook. In Airport Passenger-Related Processing Rates Guidebook. https://doi.org/10.17226/22990
[14] Cripwell, J. P., Gosling, G. D., Biggs, D. C., Bol, M. A., Baker, J., & Franz, J. D. (2010). Guidebook for Conducting Airport User Surveys. In Guidebook for Conducting Airport User Surveys. https://doi.org/10.17226/14333
130
I-CReST 2021:114-140 – Analysis of Driving Speeds of Private Vehicles and Contributing Factors on The Cipali Toll Road (Cikopo-Palimanan)
*1Yanika Desita, 1Tri Tjahjono, 2Guritnaningsih
1Department of Civil Engineering, University of Indonesia, Depok, Indonesia
2Department of Psychology, University of Indonesia, Depok, Indonesia
*E-mail: [email protected]
ABSTRACT The high number of accidents that caused 23,529 people to die in 2020 in Indonesia, triggered concern to encourage concrete efforts to reduce the fatalities of the victims. Speed is still regarded as the largest contributor to traffic accidents and the core of the problem of road safety. The purpose of this research is to analyse the driving speed and psychological factors that play a role based on the Theory Planned Behaviour, which is introduced by Ajzen, namely attitude, subjective norm, and perceived behavioural control and belief. The research conducted on private vehicle drivers who commit driving violations exceeding the maximum speed limit on the Cikopo-Palimanan (Cipali) Toll Road, which are detected by using a speed gun. Furthermore, 219 drivers who committed violations (Mean age = 37.9 years, SD = 6.9) were given a questionnaire based on the TPB. The results shown that the behaviour violates the speed limit because law enforcement is still considered weak, and respondents want to reach their destination faster or save travel time. The implication of this finding is that efforts to control speed, law enforcement and traffic engineering are needed to create safety roads. Keywords: Speed; toll roads; theory of planned behaviour (TPB); behavior violating the speed limit; violation 1. INTRODUCTION Speed is at the core of the road safety problem [1], a major cause of road traffic accidents and death [2]. Driving a vehicle above the speed limit is unsafe driving behavior that may cause the occurrence of an accident [3]. Speed has been identified as one of the main risk factors for accidents in Indonesia, in the aspect of traffic and vehicle aspect regulation, control and traffic control needs to be considered, one example of which is by recommending the design speed or plan speed on a road segment. The higher speed, the greater the stop distance needed, and the risk of accidents increases. [4]. It is generally accepted that high speeds increase both the severity and frequency of crashes [5]. According to data from the Indonesian National Police in 2020, the number of victims who died due to traffic accidents was 23.529 people, of which an average of 2-3 peoples per hour, which is concerning 67% are in productive age (22 to 50 years old), this is indicated as one of the causes of economic loss/an increase in the poverty rate because the head or family member of the breadwinner becomes a victim of an accident. [6]. The number of victims who die due to accidents tends to increase from year to year [7]. Speed limitation can be one way to improve road safety. Without a speed limit, drivers can drive their vehicles at high speed freely (driving at the excess limit) [4]. This needs to be carried out,
131
especially on The Cipali (Cikopo-Palimanan) Toll Road, West Java, which has a high accident rate involving private vehicles every year, as follows:
Table 1: Data on Traffic Accidents on The Cipali Toll Road 2020 No. Descriptive Unit Amount Amount Involving Private Vehicles 1. Number of Accidents Case 31 18 2. Fatalities Person 22 11 3. Seriously Injured Person 7 3 4. Slightly Injured Person 91 77
Source: Integrated Road Safety Management System of Indonesian National Traffic Police Corps 2020.
With the length of this toll road is 116 km resulting to the fatality density is 0.19 fatality per km in 2020. To combat the speeding issue in order to improve traffic safety, it is necessary to discover the insight reasons as to why this violation has commonly been committed. With regard to speeding behavior, a number of studies have been conducted to find out its psychological determinants. [8]. One of the most commonly used social science theories to link beliefs and behaviors is the Theory of Planned Behavior (TPB) [9], a theoretical framework and models of successful health behavior, which have previously been used to evaluate various traffic safety contexts. [10]. TPB is considered a social psychology variant of the common choice approach and it is one of the most widely developed psychological models of individual decision development. [11]. In addition, law enforcement by the Police is an important means of improving traffic safety and security [12]. This is in line with the Chief of Police General's 16 Priority Programs, Police General Drs. Listyo Sigit Prabowo, M.Sc. regarding the transformation towards a “Polri Presisi/Precice of Indonesian National Police” (predictive, responsibility and fair transparency) [13].
This research aims to analyze the driving speed of The Cipali Toll Road and the psychological factors that play a role based on the TPB introduced by Ajzen, namely the analysis of Belief (B), Attitude (ATT), Subjective Norms (SN) dan Perceived Behavioral Control (PBC). The implications of the need for speed control, law enforcement, and traffic engineering efforts are needed, creating safer roads, for the achievement of the United Nations Global Road Safety target of 50% reduction in deaths by the end of 2030. 2. METHODOLOGY This research was conducted on the Cipali Toll Road access as a fairly congested location because it is the main access to and from Jakarta. Average Daily Traffic (LHR) of class I vehicles (Based on the Decree of the Minister of Public Works Number 370/KPTS/M/2007 concerning Vehicle Classes) on the Cipali Toll Road section in both directions recorded passing at the Palimanan Toll Gate on March 31, 2021, at 00.00-24.00 Western Indonesian Time, as many as 31,590 vehicles. Participants Participants of 219 respondents consisted of men and women, with various age ranges starting from 17 years (M = 37.9, SD = 6.9). The majority already have Driving Licence and are private car drivers passing on The Cipali Toll Road and have been proven to have

132
violated the maximum speed limit that has been determined, which is more than 100 km/hour. Research Instruments Based on the formulation of the problems and objectives, this research is a quantitative study that uses a correlational approach. Questionnaire The questionnaire consists of 3 parts, namely the characteristics of the respondent, the randomly arranged TPB items, and the participant vehicle identity data. It takes approximately 3 minutes to fill out the questionnaire via Google Form/paperless. Theory of Planned Behaviour Participants were given a questionnaire containing a list of questions consisting of TPB psychological factors are beliefs, attitudes, subjective norms and perceived behavioral control (n = 25). Participants were asked to answer question items by choosing according to a 6-point Likert scale, from 1 = strongly disagree to 6 = strongly agree. Demographic variables Participants were asked about personal data such as gender, age, education level, occupation, driver's license ownership, how to obtain a driver's license, and length of driving experience. Research Location The study location was in Cipali toll road with a length of 116 km is a part of trans Java Toll Road on of the busiest toll roads in Indonesia. Capturing the vehicle speeding was along this toll road and survey conducting at the downstream toll gate at Cipali by pulled out order by Police.
Figure 1: Study location of Cipali Toll Road (Taken from Google Maps).

133
Procedure There is something special in the data collection of this research, the participant is a private car driver who has been proven to have violated the maximum speed limit set on The Cipali Toll Road and proven through the speed data from the Speed Gun motorized vehicle speed meter operated by Traffic Police. The guard crossing is about 3 kilometers before the driver passes the Palimanan Toll Gate. After paying the toll, the offender is then officially stopped by Police, who previously received information on speed limit violations from the officers operating the Speed Gun. However, all offenders were only given a sympathetic warning and asked to fill out a research questionnaire. The questionnaire data collection will be conducted on March 31, 2021, at 09.00-17.00 Western Indonesian Time at the Palimanan Toll Gate leading to Palimanan. Participants are not given any compensation for their participation. Data Analysis The quantitative data that has been collected is transferred to Microsoft Excel, then processed using the software Statistical Package for Social Science (SPSS) 26.
Figure 2: Theory of Planned Behaviour (TPB)
Source: Ajzen, 1991.
3. RESULT AND DISCUSSION
Demographic and Psychological Factor The majority of participants who filled out the questionnaire were male (76.7%) and female (23.3%), with an age range of 36-40 years (M = 37.9 years, SD = 6.9). The majority of education levels are S1 graduates (34.4%), the majority of occupations are private/self-employed employees (40.6%) with a Driving Licence A/B1 ownership (97.7%) and respondents take the test at the time of the test get a SIM (83.6%) and with the majority of experience driving over 10 years (55.3%). Based on the size of the engine, there were 50.23% participants with an engine capacity of <1500cc, 19.63% participants with a capacity of 1500-2000cc, and 30.14% participants with a capacity of > 2000cc.
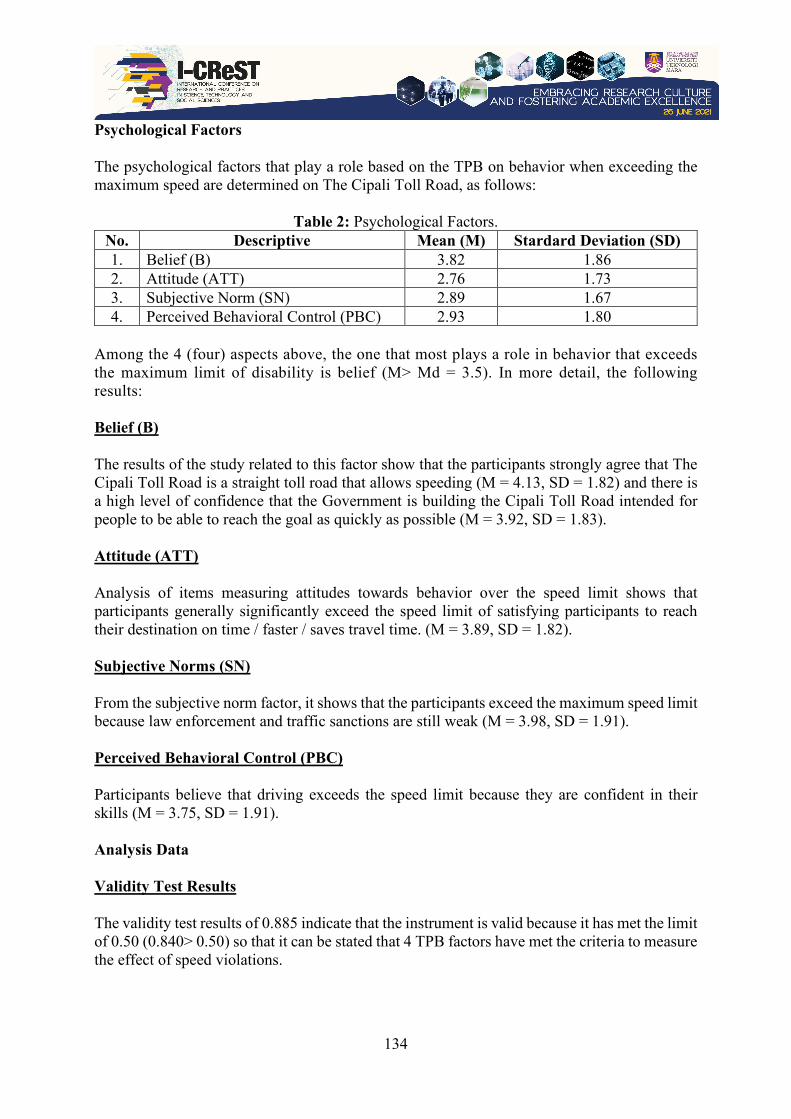
134
Psychological Factors The psychological factors that play a role based on the TPB on behavior when exceeding the maximum speed are determined on The Cipali Toll Road, as follows:
Table 2: Psychological Factors.
No. Descriptive Mean (M) Stardard Deviation (SD) 1. Belief (B) 3.82 1.86 2. Attitude (ATT) 2.76 1.73 3. Subjective Norm (SN) 2.89 1.67 4. Perceived Behavioral Control (PBC) 2.93 1.80
Among the 4 (four) aspects above, the one that most plays a role in behavior that exceeds the maximum limit of disability is belief (M> Md = 3.5). In more detail, the following results: Belief (B)
The results of the study related to this factor show that the participants strongly agree that The Cipali Toll Road is a straight toll road that allows speeding (M = 4.13, SD = 1.82) and there is a high level of confidence that the Government is building the Cipali Toll Road intended for people to be able to reach the goal as quickly as possible (M = 3.92, SD = 1.83).
Attitude (ATT)
Analysis of items measuring attitudes towards behavior over the speed limit shows that participants generally significantly exceed the speed limit of satisfying participants to reach their destination on time / faster / saves travel time. (M = 3.89, SD = 1.82). Subjective Norms (SN)
From the subjective norm factor, it shows that the participants exceed the maximum speed limit because law enforcement and traffic sanctions are still weak (M = 3.98, SD = 1.91). Perceived Behavioral Control (PBC)
Participants believe that driving exceeds the speed limit because they are confident in their skills (M = 3.75, SD = 1.91). Analysis Data
Validity Test Results
The validity test results of 0.885 indicate that the instrument is valid because it has met the limit of 0.50 (0.840> 0.50) so that it can be stated that 4 TPB factors have met the criteria to measure the effect of speed violations.
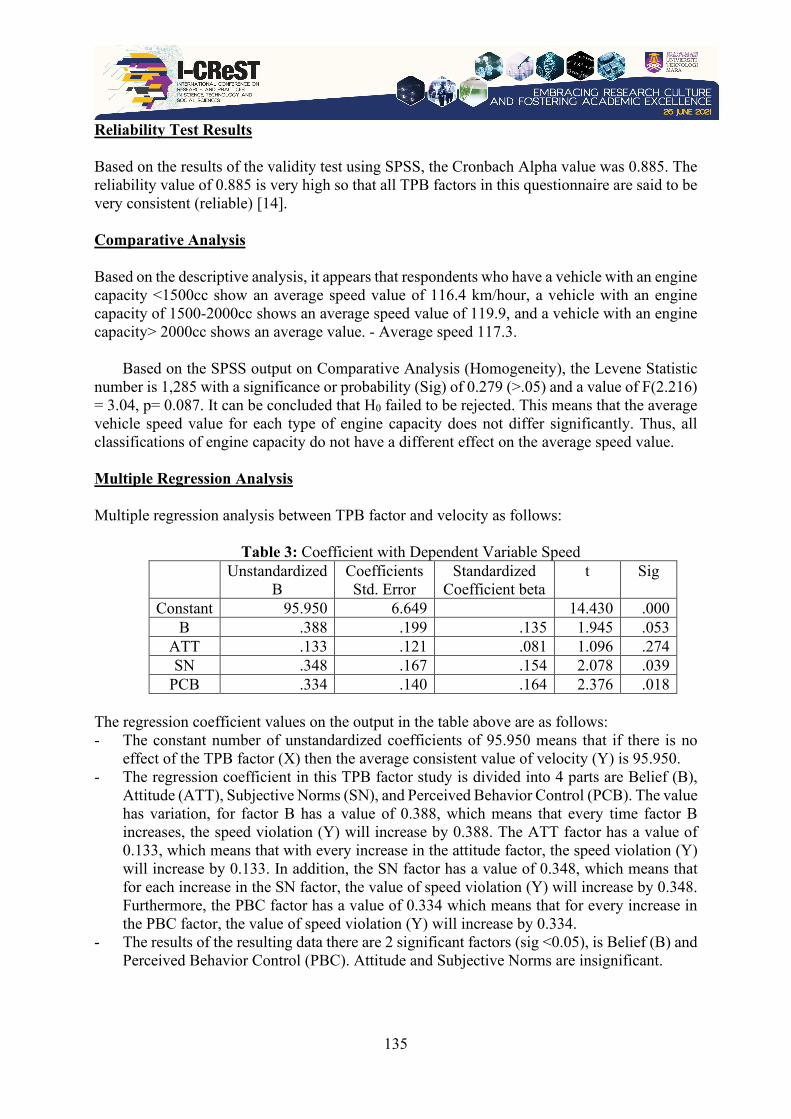
135
Reliability Test Results
Based on the results of the validity test using SPSS, the Cronbach Alpha value was 0.885. The reliability value of 0.885 is very high so that all TPB factors in this questionnaire are said to be very consistent (reliable) [14]. Comparative Analysis
Based on the descriptive analysis, it appears that respondents who have a vehicle with an engine capacity <1500cc show an average speed value of 116.4 km/hour, a vehicle with an engine capacity of 1500-2000cc shows an average speed value of 119.9, and a vehicle with an engine capacity> 2000cc shows an average value. - Average speed 117.3.
Based on the SPSS output on Comparative Analysis (Homogeneity), the Levene Statistic number is 1,285 with a significance or probability (Sig) of 0.279 (>.05) and a value of F(2.216) = 3.04, p= 0.087. It can be concluded that H0 failed to be rejected. This means that the average vehicle speed value for each type of engine capacity does not differ significantly. Thus, all classifications of engine capacity do not have a different effect on the average speed value. Multiple Regression Analysis Multiple regression analysis between TPB factor and velocity as follows:
Table 3: Coefficient with Dependent Variable Speed
Unstandardized B
Coefficients Std. Error
Standardized Coefficient beta
t Sig
Constant 95.950 6.649 14.430 .000 B .388 .199 .135 1.945 .053
ATT .133 .121 .081 1.096 .274 SN .348 .167 .154 2.078 .039
PCB .334 .140 .164 2.376 .018 The regression coefficient values on the output in the table above are as follows: - The constant number of unstandardized coefficients of 95.950 means that if there is no
effect of the TPB factor (X) then the average consistent value of velocity (Y) is 95.950. - The regression coefficient in this TPB factor study is divided into 4 parts are Belief (B),
Attitude (ATT), Subjective Norms (SN), and Perceived Behavior Control (PCB). The value has variation, for factor B has a value of 0.388, which means that every time factor B increases, the speed violation (Y) will increase by 0.388. The ATT factor has a value of 0.133, which means that with every increase in the attitude factor, the speed violation (Y) will increase by 0.133. In addition, the SN factor has a value of 0.348, which means that for each increase in the SN factor, the value of speed violation (Y) will increase by 0.348. Furthermore, the PBC factor has a value of 0.334 which means that for every increase in the PBC factor, the value of speed violation (Y) will increase by 0.334.
- The results of the resulting data there are 2 significant factors (sig <0.05), is Belief (B) and Perceived Behavior Control (PBC). Attitude and Subjective Norms are insignificant.
136
From the summary output of the data processing model, it is known that the value of R Square is 0.054. This value means that the effect of 4 TPB (X) factors on speed violations (Y) is 54% while 46% of speed violations (Y) are influenced by other variables. 4. CONCLUSION AND FURTHER RESEARCH The results of survey data processing show that the analysis of driving speed and psychological factors that play a role based on TPB on breaking the speed limit behavior is carried out because it is based more on the belief that toll roads are made to speed up travel time and drivers are speeding because they believe in their abilities and there is an influence. or the very small relationship between engine capacity and speed violation. Speed control, law enforcement, and traffic engineering are required. Recommendations for future work include the need for more intensive law enforcement by the National Police on The Cipali Toll Road, safety campaigns on the dangers of over-speeding/speeding behavior, awareness of safe driving and driving etiquette s, and designing practical solutions for stakeholders to overcome behavior of private car drivers who exceed the speed limit. Further research can be carryout relate to engineering solutions to make The Cipali Toll Road a more safety road. ACKNOWLEDGEMENT This research was funded by the Indonesian National Police through the Traffic Police Corps through the Education Scholarship Program and fully supported by The Highway Patrol Unit of The Cipali Toll Road, West Java Region Police who participated in this research. The authors are grateful to all those who helped. REFERENCES [1] Yao, Y., Carsten, O. & Hibberd, D. (2020). A Close Examination of Speed Limit
Credibility and Compliance on UK Roads. International Association of Traffic and Safety Science Research, Vol. 44, 17-29. https://doi.org/10.1016/j.iatssr.2019.05.003.
[2] Bordarie, J. (2019). Predicting Intentions To Comply With Speed Limits Using A “Decision Tree” Applied To An Extended Version of The Theory of Planned Behaviour. Transportation Research Part F: Traffic Psychology and Behaviour, Vol. 63, 174-185. https://doi.org/10.1016/j.trf.2019.04.005.
[3] Guritnaningsih., Siregar, Martha L., & Septiawan, Ahmad. (2019). Analysis of Driving Speed in Highway and Psychological Factors Speedings Behaviour in the Jakarta Area and Its Surroundings (Case study: Bekasi Main Street). Traffic Accident Research Centre: Journal of Indonesia Road Safety, Vol. 2 No. 3, pages 183-195.
[4] Kusuma, A., Maulina, D., & Hutami, A. M. (2019). Analysis of speed and Social Psychology factors of Speeding Behaviour on Drivers in DKI Jakarta. Traffic Accident Research Centre: Journal of Indonesia Road Safety, Vol. 2 No. 3, pages 133-148.
[5] Ahie, Liv M., Charlton, Samuel G., Starkey & Nicola J. (2015). The Role of Preference in Speed Choice. Journal Transportation Research Part F: Traffic Psychology and Behaviour, 30, 66-73.https://doi.org/10.1016/j.trf.2015.02.007.
[6] Korlantas Polri. (2020). Buku Potret Keselamatan Lalu Lintas di Indonesia Edisi 3. Desember 2020.
137
[7] Tjahjono, T. & Hendratmoko, P. (2014). Perhitungan Kemauan untuk Membayar Pada Penetapan Nilai Keselamatan Transportasi Jalan Untuk Kelompok Pengguna Jalan Tertentu. Jurnal Transportasi Vol. 14 No. 3, Universitas Katolik Parahyangan.
[8] Dinh, D. D., & Kubota, H. (2013). Speeding Behavior on Urban Residential Streets with a 30 km/h Speed Limit Under The Framework of The Theory of Planned Behavior. Transport Policy, 29, 199-208. https://doi.org/10.1016/j.tranpol.2013.06.003.
[9] Ajzen, I. (1991). The Theory of Planned Behavior. Organization Behavior and Human Decision Progress, 50(2), 179-211.
[10] McBride, M., Carter, L., & Phillips, B. (2020). Integrating The Theory of Planned Behavior and Behavioral Attitudes to Explore Texting Among Young Drivers in The US. International Journal of Information Management, 50, 365-374. https://doi.org/10.1016/j.ijinfomgt.2019.09.003.
[11] Aldo. (2019). Pengembangan Model Pemilihan Moda Perjalanan ke Sekolah Berbasis Transportasi Aktif. In Thesis (issue 1). Universitas Indonesia.
[12] Siregar, A. A. (2018). How Can Speed Enforcement be Made More Effective? An Investigation into The Effect of Police Presence, Speed Awareness Training and Road Publicity on Driver’s Choice of Speed. In Disertasi: The University of Leeds.
[13] Prabowo, L. S. (2021). Program Prioritas Kapolri (Priority Programs of Chief of Indonesia National Police 2021). In Commander Wish Kapolri Jenderal Pol. Drs. Listyo Sigit Prabowo, M. Si Tahun 2021.
[14] Hair. Jr., J. F., Black., W. C., Babin., B. J., Anderson., R. E., & L. Tatham., R. (2006). Multivariant Data Analysis. New Jersey: Pearson International Edition.
138
I-CReST 2021:124-145 – Contribution of Nano Crumb Rubber to Hot-Mix and Warm-Mix Buton Rock Asphalt with used Waste Engine Oil
*1Celcio Ricardo, 1Sigit Pranowo Hadiwardoyo
1Civil Engineering Department, Universitas Indonesia, Indonesia
*E-mail: [email protected]
ABSTRACT The development of movement and the density of the population, has an impact on increasing transportation facilities and infrastructure. Rubber has been widely used in various fields, including as a raw material for vehicle tires. Crumb Rubber is one of the results of processing with used tire waste grated, this result has been used as an added asphalt material as an aggregate binder in the asphalt mixture. The problem with using Crumb Rubber is in the process of mixing with asphalt which cannot mix evenly so it requires certain technology for its use. In this research, nano-sized crumb rubber has been used which aims to facilitate the mixing process and increase the benefits of Crumb Rubber. The test was carried out using the Asphalt Concrete Wearing Course (ACWC) specification asphalt mixture for hot and warm mixtures of Buton rock asphalt with used waste engine oil. The research began with the process of modified asphalt to obtain the optimum asphalt content. Furthermore, the hot-mix and warm-mix asphalt was added with Nano Crumb Rubber (NCR) 0%, 0.6%, 1.2%, 2.4% and 4.8% to the asphalt content in the mixture by dry process. This addition was made during the process of mixing asphalt with aggregate. By using the Marshall Standard and Immersion test, it can be seen that there is an increase in the performance of the asphalt mixture with added material on the stability and susceptibility of the asphalt mixture. This research has shown the results of the effect of using waste tire rubber and waste engine oil on Buton rock asphalt in hot-mix asphalt and warm-mix asphalt. Keywords: Nano crumb rubber; waste engine oil; moisture susceptibility; hot-mix ACWC; warm-mix ACWC 1. INTRODUCTION The development of road technology in Indonesia is directed at the use of environmentally friendly materials. Flexible pavement is one type of pavement that is often used and is directed to use modified materials to preserve the environment. Transportation, especially road construction, has a great influence on the environment [1]. The increasing volume and load of vehicles as well as tropical climate conditions in Indonesia are the main causes of premature road damage. The use of asphalt with improper processing can cause premature damage, such as damage to wheel grooves, wavy surfaces, and cracks [2][3]. The increase in traffic load occurs as a consequence of the increase in the number of population movements. This has an impact on increasing transportation facilities and infrastructure [3][4]. Hot-Mix Asphalt is a conventional mixture for road pavement construction, and there has been a lot of research on environmentally friendly road construction. The method of mixing with warm asphalt is a strategy for environmentally friendly technology because it reduces carbon emissions and
139
lowers the mixing temperature of asphalt. The use of added material in the warm mix is expected to have a better work performance in compaction and provide a higher density even at low temperatures [5].
The use of rubber as an added material has been used in various fields, including as a raw material for vehicle tires. The use of rubber as a raw material for vehicle tires can cause waste problems. Waste tires are still a small part that is used [6]. Crumb Rubber (CR) from used tires has been used in road pavement construction since the 1930s [7]. The use of modified asphalt and CR additives can contribute to overcoming the problem of waste disposal and improving the quality of road pavements [8]. This material can be mixed with aggregate in the asphalt mixture through a dry mix process or mixed into bitumen at a certain temperature, where CR serves as a binder in the wet mix process. The addition of CR can increase the resistance to stiffness and elasticity of asphalt at high temperatures [7–9]. Based on the research that has been done with the addition of CR on asphalt can improve the characteristics of the asphalt mixture [7][10]. The addition of CR tends to increase the strength and quality of the asphalt mixture. This is indicated by an increase in the value of stability and a decrease in the value of flow [10].
In this study, nano-sized CR was mixed with aggregates using the Dry-Mix method. This
method aims to facilitate the mixing process and increase the resistance to permanent deformation at high temperatures and cracking at low temperatures [10]. Tests have been carried out using a mixture of asphalt concrete specifications Asphalt Concrete Wearing Course (ACWC) with a hot-mix and warm-mix, using Buton Rock Asphalt (BRA) by adding waste engine oil.
The main objective of the study was to determine the effect of using nano-sized CR waste
and waste oil on hot-mixed and warm-mixed BRA. Tests were carried out using the Marshall Standard and Marshall Immersion tests to determine the level of susceptibility of the mixture to the influence of temperature and water. 2. RESEARCH METHOD AND MATERIAL Research on Buton Rock Asphalt (BRA) has been widely carried out using special specifications or with other general specifications. In this study, the specification of Asphalt Concrete Wearing Course (ACWC) was used. Utilization of BRA as in general uses pure asphalt, but in this study waste engine oil and waste tire fibers have been used as additives in the BRA Modified Asphalt mixture.
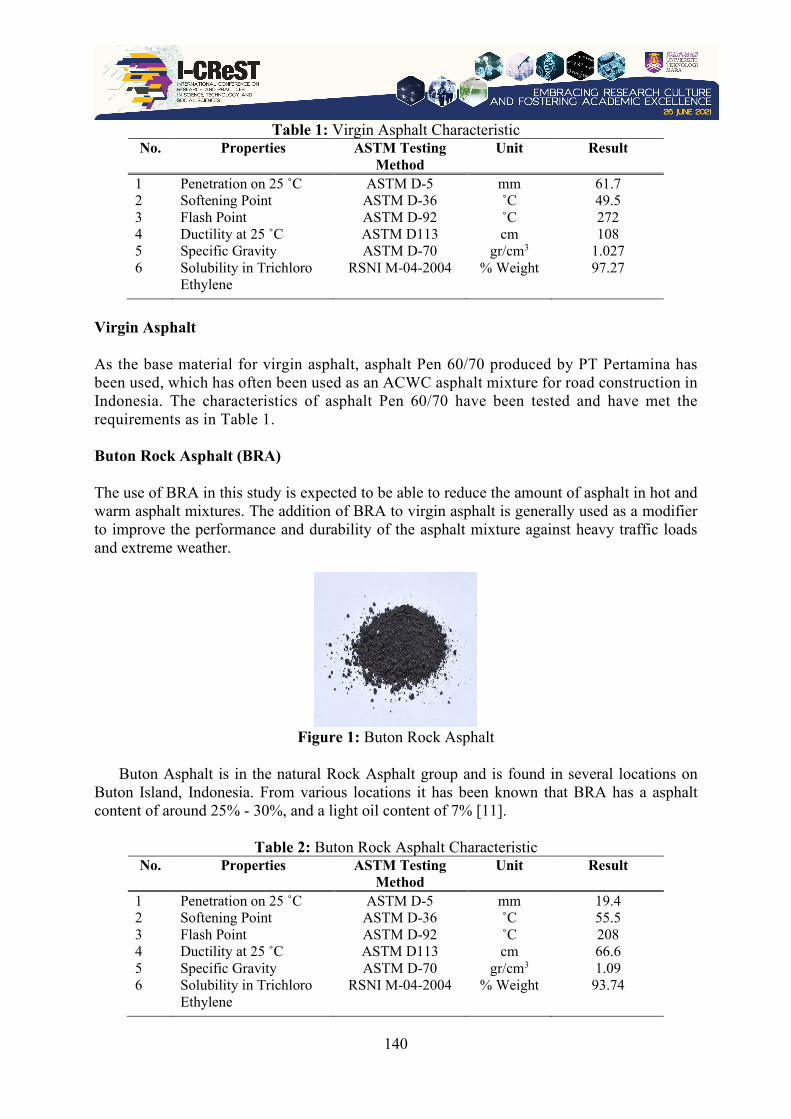
140
Table 1: Virgin Asphalt Characteristic No. Properties ASTM Testing
Method Unit Result
1 2 3 4 5 6
Penetration on 25 ˚C Softening Point Flash Point Ductility at 25 ˚C Specific Gravity Solubility in Trichloro Ethylene
ASTM D-5 ASTM D-36 ASTM D-92 ASTM D113 ASTM D-70
RSNI M-04-2004
mm ˚C ˚C cm
gr/cm3 % Weight
61.7 49.5 272 108
1.027 97.27
Virgin Asphalt As the base material for virgin asphalt, asphalt Pen 60/70 produced by PT Pertamina has been used, which has often been used as an ACWC asphalt mixture for road construction in Indonesia. The characteristics of asphalt Pen 60/70 have been tested and have met the requirements as in Table 1. Buton Rock Asphalt (BRA) The use of BRA in this study is expected to be able to reduce the amount of asphalt in hot and warm asphalt mixtures. The addition of BRA to virgin asphalt is generally used as a modifier to improve the performance and durability of the asphalt mixture against heavy traffic loads and extreme weather.
Figure 1: Buton Rock Asphalt
Buton Asphalt is in the natural Rock Asphalt group and is found in several locations on
Buton Island, Indonesia. From various locations it has been known that BRA has a asphalt content of around 25% - 30%, and a light oil content of 7% [11].
Table 2: Buton Rock Asphalt Characteristic
No. Properties ASTM Testing Method
Unit Result
1 2 3 4 5 6
Penetration on 25 ˚C Softening Point Flash Point Ductility at 25 ˚C Specific Gravity Solubility in Trichloro Ethylene
ASTM D-5 ASTM D-36 ASTM D-92 ASTM D113 ASTM D-70
RSNI M-04-2004
mm ˚C ˚C cm
gr/cm3 % Weight
19.4 55.5 208 66.6 1.09
93.74
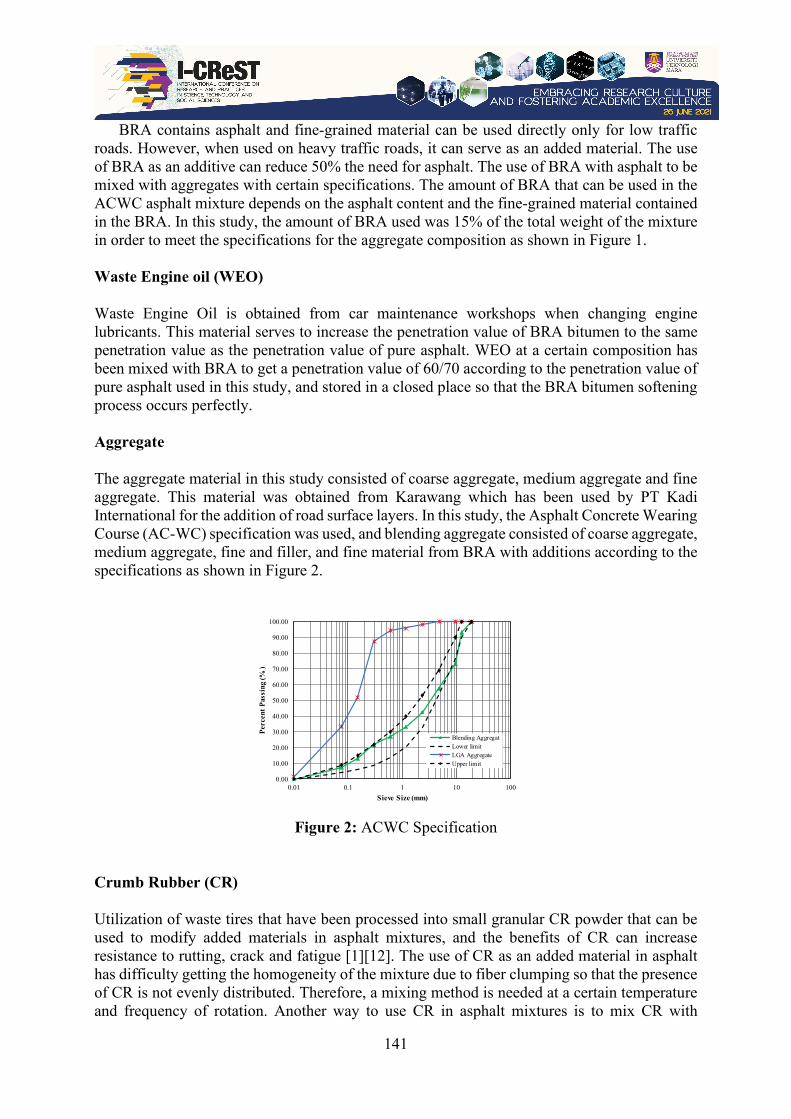
141
BRA contains asphalt and fine-grained material can be used directly only for low traffic roads. However, when used on heavy traffic roads, it can serve as an added material. The use of BRA as an additive can reduce 50% the need for asphalt. The use of BRA with asphalt to be mixed with aggregates with certain specifications. The amount of BRA that can be used in the ACWC asphalt mixture depends on the asphalt content and the fine-grained material contained in the BRA. In this study, the amount of BRA used was 15% of the total weight of the mixture in order to meet the specifications for the aggregate composition as shown in Figure 1. Waste Engine oil (WEO) Waste Engine Oil is obtained from car maintenance workshops when changing engine lubricants. This material serves to increase the penetration value of BRA bitumen to the same penetration value as the penetration value of pure asphalt. WEO at a certain composition has been mixed with BRA to get a penetration value of 60/70 according to the penetration value of pure asphalt used in this study, and stored in a closed place so that the BRA bitumen softening process occurs perfectly. Aggregate
The aggregate material in this study consisted of coarse aggregate, medium aggregate and fine aggregate. This material was obtained from Karawang which has been used by PT Kadi International for the addition of road surface layers. In this study, the Asphalt Concrete Wearing Course (AC-WC) specification was used, and blending aggregate consisted of coarse aggregate, medium aggregate, fine and filler, and fine material from BRA with additions according to the specifications as shown in Figure 2.
Figure 2: ACWC Specification
Crumb Rubber (CR)
Utilization of waste tires that have been processed into small granular CR powder that can be used to modify added materials in asphalt mixtures, and the benefits of CR can increase resistance to rutting, crack and fatigue [1][12]. The use of CR as an added material in asphalt has difficulty getting the homogeneity of the mixture due to fiber clumping so that the presence of CR is not evenly distributed. Therefore, a mixing method is needed at a certain temperature and frequency of rotation. Another way to use CR in asphalt mixtures is to mix CR with
0.00
10.00
20.00
30.00
40.00
50.00
60.00
70.00
80.00
90.00
100.00
0.01 0.1 1 10 100
Perc
ent P
assi
ng (%
)
Sieve Size (mm)
Blending AggregatLower limitLGA AggregateUpper limit

142
aggregate during heating. In this study, the CR milling process has been carried out to be finer to nano-sized. This is intended to increase the effectiveness of CR in asphalt mixtures. Optimum Modified BRA Mixtures
The initial process of making BRA modified asphalt is mixing engine oil waste with BRA as an added material for pure asphalt and aggregates to obtain the optimum asphalt content of the mixture.
Pure asphalt with a penetration of 60/70 is used in this mixture, and Nano Crumb Rubber (NCR) material is added at the temperature of mixing hot asphalt or warm asphalt mixture. Marshall test has been carried out to obtain the optimum asphalt content, and as a reference for further testing using the optimum asphalt content. The way to get the optimum asphalt content is to use variations in the asphalt content in the mixture of 6%, 6.5%, 7%, 7.5% and 8% for each of the 3 samples.
The asphalt mixture compaction process was carried out following the standard Marshall procedure where the hot-mix mixing temperature was at 150 C and the compaction temperature was at 145 ˚C, then the warm-mix mixing temperature was at 135 ˚C and the compaction temperature was at 125 ˚C. The sample was compacted with 75 blows on both sides of the cylindrical surface of the Marshall specimen.
Optimum asphalt content of modified BRA was obtained from the performance value of
the mixture that met the ACWC mixture specification standard, and this value was obtained at 7.75% as shown in Table 3.
Table 3: Optimum Asphalt Content Test Results
Asphalt Content 6% 6.5% 7% 7.5% 8% Standard VMA 21.08 20.86 20.68 20.46 20.56 ≥ 15 VFA 58.00 64.08 70.26 76.91 81.99 ≥ 65 VIM 8.86 7.50 6.15 4.75 3.71 3 - 5
Marshall Stability 920.10 1077.77 998.91 1039.32 1160.11 ≥ 800 Flow 3.13 3.60 3.68 3.70 3.47 2 - 4
Marshall Quotient 292.78 300.37 272.07 286.47 342.61 ≥ 250 Nano Crumb Rubber Modified Asphalt Mixtures
In this study, we used ACWC asphalt mixture at a bitumen content of 7.75%, with variations in the addition of NCR: 0%, 0.6%, 1.2%, 2.4%, 3.6% and 4.8% in hot-mix and warm- mix asphalt. The addition of NCR is carried out during the aggregate heating process which has been called the dry mix method.
The testing process has been carried out by means of the Marshall Standard and Marshall Immersion test. By using this test, it can be seen the effect of temperature and water on the mixture by comparing the Marshall stability value. This value can indicate the value of the moisture susceptibility of the mixture from the influence of environmental changes.

143
3. RESULT AND DISCUSSION Effect of compaction temperature and mixing temperature on ACWC performance The process of mixing and compaction using a warm mixture and a hot mixture has given an overview of the changes in the characteristics of the material from the Marshall test results. Figure 2 shows the comparison between the warm-mix test results and the hot-mix test results, this result is called the warm-mix/hot-mix ratio.
The decrease in temperature in the mixing and compaction processes has caused the voids in the mixture to be larger. With the addition of NCR, it appears that the voids in the mixture are larger than the asphalt mixture without NCR. This also occurs in voids in the mineral aggregate (VMA), but the addition of NCR does not significantly affect this value.
The decrease in mixing temperature and compaction temperature greatly affects the
Marshall stability value as shown in Figure 3, the warm-mix/hot-mix ratio < 1. This graph shows that the warm-mix parameters of the Marshall stability value, Flow and Marshall Quotient have decreased compared to with the value of the hot-mix asphalt mixture. The effect of Crumb Rubber on the performance of asphalt mixtures
The addition of NCR to the ACWC mixture had no effect on the value of the volume of voids filled with aggregate (VFA), in Figure 3 it is shown by a horizontal graph. On the other hand, for Marshall Stability, Flow and Marshall Quotient values there is a very real change.
The results obtained, the more NCR the Marshall stability value will decrease (Figure 4). It is the same with warm mixtures where the Marshall stability value will decrease with increasing NCR content in the mixture.
Figure 3: Effect of NCR content on the results of the Marshall test
0.40
0.60
0.80
1.00
1.20
1.40
1.60
0.0 0.6 1.2 1.8 2.4 3.0 3.6 4.2 4.8
ratio
war
m-m
ix/h
ot-m
ix
% NCR
MarshallStabilityMarshallQuotientFlow
VMA
VFA
VIM

144
Figure 4: Effect of NCR on Marshall stability
From the results of the Marshall test, it is known that the highest value of voids in mineral
aggregates (VIM) is in variation of 4.8%, and the value of the volume of void filled with asphalt (VFA) is smaller than the ACWC mixture without NCR. This is due to the presence of NCR so that the value of the cavity filled with asphalt decreases. The highest value of Marshall stability is in the variation of the addition of 0.6% NCR to the asphalt content, and there is a decrease in the flow value so that the Marshall quotient results increase as shown in Figure 5.
Figure 5: Effect of NCR on the value of Flow
Residual Strength Index (RSI) Residual Strength Index (RSI) for Marshall Stability test results for 0% NCR content, it can be seen that the RSI value for hot mix asphalt mixtures has decreased by 91%, and for warm mix asphalt mixtures has decreased by 63%. For hot mix asphalt with 2.4% NCR, the RSI value is higher 96%, while for warm mix asphalt it is 94.3%.
0
200
400
600
800
1000
1200
1400
0.00 0.60 1.20 2.40 3.60 4.80
Mar
shal
l St
abili
ty (
kg)
% NCR
Hot MixWarm Mix
0.00
0.50
1.00
1.50
2.00
2.50
3.00
3.50
4.00
4.50
0.00 0.60 1.20 2.40 3.60 4.80
Flow
(m
m)
% NCR
Hot MixWarm Mix
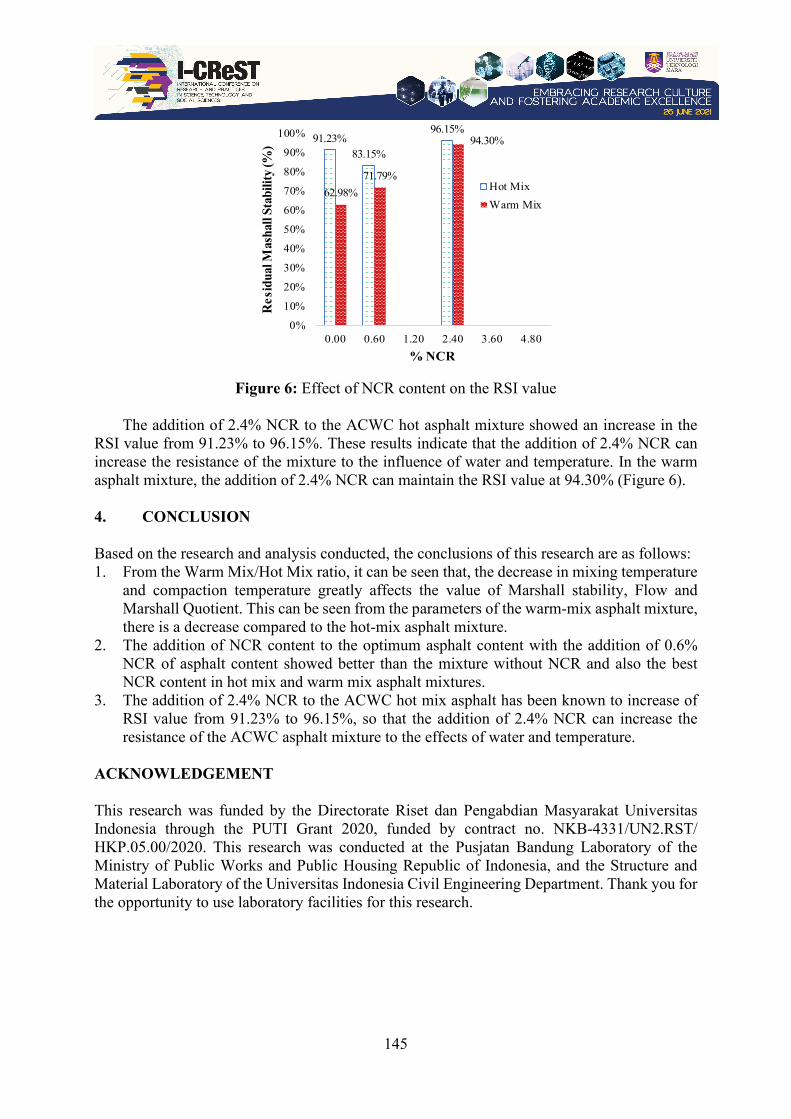
145
Figure 6: Effect of NCR content on the RSI value
The addition of 2.4% NCR to the ACWC hot asphalt mixture showed an increase in the
RSI value from 91.23% to 96.15%. These results indicate that the addition of 2.4% NCR can increase the resistance of the mixture to the influence of water and temperature. In the warm asphalt mixture, the addition of 2.4% NCR can maintain the RSI value at 94.30% (Figure 6). 4. CONCLUSION Based on the research and analysis conducted, the conclusions of this research are as follows: 1. From the Warm Mix/Hot Mix ratio, it can be seen that, the decrease in mixing temperature
and compaction temperature greatly affects the value of Marshall stability, Flow and Marshall Quotient. This can be seen from the parameters of the warm-mix asphalt mixture, there is a decrease compared to the hot-mix asphalt mixture.
2. The addition of NCR content to the optimum asphalt content with the addition of 0.6% NCR of asphalt content showed better than the mixture without NCR and also the best NCR content in hot mix and warm mix asphalt mixtures.
3. The addition of 2.4% NCR to the ACWC hot mix asphalt has been known to increase of RSI value from 91.23% to 96.15%, so that the addition of 2.4% NCR can increase the resistance of the ACWC asphalt mixture to the effects of water and temperature.
ACKNOWLEDGEMENT This research was funded by the Directorate Riset dan Pengabdian Masyarakat Universitas Indonesia through the PUTI Grant 2020, funded by contract no. NKB-4331/UN2.RST/ HKP.05.00/2020. This research was conducted at the Pusjatan Bandung Laboratory of the Ministry of Public Works and Public Housing Republic of Indonesia, and the Structure and Material Laboratory of the Universitas Indonesia Civil Engineering Department. Thank you for the opportunity to use laboratory facilities for this research.
91.23%83.15%
96.15%
62.98%71.79%
94.30%
0%
10%
20%
30%
40%
50%
60%
70%
80%
90%
100%
0.00 0.60 1.20 2.40 3.60 4.80
Res
idua
l Mas
hall
Stab
ility
(%)
% NCR
Hot MixWarm Mix
146
REFERENCES [1] S. L. Annisa, S. P. Hadiwardoyo, R. J. Sumabrata, and D. Iskandar, “Contribution of
Nano Crumb Rubber on Recycled Asphalt Concrete As Pedestrian Paving Block,” IOP Conf. Ser. Mater. Sci. Eng., vol. 811, no. 1, 2020, doi: 10.1088/1757-899X/811/1/012036.
[2] S. Mulyani, N. Suaryana, P. Penelitian, K. Pekerjaan, and P. Rakyat, “Kajian Penambahan RejIRE pada Aspal Modifikasi Crumb Rubber serta Kinerjanya pada Campuran Beraspal Panas,” vol. 24, no. 2, pp. 148–157, 2018.
[3] S. P. Hadiwardoyo, F. N. P. Imansyah, R. J. Sumabrata, and D. Iskandar, “Rut depth characteristics on hot mix asphalt with addition nano crumb rubber,” Civ. Eng. Archit., vol. 8, no. 4, pp. 525–532, 2020, doi: 10.13189/cea.2020.080416.
[4] S. M. Soleimani, A. Faheiman, Z. Mowaze, and S. M. Soleimani, “The Effects of Using Crumb Rubber Modified Binder in an Asphalt Pavement,” 2020, doi: 10.3844/ajeassp.2020.237.253.
[5] S. Nur, N. Kamarudin, M. R. Hainin, M. Khairul, and I. Mohd, “Comparison of Performance between Hot and Warm Mix Asphalt as Related to Compaction Design Comparison of Performance between Hot and Warm Mix Asphalt as Related to Compaction Design,” 2018.
[6] N. S. Mashaan, A. H. Ali, M. R. Karim, and M. Abdelaziz, “An overview of crumb rubber modified asphalt,” Int. J. Phys. Sci., vol. 7, no. 2, pp. 166–170, 2012, doi: 10.5897/IJPSX11.007.
[7] M. R. Ibrahim, H. Y. Katman, M. R. Karim, S. Koting, and N. S. Mashaan, “A Review on the Effect of Crumb Rubber Addition to the Rheology of Crumb. A Review on the Effect of Crumb Rubber Addition to the Rheology of Crumb Rubber Modified Bitumen,” no. April 2020, 2013, doi: 10.1155/2013/415246.
[8] M. Mohamed and E. Zumrawi, “Effect of Crumb Rubber Modifiers (CRM) on Characteristics of Asphalt Binders in Sudan,” vol. 6, pp. 1–6, 2017, doi: 10.11648/j.ijmsa.s.2017060201.11.
[9] N. S. Mashaan, A. H. Ali, M. R. Karim, and M. Abdelaziz, “Effect of crumb rubber concentration on the physical and rheological properties of rubberised bitumen binders,” Int. J. Phys. Sci., vol. 6, no. 4, pp. 684–690, 2011, doi: 10.5897/IJPS11.113.
[10] P. S. Wulandari and D. Tjandra, “Use of Crumb Rubber as an Additive in Asphalt Concrete Mixture,” Procedia Eng., vol. 171, pp. 1384–1389, 2017, doi: 10.1016/j.proeng.2017.01.451.
[11] I. K. Darsana, “Teknologi Pemanfaatan ASBUTON Sebagai Bahan Perkerasan Jalan,” 1980.
[12] M. Adamu et al., “Effect of crumb rubber and nano silica on the fatigue performance of roller compacted concrete pavement Effect of crumb rubber and nano silica on the fatigue performance of roller compacted concrete pavement,” Cogent Eng., vol. 21, no. 1, 2018, doi: 10.1080/23311916.2018.1436027.
147
I-CReST 2021:125-132 – Perception Measurement after Service Upgrade towards Feeder Ridership (Case Study: Mikrotrans Jakarta)
*Kusumastuti Rahmawati, Andyka Kusuma, Robby Yudo Purnomo
Department of Civil Engineering, Faculty of Engineering, Universitas Indonesia, Depok,
Indonesia
*E-mail: [email protected]
ABSTRACT The provision of feeder services is a major factor in the success of the public transport system, particularly in a metropolitan city. The public transport user in Jakarta tends to use a private motorcycle or online motorcycle taxi (ojek) in accessing the trunk line i.e. Mass Rapid Transit, Commuter Line, and Bus Rapid Transit. In-depth interviews with stated preferences are held in four urban villages in Cilandak and Kebayoran Baru Sub-district, South Jakarta. The study area was chosen because there are good trunk line services already, but poor first and last-mile services. Sample data of the study area was explored by maxLik package of RStudio. The study adopts willingness to pay approach in capturing the users' preference for the paratransit, which is known as mikrotrans feeder services. The study realizes that both price and accessibility are the issues in using paratransit for their first and last-mile trips. The study shows that the most influential variables to the choice of public transportation are fare, access time, and waiting time. It is revealed that male and female respondents are willing to pay for mikrotrans at a rate of IDR 7,700 and IDR 7,500 respectively to replace the ojek which costs IDR 13,000 after upgrading the mikrotrans fleet to a larger minibus, providing air-conditioner facilities, and scheduling the services with certainty. The considerable access time to reach the mikrotrans stop point from home for men and women are 11.25 minutes and 13.75 minutes respectively, or equal to 688.5 m and 684.75 m if we consider the walking speed of 1.02 m/s for men and 0.83 m/s for women. Price changes gives a more significant effect on female respondents. The male respondents desire the shorter access time for the mikrotrans. Keywords: feeder; mikrotrans; discrete choice model; willingness to pay; maximum Log-Likelihood 1. INTRODUCTION Jakarta has a population of 10,56 million people with 12% of it are commuters. There are total 2.3 million commuter from Jakarta and its surrounding cities (Bogor, Depok, Tangerang, and Bekasi) [1]. Mass transportation systems as an efficient and cost-effective mode can serve most of the city's commuters (Talamini & Pires Ferreira, 2019). Problems arise when the main public transport network is not well-planned at the first and last miles, so people prefer to use private vehicles to reach the destination or book a motorcycle taxi to get the trunk line [2]. In developing countries, access to and from the trunk line of transport is still a concern due to the lack of feeder services [3]. To avoid the same problem, the DKI Regional Government initiated Jaklingko, a program that integrates all types of transportation modes, both feeder and mass
148
transportation. Feeder vehicle in the form of a minibus, which is known as mikrotrans in Jakarta, is very important to serve passengers with special conditions, for example, to serve passengers who live in densely populated settlements with narrow roads so that they can provide wider route coverage and accessibility [2], [4].
This study aims to measure the perceptions of Jakarta residents on the tendency to choose
mikrotrans services instead of online motorcycle taxis (ojek) if there is an improvement in the quality of the fleet and service. 2. LITERATURE REVIEW Paratransit as Feeder
Referring to the paratransit function, the researchers recommend the integration of paratransit as feeders in the public transportation system to improve urban transport performance [3]. Paratransit vehicles vary from country to country e.g. wagons in Pakistan, e-bikes in China, and jeep-neys in Philippines [2]–[6].
In Indonesia, angkutan kota (angkot), or mikrotrans in Jaklingko system, is a very familiar
feeder. Some of the advantages possessed by angkot compared to other public transportation are (a) providing high accessibility and mobility, (b) operating costs are more favorable for short-distance travel, (c) easy and free passage through narrow roads, and (d) costs maintenance is cheaper [7]. But there is online motorcycle taxi as its main rival.
In 2020, there are 1,865 unit of mikrotrans in Jakarta from 10 Jaklingko transport provider
partners [8]. In the same year, there are 4M online motorcycle taxi driver in ndonesia which a quarter of it operate in Jakarta and the surrounding cities. The three main reason for the passengers to choose the online motorcycle taxi are : cheap, secure, and fast [9].
To predict the walking distance, the author will use the walking speed for Indonesian
people is 1.02 m/s or 3.672 km/h for men and 0.83 m/s or 2.988 km/h for women [10]. Men and women in Jakarta choose to walk compared to other alternative modes when the distance between their home and MRT station is 629 m and 593 m respectively [11]. Binomial Logit Model This study estimates the likelihood of choosing a mode by the Discrete Choice model. As with deterministic choice theory, the individual is assumed to choose an alternative if its utility is greater than that of any alternative. The utility of alternative consists of two-component, the first component represents the portion of the utility observed by the researchers, often called the deterministic portion, while the other component is the difference between the unknown utility used by the individual and the utility estimated by the researcher [12]. The function equation model is:
Ui = βi0 + βi
1 Xi1 + βi
2 Xi2 + … + βi
k Xik (1)
Where Ui is the utility function of mode i, βi
k is the k-variable parameter of mode i, and Xik
is the k-variable of mode i.
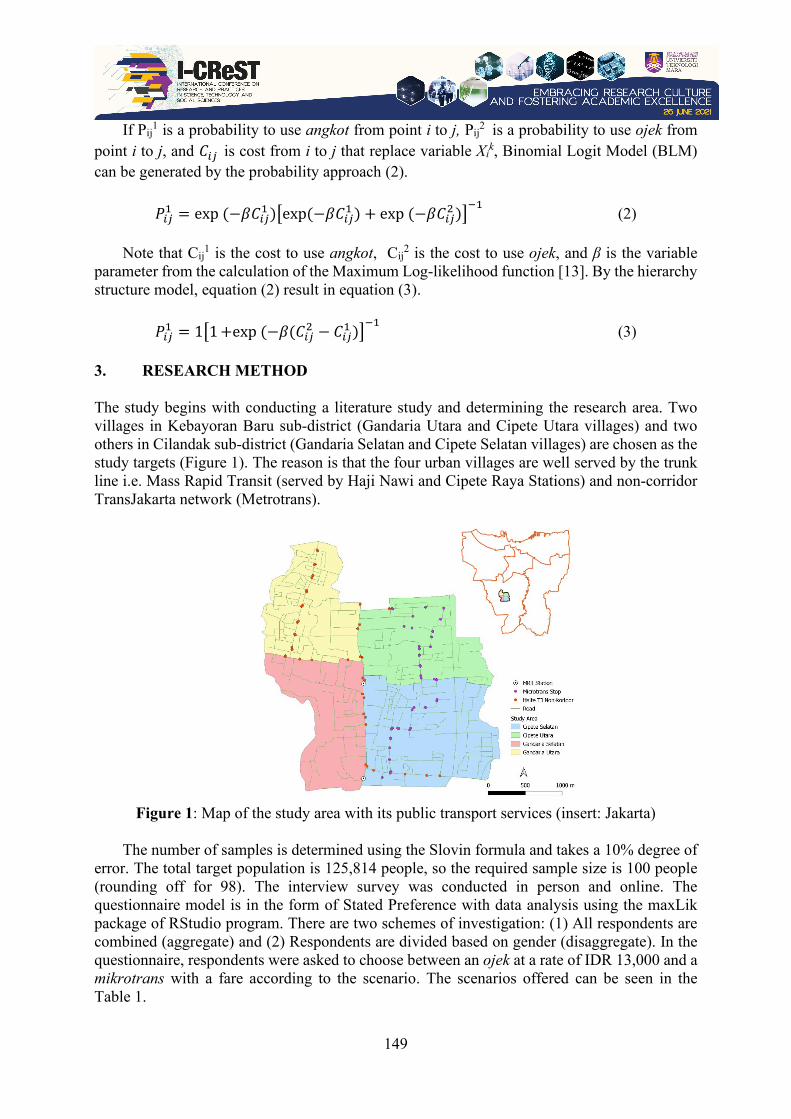
149
If Pij1 is a probability to use angkot from point i to j, Pij
2 is a probability to use ojek from point i to j, and 𝐶𝐶𝑖𝑖𝑗𝑗 is cost from i to j that replace variable Xi
k, Binomial Logit Model (BLM) can be generated by the probability approach (2).
𝐹𝐹𝑖𝑖𝑗𝑗1 = exp (−𝛽𝛽𝐶𝐶𝑖𝑖𝑗𝑗
1 )�exp(−𝛽𝛽𝐶𝐶𝑖𝑖𝑗𝑗1 ) + exp (−𝛽𝛽𝐶𝐶𝑖𝑖𝑗𝑗
2 )�−1
(2)
Note that Cij1 is the cost to use angkot, Cij
2 is the cost to use ojek, and β is the variable parameter from the calculation of the Maximum Log-likelihood function [13]. By the hierarchy structure model, equation (2) result in equation (3).
𝐹𝐹𝑖𝑖𝑗𝑗
1 = 1�1 +exp (−𝛽𝛽(𝐶𝐶𝑖𝑖𝑗𝑗2 − 𝐶𝐶𝑖𝑖𝑗𝑗
1 )�−1
(3) 3. RESEARCH METHOD The study begins with conducting a literature study and determining the research area. Two villages in Kebayoran Baru sub-district (Gandaria Utara and Cipete Utara villages) and two others in Cilandak sub-district (Gandaria Selatan and Cipete Selatan villages) are chosen as the study targets (Figure 1). The reason is that the four urban villages are well served by the trunk line i.e. Mass Rapid Transit (served by Haji Nawi and Cipete Raya Stations) and non-corridor TransJakarta network (Metrotrans).
Figure 1: Map of the study area with its public transport services (insert: Jakarta)
The number of samples is determined using the Slovin formula and takes a 10% degree of
error. The total target population is 125,814 people, so the required sample size is 100 people (rounding off for 98). The interview survey was conducted in person and online. The questionnaire model is in the form of Stated Preference with data analysis using the maxLik package of RStudio program. There are two schemes of investigation: (1) All respondents are combined (aggregate) and (2) Respondents are divided based on gender (disaggregate). In the questionnaire, respondents were asked to choose between an ojek at a rate of IDR 13,000 and a mikrotrans with a fare according to the scenario. The scenarios offered can be seen in the Table 1.

150
Table 1: Scenarios of State Preferences Scenario Fare (000 IDR) Access Time
(Minutes) 1 10 15 2 10 10 3 10 5 4 8 15 5 8 10 6 8 5 7 5 15 8 5 10 9 5 5
4. RESULTS AND DISCUSSION Obtained 900 response condition preferences from 100 respondents, consisting of 49% male and 51% female. Most respondents had a high school / vocational high school education (73%) followed by 10% Diploma / Bachelor graduates, 5% elementary / junior high school graduates, and 3% postgraduates / Doctoral graduates. Many respondents' ages were in the range of 25-29 years (27%) and 20-24 years (26%). The rest are in the age range of 35-39 years (9%), 40-44 years (5%), 45-49 years (6%). The age range of 50-54 years and 55-59 years has the same portion, 7%.
As many as 77% of respondents have an income of less than 5 million per month, followed by those with an income of 5-10 million per month (19%). There are only 3% of respondents who earn 10-15 million and 1% earn 15-20 million.
From the two schemes (aggregate and disaggregate), the combination of the fare gap (FG),
access time (AT), and waiting time (WT) variables gives the maximum Log-Likelihood (LL) value (Table 2). Access time here means time people need to walk from their home to the feeder stops, while the waiting time means the time they usually suffer to wait for the public transport.
Table 2: The maximum Log-Likelihood value from the 2 schemes Scheme Condition Maximum LL 1 Combined Respondents -498.7999 2 Male Respondent -251.4664 Female Respondents -211.5418
The combination results in different constants for each parameter (Table 3) and the utility
function model which obtained for the condition is in Table 4.
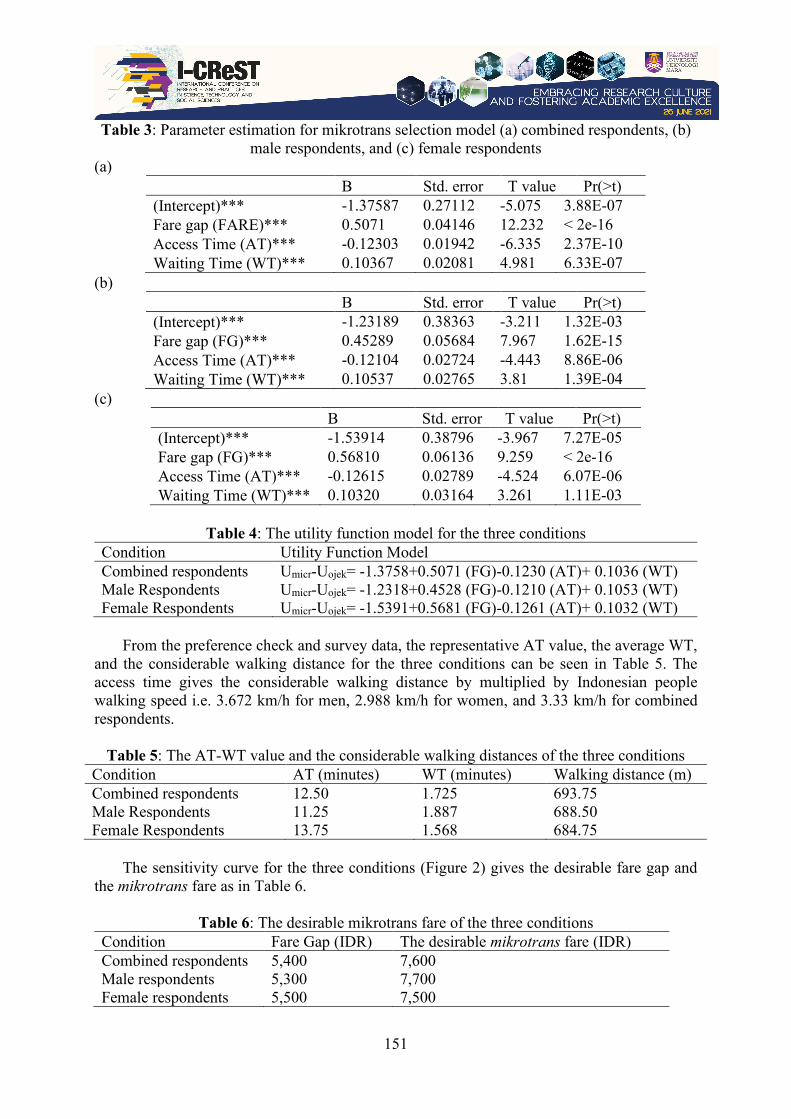
151
Table 3: Parameter estimation for mikrotrans selection model (a) combined respondents, (b) male respondents, and (c) female respondents
(a) B Std. error T value Pr(>t) (Intercept)*** -1.37587 0.27112 -5.075 3.88E-07 Fare gap (FARE)*** 0.5071 0.04146 12.232 < 2e-16 Access Time (AT)*** -0.12303 0.01942 -6.335 2.37E-10 Waiting Time (WT)*** 0.10367 0.02081 4.981 6.33E-07
(b) B Std. error T value Pr(>t) (Intercept)*** -1.23189 0.38363 -3.211 1.32E-03 Fare gap (FG)*** 0.45289 0.05684 7.967 1.62E-15 Access Time (AT)*** -0.12104 0.02724 -4.443 8.86E-06 Waiting Time (WT)*** 0.10537 0.02765 3.81 1.39E-04
(c) B Std. error T value Pr(>t) (Intercept)*** -1.53914 0.38796 -3.967 7.27E-05 Fare gap (FG)*** 0.56810 0.06136 9.259 < 2e-16 Access Time (AT)*** -0.12615 0.02789 -4.524 6.07E-06 Waiting Time (WT)*** 0.10320 0.03164 3.261 1.11E-03
Table 4: The utility function model for the three conditions
Condition Utility Function Model Combined respondents Umicr-Uojek= -1.3758+0.5071 (FG)-0.1230 (AT)+ 0.1036 (WT) Male Respondents Umicr-Uojek= -1.2318+0.4528 (FG)-0.1210 (AT)+ 0.1053 (WT) Female Respondents Umicr-Uojek= -1.5391+0.5681 (FG)-0.1261 (AT)+ 0.1032 (WT)
From the preference check and survey data, the representative AT value, the average WT,
and the considerable walking distance for the three conditions can be seen in Table 5. The access time gives the considerable walking distance by multiplied by Indonesian people walking speed i.e. 3.672 km/h for men, 2.988 km/h for women, and 3.33 km/h for combined respondents.
Table 5: The AT-WT value and the considerable walking distances of the three conditions Condition AT (minutes) WT (minutes) Walking distance (m) Combined respondents 12.50 1.725 693.75 Male Respondents 11.25 1.887 688.50 Female Respondents 13.75 1.568 684.75
The sensitivity curve for the three conditions (Figure 2) gives the desirable fare gap and the mikrotrans fare as in Table 6.
Table 6: The desirable mikrotrans fare of the three conditions Condition Fare Gap (IDR) The desirable mikrotrans fare (IDR) Combined respondents 5,400 7,600 Male respondents 5,300 7,700 Female respondents 5,500 7,500
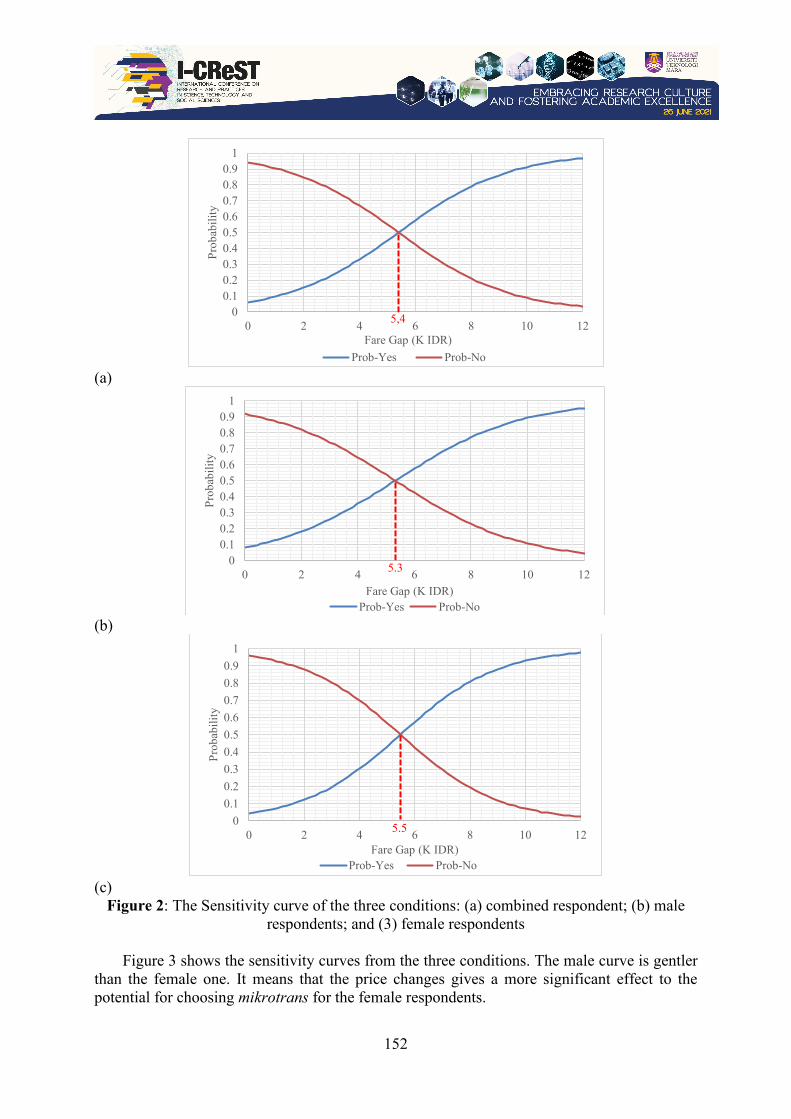
152
(a)
(b)
(c)
Figure 2: The Sensitivity curve of the three conditions: (a) combined respondent; (b) male respondents; and (3) female respondents
Figure 3 shows the sensitivity curves from the three conditions. The male curve is gentler
than the female one. It means that the price changes gives a more significant effect to the potential for choosing mikrotrans for the female respondents.
00.10.20.30.40.50.60.70.80.9
1
0 2 4 6 8 10 12
Prob
abili
ty
Fare Gap (K IDR)Prob-Yes Prob-No
5,4
00.10.20.30.40.50.60.70.80.9
1
0 2 4 6 8 10 12
Prob
abili
ty
Fare Gap (K IDR)Prob-Yes Prob-No
00.10.20.30.40.50.60.70.80.9
1
0 2 4 6 8 10 12
Prob
abili
ty
Fare Gap (K IDR)Prob-Yes Prob-No
5.3
5.5
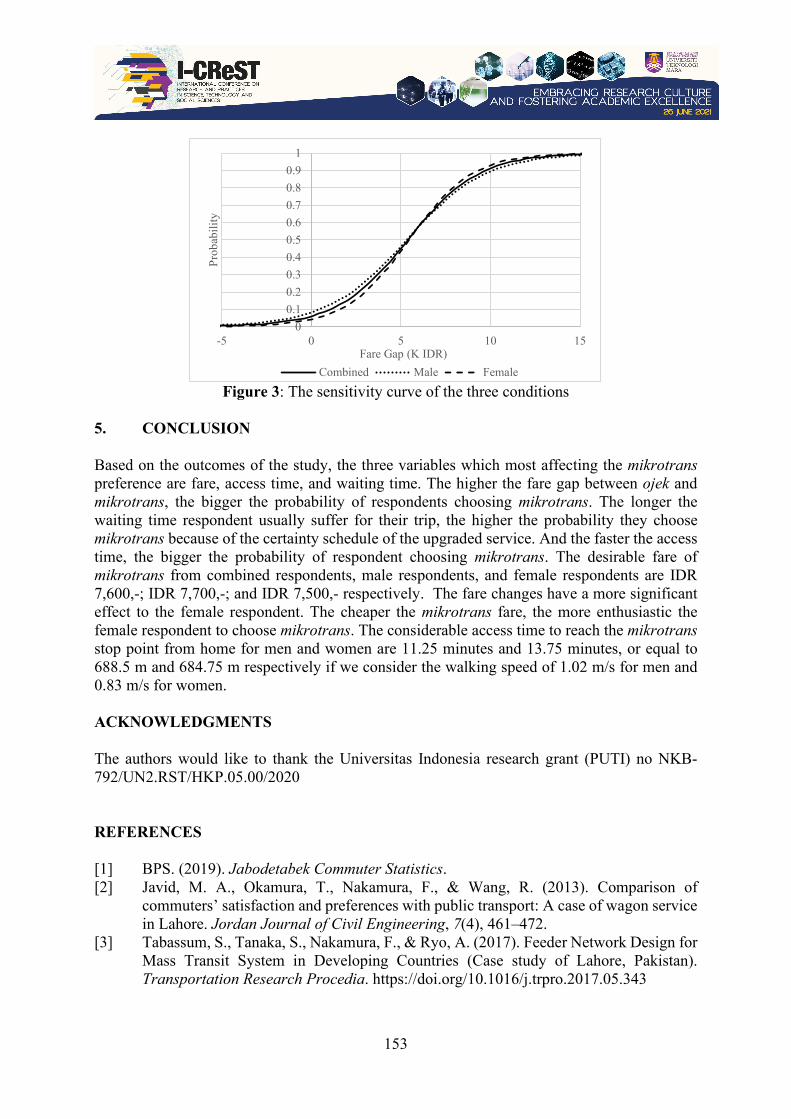
153
Figure 3: The sensitivity curve of the three conditions
5. CONCLUSION Based on the outcomes of the study, the three variables which most affecting the mikrotrans preference are fare, access time, and waiting time. The higher the fare gap between ojek and mikrotrans, the bigger the probability of respondents choosing mikrotrans. The longer the waiting time respondent usually suffer for their trip, the higher the probability they choose mikrotrans because of the certainty schedule of the upgraded service. And the faster the access time, the bigger the probability of respondent choosing mikrotrans. The desirable fare of mikrotrans from combined respondents, male respondents, and female respondents are IDR 7,600,-; IDR 7,700,-; and IDR 7,500,- respectively. The fare changes have a more significant effect to the female respondent. The cheaper the mikrotrans fare, the more enthusiastic the female respondent to choose mikrotrans. The considerable access time to reach the mikrotrans stop point from home for men and women are 11.25 minutes and 13.75 minutes, or equal to 688.5 m and 684.75 m respectively if we consider the walking speed of 1.02 m/s for men and 0.83 m/s for women. ACKNOWLEDGMENTS The authors would like to thank the Universitas Indonesia research grant (PUTI) no NKB-792/UN2.RST/HKP.05.00/2020 REFERENCES [1] BPS. (2019). Jabodetabek Commuter Statistics. [2] Javid, M. A., Okamura, T., Nakamura, F., & Wang, R. (2013). Comparison of
commuters’ satisfaction and preferences with public transport: A case of wagon service in Lahore. Jordan Journal of Civil Engineering, 7(4), 461–472.
[3] Tabassum, S., Tanaka, S., Nakamura, F., & Ryo, A. (2017). Feeder Network Design for Mass Transit System in Developing Countries (Case study of Lahore, Pakistan). Transportation Research Procedia. https://doi.org/10.1016/j.trpro.2017.05.343
00.10.20.30.40.50.60.70.80.9
1
-5 0 5 10 15
Prob
abili
ty
Fare Gap (K IDR)Combined Male Female

154
[4] KANEKO, Y., OKAMURA, T., NAKAMURA, F., & WANG, R. (2013). Passengers’ Attitudes to the Service items of Jeepneys in Metro Manila by Different Lifestyles. Journal of the Eastern Asia Society for Transportation Studies, 10, 1384–1395.
[5] Cervero, R., & Golub, A. (2007). Informal transport: A global perspective. Transport Policy, 14(6), 445–457. https://doi.org/10.1016/j.tranpol.2007.04.011
[6] Talamini, G., & Pires Ferreira, D. (2019). An informal transportation as a feeder of the rapid transit system. Spatial analysis of the e-bike taxi service in Shenzhen, China. Transportation Research Interdisciplinary Perspectives. https://doi.org/10.1016/j.trip.2019.100002.
[7] Joewono, T. B. (2005). the Characteristics of Paratransit and Non-Motorized Transport in Bandung, Indonesia. Journal of the Eastern Asia Society for Transportation Studies, 6, 262–277. https://doi.org/10.11175/easts.6.262
[8] PPID Transjakarta (2020) [9] Online Research Shopback (2018) [10] Pratama, Y., Setiawan, L. B., Afif, Z., & Anugerah, A. A. (2018). Identifying Public
Facilities Surrounding MRT Stations Based on Pedestrian Walking Distance using GIS-Based Buffer and Spatial Query Method (Case study: Central and South Jakarta). SuperMap Cup 2018, August.
[11] Afkara, A. V., & Kusuma, A. (2020). Walking Distance Perception in Jakarta MRT Station Area*. 193(Istsdc 2019), 120–124. https://doi.org/10.2991/aer.k.200220.025
[12] Ortúzar, J. de D., & Willumsen, L. G. (2011). Modelling Transport. In Modelling Transport. https://doi.org/10.1002/9781119993308
[13] Tamin, O. Z. (2000). Perencanaan & Pemodelan.

155
I-CReST 2021:174-175 – Development of Multipurpose In-House Tracking Device
*1Hasnorhafiza binti Husni, 2Nik Muhammad Syazwan bin Nik Yusof, 2Muhammad
Iqbal Haziq bin Othman, 2Nor Shazwaney Atiqah bt Ibrahim
1Centre of Foundation Studies, Universiti Teknologi MARA, Cawangan Selangor, Kampus Dengkil, 43800 Dengkil, Selangor, Malaysia
2School of Electrical Engineering, College of Engineering, Universiti Teknologi MARA Cawangan Terengganu Kampus Dungun, Malaysia
*E-mail: [email protected]
ABSTRACT In-house tracking device is a crucially needed system in every household. The most important feature of in-house tracking device is the ability to ensure the safety of people inside the house by tracing any possible danger for example gas leakage, intrusion, fire, etc. In this project, our aim is to develop a simple in-house tracking device that can detect and notify the resident in the event of gas leakage. Not only that, but this device also has some additional features where it can track the commonly misplaced items around the house. In this project, the idea is simply by combining the RF module receiver, Bluetooth module, RF module transmitter and MQ-2 (gas sensor) by using Arduino Uno. This project use Atmega328P-PU to install all coding program that will give instructions to conduct this system properly. The receiver can also be connected with mobile phone via Bluetooth in case the transmitter does not function. Thus, by having this project, detection of gas leakage and misplaced items within the house area is made possible and hence the risk of losing important personal stuff can be avoided while at the same time ensuring the safety of everyone within the house. Keywords: Atmega328p-pu; Arduino; Item tracing; MQ-2; Gas Sensor 1. INTRODUCTION The usage of Liquefied Petroleum Gas (LPG) is quite common. It is in fact has been widely used in industry, household appliances, motor fuel, etc [1]. However, although it is environmentally friendly, it can pose serious threat if it leaks. If leak happens, LPG will spread into air and replace oxygen which can cause suffocation. Moreover, since almost everything is powered by electricity, a small ignition in the premises during LPG leakage is more than enough to cause an explosion that will lead to fatal accidents. So, it is highly necessary that the users are aware of LPG leakage for them to take necessary safety precautions [2], [3].
Speaking of gas leakage, household safety is one of the major issue due to the extensive use of LPG mainly for cooking. In Malaysia, most of the cooking is done using LPG. Only recently some people shifted to use electrically powered induction cooker for cooking. With the widely usage of LPG and lack of safety awareness, accidents due to this LPG (gas) leakage are bound to happen. For example, in 2016 at Kuala Lumpur, eight people were reported badly injured due to explosions in a restaurant due to LPG leakage [4]. More recently, in 2018 at
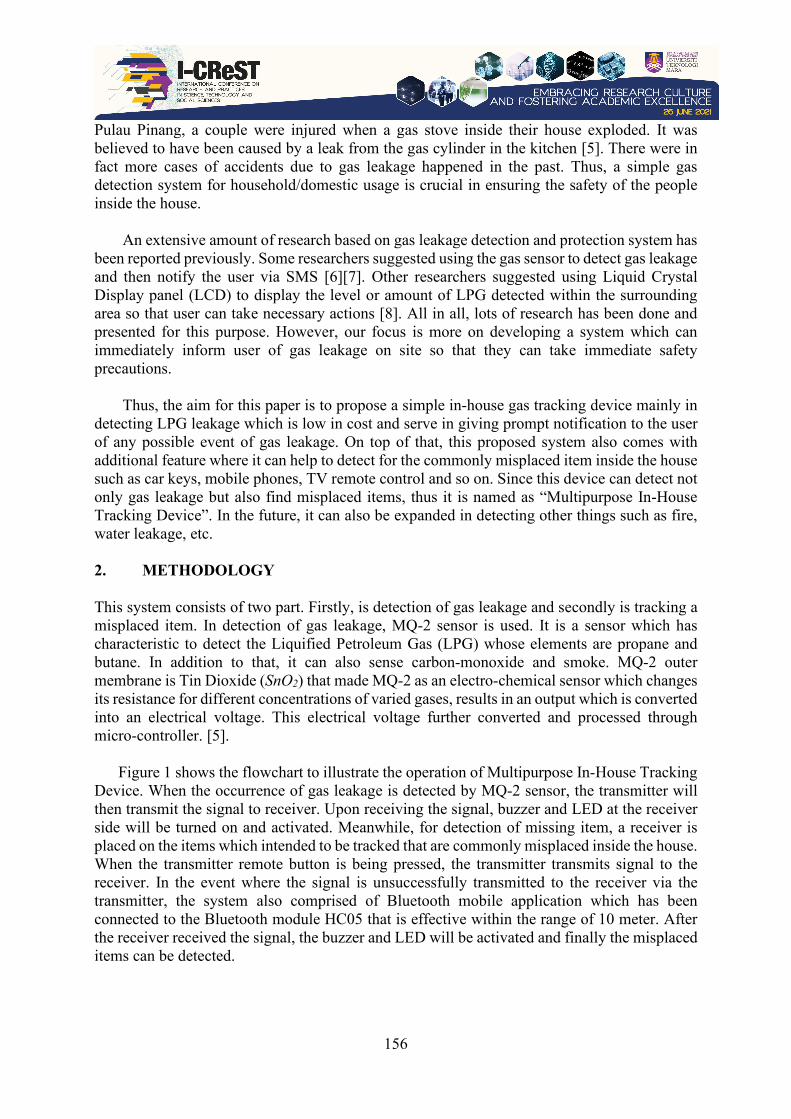
156
Pulau Pinang, a couple were injured when a gas stove inside their house exploded. It was believed to have been caused by a leak from the gas cylinder in the kitchen [5]. There were in fact more cases of accidents due to gas leakage happened in the past. Thus, a simple gas detection system for household/domestic usage is crucial in ensuring the safety of the people inside the house.
An extensive amount of research based on gas leakage detection and protection system has been reported previously. Some researchers suggested using the gas sensor to detect gas leakage and then notify the user via SMS [6][7]. Other researchers suggested using Liquid Crystal Display panel (LCD) to display the level or amount of LPG detected within the surrounding area so that user can take necessary actions [8]. All in all, lots of research has been done and presented for this purpose. However, our focus is more on developing a system which can immediately inform user of gas leakage on site so that they can take immediate safety precautions.
Thus, the aim for this paper is to propose a simple in-house gas tracking device mainly in detecting LPG leakage which is low in cost and serve in giving prompt notification to the user of any possible event of gas leakage. On top of that, this proposed system also comes with additional feature where it can help to detect for the commonly misplaced item inside the house such as car keys, mobile phones, TV remote control and so on. Since this device can detect not only gas leakage but also find misplaced items, thus it is named as “Multipurpose In-House Tracking Device”. In the future, it can also be expanded in detecting other things such as fire, water leakage, etc. 2. METHODOLOGY This system consists of two part. Firstly, is detection of gas leakage and secondly is tracking a misplaced item. In detection of gas leakage, MQ-2 sensor is used. It is a sensor which has characteristic to detect the Liquified Petroleum Gas (LPG) whose elements are propane and butane. In addition to that, it can also sense carbon-monoxide and smoke. MQ-2 outer membrane is Tin Dioxide (SnO2) that made MQ-2 as an electro-chemical sensor which changes its resistance for different concentrations of varied gases, results in an output which is converted into an electrical voltage. This electrical voltage further converted and processed through micro-controller. [5].
Figure 1 shows the flowchart to illustrate the operation of Multipurpose In-House Tracking Device. When the occurrence of gas leakage is detected by MQ-2 sensor, the transmitter will then transmit the signal to receiver. Upon receiving the signal, buzzer and LED at the receiver side will be turned on and activated. Meanwhile, for detection of missing item, a receiver is placed on the items which intended to be tracked that are commonly misplaced inside the house. When the transmitter remote button is being pressed, the transmitter transmits signal to the receiver. In the event where the signal is unsuccessfully transmitted to the receiver via the transmitter, the system also comprised of Bluetooth mobile application which has been connected to the Bluetooth module HC05 that is effective within the range of 10 meter. After the receiver received the signal, the buzzer and LED will be activated and finally the misplaced items can be detected.
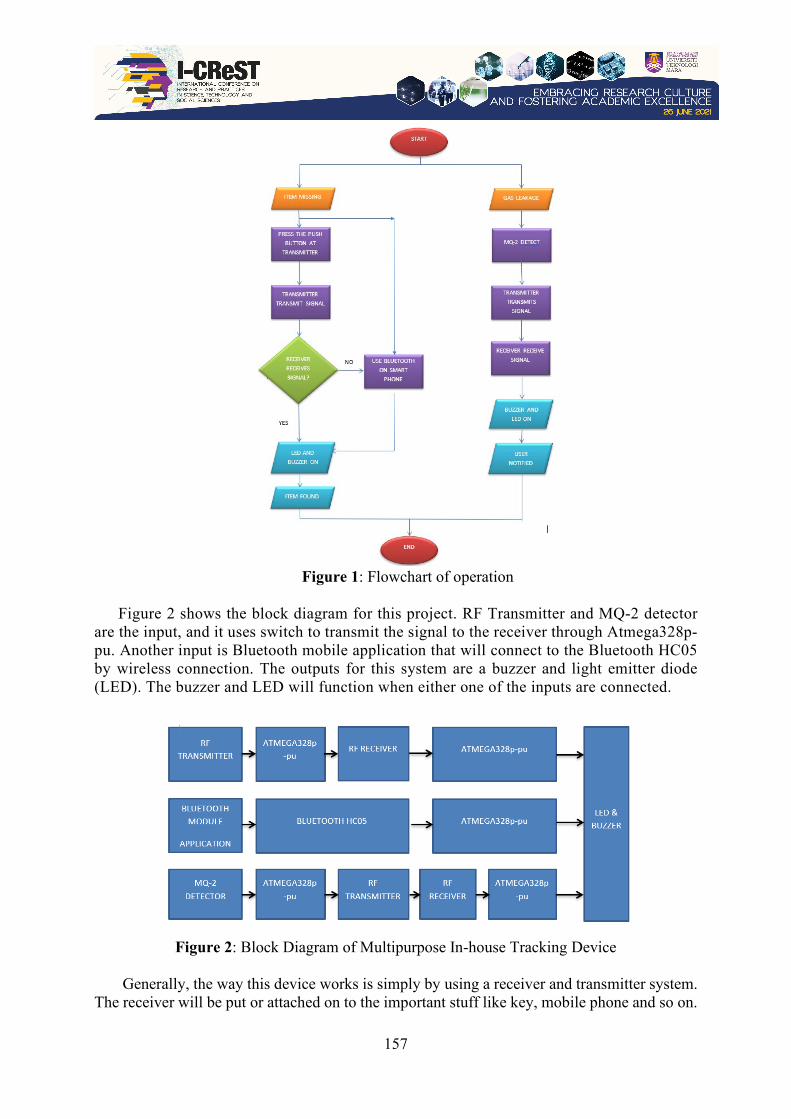
157
Figure 1: Flowchart of operation
Figure 2 shows the block diagram for this project. RF Transmitter and MQ-2 detector
are the input, and it uses switch to transmit the signal to the receiver through Atmega328p-pu. Another input is Bluetooth mobile application that will connect to the Bluetooth HC05 by wireless connection. The outputs for this system are a buzzer and light emitter diode (LED). The buzzer and LED will function when either one of the inputs are connected.
Figure 2: Block Diagram of Multipurpose In-house Tracking Device
Generally, the way this device works is simply by using a receiver and transmitter system.
The receiver will be put or attached on to the important stuff like key, mobile phone and so on.
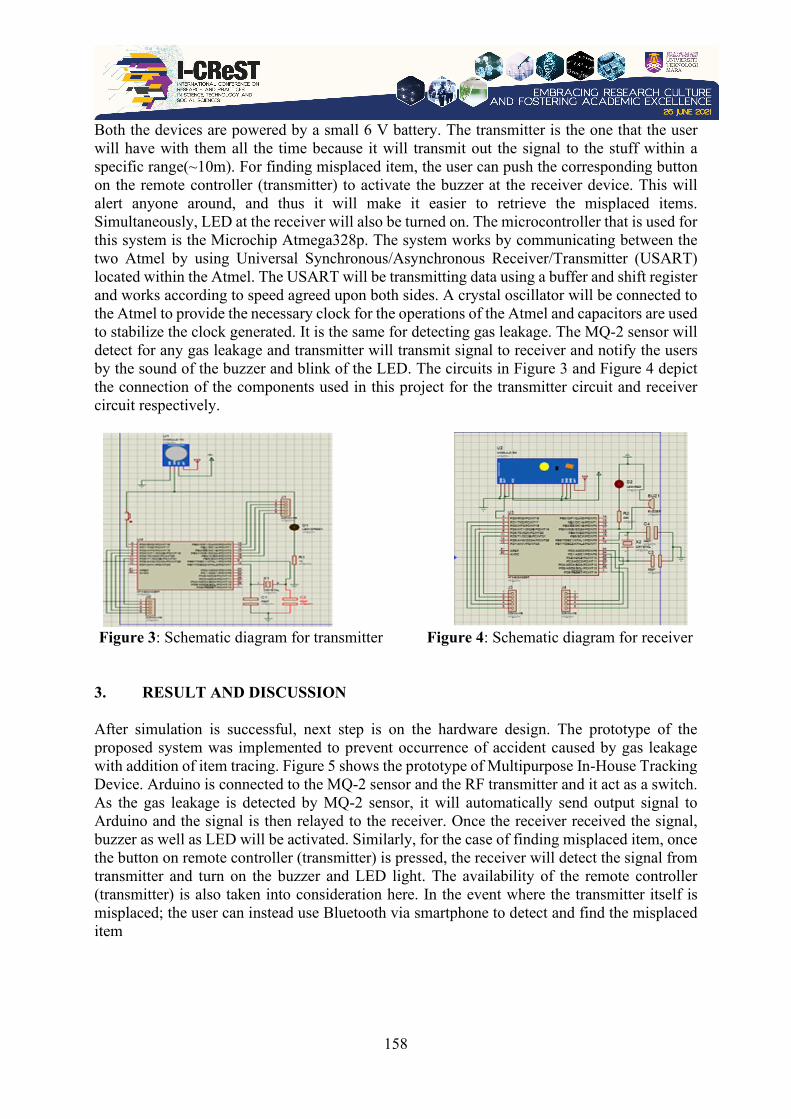
158
Both the devices are powered by a small 6 V battery. The transmitter is the one that the user will have with them all the time because it will transmit out the signal to the stuff within a specific range(~10m). For finding misplaced item, the user can push the corresponding button on the remote controller (transmitter) to activate the buzzer at the receiver device. This will alert anyone around, and thus it will make it easier to retrieve the misplaced items. Simultaneously, LED at the receiver will also be turned on. The microcontroller that is used for this system is the Microchip Atmega328p. The system works by communicating between the two Atmel by using Universal Synchronous/Asynchronous Receiver/Transmitter (USART) located within the Atmel. The USART will be transmitting data using a buffer and shift register and works according to speed agreed upon both sides. A crystal oscillator will be connected to the Atmel to provide the necessary clock for the operations of the Atmel and capacitors are used to stabilize the clock generated. It is the same for detecting gas leakage. The MQ-2 sensor will detect for any gas leakage and transmitter will transmit signal to receiver and notify the users by the sound of the buzzer and blink of the LED. The circuits in Figure 3 and Figure 4 depict the connection of the components used in this project for the transmitter circuit and receiver circuit respectively.
Figure 3: Schematic diagram for transmitter Figure 4: Schematic diagram for receiver
3. RESULT AND DISCUSSION
After simulation is successful, next step is on the hardware design. The prototype of the proposed system was implemented to prevent occurrence of accident caused by gas leakage with addition of item tracing. Figure 5 shows the prototype of Multipurpose In-House Tracking Device. Arduino is connected to the MQ-2 sensor and the RF transmitter and it act as a switch. As the gas leakage is detected by MQ-2 sensor, it will automatically send output signal to Arduino and the signal is then relayed to the receiver. Once the receiver received the signal, buzzer as well as LED will be activated. Similarly, for the case of finding misplaced item, once the button on remote controller (transmitter) is pressed, the receiver will detect the signal from transmitter and turn on the buzzer and LED light. The availability of the remote controller (transmitter) is also taken into consideration here. In the event where the transmitter itself is misplaced; the user can instead use Bluetooth via smartphone to detect and find the misplaced item
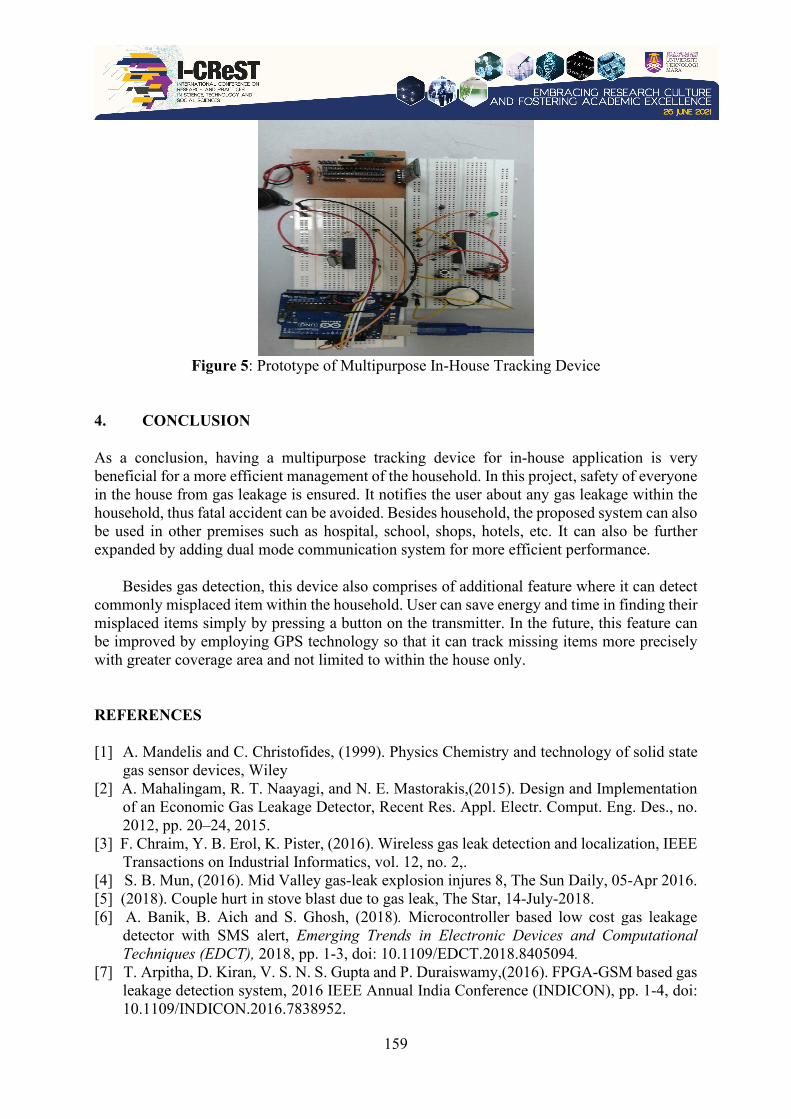
159
Figure 5: Prototype of Multipurpose In-House Tracking Device
4. CONCLUSION
As a conclusion, having a multipurpose tracking device for in-house application is very beneficial for a more efficient management of the household. In this project, safety of everyone in the house from gas leakage is ensured. It notifies the user about any gas leakage within the household, thus fatal accident can be avoided. Besides household, the proposed system can also be used in other premises such as hospital, school, shops, hotels, etc. It can also be further expanded by adding dual mode communication system for more efficient performance.
Besides gas detection, this device also comprises of additional feature where it can detect commonly misplaced item within the household. User can save energy and time in finding their misplaced items simply by pressing a button on the transmitter. In the future, this feature can be improved by employing GPS technology so that it can track missing items more precisely with greater coverage area and not limited to within the house only.
REFERENCES [1] A. Mandelis and C. Christofides, (1999). Physics Chemistry and technology of solid state
gas sensor devices, Wiley [2] A. Mahalingam, R. T. Naayagi, and N. E. Mastorakis,(2015). Design and Implementation
of an Economic Gas Leakage Detector, Recent Res. Appl. Electr. Comput. Eng. Des., no. 2012, pp. 20–24, 2015.
[3] F. Chraim, Y. B. Erol, K. Pister, (2016). Wireless gas leak detection and localization, IEEE Transactions on Industrial Informatics, vol. 12, no. 2,.
[4] S. B. Mun, (2016). Mid Valley gas-leak explosion injures 8, The Sun Daily, 05-Apr 2016. [5] (2018). Couple hurt in stove blast due to gas leak, The Star, 14-July-2018. [6] A. Banik, B. Aich and S. Ghosh, (2018). Microcontroller based low cost gas leakage
detector with SMS alert, Emerging Trends in Electronic Devices and Computational Techniques (EDCT), 2018, pp. 1-3, doi: 10.1109/EDCT.2018.8405094.
[7] T. Arpitha, D. Kiran, V. S. N. S. Gupta and P. Duraiswamy,(2016). FPGA-GSM based gas leakage detection system, 2016 IEEE Annual India Conference (INDICON), pp. 1-4, doi: 10.1109/INDICON.2016.7838952.

160
[8] S. M. Zinnuraain, M. Hasan, M. A. Hakque and M. M. N. Arefin, (2019). Smart Gas Leakage Detection with Monitoring and Automatic Safety System, 2019 International Conference on Wireless Communications Signal Processing and Networking (WiSPNET), 2019, pp. 406-409, doi: 10.1109/WiSPNET45539.2019.9032872.
[9] V. Ramya and B. Palaniappan, (2012). Embedded system for Hazardous Gas detection and Alerting,” Int. J. Distrib. Parallel Syst. IJDPS, vol. 3, pp. 287–300

161
SOCIAL SCIENCES & HUMANITIES
162
I-CReST 2021:001-055 – Peranan Undang-undang Jenayah Syariah dalam Menangani Isu Gejala Sosial dalam Kalangan Masyarakat Islam di
Malaysia
*1Mohamad Afandi Md Ismail, 1,2Mohd Sabree Nasri, 1Ikmal Hafiz Jamal, 1Muhammad Hasif Yahaya, 1Muhd Najib Abdul Wakil
1Akademi Pengajian Islam Kontemporari, Universiti Teknologi MARA, Shah Alam 40450,
Selangor, Malaysia 2Fakulti Undang-Undang, Governan dan Hubungan Antarabangsa, Kolej Universiti Islam
Melaka, 78200, Melaka
*E-mail: [email protected]
ABSTRAK Gejala sosial dalam kalangan masyarakat Islam di Malaysia sentiasa menjadi isu dan perhatian. Pelbagai perbuatan yang merujuk kepada gejala sosial antaranya membabitkan aktiviti seksual seperti persetubuhan luar nikah, melahirkan anak luar nikah, LGBT, pengambilan bahan memabukkan seperti dadah dan arak, berjudi, dan sebagainya. Sebagai sebuah negara yang mengamalkan sistem perundangan syariah dan sivil, maka umat Islam di Malaysia diwajibkan mematuhi kedua-dua perundangan tersebut. Perlembagaan Persekutuan telah memberikan kuasa kepada setiap negeri untuk mewujudkan undang-undang syariah bagi kegunaan masyarakat Islam di negeri tersebut. Peruntukan undang-undang jenayah syariah di Malaysia adalah berbeza bagi setiap negeri namun masih dalam lingkungan sumber utama yang sama iaitu al-Quran dan al-Sunnah. Walaupun telah terdapat pelbagai peruntukan undang-undang samada syariah dan sivil yang mengandungi peruntukan bagi menjaga perilaku dan tatasusila masyarakat khususnya orang Islam, namun isu melibatkan gejala sosial masyarakat Islam masih serius dan perlu diambil perhatian. Oleh yang demikian, penulisan ini akan membincangkan peranan peruntukan undang-undang jenayah syariah yang terdapat disetiap negeri di Malaysia dalam menyelesaikan isu gejala sosial yang berlaku dalam kalangan masyarakat Islam. Kajian ini akan menggunapakai metod kajian kualitatif dengan merujuk kepada bahan bercetak seperti artikel jurnal, thesis, buku akademik, Akta Kesalahan Jenayah Syariah (Wilayah Persekutuan) 1997, enakmen dan ordinan yang telah diwartakan serta beberapa kes terpilih yang telah diputuskan oleh mahkamah. Hasil daripada penulisan ini akan memberikan gambaran yang lebih jelas tentang kedudukan dan peranan peruntukan undang-undang jenayah syariah sedia ada, serta bagaimana ia sepatutnya mampu menyelesaikan isu gejala sosial yang berlaku. Beberapa cadangan penambahbaikan juga akan dikemukakan sebagai dapatan kepada penulisan. Kata kunci: Gejala sosial, undang-undang jenayah syariah, Malaysia. 1. PENDAHULUAN Gejala sosial merupakan himpunan beberapa aktiviti yang bersifat negatif yang sering dilakukan oleh masyarakat dalam sesuatu komuniti dan ia mengundang kritikan serta

163
perbincangan. Gejala sosial boleh dikategorikan kepada dua iaitu yang melibatkan semua kelompok masyarakat dan gejala sosial yang melibatkan remaja [1]. Dalam menghadapi cabaran dunia yang tiada sempadan kini, aspek pendidikan akhlak menjadi antara cabaran yang sangat besar kepada setiap golongan masyarakat. Peningkatan proses pembangunan dan pemodenan negara-negara maju dari sudut sejarahnya memperlihatkan terdapatnya peningkatan terhadap pelbagai isu dan masalah yang melibatkan masyarakat. Begitu juga seperti mana yang sedang dialami oleh Malaysia [2].
Golongan remaja terutamanya sangat mudah terdedah dengan pelbagai unsur negatif yang dibawa oleh arus perdana terutamanya media sosial.Perkembangan arus globalisasi yang bersifat negatif serta pengaruh unsur modenisme menjadikan isu gejala sosial semakin kritikal, ditambah pula dengan faktor sikap, budaya pergaulan bebas dan berhibur secara berlebihan, kurangnya sikap penjagaan akhlak dan rohani, kurang sifat jati diri, pengabaian ibu bapa dan penguatkuasaan undang-undang yang longgar menjadi asbab utama isu gejala sosial semakin berleluasa [3].
Masyarakat Islam di Malaysia dikawal oleh dua jenis undang-undang iaitu undang-undang
sivil seperti kanun keseksaan dan undang-undang Islam yang terdapat disetiap negeri-negeri. Keberadaan kedua-dua undang-undang ini sepatutnya menjadikan umat Islam itu lebih terjaga dan terhindar daripada terlibat dengan gejala sosial. Namun apa yang berlaku adalah sebaliknya, bila mana kajian menunjukkan bahawa masyarakat melayu yang beragama Islam adalah antara penyumbang utama kepada statistik isu-isu yang melibatkan gejala sosial di Malaysia [4]. Sebagai umat Islam, kepatuhan kepada perintah agama itu sepatutnya telah menghindarkan mereka daripada terlibat dengan sebarang perilaku negatif. Undang-undang jenayah syariah yang terdapat disetiap negeri pula berperanan sebagai penghalang kepada penglibatan umat Islam dan sumber peruntukan hukuman kepada mereka yang terlibat.
Oleh yang demikian, suatu tinjauan terhadap peruntukan undang-undang jenayah syariah
yang menyentuh tentang gejala sosial akan dilaksanakan melalui kaedah penilitian kepada beberapa sumber bertulis. Peranan undang-undang jenayah syariah dalam menyelesaikan isu gejala sosial akan diketengahkan serta beberapa cadangan penambahbaikan akan diutarakan sebagai dapatan kepada penulisan ini.
2. SOROTON LITERATUR
Kajian berhubung dengan gejala sosial di Malaysia telah banyak dilakukan oleh ramai pengkaji. Antara kajian yang dilaksanakan ialah Gejala Sosial Dalam Komuniti: Satu Sorotan Penyelesaian Dari Perspektif Wahyu [1]. Menurut beliau, gejala sosial boleh dibincangkan melalui dua aspek iaitu dalam kalangan semua warga tua dan muda serta aspek remaja sahaja. Kajian beliau telah mengklasifikasikan gejala sosial dengan pelbagai bentuk iaitu, penyalahgunaan dadah, gangster, melepak, khalwat, minum arak, lari dari rumah, gejala bohsia, dan pelacuran. Beliau juga menyatakan beberapa faktor yang membawa kepada gejala sosial antaranya, sikap ibubapa, cetek pendidikan agama, pengaruh rakan sebaya, pengaruh media massa, dan kehidupan yang style. Kajian yang dilakukan oleh Azlina [2] pula membincangkan tentang Tema dan Isu Penyelidikan Mengenai Gejala Sosial pada Dekad Pertama Abad 21 di Malaysia. Pengkaji dalam kajian tersebut telah membuat analisis terhadap jenis-jenis kajian berkenaan dengan gejala sosial yang telah dilaksanakan di Malaysia sepanjang tahun 2000 sehingga 2010. Hasil kajian beliau mendapati terdapat hampir 150 kajian berkenaan dengan pelbagai tema dan isu yang menyentuh aspek gejala sosial telah dijalankan oleh pengkaji di
164
Malaysia. Zeenath [5] telah menjalankan kajian berkenaan jenis-jenis masalah sosial yang dilakukan dan melibatkan golongan wanita seperti gangguan seksual, seks luar nikah, rogol, penagihan dadah dan perceraian.
Md. Zain et.al, [6] telah mengkaji tentang gejala sosial di Malaysia dengan fokus kajian menyentuh tentang pendekatan Islam dan peranan pemimpin untuk mencegahnya. Kajian tersebut menyatakan bahawa kes bunuh diri, murtad, berjudi, zina, arak, khalwat, transgender, dan sumbang mahram merupakan gejala yang semakin merisaukan di Malaysia terutamanya dalam kalangan orang Melayu Islam. Malah, yang lebih membimbangkan ialah golongan remaja di Malaysia yang berumur 10 hingga 24 tahun sangat aktif terlibat dengan senario tingkah laku devian yang terkait dengan gejala sosial seperti dadah, merokok, berjudi, kelucahan, berkelakuan kurang sopan dan beberapa perbuatan lain termasuk aktiviti jenayah [7]. Kajian berkenaan dengan kesalahan juvana dalam kalangan remaja juga telah dijalankan oleh Hasan [8]. Kajian tersebut mendapati bahawa faktor keluarga, pendidikan, pengaruh rakan sebaya, media massa dan masyarakat telah menyumbang kepada penglibatan remaja terhadap jenayah dan kesalahan berkenaan.
Rokiah [9] pula telah menjalakankan kajian tentang masalah salah laku dalam kalangan
pelajar sekolah menengah. Pelbagai gejala sosial telah disenaraikan dalam hasil kajian beliau seperti peras ugut, mencuri, buli, berjudi, merokok, dan vandalisme. Dalam pada itu, kajian mendapati bahawa terdapat pelbagai bentuk kajian yang menyentuh tentang gejala sosial yang berbentuk kesalahan seksual. Antaranya kajian tentang masalah jenayah rogol [10], melahirkan anak luar nikah [11], sumbang mahram [12], dan seks bebas [13]. Dalam pada itu, terdapat beberapa kajian yang menyentuh tentang gejala sosial menyentuh aktiviti LGBT, antaranya ialah kajian tentang mak nyah [14], LGBT [4] [15], dan transgender [16]. Kajian oleh Ahmad Hassan [17] pula menyentuh tentang gejala pelacuran, Amirul & Nooraini [18] tentang gejala pornografi dan gejala berkait dengan dadah [19].
Melihat kepada pelbagai kajian yang telah dinyatakan, kajian yang menyentuh tentang
peranan undang-undang jenayah syariah yang wujud di setiap negeri-negeri dalam menyelesaikan isu gejala sosial agak kurang dibincangkan. Cuma terdapat beberapa sahaja kajian yang ada menyentuh tentang gejala sosial dan perundangan Islam antaranya kajian oleh Aimini Amir [3] yang menyentuh tentang gejala sosial menurut persepektif Islam. Selain itu, kajian oleh Mohamad Hafifi Hassim & Azizah Mat Rashid [20] bertajuk Analisis Terhadap Peruntukan Kesalahan Tatasusila Dalam Enakmen Jenayah Syariah Di Malaysia yang mana membincangkan tentang aspek perilaku tatasusila yang turut melebatkan gejala sosial dan kaitannya dengan enakmen jenayah syariah. Terdapat juga beberapa kajian lain yang menyentuh tentang gejala sosial dan undang-undang jenayah syariah namun lebih bersifat khusus kepada satu bentuk kesalahan sahaja.
3. GEJALA SOSIAL DARI PERSPEKTIF UNDANG-UNDANG JENAYAH SYARIAH DI MALAYSIA
Perlembagaan Persekutuan telah memperuntukkan bidang kuasa kepada setiap negeri di Malaysia bagi mewujudkan peruntukan undang-undang yang menyentuh tentang hal-ehwal agama Islam. Peranan tersebut berada dibawah bidang kuasa Dewan Undangan Negeri yang meletakkan Sultan sebagai ketua agama Islam bagi negeri Selangor; Johor; Perak; Pahang; Terenggganu; Kelantan; Kedah, Raja bagi negeri Perlis, Yang DiPertuan Besar bagi Negeri Sembilan, dan Yang Dipertuan Agong bagi negeri Melaka; Pulau Pinang; Wilayah Persekutuan
165
Putrajaya; Kuala Lumpur; Labuan; Sabah dan Sarawak. Oleh yang demikian, disetiap negeri tersebut telah diwujudkan suatu enakmen, akta atau ordinan yang menyentuh tentang kesalahan-kesalahan jenayah syariah yang terpakai bagi negeri masing-masing. Pelaksanaan undang-undang jenayah syariah terletak di bawah bidang kuasa Mahkamah Syariah yang terletak di bawah bidang kuasa negeri-negeri selaras dengan Jadual Kesembilan, Senarai II, Senarai Negeri, Perlembagaan Persekutuan dan pelaksanaannya masih berterusan sehingga kini [21].
Kesalahan jenayah syariah di Malaysia merujuk kepada peruntukan berkait dengan hukum jenayah Islam yang berada dibawah bidang kuasa Mahkamah Syariah di negeri-negeri. Tindakan penguatkuasaan pula terletak dibawah bidang kuasa pihak berkuasa agama iaitu Jabatan Agama Islam negeri melalui pegawai penguatkuasa agama (PPA). Bahagian/Jabatan Pendakwaan Negeri pula bertindak sebagai pihak yang akan mendakwa di Mahkamah Syariah [22].
Dengan merujuk kepada Akta Kesalahan Jenayah Syariah (Wilayah Persekutuan) 1997,
terdapat beberapa kesalahan yang dinyatakan dalam akta tersebut terkait secara langsung dengan aktiviti yang disebutkan sebagai gejala sosial.
Jadual 1: Antara kesalahan yang berkait dengan gejala sosial yang terdapat dalam
Akta Kesalahan Jenayah Syariah (Wilayah Persekutuan) 1997 Bil. Seksyen Peruntukan Kesalahan 1. 18 Berjudi 2. 19 Minum minuman yang memabukkan 3. 20 Sumbang Mahram 4. 21 Pelacuran 5. 23 Persetubuhan Luar Nikah 6. 27 Khalwat 7. 28 Orang lelaki berlagak seperti perempuan 8. 29. Perbuatan tidak sopan di tempat awam
Sumber: Akta Kesalahan Jenayah Syariah (Wilayah Persekutuan) 1997.
Berdasarkan kepada jadual 1.0 berikut, sememangnya telah terdapat peruntukan kesalahan yang mana kesalahan tersebut merujuk kepada beberapa perbuatan atau aktiviti yang disebutkan sebagai gejala sosial dalam kalangan masyarakat. Perbuatan berjudi menurut Seksyen 18 akta tersebut menyatakan bahawa mana-mana orang yang berjudi, atau didapati berada dirumah judi adalah melakukan suatu kesalahan. Mereka yang disabitkan bersalah boleh dikenakan hukuman denda tidak melebihiRM3000.00 atau penjara tidak melebihi 2 tahun atau kedua-duanya sekali. Perbuatan berjudi merupakan aktiviti yang boleh membawa kepada ketagihan. Di dalam dunia yang serba canggih, kewujudan media sosial dan internet telah berperanan sebagai medium kepada aktiviti perjudian. Aktiviti berjudi ini semakin berleluasa dalam kalangan masyarakat termasuk remaja dan kanak-kanak seperti kasino, judi online, tapak atau slot, tiket loteri, gores dan menang serta permainan video [23]. Mengambil contoh statistik kesalahan berjudi yang terdapat di Malaysia, Negeri Melaka contohnya telah mencatatkan sejumlah 823 kes sepanjang tahun 2014 hingga 2018 [21]. Hal ini menunjukkan bahawa kesalahan berjudi merupakan suatu gejala sosial yang amat serius dalam kalangan umat Islam.
Pengambilan arak atau segala jenis minuman yang memabukkan merupakan suatu
kesalahan jenayah menurut syariat Islam. Hal ini bagi menjaga maslahah manusia iaitu menjaga
166
akal [24]. Seksyen 19 Akta Kesalahan Jenayah Syariah (Wilayah Persekutuan) 1997 menyatakan bahawa mana-mana orang yang berada dimana-mana kedai atau tempat awam, meminum apa-apa minuman yang memabukkan adalah melakukan kesalahan. Malah perbuatan membuat, menjual, menawarkan, mempamerkan untuk jualan, menyimpan atau membeli minuman yang memabukkan juga merupakan suatu kesalahan. Umumnya di Malaysia, setiap negeri memperuntukkan hukuman denda tidak melebihi RM3000.00 atau hukuman penjara bagi tempoh tidak melebihi 2 tahun atau kedua-duanya sekali. Namun, terdapat juga peruntukan sebatan sebagai hukuman iaitu Pahang, Kelantan dan Perlis [22]. Peruntukan kesalahan ini secara dasarnya merupakan suatu hakikat kepada pencegahan dan larangan dalam Islam terhadap gejala sosial yang diamalkan oleh masyarakat.
Sumbang mahram atau Inses ialah merujuk kepada perbuatan seksual terhadap seseorang
yang dilakukan oleh mereka yang mempunyai pertalian darah, nasab atau mahram kepada mangsa tersebut. Hubungan seksual oleh pasangan yang perkahwinan mereka tidak sah menurut undang-undang atau dilarang oleh agama dan adat resam juga disebut sebagai sumbang mahram [25]. Seksyen 20, AKJS (Wilayah Persekutuan) 1997 menyatakan bahawa mana-mana orang yang melakukan perbuatan sumbang mahram adalah melakukan kesalahan dan boleh dikenakan denda tidak melebihi RM5000.00 atau dipenjara tidak melebihi 3 tahun atau disebat tidak melebihi 6 sebatan atau kombinasi antara hukuman tersebut. Menurut kajian yang dijalankan oleh beberapa pengkaji, kesalahan sumbang mahram ini sering berlaku terhadap golongan muda, tinggal serumah antara mangsa dan pemangsa dan kebanyakan yang dilaporkan berlaku di kawasan luar bandar yang majoritinya berpendapatan rendah. Malah, masyarakat Melayu dan beragama Islam merupakan penyumbang majoriti kepada kes-kes sumbang mahram yang dilaporkan di Malaysia [26]. Gejala sosial sumbang mahram ini merupakan salah satu daripada berjenis-jenis gejala sosial yang selari dengan yang lainnya. Bezanya gejala ini dianggap besar kerana melampaui batas-batas kemanusiaan dan keinsanan samada daripada kacamata manusia mahupun agama [27].
Pelacuran menurut seksyen 21 (1) AKJS (Wilayah Persekutuan) 1997 merujuk kepada
mana-mana perempuan yang melakukan kesalahan melacurkan dirinya. Seksyen 21(2) juga memperuntukkan kesalahan kepada mana-mana orang yang melacurkan isteri atau anak perempuannya, serta menjadi penyebab atau membenarkan isteri atau anaknya melacurkan diri. Kedua-dua perbuataan tersebut jika disabit bersalah boleh dihukum dengan denda tidak melebihi RM5000.00 atau dipenjara tidak melebihi 3 tahun atau disebat tidak melebihi 6 sebatan atau kombinasi antara hukuman tersebut. Aktiviti pelacuran merujuk kepada perbuatan menawarkan perkhidmatan seks haram dengan mendapatkan bayaran [28]. Individu yang melacurkan diri dan individu yang menerima perkhidmatan pelacur ini menurut pandangan syariat adalah melakukan perbuatan zina dan boleh dikenakan hukuman hudud. Kebanyakan negeri-negeri di Malaysia telah memperuntukkan hukuman yang maksimum bagi kesalahan ini. Namun begitu, terdapat halangan dan kesukaran dalam menguatkuasakan kesalahan pelacuran ini bila mana elemen tawar menawar itu sukar untuk dibuktikan pada peringkat pendakwaan [20].
Persetubuhan luar nikah atau dalam istilah bahasa arabnya ialah Zina merujuk kepada
perhubungan seksual antara lelaki dan perempuan yang tidak berada dalam ikatan perkahwinan yang sah menurut undang-undang atau syarak. Merujuk kepada seksyen 23 AKJS (Wilayah Persekutuan) 1997, keadaan seseorang wanita yang hamil tanpa perkahwinan dan yang melahirkan anak dalam tempoh kurang 6 bulan Qamariah dari tarikh pernikahannya juga dirujuk sebagai telah melakukan kesalahan persetubuhan luar nikah. Hukuman yang
167
diperuntukkan bagi kesalahan tersebut ialah didenda tidak melebihi RM5000.00 atau dipenjarakan selama tempoh tidak melebihi tiga tahun atau disebat tidak melebihi enam sebatan atau dihukum dengan mana-mana kombinasi hukuman itu. Gejala sosial yang melibatkan persetubuhan luar nikah ini merupakan suatu kesalahan yang berat dan semakin berleluasa [29]. Malah, kajian menunjukkan bahawa perbuatan intim seperti bercium, berpeluk dan melakukan hubungan seks antara pasangan kekasih semakin menjadi gaya hidup yang dianggap normal dalam masyarakat seterusnya membuktikan bahawa salah laku seksual dalam kalangan masyarakat terutamnya golongan remaja semakin serius [30].
Khalwat menurut Akta Kesalahan Jenayah Syariah (Wilayah Persekutuan) 1997 merujuk
kepada perbuatan mana-mana lelaki yang bersama dengan seorang perempuan atau lebih yang bukan isterinya atau mahramnya atau mana-mana perempuan yang didapati bersama dengan seorang lelaki atau lebih yang bukan suami atau mahramnya. Keberadaan bersama tersebut merujuk kepada dimana-mana tempat yang terselindung atau di dalam rumah atau bilik yang keadaan mereka itu boleh menimbulkan syak bahawa mereka sedang melakukan perbuatan yang tidak bermoral. Perbuatan ini jika disabitkan kesalahan boleh didenda tidak melebihi RM3000.00 atau penjara tidak melebihi 2 tahun atau kedua-duanya. Kajian mendapati bahawa pergaulan bebas antara lelaki dan wanita menjadi punca utama kepada berlakunya perbuatan khalwat [31]. Perbuatan berkhalwat berlaku tanpa mengira golongan umur dan status sama ada berkahwin atau bujang, malah ia telah menjadi suatu isu yang sering diperkatakan sejak tahun 1980 serta menjadi antara kesalahan yang mencatat statistik tertinggi tangkapan oleh pihak berkuasa agama [32].
Terdapat tiga elemen utama yang perlu wujud dalam kesalahan khalwat iaitu pertama,
wujud keadaan berdua-duan atau bersekedudukan di tempat tersembunyi, di dalam rumah atau dalam bilik yang boleh mendatangkan syak; kedua, perbuatan bersekedudukan dengan seorang atau lebih lelaki atau perempuan, sama ada Islam atau tidak; dan ketiga, status mereka yang bersekedudukan itu bukan suami atau isteri, atau mahramnya. Mengambil contoh kes Mohd Ibrahim Bin Mohd. Sharif lwn Pendakwa Syarie Pulau Pinang, tertuduh telah ditangkap atas kesalahan berkhalwat selepas didapati berdua-duan dengan seorang wanita yang bukan mahramnya di dalam sebuah bilik hotel. Selepas mendapati semua elemen telah dipatuhi dan pengakuan bersalah oleh tertuduh, Mahkamah telah menjatuhkan hukuman tiga bulan penjara atau denda RM 2000.00 [33].
Seksyen 28 Akta Kesalahan Jenayah Syariah (Wilayah Persekutuan) 1997 pula
menyatakan tentang kesalahan orang lelaki berlagak seperti perempuan. Akta ini menyebutkan bahawa mana-mana lelaki yang memakai pakaian atau berlagak seperti perempuan di mana-mana tempat awam bagi tujuan yang tidak bermoral, adalah telah melalukan kesalahan dan boleh dikenakan hukuman denda tidak melebihi RM1000.00 atau dipenjarakan tidak melebihi 1 tahun atau kedua-duanya. Perbuatan orang lelaki berlagak seperti perempuan ini dalam bahasa yang mudah difahami sekarang disebut sebagai pondan atau mak nyah. Dalam kajian yang terkini, golongan ini lebih banyak dikaitkan dengan perkembangan gejala LGBT yang semakin sinonim dengan masyarakat semasa. Pelbagai kajian telah dilaksanakan oleh pengkaji lepas yang menyentuh tentang isu ini. Sememangnya, perbuatan pondan atau mak nyak ini telah menjadi gejala sosial dalam kalangan masyarakat sejak lama dahulu, malah terdapat perkembangan yang lebih menakutkan apabila perbuatan menjadi pondan atau mak nyah ini yang dahulunya dibuat secara agak terselindung tetapi kini dilakukan secara terang-terangan sehingga golongan yang seperti ini dikatakan telah membentuk komuniti mereka sendiri dan
168
menjadikan beberapa NGO sebagai sandaran untuk mereka bergerak dan mengembangkan ideologi mereka serta mendapatkan hak dan pengiktirafan [4].
Di setiap negeri secara umumnya telah memperuntukkan kesalahan bagi perbuatan lelaki
berlagak seperti perempuan ini namun dengan beberapa perbezaan tersendiri. Sebagai contohnya, Negeri Melaka melalui Enakmen Kesalahan Jenayah (Negeri Melaka) 1991 masih memberi pengecualian kepada lelaki yang berlagak seperti perempuan dengan alasan yang munasabah. Walaupun begitu, dikesemua negeri secara jelas menyatakan bahawa selagi mana perlakuan itu adalah bagi tujuan yang tidak bermoral maka ia dianggap sebagai satu kesalahan [34]. Terdapat banyak kes yang melibatkan kesalahan ini telah didakwa di Mahkamah Syariah dan antaranya yang paling mendapat perhatian umum ialah kes Mohd Juzaili & Anor lwn Kerajaan Negeri Sembilan yang mana pihak-pihak dalam kes ini telah mengherat kes ini hingga ke peringkat Mahkamah Persekutuan dengan wujud keadaan dimana tertuduh berjaya mencabar validasi peruntukan yang terdapat di dalam enakmen kesalahan jenayah syariah negeri di peringkat Mahkamah Rayuan. Walaupun pada akhirnya Mahkamah Persekutuan telah mengesahkan semula validasi peruntukan enakmen tersebut, namun kejadian tersebut boleh dianggap suatu tamparan hebat tentang risiko yang mampu dibawa oleh golongan ini. [15].
Gejala sosial dalam masyarakat juga merujuk kepada pelbagai perbuatan tidak sopan
ditempat awam. Bagi maksud perbuatan ini, seksyen 29 AKJS (Wilayah Persekutuan) 1997 telah memperuntukkan bahawa mana-mana orang yang bertindak atau berkelakuan tidak sopan yang bertentangan dengan Hukum Syarak dimana-mana tempat awam adalah melakukan kesalahan dengan hukuman denda tidak melebihi RM1000.00 atau penjara tidak melebihi 6 bulan atau kedua-duanya. Perbuatan tidak sopan ini boleh merujuk kepada setiap perbuatan, perilaku atau tindakan yang dibuat oleh manusia sama-ada secara individu atau berpasangan atau berkumpulan, yang mana perbuatan tersebut pada hemat sebagai seorang manusia atau pada pandangan umum masyarakat merupakan perbuatan yang tidak sopan, lucah, berunsur seksual atau bersifat negatif serta perbuatan tersebut dilakukan dimana-mana tempat yang dikategorikan sebagai tempat awam seperti taman permainan, pusat membeli belah, jalan raya atau dalam pengangkutan awam.
Terdapat beberapa kes yang berkait dengan kesalahan ini telah dibicarakan di Mahkamah
yang majoritinya melibatkan pasangan kekasih yang ditangkap berkelakuan tidak sopan ditempat awam seperti bercumbuan, berpelukan, dan berpegang tangan di tepi pantai, taman rekreasi dan air terjun [35]. Statistik menunjukkan terdapat peningkatan tangkapan dan pendakwaan berkait dengan kesalahan ini, contohnya di negeri Johor dari tahun 2012 hingga tahun 2014, Bahagian Penguatkuasaan, Jabatan Agama Islam Negeri Johor telah mencatatkan peningkatan kes bagi kesalahan perbuatan tidak sopan ditempat awam setiap tahun [35]. Berdasarkan kepada peruntukan undang-undang yang ada, tiada sebarang pengecualian dinyatakan berhubung dengan kesalahan ini. Antara kes yang boleh dirujuk ialah kes Fahyu Hanim dan lain-lain iaitu kes berkait dengan kesalahan menyertai pertandingan ratu cantik. Hakim dalam kes berkenaan menyatakan bahawa, sememangnya tidak menjadi kesalahan untuk menyertai pertandingan tersebut, namun apabila peserta perlu memenuhi syarat-syarat pertandingan yang antaranya memerlukan peserta tampil dalam keadaan yang tidak sopan dikhalayak awam, maka sebagai seorang yang beragama Islam ia merupakan suatu kesalahan [36]. Secara keseluruhannya, sememangnya telah terdapat peruntukan kesalahan yang berhubung dengan gejala sosial di dalam akta, enakmen atau ordinan kesalahan jenayah syariah yang terdapat di setiap negeri-negeri di Malaysia. Walaupun terdapat beberapa perbezaan

169
peruntukan di antara negeri-negeri, namun masih secara jelas meletakkan setiap gejala sosial tersebut sebagai suatu kesalahan terhadap orang Islam dalam negara ini.
4. PERANAN UNDANG-UNDANG JENAYAH SYARIAH DALAM ISU GEJALA SOSIAL DAN CADANGAN PENAMBAHBAIKAN TERHADAPNYA
Undang-undang diwujudkan berperanan sebagai usaha untuk mengatur tindakan manusia untuk sentiasa melaksanakan kebaikan dan melarang daripada melakukan kerosakan kepada sesama manusia atau alam sekitar. Setiap undang-undang atau peraturan yang digubal oleh kerajaan atau pemerintah mesti dipatuhi oleh semua masyarakat dalam negara tersebut [37]. Jenayah menurut Islam adalah suatu kesalahan yang mesti dihukum kerana padanya telah berlaku pelanggaran terhadap hak Allah dan hak manusia atau makhluk yang lain. Hal ini kerana Islam meletakkan kedudukan agama, nyawa, akal dan harta dan maruah pada kedudukan yang tinggi dan wajib dipelihara serta pencabulan kepada mana-mana lima perkara tersebut perlu kepada hukuman [38]. Oleh itu, suatu dasar kepada penguatkuasaan undang-undang sedia ada, merangkumi penyediaan fasiliti dan sumber manusia yang mencukupi perlu dilaksanakan bagi memastikan masyarakat Islam sentiasa terjaga dan mereka yang terjebak dengan gejala sosial ini dapat ditangkap, dihukum dan dipulihkan.
Peranan yang dimainkan oleh undang-undang jenayah Islam mencakupi semua perkara dan salah satu daripadanya yang melibatkan soal akhlak dan perilaku manusia. Perilaku dan tindakan seperti berzina, khalwat, berjudi, minum arak dan pelbagai lagi kesalahan tatasusila telah diperuntukkan hukuman yang sesuai. Roh kepada undang-undang jenayah Islam ini ialah menegakkan “prinsip al-amr bil makruf wa al nahyi anil munkar” [38]. Realiti keberadaan undang-undang jenayah syariah di Malaysia dalam bentuknya yang tersendiri pada hari ini yang telah menjangkau lebih 30 tahun, walaupun masih tidak boleh dianggap sempurna, namun dengan kewujudan enakmen kesalahan jenayah syariah, enakmen tatacara jenayah syariah dan enakmen keterangan Mahkamah Syariah, kesemuanya bersifat saling melengkapi antara satu dan lain dalam menegakkan keadilan untuk masyarakat [39]. Maka suatu usaha kepada menyempurnakan undang-undang jenayah syariah diseluruh negeri di Malaysia perlu dilakukan agar menjadi seragam, menyeluruh dan kompeten bagi memastikan pelaksanaanya lebih berkesan.
Dari sudut hukuman yang diperuntukkan, selain daripada hukuman denda, penjara dan sebatan yang dinyatakan dalam akta, enakmen atau ordinan di setiap negeri-negeri, undang-undang jenayah Islam juga telah memperuntukkan beberapa bentuk hukuman alternatif bagi pesalah-pesalah. Hukuman alternatif seperti perintah untuk berkelakuan baik dan pemulihan di pusat pemulihan atau rumah yang diluluskan adalah antara kaedah yang diguna pakai bagi memastikan para pesalah mendapat hukuman yang berbentuk memberi pengejaran, mendidik dan memulihkan [40]. Pendekatan begini adalah sangat sesuai bagi menangani isu-isu gejala sosial yang berlaku dalam masyarakat yang terdiri dalam kalangan pelbagai peringkat umur dan keadaan. Namun tidak semua negeri mempunyai pusat pemulihan bagi tujuan pelaksanaan hukuman tersebut. Maka dicadangkan kepada setiap negeri menyediakan pusat pemulihan akhlak yang lengkap dengan fasiliti dan sumber manusia yang mampu untuk membantu mendidik dan memulihkan semula peribadi dan akhlak pesalah.
Tuntasnya, kajian yang menyeluruh berkait dengan kaedah dan usaha kepada mengatasi
masalah gejala sosial dalam masyarakat perlu sentiasa dilaksanakan oleh pelbagai pihak. Malah usaha membanteras gejala sosial ini perlu dilaksanakan dengan cara yang lebih bersistematik
170
dan berkualiti [3]. Kajian penilaian terhadap keberkesanan program pemulihan sama ada di pusat pemulihan atau selain daripadanya perlu dilaksanakan untuk memastikan bahawa program tersebut benar-benar berkesan dan membuat penambahbaikan terhadapnya. Kerjasama yang erat antara kerajaan, pihak penggubal undang-undang, pihak berkuasa dan masyarakat umum perlu sentiasa diwujudkan bagi memastikan isu-isu yang melibatkan gejala sosial dalam kalangan masyarakat di Malaysia dapat diatasi sebaiknya.
5. KESIMPULAN
Sememangnya isu-isu yang melibatkan gejala sosial dalam kalangan masyarakat ini sukar untuk dibendung secara kesuluruhannya ekoran daripada perubahan sistem kehidupan manusia dan perkembangan teknologi yang mempengaruhi corak kehidupan masyarakat. Pelbagai unsur-unsur negatif yang dibawa oleh masyarakat seluruh dunia sangat mempengaruhi masyarakat terutamanya golongan remaja melalui perkembagan media sosial. Corak kehidupan masyarakat hari ini yang berdepan dengan pelbagai kekangan hidup ekoran daripada tekanan kewangan dan pengaruh sosial, menjadikan mereka mudah untuk terjebak kepada gejala sosial.
Kewujudan undang-undang jenayah syariah sepatutnya menjadi suatu unsur yang sangat penting kepada masyarakat sebagai dinding penghalang kepada mereka daripada terjebak kepada gejala berkenaan. Melalui pelbagai peruntukan kesalahan menyentuh tentang gejala sosial yang terdapat dalam setiap akta, enakmen atau ordinan kesalahan jenayah syariah disetiap negeri, umat Islam seharusnya tidak sama sekali terpalit dengan masalah berkenaan. Namun, kegagalan menghayati undang-undang yang ada, serta pelbagai faktor lain memperlihatkan bagaimana umat Islam tetap terjerumus kepada gejala berkenaan, malah menjadi antara golongan terbesar yang menyumbang kepada isu gejala sosial.
Oleh yang demikian, setiap usaha yang dijalankan bagi memastikan masalah gejala sosial
dalam kalangan masyarakat terutamanya umat Islam perlu sentiasa diperkasakan. Pelbagai kajian dan usaha sama perlu terus dilaksanakan melibatkan pelbagai pihak. Cadangan dan pandangan daripada pelbagai pihak perlu sentiasa ditagih bagi memastikan isu gejala sosial yang semakin meruncing ini dapat diatasi atau sekurang-kurangnya dapat dikawal.
RUJUKAN [1] Z. H. M. Yusoff, "Gejala Sosial Dalam Kalangan Komuniti: Satu Sorotan Dari
Perspektif Wahyu.," Universiti Utara Malaysia., 2004. [2] A. Abdullah, "Tema dan Isu Penyelidikan Mengenai Gejala Sosial pada Dekad Pertama
Abad 21 di Malaysia," Jurnal Akademika, no. (Jan-April), pp. 3-14, 2010. [3] A. A. Abdullah, "Menangani Gejala Sosial Menurut Perspektif Islam," in Islam Yang
Dinamik, Selangor, Penerbit Universiti Putra Malaysia, 2014 , pp. 36-48. [4] M. A. M. I. &. M. S. Nasri, "Gejala Lgbt Di Malaysia: Isu dan Cadangan Penyelesaian,"
Journal of Law & Governance, vol. 2 (1) , pp. 51-65, 2019 . [5] Z. Kausar, "Social Ills and Sexploitation of Woman in Malaysia: Views of Woman
Political Leaders on Causes and Remedies," Universiti Islam Antarabangsa Malaysia, Kuala Lumpur, 2005.
[6] K. M. a. M. H. Rajwani Md. Zain, "Gejala sosial di Malaysia: pendekatan Islam dan peranan pemimpin dalam usaha pencegahan," in 1st International Islamic Heritage Conference (ISHEC) , 11-12 November 2015, 2015.
171
[7] S. N. S. M. H. &. J. M. Syazwana Aziz, "Tingkah Laku Devian Dalam Kalangan Remaja Di Semenanjung Malaysia Berdasarkan Faktor Pemantauan IbuBapa, Komunikasi Ibu Bapa Dan Religiositi," Jurnal Sains Sosial, vol. 4, no. 1, 2019 .
[8] H. Baharom, "Kajian Jenayah Juvana di Pantai Timur," Universiti Teknologi Mara, Shah Alam, 2003.
[9] R. Ismail, "Salah Laku di Kalangan Pelajar Sekolah Menengah: Pengalaman Bersama Keluarga, Rakan Sebaya dan Sekolah," in Negara Pasaran dan Pemodenan Malaysia, Bangi, Universiti Kebangsaan Malaysia, 2000.
[10] T. Y. Koon, "Preventing The Crimes Of Rape Againts Children," Akademika, vol. 57, pp. 87-106, 2000.
[11] Z. Ramlee, "Incest: Its Legal Implication from Islamic Perspective," Universiti Islam Antarabangsa Malaysia, Kuala Lumpur, 2004.
[12] M. Zakaria, "Kajian Mengenai Ciri-Ciri Pelaku dan Mangsa Jenayah Sumbang Mahram di Malaysia," Universiti Teknologi MARA, Shah Alam, 2004.
[13] R. A. B. N. A. S. M. H. F. I. M. S. M. Nasrudin Subhi, "Hubungan Seksual Remaja:Antara Cinta dan Nafsu," Journal of Social Science and Humanities , vol. 7, no. 1, pp. 015-025, 2012.
[14] N. S. M. S. &. K. A. Muhammad Adam Abd. Azid, "Mak Nyah dan Perkembangnnya di Malaysia," RABBANICA, vol. 1, no. 1, pp. e-ISSN: 2756-7893., 2020.
[15] M. S. N. M. H. Y. I. H. J. &. M. N. A. W. Mohamad Afandi Md Ismail, "Isu Lgbt Di Malaysia: Satu Tinjauan Terhadap Aspek Kajian," in International Conference in Syariah and Law (INSLA), Nilai, 2020.
[16] M. I. I. J. &. N. H. M. S. Muhammad Ramzi Zakaria, "Punca Permasalahan Transgender Dalam Kalangan Pelajar Islam di Malaysia," www.academia.edu, Kuala Lumpur, 2020.
[17] A. Hassan, Wanita Kelantan dan Pelacuran: Satu Kes Kajian di Kota Bharu, Kuala Lumpur: Disertasi PhD, Universiti Malaya, 2004.
[18] A. A. N. &. N. Othman, "Ketagihan Pornografi Dalam Kalangan Remaja: Faktor dan Implikasi Terhadap Sahsiah Diri Remaja," Jurnal Melayu, vol. 19, no. 2, pp. 205-216, 2020.
[19] S. P. P. F. H. M. Suppiah Nachiappan, "Penyalahgunaan Dadah dan Langkah Mengatasi dari segi Kognisi di Pusat Pengasih Malaysia," Jurnal Peradaban Melayu, vol. 9, pp. 176-184, 2014.
[20] M. H. H. &. A. M. Rashid., "Hifz Al-Nasb: Analisis Terhadap Peruntukan Kesalahan Tatasusila Dalam Enakmen Jenayah Syariah Di Malaysia," Jurnal Hal Ehwal Islam dan Warisan Selangor, vol. 1, no. 1, pp. 86-98, 2017.
[21] Z. I. Z. &. Z. Nasohah, "Cabaran Pelaksanaan Penguatkuasaan Undang-Undang Jenayah Syariah di Negeri Melaka," Malaysian Journal of Syariah and Law., vol. 17, no. 2, 2019.
[22] S. Z. Ismail, Undang-undang kesalahan Jenayah Syariah di Malaysia, .Kuala Lumpur : Penerbit Universiti Malaya, 2017.
[23] M. H. Johari, A. S. Baharuddin and S. S. Ihwani, "Media Sosial dan Kelestarian Penggunaan Menurut Islam," in Seminar Sains Teknologi dan Manusia, Johor Bharu, 2019.
[24] S. A. Khalil, " Hukuman Bagi Pemandu Mabuk Di Malaysia: Analisis Menurut Perspektif Perundangan Islam," Jurnal Al-Ummah, vol. 2, pp. 73-103, 2020.
[25] S. H. Salleh, "Jabatan Agama Islam Negeri Selangor," 16 Oktober 2018. [Online]. Available: https://www.jais.gov.my/v2/page.php?id=450&k=sumbang%20mahram. [Accessed 5 Jun 2021].

172
[26] S. S. M. S. M. S. S. M. N. Fizwani Sarkawi, Mengenal pasti Punca-Punca dan Kaedah Menangani Tingkah Laku Sumbang Mahram, Kuala Lumpur: Seminar Kaunseling Keluarga, 2008.
[27] K. A. M. A. K. &. M. A. Jasmi, Jenayah Sumbang Mahram: Perkembangan dan Faktor Penyebarannya, Negeri Sembilan: Wacana Pendidikan Islam Peringkat Kebangsaan [Siri Ketiga] at Hotel Alison, 2003.
[28] N. Hussain, Kesalahan Berkaitan Tatasusila Dan Moral Dalam Undang-Undang Kesalahan Jenayah Syariah Malaysia: Satu Analisis. Undang-Undang Islam: Jenayah, Keterangan Dan Prosedur, Kuala Lumpur: Dewan Bahasa Dan Pustaka, 2007.
[29] M. H. H. &. A. M. Rashid, "Hifz Al-Nasb: Analisis Terhadap Peruntukan Kesalahan Tatasusila Dalam Enakmen Jenayah Syariah Di Malaysia," Jurnal Hal Ehwal Islam dan Warisan Selangor, vol. 1, no. 1, 2017.
[30] N. Z. A. &. N. I. Y. 2. Mariam Majid, " Faktor Penglibatan Remaja Dalam Salah Laku Seksual: Kajian Terhadap Remaja Hamil Luar Nikah Di Pusat Pemulihan Akhlak Negeri Selangor," Al-Irsyad: Journal of Islamic and Contemporary Issues, 2019.
[31] Z. K. &. M. N. M. Z. Ainul Bashirah Ismail, "Kesalahan Khalwat dan Perbuatan Tidak Sopan dan Hukumannya Menurut Islam," Jurnal Hadhari, vol. 4, no. 2, pp. 65-88, 2012.
[32] S. N. S. N. M. L. S. M. J. &. N. A. P. Noor ‘Ashikin Hamid, "Khalwat dalam Kalangan Remaja di Malaysia dan Acheh: Kajian terhadap Pematuhan Syariah," Jurnal Undang-Undang Malaysia (KANUN), vol. 27, no. 2, 2015.
[33] Jurnal Hukum, 1999. [34] I. R. M. M. S. M. &. M. A. M. Yuhanza Othman, "Lelaki Berpakain Seperti Perempuan:
Antara Gender Identity Disorder, Undang-Undang Syariah dan Perlembagaan Malaysia," in International Islamic Heritage Conference, Melaka, 2015.
[35] M. A. H. Ibakarim, Hukuman Pemulihan dan Pelaksanaannya Dalam Perundangan Islam Di Negeri Johor, Johor Bharu: Tesis Ijazah Sarjana Falsafah, Universiti Teknologi Malaysia, 2017.
[36] M. A. M. I. Nasri, "The etiquette of athlete attire, violation to domestic law and a view towards International practice.," Journal of Law & Governance, vol. 1, no. 1, pp. 25-35, 2018.
[37] M. Sarbini, Kesediaan Malaysia dalam Pelaksanaan Undang-Undang Jenayah Islam: Kajian Kes ke Atas JKSM., Pulau Pinang: Tesis Ijazah Doktor Falsafah. USM., 2018.
[38] M. F. Yusof, "Kesesuaian Perlaksanaan Undang-Undang Jenayah Islam di Malaysia," in Pelaksanaan Kanun Jenayah Syariah: Teori & Realiti, Selangor, KUIZM Publication, 2014 , pp. 108-132.
[39] S. Z. Ismail, "Hudud dan Undang-Undang Jenayah Syariah dalam Kerangka Perlembagaan dan Sistem Perundangan “Dualisme”: Komitmen Pelaksanaan Ke Arah Membendung Jenayah di Malaysia.," Jurnal Syariah, vol. 22, no. 2, pp. 193-212, 2014.
[40] H. H. &. J. Jamal, "Pelaksanaan Hukuman Alternatif di Mahkamah Syariah: Keperluan Kepada Pemantapan Peruntukan Perundangan dalam Akta/Enakmen Syariah Negeri-Negeri," Journalarticleukm.edu.my, pp. 1-15, 2015.
[42] N. H. &. Norsaleha, "Metodologi Dakwah Terhadap Golongan Lesbian, Gay, Biseksual dan Transgender (LGBT)," Jurnal Pengajian Islam, vol. 9, pp. 103-119, 2016.

173
I-CReST 2021:059-038 – Students’ Readiness, Performance, and Intention to Continue Online Learning during Covid-19 Pandemic
*Siti Ngayesah Ab Hamid, Hafizah Omar Zaki
Faculty of Economics and Management, Universiti Kebangsaan Malaysia, Bangi,
Selangor, Malaysia
*E-mail: [email protected]
ABSTRACT The covid-19 pandemic has affected teaching and learning in various ways. One of the most challenging transformations is the shift from traditional in-class learning to online learning. Without early preparation, students and academicians are forced to teach and learn in front of the screen instead of facing each other in class. This has affected education process in many ways including the pedagogical content, instructional materials, and grading method. Thus, this study investigates students’ readiness, performance and intention to continue learning through online platform during this covid-19 pandemic. 305 usable questionnaires were collected among undergraduate and postgraduate students at the Universiti Kebangsaan Malaysia. Data was analysed using descriptive statistics. The findings in general suggest that students are somewhat ready to study using online platform. Students’ performance are moderate, while the intention to continue online learning is also moderate. The study in general provides understanding on the challenges faced by students in online learning especially in the situation of covid-19 pandemic. Keywords: Online learning; readiness; performance; intention; covid-19 1. INTRODUCTION In December 2019, a spate of pneumonia cases with an unknown source occurred in Wuhan, China. Medical analysis then identified a novel coronavirus as the cause of the disease, initially named as 2019 novel coronavirus (2019-nCoV) [1]. The series of cases however did not stop in Wuhan only. In March 2020, the World Health Organization (WHO) announced the coronavirus which has been renamed as Covid-19 as a pandemic, following the increase in number of cases throughout the world [2]. As of 4th June 2021, 171,782,908 confirmed cases have been reported around the world, with number of deaths nearly 3.7 million [3].
The severity of Covid-19 outbreak has disrupted the global economy and human social activity dramatically. The full and partial lockdown measures taken by most countries in the world to curb the spread of covid-19 has affected normal daily activities, including education. As of 31st May 2021, the suspension of school has affected nearly 203 million learners, including those in the tertiary level [4]. In Malaysia, the resume of school in January 2021 has sparked 83 Covid-19 clusters related to education sector, including 19 clusters with 1,578 cases from the higher education subcategory [5]. Thus, to avoid worsening situation, school students need to return to another round of Teaching and

174
Learning at Home (PdPR), while universities continue their lesson online. The migration from face-to-face learning to full online learning however cause various
challenges, especially since it is done without preparation [6]. The inadequate infrastructure to support online learning, the lack of experience in handling online teaching among lecturers, and the different assessment style between online and offline are among the quoted challenges faced by the institutions [7]. On the other hand, from the students side, the unequal internet infrastructure among states in Malaysia, the lack of flexibility in interaction between students and lecturers and among students itself [7], the lack of motivation and lack of self-discipline [8] are among the constraints need to be faced. However, after more than a year of online studying, a global study indicated that students now prefer online studying if it would enable them to pay lower tuition fees [9].
Several studies have been conducted on the Malaysian student’s readiness to study
online during Covid-19 pandemic [10, 11]. However, most of the study have tried to compare the readiness among different demographic profiles and its effect on satisfaction. Despite the role of readiness in influencing academic performance, lack of study could be found measuring this constructs in the context of Malaysia. Thus, this study attempts to investigate the the level of students’ readiness to study online during the covid-19 pandemic, their academic performance, and their intention to continue online studying.
The remaining parts of this paper are arranged as follows: first, after the introduction
section, review of literatures related to the study is explained. This is then followed by research methodology, data analysis, and end with discussion and conclusion. 2. LITERATURE REVIEW The online learning programme was firstly introduced in Malaysia in the year 1990s [12]. Since then, universities have started using online learning in distance education and blended learning for full-time programme in order to enhance effectiveness of teaching and learning. However, the progress of online learning is considered slow and the receptivity among instructors and learners are not at the full capacity. The Covid-19 outbreak indirectly has accelerated the implementation of online learning at a full capacity [13], which requires various adjustment and adaptation on the lecturers and students part.
In general, online learning could be defined as a form of education characterised by a physical separation between lecturers and students and the application of online platforms to facilitate interactions between parties involved [14]. In the era of Covid-19 pandemic, various online platforms have been used to conduct online classes including Zoom, Microsoft platform and Google Classroom and Webex [15]. The usage of this platforms and other online education portals have enabled online learning to be conducted in two modes either synchronous or asynchronous. The option of asynchronous learning provides flexibility to the students to learn at their own comfortable time and place [16]. Despite this flexibility, learning through online medium requires several ability such as familiarity with the technology, self-discipline in managing time and willingness to interact using online technology [16]. Thus, the following explanation will touch in detail on these factors which could be considered to be related to student readiness.
175
Student Readiness Student readiness refers to the state in which a student is physically, cognitively and emotionally prepared to learn [17]. It is one of the pre-requisites for successful learning including in the online setting [17]. Various studies have been conducted over the years on student readiness through variety of constructs [18]. Among others, scholars have attributed several construct such as self-regulated learning, locus of control, academic self-efficacy, and self-directed learning as among the dimensions of online learning readiness [18]. However, one of the most adapted measures for online learning readiness was developed by Hung, Chou, Chen, and Own (2010), named as Online Learning Readiness Scale (OLRS). Five dimensions were proposed to be the factors that could measure online learning readiness which are self-directed learning, motivation, computer self-efficacy, learner’s control and online communication self-efficacy [19].
Self-directedness refers to a person’s ability to guide and manage their own activity [16]. In the early study, self-directed learning is defined as a process in which individuals try to recognise their learning requirements, develop learning objectives, identify needed resources, deciding and executing the best learning strategies and assessing the learning results [20].
Motivation for learning on the other hand refers to attitude on the students towards online learning which could be divided into two namely internal and external motivation [21]. Internal motivation provides internal push that may have permanent impact on students behaviour while external motivation is caused by external stimuli and could be temporary. External motivation however could change to be internal motivation if it last long [22]. Student that has the motivation to learn through online platform would be able to put an effort to enhance their learning, retain the information and could be able to recall the knowledge when needed [19]. In addition, since the online learning process is delivered through internet network, it is important for students to master the skill of using the technology such as computer and the internet. Thus, computer self-efficacy reflects an individual’s perception on their ability to work with the computer to complete their task which may include the use of software for data analysis [19]. Next, learner’s control in general refers to the students ability to handle their own learning process [23]. Learner’s control is important in online learning since students are given the flexibility to choose which approach suits them, especially in the context of asynchronous learning [19]. Thus, students who are able to direct their own learning is predicted to have a better learning performance [19]. Lastly, as online learning involved computer mediated communication, online communication self-efficacy as such is an important dimension that could overcome the limitations of online communication [19]. Studies shown that a timid and shy students perform better in an online context as compared to the traditional classroom learning situation [24]. Successful students take advantage of the technology to communicate with each other and to participate in class discussion and ask questions. Thus, students with online communication self-efficacy as such is showing a sense of readiness. Performance Students readiness play an impact towards students’ performance. Previous studies have shown that students motivation which is one of the dimension of readiness have an impact on learning achievement [25]. Not only that, the lack of cognitive presence which shows the lack of readiness also could drop learning performance [25]. Student performance has been measured through several ways including in terms of the improvement in problem solving and critical
176
thinking skills [26]. On the other hand, there are also studies that measure learning performance using marks achieved in the assessment [27]. Intention The success of an online learning depends largely on the students intention to continue using it [27]. In general, most of the studies on intention have used several theories including Theory of Planned Behaviour (TPB) , Technology Acceptance Model (TAM) and Unified Theory of Acceptance and Use of Technology (UTAUT) [28]. However, in trying to understand the acceptance of new technology, most studies have emphasis on the importance to understand continuance intention [29]. Thus, in the context of this study, the students intention to continue using online learning is measured. 3. METHODOLOGY Data Collection Data were collected using survey method among the undergraduate and postgraduate students at the Universiti Kebangsaan Malaysia. A non-probability purposive sampling was used to select the respondents. Only students who are attending online classes during the Covid-19 pandemic are eligible to answer the questionnaire.
In order to collect the data, students were asked to answer and submit the questionnaire prepared in Google Form while attending online classes. 350 questionnaires were collected, but only 305 questionnaires were considered usable. The other 45 questionnaires were discarded due to incomplete response and straight lining. Specifically, 68.2% of the respondents are female, 74.1% are currently attending a bachelor’s degree programme and 66.9% are between the age of 18 to 20. Questionnaire Questionnaire used in the study was adapted from Hung et al. (2010), Wei and Chou (2020) and Chiu, Chiu, and Chang (2007). In order to avoid common method variance during data collection stage [31], seven-point Likert scale was used to measure independent variables while five-point Likert scale was used to measure dependent variable. All together, the questionnaire consists of eight sections including a demographic profile section. 4. DATA ANALYSIS The data were analysed using SPSS software version 24. Descriptive statistics were performed to examine the level of students’ readiness, performance and intention to continue studying online. The descriptive statistics show the minimum, maximum and mean of the variables [32], thus reveal the overall level of students readiness, performance and intention. Table 1 indicates the descriptive statistics for each item related to students’ readiness.

177
Table 1: Descriptive Statistics for Student Readiness Constructs/Items N Min Max Mean Std
Deviation Computer Self-Efficacy 305 1.00 7.00 5.26 1.18 I feel confident in performing basic functions of Microsoft Office programmes
305 1.00 7.00 5.31 1.33
I feel confident in my knowledge and skills of how to manage online learning
305 1.00 7.00 4.92 1.51
I feel confident in using the Internet to find information
305 1.00 7.00 5.54 1.26
Motivation 305 1.00 7.00 4.95 1.35 I am open to new ideas when learning online. 305 1.00 7.00 5.21 1.34 I am motivated to do online learning. 305 1.00 7.00 4.65 1.64 While learning online, I learn to improve from my previous mistakes.
305 1.00 7.00 4.98 1.52
I like to share my ideas with my friends while learning online.
305 1.00 7.00 4.98 1.62
Learner’s Control 305 1.00 7.00 4.89 1.33 I can manage my own learning progress while learning online.
305 1.00 7.00 4.87 1.61
I am not distracted by other online social activities (Instagram, FB etc) while learning.
305 1.00 7.00 4.36 1.91
I repeated/replay the online learning materials based on my needs
305 1.00 7.00 5.43 1.37
Self-Directed Learning 305 1.00 7.00 4.96 1.34 I am able to carry out my own study plan while learning online.
305 1.00 7.00 4.88 1.53
I seek assistance when facing learning problems from lecturers and friends.
305 1.00 7.00 5.25 1.45
I manage my time well while learning online. 305 1.00 7.00 4.79 1.70 I set up my personal online learning goals for each lesson.
305 1.00 7.00 4.81 1.52
I have a high expectation for my learning performance.
305 1.00 7.00 5.09 1.50
Online Communication Self-Efficacy 305 1.00 7.00 4.95 1.47 I feel confident in using online tools to communicate with my lecturer and friends.
305 1.00 7.00 4.98 1.55
I feel confident in expressing my thoughts through online text messages/ posting comments in WhatsApp/ Zoom etc.
305 1.00 7.00 4.99 1.57
I feel confident in posting questions in online discussions.
305 1.00 7.00 4.88 1.60
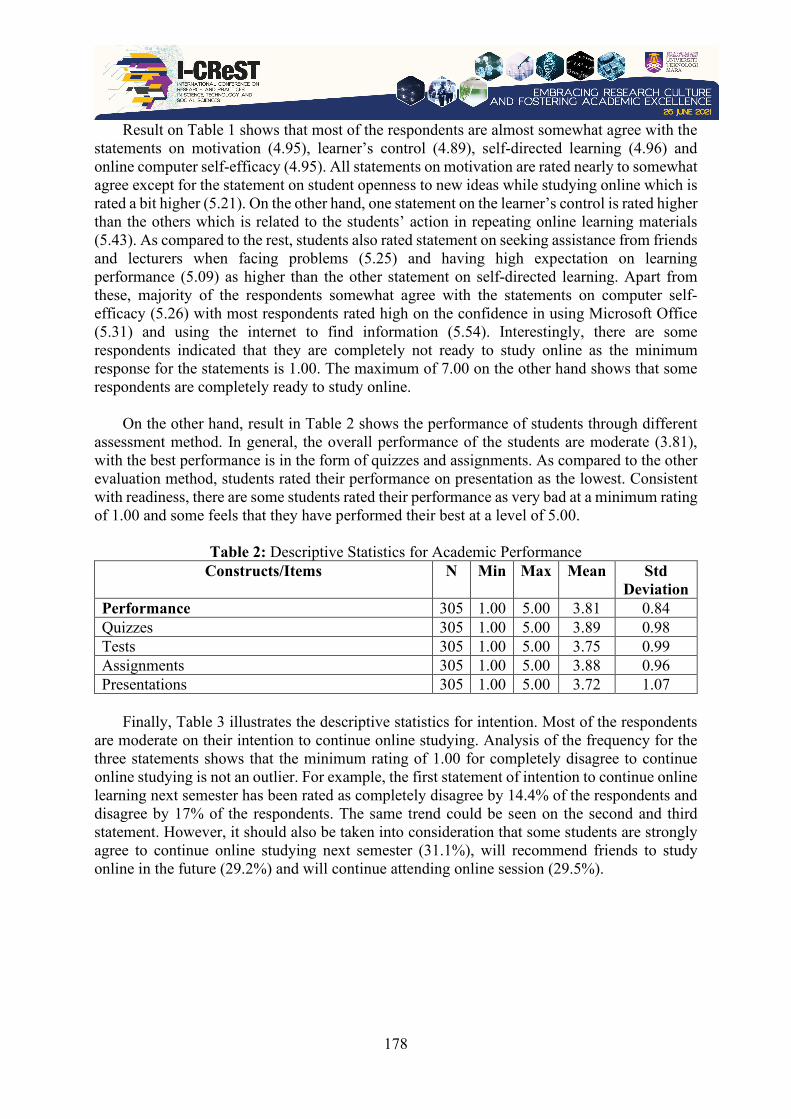
178
Result on Table 1 shows that most of the respondents are almost somewhat agree with the statements on motivation (4.95), learner’s control (4.89), self-directed learning (4.96) and online computer self-efficacy (4.95). All statements on motivation are rated nearly to somewhat agree except for the statement on student openness to new ideas while studying online which is rated a bit higher (5.21). On the other hand, one statement on the learner’s control is rated higher than the others which is related to the students’ action in repeating online learning materials (5.43). As compared to the rest, students also rated statement on seeking assistance from friends and lecturers when facing problems (5.25) and having high expectation on learning performance (5.09) as higher than the other statement on self-directed learning. Apart from these, majority of the respondents somewhat agree with the statements on computer self-efficacy (5.26) with most respondents rated high on the confidence in using Microsoft Office (5.31) and using the internet to find information (5.54). Interestingly, there are some respondents indicated that they are completely not ready to study online as the minimum response for the statements is 1.00. The maximum of 7.00 on the other hand shows that some respondents are completely ready to study online.
On the other hand, result in Table 2 shows the performance of students through different assessment method. In general, the overall performance of the students are moderate (3.81), with the best performance is in the form of quizzes and assignments. As compared to the other evaluation method, students rated their performance on presentation as the lowest. Consistent with readiness, there are some students rated their performance as very bad at a minimum rating of 1.00 and some feels that they have performed their best at a level of 5.00.
Table 2: Descriptive Statistics for Academic Performance
Constructs/Items N Min Max Mean Std Deviation
Performance 305 1.00 5.00 3.81 0.84 Quizzes 305 1.00 5.00 3.89 0.98 Tests 305 1.00 5.00 3.75 0.99 Assignments 305 1.00 5.00 3.88 0.96 Presentations 305 1.00 5.00 3.72 1.07
Finally, Table 3 illustrates the descriptive statistics for intention. Most of the respondents
are moderate on their intention to continue online studying. Analysis of the frequency for the three statements shows that the minimum rating of 1.00 for completely disagree to continue online studying is not an outlier. For example, the first statement of intention to continue online learning next semester has been rated as completely disagree by 14.4% of the respondents and disagree by 17% of the respondents. The same trend could be seen on the second and third statement. However, it should also be taken into consideration that some students are strongly agree to continue online studying next semester (31.1%), will recommend friends to study online in the future (29.2%) and will continue attending online session (29.5%).
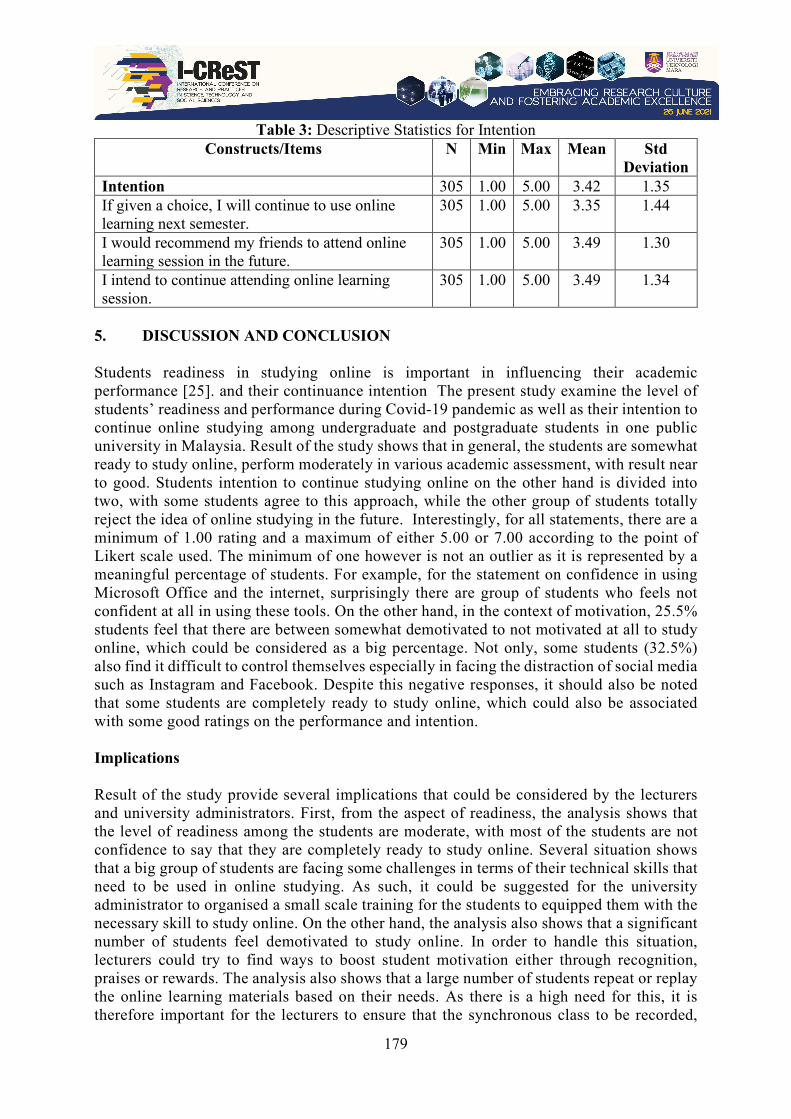
179
Table 3: Descriptive Statistics for Intention Constructs/Items N Min Max Mean Std
Deviation Intention 305 1.00 5.00 3.42 1.35 If given a choice, I will continue to use online learning next semester.
305 1.00 5.00 3.35 1.44
I would recommend my friends to attend online learning session in the future.
305 1.00 5.00 3.49 1.30
I intend to continue attending online learning session.
305 1.00 5.00 3.49 1.34
5. DISCUSSION AND CONCLUSION Students readiness in studying online is important in influencing their academic performance [25]. and their continuance intention The present study examine the level of students’ readiness and performance during Covid-19 pandemic as well as their intention to continue online studying among undergraduate and postgraduate students in one public university in Malaysia. Result of the study shows that in general, the students are somewhat ready to study online, perform moderately in various academic assessment, with result near to good. Students intention to continue studying online on the other hand is divided into two, with some students agree to this approach, while the other group of students totally reject the idea of online studying in the future. Interestingly, for all statements, there are a minimum of 1.00 rating and a maximum of either 5.00 or 7.00 according to the point of Likert scale used. The minimum of one however is not an outlier as it is represented by a meaningful percentage of students. For example, for the statement on confidence in using Microsoft Office and the internet, surprisingly there are group of students who feels not confident at all in using these tools. On the other hand, in the context of motivation, 25.5% students feel that there are between somewhat demotivated to not motivated at all to study online, which could be considered as a big percentage. Not only, some students (32.5%) also find it difficult to control themselves especially in facing the distraction of social media such as Instagram and Facebook. Despite this negative responses, it should also be noted that some students are completely ready to study online, which could also be associated with some good ratings on the performance and intention. Implications Result of the study provide several implications that could be considered by the lecturers and university administrators. First, from the aspect of readiness, the analysis shows that the level of readiness among the students are moderate, with most of the students are not confidence to say that they are completely ready to study online. Several situation shows that a big group of students are facing some challenges in terms of their technical skills that need to be used in online studying. As such, it could be suggested for the university administrator to organised a small scale training for the students to equipped them with the necessary skill to study online. On the other hand, the analysis also shows that a significant number of students feel demotivated to study online. In order to handle this situation, lecturers could try to find ways to boost student motivation either through recognition, praises or rewards. The analysis also shows that a large number of students repeat or replay the online learning materials based on their needs. As there is a high need for this, it is therefore important for the lecturers to ensure that the synchronous class to be recorded,
180
and the recordings could be easily accessible by the students. In addition, it is also important for the lecturers to understand that despite all the challenges, students still have high expectation to perform in this challenging time, thus a high empathy and willingness to assist the students is very important. On the other hand, in order to help students to have a better control on their study and to develop self-directed learning skills, lecturer could help by improving their explanation on the syllabus and course structure, which could help students in establishing their own time and information management [19].
Second, from the aspect of performance, it could be seen that most students perform moderately in the various assessment. The performance however is almost good with mean near to 4.00. Among the various assessments, student seems to be rated a bit low in the aspect of presentation, which may be due to the inflexibility of the online platform. In handling this, lecturers are suggested to open the presentation to the students’ own creativity, by using any tools that could make the presentation more interesting.
Finally, despite some rejection from the students to continue online studying, there are
also a significant number of students who agree to study online in the future. Apart from the various challenges, there are many advantages of online studying including flexibility in terms of time and saving in the cost. Not only that, online learning also allows materials to be replay and revisited, which may not be available in face to face learning. Thus, it is suggested for the university to emphasis on blended learning in the future, with a combination of online and traditional learning.
Limitations and Suggestions for Future Studies There are several limitations of the study. First, a non-probability sampling method was used, which may limit the generalizability of the findings. Second, the measurement on performance is based on students’ own judgment, which may be biased. Third, the study is focusing on the descriptive analysis of the construct only and do not touch anything on the relationship among the constructs which may provide another point of view. Thus, future studies could be conducted using probability sampling method which would allow the findings to be generalise to the whole population. On the other hand, another objective measurement could be used to examine performance such as CGPA or grade for the assessment, which is more reliable. Finally, another study analysing the relationship between construct could be performed to get more meaningful conclusion. REFERENCES [1] Huang, Chaolin, Yeming Wang, Xingwang Li, Lili Ren, Jianping Zhao, Yi Hu, Li Zhang,
Guohui Fan, Jiuyang Xu, Xiaoying Gu, Zhenshun Cheng, Ting Yu, Jiaan Xia, Yuan Wei, Wenjuan Wu, Xuelei Xie, Wen Yin, Hui Li, Min Liu, Yan Xiao, Hong Gao, Li Guo, Jungang Xie, Guangfa Wang, Rongmeng Jiang, Zhancheng Gao, Qi Jin, Jianwei Wang & Bin Cao, Clinical features of patients infected with 2019 novel coronavirus in Wuhan, China. The Lancet. 2020, 395, 497–506. ISSN 1474547X. Dostupné z: doi:10.1016/S0140-6736(20)30183-5
[2] WHO. WHO Director-General’s opening remarks at the media briefing on COVID-19 - 11 March 2020. 2020. Dostupné z: https://www.who.int/director-general/speeches/detail/who-director-general-s-opening-remarks-at-the-media-briefing-
181
on-covid-19---11-march-2020 [3] WHO. WHO Coronavirus (COVID-19) Dashboard .2021. Dostupné
z: https://covid19.who.int/ [4] UNESCO. Education: From disruption to recovery. 2021. Dostupné
z: https://en.unesco.org/covid19/educationresponse [5] BERNAMA. Covid-19: 83 clusters in education sector recorded, 49 still active. The Edge
[online]. 2021. Dostupné z: https://www.theedgemarkets.com/article/covid19-83-clusters-education-sector-recorded-49-still-active
[6] Widodo, Arif, Nursaptini Nursaptini, Setiani Novitasari, Deni Sutisna & Umar Umar. From face-to-face learning to web base learning: How are student readiness? Premiere Educandum : Jurnal Pendidikan Dasar dan Pembelajaran [online]. 2020, 10(2), 149. ISSN 2088-5350. Dostupné z: doi:10.25273/pe.v10i2.6801
[7] Sia, Joseph Kee-ming & Adamu Abbas Adamu. Facing the unknown: pandemic and higher education in Malaysia. Asian Education and Development Studies [online]. 2020. Dostupné z: doi:10.1108/AEDS-05-2020-0114
[8] Lim, Ida. Reality for Malaysia’s university students: Online learning challenges, stress, workload; possible solutions for fully digital future until Dec. Malay Mail [online]. 2020. Dostupné z: https://www.malaymail.com/news/malaysia/2020/05/30/reality-for-malaysias-university-students-online-learning-challenges-stress/1870717
[9] Chegg.Org. Global Student Survey . 2021. https://www.chegg.org/global-student-survey-2021
[10] Chung, Ellen, Norlina Mohamed Noor & Vloreen Nity Mathew. Are You Ready ? An Assessment of Online Learning Readiness among University Students. International Journal of Academic Research in Progressive Education and Development [online]. 2020, 9(1), 301–317.
[11] Abdul-Hamid, Samsiah & Rohani Hamzah. How Ready Were Malaysian Undergraduates for the Sudden Online Classes During the COVID-19 Pandemic? Proceedings of the First International Conference on Science, Technology, Engineering and Industrial Revolution (ICSTEIR 2020) . 2021, 423–430.
[12] Hussin, Husnayati, Fatimah Bunyarit & Ramlah Hussein. Instructional design and e-learning: Examining learners’ perspective in Malaysian institutions of higher learning. Campus-Wide Information Systems [online]. 2009, 26(1), 4–19.
[13] N.A. Embracing online teaching during the pandemic. New Straits Times. 2020. Dostupné z: https://www.nst.com.my/news/nation/2020/11/644079/embracing-online-teaching-during-pandemic
[14] Sah Allam, Siti Nurshahidah, Mohd Sufiean Hassan, Rosilawati Sultan Mohideen, Aini Faezah Ramlan & Rusydi Mohd Kamal. Online Distance Learning Readiness During Covid-19 Outbreak Among Undergraduate Students. International Journal of Academic Research in Business and Social Sciences. 2020, 105(5), 642–657.
[15] Shahzad, Arfan, Rohail Hassan, Adejare Yusuff Aremu, Arsalan Hussain & Rab Nawaz Lodhi. Effects of COVID-19 in E-learning on higher education institution students: the group comparison between male and female. Quality & Quantity. 2021, 55, 805–826.
[16] Joosten, Tanya & Rachel Cusatis. Online Learning Readiness. American Journal of Distance Education [online]. 2020, 34(3), 180–193.
[17] Shrestha, Milan & Rita Dangol. Learning Readiness and Educational Achievement among School Students. Indian Psycology [online]. 2019, 7(2), 468.
[18] Martin, Florence, Brandy Stamper & Claudia Flowers. Examining student perception of readiness for online learning: Importance and confidence. Online Learning Journal [online]. 2020, 24(2), 38–58. ISSN 24725730.

182
[19] Hung, Min-Ling, Chien Chou, Chao-Hsiu Chen & Zang-Yuan Own. Learner readiness for online learning: Scale development and student perceptions. Computers & Education. 2010, 55(3), 1080–1090.
[20] Knowles, M. S. Self-directed learning: A guide for learners and teachers. Associatio. 1975.
[21] Thongsri, Nattaporn, Chalothon Chootong, Orawan Tripak, Piyaporn Piyawanitsatian & Rungtip Saengae. Predicting the determinants of online learning adoption during the COVID-19 outbreak: a two-staged hybrid SEM-neural network approach. Interactive Technology and Smart Education [online]. 2021, ahead-of-p(ahead-of-print). ISSN 1741-5659.
[22] Lepper, M.R. & D.I. Cordova. A desire to be taught: instructional consequences of intrinsic motivation. Motivation and Emotion. 1992, 16(3), 187–208.
[23] Shyu, H. Y. & S. W. Brown. Learner control versus program control in interactive videodisc instruction: what are the effects in procedural learning? International Journal of Instructional Media. 1992, 19(2), 85–95.
[24] Rafique, Ghulam Murtaza, Khalid Mahmood, Nosheen Fatima Warraich & Shafiq Ur Rehman. Readiness for online learning during COVID-19 pandemic : A survey of Pakistani LIS students. The Journal of Academic Librarianship [online]. 2021, 47(3), 102346. ISSN 0099-1333.
[25] Tan, Consilz. The impact of COVID-19 on student motivation, community of inquiry and learning performance. Asian Education and Development Studies [online]. 2020. ISSN 20463170.
[26] Tan, Consilz. The impact of COVID-19 pandemic on student learning performance from the perspectives of community of inquiry [online]. 2020.
[27] Chiu, Chao Min, Chao Sheng Chiu & Hae Ching Chang. Examining the integrated influence of fairness and quality on learners’ satisfaction and Web-based learning continuance intention. Information Systems Journal [online]. 2007, 17(3), 271–287. ISSN 13501917.
[28] Chung, Ellen & Vloreen Nity Mathew. Satisfied with Online Learning Amidst COVID-19, but do you Intend to Continue Using it? International Journal of Academic Research in Progressive Education and Development [online]. 2020, 9(4).
[29] Joo, Y. J., H.-J. So & N. H. Kim. Examination of relationships among students’ self-determination, technology acceptance, satisfaction, and continuance intention to use K-MOOCs. Computers & Education. 2018, 122, 260–272.
[30] Wei, Huei Chuan & Chien Chou. Online learning performance and satisfaction: do perceptions and readiness matter? Distance Education [online]. 2020, 41(1), 48–69. ISSN 14750198.
[31] Podsakoff, Philip M., Scott B. Mackenzie, Jeong Yeon Lee & Nathan P. Podsakoff. Common Method Biases in Behavioral Research: A Critical Review of the Literature and Recommended Remedies. Journal of Applied Psychology [online]. 2003, 88(5), 879–903. ISSN 00219010.
[32] Sekaran, Uma & Roger Bougie. Research methods for business: A skill building approach. 5th edn. West Sussex: John Wiley and Sons, 2009.
183
I-CReST 2021:063-047 – A Systematic Review Analysis on Module Development: Systematic Review Analysis of Module Development in
Technical Teaching and Learning in Technical and Vocational Education Systems
*1Shaiful Hazmir Shaifuddin, 1Dr. Irdayanti Mat Nashir, 2Muhammad Ridzuan Idris
1Faculty of Technical and Vocational Education
2Sultan Idris Education University, Tanjung Malim, Perak, Malaysia
*E-mail: [email protected]
ABSTRACT The issue of module development in teaching and learning needs to be emphasized in ensuring the continuity of achievement of the education system in Malaysia in accordance with the current situation of the country and the world, namely the Covid-19 pandemic situation which has forced educators to diversify teaching and learning methods. The development of modules in teaching and learning is important to ensure student achievement in the course or field being pursued. The systematic development of specific modules is also important for the teaching staff in ensuring that the teaching and learning process takes place at the best level. Therefore, this research article aims to analyze the relevant literature on issues related to the importance of module development in teaching and learning systems. Thus, the search effort produced a total of 15 articles that will be systematically analyzed. This study successfully summarizes the importance of module development in ensuring the continuity of the teaching and learning process which in turn will affect student achievement. Finally, some suggestions and views are presented at the end of this research for the reference of future scholars. Keywords: module development; teaching and learning; teaching staff; student achievement 1. INTRODUCTION The systematic development of specific modules for these students is very necessary to ensure that the teaching and learning process can be implemented effectively and efficiently. This is to show that the development of this module has an effect as a teaching aid that is needed among students. Equipment facilities, teaching aids and modules need to be provided so that challenges in the teaching and learning of subjects can be overcome. Therefore, a study on the development of this module should be developed to ensure that the teaching and learning process is enhanced and further improve students' understanding and achievement (Ahmad, Minghat, Nasir, Buntat, Kamin & Latib, 2017).
Module development is a learning approach that can engage students through a more systematic comprehension process. In line with the need for modules to students in the current era of education, in stimulating students towards the teaching and learning process takes place. A review of the literature based on theory and past studies found that the module -based learning approach in the classroom ensures that the teaching and learning process takes place more
184
seamlessly in ensuring student achievement. The teaching and learning process based on this module is more interesting and effective because this approach will give more effectiveness to the process of development and student performance. The findings from previous studies give a positive perspective to the research paper in the effect of module development on student achievement and the teaching and learning process by the teaching staff. 2. MODULE DEVELOPMENT IN TEACHING AND LEARNING Methodology Systematic literature review has been recognized as a popular method in research for over a decade. In recent years, searches are often searched on "Google Scholar" and "Scopus", such methods are becoming popular in Malaysia, as more researchers are able to use them in conducting and finding suitable research materials. A systematic literature review is an approach that involves identifying, reviewing documents relevant to a research question, analyzing and summarizing using systematic methods to select and critically evaluate relevant research (Pettigrew and Roberts, 2006; Cochrane Collaboration, 2008). Scholars have consistently emphasized the use of systematic surveys because it will provide space to justify their research, in particular studies that can be made in order to identify gaps and clues for future research.
This study was conducted by looking for previous studies to conduct the entire systematic review process; eligibility and exclusion criteria, procedures involved (identification, inspection, and eligibility) and data collection and analysis. In general, this study is designed in the context of Malaysia, an upper middle-income country that has high ambitions to compete with other developed countries.
The survey method of this study was conducted by using Google Scholar as the main journal database. Google Scholar is among the well-known and favourite database platforms of researchers, having the largest database of abstracts and citations of literature reviewed with more than tens of thousands of journals from thousands of publishers around the world. The database from Google Scholar spans from a variety of fields such as social sciences, education, environmental sciences, agriculture, biological sciences and more.
There are several stages involved in the systematic review process. The first stage is to identify the keywords used in the search process. Based on previous studies and thesauruses, similar and relevant keywords related to module development were used. Specifically, the keywords used in this study in a search on Google Scholar were: (teaching aids in OR teaching OR and OR learning AND “module development”).
For the first process, 195 articles were found from the search database. The term is broad enough to track the most appropriate articles, and at the same time successfully remove the least appropriate articles. In the second stage, several eligibility and exemption criteria were determined. For the term, a period of 10 years was chosen (between 2011 and 2020).
The remaining articles were evaluated and analyzed. Efforts are focused on specific studies that respond to those studies. Data were extracted by reading the abstract first, then the complete (in-depth) article to identify appropriate themes and subthemes. In the end, an

185
exclusion process was applied to the articles that had been obtained by selecting the most appropriate articles to be involved in this systematic literature review study.
Figure 1: Search process 3. RESULTS OF THE STUDY Past studies related to module development have been explored to further strengthen the meaningful search to this research. Findings from previous studies involved in this systematic literature review study are among those that describe that many researchers found the need for teachers to deliver teaching actively and creatively to achieve teaching objectives, however not necessarily many consider the effectiveness of module development on student achievement.
A study conducted by Ahmad & Halim (2019) concluded that the development of Teaching Aids (ABM) in the process of Teaching and Learning (PdP) can help students to achieve the Learning Outcome Program (PLO) as set out in the curriculum. The findings of the questionnaire conducted found that the innovations developed meet the needs of the teaching process and achieve the mastery of students' skills. The PdP process with the variety of uses of ABM makes it easier for students to tend to remember things through tactile and visual stimuli. Through the activities performed, students are easier to remember because they see for themselves the process carried out. This study also states that the use of ABM in the PdP process is effective in enhancing students understanding of various aspects. The effect of module development was found in a study conducted by Arbaa, Jamil & Ahmad (2017), the findings of their study which indicate that teachers need to have methods that are appropriate to the inclinations and needs of students in the teaching and learning sessions conducted by the teacher or instructor. Therefore, as a lecturer who implements a PdP session, the need for students to achieve the results of the teaching session is important. The variety of methods and also the use of ABM in PdP sessions is necessary if there are weaknesses and also improvements from the existing needs to ensure students achieve results from PdP sessions.
Records are retrieved using a database
(Google Scholar) (n = 195)
Retains 50 articles after abstract reading
Total records after reading the full text
(n = 15) Removed 35 articles with
unrelated fields
186
The impact in module development has also been detailed in a study conducted to help teachers who teach the subject of Automotive Technology by Mukhari & Naharuddin (2011). The study found that Automotive Technology is a field that requires high research and skills in producing students who have high potential to enter the job market in the automotive field. The study can see the content of books used in the subject of Automotive Technology in all Technical and Vocational schools in Malaysia are still considered backward. This is because the content in the book is still using the methods and also the description is quite old and outdated in terms of technology. Teachers also had to find other methods in ensuring that students were not left behind with the use of new technologies. The findings of the study show that the development of Automotive Technology contributes to the development of learning. This study is aimed at developing an interactive multimedia software for Anti-Lock Brake System (ABS), where the need of this development is to help improve students ’knowledge of ABS system. Information on ABS in reference books supplied in schools is very limited and the need to obtain information on ABS systems must be in line with the development of the automotive world today.
The importance of module development to students can be proven further in a study
conducted by Ahmad, Rajuddin, Kamin, Udin, Minghat & Cartledge (2014) on Vocational School students in Malaysia showed weak students in automotive subjects, this is because students still ask about a vehicle system problem at the end of the learning session. This happens because students need to be influenced by the real and up -to -date work environment. Students continue to be weak because the learning sessions still use traditional methods and do not use the latest methods according to the passage of time. This problem continues to exist because vocational students have different characteristics compared to other fields. Studies also show that only teachers play an important role in providing an engaging teaching and learning environment. Equipment facilities, teaching aids and modules need to be provided so that the challenges in the teaching and learning of this Automotive subject can be overcome and this led to the study of module development for this Automotive topic becoming a necessity in ensuring that the teaching and learning process is enhanced and in turn enhances student understanding and achievement.
The importance of module development in technical teaching and learning conducted by
Ahmad, Minghat, Nasir, Buntat, Kamin & Latib (2017) to students and teachers of Vocational Colleges in Malaysia who discussed the analysis based on interview sessions in the teaching of Automotive Practical Work for Vocational Colleges. Six teachers specializing in Automotive were interviewed and three key themes were discussed to analyze teacher feedback. The interviews were categorized into three main themes of teaching methods namely: introduction, content and conclusion. In discussions of how to begin their teaching, teachers prefer to use demonstration, sketching and questioning techniques in the introduction. They choose demonstrations, question and answer, problem -solving and problem -solving approaches while teaching the content or content of Automotive Practical Work. At the end of the teaching session the teacher prefers to summarize the topic and ask the students to write a report. All teachers agreed that they were unable to deliver in a variety of creative teaching methods or methods due to time constraints, as students had to complete the task within two hours. But from the answers in practical teaching, some teachers give students other problems and let students solve them with their creativity. To increase students ’knowledge and give them the opportunity to explore current situations of automotive development in reflection and conclusion sessions, respondents were asked how they motivate students in a particular way. In short, teachers apply teaching methods based on what the curriculum requires and the needs of students based on the
187
level of difficulty in a given task. The importance of module development in technical teaching and learning is also
emphasized in the study Suyitno, Jatmoko, Ardiansyah & Anitasar (2018). A study was conducted on students of Yani Gebang Purworejo vocational school in Indonesia who found that learning modules shape students' interest in the subjects studied. In showing the effect of the importance of the module on the teaching aspect, Ren (2019) has conducted a study on university students in China. In the study stated that the problems arose as a result of the old ways in teaching that did not use modules. To enhance the teaching effect in the field of Automotive Engineering, modular teaching methods are proposed to enhance the teaching effect and student performance. To improve the ability of students in the field of Automotive Engineering, this study proposes a deep modular teaching method to ensure optimal achievement to the teaching effect. The findings of Kong's study (2019), showed that the level of mastery of cognitive domains and teaching strategies in High-Level Thinking Skills (KBAT) technical teachers was weak and there was a moderately significant positive relationship between cognitive domains and teaching strategies in KBAT technical teachers. The results of the study also show that the modules of cognitive domain integration and teaching strategies in KBAT are suitable in terms of design, content and can be used by technical teachers. In conclusion, it is found that the implications of this integration module can contribute as reading material to technical teachers to apply KBAT in teaching and learning.
The importance of the development of this module according to the study conducted by
Harun & Abidin (2020) found that the module is an example of a learning material that has been adopted for a long time. Although it is considered obsolete and accepts the competition of electronic media, but its use is still needed and considered important in the teaching and learning process. Module learning has long been introduced but learning through interactive video media with the help of computer technology has not been widely practiced. Computer -assisted learning gives a new dimension in the world of education because it is interesting and fun. The combination of learning modules and interactive videos is seen to have a more positive impact on the learning process. Through the evaluation of the research that has been done, it is found that the combination of learning modules and interactive videos are able to increase students' understanding and give an impact in students' mastery of the applications developed.
The effectiveness of module development in technical teaching and learning in technical
and vocational education systems is further evidenced in a study conducted by Husin, Ahmad & Mansor (2019). This study aims to develop an interactive module system that can be used to explore and build a checklist of teacher’s self-measurement of significant learning content in students daily lives and jobs in the future. The purpose of this interactive module system developed is to contribute to teachers in selecting appropriate learning content for teaching. The built -in interactive module system also benefits students when the learning that takes place is centred on content and skills that can be used all the time. Respondents stated that the use of interactive module system developed is very good and effective, the interface of the developed system is attractive to users, the usability of the developed system is very helpful to teachers and students, the navigation of the developed system is user friendly and respondents were satisfied with the modules developed. The effectiveness of module development can also be found in the study Arshad & Ching (2017) which states that from the findings of the study shows that the conventional teaching methods practiced by most teachers fail to attract the interest of children in the process of early learning to read. In conclusion shows that teachers need teaching aids that are suitable for children's development with affordable temporary
188
support. The teaching elements that need to be included in the initial reading module involve phonics teaching, temporary support and authentic assessment instruments. The implication is that modules should be constructed to enhance student’s mastery.
The effectiveness of module development in teaching and learning is further evidenced
from the results of analysis in the study data Suraji, Ahmad & Awang (2016) which generally contains 5 themes, namely (1) Teaching and learning activities based on the play approach are very suitable for preschool children, (2) Teaching while teachers are less focused on the play approach, (3) Teachers need appropriate resources and materials to stimulate interest in learning the basics of the humanities, (4) Teaching and learning activities should take into account the child's existing experience and (5) Meaningful and enjoyable teaching should stimulate the child's various senses. The findings of the study show that the teaching and learning modules based on the play approach are able to develop the true potential of children. The effectiveness of the development of this module was also emphasized in the study conducted by Saad, Sharif & Mariappan (2018). The topic of cell respiration contains abstract concepts and facts and requires different approaches in the learning process to enable students to relate abstract concepts in the form of a comprehensive understanding. This allows students to improve their achievement in this topic which in turn can increase students' motivation in continuing the learning process of cellular respiration. Researchers have developed game-based robot learning materials in the form of modules that not only serve as a platform to improve achievement but also 21st century skills and student motivation. This learning module will provide a conceptual model for learning to minimize the need for conventional learning techniques that are verbal in nature especially in the topic of cellular respiration.
The effectiveness of the development of this module is also evidenced from the results of
the study Heong, Sharberi, Bakar, Chin & Mohamad (2020) which states Inventive Problem-Solving theory (TRIZ) is a problem-solving method that can be used in Problem Based Learning (PBL). Their study aimed to produce a learning module to integrate TRIZ in an integrated manner into the PBL. Learning modules are techniques that allow teaching and learning to be done individually. Students can take each unit step by step. Their study also identified the suitability of the format, content and usability of the TRIZ integration module in PBL in depth. Based on the findings of the study showed the majority of lecturers and students agreed that the format and content of the TRIZ integration learning module is appropriate and can be used in PBL. It can be concluded that the modules developed can be used as a reference source for lecturers and students to solve inventive problems and PBL during the teaching and learning process.
The effectiveness of module development in technical teaching and learning in technical
and vocational education systems is evidenced in the results of the study Jamion, Salleh & Hussin (2020). The study implemented was to develop a GIMP software module that considers the various learning styles of students. The development of the GIMP module is to facilitate teachers and students to conduct teaching and learning sessions in the context of the creation of the Contemporary Art Era of Form three students by using the GIMP software module. Module development can assist students in their exploratory activities to produce digital drawing techniques. The findings of the study showed that the students showed a very positive attitude and the students were able to use the module without the help of the teacher. The learning sessions in the classroom were fun and smooth. Basically 21st century learning classes have been achieved. It is hoped that this learning module can help teachers as well as increase students' understanding of digital drawing techniques of Form 3 students. Students can also
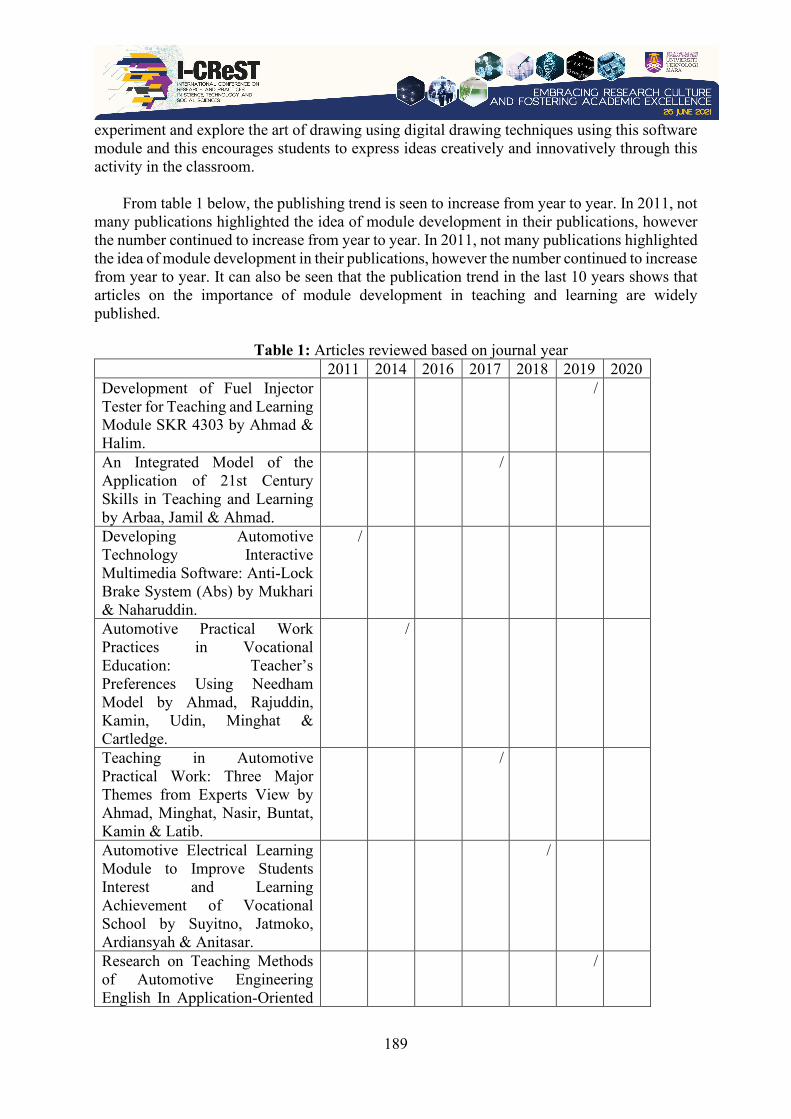
189
experiment and explore the art of drawing using digital drawing techniques using this software module and this encourages students to express ideas creatively and innovatively through this activity in the classroom.
From table 1 below, the publishing trend is seen to increase from year to year. In 2011, not
many publications highlighted the idea of module development in their publications, however the number continued to increase from year to year. In 2011, not many publications highlighted the idea of module development in their publications, however the number continued to increase from year to year. It can also be seen that the publication trend in the last 10 years shows that articles on the importance of module development in teaching and learning are widely published.
Table 1: Articles reviewed based on journal year
2011 2014 2016 2017 2018 2019 2020 Development of Fuel Injector Tester for Teaching and Learning Module SKR 4303 by Ahmad & Halim.
/
An Integrated Model of the Application of 21st Century Skills in Teaching and Learning by Arbaa, Jamil & Ahmad.
/
Developing Automotive Technology Interactive Multimedia Software: Anti-Lock Brake System (Abs) by Mukhari & Naharuddin.
/
Automotive Practical Work Practices in Vocational Education: Teacher’s Preferences Using Needham Model by Ahmad, Rajuddin, Kamin, Udin, Minghat & Cartledge.
/
Teaching in Automotive Practical Work: Three Major Themes from Experts View by Ahmad, Minghat, Nasir, Buntat, Kamin & Latib.
/
Automotive Electrical Learning Module to Improve Students Interest and Learning Achievement of Vocational School by Suyitno, Jatmoko, Ardiansyah & Anitasar.
/
Research on Teaching Methods of Automotive Engineering English In Application-Oriented
/

190
Universities by Ren. Development of Cognitive Domain Integration Module and Teaching Strategies in Higher Order Thinking Skills of Technical Teachers by Kong.
/
Development of Interactive Video Aided Learning Module for Visual Basic Programming Learning Based on Project Approach by Harun & Abidin.
/
Development of an Interactive Module of Teachers' Self -Measurement on the Level of Daily Use of Lesson Content by Husin, Ahmad & Mansor.
/
Reassessment of teaching and learning in early reading by Arshad & Ching.
/
Historical Literacy in the Education of Preschool Children: A Needs Analysis of a Humanities Teaching and Learning Module Based on a Learning Through Play Approach by Suraji, Ahmad & Awang.
/
Development of a Game Robot Module on the topic of Cell Respiration using the ADDIE Model by Saad, Sharif & Mariappan.
/
Triz Module Development by Trimming for Problem Based Learning by Heong, Sharberi, Bakar, Chin & Mohamad.
/
Construction of Form 3 Digital Drawing Techniques Learning Module by Jamion, Salleh & Hussin.
/
Of the 195 total articles that were found, a total of 15 research articles were reviewed in a
systematic review analysis of the development of this module. The list of publications and analysis can be found in Table 2.
It can be concluded that from Table 2 which shows that the development of modules in
teaching and learning affects the teaching and learning process conducted by the teaching staff and at the same time the development of this module affects student achievement.

191
Table 2: Documents to analysis table Impact on the teaching
and learning process by educators
Impact on student achievement
Ahmad & Halim (2019) / / Arbaa, Jamil & Ahmad (2017) / / Mukhari & Naharuddin (2011) / / Ahmad, Rajuddin, Kamin, Udin, Minghat, & Cartledge (2014)
/ /
Ahmad, Minghat, Nasir, Buntat, Kamin & Latib (2017)
/ /
Suyitno, Jatmoko, Ardiansyah & Anitasar (2018)
/ /
Ren (2019) / / Kong (2019) / / Harun & Abidin (2020) / / Husin, Ahmad & Mansor (2019) / / Arshad & Ching (2017) / / Suraji, Ahmad & Awang (2016) / / Saad, Sharif & Mariappan (2018) / / Heong, Sharberi, Bakar, Chin & Mohamad (2020)
/ /
Jamion, Salleh & Hussin (2020) / /
4. DISCUSSION
Studies conducted related to the development of modules in teaching and learning are becoming increasingly common nowadays. This indicates that researchers are aware of the importance of this matter in the future. Therefore, module development is a learning approach that can attract students through a more systematic understanding process. In line with the need for modules to students in the current era of education, in stimulating students towards the teaching and learning process takes place. A review of the literature of previous studies found that the module-based learning approach in the classroom ensures that the teaching and learning process takes place more seamlessly in ensuring student achievement. The teaching and learning process based on this module is more interesting and effective because this approach will give more effectiveness to the process of development and student performance. The findings from previous studies give a positive view to the study of the impact of module development and this systematic literature review.
In ensuring that the teaching and learning system in this new era of norms runs in line with the rapid advancement of the latest technology, the development of modules in the education system needs to be enhanced. This is to ensure that education continues to happen to every layer of society no matter what the situation. This is to ensure that the lessons can be enjoyed together by all whether urban or rural. No matter rich or poor, teaching and learning must continue to take place not recognizing the socio-economic gaps of life. This is to ensure the continuity of the development of education in Malaysia, which in turn affects the overall development of society in Malaysia.
192
The development of modules in teaching and learning not only affects student achievement but it also affects the process that will be carried out by the teaching staff. The delivery methods and methods used by the instructors play a considerable role for the teaching and learning process (PdP) of the students. The PdP process does not only depend on available information, in fact it is necessary to be creative with activities and materials to produce innovation for students to gain experience after the session is implemented (Blândul, 2014). Therefore, the results shown by students at the end of the course that is knowledge, skills, abilities, values and attitudes do not depend on the educational process alone but it also depends on the curriculum and approach implemented.
5. CONCLUSION The teaching and learning process with the variety of uses of Teaching Aids (ABM) makes it easier for students to tend to remember things through tactile and visual stimulation methods. Students are easier to remember because they see for themselves the process carried out through the activities implemented. The use of ABM in the teaching and learning process is very effective in enhancing students' understanding of various aspects. The study of the effectiveness of the development of this module also shows that the teaching staff should have methods that are appropriate to the inclinations and needs of students in the teaching and learning sessions conducted. Therefore, as a lecturer who implements a teaching and learning session, the need for students to achieve the results of the teaching session is very important. The variety of methods and also the use of ABM in teaching and learning sessions is necessary if there are weaknesses and also improvements from the existing needs to ensure that students achieve results from teaching and learning sessions (Ahmad & Halim, 2019).
The effectiveness of module development in technical teaching and learning in technical and vocational education systems is evidenced in the findings of previous studies on the importance of module development has greatly contributed to the development of this systematic literature review study. Based on the findings of the issues and problem statements, researchers feel that this study is very important to be implemented because it is an added value in the field of education especially to the development and continuity of Technical and Vocational Education in Malaysia. ACKNOWLEDGEMENT Thanks for those who are involve in this Systematic Review Analysis paper. May all of us who are contribute to this paper have a long life in a good deed. REFERENCES Ahmad, A., Minghat, A. D., Nasir, A. N. M., Buntat, Y., Kamin, Y., & Latib, A. A. (2017). Teaching in Automotive Practical Work: Three Major Themes from Experts View. Advanced Science Letters, 23(1), 679-683. Ahmad, A., Rajuddin, M. R., Kamin, Y., Udin, A., Minghat, H. D., & Cartledge, D. (2014). Automotive Practical Work Practices in Vocational Education: Teacher’s Preferences Using Needham Model. Sains Humanika, 2(4).
193
Ahmad, M. J. B., & Halim, M. N. B. A. (2019). PEMBANGUNAN FUEL INJECTOR TESTER UNTUK PENGAJARAN DAN PEMBELAJARAN MODUL SKR 4303. Journal on Technical and Vocational Education, 4(1), 51-60. Arbaa, R., Jamil, H., & Ahmad, M. Z. (2017). Model Bersepadu Penerapan Kemahiran Abad Ke-21 dalam Pengajaran dan Pembelajaran (Integrated Model of Infusing 21st Century Skills in Teaching and Learning). Jurnal Pendidikan Malaysia (Malaysian Journal of Education), 42(1), 1-11. Arshad, M., & Ching, C. S. (2017). Penilaian semula pengajaran dan pembelajaran dalam pembacaan awal. Jurnal Pendidikan Awal Kanak-Kanak Kebangsaan, 6, 79-86. Blândul, V. C. (2014). New Curricular Approaches in the Pre-academic Learning System from Bihor County, Romania. Procedia-Social and Behavioral Sciences, 159, 248-253. Harun, J., & Abidin, S. N. M. Z. Pembangunan Modul Pembelajaran Berbantukan Video Interaktif Bagi Pembelajaran Pengaturcaraan Visual Basic Berdasarkan Pendekatan Projek. Heong, Y. M., Sharberi, S. N. M., Bakar, N. A., Chin, K. B., & Mohamad, M. M. (2020). Pembangunan Modul Triz Secara Pencantasan untuk Pembelajaran Berasaskan Masalah. Online Journal for TVET Practitioners, 5(2), 12-19. Husin, M. R., Ahmad, H., & Mansor, M. S. F. M. (2019). Pembangunan Modul Interaktif Pengukuran Kendiri Guru Terhadap Tahap Kegunaan Harian Kandungan Pelajaran. Journal of ICT in Education, 6, 58-65. Jamion, F. N. M., Salleh, N. S. M., & Hussin, R. H. (2020). Pembinaan Modul Pembelajaran Teknik Lukisan Digital Tingkatan 3. Journal of Applied Arts, 2(1), 141-145. Kong, H. P. (2019). Pembangunan modul pengintegrasian domain kognitif dan strategi pengajaran dalam kemahiran berfikir aras tinggi guru teknikal (Doctoral dissertation, Universiti Tun Hussein Onn Malaysia). Mukhari¹, A. W., & Naharuddin, M. F. (2011). Membangunkan Perisian Multimedia Interaktif Teknologi Automotif: Anti-Lock Brake System (ABS). Journal of Technical, Vocational & Engineering Education, 4, 38-57. Okoli, C., & Schabram, K. (2010). A guide to conducting a systematic literature review of information systems research. Ren, C. (2019, April). Research on Teaching Methods of Automotive Engineering English in Application-oriented Universities. In 1st International Symposium on Education, Culture and Social Sciences (ECSS 2019). Atlantis Press. Saad, M. S., Sharif, S., & Mariappan, M. (2018). Pembangunan Modul Robot Permainan topik Respirasi Sel menggunakan Model ADDIE. Jurnal Pendidikan Sains Dan Matematik Malaysia, 8(1), 55-73. Suraji, S. B., Ahmad, A. R., & Awang, M. M. (2016, January). Literasi Sejarah dalam

194
Pendidikan Kanak-kanak Prasekolah: Satu Analisis Keperluan Terhadap Modul Pengajaran dan Pembelajaran Tunjang Kemanusiaan Berasaskan Pendekatan Belajar Melalui Bermain. In Proceeding 7th International Seminar on Regional Education (Vol. 1, pp. 446-456). Suyitno, S., Jatmoko, D., Ardiansyah, N., & Anitasar, M. (2018). Automotive Electrical Learning Module to Improve Students Interest and Learning Achievement of Vocational School. In Proceedings of the 1st International Conference on Science and Technology for an Internet of Things. European Alliance for Innovation (EAI).
195
I-CReST 2021:101-092 – Rights of Education: Review of the Conditions of Students in Learning amid the Covid-19 Pandemic
*Ainul Mardhiyyah binti Tajudin, Fareez Junaidy bin Mohd Junus
Centre of Foundation Studies, Universiti Teknologi MARA, Cawangan Selangor, Kampus
Dengkil, 43800 Dengkil, Selangor, Malaysia
*E-mail: [email protected]
ABSTRACT The Covid-19 pandemic is wreaking havoc on Malaysians’ lives in numerous different ways. Since the World Health Organization (WHO) declared that this virus was a Public Health Emergency of International Concern back on the 30th of January 2020, citizens across the country had suffered tremendously. The virus has impacted society horrendously, nearly every sector has gone downhill since the declaration by WHO. Predominantly, it left a gargantuan impact on the education sector. It has resulted in the closure of nearly every educational institution and suspended formal classroom learning for millions of students ranging from pre-, primary, secondary and tertiary education. Consequently, a new method of learning is adopted in order to adapt to this new norm. The method of online learning or more commonly known as “Open Distance Learning (ODL)” has transformed the way we observe our entire educational system. Nevertheless, it remains a flawed method as students' conditions are often neglected and overlooked. Thus, the purpose of this paper is to study and discover the conditions of students in learning amid the Covid-19 pandemic in Malaysia. It further seeks to provide solutions and initiatives to improve and enhance their condition in order to fulfil their rights of education. This research is based on a doctrinal basis. It is qualitative in nature and uses published data, reports, researches, articles and case studies as its sources. This paper concludes that ODL had many detrimental effects on the students’ and the authors further provided measures to curb those effects. Keywords: Covid-19; Education; Open Distance Learning; Students; Malaysia 1. BACKGROUND OF THE RESEARCH Education is vital for the progression of human civilization. It brings many benefits to the one who seeks it. Many major problems could be solved through the pursuit of education such as ending the vicious cycle of poverty, developing critical thinking skills, increasing productivity and the list goes on. However, more than 4.9 million students in Malaysia had been affected due to the new method of learning in this Covid-19 era and their conditions are often forsaken [1]. This could leave a drastic impact on their journey of educational attainment.
Thus, the authors felt it is their responsibility to shed some light on what these students are currently going through. This paper aims to study and discover the conditions of students in learning amid the Covid-19 pandemic in Malaysia. It further seeks to provide solutions and initiatives to improve and enhance their condition so as to properly give due to their inherent right to education.
196
This paper begins by defining the method of learning that is used in this Covid-19
era which is “Open Distance Learning” or ODL – henceforth will be used interchangeably. It is a method that has become pervasive and is a core element towards holistically understanding the conditions of the students; therefore, it is consequential to address it. It is then followed by the examination of the effects and implications of ODL which is the raison d'etre of this study. The effects and implications of ODL reflect the conditions of the students and consequently provide an indication with regards to the efficiency of the method. Subsequently, it will be followed with recommended policies and initiatives that could be taken by the relevant bodies to ameliorate the undesirable consequences of ODL. It is then concluded with a summarisation of the conditions of students in learning amid the Covid-19 Pandemic, the policies that can be taken by the relevant bodies and the authors’ hope for the future of education. 2. RESEARCH METHODOLOGY This research was done purely on a doctrinal basis in which the research aimed to discover, examine, analyse and present the conditions of students in learning amid the Covid-19 pandemic. It is qualitative in nature and uses published data, reports, researches, articles and case studies as its sources. Every single one of the sources was reviewed meticulously in order to make an authentic and accurate assessment. The following steps were taken when conducting this study: i) Reading the published data, reports, researches, articles and case studies relating to health,
Covid-19, education, online education and education amid Covid-19. ii) Reviewing and analysing the aforementioned sources. iii) Inferred and made conclusions from the analysis that had been made. iv) Provide suggestions on initiatives and policies to solve the issue at hand. 3. METHOD ADOPTED IN LEARNIG AMID COVID-19 The Covid-19 pandemic had caused the education sector to be innovative and substitute the traditional and orthodox way of doing things. Prior to the pandemic, teachers and students are connected in the same classroom, they interact with each other and create special bonds. Sessions will usually be conducted with the teachers writing the relevant materials on whiteboards, explaining the information and the students writing notes and comprehending the lessons. Students could play around with their friends during break times and experience the customary school life. However, as a result of the pandemic, the world had to “shut down”.
Open Distance Learning or ODL is a method in which knowledge and skills are acquired through mediated information and instruction, encompassing all technologies and other forms of learning at a distance. In simpler terms, it means “learning through technology”. Malaysia had also opted to embrace this method to combat the spread of the disease concurrently ensuring the perpetuation of the students’ education. Schools in Malaysia mainly use platforms such as Google Meet, Zoom, Webex and Google Classroom to conduct the lessons. Students would need devices such as computers, laptops or at least a smartphone in order to adapt to this new method. Teachers would have to give lessons via their webcams and the students would have to learn via their computer, laptop or smartphone screen. Assessments would be done by doing exercises, quizzes and online tests, all of which will be delivered online through the said
197
platforms. ODL is an expedient course of action taken by the government as they did not take into account the conditions and consequences of the method to the students, especially those from the lower income groups. 4. EFFECTS AND IMPLICATIONS OF OPEN DISTANCE LEARNING Lack of Accessibility to Learning Devices Open Distance Learning (ODL) has a lot of requirements that need to be fulfilled in order to be enforced. The primary aspect of learning online is the device itself as it is the channel through which education will be delivered. Devices such as computers, laptops and even smartphones are currently the inventions that are binding the teachers and the students thus keeping education going in this country.
A survey was done by the Ministry of Education with close to 900,000 students as their samples found that 37% of students do not own any appropriate devices to continue their education through ODL. It further states that at the same time, personal ownership of laptops/tablets by students only amounted to 6%-9%. The number of students who possess smartphones has been found to be at 46.5%; smartphones are what these students rely on for their online lessons [2]. This is a staggering amount and cause for concern as almost 333,000 students are restricted from pursuing their education as they lack the necessary privileges. Even if a family does have an appropriate device, family members would have to share it as it is limited. The 46.5% of the students who had to rely on smartphones to get through their online lessons cannot be ignored as well. This is because smartphones are inadequate for online learning as students need to do their school work and assignments. The main cause for this problem is believed to be due to financial constraints, especially in the Covid-19 era where unemployment is at an all-time high [3]. Families would prioritise their own survival by spending their limited amount of money on food and shelter rather than technological devices. Students from the rural areas suffer much more than those in urban areas as rural students have less digital access than their counterparts [4].
As a result, a tremendous number of students are unable to participate in online classes. Not only are they being discriminated against, but it would also leave a lasting impact on them in the long run as lack of education has been proven to increase unemployment and perpetuate poverty [5]. The wealth and inequality gap will continue to grow wider. The upwards social mobility of the students would be impaired. The lack of access to learning devices among the students remains the major and most vital problem that affects the students by refraining them from pursuing their education completely.
Lack of Accessibility to Good Internet Connections The Internet is the element that connects us all. It is what has broken down barriers and caused the rapid progression of globalisation. However, not all barriers have been broken down. The clear demarcation between the urban and the rural, the rich and the poor can be seen through the accessibility of the internet by them. It is as important as ever, especially in this Covid-19 pandemic, where the whole world including Malaysia has decided to adopt the Open Distance Learning as the method in which we will proceed with our children’s education.
According to research done by the Khazanah Research Institute, the B40 (Below 40%
198
income group) have an outstandingly less internet subscription as compared to the M40 (Middle 40% income group) and the T20 (Top 20% income group). Aside from internet subscriptions, the national mobile broadband is also sub-par. Mobile broadband is an internet connection that is tied with a sim card in a mobile phone [6]. It is important as there are 46.5% of students who relied on smartphones for their online lessons as previously stated. The fixed-mobile broadband penetration rate was only at 8% per 100 people, which shows that a lot of people are yet to have access to broadband internet. Internet connections play an important role in order to ensure the smoothness of online learning. It is what made online learning possible in the first place. Students who find their internet connections to be problematic will face difficulties in their learning process as it will cause lagging and unwelcomed disconnections while they are working hard to focus on their online lessons. Thus, they will go to extreme measures to ensure that they have a good internet connection.
To give an illustration of the measures that had been taken by students to ensure their
seriousness in this matter, we must take a look at the case of Vevenoah. Vevenoah Mosbibin is a Sabahan student who studied at the “University Malaysia Sabah”, due to the Covid-19 pandemic, the university had adopted the ODL method of learning as the rest of Malaysia. This had caused Vevenoah to proceed with her online lessons at her own home, where the internet connection is terrible. However, she was determined to pursue her education as she wanted to lead a better life in the future and she believed that she could only achieve that by being educated. She then decided to arm herself with a mosquito net, a mobile phone, a power bank, food, stationery and decided to climb to the top of a tree. She decided to climb the tree because the connection there was much better than at her own house thus she could take her examinations without the fear of disconnecting [7]. Although her courage is one that needs to be praised, it is not a success story. In fact, it is proof of failure by the relevant bodies that were supposed to be responsible for implementing these basic infrastructures. This case proves that internet connection is an enormous problem that will intervene with the education of students. It will hinder the smoothness and progression of students if it is not working incessantly. Students all over Malaysia need good internet connections as they have a difficult task of learning in this unprecedented time.
Lack of Face-to-Face Interaction Human interaction is a vital component in education. It is proven that human interaction affects mental and physical health through its influence on emotions, cognitions and behaviours [8]. Specifically, with regards to education, it brings about numerous benefits. It can be observed that in ODL, support from teachers and the camaraderie experience has been limited, if not shun. Students are no longer allowed to meet with their teachers and friends at school. As a result, it brings about severe detriment and inconvenience to the students' learning experience. There are two evident detriments that could be observed.
The first detriment that could be found as a result of online learning is to the “school climate”. School climate can be defined as “the set of internal characteristics that distinguishes one school from another and influences the behavior of people” [9]. These “internal characteristics” play a huge role in the development of the students. The sense of community and interpersonal relationships among the teacher and students and students among themselves has been proven to have an impact on the student’s value, growth and satisfaction [10]. However, as a result of online learning, it is no longer possible for the students to experience it and this could hinder their intention to progress and improve themselves. Student’s ability to

199
enhance their social skills through integration and involvement in group activities could not be made. They are denied the opportunity to mingle with their peers and have to isolate themselves. Isolation leads to loneliness which in return may encourage unhealthy habits. Loneliness raises the levels of stress, causes sleep disturbance and augments depression and anxiety [11]. This is the huge problem with online learning where students feel more isolated and feel disconnected from their teachers and fellow classmates. ODL has led students to spend most of their time isolated in their home thus limiting their social interaction which prevents them from developing their social skills and promotes negative effects as stated before. This will harm students' social and work prospects in the years to come.
The second detriment that can be found with regards to the lack of face-to-face interaction is communication. ODL has caused a negative impact on communication between teachers and students, it has been much more difficult for teachers and students to get their information across through computer-mediated communication [12]. Communication is important as it involves many skills such as identifying the intent of the messenger, analyzing, interpreting, and evaluating. All of these skills would be much easier to perform if the persons involved could see each other face to face. All of these skills are essential for learning, making good relationships and designing a feeling of camaraderie [13]. The virtues of learning face-to-face is irreplaceable. This is true as we could see that presentations are largely done via video call and it impairs humans' ingrained abilities to recognize social cues. This problem is even more severe when there are a lot of students in a classroom as students are anxious to present their ideas publicly due to the fear that they cannot elucidate their thoughts well enough to make others understand them [14]. Lack of Accessibility to Food Food is important to human lives, after all, it is what keeps humans’ alive. Foods provide nutrients for growth and rapid development, especially for those of the age of 5 to 19 years old [14]. The National Institute of Health stated that close to one-tenth of children age from 10 to 17 were stunted, which means that they were too short for their age [15]. Prior to the Covid-19 crisis, about 4 million children were experiencing food insecurity and 3.5 million households were impotent to provide a variety of foods to their children [16]. This proves that a substantial amount of children in Malaysia had faced the consequences of malnutrition. However, this problem will only deteriorate even further due to the adoption of Open Distance Learning.
School closures not only disrupt learning, but it also affects the livelihoods of students. Schools offer food programmes such as Program Sarapan Pagi (PSP), Program Hidangan Berkhasiat di Sekolah (PHP) and Rancangan Makanan Tambahan (RMT). Students rely on these programmes in order to meet their daily food intake. Nonetheless, the closures of schools had to refrain these programmes from continuing. It is thus safe to forecast that the malnutrition rate amongst children in Malaysia will most likely be aggravated by the Covid-19 pandemic due to the suspension of school food programmes. The impacts of malnutrition are acute as it will lead to health implications that the children will carry through into adulthood, it will also impair their cognitive development which will affect their education in the long run [17].
200
5. RECOMMENDED POLICIES AND INITIATIVES Televisions and Radios The authors propose that televisions and radios be used as the medium of learning. This could be done by executing a mass lecture in which every student can watch the lecture on their televisions and listen to the lectures through their radios. These lectures must follow a certain schedule in order to ensure the coherence of the subjects and topics taught. A specific channel must be made to cater for these lectures and refrain any disruption from happening. As for subjects where visual explanations are required, lectures could be done through the use of television whereas lectures that require fewer visual explanations, the radios can be used as the medium of learning. On the question of whether it will be accessible to all students, according to the Department of Statistics Malaysia, it reported that 97.6% of households in Malaysia own televisions [18]. Radios, on the other hand, are still the principal information disseminator as it reaches around 20 million listeners [19]. As most households have already owned these devices, it will be much easier and inclusive for everyone to learn. Personalised Connections and Better Communication The authors suggest that instructors should check in with their learners regularly so as to build personal connections with them. Personal connections are vital to ensure that the ‘school climate’ can be replicated so as to mitigate its loss. Students' value, growth and satisfaction could be promoted through the implementation of this method. In terms of communication, the authors suggest that ongoing feedback by the instructor should be provided as it is helpful for an effective learning environment. The reviews by the instructor will help to create the method of Open Distance Learning more insightful, engaging and motivating. During the online learning process, the feedback should be constant, with positive feedback given as soon as possible so that students can easily recognise the attitudes or skills that need to be strengthened or changed because sometimes the students might not know what the instructor expects from them. Communication outside of the classroom is indispensable as well. Platforms such as Whatsapp and Telegram could be used to ease the process of communication. These platforms could be used in order for the students, especially those who are anxious to present their questions, thoughts or ideas in class due to the often huge number of students in the class and the fear of facing the difficulty of elucidating it to opine their curiosity. Deliveries and Food Pick Ups The authors propound that in relation to foods, there should be an innovative way of ensuring the food gets to the hands of students. Relevant bodies could deliver the school meals straight to the home of students or at bus stops every day as done in the United States of America in districts such as Michigan and New York [20]. School busses that are currently not utilised could be used to deliver the foods; especially in areas in which are at high risks of getting infected, where going out is not recommended. However, low risks areas, the meals could be provided in fixed sites such as schools or halls. These fixed sites must meet and practice all the requirements and standard operating procedures given by the Ministry of Health. This is to guarantee that the students get their meals and simultaneously secure them from being infected by the virus.
201
Amendments of Syllabus The unprecedented Covid-19 situation necessitates unprecedented government action, particularly from the Ministry of Education. Covid-19 began in December of 2019, and Malaysia began imposing the "Restricted Movement Order" on March 18, 2020. Thus, during the time this paper is being written, it has been about a year and a half but the Covid-19 situation is still ongoing. The authors propose that the Ministry of Education make necessary changes to the current syllabus so that students and teachers are not burdened. Physical classes and online classes are different. Students may be able to absorb the current syllabus when they are going through normal and physical classes. However, as previously discussed, there are a myriad of challenges that students face during online classes. If the current syllabus is still being implemented, it will jeopardise the students in terms of their ability to cope and their overall well-being; teachers will also face difficulties in terms of teaching the materials. Amendments such as removing inconsequential topics, changing the learning outcome of a subject and alteration to the substance of a subject will significantly benefit teachers and students alike. 6. CONCLUSION In conclusion, the Open Distance Learning method is a convenient course of action to mitigate the impacts of the Covid-19 virus and at the same time ensuring the continuance of the education for students due to its nature of being absent of physical contact with others. In spite of this, convenience does not amount to effectiveness. Students in Malaysia are suffering from the results of ODL. The essence of requiring learning devices and good internet connections does not fit well with the current climate in Malaysia where the digital divide is big. The lack of face-to-face interactions and conducive surroundings eliminates the ‘school climate’ and safety of the students. The food problem which affects the cognitive and mental growth of the children, as well as the grave implication to physical health, are causes for concern.
There is still hope for our students. The authors had provided initiatives and solutions that could be done by the relevant bodies to overcome these issues. The Covid-19 pandemic is not going to go away in the foreseeable future hence so will ODL. Therefore, the government must ameliorate this method in order to remove its undesirable consequences. Students are the future of our country; they play a huge role in leading and developing the nation onwards. It is therefore indispensable that they should be given the right to pursue their education with ease and incessantly so as to ensure their development is constantly progressing well. We may not control all the events that happen to us, but we can decide not to be reduced by them. In these unprecedented times, let us not neglect and deprive the education of our children and instead be more innovative in adapting to their needs. REFERENCES [1] Hamid, H. A., & Khalidi, J. R. (2020). Covid-19 and Unequal Learning. Kuala Lumpur:
Khazanah Research Institute. [2] Hamid, H. A., & Khalidi, J. R. (2020). Covid-19 and Unequeal Learning. Kuala Lumpur:
Khazanah Research Institute. [3] MIER. (2020). The Economic Impacts of Covid-19. Kuala Lumpur: Malaysian Institute of
Economic Research. [4] Shaharudin, A. A. (2020). Giving Access to Education Equitably and Safely. Kuala
Lumpur: Khazanah Research Institute.
202
[5] Payne, R. (2005). A Framework for Understanding Poverty (4th ed.). Highland: Aha! Process.
[6] Gong, R. (2020). Coping with Covid-19: Distance Learning and the Digital Divide. Kuala Lumpir: Khazanah Research Institute.
[7] Zi, T. M. (2020, January 20). Sabah university student spends 24 hours on top of a three for better internet connection for online exams. Malay Mail.
[8] Cohen, S. (1988). Psychosocial Models of the role of Social Support in the Etiology of Physical Disease. Health Psychology.
[9] Hoy, W. K., & Miskel, C. G. (2001). Educational Administration: Theory, Research and Practice (6th ed.). New York: McGraw Hill.
[10] Anderson, C. S. (1982). The Search for School Climate: A Review of the Research. Review of Educational Research.
[11] Valtorta, K.N., Kanaan, M., Gilbody S., & Hanratty, B. (2016). Loneliness and Social Isolation as Risks Factors for Coronary Heart Disease and Stroke: Systematic Review and Meta-Analysis of Longitudinal Observational Studies. BMJ Journals.
[12] Mohammad, A., Lana, M., & Gharam, R. (2020). The Effect of Online Learning on Communication between instructors and Students during Covid-19 Pandemic. Asian Education and Development Studies.
[13] Velentzas, J., & Broni, G. (2014). Communication Cycle: Definition, Process, Models and Examples. Technological Institute of Western Macedonia.
[14] UNICEF. (2019). The State of the World’s Children 2019. Children, Food and Nutrition: Growing Well in a Changing World. New York: United Nations Children’s Fund.
[15] Institute for Public Health, National Institutes of Health, & Ministry of Health. (2017). National Health and Morbidity Survey 2017: Adolescent Nutrition Survey. Kuala Lumpur: National Institute of Health
[16] Ahmad, A. Z., Azhana, H. Z., Azli, B., & Ahmad, N. J. (2016). National Health and Morbidity Survey 2014: Malaysian Adult Nutrition Survey (MANS) Vol. II: Survey Findings. Kuala Lumpur: Institute for Public Health.
[17] Dunn, C. G., Kenney, E., & Fleischhacker, S. E. (2020). Feeding Low-Income Children During the Covid-19 Pandemic. New England Journal of Medicine.
[18] Department of Statistics Malaysia (DOS). (2020). ICT Use and Access By Individuals and Households Survey Report 2019. Putrajaya: Department of Statistics Malaysia.
[19] Malaysian Communications and Multimedia Commission (MCMC). (2019). Industry Performance Report 2018. Cyberjaya: Malaysian Communications and Multimedia Commission.
[20] Dunn, C. G., Kenney, E., & Fleischhacker, S. E. (2020). Feeding Low-Income Children During the Covid-19 Pandemic. New England Journal of Medicine.
203
I-CReST 2021:102-098 – Right of Education: Difficulties to Earn Education for Children from Minimum Wage Families
*Ainul Mardhiyyah binti Tajudin, Mohamad Nasrul bin Mohd Nizar
Centre of Foundation Studies, Universiti Teknologi MARA, Cawangan Selangor, Kampus
Dengkil, 43800 Dengkil, Selangor, Malaysia
*E-mail: [email protected]
ABSTRACT In reference to the National Minimum Wage (NMW) studies, Malaysia ranks as one of the lowest paying countries in the world with the minimum wage of RM1,200 ($291.47 USD) of which the significant contrast can be seen as countries across the globe such as Finland are earning a minimum wage of €1,190 ($1,433.99 USD). On average, living expenses for a single family to live in Kuala Lumpur is RM7,310 which proves how parents earning a minimum wage would still be unable to afford a comfortable life [Wise, 2017]. Subsequently, this has inflicted a difficulty for parents to sustain their children’s educational needs as they are required to spend an average of RM107,920 from primary school to undergraduate institutions [New Straits Times, 2017]. Moreover, such an amount is only for one child’s worth of education whereas the same number may multiply drastically depending on how many children the parents may have. Nonetheless, this study aims to analyse the difficulties of children to earn education while living in a minimum wage family and to further emphasize the impacts of illiteracy should they be deprived of their rights to education. The methodology implied in completing this study is through critical analysis of statistics, causes, effects and comparisons made between Malaysia and foreign countries that have successfully provided proper earnings and education mechanisms for their citizens. Some of the major findings include, children who are from minimum wage families are prone to earn minimum wage themselves and how the absence of education shall only perpetuate their poor living status. In summary, the magnitude of difficulties for children from minimum wage families to receive education is far too grave to be overlooked. Therefore, this critical analysis is made to understand the core of the issue so that it can be better overcome. Keywords: Children; Education; Minimum Wage; Analysis; Malaysia 1. BACKGROUND OF THE RESEARCH
According to the International Labour Organisation, minimum wage can be defined as the minimum amount of remuneration that an employer is required to pay wage earners for the work performed during a given period, of which cannot be reduced by collective agreement or an individual contract. This brought to the reason that the purpose of minimum wage is to ensure that workers are protected from being unduly low paid in regards to their work positions. Thus, the amount of minimum wage should always remain above the minimum cost of living in a country or territory in order to ensure that all income earners are able to sustain a living even by having a minimum wage income. However, this seems to not be the case in Malaysia as the amount of RM1,200 being set as the minimum wage as of 2019 is simply insufficient for a
204
single person to sustain a living with basic commitments such as rent, groceries, bills, transportation and other necessities.
This begs the question on whether there is justice implemented by the government upon its citizens in relation to the current state of minimum wage. Due to the low paying jobs offered by working sectors, a lot of parents are deprived from securing a comfortable life for their family as they are obliged to spend most if not all of their income on necessities, commitments and additional fees including education for their children. According to the statistics provided by H.Pletcher in 2020, Malaysia’s inflation rate is 0.66% every year from 1985 to 2019. In comparison, this is significantly higher than other countries such as Qatar with -2.17%, Puerto Rico with -1.62% and UAE with -1.5%. As parents are required to provide their children with fundamentals of education, they are practically forced to spend a large sum of resources for each of their children’s learning from early childhood all the way to tertiary level institutions. Parents are expected to struggle through the high inflation rates and low wages in order to provide for their families. This has been resulting in multiple difficulties for children of minimum wage families to earn proper education.
In brief, the need for education rises as the cost of living increases as well. However, it is
becoming harder especially for parents in the 21st century to sustain and support their children’s education needs due to the high maintenance cost of living and low paying jobs. As we see across the media, youth nowadays are prone to abandon their education at such a young age to start earning an income for themselves in order to be able to sustain their own living. Therefore, we are able to assume that the low minimum wage along with high inflation rates are the factors that led to the rise of poverty among Malaysians thus making it harder for parents to provide their children with education.
Hence, this study is made with the objectives of highlighting the difficulties of parents to
provide sustenance of education for their children with an earning from minimum wage jobs. Aside from that, this study further aims to understand the causes, effects, and importance of receiving proper education and how the resources required to achieve that is unmatched with the amount of minimum wage that is earned by a large number of parents for their household. Methods used in analysing the issue of difficulties to earn education from children of minimum wage families are through literature reviews, statistics summary, public’s statements on the issue and critical review of the current situation based on multiple media platforms.
2. EFFECTS OF LOW MINIMUM WAGE TOWARDS EDUCATION
Low income in education among children gives negative impact outcomes especially in the socioeconomic aspects. Most importantly, having low minimum wage gives major impacts to children for their readiness for school and their attainment in education as a child living in minimum wage families. However, the educational negative outcomes has been a main topic nowadays since education is vital for every child with different levels and status. For illustration, Canadian’s children still live in poverty but the plan to eliminate poverty turned out unsuccessful but soon after decades Canadian family incomes rose. Canadian researcher has found that poverty issues give bad impacts to the children in their behaviour and school achievements [Ferguson, Bovaird, Mueller, 2007].
The first impact on education among children is the readiness for school which defines the child's ability for being successful in both aspects, academically and socially at school which
205
requires children’s well health condition, stability in physical and emotions development and also cognitive skills. The low income status impacts children from low-income families in the school readiness where they do not receive and learn any social skills that are necessary for their preparation for attending school due to some problems such as lack of support from parents and bad parenting style affect the children’s reflection becoming more negative behaviour outcomes before receiving the education. According to some Canadian studies, establishing a report regarding the issues faced by the children from poverty lifestyle before getting proper education in school, for example lack of communication skills, less knowledge in recognising numbers, symbols, letters and vocabulary also not being able to concentrate well.
Besides, the educational attainment among children somehow associate low income as the
negative influence to the development in children cognitive skills, behaviour and socioemotional effect toward children along with their achievement in academics. In addition, an American study found that parents from disadvantaged backgrounds are most likely to have premature babies while the children are highly at risk to fail in school. Children in minimum wage families are also most likely to fail in maintaining school achievements in academics which might be blamed for their backgrounds. Lastly, another issue reported regarding low income students usually leaving school without graduating in debt because unable to pay the education fees, this report has been found out in a study by Canada Human Resource Development.
Education as Mechanism to Earn Higher Living Status
There's this one myth circulating among people that children who’re growing up in low income families are lacking the native intelligence to succeed. Fortunately, the myth itself is shattered by children themselves. One recent example is 11-year-old Paloma Noyola Martínez, a student from José Urbina López elementary school, which lives in the community surrounding the Matamoros garbage dump and accomplished a score of 921 on Mexico’s national academic achievement test which is the highest score in the country [Montecel, 2013]. Martínez is among just many children in the poorest parts of Matamoros who successfully achieved the top test scores in the state.
First, through education, generation of awareness may be achieved by an individual. From
this, they can differentiate whether something is appropriate or not, thus making a wise decision [Radhika, 2019]. As we all know, being decisive is a skill that is essential for an individual as we ought to make decisions in our daily life. Education enables one to make an effective decision that is most beneficial to them [Radhika, 2019]. As a result, they are able to decide what type of jobs that are suitable to them the most. A powerful and functional decision would enable them to improve their living conditions [Radhika, 2019].
Furthermore, education is a way to earn higher living status as education can develop one’s
communication skills [Radhika, 2019]. There is research done where it states that people living in rural communities and those who reside in the surroundings of poverty tend to have an introverted nature inside themselves and lack communication skills [Radhika, 2019]. When one has a good communication skill, he or she is able to socialise with organizations and agencies easily that would enable them to minimise the conditions of poverty and sustain their lives. Good communication skills are required to secure a job. When they develop higher qualifications, they are able to obtain well-paid employment opportunities, and acquiring the
206
opportunity is one of the primary aspects to the reduction in the conditions of poverty [Radhika, 2019].
Education Challenges/Issues Raised by Low Income Groups
Education has also been affected by the developments that have shaped global economics and politics [Stephen, 2001]. By that statement, there are many issues and challenges that have arisen from any fundamental changes of the world such as the economy and politics. Other forms of change are glacial in the pace at which they are noticed, but they are no less profound in terms of effects [Stephen, 2001]. The study noted that with regard to education issues and their change from local to international significance. The challenges and issues will give a hard time for the government and require more time and effort to handle them.
There are numerous challenges whether in Malaysia or other countries that have been facing in general. This is due to the fact school systems vary from country to country, but they all share similar features [Stephen, 2001]. The strain for schools to adapt to local economic demands and to follow the required policies is among the most prevalent. So, what are some of the serious issues and challenges that countries often encounter when struggling to take care of the right of education for children in minimum wage families? A few of the common issues and challenges are budget issues and government funding, lack of awareness toward education and language barriers.
As an instance, India can be taken as a prime example of a country with many education
issues. This is due to the fact that India faced many challenges and issues in their country in the aspect of education as there are 35% of uneducated individuals in India [Krina, 2020]. Some of the issues are expensive higher education, mass illiteracy and neglect of Indian languages. We can analyse some of the issues and understand how it will affect the country in giving rights to education for children in minimum wage families. For instance, about the issues of expensive higher education, this is a common issue for children across the world. People in India are familiar with low minimum wage, as two-third of people in India live in poverty [Krina, 2020]. Next, there are people with mass illiteracy who are unable to read and write, hence any effort of the government in encouraging education to the people will be futile. This claim is supported by a statistic that shows the amount of illiterate people in India is almost 33% of the accumulation of uneducated individuals in the world. These are some of the issues in providing the right of education to children in low income families.
Education in Malaysia
As compared to the other Southeast Asian (ASEAN) counties, Malaysia is placed higher than countries namely Thailand, Philippines and Indonesia in the latest PISA that was held in 2018. However, being placed at rank-56 in the recent PISA shows that there are a plethora of things that need to be fixed in Malaysia’s education system as the students are still lacking in basic skills such as reading, mathematics and science especially those who live in poverty [Wing Thye, 2019]. Therefore, Malaysia's education policies need to be analyzed and improved by referring to Finland's education system that is regarded as one of the best in the world.
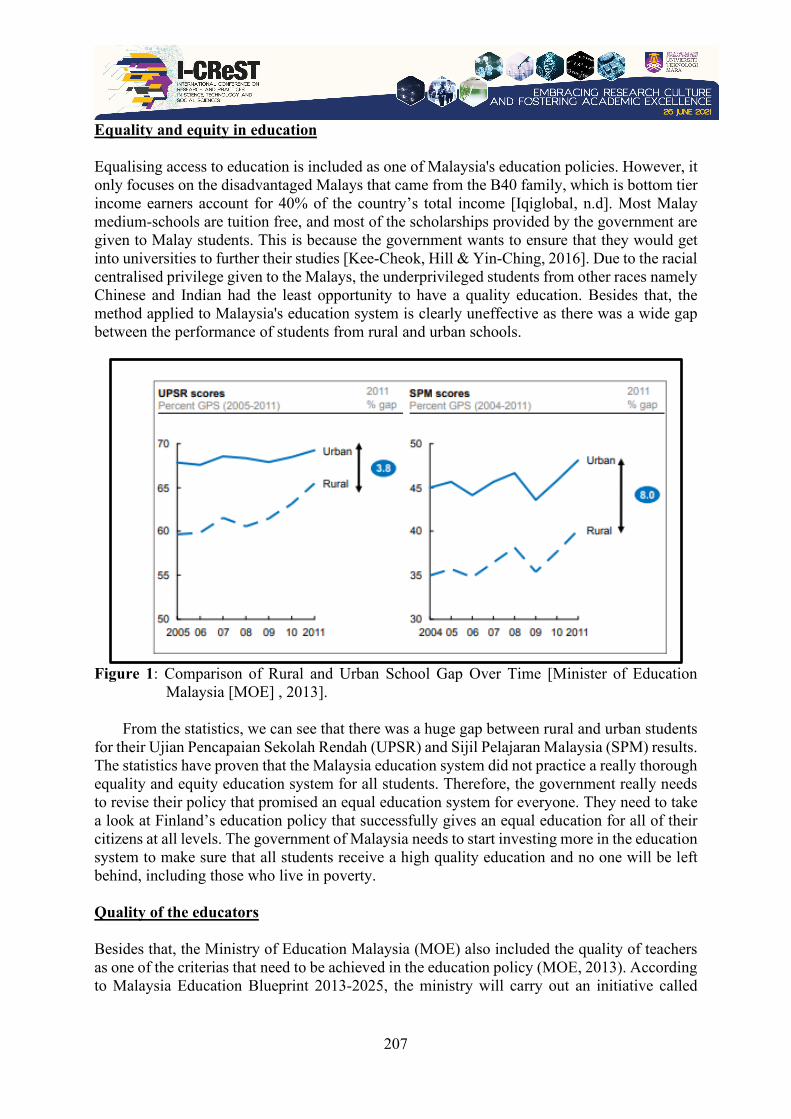
207
Equality and equity in education
Equalising access to education is included as one of Malaysia's education policies. However, it only focuses on the disadvantaged Malays that came from the B40 family, which is bottom tier income earners account for 40% of the country’s total income [Iqiglobal, n.d]. Most Malay medium-schools are tuition free, and most of the scholarships provided by the government are given to Malay students. This is because the government wants to ensure that they would get into universities to further their studies [Kee-Cheok, Hill & Yin-Ching, 2016]. Due to the racial centralised privilege given to the Malays, the underprivileged students from other races namely Chinese and Indian had the least opportunity to have a quality education. Besides that, the method applied to Malaysia's education system is clearly uneffective as there was a wide gap between the performance of students from rural and urban schools.
Figure 1: Comparison of Rural and Urban School Gap Over Time [Minister of Education
Malaysia [MOE] , 2013].
From the statistics, we can see that there was a huge gap between rural and urban students for their Ujian Pencapaian Sekolah Rendah (UPSR) and Sijil Pelajaran Malaysia (SPM) results. The statistics have proven that the Malaysia education system did not practice a really thorough equality and equity education system for all students. Therefore, the government really needs to revise their policy that promised an equal education system for everyone. They need to take a look at Finland’s education policy that successfully gives an equal education for all of their citizens at all levels. The government of Malaysia needs to start investing more in the education system to make sure that all students receive a high quality education and no one will be left behind, including those who live in poverty.
Quality of the educators Besides that, the Ministry of Education Malaysia (MOE) also included the quality of teachers as one of the criterias that need to be achieved in the education policy (MOE, 2013). According to Malaysia Education Blueprint 2013-2025, the ministry will carry out an initiative called

208
‘Teacher Career Package’ to change how the educators or teachers are selected, evolved and rewarded. This program will include a few things as follows (MOE, 2013).
● Raising and enforcing entry standards into teacher training programmes ● Revamping the Institusi Pendidikan Guru (IPG) to raise the quality of leadership and
lecturers, research and innovation, infrastructure facilities, IPG as a learning organisation, and pre-service training curriculum
● Improving the effectiveness of pre-service and continuous professional development ● Developing exciting new career pathways that support fast-tracking based on
performance and competencies along with opportunities for redeployment for consistent underperformers
However, despite having this kind of programme being enforced, the gap of performance between students who live in poverty and those who are not, is still visible. This is due to the quality of teachers that differs in each school. For instance, Sekolah Berasrama Penuh (SBP), Maktab Rendah Sains Mara (MRSM) and private schools obviously provide more experienced and high performing teachers as compared to public schools that are usually attended by students that came from the B40 family. Thus, it will create a huge gap in the students' performance. Besides that, high performing schools like SBP and MRSM are also starting to become the preferred schools for wealthy students, although its initial objective is to help students from underprivileged families that lived in the rural area. This will eventually create less opportunity for students in poverty to receive the same amount of quality education.
Therefore, the government needs to improve the quality of teachers by imposing new
programmes and suggesting new initiatives. Rather than focusing on SBP and MRSM only, they should provide high performing educators with the same level of education and training for all schools just like what is being practiced by Finland. This is vital as it will ensure that no students will be left behind no matter what kind of school they will be attending. By enforcing this method, all students will receive the same quality of education and eventually will increase their performance.
Suggestions Many barriers stand in the way of children receiving an education, from unaffordable school fees and a lack of basic facilities to the low-quality instruction. Not only that, threats of natural disasters and civil conflicts occured in their own country also disrupt many children’s education. We passionately believe that every child deserves education, hope, and opportunity which does not come naturally to these unfortunate kids like any other normal kids.
The first prime solution that should be taken is by the help of the federal government to cope with this matter. Federal government indeed plays a major role on every issue and conflict that occurs in their own homeland. For instance, the right education of children in poverty issues that arise, will be taken into consideration and the federal government will eventually fulfill their roles by finding an effective measure and put it in action to deter the problems efficiently. With that notion in mind, the federal government can help the children of low income families lessen their difficulty to have rights in education by assisting meal programs in all public schools, nonprofit private schools and residential child care institutions. These meal programs will provide the children with nutritional balanced, low-cost or free lunches during recess time

209
[Callahan, 2018]. By this, the parents will not have worries about providing extra money on unaffordable meals every single day and the kids can focus on their study with ease at school.
Providing meal support to the children of low income families can be considered as a source of compensation for low income children to lessen the burden of their families on everyday expenses. As an example, the federal government can put this into action effectively by allocating a constant amount of money per child or household of minimum wages within each state. As a result, the children of minimum wage families can take account of differences in the educational needs of students and other factors affecting the cost of education [Callahan, 2018].
Furthermore, by improving accountability on the sponsorship program like providing the
basic necessities such as food, clothing, healthcare and educational support to children living in minimum wage families where these essentials are so often taken for granted by many people as it can give impact on a child’s growth and success in school [Callahan, 2018]. Thus, sponsorship that provides an underprivileged child with basic and education-related necessities such as school supplies and school tuition payments will allow impoverished, vulnerable children to develop to their full potential physically, emotionally and socially. Sponsors, be it from the government or charity or any parties that are willing to lend a hand will positively impact the lives of the children as the simple knowledge of someone actually cares about their well-being [Callahan, 2018]. This gives children or the next generation in need of hope which is a powerful feeling for an individual in general. The sponsors can channel their funds or necessities like basic education-related items for children in our program to the orphanages, homes, community centers and schools to ensure that every child have every right to have an education under any circumstances and have what they need to do their very best and succeed in school [Callahan, 2018].
Moreover, building the capacity of schools to educate low-income students will help the
children of minimum wage families to have the right of education. Most children from the rural and urban areas are the ones who are unable to have the best education as the roads for transportation there are not suitable for any vehicles to cross which make it difficult for the children to go to school. It has been stated that the rate of the urban population of Malaysia was at 3.8%, while rural poverty was at 12.3% [Statista, 2021]. In 2019, Malaysia revised its national poverty line income, increasing it from RM 980 to RM 2208. This accounted for the increases in the poverty rate in 2016. Thus, building new facilities and reconstructing better roads for the children to study and go to school in rural and urban areas surely is an efficient measure to be taken.
3. CONCLUSION
Based on the research on difficulties to earn Education for children of minimum wage families above, it is nothing new that education should be a basic need in life and everybody shall have their right to gain education. Practically, all children that live in low income families are struggling to earn their basic rights to education. Many unfortunate children living in Third World Countries such as South Sudan and Syria are most likely to keep their children out of school. As mentioned above, obvious negative effects have been discussed on why low minimum wage is a crucial factor for children to not gain proper access to basic education.
210
This has bad effects on a child’s behaviour development and achievements. Along the same line, children in minimum wage families have lower chances of performing well academically and socially. From not getting full support from parents deters them from having good social skills. The inability to pay up student loans is also one of the reasons. However, education has its way to secure a better life through higher living status. Communication skills can be fully developed if a child has a proper education which would allow for better social and academic performance.
As a result, they are able to secure higher qualifications to earn better paying jobs. Thus,
having access to education has the power to reduce the state of being poor. Children in minimum wage families are still in their paths to fight for their own rights to gain proper education in their countries, and the government should feel the obligation to raise the National Minimum Wage to a higher and more adequate level so that the status of living in Malaysia shall increase and affects the citizens positively REFERENCES [1] Briefing, A. (2021, April 20). Malaysia Increases Minimum Wage. ASEAN Business
News. https://www.aseanbriefing.com/news/malaysia-increases-minimum-wage/#:%7E:text=The%20Malaysian%20government%20has%20increased,(US%2423)%20from%202019
[2] W. (2021, May 25). Cost of living in Malaysia: Your guide. Wise. https://wise.com/au/blog/cost-of-living-in-malaysia
[3] Vijaindren, A. (2017, November 5). The cost of children's education. NST Online. https://www.nst.com.my/news/exclusive/2017/11/299559/cost-childrens-education
[4] Plecher, H. (2020, December 15). Malaysia: Inflation rate from 1985 to 2025. Statista. https://www.statista.com/statistics/319033/inflation-rate-in-malaysia/
[5] Ferguson HB, Bovaird S, Mueller MP. (2007), The impact of poverty on educational outcomes for children. Pediatric Child Health, Volume 12(8), 701–706. doi : https://dx.doi.org/10.1093%2Fpch%2F12.8.701
[6] Radhika, K. (2019). Role of Education in Poverty Reduction. Retrieved from https://www.researchgate.net/publication/335202160_Role_of_Education_in_Poverty_Reduction
[7] Krina, G. (2020). Problem Faced In Progress Of Education in India. Retrieved from https://www.indiatoday.in/education-today/featurephilia/story/problems-faced-in-progress-of-education-in-india-1666068-2020-04-12
[8] Kee-Cheok Cheong, Hill, C., Yin-Ching Leong. (2016). Malaysia’s Education Policies and The Law of Unintended Consequences. Journal of International and Comparative Education, 5(2), 75. doi: https://jice.um.edu.my/article/view/2754/946
[9] Callahan, S. (2018, April 17). Children’s Education and Poverty. Children Incorporated. https://childrenincorporated.org/childrens-education-and-poverty/#:~:text=You%20can%20help%20a%20child%20living%20in%20poverty,clothing%2C%20healthcare%2C%20school%20supplies%2C%20and%20school%20tuition%20payments
[10] Statista. (2019). PISA student performance in Finland from 2000 to 2018, by subject and score. Retrieved from https://www.statista.com/statistics/986919/pisa-student-performance-by-field-and-score-finland/#:~:text=In%20the%20PISA%20test%202018,mathematics%2C%20and%20522%20in%20science.
211
I-CReST 2021:121-108 – The Admissibility of Eyewitness Identification Evidence in Malaysian Courts: An Analysis on R v Turnbull guidelines and
Scientific Approach to Eyewitness Identification
*1Nur Hafidah Abd Kadir, 1Hariati Ibrahim @ Musa, 2Sharifah Zulia Balqish Syed Agil
1Centre of Foundation Studies, Universiti Teknologi MARA, Cawangan Selangor, Kampus Dengkil, 43800 Dengkil, Selangor, Malaysia
2Faculty of Law, Universiti Teknologi MARA, Shah Alam Selangor, Malaysia
*E-mail: [email protected]
ABSTRACT Identification by an eyewitness arises when a witness who has seen the offender committing the crime is given an opportunity to identify a person. In Malaysian criminal justice system, eyewitnesses have long played a significant role in criminal investigations and prosecutions. For cases where the case wholly or substantially depends on the correctness of the identification of accused by the eyewitness, the courts ought to follow guidelines enunciated in the case of R v Turnbull [1977] QB 224 in evaluating the credibility of identification evidence testified by the eyewitness. The guidelines directed the trial judge to consider factors surrounding the case as the standard to measure the quality of the identification evidence. In order to identify the list of factors considered by the trial judge, this paper critically analyses criminal cases that have followed the Turnbull guidelines. Furthermore, this paper highlights how the scientific human behaviour studies validate such factors to be the factors that may affect the veracity of the eyewitness identification evidence. Drawing conclusion based on the analysis made, this paper advocates the need for the trial court to imperatively follow the Turnbull guidelines in cases which depend wholly or substantially on eyewitness identification evidence. Keywords: eyewitness identification, admissibility of evidence, R v Turnbull guidelines, criminal justice system 1. INTRODUCTION Eyewitness identification is a specific type of eyewitness testimony in which an eyewitness claims to recognize a specific person as one who committed a particular action.[1] An eyewitness is responsible to assists police officer in crime investigation. The Malaysian Criminal Procedure Code [Act 593] (hereinafter referred to as the “CPC”) is the primary law that governs the processes that potential witnesses need to adhere to from the particular moment they witnessed a crime before their eyes to standing in a witness box in the court of law. Section 111 of the CPC empowered a police officer investigating the information on any crime to require the attendance of witnesses acquainted with the circumstances of the case by order in writing and that person is obliged to attend. Section 112 of the CPC governs the examination session of an eyewitness by police officer. Upon heeding to the order to attend, an eyewitness may be examined orally by the police officer. However, before the examination begins, the police officer must notify the eyewitness of his obligation to answer all questions by stating the
212
truth relating to the case put to him by that officer unless if the answer would have a tendency to expose him to a criminal charge or penalty or forfeiture. The police officer then must reduce any statement made by the eyewitness into writing, read to him in the language in which he made it, give him the opportunity to make any corrections he may wish and signed or affixed with thumbprint by the eyewitness.
These steps have to be strictly adhered to as the statement given will form the crux of the investigation. It is vital that the statement capture as detailed information as possible. An eyewitness may bear in mind that he should not be prevented or discouraged in giving his statement to police by virtue of section 114 of the CPC. It is at this recording of statement stage that eyewitness will be asked to not only elaborate on the particulars of the events that unfolded but to also identify any other relevant supporting facts such as victim, accused, weapon used or property lost.
One of the most direct ways in which eyewitnesses can affect the outcome of a trial is through testimony stating that a particular person was the perpetrator of the crime.[1] Evidence given by such eyewitness can bring about miscarriages of justice; both the conviction of the innocent and its mirror, the failure to convict the guilty. Mistaken identifications are proven to have disastrous effects for those wrongly accused of crimes and for society should a guilty person go free. This mistaken identification may also erode public confidence in the criminal justice system as a whole.[2] According to Findley (2016), eyewitness error is a leading contributor to the emerging phenomenon of wrongful convictions.[3] 2. THE ANALYSIS
R v. Turnbull Guidelines In Malaysia, the Court of Appeal in the case of R v. Turnbull & Ors [4] has addressed this issue and held that the danger of miscarriages of justice occurring can be much reduced if trial judges sum up to the juries in the way indicated in the judgment as per below:
“First, whenever the case against an accused depends wholly or substantially on the correctness of one or more identifications of the accused which the defence alleges to be mistaken, the judge should warn the jury of the special need for caution before convicting the accused in reliance on the correctness of the identification or identifications. In addition, he should instruct them as to the reason for the need for such a warning and should make some reference to the possibility that a mistaken witness can be a convincing one and that a number of such witnesses can all be mistaken. Secondly, the judge should direct the jury to examine closely the circumstances in which the identification by each witness came to be made. How long did the witness have the accused under observation? At what distance? In what light? Was the observation impeded in any way, as for example by passing traffic or a press of people? Had the witness ever seen the accused before? How often? If only occasionally, had he any special reason for remembering the accused? How long elapsed between the original observation and the subsequent identification to the police? Recognition may be more reliable than identification of a stranger; but, even when the witness is purporting to recognise someone whom he knows, the
213
jury should be reminded that mistakes in recognition of close relatives and friends are sometimes made. All these matters go to the quality of the identification evidence. If the quality is good and remains good at the close of the accused’s case, the danger of a mistaken identification is lessened; but the poorer the quality, the greater the danger. In our judgment, when the quality is good, as for example when the identification is made after a long period of observation, or in satisfactory conditions by a relative, a neighbour, a close friend, a workmate and the like, the jury can safely be left to assess the value of the identifying evidence even though there is no other evidence to support it; provided always, however, that an adequate warning has been given about the special need for caution. Were the courts to adjudge otherwise, affronts to justice would frequently occur. When, in the judgment of the trial judge, the quality of the identifying evidence is poor, as for example when it depends on a fleeting glance or on a longer observation made in difficult conditions, the situation is very different. The judge should then withdraw the case from the jury and direct an acquittal unless there is other evidence which goes to support the correctness of the identification. A failure to follow these guidelines is likely to result in a conviction being quashed and will do so if in the judgment of this court on all the evidence the verdict is either unsatisfactory or unsafe."
These were the operative parts of Widgery CJ's judgment (speaking for the Court of
Appeal), which rehearses the essential components of what has come to be known as the Turnbull guidelines. Although the Turnbull guidelines were drafted to assist a trial judge in correctly directing the jury, the principles which were enunciated in it are of equal relevance to Malaysian criminal trial system. In adapting the Turnbull guidelines for Malaysian local system, the court have reworked the Turnbull guidelines into the following three-step test.[5]
The first question which a judge should ask where there is identification evidence is whether the case against the accused depends wholly or substantially on the correctness of the identification evidence which is alleged by the defence to be mistaken. If so, the second question is whether the identification evidence is of good quality, taking into account the circumstances in which the identification by the witness was made. The circumstances in which the identification by the witness were made must be carefully examined. Factors which affect the quality of the identification evidence include: a) how long the witness observed the accused; b) how often?; c) under what light?; d) at what distance?; e) was there any impediment in the way?; f) was the accused known to the witness previously?; g) any special reasons for witness to remember the accused?; h) any material discrepancies between description given to the police and the accused's actual appearance?; i) time elapse between original sighting and subsequent ID parade identification. Where the quality of the identification evidence is poor, the judge should go on to ask the third question; whether is there any other evidence which goes to support the correctness of the identification. If the judge is unable to find other supporting evidence for the identification evidence, he should be mindful that a conviction which relies on such poor identification evidence would be unsafe.
Up until today, the Turnbull guidelines are applied by the trial court in Malaysia to assist in the evaluation of the identification evidence. Based on decided cases, these Turnbull guidelines are relevant to cases which depend wholly or substantially on the correctness of the identification evidence.[6] The evidence identified in cases where the eyewitness knows the

214
alleged perpetrator (a friend or relative) and only need to recognize the accused is still admissible even though it did not follow the Turnbull guidelines as illustrated in the case of Suharman Mohamad Noor@Ismail v. PP.[7] In addition, recognition may be more reliable than the identification of a stranger.[8] In cases where the perpetrator was a stranger, the contention of the eyewitness that the identified person is the actual perpetrator can be quite controversial hence failure to consider the guidelines is fatal and may amount to setting aside of conviction as was held in the case of Wong Soon Choon v. PP. [9] Common Factors that have been considered by the Trial Judge It can be summarized that the guidelines directed the trial judge to consider a specified list of factors surrounding the case as the standard to measure the quality of the identification evidence. Such consideration should be tailored to fit the facts of the particular case in order to rely on the correctness of the evidence.[10] Based on analysis, there are a number of factors that commonly considered by the trial court in applying the guidelines.
The first factor is the presence of lighting. The trial court is prone to reject eyewitness identification of the perpetrator made in poor presence of lighting.[10,11,12] Secondly, the length of time of observation. Observation of the incident for a period of extreme brevity would affect the quality of the identification. [13,14] Thirdly is the distance of the observation. Visual identification from a distance may decline the accuracy of the observation.[15] Next is the elapse of time between the original observation and the subsequent identification parade. Identification parade conducted after two and a half months of the incidents is held to be flawed and amounts to poor quality of identification.[16] Lastly, the impediment or obstruction to the visual identification. For example, helmet declines accuracy as it conceals hair, head and facial shape which are cardinal signs in visual identification.[17]
When the quality of identification is poor after considering these factors, the court should find other supportive evidence. Supportive evidence is evidence that makes a judge sure that there was no mistake in the identification.[5] An example of supportive evidence is the identification parade. In Malaysia, identification parade is admissible under Section 9 of the Evidence Act 1950. In conducting the identification parade, the Malaysia Royal Police shall comply with instructions laid down in the Inspector-General’s Standing Order (the IGSO). The Federal Court in Adiswaran a/l Tharumaputrintar v. PP explained that a properly conducted identification parade is the one where the police officer in charge of conducting had complied with the directions under Inspector General’s Standing Order relating to the height, age, race and appearance of the participants who took part in the identification parades.[18] The judicial response to the non-compliance of the IGSO can be seen in the case of Muhammad Zakwan Zainuddin v. PP where the court held that any breach of the procedural requirements in holding an identification parade does not lead automatically to inadmissibility.[19] If the parade is conducted fairly, a failure to comply strictly with instructions in the police orders is not fatal. The court in the case of PP v. Saiful Anuar Shahabuddin reaffirmed the decision and held that provided the parade is conducted fairly, a failure to comply strictly with instructions in the parade book or other police orders need not be fatal.[13] The court further elaborate that where there is evidence of bad faith or a deliberate flouting of procedural requirements rather than mere inefficiency, the identification will probably not be upheld.
The trial courts in Malaysia have consistently and systematically followed the Turnbull guidelines to assess the admissibility of the eyewitness identification evidence. Even though
215
the Turnbull case was decided almost some 4 decades ago, the enunciated guidelines remain relevant in cases which depend wholly or substantially on identification evidence [6]. However, the guidelines is rather imperative based on the remarks made by the Court of Appeal in the case of Mohamad Yazri Minhat v. PP [2003] 2 CLJ 65 as follows:
“Now, the English case of Turnbull (supra) did not lay down any proposition of law embodied in concrete. As all members of the criminal bar are aware, the several propositions in Turnbull are known as the “Turnbull guidelines”. And that is what they really are. They are just guidelines and each case depend on its own facts. What was said in Turnbull does not amount to inflexible rules with no exceptions whatsoever.”
This proposition was agreed by the courts in few other cases [20,21] as the guidelines are
merely directions.[22] The court in the case of Thenegaran Murugan & Anor v. PP [23] highlighted that the main reason why the court need to approach identification evidence with caution is because of the fallibility of human observation. Moreover, the reliability and veracity of the eyewitness identification may be affected as memory is far from a faithful record of what was perceived through the sense of sight: its contents can be forgotten or contaminated at multiple stages, it can be biased by the very practices designed to elicit by emotional states associated with witnessed events and their recall.[2] Scientific Findings on Factors Affecting Accuracy of the Eyewitness Identification Evidence Human memory involves three stages which are encoding, storage, and retrieval. At each of these stages, memory can be affected by a variety of factors. [2] Drawing on the scientific research, there are a set of factors that courts should consider when deciding whether eyewitness identification evidence is reliable which are known as system variables and estimator variables.
System variables are those that affect the reliability of eyewitness identification over which the justice system has (or could have) control; whereas estimator variables are those that affect eyewitness identification reliability but the justice system can only estimate that influence after the fact rather than control it. [24] Examples of system variables include pre-lineup instructions to witnesses, suggestive comments or behaviors by lineup administrators, and characteristics of fillers used in lineups. Examples of estimator variables include whether or not the witness and the culprit are the same race, the view that the witness had of the culprit at the time of the crime, and stress or fear during witnessing. Both system and estimator variables affect the reliability of an identification. [24]
In an amicus brief filed by the American Psychological Association (APA) in the case of Commonwealth of Pennsylvania v. Benjamin Walker [25], there are 6 estimator variables were widely believed to affect the reliability of eyewitness identification were given. Below are the scientific consensus succinctly conveyed about these variables:
a. Passage of Time
Empirical research establishes that as time passes between an event and an associated identification, the identification becomes increasingly unreliable; put simply, the memory “decays.”
216
b. Witness Stress The level of stress experienced by an eyewitness at the time of exposure to the perpetrator can also affect the reliability of a subsequent identification.
c. Exposure Duration Studies have similarly demonstrated that the reliability of an eyewitness identification diminishes when the witness sees the perpetrator for only a short period of time.
d. Distance As everyday experience tells us, clarity of vision decreases with distance. Experimental research provides specifics about this relationship between distance and the ability to identify faces. The research reveals that for people with normal vision, this ability begins to diminish at approximately 25 feet, and nearly disappears by approximately 150 feet.
e. Weapon Focus Weapon focus refers to the visual attention eyewitnesses give to a perpetrator’s weapon during the course of a crime. This visual attention may reduce the eyewitness ability to later recall details about the perpetrator or to recognize the perpetrator.”
f. Cross-Race Bias
Extensive empirical research demonstrates that eyewitnesses are more accurate at identifying perpetrators of their own race than those of a different race.
The Way Forward It is safe to say that commonly considered factors by the trial judge in applying the Turnbull guidelines have been validated by the scientific studies on the estimator variables relating to the accuracy of eyewitness identification. Emerging development of human behavior also offers additional factors to be considered such as the presence of a weapon during the incident and the similarity of race of the witness and perpetrator. These important factors might assist the trial judge in reaching better evaluation on the reliability of the eyewitness identification as for such evidence to be admissible it must be reliable. Hence, a legal framework consisting comprehensive guidelines of the scientific findings on the accuracy of the eyewitness identification could be used as a medium to refer to by the trial judge in assessing the admissibility of the evidence. This legal framework would act as a precautionary measure against eyewitness misidentification that may lead to miscarriage of justice. 3. CONCLUSION
Based on the analysis made, it can be concluded that the Turnbull guidelines applied by the trial judge in Malaysia in assessing the admissibility of the eyewitness identification evidence is aligned with the emerging scientific findings on human behaviour relating to the accuracy of the eyewitness identification. Thus, for the case that depends wholly or substantially on the correctness of the eyewitness identification evidence, the trial judge shall mandatorily follow the Turnbull guidelines to evaluate the reliability of such evidence. This is to ensure the ghastly danger of eyewitness misidentification is effectively minimized.
217
ACKNOWLEDGMENT The authors would like to thank Centre of Foundation UiTM, Cawangan Selangor Kampus Dengkil for the financial support given for this research paper. REFERENCES [1] Wells, G. L., & Olson, E. A. (2003). Eyewitness testimony. Annual review of
Psychology, 54(1), 277-295. [2] National Research Council. (2015). Identifying the culprit: Assessing eyewitness
identification. National Academies Press. [3] Findley, K. A. (2016). Implementing the lessons from wrongful convictions: An empirical
analysis of eyewitness identification reform strategies. Mo. L. Rev., 81, 377. [4] R v Turnbull, QB 224 (1977) [5] Heng Aik Ren Thomas v. Public Prosecutor, 3 SLR 465 (1998) [6] Mohd Razaly Rahmad v. PP, 2 CLJ 574 (2015) [7] Suharman Mohamad Noor@Ismail v. PP, 1 LNS 2062 (2020) [8] Chew Wai Keong & Anor v. Public Prosecutor and another appeal, 3 CLJ 681 (2018) [9] Wong Soon Choon v. PP, 2 CLJ 807 (2016) [10] Kap Hua Tong v. PP, 1 LNS 874 (2019) [11] PP v. Muhammad Nur Afiq, 5 LNS 3 (2021) [12] Lim San Muk v. PP, 1 LNS 1762 (2019) [13] PP v Saiful Anuar Bin Shahabuddin, 5 LNS 20 (2020) [14] Jaafar Ali v. PP, 4 MLJ 406 (1998) [15] PP v. Mohd Sharizam Zulkifli Abdullah, 5 LNS 31 (2020) [16] Mohd Nazaruddin Khairudin v. PP, 2 CLJ 244 (2020) [17] PP v. Nazariman Bujang & Anor, 9 CLJ 437 (2016) [18] Adiswaran a/l Tharumaputrintar v Public Prosecutor and other appeals, 3 MLJ 228
(2016) [19] Muhammad Zakwan Zainuddin v. PP, 1 LNS 1908 (2019) [20] Ahmad Nazari bin Abdul Majid v. PP, 9 MLJ 297 (2009) [21] PP v. Joachim Selvanathan & Ors, 10 CLJ 488 (2009) [22] Ramalinggam, R. and Kung, K.B. (2017). Identification Parade: Current Position And
Issues In Malaysia. IEBMC 2017 8th International Economics and Business Management Conference.
[23] Thenegaran Murugan & Anor v. PP, 5 CLJ 850 (2013) [24] Wells, G. L. (2018). Eyewitness identification. [25] American Psychological Association. (2011). Brief for Amicus Curiae American
Psychological Association in support of neither party. Washington, DC: Author.

218
I-CReST 2021:144-138 – Konsep Manusia dalam Pemikiran dan Peradaban Barat
*1Wan Noor Zeiti Wan Abdul Rashid, 1Aliza Elias, 2 Mohd Razali Haron dan
1Noorkharilhuda Ibrahim
134Jabatan Pengajian Moral Sivik dan Pembangunan Karakter, Fakulti Sains Kemanusiaan,
UPSI, 35900 Tanjong Malim, Perak Darul Ridzuan 2Jabatan Pengajian Teras dan Inter-Disiplin, Kulliyyah Ilmu Wahyu dan Sains Kemanusiaan,
UIAM, 45900 Kuala Lumpur
* E-mail: [email protected]
ABSTRAK Kajian ini bertujuan meninjau konsep manusia yang merupakan tema perdebatan dan perbahasan hangat pemikir Barat sepanjang zaman. Persoalan utama kajian ialah siapakah manusia menurut Barat dan apakah kesan faham manusia Barat ini terhadap pembinaan peradaban? Justeru, kajian akan menggunakan pendekatan kualititatif dengan kaedah analisis dokumen. Beberapa sumber kepustakaan akan dikaji dan dianalisis menggunakan metod deskriptif, deduktif dan induktif. Sebagai rumusan, kajian mendapati bahawa konsep manusia Barat mempunyai takrifan pelbagai, tidak jelas dan berubah mengikut zaman serta tokoh yang mewakili sesebuah aliran pemikiran. Dasar pemikiran yang berubah daripada pandangan alam ketuhanan dan metafizik kepada pemikiran sekularisme dan modenisme menjadikan takrifan semakin rencam dan kompleks. Takrifan manusia yang bersifat nisbi (relatif) dan bergantung semata-mata kepada akal serta pengalaman pancaindera tersebut ternyata memberi kesan besar terhadap corak dan halatuju pembinaan tamadun Barat sendiri. Kata kunci: Manusia, Peradaban, Barat, Insan, Islam. 1. PENGENALAN Hakikat manusia atau insan sering diangkat sebagai tema perbahasan sepanjang sejarah peradaban Barat dan juga Islam. Di dunia Barat, pelbagai pemikir terkemuka tampil memberikan takrifan dan membahaskan hakikat sebenar manusia. Konsep atau faham manusia dalam kerangka pemikiran dan peradaban Barat moden telah melihat manusia sebagai makhluk yang bebas dan berkeupayaan penuh melakar nasib dan menentukan masa depan serta kemajuan dan peradaban tersendiri tanpa terikat dengan mana-mana peraturan terdahulu atau sebelumnya. Peraturan terdahulu dan sebelumnya termasuklah agama atau tradisi dianggap telah mengongkong dan menghalang cita-cita kemajuan dan penerokaan mereka terhadap alam. Memang benar, manusia Barat moden telah terlihat unggul dan dikagumi oleh masyarakat lain di dunia kerana kemajuan mereka dalam keadaan mereka bebas dari ikatan keagamaan dan tradisi kolot yang dikatakan membelenggu jiwa Barat di abad pertengahan Eropah.
Kajian ini akan cuba meninjau beberapa takrifan yang popular dalam kalangan tokoh terkenal dunia Barat, menyorot perubahan atau dinamika yang berlaku dalam pentakrifan,
219
hakikat, potensi dan ciri manusia dari zaman kuno hingga zaman kini hingga mencorakkan pemikiran dan halatuju kemajuan dan peradaban yang dibina.
2. SOROTAN KAJIAN LEPAS Tiga kajian terdahulu yang menjadi landasan kajian ini ialah oleh Siti Khasinah (2013), Kamal Azmi Abd Rahman et al (2014) dan Eka Kurniawati dan Nurhasanah Bakhtiar(2018). Kajian Siti Khasinah (2013) ‘hakikat manusia menurut pandangan Islam dan Barat’ telah meneliti hakikat manusia dan ciri-cirinya menurut ahli falsafah Barat. Kajian beliau membantah kecenderungan Barat melihat manusia sebagai sama dengan haiwan dan menegaskan bahawa menurut Islam manusia mempunyai potensi dalaman yang dapat dikembangkan melalui pengalaman hidup atau melalui pengajaran secara formal seperti sekolah dan lembaga pendidikan lainnya.
Kajian oleh Kamal Azmi Abd Rahman et. Al. (2014) berjudul ‘Manusia dalam Wacana Pemikiran Moden di Barat’ pula telah menghuraikan konsep manusia dan hakikat kejadiannya tokoh pemikir Barat terkenal di zaman moden. Kajian mendapati terdapat beberapa salah tanggapan tentang manusia di kalangan pemikir Barat rentetan kebergantungan mereka kepada daya yang ada pada manusia sahaja dalam usaha mendapatkan jawapan tentang manusia. Lantaran itu, kajian juga akan membahaskan pandangan tentang konsep manusia sebagai khalifah di bumi Allah yang mudah dan menyeluruh yang diberikan oleh Islam berdasarkan wahyu.
Kajian oleh Eka Kurniawati dan Nurhasanah Bakhtiar (2018) berjudul “Manusia Menurut Konsep Al-Qur’an dan Sains” telah meneroka konsep manusia dalam persfektif al-Qur’an, saintis Muslim dan saintis Barat (sekular). Tiga kesimpulan ditegaskan iaitu i) Al-Qur’an sebagai sumber ilmu telah menggambarkan bagaimana hakikat kemanusiaan mulai dari asal usul penciptaan manusia, potensi yang diberikan Allah kepada manusia dan tugas serta tujuan dari penciptaan manusia itu sendiri. ii) Manusia dalam persfektif saintis Muslim memperkuat dan membuktikan kesesuaian antara konsep al-Qur’an dan konsep ilmu pengetahuan. iii) Konsep manusia dalam perspektif sains Barat (sekular) telah menafikan unsur Tuhan dalam proses kewujudan manusia di mana konsep ini semakin melemah dan mendapat banyak bantahan dari pelbagai pihak.
Ketiga-tiga kajian di atas telah memberikan pandangan yang sangat baik dalam perspektif
Al-Qur’an dan Al-Sunnah namun kurang memberikan penekanan dari sisi tamadun dan peradaban. Justeru kajian ini berharap memenuhi jurang yang ada dengan melihat bagaimanakah konsep asal-usul dan potensi manusia Barat mampu mencorak halatuju pembangunan dalam peradaban Barat. KONSEP MANUSIA DALAM PEMIKIRAN BARAT Untuk memahami definisi tamadun Barat, kami ingin memetik takrif yang dikemukakan oleh Professor Syed Muhammad Naquib Al-Attas iaitu “sebuah tamadun yang terbina dengan kesatuan yang telah berlaku dalam sejarah dengan menggabungkan budaya-budaya, falsafah-falsafah, nilai-nilai dan cita-cita Greek dan Romawi silam, digabungkan dengan agama Yahudi dan Kristian, dan pertumbuhan dan pembentukan seterusnya dipersadurkan dengan budaya, falsafah, nilai dan cita-cita bangsa-bangsa Latin, German, Celt dan Nordik.” (Al-Attas, Zainy 2012)
220
Manusia Dalam Pemikiran Yunani Dalam kronologi perbahasan manusia sebagai satu mauduk falsafah Barat, (C.Zarina Sha’ari 2017) Plato (427SM-347SM) dan Aristotle (384SM-322SM) merupakan ahli falsafahYunani yang menjadi pelopor dan mempengaruhi begitu ramai tokoh pemikir dari zaman Yunani sehingga ke abad pertengahan Eropah dan zaman moden. Kedua-duanya memberikan sudut pandang yang berbeza tentang manusia di mana Plato menganggap manusia sebagai memiliki pengetahuan dan pemilik kepada jiwa yang abadi (man as knower and possessor of immortal soul) Berdasarkan bukti empirikal dan rasional, Plato memegang bahawa manusia terdiri daripada jasad dan ruh atau jiwa dan raga, makhluk dualis (ganda), memiliki tubuh yang "berubah," yang tidak terpisahkan dengan dunia fizikal, dan tunduk kepada takdir semua makhluk yang lain di dunia ini. (Nur Rohmah, 2016) Secara ringkasnya Plato mentakrifkan manusia sebagai ‘makhluk yang mengetahui dan pemilik kepada jiwa yang kekal’ (man as knower and possessor of immortal soul.)
Aristotle pula mentakrifkan manusia sebagai ‘rasional animal’ atau haiwan yang berakal
atau haiwan yang berfikir (Kurniawati 2018). Manusia merupakan satu juzuk daripada juzuk-juzuk alam semesta tetapi manusia bukan pusat kepada alam semesta kerana pusat alam semesta adalah kosmos. Pandangan Aristotle ini disebut kemudiannya oleh pemikir Barat sebagai sistem sfera geosentrik (geocentric spherical system).
Lebih awal daripada itu, Sorates (469- 399 BC) yang merupakan guru kepada Plato
mempunyai pandangan istimewa tentang manusia. Socrates dikatakan tidak menulis ideanya sendiri (James M. Ambury, t.t) namun ianya telah dikembangkan oleh murid-muridnya sendiri seperti Plato. Beliau berpandangan manusia adalah sebagai Zoon Politicon atau haiwan bermasyarakat (Siti Khasinah 2013) yang menonjolkan aspek sosialnya. Manusia Dalam Pemikiran Abad Pertengahan Eropah Bagi mewakili abad pertengahan Thomas Aquinas (1225-1274) dipilih sebagai tokoh falsafah zaman skolastik. Seorang pemikir Kristian yang disegani, St. Thomas Aquinas merupakan tokoh yang mengharmonikan di antara dua fahaman yang bercanggah iaitu rasional dan empirikal yang kemudiannya membentuk aliran Thomism. Dari segi hakikat kejadian manusia, Thomas Aquinas berpandangan bahawa manusia terdiri daripada dua unsur iaitu jasad dan ruh. Ruh manusia adalah lebih utama dan terpisah daripada jasad. Namun untuk menjadikan diri manusia lengkap, ruh perlu berhubungan dengan jasad. Bagi Aquinas lagi, kemanusiaan (humanity and quiddity) itu adalah hakikat sebenar manusia dan bukan ruhnya (soul). Ini kerana humanity atau quiddity (form of the whole) itu mengandungi kedua-dua unsur form and matter di mana ruh adalah sebahagian daripadanya (form of the part). Oleh itu ‘quiditty of man’ itu berbeza daripada ruh manusia. (Valentine Ehichioya Obinyan 2012)
Dari sudut fungsi dan tanggungjawab manusia dan nasib diri, Thomas Aquinas menyatakan diri manusia adalah ‘damns sui’ iaitu tuan kepada kewujudan dan diri seseorang sendiri. Pandangan beliau ini bermaksud kewujudan manusia adalah hasil perbuatannya sendiri berdasarkan ilmu dan kehendak diri. Ini kerana daya intelektual yang dimiliki manusia yang merupakan ciri khusus membezakan manusia dengan makluk lain. Menurutnya, kepemilikan diri (self-pocession) di sini berlaku dalam tiga susunan iaitu mempunyai: (i) Ilmu Pengetahuan (kesedaran kendiri atau self conciousness), (ii) Kehendak atau penentuan nasib sendiri (iii) Tindakan atau tanggungjawab terhadap tindakan sendiri. (Ralph McInerny 2014).
221
Manusia Dalam Pemikiran Moden (Bermula Zaman Renaissance) Perkembangan pemikiran di zaman moden memperlihatkan cubaan untuk menjelaskan hakikat manusia dalam pelbagai perspektif yang boleh diringkas seperti berikut:
i. Pandangan Psikoanalitik: Dalam pandangan psikoanalitik diyakini bahawa pada hakikatnya manusia digerakkan oleh dorongan-dorongan dari dalam dirinya yang bersifat instingtif. Hal ini menyebabkan tingkah laku seorang manusia diatur dan dikontrol oleh kekuatan psikologis yang memang ada dalam diri manusia. Terkait hal ini diri manusia tidak memegang kendali atau tidak menentukan atas nasibnya seseorang tapi tingkah laku seseorang itu semata-mata diarahkan untuk mememuaskan keperluan dan insting biologisnya.
ii. Pandangan Humanistik: Para humanis atau pendokong falsafah humanisme Barat
menyatakan bahawa manusia memiliki dorongan-dorongan dari dalam dirinya untuk mengarahkan dirinya mencapai tujuan yang positif. Mereka menganggap manusia itu rasional dan dapat menentukan nasibnya sendiri. Hal ini membuat manusia itu terus berubah dan berkembang untuk menjadi pribadi yang lebih baik dan lebih sempurna. Manusia dapat pula menjadi anggota kelompok masyarakat dengan tingkah laku yang baik.
iii. Selain dorongan manusia juga mempunyai tanggungjawab dan keinginan untuk mendapatkan sesuatu samada secara individu atau berkelompok. Dalam hal ini terdapat 3 pandangan utama iaitu oleh Martin Buber dan kelompok behavioristik
iv. Martin Buber (1878-1975) berpandangan bahawa manusia adalah sejenis eksistensi
atau kewujudan yang memiliki potensi namun dibatasi oleh kesejagatan alam. Namun begitu, keterbatasan ini hanyalah bersifat faktual dan bukannya esensial sehingga apa yang bakal dilakukannya tidak dapat dijangka. Oleh yang demikian, manusia berpotensi menjadi baik atau sebaliknya bergantung kepada kecenderungan mana yang lebih dominan dalam diri manusia. Hal ini menjelaskan kenapa manusia baik mampu melakukan kesalahan dalam keadaan tertentu.
v. Kelompok Behavioristik pada dasarnya beranggapan manusia adalah makhluk yang
reaktif dan tingkah lakunya dikendalikan oleh faktor-faktor dari luar dirinya iaitu lingkungannya. Lingkungan merupakan faktor dominan yang mengikat hubungan individu. Hubungan ini diatur oleh hukum-hukum belajar, seperti adanya teori conditioning atau teori pembiasaan dan keteladanan. Mereka juga meyakini bahwa baik dan buruk itu adalah karena pengaruh lingkungan.
vi. Kelompok Organismik memandang manusia sebagai suatu keseluruhan (gestalt) yang
lebih daripada penjumlahan juzuk-juzuk (bahagian-bahagian). Dalam pandangan ini dunia dianggap sebagai sistem yang hidup seperti halnya tumbuhan dan binatang. Organismik menyatakan bahawa pada hakikatnya manusia bersifat aktif, keutuhan yang terorganisasi dan selalu berubah. Manusia menjadi sesuatu karena hasil dariapa yang dilakukannya sendiri, karena hasil mempelajari
vii. Pandangan Kontekstual pula menyatakan manusia hanya dapat dipahami dalam
konteksnya. Manusia tidak kendiri (independent), melainkan merupakan sebahagian dari lingkungannya. Manusia adalah individu yang aktif dan organisme sosial. Bagi
222
memahami manusia secara utuh perlulah dilakukan pemerhatian terhadap gejala-gejala fisik, psikis, dan juga lingkungannya, serta peristiwa-peristiwa budaya dan historis. (Siti Khasinah 2013)
viii. Pandangan mekanistik berpendapat semua benda yang ada di dunia ini termasuk
makhluk hidup dipandang sebagai sebagai mesin, dan semua proses termasuk proses psikologi pada akhirnya dapat diredusir menjadi proses fizik dan kimia. Lock dan Hume, berdasarkan andaian ini memandang manusia sebagai robot yang pasif yang digerakkan oleh daya dari luar dirinya. Menurut penulis pendapat ini seperti menafikan keberadaan potensi diri manusia sehingga manusia hanya mampu digerakkan oleh kekuatan yang ada dari luar dirinya.
3. DAPATAN DAN PERBINCANGAN: Takrifan, Asal-Usul dan Hakikat Kejadian Manusia Berdasarkan kajian lepas, terdapat sekurang-kurangnya sepuluh (10) takrifan utama manusia iaitu: i) sebagai haiwan berfikir yang menonjolkan aspek kerasionalannya ii) haiwan yang bersifat ramah yang menonjolkan naluri interaksi sosialnya, iii) makhluk yang berasal dari langit di mana ia berkaitan dengan Adam yang dicampakkan dari syurga kerana termakan pujukan Syaitan dan iv) haiwan bereksistensi yang merupakan takrifan berdasarkan teori evolusi Darwin. (Mohammad Thalib 1977 di dalam Kamal Azmi 2014). v. Homo sapiens atau makhluk yang mempunyai akal budi; vi. Homo faber atau Tool Making Animal iaitu makhluk yang pandai membuat bentuk peralatan dari bahan alam untuk keperluan hidupnya; vii. Homo economicus atau makhluk ekonomi; viii. Homo religious iaitu makhluk beragama; dan ix. Homo laquen atau makhluk yang pandai menciptakan bahasa dan menjelmakan pikiran dan perasaan manusia dalam kata-kata yang tersusun (Khasinah 2013) serta x. Homo homini lupus iaitu manusia yang suka memakan atau memangsa manusia lain yang disebut canibalisme oleh Thomas Hobbes (1588-1879 M). Enam definisi terakhir di atas adalah menggunakan istilah homo dengan maksud manusia (man atau human).
Berdasarkan kajian, persoalan yang ditimbulkan dan dipertikaikan oleh pengkaji sebelumnya ialah mengapakah pemikir Barat cenderung menyamakan manusia dengan haiwan (Siti Khasinah 2013, Eka Kurniawati et al.2018). Penggunaan perkataan animal dalam kajian mereka seperti haiwan rasional (Aristle), haiwan ekonomi atau economic animal (Karl Marx), haiwan didik atau animal educandum (M.J. Langeveld) dan haiwan simbol atau animal symbolicum (Ernst Cassirer) (Richard T. De George. 1966N., k., & Firdaus, M. A. 2021, Tchertov, L. 2019). Kenapa bukan dari sudut kemanusiannya yang lebih tinggi iaitu kerasionalannya yang ditekankan oleh Barat? Pada pandangan pengkaji kecenderungan ini mungkin timbul akibat pengaruh teori evolusi Darwin yang dianuti oleh kebanyakan pemikir dan saintis Barat Moden. Namun begitu, penggunaan perkataan animal dalam bahasa Inggeris merupakan terjemahan kepada perkataan hayawan dalam bahasa yang lebih sesuai diterjemahkan sebagai ‘hidupan’ bila merujuk kepada manusia (Al-Attas).
Persoalan seterusnya yang ingin dijawab ialah: Adakah manusia dicipta atau terjadi dengan
sendirinya atau berevolusi? Secara umumnya terdapat dua aliran utama dalam memperkatakan asal kejadian manusia iaitu i. manusia diciptakan dan ii. manusia berevolusi daripada species lain. Aliran pertama iaitu creationism atau disebut sebagai science creation percaya bahawa
223
manusia itu diciptakan. Pandangan ini berkemungkinan merupakan pengaruh daripada agama Kristian di Barat.
Pandangan kedua iaitu teori Darwin atau Darwinisme merupakan pandangan yang sangat
berpengaruh di dunia Barat moden hasil sokongan sains dan masyarakat berfahaman sekular. Gagasan teori Darwin mendapat sambutan hangat dalam kalangan saintis atau kalangan empiris walaupun ternyata teori tersebut mempunyai kekurangan khususnya dalam konteks ‘missing link’ yang diperkatakan. Walaupun asas utama teori dikatakan telah terbatal oleh penemuan ilmiah selepasnya dan yang tinggal hanyalah garis besarnya sahaja, Eka Kurniawati (2018) namun kecenderungan malahan obsesi terhadap teori ini masih lagi wujud. Satu keadaan yang agak pelik kerana Darwin sendiri menyatakan ketidakpastian beliau tentang teori tersebut kerana wujud kelompongan (missing link) dalam menghubungkan species satu sel (amoeba) dengan species manusia. (Thanukos, A. 2009) Penulis berpandangan adakah manusia Barat terlalu taksub dengan sains atau penafian terhadap bertuhan itu begitu mengakar sekali dalam jiwa mereka?
Daripada Darwinisme, dua kelompok besar muncul iaitu kelompok pendokong evolusi
(evolutionist) dan kelompok finalisme. Kelompok Finalisme mengasaskan pandangan mereka pada terhentinya pertambahan volume otak jenis manusia moden. Dikatakan bahawa pertambahan volume dan penyempurnaan otak ada hubungannya dengan perkembangan kecerdasan. Dipercayai Australopithecus memiliki volume otak 450 cm3 sedangkan Homo Neabderthalensis mencapai volume otak 1,450 cm3 hasil evolusi selama 400-500 ribu tahun yang menunjukkan pertambahan volume otak manusia kuno sebanyak 1000 cm3. Namun agak pelik dan menimbulkan persoalan ialah kenapa volume otak manusia kini tetap dan tidak bertambah volumenya yang secara jelas berlawanan dengan hukum Darwin. Pada pandangan finalisme, dengan terhentinya evolusi organ tubuh manusia yang amat penting dalam diri manusia, maka terhentilah pula evolusi pada jenis manusia. Tujuan evolusi menurut kaum finalisme, ialah untuk mewujudkan manusia, atau pada manusialah finalnya (berakhirnya) proses evolusi. (Kurniawati 2018) Bagi pengkaji alasan dan hujahan Finalisme tentang terhentinya evolusi otak manusia, secara sendirinya menyokong tentang manusia itu diciptakan sebagai seyang didakwasudah menjawab bahawa teori evolusi Darwin adalah
Sedikit latar belakang mengenai teori Darwin, Anaximender (611–546 SM) ahli falsafah
Ionia telah menyebabkan timbulnya perdebatan dalam kalangan penyokong evolusi (evolutionis) dan penentangnya (creationist) bahawa teori evolusi sebenarnya telah bermula seawal zaman pra Socrates Greek. Benarkah Anaximender adalah pencetus kepada teori evolusi yang muncul dan terkenal beratus tahun kemudian di zaman moden bersama Darwin? Dibahaskan bersama dengan bukti bahawa Anaximender telah mengembangkan idea gurunya Thales dari Miletus (640–546 SM) tentang asal-usul hidupan adalah air. Anaximender mengatakan bahawa manusia berevolusi daripada ikan atau bentuk seperti ikan. Manusia seakan ikan ini kemudiannya telah keluar daripada air dan menanggalkan sisiknya untuk tinggal di darat. (Benno Zuiddam 2018)
Melihat kepada perbahasan yang hanya berteraskan sangkaan akal dan bukti saintifik yang
longgar, pemikir Barat mengambil jalan mudah dengan melompat kepada kesimpulan bahawa manusia itu berevolusi daripada species sedia ada dan bukannya diciptakan sebagaimana kemudiannya sebahagian pemikir Barat terutama ahli falsafah gereja di zaman skolastik menerima konsep penciptaan manusia di syurga oleh Tuhan yang dinamakan Adam (Bible: Genesis 2: 7) yang kemudiannya diturunkan ke dunia bersama Hawa kerana peristiwa
224
perlanggaran perintah (Genesis 2:17) Daripada detik diturunkan Adam dan Hawa itu, maka bermula keturunan manusia berkembang menjadi bermasyarakat, bersuku dan berbangsa. Keadaan pemikiran dan pandangan alam Barat yang berubah kepada penolakan wahyu dan kerohanian sebagai sumber epistemologi telah bermula dengan kebangkitan dan kesedaran tentang ilmu dan sains di zaman renaissance. Ini telah menyebabkan ketamadunan dan peradaban Barat telah terbina di atas asas sekularisme yang bersifat ‘human centric’ atau pemusatan kepada manusia semata-mata. Ianya telah beralih secara total daripada ‘god-centric’ dan mendominasi pemikiran mereka untuk melakar zaman baharu atau digelar sebagai zaman moden.
Dalam perspektif Islam pula, Islam menolak teori evolusi atau idea di mana manusia itu
berevolusi daripada species monyet (ape) yang berkembang menjadi manusia moden. Secara jelas manusia itu diciptakan (Surah al-‘Alaq 96:1-5) oleh Allah dengan kuasa dan kehendaknya sendiri tanpa wujud unsur paksaan atau sebarang kebetulan proses penciptaan manusia. Allah menegaskan di dalam sebuah hadis qudsi bahawa “Akulah perbendaharaan yang tersembunyi dan Kuingin agar dikenali; maka aku jadikan Makhluk Semesta agar dapat aku kenali.”(Petikan terjemahan dari buku Al-Attas, Faham Agama dan Asas Akhlak)
Secara hakikatnya manusia atau lebih tepat disebut ‘insan’ adalah ciptaan Allah yang
mempunyai dua unsur iaitu jasad dan ruh. Manusia dianugerahkan ilmu namun ilmu manusia adalah terbatas sehingga dia tidak mampu mengetahui rahsia tentang dimensi ruhani yang merupakan dimensi hakikat dirinya yang sejati. Namun dengan ilmu ini manusia mampu mengetahui tentang Penciptanya Yang Esa dan bahawasanya Tuhannya itu adalah sebenar-benar Tuhan yang layak disembah. Kesemua ilmu ini telah diperolehinya di alam mithaq di mana telah termeterai perjanjian taat setianya terhadap Tuhannya (Al-A’raf 7: 172). Namun begitu manusia telah lupa akan perjanjian ini kerana ianya berlaku sebelum dia dilahirkan ke dunia. Lantaran itulah manusia disebut sebagai ‘insan’ kerana ‘kealpaan’nya tentang perjanjian dengan Penciptanya. Pada pandangan Al-Attas (1995) ilmu dan agama adalah sesuatu yang telah tertanam secara semulajadi di dalam diri anak Adam dan itulah fitrah asal yang diciptakan Allah.
Pada pandangan pengkaji, perbahasan tentang konsep sebelum zaman moden, sarjana
Barat juga seperti Plato dan Aristotle serta Thomas Aquinas masih lagi mempunyai jentikan kerohanian atau metafizik dalam pandangan falsafah mereka tentang manusia. Antaranya Plato mengatakan man as knower and possessor of immortal soul yang menjelaskan bahawa unsur kedua bagi manusia yang merupakan misteri bagi dunia moden iaitu ‘soul’ masih diiktiraf dan mendapat perhatian. Begitu juga dalam pandangan Thomas Aquinas yang mewakili pemikiran abad pertengahan, turut membahaskan tentang isu hubungan jasad dan ruh, ruh (form of the part) sebagai sebahagian daripada jasad yang melengkapkan kemanusiaan (humanity and quiddity) yang merupakan form of the whole. Peranan Manusia dan Tujuan Hidup Di Dunia Dalam pemikiran Barat moden secara umumnya matlamat hidup manusia itu tidak sepakat dan tidak jelas. Sebahagian besar berpandangan matlamat hidup adalah untuk memenuhi kehendak diri sendiri atau sekurang-kurang menepati fungsi hidup bermasyarakat dan berhubungan dengan hidupan lain yang dinamakan haiwan atau alam semulajadi. Bagi penganut secular humanism misalnya tujuan hidup manusia adalah untuk hidup itu sendiri dan ianya ditentukan oleh manusia. Umpamanya hidup bermaksud menikmati setiap detik
225
kehidupan selagi bernyawa. Lalu apakah maksud hidup itu secara yang lebih mendalam. Apakah wujud tuhan di dalam tujuan hidup golongan ini? Jawapannya tiada. Neraca kebenaran sesuatu nilai yang dipilih adalah manusia itu sendiri dan tiada suatu nilai pun yang mutlak. ‘Man is the measure of all things’ adalah falsafah warisan Protagoras dari golongan sophist yang wujud sedari zaman Yunani lagi (Sholarin M.A. et.all 2015). Ideologi yang mengangkat faham liberalisme dalam kalangan manusia ini mempamerkan tiada nilai universal yang mutlak dan wajib dianuti oleh semua individu dalam sesebuah peradaban. Hasil pemikiran yang mengatakan agama dan nilai moral mutlak adalah satu perangkap atau berfungsi sebagai ‘escapism’ manusia yang telah berputus asa untuk hidup. Faham secular humanism ini mendapat sambutan dan semakin diterima oleh masyarakat dari sehari ke sehari. (Zuckerman 2020) Pengkaji berpandangan secular humanisme tidaklah menyelesaikan masalah manusia bahkan menghasilkan penisbian nilai dan lebih banyak pertelagahan dan perpecahan sesama manusia muncul akibat tiada lagi autoriti dalam kehidupan. Ianya lama kelamaan boleh membawa kepada kematian agama dan tuhan sebagaimana ungkapan Nietszche ‘God is Dead’!
Dalam perspektif Islam, manusia tidak diciptakan dengan sia-sia melainkan dengan satu
tujuan utama iaitu mengabdikan diri kepada Penciptanya. Inilah tujuan penciptaan yang tertinggi iaitu beribadat kepada Allah. Perjalanan hidup dan kegiatan manusia di dunia adalah satu bentuk ibadat yang perlu ditunaikan oleh manusia. Manusia perlu merasakan betapa terhutang budinya dengan Allah kerana menganugerahkannya kewujuda diri, budi dan daya kepadanya. Lalu dengan keinsafan tentang hal tersebut membawa dirinya kepada keterikatan (takluk) dan penyerahan mutlak kepada Allah secara rohani dan jasmani melalui pematuhan terhadap segala hukum hakam dan syariat Allah. Hasil penyerahan diri yang dilakukan secara mutlak tersebut akan menyerlahkan sifat keinsanan sejati dan pengembalian manusia kepada fitrahnya yang asal. (Al-Attas 2019) Inilah yang dimaksudkan dengan faham agama atau al-Din di dalam Islam. Oleh yang demikian hidup bukanlah dijalani sekadar untuk memenuhi waktu tetapi diisi dengan ibadah dan pengabdian kepada Allah.
Tujuan kedua utama manusia di dunia dikaitkan dengan tugasnya sebagai ‘khalifah’ yang
merupakan tugas dan amanah yang sangat berat untuk ditunaikan. Namun begitu Allah memuliakan manusia dalam keseluruhan makhluk itu dengan kurniaan akal fikiran dan anugerah penciptaan yang paling sempurna. (Surah al-Tin 95:4 ) Melalui kurniaan akal dan anugerah kedudukannya sebagai makhluk Allah paling sempurna ciptaannya, (al-Baqarah: 3-34) menjadi satu ujian besar dari Allah kepada manusia untuk menggunakan akal dan kedudukannya yang mulia itu sebagai khalifah bagi menegakkan keadilan dan menghindari dirinya daripada melakukan kezaliman (al-An’am: 165) serta menghapuskan ketidakadilan yang berleluasa di dunia ini. (Al-Attas 2019)
Potensi Manusia dan Pembinaan Tamadun Friedrich Wilhelm Nietzsche (1844-1900) pendokong idea nihilisme dan penggegar dunia kristian dengan idea monumentalnya ‘God is dead’ telah mengetengahkan idea manusia unggul atau manusia super (ubermensch) yang berkehendak dan berkeinginan diri untuk berkuasa (will to power)(Nanuru R. F ). Idea beliau ini bertujuan mengajak manusia untuk mengalihkan fokus dan menikmati kehidupan dunia dan meninggalkan tujuan kehidupan selepas mati yang dianggap sebagai ilusi dan tidak pasti.
Nietszche dalam gagasannya tentang ubermench (superman) telah mengetengahkan idea
existensialisme dan pemikiran mendalam psikologi manusia tentang tips membentuk masa
226
hadapan dengan tanggungjawab sepenuhnya terhadap diri sendiri. Ciri manusia ubermench adalah yang hanya mengatakan ‘ya’ kepada diri sendiri dan bersedia mengahadapi segala kemungkinan yang bakal terjadi. Terdapat empat langkah asas yang perlu dikuti iaitu: Jangan mengikut kata-kata lingkungan atau masyarakat (‘Don’t follow the ‘herd mentality’) Pandangan Nietsche agak skeptikal tentang mentality herd. Beliau beranggapan kebenaran dan nilai sejagat hanyalah ekspresi atau hasil luahan peribadi orang yang memperjuangkannya. Bagi beliau nilai-nilai tersebut adalah hasil aturan masyarakat yang ‘rigid’ bagi menghasilkan ‘herd mentality’. Iaitu ‘kesamaan, keselesaan dan mengekalkan kelompok tertentu (sameness, comfort and preservation of its population). Kod atau aturan moral adalah ciptaan masyarakat bertujuan mengawal tingkah laku manusia. Walaupun ianya dapat menghalang sikap melampau namun ianya tidak bagus untuk pembinaan peribadi dan kreativiti. Hukuman salahlaku manusia berdasarkan dogma yang keras mampu menjadikan individu itu semakin memberontak yang akan menatijahkan sikap anti sosial atau mungkin tindakan lebih buruk lagi.
Pada pandanggan pengkaji, apabila idea Nietszche bergabung dengan idea aliran
eksistensialisme yang mengatakan manusia mampu melonjakkan maknanya sendiri tanpa berpandu kepada agama atau tradisi terdahulu. Gaya pemikiran skeptikal dan penolakan tradisi dan agama ini sangat berpengaruh dan mewujudkan sebahagian manusia yang berjaya dan unggul namun keunggulannya hanyalah untuk diri sendiri dan berkemungkinan besar tidak mengindahkan masyarakat apabila masyarakat menjadi faktor penghalang kepada cita-cita peribadinya. Pendek kata, penganut eksistensialisme yang menganggap manusia itu dilahirkan tanpa panduan dalam hidup dan tanpa sifat kerohanian serta ditugaskan hanya untuk mencari makna dalam kehidupannya sendiri akan cenderung bercita-cita tinggi dan menyuburkan sikap individualistik. Keadaan ini mampu mengancam ketamadunan manusia dan membunuh keadilan sejagat. Obsesi untuk berjaya dan cita-cita peribadi untuk menakluki dunia dan menambah kuasa mampu mengorbankan golongan tidak berdaya dan lemah dalam pelbagai sektor kehidupan terutama dalam bidang politik dan ekonomi.
Khurshid Ahmad (1995) dalam tulisannya Man and Future Civilization mengkritik
manusia moden yang menguasai teknologi dan kemajuan akal fikiran dan sains namun semakin rakus mengejar kepentingan diri dan memutuskan segala hubungan dengan tradisi dan agama. Keghairahan melakar dunia baharu melalui idea dan kehendak nafsunya telah menjadikan lebih banyak kekecewaan berlaku dalam kalangan manusia termasuk golongan lemah dan miskin. Dunia sepatutnya menjadi lebih aman namun realiti adalah sebaliknya. Beliau memperkatakan bahawa manusia:
“Although he has shown his ability to fly in the air like the birds, and to swim in the oceans like the fish, he has fails his ability to live on the earth as a good human being.”
Memang benar apa yang dinukilkan oleh Khurshid Ahmad tersebut. Manusia menjadi
rakus sejak sekian lama bermula dari era penciptaan teknologi lagi dan berlarutan sehingga kini. Kesannya sangat nyata dengan krisis alam sekitar dan ekologi dihadapi keseluruhan masyarakat dunia hari ini sehinggakan kempen kesedaran besar-besar terpaksa dilakukan demi menyelamatkan bumi dan hidupan serta alam sekitar. Kini agenda SDGs telah menjadi agenda dan tanggungjawab sejagat bagi menyelamatkan bumi daripada masalah yang dicipta oleh Barat sendiri. Jika diperhalusi, keandaan yang berlaku ini berpunca daripada pemikiran manusia sendiri iaitu Rene Descartes (1596-1960) dan Isaac Newton (1642-1727). Melalui falsafah Cartesian-Newtonian yang disebarkan, alam dianggap sebagai tidak lain daripada sebuah mesin besar yang tidak bernyawa, mati dan statik. Semua yang di luar tubuh manusia dianggap
227
sebagai mesin berkerja menurut hukum matematik yang bersifat kuantitatif. Alam dipandang sebagai mesin mati tanpa makna simbolik dan kosong tanpa rasa rohani dan erti keindahan. Alam dipandang dengan pandangan benar-benar hampa dan sepi. Pandangan sedemikian menatijahkan eksploitasi alam dengan rakusnya oleh manusia Barat dengan bantuan alat jentera canggih demi mengaut keuntungan material berlipat ganda. Hasilnya timbullah pelbagai krisis alam sekitar termasuk kemusnahan hutan, tanah runtuh, gempa bumi dan pelbagai lagi bencana alam dan pemanasan global. (Noor Hisham 2021)
Secara akar umbinya, masalah di atas adalah bertitik tolak dari pandangan bahawa manusia
Barat telah bebas dan berjaya menemukan jiwa baru melalui ‘renaissance’ itu. Lantaran itu manusia Barat begitu teruja dan mula membebaskan diri mereka daripada segala ikatan agama atau ketuhanan serta tradisi kolot yang dianggap menghalang kemajuan dan pembangunan yang ingin mereka capai. Kelahiran pelbagai falsafah Barat berteraskan sekularisme dan kebebasan seperti liberalisme, materialisme, antroposentrisme, utilitarianismedan kapitalisme di samping pemartabatan akal rasional dan sains empirikal memberi lonjakan kepada Barat untuk menuju kepada zaman yang lebih gemilang dan meninggalkan masa lampau yang gelap dan penuh tragik. Melalui perkembangan ilmu sains dan teknologi yang saling sokong menyokong sehingga melahirkan pelbagai teknologi moden dalam bentuk komunikasi serta penciptaan alat-alat senjata, Barat telah mampu keluar dari zaman kemunduran menuju kepada zaman pembaharuan yang lebih terang sinarnya. Leslie White (m.1975) pernah menulis tentang evolusi budaya bagaimana budaya baharu telah terbina dan akan terus berkembang hasil penguasaan manusia terhadap teknologi yang digambarkan melalui istilah ‘culturology’ (White 2007). Kini usaha memartabatkan manusia Barat sebagai satu-satunya kuasa di dunia yang tidak dapat dikalahkan telah berjaya dilakukan dengan jayanya.
4. KESIMPULAN Kefahaman tentang manusia adalah sesuatu yang mendasar dalam Islam di mana perbahasannya termasuk dalam aspek aqidah yang membentuk pandangan alam Islam berdasarkan sumber epistemologi yang tertinggi iaitu Al-Qur’an dan Al-Sunnah. Justeru itu tiada pertikaian dalam kalangan pemikir Islam tentang hakikat sebenar manusia termasuk asal-usul, tujuan manusia, kedudukan dan tanggungjawab manusia dalam kehidupannya di dunia. Hal ini bercanggah dengan Barat di mana konsep manusia itu tidak sama dan mengalami perubahan mengikut tokoh tertentu pada zaman tertentu. Perubahan dasar ini banyak bergantung kepada corak pemikiran dan pandangan alam yang mendasari setiap bermula dari dasar agama sehinggalah kepada dasar sekularisme dan modenisme yang menolak peranan agama dan kerohanian dalam halatuju peradaban dan kehidupan insan. Bertitik tolak daripada kefahaman tentang konsep manusia tersebut maka lahirlah ciri perbezaan yang ketara dalam dasar pembinaan dan halatuju peradaban bagi Islam dan Barat. Dapat difahami bahawa pandangan tentang manusia yang dibentuk daripada asas pemikir sekular berpusatkan manusia mampu menjadikan diri manusia rakus dan lupa diri terhadapnya sebagai khalifah penegak keadilan dan pembentuk peradaban manusia yang unggul.
228
RUJUKAN Achmad Charris Zubair, TT. Kebebasan Manusia Menurut Konsep Islam. Jurnal Filsafat
Disember 1994: 1-13. Che Zarrina & Mohd Manawi, “Beberapa Persoalan Berkaitan Konsep Insan,”Afkar Vol. 19
Special Issue (2017):87-114 Internet Encyclopaedia of Philosophy https://iep.utm.edu/socrates/ Leslie A White 2007. The Evolution of Culture: The Development of Civilization to the Fall of
Rome. Khurshid Ahmad 1995. Man and The Future of Civilization: An Islamic Perspective.
Encounters: Journal of Inter-Cultural Perspectives. Vol 1. No 1 March 1995: 39-55. Eka Kurniawati., Nurhasanah Bakhtiar. 2018. Manusia Menurut Konsep Al-Qur`an dan Sains.
JNSI: Journal of Natural Science and Integration, Vol. 1, No. 1, April 2018: 78-94 N., k., & Firdaus, M. A. (2021, April 12). Manusia Sebagai Animal Educandum.
https://doi.org/10.31219/osf.io/gmfsy Noor Hisham Md Nawi. 2020. Modul Falsafah dan Isu Semasa. Kota Bharu: Penerbit UMK. Ralph McInerny. 2014. https://plato.stanford.edu/entries/aquinas/ Sholarin, Muyiwa Adeniyi, Wogu, Ikedinachi Ayodele Power, Omole, Funke, Agoha, Benedict
Emerenwa Agoha (2015). “Man Is The Measure Of All Things”: A Critical Analysis Of The Sophist Conception Of Man. Research on Humanities and Social Sciences. Vol.5, No.4: 178-185. www.iiste.org ISSN (Paper)2224-5766 ISSN (Online)2225-0484 (Online)
Nur Rohmah. 2016. Konsep Manusia Menurut Plato (Relevansinya Dengan Ajaran Islam). Tesis Sarjana Muda (S1) http://eprints.walisongo.ac.id/id/eprint/5826
Richard T. De George. (1966) Morality, ethics and East‐European Marxism. Inquiry 9:1-4, pages 11-29.
Martin Buber. Satnford Encyclopaedia of Philosophy. https://plato.stanford.edu/entries/buber/ S.M.N. Al-Attas. 1995. Prolegomena to The Metaphysics of Islam. Kuala Lumpur:
International Institute of Islamic Thought and Civilization. S.M.N. Al-Attas. 2019. Islam Faham Agama dan Asas Akhlak. Kuala Lumpur: Ta’dib
International. Siti Khasinah. Hakikat Manusia Menurut Pandangan Islam Dan Barat. Jurnal Ilmiah Didaktika
Februari 2013. VOL. XIII, NO. 2: 296-317 Thanukos, A. 2009. Darwin’s “Extreme” Imperfection?. Evo Edu Outreach 2: 84–89.
https://doi.org/10.1007/s12052-008-0105-0 Tchertov, L. 2019. “Animal Symbolicum” in the Natural and Cultural Semiospheres.
Philosophy study, 9. Valentine Ehichioya Obinyan, Ph.D. (2012). The Controversy With The Concept Of Man In
Western And African Philosophy: A Comparative Analysis. Volume 2012, Article Id Sjsa-231, 11 Pages. Doi: 10.7237/Sjsa/231
Zuckerman, Phil. (2020) What Is Secular Humanism? : A Positive, Ethical, Non-Religious Orientation. Psychology Today. https://www.psychologytoday.com/us/blog/the-secular-life/202002/what-is-secular-humanism
229
I-CReST 2021:151-147 – Al-Quran and Environmental Preservation: A Specific Study on Water Conservation
1Mohd Takiyuddin Ibrahim, 2Huzaimah Hj Ismail, *1Ahmad Jamil Jaafar, 1Mohd
Shahrudin Mohmud
1Centre of Foundation Studies, Universiti Teknologi MARA, Cawangan Selangor, Kampus Dengkil, 43800, Dengkil, Selangor
2Akademi Pengajian Islam Kontemporari (ACIS), Universiti Teknologi MARA, 40450, Shah Alam, Selangor
*E-mail: [email protected]
ABSTRACT There are many verses of the Quran that explain the importance of the environment to all living creatures in this world. Among the important elements of environmental preservation is water conservation. The objective of this study is to examine the Quran’s emphasis on the importance of water and its conservation. Water is not only used in various forms of human daily activities such as drinking, bathing and washing, but water is also important in economic activities such as industry, manufacturing and transportation. The importance of water can be seen in the fact that 60 percent of the human body is water and most of the amount of water is found in human cells. In addition, about 71 percent of the earth's surface is water-covered. Even the water on the earth moves constantly from one place to another and from one form to another, and without this cycle, the earth will lose its balance. The method of this study is a qualitative study of the literature by analyzing information from the verses of the Quran and the debate of scholars related to them. The impact of this study proves that water is indeed essential for all life on earth and humans are responsible for constantly maintaining and preserving water quality as it is the lifeblood of all beings in this world. Keywords: Conservation, Environment, Lifeblood, Quran, Sustainable, Water 1. INTRODUCTION Many verses of the Quran that describe the importance of the environment to human life and creatures in this world. The emphasis of the Quran on the importance of the environment can clearly be seen from the naming of several surahs in the Quran that take the elements found in the environment, such as Surah al-Baqarah, Surah al-An'am, Surah al- Fiil, Surah al-'Adiyaat, Surah al-Ankabut and Surah al-Naml (al-Qaradawi, 2001, p. 54). In addition, some elements of the environment are also touched directly in the Quran; such as the term ard (earth or land) mentioned 459 times, the term ma' (water) mentioned 59 times, and sama' (sky) mentioned 120 times (Zahari Mahad Musa, 2010).
According to Haliza Abdul Rahman (2019), al-Quran and al-Sunnah have indeed given a serious emphasis on the care of the environment, which these two sources of legislation call on human beings to maintain its preservation as a gift or favor of Allah SWT. Islam as a comprehensive religion, prohibits any form of pollution, in addition urges us to utilize the

230
treasures of nature, which this noble endeavor is praised by Islam, in fact it is considered a great worship in the sight of Allah SWT.
The ‘environment’ in English refers to everything that is near or around us (Miranda Steel, 2004, p. 266). In addition, it also means the surrounding conditions or circle. Based on the literal translation, the word ‘environment’ refers to anything that surrounds and encompasses human (‘Imaaduddin Abdul Halim & Noor Shakirah Mat Akhir, 2016).
In Arabic, environment is referred to as al-bi’ah which means environment, circle, or surroundings (Mohd Khairi Zainuddin et.al., 2007, p. 385). The term al-biah according to Lisan al-‘Arab means the house of a tribe located in a valley. In addition, it can also be interpreted as the softness of a place because of the beautiful environment (Ibn Manzur, t.t). Another definition of the environment is the surroundings of human life. These surroundings are produced through the values of life that have the sources of life such as food, clothing, medicine, and shelter. Interactions and relationships among human beings are also found in these surroundings (Yunus Ibrahim Ahmad Muzid, 2009, p. 31).
The preservation of the environment is also emphasized in Islam. This is based on the verses of the Quran that call on human beings to take care of the environment. Furthermore, human beings are created with one of the elements of nature, namely soil. Even so, the verses found in the Quran do not specifically mention ways to take care of the environment but there are hundreds of Quranic verses about the environment that demand us to think. Allah SWT talks about water, sky, earth, land, hills, mountains, environmental phenomena, moon, stars, and sun, all of which, among others, are for us to be grateful and appreciate all the creations. Allah SWT says in Surah Hud verse 61:
ن ٱألرض وٱستعمركم فیہا ھو أنشأكم م
“It is He Who hath produced you from the earth and want you to prosper it…”
According to Zaid ibn Aslam in al-Jami` li Ahkam al-Quran (al-Qurtubi, 2006, p. 149), the term 'prospering nature' means ‘Allah SWT commands you to bring prosperity to nature based on your needs such as building a home and plant trees.’
In addition, Quran also talks a lot about the damage and pollution of nature associated with
human actions. Among them in Surah al-Rum verse 41:
یرجعون ظھر ٱلفساد فى ٱلبر وٱلبحر بما كسبت أیدى ٱلناس لیذیقھم بعض ٱلذى عملوا لعلھم “Calamities have appeared on land and sea because of what the hands of the people have earned, so that He (Allah) makes them taste some of what they did, in order that they may
return (to the right way)”
In Tafsir al-Jami` li Ahkam al-Quran (al-Qurtubi, 2006), al-Qurtubi quoted a view that says these calamities refer to syirk. Whereas Ibn `Abbas referred the damage in this verse to the murder of Habil by Qabil. Moreover, there was a view that this damage refers to drought and loss of blessings, in addition to committing immorality, robbery, and tyranny. Similarly, the opinion put forward by ʻAtiyyah who referred the damage to the lack of income from marine products due to the existence of disasters. In conclusion, these damages involve spiritual damages such as committing shirk and tyranny, while the lack of marine products due to disasters such as the existence of pollution and so on refers to physical damages.

231
Mawil Izzi Dien (Mawil Izzi Dien, 2000, p. 24) in discussing the concept of environment in Quran stated that ‘environment’ refers to the word ma‘ayish (residence/dwelling). The term refers to the environment in which to live, have food and have animals and plants. These three elements are interrelated and have a relationship with each other in life.
Comprehensively, environmental conservation is the process of caring and preserving the environment from any damage or something that can cause defects and harm. Various efforts need to be made to maintain a balanced environment and maintain its fertility for the survival of human life and other life in this world. Therefore, the universe and the stability of its ecosystems are due to human attitudes whether giving good or bad effects. This is because the human behaviour and actions that affects the balance of nature or cause damage and destruction to the environment. 2. WATER ACCORDING TO THE QURAN The word ‘water’ is repeated in the Quran 63 times with the word (ماء) and this repetition covers 41 surahs, namely al-Baqarah: 22, 74, 164., al-Nisa ': 43., al-Ma'idah: 6. , al- An'am: 99., al-A'raf: 50, 57., Al-Anfal: 11., Yunus: 24., Hud: 7, 43, 44., al-Ra'd: 4, 14, 17., Ibrahim 16, 32., al-Hijr: 22, al-Nahl: 10, 65., al-Kahfi: 29, 41, 45., Taha: 53., al-Anbiya ': 30, al -Haj: 5, 63., al-Mu'minun: 18., an-Nur: 45., al-Furqan: 48, 54., al-Naml: 60., al-Qasas: 23., al-Ankabut : 63, al-Rum: 24., Luqman: 10., al-Sajadah: 8, 27., Fatir: 27., al-Zumar: 21., Fussilat: 39., al-Zukhruf: 11., Muhammad: 15., Qaf: 9., al Qamar: 11, 12, 28., al-Waqi'ah: 31, 68., al-Mulk: 30., al-Haqqah: 11., al-Jin: 16., al-Mursalat: 20, 27., al Naba ': 14.,' Abasa: 25., al-Tariq: 6., Hud: 44., al-Nazi'at: 31 (Abdul Baqi, 1996, pp. 779-780). Based on an analysis, a study related to the Quran's emphasis on water stated that 0.945% of the content of the Quran talks about water, while the words referring to rivers are 52 times (0.78%) and verses related to springs, rain and clouds not less than five times (0.075%) for each such water source (Ahmad Zaharuddin Sani Ahmad Sabri, 2004).
Such are the facts related to water and the hydrology of other water sources such as rivers, seas, rain, clouds, wind, and other water sources. The emphasis illustrates Allah SWT's recognition of water as the most important resource in the life of His creatures. In fact, Allah SWT has explained the nature of water in the Quran which is the origin of all life on earth. The justification recognizes water as the most important creature of Allah SWT to preserve life and other creatures. Allah SWT says in Surah al-Anbiya verse 30:
ء حى وجعلنا من ٱلماء كل شى
“…and We created from water all living thing…” Al-Tabari (al-Tabari, 2001, pp. 16: 254-260) stated that the verse explains that Allah SWT
gives life to all living things with water sent down from the sky, and in other words all life is created from the element of water. Al-Qurtubi, on the other hand, in explaining the verse brings three parables. First, Allah SWT created everything from water. Second, preserving all life with water, while the third is the origin of all living things created from water (al-Qurtubi, 2006, pp. 14:195-198).

232
Allah SWT says in Surah Hud verse 7:
وٲت وٱألرض فى ستة أیام ـ ۥ على ٱلماء وڪان عرشھ وھو ٱلذى خلق ٱلسم “He is the one who created the heavens and the earth in six days, while His throne was on
water…”
According to tafsir scholars, this verse proves that water is one of the earliest creatures created by Allah SWT. This fact is explained when Allah SWT places His throne on the water (Ibn Kathir, 2008) (Qutb, 2000). Thus, through this interpretation it can be concluded that water already existed before the creation of other beings including humans, heaven, and earth (al-Khalidi, 2017) (al-Shatibi, 2001).
In conclusion, the function and position of water from the Islamic point of view is that it is the source of all kinds of life on earth. Fertility and sustainability of life are highly dependent on water. In fact, the statement is not just a theory and information because Islam places great emphasis on the application and pure action along with sincere norms. 3. WATER USE AND WATER USAGE IN DAILY LIFE In Quran and Sunnah, it has been explained about the function of water to life and its importance in ensuring the survival of all beings and the balance of the ecosystem. To control quality, Islam also teaches its believers about the morals or ethics of water use because the way water is used also affects water quality. Every Muslim is responsible for using water in a rational and equitable manner.
According to Nooh Gadot (2002) water is a blessing towards the hasanah (goodness) of the world and the hasanah of the hereafter that needs to be managed as best as possible because it will be questioned in the hereafter. Table 1 below summarizes the use of water based on the variation of Quranic verses:
Table 3.1: Water Use According to the Quranic Perspective
NO WATER USE SURAH
1 As a drink for humans and animals as well as nourishing plants.
Al-Nahl (16): 10 Al-Waqi`ah (56): 17-
21.
2 Physical cleansing agents (self, clothing, and residence) and spiritual cleansing agents (from demonic interference).
al-Muddathir (74): 4 Al-Anfal (9): 11
3 Nourish nature, green the landscape and balance the ecosystem.
Al-Nahl (16): 65 al-Rum (30): 24 al-Hajj (22): 63
4 Sources of livelihood through economic activities such as agriculture, farming, and fishery.
Al-Baqarah (2): 22 al-Jathiyah (45): 12 al-Ma’idah (5): 96
5 Medium of communication between regional and international.
Luqman (31):31
6 Development of knowledge. al-Mulk (67): 30 Source: (Mohd Istajib Mokhtar & Raihanah Abdullah, 2012)

233
According to the table above, it is shown that the priority to be given in water uses application; starting with the human uses, then for animal uses and lastly for agriculture purposes (Walid A. Abderrahman, 2000).
Referring to the aspect of water usage, there are many arguments that suggest the practice of frugality, using water in partnership and using water reasonably without polluting it. Islam emphasizes moderation which is not too wasteful and not too stingy. Imam Bukhari narrated from Anas RA: “The Prophet (ملسو هيلع هللا ىلص) used to perform ablution with one mudd of water.” (Al-Bukhari, 2000, p. 19). Mudd of water in the hadith referred to content of a rectangular container about 10 cm high (Taqi al-Din Abu Bakr, 2001, p. 50) equivalent to 750 milliliters (Al-Bassam, 2007, p. 1/34). Excessive use of water or too little in using it is contrary to the sunnah of the Prophet SAW and the general prohibition of the words of Allah SWT in Surah al-A`araf verse 31:
ۥ ال یحب ٱلمسرفین إنھ وال تسرفوا
“…And do not be extravagant, surely He does not like the extravagant”.
The meaning of extravagance (israf) is more than modest limits of known and commonly used. Abu Dawud (Abu Dawud, 2000, p. 1229) narrated, the Prophet Muhammad said: "There will be among my people, the people who are extreme when performing ablution and pray". A person may be considered unkind and unjust for having violated the Sunnah shown by the Prophet Muhammad SAW. Regarding bathing, Imam Bukhari (Al-Bukhari, 2000, pp. 22-23) narrated from Jabir RA: 'The Prophet ( ملسو هيلع هللا ىلص) uses to take three handfuls of water, pour them on his head and then pour more water over his body.'
The message contained in all the above propositions is the same, which is to save water consumption and use water in a reasonable amount. For people living in countries with high rainfall such as Malaysia, they tend to waste water because it is easy to get it due to lack of awareness that water resources are limited. This fact has been stated in Surah al-Mukminun verse 18 which states that the rain is sent down according to the limits of measure as Allah SWT says:
ھ فى ٱألرض و ـ درون أنزلنا من ٱلسماء ماء بقدر فأسكن ـ وإنا على ذھاب بھۦ لق
“And We sent down water from sky in due measure, then We lodged it in the earth, and of course We are able to take it away.”
According to Abu Bakar Yang (2007) atmospheric humidity takes 12 days to replenish,
river water takes 20 days, while groundwater takes hundreds of years.
At international level, this frugal practice has been assimilated in resolving the water crisis through The Convention on the Law of the Non-Navigational Uses of International Watercourses. Articles 5 and 6 of the convention emphasize the concept of ‘equitable and reasonable utilization’ (Bernard J. Wohlwend, 2010). This concept states that everyone has the right to a water supply. In addition, the use of water must also be appropriate and used only for needs that bring benefits. This is to avoid wastage of water. This concept of equitable and reasonable utilization exists for countries that share the same water resources or rivers with an emphasis on distributive justice. The basic principle of water use emphasizes the aspect of partnership in social institutions, and this coincides with the words of the Prophet SAW narrated by ibn Majah (2000, p. 2625):

234
والنار والكأل الماء في ثالث في شركاء الناس
“Humans are partners in three things: water, pasture and fire.”
4. HUMANS` ROLE IN WATER CONSERVATION According to Ahmad Zaharuddin Sani (2004), al-Quran and al-Sunnah are the main references in producing a legislation that can be used as a guideline for life. The purpose of the formation of Islamic law is to look at the welfare of society as a whole across time, place, or certain groups only. In fact, it is also a guide to protect the rights of future generations, especially in obtaining the rights to use water. It is also a guideline that has been agreed upon by the majority of scholars who are recognized for their views by the community to be used as the basis of guidance that is al-qawaid al-fiqihiyah (Islamic legal maxims) related to management for a country.
Islamic law has laid down the principles of environmental conservation and it becomes the duty of every individual, society, government through the agencies involved and the global community. It is the duty of the individual and society that must be performed towards Allah SWT because the human beings have the rights to utilize the resources of the environment. This benefit is a common right between individuals in the community. Every individual has the right to take advantage of natural resources that can meet his or her needs without disregarding the rights of others. This right coincides with the words of Allah SWT in Surah al-Qamar verse 28:
حتضر ونبئہم أن ٱلماء قسمة بینہم كل شرب م
“And tell them that the water is to be divided between them: each one`s right to drink being brought forward (by suitable turns).”
Rasulullah SAW emphasized that water is one of the three natural resources that should be
shared together (Ibn Majah, 2000):
والنار والكأل الماء في ثالث في شركاء الناس “Humans are partners in three things: water, pasture and fire.”
When an individual does damage to the resources, then it is obligatory for him to remove
the damage in order to maintain the benefits/goodness because any damage can be an obstacle to the rights of others (Ahmad Dahlan Salleh, 2013).
Also included is the duty of every individual in the society is not to waste and not being excessive in using natural resources, and not to damage any resources without any particular interest or mutual benefits derived from it. Allah SWT says in Surah al-A`araf verse 31:
ۥ ال یحب ٱلمسرفین إنھ وال تسرفوا
“…And do not be extravagant, surely He does not like the extravagant”.
Rasulullah SAW passed by Sa'd when he was performing ablution, and he said: “What is this extravagance?”. He said: “Can there be any extravagance in ablution?”. He said: “Yes, even if you are on the bank of a flowing river." (Ibn Majah, 2000).
Among their obligations is also not to cause damage to nature in general and not to damage it in any way. Everyone must also preserve the environment, soil, water, air, and others. They
235
must work together, by controlling everyone not to cause damage to the environment. Prophet Muhammad SAW said in the hadith narrated by Ibn Majah (2000):
ال ضرر وال ضرار
“There should be neither harming nor reciprocating harm.”
According to Ahmad Dahlan Salleh (2013), the duty of leaders or governments towards the conservation of the environment and resources is to treat the harm and pollution that occurs, as well as to take precautionary measures before they occur. This shows that Islamic ethics related to the preservation of the environment is so closely related to the concepts of tauhid (faith), caliphate and 'abd (worship) which ultimately forms a concrete theory in ensuring the preservation and conservation of the environment (Haliza Abdul Rahman, 2019).
Considering all of these, Islamic law always demands Muslims to do good deeds and
always avoid doing damage and destruction (Mohd Nor Mamat, 2002) including to the environment generally and water specifically.
5. CONCLUSION
In Islam, human life involves the relationship between human and Allah SWT, human with human and human with nature. Therefore, in order to preserve the environment, each of us as part of community members should return to Islamic teachings. The task of preserving the environment is not an option, rather is an obligation claimed by Islam. If seen from a wider scope in the current context, Islam prevents Muslims from polluting water resources with something that is harmful to nature and humans.
This prohibition coincides with the authentic hadith narrated by al-Bukhari (2000),
Rasulullah SAW said: ال یبولن أحدكم في الماء الدائم الذي ال یجري، ثم یغتسل فیھ.
“You should not pass urine in stagnant water which is not flowing then (you may need to) wash in it.”
This hadith indicates that Islam is very concerned with the hablu min al-alam (relationship
with nature) coincides with the opinion expressed by Azizan Ramli (2010) that the concept of morality and hygiene of nature is very clearly shown in Islam. But because of not practicing this honorable morals or values, some of us arbitrarily pollute water sources such as rivers and lakes with toxic waste and industrial waste that are harmful to all aquatic life and exposing consumers to dangers and poisoning. According to Ang Kean Hua (2015), it is predicted that the vulnerability of the quality and quantity of water in the future will be the main determinant of the quality of human life and other organisms on earth. The advancement of technology and the adoption of sustainable development concepts in human life can only reduce river water pollution from continuously occur just in a very small percentage. But human greed and selfishness cause water pollution occur continuously.
In confronting this issue, education about the environment is a step or platform for the realization of a sustainable relationship, because environmental education can provide explanation of ecology, hydrology, human habitats, flora and fauna and natural changes. Every individual must cultivate the determination to be an agent of change in order to ensure
236
environmental sustainability. Abu Hurairah RA narrated that Rasulullah SAW said (Muslim, 2000):
:فقال طریق، ظھر على شجرة بغصن رجل مر ین و� الجنة فأدخل یؤذیھم ال المسلمین عن ھذا ألنح
“A person while walking along the path saw the branches of a tree lying there. He said: By Allah, I shall remove these branches from this path, so that these branches may not do harm
to the Muslims, and he was admitted to Paradise”. REFERENCES [1] ‘Imaaduddin Abdul Halim & Noor Shakirah Mat Akhir. (2016). Tafsir Ayat-Ayat al-Quran
Berkenaan Penjagaan Alam Sekitar dan Analisis Isu-isu Alam Sekitar di Malaysia. Afkar Vol. 18 Issue 1, 91 - 130.
[2] Abdul Baqi, M. F. (1996). Mu’ajam al-Mufahras li alfadzh al-Quran al-Karim. Kaherah: Darul Hadis.
[3] Abu Dawud, S. i.-A. (2000). Sunan Abi Dawud’ dalam Salih ‘Abd al-‘Aziz, Mawsu’ah al-Hadith al-Syarif, al-Kutub al-Sittah. Riyadh: Dar al-Salam li al-Nasyr wa al-Tawzi’.
[4] Abu Hasan Ali. (2005). Ensiklopedia Pendidikan Sains dalam al-Quran. Kuala Lumpur: Emedia Publication.
[5] Ahmad Dahlan Salleh. (2013). Konsep Penjagaan dan Pemuliharaan Alam Sekitar Menurut Perspektif Islam. Isu Syariah dan Undang-undang, Siri 19, 122 - 141.
[6] Ahmad Zaharuddin Sani Ahmad Sabri. (2004). Nilai Pengurusan Air Secara Islam dalam Komuniti Dalam Pascamodenism. Seminar Antarabangsa Nilai Dalam Komuniti Pasca Modenisme (SIVIC 2004). Sintok, Kedah: UUM Press.
[7] Al-Bassam, A. A. (2007). Tawdhih al-Ahkam min Bulugh al-Maram. Kaherah: Jannat al-Afkar.
[8] Al-Bukhari, M. i. (2000). ‘Sahih Bukhari’, dalam Salih ‘Abd al-‘Aziz, Mawsu’ah al-Hadith al-Syarif, al-Kutub al-Sittah. Riyadh: Dar al-Salam li al-Nasyr wa al-Tawzi’.
[9] al-Khalidi, S. ‘.-F. (2017). Oh Begitu Rupanya Kisah Nabi Adam ‘Alaihissalam Cerita Sahih Dari Langit. Terj: Azrul Azlan & A. Hadi ‘Abd ‘Aziz. Ampang: al-Khalidi Global Resources.
[10] al-Qaradawi, Y. (2001). Ri`ayat al-Biah fi Syariat al-Islam. Kaherah: Dar al-Syuruq. [11] al-Qurtubi, M. i. (2006). al-Jami` li Ahkam al-Quran. Beirut, Lubnan: Muassasah al-
Risalah. [12] al-Shatibi, I. b.-G. (2001). al-Muwafaqat fi Usul al-Shari’ah. Beirut: Dar al-Kutub al-
’Ilmiyah. [13] al-Tabari, A. J. (2001). Jami’ al-Bayan An Ta’wil Ayyi al-Qur‘an, ed. ‘Abd Allah bin
‘Abd al-Muhsin al-Turki,. Kaherah: Dar al-Hijrah. [14] Ang Kean Hua. (2015). Kualiti Sumber Air di Malaysia: Satu Analisis. GEOGRAFIA
OnlineTM Malaysia Journal of Society and Space 11, Issue 6, 98 - 108. [15] Azizan Ramli. (2010). Membudayakan Minda Lestari Dalam Pengurusan Alam Sekitar.
Kuantan: Penerbit Universiti Malaysia Pahang. [16] Bernard J. Wohlwend. (2010, Januari 1). Equitable Utilization and the Allocation of
Water Rights to Shared Water Resources. Didapatkan dari bjwconsult: http://www.bjwconsult.com/EQUITABLE.PDF
[17] Er Ah Choy, N. A. (2015). Kesedaran Awam Terhadap Pemeliharaan dan Pemuliharaan Alam. GEOGRAFIA OnlineTM Malaysian Journal of Society and Space 11 Issue 8,
237
Themed Issue on Attitudinal and Institutional Dimensions of Malaysia’s Development, 13-26.
[18] Falkenmark, M. &. (2006). The New Blue and Green Water Paradigm. Breaking New Ground for Water Resources Planning Management. Journal of Water Resources Planning and Management 132(3), 129 - 132.
[19] Feitelson, E. (2012). What is Water? A Normative Perspective. Water Policy 14, 52 - 64.
[20] Haliza Abdul Rahman. (2019). Anda & Alam Sekitar. Serdang, Selangor: Penerbit UPM.
[21] Haliza Abdul Rahman. (2019). Kesyumulan Islam dalam Aspek Pemeliharaan Alam Sekitar. Jurnal Sultan Alauddin Sulaiman Shah, 353 - 365.
[22] Ibn Kathir, A. a.-F.-D. (2008). Tafsir Ibn Kathir. Terj: Abu Ahsan al-Atsari & Abu Ahsan Sirojuddin Hasan Bashri. Bogor: Pustaka Ibnu Katsir.
[23] Ibn Majah, M. i. (2000). Sunan Ibn Majah” dalam dalam Salih ‘Abd al-‘Aziz, Mawsu’ah al-Hadith al-Syarif, al-Kutub al-Sittah. Riyadh: Dar al-Salam li al-Nasyr wa al-Tawzi’.
[24] Ibn Manzur, M. i. (t.t). Lisan al-‘Arab. Beirut: Dar al-Dar. [25] Jabatan Alam Sekitar Malaysia. (2012). Malaysia Environmental Quality Report.
Didapatkan dari Ministry of Natural Resources and Environment:: http://enviro.doe.gov.my/view.php?id=558.
[26] Jabatan Pengairan dan Saliran Malaysia. (2009). Study on the River Water Quality Trends and Indexes in Peninsular Malaysia. Water Resources Publication, No. 2.
[27] Mawil Izzi Dien. (2000). The Environmental Dimensions of Islam. Cambridge: The Lutterworth Press.
[28] Miranda Steel. (2004). New Oxford Dictionary, terj. Zubaidah Abdul Rahman. Shah Alam: Fajar Bakti Sdn. Bhd.
[29] Modul Islam & Pemeliharaan Sungai. (2019). Kuala Lumpur: International Institute of Advanced Islamic Studies (IAIS) Malaysia.
[30] Mohd Istajib Mokhtar & Raihanah Abdullah. (2012). Islamic Law of Water: Comparative Analysis of the Quality Aspects of Water. Jurnal Syariah. Jil 20. Bil 2, 187-220.
[31] Mohd Khairi Zainuddin et.al. (2007). Kamus al-Miftah. Seremban: al-Azhar Media. [32] Mohd Nor Mamat. (2002). Prinsip dan Etika Islam Dalam Pemuliharaan Alam Sekitar.
Jurnal Tasawwur Islam. 5 , 71 -81. [33] Muslim, H. A.-Q.-N. (2000). Sahih Muslim, in Mawsu’at al-Hadith al-Sharif al-Kutub
al-Sittah, ed. Salih bin ‘Abd al-‘Aziz al-Shaykh. Riyadh: Dar Salam. [34] Nooh Gadot. (2002). Konsep Air dalam Islam. Seminar ‘Air Anugerah Tuhan’. Kuala
Lumpur: Institut Kefahaman Islam Malaysia (IKIM). [35] Norhibah Hasan Zawawi. (1999). Konsep Islam terhadap Pemuliharaan Alam Sekitar.
Putrajaya: Jabatan Perdana Menteri: Jabatan Kemajuan Islam Malaysia. [36] Persatuan Pengguna Air dan Tenaga Malaysia. (2017, Mac - April). Apakah Air
Basuhan? Majalah PENTING. [37] Qutb, S. (2000). Tafsir Fi Zilalil Qurʾan. Terj: Yusoff Zaky Haji Yacob. Kota Bharu:
Pustaka Aman Press. [38] Shihab, Q. M. (1997). Wawasan al-Quran Tafsir Maudhu’i atas Pelbagai Persoalan
Umat. Bandung: Penerbit Mizan. [39] Taqi al-Din Abu Bakr. (2001). Kifayah al-Akhyar fi Halli Ghayah al-Ikhtisar. Beirut:
Dar al-Kutub al-‘Ilmiyyah. [40] Walid A. Abderrahman. (2000). Application of Islamic Legal Principles for Advanced
Water ManagemenT. Water International, 25/4, 514.

238
[41] Yang, A. B. (2007). Air. Alam Sekitar Anugerah Tuhan, vol 3, 26. [42] Younger, P. L. (2012). Water: All That Matters. London: Hodder & Stoughton. [43] Yunus Ibrahim Ahmad Muzid. (2009). Al-Bi’ah fi al-Islam. Riyadh: Dar al-Hamid. [44] Zahari Mahad Musa. (2010). Fiqh al-Bi’ah ; Prinsip Interaksi Manusia Dengan Alam
Persekitaran. Jurnal Syariah, Jil. 18, Bil. 1, 4-5.

239
I-CReST 2021:161-165 – Perceptions and Views of Pre-University Students about Physics
*1Noorakmar Hidayah Mohamed Hashini, 1Nur Sa’aidah Ismail, 2Nur ‘Ain Hamdan
1,2 Centre of Foundation Studies, Universiti Teknologi MARA, Cawangan Selangor,Kampus
Dengkil,Selangor,Malaysia 2Centre of Foundation Studies, Universiti Teknologi MARA, Cawangan Selangor,Kampus
Dengkil,Selangor,Malaysia
*E-mail: [email protected]
ABSTRACT STEM is designed and introduced in the effort to educate students in four specific disciplines; Science, Technology, Engineering and Mathematics in an interdisciplinary and applied approach. Rather than teach the four disciplines as separate and discrete subjects, STEM integrates them into a cohesive learning paradigm based on real-world applications. However, the number of students enrolling in these areas are decreasing significantly every year. This trend is worrying despite the fact that STEM-related positions being among the top emerging jobs. This study investigates the perceptions and views of pre-tertiary university students at a local institution on physics subject. This study was conducted to discuss physics specifically because compared to Biology and Chemistry, Physics is the least favourite subject and it has been established that there are many challenges associated with physics teaching and learning. This paper presents the views of the students, and looks in more detail at how the students’ family and educational background as well as their learning experience affect their perceptions of the physics subject. A comparison was also made between the responses of female and male students. This online survey was conducted among foundation students from 2019/2020 and 2020/2021 sessions. A total of 410 students responded to the survey. The questionnaire consists a vast spectrum of questions including 54 questions on factors influencing students’ choice of physics-related courses at university and 12 questions on sociodemographic. Frequency and percentage were used to present categorical data. Pearson’s chi-squared test was used to test statistically significant differences between two groups for categorical data. Mean and standard deviation were used to present the continuous data. T-test was used to compare the mean difference between the two groups. Association between the decision in choosing physics as their choice and other study variables was measured by using logistic regression analysis. The findings of this research can be used to improve the teaching and learning of physics and make the existing physics program more attractive and preferable for students. Keywords: Physics; perceptions; interests, education 1. INTRODUCTION
Science, Technology, Engineering and Mathematics (STEM) is a curriculum that was designed to educate students in the four disciplines in an interdisciplinary and applied approach. In the Malaysia Education Blueprint, the initiative to strengthen STEM education is mentioned
240
explicitly. STEM education is important as it helps to create critical thinkers, increases science literacy and enables the next generation of innovators. This is why STEM education has since been a national agenda by the Education Ministry because the knowledge and skills learned in these areas are crucial to provide the foundation to produce quality and sufficient human capital required to drive the economy. The aim of STEM education is to produce STEM literate students who are able to identify, understand problems, proposed solutions accordingly, as well as being creative, innovative and inventive. However, despite STEM-related positions being among the top emerging jobs, the number of students taking STEM subjects is decreasing significantly and this trend is worrying [3]. Of all the subjects taught in STEM, Physics is the least favourite subject among students. Perhaps this is because of the lack of understanding of what physics is, combined with the subject’s difficulty, as well as the methods used to teach the subject that tends to discourage students from studying physics. Lack of exposure on the careers and other benefits that may stem from studying Physics may also contribute to this declining number [1,4]. Physics is an essential part of science and technology as it enhances our understanding of other disciplines such as biology, chemistry, geology, agriculture, mathematics, information technology, and biomedical sciences.
The importance of physics to society can be seen in our reliance on technology. Many
aspects in our life would not have been possible without the scientific discoveries made in the past as those discoveries became the foundation on which the current technologies and advances were developed. For example, the current situation has forced us to resort to tools such as Google Meet, Zoom, Webex and many other applications not only to connect with family and friends but also to get our daily supplies. To develop these technologies requires a person to be innovative, creative, to think critically and analytically, and to have good problem-solving skills. These are the skills that are taught and trained to students taking up physics. Physics helps in generating the necessary knowledge that will contribute in maintaining and developing stable economic growth. Therefore, physics and the sciences prove to play a crucial role for sustainable development. In this study, a quantitative analysis was employed by using students from diverse backgrounds and this study has also investigated factors that affects the perceptions and views of the young generation on physics.
2. METHODS This survey was conducted among foundation students from 2019/2020 and 2020/2021 sessions. A total of 410 students responded to the survey. The questionnaire consists of 54 questions on factors influencing students’ choice of physics related-courses for tertiary education and 12 questions on sociodemographic.
Frequency and percentage were used to present categorical data. Pearson’s chi-squared test was used to test statistically significant differences between two groups for categorical data. Mean and standard deviation were used to present the continuous data. A t-test was used to compare the mean difference between the two groups [6].
Association between the decision in choosing physics as their choice and other study variables were measured by using logistic regression analysis. Firstly, the odds ratio (OR) and their 95% confidence interval (CI) were computed to assess the univariate associations between the outcome of interest and potential factors [2]. Factors with a p-value less than 0.25 were included in the multivariable regression model. Gender remained in the multivariable models due to its significance. Stepwise logistic regression was used to conduct the multivariable
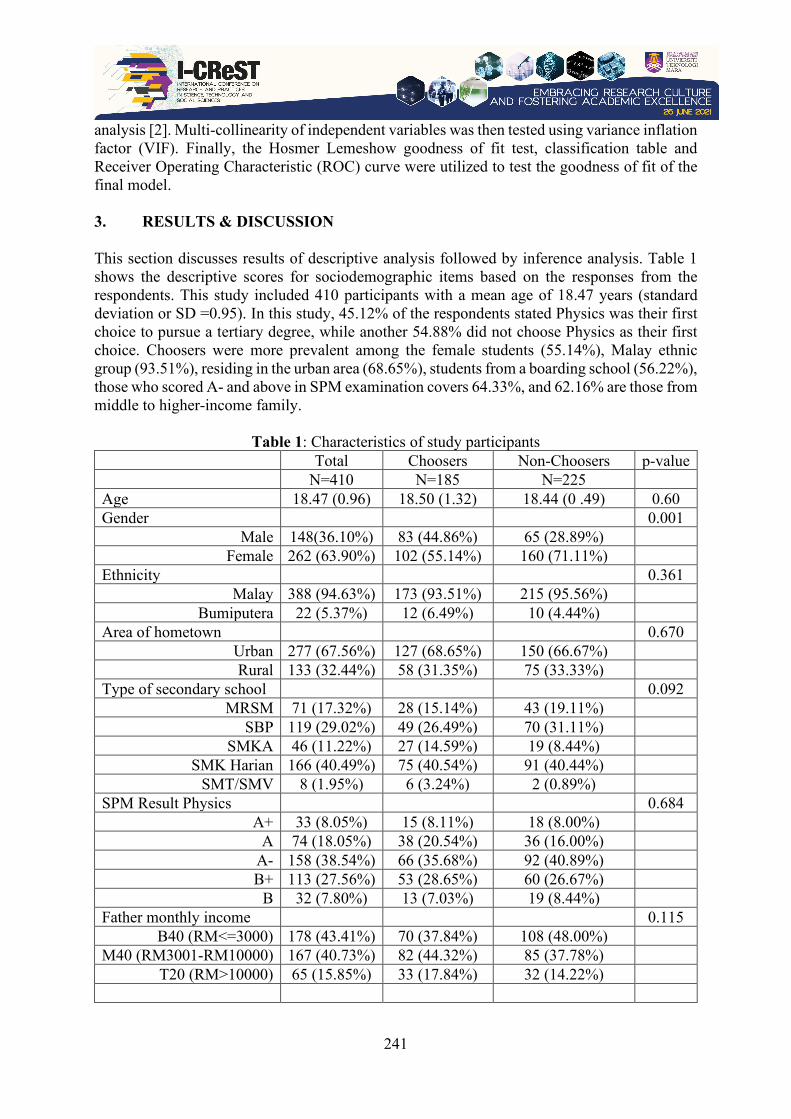
241
analysis [2]. Multi-collinearity of independent variables was then tested using variance inflation factor (VIF). Finally, the Hosmer Lemeshow goodness of fit test, classification table and Receiver Operating Characteristic (ROC) curve were utilized to test the goodness of fit of the final model.
3. RESULTS & DISCUSSION This section discusses results of descriptive analysis followed by inference analysis. Table 1 shows the descriptive scores for sociodemographic items based on the responses from the respondents. This study included 410 participants with a mean age of 18.47 years (standard deviation or SD =0.95). In this study, 45.12% of the respondents stated Physics was their first choice to pursue a tertiary degree, while another 54.88% did not choose Physics as their first choice. Choosers were more prevalent among the female students (55.14%), Malay ethnic group (93.51%), residing in the urban area (68.65%), students from a boarding school (56.22%), those who scored A- and above in SPM examination covers 64.33%, and 62.16% are those from middle to higher-income family.
Table 1: Characteristics of study participants Total Choosers Non-Choosers p-value
N=410 N=185 N=225 Age 18.47 (0.96) 18.50 (1.32) 18.44 (0 .49) 0.60 Gender 0.001
Male 148(36.10%) 83 (44.86%) 65 (28.89%) Female 262 (63.90%) 102 (55.14%) 160 (71.11%)
Ethnicity 0.361 Malay 388 (94.63%) 173 (93.51%) 215 (95.56%)
Bumiputera 22 (5.37%) 12 (6.49%) 10 (4.44%) Area of hometown 0.670
Urban 277 (67.56%) 127 (68.65%) 150 (66.67%) Rural 133 (32.44%) 58 (31.35%) 75 (33.33%)
Type of secondary school 0.092 MRSM 71 (17.32%) 28 (15.14%) 43 (19.11%)
SBP 119 (29.02%) 49 (26.49%) 70 (31.11%) SMKA 46 (11.22%) 27 (14.59%) 19 (8.44%)
SMK Harian 166 (40.49%) 75 (40.54%) 91 (40.44%) SMT/SMV 8 (1.95%) 6 (3.24%) 2 (0.89%)
SPM Result Physics 0.684 A+ 33 (8.05%) 15 (8.11%) 18 (8.00%)
A 74 (18.05%) 38 (20.54%) 36 (16.00%) A- 158 (38.54%) 66 (35.68%) 92 (40.89%) B+ 113 (27.56%) 53 (28.65%) 60 (26.67%)
B 32 (7.80%) 13 (7.03%) 19 (8.44%) Father monthly income 0.115
B40 (RM<=3000) 178 (43.41%) 70 (37.84%) 108 (48.00%) M40 (RM3001-RM10000) 167 (40.73%) 82 (44.32%) 85 (37.78%)
T20 (RM>10000) 65 (15.85%) 33 (17.84%) 32 (14.22%)
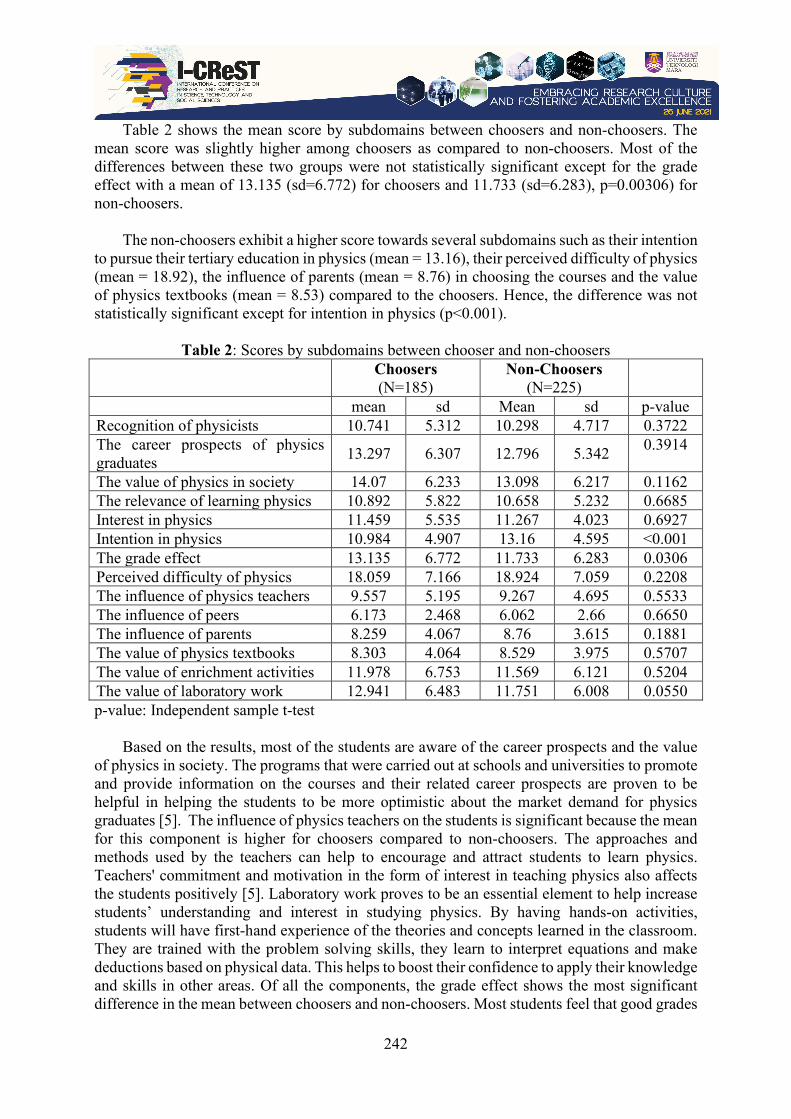
242
Table 2 shows the mean score by subdomains between choosers and non-choosers. The mean score was slightly higher among choosers as compared to non-choosers. Most of the differences between these two groups were not statistically significant except for the grade effect with a mean of 13.135 (sd=6.772) for choosers and 11.733 (sd=6.283), p=0.00306) for non-choosers.
The non-choosers exhibit a higher score towards several subdomains such as their intention
to pursue their tertiary education in physics (mean = 13.16), their perceived difficulty of physics (mean = 18.92), the influence of parents (mean = 8.76) in choosing the courses and the value of physics textbooks (mean = 8.53) compared to the choosers. Hence, the difference was not statistically significant except for intention in physics (p<0.001).
Table 2: Scores by subdomains between chooser and non-choosers Choosers
(N=185) Non-Choosers
(N=225)
mean sd Mean sd p-value Recognition of physicists 10.741 5.312 10.298 4.717 0.3722 The career prospects of physics graduates 13.297 6.307 12.796 5.342 0.3914
The value of physics in society 14.07 6.233 13.098 6.217 0.1162 The relevance of learning physics 10.892 5.822 10.658 5.232 0.6685 Interest in physics 11.459 5.535 11.267 4.023 0.6927 Intention in physics 10.984 4.907 13.16 4.595 <0.001 The grade effect 13.135 6.772 11.733 6.283 0.0306 Perceived difficulty of physics 18.059 7.166 18.924 7.059 0.2208 The influence of physics teachers 9.557 5.195 9.267 4.695 0.5533 The influence of peers 6.173 2.468 6.062 2.66 0.6650 The influence of parents 8.259 4.067 8.76 3.615 0.1881 The value of physics textbooks 8.303 4.064 8.529 3.975 0.5707 The value of enrichment activities 11.978 6.753 11.569 6.121 0.5204 The value of laboratory work 12.941 6.483 11.751 6.008 0.0550 p-value: Independent sample t-test
Based on the results, most of the students are aware of the career prospects and the value of physics in society. The programs that were carried out at schools and universities to promote and provide information on the courses and their related career prospects are proven to be helpful in helping the students to be more optimistic about the market demand for physics graduates [5]. The influence of physics teachers on the students is significant because the mean for this component is higher for choosers compared to non-choosers. The approaches and methods used by the teachers can help to encourage and attract students to learn physics. Teachers' commitment and motivation in the form of interest in teaching physics also affects the students positively [5]. Laboratory work proves to be an essential element to help increase students’ understanding and interest in studying physics. By having hands-on activities, students will have first-hand experience of the theories and concepts learned in the classroom. They are trained with the problem solving skills, they learn to interpret equations and make deductions based on physical data. This helps to boost their confidence to apply their knowledge and skills in other areas. Of all the components, the grade effect shows the most significant difference in the mean between choosers and non-choosers. Most students feel that good grades

243
help them remain motivated and strengthen their interest in studying physics [5]. Therefore, it is crucial to introduce physics as early as possible in the school’s curriculum as well as to modify the current teaching and learning techniques and materials. Teachers also need to be resourceful and creative and start making use of various tools in order to make the physics lesson interesting and less abstract. Teachers can start to introduce more project-based activities. The students are more engaged when they feel what they are learning is connected to life outside the classroom.
Table 3 indicates the univariate analyses by using simple logistic regression. There are six
independent variables which have OR (odds ratio) more than 1, which indicates an association with the outcome: gender, ethnicity, area of hometown, type of secondary school, SPM physics result and father monthly income. The odds of choosers among male students was 2.00 times higher compared to female students (OR 2.00, 95%CI 1.33, 3.01). Bumiputera students showed higher odds of choosing physics compared to Malay students (OR 1.49, 95%CI 0.63, 3.53). Students from urban area were having a slight likelihood of choosing physics compared to students from rural (OR 1.09, 95%CI 0.72, 1.66). Students from SMKA, SMK Harian and SMT/SMV showed higher likelihood to choose physics for their undergraduate studies ([ORSMKA 2.18, 95%CI 1.02, 4.64], [ORSMK Harian 1.26, 95%CI 0.71, 2.22], [ORSMT/SMV 4.60, 95%CI 0.86,24.46]), respectively.
Students whose fathers had middle monthly income showed 48% increase likelihood of
choosers (OR 1.48, 95% CI 0.97, 2.28) and students whose fathers had high monthly income were 59% more likely to be the choosers compared to students whose fathers had lower monthly income (OR 1.59, 95%CI 0.89, 2.81). Among fourteen subdomains, only two domains were found to be significantly associated univariately to the likelihood of physics choosers. For one-unit increase in intention in physics, it is expected to see about 10% decrease in the odds of being in a chooser. This 10% of decrease does not depend on the score that intention in physics is held at (OR 0.90, 95%CI 0.86, 0.94). The grade effect was found to be associated with the likelihood of choosers. For one increase score of the grade effect, there were about 3% increase in odds of being a chooser (OR 1.03, 95%CI 1.00, 1.06).
Table 3: Univariate Analyses of Total Scores Among Choosers and Non-Choosers Participants (N=410)
Variables N (%) Univariate OR (95% CI) p - value Choosers Non – Chooser
1. Age (years)
18.50 (1.32) 18.44 (0 .49) 0.83 (0.56, 1.24)
0.366
2. Gender Female 102 (55.14%) 160 (71.11%) Ref
Male 83 (44.86%) 65 (28.89%) 2.00 (1.33, 3.01)
0.001
3. Ethnicity Malay 173 (93.51%) 215 (95.56%) Ref
Bumiputera 12 (6.49%) 10 (4.44%) 1.49 (0.63, 3.53)
0.364
4. Area of hometown
Rural 58 (31.35%) 75 (33.33%) Ref

244
Urban 127 (68.65%) 150 (66.67%) 1.09 (0.72, 1.66)
0.670
5. Type of secondary school
MRSM 28 (15.14%) 43 (19.11%) Ref
SBP 49 (26.49%) 70 (31.11%) 1.07 (0.59, 1.95)
0.813
SMKA 27 (14.59%) 19 (8.44%) 2.18 (1.02, 4.64)
0.043
SMK Harian 75 (40.54%) 91 (40.44%) 1.26 (0.71, 2.22)
0.414
SMT/SMV 6 (3.24%) 2 (0.89%) 4.60 (0.86, 24.46)
0.073
6. SPM Result Physics
B 13 (7.03%) 19 (8.44%) Ref
A+ 15 (8.11%) 18 (8.00%) 1.22 (0.46, 3.26)
0.694
A 38 (20.54%) 36 (16.00%) 1.54 (0.67, 3.57)
0.312
A- 66 (35.68%) 92 (40.89%) 1.05 (0.48, 2.71)
0.904
B+ 53 (28.65%) 60 (26.67%) 1.29 (0.58, 2.86)
0.530
7. Father monthly income
B40 (RM<=3000) 70 (37.84%) 108 48.00%) Ref
M40 (RM3001-RM10000)
82 (44.32%) 85 (37.78%) 1.48 (0.97,
2.28) 0.068
T20 (RM>10000) 33 (17.84%) 32 (14.22%) 1.59 (0.89,
2.81) 0.111
Subdomains Mean (sd) Mean (sd) Recognition of physicists 10.74(5.31) 10.30(4.72) 1.01 (0.97,
1.05) 0.371
The career prospects of physics graduates
13.30(6.31) 12.80(5.34) 1.01 (0.98, 1.04) 0.383
The value of physics in society
14.07(6.23) 13.10(6.22) 1.02 (0.99, 1.05) 0.116
The relevance of learning physics 10.89(5.82) 10.66(5.23) 1.00 (0.97,
1.04) 0.668
Interest in 11.46(5.54) 11.27(4.02) 1.00 (0.96, 0.683
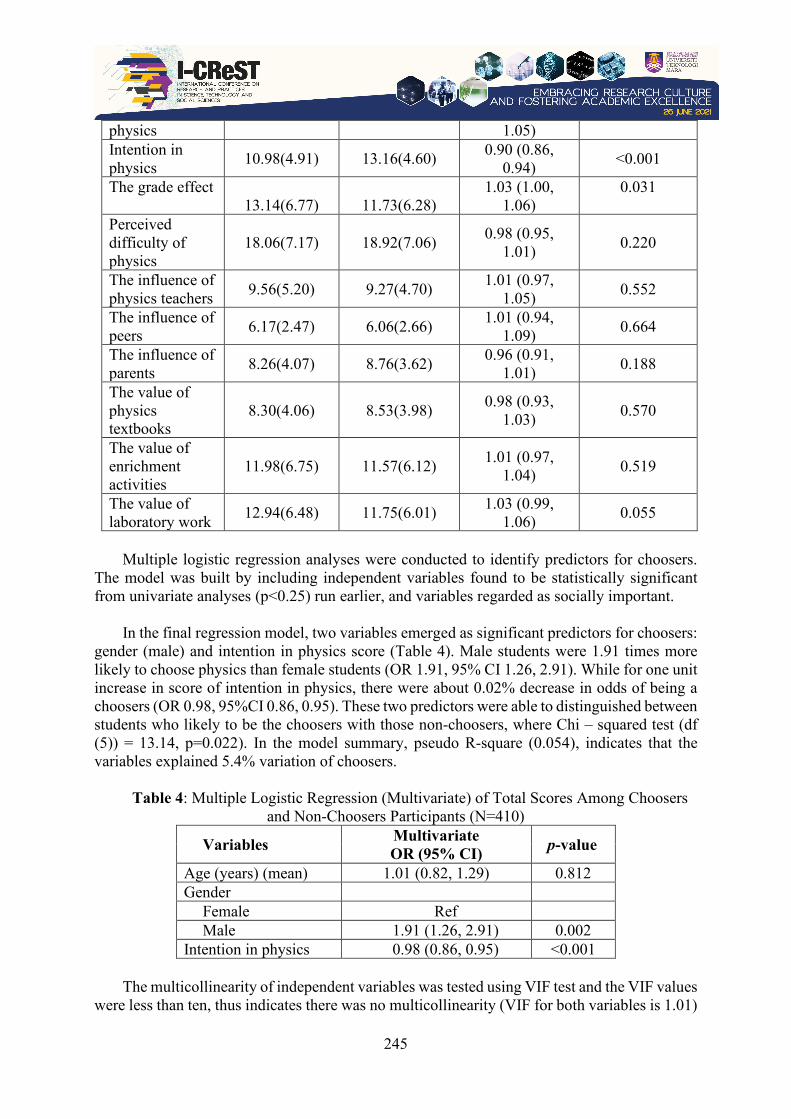
245
physics 1.05) Intention in physics 10.98(4.91) 13.16(4.60) 0.90 (0.86,
0.94) <0.001
The grade effect 13.14(6.77) 11.73(6.28)
1.03 (1.00, 1.06)
0.031
Perceived difficulty of physics
18.06(7.17) 18.92(7.06) 0.98 (0.95, 1.01) 0.220
The influence of physics teachers 9.56(5.20) 9.27(4.70) 1.01 (0.97,
1.05) 0.552
The influence of peers 6.17(2.47) 6.06(2.66) 1.01 (0.94,
1.09) 0.664
The influence of parents 8.26(4.07) 8.76(3.62) 0.96 (0.91,
1.01) 0.188
The value of physics textbooks
8.30(4.06) 8.53(3.98) 0.98 (0.93, 1.03) 0.570
The value of enrichment activities
11.98(6.75) 11.57(6.12) 1.01 (0.97, 1.04) 0.519
The value of laboratory work 12.94(6.48) 11.75(6.01) 1.03 (0.99,
1.06) 0.055
Multiple logistic regression analyses were conducted to identify predictors for choosers.
The model was built by including independent variables found to be statistically significant from univariate analyses (p<0.25) run earlier, and variables regarded as socially important.
In the final regression model, two variables emerged as significant predictors for choosers:
gender (male) and intention in physics score (Table 4). Male students were 1.91 times more likely to choose physics than female students (OR 1.91, 95% CI 1.26, 2.91). While for one unit increase in score of intention in physics, there were about 0.02% decrease in odds of being a choosers (OR 0.98, 95%CI 0.86, 0.95). These two predictors were able to distinguished between students who likely to be the choosers with those non-choosers, where Chi – squared test (df (5)) = 13.14, p=0.022). In the model summary, pseudo R-square (0.054), indicates that the variables explained 5.4% variation of choosers.
Table 4: Multiple Logistic Regression (Multivariate) of Total Scores Among Choosers
and Non-Choosers Participants (N=410)
Variables Multivariate OR (95% CI) p-value
Age (years) (mean) 1.01 (0.82, 1.29) 0.812 Gender
Female Ref Male 1.91 (1.26, 2.91) 0.002
Intention in physics 0.98 (0.86, 0.95) <0.001
The multicollinearity of independent variables was tested using VIF test and the VIF values were less than ten, thus indicates there was no multicollinearity (VIF for both variables is 1.01)

246
(results are not shown). The goodness of fit of the final model, presented as the p-value of Hosmer-Lemeshow test showed that the final model fits the data well (p= 0.3337). This supported that 64.39%% of the observed values for dependent outcome and the predicted values were correctly classified, hence the assumption of classification table was met. The Area Under Curve of ROC curve was 0.6603 and therefore the model can differentiate 66% of the cases. In summary, all three assumption tests demonstrated the final model was fit. 4. CONCLUSION & RECOMMENDATION To overcome students' lack of interest in physics and to encourage students to embark on physics-related career in the future, the exposure must begin as early as possible. Leading by example, the physics teachers must play their role actively in encouraging their students to get involve in innovation competition both at the national or international level. This will help to broaden the students’ insights about physics. During the current Pandemic, teachers need to be resourceful and creative in delivering their class. They can use the various online tools and materials available [7,8]. They can even run their virtual laboratory by using simulations.
Besides that, schools and matriculations can also invite individuals who specializes in the various physics field to talk on degree programs available and physics-oriented career. These sessions will allow the students to ask questions directly and provide them with first-hand information. This will help them to have better insights on physics related issues. Based on the findings, when the students feel that the teachers are passionate, motivated and have a genuine interest in the subject and make use a lot of hands-on activities, the students have a better understanding and positive view of the subject, and most likely to endeavor in physics-related courses at tertiary level. ACKNOWLEDGEMENT This work has been carried out with the support of Universiti Teknologi MARA (UiTM) under Lestari (214/2017). The authors would like to thank the lecturers from Universiti Teknologi MARA (UiTM), Kampus Dengkil for helping to disseminate the questionnaire. REFERENCES [1] Baran, M. (2016). An analysis of high school student’s perceptions of physics course in
terms of gender (A sample from Turkey). Journal of Education and Training Studies, Vol 4 (3), 150-161. https://dx.doi.org/10.11114/jets.v4i3.1243
[2] Kleinbaum, D. G. (2010). Logistic Regression : A Self – Learning Text. New York, NY : Springer New York.
[3] Nor’Aidah Nordin. (2020). Activities for STEM education in Malaysia. Retrieved November 23, 2020, from https://www.apecstemplustw.org
[4] Oon, P. T., & Subramaniam, R. (2013). Factors influencing Singapore students’ choice of Physics as a tertiary field of study : A Rasch analysis. International Journal of Science Education. Vol. 35 (1), 86-118. https://doi.org/10.1080/09500693.2012.718098
[5] Oon, P. T., & Subramaniam, R. (2013). On the Declining Interest in Physics among students-From the perspective of teachers. International Journal of Science Education. Vol. 33 (5), 727-746. http://dx.doi.org/10.1080/09500693.2010.500338

247
[6] Pallant, J. (2007). SPSS Survival Manual Third Edition. Australia, Sydney : Ligare Book Printer
[7] Stokking, K.M. (2000). Predicting the choice of physics in secondary education. International Journal of Science Education. Vol. 22 (12), 1261-1283. https://doi.org/10.1080/095006900750036253
[8] Williams, C., Stanniestret, M., Spall, K., Boyes, E., & Dickson, D. (2003). Why aren’t secondary students interested in physics. Physics Eduaction. Vol. 38 (4), 324-329. https://doi.org/10.1088/00319120384306

248
OUR SPONSORS

MIDSTREAM
DOWNSTREAM
UPSTREAM
Remote Operating Vehicle Services (ROV)Tools & Accessories
Supply of Flexible PipeSupply of Rigid Pipe
Automatic WeldingSystem (AWS) Services
Marine RepairVessel Dockyard
Crane & MaterialHandling Services
Non-Destructive Test(NDT) Services
Rotating EquipmentFirewater Pump
Minor FabricationSteel Structure
Skid Frame, Pipe SpoolsBlasting & Painting
TRADINGSteel Material,Chemical
Mechanical ToolsCrane parts & Accessories
Well Completion Equipment & Services
Rig Up & Rig DownServices
BRAVE’s PRODUCTS & SERVICES
Brave Oilfield Services Engineering Sdn Bhd. (ROC No.: 1244530-D)No. 133, Blok 5, Laman Seri Business Park, Seksyen 13, 40100 Shah Alam, Selangor, MALAYSIA
Tel.: +603-5524 3347 | Fax.: +603-5524 3364 | Email: [email protected] | Website: www.brave.com.my


Copyright © 2022 FDOKUMEN