In-Situ Triboluminescent Optical Fiber Sensor For Real-Time ...
171
Florida State University Libraries Electronic Theses, Treatises and Dissertations The Graduate School 2013 In-Situ Triboluminescent Optical Fiber Sensor for Real-Time Damage Monitoring in Cementitious Composites David Oluseun Olawale Follow this and additional works at the FSU Digital Library. For more information, please contact [email protected]
-
Upload
khangminh22 -
Category
Documents
-
view
0 -
download
0
Transcript of In-Situ Triboluminescent Optical Fiber Sensor For Real-Time ...
Florida State University Libraries
Electronic Theses, Treatises and Dissertations The Graduate School
2013
In-Situ Triboluminescent Optical FiberSensor for Real-Time Damage Monitoringin Cementitious CompositesDavid Oluseun Olawale
Follow this and additional works at the FSU Digital Library. For more information, please contact [email protected]

THE FLORIDA STATE UNIVERSITY
COLLEGE OF ENGINEERING
IN-SITU TRIBOLUMINESCENT OPTICAL FIBER SENSOR
FOR REAL-TIME DAMAGE MONITORING IN CEMENTITIOUS COMPOSITES
By
DAVID OLUSEUN OLAWALE
A Dissertation submitted to the Department of Industrial and Manufacturing Engineering
in partial fulfillment of the requirements for the degree of
Doctor of Philosophy
Degree Awarded: Spring Semester, 2013

ii
David O. Olawale defended this dissertation on November 28, 2012.
The members of the supervisory committee were:
Okenwa I. Okoli Professor Directing Dissertation
John O. Sobanjo University Representative
Tao Liu Committee Member
Zhiyong Liang Committee Member
The Graduate School has verified and approved the above-named committee members, and
certifies that the dissertation has been approved in accordance with university requirements.

iii
This work is dedicated to:
Jesus Christ my Lord, Redeemer and Shepherd for He has never failed, lied or lost a battle;
My beloved parents – Engr (Late) and Mrs Adeoye O. OLAWALE;
God’s priceless gift of love, favor and wisdom to me: Martha(mi) Oluwasheyi OLAWALE; “Many women do noble things but you surpass them all.”

iv
ACKNOWLEDGEMENTS
My doctoral study has humbled me to know how little I know, but elevated me to know
how to search for what I need to know. My search would have been fruitless without the
priceless help I received from many people too numerous to count. Special thanks go to my
advisor, Dr Okenwa I. Okoli, who supervised and sponsored my studies. Dr Okoli has been more
than a PhD supervisor to me; he mentored me and was there for me throughout this journey. I am
eternally grateful for the leadership opportunities and responsibilities he provided for me.
My sincere appreciation goes to members of my dissertation committee; Drs John
Sobanjo, Tao Liu, Ben Wang and Richard Liang. Your kind and constructive feedback have
greatly enhanced the quality of my work and given me the courage to finish my dissertation. I
greatly appreciate all the help, support and friendship from my colleagues and interns that I have
worked with under Dr Okoli including: Tarik Dickens, Garret Sullivan, Dr Muhammed Uddin,
Dr Rufus Ighodaro, Stephen Tsalickis, Divyesh Bhakta, Kaitlyn Kliewer and Taniwa Ndebele.
Special gratitude goes to the administrative and technical staff of both the Department of
Industrial and Manufacturing Engineering (IME), and the High-Performance Materials Institute
(HPMI). I particularly appreciate the countless help I received from Ms Stephanie Salters, Ms
Judy Gardner, Ms Shavaughn Robinson, Mr Jim Horne, Mr Jerry Horne and Mr Frank Allen.
Thanks to Mr John Taylor, all professors, post-docs and my colleagues in IME and HPMI. Your
kindness, hard work and brilliance have been a great inspiration.
I appreciate my wife’s parents, Mr Tandy and Mrs Jumoke Aderibigbe. I am grateful for
all the love and support I received from my spiritual families at Redeemed Christian Church of
God, Go Ye Chapel and Christian Heritage Church, Tallahassee. Finally, I am eternally grateful
to my family: my beloved and selfless wife, Martha Oluwasheyi OLAWALE; and my two
children, Desayo and Toluwani. I am so blessed and favored to have you. Thank you for all the
sacrifices and unconditional love you give always.

v
TABLE OF CONTENTS
List of Tables ............................................................................................................................... viii List of Figures ................................................................................................................................ ix Abstract ........................................................................................................................................ xvi
1. INTRODUCTION ...................................................................................................................1
1.1 Technical Challenges .....................................................................................................3 1.2 Research Objectives .......................................................................................................4 1.3 Structure of the Dissertation ..........................................................................................5
2. LITERATURE REVIEW ........................................................................................................6
2.1 Crack Initiation and Propagation in Concrete ................................................................6 2.1.1 Strain Localization .............................................................................................9 2.1.2 Non-linear Fracture Mechanics for Concrete System ......................................11
2.2 Crack Monitoring in Concrete Systems .......................................................................13 2.2.1 Acoustic-based Damage Detection ..................................................................15 2.2.2 Electromagnetic Imaging methods ..................................................................19 2.2.3 Radiography .....................................................................................................21 2.2.4 Fiber Optic Sensors ..........................................................................................23
2.3 The Triboluminescence Phenomenon ..........................................................................29 2.3.1 Elastico-triboluminescence ..............................................................................30 2.3.2 Plastico-triboluminescence ..............................................................................32 2.3.3 Fracto-triboluminescence .................................................................................34
2.4 Triboluminescent Sensor Systems ...............................................................................36 2.4.1 Triboluminescent Materials for Sensing Applications ....................................36 2.4.2 Artificial Skin to Sense Mechanical Stress ......................................................39 2.4.3 Impact Sensors .................................................................................................41 2.4.4 Triboluminescent Signal Detection and Transmission in Composites ............45
2.5 Summary ......................................................................................................................47
3. DAMAGE MONITORING IN CEMENTITIOUS COMPOSITES BY DIRECT
DISPERSION OF ZNS:MN ................................................................................................448
3.1 Experimental ................................................................................................................48 3.1.1 Sample Preparation ..........................................................................................48 3.1.2 Mechanical Tests .............................................................................................49 3.1.3 Triboluminescent Signal Measurement ...........................................................50
3.2 Results and Discussion ................................................................................................51 3.2.1 Effect of ZnS:Mn Concentration on Triboluminescent Response .................51 3.2.2 Influence of ZnS:Mn Concentration on Strength of Cementitious Patch ......53 3.2.3 SEM Characterization ....................................................................................54 3.2.4 EDX Analysis ................................................................................................55
3.3 Summary ......................................................................................................................58
4. BIO-INSPIRED IN-SITU TRIBOLUMINESCENT OPTICAL FIBER SENSOR ..............59
4.1 Operating Principle of the ITOF Sensor ......................................................................60

vi
4.2 Sensor Characterization Tools .....................................................................................61 4.3 Design Parameters Evaluation with Sensors fabricated with Dip Process ..................63
4.3.1 Test Procedure .................................................................................................64 4.3.2 Results and Discussion ....................................................................................64
4.4 Design Parameters Evaluation with Sensors fabricated by Mold Process ...................69 4.4.1 Test Procedure .................................................................................................70 4.4.2 Results and Discussion ....................................................................................71
4.5 Summary ......................................................................................................................80
5. ITOF SENSOR IMPACT EXCITATION MODEL .............................................................82
5.1 Theoretical Model ........................................................................................................82 5.2 Model Validation .........................................................................................................87 5.3 Results and Discussion ................................................................................................88 5.4 Summary ......................................................................................................................94
6. CHARACTERIZATION OF THE DAMAGE MONITORING BEHAVIOR OF THE
ITOF SENSOR .....................................................................................................................96
6.1 Materials and Methods .................................................................................................96 6.1.1 Sensor Fabrication ...........................................................................................96 6.1.2 Flexural Test ....................................................................................................98 6.1.3 Characterization Techniques ............................................................................99
6.2 Results and Discussion ..............................................................................................102 6.2.1 Raman Spectroscopy ......................................................................................102 6.2.2 Stress-strain Characterization with DMA ......................................................103 6.2.3 Triboluminescent Behavior under Flexural Loading .....................................105 6.2.4 Surface Cracks Characterization ....................................................................105 6.2.5 Morphological Characterization with FESEM ..............................................109
6.3 Summary ....................................................................................................................112
7. TRIBOLUMINESCENT MULTIFUNCTIONAL CEMENTITIOUS COMPOSITES .....114
7.1 Materials and Methods ...............................................................................................114 7.1.1 Silicon Mold Fabrication ...............................................................................114 7.1.2 TMCC Fabrication .........................................................................................116 7.1.3 Flexural Test ..................................................................................................118
7.2 Results and Discussion ..............................................................................................118 7.2.1 Damage Characterization with TL Emission Profile Analysis ......................118 7.2.2 Real-time Damage Monitoring in Mortar Beams ..........................................126 7.2.3 Triboluminescent Peak Intensity....................................................................127
7.3 Summary ....................................................................................................................131
8. CONCLUSIONS .................................................................................................................132
8.1 Conclusions ................................................................................................................132 8.2 Summary of Contributions .........................................................................................133 3.3 Future Research .........................................................................................................135
APPENDIX ..................................................................................................................................138

vii
A. LIST OF PUBLICATIONS .................................................................................................138
REFERENCES ............................................................................................................................141
BIOGRAPHICAL SKETCH .......................................................................................................154

viii
LIST OF TABLES
2.1 Guide to reasonable* crack for reinforced concrete under service loads ............................9 2.2 Overview of the strengths and limitations of the four classes of fiber optic sensors .........24 2.3 Solid-state photoluminescent quantum yields of a number of triboluminescent
compounds .........................................................................................................................37 2.4 Triboluminescence of various materials ............................................................................38 3.1 Main constituents of the TL cementitious optical sensor ..................................................49 4.1 Specification of the ESKA CK40 polymer optical fiber (POF) ........................................63 4.2 Levels of the four factors investigated ...............................................................................64 4.3 ANOVA result of estimated effects and coefficients for impact energy level of 0.181J ..66 4.4 The 2K Factorial experimental levels of the design factors investigated ...........................71 5.1 TL responses from different ITOF sensor configuration based on experimental result
(TLexp) and model result (TLmodel) under impact energy of 0.199 J .............................89 6.1 Result of stress-strain characterization with DMA ..........................................................103 7.1 Constituents of triboluminescent multifunctional cementitious composite (mortar) ......116

ix
LIST OF FIGURES
1.1 Causes of bridge failures ......................................................................................................1 1.2 Collapse of the Minneapolis I-35W bridge ..........................................................................2 1.3 Percentage of superstructure material types for US bridges by a. Numbers, b. Average distance travelled, c. Deck area .........................................................................3 2.1 Physical and chemical causes of cracking in concrete.........................................................6 2.2 Cracking of concrete due to drying shrinkage .....................................................................7 2.3 Schematic of cracking pattern in normal strength concrete ...............................................10 2.4 Stages of crack propagation in concrete under tension ......................................................11 2.5 Some toughening mechanisms in the fracture process zone ..............................................12 2.6 Modeling cracks in concrete ..............................................................................................13 2.7 Counting methods in AE technique ...................................................................................16 2.8 Crack monitoring with AE .................................................................................................17 2.9 The impact echo method ....................................................................................................18 2.10 (a) Conventional photograph of sample subjected to compressive strength to induce
cracking, (b) digital neutron radiography of sample, (c) digital X-ray radiography .........22 2.11 Extrinsic and intrinsic Fabry–Perot interferometric sensors: (a) Extrinsic sensor and (b) reflective and transmissive configurations of an intrinsic sensor ...............................26 2.12 Fiber bragg grating concept ...............................................................................................27 2.13 Concept of distributed sensing with the novel sensors ......................................................28 2.14 Schematic of elastico-TL in ZnS:Mn .................................................................................30 2.15 Schematic energy level diagram of mechanoluminescence of coloured alkali halide
crystals ...............................................................................................................................33 2.16 A schematic of the piezoelectric theory illustrating TL phenomena upon cleavage..............................................................................................................................34 2.17 (a) TL intensity of various inorganic thin films under the same friction conditions

x
and (b) effect of Mn additive amount on TL intensity.......................................................39 2.18 (a) Luminescence intensity response of the ZnS:Mn film to the friction, (b) response to compression stress of 500 N, applied at a cross head speed of 0.1 mm/min, and (c)
response to impact stress applied by a free-falling steel ball .............................................40 2.19 (a) Dependence of the luminescence intensity on load in the case of friction and (b)
dependence of the luminescence intensity on the falling height of a steel ball on impact .................................................................................................................................40 2.20 ZnS:Mn emission spectrum ...............................................................................................42 2.21 Plot of the peak TL intensity as a function of impact kinetic energy for the ZnS:Mn
powder ...............................................................................................................................43 2.22 Light intensity comparison from unshielded and shielded detectors as a result of a
hypervelocity impact on a ZnS:Mn coated plate ...............................................................44 2.23 The spectral overlap of the terbium triboluminescence with the absorption spectrum of the rhodamine 6G fibre core. The photoluminescent emission spectrum from the
rhodamine 6G fibre core is shown for completion ............................................................45 2.24 (a) The optical damage signal upon impacting a resin, (b) a CFRP panel containing a
silica photoluminescent fibre and (C) CFRP panel post-impact ........................................46 3.1 Schematic of the custom-built impact rig for assessing TL performance of sensor patch samples .....................................................................................................................48 3.2 Experimental set-up for determining the compressive strengths of samples .....................50 3.3 Block diagram of impact test setup for TL performance assessment of cementitious
sensor patches ....................................................................................................................50 3.4 Typical TL response obtained (a) during the impact tests .................................................51 3.5 Effect of ZnS:Mn concentration level on TL output of composite ....................................52 3.6 Effect of ZnS:Mn concentration levels on the compressive strengths of 28 days cured
samples ...............................................................................................................................53 3.7 SEM micrographs of 28-days cured cementitious composite (a) 0% ZnS:Mn by wt, (b) 25% ZnS:Mn by wt .....................................................................................................55 3.8 SEM micrographs of 10-days cured Cementitious composite (a) 0% ZnS:Mn by wt, (b) 5% ZnS:Mn by wt .......................................................................................................55

xi
3.9 EDX result of Sample (5% wt ZnS:Mn, 10 days cure) with no ZnS:Mn presence at location under examination ................................................................................................56
3.10 EDX result of Sample (5% wt ZnS:Mn, 10 days cure) with ZnS:Mn present ...................56 3.11 EDX result of Sample (5% wt ZnS:Mn, 10 days cure) with ZnS:Mn clearly identified ...57 3.12 SEM micrograph showing the interface between ZnS:Mn crystals and the products of
hydration (5% wt ZnS:Mn, 10 days cure): A-ettringite, B-flyash, C-ZnS:Mn, D-calcium silicate hydrate, E-calcium hydroxide ..............................................................57 4.1 A schematic of the ITOF sensor ........................................................................................60 4.2 An ITOF based sensing system for SHM of bridges a) damage-sensitive region with
ITOF sensor, b) TL (damage) signal from ITOF sensor due to crack, c) signal transmission by ITOF sensor and signal detection by PMT, d) signal analysis and
damage identification ........................................................................................................61 4.3 Experimental set-up for impact tests with custom-built impact rig for ITOF sensor
characterization ..................................................................................................................62 4.4 Experimental set-up for impact tests with custom-built impact rig for ITOF sensor
characterization ..................................................................................................................64 4.5 Normal plot of the standardized effects from impact level of 0.181 J ...............................65 4.6 Main effects plot at impact level of 9.91 x 10⁻² J ...............................................................66 4.7 Main effects plot at impact level of 18.13 x 10⁻² J .............................................................67 4.8 Main effects plot at impact level of 26.35 x 10⁻² J .............................................................67 4.9 (a) Cut cross-section of an uncladded ITOF sensor, (b) Interface between POF and ITOF sensor coating ..........................................................................................................68 4.10 (a) Dispersion of ZnS:Mn in epoxy marix (1:1) of the ITOF coating (b) the Zns:Mn
crystals ...............................................................................................................................69 4.11 Schematic of ITOF sensor with integrated sensing and transmission components a)
Polymer optical fiber (POF) with protective plastic jacket, b) POF with protective jacket removed from mid-section, c) Fabricated ITOF sensor with ZnS:Mn/epoxy coating.......................................................................................................70 4.12 ITOF sensor fabrication (a) ITOF undergoing curing in silicone mold, (b) fabricated
ITOF sensors ......................................................................................................................70

xii
4.13 Effect of sensor coating thickness and ZnS:Mn/epoxy weight fraction on ITOF sensors’ TL responses (a) surface plot (b) contour plot ....................................................72 4.14 Effect of sensor’s ZnSμMn/epoxy weight fraction and impact energy on ITOF sensors’ TL responses (a) surface plot (b) contour plot .....................................................73 4.15 Figure 4.15: Effect of impact energy and sensor coating thickness on the TL responses of ITOF sensors (a) surface plot (b) contour plot ..............................................74 4.16 Interaction plot for the TL response of the ITOF sensor under impact load .....................75 4.17 DMA plot from ITOF coating characterization .................................................................76 4.18 Effect of ZnS:Mn loading on the mean Tg of ITOF coating ..............................................77 4.19 Effect of ZnS:Mn loading on the mean modulus of the ITOF coating ..............................77 4.20 Line Plot of Mean TL responses of ITOF sensors at different impact energy levels ........78 4.21 Interval plot with one standard error from mean of TL response of ITOF sensor (a)
0.63mm coating thickness (b) 1.63 coating thickness .......................................................80 5.1 Schematic of ITOF sensor under impact loading ..............................................................83 5.2 Overview of the model’s variables, input and output ........................................................88 5.3 Plot of TL (intensity) signal from tested sensors, TLexp (V) versus the sensor diameter, D (mm) and the TL crystal volume fraction, vTL .............................................90 5.4 Plot of TL (intensity) signal from ITOF impact excitation model, TLmodel (arbitrary
unit) versus the sensor diameter, D (mm) and the TL crystal volume fraction, vTL ........91 5.5 Plot showing the experimental TL signal (TLexpt) with that predicted by the ITOF
impact excitation model (TLmodel) ..................................................................................92 5.6 FESEM micrographs of Sensor 2 a) top, b) bottom, c) left and d) right sections..............93 5.7 FESEM micrographs for Sensor 3 showing unequal dispersion of ZnS:Mn crystals within the ITOF sensor coating a) top, b) bottom, c) left and d) right sections .................94 6.1 Schematic showing placement of aluminum mold on the base of topless plexiglass box during sensor mold fabrication with dimensions (mm), drawing not to scale ............97 6.2 ITOF sensor fabrication process ........................................................................................97 6.3 a) Silicon mold for fabrication of rectangular cross-section sensors, b) fabricated
xiii
ITOF sensors with and without POF .................................................................................98 6.4 Shimadzu micro-tensile testing machine used to apply flexural load and ITOF sensor
samples ...............................................................................................................................99 6.5 Renishaw in Via Raman Microscope for Raman spectroscopy analysis .........................100 6.6 a) Stress-strain characterization with TA Inc DMA 2890, b) furnace exposed with sensor loaded onto the clamp ...........................................................................................100 6.7 Field Emission Scanning Electron Microscope (JEOL JSM-7401F) for morphological characterization ........................................................................................101 6.8 Surface crack characterization with OLYMPUS BX40 Microscope ..............................101 6.9 Raman spectra of 1) ZnS:Mn(1:1), 2) epoxy, 3) ZnS:Mn:epoxy ....................................103 6.10 ITOF sensor (50:50 wt percent) exhibits linear elastic behavior above 0.6% strain .......104 6.11 a) ITOF sensor under 3 PBT loading condition, b) real-time damage sensing with ITOF sensor .....................................................................................................................105 6.12 Typical TL emission profile from the brittle failure of the ITOF sensor under flexural loading ................................................................................................................106 6.13 Effect of loading rate on ITOF sensor damage monitoring behavior ..............................106 6.14 TL sensing performance of two ITOF sensor systems by weight percent .......................107 6.15 Typical surface micrograph of ITOF samples showing no micro-cracks after 3 point bend test ..........................................................................................................................108 6.16 a) ITOF sensor surface with fabrication defects, b) crack originating from surface defect, c) micro-crack on surface of the tested sample ....................................................109 6.17 Scanning electron micrographs a) ZnS:Mn crystals b) cross-section of an ITOF sensor showing the ZnS:Mn crystals loaded coating, interface between the coating and the smooth-surfaced POF c) ITOF sensor coating with ZnS:Mn crystals randomly dispersed in the epoxy matrix d) void and crystal agglomeration in the ITOF coating ....................................................................................................................109 6.18 FESEM micrograph of fractured surface of ITOF (50:50 wt percent ZnS:Mn/epoxy)
cross-section a) virtually all crystals in the fractured plane were fractured b) ZnS:Mn crystals with fractured surface showing fracture lines ..................................111 6.19 FESEM micrographs of a) fractured surface of the 60:40 (wt percent)

xiv
ZnS:Mn/epoxy ITOF sensor coating, b) close-up view showing grooves and many crystals not fractured because of weak interface in the composite system ......................112
7.1 Schematic of double layer sensor TMCC girder for early crack detection ......................114 7.2 Schematic of the dimensions (mm) and positioning of wooden molds in the ABS mold for silicon mold for fabricating TMCC beams (300 x 90 x 75mm) ......................115 7.3 Mixing of TMCC constituents in an electric-driven concrete mixer ...............................116 7.4 (a) Silicon mold with single layer ITOF sensor ready for CC pouring, (b) fabricated
TMCC beams ready for de-molding from silicon mold ..................................................117 7.5 TMCC beams and CC cylinders being cured in a water bath ..........................................117 7.6 a) TMCC beams with strain gages installed b) Three point bend tests (3PBT) set up ....118 7.7 Location of ITOF relative to neutral axis determines whether it is in tension or
compression zone during flexural test of cementitious beams ........................................119 7.8 (a) Typical TL signal depicting brittle failure of unreinforced cementitious composite (mortar) beam, (b) Close-up view of TL signal showing multiple emissions over extended period ......................................................................................120 7.9 a) TL signal shows multiple emissions as well as a small early TL emission peak
suggestive of sensor excitation prior to actual contact with the crack (emission time ~16.5ms), b) Fracture plane cuts across ITOF sensor .....................................................121
7.10 a) TL signal due to remote damage sensing by ITOF sensor (emission time ~13ms), b) Fractured mortar beam cross-section showing no ITOF sensor in fractured plane ....122 7.11 a) TL emission from flexural test on ITOF sensor, b) TL emission spectral with TL
duration ~3ms ..................................................................................................................123 7.12 Schematic of different modes of ITOF sensor excitation in mortar beams a) pre-indirect b) direct c) post-indirect excitations .........................................................124 7.13 TL profile from ITOF sensor located in compression zone of mortar beam ...................124 7.14 TL signal at instant of brittle failure of unreinforced mortar beam .................................126 7.15 Large increases in strain value at instant of brittle failure corresponding to instant of TL signal generation ....................................................................................................127 7.16 Plot of TL intensity and stress at beam failure ................................................................128

xv
7.17 Plot of TL intensity and estimated stress on ITOF sensor ...............................................128 7.18 Failure of a mortar beam showing the typical large crack width from the brittle failure that suggests fracturing of the integrated ITOF sensor ........................................129 7.19 a) Fractured surface of ITOF cross-section showing fractured ZnS:Mn crystals in epoxy matrix b) fracture lines on the surfaces of the fractured crystals ..........................130
xvi
ABSTRACT
Triboluminescent-based sensor systems have the potential to enable in-situ and distributed structural
health monitoring of composite structures. Inability to effectively capture and transmit optical signals
generated within opaque composites like concrete and carbon fiber reinforced polymers have
however greatly limited their use. This problem is being addressed by the development of the bio-
inspired in-situ triboluminescent optical fiber (ITOF) sensor. This sensor has the potential for
wireless, in-situ, real-time and distributed (WIRD) damage monitoring. Its integrated sensing
(triboluminescent thin film) and transmission (polymer optical fiber) components convert the energy
from damage events like impacts and crack propagation into optical signals that are indicative of the
magnitude of damage in composites.
Utilizing the triboluminescent (TL) property of ZnS:Mn, the ITOF sensor has been successfully
developed. Key design parameters were evaluated to develop a sensor with enhanced damage sensing
capability. Material properties of the new sensor were characterized with Raman spectroscopy, field
emission scanning electron microscopy (FESEM) and dynamic mechanical analysis (DMA). Flexural
tests were also carried out to evaluate the damage sensing performance of the sensor before
integrating into unreinforced concrete beams to create triboluminescent multifunctional cementitious
composites (TMCC) with in-situ damage monitoring capabilities like biological systems.
Results show that the ZnS:Mn in the epoxy coating of the ITOF sensor does not degrade the thermo-
mechanical properties of the composite system. Raman spectroscopy indicates that the ZnS:Mn
crystals retained their physical and chemical properties after undergoing the sensor fabrication
process. Enhanced side coupling of TL signals from the ITOF coating into the polymer optical fiber
(POF) was achieved with TL thin film coating on POF. This makes distributed sensing possible when
the entire length of the POF is coated with TL thin film. Uniform TL crystals dispersion and uniform
coating of the sensor are critical for consistent sensor performance. A new approach to damage
characterization using TL emission profiles was employed with the TMCC. Three modes of sensor
excitation in the TMCC were identified indicative of sensor’s ability to sense crack propagation
within the beam. FESEM analysis indicated that fracto-triboluminescence was responsible for the TL
signals observed at beam failure. The TL profile analysis promises to facilitate better understanding
of crack propagation in composite structural materials.

1
CHAPTER ONE
INTRODUCTION
Bridges occupy a critical position in the infrastructural system of any nation. The National
Bridge Inventory (NBI) reveals that there are 591,707 bridges over 6.1 meters (20 feet) in total
length located on public roads in the United States. These bridges have a total deck area of more
than 300 million square meters, and carry an average of nearly 4 billion vehicles per day [1].
However, about 25 % of the bridges are either structurally deficient or functionally obsolete [2].
This is due to the destructive effect of de-icing salts, pollutants, material aging, increasing traffic
volume, and overloading bridges are continuously subjected to [3]. Structurally deficient or
functionally obsolete bridges pose great risks to the life of commuters because limited resources
militate against their replacement or prompt repair. The average age of structurally deficient
bridges in the US is 59 years [4]. Over 50% of US bridges are more than 60 years old. Hence, it
is estimated that the number of deficient bridges would grow by about 7600 per annum [3].
Furthermore, a study of over 500 bridge failures in the US between 1989 and 2000 showed that
the most frequent causes of bridge failures were floods and collisions [5]. Flood and scour were
responsible for about 60 percent of collapses (Figure 1.1) while Bridge overload and lateral
impact forces from trucks, barges/ships, and trains constitute 20% of the total bridge failures [6,
7]. About 500,000 of the approximately 600,000 bridges in the US lie over water [7, 8].
Figure 1.1: Causes of bridge failures [7].

2
A number of catastrophic bridge failures have occurred over the past decades that have provoked
interest in the development of structural health monitoring (SHM) systems for bridges and other
civil infrastructure systems (CIS). An example is the collapse of the Minneapolis I-35W Bridge
(Figure 1.2) in the United States on August 1, 2007. A total of 13 people died while 145 were
injured. According to the National Transportation Safety Board (NTSB), undersized gusset
plates, increased concrete surfacing load, and weight of construction supplies/equipment were
the cause of the bridge collapse. SHM can however help to prevent sudden failure through early
damage detection and prompt repairs.
Figure 1.2: Collapse of the Minneapolis I-35W bridge [9].
The structural health monitoring of concrete bridges is particularly of great importance. The
combined market share for reinforced and prestressed concrete bridges in the U.S. is about 70%
of bridges built since 1980 [10]. As illustrated in Figure 1.3, the NBI indicates that the combined
number of concrete and prestressed concrete bridges superstructure out-number all other
construction materials not just in terms of the number of bridges, but also in terms of the average
distance travelled (ADT) and the deck area. This trend is expected to continue because of
concrete’s economic competitiveness, relatively long life and low maintenance requirements
[11].
Other than earthquakes, the most severe damage to large concrete structure arises from the
corrosion of the embedded steel reinforcements especially due to deicing salt [6, 12]. The direct
cost of metallic corrosion in the U.S. is estimated at $300 billion per year [13]. The degradation

3
of these concrete structures occurs through the formation and propagation of cracks [14]. Crack
openings above 0.2-0.4 mm (depending on environmental exposure) may result in durability
problems because of steel reinforcement corrosion. Larger crack openings (1-2 mm) that may be
caused by excessive loading during natural hazards like earthquake are signs of severe damage
that may require immediate closing of the facility [14]. There are currently no quantifiable
methods to determine if buildings are safe for reoccupation after a significant earthquake [15].
Hence, monitoring cracks in concrete is an effective way to assess the structural condition or
‘health’ of a concrete structure [16, 17].
Figure 1.3: Percentage of superstructure material types for US bridges by a. Numbers, b. Average distance travelled, c. Deck area [1].
1.1 Technical Challenges
There are currently a number of techniques being used for damage detection and monitoring of
cementitious composites like concrete structures [18, 19]. These include imaging techniques
such as ultrasonic C-scan, x-ray and thermography. The major drawback of these techniques is
that they do not provide for in-situ sensing. This inhibits the real-time monitoring of the
structure. Furthermore, the associated costs resulting from the downtime required for periodic
non-destructive inspections can be very high for civil structures like bridges [20]. The acoustic
emission technique is promising, but it suffers from low-signal-to-noise ratio. Surface-mounted
resistive foil strain gages have potential for in-situ and continuous monitoring. They are however
33
20.4
40.6
5.5
0.6
35.7
24.5
39.1
0.3 0.4
46.3
31.1
20.9
1.2 0.5
0
5
10
15
20
25
30
35
40
45
50
Steel Prestressed
concrete
Concrete Timber Others
By numbers Average distance travelled (ADT) Deck area

4
less effective in monitoring internal damage and are vulnerable to electromagnetic and electrical
interference, as well as physical damage [18].
Triboluminescence-based sensor systems have the potential to enable in-situ and distributed
structural health monitoring of composite structures [21]. Triboluminescence (TL) is the
emission of light from solids when stressed or fractured [22, 23]. There have been a number of
attempts to apply the TL phenomenon for damage sensing in composite structures [24-27].
Nonetheless, a major challenge militating against TL-based sensor systems is the inability to
effectively capture and transmit the optical signal generated within opaque composites like
concrete and carbon fiber reinforced polymers. A number of other factors are critical to the
effective implementation of TL damage sensing. These include the effective dispersion of TL
materials and the determination of optimized concentration levels in the host materials. A
common approach being employed is to incorporate the TL crystals into the host material like
concrete. The concentration level of the TL crystals in the host matrix required for good TL
response is however, usually high. This introduces parasitic weight effect that is highly
undesirable. The crystals may also adversely affect the mechanical properties and performance
of the host structure. The high cost of the crystals also makes this approach not to be
economically viable.
In summary, the problem is how to have an in-situ TL-based sensor system in opaque
structures/materials like concrete with effective light transmission and detection without
adversely affecting the performance of the host structure or material.
1.2 Research Objectives
The goal of this research is to apply the TL phenomenon of ZnS:Mn and light propagation in
polymer optical fibers for the in-situ , continuous and real time monitoring of damage (cracks) in
cementitious composite (CC) structures. This work will focus on mortar. In line with this goal,
the research objectives are:
i. Investigate the viability of in-situ TL-based damage sensing in mortar by direct
dispersion of ZnS:Mn in the host matrix
ii. Develop a triboluminescent signal transport mechanism
5
iii. Determine sensor’s key design parameters that give enhanced TL signal transport
performance
iv. Develop fabrication methodology for the triboluminescent-based multifunctional
cementitious composites with integrated TL transport mechanism and characterize in-situ
damage sensing performance under flexural loading
v. Model TL response of the sensor under impact loading and validate proposed model
against experimental data
1.3 Structure of the Dissertation
The dissertation is divided into eight chapters. Chapter 1 is the introduction and focuses on the
motivation and key objectives of this study. Chapter 2 is the literature review and provides an
update on progress in the understanding and application of triboluminescence for damage
monitoring in composites. Chapter 3 presents the results of the first application of the
triboluminescent properties of ZnS:Mn for damage monitoring in cementitious composites that
involves the direct dispersion of ZnS:Mn in mortar matrix. The development of the bio-inspired
in-situ triboluminescent optical fiber (ITOF) sensor is described in chapter four. Chapter 5
presents the ITOF sensor impact excitation model and its validation. In chapter six, flexural tests
and some characterization tools were employed to gain insights in to the properties of the ITOF
sensor and its behavior under flexural loading. Chapter 7 gives the details of the fabrication and
damage characterization of the triboluminescent multifunctional cementitious composites
(TMCC) under flexural loading. Finally, the conclusion is provided in chapter eight.
6
CHAPTER TWO
LITERATURE REVIEW
This chapter provides insight into the crack mechanism in concrete structures. The underlying
mechanism of the triboluminescence phenomenon and progress made in the development of
triboluminescent-based sensors for damage monitoring in composite structures are discussed.
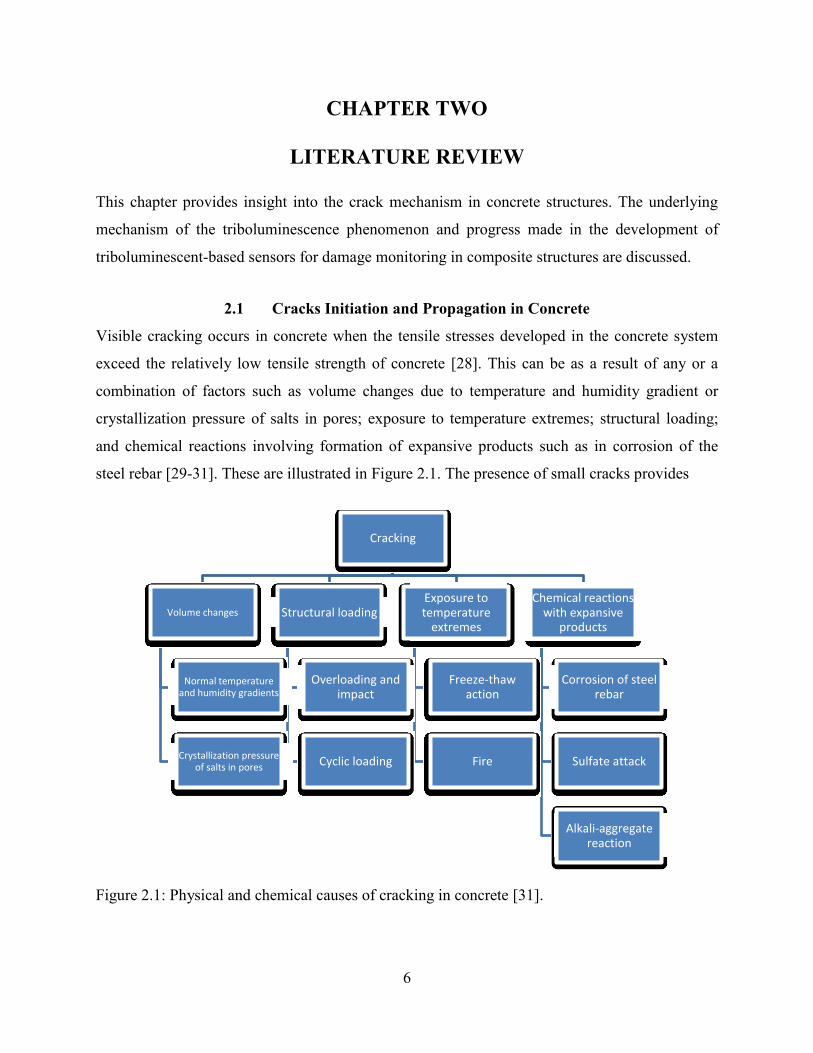
2.1 Cracks Initiation and Propagation in Concrete
Visible cracking occurs in concrete when the tensile stresses developed in the concrete system
exceed the relatively low tensile strength of concrete [28]. This can be as a result of any or a
combination of factors such as volume changes due to temperature and humidity gradient or
crystallization pressure of salts in pores; exposure to temperature extremes; structural loading;
and chemical reactions involving formation of expansive products such as in corrosion of the
steel rebar [29-31]. These are illustrated in Figure 2.1. The presence of small cracks provides
Figure 2.1: Physical and chemical causes of cracking in concrete [31].
Cracking
Volume changes
Normal temperature and humidity gradients
Crystallization pressure of salts in pores
Structural loading
Overloading and impact
Cyclic loading
Exposure to temperature
extremes
Freeze-thaw action
Fire
Chemical reactions with expansive
products
Corrosion of steel rebar
Sulfate attack
Alkali-aggregate reaction
7
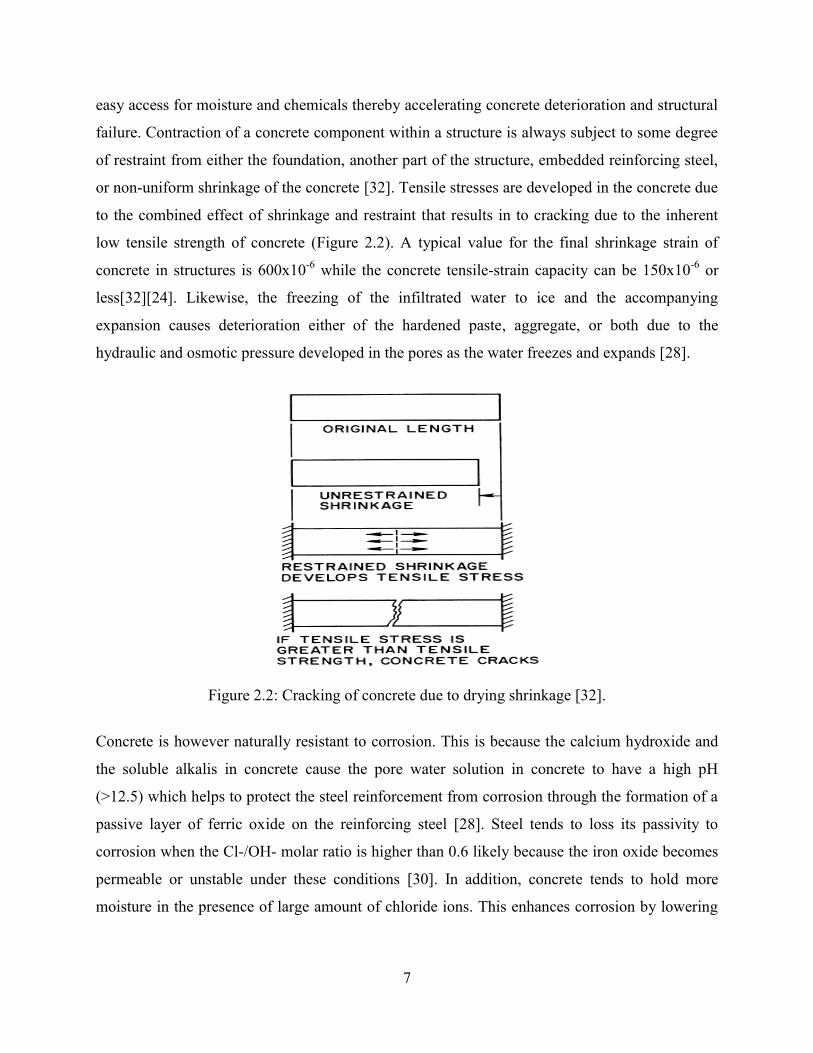
easy access for moisture and chemicals thereby accelerating concrete deterioration and structural
failure. Contraction of a concrete component within a structure is always subject to some degree
of restraint from either the foundation, another part of the structure, embedded reinforcing steel,
or non-uniform shrinkage of the concrete [32]. Tensile stresses are developed in the concrete due
to the combined effect of shrinkage and restraint that results in to cracking due to the inherent
low tensile strength of concrete (Figure 2.2). A typical value for the final shrinkage strain of
concrete in structures is 600x10-6 while the concrete tensile-strain capacity can be 150x10-6 or
less[32][24]. Likewise, the freezing of the infiltrated water to ice and the accompanying
expansion causes deterioration either of the hardened paste, aggregate, or both due to the
hydraulic and osmotic pressure developed in the pores as the water freezes and expands [28].
Figure 2.2: Cracking of concrete due to drying shrinkage [32].
Concrete is however naturally resistant to corrosion. This is because the calcium hydroxide and
the soluble alkalis in concrete cause the pore water solution in concrete to have a high pH
(>12.5) which helps to protect the steel reinforcement from corrosion through the formation of a
passive layer of ferric oxide on the reinforcing steel [28]. Steel tends to loss its passivity to
corrosion when the Cl-/OH- molar ratio is higher than 0.6 likely because the iron oxide becomes
permeable or unstable under these conditions [30]. In addition, concrete tends to hold more
moisture in the presence of large amount of chloride ions. This enhances corrosion by lowering
8
the electrical resistivity of the concrete. No significant corrosion is observed provided the
electrical resistivity is above 50 to 70 x 103 Ω.cm [30].
The corrosion of steel in concrete is an electrochemical process [30]. It requires the presence of
moisture, oxygen, and an electrolyte to occur and is accelerated by wetting and drying cycles.
The chemical reaction at the anode and cathode are as follows [30]:
Anode:
Cathode:
[rust]
The rust formed occupies a larger volume than the iron from which it was formed and depending
on the state of oxidation, it may result in a volume increase as large as 600 percent of the original
metal [30]. This volume increase results in internal stresses that cause cracking of the concrete
and debonding between the steel rebar and the concrete [28, 30, 31]. The presence of water and
moisture at the cathode is absolutely necessary to sustain the ionization of the iron at the anode
and thereby sustain the corrosion process. It has been noted that the thickness of corrosion
products required to cause cracking is proportional to the cover thickness; a corrosion product
thickness of 50 m (0.00β in.) is usually sufficient to cause cracking in concrete with a cover
thickness of 40 mm (1.6 in.) [28].
Furthermore, laboratory studies have shown that preexisting cracks and sustained loads can
accelerate corrosion initiation and propagation, and can lead to creep [33, 34]. The localized
corrosion at the cracked areas lead to further longitudinal surface cracking, delamination, and
debonding, ultimately resulting in a reduction in the strength capacity and stiffness of the
structure [28, 35]. Table 2.1 provides recommended acceptable crack sizes for different
scenarios.

9
Table 2.1: Guide to reasonable* crack for reinforced concrete under service loads [32].
Exposure condition Crack width
In. mm
Dry air or protective membrane 0.016 0.41
Humidity, moist air, soil 0.012 0.30
Deicing chemicals 0.007 0.18
Seawater and seawater spray, wetting and drying 0.006 0.15
Water-retaining structures+ 0.004 0.10 * It should be expected that a portion of the cracks in the structure will exceed these values. With time, a significant portion can exceed these values. These are general guidelines for design to be used in conjunction with sound engineering judgment. +Excluding non-pressure pipes.
2.1.1 Strain Localization
Concrete is an anisotropic and heterogenous material made up of cement, fine aggregate, coarse
aggregate, and water. The cement hydrates when mixed with water to form a hard matrix after a
certain period of curing. The hydrated cement when in the fluid state flows to occupy the spaces
between the aggregates and on curing acts as the binder that bonds them together.
Macroscopically, concrete can be considered a two-phase material consisting of the matrix and
the aggregate [36]. However, the interfacial transition zone (ITZ), between the hardened cement
paste (hcp) and the aggregate, often has more voids and is weaker compared to the bulk cement
matrix. This is due to the differences in the modulus of elasticity, thermal expansion coefficient
and response to change of moisture content, of the matrix (hcp) and the aggregate [30, 37].
Consequently, as the load on the concrete increases, cracking will start in the ITZ, and
subsequently propagate into the hydrated cement paste until crack paths are formed through the
concrete, as shown in Figure 2.3. When this is sufficiently extensive, it will result in the failure
of the structure. The ITZ is about 30-50 microns wide [37].
10
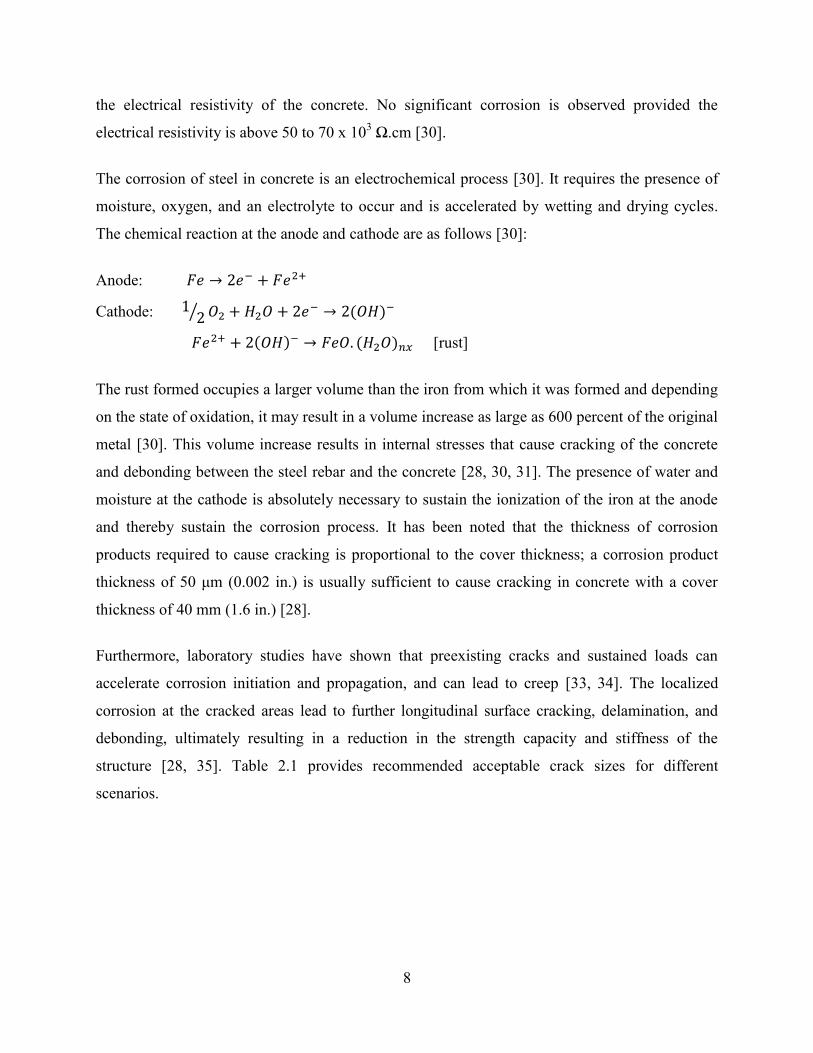
Figure 2.3: Schematic of cracking pattern in normal strength concrete [37].
Concrete, unlike linear elastic materials (ideally brittle) is a quasi-brittle material that exhibits
substantial nonlinearity before the maximum stress. The stress-elongation relationship for a
concrete subjected to uniaxial tension has been divided into four stages (Figure 2.4) [37, 38].
The first stage is before point A, which is about 30% of the peak load. At this stage, the
propagation of internal voids is negligible. In the second stage (point A to point B), which is up
to about 80% of the peak load, internal voids propagate.
The cracks are isolated and randomly distributed over the specimen volume, and the distribution
of tensile strain in the loading direction is approximately uniform over the specimen length. In
the third stage (point B and point C), the internal cracks start to localize into a major crack,
which propagates with increasing load. This phenomenon is called damage localization or strain
localization and causes non-uniform distribution of tensile strain over the specimen’s length in
the loading direction.

11
Figure 2.4: Stages of crack propagation in concrete under tension [36].
The crack propagation is stable until the peak load (point C) is attained. Stable crack growth
implies that the crack propagates only when the load increases [36]. The crack length at the peak
load is referred to as the critical crack length. The fourth stage is after the peak load and here, the
major crack continuously propagates even though the load decreases. The tensile strain of the
material within the localized damage band continuously increases, whereas unloading may occur
for the material outside the damage band. Consequently, the failure of concrete is characterized
by strain localization that may be modeled by a macro-crack. The failure of concrete can
therefore be simulated by fracture mechanics, a powerful tool to describe crack propagation [36].
2.1.2 Non-linear Fracture Mechanics for Concrete System
Linear elastic fracture mechanics is not suitable for modeling the failure of concrete because the
fracture behavior of concrete is greatly influenced by the relatively large fracture process zone
[36]. LEFM can be applied when the length of the fracture process zone is much smaller than the
cross section dimension of the structure but this is usually not the case for most concrete
structures [39]. Furthermore, the crack path in concrete is tortuous, and it is difficult to determine
12
the crack tip in concrete because of particles bridging and variation of the fracture process zone
along the thickness direction. Hence, nonlinear fracture mechanics needs to be used in modeling
concrete fracture. Some of the toughening mechanisms in the sizeable fracture process zone in
concrete are shown in Figure 2.5.
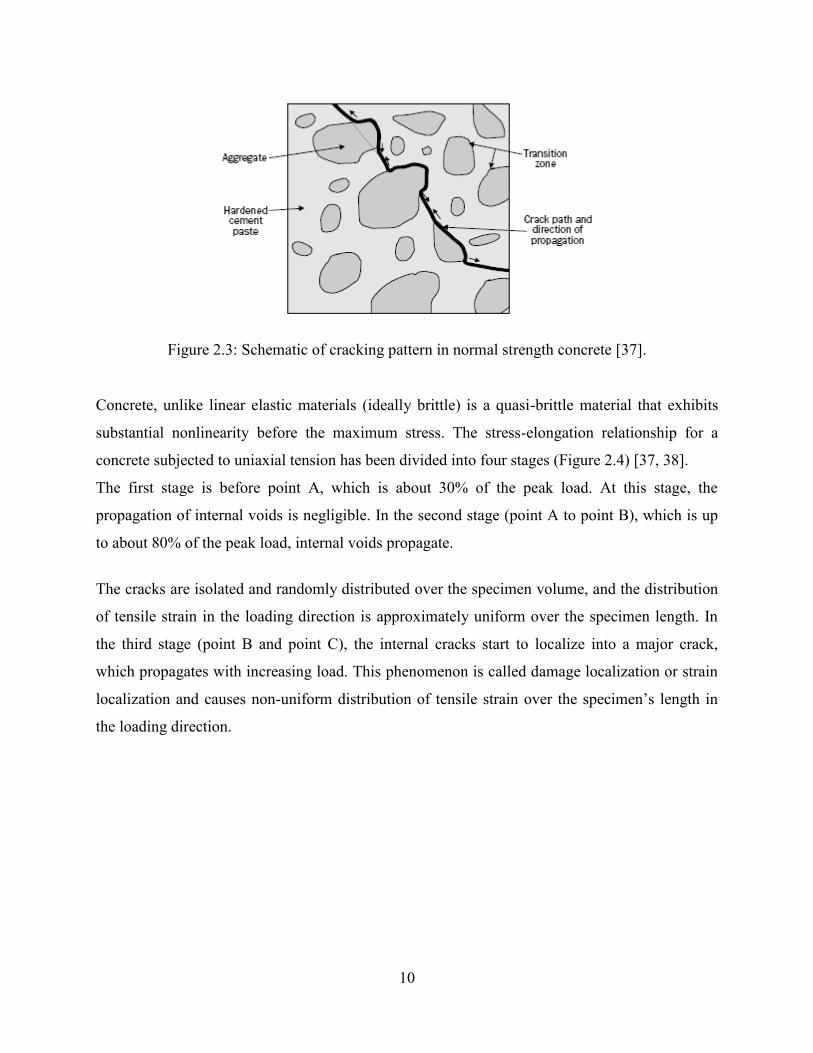
Figure 2.5: Some toughening mechanisms in the fracture process zone [36].
An accurate description of concrete fracture needs to include the tortuous crack path, the three-
dimensional aspects of the crack profile, and the inelastic material response within the fracture
process zone [36]. This can be achieved by representing the crack in the structural material with
an effective quasi-brittle crack. Figure 2.6 shows an effective quasi-brittle crack where an initial
crack and the toughening mechanisms in the associated fracture process zone are presented by an
effective crack with length (a) and a cohesive pressure σ(w) acting on the crack surfaces
respectively. The cohesive pressure σ(w) tends to close the crack and is a monotonically
decreasing function of crack separation displacement (w).
13
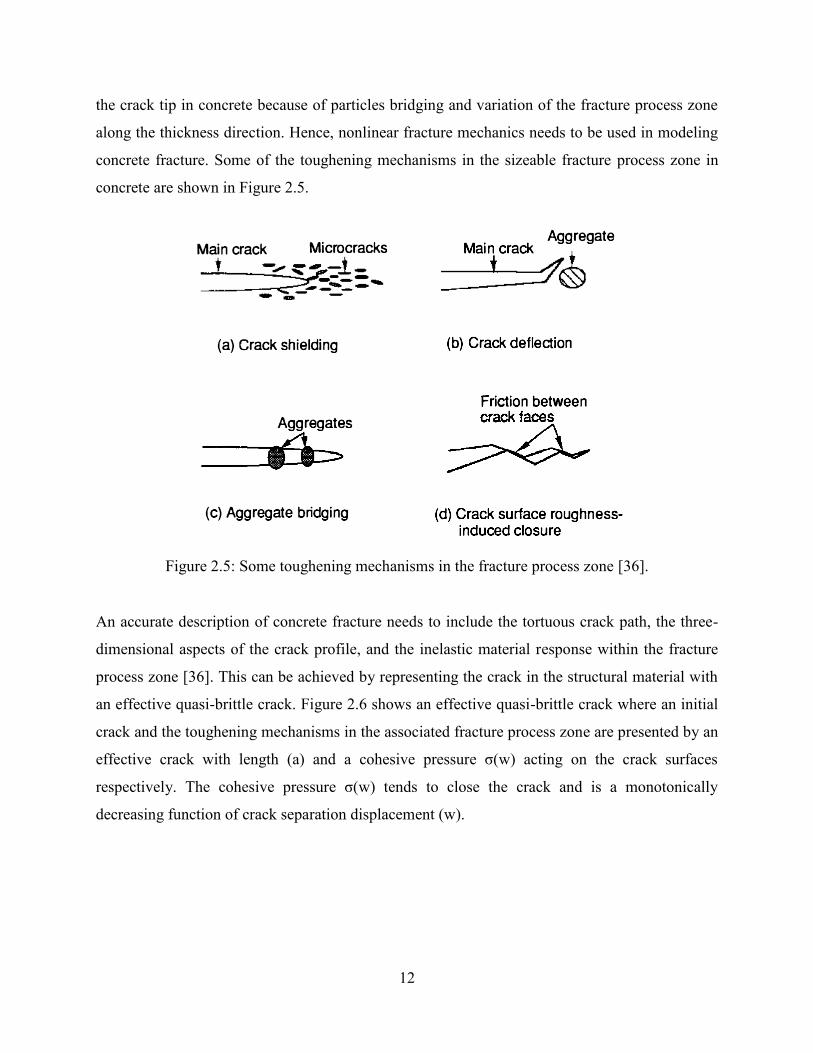
Figure 2.6: Modeling cracks in concrete [36].
The value of σ(w) at the end of the fracture process zone (w=0) is equal to material tensile
strength ft. The load on a concrete structure with the effective quasi-brittle crack results in an
energy release rate G at the tip of the effective quasi-brittle crack. The G may be considered as
the resistance to crack propagation that consists of two parts [36]: (a) the energy rate consumed
during material fracture in creating two surfaces (the material surface energy) i.e. the Griffith-
Irwin energy dissipation mechanism, and (b) the energy rate required to overcome the cohesive
pressure a(w) in the separating of the surfaces i.e. the Dugdale-Barenblatt energy dissipation
mechanism. The energy release rate for a mode I quasi-brittle crack may be expressed as follows
[36]:
(3.2.13)
where is the strain energy rate to create two new crack surfaces for mode I crack, is the
normal traction pressure that is the function of crack opening displacement as shown in Figure
2.6, while CTOD is the original crack-tip opening displacement.
2.2 Crack Monitoring in Concrete Systems
Damage has been defined as changes introduced into a system that adversely affect its current
and future performance [15]. Based on length-scales, all damage begins at the material level.
14
Such damage is usually called a flaw or defect and is present to some degree in all materials.
Under appropriate loading conditions, the defects or flaws grow and coalesce at different rates to
leading to component and then system-level damage [15]. Damage does not necessarily means a
total loss of system functionality but that the system is no longer operating in its optimal manner.
If the damage is allowed to grow, a point of failure is reached at which it is no longer acceptable
to the user. On the time-scales, damage can accumulate incrementally over long period of time
such as in fatigue or corrosion damage accumulation. Damage can also occur in relatively shorter
time-scales such as from scheduled discrete events such as aircraft landings and from
unscheduled discrete events such as military or terrorist attacks, or from natural phenomena
hazards such as earthquakes [15].
Structural health monitoring (SHM) is the process of implementing a damage identification
strategy for aerospace, civil and mechanical engineering infrastructure [15]. It involves the the
observation of a structure or mechanical system overtime using periodically spaced
measurements, the extraction of damage-sensitive features from these measurements and the
statistical analysis of these features to determine the current state of the system’s health [15].
SHM usually involves online-global damage identification in structural systems such as aircrafts,
buildings and bridges. Global health monitoring do not give sufficiently accurate information to
determine the extent of the damage and are mostly based on either finding shifts in resonant
frequencies or changes in structural mode shapes. There is lot of questions about the suitability
of modal data for damage detection since modal information is a reflection of the global system
properties while damage such as crack initiation and propagation is a local phenomenon [40, 41].
Furthermore, the effects of environmental changes especially temperature, can often mask
subtler structural changes caused by damage [42, 43]. A combination of global and local health
monitoring methods is therefore necessary for effective SHM [44, 45].
There are two major challenges for crack monitoring in concrete: exact crack locations cannot be
determined a priori because of concrete’s high inhomogeneity; and there are many possible crack
locations along the concrete due to the load redistribution effect of the steel reinforcements
[16][]. Furthermore, all existing electrical instruments and most fiber optic sensors are ‘point’
sensors that can only detect changes at local points in a structure [16]. Such measurements are
not effective for health monitoring of concrete structures since degradation of such structures
15
occurs through the formation and propagation of localized cracks that have little effect on
structural stiffness [16, 46]. Consequently, measuring the displacement, strain or acceleration at a
particular sensing point is insensitive to cracking unless the point is very close to the damage
location or by using very large number of sensors which is impractical [16, 46].
In addition, the prevailing approach for evaluating the structural condition of bridges is through
visual inspection and tap tests by trained personnel [2, 3]. Visual inspection and tap tests are
however limited to finding voids near the surface of concrete [4]. This approach is also highly
subjective and labor-intensive. It has resulted in the retrofitting or replacement of many bridges
that did not warrant such attention, while increasing the possibility of failure to identify bridges
needing rehabilitation or replacement [3, 4, 6].
2.2.1 Acoustic-based Damage Detection
Elastic waves in the ultrasonic frequency range are widely used in the nondestructive evaluation
(NDE) of defects in concrete [47-49]. This class of acoustic based NDE techniques consists of
the passive acoustic emission (AE) and the ultrasonic testing (UT) methods. The AE is an
inspection technique which detects elastic waves due to micro-cracking while ultrasonic testing
(UT) detects elastic waves due to impacts from a steel ball or dynamic vibrations driven by a
piezoelectric element [47].
Acoustic Emission (AE)
AE is the spontaneous generation of pressure waves by a material under loading due to the
sudden release of energy from micro-cracking [17, 47]. The onset of damage in a structure is
preceded, and accompanied by an emission of elastic waves that spread in the material [17].
These can be received and recorded by sensors applied to the external surface and used to locate
where cracks form [47]. The technique was originally employed to detect cracks and plastic
deformations in metals [50] but can also be used for diagnosing structural damage phenomena in
concrete and masonry structures [51-53]. The strength of AE measurement techniques is the
ability to monitor microscopic damage occurring inside the material [54]. AE monitoring is
performed by means of piezoelectric (PZT) sensors, using crystals that give out signals when
subjected to a mechanical stress [55].
16
Because the amplitude of the elastic pressure waves is usually very weak, less than a millionth
(10−6) of the atmospheric pressure, the electric (voltage) signals emitted by the transducers have
to be amplified greatly (104 or 105 times) before processing [56]. The signal amplification value
generally adopted in monitoring AE events in concrete is 60dB [30] and the duration of a signal
emitted during the cracking of a non-metallic material, like concrete, is around 2000μs [50]. The
amplified signal is then filtered to eliminate unwanted frequencies, such as the vibrations due to
the mechanical instrumentation, which are generally lower than 100 kHz. The AE signals
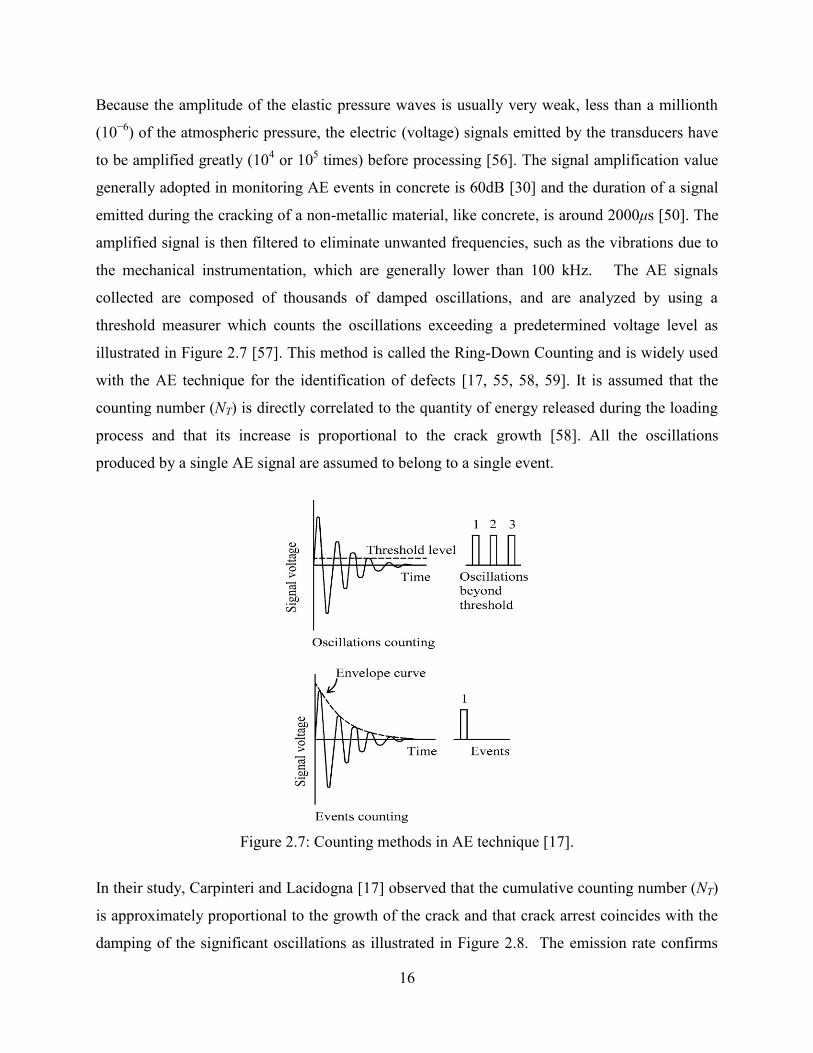
collected are composed of thousands of damped oscillations, and are analyzed by using a
threshold measurer which counts the oscillations exceeding a predetermined voltage level as
illustrated in Figure 2.7 [57]. This method is called the Ring-Down Counting and is widely used
with the AE technique for the identification of defects [17, 55, 58, 59]. It is assumed that the
counting number (NT) is directly correlated to the quantity of energy released during the loading
process and that its increase is proportional to the crack growth [58]. All the oscillations
produced by a single AE signal are assumed to belong to a single event.
Figure 2.7: Counting methods in AE technique [17].
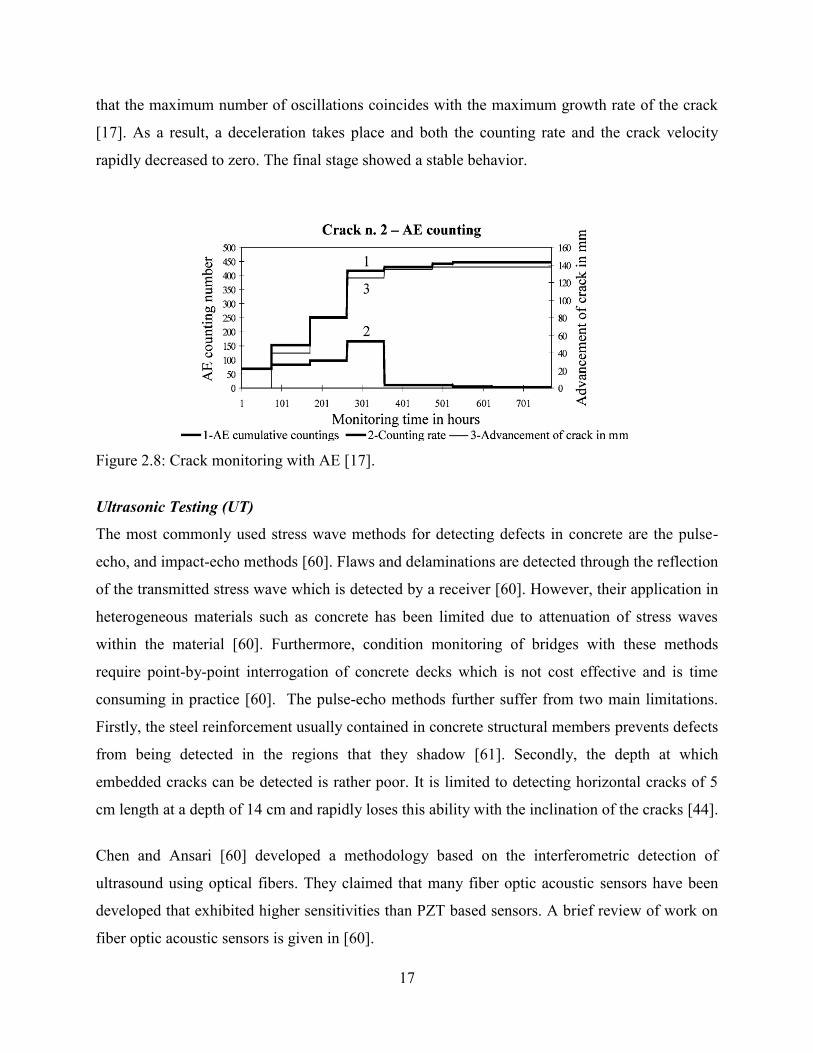
In their study, Carpinteri and Lacidogna [17] observed that the cumulative counting number (NT)
is approximately proportional to the growth of the crack and that crack arrest coincides with the
damping of the significant oscillations as illustrated in Figure 2.8. The emission rate confirms
17
that the maximum number of oscillations coincides with the maximum growth rate of the crack
[17]. As a result, a deceleration takes place and both the counting rate and the crack velocity
rapidly decreased to zero. The final stage showed a stable behavior.
Figure 2.8: Crack monitoring with AE [17].
Ultrasonic Testing (UT)
The most commonly used stress wave methods for detecting defects in concrete are the pulse-
echo, and impact-echo methods [60]. Flaws and delaminations are detected through the reflection
of the transmitted stress wave which is detected by a receiver [60]. However, their application in
heterogeneous materials such as concrete has been limited due to attenuation of stress waves
within the material [60]. Furthermore, condition monitoring of bridges with these methods
require point-by-point interrogation of concrete decks which is not cost effective and is time
consuming in practice [60]. The pulse-echo methods further suffer from two main limitations.
Firstly, the steel reinforcement usually contained in concrete structural members prevents defects
from being detected in the regions that they shadow [61]. Secondly, the depth at which
embedded cracks can be detected is rather poor. It is limited to detecting horizontal cracks of 5
cm length at a depth of 14 cm and rapidly loses this ability with the inclination of the cracks [44].
Chen and Ansari [60] developed a methodology based on the interferometric detection of
ultrasound using optical fibers. They claimed that many fiber optic acoustic sensors have been
developed that exhibited higher sensitivities than PZT based sensors. A brief review of work on
fiber optic acoustic sensors is given in [60].

18
The use of mechanical impact to generate the stress pulse has the greatest success in concrete
testing in practice and several of such techniques have been developed [54, 62-71]. The impact
echo method was developed in the 1980s by Sansalone and Carino [67] for the detection of flaws
in relatively thin concrete structures [62, 71]. The method has been successfully used in detecting
voids and honeycombed concrete in members, delaminations in bare and overlaid slabs, and
voids in tendon ducts [62, 72-74]. The first standard on the use of the impact-echo method for
thickness measurement was adopted in 1998 by the ASTM [62, 67].
When carrying out an impact-echo test, a transient stress pulse is introduced into the test object
using a mechanical point impact as shown in Figure 2.9. The stress waves generated travel in to
Figure 2.9: The impact echo method [68].
object along spherical wavefronts as compression (P) and distortional (S) waves [68, 75]. A
surface wave (R) also travels away from the impact point. The P- and S-waves are reflected by
internal defects (difference in acoustic impedance) or external boundaries [62, 71] and are
measured using a displacement, velocity or acceleration transducer [63, 75]. From the pulse
velocity through the specimen and the measured arrival time t of the reflected wave, the
distance T to the target can be calculated [68]:
19
(2.1)
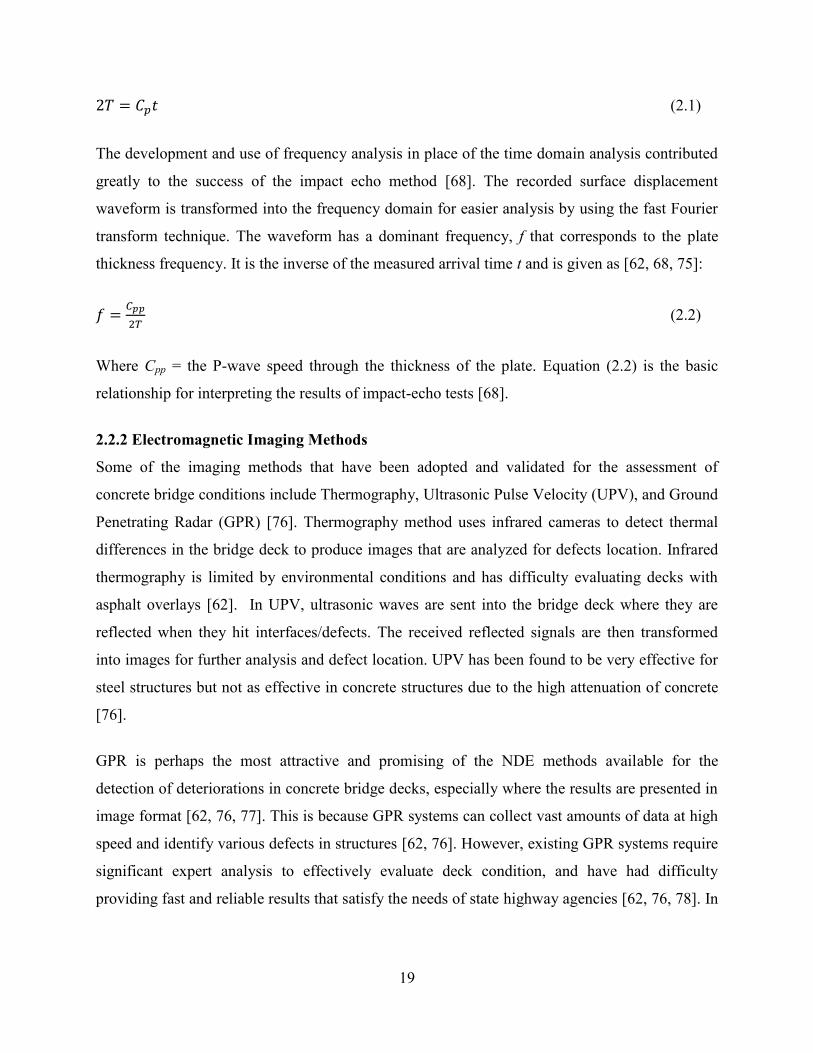
The development and use of frequency analysis in place of the time domain analysis contributed
greatly to the success of the impact echo method [68]. The recorded surface displacement
waveform is transformed into the frequency domain for easier analysis by using the fast Fourier
transform technique. The waveform has a dominant frequency, f that corresponds to the plate
thickness frequency. It is the inverse of the measured arrival time t and is given as [62, 68, 75]:
(2.2)
Where Cpp = the P-wave speed through the thickness of the plate. Equation (2.2) is the basic
relationship for interpreting the results of impact-echo tests [68].
2.2.2 Electromagnetic Imaging Methods
Some of the imaging methods that have been adopted and validated for the assessment of
concrete bridge conditions include Thermography, Ultrasonic Pulse Velocity (UPV), and Ground
Penetrating Radar (GPR) [76]. Thermography method uses infrared cameras to detect thermal
differences in the bridge deck to produce images that are analyzed for defects location. Infrared
thermography is limited by environmental conditions and has difficulty evaluating decks with
asphalt overlays [62]. In UPV, ultrasonic waves are sent into the bridge deck where they are
reflected when they hit interfaces/defects. The received reflected signals are then transformed
into images for further analysis and defect location. UPV has been found to be very effective for
steel structures but not as effective in concrete structures due to the high attenuation of concrete
[76].
GPR is perhaps the most attractive and promising of the NDE methods available for the
detection of deteriorations in concrete bridge decks, especially where the results are presented in
image format [62, 76, 77]. This is because GPR systems can collect vast amounts of data at high
speed and identify various defects in structures [62, 76]. However, existing GPR systems require
significant expert analysis to effectively evaluate deck condition, and have had difficulty
providing fast and reliable results that satisfy the needs of state highway agencies [62, 76, 78]. In
20
some cases, the interpretation of GPR images requires additional information from destructive
methods such as coring or drilling [79].
Ground Penetrating Radar (GPR)
A GPR system emits radar (Radio Detection and Ranging) and radio waves from an antenna into
a structure to detect defects [76]. When the radar and radio waves come in contact with a defect,
some of the energy is re-emitted and this is used to detect the defect and to determine its size,
direction, distance and properties [80]. GPR provides images that relate the amplitude of the
signal to the arrival time or depth when the velocity in the medium is known [81]. The image of
the subsurface is obtained by assigning a different color to each amplitude and combining the
traces [76]. From the permittivity of the material (dielectric constant); the speed of the
electromagnetic impulse can be calculated and the depth of reflectors (defects/interfaces) can be
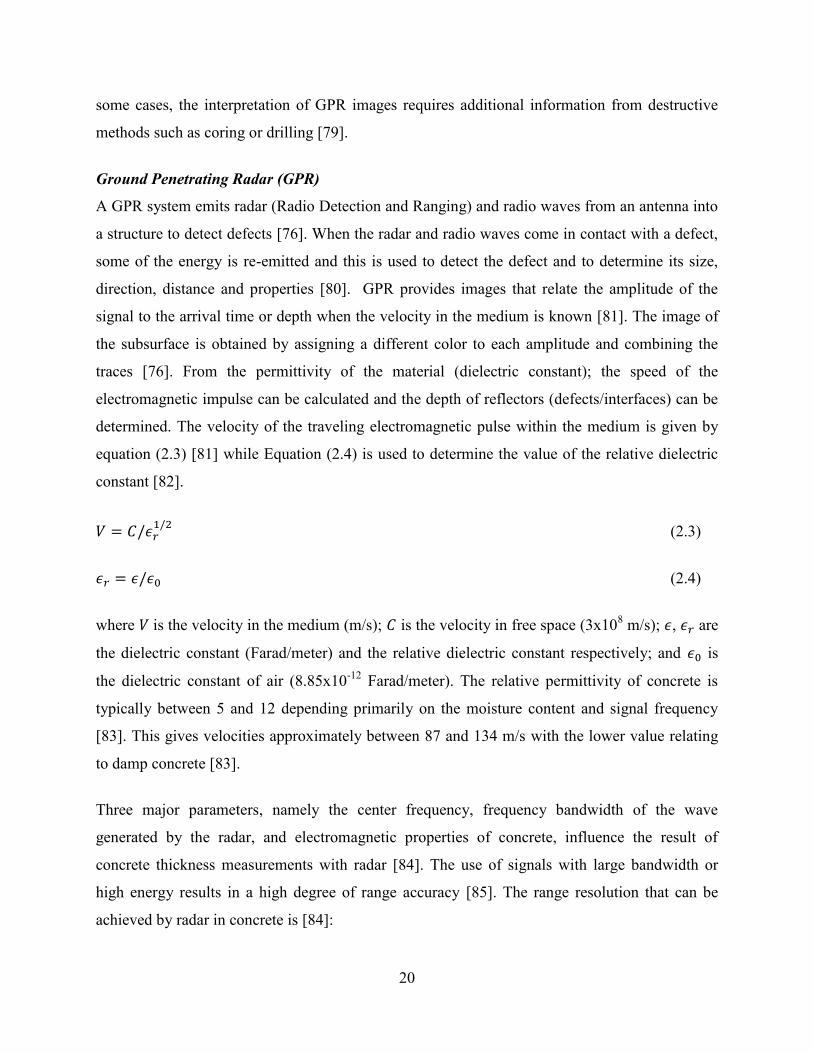
determined. The velocity of the traveling electromagnetic pulse within the medium is given by
equation (2.3) [81] while Equation (2.4) is used to determine the value of the relative dielectric
constant [82].
(2.3)
(2.4)
where is the velocity in the medium (m/s); is the velocity in free space (3x10⁸ m/s); , are
the dielectric constant (Farad/meter) and the relative dielectric constant respectively; and is
the dielectric constant of air (8.85x10⁻¹² Farad/meter). The relative permittivity of concrete is
typically between 5 and 12 depending primarily on the moisture content and signal frequency
[83]. This gives velocities approximately between 87 and 134 m/s with the lower value relating
to damp concrete [83].
Three major parameters, namely the center frequency, frequency bandwidth of the wave
generated by the radar, and electromagnetic properties of concrete, influence the result of
concrete thickness measurements with radar [84]. The use of signals with large bandwidth or
high energy results in a high degree of range accuracy [85]. The range resolution that can be
achieved by radar in concrete is [84]:
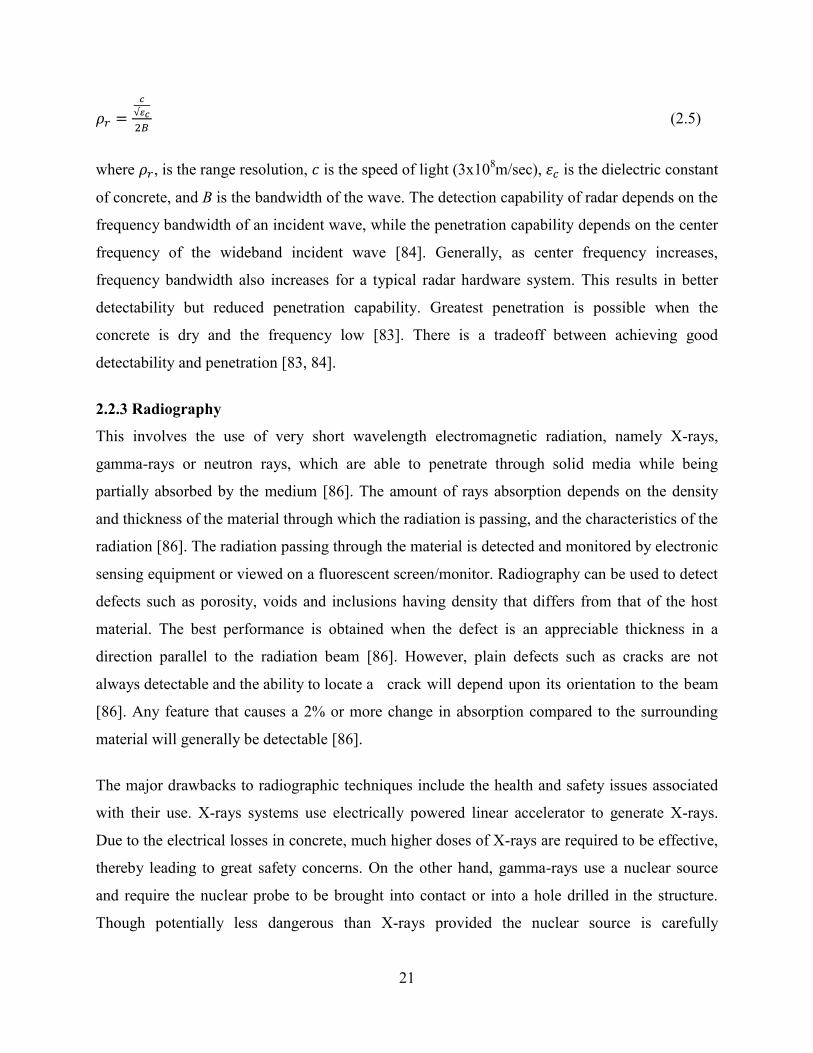
21
(2.5)
where , is the range resolution, is the speed of light (3x10⁸m/sec), is the dielectric constant
of concrete, and B is the bandwidth of the wave. The detection capability of radar depends on the
frequency bandwidth of an incident wave, while the penetration capability depends on the center
frequency of the wideband incident wave [84]. Generally, as center frequency increases,
frequency bandwidth also increases for a typical radar hardware system. This results in better
detectability but reduced penetration capability. Greatest penetration is possible when the
concrete is dry and the frequency low [83]. There is a tradeoff between achieving good
detectability and penetration [83, 84].
2.2.3 Radiography
This involves the use of very short wavelength electromagnetic radiation, namely X-rays,
gamma-rays or neutron rays, which are able to penetrate through solid media while being
partially absorbed by the medium [86]. The amount of rays absorption depends on the density
and thickness of the material through which the radiation is passing, and the characteristics of the
radiation [86]. The radiation passing through the material is detected and monitored by electronic
sensing equipment or viewed on a fluorescent screen/monitor. Radiography can be used to detect
defects such as porosity, voids and inclusions having density that differs from that of the host
material. The best performance is obtained when the defect is an appreciable thickness in a
direction parallel to the radiation beam [86]. However, plain defects such as cracks are not
always detectable and the ability to locate a crack will depend upon its orientation to the beam
[86]. Any feature that causes a 2% or more change in absorption compared to the surrounding
material will generally be detectable [86].
The major drawbacks to radiographic techniques include the health and safety issues associated
with their use. X-rays systems use electrically powered linear accelerator to generate X-rays.
Due to the electrical losses in concrete, much higher doses of X-rays are required to be effective,
thereby leading to great safety concerns. On the other hand, gamma-rays use a nuclear source
and require the nuclear probe to be brought into contact or into a hole drilled in the structure.
Though potentially less dangerous than X-rays provided the nuclear source is carefully

22
controlled, the nuclear source imposes a lot of regulations and concern in its use and handling.
Furthermore, because the gamma-ray procedure emits far less power than the X-ray system, the
images tend to be weaker and require longer “stacking” time [86]. In neutron radiography, a
neutron flux is passed through an object and is differentially attenuated by the various materials
present in the object. The differential attenuation is then recorded on film as the flux emanates
from the specimen to reveal details regarding the composition of the object [86]. Neutron
radiography (NR) has been used with contrast agents to study internal cracking patterns in
concrete [86-90].
Comparative studies have shown that the NR shows more cracking (Figure 2.10) than the X-ray
radiograph [86, 90]. Pugliesi and Andrade [87] used digital neutron radiography (NR) technique
to visualize cracks in concrete. They enhanced crack visualization by using samples impregnated
with a high neutron absorbing substance (contrast agent) made from a chemical solution of
gadolinium. Its neutron absorption microscopic cross-section is over 1000 times more than any
element of the concrete composition [87]. They were able to obtain digital radiographs (Figure
2.10b) that gave better results, in terms of crack visualization, than those from digital X-ray
radiographs (Figure 2.10c) and analog ones obtained by the NR technique of the same samples.
The minimal discernible thickness of the gadolinium nitrate crystal deposits into the cracks
obtained with the NR technique was about 0.6 µm. This is 25 times smaller than that obtained
with conventional X-ray radiography [87]. However, NR cannot be easily used on large scale
structures such as bridges [86].
Figure 2.10: (a) Conventional photograph of sample subjected to compressive strength to induce cracking, (b) digital neutron radiography of sample, (c) digital X-ray radiography [87].
(a) (b) (c)

23
2.2.4 Fiber Optic Sensors (FOS)
Fiber optic sensors have some unique properties which make them particularly suitable for defect
monitoring in civil infrastructure [6]. Their flexibility makes them applicable on complex
surfaces and difficult-to-reach areas. They are also capable of both local and distributive
measurements (ranging from 1 mm to tens of kilometers) through multiplexing [91, 92]. Their
small sizes (250-1000 m ) make them very suitable for embedding in civil infrastructure for in-
situ monitoring. They are also immune to electric and magnetic interferences (EMI). In addition,
they are able to measure a wide array of parameters including temperature, strain and loads
acting on a structure. Finally, the use of fiber optics in telecommunication has helped in reducing
the cost of fiber optic system components and has made them competitive with conventional
sensors [92].
An optical fiber is a cylindrical dielectric waveguide made from silica glass or a polymer
material. Both the core and the cladding are made from glass or plastic, and the surrounding
coatings used to protect the optical fiber are made from acrylate or polyimide materials [16, 91].
The refractive index of the core is slightly higher than that of the cladding [93].
FOS are based on measuring changes in four main properties of the light passing through the
optical fiber that can be modulated by various environmental perturbations [94, 95]. The
properties are the phase, polarization state, intensity, and wavelength [95]. Based on these, FOS
can be classified in to interferometric, polarimetric, intensity modulated, and spectrometric
sensors respectively [95]. Table 2.2 summarizes the strengths and limitations of these four
classes of FOS.
Three main approaches were identified in literature for fiber optic-based crack monitoring in
concrete structures. The first involves detecting the fracture of the optical fibers; the second is by
monitoring the amount of strain [96], while the third entails measuring the bending loss [49] of
an embedded optical fiber or optical fiber array near an impact [54].
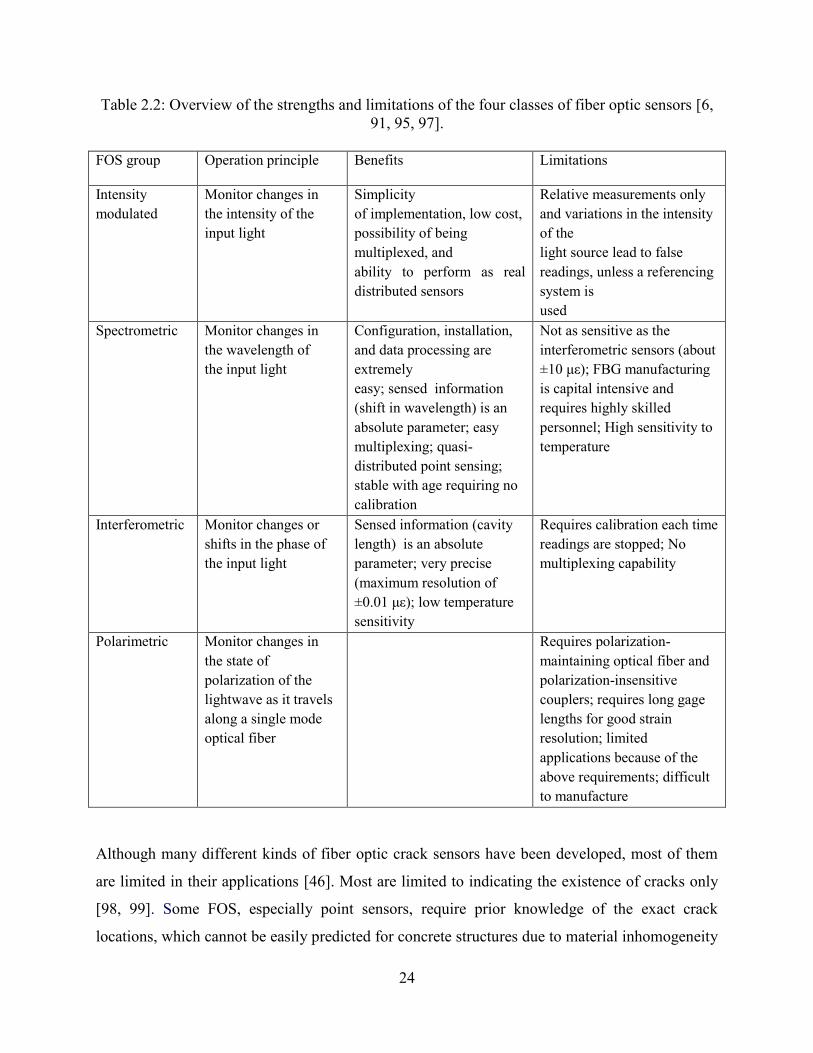
24
Table 2.2: Overview of the strengths and limitations of the four classes of fiber optic sensors [6, 91, 95, 97].
FOS group Operation principle Benefits Limitations
Intensity
modulated
Monitor changes in
the intensity of the
input light
Simplicity
of implementation, low cost,
possibility of being
multiplexed, and
ability to perform as real
distributed sensors
Relative measurements only
and variations in the intensity
of the
light source lead to false
readings, unless a referencing
system is
used
Spectrometric Monitor changes in
the wavelength of
the input light
Configuration, installation,
and data processing are
extremely
easy; sensed information
(shift in wavelength) is an
absolute parameter; easy
multiplexing; quasi-
distributed point sensing;
stable with age requiring no
calibration
Not as sensitive as the
interferometric sensors (about
±10 ε); FBG manufacturing
is capital intensive and
requires highly skilled
personnel; High sensitivity to
temperature
Interferometric Monitor changes or
shifts in the phase of
the input light
Sensed information (cavity
length) is an absolute
parameter; very precise
(maximum resolution of
±0.01 ε); low temperature sensitivity
Requires calibration each time
readings are stopped; No
multiplexing capability
Polarimetric Monitor changes in
the state of
polarization of the
lightwave as it travels
along a single mode
optical fiber
Requires polarization-
maintaining optical fiber and
polarization-insensitive
couplers; requires long gage
lengths for good strain
resolution; limited
applications because of the
above requirements; difficult
to manufacture
Although many different kinds of fiber optic crack sensors have been developed, most of them
are limited in their applications [46]. Most are limited to indicating the existence of cracks only
[98, 99]. Some FOS, especially point sensors, require prior knowledge of the exact crack
locations, which cannot be easily predicted for concrete structures due to material inhomogeneity

25
[46, 49, 100]. Strain-based sensors are only able to detect the integral strain along their gauge
length [95, 101]. However, if the selected gauge length is too large, it becomes very difficult to
differentiate between one widely opened crack and many small harmless ones [46]. If the gauge
length is small, many gauges are required to cover the plausible cracking region which makes it
impractical [46]. The underlying principles of the three commonly used FOS techniques for
crack detection are hereby described.
Fabry-Perot (FP) Sensor
There are two main types of FP sensor as illustrated Figure 2.11. In the extrinsic FP, a cavity is
formed between the air–glass interfaces of two fiber end faces aligned inside a hollow-core tube
(Figure 2.11a). The air gap between the mirrors defines the FP cavity while the distance
separating the fuse spots is the gauge length [91]. In the intrinsic sensor, the cavity is formed
between two partial mirrors formed as an integral part of a continuous length of fiber (Figure
2.11b) by fusion splicing an uncoated fiber to a fiber with a thin dielectric coating on the end
[95]. The cavity is the sensing region. Strain variations induce changes in the length of the FP
cavity, thereby inducing optical signals. During strain measurement, a white light is sent into one
end of the fiber optic cable and the reflected signal is received by a readout unit. The strain in a
FP sensor is measured using the following equations [91]:
/cavity gaugeL L (2.6)
where cavityL is the change in the cavity length and gaugeL is the gauge length. The real strain can
be obtained by eliminating the temperature effect using the following equation:
r T (2.7)
where is the total strain in a FP sensor obtained using Eq. (2.6), r is the real strain of the
structure, is the thermal coefficient of structure, and T is the temperature change relative to
the temperature at installation.

26
Figure 2.11: Extrinsic and intrinsic Fabry–Perot interferometric sensors: (a) Extrinsic sensor and (b) reflective and transmissive configurations of an intrinsic sensor [95].
FBG Sensor
The precise spacing of the grating, called the ‘pitch’, reflects the incident light with a narrow
band centered about the ‘Bragg’ wavelength, defined byμ
0 2n (2.8)
where 0 is the Bragg wavelength, n is the average effective index of refraction of the grating,
and is the pitch spacing, as shown in Figure 2.12 [91]. The FBG also provides a linear
response based on the measurement of wavelength shift (Δ ) due to the straining of the gauge
[91]. The actual strain can be determined by taking into account the strain due to temperature by
the equation:
0/ ( )GF T (2.9)
where 0 , GF is the FBG gauge factor, typically about 0.75 − 0.8β, is the strain,
is the thermal coefficient, and T is the temperature change relative to the temperature at
installation.
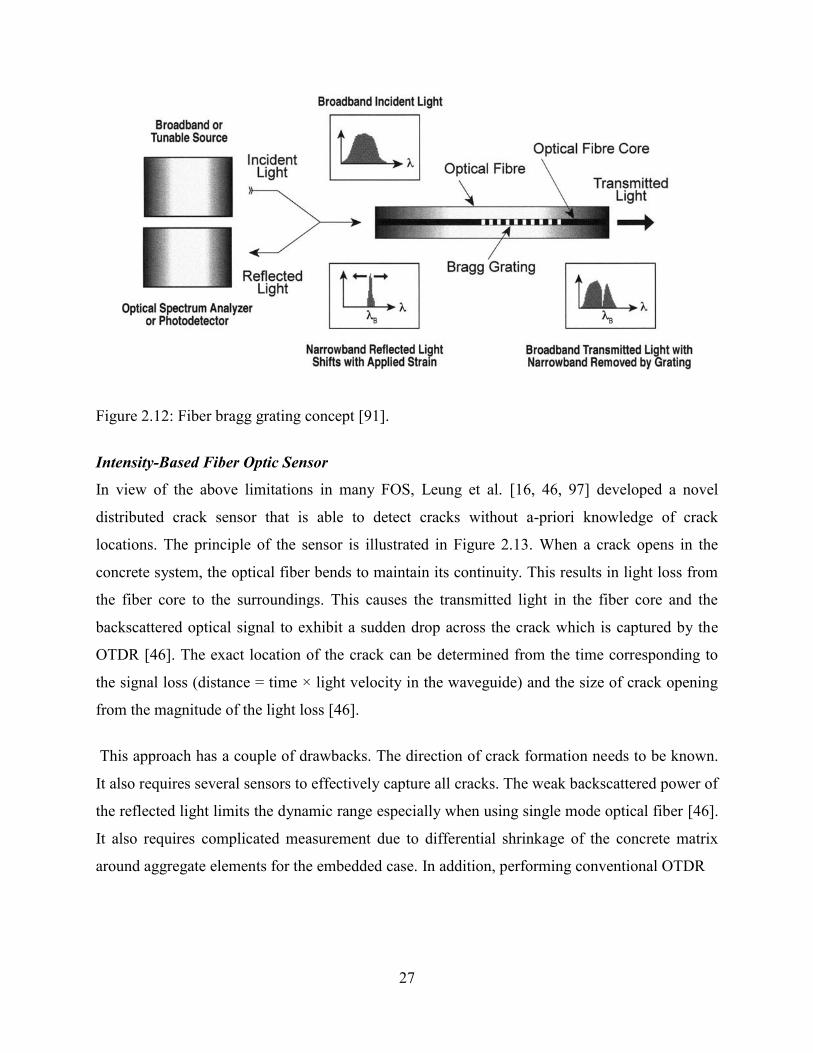
27
Figure 2.12: Fiber bragg grating concept [91].
Intensity-Based Fiber Optic Sensor
In view of the above limitations in many FOS, Leung et al. [16, 46, 97] developed a novel
distributed crack sensor that is able to detect cracks without a-priori knowledge of crack
locations. The principle of the sensor is illustrated in Figure 2.13. When a crack opens in the
concrete system, the optical fiber bends to maintain its continuity. This results in light loss from
the fiber core to the surroundings. This causes the transmitted light in the fiber core and the
backscattered optical signal to exhibit a sudden drop across the crack which is captured by the
OTDR [46]. The exact location of the crack can be determined from the time corresponding to
the signal loss (distance = time × light velocity in the waveguide) and the size of crack opening
from the magnitude of the light loss [46].
This approach has a couple of drawbacks. The direction of crack formation needs to be known.
It also requires several sensors to effectively capture all cracks. The weak backscattered power of
the reflected light limits the dynamic range especially when using single mode optical fiber [46].
It also requires complicated measurement due to differential shrinkage of the concrete matrix
around aggregate elements for the embedded case. In addition, performing conventional OTDR

28
Figure 2.13: Concept of distributed sensing with the novel sensors [46].
on a straight fiber is not very effective because the cracking needs to almost reach the point of
fracturing the fiber before the signal is attenuated enough to be detectable [49]. Because pulses
of shorter than 10 ns duration are required in order to achieve spatial resolutions of within a
meter, there is a conflict between short pulses for high resolution and more powerful ones for
high signal to noise ratio required for proper signal assessment [49].
In another study, Kuang et al [102] developed an intensity based polymer optical fiber sensor for
crack detection and vertical deflection monitoring in concrete beams. A segment of the POF
cross sectional profile was removed to increase its sensitivity. This increases the amount of light
loss in the fiber when bent because the cladding has been removed. This approach to sensitizing
the fiber optic sensor (FOS) differs from others such as chemical tapering [103], intermittent
etching [104, 105] and radial grooving [105] because the sensitized region of the sensor is
limited to a segment of the POF and not the entire FOS cross-section. The benefits of this
method include fast sensitizing procedure with the FOS produced having excellent sensitivity to
bending/flexural loading and high level signal repeatability [106]. The sensor exhibited great
potential for monitoring beam deflections during loading and detecting initial cracking and
failure [102].

29
2.3 The Triboluminescence Phenomenon
The triboluminescence (TL) phenomenon has generated extensive research interest over the
years because of its potential application for damage detection [24]. Triboluminescence also
known as fracto- [107], piezo- [108], or mechano-luminescence [109], is the emission of light by
solid materials when they are stressed or fractured [110, 111]. It has been estimated that about
50% of all crystal compounds exhibit a range of TL [112].
Although TL was reportedly discovered in the sixteenth century by Sir Francis Bacon, serious
research into the phenomenon only began in the twentieth century. The main contribution of
early nineteenth century research was the compilation of an extensive list of TL materials using
highly subjective visual observation of the TL response as a function of time and quantity [112].
The development of the photomultiplier tube (PMT) in the 1930s and its application in
triboluminescence studies in 1952 however introduced a quantitative technique for detecting,
measuring, and comparing TL emissions objectively.
Recent research in triboluminescence includes those on [24, 25, 107-116]:
(i) Techniques to initiate the triboluminescent light emission with a known amount of
mechanical energy, so as to investigate the relationship between mechanical energy input and the
resulting TL emission intensity [117, 118].
(ii) Techniques to measure the TL emission spectrum [118, 119] with increased resolution and
with a reduction in both the amount of triboluminescent material required and the time needed to
obtain the spectrum.
(iii) The analysis of the spectral properties of the TL to understand the underlying mechanism of
fracture-induced light emission [120, 121].
Light emission in a material can either be by incandescence or luminescence. Incandescence is
light produced by heating an object to such a high temperature that the atoms become highly
agitated leading to the glowing of the bulk matter [122]. It is an inefficient way of producing
light as most of the energy is dissipated as heat. Incandescence is explained by Planck’s Black
Body Emission theory. On the other hand, luminescence, sometimes referred to as ‘‘cold light’’,
is light produced at normal and lower temperatures. It involves an energy source elevating an
electron of an atom out of its ‘‘ground’’ state into an ‘‘excited’’ state; and the sequential release
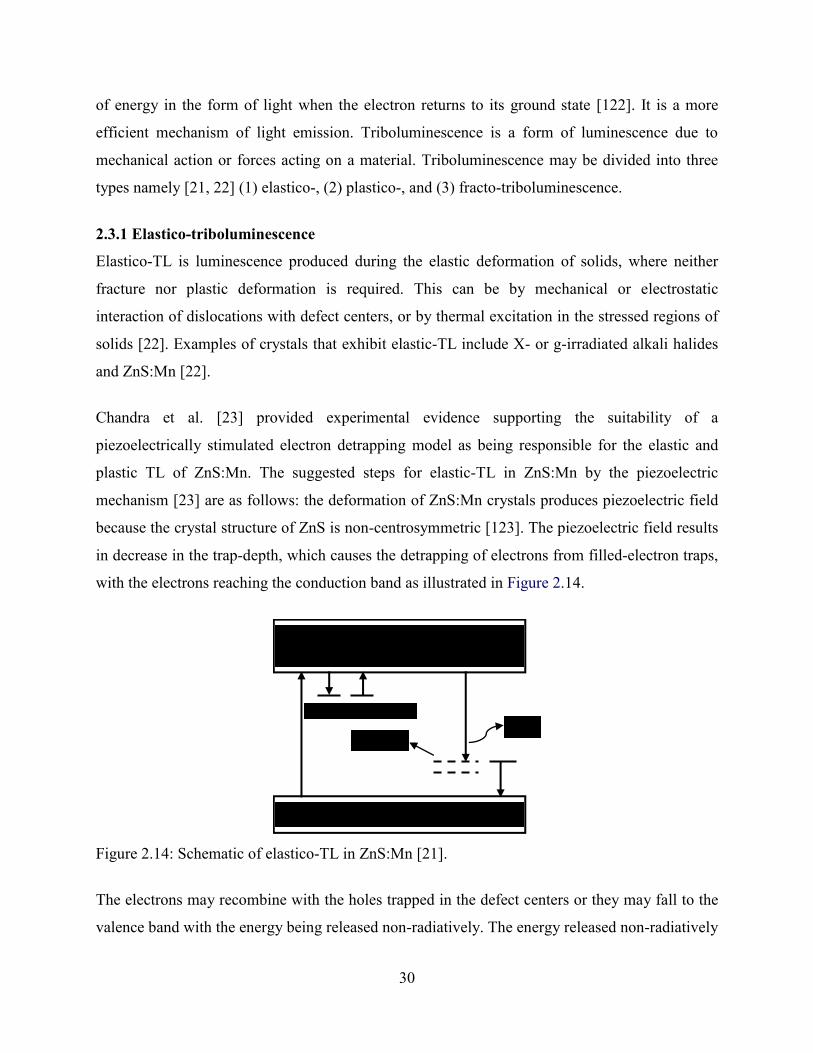
30
of energy in the form of light when the electron returns to its ground state [122]. It is a more
efficient mechanism of light emission. Triboluminescence is a form of luminescence due to
mechanical action or forces acting on a material. Triboluminescence may be divided into three
types namely [21, 22] (1) elastico-, (2) plastico-, and (3) fracto-triboluminescence.
2.3.1 Elastico-triboluminescence
Elastico-TL is luminescence produced during the elastic deformation of solids, where neither
fracture nor plastic deformation is required. This can be by mechanical or electrostatic
interaction of dislocations with defect centers, or by thermal excitation in the stressed regions of
solids [22]. Examples of crystals that exhibit elastic-TL include X- or g-irradiated alkali halides
and ZnS:Mn [22].
Chandra et al. [23] provided experimental evidence supporting the suitability of a
piezoelectrically stimulated electron detrapping model as being responsible for the elastic and
plastic TL of ZnS:Mn. The suggested steps for elastic-TL in ZnS:Mn by the piezoelectric
mechanism [23] are as follows: the deformation of ZnS:Mn crystals produces piezoelectric field
because the crystal structure of ZnS is non-centrosymmetric [123]. The piezoelectric field results
in decrease in the trap-depth, which causes the detrapping of electrons from filled-electron traps,
with the electrons reaching the conduction band as illustrated in Figure 2.14.
Figure 2.14: Schematic of elastico-TL in ZnS:Mn [21].
The electrons may recombine with the holes trapped in the defect centers or they may fall to the
valence band with the energy being released non-radiatively. The energy released non-radiatively
Conduction Band
Valence Band
Holes
Shallow traps hv
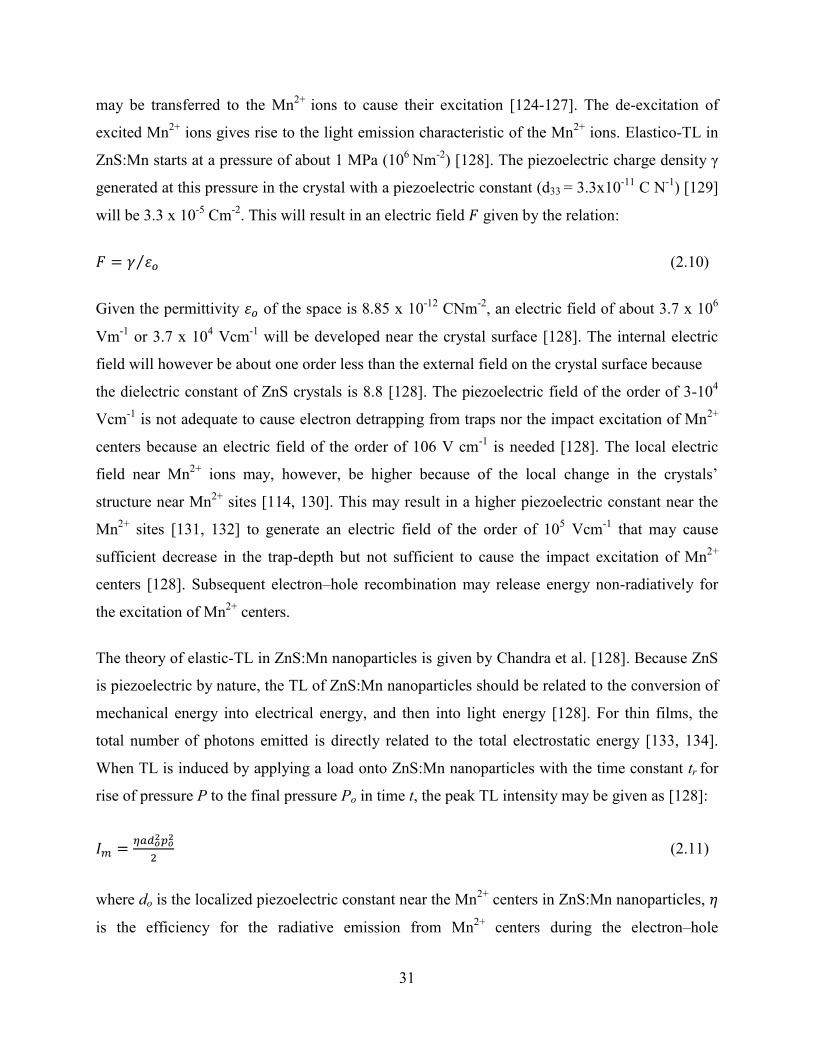
31
may be transferred to the Mn2+ ions to cause their excitation [124-127]. The de-excitation of
excited Mn2+ ions gives rise to the light emission characteristic of the Mn2+ ions. Elastico-TL in
ZnS:Mn starts at a pressure of about 1 MPa (106 Nm-2) [128]. The piezoelectric charge density
generated at this pressure in the crystal with a piezoelectric constant (d33 = 3.3x10⁻¹¹ C N-1) [129]
will be 3.3 x 10⁻⁵ Cm-2. This will result in an electric field given by the relation:
(2.10)
Given the permittivity of the space is 8.85 x 10⁻¹² CNm-2, an electric field of about 3.7 x 10⁶
Vm-1 or 3.7 x 10⁴ Vcm-1 will be developed near the crystal surface [128]. The internal electric
field will however be about one order less than the external field on the crystal surface because
the dielectric constant of ZnS crystals is 8.8 [128]. The piezoelectric field of the order of 3-104
Vcm-1 is not adequate to cause electron detrapping from traps nor the impact excitation of Mn2+
centers because an electric field of the order of 106 V cm-1 is needed [128]. The local electric
field near Mn2+ ions may, however, be higher because of the local change in the crystals’
structure near Mn2+ sites [114, 130]. This may result in a higher piezoelectric constant near the
Mn2+ sites [131, 132] to generate an electric field of the order of 105 Vcm-1 that may cause
sufficient decrease in the trap-depth but not sufficient to cause the impact excitation of Mn2+
centers [128]. Subsequent electron–hole recombination may release energy non-radiatively for
the excitation of Mn2+ centers.
The theory of elastic-TL in ZnS:Mn nanoparticles is given by Chandra et al. [128]. Because ZnS
is piezoelectric by nature, the TL of ZnS:Mn nanoparticles should be related to the conversion of
mechanical energy into electrical energy, and then into light energy [128]. For thin films, the
total number of photons emitted is directly related to the total electrostatic energy [133, 134].
When TL is induced by applying a load onto ZnS:Mn nanoparticles with the time constant tr for
rise of pressure P to the final pressure Po in time t, the peak TL intensity may be given as [128]:
(2.11)
where do is the localized piezoelectric constant near the Mn2+ centers in ZnS:Mn nanoparticles,
is the efficiency for the radiative emission from Mn2+ centers during the electron–hole

32
recombination, and is a constant that is related to the density of the Mn2+ centers and the
density of electrons in shallow traps. Eq. (2.11) implies that the peak TL intensity will increase
quadratically with Po. At constant deformation rate, however, the peak intensity will increase
linearly with the applied pressure:
(2.12)
When (the rate constant for the relaxation of surface charges), the total TL intensity can
be given as:
(2.13)
where is the rate constant for the pressure rise, and is equivalent to the machine
constant [128]. Since , , and decrease with increasing temperature, it follows from Eqs.
(2.11) and (2.13) that the peak and total TL intensity decrease significantly with increase in the
temperature of the nano-crystals.
2.3.2 Plastico-triboluminescence
Plastico-TL is luminescence produced during plastic deformation of solids where fracture is not
required. It can be excited by the mechanical or electrostatic interaction of dislocations with
defect centers; electrification of crystal surfaces by the movement of charged dislocations; or
thermal excitation in the stressed regions of solids such as colored alkali halides, II–VI
compounds, alkaline-earth oxides, and metals [22]. Chandra et al. [135] reported on the
luminescence arising from the plastic deformation of colored alkali halides using pressure steps.
In the elastic region, the strain increases linearly with the stress, and the TL intensity also
increased linearly with stress. In the plastic region, the strain and TL intensity also increased
with stress according to the power law [135].
The steps involved in the TL of x- or -irradiated alkali halide crystals can be as follows and is
illustrated in Figure 2.15: (i) Plastic deformation causes movement of dislocations, (ii) the
moving dislocations capture electrons from the interacting F-centers lying in the expansion
region of dislocations, (iii) the captured electrons from F-centers move with the dislocations and
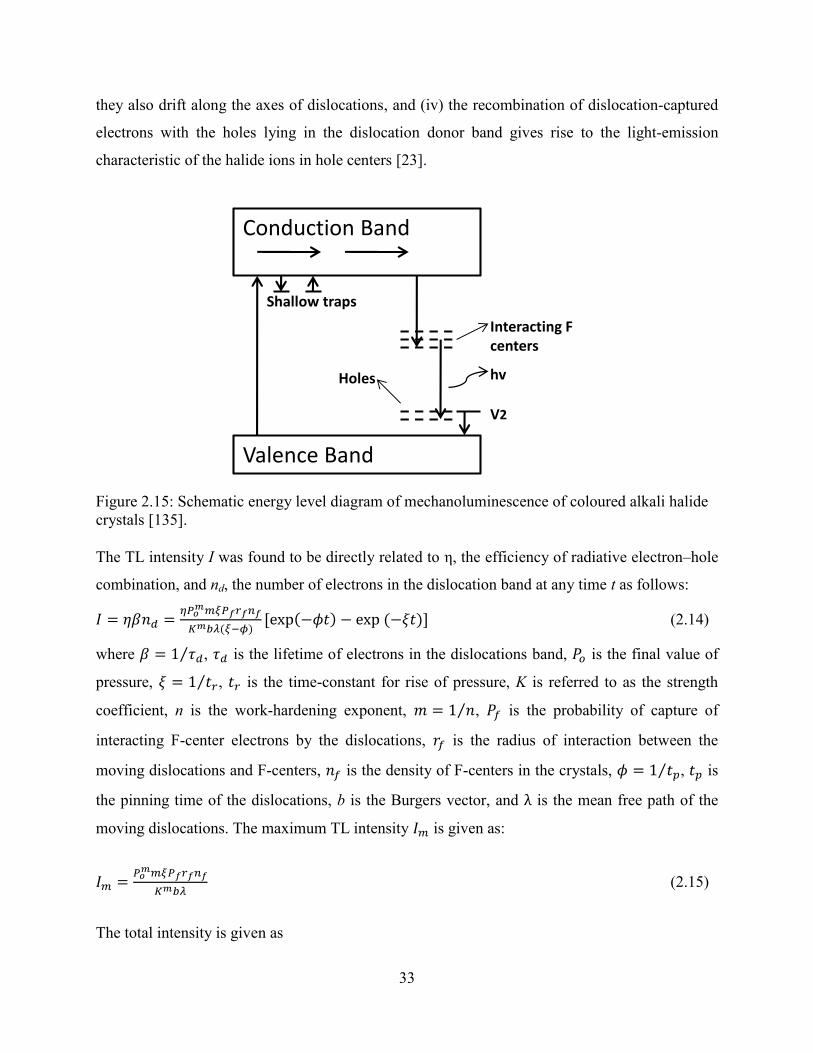
33
they also drift along the axes of dislocations, and (iv) the recombination of dislocation-captured
electrons with the holes lying in the dislocation donor band gives rise to the light-emission
characteristic of the halide ions in hole centers [23].
Figure 2.15: Schematic energy level diagram of mechanoluminescence of coloured alkali halide crystals [135].
The TL intensity I was found to be directly related to η, the efficiency of radiative electron–hole
combination, and nd, the number of electrons in the dislocation band at any time t as follows: (2.14)
where , is the lifetime of electrons in the dislocations band, is the final value of
pressure, , is the time-constant for rise of pressure, K is referred to as the strength
coefficient, n is the work-hardening exponent, , is the probability of capture of
interacting F-center electrons by the dislocations, is the radius of interaction between the
moving dislocations and F-centers, is the density of F-centers in the crystals, , is
the pinning time of the dislocations, b is the Burgers vector, and λ is the mean free path of the
moving dislocations. The maximum TL intensity is given as:
(2.15)
The total intensity is given as
Conduction Band
Valence Band
V2
hv
Shallow traps
Interacting F
centers
Holes

34
(2.16)
Both and increase according to the power law with an increase in the applied pressure. It
has also been shown that the TL intensity depends on many parameters including strain rate,
stress, density of F-centers, size of crystals, temperature, and luminescence efficiency [22, 112,
136-138].
2.3.3 Fracto-triboluminescence
Fracto-TL is luminescence produced due to the creation of new surfaces during the fracture of
solids. During fracto-TL, there is creation of charged surfaces at fracture (Figure 2.16) due to
processes such as piezoelectrification, movements of charged dislocations, and charged defect
barodiffusion [22, 139]. There is neutralization of these surface charges by the charge carriers or
ions produced from the dielectric breakdown of the intervening gases and solids. This results in
the production of luminescence that resembles a gas discharge (e.g. sucrose, tartaric acid, and
Rochelle salt) or luminescence of a solid (e.g. coumarin, resorcinol, and phenanthrene) or one
that combines the characteristics of both the intervening gases and solids (e.g. uranyl nitrate
hexahydrate, impure saccharin, and chlorotriphenyl-methane [22, 110].
Figure 2:16 A schematic of the piezoelectric theory illustrating TL phenomena upon cleavage [139].
If a crystal with thickness H is cleaved along a plane parallel to its width W, with velocity of
crack propagation being v, provided ɑ3t < 1, then the TL intensity may be given as [22]:
(2.17)

35
where is the charge density of the newly created surfaces, and are the rate constants for
the relaxation of charges on the newly created surfaces, ɑ3= ɑ1 + ɑ2, and η1 is the luminescence
efficiency associated with the movement of carriers produced by the dielectric breakdown of the
crystals while η2 is the efficiency associated with the movement of electrons and ions produced
by the dielectric breakdown of intervening gases. According to Eqn 6, when a crystal is cleaved,
initially the TL intensity should rise linearly with time t. At the end of cleavage (at t = tm, v = 0),
the TL intensity may be expressed as
(2.18)
Where Qo is the surface charge at t = tm. Eqn (2.18) shows the exponential decay of the TL
intensity after the cleavage of the crystals. The time tm taken for cleaving the crystal of thickness
H is
(2.19)
From Eqn (2.19), the crack propagation velocity is
(2.20)
Based on Eqn (2.20), TL can be a tool for determining the velocity of crack propagation in
crystals. The peak TL intensity at t = tm can be obtained from Eqn (2.17) and (2.19) as
(2.21)
or (2.22)
Since A = 2WH is the area of the newly created surfaces. Eqn (2.22) implies that should
increase linearly with A and . The total intensity is given as
(2.23)
When , that is no gaseous discharge as is the case with ZnS:Mn, the emission will be
primarily bulk TL and . When , that is, no bulk TL, emission is primarily by

36
gaseous discharge, and . Based on Eqn (2.23), the total TL intensity should be directly
proportional to A, and crystals with higher values of should have higher . According to Eqns
(2.22) and (2.23), and should decrease with increase in temperature because , , and
decrease with temperature increase. A specific temperature may however be reached above
which may decrease to the point that the breakdown of gases and solids becomes impossible,
and TL no longer occurs [22].
2.4 Triboluminescent Sensor Systems
More recently, researchers have investigated the application of TL in damage detection [24,
111]. Triboluminescence-based sensor systems have the potential for wireless, in-situ , real time
and distributed (WIRD) sensing that can enable continuous monitoring of civil and aerospace
structures [21]. A TL-based sensor system comprising highly efficient triboluminescent materials
could allow simple, real time monitoring of both the magnitude and location of damage with
minimal parasitic influence to the host structure [114, 115]. They can be used as stress, fracture,
and damage sensors [23, 140]. They have also been proposed for visualizing the stress field near
the crack-tip, stress distribution in solids, and quasi-dynamic crack-propagation in solids [25, 26,
140-143]. In spite of all these research efforts, there is no information contained in the open
literature that suggests commercial use of TL as a damage sensing mechanism [115]. Olawale et
al [21] provides a detailed review of TL sensor systems.
2.4.1 Triboluminescent Materials for Sensing Applications
The principal requirements for any candidate triboluminescent material are that it should be
highly efficient (allowing detection using inexpensive, compact detectors) and that it should emit
light over a discrete and thus characteristic spectrum (allowing integration into an array of
sensors to monitor damage location) [113, 114]. Bourhill et al. [144] used the photoluminescence
(PL) quantum yield as a measure of the TL efficiency of different TL materials (Table 2.3) based
on the assumption that both phenomena originate from the same excited state for the compounds
studied. The ZnS–Mn has the highest triboluminescent efficiency among the TL materials
investigated. Metal complexes are among the most intense TL materials known [114]. Metal
complexes include europium tetrakis (dibenzoylmethide) triethylammonium [138][64], tris (1,3-
di-tert-butyl-B-propane dione) terbium-p-dimethylamino pyridine [144] and dibromobis

37
(triphenylphosphine oxide) manganese [26, 121]. Most metal complexes contain a trivalent
lanthanide as the emitting center [114].
Table 2.3: Solid-state photoluminescent quantum yields of a number of triboluminescent compounds [114, 144].
Compound Name Φ
1 Europium tetrakis (dibenzoylmethide) triethylammonium 0.75
2 Europium tris (2-thenoyltrifluoroacetone)-phenanthroline 0.85
3 Hexakis(antipyrine) terbium triiodide 0.53
4 Tris(1,3-di-tert-butyl- -propanedione) terbium-p-
dimethylaminopyridine
0.71
5 Tris(1,3-di-tert-butyl- -propanedione) samarium-p-
dimethylaminopyridine
0.04
6 Tris(1,3-di-tert-butyl- -propanedione) dysprosium-p-
dimethylaminopyridine
0.07
7 Terbium trichloride hexahydrate 0.33
8 Mn:ZnS 1.00
9 Dibromobis(triphenylphosphine oxide) manganese 0.19
10 Europium (2+) hexacelsian >0.57
11 Samarium (2+ and 3+) hexacelsian 0.62
12 Cerium (3+) hexacelsian 0.44
13 Cholesteryl salicylate 0.13
14 N-Acetylanthranilic acid >0.28
15 Salicylsalicyclic acid 0.17
16 Menthyl-9-anthracenecarboxylate >0.43
In the study by Xu et al. [26], a comparison of the TL performance of different inorganic
materials under identical mechanical stress conditions produced similar results for thin film and
bulk materials (Table 2.4). Among the materials tested, the ZnS-based materials showed much
higher TL intensities while the ZnS doped with Mn exhibited the highest luminous intensity of
all the materials tested (Figure 2.17a). Furthermore, the study showed that a manganese doping

38
level of about 5% gives the highest TL response (Figure 2.17b). Based on the prevailing
discussion, ZnS:Mn is a strong candidate for TL-based sensor systems.
Table 2.4: Triboluminescence of various materials [26].
Group Sample TL intensity (cps)a
Hexagonal ZnS 60
ZnS–Mn0.05 2800
ZnS–Cu0.01 1100
Zn2SiO4:Mn0.01 57
ZnO 3
SiC 4
X2O3 (X = Al or Y) α-Al2O3 10
α -Al2O3:Mn0.01 60
Y2O3 9
Y2O3:Eu 20
MgAl2O4 31
CaAl2O4 14
SrAl2O4 36
Fluorite ZrO2 8
HfO2 3
CeO2 3
Perovskite YBa2Cu4O8 1
PbZr0.52 Ti0.48 O3 3
Pb0.93La0.07Zr0.60Ti0.40O3 3
aTL intensity was measured as a function of friction applied to the material by a brass rod of 1 mm diameter under a load of 5 N and slide speed of 6.3 cm/s (2.5 rps).
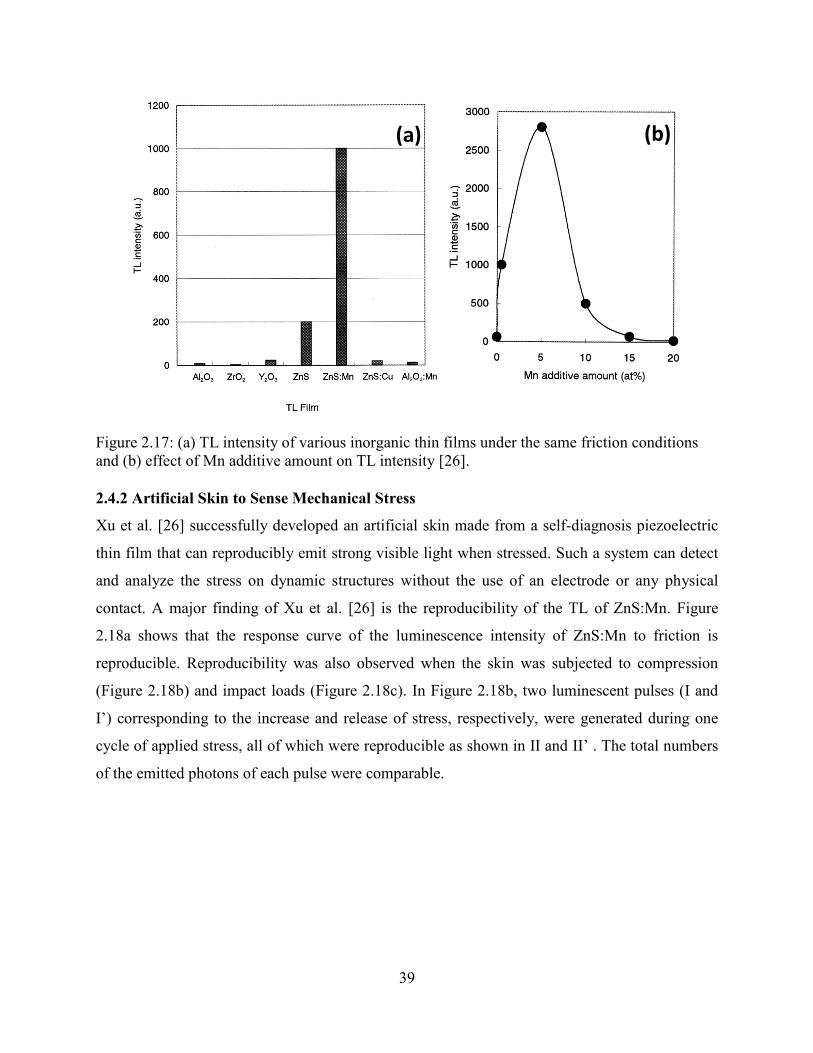
39
Figure 2.17: (a) TL intensity of various inorganic thin films under the same friction conditions and (b) effect of Mn additive amount on TL intensity [26].
2.4.2 Artificial Skin to Sense Mechanical Stress
Xu et al. [26] successfully developed an artificial skin made from a self-diagnosis piezoelectric
thin film that can reproducibly emit strong visible light when stressed. Such a system can detect
and analyze the stress on dynamic structures without the use of an electrode or any physical
contact. A major finding of Xu et al. [26] is the reproducibility of the TL of ZnS:Mn. Figure
2.18a shows that the response curve of the luminescence intensity of ZnS:Mn to friction is
reproducible. Reproducibility was also observed when the skin was subjected to compression
(Figure 2.18b) and impact loads (Figure 2.18c). In Figure 2.18b, two luminescent pulses (I and
I’) corresponding to the increase and release of stress, respectively, were generated during one
cycle of applied stress, all of which were reproducible as shown in II and II’ . The total numbers
of the emitted photons of each pulse were comparable.
(a) (b)

40
Figure 2.18: (a) Luminescence intensity response of the ZnS:Mn film to the friction, (b) response to compression stress of 500 N, applied at a cross head speed of 0.1 mm/min, and (c) response to impact stress applied by a free-falling steel ball [145].
These results differ substantially from those of other reported piezoluminescent materials like
gamma-colored alkali halide crystals and rubber in which the emitted photons normally
decreased greatly during repeated cycles of stress [145]. Figure 2.18 (c) shows the single optical
pulse obtained in response to mechanical impact. The energy conversion efficiency for
converting mechanical energy to photon energy was found to be of the order of 10-2 and 10-6 for
compression and impact cases, respectively, values similar to those reported for piezoelectrics
[145]. The luminescent intensity also increased with increasing mechanical stress (Figure 2.19
(a) and (b)). The TL intensity from the thin film was more than one magnitude higher than that
obtained from the bulk material synthesized in the same way. The significant improvement is
attributed to the high orientation and crystallization of the film and the nano sized grains. The TL
of ZnS:Mn is from the Mn emitting center due to the transition of 4T1 to 6A1 [146].
Figure 2.19: (a) Dependence of the luminescence intensity on load in the case of friction and (b) dependence of the luminescence intensity on the falling height of a steel ball on impact [145].
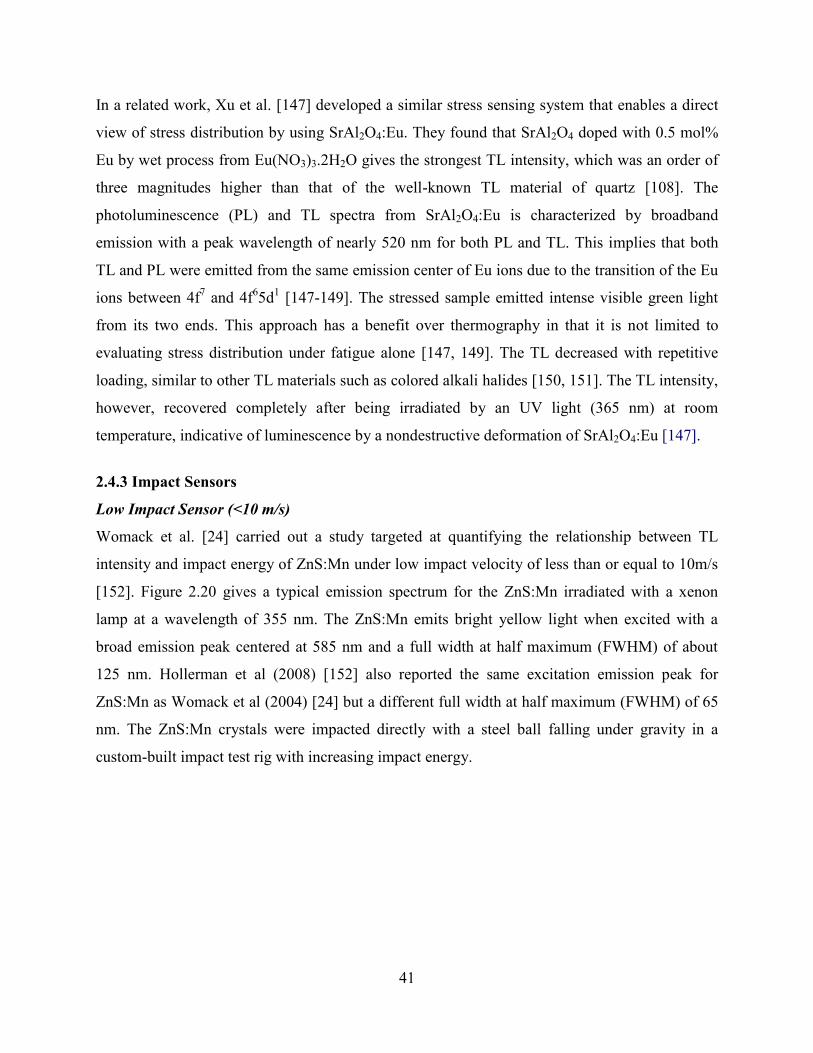
41
In a related work, Xu et al. [147] developed a similar stress sensing system that enables a direct
view of stress distribution by using SrAl2O4:Eu. They found that SrAl2O4 doped with 0.5 mol%
Eu by wet process from Eu(NO3)3.2H2O gives the strongest TL intensity, which was an order of
three magnitudes higher than that of the well-known TL material of quartz [108]. The
photoluminescence (PL) and TL spectra from SrAl2O4:Eu is characterized by broadband
emission with a peak wavelength of nearly 520 nm for both PL and TL. This implies that both
TL and PL were emitted from the same emission center of Eu ions due to the transition of the Eu
ions between 4f7 and 4f65d1 [147-149]. The stressed sample emitted intense visible green light
from its two ends. This approach has a benefit over thermography in that it is not limited to
evaluating stress distribution under fatigue alone [147, 149]. The TL decreased with repetitive
loading, similar to other TL materials such as colored alkali halides [150, 151]. The TL intensity,
however, recovered completely after being irradiated by an UV light (365 nm) at room
temperature, indicative of luminescence by a nondestructive deformation of SrAl2O4:Eu [147].
2.4.3 Impact Sensors
Low Impact Sensor (<10 m/s)
Womack et al. [24] carried out a study targeted at quantifying the relationship between TL
intensity and impact energy of ZnS:Mn under low impact velocity of less than or equal to 10m/s
[152]. Figure 2.20 gives a typical emission spectrum for the ZnS:Mn irradiated with a xenon
lamp at a wavelength of 355 nm. The ZnS:Mn emits bright yellow light when excited with a
broad emission peak centered at 585 nm and a full width at half maximum (FWHM) of about
125 nm. Hollerman et al (2008) [152] also reported the same excitation emission peak for
ZnS:Mn as Womack et al (2004) [24] but a different full width at half maximum (FWHM) of 65
nm. The ZnS:Mn crystals were impacted directly with a steel ball falling under gravity in a
custom-built impact test rig with increasing impact energy.

42
Figure 2.20: ZnS:Mn emission spectrum [24].
This study indicates that only a few crystals of ZnS:Mn is required to achieve a significant light
output during impact, and that the TL decay follow the standard exponential decay curve of
luminescence under phosphor thermometry. Figure 2.21 shows the variation in TL emission from
the ZnS:Mn crystals as indicated by the output voltage from the photomultiplier tube (PMT) as a
function of the drop height. Two regions of interests can be observed. In the first region,
threshold energy of approximately 1.6 x 10⁻² J was observed to be the minimum energy required
by the projectile to fracture the TL crystals and emit light. The intensity then increased rapidly
with increased projectile kinetic energy up to about 0.26 J.
The second stage starts at 0.26 J with a shallow slope indicating that the sample has become less
sensitive to impact energy. At this stage, it was proposed that the projectile was already cracking
as many crystals as it could in the impact area so the increased energy levels could not generate
higher TL responses. Impact velocities greater than 0.5 m/s were found to produce measurable
TL light [24]. Earlier work done in applying triboluminescence as low impact sensor can be
found in Ref. [140].
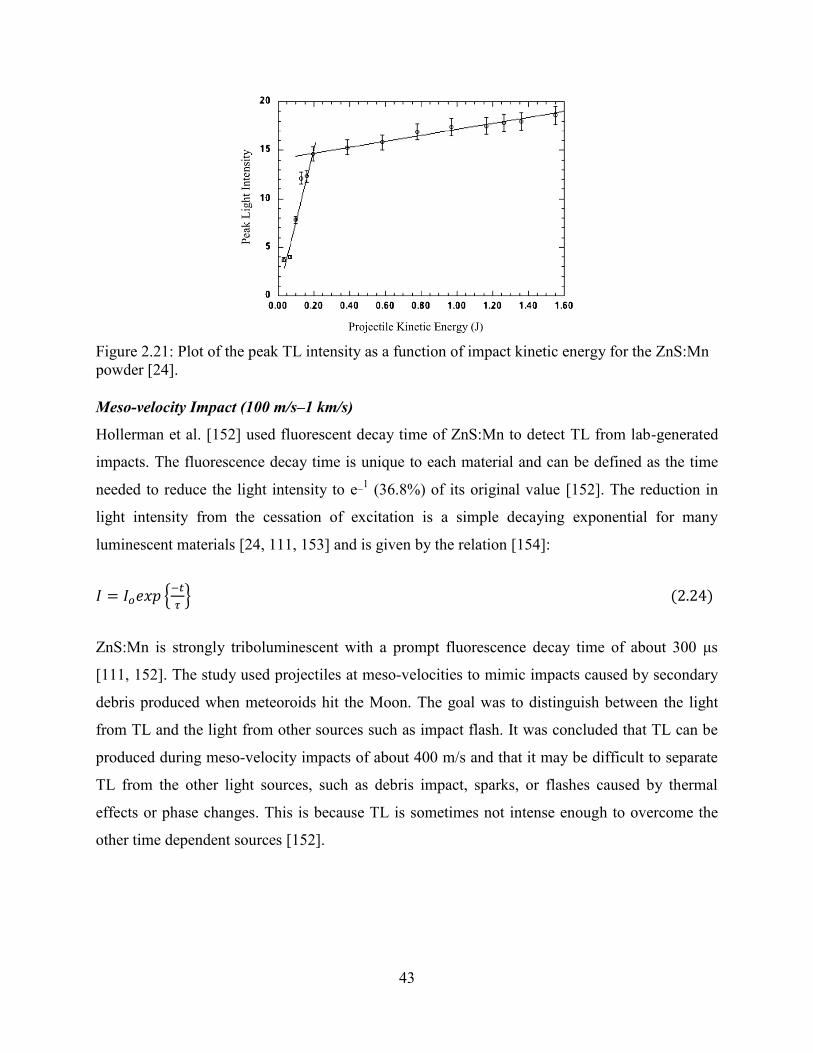
43
Figure 2.21: Plot of the peak TL intensity as a function of impact kinetic energy for the ZnS:Mn powder [24].
Meso-velocity Impact (100 m/s–1 km/s)
Hollerman et al. [152] used fluorescent decay time of ZnS:Mn to detect TL from lab-generated
impacts. The fluorescence decay time is unique to each material and can be defined as the time
needed to reduce the light intensity to e_1 (36.8%) of its original value [152]. The reduction in
light intensity from the cessation of excitation is a simple decaying exponential for many
luminescent materials [24, 111, 153] and is given by the relation [154]:
(2.24)
ZnSμMn is strongly triboluminescent with a prompt fluorescence decay time of about γ00 s
[111, 152]. The study used projectiles at meso-velocities to mimic impacts caused by secondary
debris produced when meteoroids hit the Moon. The goal was to distinguish between the light
from TL and the light from other sources such as impact flash. It was concluded that TL can be
produced during meso-velocity impacts of about 400 m/s and that it may be difficult to separate
TL from the other light sources, such as debris impact, sparks, or flashes caused by thermal
effects or phase changes. This is because TL is sometimes not intense enough to overcome the
other time dependent sources [152].
44
Hypervelocity Impact (41 km/s)
The application of TL sensors to detect hypervelocity impacts was fueled by the loss of the
Columbia orbiter [111]. The research started in August 2003 at the NASA Marshall Space Flight
Center (MSFC) in Huntsville, Alabama. The study involved shooting 1 mm aluminum spheres at
hyper velocity (5–6 km/s) on to aluminum plate targets coated with ZnS:Mn and binder paint.
Poly (phenyl methyl) siloxane (PPMS) gave the toughest and most wear resistant paint and was
sufficiently resistant to hypervelocity impacts [24]. A combination of ZnS:Mn and PPMS 1:4
ratio by weight was consequently used. The test result (Figure 2.22) shows that there is a rapid
but late increase in TL signal from the ZnS:Mn when impacted as against the gradual and earlier
increase in the light from the flash of the gun as measured by the unshielded detector [111]. This
indicates that hyper velocity impact can be detected by a TL sensor system [111].
Figure 2.22: Light intensity comparison from unshielded and shielded detectors as a result of a hypervelocity impact on a ZnS:Mn coated plate [111].

45
2.4.4 TL Signal Detection and Transmission in Composites
The utilization of TL materials as sensors in composite materials necessitates the ability for
transmitting the emitted signals. Most of the works in open literature involve end and/or side
coupling of light through optical fibers to transmit emitted light from damage zones in
composites [25, 114]. This is, however, inefficient, resulting in a very poor signal to noise ratio
[25]. Furthermore, the integrity of the sensor system is compromised when the optical fiber is
fractured. To overcome these limitations, Sage et al. [25] used a combination of polymeric
optical fiber having its core doped with a highly photoluminescent material and triboluminescent
damage sensors. When fracture occurs, the TL signal from the embedded TL sensor is efficiently
absorbed by the photoluminescent material and re-emitted as light, which can match the
waveguide modes of the polymeric fiber. This was achieved by using materials with significant
spectral overlap between the TL emission and the absorption profile of the photoluminescent
material (Figure 2.23).
Figure 2.23: The spectral overlap of the terbium triboluminescence with the absorption spectrum of the rhodamine 6G fibre core. The photoluminescent emission spectrum from the rhodamine 6G fibre core is shown for completion [25].
Hollow silica capillaries with an inside diameter of 100 mm and an outside diameter of 170 mm
were vacuum-filled with a benzyl alcohol solution of the highly efficient photoluminescent
material, rhodamine 6G [155]. The refractive index of the benzyl alcohol core (n = 1.539 at 633
nm) was larger than that of silica, consistent with wave guiding [25]. In addition, the TL
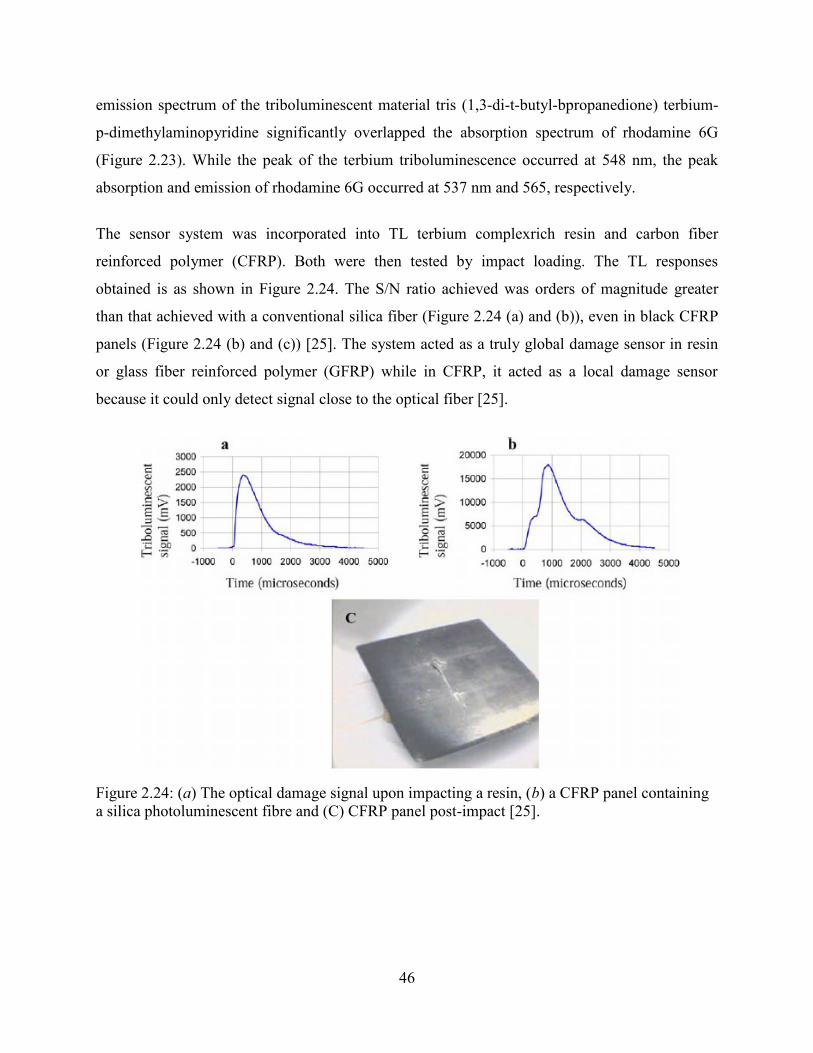
46
emission spectrum of the triboluminescent material tris (1,3-di-t-butyl-bpropanedione) terbium-
p-dimethylaminopyridine significantly overlapped the absorption spectrum of rhodamine 6G
(Figure 2.23). While the peak of the terbium triboluminescence occurred at 548 nm, the peak
absorption and emission of rhodamine 6G occurred at 537 nm and 565, respectively.
The sensor system was incorporated into TL terbium complexrich resin and carbon fiber
reinforced polymer (CFRP). Both were then tested by impact loading. The TL responses
obtained is as shown in Figure 2.24. The S/N ratio achieved was orders of magnitude greater
than that achieved with a conventional silica fiber (Figure 2.24 (a) and (b)), even in black CFRP
panels (Figure 2.24 (b) and (c)) [25]. The system acted as a truly global damage sensor in resin
or glass fiber reinforced polymer (GFRP) while in CFRP, it acted as a local damage sensor
because it could only detect signal close to the optical fiber [25].
Figure 2.24: (a) The optical damage signal upon impacting a resin, (b) a CFRP panel containing a silica photoluminescent fibre and (C) CFRP panel post-impact [25].

47
2.5 Summary
Virtually all the work done on the application of TL for damage sensing are based on impact
damage. The review done on damages in concrete structures clearly indicates that damage in
such structures are not limited to impact damage. There is therefore a need to investigate the
suitability of TL for damage sensing under flexural and fatigue loading before it can be
considered suitable for CSHM. Another important observation is that most work done on TL
damage sensing have focused on polymer matrices as the host structure. Concrete structures
however, have very different microstructure and properties from polymer systems. Hence, it is
imperative to investigate the TL performance of ZnS:Mn in a concrete system.
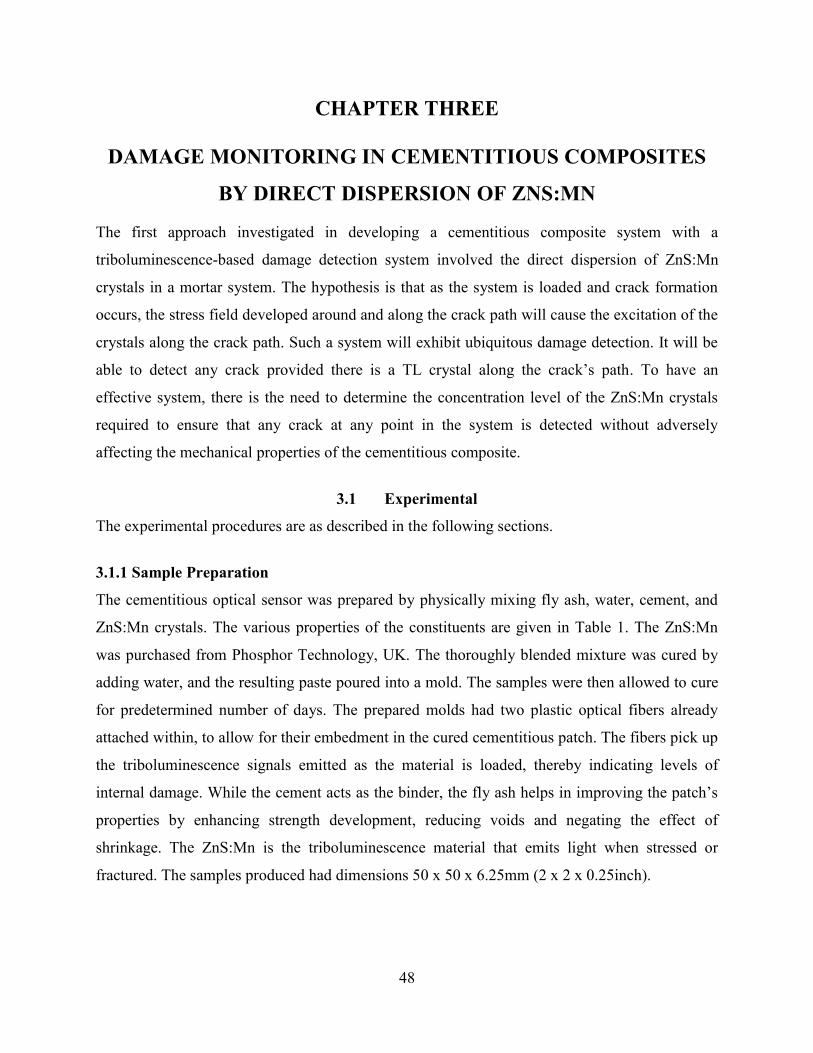
48
CHAPTER THREE
DAMAGE MONITORING IN CEMENTITIOUS COMPOSITES
BY DIRECT DISPERSION OF ZNS:MN
The first approach investigated in developing a cementitious composite system with a
triboluminescence-based damage detection system involved the direct dispersion of ZnS:Mn
crystals in a mortar system. The hypothesis is that as the system is loaded and crack formation
occurs, the stress field developed around and along the crack path will cause the excitation of the
crystals along the crack path. Such a system will exhibit ubiquitous damage detection. It will be
able to detect any crack provided there is a TL crystal along the crack’s path. To have an
effective system, there is the need to determine the concentration level of the ZnS:Mn crystals
required to ensure that any crack at any point in the system is detected without adversely
affecting the mechanical properties of the cementitious composite.
3.1 Experimental
The experimental procedures are as described in the following sections.
3.1.1 Sample Preparation
The cementitious optical sensor was prepared by physically mixing fly ash, water, cement, and
ZnS:Mn crystals. The various properties of the constituents are given in Table 1. The ZnS:Mn
was purchased from Phosphor Technology, UK. The thoroughly blended mixture was cured by
adding water, and the resulting paste poured into a mold. The samples were then allowed to cure
for predetermined number of days. The prepared molds had two plastic optical fibers already
attached within, to allow for their embedment in the cured cementitious patch. The fibers pick up
the triboluminescence signals emitted as the material is loaded, thereby indicating levels of
internal damage. While the cement acts as the binder, the fly ash helps in improving the patch’s
properties by enhancing strength development, reducing voids and negating the effect of
shrinkage. The ZnS:Mn is the triboluminescence material that emits light when stressed or
fractured. The samples produced had dimensions 50 x 50 x 6.25mm (2 x 2 x 0.25inch).
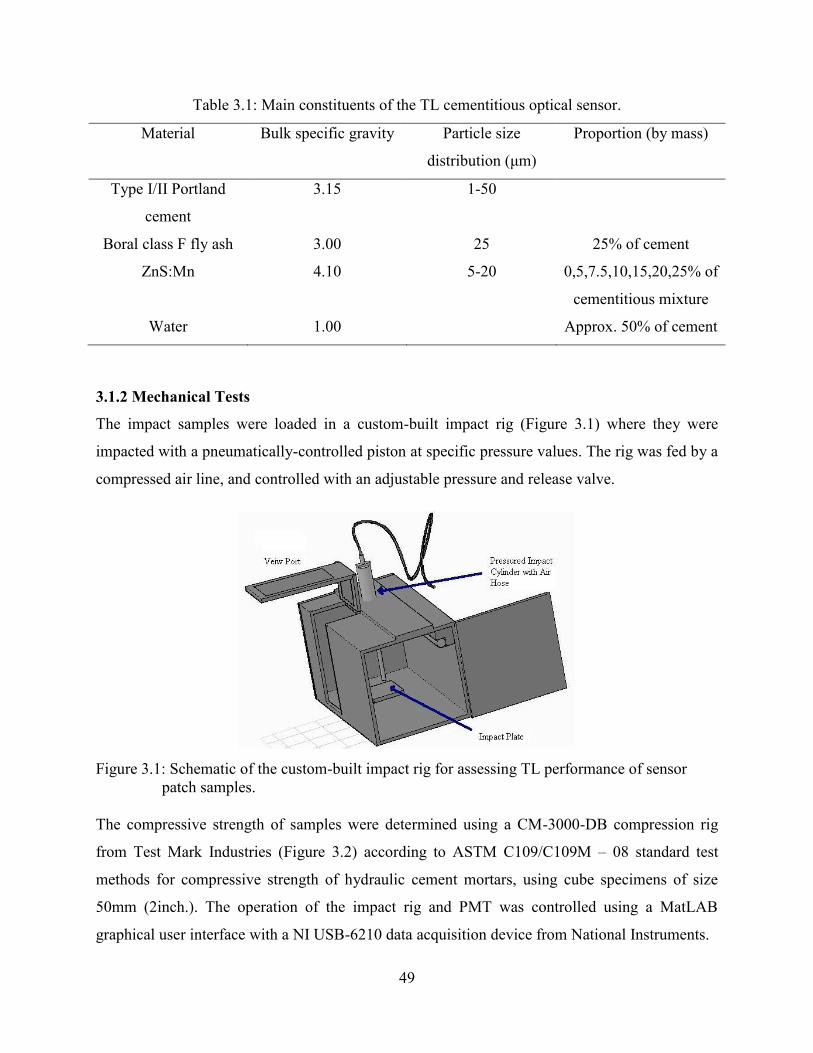
49
Table 3.1: Main constituents of the TL cementitious optical sensor.
Material Bulk specific gravity Particle size
distribution ( m)
Proportion (by mass)
Type I/II Portland
cement
3.15 1-50
Boral class F fly ash 3.00 25 25% of cement
ZnS:Mn 4.10 5-20 0,5,7.5,10,15,20,25% of
cementitious mixture
Water 1.00 Approx. 50% of cement
3.1.2 Mechanical Tests
The impact samples were loaded in a custom-built impact rig (Figure 3.1) where they were
impacted with a pneumatically-controlled piston at specific pressure values. The rig was fed by a
compressed air line, and controlled with an adjustable pressure and release valve.
Figure 3.1: Schematic of the custom-built impact rig for assessing TL performance of sensor patch samples.
The compressive strength of samples were determined using a CM-3000-DB compression rig
from Test Mark Industries (Figure 3.2) according to ASTM C109/C109M – 08 standard test
methods for compressive strength of hydraulic cement mortars, using cube specimens of size
50mm (2inch.). The operation of the impact rig and PMT was controlled using a MatLAB
graphical user interface with a NI USB-6210 data acquisition device from National Instruments.
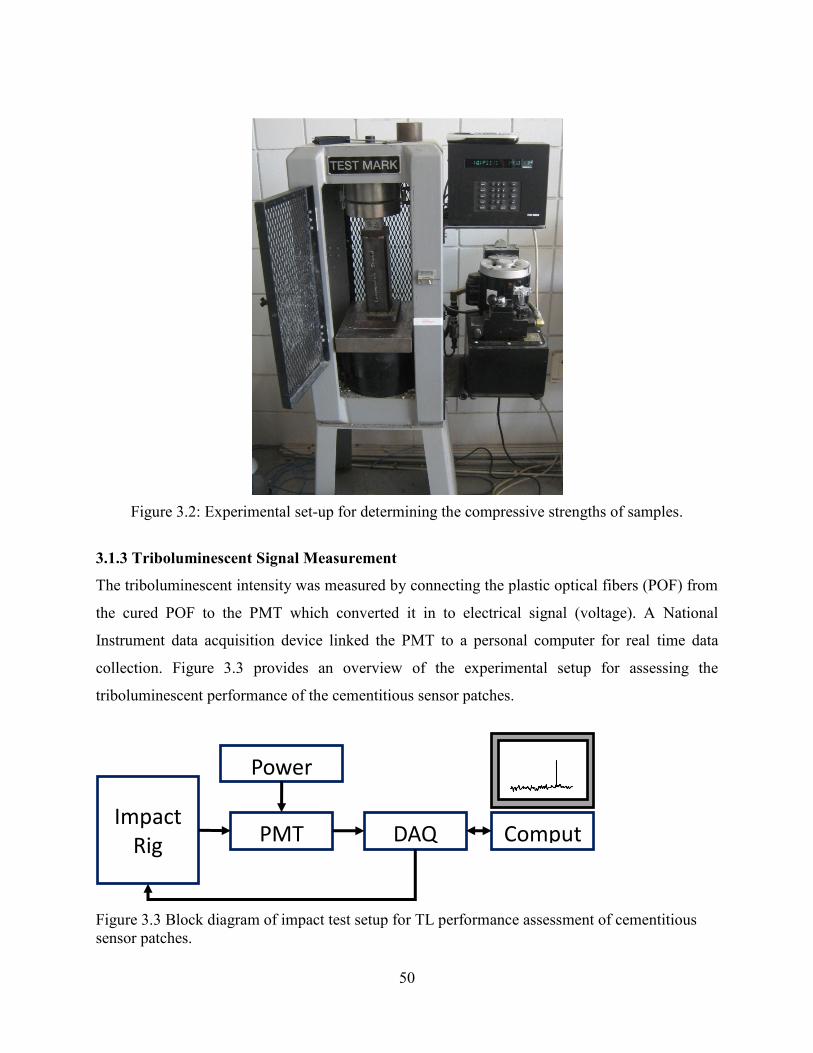
50
Figure 3.2: Experimental set-up for determining the compressive strengths of samples.
3.1.3 Triboluminescent Signal Measurement
The triboluminescent intensity was measured by connecting the plastic optical fibers (POF) from
the cured POF to the PMT which converted it in to electrical signal (voltage). A National
Instrument data acquisition device linked the PMT to a personal computer for real time data
collection. Figure 3.3 provides an overview of the experimental setup for assessing the
triboluminescent performance of the cementitious sensor patches.
Figure 3.3 Block diagram of impact test setup for TL performance assessment of cementitious sensor patches.
Impact
Rig PMT
Power
DAQ Comput
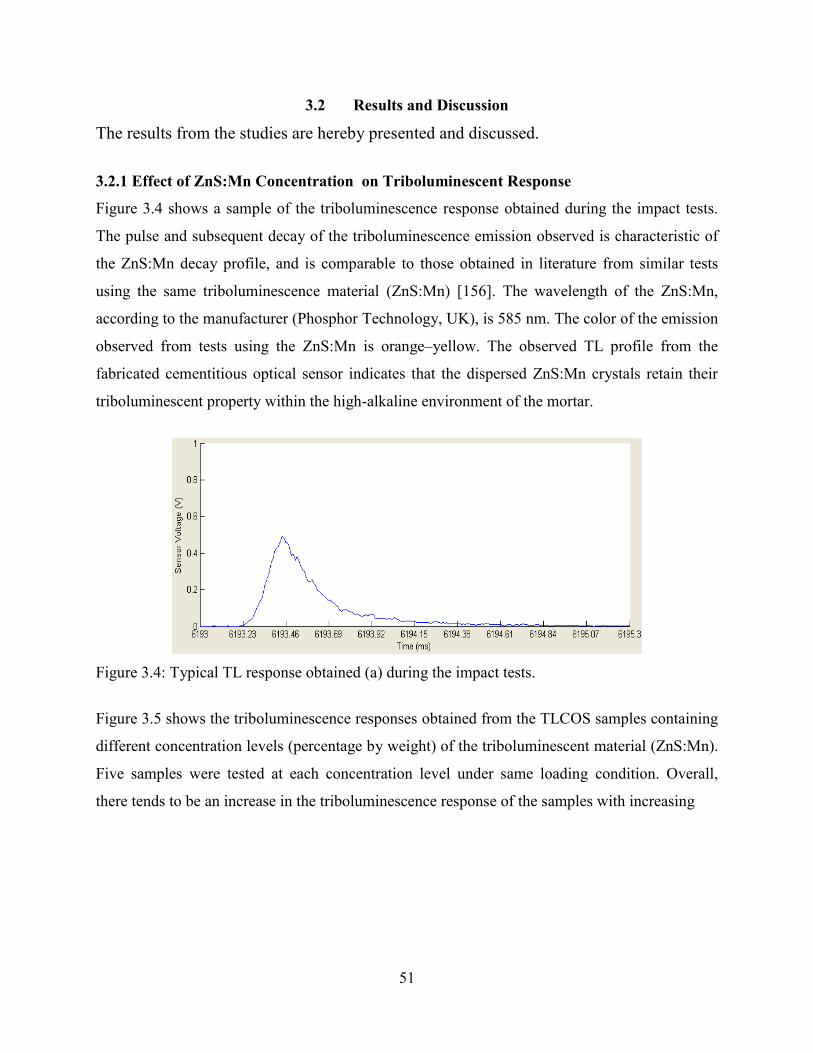
51
3.2 Results and Discussion
The results from the studies are hereby presented and discussed.
3.2.1 Effect of ZnS:Mn Concentration on Triboluminescent Response
Figure 3.4 shows a sample of the triboluminescence response obtained during the impact tests.
The pulse and subsequent decay of the triboluminescence emission observed is characteristic of
the ZnS:Mn decay profile, and is comparable to those obtained in literature from similar tests
using the same triboluminescence material (ZnS:Mn) [156]. The wavelength of the ZnS:Mn,
according to the manufacturer (Phosphor Technology, UK), is 585 nm. The color of the emission
observed from tests using the ZnS:Mn is orange–yellow. The observed TL profile from the
fabricated cementitious optical sensor indicates that the dispersed ZnS:Mn crystals retain their
triboluminescent property within the high-alkaline environment of the mortar.
Figure 3.4: Typical TL response obtained (a) during the impact tests.
Figure 3.5 shows the triboluminescence responses obtained from the TLCOS samples containing
different concentration levels (percentage by weight) of the triboluminescent material (ZnS:Mn).
Five samples were tested at each concentration level under same loading condition. Overall,
there tends to be an increase in the triboluminescence response of the samples with increasing

52
25.020.015.010.07.55.02.50.0
0.6
0.5
0.4
0.3
0.2
0.1
0.0
ZnS:Mn concentration (% weight)
TL r
esponse (
V)
Figure 3.5: Effect of ZnS:Mn concentration level on TL output of composite.
ZnS:Mn concentration levels. Triboluminescence signals were obtained at concentration levels
as low as 2.5 and 5%. However, not all the samples tested at these low concentration levels
yielded a triboluminescence response on impact. Triboluminescence responses were obtained for
all five samples tested at concentration levels of 7.5% and higher. The absence of
triboluminescent response from some of the samples with low concentration levels was due to
insufficient ZnS:Mn particles in the patch. As a result, the crack path may miss the scantily
dispersed ZnS:Mn crystals. Consequently, a ZnS:Mn percolation level of 7.5% is required for an
effective TLCOS.
A significant jump in the mean triboluminescent response was noted between 5% and 7.5%
concentration levels. The mean triboluminescence signal quadrupled from about 0.04V at 5%
concentration level to about 0.16V at 7.5% concentration level. This level of triboluminescent
response was maintained with slight variations up to the 20% concentration level. At
concentration levels of 7.5% weight and above, there are more ZnS:Mn crystals dispersed within
the composite system that are being activated by the impact energy during testing. These higher
levels of ZnS:Mn concentration also make it possible for sufficient number of crystals to be
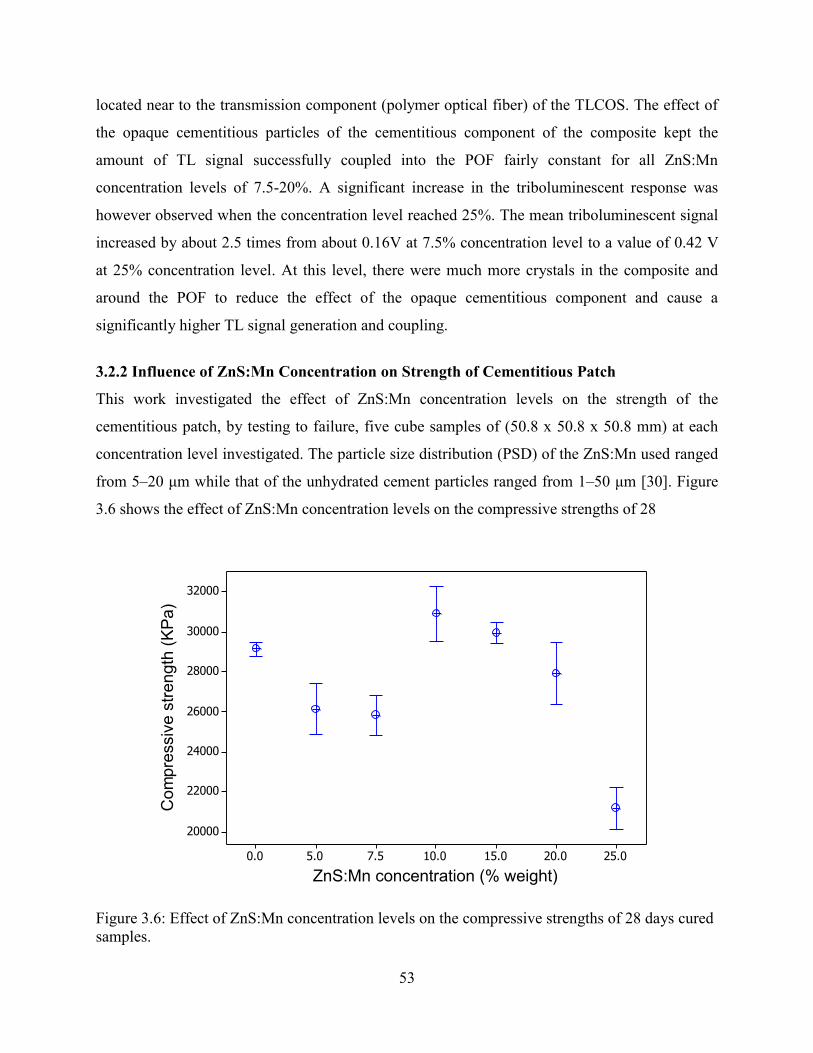
53
located near to the transmission component (polymer optical fiber) of the TLCOS. The effect of
the opaque cementitious particles of the cementitious component of the composite kept the
amount of TL signal successfully coupled into the POF fairly constant for all ZnS:Mn
concentration levels of 7.5-20%. A significant increase in the triboluminescent response was
however observed when the concentration level reached 25%. The mean triboluminescent signal
increased by about 2.5 times from about 0.16V at 7.5% concentration level to a value of 0.42 V
at 25% concentration level. At this level, there were much more crystals in the composite and
around the POF to reduce the effect of the opaque cementitious component and cause a
significantly higher TL signal generation and coupling.
3.2.2 Influence of ZnS:Mn Concentration on Strength of Cementitious Patch
This work investigated the effect of ZnS:Mn concentration levels on the strength of the
cementitious patch, by testing to failure, five cube samples of (50.8 x 50.8 x 50.8 mm) at each
concentration level investigated. The particle size distribution (PSD) of the ZnS:Mn used ranged
from 5–20 m while that of the unhydrated cement particles ranged from 1–50 m [30]. Figure
3.6 shows the effect of ZnS:Mn concentration levels on the compressive strengths of 28
25.020.015.010.07.55.00.0
32000
30000
28000
26000
24000
22000
20000
ZnS:Mn concentration (% weight)
Com
pre
ssiv
e s
trength
(K
Pa)
Figure 3.6: Effect of ZnS:Mn concentration levels on the compressive strengths of 28 days cured samples.
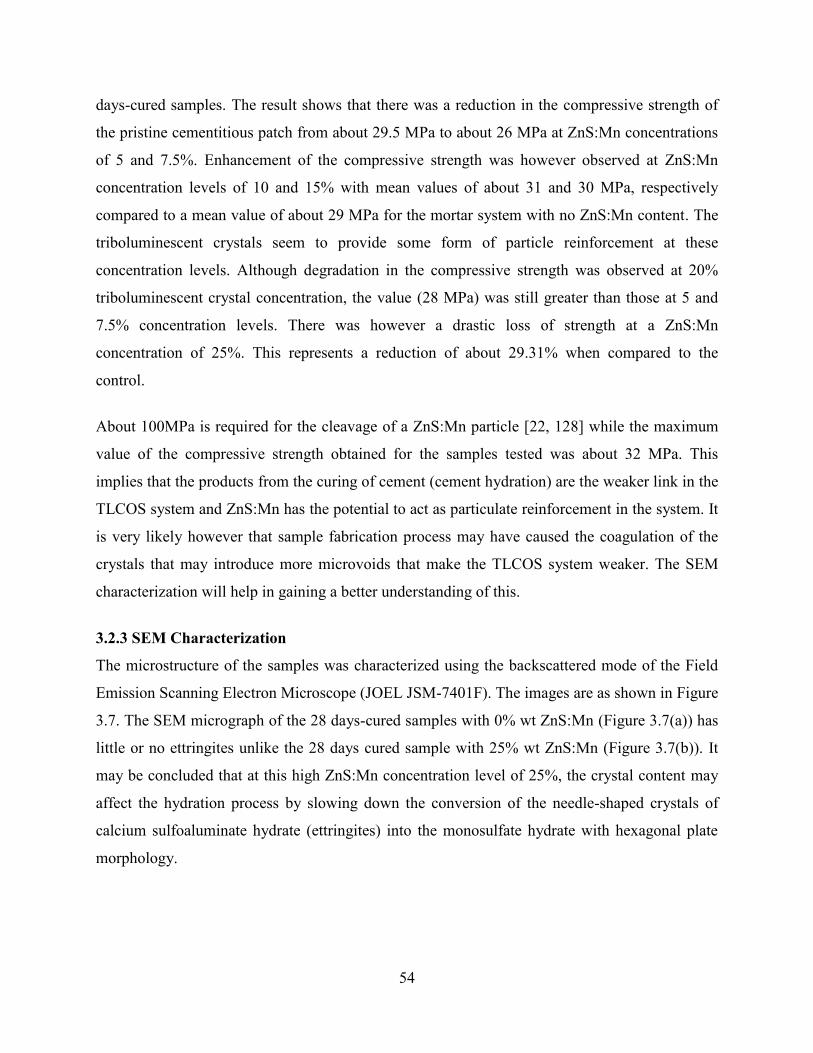
54
days-cured samples. The result shows that there was a reduction in the compressive strength of
the pristine cementitious patch from about 29.5 MPa to about 26 MPa at ZnS:Mn concentrations
of 5 and 7.5%. Enhancement of the compressive strength was however observed at ZnS:Mn
concentration levels of 10 and 15% with mean values of about 31 and 30 MPa, respectively
compared to a mean value of about 29 MPa for the mortar system with no ZnS:Mn content. The
triboluminescent crystals seem to provide some form of particle reinforcement at these
concentration levels. Although degradation in the compressive strength was observed at 20%
triboluminescent crystal concentration, the value (28 MPa) was still greater than those at 5 and
7.5% concentration levels. There was however a drastic loss of strength at a ZnS:Mn
concentration of 25%. This represents a reduction of about 29.31% when compared to the
control.
About 100MPa is required for the cleavage of a ZnS:Mn particle [22, 128] while the maximum
value of the compressive strength obtained for the samples tested was about 32 MPa. This
implies that the products from the curing of cement (cement hydration) are the weaker link in the
TLCOS system and ZnS:Mn has the potential to act as particulate reinforcement in the system. It
is very likely however that sample fabrication process may have caused the coagulation of the
crystals that may introduce more microvoids that make the TLCOS system weaker. The SEM
characterization will help in gaining a better understanding of this.
3.2.3 SEM Characterization
The microstructure of the samples was characterized using the backscattered mode of the Field
Emission Scanning Electron Microscope (JOEL JSM-7401F). The images are as shown in Figure
3.7. The SEM micrograph of the 28 days-cured samples with 0% wt ZnS:Mn (Figure 3.7(a)) has
little or no ettringites unlike the 28 days cured sample with 25% wt ZnS:Mn (Figure 3.7(b)). It
may be concluded that at this high ZnS:Mn concentration level of 25%, the crystal content may
affect the hydration process by slowing down the conversion of the needle-shaped crystals of
calcium sulfoaluminate hydrate (ettringites) into the monosulfate hydrate with hexagonal plate
morphology.
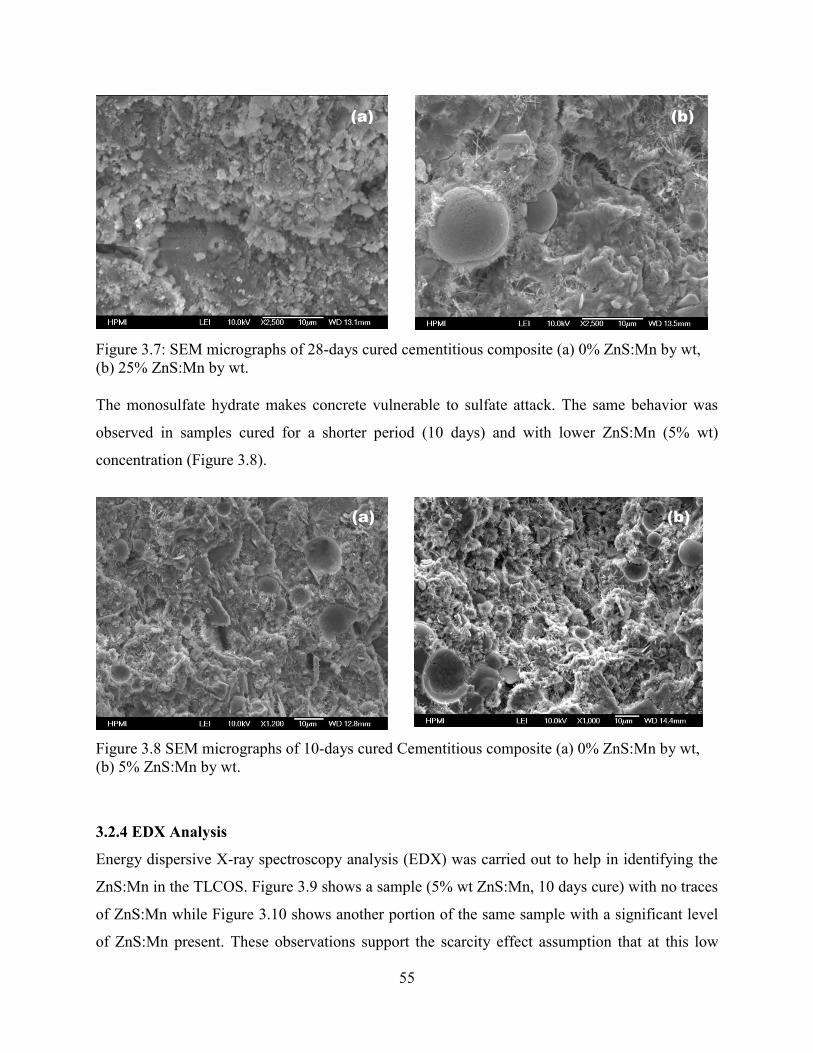
55
Figure 3.7: SEM micrographs of 28-days cured cementitious composite (a) 0% ZnS:Mn by wt, (b) 25% ZnS:Mn by wt.
The monosulfate hydrate makes concrete vulnerable to sulfate attack. The same behavior was
observed in samples cured for a shorter period (10 days) and with lower ZnS:Mn (5% wt)
concentration (Figure 3.8).
Figure 3.8 SEM micrographs of 10-days cured Cementitious composite (a) 0% ZnS:Mn by wt, (b) 5% ZnS:Mn by wt.
3.2.4 EDX Analysis
Energy dispersive X-ray spectroscopy analysis (EDX) was carried out to help in identifying the
ZnS:Mn in the TLCOS. Figure 3.9 shows a sample (5% wt ZnS:Mn, 10 days cure) with no traces
of ZnS:Mn while Figure 3.10 shows another portion of the same sample with a significant level
of ZnS:Mn present. These observations support the scarcity effect assumption that at this low
(a) (b)
(b) (a)
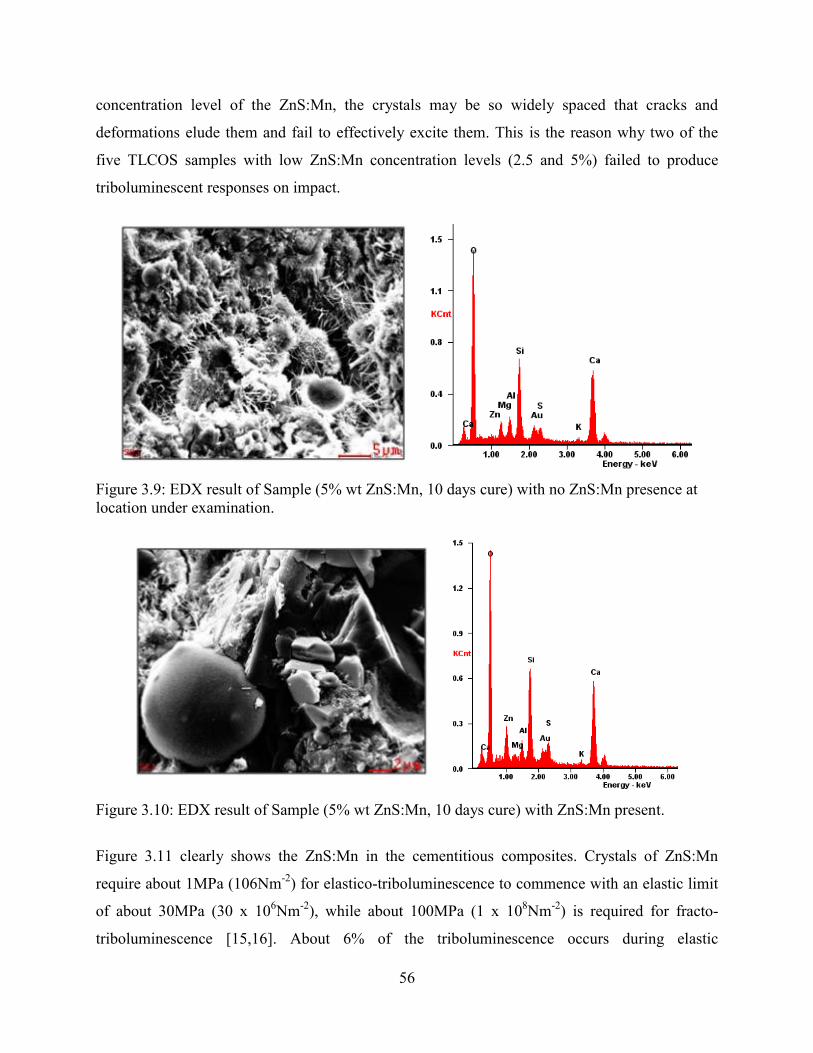
56
concentration level of the ZnS:Mn, the crystals may be so widely spaced that cracks and
deformations elude them and fail to effectively excite them. This is the reason why two of the
five TLCOS samples with low ZnS:Mn concentration levels (2.5 and 5%) failed to produce
triboluminescent responses on impact.
Figure 3.9: EDX result of Sample (5% wt ZnS:Mn, 10 days cure) with no ZnS:Mn presence at location under examination.
Figure 3.10: EDX result of Sample (5% wt ZnS:Mn, 10 days cure) with ZnS:Mn present.
Figure 3.11 clearly shows the ZnS:Mn in the cementitious composites. Crystals of ZnS:Mn
require about 1MPa (106Nm-2) for elastico-triboluminescence to commence with an elastic limit
of about 30MPa (30 x 106Nm-2), while about 100MPa (1 x 10⁸Nm-2) is required for fracto-
triboluminescence [15,16]. About 6% of the triboluminescence occurs during elastic
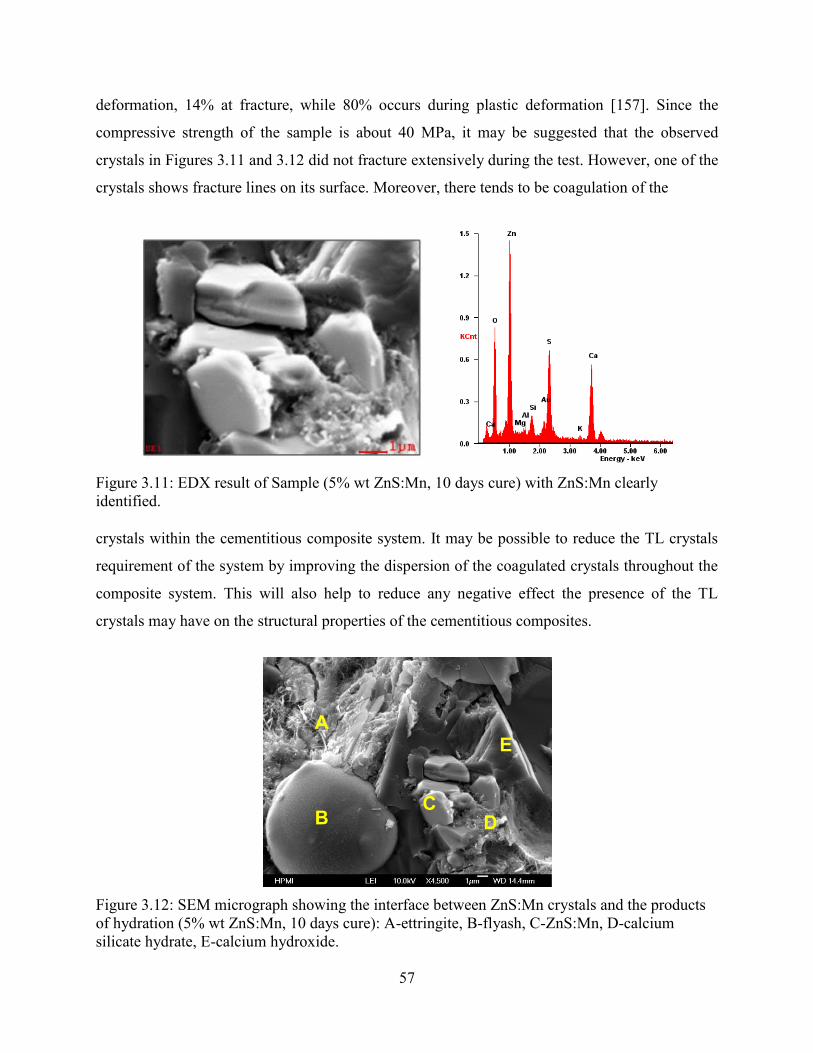
57
deformation, 14% at fracture, while 80% occurs during plastic deformation [157]. Since the
compressive strength of the sample is about 40 MPa, it may be suggested that the observed
crystals in Figures 3.11 and 3.12 did not fracture extensively during the test. However, one of the
crystals shows fracture lines on its surface. Moreover, there tends to be coagulation of the
Figure 3.11: EDX result of Sample (5% wt ZnS:Mn, 10 days cure) with ZnS:Mn clearly identified.
crystals within the cementitious composite system. It may be possible to reduce the TL crystals
requirement of the system by improving the dispersion of the coagulated crystals throughout the
composite system. This will also help to reduce any negative effect the presence of the TL
crystals may have on the structural properties of the cementitious composites.
Figure 3.12: SEM micrograph showing the interface between ZnS:Mn crystals and the products of hydration (5% wt ZnS:Mn, 10 days cure): A-ettringite, B-flyash, C-ZnS:Mn, D-calcium silicate hydrate, E-calcium hydroxide.
A
CB
E
D
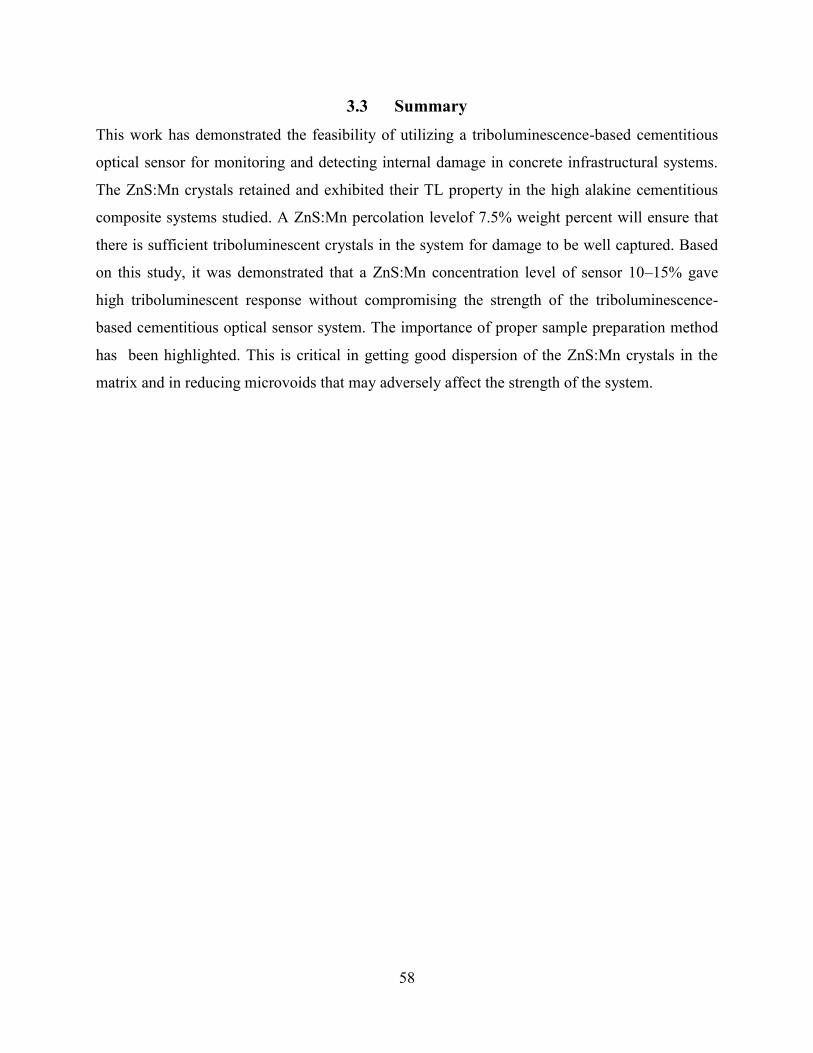
58
3.3 Summary
This work has demonstrated the feasibility of utilizing a triboluminescence-based cementitious
optical sensor for monitoring and detecting internal damage in concrete infrastructural systems.
The ZnS:Mn crystals retained and exhibited their TL property in the high alakine cementitious
composite systems studied. A ZnS:Mn percolation levelof 7.5% weight percent will ensure that
there is sufficient triboluminescent crystals in the system for damage to be well captured. Based
on this study, it was demonstrated that a ZnS:Mn concentration level of sensor 10–15% gave
high triboluminescent response without compromising the strength of the triboluminescence-
based cementitious optical sensor system. The importance of proper sample preparation method
has been highlighted. This is critical in getting good dispersion of the ZnS:Mn crystals in the
matrix and in reducing microvoids that may adversely affect the strength of the system.

59
CHAPTER FOUR
BIO-INSPIRED IN-SITU TRIBOLUMINESCENT OPTICAL
FIBER SENSOR
A major challenge militating against triboluminescence-based sensing systems has to do with the
effective capture and transmission of the optical signal generated within opaque composites like
concrete and carbon fiber reinforced polymer. The common approach is to incorporate the
crystals into the resin and infuse into the fiber layup in which optical fiber has been placed. The
whole part is then cured. There are however many limitations with this approach.
Firstly, the concentration level (weight fraction) of the triboluminescent (TL) crystals in the host
matrix required for good TL response is usually high. This introduces parasitic weight effect
which is highly undesirable. The density differences between the TL crystals and resin matrix
may also cause the settling of the crystals during curing. There will therefore be uneven
dispersion of the crystals in the cured composite part or structure. Another problem associated
with this approach is filtration during the infusion process. The second approach is to
incorporate the crystals in polymer and produce as thin films. This approach is however limited
to surface mounting on structures. There is also the problem of incorporating the signal
transmission component. If the thin film is placed within a laminate, the risk of delamination
increases.
The in-situ triboluminescent optical fiber (ITOF) sensor overcomes most of these challenges.
The (ITOF) sensor mimics the sensory receptor of the human nervous system (HNS) by
converting the energy from damaging events like impact and fracture into optical signals that are
indicative of the magnitude of damage. The ITOF sensor has the potential for wireless, in-situ,
real time and distributed (WIRD) sensing. Furthermore, it eliminates the problems associated
with parasitic weight and filtration during composite fabrication. The ITOF sensor combines the
highly desirable properties of optical fibers such as lightweight, small size, immunity to
electromagnetic interference and capacity for distributed sensing [18, 19], with the
triboluminescent property of ZnS:Mn.

60
Before the new sensor can be incorporated into composite parts for damage detection and
monitoring however, key design factors affecting its performance have to be identified and the
appropriate levels that give enhanced TL response need to be determined. The work in
developing a viable production methodology and for characterizing the ITOF sensor is hereby
reported. In the proof of concept experiments, four factors were investigated namely: presence or
absence of cladding on the polymer optical fiber, ZnS:Mn/epoxy ratio, crystal size, and coating
thickness. Based on these results, a second set of experiments was conducted with an improved
fabrication methodology for the ITOF sensor.
4.1 Operating Principle of the ITOF Sensor
The ITOF sensor (Figure 4.1) consists of a polymer optical fiber (POF) with a highly sensitized
section, the triboluminescent sensory receptor (TSR). The TSR is made by mechanically
removing the jacket in that section along the length of the POF, and coating with fast curing
epoxy containing dispersed ZnS:Mn crystals which is one of the most efficient triboluminescent
materials known [144]. The ITOF sensor senses damage in the composite structure by converting
the mechanical energy of the damage causing event like impacts and crack propagation into
triboluminescent (TL) optical signals. The TL signals are then transmitted through the POF to a
photodetector such as a photomultiplier tube (PMT) or a photodiode. The photodetector converts
the TL optical signals into electrical signals that can be analyzed by a computer system for
damage characterization (Figure 4.2).
Figure 4.1: A schematic of the ITOF sensor.
Triboluminescence Sensory
Receptor (TSR)
Polymer optical fiber
(POF)
POF with jacket

61
a)
b) c)
d)
Figure 4.2: An ITOF based sensing system for SHM of bridges a) damage-sensitive region with ITOF sensor, b) TL (damage) signal from ITOF sensor due to crack, c) signal transmission by ITOF sensor and signal detection by PMT, d) signal analysis and damage identification.
The operation of the ITOF sensor is analogous to that of the sensory receptors in the human
nervous system that are able to convert the energy of the stimuli into nerve impulses that can be
transmitted through the neurons. The sensitized section of the ITOF acts like the sensory receptor
of the HNS while the optical fiber acts like the neuron for transmitting the TL optical signal to
the photodetectors.
4.2 Sensor Characterization Tools
Impact tests were carried out using a custom-built impact rig (Figure 4.3). The impact energy
was defined based on Newton’s equations for a free-falling body with the assumption that the air
resistance is negligible and the impacting mass does not touch the side of the aluminum drop
tube.
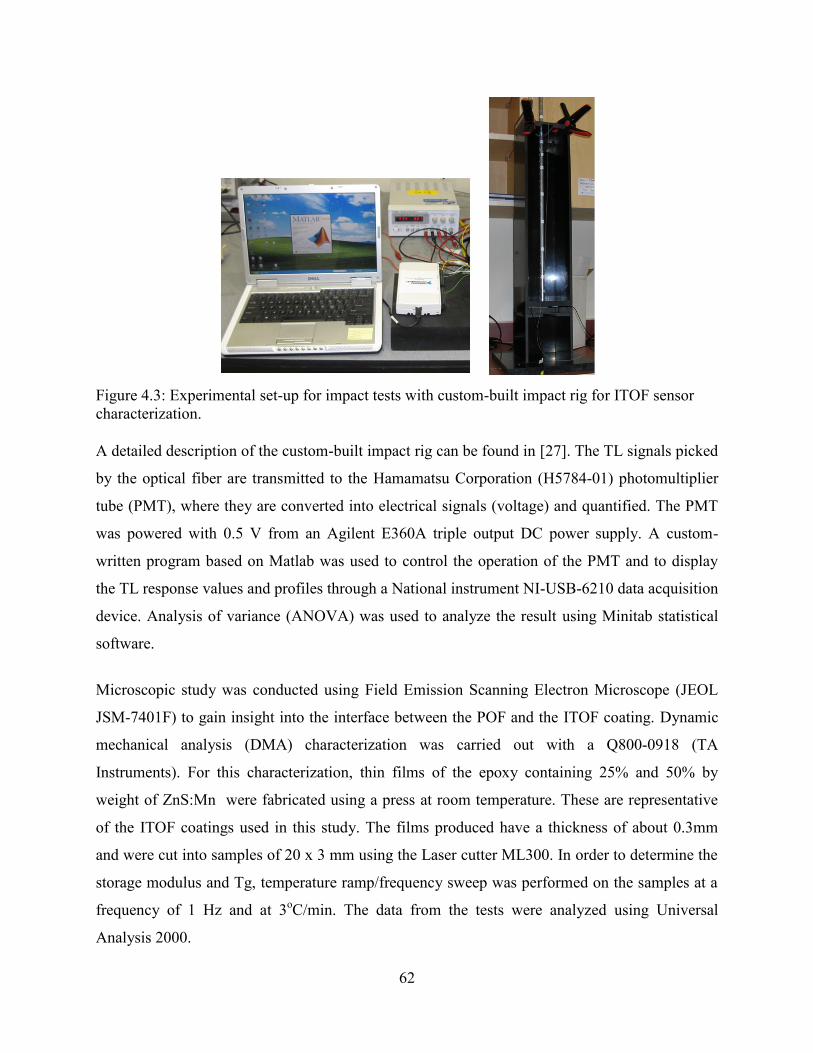
62
Figure 4.3: Experimental set-up for impact tests with custom-built impact rig for ITOF sensor characterization.
A detailed description of the custom-built impact rig can be found in [27]. The TL signals picked
by the optical fiber are transmitted to the Hamamatsu Corporation (H5784-01) photomultiplier
tube (PMT), where they are converted into electrical signals (voltage) and quantified. The PMT
was powered with 0.5 V from an Agilent E360A triple output DC power supply. A custom-
written program based on Matlab was used to control the operation of the PMT and to display
the TL response values and profiles through a National instrument NI-USB-6210 data acquisition
device. Analysis of variance (ANOVA) was used to analyze the result using Minitab statistical
software.
Microscopic study was conducted using Field Emission Scanning Electron Microscope (JEOL
JSM-7401F) to gain insight into the interface between the POF and the ITOF coating. Dynamic
mechanical analysis (DMA) characterization was carried out with a Q800-0918 (TA
Instruments). For this characterization, thin films of the epoxy containing 25% and 50% by
weight of ZnS:Mn were fabricated using a press at room temperature. These are representative
of the ITOF coatings used in this study. The films produced have a thickness of about 0.3mm
and were cut into samples of 20 x 3 mm using the Laser cutter ML300. In order to determine the
storage modulus and Tg, temperature ramp/frequency sweep was performed on the samples at a
frequency of 1 Hz and at 3oC/min. The data from the tests were analyzed using Universal
Analysis 2000.

63
4.3 Design Parameters Evaluation with Sensors Fabricated with Dip Process
Figure 4.4 gives an overview of the dip process for the fabrication of the ITOF sensor. The ITOF
sensor fabricated consisted of a 1 mm diameter polymer optical fiber (POF) produced by
Mitsubishi Rayon Company (SH-2001-J), a portion of which the jacket had been removed to
expose the desired length. The properties of the POF are as shown in Table 4.1.
Table 4.1: Specification of the ESKA CK40 polymer optical fiber (POF).
Core Clad
Material PMMA resin Fluorinated polymer
Diameter (typical) λ80 m 1000 m
Young’s modulus 3.09 GPa 0.68 GPa
Poisson’s ratio 0.3 0.3
Refractive index 1.492 1.405
Yield strength 82 MPa
Transmission loss (at 650 nm) 200dB/km
Maximum operating
temperature
70oC
Approximate weight 1 g/m
The appropriate weight of ZnS:Mn (Supplied by Phosphor Technology, UK) and fast cured
epoxy (Devcon 5 Minute Epoxy, #14250) required to get the desired concentration ratio was
measured, mixed and stirred manually to ensure good dispersion of the crystals in the epoxy
matrix. The coating of the exposed portion of the POF was accomplished by the dip process. The
dipping had to be done immediately the ZnS:Mn and fast cure epoxy were mixed. The system
was then allowed to cure. The ITOF sensors produced for this study had a total length of 640mm
with a sensitized region of 40mm.

64
Figure 4.4: A schematic of the dip fabrication process for the ITOF sensor.
4.3.1 Test Procedure
In the first phase of this characterization, design of experiments was used to investigate four
factors that were thought to affect the performance of the ITOF sensor. These factors are the
presence or absence of cladding on the POF, ZnS:Mn/epoxy ratio, crystal size, and coating
thickness. Table 4.2 gives the different levels of the four factors investigated in this study. The
two-level full factorial design resulted in 16 sensors being produced and randomly tested.
Table 4.2: Levels of the four factors investigated.
Factors Low level High level
ZnS:Mn-Epoxy concentration (by mass) 1:1 1:3
ZnSμMn average crystal size ( m) 15 60
Presence of cladding Cladded Uncladded
Coating thickness (mm) 0.66 1.44
The ITOF sensors’ coating thickness at the low level ranged from 0.55 to 0.82 mm, while the
value ranged from 1.15 to 1.73 mm at the high level. The average values for the samples are
given in Table 4.2. The samples were then impacted with a small mass of 33g at five
monotonically increasing impact levels namely 1.68, 9.91, 18.13, 26.35, and 34.57 (10-2 J)
corresponding to a drop height of 0.052, 0.302, 0.560, 0.814, and 1.068 (m) respectively.
4.3.2 Results and Discussion
Analysis of Variance (Identification of important ITOF fabrication parameters)
Data from the second, third and fourth impact levels were used for the ANOVA. This is because
the first impact level seems to be very low and inadequate to cause the TL excitation of the
ITOF. Earlier work by Womack et al [24] and by Olawale et al [27] reported a minimum impact
Prepare POF Weigh &
disperse ZnS:Mn + Epoxy
POF Coating by dip process
Curing
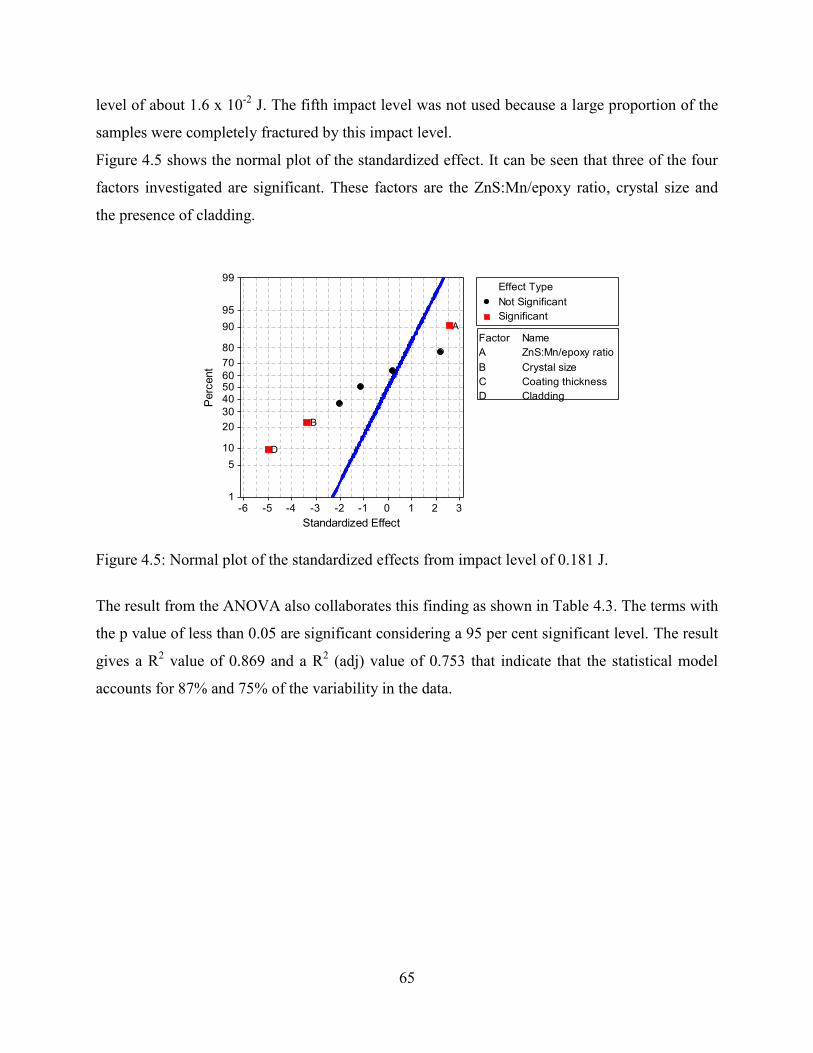
65
level of about 1.6 x 10⁻² J. The fifth impact level was not used because a large proportion of the
samples were completely fractured by this impact level.
Figure 4.5 shows the normal plot of the standardized effect. It can be seen that three of the four
factors investigated are significant. These factors are the ZnS:Mn/epoxy ratio, crystal size and
the presence of cladding.
3210-1-2-3-4-5-6
99
95
90
80
70
605040
30
20
10
5
1
Standardized Effect
Perc
ent
A ZnS:Mn/epoxy ratio
B Crystal size
C Coating thickness
D Cladding
Factor Name
Not Significant
Significant
Effect Type
D
B
A
Figure 4.5: Normal plot of the standardized effects from impact level of 0.181 J.
The result from the ANOVA also collaborates this finding as shown in Table 4.3. The terms with
the p value of less than 0.05 are significant considering a 95 per cent significant level. The result
gives a R2 value of 0.869 and a R2 (adj) value of 0.753 that indicate that the statistical model
accounts for 87% and 75% of the variability in the data.
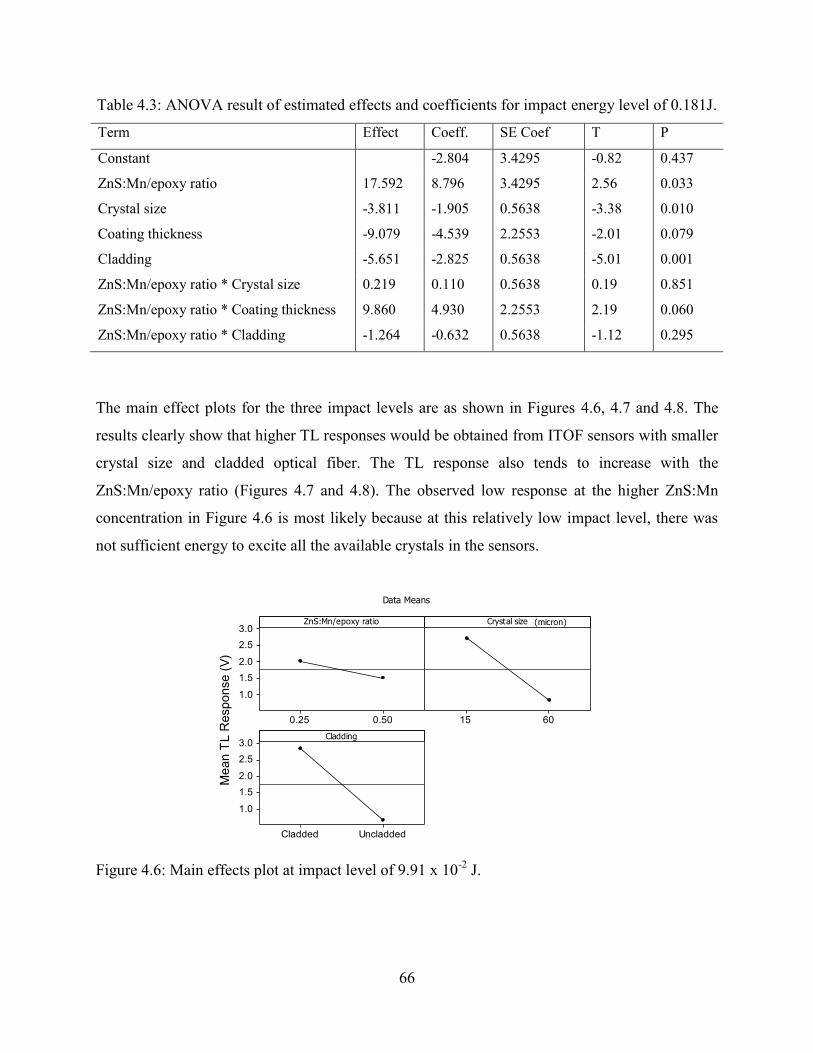
66
Table 4.3: ANOVA result of estimated effects and coefficients for impact energy level of 0.181J.
Term Effect Coeff. SE Coef T P
Constant -2.804 3.4295 -0.82 0.437
ZnS:Mn/epoxy ratio 17.592 8.796 3.4295 2.56 0.033
Crystal size -3.811 -1.905 0.5638 -3.38 0.010
Coating thickness -9.079 -4.539 2.2553 -2.01 0.079
Cladding -5.651 -2.825 0.5638 -5.01 0.001
ZnS:Mn/epoxy ratio * Crystal size 0.219 0.110 0.5638 0.19 0.851
ZnS:Mn/epoxy ratio * Coating thickness 9.860 4.930 2.2553 2.19 0.060
ZnS:Mn/epoxy ratio * Cladding -1.264 -0.632 0.5638 -1.12 0.295
The main effect plots for the three impact levels are as shown in Figures 4.6, 4.7 and 4.8. The
results clearly show that higher TL responses would be obtained from ITOF sensors with smaller
crystal size and cladded optical fiber. The TL response also tends to increase with the
ZnS:Mn/epoxy ratio (Figures 4.7 and 4.8). The observed low response at the higher ZnS:Mn
concentration in Figure 4.6 is most likely because at this relatively low impact level, there was
not sufficient energy to excite all the available crystals in the sensors.
0.500.25
3.0
2.5
2.0
1.5
1.0
6015
UncladdedCladded
3.0
2.5
2.0
1.5
1.0
ZnS:Mn/epoxy ratio
Mean T
L R
esponse (
V)
Crystal size
Cladding
Data Means
(micron)
Figure 4.6: Main effects plot at impact level of 9.91 x 10⁻² J.

67
0.500.25
6
4
2
6015
UncladdedCladded
6
4
2
ZnS:Mn/epoxy ratio
Mean
TL R
esponse (
V)
Crystal size
Cladding
Data Means
(micron)
Figure 4.7: Main effects plot at impact level of 18.13 x 10⁻² J.
0.500.25
8
6
4
2
0
6015
UncladdedCladded
8
6
4
2
0
ZnS:Mn/epoxy ratio
Mean T
L R
esponse (
V)
Crystal size
Cladding
Data Means
(micron)
Figure 4.8: Main effects plot at impact level of 26.35 x 10⁻² J.
The low TL responses associated with the uncladded sensors are caused by signal losses along
the length of the optical fiber because of the removed cladding. For TL signals to be successfully
transmitted along the length of the optical fiber, the refractive index of the core must be greater
than that of the cladding:
(4.1)
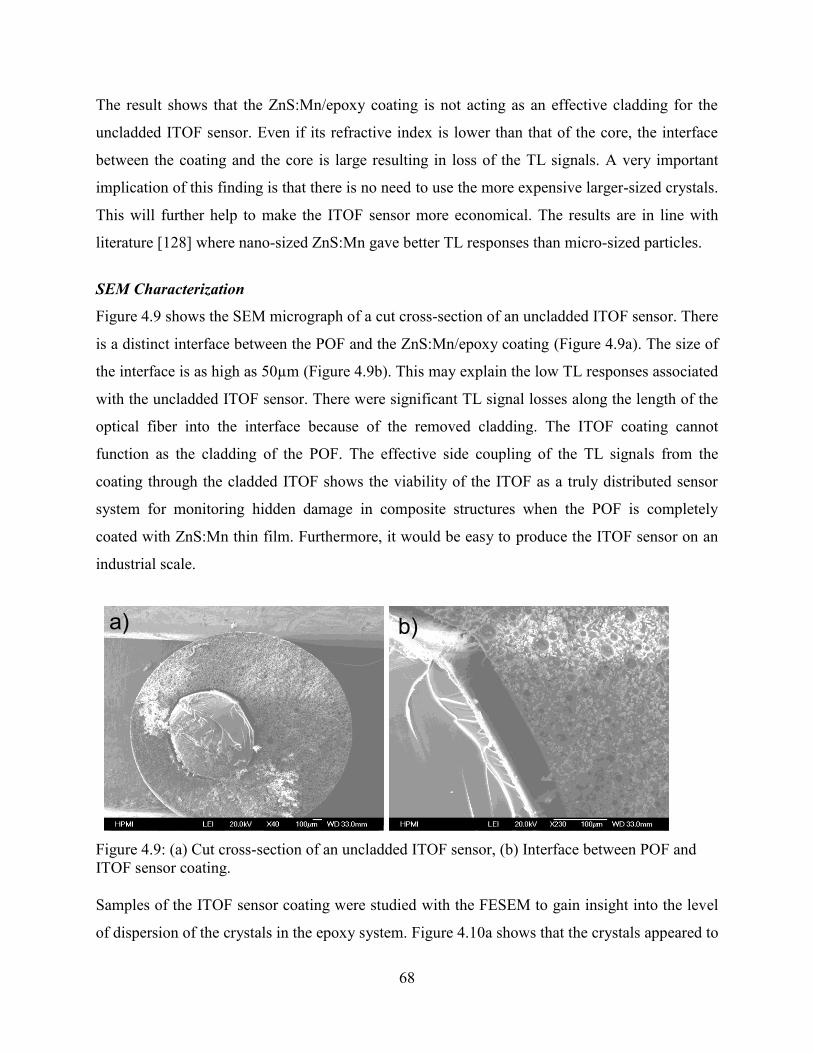
68
The result shows that the ZnS:Mn/epoxy coating is not acting as an effective cladding for the
uncladded ITOF sensor. Even if its refractive index is lower than that of the core, the interface
between the coating and the core is large resulting in loss of the TL signals. A very important
implication of this finding is that there is no need to use the more expensive larger-sized crystals.
This will further help to make the ITOF sensor more economical. The results are in line with
literature [128] where nano-sized ZnS:Mn gave better TL responses than micro-sized particles.
SEM Characterization
Figure 4.9 shows the SEM micrograph of a cut cross-section of an uncladded ITOF sensor. There
is a distinct interface between the POF and the ZnS:Mn/epoxy coating (Figure 4.9a). The size of
the interface is as high as 50µm (Figure 4.9b). This may explain the low TL responses associated
with the uncladded ITOF sensor. There were significant TL signal losses along the length of the
optical fiber into the interface because of the removed cladding. The ITOF coating cannot
function as the cladding of the POF. The effective side coupling of the TL signals from the
coating through the cladded ITOF shows the viability of the ITOF as a truly distributed sensor
system for monitoring hidden damage in composite structures when the POF is completely
coated with ZnS:Mn thin film. Furthermore, it would be easy to produce the ITOF sensor on an
industrial scale.
Figure 4.9: (a) Cut cross-section of an uncladded ITOF sensor, (b) Interface between POF and ITOF sensor coating.
Samples of the ITOF sensor coating were studied with the FESEM to gain insight into the level
of dispersion of the crystals in the epoxy system. Figure 4.10a shows that the crystals appeared to
a) b)
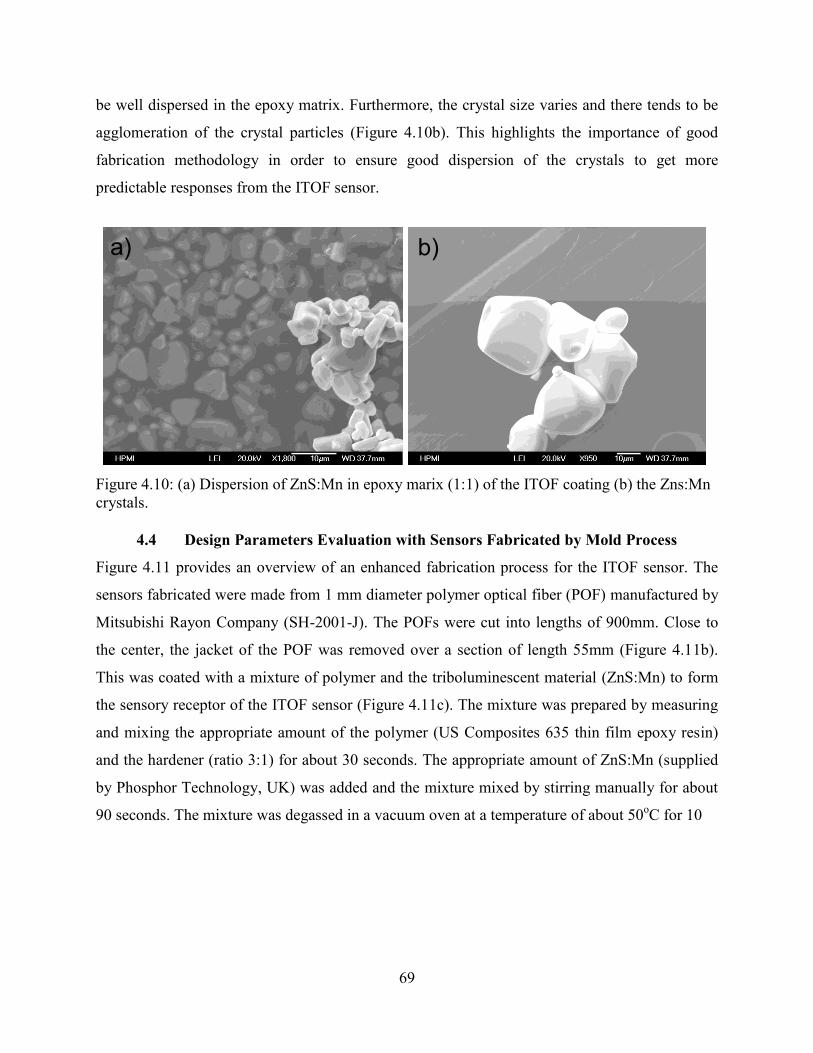
69
be well dispersed in the epoxy matrix. Furthermore, the crystal size varies and there tends to be
agglomeration of the crystal particles (Figure 4.10b). This highlights the importance of good
fabrication methodology in order to ensure good dispersion of the crystals to get more
predictable responses from the ITOF sensor.
Figure 4.10: (a) Dispersion of ZnS:Mn in epoxy marix (1:1) of the ITOF coating (b) the Zns:Mn crystals.
4.4 Design Parameters Evaluation with Sensors Fabricated by Mold Process
Figure 4.11 provides an overview of an enhanced fabrication process for the ITOF sensor. The
sensors fabricated were made from 1 mm diameter polymer optical fiber (POF) manufactured by
Mitsubishi Rayon Company (SH-2001-J). The POFs were cut into lengths of 900mm. Close to
the center, the jacket of the POF was removed over a section of length 55mm (Figure 4.11b).
This was coated with a mixture of polymer and the triboluminescent material (ZnS:Mn) to form
the sensory receptor of the ITOF sensor (Figure 4.11c). The mixture was prepared by measuring
and mixing the appropriate amount of the polymer (US Composites 635 thin film epoxy resin)
and the hardener (ratio 3:1) for about 30 seconds. The appropriate amount of ZnS:Mn (supplied
by Phosphor Technology, UK) was added and the mixture mixed by stirring manually for about
90 seconds. The mixture was degassed in a vacuum oven at a temperature of about 50oC for 10
a) b)
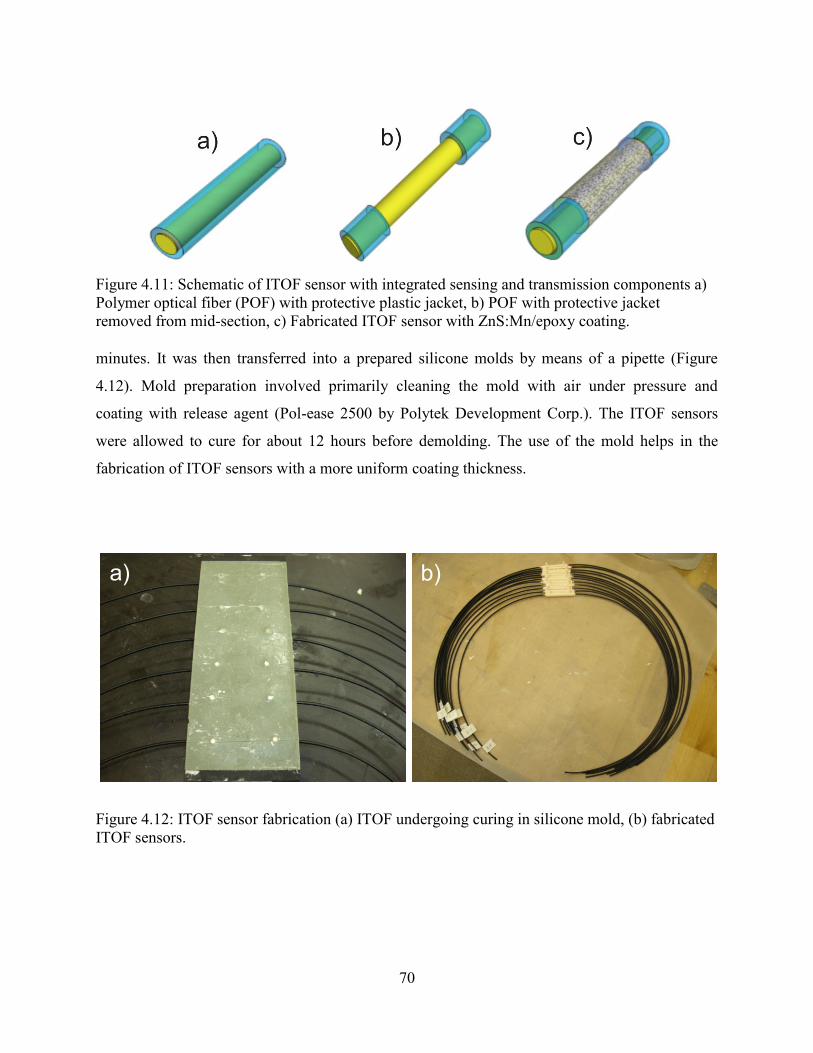
70
Figure 4.11: Schematic of ITOF sensor with integrated sensing and transmission components a) Polymer optical fiber (POF) with protective plastic jacket, b) POF with protective jacket removed from mid-section, c) Fabricated ITOF sensor with ZnS:Mn/epoxy coating.
minutes. It was then transferred into a prepared silicone molds by means of a pipette (Figure
4.12). Mold preparation involved primarily cleaning the mold with air under pressure and
coating with release agent (Pol-ease 2500 by Polytek Development Corp.). The ITOF sensors
were allowed to cure for about 12 hours before demolding. The use of the mold helps in the
fabrication of ITOF sensors with a more uniform coating thickness.
Figure 4.12: ITOF sensor fabrication (a) ITOF undergoing curing in silicone mold, (b) fabricated ITOF sensors.
a) b)

71
4.4.1 Test Procedure
The 2K factorial experimental design technique was used in determining the levels of three key
design parameters that give enhanced TL responses in the ITOF sensor. The key design
parameters investigated are the sensor thickness, ZnS:Mn/epoxy concentration, and the impact
energy level. Table 4.4 highlights the levels of the parameters investigated. The samples were
impacted with a small cylindrical steel mass in a custom-built impact rig (Figure 4.4) as
described earlier.
Table 4.4: The 2K Factorial experimental levels of the design factors investigated.
Factor Low level High Level
Sensor coating thickness (mm) 1.63 2.63
ZnS:Mn/epoxy concentration 0.25 0.5
Impact energy (J) 0.249 0.483
4.4.2 Results and Discussion
Determination of key design factors’ levels
Figures 4.13-4.15 show the surface and contour plots of the TL responses of the ITOF sensors.
Figures 4.13(a) and 4.13(b) indicate that higher TL responses were obtained with the low coating
thickness (1.63mm) and the high ZnS:Mn/epoxy weight fraction (0.5). The contour plot (Figure
4.13(b)) shows that with low coating thickness, it may be possible to reduce the ZnS:Mn/epoxy
weight fraction without significantly lowering its TL performance over a given range. Similarly,
Figure 4.14(a) and 4.14(b) indicate that higher TL responses were obtained with high
ZnS:Mn/epoxy weight fraction and high impact energy levels.
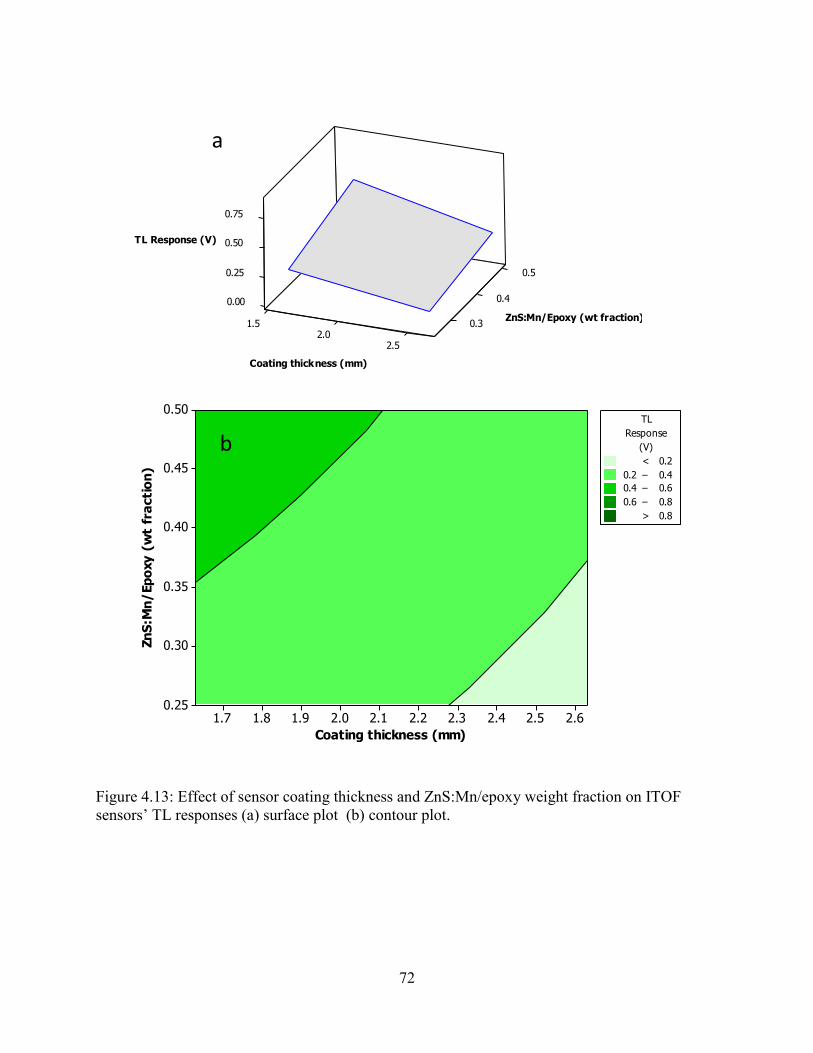
72
Figure 4.13: Effect of sensor coating thickness and ZnS:Mn/epoxy weight fraction on ITOF sensors’ TL responses (a) surface plot (b) contour plot.
0.4
0.5
0.00
0.25
0.50
0.75
1.5 0.32.0
2.5
TL Response (V)
ZnS:Mn/Epoxy (wt fraction)
Coating thickness (mm)
Coating thickness (mm)
Zn
S:M
n/
Ep
oxy
(w
t fr
acti
on
)
2.62.52.42.32.22.12.01.91.81.7
0.50
0.45
0.40
0.35
0.30
0.25
>
– – – < 0.2
0.2 0.4
0.4 0.6
0.6 0.8
0.8
(V)
Response
TL
a
b
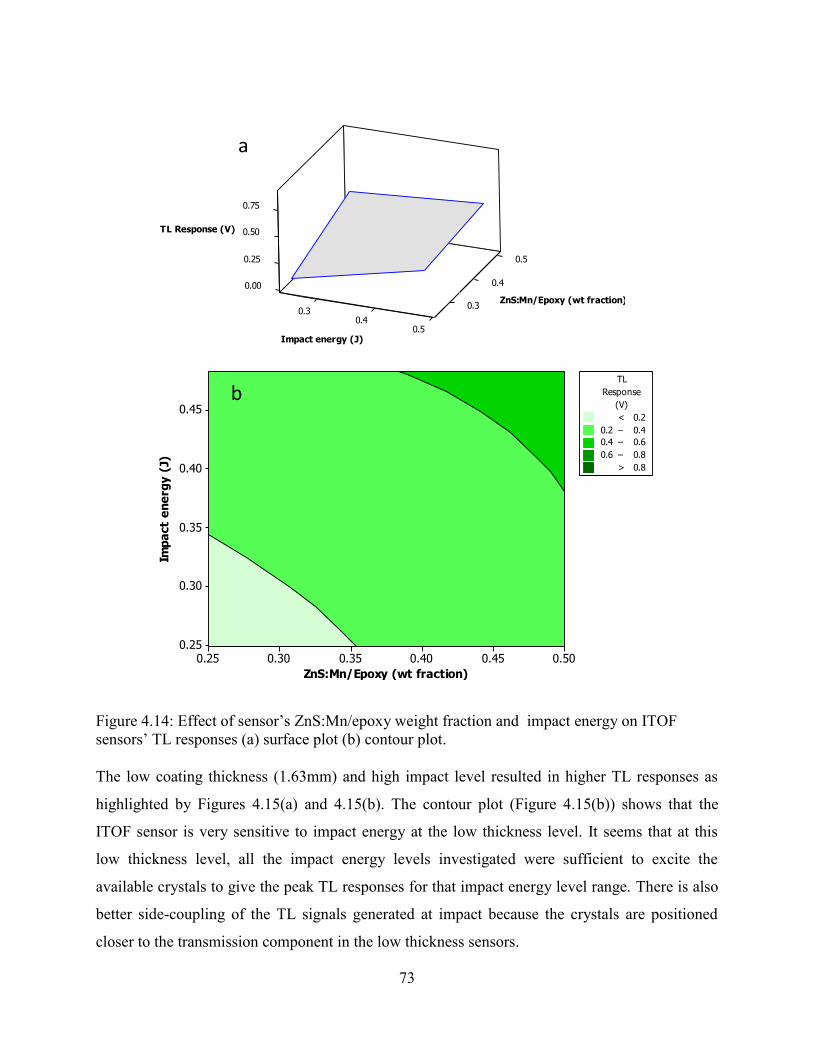
73
Figure 4.14: Effect of sensor’s ZnSμMn/epoxy weight fraction and impact energy on ITOF sensors’ TL responses (a) surface plot (b) contour plot.
The low coating thickness (1.63mm) and high impact level resulted in higher TL responses as
highlighted by Figures 4.15(a) and 4.15(b). The contour plot (Figure 4.15(b)) shows that the
ITOF sensor is very sensitive to impact energy at the low thickness level. It seems that at this
low thickness level, all the impact energy levels investigated were sufficient to excite the
available crystals to give the peak TL responses for that impact energy level range. There is also
better side-coupling of the TL signals generated at impact because the crystals are positioned
closer to the transmission component in the low thickness sensors.
0.5
0.40.00
0.25
0.50
0.75
0.30.3
0.40.5
TL Response (V)
ZnS:Mn/Epoxy (wt fraction)
Impact energy (J)
ZnS:Mn/Epoxy (wt fraction)
Imp
act
en
erg
y (
J)
0.500.450.400.350.300.25
0.45
0.40
0.35
0.30
0.25
>
– – – < 0.2
0.2 0.4
0.4 0.6
0.6 0.8
0.8
(V)
Response
TL
a
b

74
Figure 4.15: Effect of impact energy and sensor coating thickness on the TL responses of ITOF sensors (a) surface plot (b) contour plot.
The interaction plot (Figure 4.16a) shows some interaction between the ZnS:Mn/epoxy weight
ratio and the coating thickness as indicated by the different slopes of the plotted lines. The
1.63mm sensors exhibited higher TL sensitivity when made of ZnS:Mn/epoxy (0.5 wt fraction)
than when made of ZnS:Mn/epoxy (0.25 wt fraction). Significant interactions exists between the
impact energy level and the coating thickness (Figure 4.16b), and the ZnS:Mn/Epoxy weight
ratio (Figure 4.16c) as indicated by the non-parallel interaction lines. The 2.63mm sensors
exhibited higher sensitivity at the high impact level investigated, compared to the 1.63mm
0.4
0.5
0.00
0.25
0.50
0.75
1.5 0.32.0
2.5
TL Response (V)
Impact energy (J)
Coating thickness (mm)
Coating thickness (mm)
Imp
act
en
erg
y (
J)
2.62.52.42.32.22.12.01.91.81.7
0.45
0.40
0.35
0.30
0.25
>
– – – < 0.2
0.2 0.4
0.4 0.6
0.6 0.8
0.8
(V)
Response
TL
a
b

75
sensors. The higher impact energy tended to excite more crystals that are available in the large
coating thickness, as well as better excite crystals located nearer to the transmission component
Figure 4.16: Interaction plot for the TL response of the ITOF sensor under impact load.
(polymer optical fiber). The peak TL responses of virtually all the available crystals in the small
coating thickness seemed to have been reached at the lower impact energy level investigated
(Figure 4.16b) as indicated by the peak mean TL response obtained. Consequently, ITOF sensors
can be designed to have enhanced sensitivity to different damaging event severity based on the
coating thickness. Low coating thickness with high sensitivity for low damage energy situations
and high coating thickness for enhanced sensitivity at high damage energy situations. The
coating thickness directly determines the number of crystals (for a given TL crystal weight
fraction) available for excitation.
Figure 4.16c shows that at both the low (0.249J) and high (0.483J) impact levels, the
ZnS:Mn/epoxy (0.5 wt fraction) sensors gave higher mean TL response compared to the
ZnS:Mn/epoxy (0.25 wt fraction) sensors. The ZnS:Mn/epoxy (0.25 wt fraction) sensors
exhibited very low sensitivity to the low impact energy (0.249J) investigated while exhibiting a
high sensitivity at the high impact level (0.483J) studied. At the high impact energy level, the
dampening effect of the high polymer content of the ZnS:Mn/epoxy (0.25 wt fraction) ITOF
sensor was overcome and more energy made available to excite the ZnS:Mn crystals. There
seemed to be less dampening effect in the ZnS:Mn/epoxy (0.5 wt fraction) sensors because of the
reduced polymer content.
0.500.25 0.4830.249
0.4
0.2
0.0
0.4
0.2
0.0
Coating thickness (mm)
ZnS:Mn/Epoxy (wt fraction)
Impact energy (J)
Mean T
L resp
onse
(V)
1.63
2.63
1.63
2.63
0.5
0.25
a
c
b
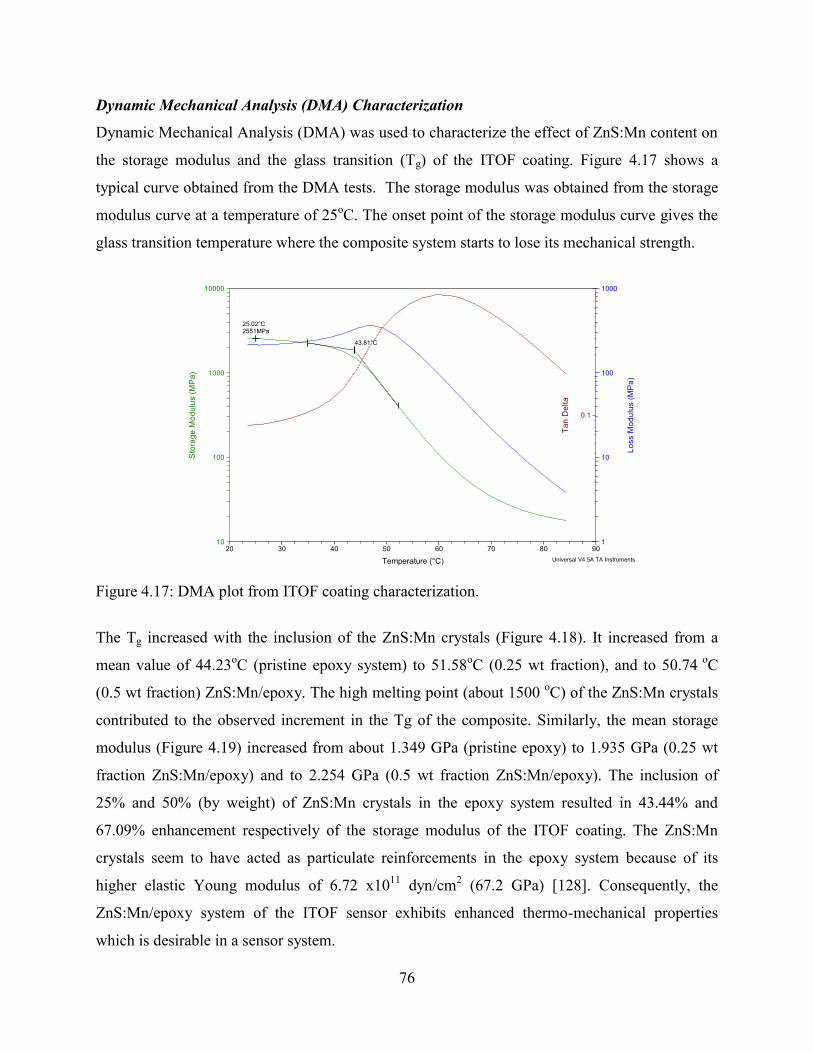
76
Dynamic Mechanical Analysis (DMA) Characterization
Dynamic Mechanical Analysis (DMA) was used to characterize the effect of ZnS:Mn content on
the storage modulus and the glass transition (Tg) of the ITOF coating. Figure 4.17 shows a
typical curve obtained from the DMA tests. The storage modulus was obtained from the storage
modulus curve at a temperature of 25oC. The onset point of the storage modulus curve gives the
glass transition temperature where the composite system starts to lose its mechanical strength.
Figure 4.17: DMA plot from ITOF coating characterization.
The Tg increased with the inclusion of the ZnS:Mn crystals (Figure 4.18). It increased from a
mean value of 44.23oC (pristine epoxy system) to 51.58oC (0.25 wt fraction), and to 50.74 oC
(0.5 wt fraction) ZnS:Mn/epoxy. The high melting point (about 1500 oC) of the ZnS:Mn crystals
contributed to the observed increment in the Tg of the composite. Similarly, the mean storage
modulus (Figure 4.19) increased from about 1.349 GPa (pristine epoxy) to 1.935 GPa (0.25 wt
fraction ZnS:Mn/epoxy) and to 2.254 GPa (0.5 wt fraction ZnS:Mn/epoxy). The inclusion of
25% and 50% (by weight) of ZnS:Mn crystals in the epoxy system resulted in 43.44% and
67.09% enhancement respectively of the storage modulus of the ITOF coating. The ZnS:Mn
crystals seem to have acted as particulate reinforcements in the epoxy system because of its
higher elastic Young modulus of 6.72 x10¹¹ dyn/cm2 (67.2 GPa) [128]. Consequently, the
ZnS:Mn/epoxy system of the ITOF sensor exhibits enhanced thermo-mechanical properties
which is desirable in a sensor system.
43.81°C
25.02°C2551MPa
0.1
Ta
n D
elta
1
10
100
1000
Lo
ss M
od
ulu
s (
MP
a)
10
100
1000
10000
Sto
rag
e M
od
ulu
s (
MP
a)
20 30 40 50 60 70 80 90
Temperature (°C)
Instrument: DMA Q800 V20.9 Build 27
Universal V4.5A TA Instruments
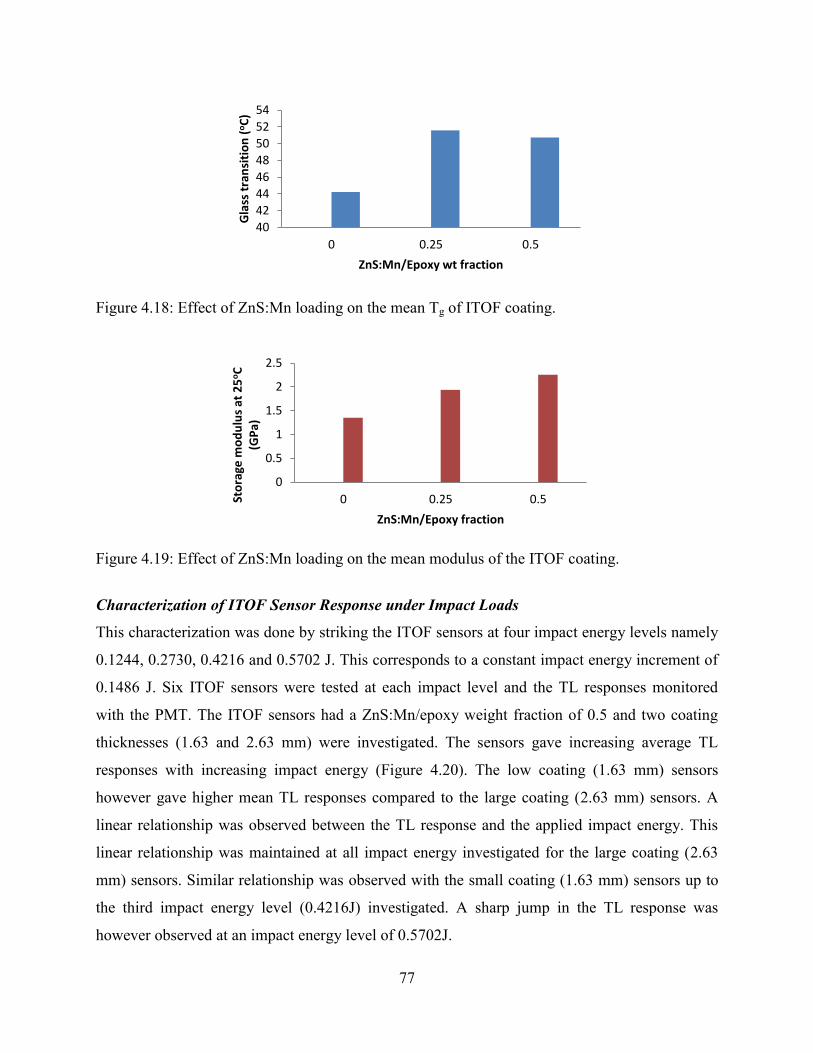
77
Figure 4.18: Effect of ZnS:Mn loading on the mean Tg of ITOF coating.
Figure 4.19: Effect of ZnS:Mn loading on the mean modulus of the ITOF coating.
Characterization of ITOF Sensor Response under Impact Loads
This characterization was done by striking the ITOF sensors at four impact energy levels namely
0.1244, 0.2730, 0.4216 and 0.5702 J. This corresponds to a constant impact energy increment of
0.1486 J. Six ITOF sensors were tested at each impact level and the TL responses monitored
with the PMT. The ITOF sensors had a ZnS:Mn/epoxy weight fraction of 0.5 and two coating
thicknesses (1.63 and 2.63 mm) were investigated. The sensors gave increasing average TL
responses with increasing impact energy (Figure 4.20). The low coating (1.63 mm) sensors
however gave higher mean TL responses compared to the large coating (2.63 mm) sensors. A
linear relationship was observed between the TL response and the applied impact energy. This
linear relationship was maintained at all impact energy investigated for the large coating (2.63
mm) sensors. Similar relationship was observed with the small coating (1.63 mm) sensors up to
the third impact energy level (0.4216J) investigated. A sharp jump in the TL response was
however observed at an impact energy level of 0.5702J.
40
42
44
46
48
50
52
54
0 0.25 0.5 G
lass
tra
nsi
tio
n (
oC
)
ZnS:Mn/Epoxy wt fraction
0
0.5
1
1.5
2
2.5
0 0.25 0.5 Sto
rag
e m
od
ulu
s a
t 2
5oC
(GP
a)
ZnS:Mn/Epoxy fraction
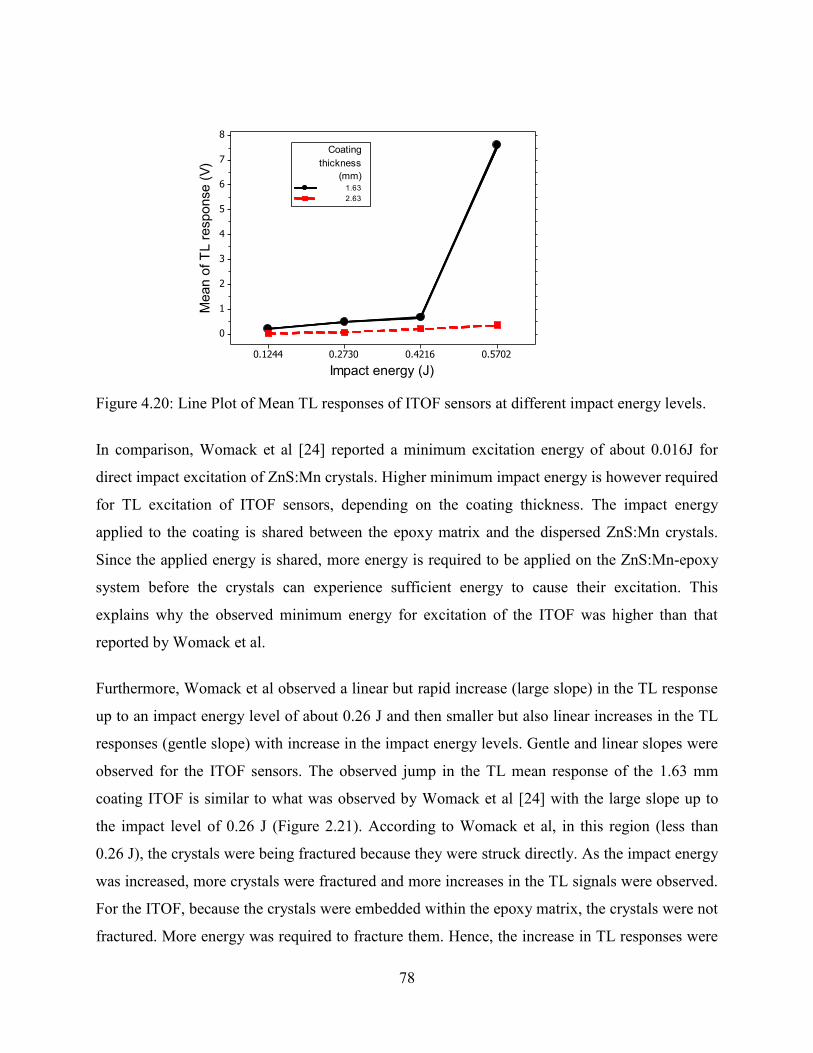
78
0.57020.42160.27300.1244
8
7
6
5
4
3
2
1
0
Impact energy (J)
Mean o
f T
L r
esponse (
V)
1.63
2.63
(mm)
thickness
Coating
Figure 4.20: Line Plot of Mean TL responses of ITOF sensors at different impact energy levels.
In comparison, Womack et al [24] reported a minimum excitation energy of about 0.016J for
direct impact excitation of ZnS:Mn crystals. Higher minimum impact energy is however required
for TL excitation of ITOF sensors, depending on the coating thickness. The impact energy
applied to the coating is shared between the epoxy matrix and the dispersed ZnS:Mn crystals.
Since the applied energy is shared, more energy is required to be applied on the ZnS:Mn-epoxy
system before the crystals can experience sufficient energy to cause their excitation. This
explains why the observed minimum energy for excitation of the ITOF was higher than that
reported by Womack et al.
Furthermore, Womack et al observed a linear but rapid increase (large slope) in the TL response
up to an impact energy level of about 0.26 J and then smaller but also linear increases in the TL
responses (gentle slope) with increase in the impact energy levels. Gentle and linear slopes were
observed for the ITOF sensors. The observed jump in the TL mean response of the 1.63 mm
coating ITOF is similar to what was observed by Womack et al [24] with the large slope up to
the impact level of 0.26 J (Figure 2.21). According to Womack et al, in this region (less than
0.26 J), the crystals were being fractured because they were struck directly. As the impact energy
was increased, more crystals were fractured and more increases in the TL signals were observed.
For the ITOF, because the crystals were embedded within the epoxy matrix, the crystals were not
fractured. More energy was required to fracture them. Hence, the increase in TL responses were

79
linear and incremental with increase in the impact energy because of the dampening effect of the
epoxy matrix (Figure 4.21a). Thus, elastico-TL and plastico-TL dominated the TL mechanism
experienced by the sensors. At the impact energy of 0.5702 J however, the applied energy was
sufficiently high to cause the fracture of the ITOF coating and the embedded TL crystals leading
to fracto-TL as evident by the jump in the TL signal similar to that obtained by Womack et al
during direct impact of the TL crystals. Experience gained with working with the ITOF has
shown this characteristic jump in the TL intensity signal when fracture or microcracks occur.
The TL crystals in the thinner (1.63 mm) ITOF coating experienced a higher impact energy than
the crystals in the larger coating ITOF. This may be attributed to the much higher density of
ZnS:Mn (4.2 g/cm3) which is about 3 times that of the epoxy matrix (1.2-1.5 g/cm3). This means
in terms of volume, there are about 3 times more epoxy than ZnS:Mn crystals for equal weight
fraction. Since the crystals are located within the epoxy matrix of the coating, the energy has to
be transmitted through the epoxy to the crystals. While ZnS:Mn has a Young modulus of about
67.2 GPa, epoxy has a Young’s modulus of about 2.4 GPa. Hence, the epoxy matrix may create a
dampening effect that further reduces the impact energy experienced by the crystals within it. As
will be shown later, the ITOF with its coating has a flexural modulus value of about 3.4GPa.
The TL crystals located nearer to the outer diameter of the coating are more likely to experience
higher impact energy. The TL emissions may however not be successfully coupled into the POF
with the increased crystal distance from the POF because of TL emission absorption by the
surrounding opaque matrix and crystals. The larger the coating thickness therefore, the more
pronounced are these effects (Figure 21b). This explains why the smaller coating thickness
consistently resulted in higher TL response for any given impact energy level.
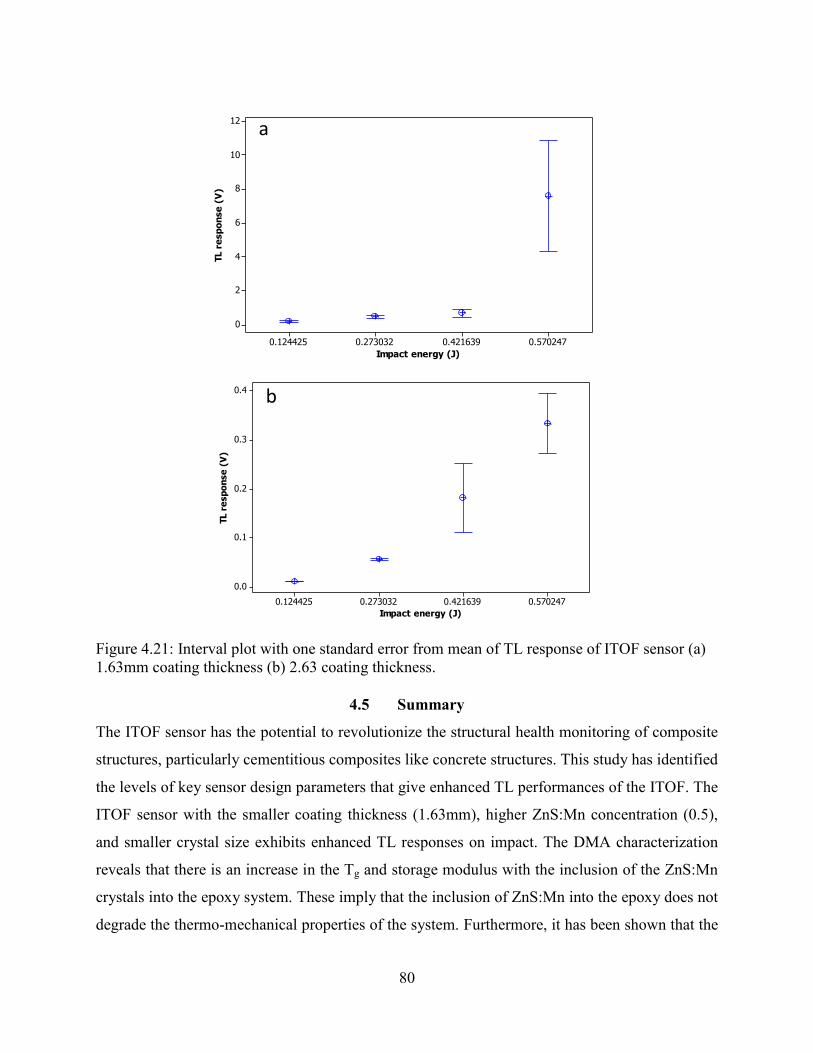
80
Figure 4.21: Interval plot with one standard error from mean of TL response of ITOF sensor (a) 1.63mm coating thickness (b) 2.63 coating thickness.
4.5 Summary
The ITOF sensor has the potential to revolutionize the structural health monitoring of composite
structures, particularly cementitious composites like concrete structures. This study has identified
the levels of key sensor design parameters that give enhanced TL performances of the ITOF. The
ITOF sensor with the smaller coating thickness (1.63mm), higher ZnS:Mn concentration (0.5),
and smaller crystal size exhibits enhanced TL responses on impact. The DMA characterization
reveals that there is an increase in the Tg and storage modulus with the inclusion of the ZnS:Mn
crystals into the epoxy system. These imply that the inclusion of ZnS:Mn into the epoxy does not
degrade the thermo-mechanical properties of the system. Furthermore, it has been shown that the
0.5702470.4216390.2730320.124425
12
10
8
6
4
2
0
Impact energy (J)
TL r
esp
on
se
(V
)
0.5702470.4216390.2730320.124425
0.4
0.3
0.2
0.1
0.0
Impact energy (J)
TL r
esp
on
se
(V
)
a
b

81
ITOF sensor can discriminate among different energy levels and is able to detect multiple
damage events provided the sensor has not been fractured. An improved fabrication process was
also developed. It was also shown that although the ZnS:Mn retained its TL properties in the
epoxy matrix of the ITOF, its TL excitation behavior is however different. This is because the
epoxy matrix introduces a dampening effect coupled with the opacity effect. The sensor can be
designed to accommodate the expected damaging energy levels based on the sensor size.

82
CHAPTER FIVE
ITOF SENSOR IMPACT EXCITATION MODEL
A lot of research work has gone into the characterization of the TL performance of TL crystals
under direct impact loading. The ITOF sensor provides a different kind of system in which the
TL crystals are randomly dispersed in an epoxy matrix. The excitation of the TL crystals in this
composite system is expected to be different because of the interactions between the crystals and
matrix during loading. Hence, this needs to be studied. Furthermore, there are two key design
parameters that can be readily used to tailor the behavior of the sensor for enhanced TL-based
sensing performance. These are the sensor size and the volume fraction of the TL crystals in the
coating. The modeling effort will draw on existing knowledge to establish a relationship
between the TL intensity response of the ITOF as a function of sensor size and volume fraction
of the sensor coating for a given impact energy level.
5.1 Theoretical Model
Triboluminescence may be divided into three types: namely (1) elastico-, (2) plastico- and (3)
fracto-triboluminescence [22]. Elastico-TL is luminescence produced during the elastic
deformation of solids, where neither fracture nor plastic deformation is required. Elastico-TL in
ZnS:Mn starts at a pressure of about 1MPa (106 Nm-2) while plastico-TL and fracto-TL start at
about 30MPa and 100MPa respectively [21, 22, 128]. This implies that a minimum stress level of
about 1MPa is required by ZnS:Mn crystals before any TL signal can be generated and detected.
Based on these, the following assumptions have been made for the model development:
1. Perfect bonding between the TL crystals and the epoxy matrix.
2. Stress level generated in the TL crystals is within the elastic limit of the crystals
The maximum TL intensity produced by applying a load onto ZnS:Mn nanoparticles may be
given as [128]:
(1a)
(1b)

83
where do is the localized piezoelectric constant near the Mn2+ centers in ZnS:Mn nanoparticles, is the final stress, η is the efficiency of the radiative emission from Mn2+ centers during the
electron-hole recombination, and is a constant that is related to the density of the Mn2+ centers
and the density of electrons in shallow traps. Equation (1) implies that the peak TL intensity will
increase quadratically with σo, the final pressure or stress experienced by the TL crystal. At
constant deformation rate however, the peak intensity will increase linearly with the applied
pressure:
(2)
(2b)
Model 1
Considering a unit length of ITOF sensor under impact loading (Figure 5.1), the fraction of the
impact energy absorbed by the ITOF sensor may be given as: (3)
or (4)
Figure 5.1: Schematic of ITOF sensor under impact loading.

84
where is the energy from the impactor, is the energy absorbed by the coating, is
the energy absorbed by the polymer optical fiber, is the energy absorbed by the TL crystals
of the ITOF coating, and is the energy absorbed by the polymer component of the ITOF
coating. The energy absorbed by the various components of the ITOF coating can be given in
terms of the specific absorption energy ξ defined as the energy absorbed per unit mass of a
material [158] as:
(5a)
or
(5b)
where and denote the mass of the TL crystals and polymer components of the ITOF
coating respectively; denotes the total volume of the coating in the region of impact; and denote the volume fraction of the TL crystals and polymer components of the coating
respectively.
The specific absorption energy is given as a function of the mean crushing stress σ and density ρ
of the material as [158]:
(6)
Equation (5b) may be rewritten as:
(7)
The stress available to cause the excitation of the TL crystals can be given as:
(8)
The volume of the impacted coating area (considering a length d corresponding to the diameter
of the impactor) is given as:
(9)

85
where R is the radius of the ITOF coating and r is the radius of the POF. Substituting in Equation
(8) gives:
(10)
Substituting Eqn (1b) into Eqn (10) gives
(11)
but
(12a)
(12b)
(13a)
where and is the mass fraction of the TL crystals and the epoxy respectively in the
ZnS:Mn/epoxy composite and is the total mass of the composite.
(13b)
Substituting Eqn 13b into Eqn 12b gives
(14a)
(14b)
Similarly,
(15)

86
(16)
Substituting Eqn (14b) and Eqn (16) in to Eqn (11) gives
(17)
(17b)
Drawing from Eqn (1), (10) and (11), Eqn (17) implies that the higher the energy of impact, the
higher the stress level generated in the ITOF coating to cause higher intensity TL responses in
accordance with Eqn (1). A quadratic relationship exists between the peak TL intensity and the
impact energy. A linear increase in the sensor coating radius (thickness) will result in a
quadrupled order of reduction in the expected TL response. Similarly, the smaller the size
(radius) of the coating of the ITOF sensor, the larger the stress predicted to be generated in the
crystals to cause higher TL responses. Furthermore, an increase in the mass ratio of the polymer
component of the ITOF coating will result in a reduction in the expected TL response from the
sensor because lesser energy will be available to excite the TL crystals.
Model 2
If a fraction of the elastic energy of a cylindrical impactor of diameter is given to the ITOF
coating of the sensor consisting of the epoxy and ZnS:Mn crystals and POF with a total volume
V under the impactor, the elastic energy can be given as [128]:
(18)
where , , and are the Young’s modulus of the sensor, impact energy and maximum value
of the impact stress respectively. Equation (18) may be written as:
(19)
where is the radius of the ITOF sensor.

87
Substituting Equation 19 into Equation 1 gives
(20)
Equation (20) is based on the assumption that the coating consists purely of TL crystals. To take
account of the available TL crystals in the coating, the volume fraction term is included:
(21)
Substituting Eqn 14 into Eqn 21 gives
(22)
or
(23)
where D is the diameter of the ITOF sensor. The factor is the volume fraction of
triboluminescent crystals in the coating. When the coating is purely TL crystals, all the generated
stress is available to excite the crystals . When there are no crystals in the coating, , and no TL signal will be generated.
Eqn (21) implies that the higher the energy of impact, the higher the stress level generated in the
ITOF coating to cause higher intensity TL responses in accordance with Eqn (1). A linear
relationship exists between the peak TL intensity and the impact energy. A linear increase in the
sensor coating radius (thickness) will result in a quadratic order of reduction in the expected TL
response.
5.2 Model Validation
Figure 5.2 is an overview of the model variables that were investigated and the measured
response. An attempt was made to validate the model by subjecting the fabricated ITOF sensor
samples to impact loading with a custom-built impact rig described earlier (Figure 4.4). Both
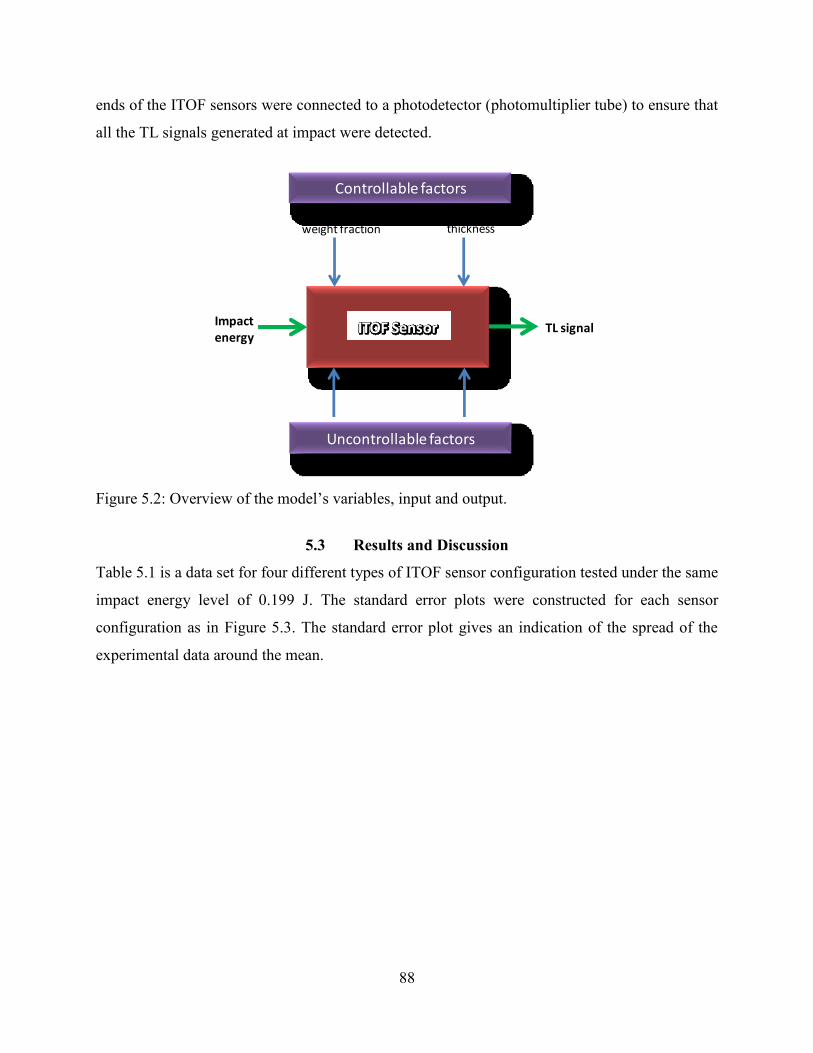
88
ends of the ITOF sensors were connected to a photodetector (photomultiplier tube) to ensure that
all the TL signals generated at impact were detected.
Figure 5.βμ Overview of the model’s variables, input and output.
5.3 Results and Discussion
Table 5.1 is a data set for four different types of ITOF sensor configuration tested under the same
impact energy level of 0.199 J. The standard error plots were constructed for each sensor
configuration as in Figure 5.3. The standard error plot gives an indication of the spread of the
experimental data around the mean.
ITOF Sensor
Controllable factors
Uncontrollable factors
ZnS-Mn/epoxy
weight fraction
Coating
thickness
Impact
energyTL signal

89
Table 5.1 TL responses from different ITOF sensor configuration based on experimental result (TLexp) and model result (TLmodel) under impact energy of 0.199 J.
x1 x2 Y1 Y2
Sensor
Sensor
diameter (mm)
ZnS:Mn weight
fraction TLexp (AU) TLmodel (AU)
1 6 0.25 0.293 0.044
2 3 0.25 0.617 0.176
3 3 0.25 0.052 0.176
4 6 0.25 0.021 0.044
5 3 0.25 0.264 0.176
6 6 0.25 0.040 0.044
7 3 0.5 0.407 0.436
8 3 0.5 0.314 0.436
9 3 0.5 1.618 0.436
10 6 0.5 0.142 0.109
11 6 0.5 0.010 0.109
12 6 0.5 0.029 0.109
Figure 5.3 shows a reduction in the mean TL signal with increase in the sensor diameter for the
two different TL crystal weight fractions investigated. The variation in the observed TL
responses is greatest in the 3mm diameter and 0.5 ZnS:Mn weight fraction sensor. Generally, the
small coating ITOF sensors exhibited higher variability in their TL responses.

90
63
1.2
1
0.8
0.6
0.4
0.2
0
63
weight fraction = 0.25
Sensor diameter (mm)
TL s
ignal_
exp
(A
U)
weight fraction = 0.50
Figure 5.3: Interval plot (one standard error from the mean) of TL responses of tested ITOF sensor under impact load of 0.199 J.
To gain insights into the cause of the variations in the TL responses of the tested sensors, they
were studied with the FESEM.
Uniformity of Coating
As noted in Table 5.1, Sensor 2 gave a significantly higher TL signal value (0.617 AU) than
Sensor 3 (with a TL signal value of 0.052 AU) though they had the same configuration (TL
crystal content of 0.25 wt fraction and sensor diameter of 3mm) and were impacted with the
same impact energy level. Figure 5.4 shows FESEM micrographs of the cross-sections of sensors
2 and 3.
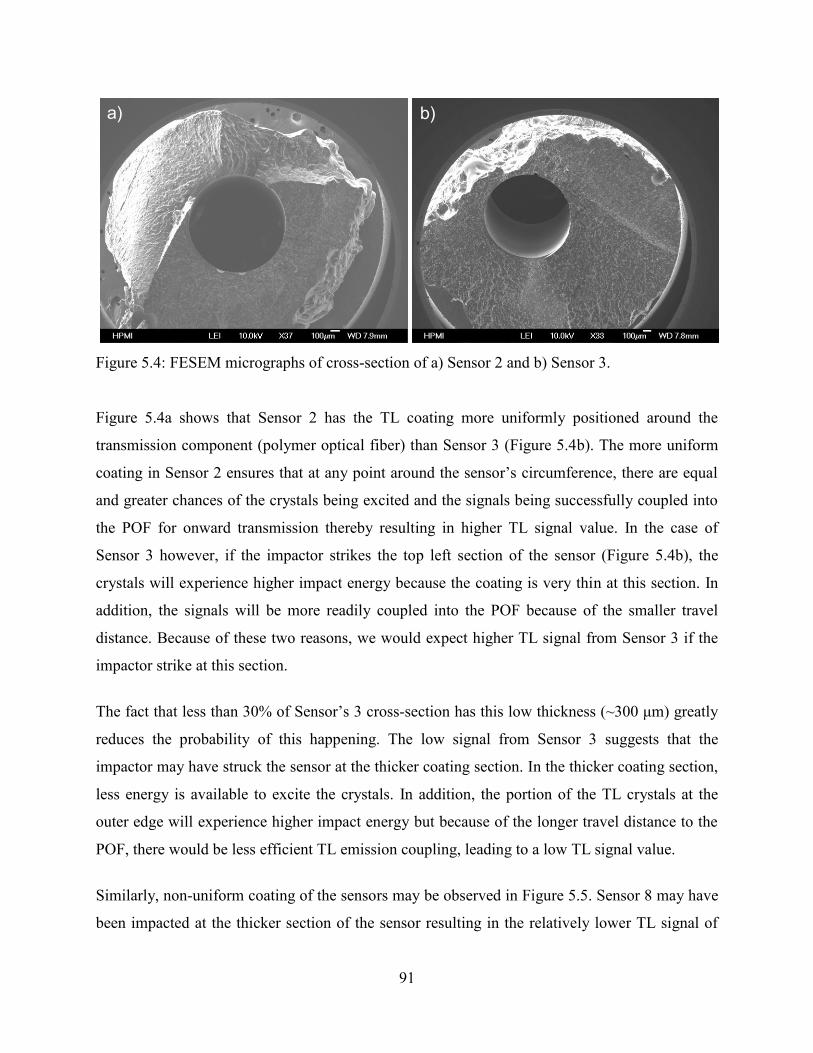
91
Figure 5.4: FESEM micrographs of cross-section of a) Sensor 2 and b) Sensor 3.
Figure 5.4a shows that Sensor 2 has the TL coating more uniformly positioned around the
transmission component (polymer optical fiber) than Sensor 3 (Figure 5.4b). The more uniform
coating in Sensor β ensures that at any point around the sensor’s circumference, there are equal
and greater chances of the crystals being excited and the signals being successfully coupled into
the POF for onward transmission thereby resulting in higher TL signal value. In the case of
Sensor 3 however, if the impactor strikes the top left section of the sensor (Figure 5.4b), the
crystals will experience higher impact energy because the coating is very thin at this section. In
addition, the signals will be more readily coupled into the POF because of the smaller travel
distance. Because of these two reasons, we would expect higher TL signal from Sensor 3 if the
impactor strike at this section.
The fact that less than γ0% of Sensor’s γ cross-section has this low thickness (~γ00 m) greatly
reduces the probability of this happening. The low signal from Sensor 3 suggests that the
impactor may have struck the sensor at the thicker coating section. In the thicker coating section,
less energy is available to excite the crystals. In addition, the portion of the TL crystals at the
outer edge will experience higher impact energy but because of the longer travel distance to the
POF, there would be less efficient TL emission coupling, leading to a low TL signal value.
Similarly, non-uniform coating of the sensors may be observed in Figure 5.5. Sensor 8 may have
been impacted at the thicker section of the sensor resulting in the relatively lower TL signal of
a) b)
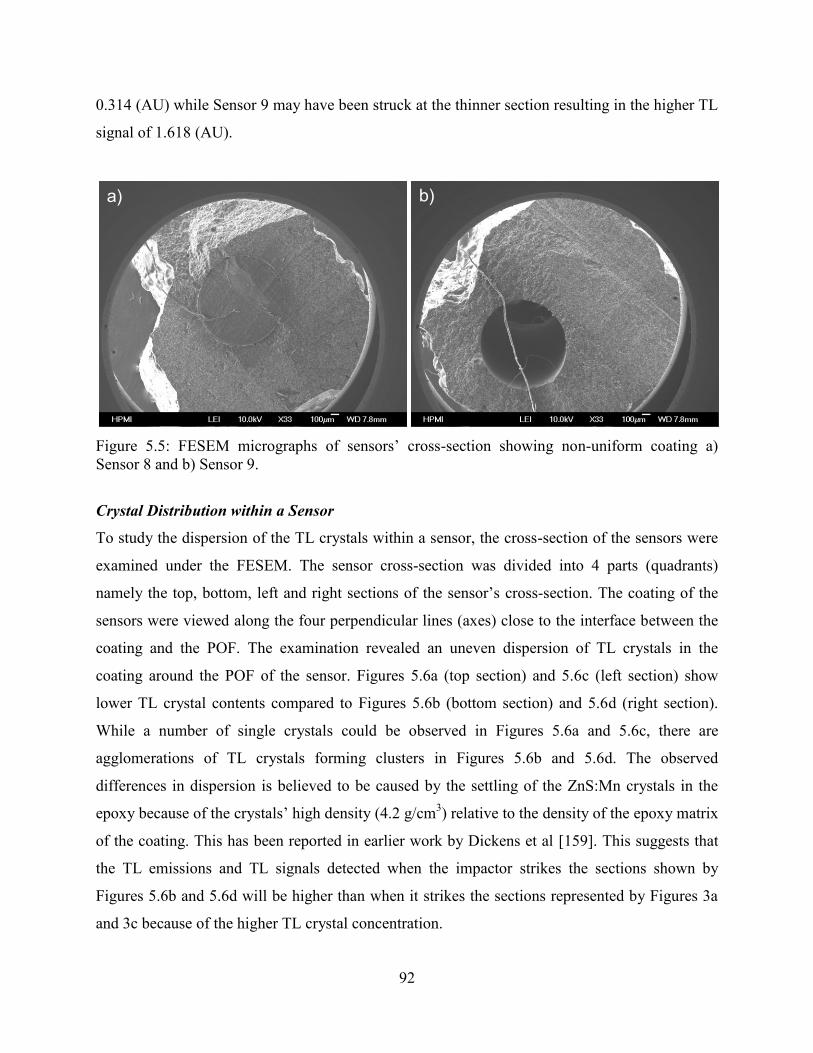
92
0.314 (AU) while Sensor 9 may have been struck at the thinner section resulting in the higher TL
signal of 1.618 (AU).
Figure 5.5μ FESEM micrographs of sensors’ cross-section showing non-uniform coating a) Sensor 8 and b) Sensor 9.
Crystal Distribution within a Sensor
To study the dispersion of the TL crystals within a sensor, the cross-section of the sensors were
examined under the FESEM. The sensor cross-section was divided into 4 parts (quadrants)
namely the top, bottom, left and right sections of the sensor’s cross-section. The coating of the
sensors were viewed along the four perpendicular lines (axes) close to the interface between the
coating and the POF. The examination revealed an uneven dispersion of TL crystals in the
coating around the POF of the sensor. Figures 5.6a (top section) and 5.6c (left section) show
lower TL crystal contents compared to Figures 5.6b (bottom section) and 5.6d (right section).
While a number of single crystals could be observed in Figures 5.6a and 5.6c, there are
agglomerations of TL crystals forming clusters in Figures 5.6b and 5.6d. The observed
differences in dispersion is believed to be caused by the settling of the ZnS:Mn crystals in the
epoxy because of the crystals’ high density (4.2 g/cm3) relative to the density of the epoxy matrix
of the coating. This has been reported in earlier work by Dickens et al [159]. This suggests that
the TL emissions and TL signals detected when the impactor strikes the sections shown by
Figures 5.6b and 5.6d will be higher than when it strikes the sections represented by Figures 3a
and 3c because of the higher TL crystal concentration.
a) b)
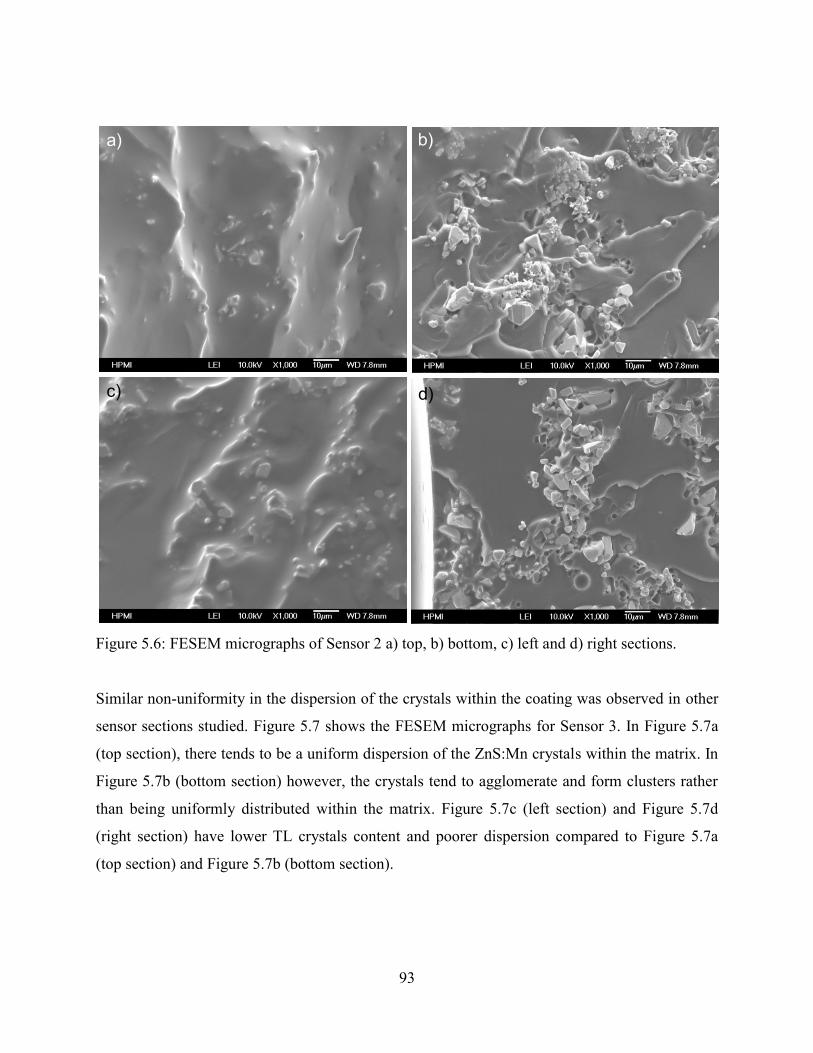
93
Figure 5.6: FESEM micrographs of Sensor 2 a) top, b) bottom, c) left and d) right sections.
Similar non-uniformity in the dispersion of the crystals within the coating was observed in other
sensor sections studied. Figure 5.7 shows the FESEM micrographs for Sensor 3. In Figure 5.7a
(top section), there tends to be a uniform dispersion of the ZnS:Mn crystals within the matrix. In
Figure 5.7b (bottom section) however, the crystals tend to agglomerate and form clusters rather
than being uniformly distributed within the matrix. Figure 5.7c (left section) and Figure 5.7d
(right section) have lower TL crystals content and poorer dispersion compared to Figure 5.7a
(top section) and Figure 5.7b (bottom section).
a)
d)c)
b)
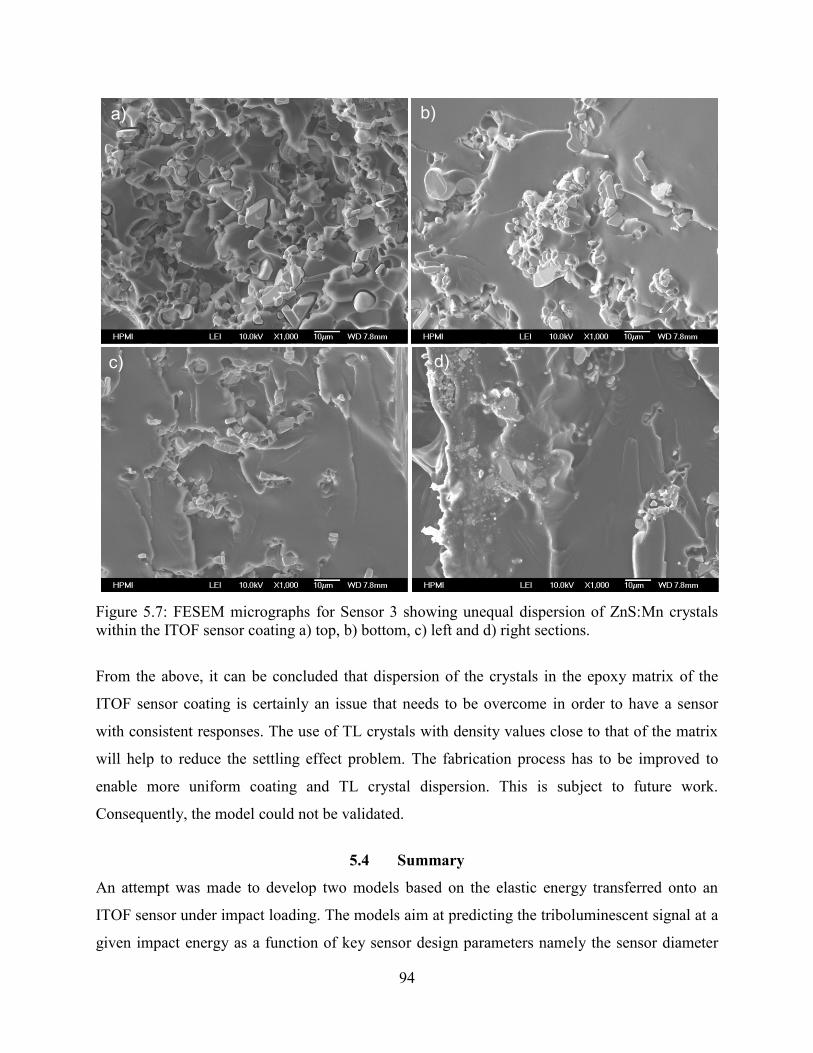
94
Figure 5.7: FESEM micrographs for Sensor 3 showing unequal dispersion of ZnS:Mn crystals within the ITOF sensor coating a) top, b) bottom, c) left and d) right sections.
From the above, it can be concluded that dispersion of the crystals in the epoxy matrix of the
ITOF sensor coating is certainly an issue that needs to be overcome in order to have a sensor
with consistent responses. The use of TL crystals with density values close to that of the matrix
will help to reduce the settling effect problem. The fabrication process has to be improved to
enable more uniform coating and TL crystal dispersion. This is subject to future work.
Consequently, the model could not be validated.
5.4 Summary
An attempt was made to develop two models based on the elastic energy transferred onto an
ITOF sensor under impact loading. The models aim at predicting the triboluminescent signal at a
given impact energy as a function of key sensor design parameters namely the sensor diameter
a) b)
c) d)
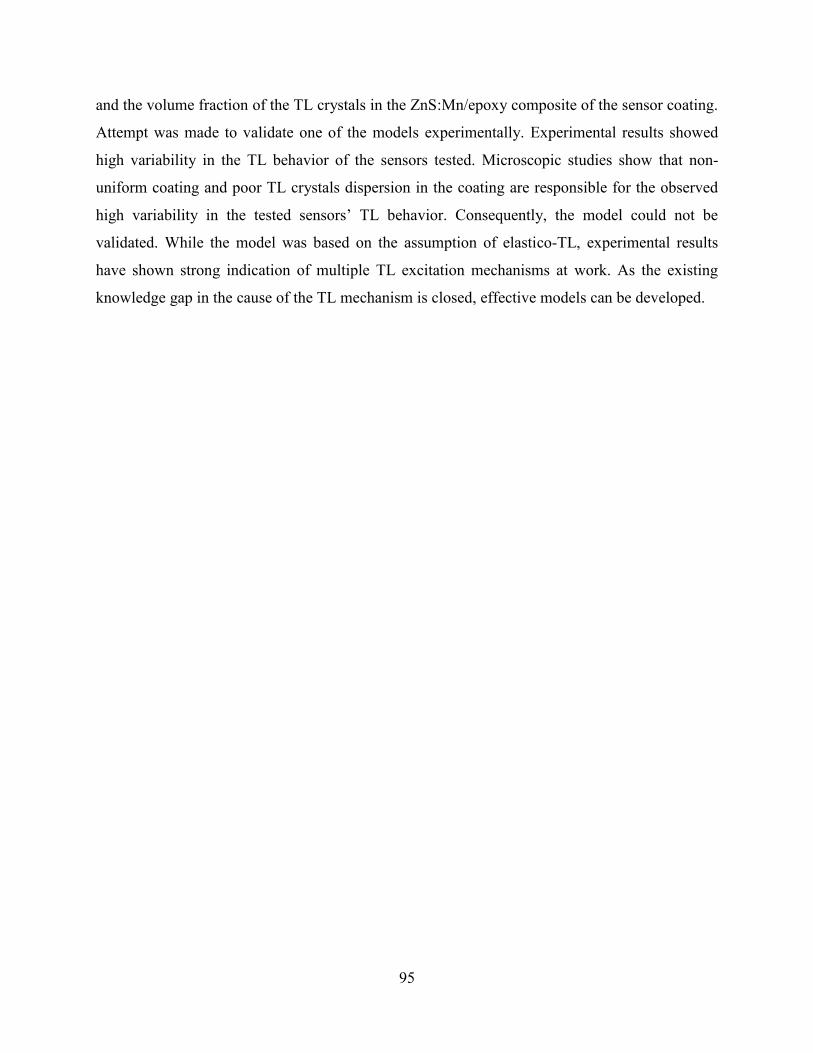
95
and the volume fraction of the TL crystals in the ZnS:Mn/epoxy composite of the sensor coating.
Attempt was made to validate one of the models experimentally. Experimental results showed
high variability in the TL behavior of the sensors tested. Microscopic studies show that non-
uniform coating and poor TL crystals dispersion in the coating are responsible for the observed
high variability in the tested sensors’ TL behavior. Consequently, the model could not be
validated. While the model was based on the assumption of elastico-TL, experimental results
have shown strong indication of multiple TL excitation mechanisms at work. As the existing
knowledge gap in the cause of the TL mechanism is closed, effective models can be developed.

96
CHAPTER SIX
CHARACTERIZATION OF THE DAMAGE MONITORING
BEHAVIOR OF THE ITOF SENSOR
Before the ITOF sensor can be effectively used in composite systems as an in-situ damage
monitoring sensor system, its triboluminescent behavior under critical loading conditions has to
be understood. To do this, the TL behavior of the ITOF sensor under flexural loading was
investigated by subjecting it to 3 point bend tests (PBTs). The tests provided insights into the
behavior of the sensor when integrated into structural components subjected to flexural loads
such as the girders of a bridge. The fracture surfaces of the sensors after the flexural tests were
studied to gain insight into the TL excitation mechanism. Raman spectroscopy was used to
characterize the properties of the TL crystals (ZnS:Mn) before and after being incorporated into
the ITOF coating. Dynamic mechanical analysis was used to characterize the stress-strain
behavior of the sensor with high precision.
6.1 Materials and Methods
This section describes the materials, fabrication and experimental setup employed in
characterizing the damage monitoring behavior of the ITOF sensor.
6.1.1 Sensor Fabrication
ITOF sensors with rectangular cross-section with dimensions of 3 x 3 x 50mm were fabricated
for the flexural test and characterization. The width and thickness were chosen to be close to the
radius of the cylindrical ITOFs. A waterjet cutting machine (Omax, Inc) was used to cut
aluminum plate of 3.28mm thickness into bars of dimensions 3.28 x 3.28 x 50mm. Eight of these
bars were glued to the base of a prepared topless rectangular box made of plexiglass (Figure 6.1)
with an epoxy adhesive. After the curing of the adhesive, release agent was applied on the
aluminum bars and the internal surfaces of the plexiglass box. After drying, appropriate
quantities of silicone and hardener (Poly 75-75) were measured and manually mixed with a
wooden stirrer for about 10 minutes according to the directions from the manufacturer (Polytek
Development Corp.). The mixture was poured into the prepared mold and allowed to cure for 24
hours before demolding. Slits were cut in the mold to allow for easy fiber placement.
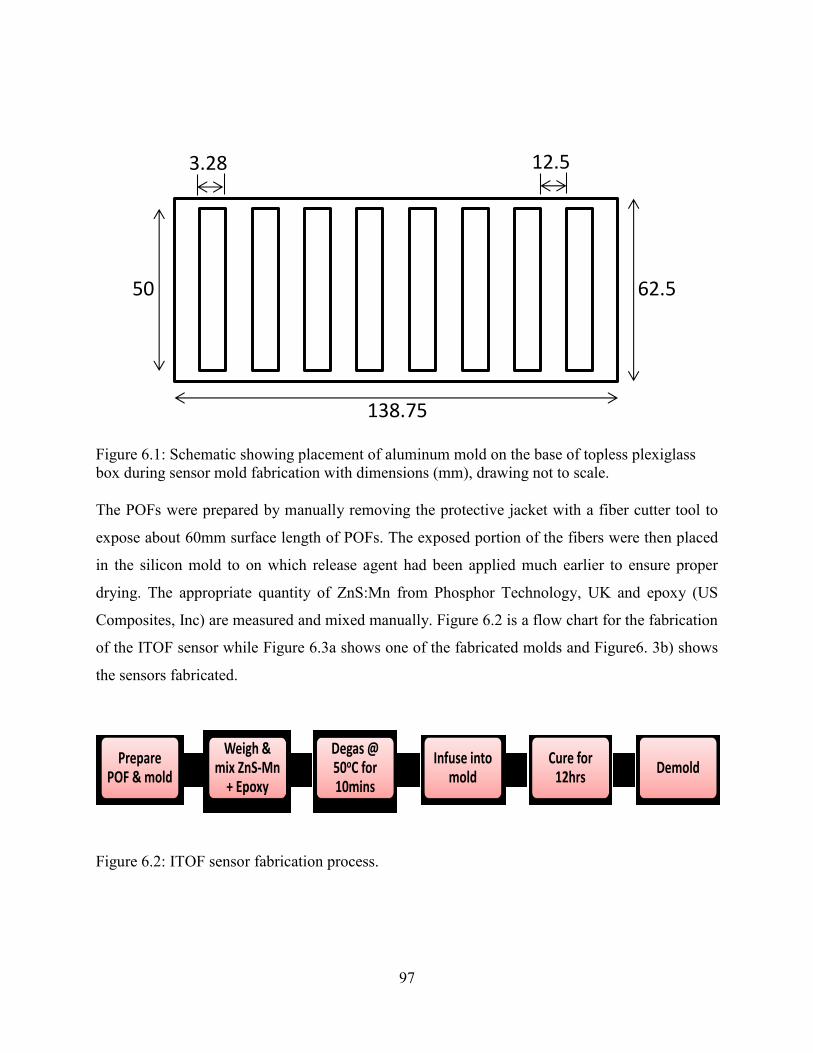
97
Figure 6.1: Schematic showing placement of aluminum mold on the base of topless plexiglass box during sensor mold fabrication with dimensions (mm), drawing not to scale.
The POFs were prepared by manually removing the protective jacket with a fiber cutter tool to
expose about 60mm surface length of POFs. The exposed portion of the fibers were then placed
in the silicon mold to on which release agent had been applied much earlier to ensure proper
drying. The appropriate quantity of ZnS:Mn from Phosphor Technology, UK and epoxy (US
Composites, Inc) are measured and mixed manually. Figure 6.2 is a flow chart for the fabrication
of the ITOF sensor while Figure 6.3a shows one of the fabricated molds and Figure6. 3b) shows
the sensors fabricated.
Figure 6.2: ITOF sensor fabrication process.
62.5
138.75
50
12.53.28
Prepare POF & mold
Weigh & mix ZnS-Mn
+ Epoxy
Degas @ 50oC for 10mins
Infuse into mold
Cure for 12hrs
Demold

98
Figure 6.3: a) Silicon mold for fabrication of rectangular cross-section senors, b) fabricated ITOF sensors with and without POF.
6.1.2 Flexural Test
A Shimadzu micro-tensile testing machine (Figure 6.4) with 5KN capacity was used to apply
flexural load on the sensors. Two loading rates (1mm/min and 10mm/min) were investigated.
The TL signals generated during loading was detected with a photomultiplier tube (PMT)
supplied by Hamamatsu, Japan. Both ends of POF from the sensor were connected to the PMT to
ensure that no signal was lost. The ends were carefully polished with a grade 1200 sandpaper
before connecting to the PMT. The PMT was powered with an Agilent E360A triple output DC
power supply at 0.5V. A custom-written program based on Matlab was used to control the
operation of the PMT and to display the TL response values and profiles through a National
instrument NI-USB-6210 data acquisition device.
a) b)
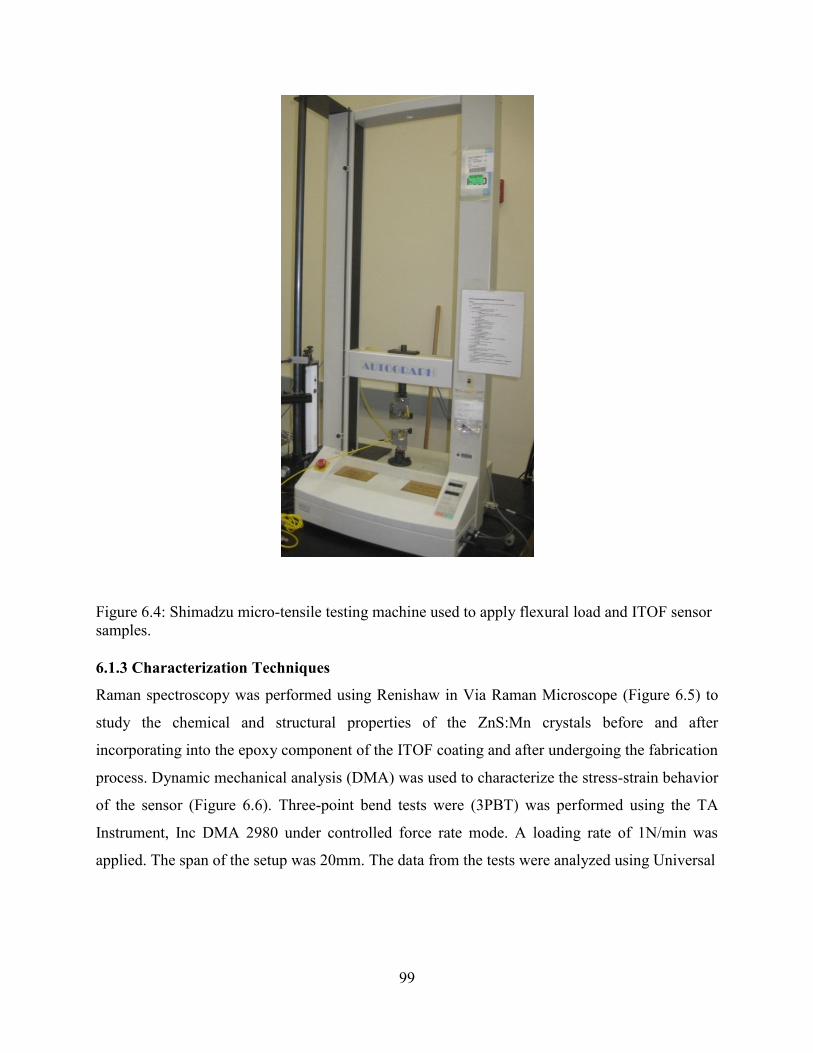
99
Figure 6.4: Shimadzu micro-tensile testing machine used to apply flexural load and ITOF sensor samples.
6.1.3 Characterization Techniques
Raman spectroscopy was performed using Renishaw in Via Raman Microscope (Figure 6.5) to
study the chemical and structural properties of the ZnS:Mn crystals before and after
incorporating into the epoxy component of the ITOF coating and after undergoing the fabrication
process. Dynamic mechanical analysis (DMA) was used to characterize the stress-strain behavior
of the sensor (Figure 6.6). Three-point bend tests were (3PBT) was performed using the TA
Instrument, Inc DMA 2980 under controlled force rate mode. A loading rate of 1N/min was
applied. The span of the setup was 20mm. The data from the tests were analyzed using Universal

100
Figure 6.5: Renishaw in Via Raman Microscope for Raman spectroscopy analysis.
Figure 6.6: a) Stress-strain characterization with TA Inc DMA 2890, b) furnace exposed with sensor loaded onto the clamp.
Analysis 2000. Morphological study was conducted using Field Emission Scanning Electron
Microscope (JEOL JSM-7401F) to have details about the ZnS:Mn crystals dispersion in the
epoxy matrix and to understand the interface between the POF and the ITOF coating (Figure
6.7). All the samples were coated with gold particles before viewing under the FESEM.
a)
b)
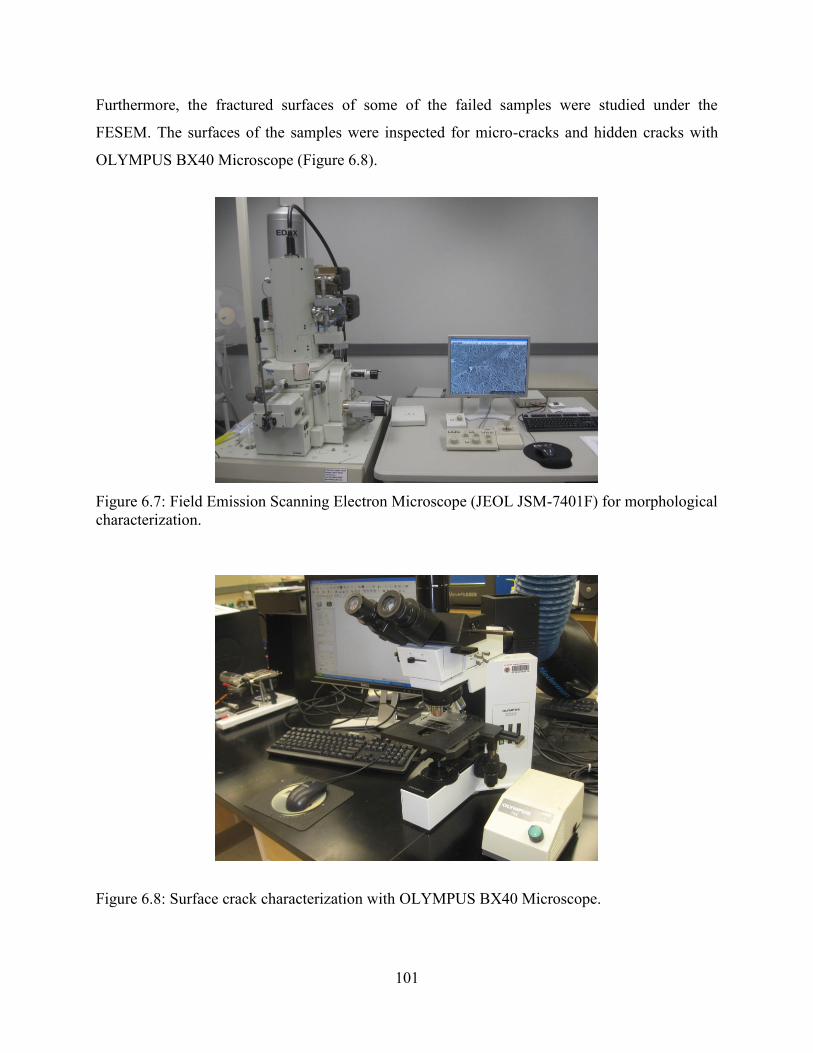
101
Furthermore, the fractured surfaces of some of the failed samples were studied under the
FESEM. The surfaces of the samples were inspected for micro-cracks and hidden cracks with
OLYMPUS BX40 Microscope (Figure 6.8).
Figure 6.7: Field Emission Scanning Electron Microscope (JEOL JSM-7401F) for morphological characterization.
Figure 6.8: Surface crack characterization with OLYMPUS BX40 Microscope.
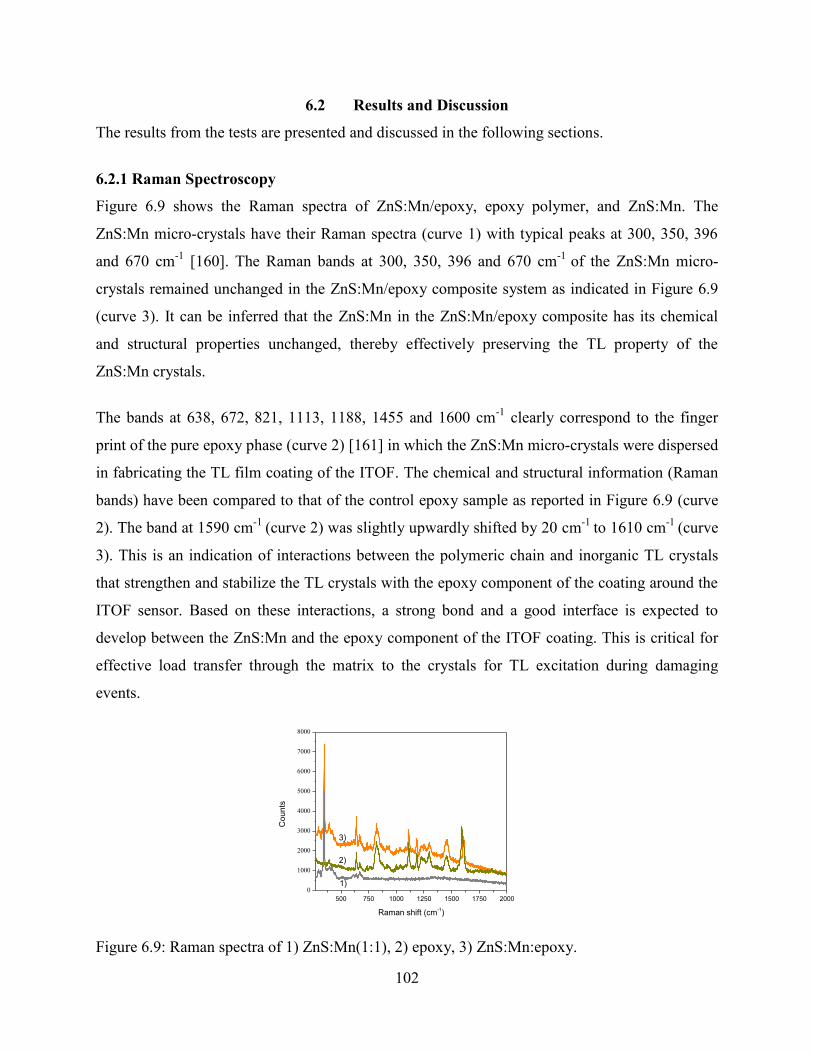
102
6.2 Results and Discussion
The results from the tests are presented and discussed in the following sections.
6.2.1 Raman Spectroscopy
Figure 6.9 shows the Raman spectra of ZnS:Mn/epoxy, epoxy polymer, and ZnS:Mn. The
ZnS:Mn micro-crystals have their Raman spectra (curve 1) with typical peaks at 300, 350, 396
and 670 cm-1 [160]. The Raman bands at 300, 350, 396 and 670 cm-1 of the ZnS:Mn micro-
crystals remained unchanged in the ZnS:Mn/epoxy composite system as indicated in Figure 6.9
(curve 3). It can be inferred that the ZnS:Mn in the ZnS:Mn/epoxy composite has its chemical
and structural properties unchanged, thereby effectively preserving the TL property of the
ZnS:Mn crystals.
The bands at 638, 672, 821, 1113, 1188, 1455 and 1600 cm-1 clearly correspond to the finger
print of the pure epoxy phase (curve 2) [161] in which the ZnS:Mn micro-crystals were dispersed
in fabricating the TL film coating of the ITOF. The chemical and structural information (Raman
bands) have been compared to that of the control epoxy sample as reported in Figure 6.9 (curve
2). The band at 1590 cm-1 (curve 2) was slightly upwardly shifted by 20 cm-1 to 1610 cm-1 (curve
3). This is an indication of interactions between the polymeric chain and inorganic TL crystals
that strengthen and stabilize the TL crystals with the epoxy component of the coating around the
ITOF sensor. Based on these interactions, a strong bond and a good interface is expected to
develop between the ZnS:Mn and the epoxy component of the ITOF coating. This is critical for
effective load transfer through the matrix to the crystals for TL excitation during damaging
events.
500 750 1000 1250 1500 1750 2000
0
1000
2000
3000
4000
5000
6000
7000
8000
Counts
Raman shift (cm-1)
3)
2)
1)
Figure 6.9: Raman spectra of 1) ZnS:Mn(1:1), 2) epoxy, 3) ZnS:Mn:epoxy.

103
6.2.2 Stress-strain Characterization with DMA
Table 6.1 summarizes the data from the stress-strain characterization of the ITOF sensor (50:50
wt percent) with DMA. Two types of samples were fabricated, a set of four without the POF
incorporated and another set of four samples with the POF present.
Table 6.1: Result of stress-strain characterization with DMA.
Sample Modulus
(GPa)
Strain (%) Stress at observed
strain (MPa)
Size w X t
(mm)
Rect ITOF 50-50 ZnSMn-
Epoxy_No POF-001
2.805 0.75 20.65
Rect ITOF 50-50 ZnSMn-
Epoxy_No POF-002
2.992 0.76 22.59 3.48, 2.62
Rect ITOF 50-50 ZnSMn-
Epoxy_No POF-003
3.324 0.63 20.67 3.25, 2.92
Rect ITOF 50-50 ZnSMn-
Epoxy_No POF-005
3.580 0.71 20.65 3.25, 2.83
Rect ITOF 50-50 ZnSMn-
Epoxy_No POF-006 (with
POF1)
4.383 0.65 20.71 3.25, 2.83
Rect ITOF 50-50 ZnSMn-
Epoxy_No POF-007 (with
POF2)
2.701 0.79 20.71 3.25, 2.83
Rect ITOF 50-50 ZnSMn-
Epoxy_No POF-008 (with
POF3)
3.995 0.57 20.70 3.25, 2.83
Rect ITOF 50-50 ZnSMn-
Epoxy_No POF-010 (with
POF4)
2.507 0.85 20.63 3.25, 2.83
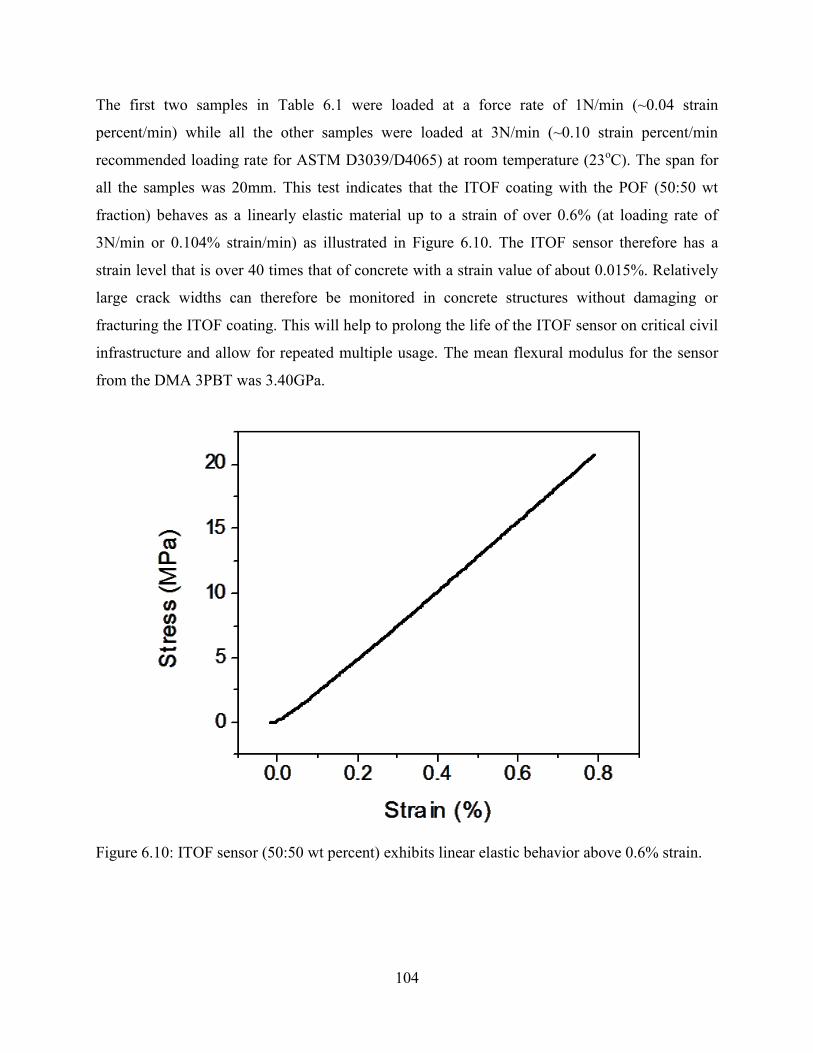
104
The first two samples in Table 6.1 were loaded at a force rate of 1N/min (~0.04 strain
percent/min) while all the other samples were loaded at 3N/min (~0.10 strain percent/min
recommended loading rate for ASTM D3039/D4065) at room temperature (23oC). The span for
all the samples was 20mm. This test indicates that the ITOF coating with the POF (50:50 wt
fraction) behaves as a linearly elastic material up to a strain of over 0.6% (at loading rate of
3N/min or 0.104% strain/min) as illustrated in Figure 6.10. The ITOF sensor therefore has a
strain level that is over 40 times that of concrete with a strain value of about 0.015%. Relatively
large crack widths can therefore be monitored in concrete structures without damaging or
fracturing the ITOF coating. This will help to prolong the life of the ITOF sensor on critical civil
infrastructure and allow for repeated multiple usage. The mean flexural modulus for the sensor
from the DMA 3PBT was 3.40GPa.
Figure 6.10: ITOF sensor (50:50 wt percent) exhibits linear elastic behavior above 0.6% strain.
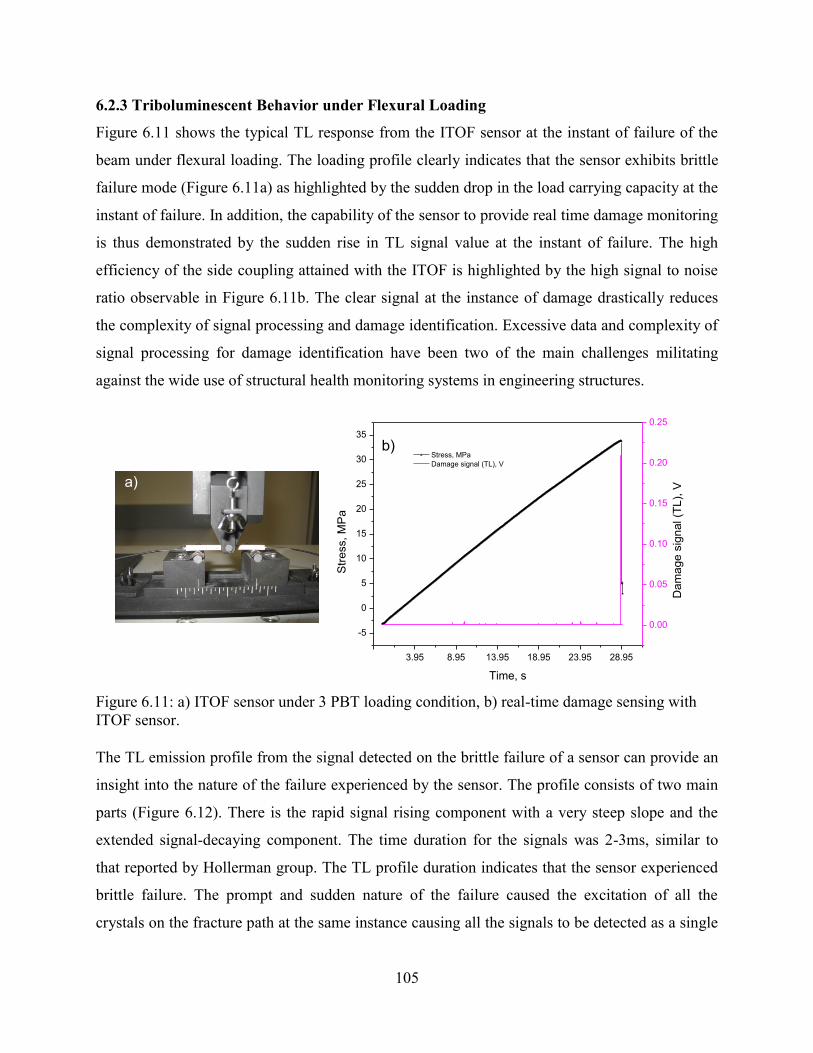
105
6.2.3 Triboluminescent Behavior under Flexural Loading
Figure 6.11 shows the typical TL response from the ITOF sensor at the instant of failure of the
beam under flexural loading. The loading profile clearly indicates that the sensor exhibits brittle
failure mode (Figure 6.11a) as highlighted by the sudden drop in the load carrying capacity at the
instant of failure. In addition, the capability of the sensor to provide real time damage monitoring
is thus demonstrated by the sudden rise in TL signal value at the instant of failure. The high
efficiency of the side coupling attained with the ITOF is highlighted by the high signal to noise
ratio observable in Figure 6.11b. The clear signal at the instance of damage drastically reduces
the complexity of signal processing and damage identification. Excessive data and complexity of
signal processing for damage identification have been two of the main challenges militating
against the wide use of structural health monitoring systems in engineering structures.
Figure 6.11: a) ITOF sensor under 3 PBT loading condition, b) real-time damage sensing with ITOF sensor.
The TL emission profile from the signal detected on the brittle failure of a sensor can provide an
insight into the nature of the failure experienced by the sensor. The profile consists of two main
parts (Figure 6.12). There is the rapid signal rising component with a very steep slope and the
extended signal-decaying component. The time duration for the signals was 2-3ms, similar to
that reported by Hollerman group. The TL profile duration indicates that the sensor experienced
brittle failure. The prompt and sudden nature of the failure caused the excitation of all the
crystals on the fracture path at the same instance causing all the signals to be detected as a single
3.95 8.95 13.95 18.95 23.95 28.95
-5
0
5
10
15
20
25
30
35
Stress, MPa
Damage signal (TL), V
Time, s
Str
ess, M
Pa
0.00
0.05
0.10
0.15
0.20
0.25
Dam
age s
ignal (T
L),
V
a)
b)
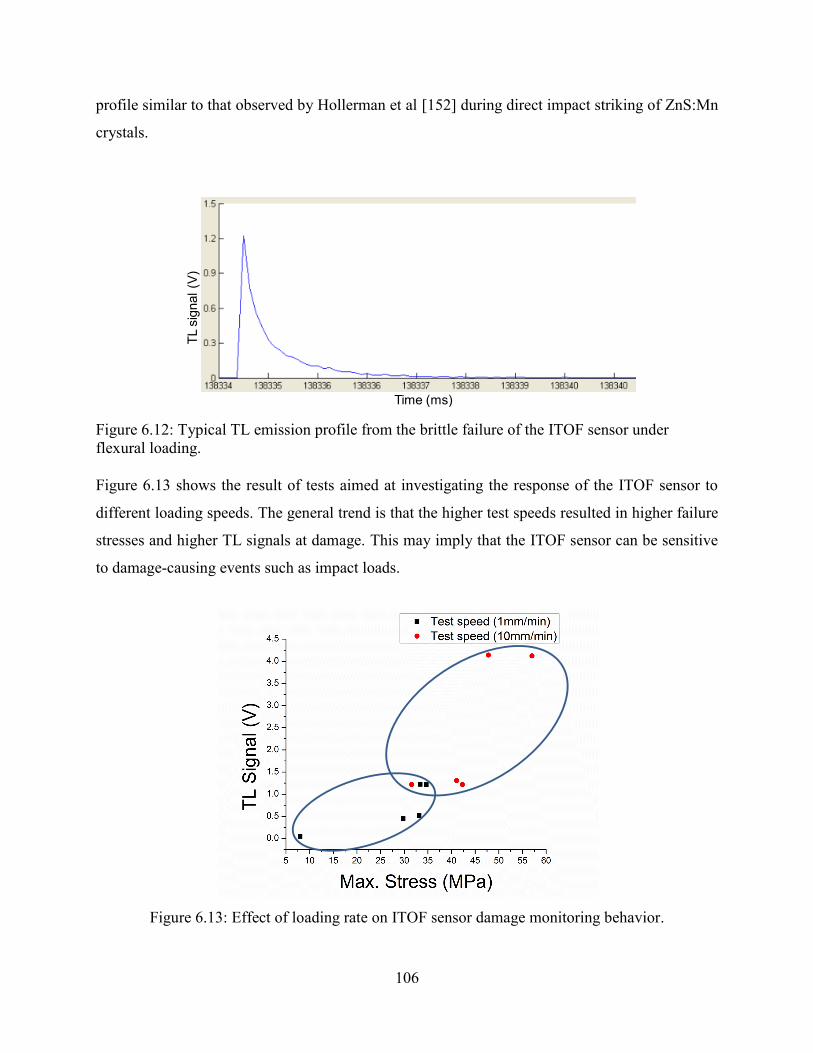
106
profile similar to that observed by Hollerman et al [152] during direct impact striking of ZnS:Mn
crystals.
Figure 6.12: Typical TL emission profile from the brittle failure of the ITOF sensor under flexural loading.
Figure 6.13 shows the result of tests aimed at investigating the response of the ITOF sensor to
different loading speeds. The general trend is that the higher test speeds resulted in higher failure
stresses and higher TL signals at damage. This may imply that the ITOF sensor can be sensitive
to damage-causing events such as impact loads.
Figure 6.13: Effect of loading rate on ITOF sensor damage monitoring behavior.
TL s
ignal (V
)
Time (ms)

107
In addition, a comparative study was carried out to evaluate the possibility of increasing the TL
damage sensing performance of the ITOF sensor by increasing the weight percent of the ZnS:Mn
in the sensor coating from 50 to 60%. Ten samples were tested under 3PBT loading condition at
a loading rate of 1mm/min. Figure 6.14 shows that both sensor systems exhibited an increase in
the TL signal peak value with increase in the failure stress. The 50:50 weight percent ITOF
sensors exhibited higher TL signals (higher signal-to-noise ratio) than the 60:40 weight percent
ITOF sensors. Although the 60:40 weight percent ITOF sensors have a higher quantity of
ZnS:Mn crystals that should result in higher TL signals being generated at fracture, fabrication
limitations adversely affected its TL sensing capability.
There tended to be insufficient quantity of epoxy in the ZnS:Mn/epoxy mixture because of the
high ZnS:Mn content. The resulting highly viscous mixture made the effective coating of the
POF by infusion in the molds very difficult. All these resulted in the fabrication of 60:40 ITOF
sensors with many fabrication defects such as voids and poor interfaces as will be shown with
surface cracks characterization (Section 6.2.4) and morphological characterization with the
FESEM (Section 6.2.5). This is believed to be responsible for the lower TL outputs compared to
the 50:50 ITOF sensors. This argument is supported by the fact that the fifth sample tested for
the 60:40 sensors had a very high TL response well above 2.5V.
Figure 6.14: TL sensing performance of two ITOF sensor systems by weight percent.
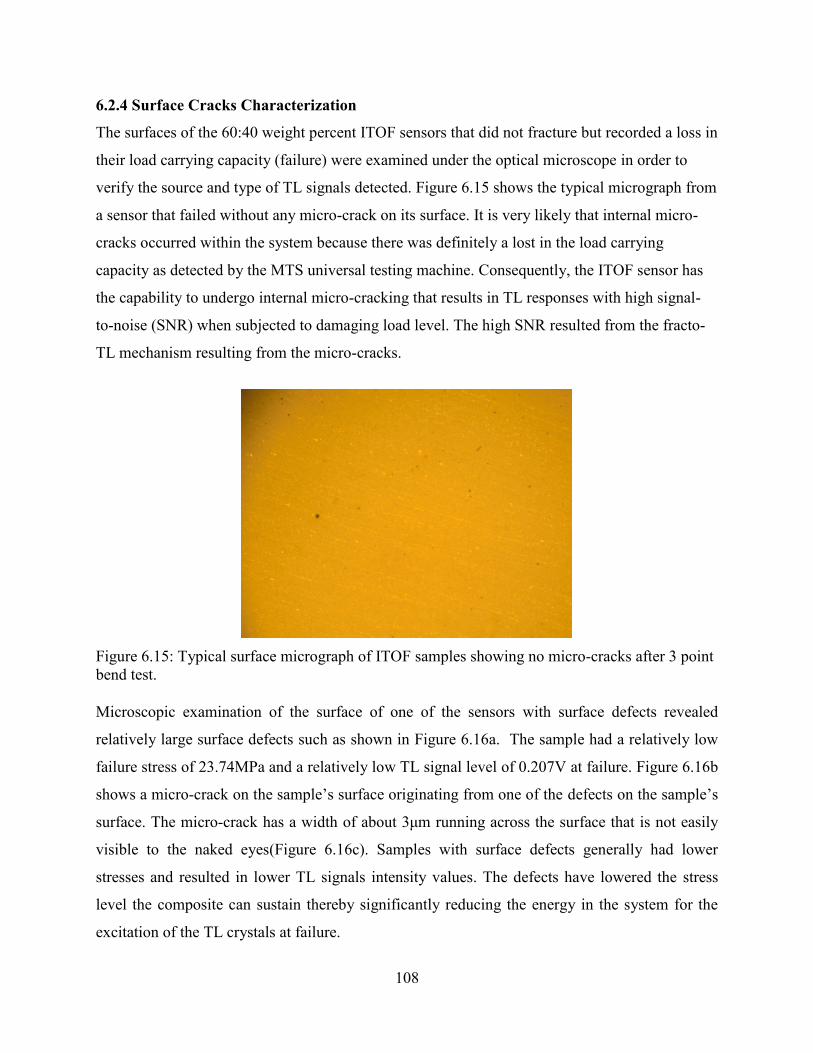
108
6.2.4 Surface Cracks Characterization
The surfaces of the 60:40 weight percent ITOF sensors that did not fracture but recorded a loss in
their load carrying capacity (failure) were examined under the optical microscope in order to
verify the source and type of TL signals detected. Figure 6.15 shows the typical micrograph from
a sensor that failed without any micro-crack on its surface. It is very likely that internal micro-
cracks occurred within the system because there was definitely a lost in the load carrying
capacity as detected by the MTS universal testing machine. Consequently, the ITOF sensor has
the capability to undergo internal micro-cracking that results in TL responses with high signal-
to-noise (SNR) when subjected to damaging load level. The high SNR resulted from the fracto-
TL mechanism resulting from the micro-cracks.
Figure 6.15: Typical surface micrograph of ITOF samples showing no micro-cracks after 3 point bend test.
Microscopic examination of the surface of one of the sensors with surface defects revealed
relatively large surface defects such as shown in Figure 6.16a. The sample had a relatively low
failure stress of 23.74MPa and a relatively low TL signal level of 0.207V at failure. Figure 6.16b
shows a micro-crack on the sample’s surface originating from one of the defects on the sample’s
surface. The micro-crack has a width of about 3 m running across the surface that is not easily
visible to the naked eyes(Figure 6.16c). Samples with surface defects generally had lower
stresses and resulted in lower TL signals intensity values. The defects have lowered the stress
level the composite can sustain thereby significantly reducing the energy in the system for the
excitation of the TL crystals at failure.
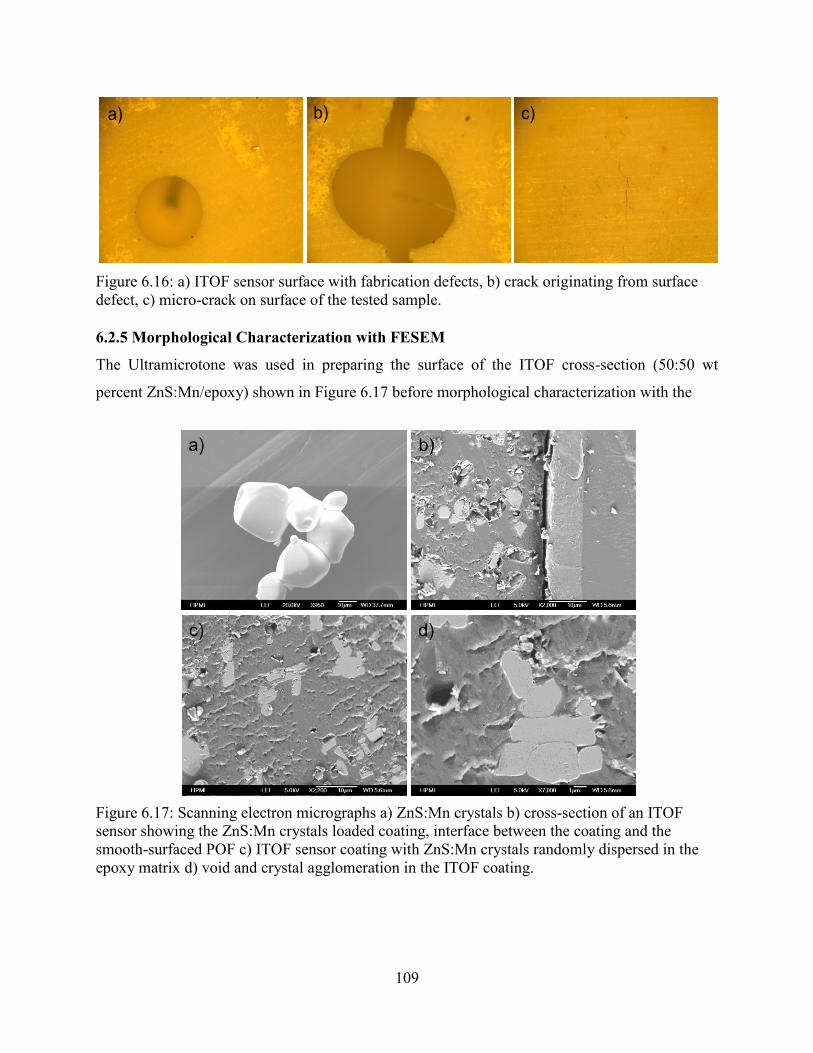
109
Figure 6.16: a) ITOF sensor surface with fabrication defects, b) crack originating from surface defect, c) micro-crack on surface of the tested sample.
6.2.5 Morphological Characterization with FESEM
The Ultramicrotone was used in preparing the surface of the ITOF cross-section (50:50 wt
percent ZnS:Mn/epoxy) shown in Figure 6.17 before morphological characterization with the
Figure 6.17: Scanning electron micrographs a) ZnS:Mn crystals b) cross-section of an ITOF sensor showing the ZnS:Mn crystals loaded coating, interface between the coating and the smooth-surfaced POF c) ITOF sensor coating with ZnS:Mn crystals randomly dispersed in the epoxy matrix d) void and crystal agglomeration in the ITOF coating.
a) b) c)
a) b)
c) d)
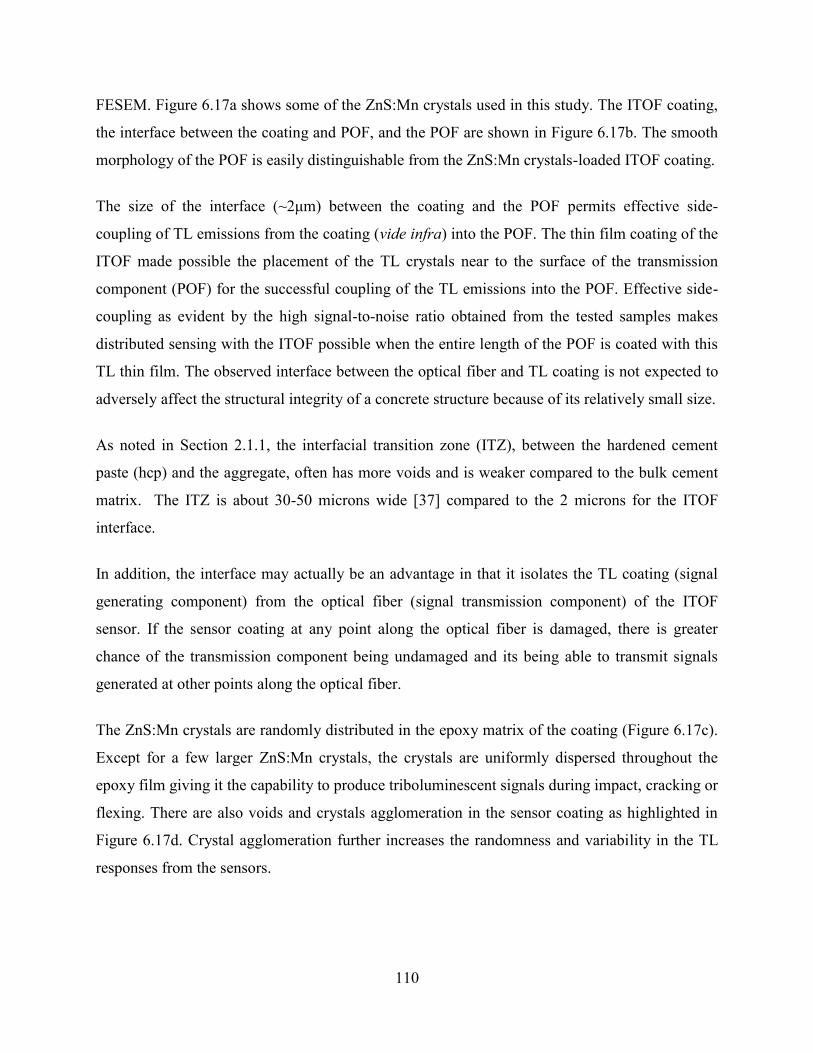
110
FESEM. Figure 6.17a shows some of the ZnS:Mn crystals used in this study. The ITOF coating,
the interface between the coating and POF, and the POF are shown in Figure 6.17b. The smooth
morphology of the POF is easily distinguishable from the ZnS:Mn crystals-loaded ITOF coating.
The size of the interface (~β m) between the coating and the POF permits effective side-
coupling of TL emissions from the coating (vide infra) into the POF. The thin film coating of the
ITOF made possible the placement of the TL crystals near to the surface of the transmission
component (POF) for the successful coupling of the TL emissions into the POF. Effective side-
coupling as evident by the high signal-to-noise ratio obtained from the tested samples makes
distributed sensing with the ITOF possible when the entire length of the POF is coated with this
TL thin film. The observed interface between the optical fiber and TL coating is not expected to
adversely affect the structural integrity of a concrete structure because of its relatively small size.
As noted in Section 2.1.1, the interfacial transition zone (ITZ), between the hardened cement
paste (hcp) and the aggregate, often has more voids and is weaker compared to the bulk cement
matrix. The ITZ is about 30-50 microns wide [37] compared to the 2 microns for the ITOF
interface.
In addition, the interface may actually be an advantage in that it isolates the TL coating (signal
generating component) from the optical fiber (signal transmission component) of the ITOF
sensor. If the sensor coating at any point along the optical fiber is damaged, there is greater
chance of the transmission component being undamaged and its being able to transmit signals
generated at other points along the optical fiber.
The ZnS:Mn crystals are randomly distributed in the epoxy matrix of the coating (Figure 6.17c).
Except for a few larger ZnS:Mn crystals, the crystals are uniformly dispersed throughout the
epoxy film giving it the capability to produce triboluminescent signals during impact, cracking or
flexing. There are also voids and crystals agglomeration in the sensor coating as highlighted in
Figure 6.17d. Crystal agglomeration further increases the randomness and variability in the TL
responses from the sensors.

111
Figure 6.18: FESEM micrograph of fractured surface of ITOF (50:50 wt percent ZnS:Mn/epoxy) cross-section a) virtually all crystals in the fractured plane were fractured b) ZnS:Mn crystals with fractured surface showing fracture lines.
The fractured surfaces of the tested ITOF sensors (50:50 wt percent ZnS:Mn/epoxy) were also
characterized using the FESEM. It can be seen that virtually all the crystals in the fractured plane
were fractured as the crack propagated through them (Figure 6.18a). The fracture lines on the
surfaces of the crystals can be clearly seen in Fig. 18b. This is an indication that a strong
bond/interface exists between the ZnS:Mn crystals and the epoxy matrix. This allows effective
load transfer on to the crystals to fracture them as the crack propagates through the epoxy matrix
of the coating. The size of the interface is about 0.1 m. The fracturing of the crystals is also an
indication that the dominant TL mechanism at work during the testing of these samples was
fracto-triboluminescence.
Figure 6.19 shows the FESEM micrographs of the 60:40 (wt percent) ZnS:Mn/epoxy ITOF
sensor coating. Compared to the micrographs of the 50:50 (wt percent) ZnS:Mn/epoxy ITOF
(Figure 6.18), a weaker interface exists between the ZnS:Mn crystals and the epoxy matrix. The
interface is about 0.5 m (Figure 6.1λb) compared to about 0.1 m in the 50μ50 (wt percent)
ZnS:Mn/epoxy ITOF system. There are also more evidences of crystal pullouts (Figures 6.19a
and 6.19b) as indicated by the many empty grooves on the fractured surface. Furthermore, the
weak interface must have been responsible for the relatively low TL signal intensity values
recorded in Figure 6.14.
a) b)

112
Figure 6.19: FESEM micrographs of a) fractured surface of the 60:40 (wt percent) ZnS:Mn/epoxy ITOF sensor coating, b) close-up view showing grooves and many crystals not fractured because of weak interface in the composite system.
The weak interface resulted in ineffective load transfer on to the crystals resulting in significant
reduction in the number of fractured crystals (Figure 6.19b) when compared to the 50:50 (wt
percent) ZnS:Mn/epoxy ITOF system (Figure 6.18).
6.3 Conclusion
The TL behavior of two different types of ITOF sensor configurations namely the 50:50 and the
60:40 (wt percent) ZnS:Mn/epoxy systems under 3PBT loading have been studied.
Characterization techniques such as Raman spectroscopy and Field emission scanning electron
microscopy were used to further gain insights into the sensors’ behavior and properties. It has
been shown that the ITOF is able to generate TL signals without the total fracturing of the
coating. Development of internal micro-cracks is believed to be responsible for this because
there was a loss in the load-carrying capacity of the tested sensors at failure. The sensor is also
able to distinguish the nature of damage-causing event. It generated higher TL signal values with
increase in the testing (load application rate) speed.
Furthermore, fabrication defects such as surface and hidden voids adversely affect the sensor’s
performance. In addition, processing limitations discourage the use of ITOF sensors with higher
ZnS:Mn wt ratio that exceed 50%. FESEM characterization indicates a stronger interface
between the crystals and the polymer matrix in the 50:50 (wt percent) than in the 60:40 (wt
a) b)

113
percent) ZnS:Mn/epoxy systems. The stronger interface promotes effective load transfer
resulting in higher TL signals. Hence, this study shows that the 50:50 (wt percent)
ZnS:Mn/epoxy system is the preferred one for an ITOF sensor system. Finally, the TL property
of the ZnS:Mn crystals were preserved in the ZnS:Mn/epoxy composite coating of the ITOF as
indicated by the Raman characterization.
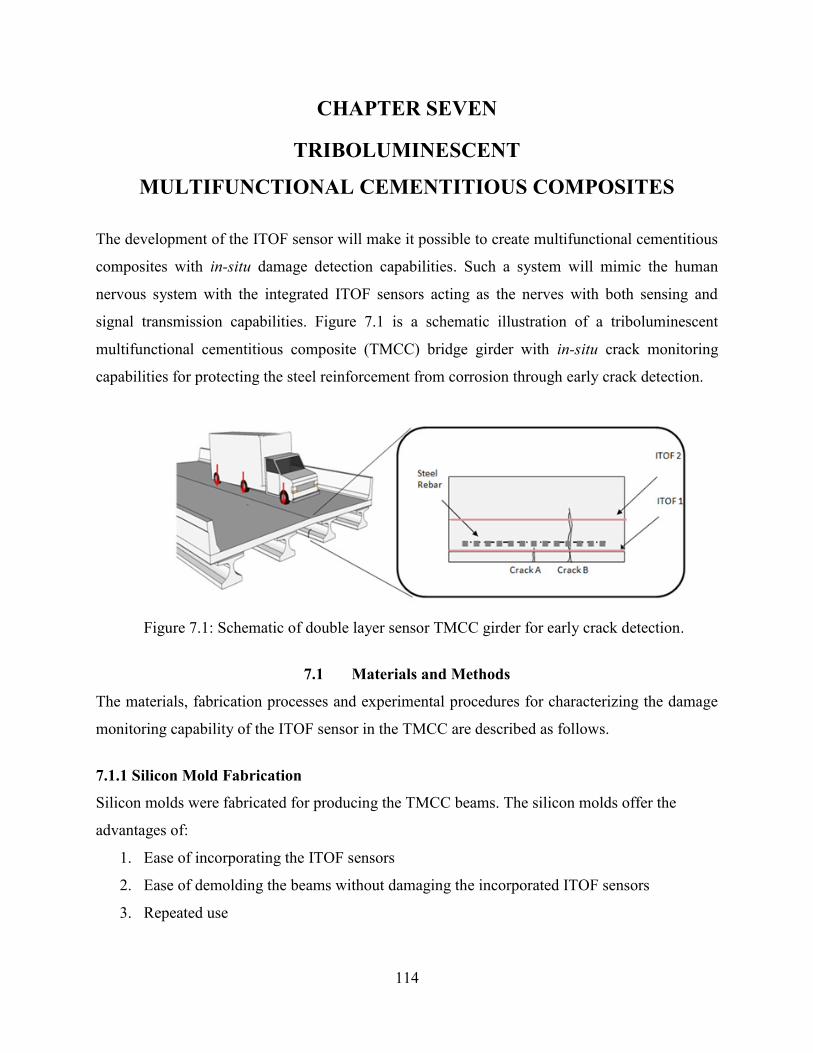
114
CHAPTER SEVEN
TRIBOLUMINESCENT
MULTIFUNCTIONAL CEMENTITIOUS COMPOSITES
The development of the ITOF sensor will make it possible to create multifunctional cementitious
composites with in-situ damage detection capabilities. Such a system will mimic the human
nervous system with the integrated ITOF sensors acting as the nerves with both sensing and
signal transmission capabilities. Figure 7.1 is a schematic illustration of a triboluminescent
multifunctional cementitious composite (TMCC) bridge girder with in-situ crack monitoring
capabilities for protecting the steel reinforcement from corrosion through early crack detection.
Figure 7.1: Schematic of double layer sensor TMCC girder for early crack detection.
7.1 Materials and Methods
The materials, fabrication processes and experimental procedures for characterizing the damage
monitoring capability of the ITOF sensor in the TMCC are described as follows.
7.1.1 Silicon Mold Fabrication
Silicon molds were fabricated for producing the TMCC beams. The silicon molds offer the
advantages of:
1. Ease of incorporating the ITOF sensors
2. Ease of demolding the beams without damaging the incorporated ITOF sensors
3. Repeated use
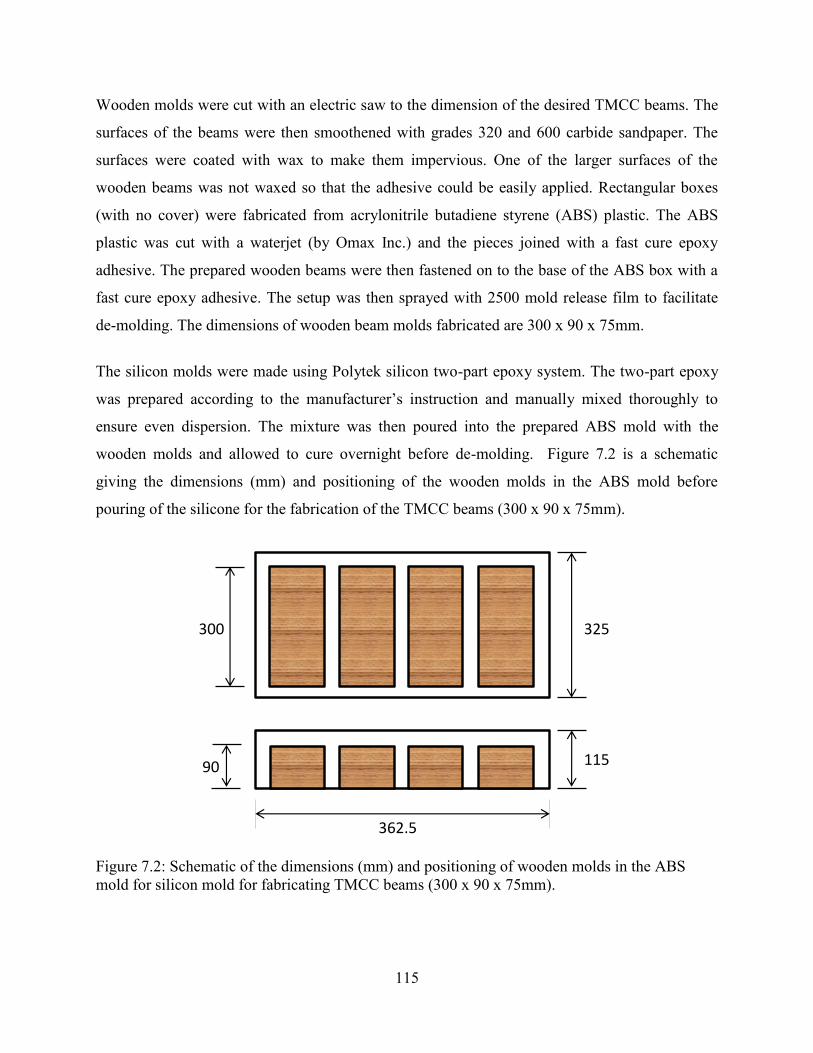
115
Wooden molds were cut with an electric saw to the dimension of the desired TMCC beams. The
surfaces of the beams were then smoothened with grades 320 and 600 carbide sandpaper. The
surfaces were coated with wax to make them impervious. One of the larger surfaces of the
wooden beams was not waxed so that the adhesive could be easily applied. Rectangular boxes
(with no cover) were fabricated from acrylonitrile butadiene styrene (ABS) plastic. The ABS
plastic was cut with a waterjet (by Omax Inc.) and the pieces joined with a fast cure epoxy
adhesive. The prepared wooden beams were then fastened on to the base of the ABS box with a
fast cure epoxy adhesive. The setup was then sprayed with 2500 mold release film to facilitate
de-molding. The dimensions of wooden beam molds fabricated are 300 x 90 x 75mm.
The silicon molds were made using Polytek silicon two-part epoxy system. The two-part epoxy
was prepared according to the manufacturer’s instruction and manually mixed thoroughly to
ensure even dispersion. The mixture was then poured into the prepared ABS mold with the
wooden molds and allowed to cure overnight before de-molding. Figure 7.2 is a schematic
giving the dimensions (mm) and positioning of the wooden molds in the ABS mold before
pouring of the silicone for the fabrication of the TMCC beams (300 x 90 x 75mm).
Figure 7.2: Schematic of the dimensions (mm) and positioning of wooden molds in the ABS mold for silicon mold for fabricating TMCC beams (300 x 90 x 75mm).
325
115
300
362.5
90
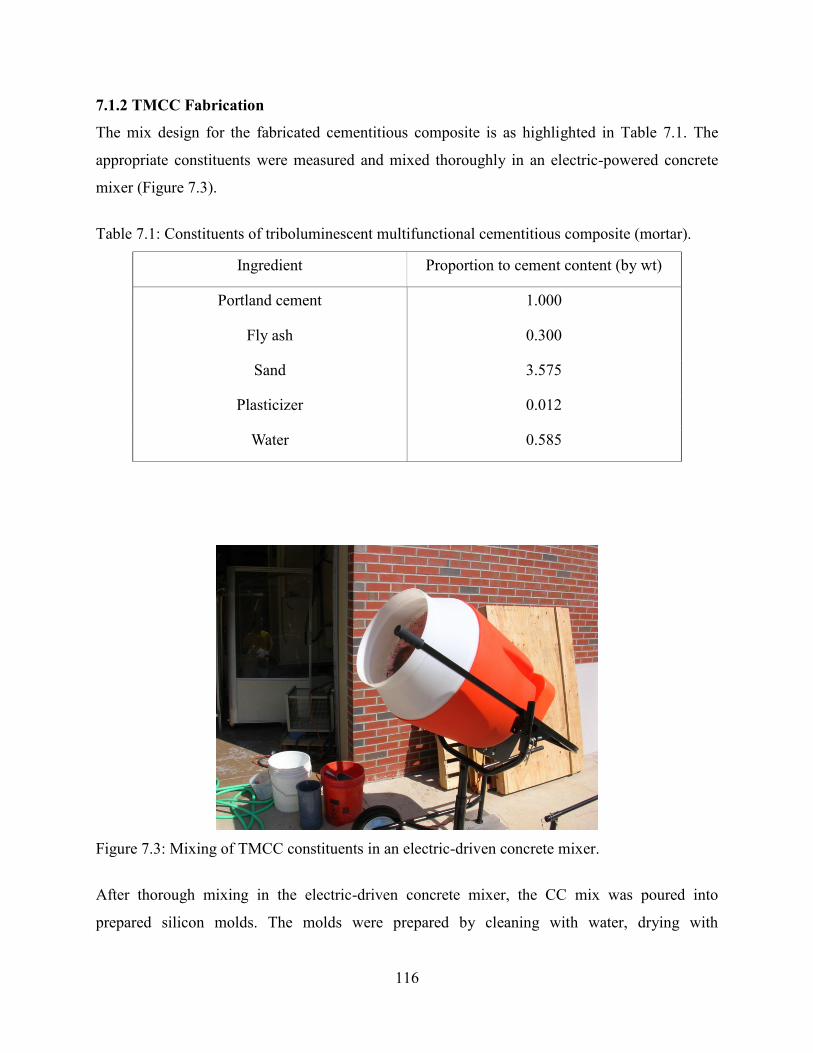
116
7.1.2 TMCC Fabrication
The mix design for the fabricated cementitious composite is as highlighted in Table 7.1. The
appropriate constituents were measured and mixed thoroughly in an electric-powered concrete
mixer (Figure 7.3).
Table 7.1: Constituents of triboluminescent multifunctional cementitious composite (mortar).
Ingredient Proportion to cement content (by wt)
Portland cement 1.000
Fly ash 0.300
Sand 3.575
Plasticizer 0.012
Water 0.585
Figure 7.3: Mixing of TMCC constituents in an electric-driven concrete mixer.
After thorough mixing in the electric-driven concrete mixer, the CC mix was poured into
prepared silicon molds. The molds were prepared by cleaning with water, drying with
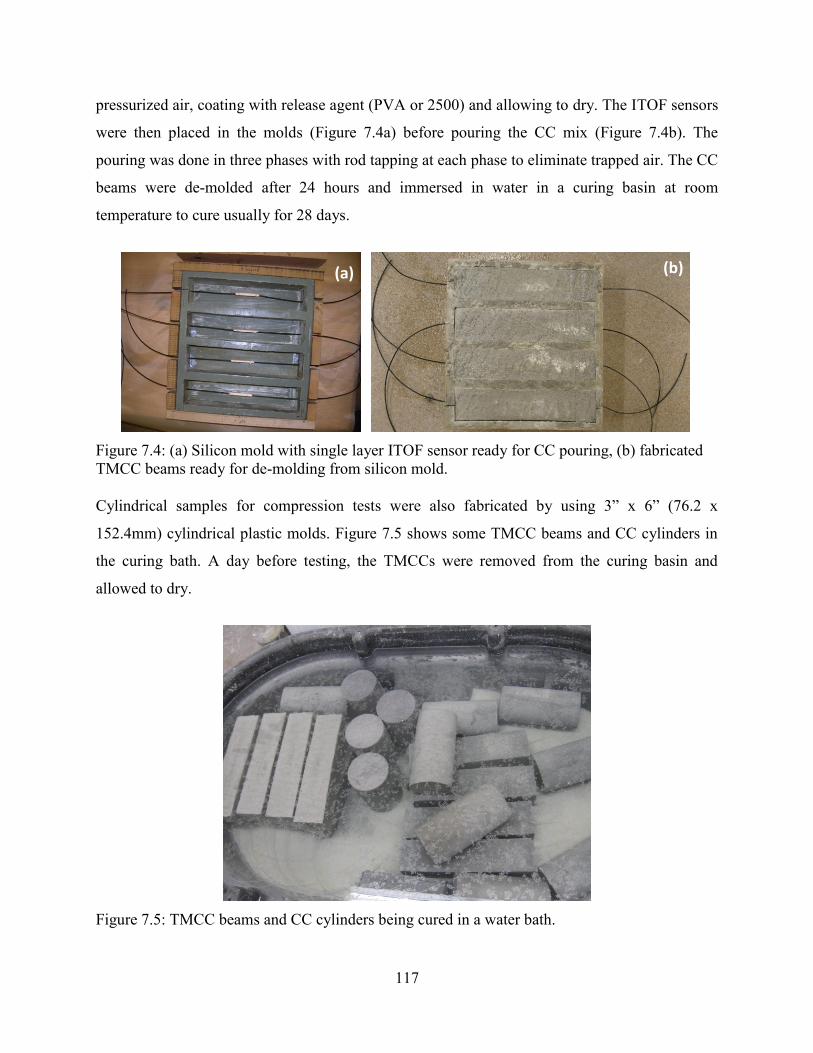
117
pressurized air, coating with release agent (PVA or 2500) and allowing to dry. The ITOF sensors
were then placed in the molds (Figure 7.4a) before pouring the CC mix (Figure 7.4b). The
pouring was done in three phases with rod tapping at each phase to eliminate trapped air. The CC
beams were de-molded after 24 hours and immersed in water in a curing basin at room
temperature to cure usually for 28 days.
Figure 7.4: (a) Silicon mold with single layer ITOF sensor ready for CC pouring, (b) fabricated TMCC beams ready for de-molding from silicon mold.
Cylindrical samples for compression tests were also fabricated by using γ” x 6” (76.β x
152.4mm) cylindrical plastic molds. Figure 7.5 shows some TMCC beams and CC cylinders in
the curing bath. A day before testing, the TMCCs were removed from the curing basin and
allowed to dry.
Figure 7.5: TMCC beams and CC cylinders being cured in a water bath.
(a) (b)
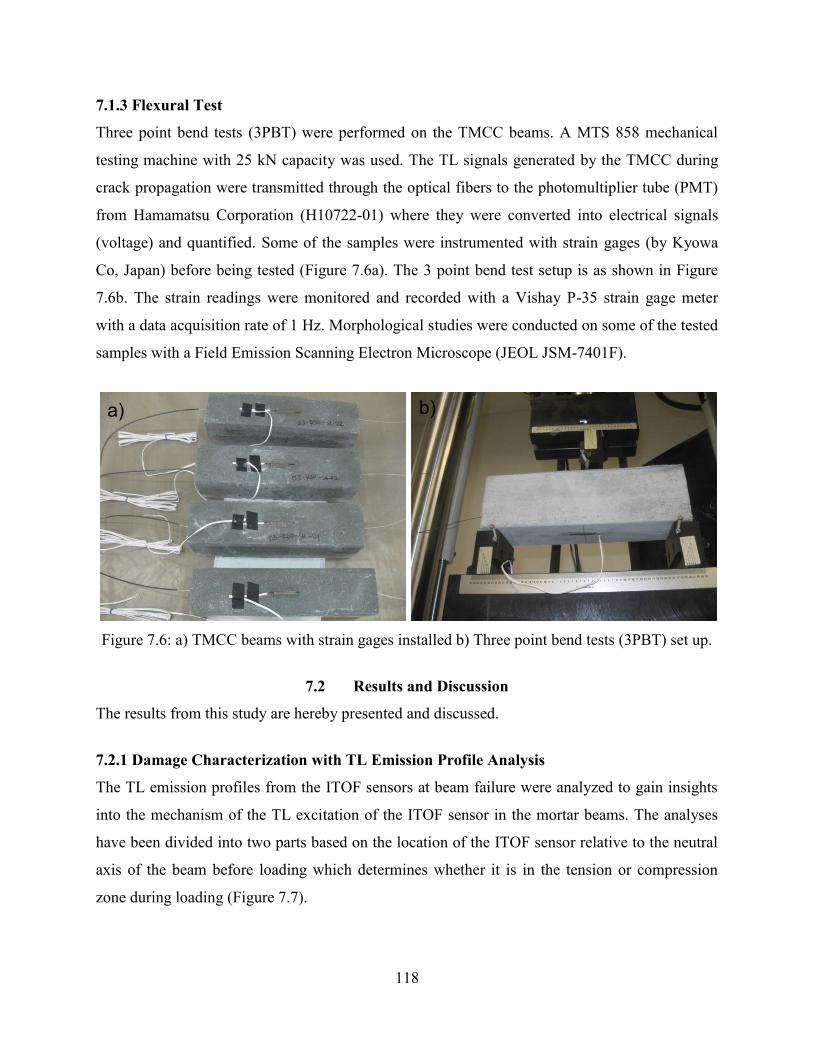
118
7.1.3 Flexural Test
Three point bend tests (3PBT) were performed on the TMCC beams. A MTS 858 mechanical
testing machine with 25 kN capacity was used. The TL signals generated by the TMCC during
crack propagation were transmitted through the optical fibers to the photomultiplier tube (PMT)
from Hamamatsu Corporation (H10722-01) where they were converted into electrical signals
(voltage) and quantified. Some of the samples were instrumented with strain gages (by Kyowa
Co, Japan) before being tested (Figure 7.6a). The 3 point bend test setup is as shown in Figure
7.6b. The strain readings were monitored and recorded with a Vishay P-35 strain gage meter
with a data acquisition rate of 1 Hz. Morphological studies were conducted on some of the tested
samples with a Field Emission Scanning Electron Microscope (JEOL JSM-7401F).
Figure 7.6: a) TMCC beams with strain gages installed b) Three point bend tests (3PBT) set up.
7.2 Results and Discussion
The results from this study are hereby presented and discussed.
7.2.1 Damage Characterization with TL Emission Profile Analysis
The TL emission profiles from the ITOF sensors at beam failure were analyzed to gain insights
into the mechanism of the TL excitation of the ITOF sensor in the mortar beams. The analyses
have been divided into two parts based on the location of the ITOF sensor relative to the neutral
axis of the beam before loading which determines whether it is in the tension or compression
zone during loading (Figure 7.7).
a) b)
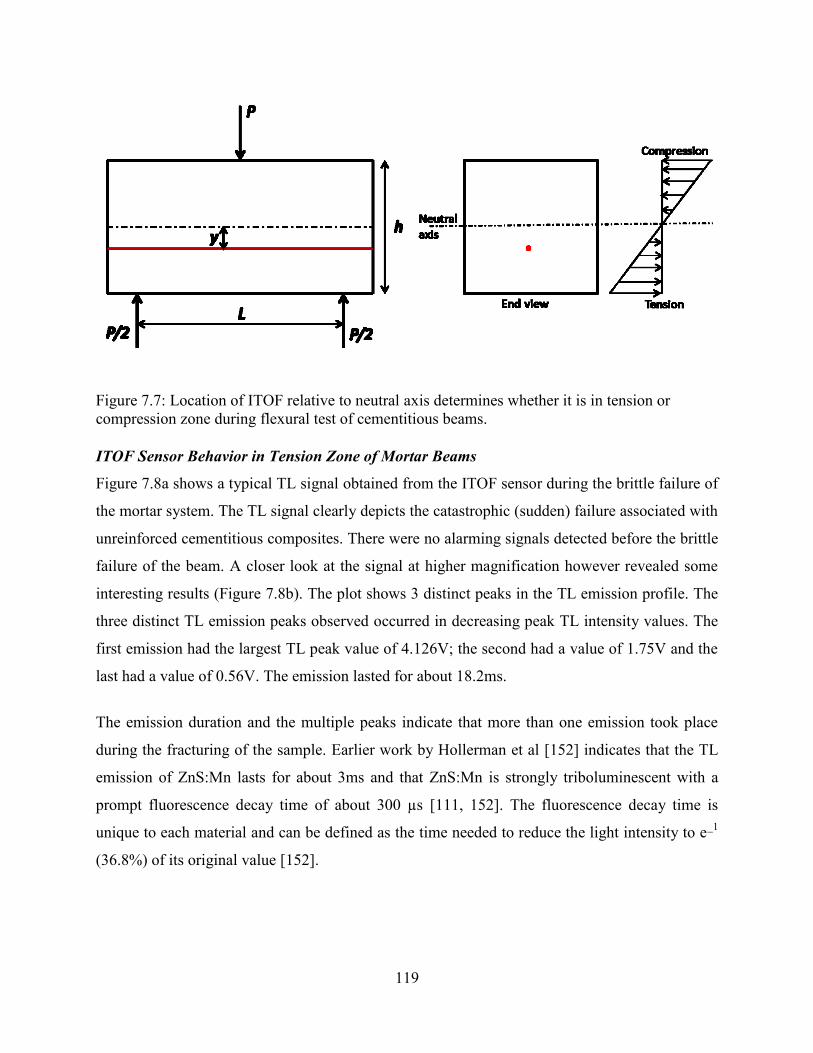
119
Figure 7.7: Location of ITOF relative to neutral axis determines whether it is in tension or compression zone during flexural test of cementitious beams.
ITOF Sensor Behavior in Tension Zone of Mortar Beams
Figure 7.8a shows a typical TL signal obtained from the ITOF sensor during the brittle failure of
the mortar system. The TL signal clearly depicts the catastrophic (sudden) failure associated with
unreinforced cementitious composites. There were no alarming signals detected before the brittle
failure of the beam. A closer look at the signal at higher magnification however revealed some
interesting results (Figure 7.8b). The plot shows 3 distinct peaks in the TL emission profile. The
three distinct TL emission peaks observed occurred in decreasing peak TL intensity values. The
first emission had the largest TL peak value of 4.126V; the second had a value of 1.75V and the
last had a value of 0.56V. The emission lasted for about 18.2ms.
The emission duration and the multiple peaks indicate that more than one emission took place
during the fracturing of the sample. Earlier work by Hollerman et al [152] indicates that the TL
emission of ZnS:Mn lasts for about 3ms and that ZnS:Mn is strongly triboluminescent with a
prompt fluorescence decay time of about 300 µs [111, 152]. The fluorescence decay time is
unique to each material and can be defined as the time needed to reduce the light intensity to e_1
(36.8%) of its original value [152].
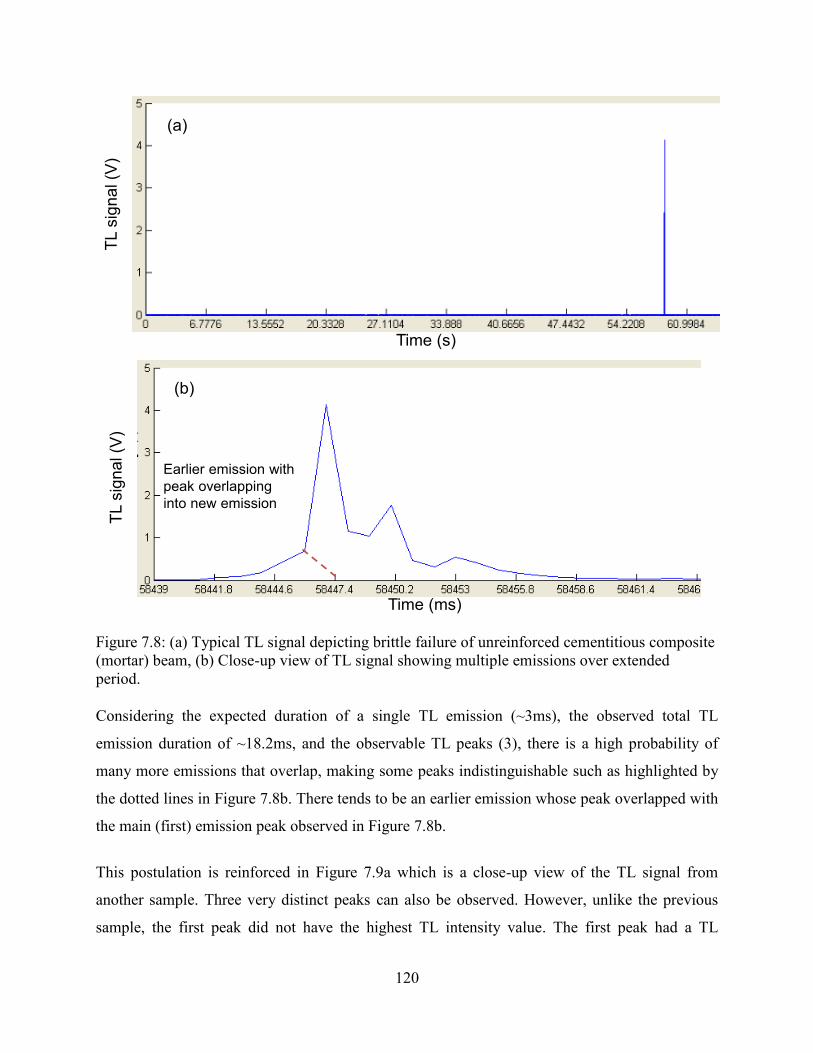
120
Figure 7.8: (a) Typical TL signal depicting brittle failure of unreinforced cementitious composite (mortar) beam, (b) Close-up view of TL signal showing multiple emissions over extended period.
Considering the expected duration of a single TL emission (~3ms), the observed total TL
emission duration of ~18.2ms, and the observable TL peaks (3), there is a high probability of
many more emissions that overlap, making some peaks indistinguishable such as highlighted by
the dotted lines in Figure 7.8b. There tends to be an earlier emission whose peak overlapped with
the main (first) emission peak observed in Figure 7.8b.
This postulation is reinforced in Figure 7.9a which is a close-up view of the TL signal from
another sample. Three very distinct peaks can also be observed. However, unlike the previous
sample, the first peak did not have the highest TL intensity value. The first peak had a TL
TL s
ign
al (V
)
Time (ms)
TL s
ign
al (V
)
Time (s)
(b)
(a)
Earlier emission with
peak overlapping
into new emission
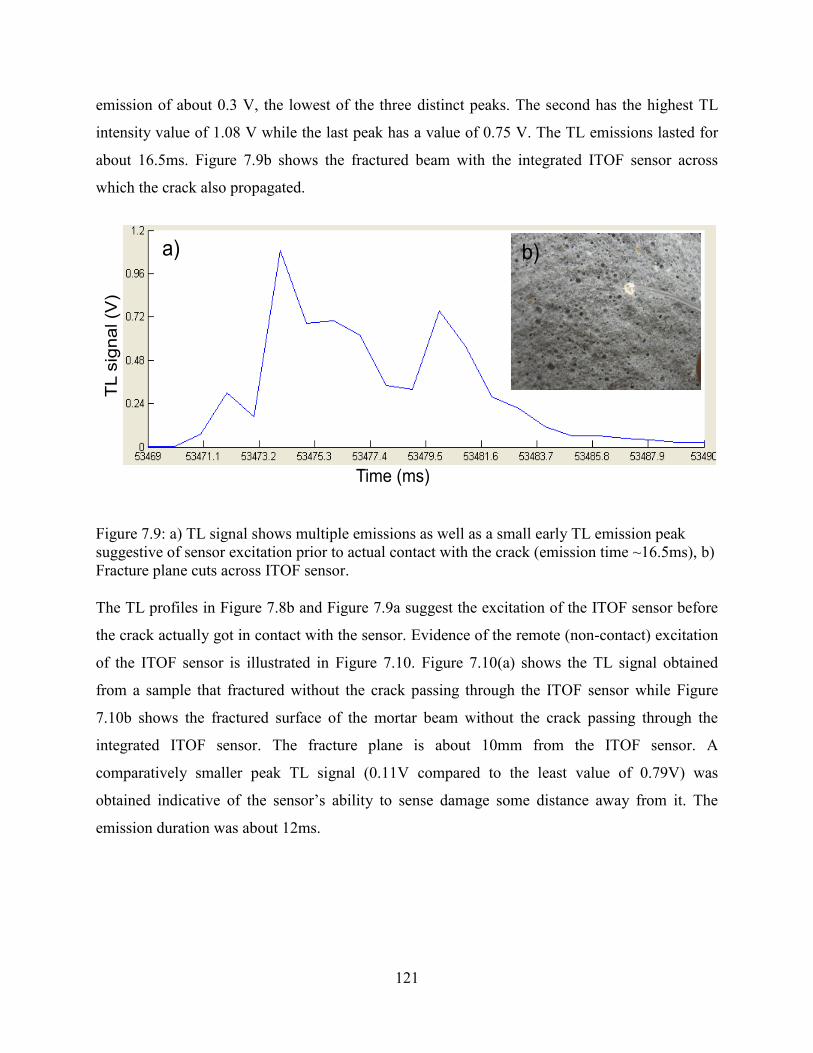
121
emission of about 0.3 V, the lowest of the three distinct peaks. The second has the highest TL
intensity value of 1.08 V while the last peak has a value of 0.75 V. The TL emissions lasted for
about 16.5ms. Figure 7.9b shows the fractured beam with the integrated ITOF sensor across
which the crack also propagated.
Figure 7.9: a) TL signal shows multiple emissions as well as a small early TL emission peak suggestive of sensor excitation prior to actual contact with the crack (emission time ~16.5ms), b) Fracture plane cuts across ITOF sensor.
The TL profiles in Figure 7.8b and Figure 7.9a suggest the excitation of the ITOF sensor before
the crack actually got in contact with the sensor. Evidence of the remote (non-contact) excitation
of the ITOF sensor is illustrated in Figure 7.10. Figure 7.10(a) shows the TL signal obtained
from a sample that fractured without the crack passing through the ITOF sensor while Figure
7.10b shows the fractured surface of the mortar beam without the crack passing through the
integrated ITOF sensor. The fracture plane is about 10mm from the ITOF sensor. A
comparatively smaller peak TL signal (0.11V compared to the least value of 0.79V) was
obtained indicative of the sensor’s ability to sense damage some distance away from it. The
emission duration was about 12ms.
TL s
ign
al (V
)
Time (ms)
a) b)
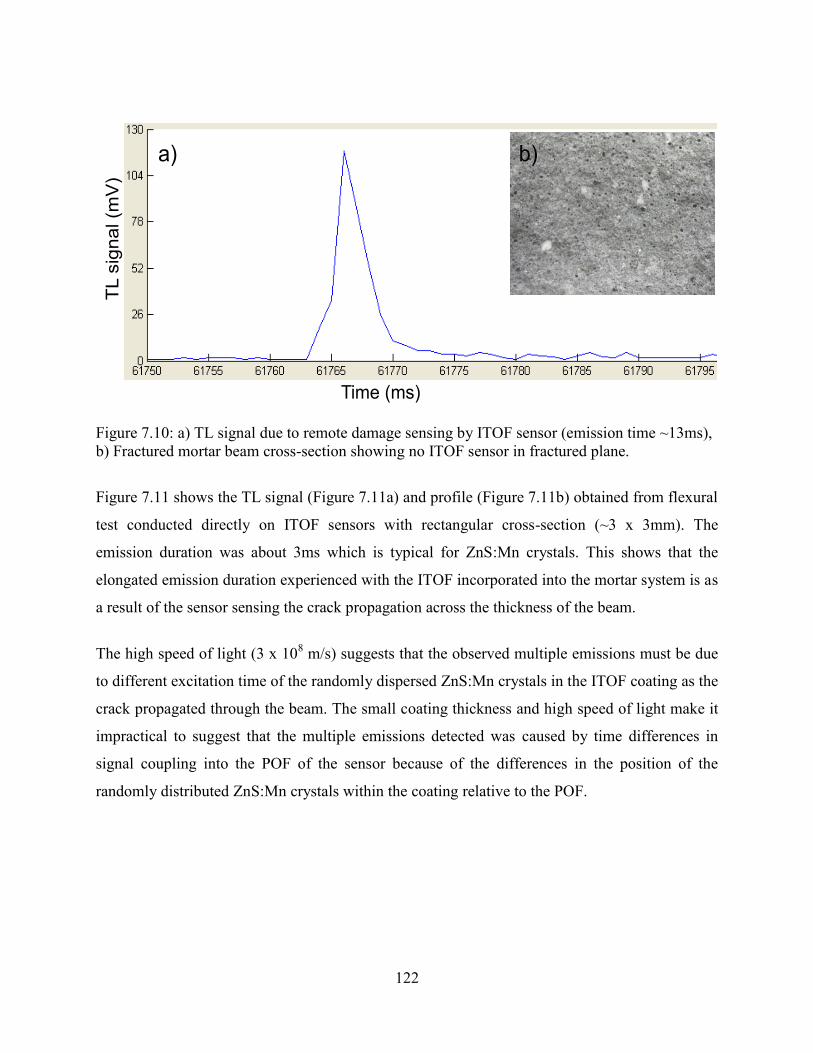
122
Figure 7.10: a) TL signal due to remote damage sensing by ITOF sensor (emission time ~13ms), b) Fractured mortar beam cross-section showing no ITOF sensor in fractured plane.
Figure 7.11 shows the TL signal (Figure 7.11a) and profile (Figure 7.11b) obtained from flexural
test conducted directly on ITOF sensors with rectangular cross-section (~3 x 3mm). The
emission duration was about 3ms which is typical for ZnS:Mn crystals. This shows that the
elongated emission duration experienced with the ITOF incorporated into the mortar system is as
a result of the sensor sensing the crack propagation across the thickness of the beam.
The high speed of light (3 x 10⁸ m/s) suggests that the observed multiple emissions must be due
to different excitation time of the randomly dispersed ZnS:Mn crystals in the ITOF coating as the
crack propagated through the beam. The small coating thickness and high speed of light make it
impractical to suggest that the multiple emissions detected was caused by time differences in
signal coupling into the POF of the sensor because of the differences in the position of the
randomly distributed ZnS:Mn crystals within the coating relative to the POF.
b)a)
TL s
ign
al (m
V)
Time (ms)

123
Figure 7.11: a) TL emission from flexural test on ITOF sensor, b) TL emission spectral with TL duration ~3ms.
Based on the preceding discussion, three modes of ITOF sensor excitation in the mortar beams
have been identified (Figure 7.12). The first mode is pre-indirect excitation (Figure 7.12a and
Figure 7.1βa’) that occurs at the lower (tensile) side of the beam when the rapidly propagating
crack is at some distance away from the integrated ITOF sensor in the beam. The second is the
direct excitation mode that occurs when the crack comes in contact with the ITOF sensor (Figure
7.1βb and Figure 7.1βb’). The final mode is the post indirect excitation (Figure 7.12c and Figure
7.1βc’) that occurs after the direct excitation, when the crack is moving away from the sensor
position. This is evident by the reduction in the TL emission peak values as the crack moves
away from the sensor location (Figure 7.1βc’). We observed that the TL signal intensity (peak)
Time (s)
Time (ms)
TL s
ign
al (V
)T
L s
ign
al (V
)
(a)
(b)

124
values for indirect excitations (Figure 7.12a and Figure 7.12c) are significantly lower than the TL
signal values observed in direct excitation (Figure 7.12b).
Figure 7.12: Schematic of different modes of ITOF sensor excitation in mortar beams a) pre-indirect b) direct c) post-indirect excitations.
ITOF Sensor Behavior in Compression Zone
Figure 7.13 shows the TL emission profile obtained from an ITOF sensor located in the
compression zone (above the neutral axis) of the mortar beam. The compressive load caused
multiple signals to be generated because of the prolonged contact of the cracked surfaces
Figure 7.13: TL profile from ITOF sensor located in compression zone of mortar beam.
TL s
ign
al (V
)
Time (ms)
a’
c’
b’
b
ca
TL s
ign
al (m
V)
Time (ms)
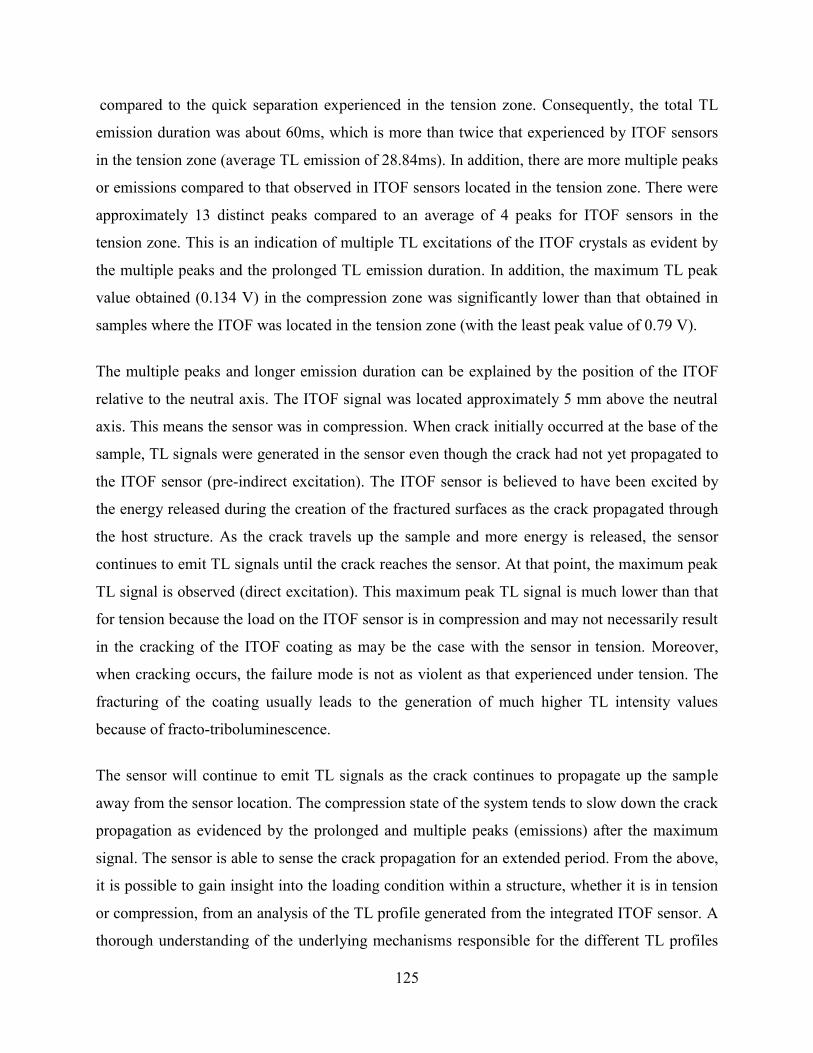
125
compared to the quick separation experienced in the tension zone. Consequently, the total TL
emission duration was about 60ms, which is more than twice that experienced by ITOF sensors
in the tension zone (average TL emission of 28.84ms). In addition, there are more multiple peaks
or emissions compared to that observed in ITOF sensors located in the tension zone. There were
approximately 13 distinct peaks compared to an average of 4 peaks for ITOF sensors in the
tension zone. This is an indication of multiple TL excitations of the ITOF crystals as evident by
the multiple peaks and the prolonged TL emission duration. In addition, the maximum TL peak
value obtained (0.134 V) in the compression zone was significantly lower than that obtained in
samples where the ITOF was located in the tension zone (with the least peak value of 0.79 V).
The multiple peaks and longer emission duration can be explained by the position of the ITOF
relative to the neutral axis. The ITOF signal was located approximately 5 mm above the neutral
axis. This means the sensor was in compression. When crack initially occurred at the base of the
sample, TL signals were generated in the sensor even though the crack had not yet propagated to
the ITOF sensor (pre-indirect excitation). The ITOF sensor is believed to have been excited by
the energy released during the creation of the fractured surfaces as the crack propagated through
the host structure. As the crack travels up the sample and more energy is released, the sensor
continues to emit TL signals until the crack reaches the sensor. At that point, the maximum peak
TL signal is observed (direct excitation). This maximum peak TL signal is much lower than that
for tension because the load on the ITOF sensor is in compression and may not necessarily result
in the cracking of the ITOF coating as may be the case with the sensor in tension. Moreover,
when cracking occurs, the failure mode is not as violent as that experienced under tension. The
fracturing of the coating usually leads to the generation of much higher TL intensity values
because of fracto-triboluminescence.
The sensor will continue to emit TL signals as the crack continues to propagate up the sample
away from the sensor location. The compression state of the system tends to slow down the crack
propagation as evidenced by the prolonged and multiple peaks (emissions) after the maximum
signal. The sensor is able to sense the crack propagation for an extended period. From the above,
it is possible to gain insight into the loading condition within a structure, whether it is in tension
or compression, from an analysis of the TL profile generated from the integrated ITOF sensor. A
thorough understanding of the underlying mechanisms responsible for the different TL profiles
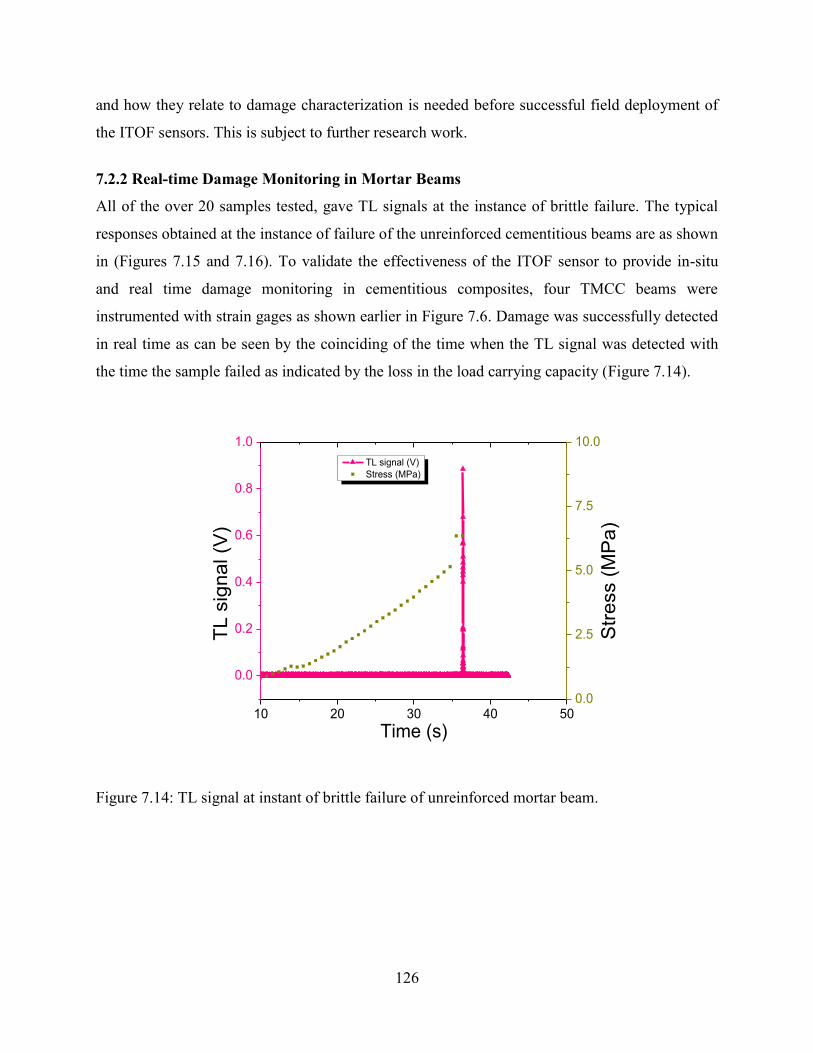
126
and how they relate to damage characterization is needed before successful field deployment of
the ITOF sensors. This is subject to further research work.
7.2.2 Real-time Damage Monitoring in Mortar Beams
All of the over 20 samples tested, gave TL signals at the instance of brittle failure. The typical
responses obtained at the instance of failure of the unreinforced cementitious beams are as shown
in (Figures 7.15 and 7.16). To validate the effectiveness of the ITOF sensor to provide in-situ
and real time damage monitoring in cementitious composites, four TMCC beams were
instrumented with strain gages as shown earlier in Figure 7.6. Damage was successfully detected
in real time as can be seen by the coinciding of the time when the TL signal was detected with
the time the sample failed as indicated by the loss in the load carrying capacity (Figure 7.14).
10 20 30 40 50
0.0
0.2
0.4
0.6
0.8
1.0
TL signal (V)
Stress (MPa)
Time (s)
TL s
ignal (V
)
0.0
2.5
5.0
7.5
10.0
Str
ess (
MP
a)
Figure 7.14: TL signal at instant of brittle failure of unreinforced mortar beam.

127
10 20 30 40 50
0.0
0.2
0.4
0.6
0.8
1.0
1.2
TL signal (V)
Strain (ue)
Time (s)
TL
sig
na
l (V
)
0
50
100
150
200
Str
ain
(u
e)
Figure 7.15: Large increases in strain value at instance of brittle failure corresponding to instance of TL signal generation.
Similarly, the strain gage experienced a sudden increase in the strain value due to crack opening
at the instance of brittle failure of the beam (Figure 7.15). At the same instance, a jump in the TL
signal was observed (Figure 7.15). Unlike the ITOF sensor, a crack must come in contact with
the strain gage before it can detect it. The ITOF sensor however offers the superior advantages of
distributed and non-contact sensing as demonstrated earlier.
7.2.3 Triboluminescent Peak Intensity
The TL intensity signal values were plotted against the stress at failure for the different TMCC
beams tested under 3PBT. A poor correlation exists between the TL peak intensity values and the
stress at failure of the beams (Figure 7.16), and the ITOF stress at failure (Figure 7.17). Both
stresses were calculated based on the linear elastic beam theory. The result shows that the linear
elastic beam theory is not adequate to describe the mortar beam system studied. The assumptions
that the beam is perfectly homogeneous and isotropic, i.e. of the same density and elastic
properties throughout are violated by the highly heterogeneous mortar beam system. This may
be responsible for the scatter or poor correlation between the stress levels and the TL intensity
values. It is also an indication that the TL intensity, though an indicator that damage has occurred
or is underway, needs to be combined with the TL profile analysis described earlier for effective
damage characterization in structures.
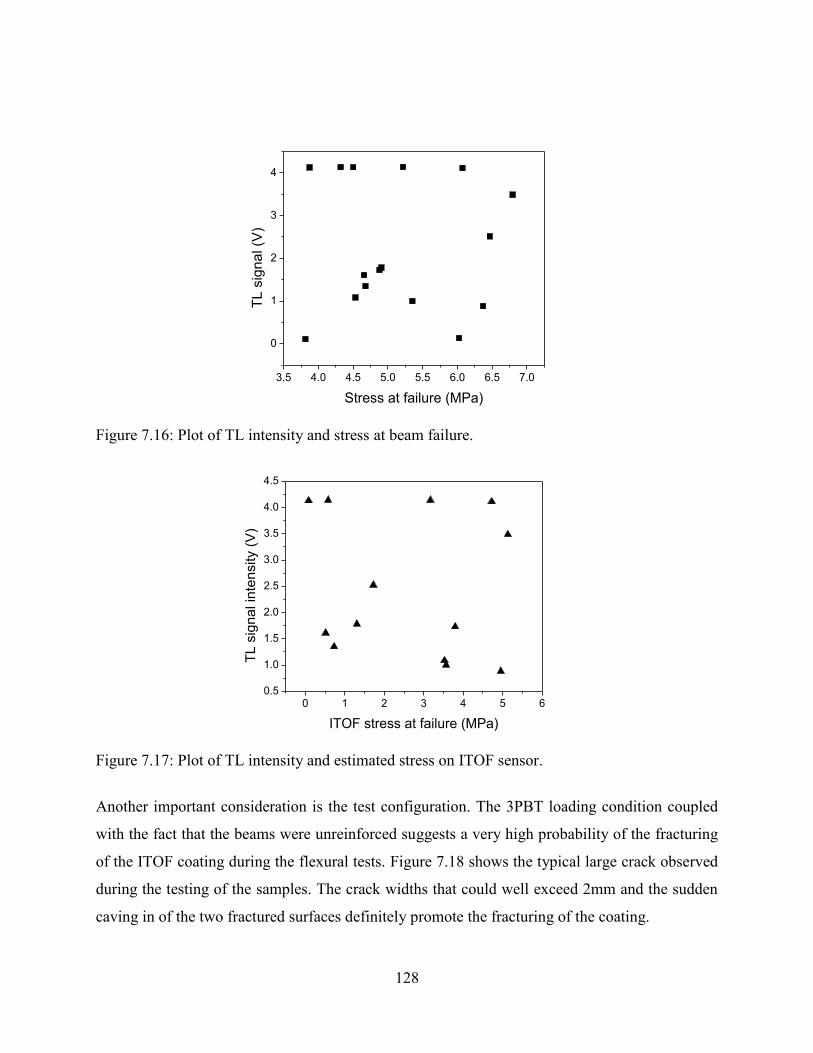
128
3.5 4.0 4.5 5.0 5.5 6.0 6.5 7.0
0
1
2
3
4
TL s
igna
l (V
)
Stress at failure (MPa)
Figure 7.16: Plot of TL intensity and stress at beam failure.
0 1 2 3 4 5 60.5
1.0
1.5
2.0
2.5
3.0
3.5
4.0
4.5
TL s
igna
l in
tensity (
V)
ITOF stress at failure (MPa)
Figure 7.17: Plot of TL intensity and estimated stress on ITOF sensor.
Another important consideration is the test configuration. The 3PBT loading condition coupled
with the fact that the beams were unreinforced suggests a very high probability of the fracturing
of the ITOF coating during the flexural tests. Figure 7.18 shows the typical large crack observed
during the testing of the samples. The crack widths that could well exceed 2mm and the sudden
caving in of the two fractured surfaces definitely promote the fracturing of the coating.

129
Figure 7.18: Failure of a mortar beam showing the typical large crack width from the brittle failure that suggests fracturing of the integrated ITOF sensor.
Earlier work on the ITOF sensor have shown that whenever the coating fractures, the ZnS:Mn
crystals within it also fracture as highlighted in the repeated SEM micrograph from Chapter 6
(Figure 7.19). This implies that fracto-triboluminescence is the prevailing TL phenomenon in
action. Fracto-TL is luminescence produced due to the creation of new surfaces during the
fracture of solids [21]. During fracto-TL, there is creation of charged surfaces at fracture due to
processes such as piezoelectrification, movements of charged dislocations, and charged defect
barodiffusion [22, 139]. The surface charges are neutralized by charge carriers or ions produced
from the dielectric breakdown of the intervening gases and solids.
The peak TL intensity resulting from Fracto-TL of ZnS:Mn crystal is however dependent on
the charge density , area of the fractured surfaces A, luminescence efficiency associated with the
movement of carriers produced by the dielectric breakdown of the crystals η, and rate constant
for the relaxation of charges on the newly created surfaces α as stated in Eqn 2.22. Since is the area of the newly created surfaces where is the thickness of the crystal
cleaved along a plane parallel to its width , Eqn (2.22) implies that should increase linearly
with and . This is contrary to the case of elastico-triboluminescence where the TL peak
intensity is a function of the applied stress. It may be desirable to have the ITOF sensor operate
within the elastico-TL range that does not involve the fracturing of the coating. This should be
130
possible with reinforced cementitious composite systems which is the targeted structures for the
ITOF sensor system.
(2.22)
Figure 7.19: a) Fractured surface of ITOF cross-section showing fractured ZnS:Mn crystals in epoxy matrix b) fracture lines on the surfaces of the fractured crystals.
Comparison of Failure Stresses from Flexural Characterization of Unreinforced Cementitious
Composite (TMCC) Beam and Direct Loading of the ITOF
Figure 7.20a shows the stress at failure and the corresponding TL peak signal obtained from 5
different rectangular-shaped ITOF sensor tested under 3PBT condition (Figure 7.20b). The
sensors’ dimensions (~γ x γ x 50mm) were similar to the ITOF sensor used in the mortar beams
used in this study. All the samples were tested to failure resulting in their fracture. The maximum
stresses recorded at failure were well below the 100MPa required for fracto-TL in literature but
was significantly higher than that obtained during the failure of the mortar beams. Localized
stress concentration due to defects such as cracks might have caused the localized stresses
around the crystals to reach the 100MPa level required for fracto-TL during the direct flexural
loading of the ITOF. The significant differences between the failure stress levels for the direct
flexural loading of the ITOF and that of the mortar beams suggest that the fracto-TL emissions
observed in the TMCC (mortar beams) are not related to or caused by the failure stresses on the
mortar beams.
a) b)

131
Figure 7.20: (a) Flexural characterization of ITOF sensor with 3PBT.
The fracturing of the ITOF coating and consequently of the crystals is most likely to have been
due to the bending of the integrated ITOF sensor when the beam cracked and the two newly
created sections bent because the beams were not reinforced.
7.3 Summary
Triboluminescent multifunctional cementitious composites consisting of integrated ITOF sensors
with in-situ crack monitoring capabilities have been successfully fabricated and demonstrated. A
new approach to damage characterization by triboluminescent (TL) emission profile analysis was
also introduced. TL profile analysis indicates that the ITOF sensor in a TMCC is able to detect
rapid crack propagation through unreinforced cementitious composite beams. The TL emission
profile may also provide insights into the loading state of the structure based on sensor location
(tension versus compression behavior of structure). While the TL intensity signal provides an
indication of the occurrence and magnitude of damage, the TL profile analysis promises to
facilitate better understanding of crack propagation in composite structural materials.
5 10 15 20 25 30 35
0.0
0.2
0.4
0.6
0.8
1.0
1.2
1.4
TL
Sig
na
l (V
)
Stress at failure (MPa)
a) b)
132
CHAPTER EIGHT
CONCLUSIONS
The main conclusions and contributions from this work are hereby presented. Inaddition,
opportunities for future work are discussed.
8.1 Conclusions
The following conclusions can be drawn from this work:
1. The problem of triboluminescent emissions detection and transmission in opaque
composite materials as stated in Section 1.2 was successfully solved through the
development of the ITOF sensor (Chapter 4). Triboluminescent-based real-time damage
monitoring is possible in opaque structures as demonstrated by the triboluminescent
multifunctional cementitious composite beams that were fabricated (Chapter 7).
2. Triboluminescent damage sensing by the direct dispersion of TL crystals in cementitious
composites has been shown feasible (Chapter 3). This study has shown that a ZnS:Mn
concentration by weight percent of 10% gives enhanced TL responses (high signal to
noise ratio) without adversely affecting the mechanical properties of the host structure.
The dense network of optical fibers that would be required for the successful
transmission of TL emissions from the randomly distributed TL crystals however greatly
limits the practicality of this approach.
3. The ITOF sensor is expected to have no adverse effect on the host cementitious
composite structure because the ZnS:Mn crystals are not directly dispersed within the
host material. As shown in Section 4.4.2, the ZnS:Mn crystals did not adversely affect the
thermo-mechanical properties of the ITOF sensor coating. Furthermore, smaller ITOF
sensor diameter and higher TL crystal content (by weight fraction) have been shown to
exhibit higher TL signal values (higher signal to noise rations) when damage events like
crack and impact occur. Fabrication limitations however currently limit the ZnS:Mn
content (by weight fraction) to 0.5 of the ZnS:Mn/epoxy of the ITOF coating thin film.
4. Efficient side-coupling of TL signals into polymer optical fiber is possible as
demonstrated by the ITOF sensor. By locating the source of the TL signals near the
surface of the polymer optical fiber, enhanced side-coupling can be achieved. This has
been demonstrated in the ITOF sensor where the randomly dispersed TL sources
133
(ZnS:Mn crystals) are located near the surface of the POF by the thin film of the ITOF
coating. Enhanced side-coupling of TL signals from the thin film coating makes truly
distributed sensing possible along the coated length of an ITOF sensor. For effective
damage characterization, it is important that both ends of an ITOF sensor are connected
to a photodetector. This will ensure that all the TL emissions coupled into the POF are
captured. Experimental work has shown that there is a random and uneven distribution of
the TL emissions between the two ends of the sensor when damage events occur.
5. Analysis of the TL emission profile from tested unreinforced triboluminescent
multifunctional cementitious composites reveals three modes of excitation of the
integrated ITOF sensor. The TL profile analysis further showed that the sensor is able to
detect crack propagation within the TMCC even when the crack is not in contact with it.
Based on the TL profile analysis, the ITOF sensor in a TMCC can act as a dynamic crack
sensor that monitors crack propagation within the structure in which it is integrated as
demonstrated in Section 7.2.2.
6. The ITOF impact excitation model attempts to predict the TL responses of the ITOF
sensor as a function of the applied impact energy within the elastico-triboluminescence
limit, the sensor’s diameter and the TL crystal volume fraction of the sensor coating.
Uneven dispersion of the ZnS:Mn crystals within the sensor coating coupled with non-
uniform coating diameter resulted in high variability in the TL responses of the sensors
under impact loading. Consequently, the model could not be validated.
8.2 Summary of Contributions
A summary of my contributions is as follows:
1. This work investigated and harnessed the triboluminescent properties of ZnS:Mn for real-
time damage sensing in cementitious composites (CC).This is the first known utilization
of the triboluminescence phenomenon in this host material system. I have demonstrated
the viability of TL-based sensors in CC by using two different approaches: direct
dispersion of TL crystals in the host structure, and development of the in-situ
triboluminescent optical fiber (ITOF) sensor.
2. Triboluminescent-based sensing of mortar systems with direct dispersion of ZnS:Mn
crystals was studied. The effects of different TL crystals content levels (weight fraction)

134
on the triboluminescent response as well as on the mechanical properties of the mortar
system were studied. The TL crystals content level (weight fraction) that give enhanced
damage sensing behavior without adversely affecting the mechanical properties of the
host CC structure was determined.
3. The problem of TL signal transmission in opaque structures was addressed by developing
the bio-inspired in-situ triboluminescent optical fiber (ITOF) sensor with integrated
sensing and transmitting components. A patent application for the sensor has already
been submitted to the US Patent Office. The fabrication process for the sensor was
developed and key sensor design parameters for enhanced sensor performance (higher TL
signal values) were investigated. It has been established that thinner coating and higher
TL crystal content result in sensors with enhanced triboluminescent performance (higher-
signal-to-noise ratio).
4. Effective side-coupling of TL signals into polymer optical fiber has been demonstrated.
This was accomplished by using triboluminescent thin films. The thin films help to
position TL crystals close to the surface of the POF resulting in enhanced coupling of the
TL emissions into the POF. This approach makes the development of truly distributed
sensors feasible when the entire length of the POF is coated with the TL thin film.
5. The properties of the TL thin film of the ITOF sensor were characterized by using
characterization techniques such as Raman spectroscopy, FESEM and DMA. This
provided important insights on the effect of the fabrication process and ZnS:Mn/epoxy
interactions on the TL properties of the ZnS:Mn crystals; and the effects of the ZnS:Mn
content (weight fraction) on the thermo-mechanical properties (glass transition and
storage modulus) of the ITOF sensor coating. FESEM analysis provided insights on the
interfaces and the failure mechanism of the TL crystals in the TL thin film of the sensor.
6. Triboluminescent damage sensing behavior of the ITOF sensor under direct flexural
loading was also studied. It has been shown that a strong bonding exists between the
ZnS:Mn crystals and the epoxy matrix of the sensor coating in the 0.5 (weight fraction)
ZnS:Mn/epoxy coating of the sensor. Consequently, the fracture of the coating results in
the fracture of the ZnS:Mn crystals thereby making fracto-TL the predominant TL
135
mechanism at work. Such strong bonding could not be developed in the 0.6 (weight
fraction) ZnS:Mn/epoxy sensors with the current fabrication process.
7. Triboluminescent multifunctional cementitious composites (TMCC) with in-situ and real-
time damage monitoring capabilities were developed by integrating the ITOF sensor into
mortar beams during fabrication. The damage monitoring behavior of the TMCC was
studied under flexural loading. Evidences were provided why the correlation of TL
intensity values and failure stress (global estimate) of a TMCC will not adequately
describe the crack propagation (a local phenomenon) in the unreinforced TMCC.
8. While virtually all TL-based sensing work had focused on the use of the TL emission
intensity for damage characterization, a new approach to damage characterization that is
based on the analysis of the TL emission profile was introduced in this work. TL
emission profile analysis indicates that the ITOF sensor senses crack propagation through
the TMCC beam. Three modes of sensor excitation were observed and reported. This
new approach promises to facilitate the understanding of crack propagation in composite
materials subject to further work.
8.3 Future Research
This work on the application of the triboluminescence phenomenon for damage monitoring
in cementitious composites has created many new opportunities for highly rewarding
research work. Future research work includes:
1. Damage characterization of ITOF sensor behavior in reinforced cementitious composites:
The current research work had focused on the damage characterization of the ITOF
sensor in unreinforced cementitious composites. Characterization of the ITOF sensor’s
performance in reinforced composites is therefore needed. For practical application of the
ITOF sensor, it needs to be integrated in reinforced systems such as steel reinforced and
fiber reinforced concrete. The damage monitoring behavior of the sensor in such systems
needs to be characterized. This will enhance the understanding of the sensor behavior and
gradual crack propagation in reinforced systems. It is also important to characterize the
behavior of the sensor in TMCC under different loading conditions such as fatigue and
impact loading.

136
2. TL emission profile analysis: As noted in Section 7.2.1, further work is needed to gain a
better understanding of the TL emission profile before it can be effectively used for
damage characterization. Of particular importance is the TL emission profile analysis of
reinforced TMCC. It is important to be able to determine the crack distance away from
the sensor from which remote sensing can occur. This knowledge will play a critical role
in the successful implementation of the ITOF in engineering structures. Effective
theoretical and empirical models need to be developed also as highlighted in Section 5.3.
3. Improved fabrication approach and model development: The problems of TL crystals
dispersion and non-uniformity of coating have to be solved for more consistent sensor
responses. Furthermore, the TL intensity depends on a large number of factors, including
stress, strain, strain rate, pressing rate, temperature, atmospheric pressure, dielectric
constant, mobility, particle/crystal, sample mass, trap depth, piezoelectric constant, trap
concentration, radiation fluence, dopant type and concentration, sample firing
temperature, sample sintering temperature, sample annealing temperature, firing time,
sintering time, charge carrier capture cross section, number of successive pressings,
efficiency for the conversion of mechanical energy into light energy, crystal structure,
crystallographic direction, piezoelectric constant, dislocation density, area of newly
created surfaces, dislocation charge, sample hardness, and sample age [162].
Consequently, the exact cause of TL is unknown [112, 162, 163] and subject to further
investigation.
4. Application of ITOF sensor as externally bonded sensor system: With the large number
of aged civil infrastructure systems like bridges, a critical application opportunity for the
ITOF sensor is on existing bridges. There is the need to develop installation methods for
external bonding of the ITOF on to engineering structures, and to characterize the
damage monitoring behavior of such externally bonded ITOF. This work only focused on
ITOF-integrated composites.
5. Techniques for determining damage location: The ITOF sensor has the capability to
monitor damage along its coated length. Techniques to determine the location along the
length of the sensor from which the TL signal originates need to be developed. This will
make damage location to be readily determined.

137
6. Durability tests on the ITOF sensor: Civil infrastructure systems like bridges are designed
to last for a very long time, often exceeding 50 years. The long-term effects of ITOF
sensor’s exposure to different environmental factors such as concrete’s high alkaline
environment need to be studied.
138
APPENDIX A
LIST OF PUBLICATIONS
PEER-REVIEWED JOURNAL ARTICLES
Published
1. D. Olawale, T. Dickens, O. Okoli, G. Sullivan, J. Sobanjo, B. Wang. “Progress in triboluminescence-based smart optical sensor system” Journal of Luminescence β011, 131 1407–1418. (DOI:10.1016/j.jlumin.2011.03.015). This paper provides a review of
efforts and progress being made by many researchers to apply the triboluminescence
phenomenon for sensing applications.
2. D. Olawale, G. Sullivan , T. Dickens, S. Tsalickis, J. Sobanjo, O. Okoli, B. Wang.
“Development of a triboluminescence-based sensor system for concrete structures” Structural Health Monitoring 2012, 11 (2), 139-147. (DOI: 10.1177/1475921711414231).
The article describes the fabrication and preliminary results of the first application of
triboluminescence for damage sensing in a cementitious composite.
3. T.J. Dickens, J. Breaux, D. O. Olawale, W.G. Sullivan and O.I. Okoli. “Effects of
ZnS:Mn Concentrated Vinyl Ester Matrices under Flexural Loading on the
Triboluminescent Yield” Journal of Luminescence 2012, 132 (7), 1714-1719.
(DOI:10.1016/j.jlumin.2012.01.056). The paper investigates the feasibility of using zinc
sulphide manganese (ZnS:Mn) concentrated vinyl ester resin as a photon emitter for
damage monitoring of polymer composites under flexural loading.
4. M. J. Uddim, T.J. Dickens, J. Yan, R. Chirayath, D.O. Olawale and O.I. Okoli. “Solid
state dye-sensitized photovoltaic micro-wires (DSPMs) with carbon nanotubes yarns as
counter electrode: Synthesis and characterization” Solar Energy Materials and Solar Cells 2013, 108, 65-69. The paper describes the development and characterization of an
innovative all solid state dye sensitized photovoltaic micro-wires (DSPMs) using low-
cost, thermally-stable and highly conductive titanium micro-wires and carbon nanotubes
yarns (CNYs). Highly inter-aligned, ultra-strong and flexible CNYs with excellent
electrical conductivity, mechanical integrity and catalytic property were successfully used
as counter electrodes (CEs).
139
Submitted
5. D. O. Olawale, M. J. Uddin, K. Kliewer, T. J. Dickens and O. I. Okoli.
“Triboluminescent optical nerve for real-time damage monitoring in composites” Smart materials and structures. The article reports on the fabrication of the triboluminescent
multifunctional cementitious composites with in-situ damage monitoring capability. A
new approach to damage characterization based on triboluminescent emission profile
analysis was also presented.
6. D. O. Olawale, M. J. Uddin, T. J. Dickens, M. Lew, D. Bharkta, O. I. Okoli. “In-situ
triboluminescent optical fiber sensor for real-time damage monitoring in cementitious
composites” Journal of intelligent material systems and structures. The article reports on the fabrication process of the ITOF sensor and preliminary results on key design factors
affecting performance of the ITOF as a triboluminescent sensor system. Also reports
initial test results of the first triboluminescence multifunctional cementitious composites
fabricated.
In preparation
7. D. O. Olawale, M. J. Uddin, K. Kliewer, T. J. Dickens and O. I. Okoli. “Characterization
of ZnS:Mn-epoxy thin film for in-situ damage monitoring in composite structures” Structural health monitoring. The paper will report results from various characterization
techniques used to gain insight into the properties of the ZnS:Mn-epoxy thin film coating
of the in-situ triboluminescent optical fiber sensor. The damage sensing behavior of the
sensor under flexural loading will also be reported.
8. D. O. Olawale, M. J. Uddin, K. Kliewer, T. J. Dickens and O. I. Okoli. “Impact
excitation model for predicting triboluminescent response of the in-situ triboluminescent
optical fiber sensor” Structural health monitoring. The paper presents the derivation of the impact excitation model for predicting the triboluminescent response of the in-situ
triboluminescent optical fiber sensor, and its validation experimentally.
CONFERENCE PROCEEDINGS
9. D. O. Olawale, T. Dickens, S. Tsalickis, O. Okoli, B. Wang and J. Sobanjo,
“Characterization of the triboluminescence performance of Zns:Mn under repeated
mechanical loading for smart optical damage sensor system”- American Society of
Nondestructive Testing (ASNT) conference on NDE/NDT for highways and bridges:
Structural materials technology 2010, New York
140
10. D. O. Olawale, W. Sullivan , T. Dickens, O. Okoli, B. Wang “Mimicking the human nervous system with a triboluminescence sensory receptor for the structural health
monitoring of composite structures”, In Sensors and Smart Structures Technologies for
Civil, Mechanical, and Aerospace Systems 2011, Tomizuka, M.; Yun, C. B.; Giurgiutiu,
V.; Lynch, J. P. Eds.; Proc. of SPIE: (2011); Vol. 7981.
11. T. J. Dickens, D. O. Olawale, G. Sullivan, J. Breaux, O. I. Okoli, B. Wang, “Toward Triboluminescent Sensor Realization for SHM: Statistical Modeling of Triboluminescent
Composites”, In Sensors and Smart Structures Technologies for Civil, Mechanical, and Aerospace Systems 2011, Tomizuka, M.; Yun, C. B.; Giurgiutiu, V.; Lynch, J. P. Eds.;
Proc. of SPIE: (2011); Vol. 7981.
12. D. O. Olawale, T. Dickens, M. J. Uddin and O. Okoli “Triboluminesence
multifunctional cementitious composites with in-situ damage sensing capability”, In
Sensors and Smart Structures Technologies for Civil, Mechanical, and Aerospace
Systems 2011, Tomizuka, M.; Yun, C. B.; Giurgiutiu, V.; Lynch, J. P. Eds.; Proc. of
SPIE: (2012); Vol. 8345.
13. M. J. Uddin, T. J. Dickens, J. Yan, D. O. Olawale, and O. I. Okoli “Photoenergy
Harvesting with 3D Solar Cell (3DSC) for Damage Sensors: A Nanotechnology
Approach”, In SAMPE 2012, North Charleston, SC, USA. Oct. 25, 2012. Manuscript
submitted for publication.
14. T. J. Dickens, D. O. Olawale and O. I. Okoli, “Multifunctional Composites with
Triboluminescent Sensors and Photoactive Materials”, In SAMPE 2012, Baltimore, MD.
May 21-24, 2012. Covina, CA, USA: Society for the Advancement of Material and
Process Engineering. Retrieved from
http://sampe.org/events/Baltimore_2012_Final_Program.pdf
PATENT
Triboluminescent Optical Fiber Sensor, U.S. Application No. 13/656,246
141
REFERENCES
[1] USDOT-FHWA. Status of the Nation's Highways, Bridges, and Transit: Conditions and Performance, Report to Congress [Online]. Available: <http://www.fhwa.dot.gov/policy/2004cpr/chap15b.htm>
[2] USDOT. Deficient bridges by state and highway system [Online]. Available: <http://www.fhwa.dot.gov/Bridge/deficient.cfm>
[3] D. N. Farhey, "Bridge instrumentation and monitoring for structural diagnostics," Structural Health Monitoring vol. 4, pp. 301-318, 2005.
[4] Federal Highway Administration. National Bridge Inventory [Online]. Available: http://www.fhwa.dot.gov/bridge/nbi.htm
[5] K. Wardhana and F. C. Hadipriono, "Analysis of Recent Bridge Failures in the United States," J. Perf. Constr. Fac., vol. 17, pp. 144-150, 2003.
[6] R. M. Measures, Structural Monitoring with Fiber Optic Technology. California: Academic Press, 2001.
[7] J. Briaud. (2007, 2/2/2009). Causes of Bridge Failures. Available: http://tti.tamu.edu/infofor/media/topics/bridge_failure.htm
[8] S. D. Glaser, H. Li, M. L. Wang, J. Ou, and J. Lynch, "Sensor technology innovation for the advancement of structural health monitoring: a strategic program of US-China research for the next decade," Smart Structures and Systems, vol. 3, pp. 221-244, 2007.
[9] K. Rofidal, "I 35W Bridge Collapse; Day 4 Operations," ed, 2007.
[10] Portland Cement Association. (2008, Report says concrete bridges stand test of time. Available: <http://www.roadsbridges.com/Report-says-concrete-bridges-stand-test-of-time-NewsPiece16901>
[11] B. Chamberlain, N. Chiesl, J. Day, L. Dowd, B. Overocker, D. Pape, M. Petrus, M. Swanson, and J. Toles, "Concrete a material for the new stone age," 1995.
[12] G. V. S. Hota and S. R. V. Hota, "Advances in fibre-reinforced polymer composite bridge decks," Prog. Struct. Engng Mater. , vol. 4, pp. 161–168, 2002.
[13] J. Sloan. (2008) Composites Fly High around the World. Sourcebook 2008: The
International Guide to Products and Services for the Composites Industry. 6-45.
142
[14] C. K. Y. Leung, N. Elvin, N. Olson, T. F. Morse, and Y. He, "A novel distributed optical crack sensor for concrete structures," Engineering Fracture Mechanics, vol. 65, pp. 133-148, 2000.
[15] C. R. Farrar and W. Keith, "An introduction to structural health monitoring," Philosophical Transactions: The Royal Society A, vol. 365, pp. 303-315, 2007.
[16] C. K. Y. Leung, "Fiber optic sensors in concrete: the future?," NDT&E International vol. 34, pp. 85-94, 2001.
[17] A. Carpinteri and G. Lacidogna, "Damage monitoring of an historical masonry building by the acoustic emission technique," Materials and Structures, vol. 39, pp. 161-167, 2006.
[18] G. Zhou and L. M. Sim, "Damage detection and assessment in fibre-reinforced composite structures with embedded fibre optic sensors—review," Smart Mater. Struct., vol. 11, pp. 925-939, 2002.
[19] R. M. Measures, Structural Monitoring with Fiber Optic Technology. California: Academic Press, 2001.
[20] K. P. Chong, N. J. Carino, and G. Washer, "Health monitoring of civil infrastructures," Smart Mater. Struct., vol. 12, pp. 483–493 2003.
[21] D. O. Olawale, T. Dickens, W. G. Sullivan, O. I. Okoli, J. O. Sobanjo, and B. Wang, "Progress in triboluminescence-based smart optical sensor system," J Luminescence, vol. 131 pp. 1407–1418, 2011.
[22] B. P. Chandra, Luminescence of Solids. New York: Plenum Press, 1998.
[23] B. P. Chandra, R. N. Baghel, and V. K. Chandra, "Mechanoluminescenct Glow Curve of ZnS:Mn," Chalcogenide Lett., vol. 7, pp. 1-9, 2010.
[24] F. N. Womack, S. M. Goedeke, N. P. Bergeron, W. A. Hollerman, and S. W. Allison, "Measurement of triboluminescence and proton half brightness dose for ZnS : Mn," IEEE
T Nucl Sci, vol. 51, pp. 1737-1741, Aug 2004.
[25] I. Sage, L. Humberstone, I. Oswald, P. Lloyd, and G. Bourhill, "Getting light through black composites: embedded triboluminescent structural damage sensors," Smart
Materials & Structures, vol. 10, pp. 332-337, Apr 2001.
[26] C. N. Xu, T. Watanabe, M. Akiyama, and X. G. Zheng, "Preparation and characteristics of highly triboluminescent ZnS film," Mater Res Bull, vol. 34, pp. 1491-1500, 1999.
[27] D. O. Olawale, T. Dickens, A. Lim, O. Okoli, B. Wang, and J. O. Sobanjo, "Characterization of the triboluminescence (TL) performance of ZnS:Mn under repeated
143
mechanical loading for smart optical damage sensor system," presented at the NDE/NDT for Highways and Bridges: Structural materials and Technology (SMT) 2010, New York, USA, 2010.
[28] Transportation Research Board, "Control of cracking in concrete-State of the Art," ed. Washington D.C., 2006.
[29] Portland Cement Association. (2009, 2/2/2010). Frequently asked questions. Cement and
Concrete Technology. Available: www.cement.org/tech/faq_cracking.asp portland
[30] P. K. Mehta and P. J. M. Monteiro, Concrete, structure, properties, and materials, 2 ed. Englewood Cliffs, NJ: Prentice-Hall, 1993.
[31] P. K. Mehta and B. C. Gerwick, Jr., "Cracking-corrosion interaction in concrete exposed to marine environment," Concr. Int., vol. 4, pp. 45-51, 1982.
[32] American Concrete Institute, "Control of Cracking in Concrete Structures," 2001.
[33] T. D. Marcotte and C. Hansson, "The Influence of Silica Fume on the Corrosion Resistance of Steel in High-Performance Concrete Exposed to Simulated Sea Water," Journal of Materials Science, vol. 38, pp. 4765–4776, 2003.
[34] D. J. W. J. Yoon, W. J. Weiss, and S. P. Shah, "Assessing Corrosion Damage in Reinforced Concrete Beams Using Acoustic Emission," Journal of Engineering
Mechanics, vol. 126, pp. 273–283, 2000.
[35] U. Attanayaku, O. Duyar, and H. M. Aktan, "Early-Age Cracking Potential of Slipformed Concrete Bridge Barriers," presented at the 83rd Annual Meeting of the Transportation Research Board, Washington, D.C, 2004.
[36] S. P. Shah and C. Ouyang, "Fracture mechanics for failure of concrete," Annual Review
of Materials Science, vol. 24, pp. 293-320, 1994.
[37] J. M. Illston and P. L. J. Domone. (2001). Construction materials (3 ed.).
[38] V.S.Gopalaratnam and S. P. Shah, "Softening response of plain concrete in direct tension," ACI Materials Journal, vol. 82, pp. 310-323, 1985.
[39] O. Büyüköztürk and H. C. Rhim, "Radar imaging of concrete specimens for non-destructive testing," Construction and Building Materials, vol. 11, pp. 195-198, 1997.
[40] E. P. Carden and P. Fanning, "Vibration Based Condition Monitoring: A Review," Structural Health Monitoring, vol. 3, pp. 355-377, 2004.
144
[41] H. T. Banks, D. J. Inman, D. J. Leo, and Y. Wang, "An experimentally validated damage detection theory in smart structures," Journal of Sound and Vibration, vol. 191, pp. 859–880, 1996.
[42] J. M. Ko and Y. Q. Ni, "Technology developments in structural health monitoring of large-scale bridges," Engineering Structures, vol. 27, pp. 1715–1725, 2005.
[43] H. Sohn, M. Dzwonczyk, E. G. Straser, K. H. Law, T. Meng, and A. S. Kiremidjian, "Adaptive Modeling of Environmental Effects in Modal Parameters For Damage Detection in Civil Structures," in Smart Systems for Bridges, Structures, and Highways, 1998, pp. 127–138.
[44] P. C. Chang, A. Flatau, and S. C. Liu, "Review Paper: Health Monitoring of Civil Infrastructure," Structural Health Monitoring, vol. 2, pp. 257-267, 2003.
[45] M. Maalej, A. Karasaridis, S. Pantazopoulou, and D. Hatzinakos, "Structural health monitoring of smart structures," Smart Materials and Structures, vol. 11, pp. 581–589, 2002.
[46] K. T. Wan and C. K. Y. Leung, "Applications of a distributed fiber optic crack sensor for concrete structures," Sensors and Actuators A, vol. 135, pp. 458-464, 2007.
[47] M. Ohtsu, M. Shigeishi, and Y. Sakata, "Nondestructive evaluation of defects in concrete by quantitative acoustic emission and ultrasonics," Ultrasonics, vol. 36, pp. I87- I95, 1998.
[48] Y. Berthaud, "Damage measurements in concrete via an ultrasonic technique: Part I Experiment," Cem. Concr. Res., vol. 21, pp. 73–82, 1991.
[49] P. Childs, A. C. L. Wong, W. Terry, and G. D. Peng, "Measurement of crack formation in concrete using embedded optical fibre sensors and differential strain analysis," Meas. Sci.
Technol., vol. 19, p. 065301 (9pp), 2008.
[50] M. Ohtsu, "The history and development of acoustic emission in concrete engineering," Magazine of Concrete Research, vol. 48, pp. 321–330, 1996.
[51] A. Carpinteri and G. Lacidogna, "Damage diagnosis in concrete and masonry structures by acoustic emission technique," J. Facta Universitatis, vol. 3, pp. 755–764, 2003.
[52] A. W. Hendry and R. Royles, "Model tests on masonry arches," Proc. Instn. Civ. Engrs.
Part 2, vol. 91, pp. 299–321, 1991.
[53] R. Royles, "Acoustic emission monitoring of masonry arch bridges," British Journal of
NDT, vol. 33, pp. 339–343, 1991.

145
[54] E. N. Landis, "Micromacro fracture relationships and acoustic emissions in Concrete," Construction and Building Materials, vol. 13, pp. 65-72, 1999.
[55] W. Swindlehurst, "Acoustic emission-1: introduction," Non-Destructive Testing, vol. 6, pp. 152–158, 1973.
[56] T. Holroyd, The acoustic emission & ultrasonic monitoring handbook. Oxford: Coxmoor Publishing Company, 2000.
[57] A. Carpinteri and G. Lacidogna, "System for the assessment of safety conditions in reinforced concrete and masonry structures," Italy Patent, 2002.
[58] A. A. Pollock, "Acoustic emission-2: acoustic emission amplitudes," Non-Destructive
Testing, vol. 6, pp. 264–269, 1973.
[59] B. J. Brindley, J. Holt, and I. G. Palmer, "Acoustic emission- 3: the use of ring-down counting," Non-Destructive Testing, vol. 6, pp. 299–306, 1973.
[60] X. Chen and F. Ansari, "Fiber optic stress wave sensor for detection of internal flaws in concrete structures," Journal of Intelligent Material Systems and Structures, vol. 10, pp. 274-279, 1999.
[61] M. Schickert, "Progress in ultrasonic imaging of concrete," Mat. Struct. , vol. 38, pp. 807–815, 2005.
[62] K. P. Chong, N. J. Carino, and G. Washer, "Health monitoring of civil infrastructures," Smart Mater. Struct. , vol. 12, pp. 483–493, 2003.
[63] P. L. Yeh, "The time–frequency domain analysis and image method of the impact-echo method," Institute of Applied Mechanics, NationalTaiwan University, Taipei, 2006.
[64] A. Davis and C. Dunn, "From theory to field experience with the nondestructive vibration testing of piles," Proc. Inst. Civ. Eng., vol. 57, pp. 571–593, 1974.
[65] J. Steinbach and E. Vey, "Caisson evaluation by stress wave propagation method," J.
Geotech. Eng. Div. ASCE, vol. 101, pp. 361–378, 1975.
[66] J. Higgs, "Integrity testing of piles by the shock method," Concrete, pp. 31-33, 1979.
[67] M. Sansalone and N. J. Carino. (1986, Impact-echo: a method for flaw detection in concrete using transient stress waves. 222.
[68] N. J. Carino, "The impact-echo method: An overview," in Structures Congress &
Exposition, Reston, Virginia, 2001.

146
[69] S. Nazarian and K. H. Stokoe, "In-situ determination of elastic moduli of pavement systems by spectral analysis-of-surface-waves method (practical aspects)," ed: Center for Transportation Research, The University of Texas at Austin, 1986.
[70] A. G. Davis and B. H. Hertlein, "Developments of nondestructive small-strain methods for testing deep foundations: a review," Transportation Research Board, Washington, DC1991.
[71] P. Yeh and P. Liu, "Imaging of internal cracks in concrete structures using the surface rendering technique," NDT&E International vol. 42, pp. 181–187, 2009.
[72] B. J. Jaeger, M. J. Sansalone, and R. W. Poston, "Detecting voids in grouted tendon ducts of post-tensioned concrete structures using the impact-echo method," ACI Struct. J., vol. 93, pp. 462–472, 1996.
[73] N. J. Carino and M. Sansalone, "Detecting voids in metal tendon ducts using the impact-echo method," ACI Mater. J., vol. 89, pp. 296–303, 1992.
[74] M. Sansalone and N. J. Carino, "Detecting delaminations in concrete slabs with and without overlays using the impact-echo method," J. Am. Concrete Inst., vol. 86, pp. 175–84, 1989.
[75] J. Martin and M. C. Forde, " Influence of concrete properties on impulse hammer spectrum and compression wave velocity," Construction and Building Materials, vol. 9, pp. 245-255, 1995.
[76] S. Nabulsi, S. Yehia, O. Abudayyeh, I. Abdelqader, and D. Randolph, "Imaging Of Electromagnetic Waves for Bridge Deck Evaluation," IEEE, 2004.
[77] J. Kuntz and J. Eales, "Evaluation of bridge deck conditions by the use of infrared and ground penetrating radar," in Proc. Of the conference on bridge official, Pittsburgh, 1985.
[78] U. Halabe and K. Maser, "Condition assessment of reinforced concrete structures using electromagnetic waves," ACI materials Journal, vol. 92, pp. 511-523, 1995.
[79] J. Hugenschmidt, "Nondestructive evaluation of bridge decks using GPR, Benefits and limits," presented at the Recent advances in bridge engineering: advanced rehabilitation, durable materials, nondestructive evaluation and management, Zurich, Switzerland, 1997.
[80] K. Maser, "Condition Assessment of transportation infrastructure using ground penetrating radar," Journal of infrastructure systems vol. 2, pp. 94-101, 1996.
[81] G. Pla-Rucki and M. Eberhard, "Imaging of reinforced concrete: State-of the- art review," Journal of infrastructure systems, vol. 1, pp. 134-141, 1996.
147
[82] H. Chen and S. Halabi, "Impulse radar reflection waveform of simulated reinforced concrete bridge decks," Materials Evaluation, vol. 52, pp. 1382-1388, 1994.
[83] J. H. Bungey, "Sub-surface radar testing of concrete: A review," Construction and
Building Materials vol. 18, pp. 1-18, 2004.
[84] O. Buyukozturk and H. C. Rhim, "Radar imaging of concrete specimens for non-destructive testing," Construcrion and Building Materials, vol. 11, pp. 195-198, 1997.
[85] M. I. Skolnik, Radar Handbook. New York: McGraw-Hill Co., 1970.
[86] D. M. McCann and M. C. Forde, "Review of NDT methods in the assessment of concrete and masonry structures," NDT&E International vol. 34, pp. 71–84, 2001.
[87] R. Pugliesi and M. L. G. Andrade, "Study of Cracking in Concrete Radiography by Neutron," Applied Radiation and Isotopes, vol. 48, pp. 339-344, 1997.
[88] W. S. Najjar, H. C. Aderhold, and K. C. Hover, "The application of neutron radiography to the study of microcracking in concrete," Cement Concrete Aggregates, vol. 8, pp. 103–110, 1986.
[89] H. C. Aderhold, K. C. Hover, and W. S. Najjar, "The cornell neutron radiography facility and its applications to the study of the internal structure and micro-cracking of concrete," in Proceedings of the Second World Conference on Neutron Radiography, France, 1986.
[90] K. C. Hover and W. S. Najjar, "Neutron radiography for the study of concrete," in Proceedings of the International Conference on Structural Faults & Repair-87, London, 1987, pp. 119–127.
[91] L. Deng and C. S. Cai, "Applications of fiber optic sensors in civil engineering," Structural Engineering and Mechanics, vol. 25, pp. 577-596, 2007.
[92] H. Li, D. Li, and G. Song, "Recent applications of fiber optic sensors to health monitoring in civil engineering," Engineering Structures, vol. 26, pp. 1647–1657, 2004.
[93] E. Udd, "Fiber optics, theory and applications," in Encyclopedia of smart materials. vol. 1, M. Schwartz, Ed., ed New York: John Wiley & Sons, Inc, 2002, pp. 415–422.
[94] E. Udd, "Early Efforts to Initiate the Field of Fiber Optic Smart Structures at McDonnell Douglas," in Proceedings of SPIE: Smart Structures and Materials, Sensory Phenomena
and measurement instrumentation for smart structures and materials, 1998, pp. 12–18.
[95] J. R. Casas and P. J. S. Cruz, "Fiber-optic sensors for bridge monitoring," Journal of
Bridge Engineering vol. 8, pp. 362-373, 2003.

148
[96] K. F. Voss and K. H. Wanser, "Fiber Sensors for monitoring structural strain and cracks," in Proceedings of the Second European Conference on Smart Materials and Structures, 1994, pp. 144–147.
[97] C. K. Y. Leung, N. Olson, K. T. Wan, and A. Meng, "Theoretical modeling of signal loss versus crack opening for a novel crack sensor," Journal Engineering Mechanics, vol. 131, pp. 777–790, 2005.
[98] D. Huston, P. Fuhr, P. Kajenski, and D. Snyder, "Concrete beam testing with optical fiber sensors," in Nondestructive Testing of Concrete Elements and Structures, S. Sture and F. Ansari, Eds., ed: ASCE, 1992, pp. 60–69.
[99] F. Ansari and R. K. Navalurkar, "Kinematics of Crack Formation in Cementitious Composites by Fiber Optics," Journal of Engineering Mechanics, vol. 5, pp. 1048–1061, 1993.
[100] R. Wolff and H. Miesseler, "Monitoring of prestressed concrete structures with optical fiber sensors," in Proceedings of the First European Conference on Smart Structures and
Materials, 1992, pp. 23-29.
[101] X. Gu, Z. Chen, and F. Ansari, "Method and theory for a multi-gauge distributed fiber optic crack sensor," Journal of Intelligent Material Systems and Structures, vol. 10, pp. 266-273, 1999.
[102] K. S. C. Kuang, Akmaluddin, W. J. Cantwell, and C. Thomas, "Crack detection and vertical deflection monitoring in concrete beams using plastic optical fibre sensors," Measurement Science and Technology, vol. 14, pp. 205-216, 2003.
[103] D. F. Merchant, P. J. Scully, and N. F. Schmitt, "Chemical tapering of polymer optical fibre," Sensors Actuators A vol. 76, pp. 365–371, 1999.
[104] N. D. W. Glossop, "An embedded fiber optic sensor for impact damage detection in composite materials," PhD, Institute for Aerospace Studies, University of Toronto, Toronto, 1989.
[105] R. Philip-Chandy, P. J. Scully, and R. Morgan, "The design, development and performance characteristics of a fibre optic drag-force flow sensor," Measurement
Science and Technology, vol. 11, pp. 31–35, 2000.
[106] K. S. C. Kuang, W. J. Cantwell, and P. J. Scully, " Evaluation of novel plastic optical fibre sensor for axial strain and bend measurements," Measurement Science and
Technology, vol. 13, pp. 1523–1534, 2002.
[107] Y. Kawaguchi, "Fractoluminescence spectra in crystalline quartz," Japanese Journal of
Applied Physics Part 1-Regular Papers Short Notes & Review Papers, vol. 37, pp. 1892-1896, Apr 1998.
149
[108] G. T. Reynolds, "Piezoluminescence from a ferroelectric polymer and quartz," Journal of
Luminescence, vol. 75, pp. 295-299, Dec 1997.
[109] B. P. Chandra, M. Elyas, and B. Majumdar, "Dislocation models of mechanoluminescence in [gamma]- and X-irradiated alkali halides crystals," Solid State
Communications, vol. 42, pp. 753-757, 1982.
[110] L. M. Sweeting, "Triboluminescence with and without Air," Chemistry of Materials, vol. 13, pp. 854-870, Mar 2001.
[111] N. P. Bergeron, W. A. Hollerman, S. M. Goedeke, M. Hovater, W. Hubbs, A. Finchum, R. J. Moore, S. W. Allison, and D. L. Edwards, "Experimental evidence of triboluminescence induced by hypervelocity impact," International Journal of Impact
Engineering, vol. 33, pp. 91-99, 2006.
[112] A. J. Walton, "Triboluminesence," Adv Phys, vol. 26, pp. 887-948, 20 July 1977 1977.
[113] I. Sage, R. Badcock, L. Humberstone, N. Geddes, M. Kemp, and G. Bourhill, "Triboluminescent damage sensors," Smart Materials & Structures, vol. 8, pp. 504-510, Aug 1999.
[114] I. Sage and G. Bourhill, "Triboluminescent materials for structural damage monitoring," Journal of Materials Chemistry, vol. 11, pp. 231-245, 2001.
[115] I. Sage, R. A. Badcock, L. Humberstone, N. Geddes, M. Kemp, S. Bishop, and G. Bourhill, "Squeezing light out of crystals: triboluminescent sensors," in Smart Structures
and Materials 1999: Smart Materials Technologies, Newport Beach, CA, USA, 1999, pp. 169-179.
[116] I. H. Sage, L.;Oswald, I.; Lloyd, P.; Bourhill, G., "Embedded triboluminescent structural damage sensors," in Proc. SPIE, 2000.
[117] L. Sodomka, "Triboluminescence of Silicon Carbide and Other Uncommon Materials," Physica Status Solidi a-Applied Research, vol. 7, pp. K65-&, 1971.
[118] G. N. Chapman, J. C. Ramage, and A. J. Walton, "An Improved Image-Intensifier Spectrograph for Recording Triboluminescent Spectra," Journal of Physics E-Scientific
Instruments, vol. 15, pp. 181-183, 1982.
[119] L. M. Sweeting and J. L. Guido, "An improved method for determining triboluminescence spectra," Journal of Luminescence, vol. 33, pp. 167-173, 1985.
[120] L. M. Sweeting, M. L. Cashel, M. Dott, J. M. Gingerich, J. L. Guido, J. A. Kling, R. F. Pippin, M. M. Rosenblatt, A. M. Rutter, and R. A. Spence, "Spectroscopy and Mechanism in Triboluminescence," Molecular Crystals and Liquid Crystals, vol. 211, pp. 389-396, 1992.

150
[121] L. M. Sweeting, "Spectroscopic Characterization of Minerals and their Surfaces," in ACS
Symposium series 415, Washington, DC, 1990, pp. 245–60.
[122] K. R. Vishwakarma, M. ; Chandra, B.P., "Luminescence and Its Application," International Journal of Nanotechnology and Applications, vol. 1, pp. 29-34, 2007.
[123] H.-Y. Lu and S.-Y. Chu, "The mechanism and characteristics of ZnS-based phosphor powders," Journal of Crystal Growth, vol. 265, pp. 476-481, 2004.
[124] L. Grmela, R. Macku, and P. Tomanek, "Near-field measurement of ZnS : Mn nanocrystal and bulk thin-film electroluminescent devices," Journal of Microscopy-
Oxford, vol. 229, pp. 275-280, Feb 2008.
[125] V. Wood, J. E. Halpert, M. J. Panzer, M. G. Bawendi, and V. Bulovic, "Alternating Current Driven Electroluminescence from ZnSe/ZnS:Mn/ZnS Nanocrystals," Nano
Letters, vol. 9, pp. 2367-2371, Jun 2009.
[126] K. Manzoor, S. R. Vadera, N. Kumar, and T. R. N. Kutty, "Multicolor electroluminescent devices using doped ZnS nanocrystals," Applied Physics Letters, vol. 84, pp. 284-286, Jan 12 2004.
[127] J. F. Suyver, S. F. Wuister, J. J. Kelly, and A. Meijerink, "Synthesis and Photoluminescence of Nanocrystalline ZnS:Mn2+," Nano Letters, vol. 1, pp. 429-433, 2001.
[128] B. P. Chandra, C. N. Xu, H. Yamada, and X. G. Zheng, "Luminescence induced by elastic deformation of ZnS:Mn nanoparticles," Journal of Luminescence, vol. 130, pp. 442-450, 2010.
[129] I. B. Kobyakov and G. S. Pado, "Investigation of Electrical and Elastic Properties of Hexagonal Zinc Sulfide in Temperature Range 1.5-300 Degrees K," Soviet Physics Solid
State, vol. 9, p. 1707, 1968.
[130] B. P. Chandra and A. S. Rathore, "Classification of Mechanoluminescence," Crystal
Research and Technology, vol. 30, pp. 885-896, 1995.
[131] I. Chudacek, "Influence of Pressure on Recombination Centres in Piezoelectric Luminophores," Czechoslovak Journal of Physics, vol. 16, pp. 520-&, 1966.
[132] I. Chudacek, "Kinetics of Triboluminescence of Zinc Sulphide I," Czechoslovak Journal
of Physics, vol. 17, pp. 34-&, 1967.
[133] R. Mach and G. O. Muller, "Physical Concepts of High-Field, Thin-Film Electro-Luminescence Devices," Physica Status Solidi a-Applied Research, vol. 69, pp. 11-66, 1982.
151
[134] S. Tiwari, S. Tiwari, and B. P. Chandra, "Characteristics of a.c. electroluminescence in thin film ZnS : Mn display devices," Journal of Materials Science-Materials in
Electronics, vol. 15, pp. 569-574, Sep 2004.
[135] B. P. Chandra, A. K. Bagri, and V. K. Chandra, "Mechanoluminescence response to the plastic flow of coloured alkali halide crystals," J Luminescence, vol. 130, pp. 309-314, 2010.
[136] F. E. Urbach, ; Akad, S. B., Wiss. Wien IIa vol. 139, p. 353, 1930.
[137] B. P. R. Chandra, Y.; Ramrakhiani, M; Ansari, M.H.; Sharma, Y.K., "Statistical Model of Mechanoluminescence in Crystals," Cryst. Res. Technol., vol. 27, pp. 561-568, 1992.
[138] B. P. Chandra, S. Singh, B. Ojha, and R. G. Shrivastava, "Mobile interstitial model and mobile electron model of mechano-induced luminescence in coloured alkali halide crystals," Pramana-Journal of Physics, vol. 46, pp. 127-143, Feb 1996.
[139] A. Chakravarty and T. E. Phillipson, "Triboluminescence and the potential of fracture surfaces," Journal of Physics D-Applied Physics, vol. 37, pp. 2175-2180, Aug 7 2004.
[140] B. P. Chandra and J. I. Zink, "Triboluminescence and the Dynamics of Crystal Fracture," Physical Review B, vol. 21, pp. 816-826, 1980.
[141] C. N. Xu, X. G. Zheng, M. Akiyama, K. Nonaka, and T. Watanabe, "Dynamic visualization of stress distribution by mechanoluminescence image," Applied Physics
Letters, vol. 76, pp. 179-181, Jan 10 2000.
[142] K. S. Sohn, S. Y. Seo, Y. N. Kwon, and H. D. Park, "Direct observation of crack tip stress field using the mechanoluminescence of SrAl2O4 :(Eu,Dy,Nd)," Journal of the
American Ceramic Society, vol. 85, pp. 712-714, Mar 2002.
[143] J. S. Kim, Y. N. Kwon, N. Shin, and K. S. Sohn, "Mechanoluminescent SrAl2O4 : Eu, Dy phosphor for use in visualization of quasidynamic crack propagation," Applied
Physics Letters, vol. 90, pp. -, Jun 11 2007.
[144] G. Bourhill, L. O. Pålsson, I. D. W. Samuel, I. C. Sage, I. D. H. Oswald, and J. P. Duignan, "The solid-state photoluminescent quantum yield of triboluminescent materials," Chem Phys Lett vol. 336, pp. 234-241, 2001.
[145] C. N. Xu, T. Watanabe, M. Akiyama, and X. G. Zheng, "Direct view of stress distribution in solid by mechanoluminescence," Applied Physics Letters, vol. 74, pp. 2414-2416, Apr 26 1999.
[146] R. N. Bhargava, D. Gallagher, X. Hong, and A. Nurmikko, "Optical-Properties of Manganese-Doped Nanocrystals of Zns," Physical Review Letters, vol. 72, pp. 416-419, Jan 17 1994.
152
[147] C. N. Xu, T. Watanabe, M. Akiyama, and X. G. Zheng, "Artificial skin to sense mechanical stress by visible light emission," Applied Physics Letters, vol. 74, pp. 1236-1238, Mar 1 1999.
[148] V. Abbrustcato, "Optical and Electrical Properties of SrAl2O4:Eu2+," J. Electrochem.
Soc. , vol. 118, pp. 930-933, 1971.
[149] T. Sakagami, "Visualization of contact stress distribution using infrared stress measurement system," in SPIE Proceedings, 1997, pp. 250-259.
[150] B. P. Chandra, Radiat. Effects Defects Solids vol. 138, p. 127, 1996.
[151] N. A. Atari and R. Ramant, Phys. Status Solidi vol. A97, 1986.
[152] W. A. Hollerman, C. A. Malespin, R. S. Fontenot, and P. J. Wasilewski, "Measuring Triboluminescence Generated By Meso-Velocity Impacts " in 39th Lunar and Planetary
Science Conference, League City, Texas, 2008, p. 1018.
[153] S. W. G. Allison, G.T., "Remote Thermometry with Thermographic Phosphors Instrumentation and Applications," Rev. Sci. Instrum, , vol. 68, pp. 2615-2650 1997.
[154] S. M. A. Goedeke, S. W.; Womack, F. N.; Bergeron, N. P.; Hollerman, W.A. , "Triboluminescence and its application to space-based damage sensors," presented at the Proc. Propulsion Measurement Sensor Development Workshop, Huntsville, AL, 2003.
[155] J. C. W. de Mello, H. F.; Friend R. H. , "An improved experimental determination of external photoluminescence quantum efficiency," Adv. Mater. , vol. 9, p. 230, 1997
[156] N. P. Bergeron, W. A. Hollerman, S. M. Goedeke, and R. J. Moore, "Triboluminescent properties of zinc sulfide phosphors due to hypervelocity impact," International Journal
of Impact Engineering, vol. 35, pp. 1587-1592, 2008.
[157] G. Alzetta, I. Chudá, ccaron, ek, and R. Scarmozzino, "Excitation of triboluminescence by deformation of single crystals," Physica Status Solidi (a), vol. 1, pp. 775-785, 1970.
[158] G. C. Jacob, J. F. Fellers, S. Simunovic, and J. M. Starbuck, "Energy Absorption in Polymer Composites for Automotive Crashworthiness," Journal of Composite Materials,
vol. 36, pp. 813-850, 2002.
[159] T. O. Dickens, Okoli, "Enabling Damage Detection: Manufacturing Composite Laminates doped with Dispersed Triboluminescent Materials " Journal of Reinforced
Plastics & Composites, 2011.
[160] Y. V. Vorobiev, S. Jiménez-Sandoval, J. González-Hernández, S. V. Kozitsky, R. V. Zakharchenko, and V. N. Zakharchenko, "Electrical and optical properties of
153
semiconducting ZnS and ZnMnS ceramics prepared by Self-Propagating High Temperature Synthesis," Superficies y Vacio, vol. 8, pp. 37-41, 1999.
[161] H. Vašková and V. Křesálek, "Raman spectroscopy of epoxy resin crosslinking," presented at the 13th WSEAS International Conference on Automation Control, Modeling & Simulation (ACMOS '11), Lanzarote, Canary Islands, Spain, 2011.
[162] V. K. Chandra and B. P. Chandra, "Dynamics of the mechanoluminescence induced by elastic deformation of persistent luminescent crystals," Journal of Luminescence, vol. 132, pp. 858-869, 2012.
[163] R. S. Fontenot, W. A. Hollerman, K. N. Bhat, and M. D. Aggarwal, "Comparison of the triboluminescent properties for europium tetrakis and ZnS:Mn powders," Journal of
Theoretical and Applied Physics, vol. 6, 2012.

154
BIOGRAPHICAL SKETCH
David O. Olawale received his B.Sc (Mechanical Engineering) from Obafemi Awolowo
University, Nigeria in 2000 and his M.Sc (Industrial and Production Engineering) from the
University of Ibadan, Nigeria in 2004. He taught at Covenant University, a leading private
university in Nigeria, from October 2005 to August 2007 before proceeding to Florida State
University for his doctoral studies in the Department of Industrial and Manufacturing
Engineering. At FSU, his research focused on the development of triboluminescence
multifunctional cementitious composites (TMCC). These are cementitious composites with both
structural and in-situ damage monitoring capabilities. They will provide our civil infrastructure
systems like bridges and dams with real time damage monitoring capability similar to that found
in biological systems.
His research work has led to the filing of a patent application, publishing of journal articles and
presentation of conference papers. The technology is also on the path to commercialization. It
won 2nd place position in the highly competitive INOLEvation business plan competition (2012)
organized by the Jim Moran Institute for Global Entrepreneurship.
Furthermore, during his doctoral studies, the author carried out leadership and administrative
responsibilities such as being the Assistant Coordinator for both the NSF-sponsored research
experience for undergraduate (RETREAT) program and the Air Force Research Laboratory
sponsored internship (DREAM) program. He also served as the Coordinator for the Alumni
Village Task Force that sees to the welfare of international scholars and their families from over
60 countries resident at the FSU Alumni Village housing facility.